Embed Size (px)
Citation preview
Appendix IX
Passive acoustic monitoring in a tidal energy environment:
Comparing acoustic data from three measurement positions in
the Minas Passage
Version 2.1 i
Passive Acoustic Monitoring in a Tidal Energy Environment
Comparing Acoustic Data from Three Measurement Positions in the Minas Passage
Submitted to: Dan Hasselman Fundy Ocean Research Centre for Energy
(FORCE)
Authors: Colleen Wilson Bruce Martin
13 September 2019
P001146-005 Document 01774 Version 2.1
JASCO Applied Sciences (Canada) Ltd Suite 202, 32 Troop Ave.
Dartmouth, NS B3B 1Z1 Canada Tel: +1-902-405-3336 Fax: +1-902-405-3337
www.jasco.com
Version 2.1 i
Suggested citation:
Wilson, C.C. and S.B. Martin. 2019. Passive Acoustic Monitoring in a Tidal Energy Environment: Comparing Acoustic Data from Three Measurement Positions in the Minas Passage. Document 01774, Version 2.1. Technical report by JASCO Applied Sciences for Fundy Ocean Research Centre for Energy (FORCE).
Disclaimer:
The results presented herein are relevant within the specific context described in this report. They could be misinterpreted if not considered in the light of all the information contained in this report. Accordingly, if information from this report is used in documents released to the public or to regulatory bodies, such documents must clearly cite the original report, which shall be made readily available to the recipients in integral and unedited form.
JASCO APPLIED SCIENCES Passive Acoustic Monitoring in a Tidal Energy Environment
Version 2.1 i
Executive Summary
Passive acoustic monitoring (PAM) is expected to be an important component of environmental management plans around marine hydro-kinetic energy sites, including tidal turbines. There are two main roles envisioned for PAM: 1) measuring sound emitted by turbines to determine the distance at which it may injure or disturb marine life and 2) monitoring the presence of vocalizing marine animals (especially porpoises) and how they interact with the turbines. In both roles, it is important to understand the noise levels from true sounds in the environment and pseudo-noise generated by flow around the hydrophones used to record the data.
Previous work analyzed data from drifting, turbine-mounted hydrophones and autonomous hydrophones during the first deployment of the OpenHydro Open-Centre turbine at the Fundy Ocean Research Centre for Energy (FORCE) site in Minas Passage, NS. It was demonstrated that drifting hydrophones had the lowest noise levels, as expected, but they were limited to measurement durations on the order of minutes. Drifters are well suited for determining the acoustic propagation loss for sound emitted by the turbine because drifters can measure sound levels as a function of range as they move past the turbines. Flow noise on hydrophones fixed to the turbine platform depended on the height of the hydrophone off the seabed, where higher hydrophones had more flow noise. Flow noise measured by the hydrophone on top of the turbine extended as high as 10 kHz in frequency. An autonomous hydrophone on the seabed had lower flow noise sound levels than the turbine mounted hydrophones. Relationships between flow speed, current direction, and turbine operating mode were developed that allow users to predict sound levels for future applications. The previous work was unable to compare sound levels before and after the turbine was installed since data were not recorded prior to the turbine installation.
This report analyzes data collected from June to November 2018. Data were available from a JASCO Autonomous Multichannel Acoustic Recorder (AMAR) in the same autonomous mooring used in 2016. The AMAR data is available for the entire June-November period. Data are also available for parts of September 2018 from icListen hydrophones mounted on the turbine and an icListen hydrophone mounted on a FAST platform 60 m from the Open-Centre turbine. The turbine was installed in late July 2018 and ceased operating on 9 Aug 2018.
The objectives of the current analysis were to further compare the noise levels at different measurement locations. A secondary objective was to further analyze how the turbine contributed to the soundscape using the limited data available. Similar to the previous results, the measured sound levels due to flow noise increased with the height of the hydrophone off the seabed. The hydrophone on top of the turbine was most affected by flow-induced noise—out to ~2.5 kHz at the 90th percentile of flow speed. For comparison, the two least affected locations (‘Aft’ turbine hydrophone and the autonomous AMAR hydrophone) were only affected by flow noise out to 160 Hz. All hydrophone positions measured approximately the same spectral and decidecade sound levels for frequencies above their flow noise cut-offs. The ambient sound above the flow cut-off frequencies also increased with current speed; however, these changes were likely due to increases in entrained bubbles and sediment movement.
When the turbine was present (and presumably free spinning) the sound levels increased in the 30–1000 Hz band. The flow-induced noise on the ‘aft’ and autonomous recorders was low enough to successfully measure the sound from the turbine; however, the FAST platform and ‘stbd’ locations had floor noise levels high enough that they would have had difficulty quantifying the turbine noise in free spinning mode.
The flow-induced noise at all recording locations were similar above 3 kHz and therefore all locations are equally appropriate for detecting porpoise.
There were two unexpected results: 1) the decidecade sound pressure levels on the turbine ‘aft’ hydrophone were up to 30 dB quieter than the same type of hydrophone in the ‘stbd’ location and 2) the decidecade sound pressure levels on the autonomous recorder were up to 20 dB quieter after the neoprene cover designed to protect the hydrophone from flow was removed.
JASCO APPLIED SCIENCES Passive Acoustic Monitoring in a Tidal Energy Environment
Version 2.1 ii
Contents
EXECUTIVE SUMMARY ......................................................................................................... I 1. INTRODUCTION .............................................................................................................. 1
2. GENERAL METHODS ....................................................................................................... 2 2.1. Data Collection .................................................................................................................................. 2 2.2. Data Analysis .................................................................................................................................... 3 2.3. Recorder Calibration ......................................................................................................................... 3
3. RESULTS ....................................................................................................................... 4 3.1. Acoustic Doppler Current Profiler (ADCP) Data ............................................................................... 4 3.2. Turbine-mounted icListen Results .................................................................................................... 4 3.3. Platform icListen Results ................................................................................................................... 5 3.4. HFM AMAR Results .......................................................................................................................... 5
4. DISCUSSION .................................................................................................................. 6 4.1. Comparison of Recording Locations ................................................................................................. 6 4.2. Correlation of Hydrophone and ADCP data ...................................................................................... 9
LITERATURE CITED .......................................................................................................... 14
APPENDIX A. DETAILED METHODS ................................................................................... A-1
APPENDIX B. RESULTS .................................................................................................... B-1
APPENDIX C. DECIDECADE SOUND PRESSURE LEVEL TABLES ........................................... C-1
JASCO APPLIED SCIENCES Passive Acoustic Monitoring in a Tidal Energy Environment
Version 2.1 iii
Figures
Figure 1. Recorder locations. ........................................................................................................................ 2 Figure 2. Water depths and total root-mean-square (rms) water speeds at the first 0.5 m bin (near-
bottom) measured by the Acoustic Doppler current profiler (ADCP). ...................................................... 4 Figure 3. Comparison of all hydrophones at each percentile at all measured frequencies. ......................... 7 Figure 4. Band SPL at each calculated decidecade band frequency for the specified percentiles. ............. 8 Figure 5. Aft hydrophone correlogram ........................................................................................................ 10 Figure 6. Starboard hydrophone correlogram ............................................................................................. 11 Figure 7. Top hydrophone correlogram ...................................................................................................... 11 Figure 8. FAST platform hydrophone correlogram ..................................................................................... 12 Figure 9. HFM AMAR hydrophone correlogram ......................................................................................... 13 Figure A-1. General arrangement drawing for the Open-Centre Turbine showing the locations of the
icListen hydrophones. ...........................................................................................................................A-2 Figure A-2. FAST platform with two icListen hydrophones. .......................................................................A-3 Figure A-3. Platform orientation .................................................................................................................A-3 Figure A-4. High Flow Mooring (HFM) design. ..........................................................................................A-4 Figure A-5. Inside the high-flow mooring. ..................................................................................................A-5 Figure A-6. Cover of the JASCO High Flow Mooring. ...............................................................................A-5 Figure A-7. Split view of a G.R.A.S. 42AC pistonphone calibrator with an M36 hydrophone ...................A-6 Figure B-1. (Top) in-band SPL and (bottom) spectrogram for the Aft hydrophone for 7–22 Sep 2018. ....B-1 Figure B-2. (Top) Exceedance percentiles and mean of the decidecade band SPL and (bottom)
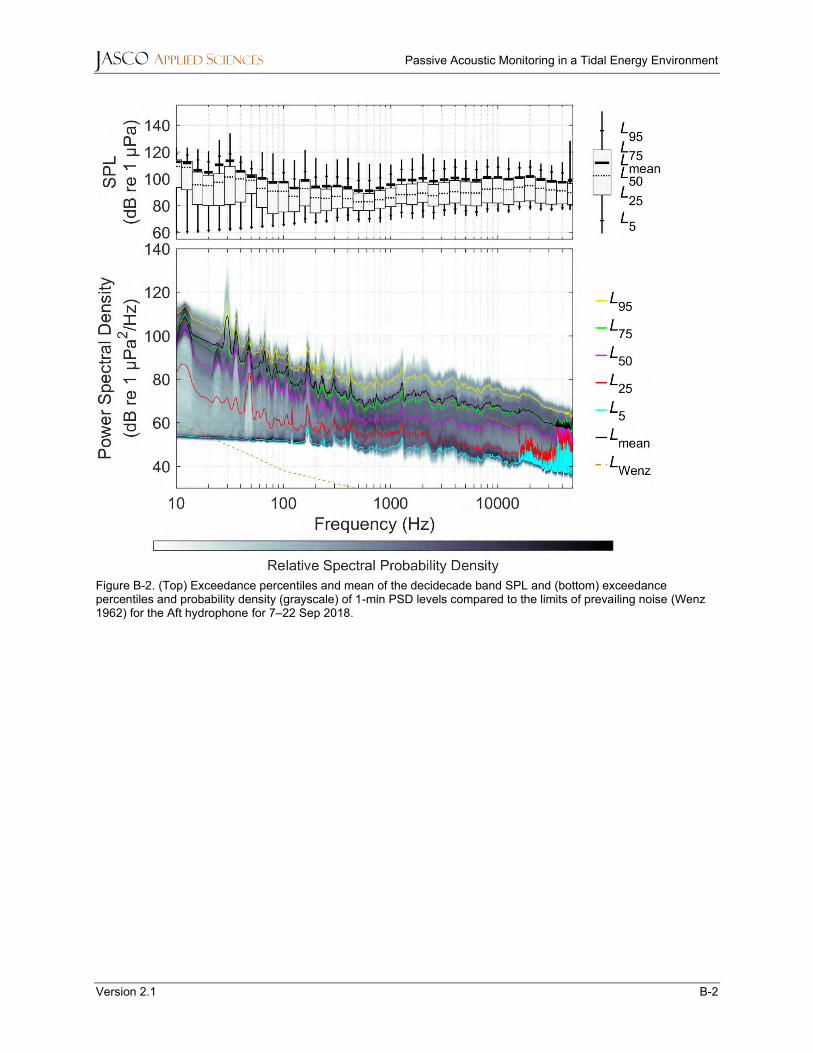
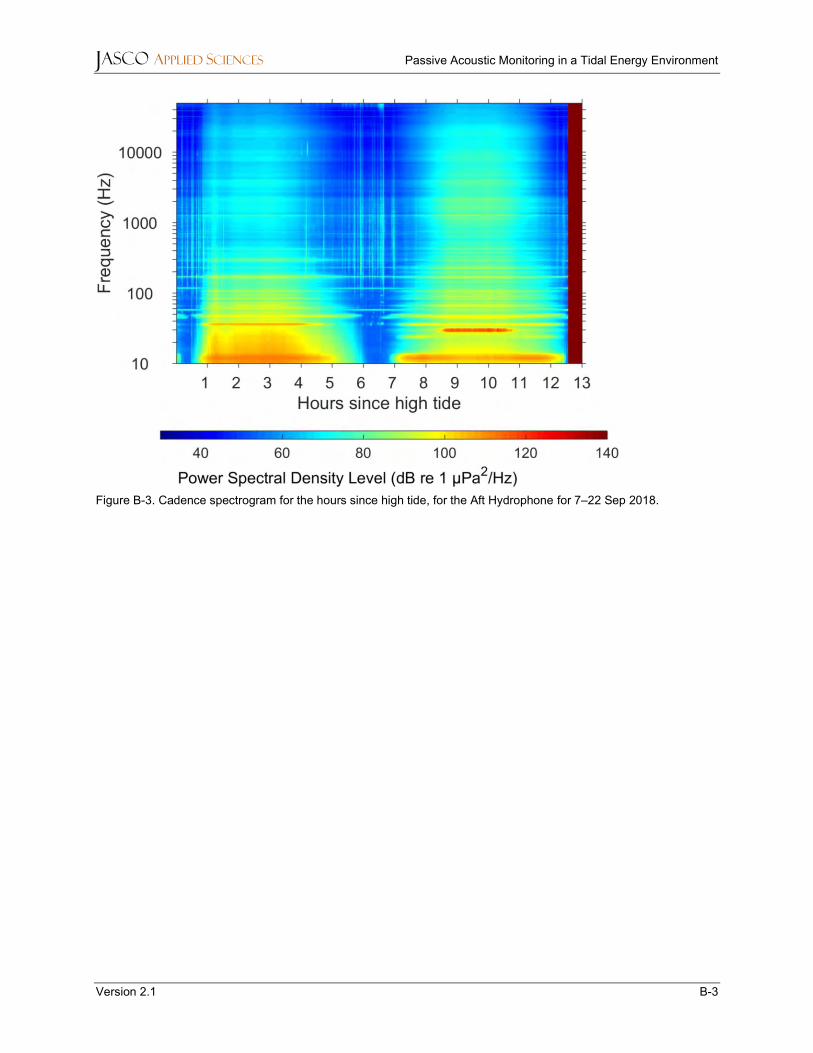
exceedance percentiles and probability density (grayscale) of 1-min PSD levels ...............................B-2 Figure B-3. Cadence spectrogram for the hours since high tide, for the Aft Hydrophone for 7–
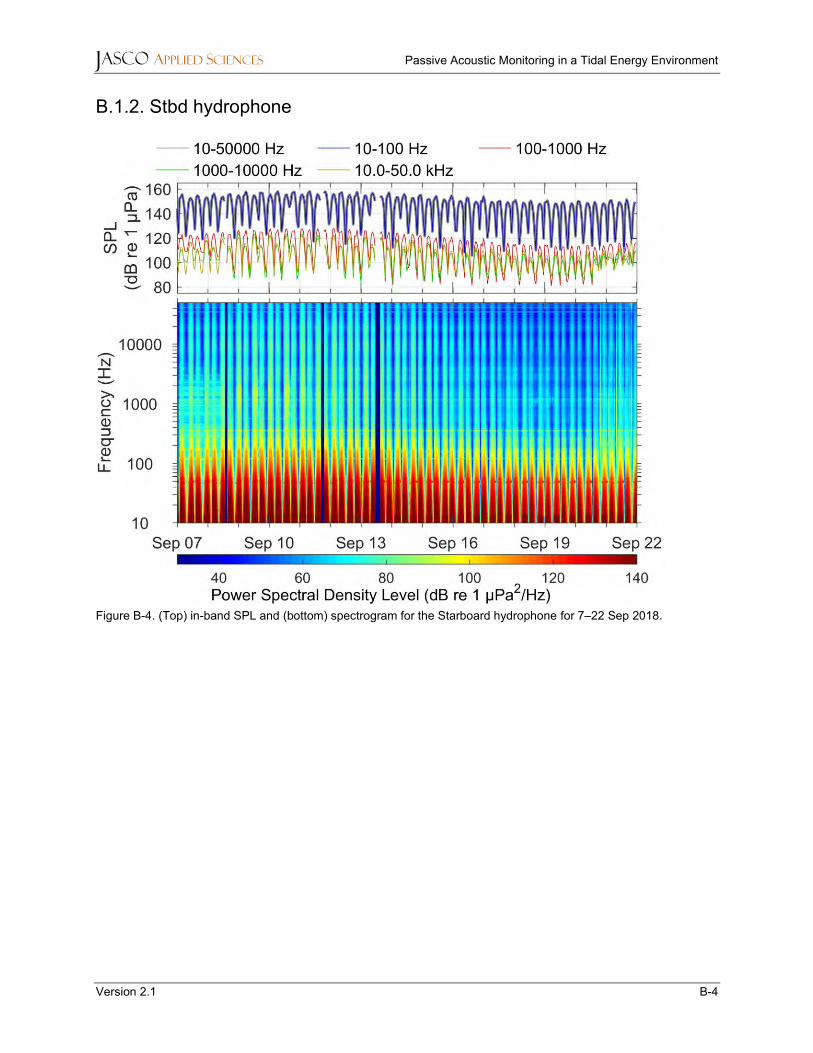
22 Sep 2018. .........................................................................................................................................B-3 Figure B-4. (Top) in-band SPL and (bottom) spectrogram for the Starboard hydrophone for 7–
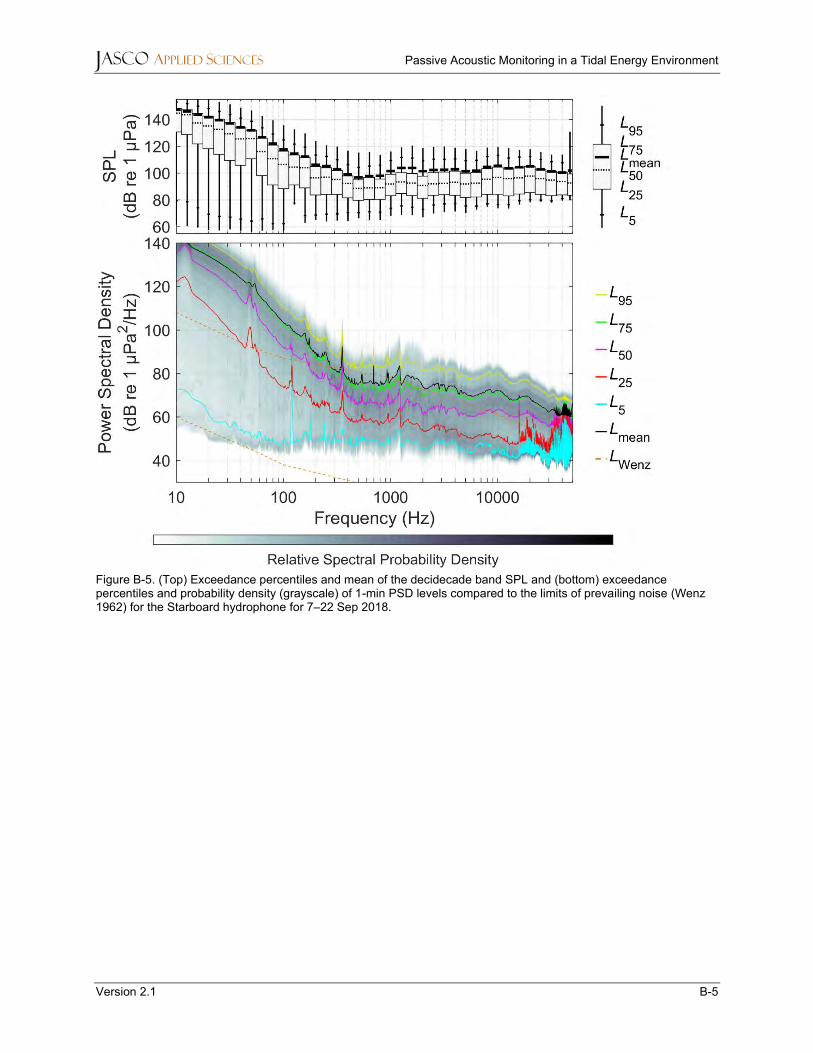
22 Sep 2018. .........................................................................................................................................B-4 Figure B-5. (Top) Exceedance percentiles and mean of the decidecade band SPL and (bottom)
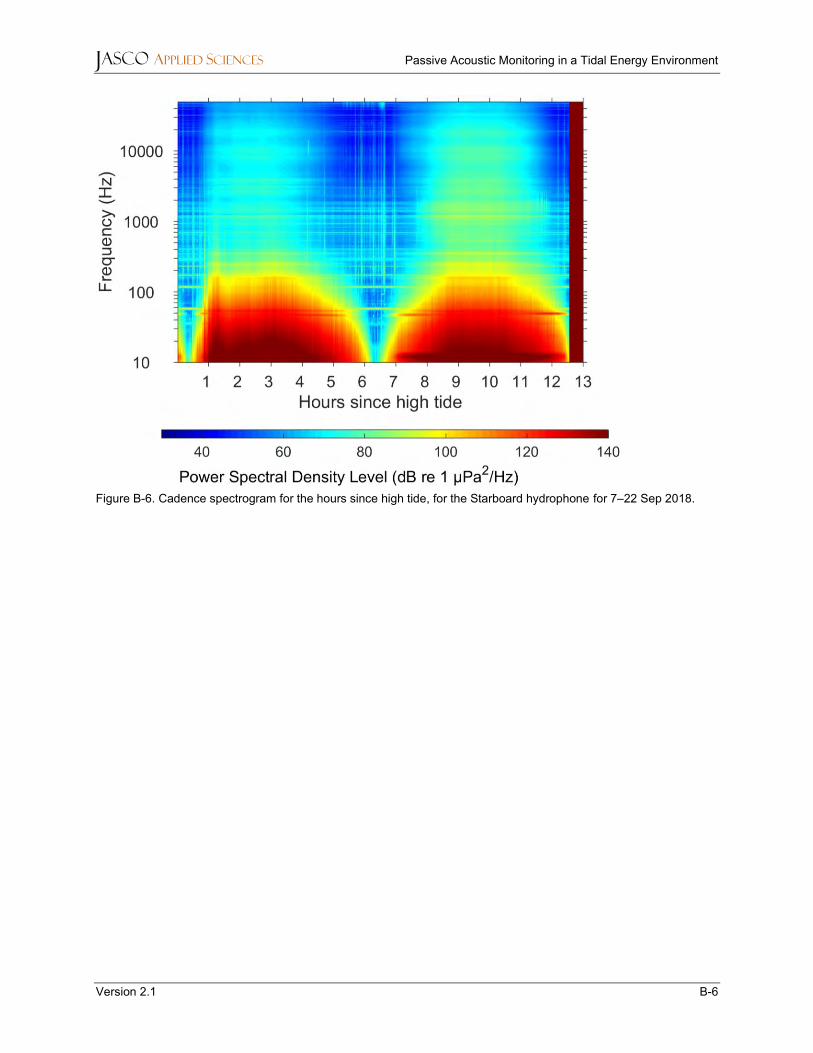
exceedance percentiles and probability density (grayscale) of 1-min PSD levels ...............................B-5 Figure B-6. Cadence spectrogram for the hours since high tide, for the Starboard hydrophone for 7–
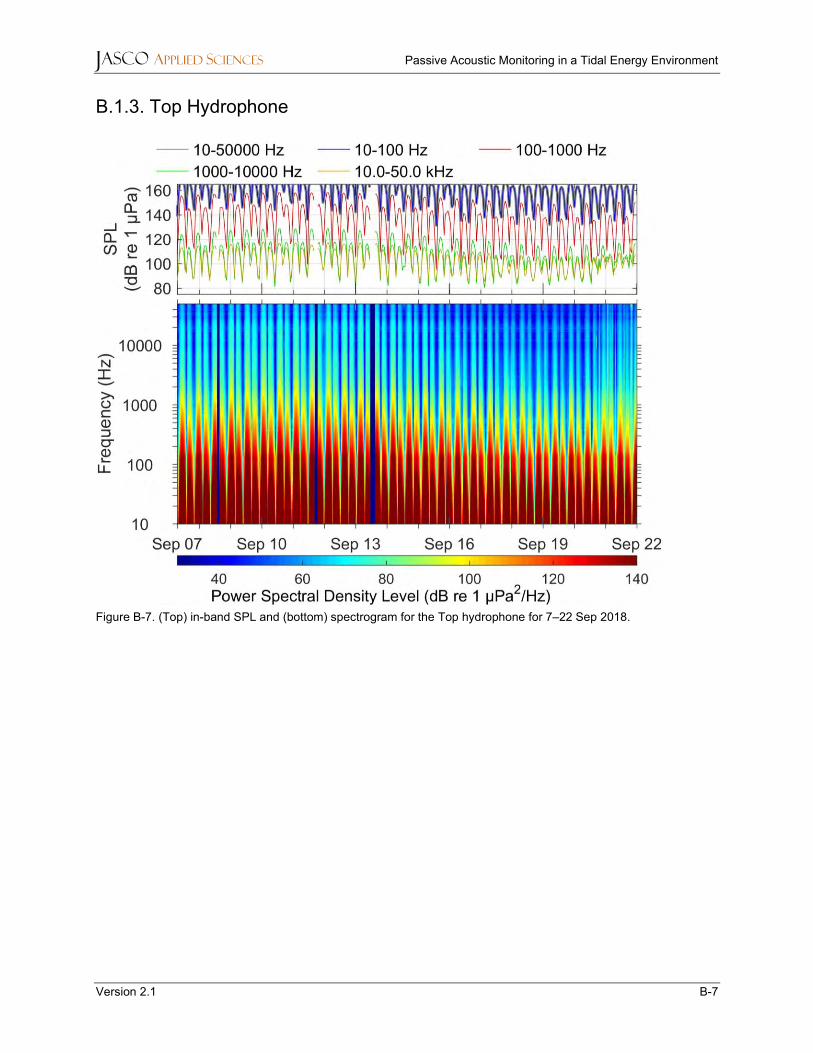
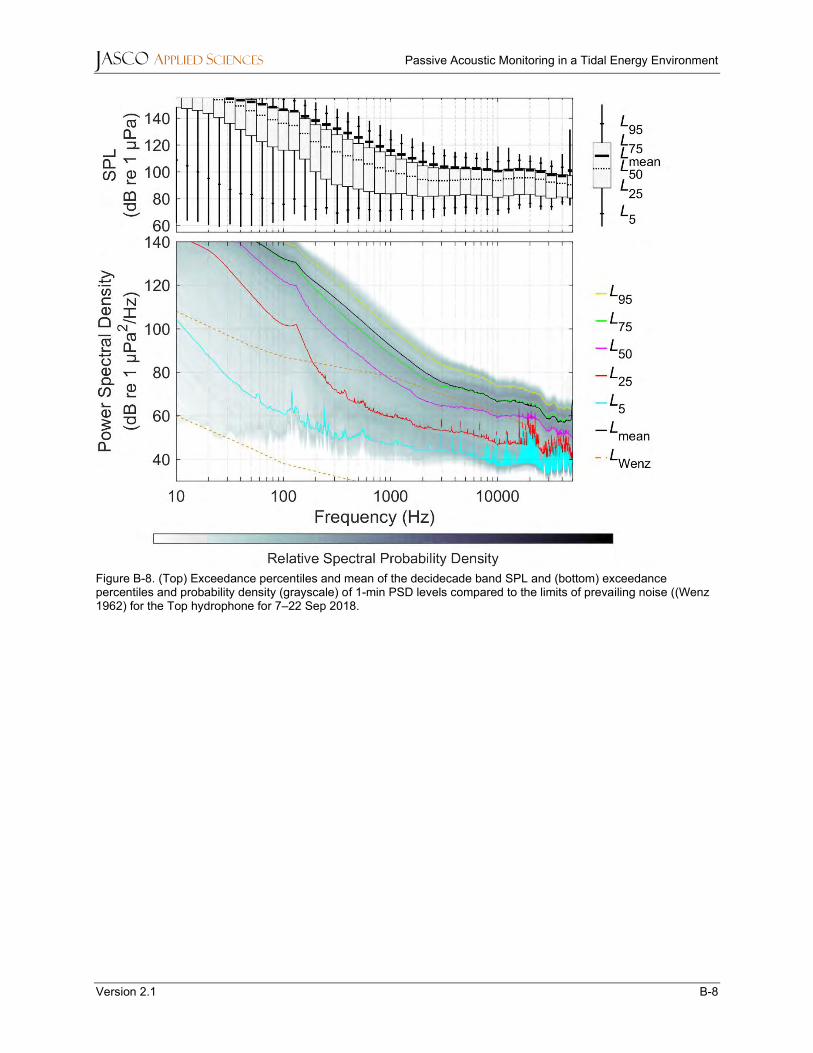
22 Sep 2018. .........................................................................................................................................B-6 Figure B-7. (Top) in-band SPL and (bottom) spectrogram for the Top hydrophone for 7–22 Sep 2018. ..B-7 Figure B-8. (Top) Exceedance percentiles and mean of the decidecade band SPL and (bottom)
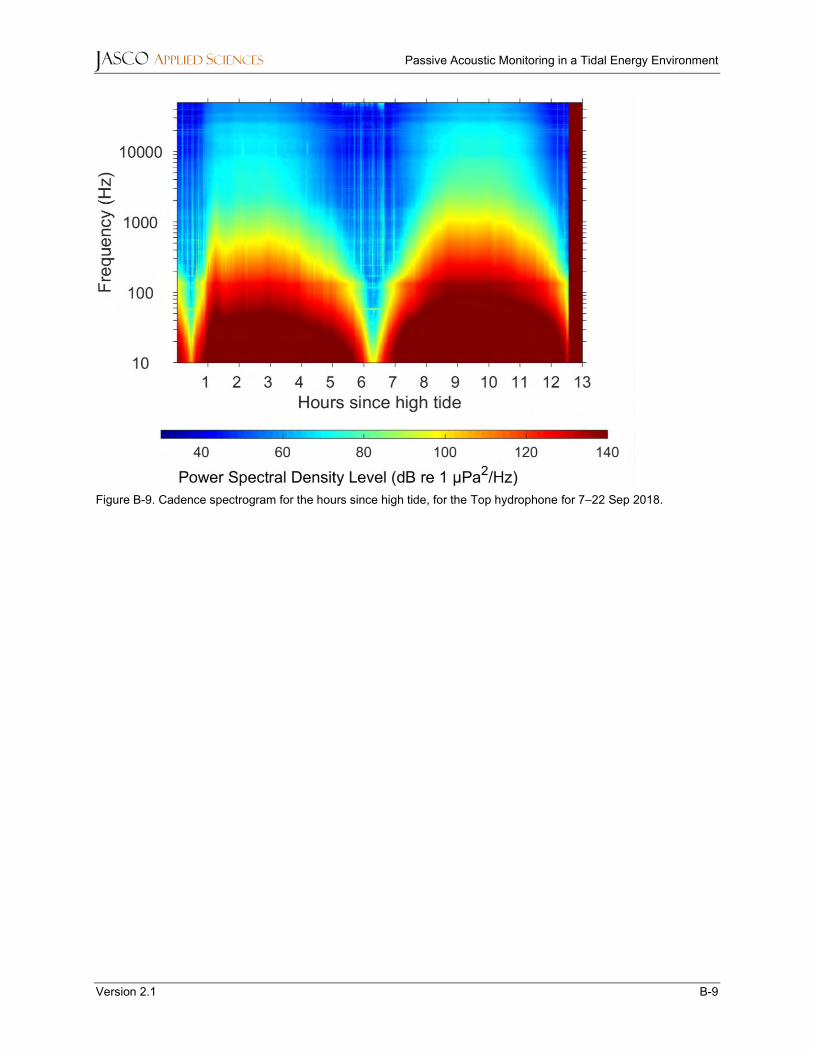
exceedance percentiles and probability density (grayscale) of 1-min PSD levels ...............................B-8 Figure B-9. Cadence spectrogram for the hours since high tide, for the Top hydrophone for 7–
22 Sep 2018. .........................................................................................................................................B-9 Figure B-10. (Top) in-band SPL and (bottom) spectrogram for the FAST platform hydrophone for 7–
22 Sep 2018. .......................................................................................................................................B-10 Figure B-11. (Top) Exceedance percentiles and mean of the decidecade band SPL and (bottom)
exceedance percentiles and probability density (grayscale) of 1-min PSD levels .............................B-11 Figure B-12. Cadence spectrogram for the hours since high tide, for the FAST platform hydrophone
for 7–22 Sep 2018. .............................................................................................................................B-12 Figure B-13. (Top) in-band SPL and (bottom) spectrogram for the AMAR hydrophone for July to
November 2018. .................................................................................................................................B-13 Figure B-14. (Top) Exceedance percentiles and mean of the decidecade band SPL and (bottom)
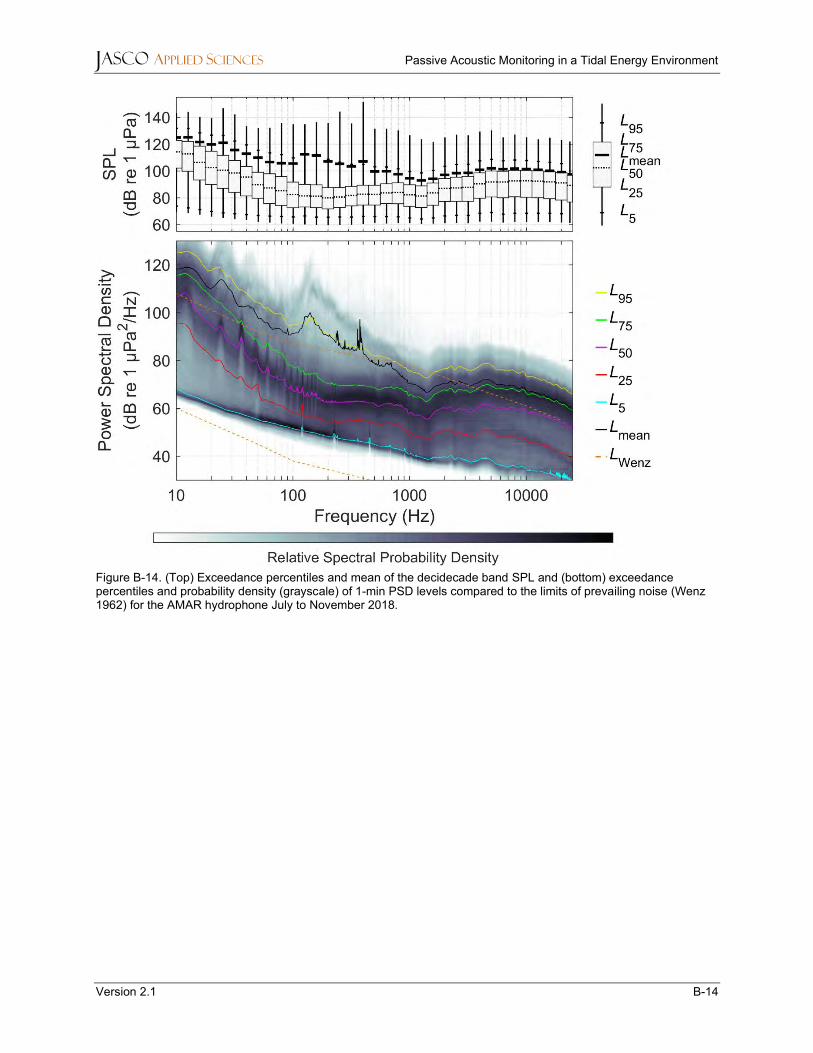
exceedance percentiles and probability density (grayscale) of 1-min PSD levels .............................B-14

JASCO APPLIED SCIENCES Passive Acoustic Monitoring in a Tidal Energy Environment
Version 2.1 iv
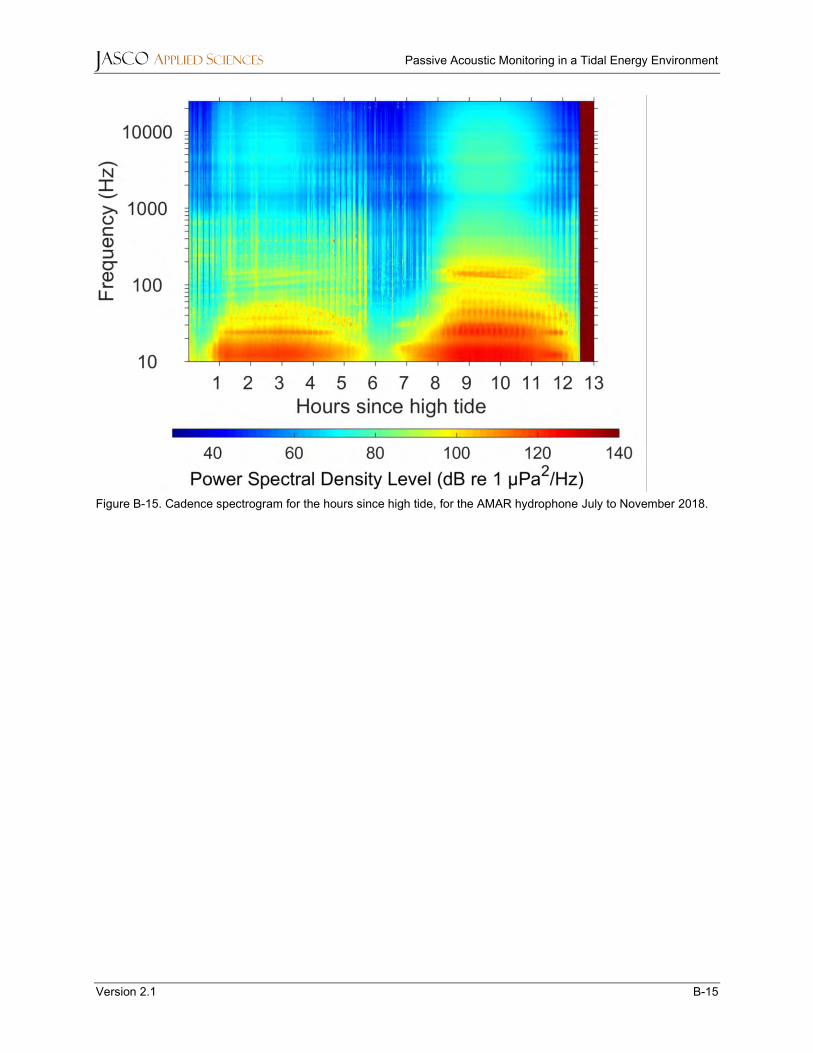
Figure B-15. Cadence spectrogram for the hours since high tide, for the AMAR hydrophone July to November 2018. .................................................................................................................................B-15
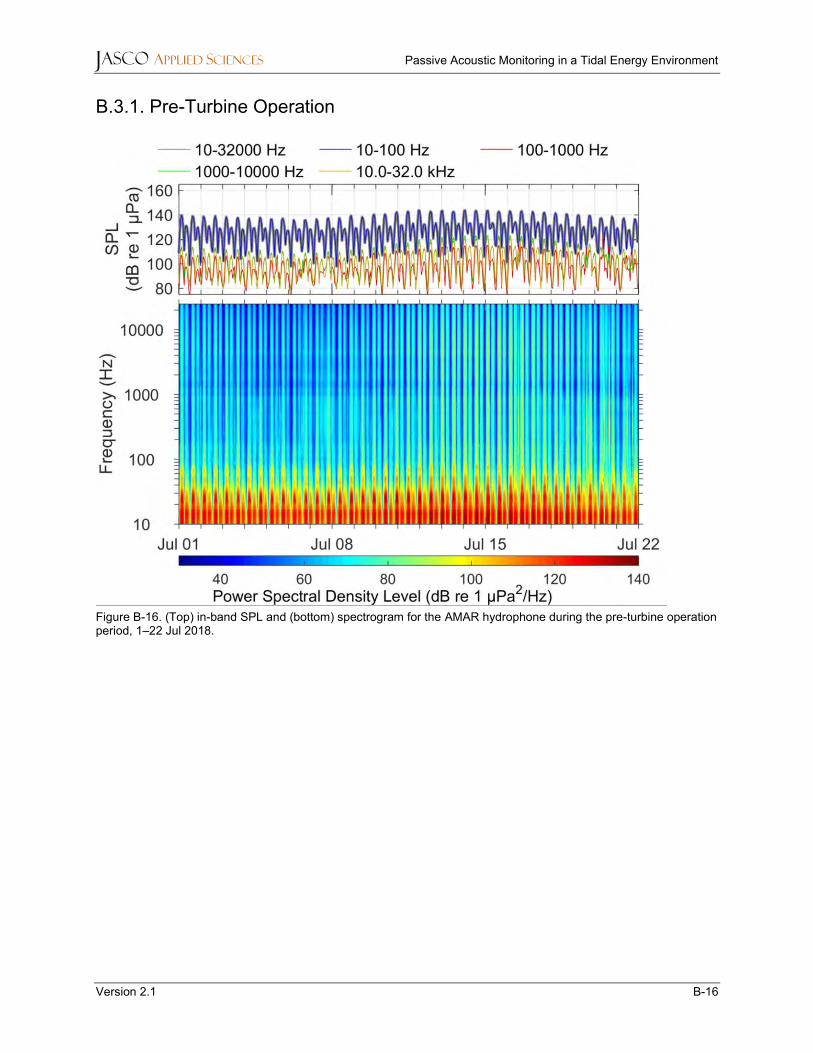
Figure B-16. (Top) in-band SPL and (bottom) spectrogram for the AMAR hydrophone during the pre-turbine operation period, 1–22 Jul 2018. ............................................................................................B-16
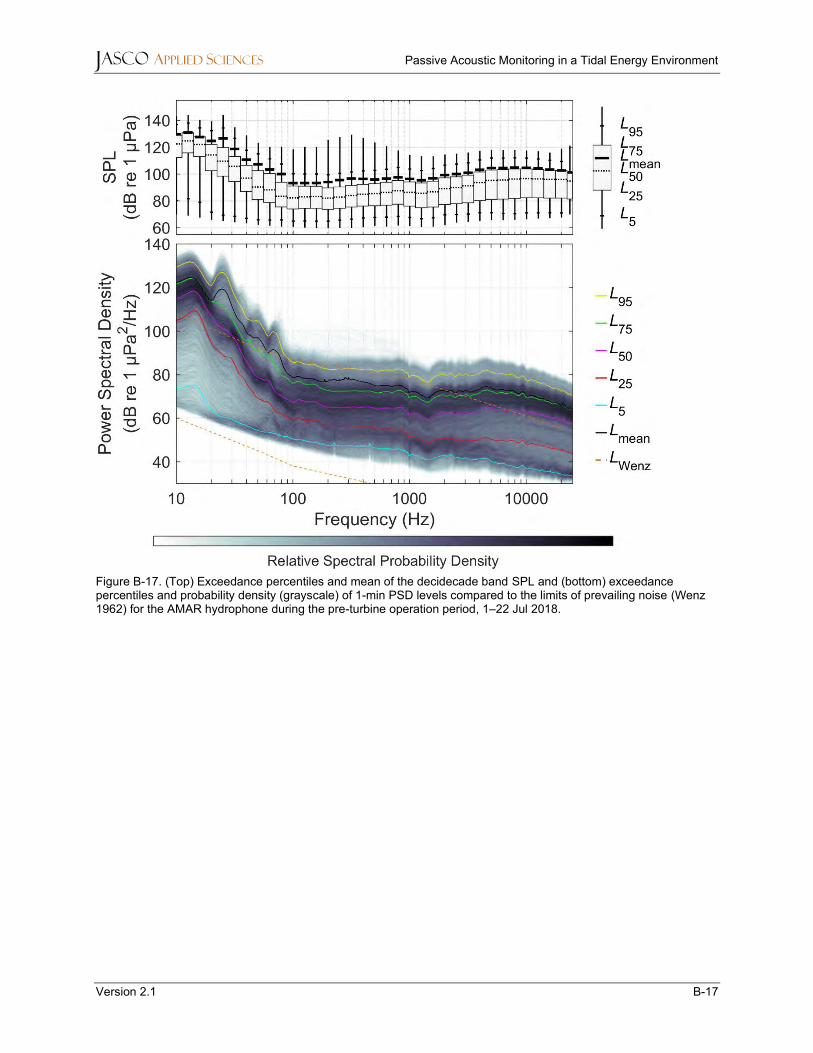
Figure B-17. (Top) Exceedance percentiles and mean of the decidecade band SPL and (bottom) exceedance percentiles and probability density (grayscale) of 1-min PSD levels compared to the limits of prevailing noise (Wenz 1962) for the AMAR hydrophone during the pre-turbine operation period, 1–22 Jul 2018. ........................................................................................................................B-17
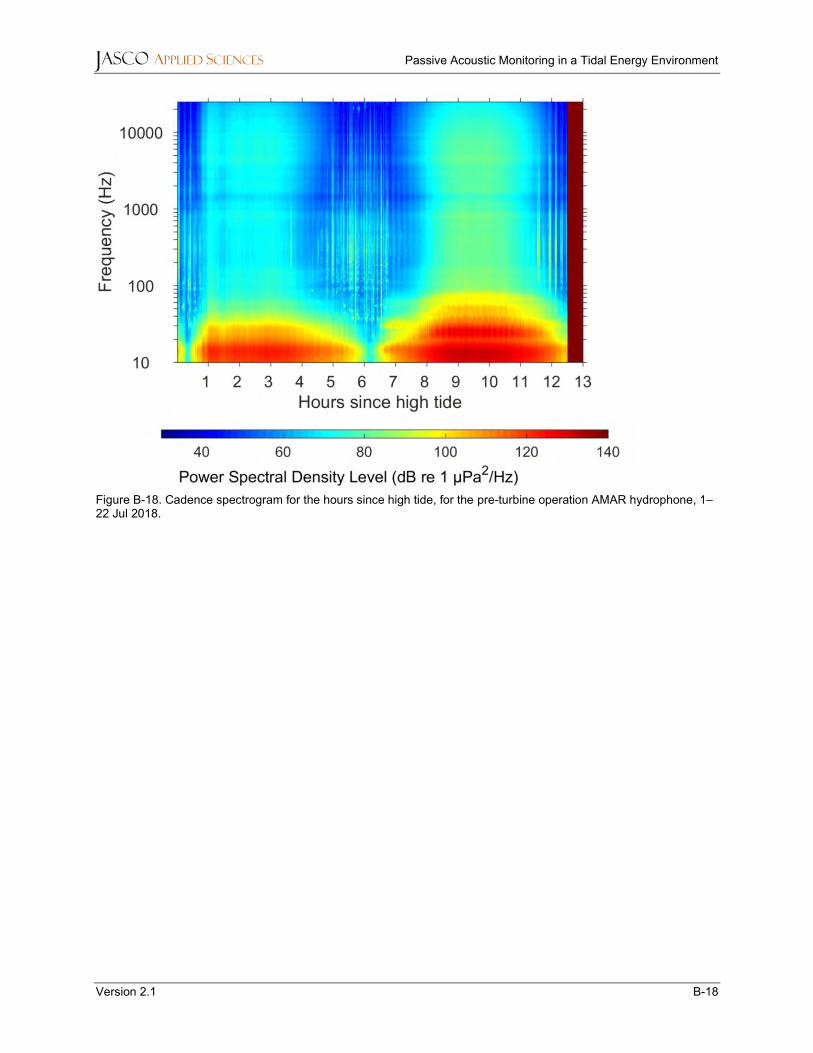
Figure B-18. Cadence spectrogram for the hours since high tide, for the pre-turbine operation AMAR hydrophone, 1–22 Jul 2018. ...............................................................................................................B-18
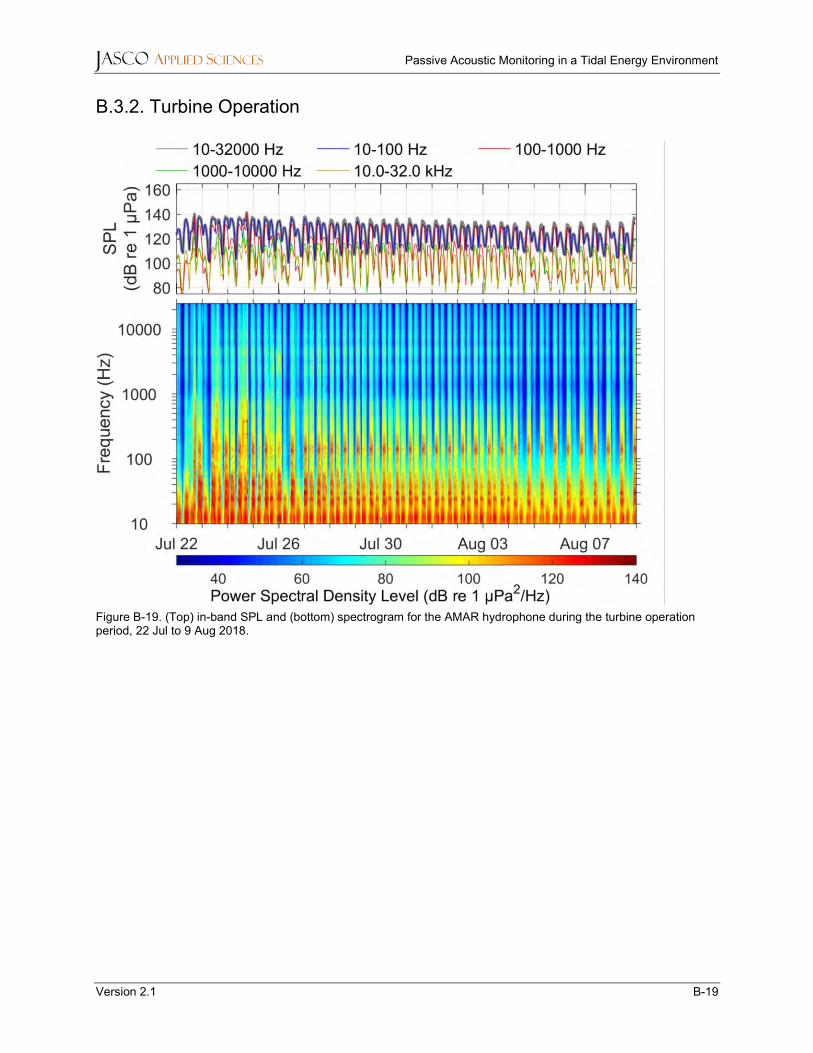
Figure B-19. (Top) in-band SPL and (bottom) spectrogram for the AMAR hydrophone during the turbine operation period, 22 Jul to 9 Aug 2018. ..................................................................................B-19
Figure B-20. (Top) Exceedance percentiles and mean of the decidecade band SPL and (bottom) exceedance percentiles and probability density (grayscale) of 1-min PSD levels compared to the limits of prevailing noise (Wenz 1962) for the AMAR hydrophone during the turbine operation period, 22 Jul to 9 Aug 2018. ..............................................................................................................B-20
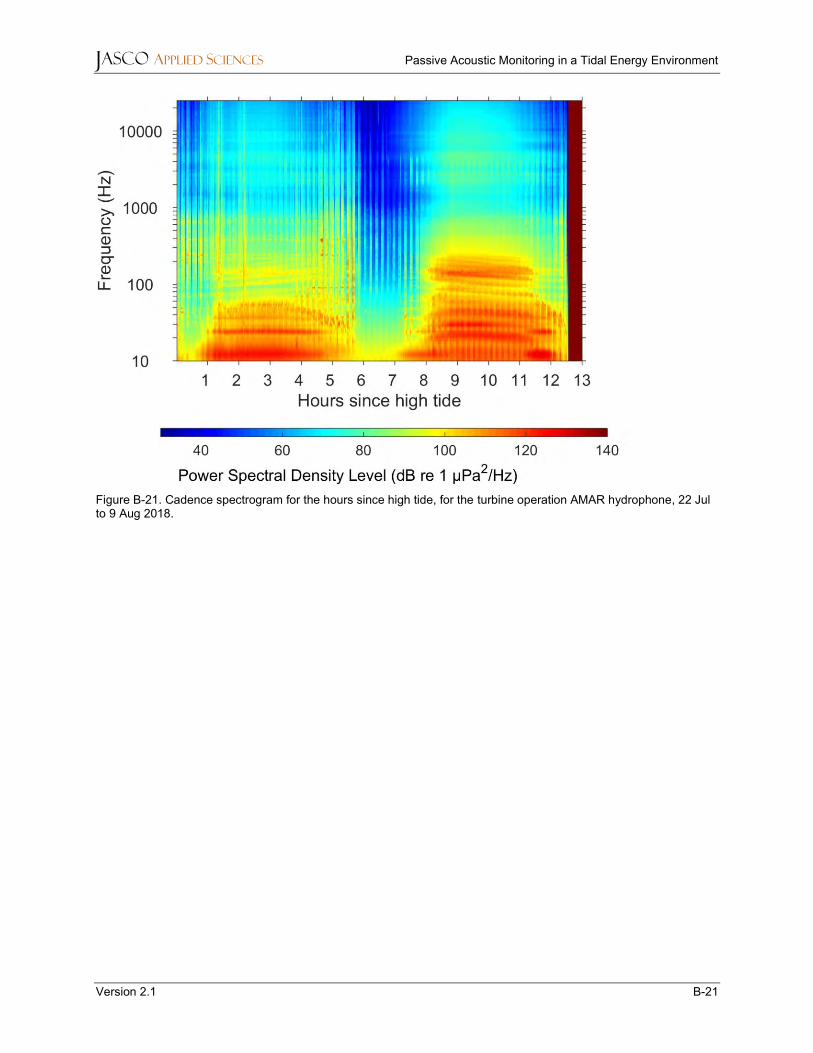
Figure B-21. Cadence spectrogram for the hours since high tide, for the turbine operation AMAR hydrophone, 22 Jul to 9 Aug 2018. .....................................................................................................B-21
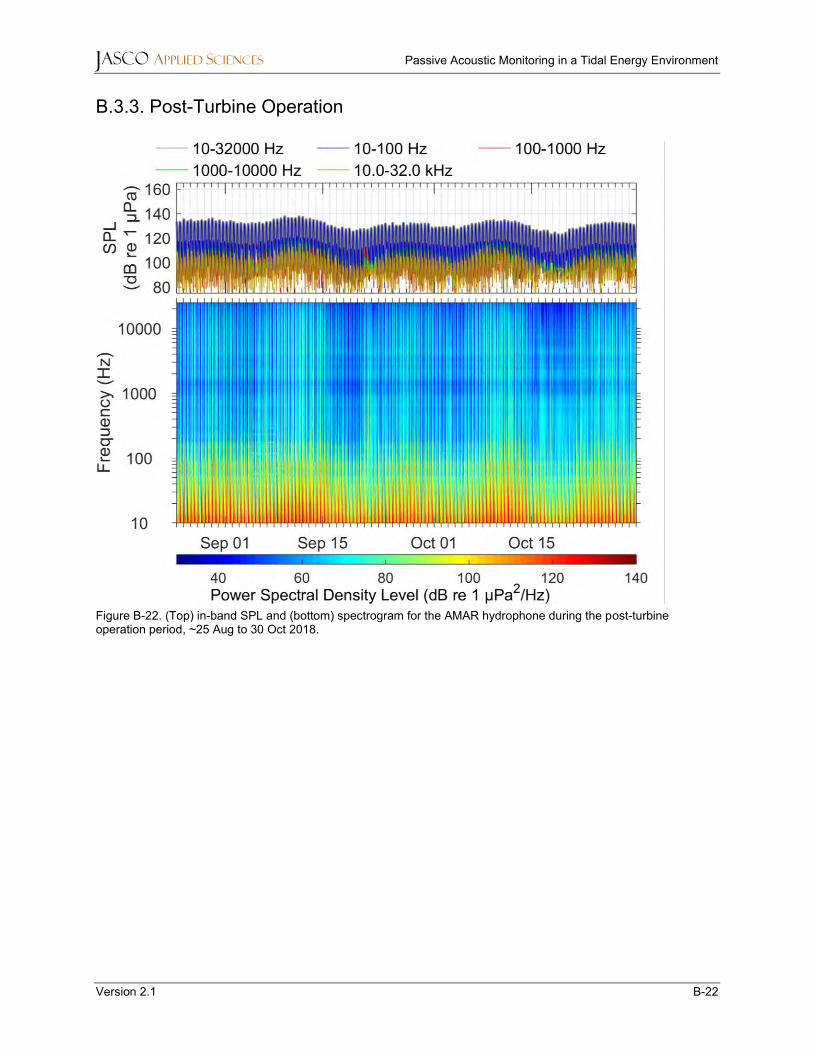
Figure B-22. (Top) in-band SPL and (bottom) spectrogram for the AMAR hydrophone during the post-turbine operation period, ~25 Aug to 30 Oct 2018......................................................................B-22
Figure B-23. (Top) Exceedance percentiles and mean of the decidecade band SPL and (bottom) exceedance percentiles and probability density (grayscale) of 1-min PSD levels compared to the limits of prevailing noise (Wenz 1962) for the AMAR hydrophone during the post-turbine operation period, ~25 Aug to 30 Oct 2018. .........................................................................................................B-23
Figure B-24. Cadence spectrogram for the hours since high tide, for the post-turbine operation AMAR hydrophone, ~25 Aug to 30 Oct 2018. ....................................................................................B-24
Tables
Table 1. Recording dates, mounting locations and sample rates of each hydrophone. ............................... 2 Table 2. Summary of the effects of flow speed on flow-induced noise cut-off frequency and increase
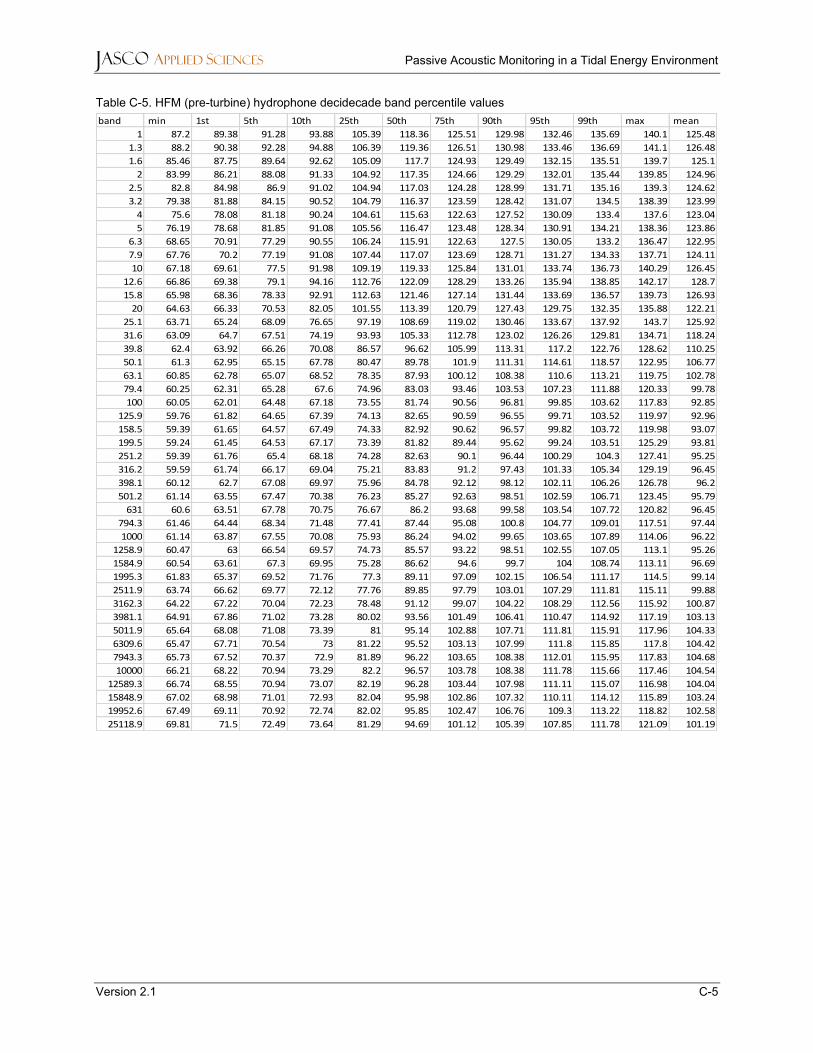
in sound levels. ........................................................................................................................................ 9 Table A-1. Data from the turbine-mounted icListen. ..................................................................................A-1 Table A-2. Data from the platform icListen. ...............................................................................................A-2 Table A-3. AMAR deployment locations ....................................................................................................A-3 Table A-4. HF AMAR recording schedule ..................................................................................................A-4 Table C-1. Aft hydrophone decidecade band percentile values ............................................................... C-1 Table C-2. Starboard hydrophone decidecade band percentile values .................................................... C-2 Table C-3. Top hydrophone decidecade band percentile values ............................................................. C-3 Table C-4. FAST platform hydrophone decidecade band percentile values ............................................ C-4 Table C-5. HFM (pre-turbine) hydrophone decidecade band percentile values ....................................... C-5 Table C-6. HFM (turbine on) hydrophone decidecade band percentile values ........................................ C-6 Table C-7. HFM (post-cover loss) hydrophone decidecade band percentile values ................................ C-7

JASCO APPLIED SCIENCES Passive Acoustic Monitoring in a Tidal Energy Environment
Version 2.1 1
1. Introduction
Passive acoustic monitoring (PAM) is expected to be an important component of environmental management plans around marine hydro-kinetic energy sites, including tidal turbines. There are two main roles envisioned for PAM: 1) measuring sound emitted by turbines to determine the distance at which it may injure or disturb marine life and 2) monitoring the presence of vocalizing marine animals (especially porpoises) and how they interact with the turbines. In both roles, it is important to understand the noise levels from true sounds in the environment and pseudo-noise generated by flow around the hydrophones used to record the data.
Martin et al. (2018) analyzed data from drifting, turbine-mounted hydrophones and autonomous hydrophones during the first deployment of the OpenHydro Open-Centre turbine at the Fundy Ocean Research Centre for Energy (FORCE) site in Minas Passage, NS. They demonstrated that drifting hydrophones had the lowest noise levels, as expected, but they were limited to measurement durations on the order of minutes. The report concluded that drifters are well suited for determining the acoustic propagation loss for sound emitted by the turbine because drifters can measure sound levels as a function of range as they move past the turbines. Flow noise on hydrophones fixed to the turbine platform depended on the height of the hydrophone off the seabed, where higher hydrophones suffered from higher levels of flow-induced noise. Flow noise measured by the hydrophone on top of the turbine extended as high as 10 kHz in frequency. The autonomous hydrophone had lower flow noise measurements than the turbine mounted hydrophones. Relationships between flow speed, current direction, and turbine operating mode were developed that allow users to predict sound levels for future applications.
The Martin et al. (2018) report was unable to compare sound levels before and after the turbine was installed since data were not recorded prior to the turbine installation. The data also contained few porpoise detections, which was unsurprising because porpoise activity typically peaks in May to June, and the data were recorded in November and December 2016.
This report analyzes data collected from June to November 2018. Data were available from a JASCO Autonomous Multichannel Acoustic Recorder (AMAR) in the same autonomous mooring used in 2016. The AMAR data were available for the entire June-November period; however, approximately halfway through the period the neoprene cover was torn from the mooring cover. Data were also available for parts of September 2018 from icListen hydrophones mounted on the turbine and an icListen hydrophone mounted on a FAST platform 60 m from the Open-Centre turbine. The turbine was installed in late July 2018 and ceased operating on 9 Aug 2018.
This report aims to:
1. Compare sound levels at measurement locations using the 1-minute power spectral density (PSD) and decidecade sound pressure levels to determine frequencies impacted by flow noise in the 10th, 25th, 50th, 75th, and 90th percentiles.
2. Evaluate the performance of the hydrophones with respect to flow noise and system noise.
3. Compare the sound levels in Minas Passage without the turbine, with the turbine free-spinning, and with the turbine stationary.
4. Examine the impact of the loss of the neoprene cover from the AMAR high-flow-mooring.
Section 2 provides an overview of the methods employed for data collection and analysis, which are explained in more detail in Appendix A. Section 3 provides the high-level results obtained, with supplemental figures provided in Appendix B. Section 4 contains a comparison of the spectral percentiles and decidecade percentiles between monitoring positions and sensors.
JASCO APPLIED SCIENCES Passive Acoustic Monitoring in a Tidal Energy Environment
Version 2.1 2
2. General Methods
This section summarizes the measurements and the analysis performed on the data. Detailed methods including information on the recorders is contained in Appendix A.
2.1. Data Collection
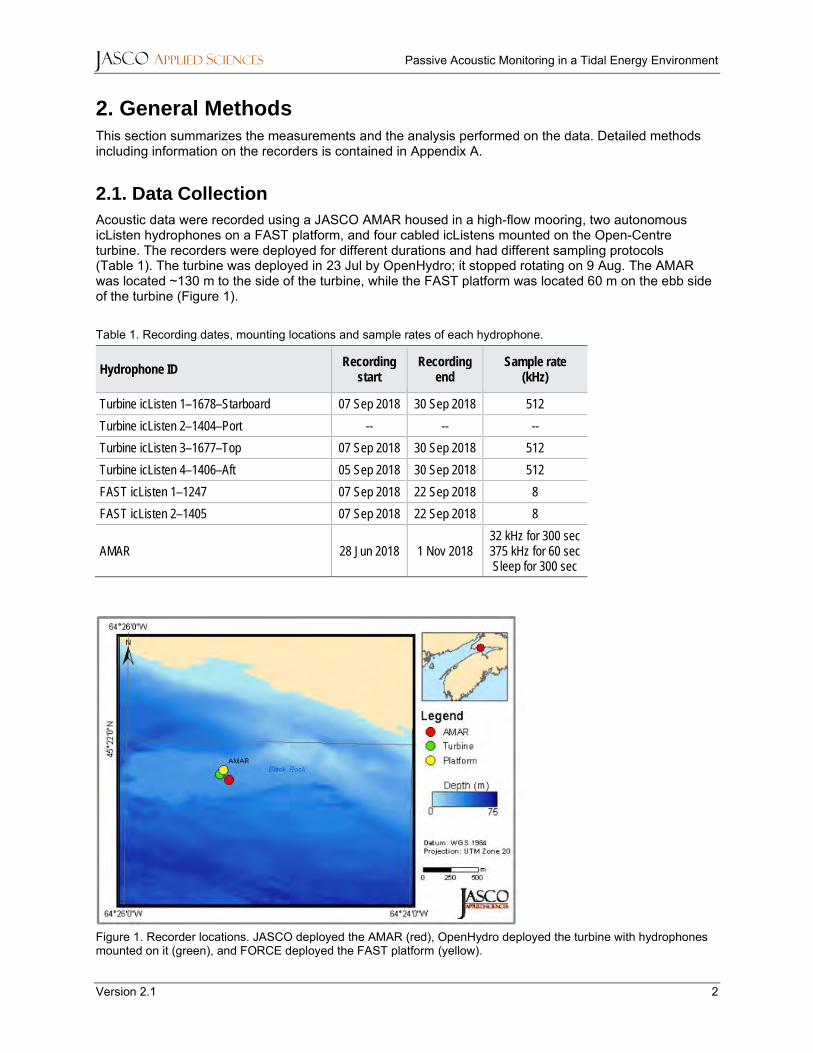
Acoustic data were recorded using a JASCO AMAR housed in a high-flow mooring, two autonomous icListen hydrophones on a FAST platform, and four cabled icListens mounted on the Open-Centre turbine. The recorders were deployed for different durations and had different sampling protocols (Table 1). The turbine was deployed in 23 Jul by OpenHydro; it stopped rotating on 9 Aug. The AMAR was located ~130 m to the side of the turbine, while the FAST platform was located 60 m on the ebb side of the turbine (Figure 1).
Table 1. Recording dates, mounting locations and sample rates of each hydrophone.
Hydrophone ID Recording
start Recording
end Sample rate
(kHz)
Turbine icListen 1–1678–Starboard 07 Sep 2018 30 Sep 2018 512
Turbine icListen 2–1404–Port -- -- --
Turbine icListen 3–1677–Top 07 Sep 2018 30 Sep 2018 512
Turbine icListen 4–1406–Aft 05 Sep 2018 30 Sep 2018 512
FAST icListen 1–1247 07 Sep 2018 22 Sep 2018 8
FAST icListen 2–1405 07 Sep 2018 22 Sep 2018 8
AMAR 28 Jun 2018 1 Nov 2018 32 kHz for 300 sec 375 kHz for 60 sec Sleep for 300 sec
Figure 1. Recorder locations. JASCO deployed the AMAR (red), OpenHydro deployed the turbine with hydrophones mounted on it (green), and FORCE deployed the FAST platform (yellow).
JASCO APPLIED SCIENCES Passive Acoustic Monitoring in a Tidal Energy Environment
Version 2.1 3
2.2. Data Analysis
The objectives of this data analysis were to compare the 1-minute power spectral density and decidecade sound pressure levels to determine frequencies impacted by flow noise in the 10th, 25th, 50th, 75th, and 90th percentiles. This comparison is effective for evaluating hydrophone performance with respect to flow noise and system noise and for examining the impact of the loss of the neoprene cover for the autonomous recorder. The acoustic metrics used for these analyzes were 1-minute broadband sound pressure levels (SPL), power spectral density (PSD), and decidecade-band SPL. One-minute statistics were used to match the time resolution of the current speed and turbine state data set.
The metrics used throughout this report are level quantities. This means that they are ten times the logarithm (base 10) of an acoustic field quantity divided by its reference value, and the units have the form ‘dB re 1 µPa²’ (see ISO 2017). A result, a 10 dB increase in the level is equivalent to multiplying the acoustic measurement by 10.
The following results are presented in Appendix A:
• Combined ambient SPL and spectrogram versus time plots: The broadband and decade band results represent SPL in in 1-minute periods as averages of 1-second Hanning-windowed spectra with 50% overlap. The results are presented in five frequency bands: first the broadband 10–50000 Hz, and then the following bands: 10–100 Hz, 100–1000 Hz, 1000–10000 Hz, and 10000–50000 Hz.
• Decidecade band levels and spectral level plots: The 1-minute power spectral density averages are displayed at 5th, 25th, 50th, 75th, and 95th percentile levels, referred to as L5, L25, L50, L75, and L95, respectively. By ANSI (American National Standards Institute) standard, L5 is the sound level only exceeded 5% of the time, and it is therefore larger than L95 (ANSI S1.43-1997 R2007). L50 is commonly referred to as the median. The frequency range displayed spans the acoustic bandwidth of the recording. The decidecade band levels are calculated similar to the spectral levels, except the 1-minute spectra are first integrated within the decidecade bands between 10 Hz and 50 kHz, which are then displayed at 5th, 25th, 50th, 75th, and 95th percentile levels. The mean band levels are also shown.
• Cadence plots: The data are examined in 10-minute steps throughout one day (i.e., from 0:00–0:10, 0:10–0:20, …, 23:50–24:00). Each 10-minute step is comprised of ten 1-minute bins. The median value is calculated from these bins for a given time each day. For example, in a 30-day month, the daily L50 for 12:00–12:10 is the median of the ten 1-minute samples each day for all 30 days (from 300 1-minute samples). Plotting the daily cadences can reveal patterns associated with human activity, such as from ferries and other regularly-scheduled vessel passages.
2.3. Recorder Calibration
The AMAR instrumentation used in this study was calibrated before and after each use (see Appendix A.2). Calibrations were validated after data collection and before data analysis to verify instrument performance, as a standard part of JASCO’s ISO 9001 Quality Management System. Data from other instrumentation were analyzed according to manufacturer-supplied calibration information.

JASCO APPLIED SCIENCES Passive Acoustic Monitoring in a Tidal Energy Environment
Version 2.1 4
3. Results
3.1. Acoustic Doppler Current Profiler (ADCP) Data
A Teledyne Workhorse ADCP mounted on the turbine recorded water depths, total rms water speeds and direction throughout the acoustic recording period (Figure 2). The water speeds were measured at the 1st and 10th, 0.5 m bins above the transducer. The ADCP had a 1.6 m blanking distance, and data was provided by FORCE with mounting unknown. These speeds and depths were used to correlate with sound level recordings in decade bands, to relate flow and flow noise.
Figure 2. Water depths and total root-mean-square (rms) water speeds at the first 0.5 m bin (near-bottom) measured by the Acoustic Doppler current profiler (ADCP). Colour variation in the water speed panel are a result of flood/ebb asymmetry and superimposing of absolute speeds.
3.2. Turbine-mounted icListen Results
Three icListen hydrophones recorded data during September 2018, at locations ‘Aft’, ‘Top’, and ‘Stbd’ (see Figure A-1 and Table A-1). The turbine was not in operation when the icListens were recording. Appendix B.1 contains detailed figures of the sound levels for the icListen hydrophones on the turbine.
The Aft hydrophone recorded much lower sound levels than any other recorder (Figures B-1 to B-3), particularly in the lower frequencies below ~1000 Hz. Further investigation is needed for this hydrophone, potentially with regards to the mounting location and whether that may have caused it to be protected from flow noise.
The Top and Stbd hydrophones recorded high levels of low-frequency sound (Figures B-4 to B-9), which we attribute to the high-flow environment. The tidal signal was very clear, including an increase/decrease of sound levels corresponding to the increase/decrease of current velocities. Both hydrophones recorded slightly higher values on the flood tide, and much decreased sound levels during slack tide. The Top hydrophone levels were higher than the Starboard by approximately 20 dB at frequencies below 1000 Hz. Since this hydrophone is mounted at the top of the turbine and tidal velocity decays with depth, it would be subjected to higher flows, which could have caused the increased flow noise. Above approximately
JASCO APPLIED SCIENCES Passive Acoustic Monitoring in a Tidal Energy Environment
Version 2.1 5
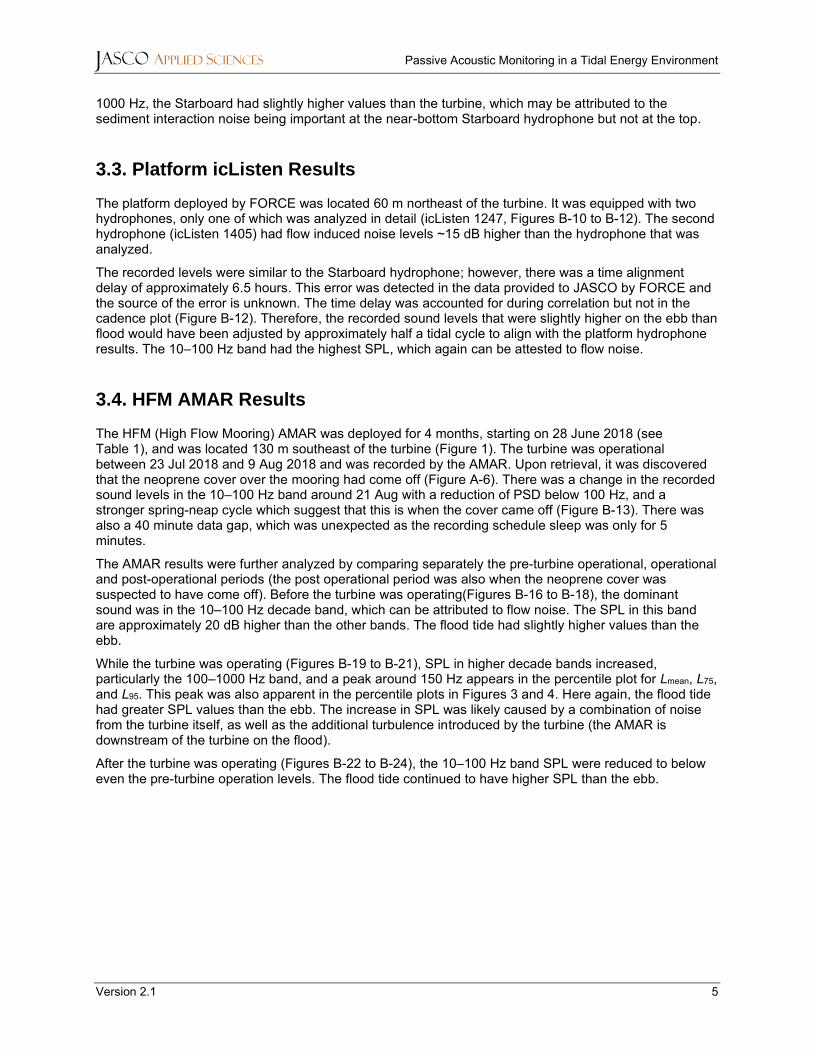
1000 Hz, the Starboard had slightly higher values than the turbine, which may be attributed to the sediment interaction noise being important at the near-bottom Starboard hydrophone but not at the top.
3.3. Platform icListen Results
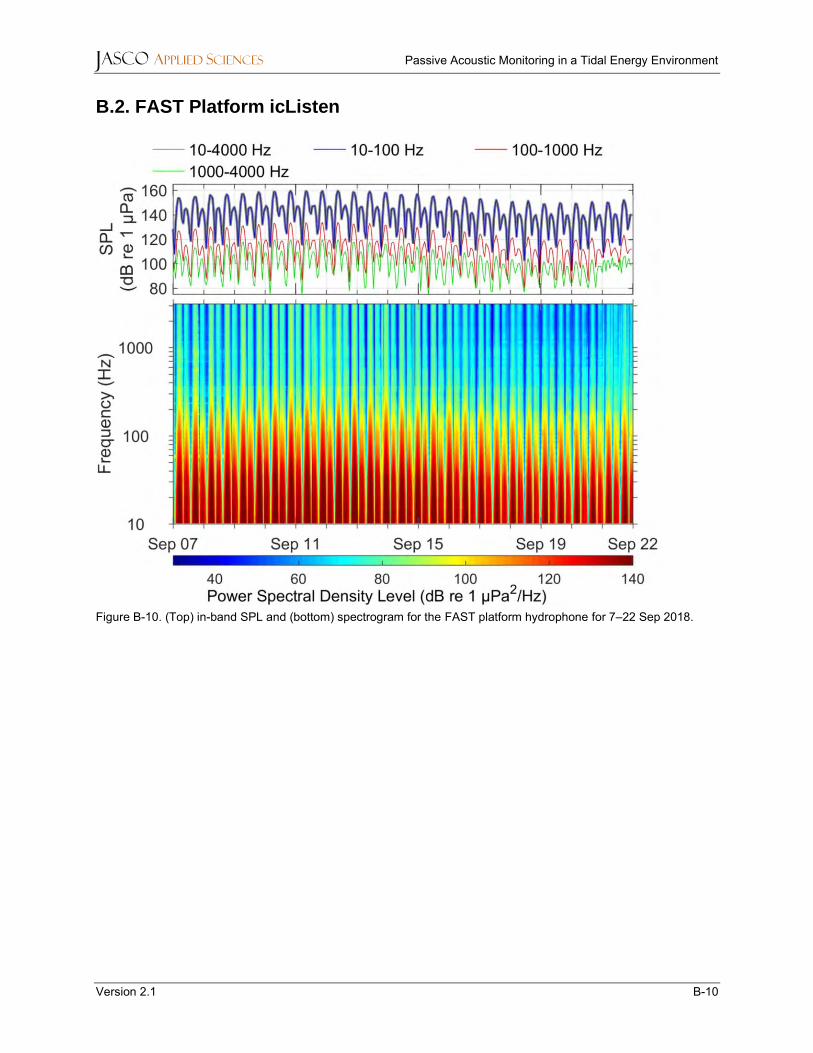
The platform deployed by FORCE was located 60 m northeast of the turbine. It was equipped with two hydrophones, only one of which was analyzed in detail (icListen 1247, Figures B-10 to B-12). The second hydrophone (icListen 1405) had flow induced noise levels ~15 dB higher than the hydrophone that was analyzed.
The recorded levels were similar to the Starboard hydrophone; however, there was a time alignment delay of approximately 6.5 hours. This error was detected in the data provided to JASCO by FORCE and the source of the error is unknown. The time delay was accounted for during correlation but not in the cadence plot (Figure B-12). Therefore, the recorded sound levels that were slightly higher on the ebb than flood would have been adjusted by approximately half a tidal cycle to align with the platform hydrophone results. The 10–100 Hz band had the highest SPL, which again can be attested to flow noise.
3.4. HFM AMAR Results
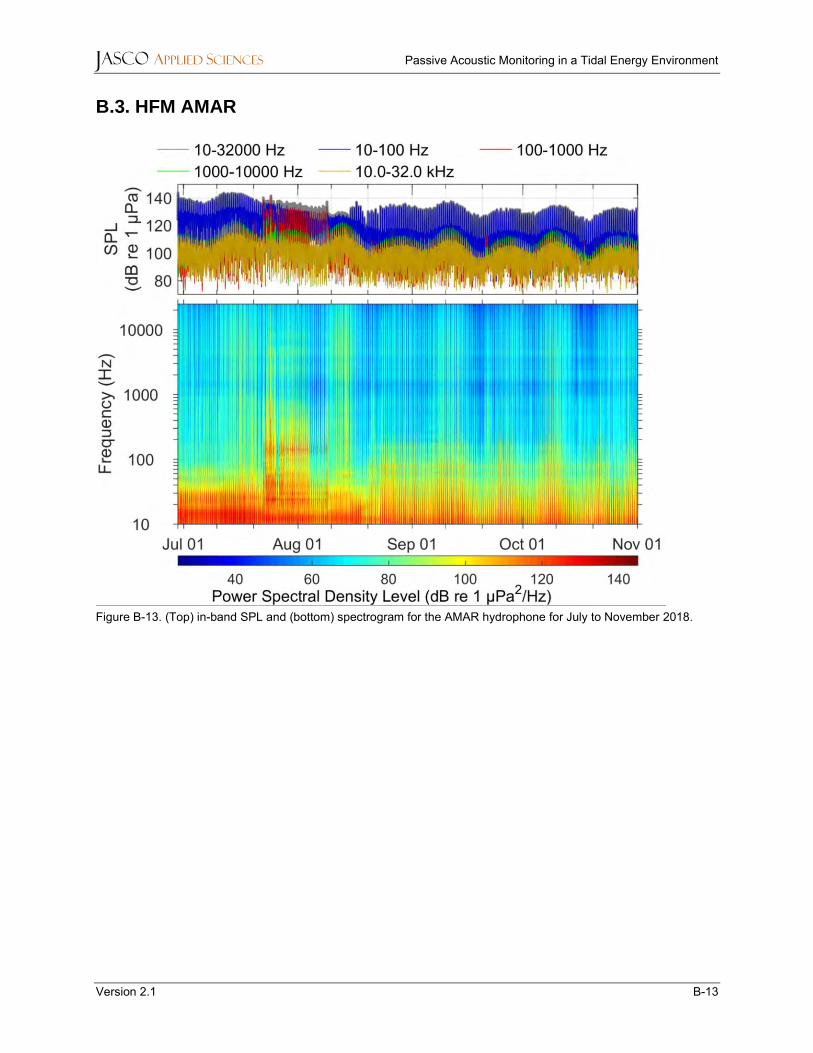
The HFM (High Flow Mooring) AMAR was deployed for 4 months, starting on 28 June 2018 (see Table 1), and was located 130 m southeast of the turbine (Figure 1). The turbine was operational between 23 Jul 2018 and 9 Aug 2018 and was recorded by the AMAR. Upon retrieval, it was discovered that the neoprene cover over the mooring had come off (Figure A-6). There was a change in the recorded sound levels in the 10–100 Hz band around 21 Aug with a reduction of PSD below 100 Hz, and a stronger spring-neap cycle which suggest that this is when the cover came off (Figure B-13). There was also a 40 minute data gap, which was unexpected as the recording schedule sleep was only for 5 minutes.
The AMAR results were further analyzed by comparing separately the pre-turbine operational, operational and post-operational periods (the post operational period was also when the neoprene cover was suspected to have come off). Before the turbine was operating(Figures B-16 to B-18), the dominant sound was in the 10–100 Hz decade band, which can be attributed to flow noise. The SPL in this band are approximately 20 dB higher than the other bands. The flood tide had slightly higher values than the ebb.
While the turbine was operating (Figures B-19 to B-21), SPL in higher decade bands increased, particularly the 100–1000 Hz band, and a peak around 150 Hz appears in the percentile plot for Lmean, L75, and L95. This peak was also apparent in the percentile plots in Figures 3 and 4. Here again, the flood tide had greater SPL values than the ebb. The increase in SPL was likely caused by a combination of noise from the turbine itself, as well as the additional turbulence introduced by the turbine (the AMAR is downstream of the turbine on the flood).
After the turbine was operating (Figures B-22 to B-24), the 10–100 Hz band SPL were reduced to below even the pre-turbine operation levels. The flood tide continued to have higher SPL than the ebb.
JASCO APPLIED SCIENCES Passive Acoustic Monitoring in a Tidal Energy Environment
Version 2.1 6
4. Discussion
4.1. Comparison of Recording Locations
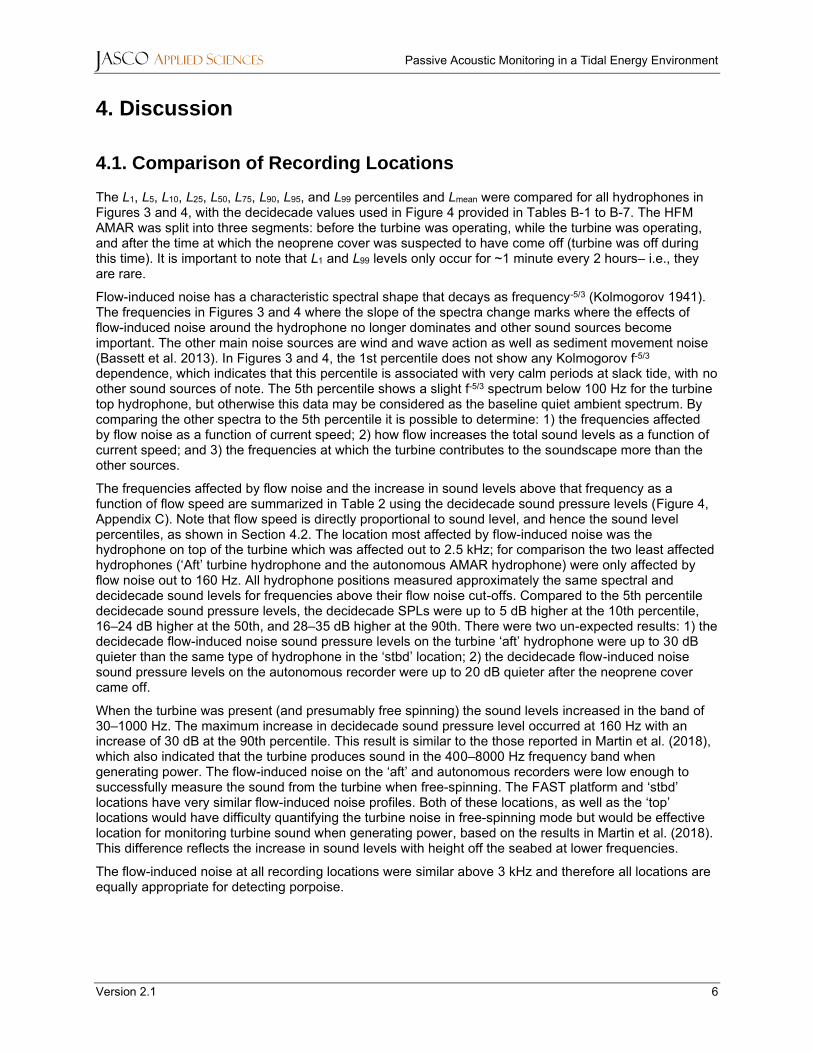
The L1, L5, L10, L25, L50, L75, L90, L95, and L99 percentiles and Lmean were compared for all hydrophones in Figures 3 and 4, with the decidecade values used in Figure 4 provided in Tables B-1 to B-7. The HFM AMAR was split into three segments: before the turbine was operating, while the turbine was operating, and after the time at which the neoprene cover was suspected to have come off (turbine was off during this time). It is important to note that L1 and L99 levels only occur for ~1 minute every 2 hours– i.e., they are rare.
Flow-induced noise has a characteristic spectral shape that decays as frequency-5/3 (Kolmogorov 1941). The frequencies in Figures 3 and 4 where the slope of the spectra change marks where the effects of flow-induced noise around the hydrophone no longer dominates and other sound sources become important. The other main noise sources are wind and wave action as well as sediment movement noise (Bassett et al. 2013). In Figures 3 and 4, the 1st percentile does not show any Kolmogorov f-5/3 dependence, which indicates that this percentile is associated with very calm periods at slack tide, with no other sound sources of note. The 5th percentile shows a slight f-5/3 spectrum below 100 Hz for the turbine top hydrophone, but otherwise this data may be considered as the baseline quiet ambient spectrum. By comparing the other spectra to the 5th percentile it is possible to determine: 1) the frequencies affected by flow noise as a function of current speed; 2) how flow increases the total sound levels as a function of current speed; and 3) the frequencies at which the turbine contributes to the soundscape more than the other sources.
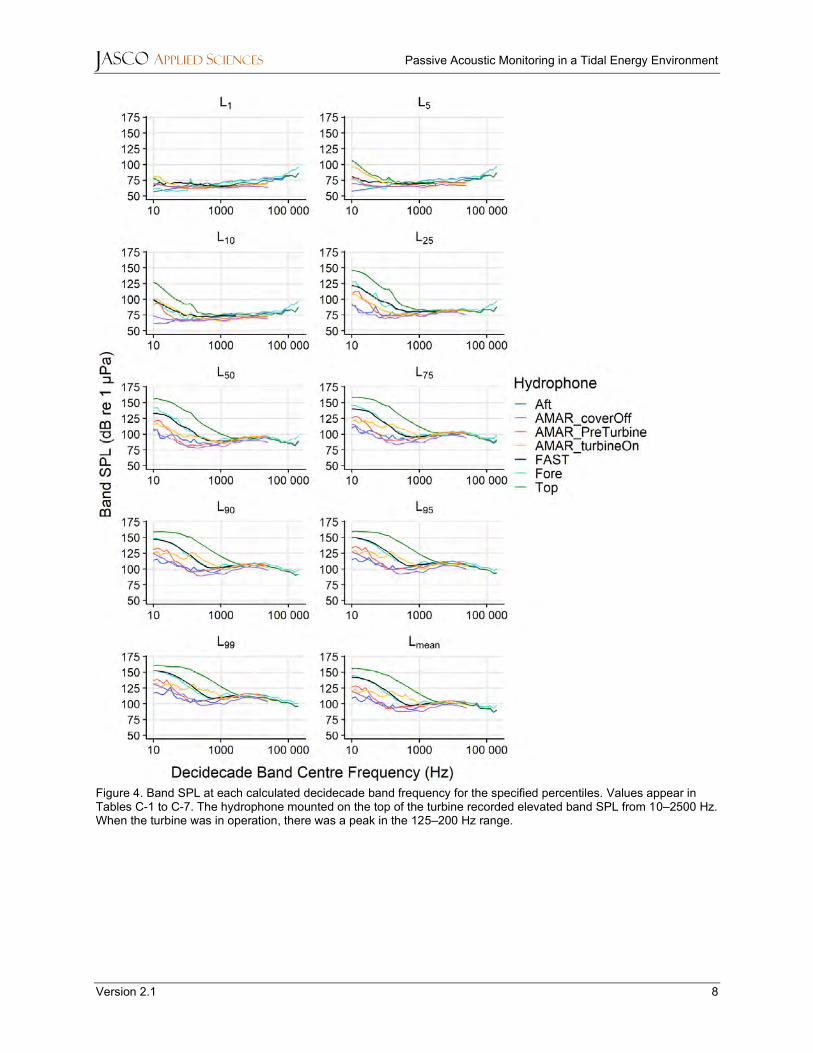
The frequencies affected by flow noise and the increase in sound levels above that frequency as a function of flow speed are summarized in Table 2 using the decidecade sound pressure levels (Figure 4, Appendix C). Note that flow speed is directly proportional to sound level, and hence the sound level percentiles, as shown in Section 4.2. The location most affected by flow-induced noise was the hydrophone on top of the turbine which was affected out to 2.5 kHz; for comparison the two least affected hydrophones (‘Aft’ turbine hydrophone and the autonomous AMAR hydrophone) were only affected by flow noise out to 160 Hz. All hydrophone positions measured approximately the same spectral and decidecade sound levels for frequencies above their flow noise cut-offs. Compared to the 5th percentile decidecade sound pressure levels, the decidecade SPLs were up to 5 dB higher at the 10th percentile, 16–24 dB higher at the 50th, and 28–35 dB higher at the 90th. There were two un-expected results: 1) the decidecade flow-induced noise sound pressure levels on the turbine ‘aft’ hydrophone were up to 30 dB quieter than the same type of hydrophone in the ‘stbd’ location; 2) the decidecade flow-induced noise sound pressure levels on the autonomous recorder were up to 20 dB quieter after the neoprene cover came off.
When the turbine was present (and presumably free spinning) the sound levels increased in the band of 30–1000 Hz. The maximum increase in decidecade sound pressure level occurred at 160 Hz with an increase of 30 dB at the 90th percentile. This result is similar to the those reported in Martin et al. (2018), which also indicated that the turbine produces sound in the 400–8000 Hz frequency band when generating power. The flow-induced noise on the ‘aft’ and autonomous recorders were low enough to successfully measure the sound from the turbine when free-spinning. The FAST platform and ‘stbd’ locations have very similar flow-induced noise profiles. Both of these locations, as well as the ‘top’ locations would have difficulty quantifying the turbine noise in free-spinning mode but would be effective location for monitoring turbine sound when generating power, based on the results in Martin et al. (2018). This difference reflects the increase in sound levels with height off the seabed at lower frequencies.
The flow-induced noise at all recording locations were similar above 3 kHz and therefore all locations are equally appropriate for detecting porpoise.

JASCO APPLIED SCIENCES Passive Acoustic Monitoring in a Tidal Energy Environment
Version 2.1 7
Figure 3. Comparison of all hydrophones at each percentile at all measured frequencies.
JASCO APPLIED SCIENCES Passive Acoustic Monitoring in a Tidal Energy Environment
Version 2.1 8
Figure 4. Band SPL at each calculated decidecade band frequency for the specified percentiles. Values appear in Tables C-1 to C-7. The hydrophone mounted on the top of the turbine recorded elevated band SPL from 10–2500 Hz. When the turbine was in operation, there was a peak in the 125–200 Hz range.
JASCO APPLIED SCIENCES Passive Acoustic Monitoring in a Tidal Energy Environment
Version 2.1 9
Table 2. Summary of the effects of flow speed on flow-induced noise cut-off frequency and increase in sound levels. These results were computed using the decidecade band sound pressure levels (Figure 4
Hydrophone position Metric L10 L50 L90
Aft
Flow-induced noise cut-off frequency band
10 Hz 50 Hz 160 Hz
Increase in decidecade band SPL <3 dB 20–24 dB 28–32 dB
AMAR–Cover Off
Flow-induced noise cut-off frequency band
16 Hz 50 Hz 160 Hz
Increase in decidecade band SPL < 3 dB 18–26 dB 27–34 dB
AMAR–Cover On
Flow-induced noise cut-off frequency band
40 Hz 80 Hz 80 Hz
Increase in decidecade band SPL <3 dB 18–26 dB 22–28 dB
FAST Platform
Flow-induced noise cut-off frequency band
63 Hz 315 Hz 400 Hz
Increase in decidecade band SPL 3–5 dB 18–22 dB 32–35 dB
Forward Starboard
Flow-induced noise cut-off frequency band
50 Hz 315 Hz 500 Hz
Increase in decidecade band SPL < 3 dB 16–22 dB 28–32 dB
Turbine Top
Flow-induced noise cut-off frequency band
160 Hz 1000 Hz 2500 Hz
Increase in decidecade band SPL 3–5 dB 21–28 dB 30–35 dB
4.2. Correlation of Hydrophone and ADCP data
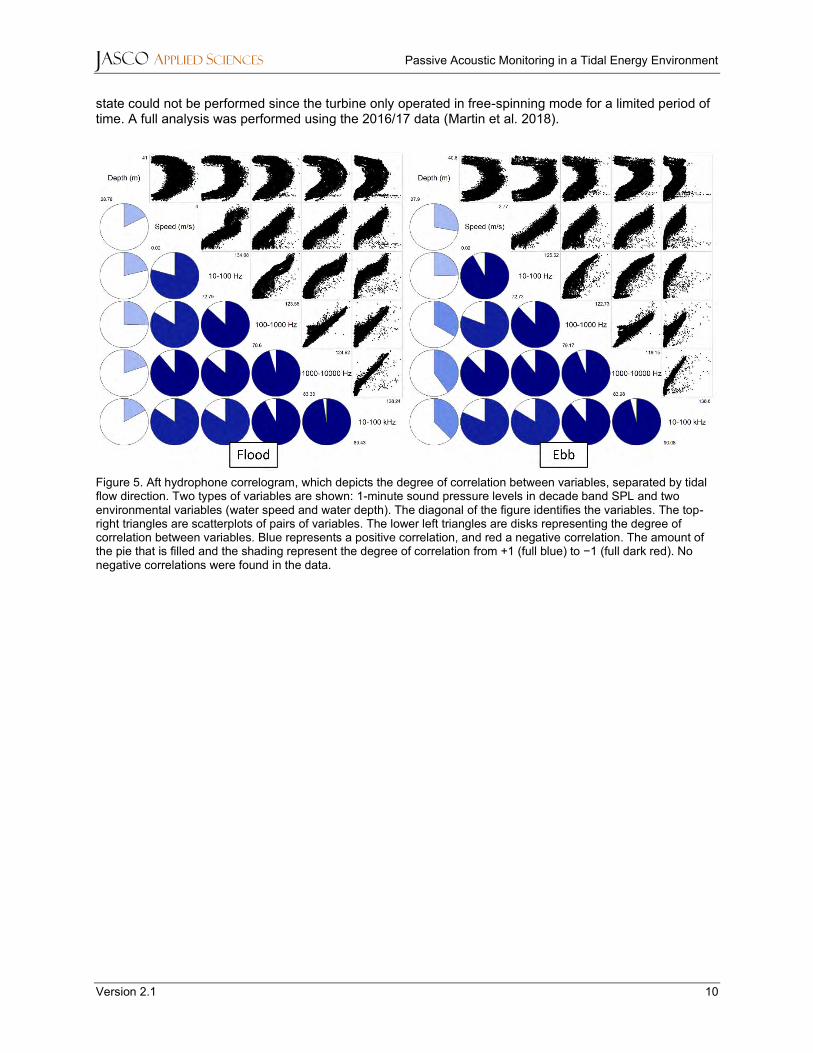
Correlograms were generated for each hydrophone, comparing the decade band SPL, water depth, and flow speed from the ADCP, with the flood and ebb tide compared separately. The water depth is measured in metres, and the speed is measured in the first ADCP bin, which is nearest to the bottom.
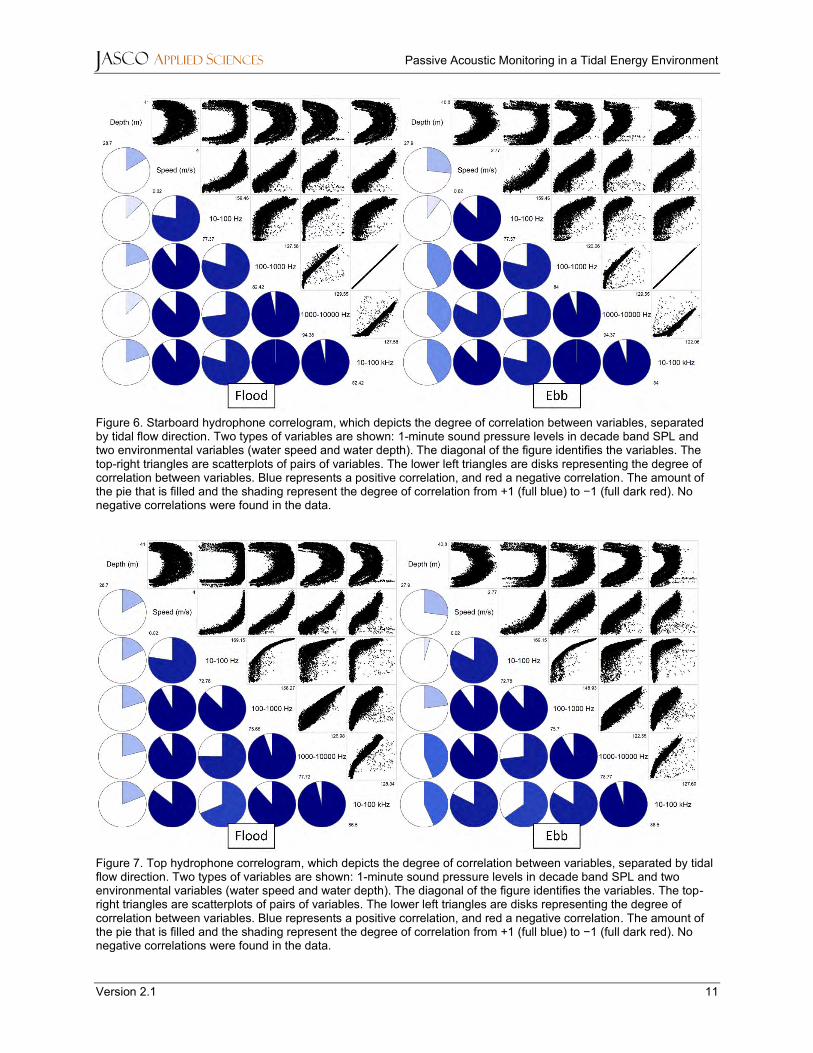
The three hydrophones mounted on the turbine (Aft, Stbd, and Top) had strong positive relationships between all decade bands and the water speed, and a weak positive relationship with the water depth. The relationship with the depth may have been weaker due to spring neap cycles causing variations in water depth, whereas the water speed at the near bottom remained more consistent with time (for a given stage of the tidal cycle). The strength of the relationship between water speed and decade band SPL did not show much variation between decade bands (Figures 5–7). We had expected that the lower frequencies would have a stronger relationship due to increased flow noise.
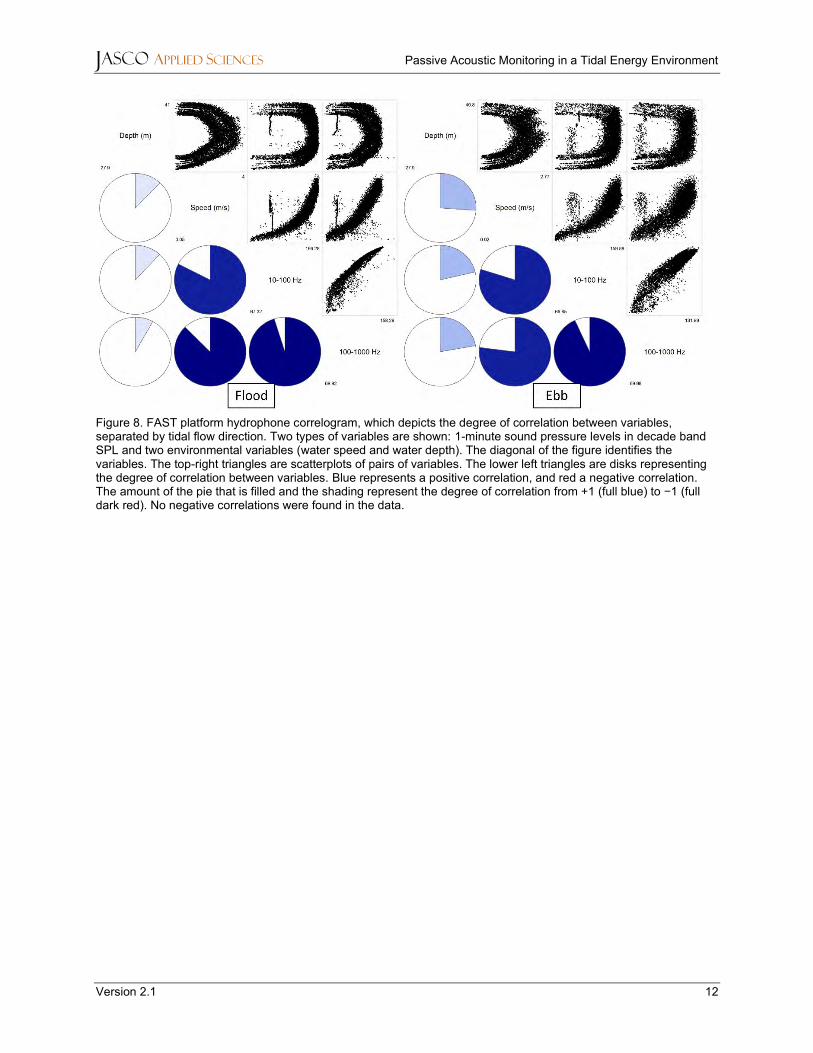
For the platform hydrophone the time stamp appears to have been off by 6.5 hours. After adjusting the time stamps, the decade bands had a strong positive relationship with each other and with the water speed, and a weakly positive relationship with water depth (Figure 8).
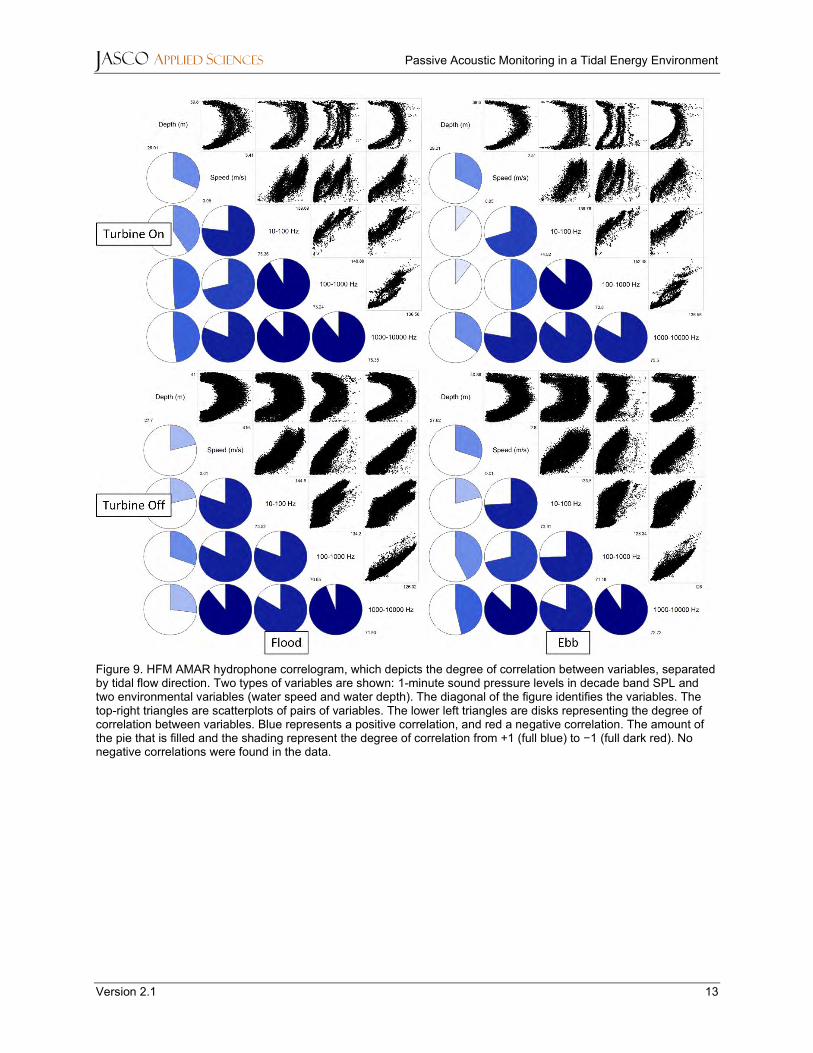
The high-flow mooring was further separated for comparing the times when the turbine was and was not operating (Figure 9). Overall, there were strong positive relationships between different decade bands, and between decade bands and water speed. There were weak to medium positive relationships between the decade bands and the water depth. When the turbine was operating, the relationship between the decade band and the water speed weakened slightly, particularly in the 100–1000 Hz band (Figure 9). This may have been due to the turbine operational sounds masking the sound affiliated with water speed. Note that a thorough analysis of sound levels as a function of flow speed, direction, and turbine operating
JASCO APPLIED SCIENCES Passive Acoustic Monitoring in a Tidal Energy Environment
Version 2.1 10
state could not be performed since the turbine only operated in free-spinning mode for a limited period of time. A full analysis was performed using the 2016/17 data (Martin et al. 2018).
Figure 5. Aft hydrophone correlogram, which depicts the degree of correlation between variables, separated by tidal flow direction. Two types of variables are shown: 1-minute sound pressure levels in decade band SPL and two environmental variables (water speed and water depth). The diagonal of the figure identifies the variables. The top-right triangles are scatterplots of pairs of variables. The lower left triangles are disks representing the degree of correlation between variables. Blue represents a positive correlation, and red a negative correlation. The amount of the pie that is filled and the shading represent the degree of correlation from +1 (full blue) to −1 (full dark red). No negative correlations were found in the data.
JASCO APPLIED SCIENCES Passive Acoustic Monitoring in a Tidal Energy Environment
Version 2.1 11
Figure 6. Starboard hydrophone correlogram, which depicts the degree of correlation between variables, separated by tidal flow direction. Two types of variables are shown: 1-minute sound pressure levels in decade band SPL and two environmental variables (water speed and water depth). The diagonal of the figure identifies the variables. The top-right triangles are scatterplots of pairs of variables. The lower left triangles are disks representing the degree of correlation between variables. Blue represents a positive correlation, and red a negative correlation. The amount of the pie that is filled and the shading represent the degree of correlation from +1 (full blue) to −1 (full dark red). No negative correlations were found in the data.
Figure 7. Top hydrophone correlogram, which depicts the degree of correlation between variables, separated by tidal flow direction. Two types of variables are shown: 1-minute sound pressure levels in decade band SPL and two environmental variables (water speed and water depth). The diagonal of the figure identifies the variables. The top-right triangles are scatterplots of pairs of variables. The lower left triangles are disks representing the degree of correlation between variables. Blue represents a positive correlation, and red a negative correlation. The amount of the pie that is filled and the shading represent the degree of correlation from +1 (full blue) to −1 (full dark red). No negative correlations were found in the data.
JASCO APPLIED SCIENCES Passive Acoustic Monitoring in a Tidal Energy Environment
Version 2.1 12
Figure 8. FAST platform hydrophone correlogram, which depicts the degree of correlation between variables, separated by tidal flow direction. Two types of variables are shown: 1-minute sound pressure levels in decade band SPL and two environmental variables (water speed and water depth). The diagonal of the figure identifies the variables. The top-right triangles are scatterplots of pairs of variables. The lower left triangles are disks representing the degree of correlation between variables. Blue represents a positive correlation, and red a negative correlation. The amount of the pie that is filled and the shading represent the degree of correlation from +1 (full blue) to −1 (full dark red). No negative correlations were found in the data.
JASCO APPLIED SCIENCES Passive Acoustic Monitoring in a Tidal Energy Environment
Version 2.1 13
Figure 9. HFM AMAR hydrophone correlogram, which depicts the degree of correlation between variables, separated by tidal flow direction. Two types of variables are shown: 1-minute sound pressure levels in decade band SPL and two environmental variables (water speed and water depth). The diagonal of the figure identifies the variables. The top-right triangles are scatterplots of pairs of variables. The lower left triangles are disks representing the degree of correlation between variables. Blue represents a positive correlation, and red a negative correlation. The amount of the pie that is filled and the shading represent the degree of correlation from +1 (full blue) to −1 (full dark red). No negative correlations were found in the data.
JASCO APPLIED SCIENCES Passive Acoustic Monitoring in a Tidal Energy Environment
Version 2.1 14
Literature Cited
[ISO] International Organization for Standardization. 2017. ISO 18405:2017. Underwater acoustics – Terminology. Geneva. https://www.iso.org/standard/62406.html.
ANSI S1.43-1997. R2007. American National Standard Acoustical Terminology. American National Standards Institute, NY, USA.
Bassett, C., J. Thomson, and B. Polagye. 2013. Sediment-generated noise and bed stress in a tidal channel. Journal of Geophysical Research 118(4): 2249-2265. https://doi.org/10.1002/jgrc.20169.
Kolmogorov, A. 1941. The Local Structure of Turbulence in Incompressible Viscous Fluid for Very Large Reynolds' Numbers. Proceedings of the USSR Academy of Sciences (Doklady Akademiia Nauk SSSR) 30: 301-305.
Martin, B., L. Horwich, and C.J. Whitt. 2018. Acoustic Data Analysis of the OpenHydro Open-Centre Turbine at FORCE: Final Report. Document Number 01588, Version 3.0 Technical report by JASCO Applied Sciences for Cape Sharp Tidal and FORCE.
Wenz, G.M. 1962. Acoustic Ambient Noise in the Ocean: Spectra and Sources. Journal of the Acoustical Society of America 34(12): 1936-1956. https://doi.org/10.1121/1.1909155.
JASCO APPLIED SCIENCES Passive Acoustic Monitoring in a Tidal Energy Environment
Version 2.1 A-1
Appendix A. Detailed Methods
This section contains details on the recorder configuration, deployment and recording schedule. The general methods, including data collection and analysis details appear in Section 0.
A.1. Recorder Configurations
A.1.1. icListen Turbine Hydrophones
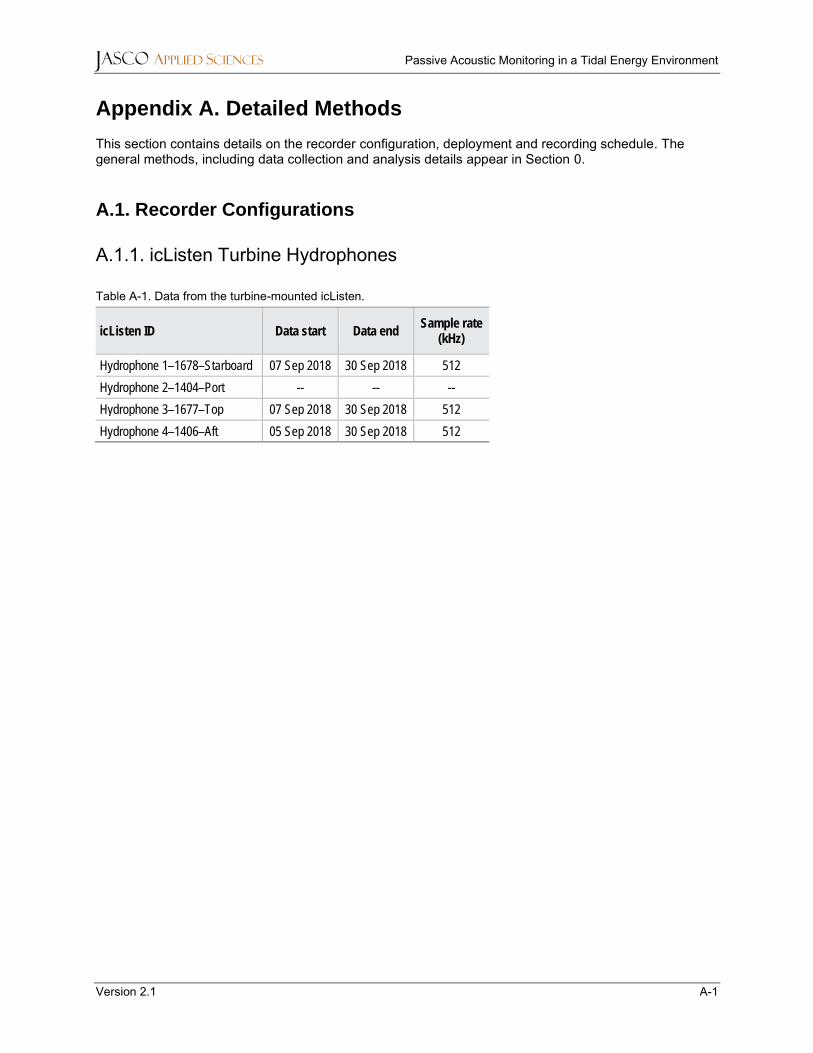
Table A-1. Data from the turbine-mounted icListen.
icListen ID Data start Data end Sample rate
(kHz)
Hydrophone 1–1678–Starboard 07 Sep 2018 30 Sep 2018 512
Hydrophone 2–1404–Port -- -- --
Hydrophone 3–1677–Top 07 Sep 2018 30 Sep 2018 512
Hydrophone 4–1406–Aft 05 Sep 2018 30 Sep 2018 512
JASCO APPLIED SCIENCES Passive Acoustic Monitoring in a Tidal Energy Environment
Version 2.1 A-2
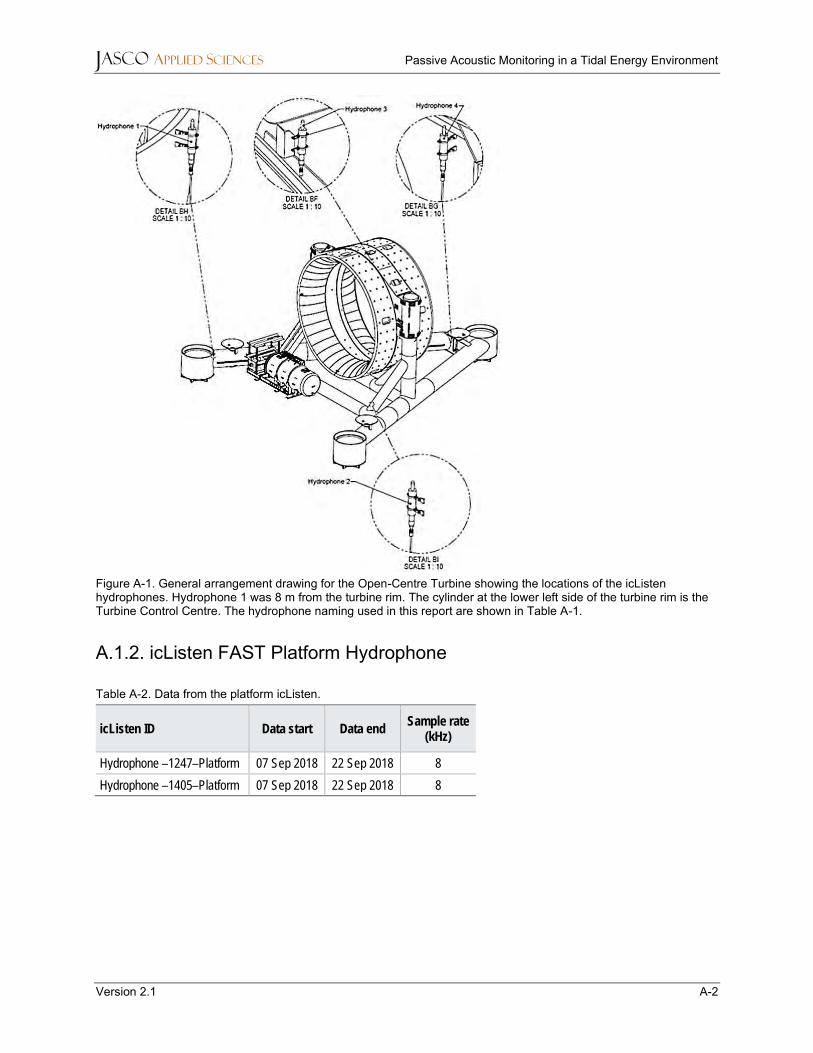
Figure A-1. General arrangement drawing for the Open-Centre Turbine showing the locations of the icListen hydrophones. Hydrophone 1 was 8 m from the turbine rim. The cylinder at the lower left side of the turbine rim is the Turbine Control Centre. The hydrophone naming used in this report are shown in Table A-1.
A.1.2. icListen FAST Platform Hydrophone
Table A-2. Data from the platform icListen.
icListen ID Data start Data end Sample rate
(kHz)
Hydrophone –1247–Platform 07 Sep 2018 22 Sep 2018 8
Hydrophone –1405–Platform 07 Sep 2018 22 Sep 2018 8
JASCO APPLIED SCIENCES Passive Acoustic Monitoring in a Tidal Energy Environment
Version 2.1 A-3
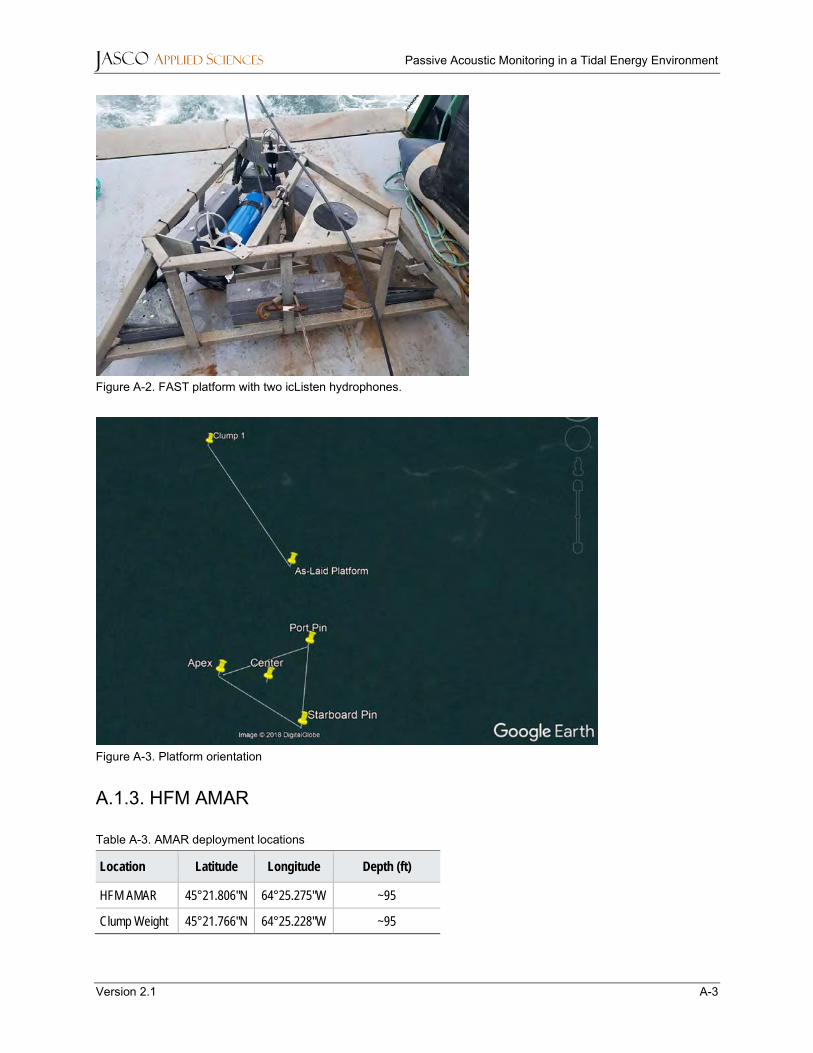
Figure A-2. FAST platform with two icListen hydrophones.
Figure A-3. Platform orientation
A.1.3. HFM AMAR
Table A-3. AMAR deployment locations
Location Latitude Longitude Depth (ft)
HFM AMAR 45°21.806"N 64°25.275"W ~95
Clump Weight 45°21.766"N 64°25.228"W ~95
JASCO APPLIED SCIENCES Passive Acoustic Monitoring in a Tidal Energy Environment
Version 2.1 A-4
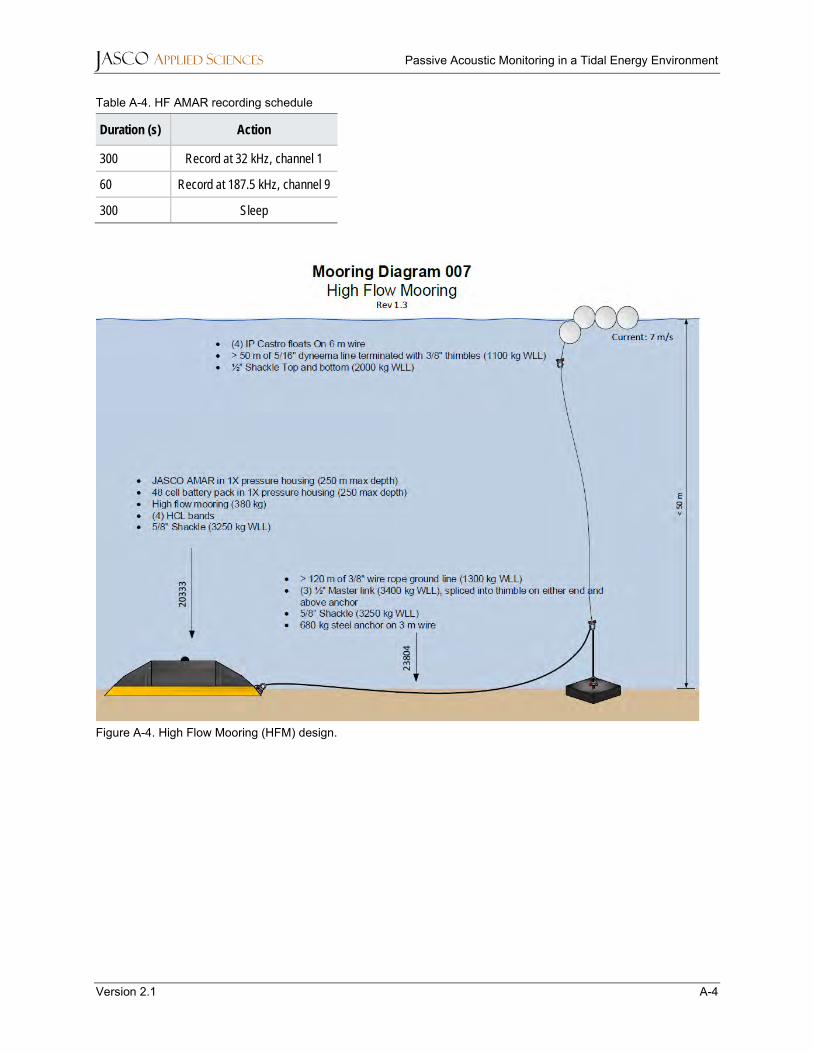
Table A-4. HF AMAR recording schedule
Duration (s) Action
300 Record at 32 kHz, channel 1
60 Record at 187.5 kHz, channel 9
300 Sleep
Figure A-4. High Flow Mooring (HFM) design.
JASCO APPLIED SCIENCES Passive Acoustic Monitoring in a Tidal Energy Environment
Version 2.1 A-5
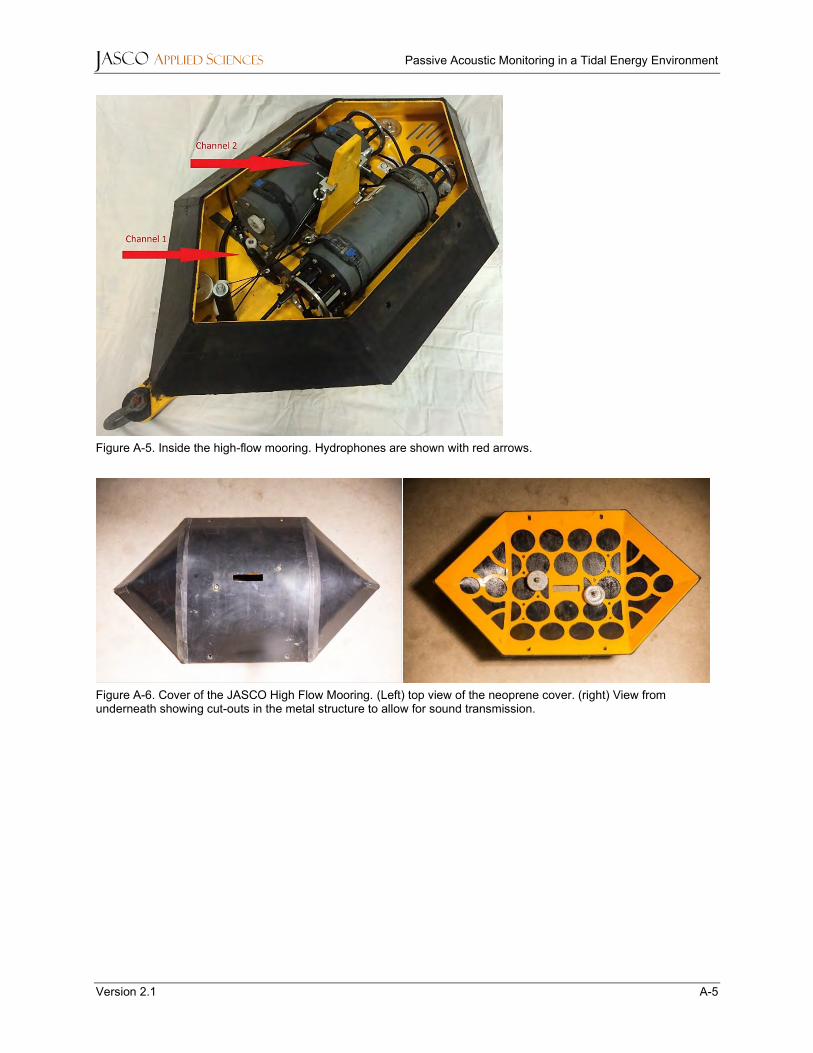
Figure A-5. Inside the high-flow mooring. Hydrophones are shown with red arrows.
Figure A-6. Cover of the JASCO High Flow Mooring. (Left) top view of the neoprene cover. (right) View from underneath showing cut-outs in the metal structure to allow for sound transmission.
JASCO APPLIED SCIENCES Passive Acoustic Monitoring in a Tidal Energy Environment
Version 2.1 A-6
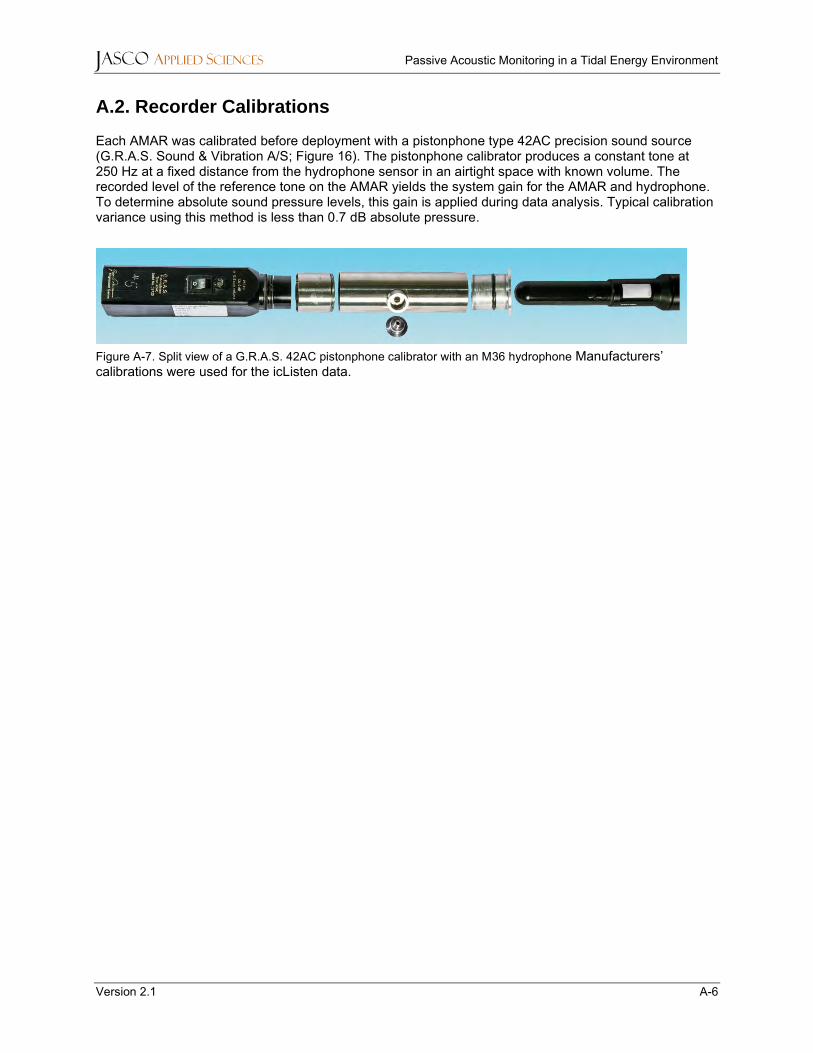
A.2. Recorder Calibrations
Each AMAR was calibrated before deployment with a pistonphone type 42AC precision sound source (G.R.A.S. Sound & Vibration A/S; Figure 16). The pistonphone calibrator produces a constant tone at 250 Hz at a fixed distance from the hydrophone sensor in an airtight space with known volume. The recorded level of the reference tone on the AMAR yields the system gain for the AMAR and hydrophone. To determine absolute sound pressure levels, this gain is applied during data analysis. Typical calibration variance using this method is less than 0.7 dB absolute pressure.
Figure A-7. Split view of a G.R.A.S. 42AC pistonphone calibrator with an M36 hydrophone Manufacturers’ calibrations were used for the icListen data.
JASCO APPLIED SCIENCES Passive Acoustic Monitoring in a Tidal Energy Environment
Version 2.1 B-1
Appendix B. Results
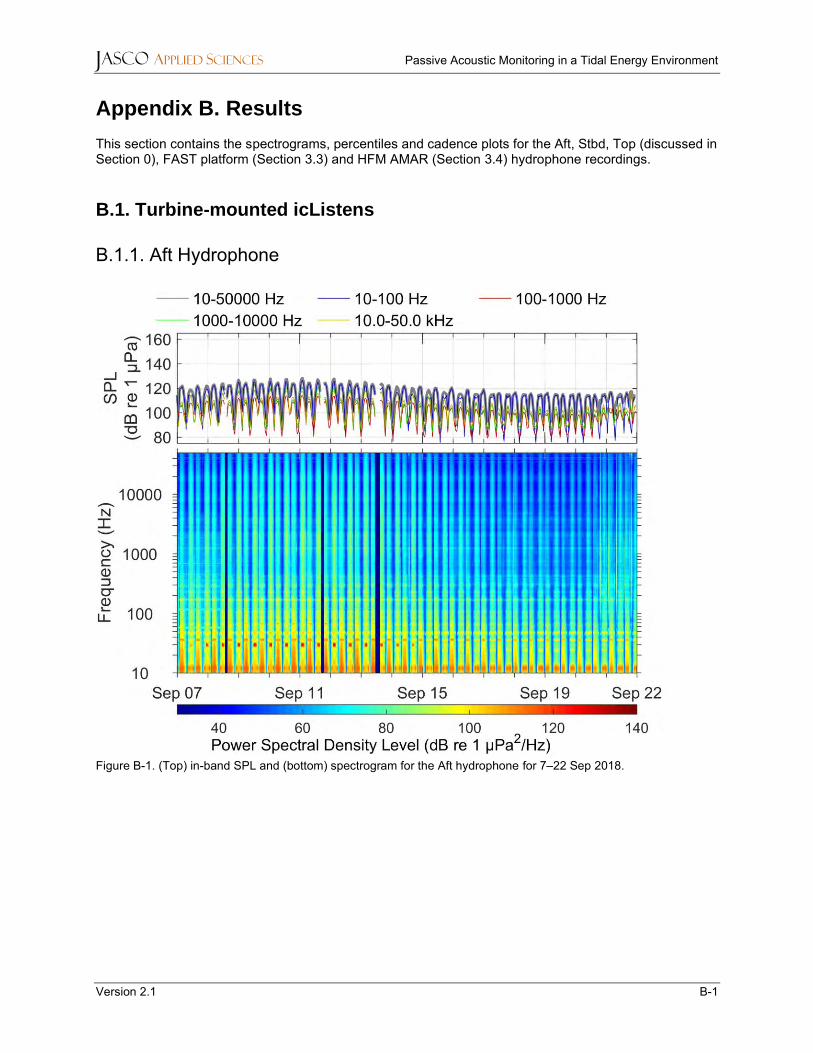
This section contains the spectrograms, percentiles and cadence plots for the Aft, Stbd, Top (discussed in Section 0), FAST platform (Section 3.3) and HFM AMAR (Section 3.4) hydrophone recordings.
B.1. Turbine-mounted icListens
B.1.1. Aft Hydrophone
Figure B-1. (Top) in-band SPL and (bottom) spectrogram for the Aft hydrophone for 7–22 Sep 2018.
JASCO APPLIED SCIENCES Passive Acoustic Monitoring in a Tidal Energy Environment
Version 2.1 B-2
Figure B-2. (Top) Exceedance percentiles and mean of the decidecade band SPL and (bottom) exceedance percentiles and probability density (grayscale) of 1-min PSD levels compared to the limits of prevailing noise (Wenz 1962) for the Aft hydrophone for 7–22 Sep 2018.
JASCO APPLIED SCIENCES Passive Acoustic Monitoring in a Tidal Energy Environment
Version 2.1 B-3
Figure B-3. Cadence spectrogram for the hours since high tide, for the Aft Hydrophone for 7–22 Sep 2018.
JASCO APPLIED SCIENCES Passive Acoustic Monitoring in a Tidal Energy Environment
Version 2.1 B-4
B.1.2. Stbd hydrophone
Figure B-4. (Top) in-band SPL and (bottom) spectrogram for the Starboard hydrophone for 7–22 Sep 2018.
JASCO APPLIED SCIENCES Passive Acoustic Monitoring in a Tidal Energy Environment
Version 2.1 B-5
Figure B-5. (Top) Exceedance percentiles and mean of the decidecade band SPL and (bottom) exceedance percentiles and probability density (grayscale) of 1-min PSD levels compared to the limits of prevailing noise (Wenz 1962) for the Starboard hydrophone for 7–22 Sep 2018.
JASCO APPLIED SCIENCES Passive Acoustic Monitoring in a Tidal Energy Environment
Version 2.1 B-6
Figure B-6. Cadence spectrogram for the hours since high tide, for the Starboard hydrophone for 7–22 Sep 2018.
JASCO APPLIED SCIENCES Passive Acoustic Monitoring in a Tidal Energy Environment
Version 2.1 B-7
B.1.3. Top Hydrophone
Figure B-7. (Top) in-band SPL and (bottom) spectrogram for the Top hydrophone for 7–22 Sep 2018.
JASCO APPLIED SCIENCES Passive Acoustic Monitoring in a Tidal Energy Environment
Version 2.1 B-8
Figure B-8. (Top) Exceedance percentiles and mean of the decidecade band SPL and (bottom) exceedance percentiles and probability density (grayscale) of 1-min PSD levels compared to the limits of prevailing noise ((Wenz 1962) for the Top hydrophone for 7–22 Sep 2018.
JASCO APPLIED SCIENCES Passive Acoustic Monitoring in a Tidal Energy Environment
Version 2.1 B-9
Figure B-9. Cadence spectrogram for the hours since high tide, for the Top hydrophone for 7–22 Sep 2018.
JASCO APPLIED SCIENCES Passive Acoustic Monitoring in a Tidal Energy Environment
Version 2.1 B-10
B.2. FAST Platform icListen
Figure B-10. (Top) in-band SPL and (bottom) spectrogram for the FAST platform hydrophone for 7–22 Sep 2018.
JASCO APPLIED SCIENCES Passive Acoustic Monitoring in a Tidal Energy Environment
Version 2.1 B-11
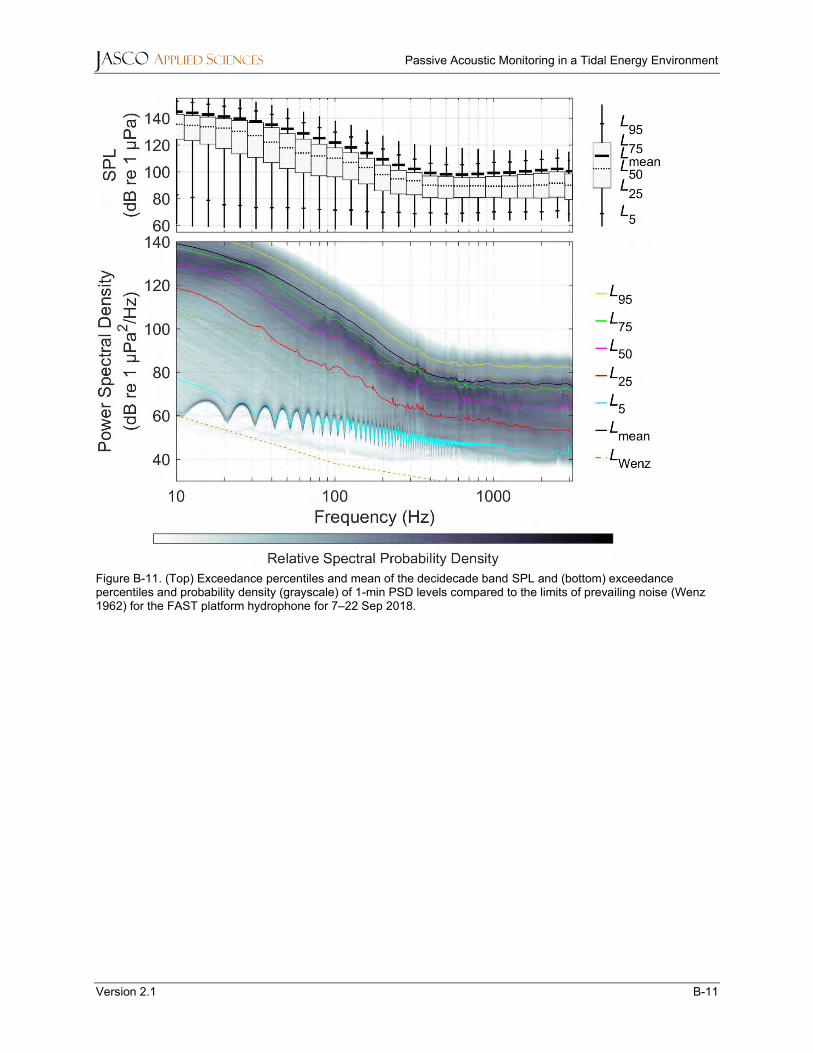
Figure B-11. (Top) Exceedance percentiles and mean of the decidecade band SPL and (bottom) exceedance percentiles and probability density (grayscale) of 1-min PSD levels compared to the limits of prevailing noise (Wenz 1962) for the FAST platform hydrophone for 7–22 Sep 2018.
JASCO APPLIED SCIENCES Passive Acoustic Monitoring in a Tidal Energy Environment
Version 2.1 B-12
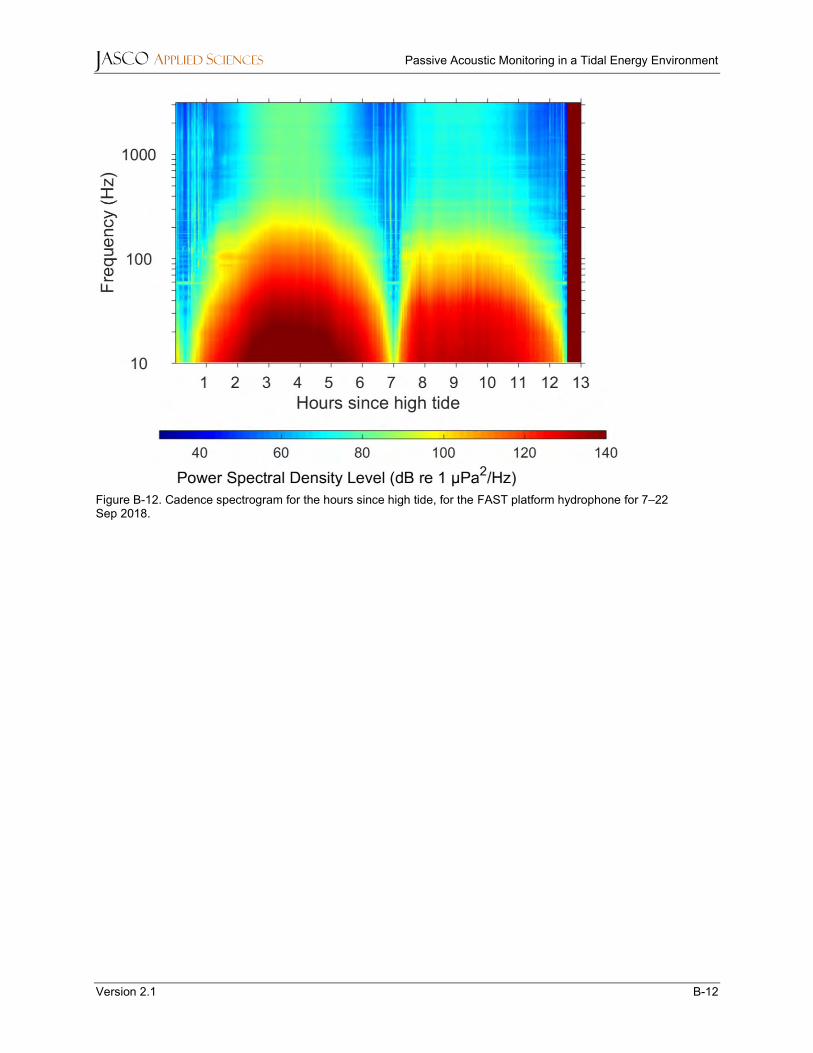
Figure B-12. Cadence spectrogram for the hours since high tide, for the FAST platform hydrophone for 7–22 Sep 2018.
JASCO APPLIED SCIENCES Passive Acoustic Monitoring in a Tidal Energy Environment
Version 2.1 B-13
B.3. HFM AMAR
Figure B-13. (Top) in-band SPL and (bottom) spectrogram for the AMAR hydrophone for July to November 2018.
JASCO APPLIED SCIENCES Passive Acoustic Monitoring in a Tidal Energy Environment
Version 2.1 B-14
Figure B-14. (Top) Exceedance percentiles and mean of the decidecade band SPL and (bottom) exceedance percentiles and probability density (grayscale) of 1-min PSD levels compared to the limits of prevailing noise (Wenz 1962) for the AMAR hydrophone July to November 2018.
JASCO APPLIED SCIENCES Passive Acoustic Monitoring in a Tidal Energy Environment
Version 2.1 B-15
Figure B-15. Cadence spectrogram for the hours since high tide, for the AMAR hydrophone July to November 2018.
JASCO APPLIED SCIENCES Passive Acoustic Monitoring in a Tidal Energy Environment
Version 2.1 B-16
B.3.1. Pre-Turbine Operation
Figure B-16. (Top) in-band SPL and (bottom) spectrogram for the AMAR hydrophone during the pre-turbine operation period, 1–22 Jul 2018.
JASCO APPLIED SCIENCES Passive Acoustic Monitoring in a Tidal Energy Environment
Version 2.1 B-17
Figure B-17. (Top) Exceedance percentiles and mean of the decidecade band SPL and (bottom) exceedance percentiles and probability density (grayscale) of 1-min PSD levels compared to the limits of prevailing noise (Wenz 1962) for the AMAR hydrophone during the pre-turbine operation period, 1–22 Jul 2018.
JASCO APPLIED SCIENCES Passive Acoustic Monitoring in a Tidal Energy Environment
Version 2.1 B-18
Figure B-18. Cadence spectrogram for the hours since high tide, for the pre-turbine operation AMAR hydrophone, 1–22 Jul 2018.
JASCO APPLIED SCIENCES Passive Acoustic Monitoring in a Tidal Energy Environment
Version 2.1 B-19
B.3.2. Turbine Operation
Figure B-19. (Top) in-band SPL and (bottom) spectrogram for the AMAR hydrophone during the turbine operation period, 22 Jul to 9 Aug 2018.

JASCO APPLIED SCIENCES Passive Acoustic Monitoring in a Tidal Energy Environment
Version 2.1 B-20
Figure B-20. (Top) Exceedance percentiles and mean of the decidecade band SPL and (bottom) exceedance percentiles and probability density (grayscale) of 1-min PSD levels compared to the limits of prevailing noise (Wenz 1962) for the AMAR hydrophone during the turbine operation period, 22 Jul to 9 Aug 2018.
JASCO APPLIED SCIENCES Passive Acoustic Monitoring in a Tidal Energy Environment
Version 2.1 B-21
Figure B-21. Cadence spectrogram for the hours since high tide, for the turbine operation AMAR hydrophone, 22 Jul to 9 Aug 2018.
JASCO APPLIED SCIENCES Passive Acoustic Monitoring in a Tidal Energy Environment
Version 2.1 B-22
B.3.3. Post-Turbine Operation
Figure B-22. (Top) in-band SPL and (bottom) spectrogram for the AMAR hydrophone during the post-turbine operation period, ~25 Aug to 30 Oct 2018.

JASCO APPLIED SCIENCES Passive Acoustic Monitoring in a Tidal Energy Environment
Version 2.1 B-23
Figure B-23. (Top) Exceedance percentiles and mean of the decidecade band SPL and (bottom) exceedance percentiles and probability density (grayscale) of 1-min PSD levels compared to the limits of prevailing noise (Wenz 1962) for the AMAR hydrophone during the post-turbine operation period, ~25 Aug to 30 Oct 2018.

JASCO APPLIED SCIENCES Passive Acoustic Monitoring in a Tidal Energy Environment
Version 2.1 B-24
Figure B-24. Cadence spectrogram for the hours since high tide, for the post-turbine operation AMAR hydrophone, ~25 Aug to 30 Oct 2018.
JASCO APPLIED SCIENCES Passive Acoustic Monitoring in a Tidal Energy Environment
Version 2.1 C-1
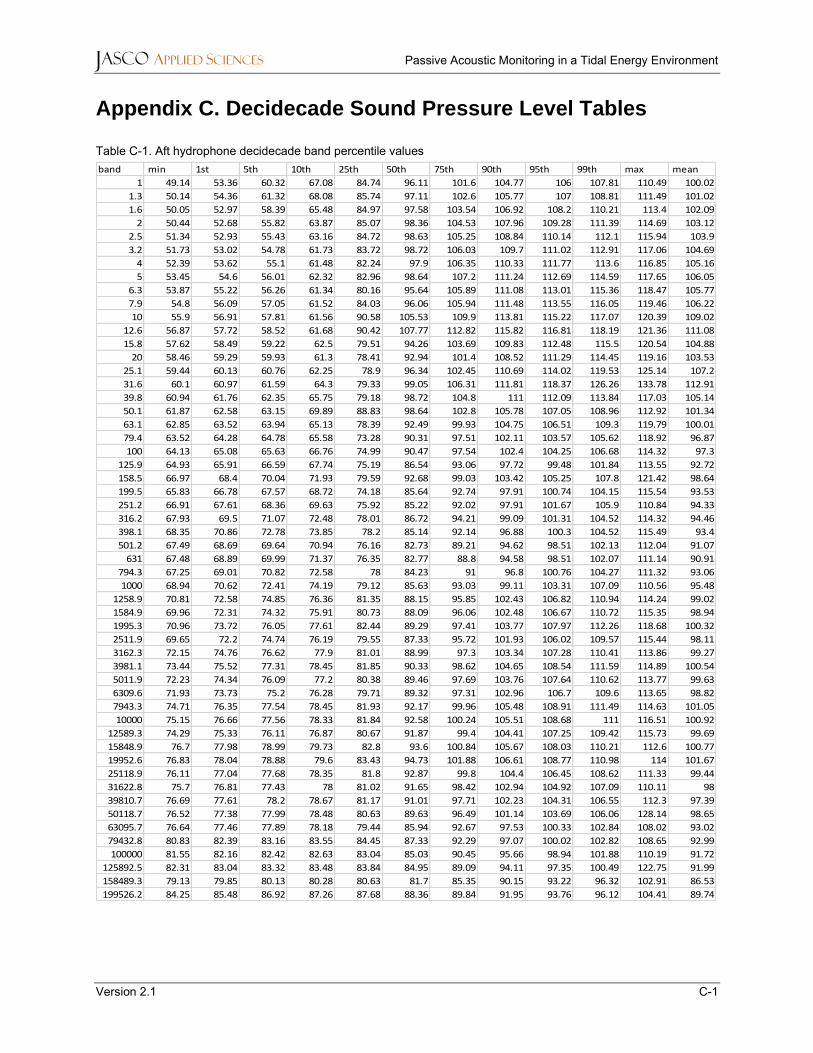
Appendix C. Decidecade Sound Pressure Level Tables
Table C-1. Aft hydrophone decidecade band percentile values band min 1st 5th 10th 25th 50th 75th 90th 95th 99th max mean
1 49.14 53.36 60.32 67.08 84.74 96.11 101.6 104.77 106 107.81 110.49 100.02
1.3 50.14 54.36 61.32 68.08 85.74 97.11 102.6 105.77 107 108.81 111.49 101.02
1.6 50.05 52.97 58.39 65.48 84.97 97.58 103.54 106.92 108.2 110.21 113.4 102.09
2 50.44 52.68 55.82 63.87 85.07 98.36 104.53 107.96 109.28 111.39 114.69 103.12
2.5 51.34 52.93 55.43 63.16 84.72 98.63 105.25 108.84 110.14 112.1 115.94 103.9
3.2 51.73 53.02 54.78 61.73 83.72 98.72 106.03 109.7 111.02 112.91 117.06 104.69
4 52.39 53.62 55.1 61.48 82.24 97.9 106.35 110.33 111.77 113.6 116.85 105.16
5 53.45 54.6 56.01 62.32 82.96 98.64 107.2 111.24 112.69 114.59 117.65 106.05
6.3 53.87 55.22 56.26 61.34 80.16 95.64 105.89 111.08 113.01 115.36 118.47 105.77
7.9 54.8 56.09 57.05 61.52 84.03 96.06 105.94 111.48 113.55 116.05 119.46 106.22
10 55.9 56.91 57.81 61.56 90.58 105.53 109.9 113.81 115.22 117.07 120.39 109.02
12.6 56.87 57.72 58.52 61.68 90.42 107.77 112.82 115.82 116.81 118.19 121.36 111.08
15.8 57.62 58.49 59.22 62.5 79.51 94.26 103.69 109.83 112.48 115.5 120.54 104.88
20 58.46 59.29 59.93 61.3 78.41 92.94 101.4 108.52 111.29 114.45 119.16 103.53
25.1 59.44 60.13 60.76 62.25 78.9 96.34 102.45 110.69 114.02 119.53 125.14 107.2
31.6 60.1 60.97 61.59 64.3 79.33 99.05 106.31 111.81 118.37 126.26 133.78 112.91
39.8 60.94 61.76 62.35 65.75 79.18 98.72 104.8 111 112.09 113.84 117.03 105.14
50.1 61.87 62.58 63.15 69.89 88.83 98.64 102.8 105.78 107.05 108.96 112.92 101.34
63.1 62.85 63.52 63.94 65.13 78.39 92.49 99.93 104.75 106.51 109.3 119.79 100.01
79.4 63.52 64.28 64.78 65.58 73.28 90.31 97.51 102.11 103.57 105.62 118.92 96.87
100 64.13 65.08 65.63 66.76 74.99 90.47 97.54 102.4 104.25 106.68 114.32 97.3
125.9 64.93 65.91 66.59 67.74 75.19 86.54 93.06 97.72 99.48 101.84 113.55 92.72
158.5 66.97 68.4 70.04 71.93 79.59 92.68 99.03 103.42 105.25 107.8 121.42 98.64
199.5 65.83 66.78 67.57 68.72 74.18 85.64 92.74 97.91 100.74 104.15 115.54 93.53
251.2 66.91 67.61 68.36 69.63 75.92 85.22 92.02 97.91 101.67 105.9 110.84 94.33
316.2 67.93 69.5 71.07 72.48 78.01 86.72 94.21 99.09 101.31 104.52 114.32 94.46
398.1 68.35 70.86 72.78 73.85 78.2 85.14 92.14 96.88 100.3 104.52 115.49 93.4
501.2 67.49 68.69 69.64 70.94 76.16 82.73 89.21 94.62 98.51 102.13 112.04 91.07
631 67.48 68.89 69.99 71.37 76.35 82.77 88.8 94.58 98.51 102.07 111.14 90.91
794.3 67.25 69.01 70.82 72.58 78 84.23 91 96.8 100.76 104.27 111.32 93.06
1000 68.94 70.62 72.41 74.19 79.12 85.63 93.03 99.11 103.31 107.09 110.56 95.48
1258.9 70.81 72.58 74.85 76.36 81.35 88.15 95.85 102.43 106.82 110.94 114.24 99.02
1584.9 69.96 72.31 74.32 75.91 80.73 88.09 96.06 102.48 106.67 110.72 115.35 98.94
1995.3 70.96 73.72 76.05 77.61 82.44 89.29 97.41 103.77 107.97 112.26 118.68 100.32
2511.9 69.65 72.2 74.74 76.19 79.55 87.33 95.72 101.93 106.02 109.57 115.44 98.11
3162.3 72.15 74.76 76.62 77.9 81.01 88.99 97.3 103.34 107.28 110.41 113.86 99.27
3981.1 73.44 75.52 77.31 78.45 81.85 90.33 98.62 104.65 108.54 111.59 114.89 100.54
5011.9 72.23 74.34 76.09 77.2 80.38 89.46 97.69 103.76 107.64 110.62 113.77 99.63
6309.6 71.93 73.73 75.2 76.28 79.71 89.32 97.31 102.96 106.7 109.6 113.65 98.82
7943.3 74.71 76.35 77.54 78.45 81.93 92.17 99.96 105.48 108.91 111.49 114.63 101.05
10000 75.15 76.66 77.56 78.33 81.84 92.58 100.24 105.51 108.68 111 116.51 100.92
12589.3 74.29 75.33 76.11 76.87 80.67 91.87 99.4 104.41 107.25 109.42 115.73 99.69
15848.9 76.7 77.98 78.99 79.73 82.8 93.6 100.84 105.67 108.03 110.21 112.6 100.77
19952.6 76.83 78.04 78.88 79.6 83.43 94.73 101.88 106.61 108.77 110.98 114 101.67
25118.9 76.11 77.04 77.68 78.35 81.8 92.87 99.8 104.4 106.45 108.62 111.33 99.44
31622.8 75.7 76.81 77.43 78 81.02 91.65 98.42 102.94 104.92 107.09 110.11 98
39810.7 76.69 77.61 78.2 78.67 81.17 91.01 97.71 102.23 104.31 106.55 112.3 97.39
50118.7 76.52 77.38 77.99 78.48 80.63 89.63 96.49 101.14 103.69 106.06 128.14 98.65
63095.7 76.64 77.46 77.89 78.18 79.44 85.94 92.67 97.53 100.33 102.84 108.02 93.02
79432.8 80.83 82.39 83.16 83.55 84.45 87.33 92.29 97.07 100.02 102.82 108.65 92.99
100000 81.55 82.16 82.42 82.63 83.04 85.03 90.45 95.66 98.94 101.88 110.19 91.72
125892.5 82.31 83.04 83.32 83.48 83.84 84.95 89.09 94.11 97.35 100.49 122.75 91.99
158489.3 79.13 79.85 80.13 80.28 80.63 81.7 85.35 90.15 93.22 96.32 102.91 86.53
199526.2 84.25 85.48 86.92 87.26 87.68 88.36 89.84 91.95 93.76 96.12 104.41 89.74
JASCO APPLIED SCIENCES Passive Acoustic Monitoring in a Tidal Energy Environment
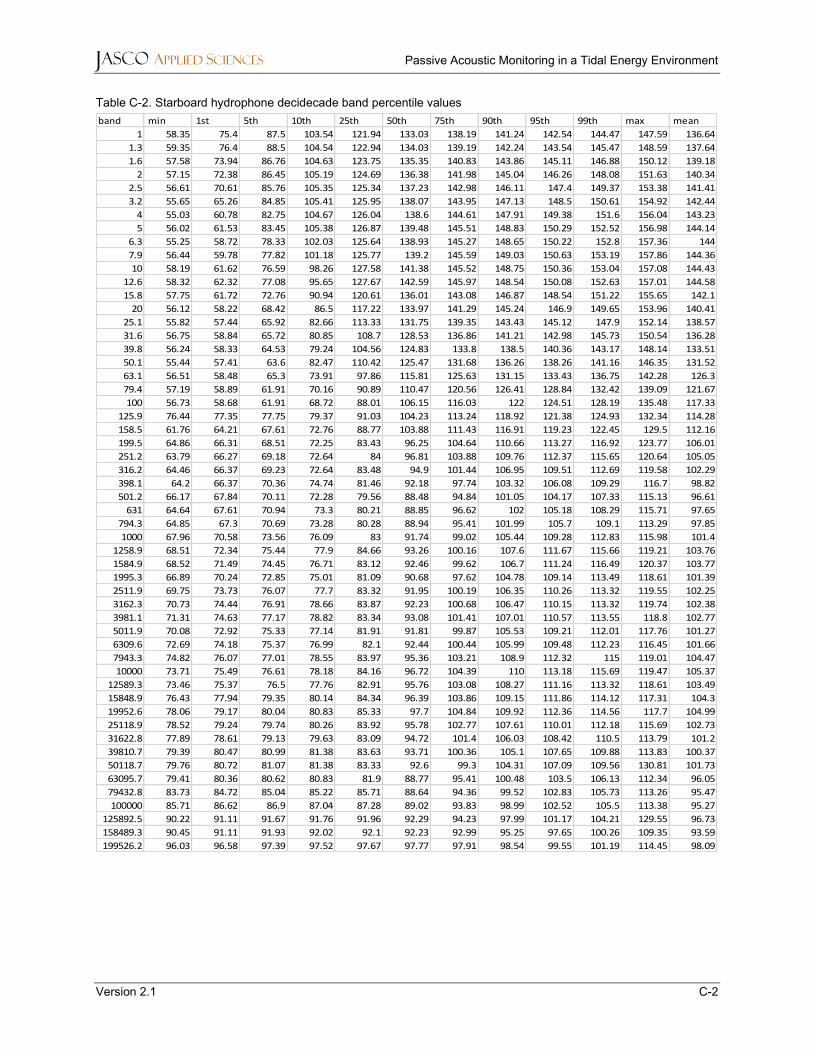
Version 2.1 C-2
Table C-2. Starboard hydrophone decidecade band percentile values band min 1st 5th 10th 25th 50th 75th 90th 95th 99th max mean
1 58.35 75.4 87.5 103.54 121.94 133.03 138.19 141.24 142.54 144.47 147.59 136.64
1.3 59.35 76.4 88.5 104.54 122.94 134.03 139.19 142.24 143.54 145.47 148.59 137.64
1.6 57.58 73.94 86.76 104.63 123.75 135.35 140.83 143.86 145.11 146.88 150.12 139.18
2 57.15 72.38 86.45 105.19 124.69 136.38 141.98 145.04 146.26 148.08 151.63 140.34
2.5 56.61 70.61 85.76 105.35 125.34 137.23 142.98 146.11 147.4 149.37 153.38 141.41
3.2 55.65 65.26 84.85 105.41 125.95 138.07 143.95 147.13 148.5 150.61 154.92 142.44
4 55.03 60.78 82.75 104.67 126.04 138.6 144.61 147.91 149.38 151.6 156.04 143.23
5 56.02 61.53 83.45 105.38 126.87 139.48 145.51 148.83 150.29 152.52 156.98 144.14
6.3 55.25 58.72 78.33 102.03 125.64 138.93 145.27 148.65 150.22 152.8 157.36 144
7.9 56.44 59.78 77.82 101.18 125.77 139.2 145.59 149.03 150.63 153.19 157.86 144.36
10 58.19 61.62 76.59 98.26 127.58 141.38 145.52 148.75 150.36 153.04 157.08 144.43
12.6 58.32 62.32 77.08 95.65 127.67 142.59 145.97 148.54 150.08 152.63 157.01 144.58
15.8 57.75 61.72 72.76 90.94 120.61 136.01 143.08 146.87 148.54 151.22 155.65 142.1
20 56.12 58.22 68.42 86.5 117.22 133.97 141.29 145.24 146.9 149.65 153.96 140.41
25.1 55.82 57.44 65.92 82.66 113.33 131.75 139.35 143.43 145.12 147.9 152.14 138.57
31.6 56.75 58.84 65.72 80.85 108.7 128.53 136.86 141.21 142.98 145.73 150.54 136.28
39.8 56.24 58.33 64.53 79.24 104.56 124.83 133.8 138.5 140.36 143.17 148.14 133.51
50.1 55.44 57.41 63.6 82.47 110.42 125.47 131.68 136.26 138.26 141.16 146.35 131.52
63.1 56.51 58.48 65.3 73.91 97.86 115.81 125.63 131.15 133.43 136.75 142.28 126.3
79.4 57.19 58.89 61.91 70.16 90.89 110.47 120.56 126.41 128.84 132.42 139.09 121.67
100 56.73 58.68 61.91 68.72 88.01 106.15 116.03 122 124.51 128.19 135.48 117.33
125.9 76.44 77.35 77.75 79.37 91.03 104.23 113.24 118.92 121.38 124.93 132.34 114.28
158.5 61.76 64.21 67.61 72.76 88.77 103.88 111.43 116.91 119.23 122.45 129.5 112.16
199.5 64.86 66.31 68.51 72.25 83.43 96.25 104.64 110.66 113.27 116.92 123.77 106.01
251.2 63.79 66.27 69.18 72.64 84 96.81 103.88 109.76 112.37 115.65 120.64 105.05
316.2 64.46 66.37 69.23 72.64 83.48 94.9 101.44 106.95 109.51 112.69 119.58 102.29
398.1 64.2 66.37 70.36 74.74 81.46 92.18 97.74 103.32 106.08 109.29 116.7 98.82
501.2 66.17 67.84 70.11 72.28 79.56 88.48 94.84 101.05 104.17 107.33 115.13 96.61
631 64.64 67.61 70.94 73.3 80.21 88.85 96.62 102 105.18 108.29 115.71 97.65
794.3 64.85 67.3 70.69 73.28 80.28 88.94 95.41 101.99 105.7 109.1 113.29 97.85
1000 67.96 70.58 73.56 76.09 83 91.74 99.02 105.44 109.28 112.83 115.98 101.4
1258.9 68.51 72.34 75.44 77.9 84.66 93.26 100.16 107.6 111.67 115.66 119.21 103.76
1584.9 68.52 71.49 74.45 76.71 83.12 92.46 99.62 106.7 111.24 116.49 120.37 103.77
1995.3 66.89 70.24 72.85 75.01 81.09 90.68 97.62 104.78 109.14 113.49 118.61 101.39
2511.9 69.75 73.73 76.07 77.7 83.32 91.95 100.19 106.35 110.26 113.32 119.55 102.25
3162.3 70.73 74.44 76.91 78.66 83.87 92.23 100.68 106.47 110.15 113.32 119.74 102.38
3981.1 71.31 74.63 77.17 78.82 83.34 93.08 101.41 107.01 110.57 113.55 118.8 102.77
5011.9 70.08 72.92 75.33 77.14 81.91 91.81 99.87 105.53 109.21 112.01 117.76 101.27
6309.6 72.69 74.18 75.37 76.99 82.1 92.44 100.44 105.99 109.48 112.23 116.45 101.66
7943.3 74.82 76.07 77.01 78.55 83.97 95.36 103.21 108.9 112.32 115 119.01 104.47
10000 73.71 75.49 76.61 78.18 84.16 96.72 104.39 110 113.18 115.69 119.47 105.37
12589.3 73.46 75.37 76.5 77.76 82.91 95.76 103.08 108.27 111.16 113.32 118.61 103.49
15848.9 76.43 77.94 79.35 80.14 84.34 96.39 103.86 109.15 111.86 114.12 117.31 104.3
19952.6 78.06 79.17 80.04 80.83 85.33 97.7 104.84 109.92 112.36 114.56 117.7 104.99
25118.9 78.52 79.24 79.74 80.26 83.92 95.78 102.77 107.61 110.01 112.18 115.69 102.73
31622.8 77.89 78.61 79.13 79.63 83.09 94.72 101.4 106.03 108.42 110.5 113.79 101.2
39810.7 79.39 80.47 80.99 81.38 83.63 93.71 100.36 105.1 107.65 109.88 113.83 100.37
50118.7 79.76 80.72 81.07 81.38 83.33 92.6 99.3 104.31 107.09 109.56 130.81 101.73
63095.7 79.41 80.36 80.62 80.83 81.9 88.77 95.41 100.48 103.5 106.13 112.34 96.05
79432.8 83.73 84.72 85.04 85.22 85.71 88.64 94.36 99.52 102.83 105.73 113.26 95.47
100000 85.71 86.62 86.9 87.04 87.28 89.02 93.83 98.99 102.52 105.5 113.38 95.27
125892.5 90.22 91.11 91.67 91.76 91.96 92.29 94.23 97.99 101.17 104.21 129.55 96.73
158489.3 90.45 91.11 91.93 92.02 92.1 92.23 92.99 95.25 97.65 100.26 109.35 93.59
199526.2 96.03 96.58 97.39 97.52 97.67 97.77 97.91 98.54 99.55 101.19 114.45 98.09
JASCO APPLIED SCIENCES Passive Acoustic Monitoring in a Tidal Energy Environment
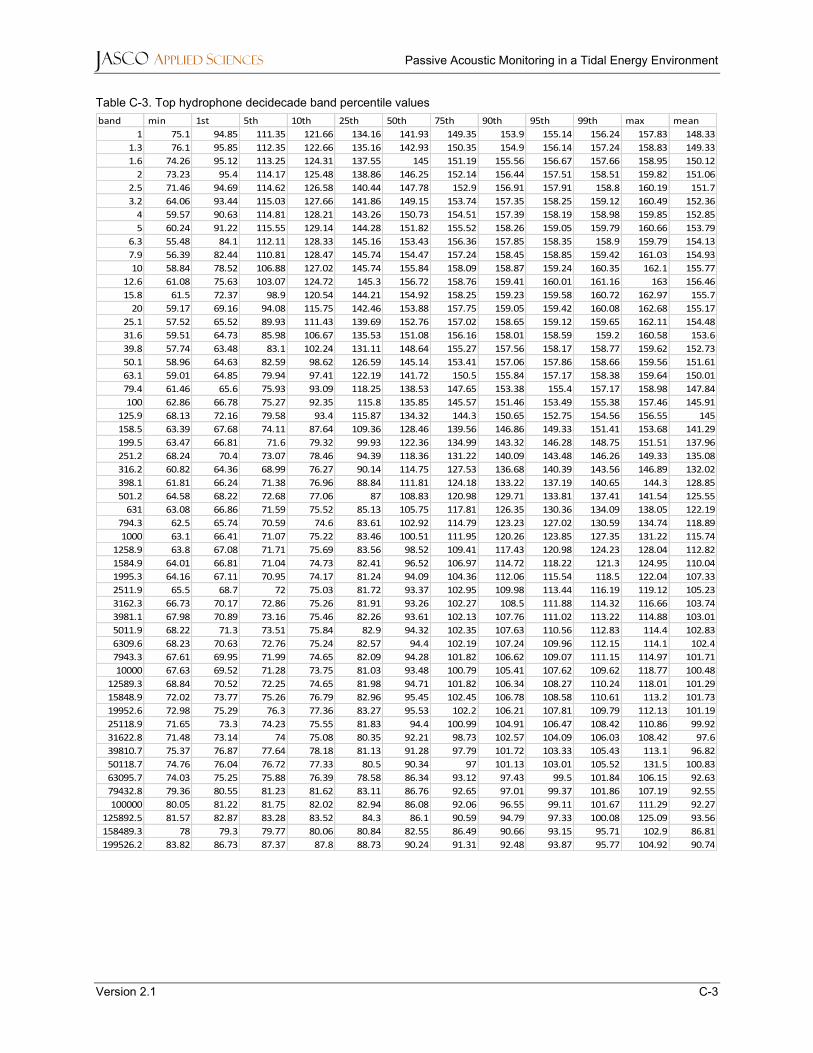
Version 2.1 C-3
Table C-3. Top hydrophone decidecade band percentile values band min 1st 5th 10th 25th 50th 75th 90th 95th 99th max mean
1 75.1 94.85 111.35 121.66 134.16 141.93 149.35 153.9 155.14 156.24 157.83 148.33
1.3 76.1 95.85 112.35 122.66 135.16 142.93 150.35 154.9 156.14 157.24 158.83 149.33
1.6 74.26 95.12 113.25 124.31 137.55 145 151.19 155.56 156.67 157.66 158.95 150.12
2 73.23 95.4 114.17 125.48 138.86 146.25 152.14 156.44 157.51 158.51 159.82 151.06
2.5 71.46 94.69 114.62 126.58 140.44 147.78 152.9 156.91 157.91 158.8 160.19 151.7
3.2 64.06 93.44 115.03 127.66 141.86 149.15 153.74 157.35 158.25 159.12 160.49 152.36
4 59.57 90.63 114.81 128.21 143.26 150.73 154.51 157.39 158.19 158.98 159.85 152.85
5 60.24 91.22 115.55 129.14 144.28 151.82 155.52 158.26 159.05 159.79 160.66 153.79
6.3 55.48 84.1 112.11 128.33 145.16 153.43 156.36 157.85 158.35 158.9 159.79 154.13
7.9 56.39 82.44 110.81 128.47 145.74 154.47 157.24 158.45 158.85 159.42 161.03 154.93
10 58.84 78.52 106.88 127.02 145.74 155.84 158.09 158.87 159.24 160.35 162.1 155.77
12.6 61.08 75.63 103.07 124.72 145.3 156.72 158.76 159.41 160.01 161.16 163 156.46
15.8 61.5 72.37 98.9 120.54 144.21 154.92 158.25 159.23 159.58 160.72 162.97 155.7
20 59.17 69.16 94.08 115.75 142.46 153.88 157.75 159.05 159.42 160.08 162.68 155.17
25.1 57.52 65.52 89.93 111.43 139.69 152.76 157.02 158.65 159.12 159.65 162.11 154.48
31.6 59.51 64.73 85.98 106.67 135.53 151.08 156.16 158.01 158.59 159.2 160.58 153.6
39.8 57.74 63.48 83.1 102.24 131.11 148.64 155.27 157.56 158.17 158.77 159.62 152.73
50.1 58.96 64.63 82.59 98.62 126.59 145.14 153.41 157.06 157.86 158.66 159.56 151.61
63.1 59.01 64.85 79.94 97.41 122.19 141.72 150.5 155.84 157.17 158.38 159.64 150.01
79.4 61.46 65.6 75.93 93.09 118.25 138.53 147.65 153.38 155.4 157.17 158.98 147.84
100 62.86 66.78 75.27 92.35 115.8 135.85 145.57 151.46 153.49 155.38 157.46 145.91
125.9 68.13 72.16 79.58 93.4 115.87 134.32 144.3 150.65 152.75 154.56 156.55 145
158.5 63.39 67.68 74.11 87.64 109.36 128.46 139.56 146.86 149.33 151.41 153.68 141.29
199.5 63.47 66.81 71.6 79.32 99.93 122.36 134.99 143.32 146.28 148.75 151.51 137.96
251.2 68.24 70.4 73.07 78.46 94.39 118.36 131.22 140.09 143.48 146.26 149.33 135.08
316.2 60.82 64.36 68.99 76.27 90.14 114.75 127.53 136.68 140.39 143.56 146.89 132.02
398.1 61.81 66.24 71.38 76.96 88.84 111.81 124.18 133.22 137.19 140.65 144.3 128.85
501.2 64.58 68.22 72.68 77.06 87 108.83 120.98 129.71 133.81 137.41 141.54 125.55
631 63.08 66.86 71.59 75.52 85.13 105.75 117.81 126.35 130.36 134.09 138.05 122.19
794.3 62.5 65.74 70.59 74.6 83.61 102.92 114.79 123.23 127.02 130.59 134.74 118.89
1000 63.1 66.41 71.07 75.22 83.46 100.51 111.95 120.26 123.85 127.35 131.22 115.74
1258.9 63.8 67.08 71.71 75.69 83.56 98.52 109.41 117.43 120.98 124.23 128.04 112.82
1584.9 64.01 66.81 71.04 74.73 82.41 96.52 106.97 114.72 118.22 121.3 124.95 110.04
1995.3 64.16 67.11 70.95 74.17 81.24 94.09 104.36 112.06 115.54 118.5 122.04 107.33
2511.9 65.5 68.7 72 75.03 81.72 93.37 102.95 109.98 113.44 116.19 119.12 105.23
3162.3 66.73 70.17 72.86 75.26 81.91 93.26 102.27 108.5 111.88 114.32 116.66 103.74
3981.1 67.98 70.89 73.16 75.46 82.26 93.61 102.13 107.76 111.02 113.22 114.88 103.01
5011.9 68.22 71.3 73.51 75.84 82.9 94.32 102.35 107.63 110.56 112.83 114.4 102.83
6309.6 68.23 70.63 72.76 75.24 82.57 94.4 102.19 107.24 109.96 112.15 114.1 102.4
7943.3 67.61 69.95 71.99 74.65 82.09 94.28 101.82 106.62 109.07 111.15 114.97 101.71
10000 67.63 69.52 71.28 73.75 81.03 93.48 100.79 105.41 107.62 109.62 118.77 100.48
12589.3 68.84 70.52 72.25 74.65 81.98 94.71 101.82 106.34 108.27 110.24 118.01 101.29
15848.9 72.02 73.77 75.26 76.79 82.96 95.45 102.45 106.78 108.58 110.61 113.2 101.73
19952.6 72.98 75.29 76.3 77.36 83.27 95.53 102.2 106.21 107.81 109.79 112.13 101.19
25118.9 71.65 73.3 74.23 75.55 81.83 94.4 100.99 104.91 106.47 108.42 110.86 99.92
31622.8 71.48 73.14 74 75.08 80.35 92.21 98.73 102.57 104.09 106.03 108.42 97.6
39810.7 75.37 76.87 77.64 78.18 81.13 91.28 97.79 101.72 103.33 105.43 113.1 96.82
50118.7 74.76 76.04 76.72 77.33 80.5 90.34 97 101.13 103.01 105.52 131.5 100.83
63095.7 74.03 75.25 75.88 76.39 78.58 86.34 93.12 97.43 99.5 101.84 106.15 92.63
79432.8 79.36 80.55 81.23 81.62 83.11 86.76 92.65 97.01 99.37 101.86 107.19 92.55
100000 80.05 81.22 81.75 82.02 82.94 86.08 92.06 96.55 99.11 101.67 111.29 92.27
125892.5 81.57 82.87 83.28 83.52 84.3 86.1 90.59 94.79 97.33 100.08 125.09 93.56
158489.3 78 79.3 79.77 80.06 80.84 82.55 86.49 90.66 93.15 95.71 102.9 86.81
199526.2 83.82 86.73 87.37 87.8 88.73 90.24 91.31 92.48 93.87 95.77 104.92 90.74
JASCO APPLIED SCIENCES Passive Acoustic Monitoring in a Tidal Energy Environment
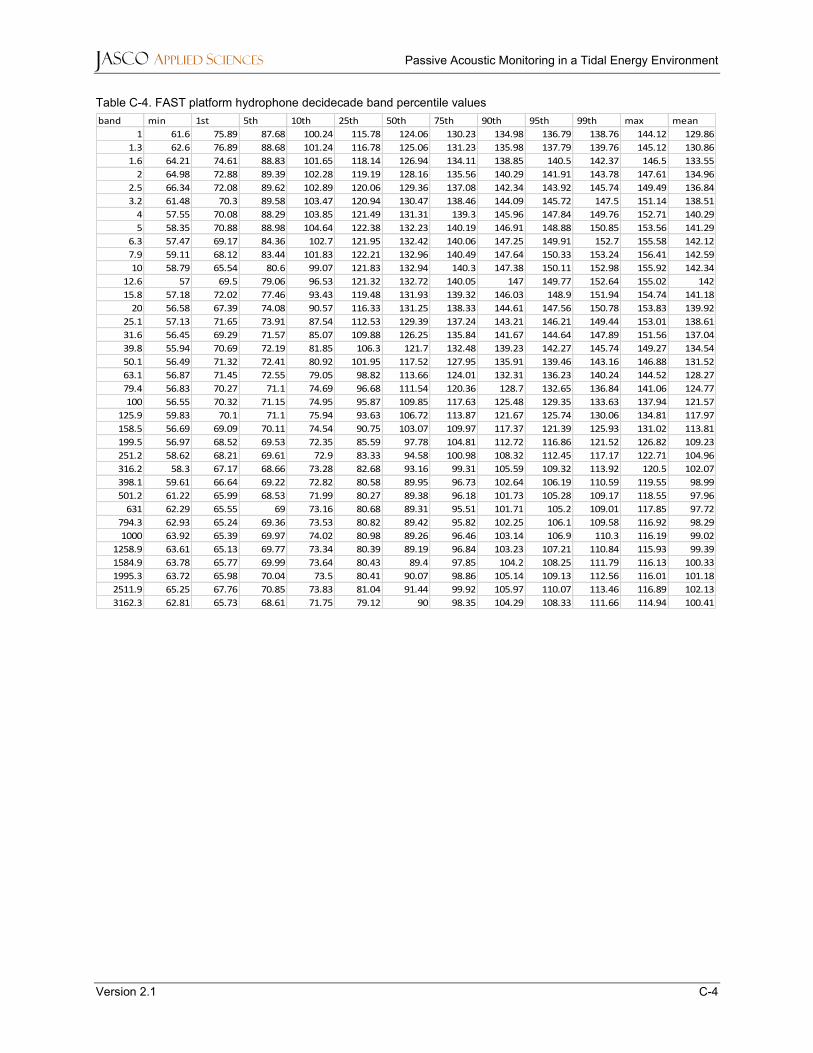
Version 2.1 C-4
Table C-4. FAST platform hydrophone decidecade band percentile values band min 1st 5th 10th 25th 50th 75th 90th 95th 99th max mean
1 61.6 75.89 87.68 100.24 115.78 124.06 130.23 134.98 136.79 138.76 144.12 129.86
1.3 62.6 76.89 88.68 101.24 116.78 125.06 131.23 135.98 137.79 139.76 145.12 130.86
1.6 64.21 74.61 88.83 101.65 118.14 126.94 134.11 138.85 140.5 142.37 146.5 133.55
2 64.98 72.88 89.39 102.28 119.19 128.16 135.56 140.29 141.91 143.78 147.61 134.96
2.5 66.34 72.08 89.62 102.89 120.06 129.36 137.08 142.34 143.92 145.74 149.49 136.84
3.2 61.48 70.3 89.58 103.47 120.94 130.47 138.46 144.09 145.72 147.5 151.14 138.51
4 57.55 70.08 88.29 103.85 121.49 131.31 139.3 145.96 147.84 149.76 152.71 140.29
5 58.35 70.88 88.98 104.64 122.38 132.23 140.19 146.91 148.88 150.85 153.56 141.29
6.3 57.47 69.17 84.36 102.7 121.95 132.42 140.06 147.25 149.91 152.7 155.58 142.12
7.9 59.11 68.12 83.44 101.83 122.21 132.96 140.49 147.64 150.33 153.24 156.41 142.59
10 58.79 65.54 80.6 99.07 121.83 132.94 140.3 147.38 150.11 152.98 155.92 142.34
12.6 57 69.5 79.06 96.53 121.32 132.72 140.05 147 149.77 152.64 155.02 142
15.8 57.18 72.02 77.46 93.43 119.48 131.93 139.32 146.03 148.9 151.94 154.74 141.18
20 56.58 67.39 74.08 90.57 116.33 131.25 138.33 144.61 147.56 150.78 153.83 139.92
25.1 57.13 71.65 73.91 87.54 112.53 129.39 137.24 143.21 146.21 149.44 153.01 138.61
31.6 56.45 69.29 71.57 85.07 109.88 126.25 135.84 141.67 144.64 147.89 151.56 137.04
39.8 55.94 70.69 72.19 81.85 106.3 121.7 132.48 139.23 142.27 145.74 149.27 134.54
50.1 56.49 71.32 72.41 80.92 101.95 117.52 127.95 135.91 139.46 143.16 146.88 131.52
63.1 56.87 71.45 72.55 79.05 98.82 113.66 124.01 132.31 136.23 140.24 144.52 128.27
79.4 56.83 70.27 71.1 74.69 96.68 111.54 120.36 128.7 132.65 136.84 141.06 124.77
100 56.55 70.32 71.15 74.95 95.87 109.85 117.63 125.48 129.35 133.63 137.94 121.57
125.9 59.83 70.1 71.1 75.94 93.63 106.72 113.87 121.67 125.74 130.06 134.81 117.97
158.5 56.69 69.09 70.11 74.54 90.75 103.07 109.97 117.37 121.39 125.93 131.02 113.81
199.5 56.97 68.52 69.53 72.35 85.59 97.78 104.81 112.72 116.86 121.52 126.82 109.23
251.2 58.62 68.21 69.61 72.9 83.33 94.58 100.98 108.32 112.45 117.17 122.71 104.96
316.2 58.3 67.17 68.66 73.28 82.68 93.16 99.31 105.59 109.32 113.92 120.5 102.07
398.1 59.61 66.64 69.22 72.82 80.58 89.95 96.73 102.64 106.19 110.59 119.55 98.99
501.2 61.22 65.99 68.53 71.99 80.27 89.38 96.18 101.73 105.28 109.17 118.55 97.96
631 62.29 65.55 69 73.16 80.68 89.31 95.51 101.71 105.2 109.01 117.85 97.72
794.3 62.93 65.24 69.36 73.53 80.82 89.42 95.82 102.25 106.1 109.58 116.92 98.29
1000 63.92 65.39 69.97 74.02 80.98 89.26 96.46 103.14 106.9 110.3 116.19 99.02
1258.9 63.61 65.13 69.77 73.34 80.39 89.19 96.84 103.23 107.21 110.84 115.93 99.39
1584.9 63.78 65.77 69.99 73.64 80.43 89.4 97.85 104.2 108.25 111.79 116.13 100.33
1995.3 63.72 65.98 70.04 73.5 80.41 90.07 98.86 105.14 109.13 112.56 116.01 101.18
2511.9 65.25 67.76 70.85 73.83 81.04 91.44 99.92 105.97 110.07 113.46 116.89 102.13
3162.3 62.81 65.73 68.61 71.75 79.12 90 98.35 104.29 108.33 111.66 114.94 100.41
JASCO APPLIED SCIENCES Passive Acoustic Monitoring in a Tidal Energy Environment
Version 2.1 C-5
Table C-5. HFM (pre-turbine) hydrophone decidecade band percentile values band min 1st 5th 10th 25th 50th 75th 90th 95th 99th max mean
1 87.2 89.38 91.28 93.88 105.39 118.36 125.51 129.98 132.46 135.69 140.1 125.48
1.3 88.2 90.38 92.28 94.88 106.39 119.36 126.51 130.98 133.46 136.69 141.1 126.48
1.6 85.46 87.75 89.64 92.62 105.09 117.7 124.93 129.49 132.15 135.51 139.7 125.1
2 83.99 86.21 88.08 91.33 104.92 117.35 124.66 129.29 132.01 135.44 139.85 124.96
2.5 82.8 84.98 86.9 91.02 104.94 117.03 124.28 128.99 131.71 135.16 139.3 124.62
3.2 79.38 81.88 84.15 90.52 104.79 116.37 123.59 128.42 131.07 134.5 138.39 123.99
4 75.6 78.08 81.18 90.24 104.61 115.63 122.63 127.52 130.09 133.4 137.6 123.04
5 76.19 78.68 81.85 91.08 105.56 116.47 123.48 128.34 130.91 134.21 138.36 123.86
6.3 68.65 70.91 77.29 90.55 106.24 115.91 122.63 127.5 130.05 133.2 136.47 122.95
7.9 67.76 70.2 77.19 91.08 107.44 117.07 123.69 128.71 131.27 134.33 137.71 124.11
10 67.18 69.61 77.5 91.98 109.19 119.33 125.84 131.01 133.74 136.73 140.29 126.45
12.6 66.86 69.38 79.1 94.16 112.76 122.09 128.29 133.26 135.94 138.85 142.17 128.7
15.8 65.98 68.36 78.33 92.91 112.63 121.46 127.14 131.44 133.69 136.57 139.73 126.93
20 64.63 66.33 70.53 82.05 101.55 113.39 120.79 127.43 129.75 132.35 135.88 122.21
25.1 63.71 65.24 68.09 76.65 97.19 108.69 119.02 130.46 133.67 137.92 143.7 125.92
31.6 63.09 64.7 67.51 74.19 93.93 105.33 112.78 123.02 126.26 129.81 134.71 118.24
39.8 62.4 63.92 66.26 70.08 86.57 96.62 105.99 113.31 117.2 122.76 128.62 110.25
50.1 61.3 62.95 65.15 67.78 80.47 89.78 101.9 111.31 114.61 118.57 122.95 106.77
63.1 60.85 62.78 65.07 68.52 78.35 87.93 100.12 108.38 110.6 113.21 119.75 102.78
79.4 60.25 62.31 65.28 67.6 74.96 83.03 93.46 103.53 107.23 111.88 120.33 99.78
100 60.05 62.01 64.48 67.18 73.55 81.74 90.56 96.81 99.85 103.62 117.83 92.85
125.9 59.76 61.82 64.65 67.39 74.13 82.65 90.59 96.55 99.71 103.52 119.97 92.96
158.5 59.39 61.65 64.57 67.49 74.33 82.92 90.62 96.57 99.82 103.72 119.98 93.07
199.5 59.24 61.45 64.53 67.17 73.39 81.82 89.44 95.62 99.24 103.51 125.29 93.81
251.2 59.39 61.76 65.4 68.18 74.28 82.63 90.1 96.44 100.29 104.3 127.41 95.25
316.2 59.59 61.74 66.17 69.04 75.21 83.83 91.2 97.43 101.33 105.34 129.19 96.45
398.1 60.12 62.7 67.08 69.97 75.96 84.78 92.12 98.12 102.11 106.26 126.78 96.2
501.2 61.14 63.55 67.47 70.38 76.23 85.27 92.63 98.51 102.59 106.71 123.45 95.79
631 60.6 63.51 67.78 70.75 76.67 86.2 93.68 99.58 103.54 107.72 120.82 96.45
794.3 61.46 64.44 68.34 71.48 77.41 87.44 95.08 100.8 104.77 109.01 117.51 97.44
1000 61.14 63.87 67.55 70.08 75.93 86.24 94.02 99.65 103.65 107.89 114.06 96.22
1258.9 60.47 63 66.54 69.57 74.73 85.57 93.22 98.51 102.55 107.05 113.1 95.26
1584.9 60.54 63.61 67.3 69.95 75.28 86.62 94.6 99.7 104 108.74 113.11 96.69
1995.3 61.83 65.37 69.52 71.76 77.3 89.11 97.09 102.15 106.54 111.17 114.5 99.14
2511.9 63.74 66.62 69.77 72.12 77.76 89.85 97.79 103.01 107.29 111.81 115.11 99.88
3162.3 64.22 67.22 70.04 72.23 78.48 91.12 99.07 104.22 108.29 112.56 115.92 100.87
3981.1 64.91 67.86 71.02 73.28 80.02 93.56 101.49 106.41 110.47 114.92 117.19 103.13
5011.9 65.64 68.08 71.08 73.39 81 95.14 102.88 107.71 111.81 115.91 117.96 104.33
6309.6 65.47 67.71 70.54 73 81.22 95.52 103.13 107.99 111.8 115.85 117.8 104.42
7943.3 65.73 67.52 70.37 72.9 81.89 96.22 103.65 108.38 112.01 115.95 117.83 104.68
10000 66.21 68.22 70.94 73.29 82.2 96.57 103.78 108.38 111.78 115.66 117.46 104.54
12589.3 66.74 68.55 70.94 73.07 82.19 96.28 103.44 107.98 111.11 115.07 116.98 104.04
15848.9 67.02 68.98 71.01 72.93 82.04 95.98 102.86 107.32 110.11 114.12 115.89 103.24
19952.6 67.49 69.11 70.92 72.74 82.02 95.85 102.47 106.76 109.3 113.22 118.82 102.58
25118.9 69.81 71.5 72.49 73.64 81.29 94.69 101.12 105.39 107.85 111.78 121.09 101.19
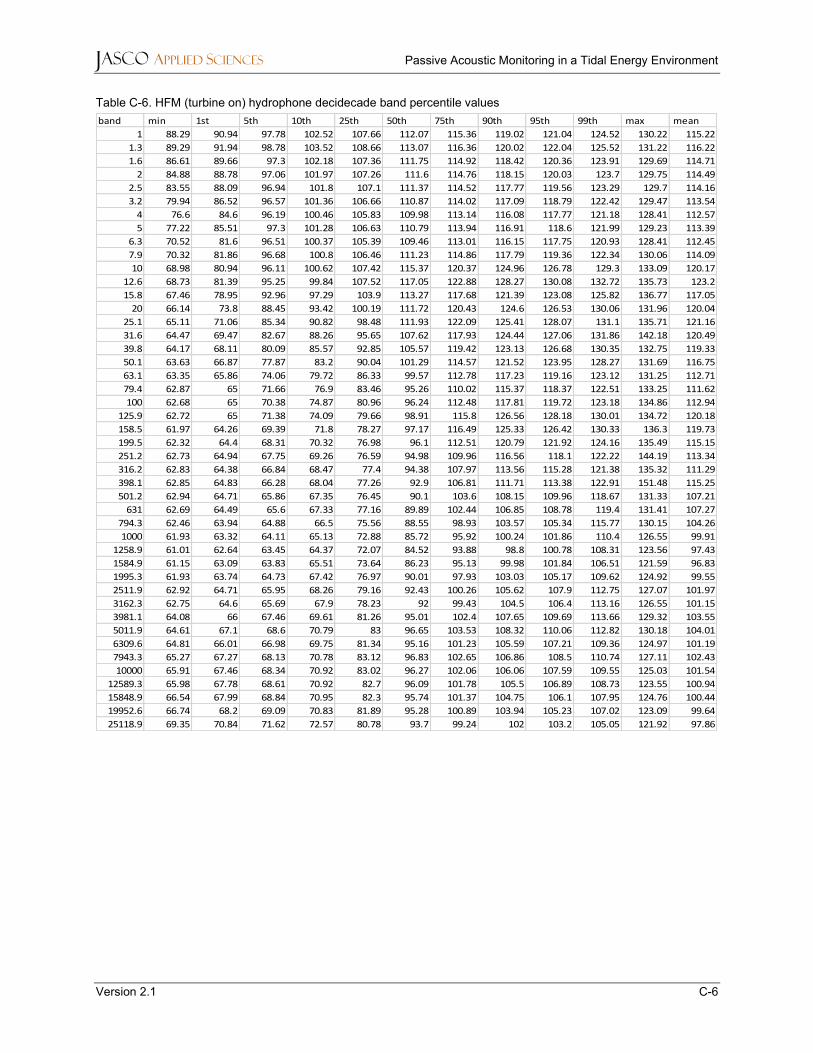
JASCO APPLIED SCIENCES Passive Acoustic Monitoring in a Tidal Energy Environment
Version 2.1 C-6
Table C-6. HFM (turbine on) hydrophone decidecade band percentile values band min 1st 5th 10th 25th 50th 75th 90th 95th 99th max mean
1 88.29 90.94 97.78 102.52 107.66 112.07 115.36 119.02 121.04 124.52 130.22 115.22
1.3 89.29 91.94 98.78 103.52 108.66 113.07 116.36 120.02 122.04 125.52 131.22 116.22
1.6 86.61 89.66 97.3 102.18 107.36 111.75 114.92 118.42 120.36 123.91 129.69 114.71
2 84.88 88.78 97.06 101.97 107.26 111.6 114.76 118.15 120.03 123.7 129.75 114.49
2.5 83.55 88.09 96.94 101.8 107.1 111.37 114.52 117.77 119.56 123.29 129.7 114.16
3.2 79.94 86.52 96.57 101.36 106.66 110.87 114.02 117.09 118.79 122.42 129.47 113.54
4 76.6 84.6 96.19 100.46 105.83 109.98 113.14 116.08 117.77 121.18 128.41 112.57
5 77.22 85.51 97.3 101.28 106.63 110.79 113.94 116.91 118.6 121.99 129.23 113.39
6.3 70.52 81.6 96.51 100.37 105.39 109.46 113.01 116.15 117.75 120.93 128.41 112.45
7.9 70.32 81.86 96.68 100.8 106.46 111.23 114.86 117.79 119.36 122.34 130.06 114.09
10 68.98 80.94 96.11 100.62 107.42 115.37 120.37 124.96 126.78 129.3 133.09 120.17
12.6 68.73 81.39 95.25 99.84 107.52 117.05 122.88 128.27 130.08 132.72 135.73 123.2
15.8 67.46 78.95 92.96 97.29 103.9 113.27 117.68 121.39 123.08 125.82 136.77 117.05
20 66.14 73.8 88.45 93.42 100.19 111.72 120.43 124.6 126.53 130.06 131.96 120.04
25.1 65.11 71.06 85.34 90.82 98.48 111.93 122.09 125.41 128.07 131.1 135.71 121.16
31.6 64.47 69.47 82.67 88.26 95.65 107.62 117.93 124.44 127.06 131.86 142.18 120.49
39.8 64.17 68.11 80.09 85.57 92.85 105.57 119.42 123.13 126.68 130.35 132.75 119.33
50.1 63.63 66.87 77.87 83.2 90.04 101.29 114.57 121.52 123.95 128.27 131.69 116.75
63.1 63.35 65.86 74.06 79.72 86.33 99.57 112.78 117.23 119.16 123.12 131.25 112.71
79.4 62.87 65 71.66 76.9 83.46 95.26 110.02 115.37 118.37 122.51 133.25 111.62
100 62.68 65 70.38 74.87 80.96 96.24 112.48 117.81 119.72 123.18 134.86 112.94
125.9 62.72 65 71.38 74.09 79.66 98.91 115.8 126.56 128.18 130.01 134.72 120.18
158.5 61.97 64.26 69.39 71.8 78.27 97.17 116.49 125.33 126.42 130.33 136.3 119.73
199.5 62.32 64.4 68.31 70.32 76.98 96.1 112.51 120.79 121.92 124.16 135.49 115.15
251.2 62.73 64.94 67.75 69.26 76.59 94.98 109.96 116.56 118.1 122.22 144.19 113.34
316.2 62.83 64.38 66.84 68.47 77.4 94.38 107.97 113.56 115.28 121.38 135.32 111.29
398.1 62.85 64.83 66.28 68.04 77.26 92.9 106.81 111.71 113.38 122.91 151.48 115.25
501.2 62.94 64.71 65.86 67.35 76.45 90.1 103.6 108.15 109.96 118.67 131.33 107.21
631 62.69 64.49 65.6 67.33 77.16 89.89 102.44 106.85 108.78 119.4 131.41 107.27
794.3 62.46 63.94 64.88 66.5 75.56 88.55 98.93 103.57 105.34 115.77 130.15 104.26
1000 61.93 63.32 64.11 65.13 72.88 85.72 95.92 100.24 101.86 110.4 126.55 99.91
1258.9 61.01 62.64 63.45 64.37 72.07 84.52 93.88 98.8 100.78 108.31 123.56 97.43
1584.9 61.15 63.09 63.83 65.51 73.64 86.23 95.13 99.98 101.84 106.51 121.59 96.83
1995.3 61.93 63.74 64.73 67.42 76.97 90.01 97.93 103.03 105.17 109.62 124.92 99.55
2511.9 62.92 64.71 65.95 68.26 79.16 92.43 100.26 105.62 107.9 112.75 127.07 101.97
3162.3 62.75 64.6 65.69 67.9 78.23 92 99.43 104.5 106.4 113.16 126.55 101.15
3981.1 64.08 66 67.46 69.61 81.26 95.01 102.4 107.65 109.69 113.66 129.32 103.55
5011.9 64.61 67.1 68.6 70.79 83 96.65 103.53 108.32 110.06 112.82 130.18 104.01
6309.6 64.81 66.01 66.98 69.75 81.34 95.16 101.23 105.59 107.21 109.36 124.97 101.19
7943.3 65.27 67.27 68.13 70.78 83.12 96.83 102.65 106.86 108.5 110.74 127.11 102.43
10000 65.91 67.46 68.34 70.92 83.02 96.27 102.06 106.06 107.59 109.55 125.03 101.54
12589.3 65.98 67.78 68.61 70.92 82.7 96.09 101.78 105.5 106.89 108.73 123.55 100.94
15848.9 66.54 67.99 68.84 70.95 82.3 95.74 101.37 104.75 106.1 107.95 124.76 100.44
19952.6 66.74 68.2 69.09 70.83 81.89 95.28 100.89 103.94 105.23 107.02 123.09 99.64
25118.9 69.35 70.84 71.62 72.57 80.78 93.7 99.24 102 103.2 105.05 121.92 97.86
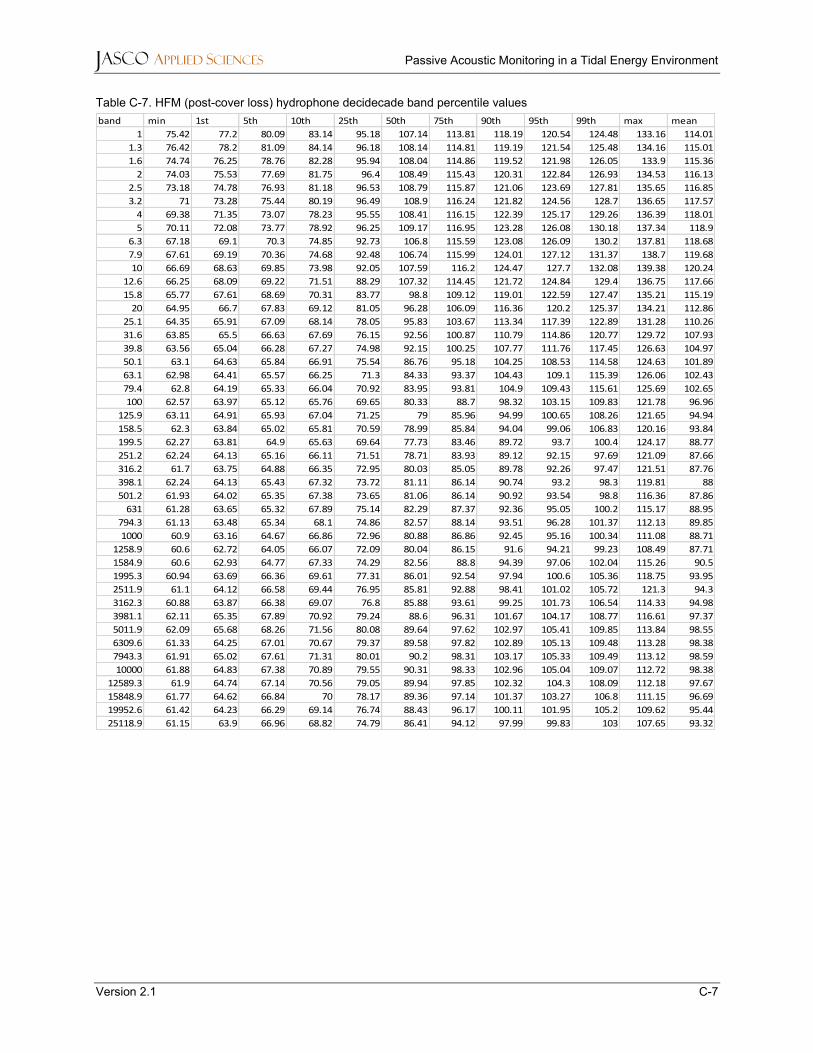
JASCO APPLIED SCIENCES Passive Acoustic Monitoring in a Tidal Energy Environment
Version 2.1 C-7
Table C-7. HFM (post-cover loss) hydrophone decidecade band percentile values band min 1st 5th 10th 25th 50th 75th 90th 95th 99th max mean
1 75.42 77.2 80.09 83.14 95.18 107.14 113.81 118.19 120.54 124.48 133.16 114.01
1.3 76.42 78.2 81.09 84.14 96.18 108.14 114.81 119.19 121.54 125.48 134.16 115.01
1.6 74.74 76.25 78.76 82.28 95.94 108.04 114.86 119.52 121.98 126.05 133.9 115.36
2 74.03 75.53 77.69 81.75 96.4 108.49 115.43 120.31 122.84 126.93 134.53 116.13
2.5 73.18 74.78 76.93 81.18 96.53 108.79 115.87 121.06 123.69 127.81 135.65 116.85
3.2 71 73.28 75.44 80.19 96.49 108.9 116.24 121.82 124.56 128.7 136.65 117.57
4 69.38 71.35 73.07 78.23 95.55 108.41 116.15 122.39 125.17 129.26 136.39 118.01
5 70.11 72.08 73.77 78.92 96.25 109.17 116.95 123.28 126.08 130.18 137.34 118.9
6.3 67.18 69.1 70.3 74.85 92.73 106.8 115.59 123.08 126.09 130.2 137.81 118.68
7.9 67.61 69.19 70.36 74.68 92.48 106.74 115.99 124.01 127.12 131.37 138.7 119.68
10 66.69 68.63 69.85 73.98 92.05 107.59 116.2 124.47 127.7 132.08 139.38 120.24
12.6 66.25 68.09 69.22 71.51 88.29 107.32 114.45 121.72 124.84 129.4 136.75 117.66
15.8 65.77 67.61 68.69 70.31 83.77 98.8 109.12 119.01 122.59 127.47 135.21 115.19
20 64.95 66.7 67.83 69.12 81.05 96.28 106.09 116.36 120.2 125.37 134.21 112.86
25.1 64.35 65.91 67.09 68.14 78.05 95.83 103.67 113.34 117.39 122.89 131.28 110.26
31.6 63.85 65.5 66.63 67.69 76.15 92.56 100.87 110.79 114.86 120.77 129.72 107.93
39.8 63.56 65.04 66.28 67.27 74.98 92.15 100.25 107.77 111.76 117.45 126.63 104.97
50.1 63.1 64.63 65.84 66.91 75.54 86.76 95.18 104.25 108.53 114.58 124.63 101.89
63.1 62.98 64.41 65.57 66.25 71.3 84.33 93.37 104.43 109.1 115.39 126.06 102.43
79.4 62.8 64.19 65.33 66.04 70.92 83.95 93.81 104.9 109.43 115.61 125.69 102.65
100 62.57 63.97 65.12 65.76 69.65 80.33 88.7 98.32 103.15 109.83 121.78 96.96
125.9 63.11 64.91 65.93 67.04 71.25 79 85.96 94.99 100.65 108.26 121.65 94.94
158.5 62.3 63.84 65.02 65.81 70.59 78.99 85.84 94.04 99.06 106.83 120.16 93.84
199.5 62.27 63.81 64.9 65.63 69.64 77.73 83.46 89.72 93.7 100.4 124.17 88.77
251.2 62.24 64.13 65.16 66.11 71.51 78.71 83.93 89.12 92.15 97.69 121.09 87.66
316.2 61.7 63.75 64.88 66.35 72.95 80.03 85.05 89.78 92.26 97.47 121.51 87.76
398.1 62.24 64.13 65.43 67.32 73.72 81.11 86.14 90.74 93.2 98.3 119.81 88
501.2 61.93 64.02 65.35 67.38 73.65 81.06 86.14 90.92 93.54 98.8 116.36 87.86
631 61.28 63.65 65.32 67.89 75.14 82.29 87.37 92.36 95.05 100.2 115.17 88.95
794.3 61.13 63.48 65.34 68.1 74.86 82.57 88.14 93.51 96.28 101.37 112.13 89.85
1000 60.9 63.16 64.67 66.86 72.96 80.88 86.86 92.45 95.16 100.34 111.08 88.71
1258.9 60.6 62.72 64.05 66.07 72.09 80.04 86.15 91.6 94.21 99.23 108.49 87.71
1584.9 60.6 62.93 64.77 67.33 74.29 82.56 88.8 94.39 97.06 102.04 115.26 90.5
1995.3 60.94 63.69 66.36 69.61 77.31 86.01 92.54 97.94 100.6 105.36 118.75 93.95
2511.9 61.1 64.12 66.58 69.44 76.95 85.81 92.88 98.41 101.02 105.72 121.3 94.3
3162.3 60.88 63.87 66.38 69.07 76.8 85.88 93.61 99.25 101.73 106.54 114.33 94.98
3981.1 62.11 65.35 67.89 70.92 79.24 88.6 96.31 101.67 104.17 108.77 116.61 97.37
5011.9 62.09 65.68 68.26 71.56 80.08 89.64 97.62 102.97 105.41 109.85 113.84 98.55
6309.6 61.33 64.25 67.01 70.67 79.37 89.58 97.82 102.89 105.13 109.48 113.28 98.38
7943.3 61.91 65.02 67.61 71.31 80.01 90.2 98.31 103.17 105.33 109.49 113.12 98.59
10000 61.88 64.83 67.38 70.89 79.55 90.31 98.33 102.96 105.04 109.07 112.72 98.38
12589.3 61.9 64.74 67.14 70.56 79.05 89.94 97.85 102.32 104.3 108.09 112.18 97.67
15848.9 61.77 64.62 66.84 70 78.17 89.36 97.14 101.37 103.27 106.8 111.15 96.69
19952.6 61.42 64.23 66.29 69.14 76.74 88.43 96.17 100.11 101.95 105.2 109.62 95.44
25118.9 61.15 63.9 66.96 68.82 74.79 86.41 94.12 97.99 99.83 103 107.65 93.32