Embed Size (px)
Citation preview

Appendix IV
Transportation Planning Factors Memo

Philip Habib & Associates Engineers and Planners • 102 Madison Avenue • New York, NY 10016 • 212 929 5656 • 212 929 5605 (fax)
-1-
TRANSPORTATION PLANNING FACTORS MEMO
To: NYC Department of City Planning Environmental Review Team From: Philip Habib & Associates Date: October 9th, 2014; updated May 17th, 2017 Re: Pfizer Sites Rezoning Transportation Planning Factors & Travel Demand Forecast (PHA #1294) CEQR No. 15DCP117K This memorandum summarizes the transportation planning factors to be used for analysis of traffic, parking, transit, and pedestrian conditions for the EIS for the Pfizer Sites Rezoning, which would facilitate the redevelopment of a two block area (including Blocks 2249 and 2265), owned by the project applicant, in Brooklyn Community District 1 (see Figure 1). Estimates of the proposed action’s and associated reasonable worst case development scenario (RWCDS) peak travel demand are provided, along with a discussion of trip assignment methodologies and study area definitions. The Proposed Action and RWCDS The applicant, Harrison Realty, LLC, is proposing zoning map and text amendments to facilitate a new predominantly residential mixed-use development on two blocks in South Williamsburg. The area directly affected by the proposed action comprises approximately 191,245 square feet (sf) (“rezoning area”), and is generally bounded by the formerly demapped segment of Walton Street on the north1, Harrison Avenue to the east, Gerry Street to the south, and Union and Marcy Avenues to the west, and is currently zoned M3-1, which allows low-performance manufacturing uses (see Figure 1). The proposed action would rezone the current M3-1 zoning district to R7A, R7D, and R8A contextual zoning districts, map C2-4 commercial overlays, and apply the Mandatory Inclusionary Housing (MIH) zoning regulations in the proposed R7A, R7D, and R8A districts. The R7A, R7D, and R8A proposed zoning districts would allow residential and community facility development where they are prohibited today, and the proposed C2-4 commercial overlays would allow commercial uses. In order to assess the potential effects of the proposed action, the EIS will consider a reasonable worst-case development scenario (RWCDS) for both the “future without the proposed action” (No-Action) and
1 The demapping of a one block segment of Walton Street, from Harrison Avenue to Union Avenue, in accordance with Maps Nos. N-2405 and N-2406, signed by the Brooklyn Borough President on November 29, 1988, was approved by the CPC (ULURP No. 880488 MMK) on May 15, 1989 (Cal. No. 2) and by the Board of Estimate on June 29, 1989 (Cal No. 16). The maps were filed on August 25, 1999 and the map change became effective the following day. The application underwent environmental review as part of the Final Environmental Impact Statement (FEIS) for the Broadway Triangle Redevelopment Area, May 1989 (CEQR No. 86-304K).


-2-
“future with the proposed action (With-Action) conditions, which will be analyzed for an analysis year, or Build year, of 2019. The environmental review will consider that the applicant would develop up to approximately 1,147 dwelling units (DUs), of which approximately 344 DUs (30 percent of the total) would be affordable housing units, with approximately 64,807 gsf of local retail space and 427 accessory parking spaces in eight buildings (“Buildings A, B, C, D, E, F, G, and H”) on two blocks, as shown in Figure 1. Block 2249 would contain Buildings A, B, and C. Building A would contain 204 DUs and 13,618 gsf of local retail space, Buildings B would contain 142 DUs and 6,240 gsf of local retail space, and Building C would contain 95 DUs and 6,240 gsf of local retail space. In total, Block 2249 would contain 441 DUs and 26,098 gsf of local retail space. It would also contain 165 accessory parking spaces. A pedestrian plaza would bisect the block with Building A on the west and Building B on the east. Building A would be located on the west side of the block and would front Union Avenue on the west and Wallabout Street on the south. Building B would be located along the pedestrian plaza, and Building C would be immediately adjacent to Building B on the east side of the block and would front Harrison Avenue. A pedestrian plaza would bisect the block with Building A on the west and Building B on the east. Block 2265 would contain Buildings D, E, F, G, and H. Buildings D would contain 95 DUs and 6,240 gsf of local retail space, Building E would contain 142 DUs and 6,240 gsf of local retail space, Buildings F and G would each contain 102 DUs and 4,855 gsf of local retail space, and Building H would contain 265 DUs and 16,519 gsf of local retail space. In total, Block 2265 would contain 706 DUs and 38,709 gsf of local retail space. It would also contain 262 accessory parking spaces. A pedestrian plaza would bisect the block with Buildings F and G on the west and Building E on the east. Building D would be located on the east side of the block and front Harrison Avenue, Building E would be located along the pedestrian plaza, Building F would front Wallabout Street on the north, and Building G would be immediately adjacent to Building F and front Gerry Street on the south. Building H would front Union Street on the west, Wallabout Street on the north, and Gerry Street on the south and would be immediately adjacent to Buildings F and G. As the RWCDS exceeds the applicable development density thresholds specified in Table 16-1 of the 2014 CEQR Technical Manual, a screening assessment is necessary to determine if detailed analyses of traffic and parking, transit, and pedestrians are warranted. Per 2014 CEQR Technical Manual guidelines, the screening assessment consists of a two-level process including a Level 1 Project Trip Generation Screening Assessment and a Level 2 Project-generated Trip Assignment Screening Assessment. Description of Project Area Block 2249 is bounded by Union Avenue on the west side, Wallabout Street on the south side, Harrison Avenue on the east side, and Walton Street on the north side. Block 2265 is bounded by Union Avenue on the west side, Gerry Street on the south side, Harrison Avenue on the east side, and Wallabout Street on the north side. The project area, consisting of the entirety of both blocks, is currently undeveloped and most nearby buildings are either residential use or a light industrial/warehouse use. There is a charter school on the southwest corner of Gerry Street and Harrison Avenue. Flushing Avenue, which crosses Union Avenue, Marcy Avenue, and Gerry Street on the southwest corner of Block 2265 is a major east-west arterial in Brooklyn. It is a designated NYC local truck route. All other streets are local streets. The nearest subway stations to the project area are the Flushing Avenue station on the IND Crosstown Line (G train) on the southwest corner of Block 2265 at Flushing Avenue, Union Avenue, Marcy Avenue, and Gerry Street, and the Lorimer Street Station on the BMT Jamaica Line (J and M trains) on Broadway between Lorimer and Wallabout Streets. The B57 bus runs along Flushing Avenue. Other nearby bus

-3-
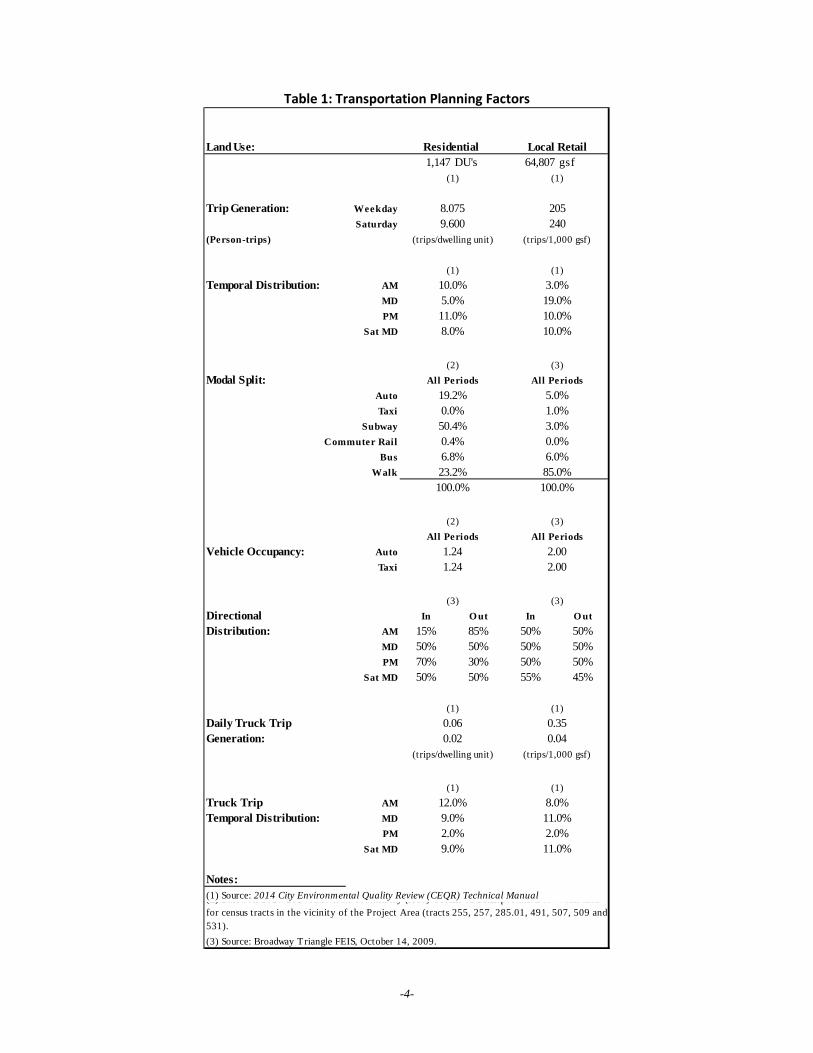
routes include the B43 on Flushing Avenue southeast of the site, B44 Select Bus Service on Bedford and Lee Avenues west of the site, the B46 on Broadway northeast of the site, and the B48 on Lorimer Street one block north of the site. Transportation Planning Assumptions & Travel Demand Forecasts In order to conduct a Level 1 Trip Generation Screening Assessment for the proposed action, a travel demand forecast was conducted for a typical peak hour during four time periods: weekday AM, weekday midday, weekday PM, and Saturday midday. Trips to and from the project area were generated using various assumptions, including daily trip generation rates, mode choice, and hourly and directional patterns. Table 1 provides the transportation planning assumptions which were based on standard criteria as per the 2014 City Environmental Quality Review (CEQR) Technical Manual, census data, and studies that have been used in previous environmental assessments and EISs for project with similar uses in nearby areas of Brooklyn. Table 2a provides the overall resulting trip generation for the RWCDS for all peak hours for person trips for each mode of transportation and Table 2b provides the overall resulting trip generation for the RWCDS for all peak hours for vehicles trips including autos, taxis, and trucks. Residential The forecast of travel demand for residential use used a weekday trip generation rate of 8.075 person trips per dwelling unit (DU), a Saturday trip generation rate of 9.6 person trips per DU, and temporal distributions of 10.0 percent, 5.0 percent, 11.0 percent, and 8.0 percent for the weekday AM, midday, PM, and Saturday midday peak hours, respectively, as per the 2014 CEQR Technical Manual. The residential modal split assumed 19.2 percent, 0.0 percent, 50.4 percent, 0.4 percent, 6.8 percent, and 23.2 percent mode shares for private auto, taxi, subway, commuter rail, bus and walk-only modes, respectively, as per the 2010 to 2014 American Community Survey (ACS) Means of Transportation to Work Table for Brooklyn census tracts 255, 257, 285.01, 491, 507, 509, and 531. The vehicle occupancy of 1.24 persons per vehicle was also based on this source. It should be noted that there is variation as to the modal split of each census tract. As such, it is standard procedure to include all census tracts within a ¼-mile radius of the project site. Directional splits (in/out) were assumed based on the Broadway Triangle FEIS, October 2009. Local Retail The forecast of travel demand for the local retail use used a weekday trip generation rate of 205 person trips per 1,000 sf, a Saturday trip generation rate of 240 person trips per 1,000 sf, and temporal distributions of 3.0 percent, 19.0 percent, 10.0 percent, and 10.0 percent for the weekday AM, midday, PM, and Saturday midday peak hours, respectively, as per the 2014 CEQR Technical Manual. The local retail modal split assumed 5.0 percent, 1.0 percent, 3.0 percent, 0.0 percent, 6.0 percent, and 85.0 percent mode shares for private auto, taxi, subway, bus, and walk-only modes, respectively, based on the Broadway Triangle FEIS, October 2009. The vehicle occupancy of 2.00 persons per vehicle and the directional splits were also assumed based on the Broadway Triangle FEIS. In addition, it was assumed that 25% of local retail trips would be linked and not new to the study area.
-4-
Table 1: Transportation Planning Factors
Land Use:1,147 DU's 64,807 gsf
Trip Generation: WeekdaySaturday
(Person-trips)
Temporal Distribution: AMMDPM
Sat MD
Modal Split:AutoTaxi
SubwayCommuter Rail
BusWalk
Vehicle Occupancy: AutoTaxi
Directional In O ut In O utDistribution: AM 15% 85% 50% 50%
MD 50% 50% 50% 50%PM 70% 30% 50% 50%
Sat MD 50% 50% 55% 45%
Daily Truck TripGeneration:
Truck Trip AMTemporal Distribution: MD
PMSat MD
Notes:(1) Source: 2014 City Environmental Quality Review (CEQR) Technical Manual
(3) Source: Broadway Triangle FEIS, October 14, 2009.
2.0%
(2) Based on 2010 2014 American Community (ACS) Means of Transportation to Work data for census tracts in the vicinity of the Project Area (tracts 255, 257, 285.01, 491, 507, 509 and 531).
5.0%
(1)
(1)
9.6008.075
3.0%19.0%10.0%
3.0%
10.0%
100.0%
(3)All Periods
(3)
6.0%85.0%
0.0%
(1)
2.002.00
(3)
(1)
(3)
All Periods1.241.24
(2)
(trips/1,000 gsf)
205
All Periods19.2%
6.8%
2.0%
(1)
1.0%
All Periods5.0%
12.0%9.0%
0.35
(trips/dwelling unit)
(1)
(trips/1,000 gsf)
(1)8.0%11.0%
10.0%
11.0%8.0%
Residential
11.0%9.0%
0.060.02
(trips/dwelling unit)
100.0%
0.0%
0.4%
(2)
50.4%
23.2%
240
Local Retail
(1)
0.04

-5-
Table 2a: Travel Demand Forecast (Person Trips)
D.U. gsf
Peak Hour Trips: In Out Total In Out Total In Out TotalAM 139 786 925 147 147 294 286 933 1,219MD 232 232 464 946 946 1,892 1,178 1,178 2,356PM 712 305 1,017 498 498 996 1,210 803 2,013
Sat MD 440 440 880 643 526 1,169 1,083 966 2,049
AM Trips by Mode: In Out Total In Out Total In Out TotalAuto 25 154 179 10 10 20 35 164 199Taxi 0 0 0 0 0 0 0 0 0
Subway 70 397 467 2 2 4 72 399 471Commuter Rail 0 2 2 0 0 0 0 2 2
Bus 10 51 61 10 10 20 20 61 81Walk 34 182 216 125 125 250 159 307 466Total 139 786 925 147 147 294 286 933 1,219
Midday Trips by Mode: In Out Total In Out Total In Out TotalAuto 44 44 88 50 50 100 94 94 188Taxi 0 0 0 10 10 20 10 10 20
Subway 120 120 240 29 29 58 149 149 298Commuter Rail 0 0 0 0 0 0 0 0 0
Bus 15 15 30 55 55 110 70 70 140Walk 53 53 106 802 802 1,604 855 855 1,710Total 232 232 464 946 946 1,892 1,178 1,178 2,356
PM Trips by Mode: In Out Total In Out Total In Out TotalAuto 136 58 194 23 23 46 159 81 240Taxi 0 0 0 6 6 12 6 6 12
Subway 359 153 512 13 13 26 372 166 538Commuter Rail 2 0 2 0 0 0 2 0 2
Bus 48 23 71 31 31 62 79 54 133Walk 167 71 238 425 425 850 592 496 1,088Total 712 305 1,017 498 498 996 1,210 803 2,013
Sat. Midday Trips by Mode: In Out Total In Out Total In Out TotalAuto 83 83 166 31 28 59 114 111 225Taxi 0 0 0 9 4 13 9 4 13
Subway 223 223 446 19 17 36 242 240 482Commuter Rail 0 0 0 0 0 0 0 0 0
Bus 32 32 64 40 31 71 72 63 135Walk 102 102 204 544 446 990 646 548 1,194Total 440 440 880 643 526 1,169 1,083 966 2,049
Residential Local RetailLand Use:
Total Trips1,147 64,807

-6-
Table 2b: Travel Demand Forecast (Vehicle Trips)
Levels 1 and 2 Screening According to the 2014 CEQR Technical Manual, if an action would result in development greater than these minimum development density thresholds, a Level 1 (Project Trip Generation) Screening Assessment should be prepared. In most areas of the city, including the project area, if the proposed actions are projected to result in fewer than 50 peak-hour vehicle trips, 200 peak-hour subway/rail or bus transit riders, or 200 peak-hour pedestrian trips, it is unlikely that further analysis would be necessary. If these trip-generation screening thresholds are exceeded, a Level 2 (Project-generated Trip Assignment) Screening Assessment should be prepared to determine if the proposed action would generate or divert 50 peak-hour vehicle trips through any intersection, 200 peak-hour subway trips through a single station, 50 peak-hour bus trips on a single bus route in the peak direction, or 200 peak-hour pedestrian trips through a single pedestrian element. If any of these Level 2 screening thresholds are met or exceeded, detailed analysis for the respective mode is required. Vehicle and Pedestrian Trip Assignment The purpose of the Level 2 vehicle Trip Assignment screening assessment is to determine if any intersection would exceed the 50-trip screening threshold and therefore likely would require detailed analysis.
D.U. gsf
Peak Hour Vehicle Trips In Out Total In Out Total In Out Total
AM Auto 21 122 143 8 8 16 29 130 159Taxi 0 0 0 0 0 0 0 0 0
Balanced Taxi 0 0 0 0 0 0 0 0 0Truck 4 4 8 0 0 0 4 4 8Total 25 126 151 8 8 16 33 134 167
MD Auto 34 34 68 27 27 54 61 61 122Taxi 0 0 0 8 8 16 8 8 16
Balanced Taxi 0 0 0 16 16 32 16 16 32Truck 2 2 4 0 0 0 2 2 4Total 36 36 72 43 43 86 79 79 158
PM Auto 111 47 158 12 12 24 123 59 182Taxi 0 0 0 6 6 12 6 6 12
Balanced Taxi 0 0 0 12 12 24 12 12 24Truck 0 0 0 0 0 0 0 0 0Total 111 47 158 24 24 48 135 71 206
Sat MD Auto 68 68 136 18 17 35 86 85 171Taxi 0 0 0 8 4 12 8 4 12
Balanced Taxi 0 0 0 12 12 24 12 12 24Truck 2 2 4 0 0 0 2 2 4Total 70 70 140 30 29 59 100 99 199
Land Use: Residential Local Retail
Total Trips1,147 64,807

-7-
For the vehicle and pedestrian trip assignment for the proposed action, the origins and destinations for auto, taxi, and truck vehicle increments and for bus, subway, and walk-only pedestrian increments were assumed using data from the Broadway Triangle FEIS, October 2009.
Traffic As indicated in Table 2b, a travel demand forecast indicates that the RWCDS would generate a project increment of approximately 167, 158, 206, and 199 generated vehicle trips in the AM, midday, PM, and Saturday midday peak periods, respectively. However, not all trips will come from the same origins and use the same routes to travel to and from the two-block area. Approximately 28 percent of residential trips and 41 percent of retail trips would come from points west (including the Brooklyn-Queens Expressway) and use Flushing Avenue or Wallabout Street, approximately 28 percent of residential trips and 9 percent of retail trips would come from points north (including the Williamsburg Bridge) and use Union Avenue, approximately 17 percent of residential trips and 20 percent of retail trips would come from points south and use Marcy, Harrison, or Tompkins Avenues, approximately 16 percent of residential trips and 24 percent of retail trips would come from points east and use Flushing Avenue or Wallabout Street, and approximately 11 percent of residential trips and 6 percent of retail trips would come from points north and northeast and use Harrison or Marcy Avenues. Vehicles were assigned to blocks based on the percentage of DUs and retail space in each block, and there would be driveways on the north and south sides of each block as shown in Figure 1. Figure 2 shows the preliminary traffic increments at the intersections surrounding the project area. Figure 2 shows that there are more than 50 vehicles at seven intersections immediately surrounding the site. Figure 3 shows the ten intersections which have been selected for detailed traffic analysis and are listed below, including three additional intersections which have less than 50 vehicles in any peak hour but are expected to have a substantial increase in pedestrian flow due to the RWCDS:
• Harrison Avenue and Union Avenue (signalized) • Lorimer Street and Union Avenue (signalized) • Walton Street and Union Avenue (signalized) • Wallabout Street and Union Avenue (two-way stop controlled) • Flushing Avenue/Gerry Street and Marcy Avenue/Union Avenue (signalized) • Lorimer Street and Harrison Avenue (signalized) • Walton Street and Harrison Avenue (two-way stop controlled) • Wallabout Street and Harrison Avenue (two-way stop controlled)2 • Gerry Street and Harrison Avenue (signalized) • Bartlett Street and Harrison Avenue (signalized)
Each intersection will be analyzed for the weekday AM, weekday midday, weekday PM, and Saturday midday. Parking As noted above, the RWCDS is required by zoning to provide at least 427 accessory parking spaces in the two-block project area.
2 It should be noted that the New York City Department of Transportation (NYCDOT) installed a signal at this location after data was collected. As such, this intersection will be analyzed as signalized in the No-Action and With-Action conditions.


-8-
As the RWCDS is primarily residential, it has been assumed that the peak parking demand would be in the overnight period. The 2006 to 2010 American Association of State Highway Transportation Officials Census Transportation Planning Products (AASHTO CTPP) data for vehicles available by income for housing units in Brooklyn Census Tracts 255, 257, 285.01, 491, 507, 509, and 531 is 42 percent for those making more than $30,000 a year (market rate) and 24 percent for those making less than $30,000 a year (affordable). Therefore, the proposed action will generate a peak parking demand of approximately 421 overnight parking spaces per the AASHTO CTPP data.
As there would be 427 accessory parking spaces on site and the peak demand will be 421 spaces, the overnight parking utilization is expected to be 98.6 percent. Therefore, detailed on-street and public off-street parking analyses are not warranted. The weekday and Saturday parking demand for the RWCDS is shown in Tables 3 and 4, respectively.
Transit According to the general thresholds used by the Metropolitan Transportation Authority specified in the 2014 CEQR Technical Manual, detailed transit analyses are not required if the proposed action is projected to result in less than 200 peak hour (weekday AM and PM) rail or bus transit riders, because a proposed development that generates such a low number of transit riders is unlikely to create a significant adverse impact on the current transit facilities. As shown in Table 2a, the approximate net hourly rail (subway and commuter rail combined) trips generated by the RWCDS would be 473 and 540 trips in the weekday AM and PM peak hours, respectively. Based on ridership data, approximately 65 percent of trips were assigned to the Lorimer Street station on the BMT Jamaica line (J and M trains) with the remaining approximately 35 percent assigned to the Flushing Avenue station on the IND Crosstown Line (G Train). Figure 4 shows the number of trips assigned to and from each subway entrance. The number of hourly trips using the Lorimer Street station would be 308 and 355 trips in the weekday AM and PM peak hours, respectively. All trips to and from the Lorimer Street station are assumed to use the southeastern staircases at the intersection of Wallabout Street and Broadway, and analysis of these staircases and associated fare arrays would be warranted. However, it was determined that there would be fewer than 5 new trips per rail car boarding or alighting trains at this station and therefore line-haul analysis would not be warranted. As shown in Table 2a, the approximate net hourly public bus trips generated by the RWCDS would be 81 and 133 in the weekday AM, midday, PM, and Saturday midday peak hours, respectively. Bus trips were assigned to the B43 bus on Flushing Avenue between Tompkins and Throop Avenues, the B44 Select Bus Service on Bedford and Lee Avenues at Flushing Avenue, the B46 bus on Broadway at Lorimer Street (for retail trips to/from Block 2249 and residential trips to/from Building B) and at Gerry Street (for all other trips), the B48 bus on Lorimer Street at Harrison Avenue, and the B57 bus on Flushing Avenue at Marcy Avenue. The number of trips assigned to each bus route is also shown in Figure 4. As shown in Figure 4, the B46 bus route would experience an increase of 50 trips in the weekday PM peak hour, however, these trips would not all be traveling in the same direction. No other bus route would experience an increase of 50 or more trips per route per direction in any one peak hour, and therefore detailed bus transit analysis would not be warranted.


-9-
Table 3: Projected Weekday Hourly Parking Demand for the RWCDS
Table 4: Projected Saturday Hourly Parking Demand for the RWCDS
Local Retail Total1,147 DU 64,807 sf, p p
In Out In Out In Out Accumulation12-1 AM 3 3 0 0 3 3 3821-2 3 3 0 0 3 3 3822-3 3 3 0 0 3 3 3823-4 3 3 0 0 3 3 3824-5 3 3 0 0 3 3 3825-6 5 15 0 0 5 15 3726-7 12 42 0 0 12 42 3427-8 15 75 3 1 18 76 2848-9 21 122 8 8 29 130 1839-10 22 58 10 5 32 63 15210-11 21 53 11 6 32 59 12511-12 19 46 11 9 30 55 10012-1 PM 34 34 27 27 61 61 1001-2 36 36 18 18 54 54 1002-3 37 29 14 14 51 43 1083-4 59 23 14 16 73 39 1424-5 73 37 13 16 86 53 1755-6 111 47 12 12 123 59 2396-7 74 32 12 14 86 46 2797-8 73 17 7 10 80 27 3328-9 51 15 5 7 56 22 3669-10 22 7 2 4 24 11 37910-11 10 7 0 0 10 7 38211-12 7 7 0 0 7 7 382
Total 717 717 167 167 884 884
Residential
Local Retail Total1,147 DU 64,807 sf, 06 uto ps 390 uto ps
In Out In Out In Out Accumulation12-1 AM 0 0 0 0 0 0 3821-2 0 0 0 0 0 0 3822-3 0 0 0 0 0 0 3823-4 9 0 0 0 9 0 3914-5 9 0 0 0 9 0 4005-6 9 19 0 0 9 19 3906-7 9 56 0 0 9 56 3437-8 9 76 0 0 9 76 2768-9 28 116 4 2 32 118 1909-10 19 56 8 6 27 62 15510-11 38 47 14 10 52 57 15011-12 38 38 15 10 53 48 15512-1 PM 38 38 15 12 53 50 1581-2 68 68 18 17 86 85 1592-3 47 28 20 20 67 48 1783-4 66 19 18 19 84 38 2244-5 77 38 18 18 95 56 2635-6 114 47 18 18 132 65 3306-7 84 38 18 18 102 56 3767-8 56 38 15 16 71 54 3938-9 56 38 10 13 66 51 4089-10 28 28 2 10 30 38 40010-11 28 38 2 4 30 42 38811-12 23 27 0 2 23 29 382
Total 853 853 195 195 1,048 1,048
Residential

-10-
Pedestrians Analysis of pedestrian conditions focuses on elements where substantial a number of trips are generated by an action. These elements include sidewalks, street corner areas, and crosswalks. The number of pedestrian trips generated includes the number of bus, subway, and “walk only” trips. According to the 2014 CEQR Technical Manual, detailed pedestrian analyses are not required if the proposed action is projected to result in less than 200 peak hour pedestrian trips on any single element. The RWCDS would generate pedestrian demand of 1,020, 2,148, 1,761, and 1,811 pedestrian trips in the in the weekday AM, midday, PM, and Saturday midday peak hours, respectively. Bus, subway, and “walk only” trips would each have a different assignment pattern; bus trips would go directly to/from bus stops, subway trips would go directly to/from subway stations, and “walk only” trips would be distributed around the neighborhood evenly. As shown in Figure 1, the entrances to each building would be as follows:
• Building A would have its residential entrance on the north side of Wallabout Street between Union and Harrison Avenues and retail entrances on the east side of Union Avenue between Wallabout and Walton Streets and in the pedestrian plaza.
• Building B would have its residential and retail in the pedestrian plaza between Wallabout and Walton Streets.
• Building C would have its residential and retail entrances on the west side of Harrison Avenue between Wallabout and Walton Streets.
• Building D would have its residential and retail entrances on the west side of Harrison Avenue between Gerry and Wallabout Streets.
• Building E would have its residential and retail in the pedestrian plaza between Gerry and Wallabout Streets.
• Building F would have its residential entrance on the south side of Wallabout Street between Union and Harrison Avenues and its retail entrance in the pedestrian plaza.
• Building G would have its residential entrance on the north side of Gerry Street between Union and Harrison Avenues and its retail entrance in the pedestrian plaza.
• Building H would have its residential entrance on the south side of Wallabout Street between Union and Harrison Avenues and its retail entrance on the east side of Union Avenue between Gerry and Wallabout Streets.
A preliminary assignment of pedestrians as shown in Figures 5 and 6 shows that pedestrian analysis will be warranted in locations situated along the project blocks and along Wallabout Street between the project area and the Lorimer Street subway station. As shown in Figure 7, the following sidewalks, crosswalks, and corner areas have been selected for analysis: SIDEWALKS
• North sidewalk on Gerry Street between Union and Harrison Avenues • South sidewalk on Wallabout Street between Union and Harrison Avenues • North sidewalk on Wallabout Street between Union and Harrison Avenues • South sidewalk on Wallabout Street between Harrison and Throop Avenues • North sidewalk on Wallabout Street between Harrison and Throop Avenues • North sidewalk on Wallabout Street between Throop Avenue and Broadway • South sidewalk on Walton Street between Union and Harrison Avenues • East sidewalk on Union Avenue between Gerry and Wallabout Streets


-11-
CROSSWALKS
• Flushing Avenue/Gerry Street and Marcy Avenue/Union Avenue – North Crosswalk • Flushing Avenue/Gerry Street and Marcy Avenue/Union Avenue – East Crosswalk • Wallabout Street and Harrison Avenue – North Crosswalk (No-Action and With-Action only) • Wallabout Street and Harrison Avenue – South Crosswalk (No-Action and With-Action only) • Wallabout Street and Harrison Avenue – West Crosswalk (No-Action and With-Action only)
CORNER AREAS
• Walton Street and Union Avenue – Northeast Corner • Walton Street and Union Avenue – Southeast Corner • Flushing Avenue/Gerry Street and Marcy Avenue/Union Avenue – Northwest Corner • Flushing Avenue/Gerry Street and Marcy Avenue/Union Avenue – Northeast Corner • Flushing Avenue/Gerry Street and Marcy Avenue/Union Avenue – Southwest Corner • Flushing Avenue/Gerry Street and Marcy Avenue/Union Avenue – Southeast Corner • Wallabout Street and Harrison Avenue – Northwest Corner (No-Action and With-Action only) • Wallabout Street and Harrison Avenue – Northeast Corner (No-Action and With-Action only) • Wallabout Street and Harrison Avenue – Southwest Corner (No-Action and With-Action only) • Wallabout Street and Harrison Avenue – Southeast Corner (No-Action and With-Action only) • Gerry Street and Harrison Avenue – Northwest Corner • Gerry Street and Harrison Avenue – Northeast Corner • Gerry Street and Harrison Avenue – Southwest Corner • Wallabout Street and Broadway – Northwest Corner
In addition, it should be noted that the following crosswalks and corner areas at unsignalized intersections would experience an increase of 200 or more pedestrian trips in any one peak hour. However, because there is currently no adequate methodology to analyze crosswalks and corner areas at unsignalized intersections, detailed pedestrian analysis at these elements would not be warranted unless the intersection experiences a significant adverse traffic impact and would require installation of a traffic signal for mitigation. CROSSWALKS
• Wallabout Street and Union Avenue – East Crosswalk • Wallabout Street and Throop Avenue – North Crosswalk
CORNER AREAS
• Wallabout Street and Union Avenue – Northwest Corner • Wallabout Street and Union Avenue – Northeast Corner • Wallabout Street and Union Avenue – Southwest Corner • Wallabout Street and Union Avenue – Southeast Corner • Walton Street and Harrison Avenue – Southwest Corner • Walton Street and Harrison Avenue – Southeast Corner • Wallabout Street and Throop Avenue – Northwest Corner • Wallabout Street and Throop Avenue – Northeast Corner

-12-
• Wallabout Street and Throop Avenue – Southwest Corner Conclusion After performing preliminary screening of traffic, parking, transit, and pedestrian conditions, it has been determined that detailed transportation analyses of traffic and pedestrians (including subway station elements) are warranted as per CEQR criteria.