Embed Size (px)
Citation preview

SSEPD LCNF Tier 1 Close Down Report
SSET1005 Low Voltage Network Modelling and Analysis Environment
© Southern Electric Power Distribution 2013
Appendix I
Data Migration Specification Report

Confidential 22 of 23
SSEPD LCNF Tier 1 Close Down Report
SSET1005 Low Voltage Network Modelling and Analysis Environment
GE Digital Energy
Data Migration SpecificationLow Carbon Network Fund First Tier Project
Date: 05/12/2012
Version: 1.3
Confidential 33 of 23
SSEPD LCNF Tier 1 Close Down Report
SSET1005 Low Voltage Network Modelling and Analysis Environment
Document Approval
Checked: John Mitchell Date: 19/11/2011
Approved: John Mitchell Date: 19/11/2011
Change History
Date Author Versio
n
Section Change Description
07/11/2011 Mark Ryall 0.1 Initial draft
15/11/2011 Mark Ryall 1.0 Revised to include section on Placar data.
18/11/2011 Mark Ryall 1.1 Revised to include Pole Towers
19/11/2011 John Mitchell 1.2 All Reviewed
05/01/2012 Mark Ryall 1.3
Copyright
©2011 General Electric Company. All Rights Reserved. GE and the GE monogram are trademarks and service marks of General Electric
Company.
The Software Product described in this documentation may only be used in accordance with the applicable License Agreement. The
Software Product and Associated Material are deemed to be “commercial computer software” and “commercial computer software
documentation,” respectively, pursuant to DFAR Section 227.7202 and FAR Section 12.212, as applicable, and are delivered with Restricted
Rights. Such restricted rights are those identified in the License Agreement, and as set forth in the “Restricted Rights Notice” contained in
paragraph (g) (3) (Alternate III) of FAR 52.227-14, Rights in Data-General, including Alternate III (June 1987).
If applicable, any use, modification, reproduction release, performance, display or disclosure of the Software Product and Associated
Material by the customer shall be governed solely by the terms of the License Agreement and shall be prohibited except to the extent
expressly permitted by the terms of the License Agreement.
The information contained in this document is subject to change without notice. The software described in this document is supplied
under license and may be used or copied only in accordance with the terms of such license.
The information contained in this document is the exclusive property of General Electric Company except as otherwise indicated, and shall
not be disclosed or reproduced in whole or in part without prior written consent from General Electric Company.

Confidential 44 of 23
SSEPD LCNF Tier 1 Close Down Report
SSET1005 Low Voltage Network Modelling and Analysis Environment
Contents
1. Introduction ..........................................................................................................................5
1.1 Purpose of Document ..................................................................................................... 5
1.2 Scope............................................................................................................................. 5
2. Project Study Area ...............................................................................................................6
3. Data Migration......................................................................................................................7
3.1 SSE GIS to Electric Office Migration ............................................................................... 7
3.1.1 GIS to EO Migration Approach.................................................................................... 7
3.1.2 GIS to EO Migration Mappings ................................................................................... 8
3.2 Placar to Electric Office Migration ................................................................................. 10
3.2.1 Placar to EO Migration Approach.............................................................................. 10
3.2.2 Placar to EO Migration Mappings.............................................................................. 10
4. Data Model Specification....................................................................................................11

Confidential 55 of 23
SSEPD LCNF Tier 1 Close Down Report
SSET1005 Low Voltage Network Modelling and Analysis Environment
1. Introduction
1.1 Purpose of Document
This specification document is one of the deliverables of Work Package 4 of the Low Carbon Network
Fund First Tier Project. The purpose of the document is to define how data will be migrated from
SSE’s existing Smallworld Version 3.1 SP2 GIS, and from the Placar system, into Smallworld Electric
Office 4.2 which will act as the LV Network Modelling Environment. The context of the migration work
package in the overall workflow of the project is indicated in the diagram below.
The specification document has 2 key purposes:
• It will be used as an input to design the software tools required to perform the data migration.
• It ensures a common understanding between SSE and GE of what data is required from
Placar and the GIS for the LV network modelling exercise.
1.2 Scope
The document covers the following aspects of the migration exercise:
• It describes how the study area for the project is defined.
• It describes the overall approach of the migration exercise.
• It defines the mapping of data from Placar and SSE’s existing GIS into Smallworld Electric
Office.
• It details any data model changes necessary in Smallworld E lectric Office to accommodate
the data from the existing GIS and from Placar
The field and value mappings are specified in detail in the associated spreadsheet ‘SSE EO Migration
Spec.xls’
Confidential 66 of 23
SSEPD LCNF Tier 1 Close Down Report
SSET1005 Low Voltage Network Modelling and Analysis Environment
2. Project Study Area
For the purposes of the LCNF First Tier Project an area in Bracknell has been mutually agreed with
SSE as providing a representative sample of the LV network. The area is defined as being fed by the
following 21 Substations:
Site Code Name Network Reference Number
BRKN BRACKNELL 2203
1626331 PRIESTWOOD 2203001020
1626216 MERRYHILL 2203001140
1626294 RACAL No1 2203002020
33722 THE ARENA BLOCK A 2203003020
33725 THE ARENA BLOCK B 2203003040
1636505 HORSNEILE LANE 2203004100
1626272 WOKINGHAM ROAD 2203008020
1640467 BOYD COURT 2203010020
37328 ONE THAMES VALLEY 2203013010
33763 TRINITY COURT No1 2203013020
1644236 MILBANKE WAY 2203013060
1626320 BROOK GREEN 2203017020
1626319 KINGSMERE ROAD 2203017040
1626135 MOORDALE AVENUE 2203017080
1626146 WINDLESHAM ROAD 2203017100
1626227 COPPICE GREEN 2203017120
1626238 PRIESTWOOD SCHOOL 2203017140
1626191 SHEPHERDS LANE 2203017260
1626249 STONEY ROAD 2203001120A
1626674 BULL LANE Unknown
The area comprises approximately 28km of LV network, not including service cables, and around
1800 supply points.

Confidential 77 of 23
SSEPD LCNF Tier 1 Close Down Report
SSET1005 Low Voltage Network Modelling and Analysis Environment
3. Data Migration
3.1 SSE GIS to Electric Office Migration
3.1.1 GIS to EO Migration Approach
In order to identify the extent of the LV network which needs to be migrated to Electric Office, a series
of network traces have been run in SSE’s existing GIS from the 21 substations in the study area. The
network traces have been used to define a polygon representing the boundary of the area to be
migrated. When the actual data migration is performed, a copy of the SSE GIS database will be
opened by the migration software in Electric Office, and all the LV network data inside the polygon will
be copied directly into the Electric Office database.
All LV network objects in the area will be migrated, including substation internals. In addition the 11kV
network between the Bracknell primary substation and the distribution substations will be included.
Schematics are excluded from the scope of the migration.
For the purposes of the LCNF First Tier Project the migration will be undertaken as a one off exercise.
If the project is extended to the second tier phase the migration software will need to be enhanced to
allow the data in Electric Office to be periodically refreshed from the source data in SSE’s GIS. This
will require that the internal ids of network objects in SSE’s GIS are stored in Electric Office to enable
EO records to be updated from the GIS source records. However, this is not within the scope of the
current project.
Confidential 88 of 23
SSEPD LCNF Tier 1 Close Down Report
SSET1005 Low Voltage Network Modelling and Analysis Environment
3.1.2 GIS to EO Migration Mappings
The table below lists the objects in the SSE GIS which will be migrated and their corresponding
objects in Electric Office.
SSE GIS Object Electric Office Object
LV Cable and Service Cable Segment
Cable Existing Phase
Cable Spec
LV Oh Line Wire Segment
Wire Existing Phase
Wire
Wire Spec
HV Cable Cable Segment
Cable Existing Phase
Cable
Cable Spec
HV Oh Line Wire Segment
Wire Existing Phase
Wire
Wire Spec
Joint Connector Point Installation
Connector Point Existing Phase
Connector Point
Connector Point Spec
Link Box Composite Switch
Composite Switch Spec
Pole Tower Composite Switch
Composite Switch Spec
Schematic Connector Network Hypernode
Sub Station Substation
Supply Location Energy Consumer
Busbar Connector Segment Installation
Connector Segment Existing Phase
Connector Segment
Connector Segment Spec
Confidential 99 of 23
SSEPD LCNF Tier 1 Close Down Report
SSET1005 Low Voltage Network Modelling and Analysis Environment
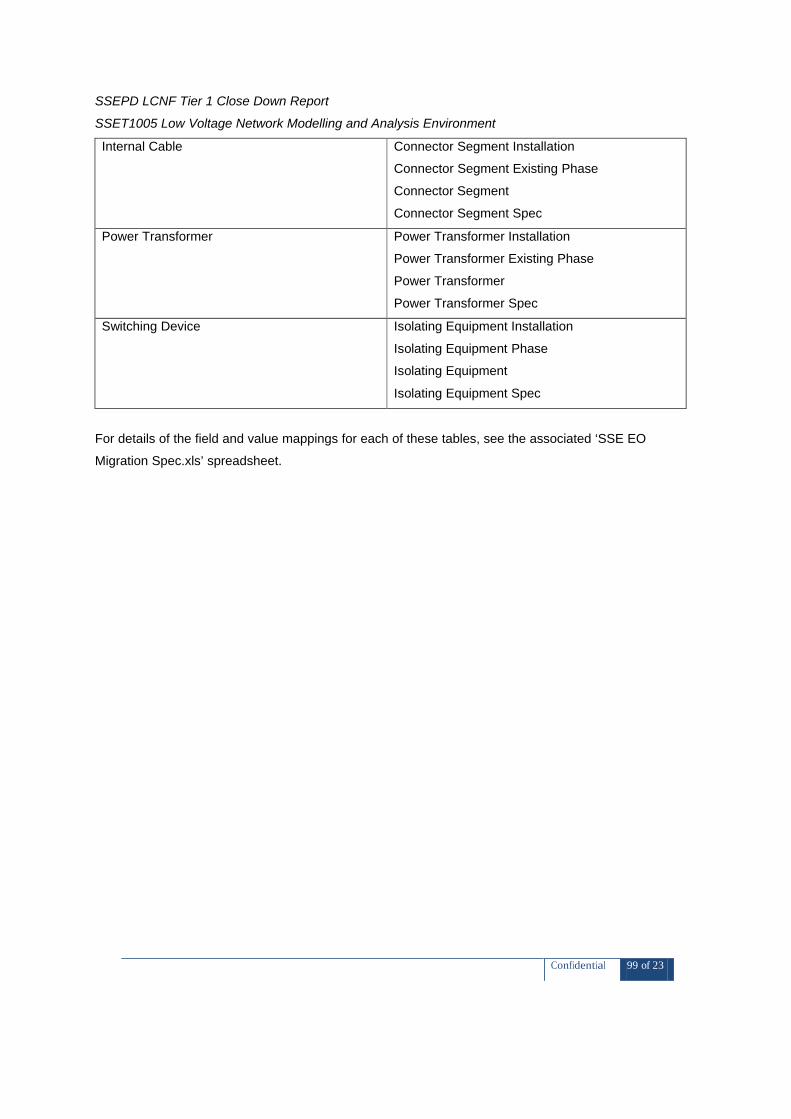
Internal Cable Connector Segment Installation
Connector Segment Existing Phase
Connector Segment
Connector Segment Spec
Power Transformer Power Transformer Installation
Power Transformer Existing Phase
Power Transformer
Power Transformer Spec
Switching Device Isolating Equipment Installation
Isolating Equipment Phase
Isolating Equipment
Isolating Equipment Spec
For details of the field and value mappings for each of these tables, see the associated ‘SSE EO
Migration Spec.xls’ spreadsheet.

Confidential 1010 of23
SSEPD LCNF Tier 1 Close Down Report
SSET1005 Low Voltage Network Modelling and Analysis Environment
3.2 Placar to Electric Office Migration
3.2.1 Placar to EO Migration Approach
Data from Placar for the 21 substations in the study area will be supplied as an Excel spreadsheet
which will be converted to CSV format and loaded into the Electric Office database.
For the tier 2 LV network modelling project it is expected that the capture of data from Placar into
Electric Office could be streamlined using a direct ODBC connection between EO and the Placar
database. However, this is not within the scope of the current LCNF First Tier Project .
3.2.2 Placar to EO Migration Mappings
The records from Placar will be matched with substations in EO using the the Loc ID (NRN) ,
Substation Code, and Substation Names fields. The rating in kVA will then be set for each substation
transformer in EO from the Placar data.
For further detail, see the associated ‘SSE EO Migration Spec.xls’ spreadsheet.

Confidential 1111 of23
SSEPD LCNF Tier 1 Close Down Report
SSET1005 Low Voltage Network Modelling and Analysis Environment
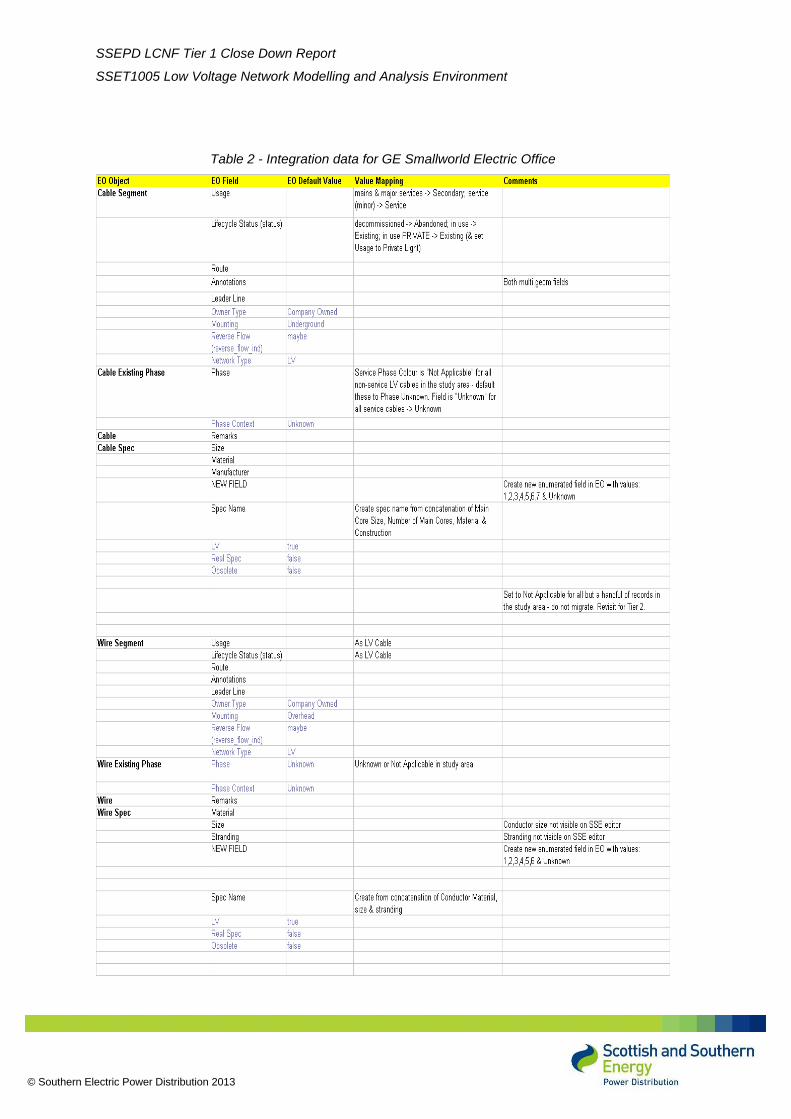
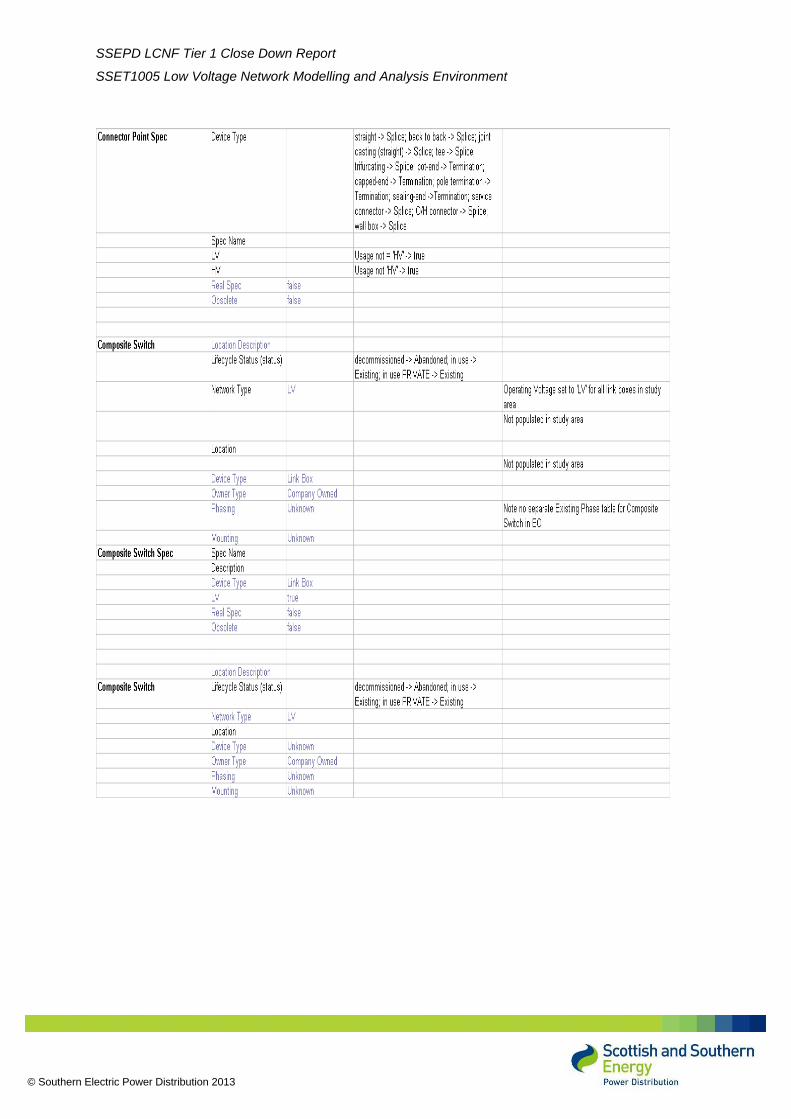
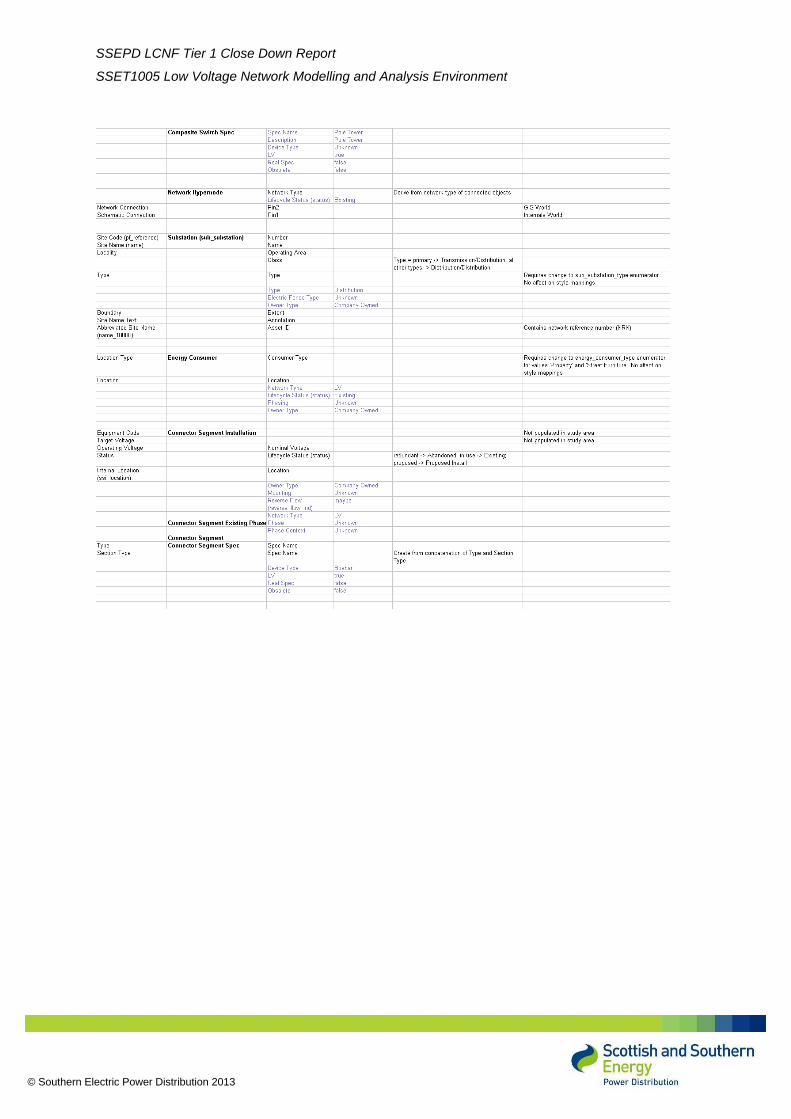
4. Data Model Specification
Almost all data from Placar and the GIS required for the LV network modelling exercise can be
migrated to Electric Office using the standard EO 4.2 datamodel and enumerator values. However, a
small number of changes to the EO datamodel will be necessary. These are detailed in the table
below. In accordance with EO customisation guidelines, and to ensure compatibility with future EO
product releases, the internal names of new fields will be prefixed with ‘sse_’.
EO Object EO Field Description
Cable Spec Number of Main Cores New enumerated field in EO with values:
1,2,3,4,5,6,7 & Unknown.
Wire Spec Number of Conductors Create new enumerated field in EO with values:
1,2,3,4,5,6,7 & Unknown.
Substation Type Change to sub_substation_type enumerator.
New enumerator values: primary, ground
mounted distribution, pole mounted distribution,
buried distribution, kiosk distribution, pillar
distribution, site only, & consumers.
Energy
Consumer
Consumer Type Change to energy_consumer_type enumerator.
New enumerator values: Property & Street
Furniture.

CYME
SSEPD LCNF Tier 1 Close Down Report
SSET1005 Low Voltage Network Modelling and Analysis Environment
© Southern Electric Power Distribution 2013
Appendix II
Distributed Generation
CYME
SSEPD LCNF Tier 1 Close Down Report
SSET1005 Low Voltage Network Modelling and Analysis Environment
© Southern Electric Power Distribution 2013
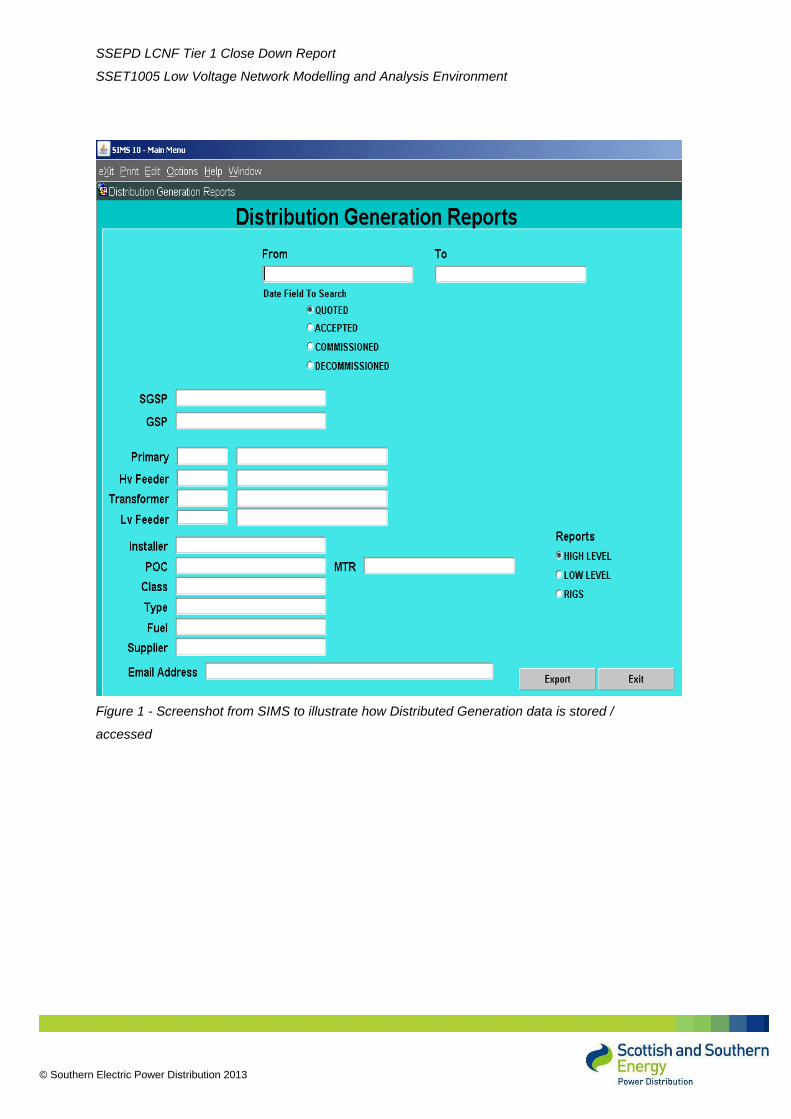
Figure 1 - Screenshot from SIMS to illustrate how Distributed Generation data is stored /
accessed
CYME
SSEPD LCNF Tier 1 Close Down Report
SSET1005 Low Voltage Network Modelling and Analysis Environment
© Southern Electric Power Distribution 2013
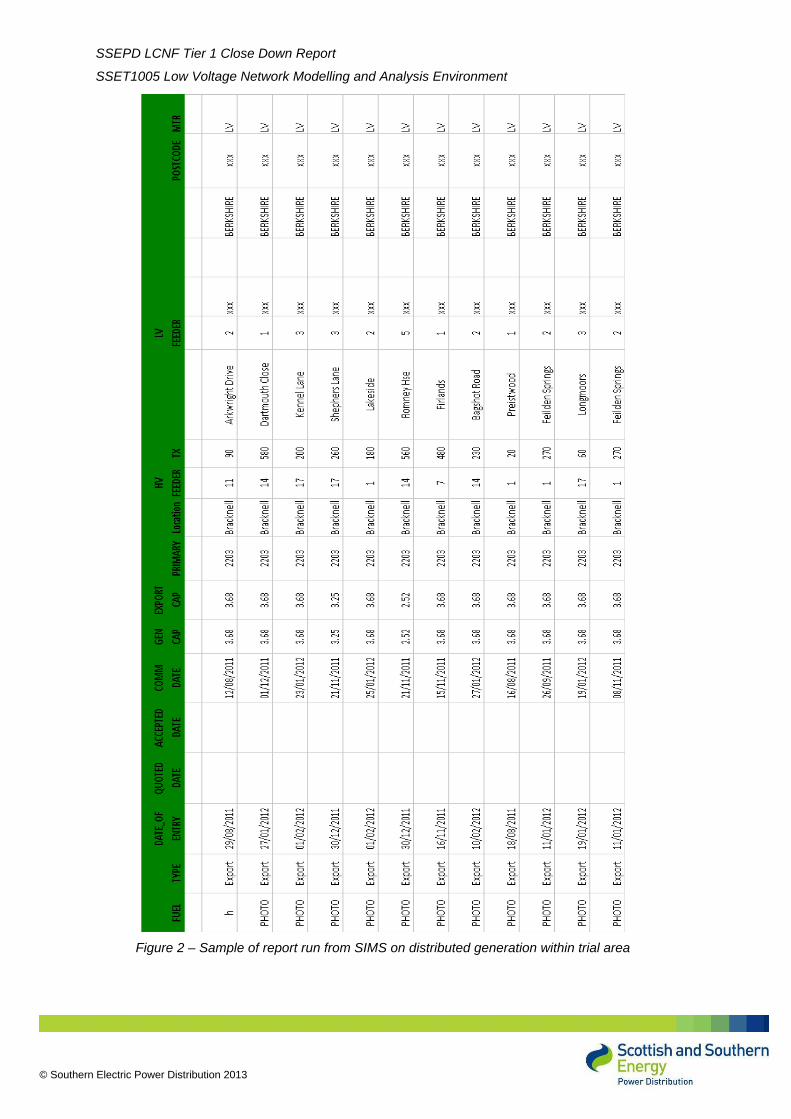
Figure 2 – Sample of report run from SIMS on distributed generation within trial area
SSEPD LCNF Tier 1 Close Down Report
SSET1005 Low Voltage Network Modelling and Analysis Environment
© Southern Electric Power Distribution 2013
Appendix III
Data Migration Specification Spreadsheet
SSEPD LCNF Tier 1 Close Down Report
SSET1005 Low Voltage Network Modelling and Analysis Environment
© Southern Electric Power Distribution 2013
Table 1 - Integration data for SSEPD’s GIS
SSEPD LCNF Tier 1 Close Down Report
SSET1005 Low Voltage Network Modelling and Analysis Environment
© Southern Electric Power Distribution 2013
Table 2 - Integration data for GE Smallworld Electric Office

SSEPD LCNF Tier 1 Close Down Report
SSET1005 Low Voltage Network Modelling and Analysis Environment
© Southern Electric Power Distribution 2013
SSEPD LCNF Tier 1 Close Down Report
SSET1005 Low Voltage Network Modelling and Analysis Environment
© Southern Electric Power Distribution 2013
SSEPD LCNF Tier 1 Close Down Report
SSET1005 Low Voltage Network Modelling and Analysis Environment
© Southern Electric Power Distribution 2013
SSEPD LCNF Tier 1 Close Down Report
SSET1005 Low Voltage Network Modelling and Analysis Environment
© Southern Electric Power Distribution 2013

SSEPD LCNF Tier 1 Close Down Report
SSET1005 Low Voltage Network Modelling and Analysis Environment
© Southern Electric Power Distribution 2013

SSEPD LCNF Tier 1 Close Down Report
SSET1005 Low Voltage Network Modelling and Analysis Environment
© Southern Electric Power Distribution 2013
Table 3 - Integration data for SSEPD's plant information system (PLACAR)

SSEPD LCNF Tier 1 Close Down Report
SSET1005 Low Voltage Network Modelling and Analysis Environment
© Southern Electric Power Distribution 2013
SSEPD LCNF Tier 1 Close Down Report
SSET1005 Low Voltage Network Modelling and Analysis Environment
© Southern Electric Power Distribution 2013
Appendix IV
Power Analysis Tool Evaluation document
GE Digital Energy
Power Analysis Tool - EvaluationLow Carbon Network Fund First Tier Project
Date: 22/12/2011
Version: 1.0
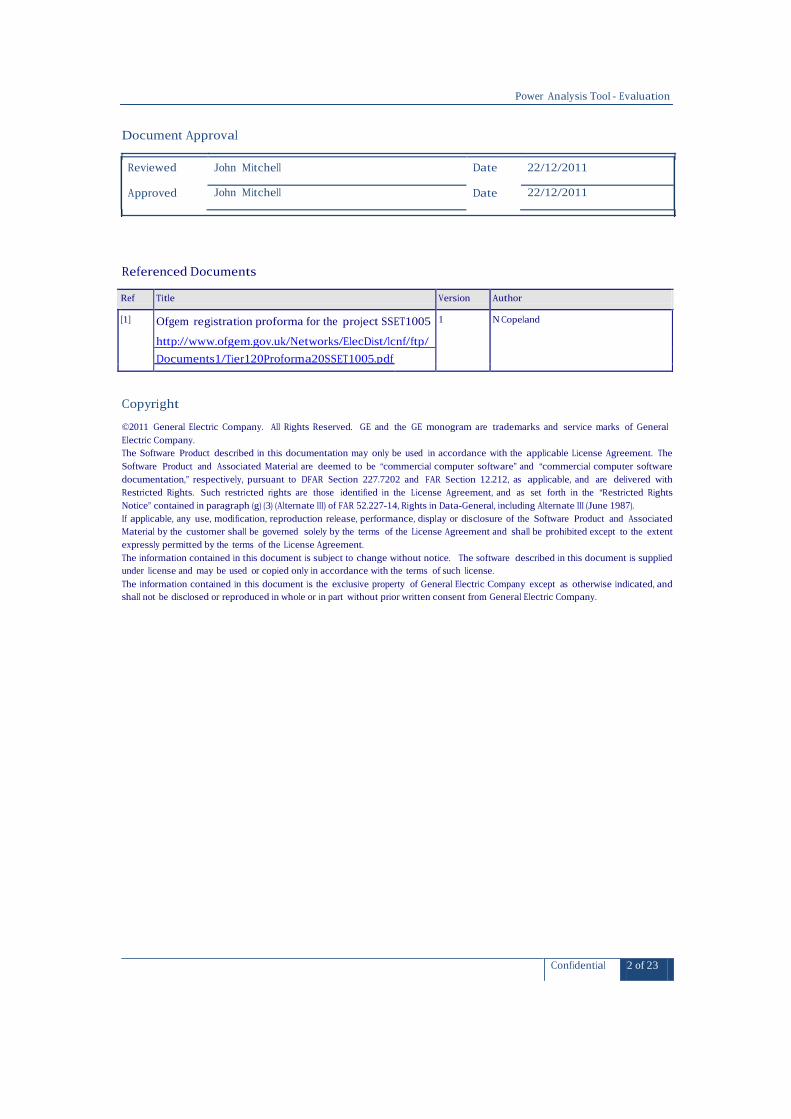
Power Analysis Tool - Evaluation
Confidential 2 of 23
Document Approval
Reviewed John Mitchell Date 22/12/2011
Approved John Mitchell Date 22/12/2011
Referenced Documents
Ref Title Version Author
[1] Ofgem registration proforma for the project SSET1005
http://www.ofgem.gov.uk/Networks/ElecDist/lcnf/ftp/
1 N Copeland
Documents1/Tier120Proforma20SSET1005.pdf
Copyright
©2011 General Electric Company. All Rights Reserved. GE and the GE monogram are trademarks and service marks of General
Electric Company.
The Software Product described in this documentation may only be used in accordance with the applicable License Agreement. The
Software Product and Associated Material are deemed to be “commercial computer software” and “commercial computer software
documentation,” respectively, pursuant to DFAR Section 227.7202 and FAR Section 12.212, as applicable, and are delivered with
Restricted Rights. Such restricted rights are those identified in the License Agreement, and as set forth in the “Restricted Rights
Notice” contained in paragraph (g) (3) (Alternate III) of FAR 52.227-14, Rights in Data-General, including Alternate III (June 1987).
If applicable, any use, modification, reproduction release, performance, display or disclosure of the Software Product and Associated
Material by the customer shall be governed solely by the terms of the License Agreement and shall be prohibited except to the extent
expressly permitted by the terms of the License Agreement.
The information contained in this document is subject to change without notice. The software described in this document is supplied
under license and may be used or copied only in accordance with the terms of such license.
The information contained in this document is the exclusive property of General Electric Company except as otherwise indicated, and
shall not be disclosed or reproduced in whole or in part without prior written consent from General Electric Company.

Power Analysis Tool - Evaluation
Confidential 3 of 23
Contents
1. INTRODUCTION ............................................................................................................................................................... 5
1.1 Purpose .......................................................................................................................................................................................................5
1.2 Scope ............................................................................................................................................................................................................5
1.3 Structure .....................................................................................................................................................................................................5
2. EVALUATED POWER ANALYSIS TOOLS................................................................................................................. 6
2.1 CYMDIST ......................................................................................................................................................................................................6
2.2 Software X...........................................................................................................................................................................................6
2.3 Software Y ..................................................................................................................................................................................................7
3. PHASE 1 - QUESTIONNAIRE ....................................................................................................................................... 8
3.1 Evaluation Criteria .................................................................................................................................................................................8
3.1.1 Load Profiles ...................................................................................................................................................................................... 8
3.1.2 Embedded Generation................................................................................................................................................................. 8
3.1.3 Batch Mode ........................................................................................................................................................................................ 8
3.1.4 Data Input........................................................................................................................................................................................... 9
3.1.5 Data Output ....................................................................................................................................................................................... 9
3.1.6 Performance......................................................................................................................................................................................9
3.1.7 GIS Linkages ...................................................................................................................................................................................... 9
3.1.8 Commercial Issues......................................................................................................................................................................... 9
3.2 Responses...............................................................................................................................................................................................10
3.3 Evaluation Process .............................................................................................................................................................................10
3.3.1 Weighting......................................................................................................................................................................................... 10
3.3.2 Scoring............................................................................................................................................................................................... 10
3.3.3 Total Score....................................................................................................................................................................................... 10
3.3.4 Validation ......................................................................................................................................................................................... 10
3.4 Phase 1 - General Observations .................................................................................................................................................11
3.4.1 Vendor Engagement .................................................................................................................................................................. 11
3.4.2 Voice of the Customer............................................................................................................................................................... 11
3.5 Phase 1 Conclusions..........................................................................................................................................................................11
3.5.1 CYMDIST............................................................................................................................................................................................ 11
3.5.2 Software X................................................................................................................................................................................. 11
3.5.3 Software Y........................................................................................................................................................................................ 12
3.6 Phase 1 Evaluation Results ............................................................................................................................................................13
4. PHASE TWO - DEMONSTRATION.......................................................................................................................... 14
4.1 Demonstration Objectives..............................................................................................................................................................14
4.2 Evaluation Criteria ..............................................................................................................................................................................14
4.2.1 Import of a circuit from an external file format........................................................................................................... 14
4.2.2 Import of a 48 value load profile for supply points.................................................................................................... 14

Power Analysis Tool - Evaluation
Confidential 4 of 23
4.2.3 Import of a 48 value generation profile for an embedded generation location........................................ 14
4.2.4 Demonstrate power analysis performance................................................................................................................... 14
4.2.5 Demonstrate reporting of overloaded equipment, to an external file format ............................................ 14
4.2.6 Demonstrate an external way of driving all the above activities ...................................................................... 14
4.3 CYMDIST Phase 2 Evaluation Results .......................................................................................................................................15
4.3.1 Demonstration Narrative......................................................................................................................................................... 15
4.3.2 Demonstration Summary........................................................................................................................................................ 16
4.3.3 Additional Observations........................................................................................................................................................... 17
4.4 Software X Phase 2 Evaluation Results ............................................................................................................................17
4.4.1 Demonstration Narrative......................................................................................................................................................... 17
4.4.2 Demonstration Summary........................................................................................................................................................ 18
4.4.3 Additional Observations........................................................................................................................................................... 18
4.5 Phase 2 General Observations.....................................................................................................................................................19
4.5.1 Vendor Engagement .................................................................................................................................................................. 19
4.5.2 Product & Industry Knowledge............................................................................................................................................. 19
4.5.3 PAT User Interfaces – Visualisation / Network Editing ............................................................................................. 19
4.6 Phase 2 Conclusion............................................................................................................................................................................19
5. PHASE THREE – PRACTICAL TEST ......................................................................................................................... 21
5.1 Evaluation Criteria ..............................................................................................................................................................................21
5.1.1 CIM Data Exchange Format ................................................................................................................................................... 21
5.2 Evaluation Results ..............................................................................................................................................................................21
5.2.1 CYMDIST............................................................................................................................................................................................ 21
5.2.2 Software X................................................................................................................................................................................. 22
5.3 Phase 3 - General Observations .................................................................................................................................................22
5.3.1 Vendor Engagement .................................................................................................................................................................. 22
5.3.2 Other ASCII Data Exchange Formats ................................................................................................................................ 22
5.4 Phase 3 Conclusions..........................................................................................................................................................................22
6. EVALUATION CONCLUSION.................................................................................................................................... 23
Power Analysis Tool - Evaluation
Confidential 5 of 23
1. Introduction
1.1 Purpose
This Power Analysis Tool evaluation document is one of the deliverables of Work Package2 of the Low
Carbon Network Fund First Tier Project with the Ofgem designation SSET1005 - LV Network Modelling and
Analysis Environment (for more details see reference document #1).
1.2 Scope
This document describes the evaluation of power analysis tools for the First Tier Low Carbon Network Fund
Project SSET1005 - LV Network Modelling and Analysis Environment.
SSE are working with GE Energy to create a Network Modelling Environment (NME) which integrates a
Geographical Information System (GIS) with a Power Analysis Tool (PAT) to identify network reinforcement
requirements around the emergence of a move towards a low carbon economy.
Three PAT vendors were selected for participation in the evaluation through discussion between SSE and
GE Energy at the project inception stage. The companies and their respective products are listed below.
Company Product
CYME CYMDIST
Vendor X Software X
Vendor Y Software Y
1.3 Structure
The evaluation process requires each of the equipment vendors to successfully demonstrate their products
suitability to meet the requirements of the SSE vision of the NME.
The evaluation was carried out in three distinct phases as detailed below and described fully within the
main body of this document:
Phase 1 – Questionnaire
Phase 2 – Demonstration
Phase 3 – Practical Test
Power Analysis Tool - Evaluation
Confidential 6 of 23
2. Evaluated Power Analysis Tools
CYMDIST, Software X and Software Y were selected for evaluation as three of the most well established
products in the European market for electrical network analysis software. GE has previous experience of
working with both CYME and Vendor X and has considerable in house knowledge of both suppliers’ products.
Vendor Y’s Software Y product was included at the request of SSE as the package is already in limited use
within SSE. Each of the three products was considered to be likely to be able to meet SSE’s operational
requirements for LV network analysis, and to offer a high probability of being successfully combined with
Smallworld Electric Office to provide an integrated Network Modelling Environment.
2.1 CYMDIST
CYME International is a Canadian software company and is part of the Cooper Power Systems group. Its
CYMDIST package is one of a suite of applications aimed specifically at distribution systems planning and
analysis. The packages comprise of a number of different modules which together offer the following
features and capabilities:
• Power flow and voltage drop analysis.
• Fault flow analysis.
• Optimal capacitor placement and sizing.
• Load balancing and load allocation/estimation.
• Harmonic analysis.
• Switching optimisation.
• Network planning.
• Distributed generation modelling.
• Reliability analysis.
• Contingency analysis.
• Analysis of balanced or unbalanced networks built with any combination of phases or
configurations.
2.2 Software X
Vendor X Gmbh is a German consulting and software company providing engineering services in the field of
electrical power systems for generation, transmission and distribution. As with CYMDIST, Vendor X’s
Software X product includes a number of different modules offering the following functionality:
• Power flow analysis.
• Contingency analysis.
• Fault analysis.
• Time domain simulation and small signal analysis.
• Harmonic analysis.
• Reliability analysis.
• Capacitor, switch, and cable reinforcement optimisation.
• Voltage drop and cable loading analysis.

Power Analysis Tool - Evaluation
Confidential 7 of 23
• Load balancing and analysis.
2.3 Software Y
Vendor Y is a UK company which originally evolved from the publically-owned UK Electricity Council’s
Research and Development Centre. Its Software Y product is the only one of the three power analysis tools
under consideration which is currently in use in SSE, although it is believed to be used by only one engineer.
Vendor Y provided only very limited information on the functionality of the product as detailed below:
• Full facilities for LV network design.
• Support for embedded generation.
• Support for demand side management
• Intuitive user interface which can be used with little training.
Power Analysis Tool - Evaluation
Confidential 88 of 23
3. Phase 1 - Questionnaire
This phase of the evaluation was based on exploring each equipment vendors’ ability to meet the general
project requirements by answering a number of foundation questions relating to the specific objectives of
the project.
Phase 1 of the evaluation was based on the vendors’ responses to a series of technical and commercial
requirements as detailed in the following sections:
3.1 Evaluation Criteria
The evaluation questions asked of the suppliers are listed in the following sections.
3.1.1 Load Profiles
Project Requirement:Effective modelling of current and future load profiles is a key requirement of the project in order to be able to identify sections of network which may be subject to excessive load. It is expected that load profile data from the University of Reading for the TVV area will be provided as an array of 48 half hour values, so it is essential that the product can handle data in this format. In addition the Power Analysis Tool must be able to handle many different load profiles associated with different classes of domestic and commercialenergy consumer on a single circuit.
LP1 - Describe the product's capabilities for analysis using load profiles in it power analysis.
LP2 - Could a profile of 48 values for a 24 hour period be handled?
LP3 - How would multiple load profiles on the same circuit be handled?
3.1.2 Embedded Generation
Project Requirement:
A key requirement of the project is to be able to model extra demand placed on the LV network by a range of embedded generation technologies, including solar, wind, heat pumps and micro combined heat and power. For accurate LV modelling it is essential that the Power Analysis Tool can model generation profiles from embedded generation devices as well as load profiles for energy consumers, and that load and generation profiles can be modelled simultaneously on the same circuit.
EG1 - Describe the product's capabilities for analysis using embedded generation:
EG2 - What types of embedded generation can your product analyse?
EG3 - Can you analyse embedded generation profiles?
EG4 - It is possible to do analysis using both embedded generation and load profiles at the same time?
3.1.3 Batch Mode
Project Requirement:
At this stage of the project it was expected that the Geographical Information System (GIS) would be the
main data gathering / network editing / visualisation platform for the Network Modelling Environment
(NME) users. It was therefore a requirement to be able to run the power analysis directly from the GIS rather
than have users undergo the necessity of learning the user-interfaces of more than one software product.
Being able to run the power analysis tool in a non-interactive way was therefore a requirement.
BM1 - Describe the non-interactive ways that your product's analysis functions can be driven.

Power Analysis Tool - Evaluation
Confidential 99 of 23
3.1.4 Data Input
Project Requirement:Using a power analysis tool in conjunction with a GIS meant that data would need to be exchanged between the two systems. Questions were therefore asked around what input formats the power analysis tools could accept and specifically the Common Interface Model (CIM) that is gaining acceptance as a standard within the electricity industry. Even if CIM was not eventually used in this project the answer to this question gives an indication of whether the development of the different power analysis tools is taking into account such advances within the industry.
DI1 - List the data input formats that your product can handle, along with any limitations to any specific formats
DI2 - Please state if your product can accept CIM format inputs. If it can then we would like to know which version of CIM is used and what constraints there are on the CIM profiles your product can use.
3.1.5 Data Output
Project Requirement:We investigated the ability of the PATs to be driven non-interactively. This was done to establish whether
the results could be reported to a file and subsequently imported into the Electric office for visualisation
and reporting purposes. This would provide SSE with the ability to visualise analysis results within the
Electric Office as opposed to the power analysis tool if required
DO1 - Describe the reporting capabilities of your product
DO2 - Can lists of out of tolerance components be generated and exported?
DO3 - Can the reporting be done non-interactively?
3.1.6 Performance
Project Requirement:To get a feel for the performance of the competing products questions were asked around the particular factors that influence how quickly the power analysis could be expected to run. Performance was alsoexamined in Phase 2 of the evaluation process, see Demonstration Objective 2.
P1 - What are the factors that affect the performance of your analysis tool?
P2 - Please indicate whether a typical low voltage circuit analysis involving load profiles and embedded generation takes in the order of seconds or minutes
3.1.7 GIS Linkages
Project Requirement:As the project design envisages the linking of a GIS with the chosen power analysis tool, questions were asked about experiences with linking to GIS products and Smallworld in particular.
G1 - Please indicate any experience you have with using your product in conjunction with GIS software
G2 - Does any of this experience involve the Smallworld GIS product?
3.1.8 Commercial Issues
Project Requirement:A number of questions concerning the Licensing model and more general commercial issues were added to the questionnaire in order to identify any potential commercial showstoppers at this stage, and also the level of likely engagement the project team could expect from each of the equipment vendors.
CI1 - Describe the licencing model and pricing structure for your product
Power Analysis Tool - Evaluation
Confidential 1010 of23
CI2 - Would you be willing to provide a free evaluation licence during the proof of concept (October 2011-June 2012)?
CI3 - What levels of support would be provided for this project?
3.2 Responses
The full questionnaire was issued to each of the potential vendors by email, after initial contact had been
made describing the high-level project scope and aims in order to establish their interest in participating in
the project. Invitations to participate were made by email on Wednesday, 21 September 2011, with
responses being requested by end of business Friday, 14 October.
CYME: The response from CYME concerning the suitability of CYMDIST was received on Wednesday, 12
October 2011. This response is attached to this document as reference.
Vendor X: The response from Vendor X relating to their product, Software X, was not received by the
deadline date. An email was sent to Vendor X on the morning of Monday, 17 October requesting
clarification of their intentions. Vendor X were insistent that they had responded on Friday, 14 October and
did not understand why GE had not received it. Vendor X immediately resent their response. It later
transpired that the original email response somehow got stuck in their mail server and did eventually turn
up on Tuesday, 18 October. This response is attached to this document as reference.
Vendor Y: Vendor Y’s response did not arrive by close of business on Friday, 14 October. The project team
finally received their submission on Friday, 21 October after several email exchanges encouraging them
to respond. This response is attached to this document as reference.
3.3 Evaluation Process
The evaluation results are shown in section 3.6 of this document and are derived as a result of executing
the following process:
3.3.1 Weighting
The principle consultant gave each question a weighting according to the importance of that particular
question in relation to the other questions contained within the questionnaire. An “essential” question was
given a weighting of 10 whilst a question about a non-essential requirement was given a significantly lower
weighting.
3.3.2 Scoring
Each question was then marked out of 10, with a 0 mark representing a totally unsuitable response and a
mark of 10 representing an exact fit to the requirement.
3.3.3 Total Score
The scores were then multiplied by the weightings to establish a total score for a particular question. The
scoring for each of the questions within the evaluation was then totalled to give a final score against each
of the vendors’ responses.
3.3.4 Validation
The principle consultant would mark each of the vendors’ responses against their own weighting and
scoring and enter the results in an evaluation table (actual results detailed in section 2.6). Once this initial
scoring was complete, two further consultants would independently apply their own weightings and
scoring against each of the questions, the objective being to establish whether the relative positions of
each of the vendors’ products would change when marked by 2 further consultants working in isolation.
Should either of these consultants results indicate a change in the position of the three evaluated vendors’
products then the intention would be to further investigate the reasons behind this disparity.

Power Analysis Tool - Evaluation
Confidential 1111 of23
This validation exercise was conducted as stated. All 3 consultants marked the relative positions of the
three products in the same order as described in section 3.5 and detailed in section 3.6.
3.4 Phase 1 - General Observations
3.4.1 Vendor Engagement
It has been very apparent during both the pre-evaluation and throughout the phase 1 evaluation that
CYMDIST’s level of engagement has been significantly higher than both Vendor X and Vendor Y.
They are pro-active in everything they do and when asked to provide specific information are able to do so
expediently.
It must equally be noted that Vendor Y’s level of engagement has been far lower than the level we would
expect from a supplier committed to supporting this project through to completion.
3.4.2 Voice of the Customer
It was documented as an assumption of the project that the necessary SSE subject matter experts would
be made available to GE during the project execution. It was our expectation that these SSE subject matter
experts would act as the empowered voice of the customer driving SSE direction at workshops and through
consultation and active participation in project meetings, document reviews and general project activities.
Unfortunately this has not been the case and the evaluation has therefore been carried out without the
required level of proactive and fully engaged detailed electrical network knowledge. The GE project team,
supported by the SSE project manager have therefore taken the decision to drive forward assuming that
the PATs included in the evaluation all meet the level of power analysis functionality required by SSE and
that this evaluation should focus wholly on the requirements needed to create the integrated NME. Please
note that this assumption was based on the fact that all three PAT’s are well established products in the
European market for electrical network analysis software.
3.5 Phase 1 Conclusions
The outcome of this process shows that CYMDIST consistently came out as the preferred power analysis
tool, followed by Software X with Software Y trailing significantly behind. A brief summary of the
responses is given below, with the full response of each vendor attached at the end of this document.
3.5.1 CYMDIST
• Satisfactory answers provided to all questions fully meeting the project requirements.
• Most thorough answers to questions on load profiles, embedded generation, analysis capabilities
and batch mode requirements.
• Product supports the CIM format, as well as Oracle, MS SQL Server & MS Access.
• Thorough responses received around the GIS interfaces. The product has been used extensively
with Smallworld.
• Demonstrated a willingness to provide in depth support throughout the project.
3.5.2 Software X
• Satisfactory answers to all questions although some responses considerably less detailed than
CYME’s for CYMDIST.
• Good answers to questions on load profiles, embedded generation, analysis capabilities and batch
mode requirements.
• Product supports the CIM format and ODBC database connections.

Power Analysis Tool - Evaluation
Confidential 1212 of23
• Good response on GIS interfaces.
• Willing to provide support for the project.
3.5.3 Software Y
• A number of questions not answered at all.
• Satisfactory answers on load profiles, embedded generation & analysis capabilities.
• Response on batch mode suggested further development may be required.
• No information provided on input formats, other than that the product does not handle the CIM
format.
• Unconvincing responses on interfaces to Smallworld.
• Support for the project would not be provided without further commercial negotiations.
Power Analysis Tool - Evaluation
Confidential 1313 of23
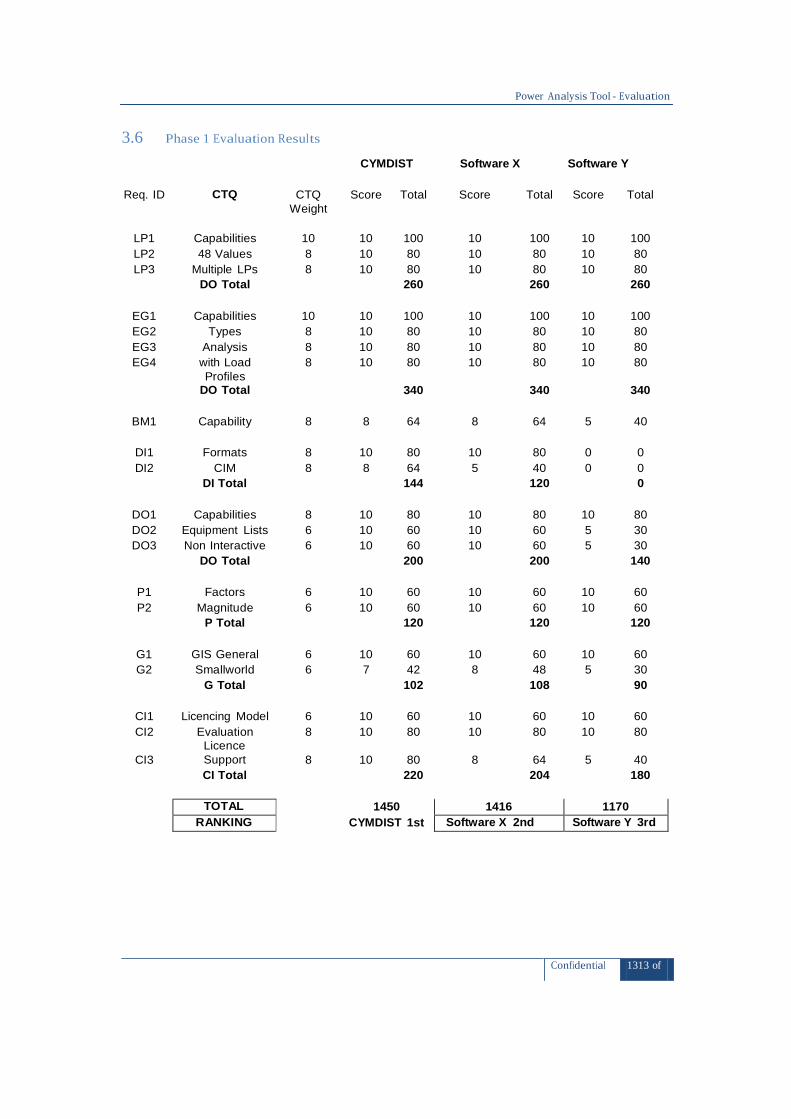
3.6 Phase 1 Evaluation Results
CYMDIST Software X Software Y
Req. ID CTQ CTQ Weight
Score Total Score Total Score Total
LP1 Capabilities 10 10 100 10 100 10 100
LP2 48 Values 8 10 80 10 80 10 80
LP3 Multiple LPs 8 10 80 10 80 10 80
DO Total 260 260 260
EG1 Capabilities 10 10 100 10 100 10 100
EG2 Types 8 10 80 10 80 10 80
EG3 Analysis 8 10 80 10 80 10 80
EG4 with Load Profiles
DO Total
8 10 80
340
10 80
340
10 80
340
BM1 Capability 8 8 64 8 64 5 40
DI1 Formats 8 10 80 10 80 0 0
DI2 CIM 8 8 64 5 40 0 0
DI Total 144 120 0
DO1 Capabilities 8 10 80 10 80 10 80
DO2 Equipment Lists 6 10 60 10 60 5 30
DO3 Non Interactive 6 10 60 10 60 5 30
DO Total 200 200 140
P1 Factors 6 10 60 10 60 10 60
P2 Magnitude 6 10 60 10 60 10 60
P Total 120 120 120
G1 GIS General 6 10 60 10 60 10 60
G2 Smallworld 6 7 42 8 48 5 30
G Total 102 108 90
CI1 Licencing Model 6 10 60 10 60 10 60
CI2
CI3
Evaluation Licence Support
8
8
10
10
80
80
10
8
80
64
10
5
80
40
CI Total 220 204 180
TOTAL 1450 1416 1170
RANKING CYMDIST 1st Software X 2nd Software Y 3rd

Power Analysis Tool - Evaluation
Confidential 1414 of23
4. Phase Two - Demonstration
The second phase of the evaluation invited each vendor to demonstrate their products suitability to meet
the requirements of the project via an on-line demo. All three companies were invited to provide
demonstrations, but despite repeated attempts via both email and telephone, EA Technologies chose not
to respond. EA Technologies were therefore removed from the evaluation at this stage.
4.1 Demonstration Objectives
A list of demonstration objectives were sent to each of the companies as detailed below:
1) Import of a circuit from an external file format.
2) Import of a 48 value load profile for supply points.
3) Import of a 48 value generation profile for an embedded generation location.
4) Demonstrate power analysis performance.
5) Demonstrate reporting of overloaded equipment, to an external file format.
6) Demonstrate an external way of driving all the above activities.
4.2 Evaluation Criteria
4.2.1 Import of a circuit from an external file format
Project requirement:In order for the power analysis to be carried out, the chosen circuit information needs to be transferred
from the GIS to the PAT.
4.2.2 Import of a 48 value load profile for supply points
Project requirement:SSE use 48 values at half-hourly periods to model the changes in consumer load over a 24 hour period. This
therefore requires multiple sets of 48 load values to be stored in the PAT in order to model the different
types of consumers.
4.2.3 Import of a 48 value generation profile for an embedded generation location
Project requirement:As with the Load Profile data mentioned above, SSE want to model embedded generation profiles as 48
values in a 24 hour period. The vendors must demonstrate this functionality.
4.2.4 Demonstrate power analysis performance
Project requirement:The power analysis needs to be carried out within a time period acceptable to the user. It is expected that
this analysis should take seconds rather than minutes in order to carry out an analysis with 48 data values
for a day’s half-hour load profiles for all the consumers on an SSE circuit.
4.2.5 Demonstrate reporting of overloaded equipment, to an external file format
Project requirement:
The aim of the NME is to enable network planners to establish whether the network configuration they are
analysing is sufficient for the expected loads and embedded generation inputs. The identification and
reporting of overloaded equipment is therefore an important requirement.
4.2.6 Demonstrate an external way of driving all the above activities
Project requirement:For the flexibility of the NME the ability to drive all the PAT activities described above in sections 4.2.1 to4.2.5 non-interactively was also explored.
Power Analysis Tool - Evaluation
Confidential 1515 of23
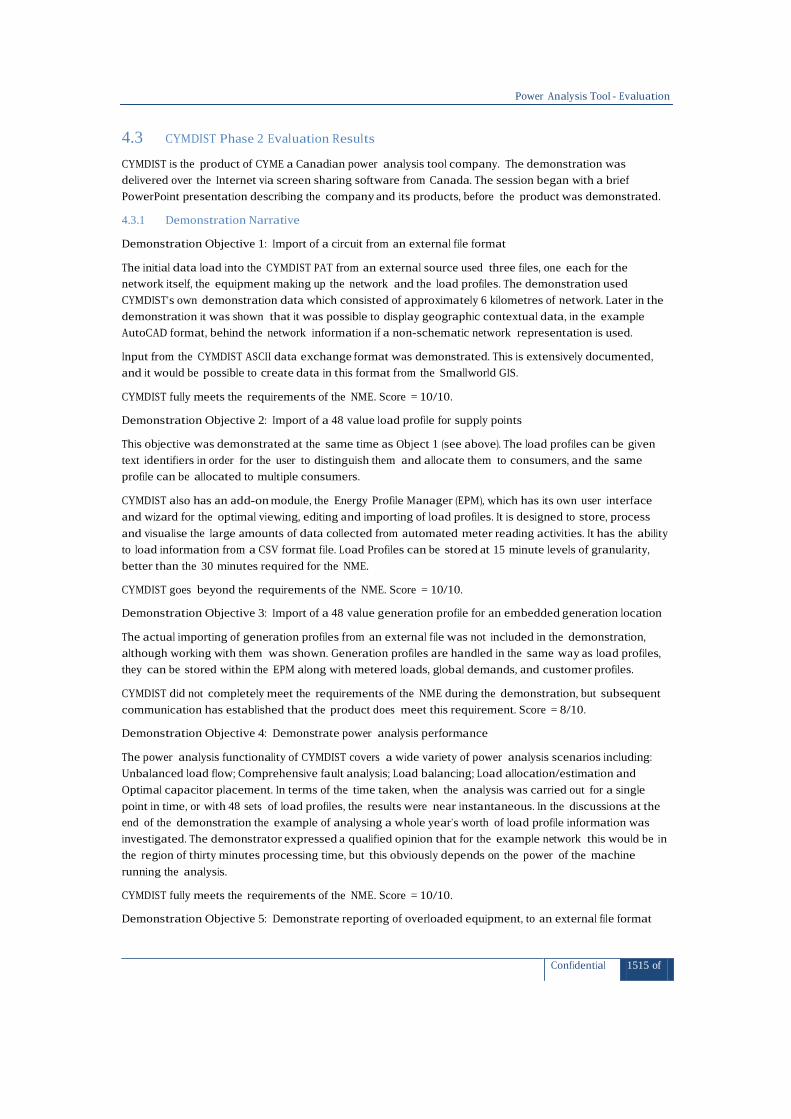
4.3 CYMDIST Phase 2 Evaluation Results
CYMDIST is the product of CYME a Canadian power analysis tool company. The demonstration was
delivered over the Internet via screen sharing software from Canada. The session began with a brief
PowerPoint presentation describing the company and its products, before the product was demonstrated.
4.3.1 Demonstration Narrative
Demonstration Objective 1: Import of a circuit from an external file format
The initial data load into the CYMDIST PAT from an external source used three files, one each for the
network itself, the equipment making up the network and the load profiles. The demonstration used
CYMDIST’s own demonstration data which consisted of approximately 6 kilometres of network. Later in the
demonstration it was shown that it was possible to display geographic contextual data, in the example
AutoCAD format, behind the network information if a non-schematic network representation is used.
Input from the CYMDIST ASCII data exchange format was demonstrated. This is extensively documented,
and it would be possible to create data in this format from the Smallworld GIS.
CYMDIST fully meets the requirements of the NME. Score = 10/10.
Demonstration Objective 2: Import of a 48 value load profile for supply points
This objective was demonstrated at the same time as Object 1 (see above). The load profiles can be given
text identifiers in order for the user to distinguish them and allocate them to consumers, and the same
profile can be allocated to multiple consumers.
CYMDIST also has an add-on module, the Energy Profile Manager (EPM), which has its own user interface
and wizard for the optimal viewing, editing and importing of load profiles. It is designed to store, process
and visualise the large amounts of data collected from automated meter reading activities. It has the ability
to load information from a CSV format file. Load Profiles can be stored at 15 minute levels of granularity,
better than the 30 minutes required for the NME.
CYMDIST goes beyond the requirements of the NME. Score = 10/10.
Demonstration Objective 3: Import of a 48 value generation profile for an embedded generation location
The actual importing of generation profiles from an external file was not included in the demonstration,
although working with them was shown. Generation profiles are handled in the same way as load profiles,
they can be stored within the EPM along with metered loads, global demands, and customer profiles.
CYMDIST did not completely meet the requirements of the NME during the demonstration, but subsequent
communication has established that the product does meet this requirement. Score = 8/10.
Demonstration Objective 4: Demonstrate power analysis performance
The power analysis functionality of CYMDIST covers a wide variety of power analysis scenarios including:
Unbalanced load flow; Comprehensive fault analysis; Load balancing; Load allocation/estimation and
Optimal capacitor placement. In terms of the time taken, when the analysis was carried out for a single
point in time, or with 48 sets of load profiles, the results were near instantaneous. In the discussions at the
end of the demonstration the example of analysing a whole year’s worth of load profile information was
investigated. The demonstrator expressed a qualified opinion that for the example network this would be in
the region of thirty minutes processing time, but this obviously depends on the power of the machine
running the analysis.
CYMDIST fully meets the requirements of the NME. Score = 10/10.
Demonstration Objective 5: Demonstrate reporting of overloaded equipment, to an external file format

Power Analysis Tool - Evaluation
Confidential 1616 of23
Once an analysis has been run there is a wide variety of analysis values that can be reported on. This can
be displayed to both screen and exported to a file, and can also be used as the basis for the thematic
display of the network. Reports can be created by choosing which analysis values the user wishes to see.
CYMDIST goes beyond the requirements of the NME. Score = 10/10.
Demonstration Objective 6: Demonstrate an external way of driving all the above activities
CYMDIST can be driven by an external program using the COM (Component Object Model) module add-on.
This allows the power analysis tool to be used as an engine, i.e. all the commands required to carry out the
power analysis can be put into a file that can be executed non-interactively without the NME user needing
to be exposed to the PAT user interface. The Smallworld GIS has native support for applications to invoke
functionality exposed via COM.
CYMDIST fully meets the requirements of the NME. Score = 10/10.
4.3.2 Demonstration Summary
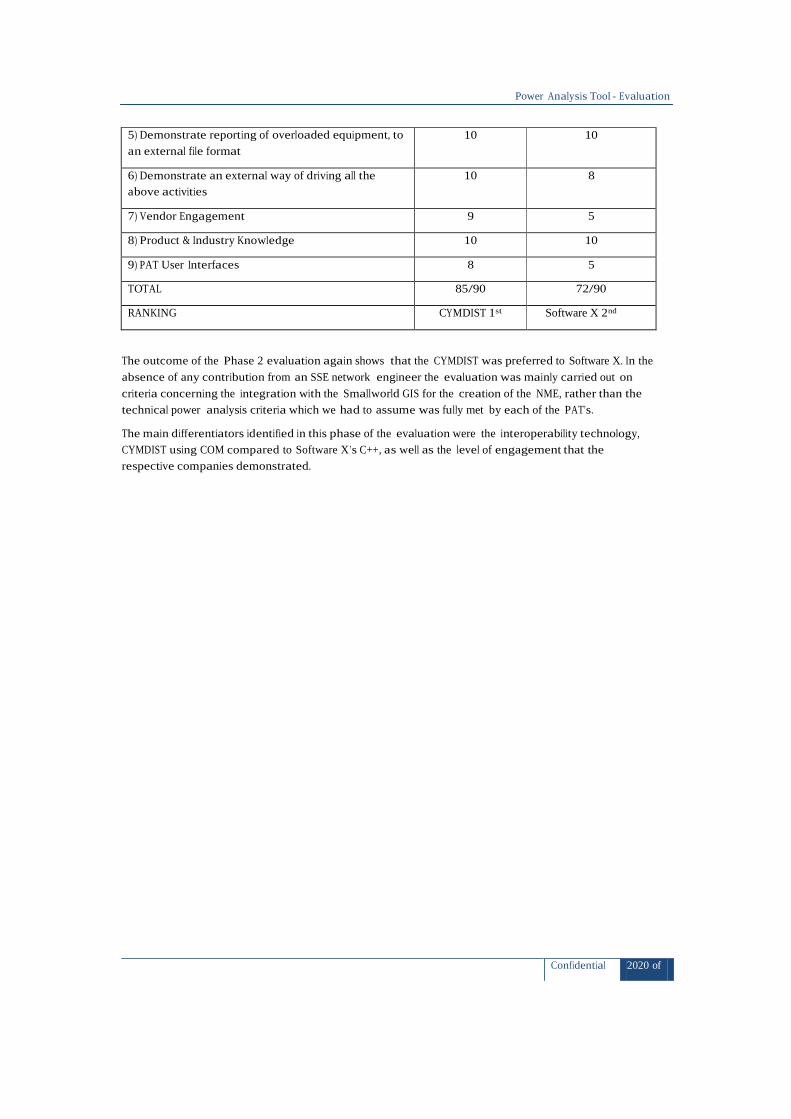
The Table below brings together GE’s evaluation results against each of the Demonstration Objectives
previously detailed:
Demonstration Objective Observation Score (10-Good 0-Bad)
1) Import of a circuit from an
external file format
ACSII format network import observed. 10
2) Import of a 48 value load
profile for supply points
ACSII format load profile import observed. 10
3) Import of a 48 value
generation profile for an
embedded generation location
Not demonstrated, but follow-up
established that it can be done.
8
4) Demonstrate power analysis
performance
Load Flow Analysis was demonstrated and
other analysis types discussed.
10
5) Demonstrate reporting of
overloaded equipment, to an
external file format
Screen and file based reporting was
demonstrated. Thematic visualisation of
results on the network was also shown.10
6) Demonstrate an external way
of driving all the above activities
The running of CYMDIST as an engine via a
script run by another software package
was demonstrated.
10
In summary CYMDIST fully meets, or goes beyond, the requirements of the NME project.
Two of the three aspects of import functionality required for the project were satisfactorily demonstrated
by the CYMDIST tool. The only gap in the presentation, the non-demonstration of the import of a generation
profile was followed-up by telephone and email. Through extensive discussions we are satisfied that
CYMDIST has this functionality and as such this does not present an issue.
Multiple load flow algorithms are available within CYMDIST for different types of analysis. This provides for
reporting on overloaded and underloaded equipment which can then be exported to a file.
The external control of CYMDIST is achieved via the COM add-on module, which provides for automating all
the required functionality. From a Smallworld perspective, external COM objects manifest themselves
within Smallworld as native classes.

Power Analysis Tool - Evaluation
Confidential 1717 of23
4.3.3 Additional Observations
Beyond the established requirements both the visualisation functionality and network editing functionality
demonstrated went beyond the project team’s expectations. The GIS had originally been envisaged as the
network editing and results visualisation platform within the NME, but the functionality within CYMDIST
established that these aspects of the project allowed the project team the flexibility to view the results
within the PAT if required. The exact visualisation solution will be fully defined with SSE at a later date.
4.4 Software X Phase 2 Evaluation Results
Power Factory is the product of Vendor X, a German power analysis tool company. The demonstration was
delivered over the Internet via screen sharing software from Germany. The session began with a brief
PowerPoint presentation explaining the product and particularly its database structure before the power
analysis tool was demonstrated.
4.4.1 Demonstration Narrative
Demonstration Objective 1: Import of a circuit from an external file format
The importing of data from an external file was demonstrated using Vendor X’s own DGS ASCII format. The
demonstration data was initially shown with a schematic representation of an electrical network, with a
geographic representation used later.
Software X fully meets the requirements of the NME. Score = 10/10.
Demonstration Objective 2: Import of a 48 value load profile for supply points
The actual importing of load profiles from an external file was not included in the demonstration, although
working with load profiles was shown, it was done via pasting data in from a spread sheet.
Software X did not completely meet the requirements of the NME during the demonstration, but
subsequent communication has established that the product does meet this requirement. Score = 8/10.
Demonstration Objective 3: Import of a 48 value generation profile for an embedded generation location
The actual importing of generation profiles from an external file was not included in the demonstration,
although working with them was shown, and they are handled in a very similar way to load profiles.
Software X did not completely meet the requirements of the NME during the demonstration, but
subsequent communication has established that the product does meet this requirement. Score = 8/10.
Demonstration Objective 4: Demonstrate power analysis performance
A load flow analysis was demonstrated. The network thematically displayed any overloading and
underloading based on default tolerances that can be set by the user. Without any load profile information
analyses are done with peak load values assigned to the network equipment. To carry out analysis for a 24
hour period with load profiles the use of a pre-defined script was needed which required the user to
manually enter the start and stop times for the analysis.
Software X meets the requirements of the NME. Score = 8/10.
Demonstration Objective 5: Demonstrate reporting of overloaded equipment, to an external file format
Reporting can be created in a variety of ways. Initially the demonstration showed on screen reporting via
pre-defined reports, but any report produced on screen can be directed to a file if required. Exception
reporting was demonstrated, in this example just those pieces of equipment on the network that fell
outside of their defined tolerances were listed.
Software X goes beyond the requirements of the NME. Score = 10/10.
Demonstration Objective 6: Demonstrate an external way of driving all the above activities

Power Analysis Tool - Evaluation
Confidential 1818 of23
The engine mode of Vendor X was demonstrated via “API mode” using an executable with a DGS import
file specified as the network data source and an output filename specified as the results. The executable
was created from C++ code. The Smallworld GIS has the ability to run such external programmes with its
Alien Co-Processor functionality.
Software X meets the requirements of the NME. Score = 8/10.
4.4.2 Demonstration Summary
The Table below brings together GE’s evaluation results against each of the Demonstration Objectives
previously detailed:
Demonstration Objective Observation Score (10-Good 0-Bad)
1) Import of a circuit from an
external file format
ACSII format network import
observed.
10
2) Import of a 48 value load
profile for supply points
Not demonstrated, but follow-up
established that it can be done.
8
3) Import of a 48 value
generation profile for an
embedded generation location
Not demonstrated, but follow-up
established that it can be done.
8
4) Demonstrate power analysis
performance
Load Flow Analysis was
demonstrated.
8
5) Demonstrate reporting of
overloaded equipment, to an
external file format
Screen and file based reporting
was demonstrated. Thematic
visualisation of results on the
network was also shown.
10
6) Demonstrate an external way
of driving all the above activities
The running of CYMDIST as an
engine via a DOS script run was
demonstrated.
8
In summary Software X fully meets the requirements of the NME project.
Although just one of the three aspects of import functionality required for the project was satisfactorily
demonstrated by the Software X tool, it was later established that the two gaps in the demonstration, the
importing of load and generation profiles from an eternal file, are possible with the software.
Like CYMDIST multiple types of load flow analysis are available, although the user interface appears more
complex than that for the equivalent functionality within CYMDIST, with more menus and options available
on each menu.
External control of Software X is via a C++ executable rather than the COM linking used by CYMDIST. A
bespoke programme would need to be written in C++, which is beyond the skillset of the current project
team.
4.4.3 Additional Observations
Software X like CYMDIST included more visualisation and network editing functionality than had originally
been expected in the PATs, offering similar levels of functionality in these areas. CYMDIST stores the
different network configurations in different study files, whilst Software X stores what it calls “variations”
in its database. The Software X application allows the user to have large areas of network

Power Analysis Tool - Evaluation
Confidential 1919 of23
visible on screen which are not included in the analysis; in CYMDIST only the network currently being
analysed is displayed.
It is our opinion that the simpler network editing functionality available in CYMDIST is preferred to similar
functionality available in Software X.
4.5 Phase 2 General Observations
4.5.1 Vendor Engagement
Our suspicions concerning the level of commercial engagement raised during the Phase 1 evaluations were
confirmed during the second phase evaluation when Software Y failed to provide a demonstration of their
product to the project team. As a result of this lack of engagement the team felt we had no choice but to
remove Software Y from the process.
Again, through this phase CYME showed a significantly higher level of engagement than Vendor X
proactively providing additional information and responding to queries without the need for follow up
communications.
4.5.2 Product & Industry Knowledge
The two demonstrators from CYMDIST and Vendor X knew their products and the electricity power
analysis domain well. They each coped well with any questions that were put to them. If an SSE network
engineer had been available to participate in the demonstrations and ask more searching technical
questions then a differential between the two companies may have been observed.
4.5.3 PAT User Interfaces – Visualisation / Network Editing
It was originally thought that the user would only interact with the NME via the Smallworld Electric Office
GIS, with the PAT being run non-interactively in the background in an engine mode. The demonstrations of
both the PATs showed us that these tools have the capacity for thematic visualisation, and also the
capability for network editing. It had been expected that both these activities would be carried out within
the GIS part of the NME, but it is possible to do them in the PAT without the need for any customisation. This
has led to the possibility that the focus of user interaction within the NME could be the GIS or the PAT. The
preferred visualisation platform will be defined during the Detailed Design phase in full consultation with
SSE.
Overall the User Interface of CYMDIST is less complicated than that of Software X. The Data Management
menu of Software X was frequently used appearing in a separate window over the top of the network.
CYMDIST makes use of an embedded panel on the left of the screen to reduce window overlay issues,
although pop-up windows are not completely eliminated. CYMDIST pop-up menus tended to be smaller and
less cluttered than those in Software X.
4.6 Phase 2 Conclusion
The Table below brings together GE’s evaluation results against each of the Demonstration Objectives for
both CYMDIST and Software X.
Demonstration Objective CYMDIST Software X
1) Import of a circuit from an external file format 10 10
2) Import of a 48 value load profile for supply points 10 8
3) Import of a 48 value generation profile for an
embedded generation location
8 8
4) Demonstrate power analysis performance 10 8
Power Analysis Tool - Evaluation
Confidential 2020 of23
5) Demonstrate reporting of overloaded equipment, to
an external file format
10 10
6) Demonstrate an external way of driving all the
above activities
10 8
7) Vendor Engagement 9 5
8) Product & Industry Knowledge 10 10
9) PAT User Interfaces 8 5
TOTAL 85/90 72/90
RANKING CYMDIST 1st Software X 2nd
The outcome of the Phase 2 evaluation again shows that the CYMDIST was preferred to Software X. In the
absence of any contribution from an SSE network engineer the evaluation was mainly carried out on
criteria concerning the integration with the Smallworld GIS for the creation of the NME, rather than the
technical power analysis criteria which we had to assume was fully met by each of the PAT’s.
The main differentiators identified in this phase of the evaluation were the interoperability technology,
CYMDIST using COM compared to Software X’s C++, as well as the level of engagement that the
respective companies demonstrated.
Power Analysis Tool - Evaluation
Confidential 2121 of23
5. Phase Three – Practical Test
The integration of the GIS and the PAT is the requirement of the NME with the most risk attached. It was
therefore decided that that the final stage of the evaluation process would concentrate on the data
exchange aspect of the project, and would attempt to use SSE’s own data.
5.1 Evaluation Criteria
5.1.1 CIM Data Exchange Format
The Common Information Model (CIM) is a specialised data exchange format for the electricity industry that
has been designed through the auspices of the International Electrotechnical Commission (IEC). It forms
part of the IEC 61970 standard for energy management systems. The CIM format for use in distribution
activities is still developing and so is the standard, but GE is developing a CIM exporter for its Smallworld
Electric Office product, and this is expected to be out of the box functionality in the next version of the
product (4.3) that is due for release in June 2012. Vendors of other software products in this domain are
also adding import and export functionality using CIM to their products.
The CIM is becoming a de facto data exchange format within the electricity industry. It was therefore
decided to investigate the CIM capabilities of the PATs under consideration as the ability to transfer
between the GIS and the PAT using a standard format rather than a bespoke one would facilitate the
further integration of the NME with other software expected in the Tier 2 project.
Both the power analysis vendors responded to the original phase 1 questionnaire by saying they either had
a CIM importer or were developing one. The objective of this phase was therefore to establish whether
network data could be transferred between Smallworld Electric Office and the PAT using a CIM format file,
allowing for the fact that the Smallworld CIM software was only available in a ‘pre-release’ state, and that
at this stage of the project SSE’s network data had only been partially migrated into Electric Office and was
missing certain important elements, most notably the internals of link boxes and substations.
5.2 Evaluation Results
5.2.1 CYMDIST
CYME already have a CIM loader for CYMDIST. A pre-release version of the CIM exporter currently in
development for Smallworld Electric Office was used with an early test migration of data from SSE’s
existing GIS to produce a set of CIM files for a single circuit. An attempt was made to import this into
CYMDIST and some success was achieved with the equipment information being read. However, the
geographic portion of the CIM format was not correctly loaded and the cable segments were left
disconnected. This meant that it was not possible to perform any LV analysis on the network, so overall the
test was only a partial success.
The failure may be the result of the Smallworld CIM exporter software being unfinished, the example data
lacking in internal structure, issues with the CYMDIST CIM loader, or a combination of all three. It would
have been an unexpected bonus if the exchange of data via the CIM format had completely worked at this
stage. However, subsequent discussions with CYME suggested that their CIM software has been
successfully used by several customers, and given that there is a significant proportion of the development
phase of the project set aside for this integration, the project team is confident that it will be possible to
successfully exchange data between Smallworld Electric Office and CYMDIST using the CIM format.
CYMDIST partly meets the requirements of the NME. Score = 4/10

Power Analysis Tool - Evaluation
Confidential 2222 of23
5.2.2 Software X
Vendor X had responded that they had a CIM importer under development but when pressed were
somewhat reticent about their CIM handling capabilities. They referred us to a project where they said that
they were already working with GE and a customer on CIM, but were unable to provide any contact names.
Our own internal enquires could not identify anybody within GE working on such a project.
Software X did not demonstrate any part of the CIM requirement of the NME. Score = 0/10.
5.3 Phase 3 - General Observations
5.3.1 Vendor Engagement
CYME were very helpful in taking the CIM format produced and attempting to load it into CYMDIST and
returning the results to us to view in a trial version of their product.
Vendor X were less than helpful with this stage of the evaluation.
5.3.2 Other ASCII Data Exchange Formats
It had originally been envisaged that the third phase of the evaluation would be carried out by creating test
data from SSE’s own network extracted into a generic ASCII format, e.g. AutoCAD’s DXF, and loading this
into each of the power analysis tools. This would have then allowed a demonstration of the power analysis
tools on part of the SSE network. Although both products do have the facility to import DXF format this is
not used for the creation of their connected network data, only for background geographical data that
gives the network context. Each product does have its own ASCII data exchange format for connected
network data. However, it was beyond the scope of the evaluation process to write exporters from the GIS
for each of these formats. It was therefore not possible to test the loading of SSE’s own data in such a
format.
5.4 Phase 3 Conclusions
The CIM format is the preferred data exchange format for the project as it will provide for greater flexibility
of integration of the NME in the Tier 2 project. The CYMDIST product has demonstrated the ability to
partially load SSE network data via the CIM format. Software X could not demonstrate this.
Demonstration Objective CYMDIST Software X
1) Import of a circuit in CIM format 4 0
RANKING CYMDIST 1st Software X 2nd

Power Analysis Tool - Evaluation
Confidential 11 of 23
6. Evaluation Conclusion
The outcome of the evaluation process is that the CYMDIST product supplied by CYME International is
the power analysis tool recommended by GE for the LCNF project.
As shown in the summary table below it scored highest out of the three PATs in each of the three phases
of the evaluation process.
Evaluation Phase
CYMDIST Software X Software Y Phase
leading PAT
1 – Questionnaire 1450 1416 1170 CYMDIST
2 – Demonstration 85 72 NA CYMDIST
3 – Practical Test 4 0 NA CYMDIST
FINAL RANKING 1 2 3 CYMDIST
Phase 1 - Questionnaire: CYME provided the most thorough response to the questionnaire,
providing satisfactory answers to all the evaluation questions.
Phase 2 – Demonstration: CYME provided the best product demonstration, in which the CYMDIST
application was shown to meet or exceed all the pre-defined project requirements.
Phase 3 – Practical Test: CYME were the only supplier to demonstrate any of the data
exchange functionality specified in the practical test.
The key factors in differentiating CYMDIST from Software X, its closest rival in the evaluation process, are
as follows:
• The application has a simpler and more intuitive user interface, which should reduce
the training/learning overhead for SSE network engineers.
• It offers interoperability via COM (as opposed to C++) , which will facilitate integration with
Smallworld Electric Office
• The product handles the CIM data exchange format. This is becoming the industry standard
format for electricity network data, is the preferred format for data exchange with
Smallworld Electric Office, and will make the NME a more flexible platform for the
integration with other systems envisaged for the Tier 2 LCNF project.
• CYME International have demonstrated a consistently high level of engagement throughout
the evaluation process, giving confidence of the supplier’s continued support in tackling any
issues that may arise during the project and providing a timely resolution.
CYME
SSEPD LCNF Tier 1 Close Down Report
SSET1005 Low Voltage Network Modelling and Analysis Environment
© Southern Electric Power Distribution 2013
Appendix V
Power Analysis Tool Vendor Responses
CYME InternationalT&D
www.cyme.com
SSEPD LCNF Tier 1 Close Down Report
SSET1005 Low Voltage Network Modelling and Analysis Environment
GE Energy UK – Power AnalysisTool
Response from CYME InternationalT&D
CYMDISTSoftware

CYME InternationalT&D
www.cyme.com
SSEPD LCNF Tier 1 Close Down Report
SSET1005 Low Voltage Network Modelling and Analysis Environment
CYMDIST - Distribution System Analysis
CYMDIST performs several types of analysis on balanced or unbalanced three-phase,
two-phase and single-phase systems that are operated in radial, looped or meshed
configurations. CYMDIST includes a full network editor, as well as:
Unbalanced load flow
Comprehensive fault analysis
Load balancing
Load allocation/estimation
Optimal capacitor placement
The CYME workspace is fully customizable. The graphical representation of
network components, results and reports can be built and modified to supply the level of
detail needed. Innovative engineering technologies, industry practices and standards
are at the core of the CYME algorithms, flexible user interface and extensive libraries.
The CYMDIST Distribution Analysis software is a suite of applications composed of a
network editor, analysis modules and user-customizable model libraries from which you
can choose to get the most powerful solution. The program is designed for planning
studies and simulating the behavior of electrical distribution networks under different
operating conditions and scenarios. It includes several built-in functions that are
required for distribution network planning, operation and analysis. The analysis
functions such as load flow, short-circuit, and network optimizations, are performed on
balanced or unbalanced distribution network that are built with any combination of
phases and configurations.

CYME InternationalT&D
www.cyme.com
SSEPD LCNF Tier 1 Close Down Report
SSET1005 Low Voltage Network Modelling and Analysis Environment
Load Profiles
Describe the product's capabilities for analysis using load profiles in itpower analysis
With the integration of automated meter reading (AMR) telemetry in distribution
systems, short-term load forecast calibrated by AMR telemetry data and energy
billing records, new tools are necessary to help the distribution utilities exploit this
data. The Energy Profile Manager module is the CYME optional planning tool that
assists users in performing accurate time range analysis based on AMR data and
combination of historical consumption patterns and real-time monitoring.
The Energy Profile Manager module comes with its own user interface and wizard
for the optimal viewing, editing and importing of load profiles and metering demands
from various types of data sources.
The Energy Profile Manager includes a Load Flow with Profiles analysis functionality that
utilizes the data organized with the module. When running a voltage drop simulation for a
specified period, it produces significant information for the system planners
about the network conditions. Using the Load Flow with Profiles analysis, the user
can generate several reports and charts based on monitored device and summary
networks results.1
Could a profile of 48 values for a 24 hour period behandled?
Yes.
How would multiple load profiles on the same circuit behandled?
Combinations of metered and non-metered profiles as well as load, generator, meter,
customer and demand profiles are supported.
1Addtionnal information is provided in the Energy Profile Manager brochure.

CYME InternationalT&D
www.cyme.com
SSEPD LCNF Tier 1 Close Down Report
SSET1005 Low Voltage Network Modelling and Analysis Environment
Embedded Generation (aka Distributed Generation)
Describe the product's capabilities for analysis using embeddedgeneration
From the traditional diesel generators to the new low-carbon energy producers such as
photovoltaic and wind turbines, distributed energy resources have changed tremendously
the landscape of power utilities. The need to manage the interconnection appropriately,
to understand the resulting technical issues and to prepare the network to meet the
challenge of tomorrow can be satisfied with the use of CYME Power System Analysis
software.
With its robust analytical and modeling capabilities, CYME is a powerful tool to help
engineers study and understand the different issues coming from small-scale embedded
generation and large distributed generation sources.2
What types of embedded generation can your productanalyze?
CYMDIST can analyze the following type of
generators: Photovoltaic
Wind Energy Conversion System
Micro-Turbine
Solid Oxide Fuel Cell Induction
Generator Electronically-
Coupled Generator
Synchronous Generators
Can you analyze embedded generationprofiles?
Yes.
It is possible to do analysis using both embedded generation and load profiles
at the same time?
Yes.
2Addtionnal information is provided in the CYME Distributed Generation brochure.

CYME InternationalT&D
www.cyme.com
SSEPD LCNF Tier 1 Close Down Report
SSET1005 Low Voltage Network Modelling and Analysis Environment
Batch Mode
Describe the non-interactive ways that your product's analysis functionscan be driven.
CYMDIST COM consist of a comprehensive collection of Power Engineering Analysis
simulation components that can be easily and transparently launched within your
preferred DMS, CAD, GIS, OMS, EMS, NMS or SCADA programs, as if they were an
integral part of your own solution.
CYMDIST COM is built on top of the information technologies most recognized standard:
the Component Object Model or COM. The COM-based components can be accessed
by any computer program written in C, C++, Java, J++, Delphi or Visual Basic.
Additionally the CYMDIST Server can be deployed either as a client/server solution,
as Web- based tools on your intranet, as an application service provider (ASP) or as
Web services, since they provide support for browser standard HTML and XML formats.
Data Input
List the data input formats that your product can handle, along with any limitations
to any specific formats
The CYMDIST import formats
are: CYMDIST ASCII
file
CIM
Multispeak 1.1, 2.2 and3
The data is imported into a database. CYMDIST supports the following 3 database
formats: Microsoft Access
Microsoft SQL Server: 2000, 2005, 2008
Oracle: 9, 10 and11

CYME InternationalT&D
www.cyme.com
SSEPD LCNF Tier 1 Close Down Report
SSET1005 Low Voltage Network Modelling and Analysis Environment
Please state if you product can accept CIM format inputs, and if it can whichversion of CIM you use and what constraints there are on the CIM profiles yourproduct can use.
CYMDIST does support CIM format inputs. If a new CIM version is available, anupdate to the
CYMDIST software can be made to support the new CIMformat.

CYME InternationalT&D
www.cyme.com
SSEPD LCNF Tier 1 Close Down Report
SSET1005 Low Voltage Network Modelling and Analysis Environment
Data Output
Describe the reporting capabilities of yourproduct
CYMDIST reporting facilities allow to fully define the analyses results into web reports.
CYMDIST includes a variety of report templates for all types of analyses. You can
combine any reports, and create new ones, utilize any CYMDIST variable and created
your own mathematical expressions using any of those variables, which further extends
the reporting possible with CYMDIST. Available report formats are:
CYME embedded reports
Microsoft Excel
spreadsheet XML format
HTML format
Microsoft Access database
Can lists of out of tolerance components be generated andexported?
The data validation engine validates all networks, equipment, and range of data
currently loaded in memory, to ensure all data are with-in operating limits. A list
of all errors and warnings is generated and can be exported to Microsoft Excel for
editing and archiving.
Can the reporting be done non-interactively?
Yes reports can be generated using the CYMDIST-COMinterface.
Performance
What are the factors that affect the performance of youranalysis tool?
Number of circuits/feeders loaded in memory
Type of analysis run
Computer memory and CPU
Please indicate whether a typical low voltage circuit analysis involving load
profiles and embedded generation takes in the order of seconds or minutes
In the order of seconds for a fewfeeders/substations.
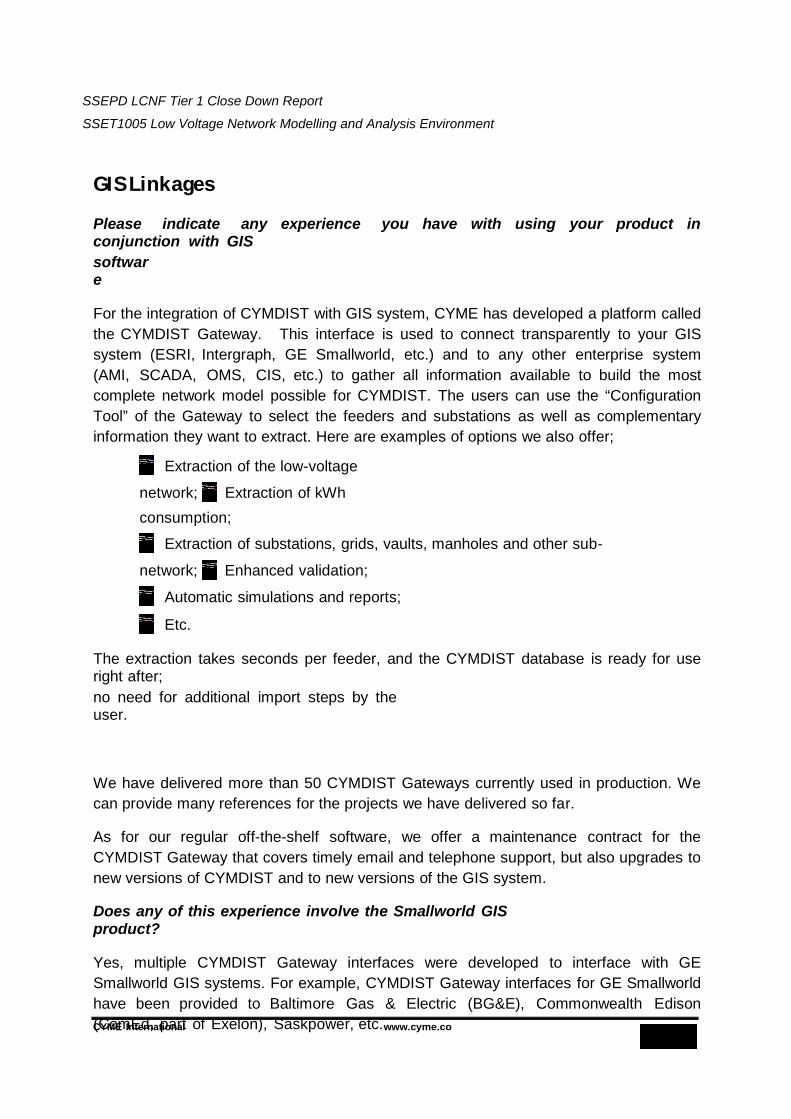
CYME InternationalT&D
www.cyme.com
SSEPD LCNF Tier 1 Close Down Report
SSET1005 Low Voltage Network Modelling and Analysis Environment
GIS Linkages
Please indicate any experience you have with using your product inconjunction with GIS
software
For the integration of CYMDIST with GIS system, CYME has developed a platform called
the CYMDIST Gateway. This interface is used to connect transparently to your GIS
system (ESRI, Intergraph, GE Smallworld, etc.) and to any other enterprise system
(AMI, SCADA, OMS, CIS, etc.) to gather all information available to build the most
complete network model possible for CYMDIST. The users can use the “Configuration
Tool” of the Gateway to select the feeders and substations as well as complementary
information they want to extract. Here are examples of options we also offer;
Extraction of the low-voltage
network; Extraction of kWh
consumption;
Extraction of substations, grids, vaults, manholes and other sub-
network; Enhanced validation;
Automatic simulations and reports;
Etc.
The extraction takes seconds per feeder, and the CYMDIST database is ready for useright after;
no need for additional import steps by theuser.
We have delivered more than 50 CYMDIST Gateways currently used in production. We
can provide many references for the projects we have delivered so far.
As for our regular off-the-shelf software, we offer a maintenance contract for the
CYMDIST Gateway that covers timely email and telephone support, but also upgrades to
new versions of CYMDIST and to new versions of the GIS system.
Does any of this experience involve the Smallworld GISproduct?
Yes, multiple CYMDIST Gateway interfaces were developed to interface with GE
Smallworld GIS systems. For example, CYMDIST Gateway interfaces for GE Smallworld
have been provided to Baltimore Gas & Electric (BG&E), Commonwealth Edison
(ComEd, part of Exelon), Saskpower, etc.

CYME InternationalT&D
www.cyme.com
SSEPD LCNF Tier 1 Close Down Report
SSET1005 Low Voltage Network Modelling and Analysis Environment

CYME InternationalT&D
www.cyme.com
SSEPD LCNF Tier 1 Close Down Report
SSET1005 Low Voltage Network Modelling and Analysis Environment
Commercial Issues
Describe the licensing model and pricing structure foryour product
Software licensing is available as stand-alone and network floating licenses. The price
structure for multiple licenses is as follows:
1st license = full price
2nd and 3rd license = 25% discount
4th and 5th = 50% discount
6th and over = 75% discount
Would you be willing to provide a free evaluation license during the proof ofconcept (October
2011-June2012)?
Yes we can provide a free evaluation license during the proof of conceptperiod.
What levels of support would be provided for thisproject?
Depending on the level of customization required, we could be involved in the design,
development and deployment phases. For developing a CYMDIST Gateway
interface, we normally assign a Project Manager and the project process go through the
following phases, all involving CYME experts; Design, Development, Factory Acceptance
Test (FAT), Installation/Deployment, Site Acceptance Test (SAT), and then warranty and
maintenance. We would propose the same approach for the development of the
CYMDIST Gateway interface, and could propose a similar process for the entire project
is custom development is required for the CYMDIST tool.
CYME InternationalT&D
www.cyme.com
Vendor X Response to LCNF Power Analysis Tool Questionnaire from GE Digital Energy
CYME InternationalT&D
www.cyme.com
Table of Contents
1 Introduction ...................................................................................................................................... 4!
2 Response to Questionnaire ............................................................................................................... 5!
2.1 Load Profiles............................................................................................................................................. 5!
2.1.1 Static Analysis Methods ........................................................................................................................ 5!2.1.2 Dynamic Analysis Methods ................................................................................................................... 5!
2.2 Embedded Generation / Distributed Generation .......................................................................................... 6!
2.3 Batch Mode .............................................................................................................................................. 6!
2.4 Data Input ............................................................................................................................................... 6!
2.5 Data Output ............................................................................................................................................. 6!
2.6 Performance............................................................................................................................................. 7!
2.7 GIS Linkage.............................................................................................................................................. 7!
2.8 Commercial Issues.................................................................................................................................... 7!

CYME InternationalT&D
www.cyme.com
1 Introduction
Smallworld UK Services / GE Energy – Infrastructure, UK has invited Vendor X to provide a response to the
Questionnaire “LV Network Modelling Power System Analysis Tool – Low Carbon Network Fund First Tier
Project”.
Background of the questionnaire in reference is the engagement of GE Digital Energy by a UK DNO to provide a
Proof of Concept demonstrating a Low Carbon Low Voltage Modelling Environment for a defined area of network
in the South of England.
The solution proposed by Smallworld UK Services comprises the following three areas:
! Low Carbon Data Modelling, Recording and Reporting
! Management of Multiple Low Carbon Network Scenarios
! Power Analysis of Low Carbon LV Networks
Vendor X’s response to the questionnaire is making reference to Vendor X’s standard power system analysis
software product Software X which is already widely in use in UK and Ireland, namely NG, UK Power Networks,
ScottishPower, NEDL, ESB, etc.
The requirements indicated in the questionnaire are already covered to a very high extend by the actual release
of the Software X software. However, Vendor X is open to implement certain extension according to specific
project requirements.
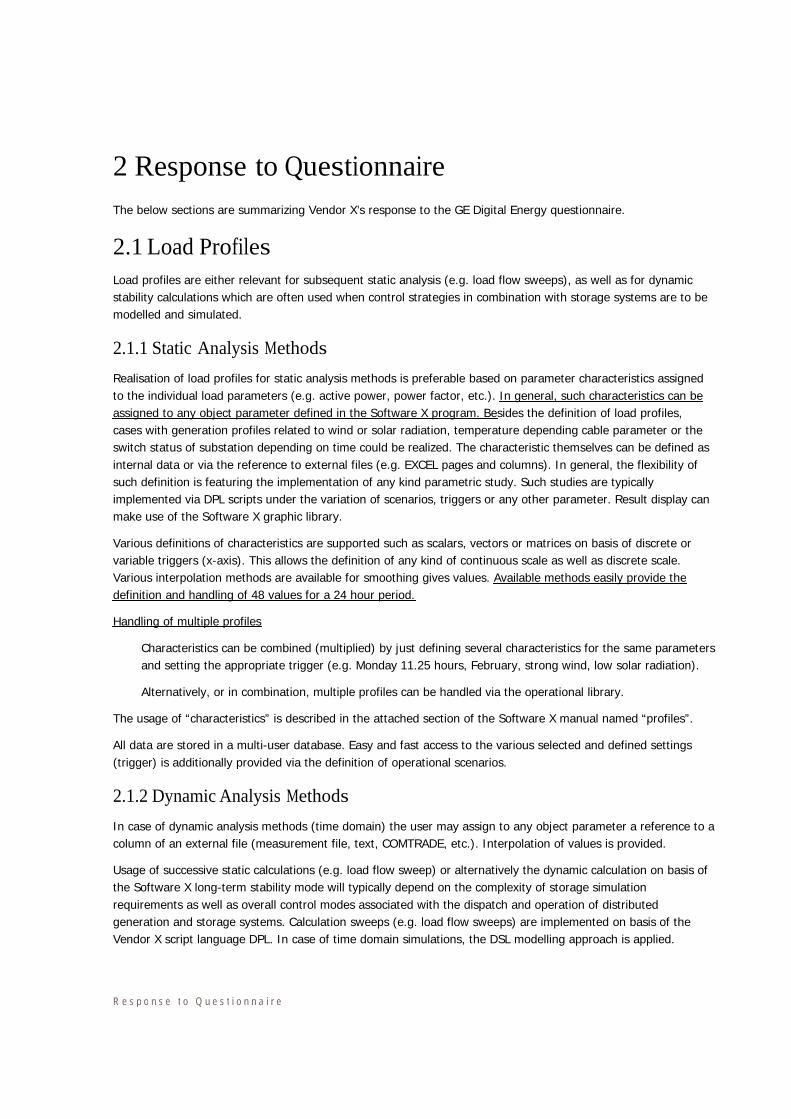
R e s p o n s e t o Q u e s t i o n n a i r e
2 Response to Questionnaire
The below sections are summarizing Vendor X’s response to the GE Digital Energy questionnaire.
2.1 Load ProfilesLoad profiles are either relevant for subsequent static analysis (e.g. load flow sweeps), as well as for dynamic
stability calculations which are often used when control strategies in combination with storage systems are to be
modelled and simulated.
2.1.1 Static Analysis Methods
Realisation of load profiles for static analysis methods is preferable based on parameter characteristics assigned
to the individual load parameters (e.g. active power, power factor, etc.). In general, such characteristics can be
assigned to any object parameter defined in the Software X program. Besides the definition of load profiles,
cases with generation profiles related to wind or solar radiation, temperature depending cable parameter or the
switch status of substation depending on time could be realized. The characteristic themselves can be defined as
internal data or via the reference to external files (e.g. EXCEL pages and columns). In general, the flexibility of
such definition is featuring the implementation of any kind parametric study. Such studies are typically
implemented via DPL scripts under the variation of scenarios, triggers or any other parameter. Result display can
make use of the Software X graphic library.
Various definitions of characteristics are supported such as scalars, vectors or matrices on basis of discrete or
variable triggers (x-axis). This allows the definition of any kind of continuous scale as well as discrete scale.
Various interpolation methods are available for smoothing gives values. Available methods easily provide the
definition and handling of 48 values for a 24 hour period.
Handling of multiple profiles
Characteristics can be combined (multiplied) by just defining several characteristics for the same parameters
and setting the appropriate trigger (e.g. Monday 11.25 hours, February, strong wind, low solar radiation).
Alternatively, or in combination, multiple profiles can be handled via the operational library.
The usage of “characteristics” is described in the attached section of the Software X manual named “profiles”.
All data are stored in a multi-user database. Easy and fast access to the various selected and defined settings
(trigger) is additionally provided via the definition of operational scenarios.
2.1.2 Dynamic Analysis Methods
In case of dynamic analysis methods (time domain) the user may assign to any object parameter a reference to a
column of an external file (measurement file, text, COMTRADE, etc.). Interpolation of values is provided.
Usage of successive static calculations (e.g. load flow sweep) or alternatively the dynamic calculation on basis of
the Software X long-term stability mode will typically depend on the complexity of storage simulation
requirements as well as overall control modes associated with the dispatch and operation of distributed
generation and storage systems. Calculation sweeps (e.g. load flow sweeps) are implemented on basis of the
Vendor X script language DPL. In case of time domain simulations, the DSL modelling approach is applied.
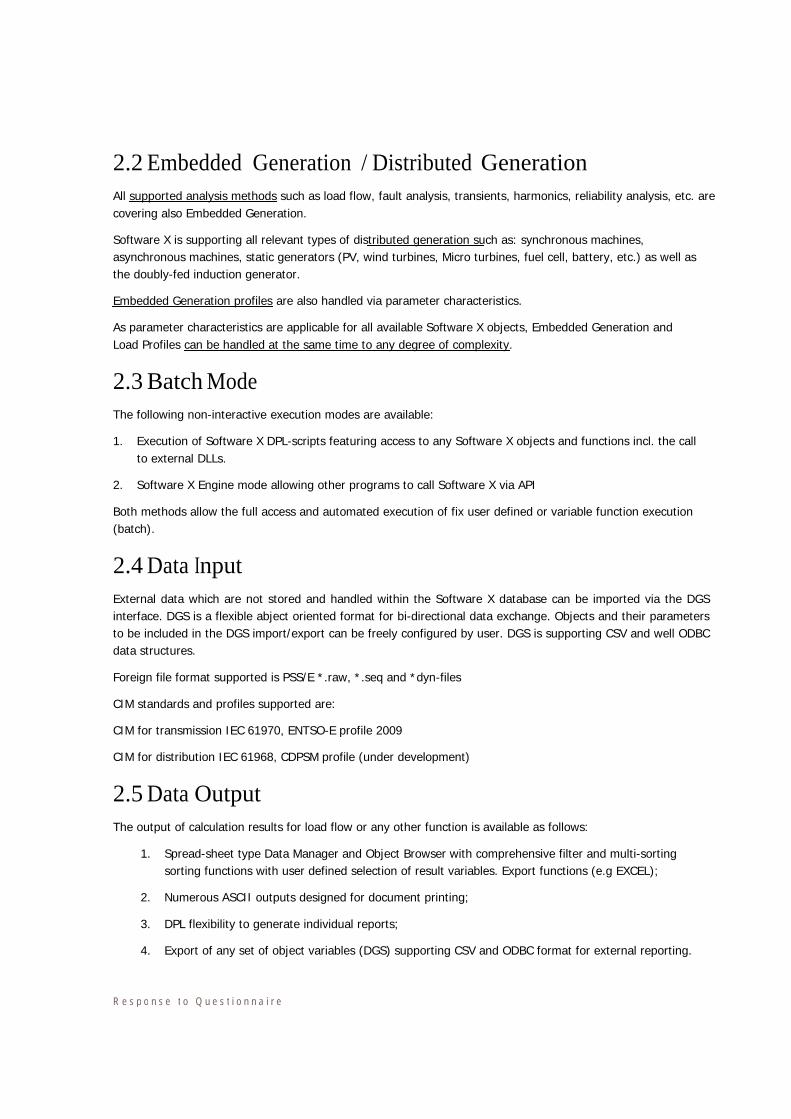
R e s p o n s e t o Q u e s t i o n n a i r e
2.2 Embedded Generation / Distributed GenerationAll supported analysis methods such as load flow, fault analysis, transients, harmonics, reliability analysis, etc. are
covering also Embedded Generation.
Software X is supporting all relevant types of distributed generation such as: synchronous machines,
asynchronous machines, static generators (PV, wind turbines, Micro turbines, fuel cell, battery, etc.) as well as
the doubly-fed induction generator.
Embedded Generation profiles are also handled via parameter characteristics.
As parameter characteristics are applicable for all available Software X objects, Embedded Generation and
Load Profiles can be handled at the same time to any degree of complexity.
2.3 Batch ModeThe following non-interactive execution modes are available:
1. Execution of Software X DPL-scripts featuring access to any Software X objects and functions incl. the call
to external DLLs.
2. Software X Engine mode allowing other programs to call Software X via API
Both methods allow the full access and automated execution of fix user defined or variable function execution
(batch).
2.4 Data InputExternal data which are not stored and handled within the Software X database can be imported via the DGS
interface. DGS is a flexible abject oriented format for bi-directional data exchange. Objects and their parameters
to be included in the DGS import/export can be freely configured by user. DGS is supporting CSV and well ODBC
data structures.
Foreign file format supported is PSS/E *.raw, *.seq and *dyn-files
CIM standards and profiles supported are:
CIM for transmission IEC 61970, ENTSO-E profile 2009
CIM for distribution IEC 61968, CDPSM profile (under development)
2.5 Data OutputThe output of calculation results for load flow or any other function is available as follows:
1. Spread-sheet type Data Manager and Object Browser with comprehensive filter and multi-sorting
sorting functions with user defined selection of result variables. Export functions (e.g EXCEL);
2. Numerous ASCII outputs designed for document printing;
3. DPL flexibility to generate individual reports;
4. Export of any set of object variables (DGS) supporting CSV and ODBC format for external reporting.

R e s p o n s e t o Q u e s t i o n n a i r e
2.6 PerformanceThe performance of the execution functions is determined by the “grid size” (topology nodes) and the complexity
of control functions. Typical execution times of distribution grid power flows of several 100 000 busbars are in the
range of a couple of seconds. Such execution times for a profile type analysis (load flow sweeps) will have to be
multiplied by the number of profiles to be considered. It is expected that for relevant distribution grid areas, the
execution of 48x24 cases will perform within the order of seconds.
2.7 GIS LinkageGIS data export via the DGS interface (non-integrated solution) has been realized for a number of different GIS
systems. As the bi-directional DGS interface is fully transparent to the user, quite a number of GIS interfaces
have been developed by the users themselves. Vendor X has executed projects or has been involved in projects
with SmallWorld, ESRI/ArcGIS, Magnis GIS, COS Vega GIS, SICAD Open, GEOGRAT GIS.
2.8 Commercial IssuesThe Software X installation options and licensing model is explained in detail in chapter 29 and 30 of the
Software X product information (attached to this email). The Software X base package is most probably
covering the initial project needs.
An free evaluation installation can be made available.
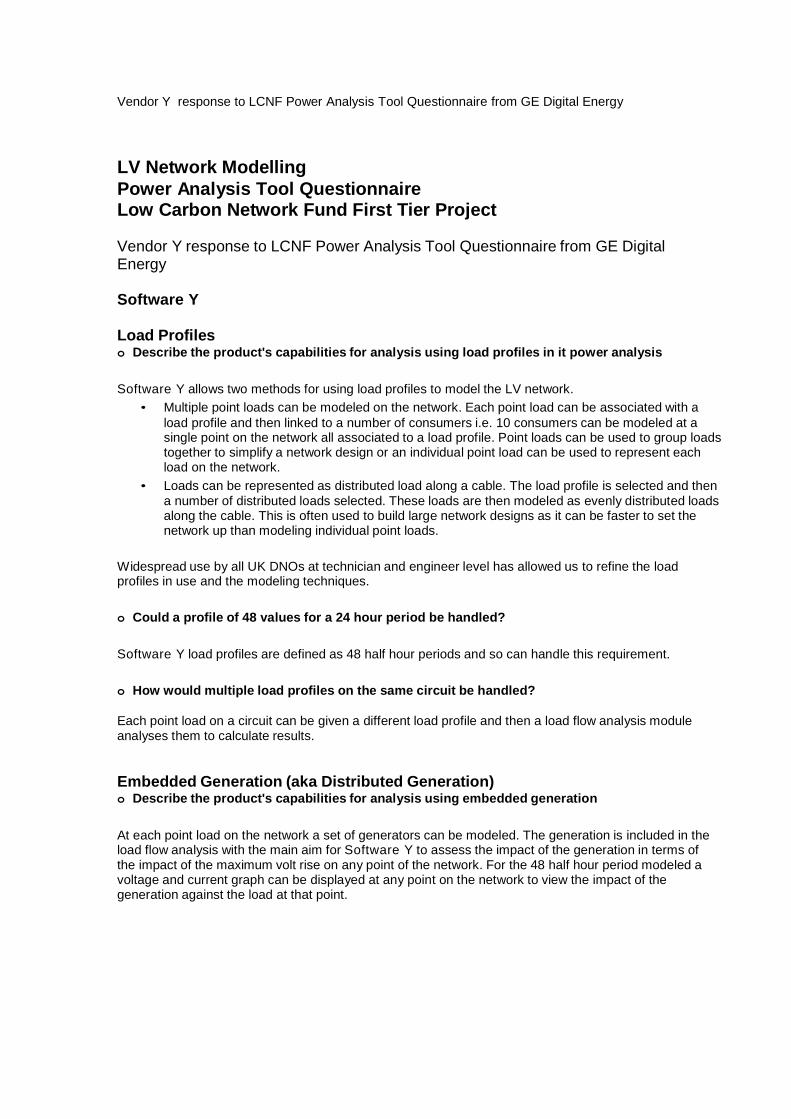
Vendor Y response to LCNF Power Analysis Tool Questionnaire from GE Digital Energy
LV Network ModellingPower Analysis Tool QuestionnaireLow Carbon Network Fund First Tier Project
Vendor Y response to LCNF Power Analysis Tool Questionnaire from GE DigitalEnergy
Software Y
Load Profileso Describe the product's capabilities for analysis using load profiles in it power analysis
Software Y allows two methods for using load profiles to model the LV network.
• Multiple point loads can be modeled on the network. Each point load can be associated with a load profile and then linked to a number of consumers i.e. 10 consumers can be modeled at a single point on the network all associated to a load profile. Point loads can be used to group loads together to simplify a network design or an individual point load can be used to represent each load on the network.
• Loads can be represented as distributed load along a cable. The load profile is selected and then a number of distributed loads selected. These loads are then modeled as evenly distributed loads along the cable. This is often used to build large network designs as it can be faster to set the network up than modeling individual point loads.
Widespread use by all UK DNOs at technician and engineer level has allowed us to refine the load profiles in use and the modeling techniques.
o Could a profile of 48 values for a 24 hour period be handled?
Software Y load profiles are defined as 48 half hour periods and so can handle this requirement.
o How would multiple load profiles on the same circuit be handled?
Each point load on a circuit can be given a different load profile and then a load flow analysis module analyses them to calculate results.
Embedded Generation (aka Distributed Generation)o Describe the product's capabilities for analysis using embedded generation
At each point load on the network a set of generators can be modeled. The generation is included in the load flow analysis with the main aim for Software Y to assess the impact of the generation in terms of the impact of the maximum volt rise on any point of the network. For the 48 half hour period modeled avoltage and current graph can be displayed at any point on the network to view the impact of the generation against the load at that point.
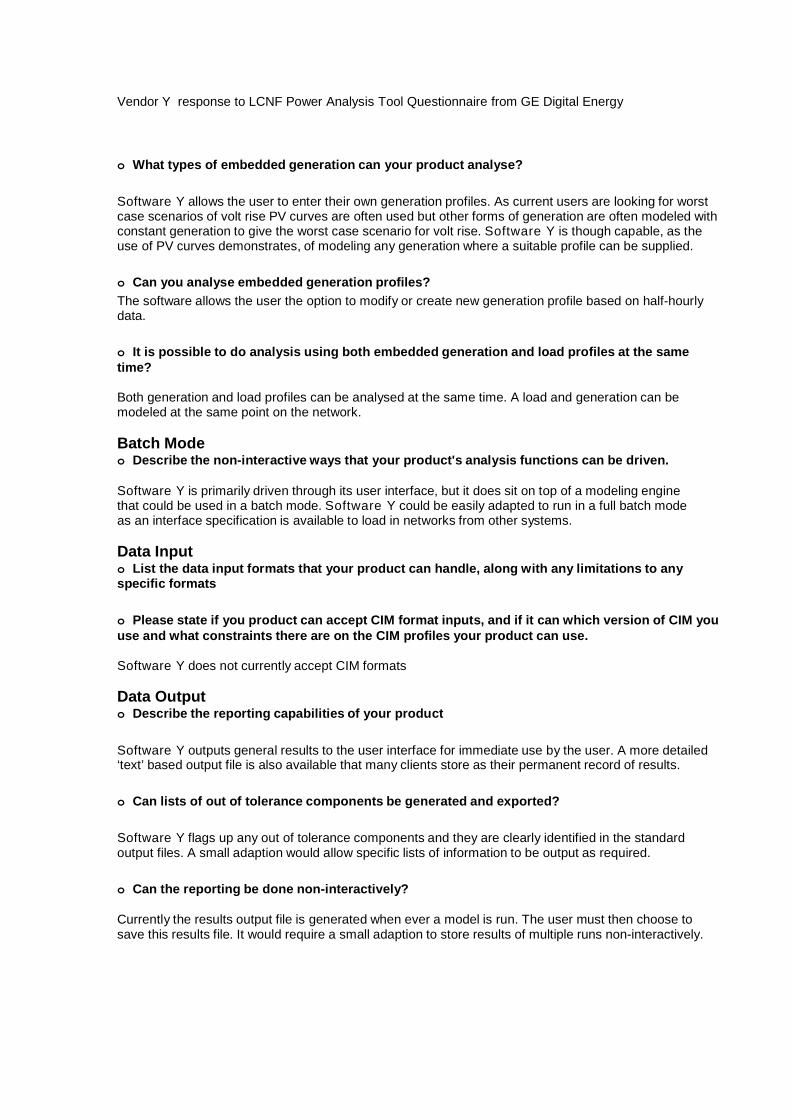
Vendor Y response to LCNF Power Analysis Tool Questionnaire from GE Digital Energy
o What types of embedded generation can your product analyse?
Software Y allows the user to enter their own generation profiles. As current users are looking for worst case scenarios of volt rise PV curves are often used but other forms of generation are often modeled with constant generation to give the worst case scenario for volt rise. Software Y is though capable, as theuse of PV curves demonstrates, of modeling any generation where a suitable profile can be supplied.
o Can you analyse embedded generation profiles?
The software allows the user the option to modify or create new generation profile based on half-hourly data.
o It is possible to do analysis using both embedded generation and load profiles at the same time?
Both generation and load profiles can be analysed at the same time. A load and generation can be modeled at the same point on the network.
Batch Modeo Describe the non-interactive ways that your product's analysis functions can be driven.
Software Y is primarily driven through its user interface, but it does sit on top of a modeling enginethat could be used in a batch mode. Software Y could be easily adapted to run in a full batch modeas an interface specification is available to load in networks from other systems.
Data Inputo List the data input formats that your product can handle, along with any limitations to any specific formats
o Please state if you product can accept CIM format inputs, and if it can which version of CIM you use and what constraints there are on the CIM profiles your product can use.
Software Y does not currently accept CIM formats
Data Outputo Describe the reporting capabilities of your product
Software Y outputs general results to the user interface for immediate use by the user. A more detailed‘text’ based output file is also available that many clients store as their permanent record of results.
o Can lists of out of tolerance components be generated and exported?
Software Y flags up any out of tolerance components and they are clearly identified in the standardoutput files. A small adaption would allow specific lists of information to be output as required.
o Can the reporting be done non-interactively?
Currently the results output file is generated when ever a model is run. The user must then choose to save this results file. It would require a small adaption to store results of multiple runs non-interactively.

Vendor Y response to LCNF Power Analysis Tool Questionnaire from GE Digital Energy
Performanceo What are the factors that affect the performance of your analysis tool?
The number of individual components to model is the main area that affects performance. Thesoftware though is relatively light on resource use and this has not been found to be an issuefor any of our clients.
o Please indicate whether a typical low voltage circuit analysis involving loadprofiles and embedded generation takes in the order of seconds or minutesA typical low voltage circuit analysis will take in the order of seconds.
GIS Linkageso Please indicate any experience you have with using your product in conjunction withGISsoftware
Software Y has an public interface specification that is targeted at allowing networksfrom GIS to be imported into Software Y.
o Does any of this experience involve the Smallworld GIS product?
The Software Y public interface was developed with a company who used Smallworld and so was targeted at this technology. It has since been used to link to further GIS products.
Commercial Issueso Describe the licencing model and pricing structure for your product
Licences are either sold per seat (1 user has an allocated licence) or as a concurrent licence(5 concurrent licences mean that as many users as required can have Software Y but only 5can be actively using it at one time)
Pricing is on a sliding scale dependant on the number of licences purchased.
o Would you be willing to provide a free evaluation licence during the proof of concept(October2011-June 2012)?
A free evaluation copy of Software Y can be supplied for the proof of concept.
o What levels of support would be provided for this project?
If selected for the proof of concept stage then we would need to enter a Commercialnegotiation to understand how we can cover costs for this type of work.
If product development is required then we would expect to enter a further Commercialagreement withGE Digital Energy or GE Digital Energy’s client.


![Requirements Specification [DRAFT] Appendix 3.1 … Requirements Danpilot ver… · Requirements Specification [DRAFT] Appendix 3.1 Maritime Planning and Dispatch System (MPDS) Danpilot](https://img.pdfslide.us/doc/110x75/5ab73a717f8b9a86428e89a7/requirements-specification-draft-appendix-31-requirements-danpilot-verrequirements.jpg)