Embed Size (px)
Citation preview

APPENDIX H TRAFFIC IMPACT STUDY

Carmel Canine Sports Center Transportation Impact Study
Central Coast Transportation Consulting
895 Napa Avenue, Suite A-6
Morro Bay, CA 93442
(805) 316-0101
February 2015
Prepared For: AMEC Earth & Environmental
Central Coast Transportation Consulting January 2015
1Carmel Canine Sports Center Transportation Impact Study
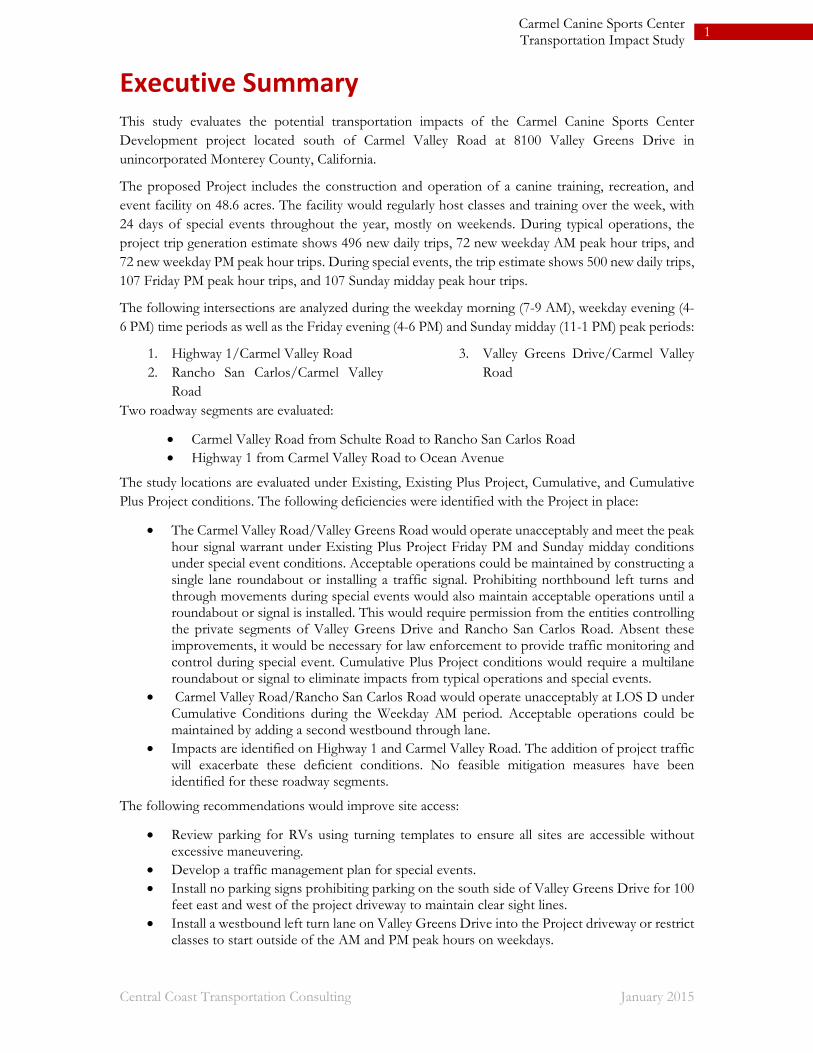
Executive Summary This study evaluates the potential transportation impacts of the Carmel Canine Sports Center Development project located south of Carmel Valley Road at 8100 Valley Greens Drive in unincorporated Monterey County, California.
The proposed Project includes the construction and operation of a canine training, recreation, and event facility on 48.6 acres. The facility would regularly host classes and training over the week, with 24 days of special events throughout the year, mostly on weekends. During typical operations, the project trip generation estimate shows 496 new daily trips, 72 new weekday AM peak hour trips, and 72 new weekday PM peak hour trips. During special events, the trip estimate shows 500 new daily trips, 107 Friday PM peak hour trips, and 107 Sunday midday peak hour trips.
The following intersections are analyzed during the weekday morning (7-9 AM), weekday evening (4-6 PM) time periods as well as the Friday evening (4-6 PM) and Sunday midday (11-1 PM) peak periods:
1. Highway 1/Carmel Valley Road 2. Rancho San Carlos/Carmel Valley
Road
3. Valley Greens Drive/Carmel Valley Road
Two roadway segments are evaluated:
Carmel Valley Road from Schulte Road to Rancho San Carlos Road Highway 1 from Carmel Valley Road to Ocean Avenue
The study locations are evaluated under Existing, Existing Plus Project, Cumulative, and Cumulative Plus Project conditions. The following deficiencies were identified with the Project in place:
The Carmel Valley Road/Valley Greens Road would operate unacceptably and meet the peak hour signal warrant under Existing Plus Project Friday PM and Sunday midday conditions under special event conditions. Acceptable operations could be maintained by constructing a single lane roundabout or installing a traffic signal. Prohibiting northbound left turns and through movements during special events would also maintain acceptable operations until a roundabout or signal is installed. This would require permission from the entities controlling the private segments of Valley Greens Drive and Rancho San Carlos Road. Absent these improvements, it would be necessary for law enforcement to provide traffic monitoring and control during special event. Cumulative Plus Project conditions would require a multilane roundabout or signal to eliminate impacts from typical operations and special events.
Carmel Valley Road/Rancho San Carlos Road would operate unacceptably at LOS D under Cumulative Conditions during the Weekday AM period. Acceptable operations could be maintained by adding a second westbound through lane.
Impacts are identified on Highway 1 and Carmel Valley Road. The addition of project traffic will exacerbate these deficient conditions. No feasible mitigation measures have been identified for these roadway segments.
The following recommendations would improve site access:
Review parking for RVs using turning templates to ensure all sites are accessible without excessive maneuvering.
Develop a traffic management plan for special events. Install no parking signs prohibiting parking on the south side of Valley Greens Drive for 100
feet east and west of the project driveway to maintain clear sight lines. Install a westbound left turn lane on Valley Greens Drive into the Project driveway or restrict
classes to start outside of the AM and PM peak hours on weekdays.

Central Coast Transportation Consulting February 2015
2Carmel Canine Sports Center Transportation Impact Study
Contents Executive Summary .................................................................. 1
Contents ...................................................................................... 2
Introduction ............................................................................... 3
Analysis Methods....................................................................... 6
Existing Conditions ................................................................... 8
Existing Plus Project Conditions .......................................... 11
Cumulative Conditions ........................................................... 18
Alternative Analysis ................................................................. 22
References ................................................................................. 23
Figure 1: Project and Study Locations .............................................................................................................. 4
Figure 2: Project Site Plan ................................................................................................................................... 5
Figure 3: Existing Peak Hour Volumes and Lane Configurations .............................................................10
Figure 4: Project Trip Distribution and Assignment ....................................................................................16
Figure 5: Existing Plus Project Volumes ........................................................................................................17
Figure 6: Cumulative Plus Project Volumes ..................................................................................................21
Appendix A: Traffic Counts
Appendix B: Intersection LOS/Queue Calculation Sheets
Appendix C: Roadway Segment LOS Calculation Sheets

Central Coast Transportation Consulting February 2015
3Carmel Canine Sports Center Transportation Impact Study
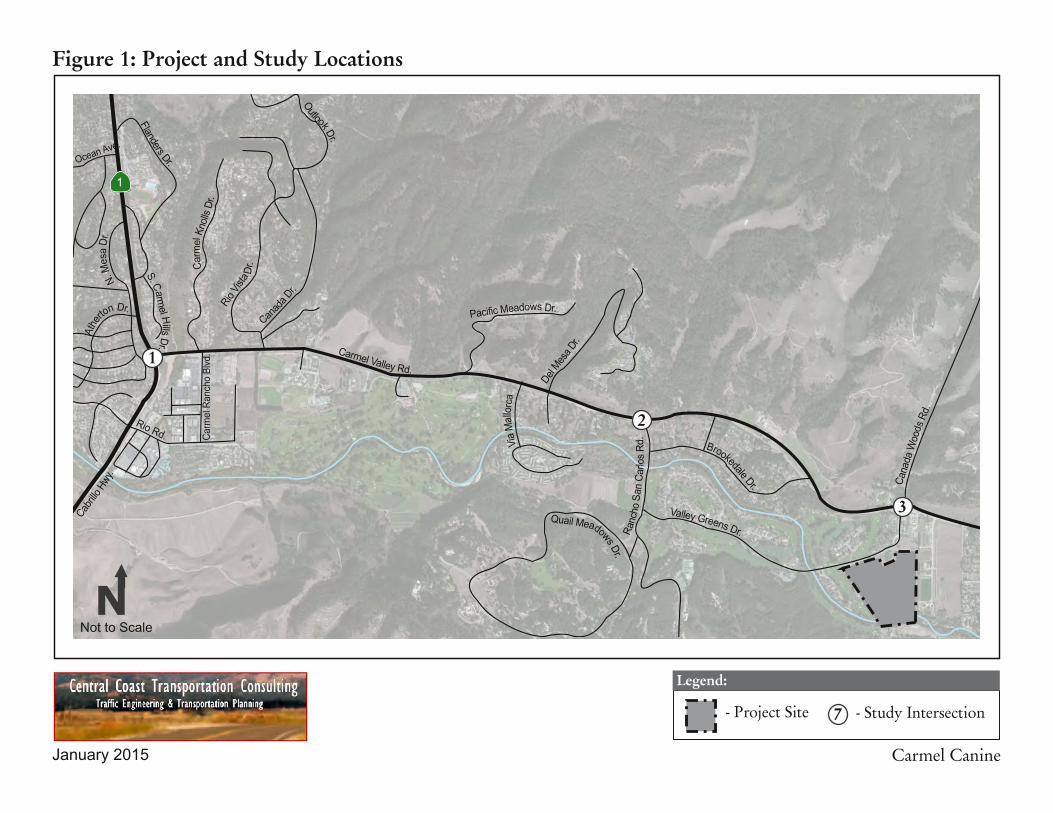
Introduction This study evaluates the potential transportation impacts of the Carmel Canine Sports Center project located in Carmel Valley, an unincorporated area of Monterey County. The proposed Project includes a 48.6 acre canine training, recreation, and special event facility with access provided via Valley Greens Drive from Carmel Valley Road.
The project’s location and study intersections are shown on Figure 1, while Figure 2 shows the Project site plan. The following intersections are analyzed in this study:
1. Highway 1/Carmel Valley Road 2. Rancho San Carlos/Carmel Valley Road 3. Valley Greens Drive/Carmel Valley Road
Two roadway segments are evaluated:
Carmel Valley Road from Schulte Road to Rancho San Carlos Road
Highway 1 from Carmel Valley Road to Ocean Avenue
Typical operations were evaluated during the weekday morning (7-9 AM) and weekday evening (4-6 PM) time periods consistent with the County’s Transportation Impact Study Guidelines. The Friday evening (4-6 PM) and Sunday midday (11-1 PM) peak periods are also evaluated to show conditions during special events. The study locations are evaluated under these scenarios:
1. Existing Conditions reflect 2014 traffic counts and the existing transportation network.
2. Existing Plus Project Conditions add project generated traffic to Existing Conditions volumes. Project traffic reflects typical operations traffic during Weekday AM and PM conditions and special event traffic during Friday PM and Sunday midday conditions.
3. Cumulative Conditions represent future traffic conditions reflective of buildout of land uses in the area.
4. Cumulative Plus Project Conditions add project traffic to Cumulative Conditions volumes. Project traffic reflects typical operations traffic during Weekday AM and PM conditions and special event traffic during Friday PM and Sunday midday conditions.
Carmel Canine
Figure 1: Project and Study Locations
Legend:
7 - Study Intersection- Project Site
1
2
3

CARMELRIVER
NO ACCESS
M
(N) SEPTIC & LEACH FIELD
IRRIGATIONRESERVOIRSEE SHEET 1
OPENEXERCISE
AREA
(E) WALNUTTREE TOREMAIN
MEMBER TRAININGAREA
(E) PEARTREE
(E) PRIVATE DRIVEWAY
(N) AUTOMATIC GATES @ MODIFIED ENTRANCEw/SECURITY LIGHTING
RIVER ACCESS& PICNIC AREA
NO ACCESS
(N) OFFICE TRAILERS
HAY FIELDHERDING/OPEN EXERCISE
HERDING TRAININGARENAS & STOCKMANAGEMENT
(N) TEMP MODULARTRAILER & MEMBERS' AREA
W
EVENT FIELD
RIVER ACCESS& PICNIC AREA
110'Lx110'W x3'HREMOVEABLEFENCED RINGS
(E) SYCAMORE TREE
3
0
'-
0
"
F
R
O
N
T
S
E
T
B
A
C
K
(N) VAN ACCESSIBLE & ACCESSIBLE SPACES
GENERAL PARKING FOR 144 STALLS
(E) WELLS,FENCED & WATERTREATMENT AREA
WIDEN & DEEPEN (E) DRIVEWAY, PAVED
PERMEABLEPATHWAYS,
TYP.
PROPERTY LINE
2
0
'
-
0
"
S
I
D
E
S
E
T
B
A
C
K
100 YEARFLOOD PLAIN
100 YEARFLOOD PLAIN
2
0
'
-
0
"
500 YEARFLOOD PLAIN
4'H BLACK VINYLCHAIN LINK
FENCE, TYP.
2
4
'-
1
0
1
2
"
T
O
⅊
429.58
267.93
336.37
233.43
333.92
242.81
82.96
182.
97
1222.67
266.
98
246
355149.11
204.89
199.
85
201.
14
146.39
720.89
841.42
4
0
'-
0
"
500 YEARFLOOD PLAIN
MEMBER & STAFF PARKING w/LOW LEVELLIGHTING (15 SPACES)
2
0
'-
0
"
3
0
'
-
0
"
3
0
'
-
0
"
6
0
'
-
0
"
1
1
0
'
-
0
"
2
0
'
-
0
"
1
1
0
'
-
0
"
2
0
'
-
0
"
1
1
0
'
-
0
"
178'-0"
DEER FENCE, TYP.
(E)8' DEER FENCE
PUMP HOUSE TO BE DESIGNED & CONSTRUCTED UTILIZINGMONTEREY COUNTY WATER RESOURCES GUIDELINES FOR
CONSTRUCTION WITHIN THE FLOOD PLAIN
IRRIGATION RESERVOIRMATERIALS DISTRIBUTED
FOR LEVELING
IRRIGATION RESERVOIRMATERIALS DISTRIBUTED
FOR LEVELING
IRRIGATION RESERVOIRMATERIALS DISTRIBUTED
FOR LEVELING
ELECT./STORAGEMODULAR RESTROOM TRAILER
(E) NATURALVISUAL SCREENING
(N) WD FENCE& VISUAL SCREENINGEVENT PARKING
FOR 70 RVS
EVENT OVERFLOW PARKING
(N) WD FENCING &VISUAL SCREENING
(N) WD FENCING & VISUAL SCREENING
MEMBER/VISITOR TRAINING AREA
AC PAVING & APPROACH OF VALLEY GREENS DR.
(N) WD FENCING &VISUAL SCREENING
(E) QUAIL GOLFMAINTENANCE YARD
(E) DEER FENCE & HEAVY VEGETATION
2
5
'
-
0
"
RV ACCESS& FIREROAD
TWO LANE RVACCESS ROADWAY3
2
'
-
0
"
TRASH ENCLOSURE
TYP. RVCLEARANCE
(13)
(10)
(3)
(23)
(16)
(20)
(14)
(13)
(13)
(13)
(5)
(25)
25 SPACES
AREA DESIGNATEDFOR VENDORS IF DESIRED/
OTHERWISE OPENTRAINING AREA
(N) AUTOMATIC GATES @ PRIVATE DRIVEWAYw/SECURITY LIGHTING
20'-0"
50'-0"
30'-0"
A1.1
8.13.13
SITE PLAN
1319
MP
THPPARTNERSHIPAUL
The Paul Davis Partnership, LLP286 Eldorado StreetMonterey, CA 93940
(831) 373-2784 FAX (831) 373-7459EMAIL: [email protected]
8100 Valley Greens DriveCarmel, CA 93923
CARMELCANINESPORTSCENTER
USE PERMIT REVISION 6.17.13
USE PERMIT REVISION 8.13.13
SITE PLAN
LEGEND
PERMEABLE PAVING
4' HIGH BLACK VINYL CHAIN LINK FENCE
SCALE: 1" = 80'
NORTH
20' EXISTING NATURALNATIVE VEGETATION
5' HIGH MTL STOCK FENCE
3' HIGH REMOVEABLE EVENT FENCE
6' HIGH WD FENCE
SCALE: 1/2" = 1'-0"
FENCES
10'-0"
WHITE VINYL TEMPORARY FENCE
GALVANIZED MTL STOCK FENCE
BLACK VINYL-COVERED
CHAIN LINK FENCE
1x12 NATURAL FINISH CEDAR/RDWD FENCE
8' HIGH DEER FENCE
GENERAL NOTES:
1. FOR NEIGHBORING USES, REFERENCE "PROXIMITY & ZONING MAP"2. THE 9 PARCELS AND EXISTING EASEMENTS HAVE BEEN LEFT OFF FOR
CLARITY PURPOSES. CCSC'S LEASE REQUIRES THE SITE TO BERETURNED TO ITS CURRENT STATE WHICH WOULD INCLUDEMAINTAINING CURRENT PROPERTY LINES AND EASEMENTS
3. POTABLE WATER SYSTEM IS BEING ENGINEERED BY C3 ENGINEERINGAND WILL BE LOCATED IN THE FENCED AREA AROUND THE (E) WELLS
4. "OWTS" IS BEING ENGINEERED BY ENVIRONMENTAL CONCEPTS.MONTEREY COUNTY ENVIRONMENTAL HEALTH'S REQUIREMENTS AREBEING ADHERED TO
5. PLANS SHOW PARKING & LIGHTING DIAGRAMMATICALLY. ACTUALPARKING & LIGHTING WILL BE SPECIFICALLY DEFINED AS PART OF THEBUILDING PERMIT PROCESS.
Carmel Canine
Figure 2: Project Site Plan

Central Coast Transportation Consulting February 2015
6Carmel Canine Sports Center Transportation Impact Study
Analysis Methods The analysis approach was developed based on the County of Monterey and Caltrans standards.
County of Monterey Facilities
Policy C-1.1 of the 2010 Monterey County General Plan specifies that level of service (LOS) D or better operations shall be maintained unless otherwise specified in a Community Plan. The 2010 Carmel Valley Master Plan (CVMP) specifies that LOS C is the acceptable operating condition for signalized intersections, and LOS D is unacceptable. Unacceptable conditions for unsignalized intersections are defined as LOS F or meeting of any traffic signal warrants.
The 2010 CVMP provides additional thresholds for segments of Carmel Valley Road. These thresholds, shown in Table 1, are based on average daily traffic volumes (ADTs).
The 2010 CVMP notes that ADTs below the thresholds in Table 1 are acceptable.
Caltrans Facilities
Caltrans operates Highway 1. Caltrans strives to maintain operations at the LOS C/D cusp on state-operated facilities, where LOS C is acceptable but LOS D is not. If an existing State Highway facility is operating at LOS D, E, or F the existing service level should be maintained.
Intersection Analysis
The level of service thresholds for intersections based on the 2010 Highway Capacity Manual (HCM) are presented in Table 2.
Segment CVMP ADT Threshold1
1. CVR-Valle Vista to Holman 84872. CVR-Holman to Esquiline 68353. CVR-Esquiline to Ford 90564. CVR-Ford to Laureles Grade 116005. CVR-Laureles Gd to Robinson Cyn 127526. CVR-Robinson Cyn to Schulte 154997. CVR-Schulte to Rancho San Carlos 163408. CVR-Rancho San Carlos to Rio 484879. CVR-Rio to Carmel Rancho Blvd 5140110. CVR-Carmel Rancho to Highway 1 27839Source: Monterey County Department of Public Works, CVMP 2010 General Plan Update.
Table 1: Carmel Valley Road ADT Thresholds
Control Delay (seconds/vehicle) Level of Service Control Delay (seconds/vehicle) Level of Service≤ 10 A ≤ 10 A
> 10 - 20 B > 10 - 15 B> 20 - 35 C > 15 - 25 C> 35 - 55 D > 25 - 35 D> 55 - 80 E > 35 - 50 E
> 80 F > 50 F
Table 2: Intersection Level of Service Thresholds
Signalized Intersections1 Stop Sign Controlled Intersections2
1. Source: Exhibit 18-4 of the 2010 Highway Capacity Manual.2. Source: Exhibits 19-1 and 20-2 of the 2010 Highway Capacity Manual.

Central Coast Transportation Consulting February 2015
7Carmel Canine Sports Center Transportation Impact Study
The study intersections were analyzed with the Synchro software package applying the 2010 HCM methods. Where 2010 HCM methods do not allow analysis of a specific lane or phasing configuration the 2000 HCM methods are applied.
Roadway Segment Analysis
In addition to the thresholds identified in the CVMP and shown in Table 1, the study roadway segments were evaluated using 2010 HCM methods. The study segments consist of a mixture of two-lane segments and multilane segments, which are evaluated using different criteria.
Two-lane segment LOS is determined based on the calculation of percent-time-spent-following (PTSF). The LOS thresholds vary by the two-lane facility class. Three classes of two-lane facilities are defined in the 2010 HCM, each with different LOS thresholds. The two-lane freeway study segment is categorized as a Class II facility consistent with the CVMP traffic study. Multilane segment LOS is determined based on vehicle density in passenger cars per mile per lane. The roadway segment thresholds are presented in Table 3.
The segment of Highway 1 from Carmel Valley Road to Ocean Avenue is evaluated using the two-lane segment methodology for southbound traffic and multilane methodology for northbound traffic.
Thresholds of Significance
Caltrans Facilities: Operations degrade from LOS C or better to LOS D, E, or F; or project traffic is added to an intersection or segment operating at LOS D, E, or F.
Monterey County Signalized intersections:
Cause an intersection operating at LOS A, B, or C to degrade to unacceptable traffic conditions of LOS D, E or F.
Worsen the LOS grade at an intersection already operating at an unacceptable LOS D or E. Add one or more vehicles to the critical movement V/C ratio at intersections already
operating at LOS F.
Monterey County Unsignalized intersections: Intersection operations degrade from LOS E or better to LOS F and a signal warrant is met; or project traffic is added to an intersection operating at LOS F and a signal warrant is met.
Carmel Valley Road roadway segment: Operations degrade from LOS D or better to LOS E or F; or project traffic worsens the LOS of a segment operating at LOS E; or project traffic is added to a segment operating at LOS F; or the CVMP ADT threshold is exceeded.
Density (passenger cars/mile/lane) Level of Service
Percent Time Spent Following (PTSF) Level of Service
≤ 11 A ≤ 40 A> 11 - 18 B > 40 - 55 B> 18 - 26 C > 55 - 70 C> 26 - 35 D > 70 - 85 D> 35 - 45 E > 85 E
> 45 (demand exceeds capacity) F See Note 2. F
Multilane Segments1 Two-lane Highway Segments2
1. Source: Exhibit 14-4 of the 2010 Highway Capacity Manual. Thresholds for free flow speed of 45 mph; other speeds have different LOS E/F thresholds. 2. Source: Exhibit 15-3 of the 2010 Highway Capacity Manual. LOS F is reached when the segment volume exceeds capacity.
Table 3: Roadway Segment Level of Service Thresholds

Central Coast Transportation Consulting February 2015
8Carmel Canine Sports Center Transportation Impact Study
Existing Conditions This section describes the existing transportation system and current operating conditions in the study area.
EXISTING ROADWAY NETWORK
Highway 1 is a north-south facility connecting Los Angeles to Mendocino. From Carmel Valley Road to Ocean Avenue, Highway 1 has two northbound lanes and one southbound lane. The study area’s portion of Highway 1 has varying grades and residential driveway access.
Carmel Valley Road is an east-west major arterial extending from Highway 1 to Arroyo Seco Road. In the study area, Carmel Valley Road varies from two-lanes to four-lanes, with posted speed limits varying from 25 mph to 55 mph. Carmel Valley Road serves both residential and commercial areas.
Valley Greens Drive and Rancho San Carlos Road are two-lane local streets serving residential and light commercial areas along Carmel Valley Road. Their speed limits are 25 mph. Valley Greens Drive is stop controlled where it intersects with Carmel Valley Road. Rancho San Carlos Drive has a signalized intersection with Carmel Valley Road.
EXISTING PEDESTRIAN AND BICYCLE FACILITIES
Pedestrian facilities include sidewalks, crosswalks, multi-use paths, and pedestrian signals at signalized intersections. In the study area, there are no paved sidewalks along Carmel Valley Road, Highway 1, Rancho San Carlos Road, and Valley Greens Drive.
Bicycle facilities in the study area consist of separated bicycle facilities (Class I paths) and on-street striped bike lanes (Class II). There is a Class I bike path that roughly parallels Highway 1 from Canada Court to a point just south of Carmel Valley Road. Class II bike lanes are provided along portions of Carmel Valley Road. While there are no designated bicycle facilities along the other study streets, many have wide paved shoulders used by cyclists.
EXISTING TRANSIT SERVICE
The Monterey-Salinas Transit (MST) provides fixed route transit service to the study area. Routes 22 and 24 serve Carmel Valley Road, terminating in Monterey.
Route 22 serves Highway 1 from Monterey to Big Sur. The nearest stop to the project is located to the South of the Rio Road and Highway 1 intersection headed Southbound. Stops have 3.5 hour headways from Memorial Day Weekend through Labor Day, stopping three times a day every day, and 3.75 hour headways from Labor Day to Memorial Day, stopping twice a day on Saturdays and Sundays only.
Route 24 serves Highway 1 and Carmel Valley Road from Monterey through Carmel Valley. Stops within the study area are located along Carmel Valley Road from Rio Vista Drive to Rippling River. Route 24 provides hourly service.
EXISTING TRAFFIC CONDITIONS
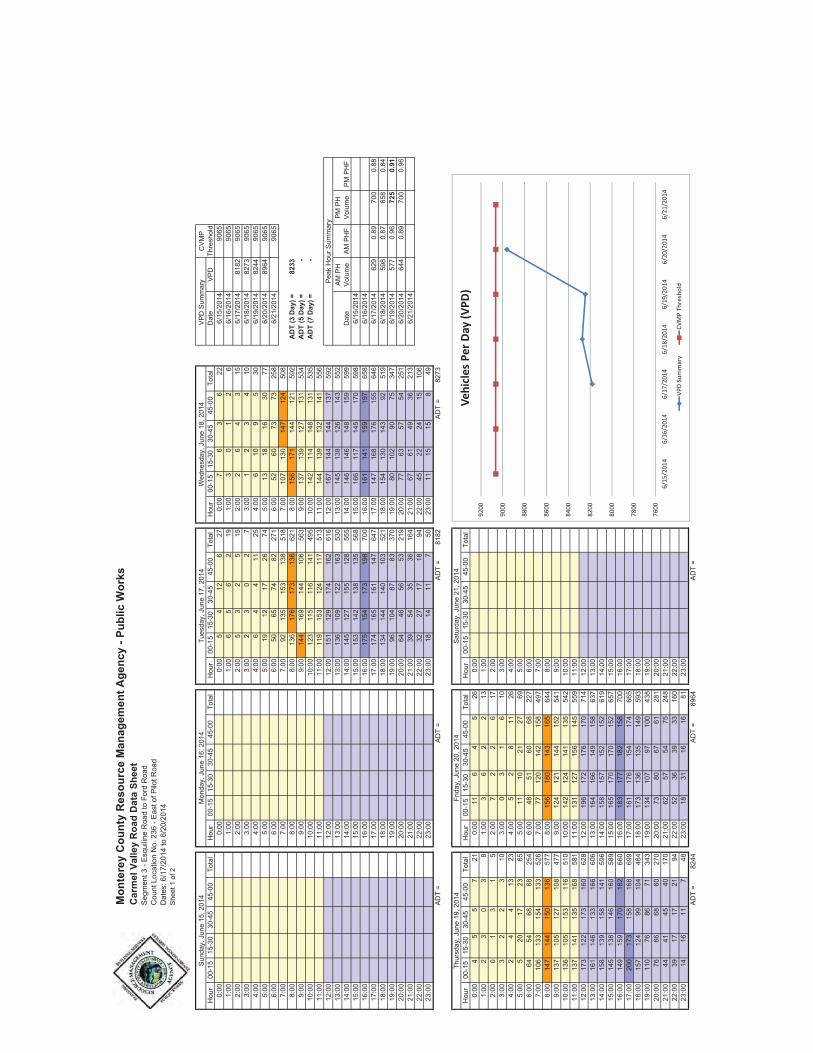
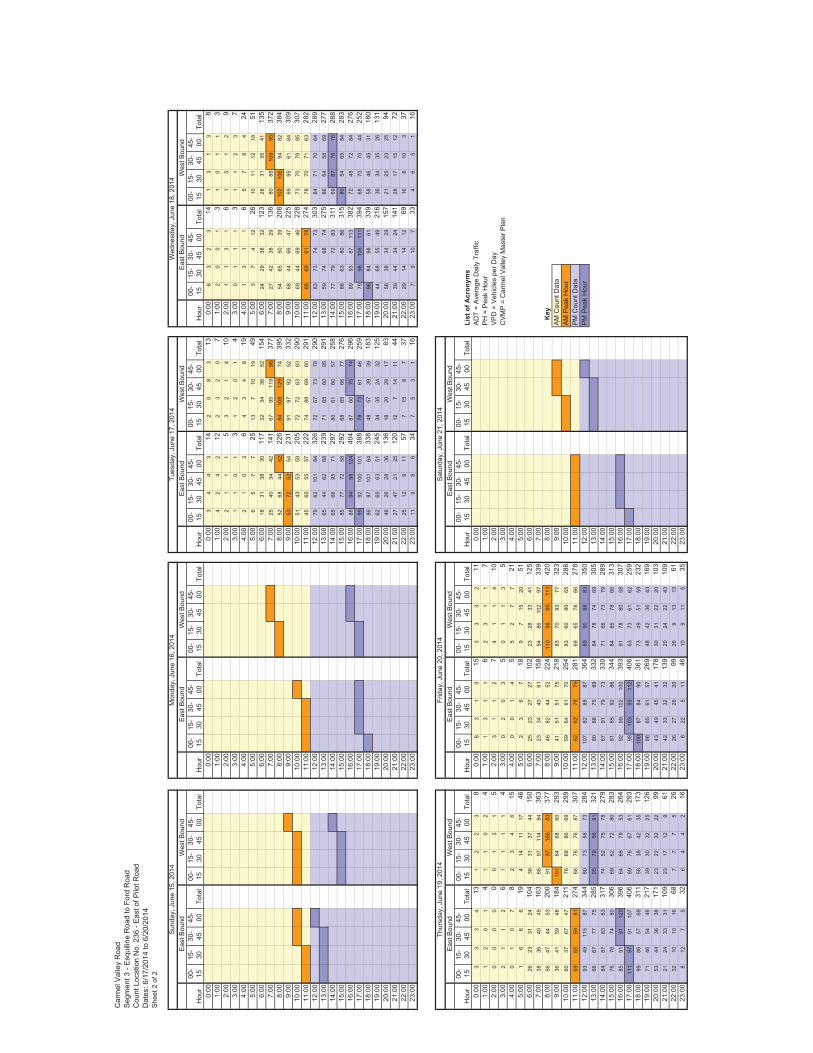
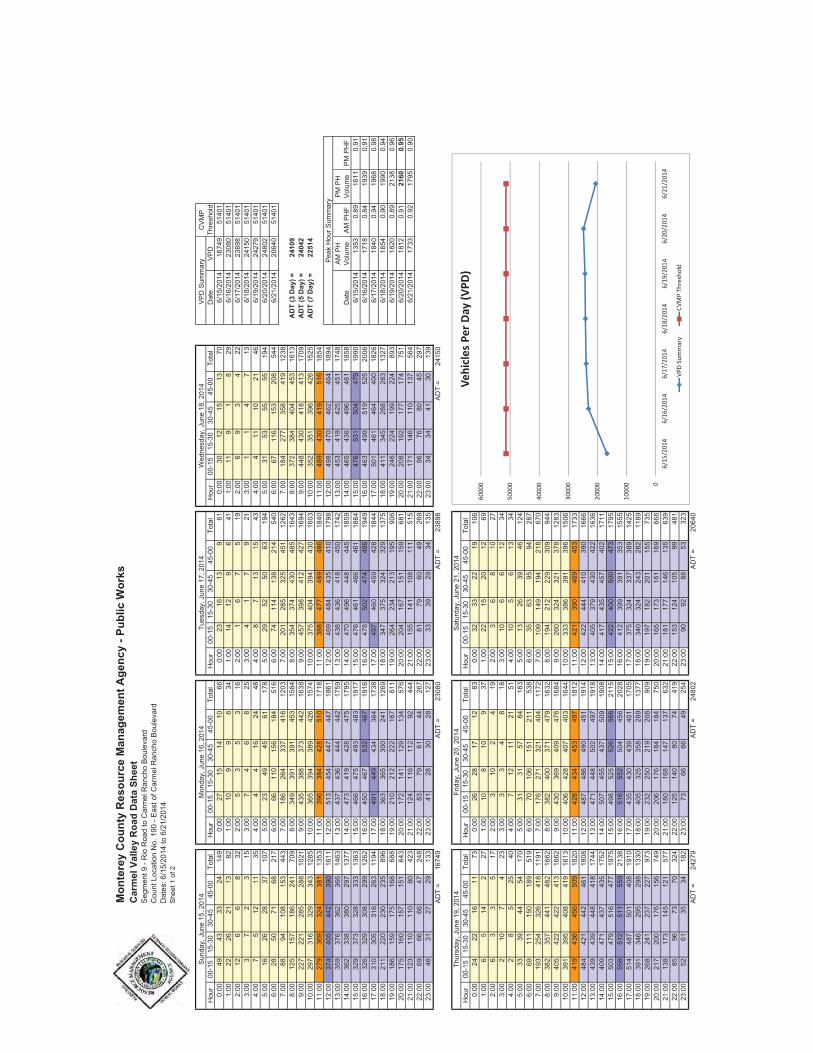
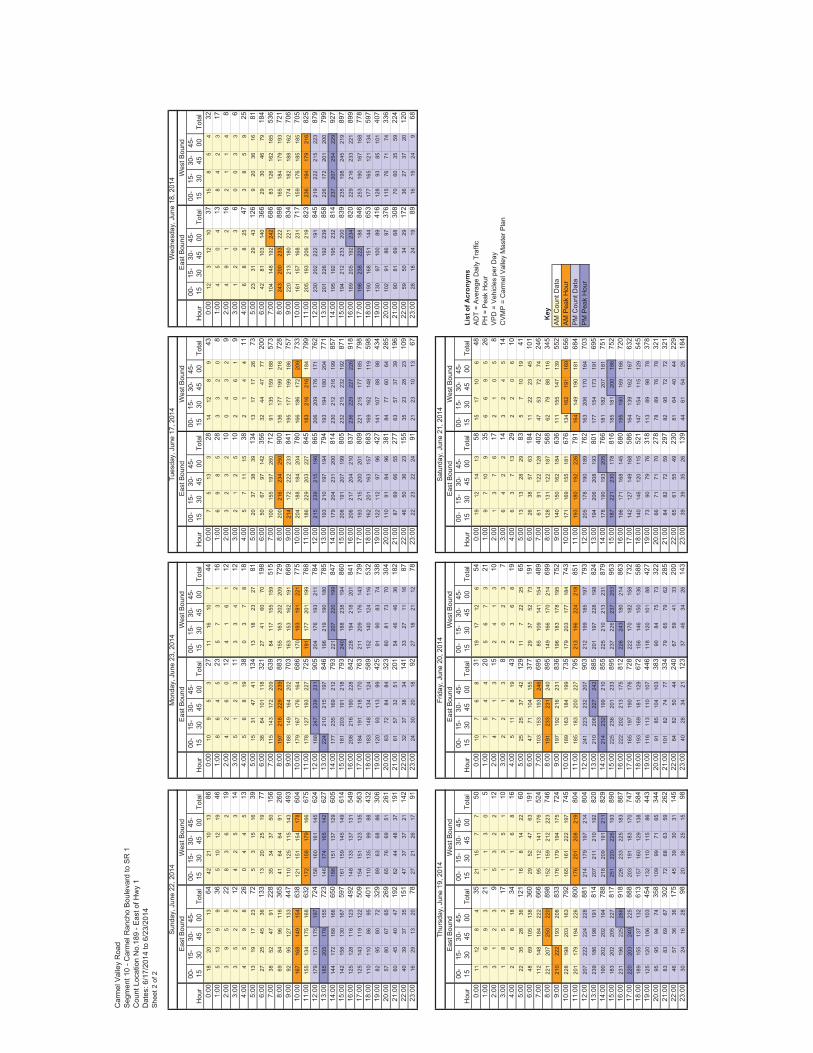
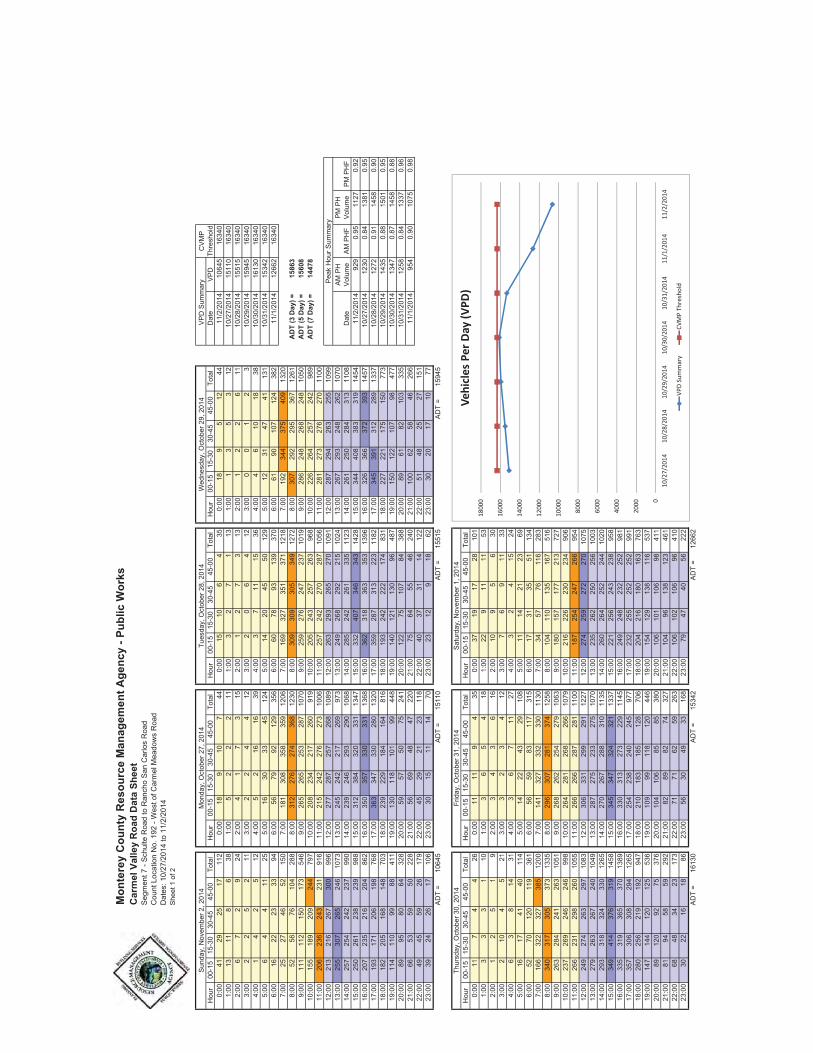
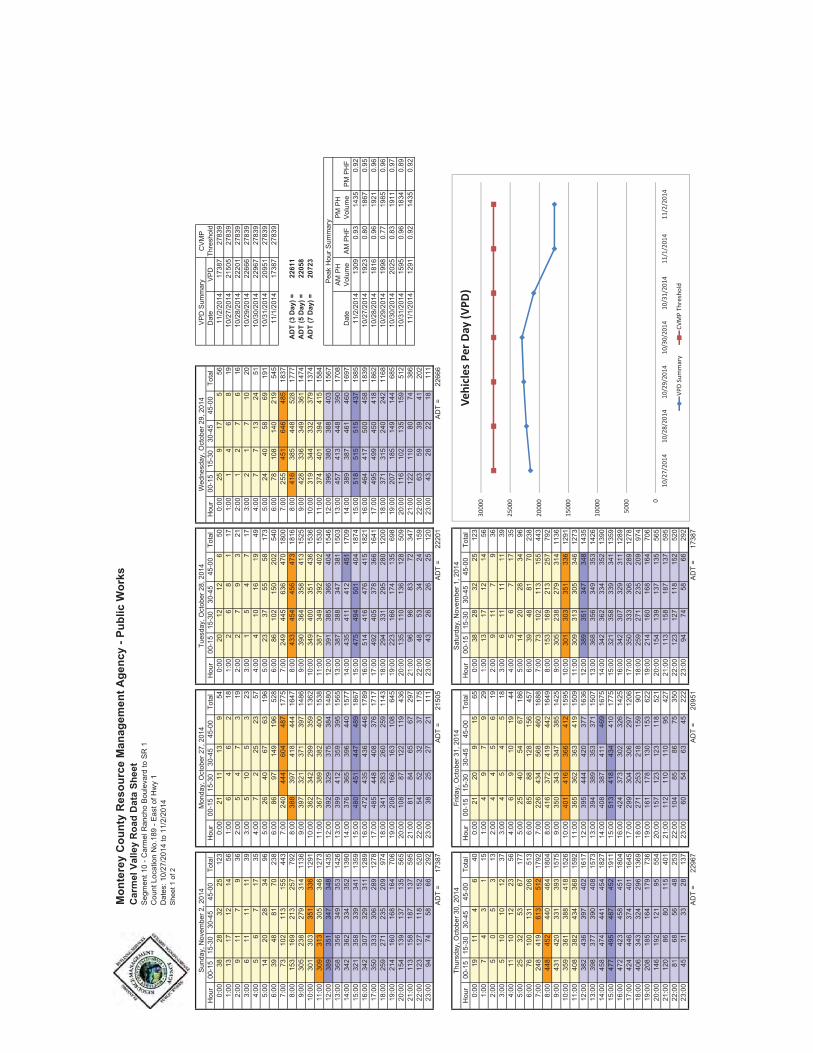
Traffic counts for weekday AM, PM, Friday, and Sunday peak hour conditions were collected at the study intersections in 2014 while schools were in session. Traffic count sheets are provided in Appendix A.
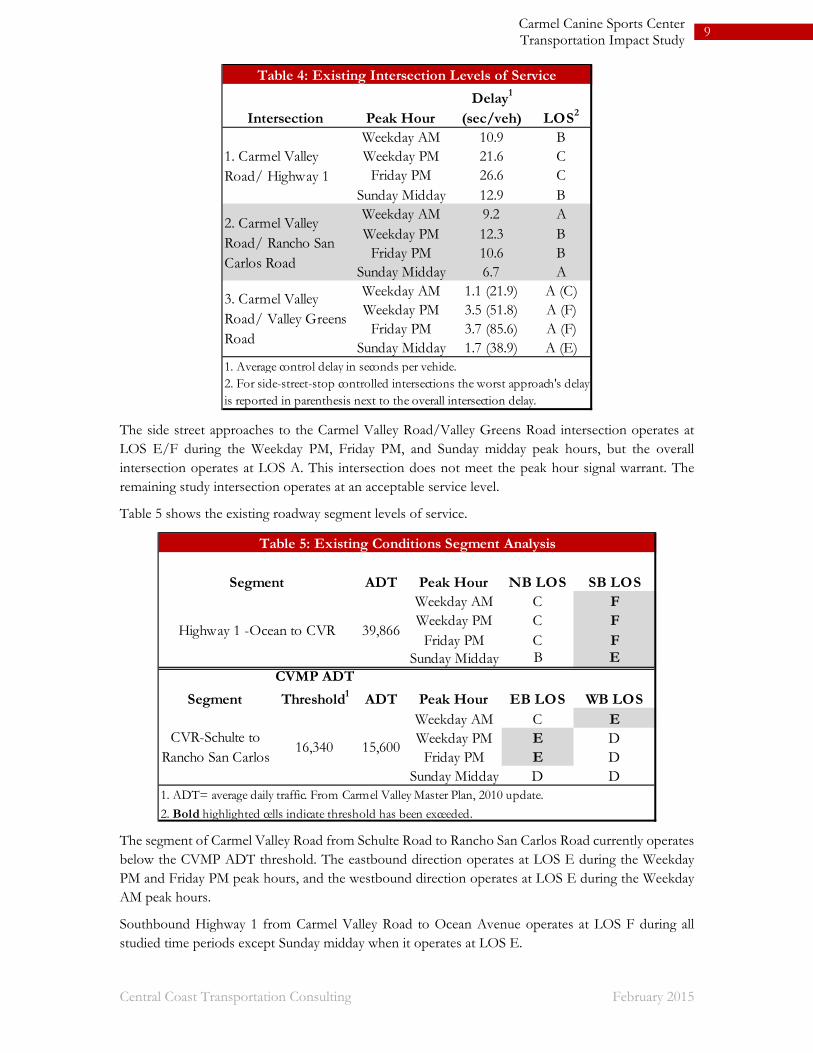
Figure 3 shows the existing peak hour traffic volumes and lane configurations. Table 4 presents the LOS for the study intersections, with detailed calculation sheets included in Appendix B.
Central Coast Transportation Consulting February 2015
9Carmel Canine Sports Center Transportation Impact Study
The side street approaches to the Carmel Valley Road/Valley Greens Road intersection operates at LOS E/F during the Weekday PM, Friday PM, and Sunday midday peak hours, but the overall intersection operates at LOS A. This intersection does not meet the peak hour signal warrant. The remaining study intersection operates at an acceptable service level.
Table 5 shows the existing roadway segment levels of service.
The segment of Carmel Valley Road from Schulte Road to Rancho San Carlos Road currently operates below the CVMP ADT threshold. The eastbound direction operates at LOS E during the Weekday PM and Friday PM peak hours, and the westbound direction operates at LOS E during the Weekday AM peak hours.
Southbound Highway 1 from Carmel Valley Road to Ocean Avenue operates at LOS F during all studied time periods except Sunday midday when it operates at LOS E.
Intersection Peak HourDelay1
(sec/veh) LOS2
Weekday AM 10.9 BWeekday PM 21.6 C
Friday PM 26.6 CSunday Midday 12.9 BWeekday AM 9.2 AWeekday PM 12.3 B
Friday PM 10.6 BSunday Midday 6.7 AWeekday AM 1.1 (21.9) A (C)Weekday PM 3.5 (51.8) A (F)
Friday PM 3.7 (85.6) A (F)Sunday Midday 1.7 (38.9) A (E)
Table 4: Existing Intersection Levels of Service
2. For side-street-stop controlled intersections the worst approach's delay is reported in parenthesis next to the overall intersection delay.
1. Average control delay in seconds per vehicle.
3. Carmel Valley Road/ Valley Greens Road
1. Carmel Valley Road/ Highway 1
2. Carmel Valley Road/ Rancho San Carlos Road
ADT Peak Hour NB LOS SB LOSWeekday AM C FWeekday PM C F
Friday PM C FSunday Midday B E
ADT EB LOS WB LOSWeekday AM C EWeekday PM E D
Friday PM E DSunday Midday D D
Table 5: Existing Conditions Segment Analysis
39,866
Segment
Highway 1 -Ocean to CVR
1. ADT= average daily traffic. From Carmel Valley Master Plan, 2010 update.
2. Bold highlighted cells indicate threshold has been exceeded.
Segment Peak Hour
CVR-Schulte to Rancho San Carlos
16,340 15,600
CVMP ADT
Threshold1

Carmel Canine
Figure 1: Project and Study Locations
1
2
3
Carmel Canine
Figure 3: Existing Peak Hour Volumes and Lane Configurations
7
Legend:
- Study Intersection- Project Site
- Traffic Volumes- Traffic Signal - Stop Sign
1. 2. 3.
1. 2. 3.
Existing Peak Hour - Weekday AM(PM) Volumes
Existing Peak Hour - Friday PM(Sunday Midday) Volumes
1
2
3

Central Coast Transportation Consulting February 2015
11Carmel Canine Sports Center Transportation Impact Study
Existing Plus Project Conditions This section evaluates the impacts of the proposed project on the surrounding transportation network. Existing Plus Project conditions reflect existing traffic levels plus the estimated traffic generated by the proposed project.
PROJECT TRAFFIC ESTIMATES
The amount of project traffic affecting the study intersections is estimated in three steps: trip generation, trip distribution, and trip assignment. Trip generation refers to the total number of trips generated by the site. Trip distribution identifies the general origins and destination of these trips, and trip assignment specifies the routes taken to reach these origins and destinations.
Trip Generation
The project’s trip generation estimate was developed using data provided in the Institute of Transportation Engineers’ (ITE) Trip Generation Manual and data provided in the project description. Trip generation for specific components of the Project were estimated individually using a combination of available resources as described below.
For typical weekday operations, the trip generation estimates were developed as follows:
Office and administration uses were evaluated as a single tenant office building with 15 employees. Because the Project has longer operational hours than typical office buildings the Project’s trips are likely to be spread throughout the day to a greater extent than offices, so the analysis is conservative by reflecting a higher level of peak hour trips.
Member visits were evaluated under the assumption that 20 percent of the anticipated 500 total members would use the facility on a typical day, with ten percent of the daily trips occurring in each peak hour.
Classes were assumed to include up to ten attendees plus two instructors. A maximum of two classes could be held simultaneously. A review of class schedules for similar facilities indicates that classes are spread throughout the day and typically range from one hour to 90 minutes. To present a reasonable worst-case scenario it was assumed that one class starts and one class ends during each peak hour. Ten classes were assumed per typical weekday.
Trip generation estimates for special events were developed as follows:
A maximum of 250 people would be permitted on the site during special events. This includes attendees, members, staff, and contractors.
The RV camping area was assumed to be fully occupied with 70 RVs. The project description notes that no in and out privileges will be granted to RVs. No mention is made of the accessory vehicles often towed by RVs (called ‘dinghies’) for day to day local trips so trip making characteristics were assumed to be similar to a typical Campground/RV park. The Sunday midday peak hour was assumed to be the reverse of Friday PM conditions.
The remaining 180 people on site during special events would arrive and depart the site in a single day. The trip generation estimate assumes that ten percent would arrive and 1/3 would depart during the Friday PM and Sunday midday peak hours. These estimates were informed by the Federal Highway Administration’s Managing Travel for Planned Special Events Handbook.
Special event conditions are evaluated during the Friday PM and Sunday midday time periods since this is when they will typically start/end. Typical, non-special event operations are evaluated during the

Central Coast Transportation Consulting February 2015
12Carmel Canine Sports Center Transportation Impact Study
Weekday AM and PM time periods. The special event estimates are conservative as they assume single occupancy in all vehicles. It is likely that some portion of attendees would carpool, thereby reducing the number of new vehicle trips. Table 6 shows the trip generation estimates.
During typical operations, the project trip generation estimate shows 496 new daily trips, 72 new Weekday AM peak hour trips, and 72 new Weekday PM peak hour trips. During special events, the trip estimate shows 500 new daily trips, 107 Friday PM peak hour trips, and 107 Sunday midday peak hour trips.
Trip Distribution and Assignment
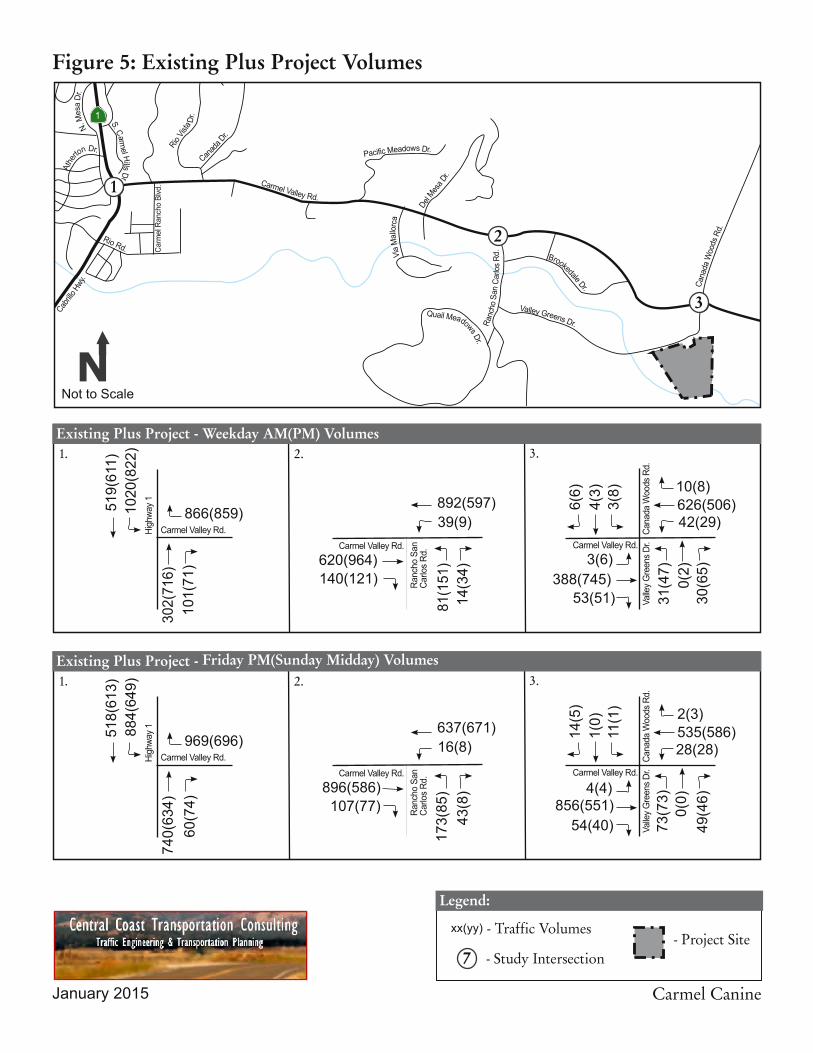
The Association of Monterey Bay Area Governments (AMBAG) developed and maintains a regional travel demand model (RTDM) for use in forecasting travel demand. The 2014 RTDM was applied to estimate the directions of approach and departure for project trips using a select zone procedure. Figure 4 shows the trip distribution percentages and project trip assignment. Existing Plus Project volumes are shown on Figure 5.
Project ComponentTypical Weekday Operations In Out Total In Out Total
Office/Administration1 15 Employees 56 7 1 8 1 7 8
Member Visits2 100 Members 200 10 10 20 10 10 20
Classes3 10 Classes 240 22 22 44 22 22 44
Typical Weekday Operations Total 496 39 33 72 33 39 72
Special Event Operations In Out Total In Out Total
Attendees, Employees, Vendors4 180 People 360 18 60 78 18 60 78
RV Campers5 70 Occupied Sites 140 18 11 29 11 18 29
Special Event Operations Total 500 36 71 107 29 78 107
Source: Trip Generation, 9th Edition, ITE (2012) and CCTC, 2014
1. Single tenant office , ITE Land Use Code 715.
Size
3. Classes assumed to include up to ten attendees plus two instructors. A maximum of two classes to be held simulaneously. Table assumes ten classes per typical weekday and that one class ends and one begins during each peak hour, and attendees drive alone.
2. Assumes 20% of 500 members use the facilty daily, each member driving alone, with 10% of the trips occuring in each peak hour.
4. Assumes that 10 percent will arrive and 1/3 will depart during the Friday and Sunday peak hours. 5. Per project description no in and out privileges will be granted for RVs; however, towed accessory vehicles ('dinghies') are not specifically addressed, so trips were estimated consistent with Campground/RV Park Land Use (ITE Land Use Code 416) assuming 100% occupancy for the weekday peak hour of generator for Friday conditions. The Sunday Midday peak was assumed to be the reverse of Friday conditions.
Daily Trips
Table 6: Trip Generation EstimatesPeak Hour Trips
Weekday AM Weekday PM
Sunday MiddayFriday PM

Central Coast Transportation Consulting February 2015
13Carmel Canine Sports Center Transportation Impact Study
EXISTING PLUS PROJECT IMPACT ANALYSIS
Table 7 summarizes the operating conditions under Existing and Existing Plus Project conditions.
The intersections of Carmel Valley Road with Highway 1 and Rancho San Carlos Road operate acceptably at LOS C or better under Existing and Existing Plus Project conditions so no impacts are noted at these locations.
The Carmel Valley Road/Valley Greens Road intersection operates at LOS E under Existing Plus Project conditions during the Friday PM peak hour, and LOS C or better under the other time periods. The northbound approach operates at LOS E or F under Existing Plus Project conditions during all studied time periods. The peak hour signal warrant is met under Existing Plus Project Friday PM and Sunday midday conditions. This is a significant impact during these time periods, which reflect special event operations. No impacts are identified during typical operations.
Acceptable operations could be achieved at the Carmel Valley Road/Valley Greens road with any one of the following modifications:
Install a single lane roundabout or a traffic signal. Either control type would provide acceptable operations under all analysis scenarios.
Until a roundabout or traffic signal is installed, the operational deficiencies could be addressed by either prohibiting northbound left turns and through movements during special events or by having law enforcement monitor and direct traffic during special events. The turn restriction would shift traffic destined to the west to the signalized Carmel Valley Road/Rancho San Carlos Road intersection, which would continue to operate at LOS B with the shifted traffic. This detour would add less than ½ mile of travel distance for project traffic and other local traffic destined to the west, but would require that the applicant enter into an agreement permitting project traffic’s use of the portions of Valley Greens Drive and Rancho San Carlos Road which are private roads.
Intersection Peak HourDelay1
(sec/veh) LOS2Delay1
(sec/veh) LOS2
Weekday AM 10.9 B 11.1 BWeekday PM 21.6 C 22.3 C
Friday PM 26.6 C 28.6 CSunday Midday 12.9 B 13.6 BWeekday AM 9.2 A 9.7 AWeekday PM 12.3 B 13.1 B
Friday PM 10.6 B 10.8 BSunday Midday 6.7 A 6.7 AWeekday AM 1.1 (21.9) A (C) 2.8 (43.1) A (E)Weekday PM 3.5 (51.8) A (F) 12.9 (157.5) B (F)
Friday PM 3.7 (85.6) A (F) 37.6 (>200) E (F)Sunday Midday 1.7 (38.9) A (E) 18.3 (>200) C (F)
Existing
2. Carmel Valley Road/ Rancho San Carlos Road
2. For side-street-stop controlled intersections the worst approach's delay is reported in parenthesis next to the overall intersection delay.
1. HCM 2010 average control delay in seconds per vehicle.
Table 7: Existing & Existing Plus Project Intersection Levels of ServiceExisting Plus Project
3. Carmel Valley Road/ Valley Greens Road
1. Carmel Valley Road/ Highway 1

Central Coast Transportation Consulting February 2015
14Carmel Canine Sports Center Transportation Impact Study
Eliminate special events on the site. This would eliminate the impacts during Friday PM and Sunday midday conditions. See the Alternative Analysis section at the end of this report for more details.
The segment analysis results are shown in Table 8. The segment of Carmel Valley Road from Schulte Road to Rancho San Carlos Road would remain below the CVMP ADT threshold. The eastbound direction operates at LOS E during the Weekday PM and Friday PM peak hours, and the westbound direction operates at LOS E during the Weekday AM peak hour. The addition of Project traffic worsens eastbound Carmel Valley Road operations to LOS D during Weekday AM conditions. LOS D is considered acceptable on this segment, and no other LOS changes are reported, so no significant impacts are identified on Carmel Valley Road.
Southbound Highway 1 would operate at LOS E or F with and without the project. The project would add traffic to this deficient existing condition, which is a significant impact. Widening Highway 1 would achieve acceptable operations on this segment; however, this is not included as a programmed and planned regional transportation project and is not considered a feasible improvement. No feasible mitigation measures have been identified for this segment.
Site Access and On-Site Circulation
On-site circulation deficiencies would occur if project designs fail to meet appropriate standards, fail to provide adequate truck access, or would result in hazardous conditions. The proposed site plan is shown on Figure 2. The Project proposes 169 general parking spaces plus a 15-space lot for staff. An unpaved overflow area would serve up to 70 RVs or as general overflow parking when RVs are not present. With the overflow area occupied by RVs, up to 254 vehicles could be parked on site. The parking supply is adequate for the maximum event size of 250 people.
Appendix B of the County’s Guide for the Preparation of Traffic Impact Studies includes guidelines for the installation of left turn lanes on two-lane roads like Valley Greens Drive. Support for a left turn lane is based on the forecast average annual daily traffic (AADT) volumes on the major street in combination with the peak hour turning volumes to the minor street. The left turn channelization policy notes that left turn channelization is based on a recommendation by Traffic Division staff based on consideration of the volumes, sight distance, geometrics, collision history, speeds, and any other special characteristics.
The 2012 AADT on Valley Greens Drive was 1,300 vehicles. The addition of typical weekday project traffic will increase the AADT to 1,796 vehicles. The inbound left turning traffic is highest during the
ADT NB LOS SB LOS ADT NB LOS SB LOSWeekday AM C F C FWeekday PM C F C F
Friday PM C F C FSunday Midday B E B E
ADT EB LOS WB LOS ADT EB LOS WB LOSWeekday AM C E D EWeekday PM E D E D
Friday PM E D E DSunday Midday D D D D
40,166
Peak HourExisting Conditions Existing Plus Project
Table 8: Existing Plus Project Segment Analysis
Highway 1 -Ocean to CVR
Segment
39,866
CVR-Schulte to Rancho San Carlos
16,340 15,600 15,950
CVMP ADT
Threshold1Segment Peak HourExisting Conditions Existing Plus Project
1. Source: Carmel Valley Master Plan 2010 update.
2. Bold & highlighted cells indicate threshold has been exceeded.
Central Coast Transportation Consulting February 2015
15Carmel Canine Sports Center Transportation Impact Study
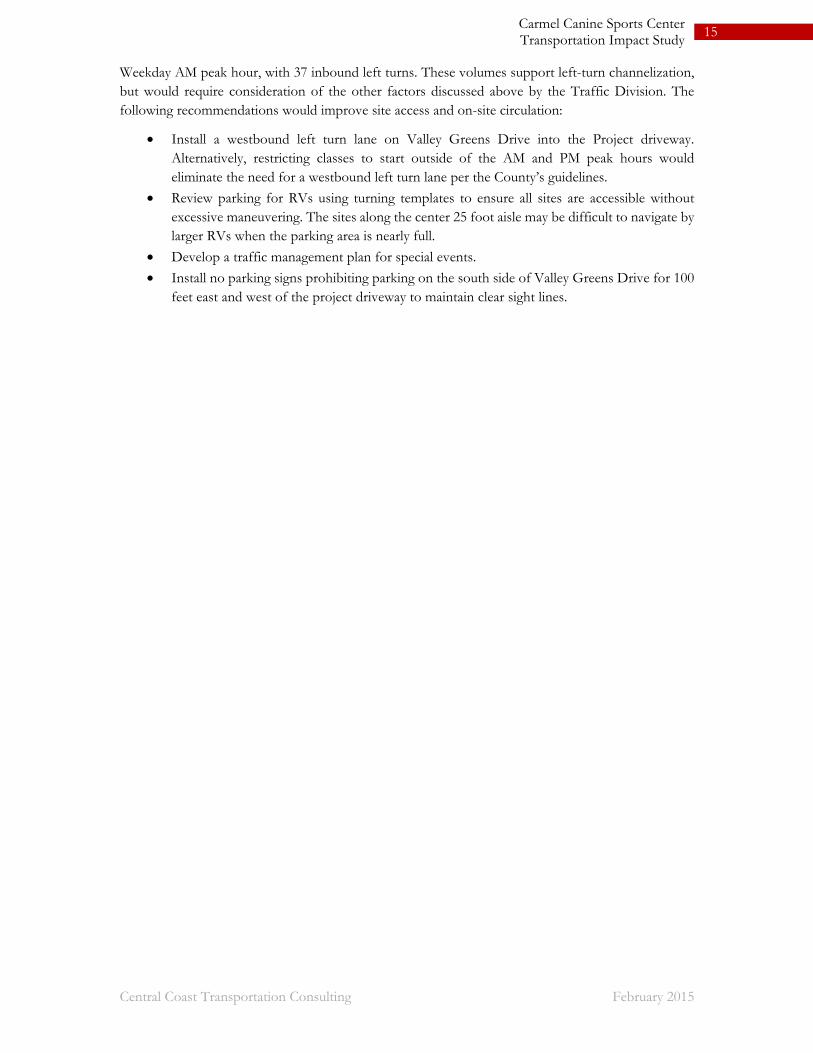
Weekday AM peak hour, with 37 inbound left turns. These volumes support left-turn channelization, but would require consideration of the other factors discussed above by the Traffic Division. The following recommendations would improve site access and on-site circulation:
Install a westbound left turn lane on Valley Greens Drive into the Project driveway. Alternatively, restricting classes to start outside of the AM and PM peak hours would eliminate the need for a westbound left turn lane per the County’s guidelines.
Review parking for RVs using turning templates to ensure all sites are accessible without excessive maneuvering. The sites along the center 25 foot aisle may be difficult to navigate by larger RVs when the parking area is nearly full.
Develop a traffic management plan for special events.
Install no parking signs prohibiting parking on the south side of Valley Greens Drive for 100 feet east and west of the project driveway to maintain clear sight lines.

Carmel Canine
Figure 1: Project and Study Locations
Legend:
7 - Study Intersection- Project Site
1
2
3
Carmel Canine
Figure 4: Project Trip Distribution and Assignment
7
Legend:
- Study Intersection
- Project Site- Project Trip DistributionPercentage
- Traffic Volumes
1. 2. 3.
1. 2. 3.
Project Trip Assignment - Weekday AM(PM) Volumes
Project Trip Assignment - Friday PM(Sunday Midday) Volumes
1
2
3
Carmel Canine
Figure 1: Project and Study Locations
1
2
3
Carmel Canine
Figure 5: Existing Plus Project Volumes
7
Legend:
- Study Intersection
- Project Site- Traffic Volumes
1. 2. 3.
1. 2. 3.
Existing Plus Project - Weekday AM(PM) Volumes
Existing Plus Project - Friday PM(Sunday Midday) Volumes
1
2
3
Central Coast Transportation Consulting February 2015
18Carmel Canine Sports Center Transportation Impact Study
Cumulative Conditions Cumulative conditions represent build-out of the land uses in the region.
CUMULATIVE ROADWAY NETWORK
The Transportation Agency for Monterey County (TAMC) collects development impact fees to help fund transportation project of regional significance. TAMC’s 2014 Regional Transportation Improvement Plan programs construction funding starting in 2015/16 for improvements to Highway 1 between Rio Road and Carmel Valley Road. The following improvements are included in this project:
Add a second northbound through lane to Highway 1 between Rio Road and Carmel Valley Road.
Add capacity to the Rio Road/Highway 1 intersection as follows: o Convert the northbound right turn lane to a shared through/right turn lane. o Add a second westbound right turn lane. o Widen the southbound approach to provide a right turn lane, through lane, and dual
left turn lanes.
Convert the Carmel Valley Road/Highway 1 intersection’s northbound right turn lane to a shared through/right turn lane.
No other roadway network changes affecting study location operations were assumed to be in place under Cumulative conditions.
CUMULATIVE VOLUME FORECASTS
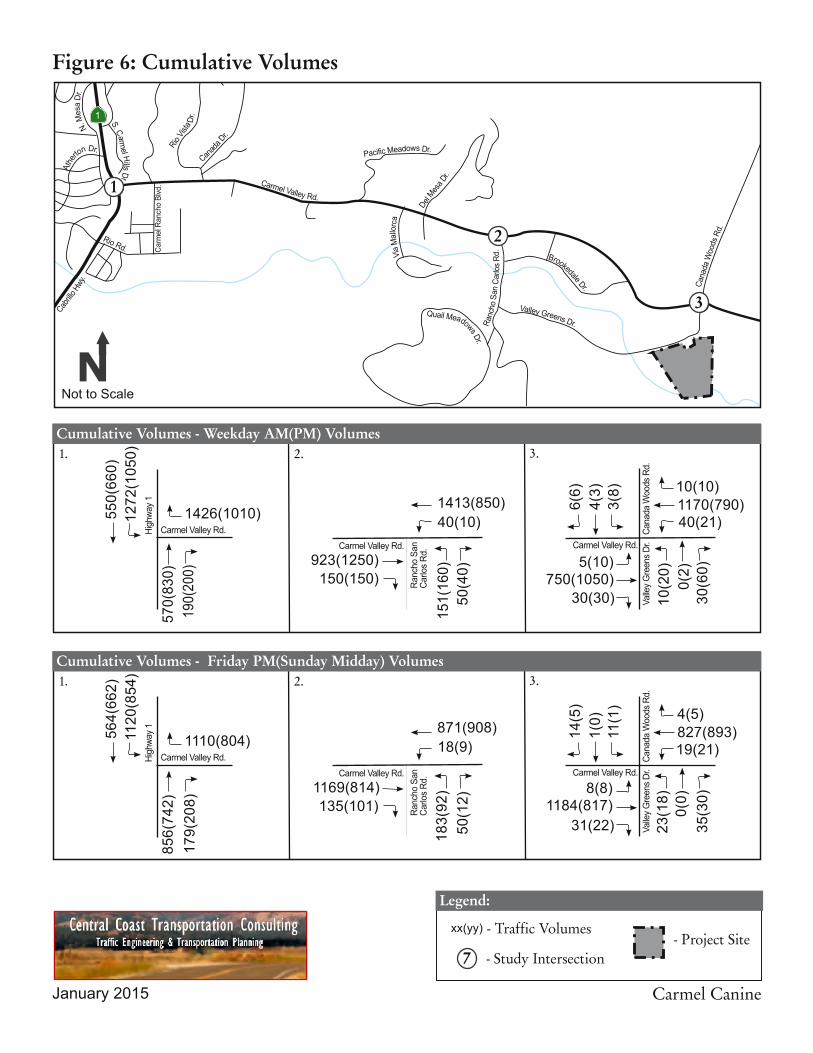
Cumulative traffic volume forecasts were developed using the 2014 AMBAG RTDM and the 2007 Carmel Valley Master Plan (CVMP) traffic study. The CVMP traffic study forecasts travel based on a detailed review of potential land use intensities within Carmel Valley, while the RTDM is by nature focused more on regional travel patterns. The CVMP traffic study forecasts substantially more growth along the Carmel Valley Road corridor than the RTDM, which shows future traffic levels within five percent of year 2010 levels. These increases flow to Highway 1, again resulting in significantly higher volumes than those projected in the RTDM.
The CVMP traffic study forecasts were given precedence over the RTDM forecasts due to the local nature of those forecasting efforts. The result of this approach is a more conservative analysis. Cumulative volumes are shown on Figure 6.

Central Coast Transportation Consulting February 2015
19Carmel Canine Sports Center Transportation Impact Study
CUMULATIVE TRAFFIC CONDITIONS
Table 9 summarizes Cumulative traffic conditions with and without the project. Cumulative impacts are identified relative to the existing operating condition.
Carmel Valley Road/Highway 1 would operate acceptably at LOS C or better under Cumulative and Cumulative Plus Project conditions. No impacts are identified at this intersection.
Carmel Valley Road/Rancho San Carlos Road would operate at LOS D during the Weekday AM peak hour under Cumulative and Cumulative Plus Project conditions and LOS C or better during all other time periods. The addition of Cumulative traffic changes the LOS to an unacceptable level from the existing condition. This impact is considered significant. Adding a second westbound through lane would improve operations to LOS B. The transition from a two-lane section to a four-lane section occurs approximately 1/3 of a mile west of Rancho San Carlos Road. It would be necessary to extend the new westbound lane to the current merge point west of the intersection. This project is not included on the Carmel Valley Road Improvement List.
Carmel Valley Road/Valley Greens Road would operate at LOS D or better under Cumulative conditions, with the addition of Project traffic worsening operations to LOS E or worse under Cumulative Plus Project conditions. The signal warrant would be met with the project in place under all time periods. This is a significant impact. Installation of a multilane roundabout or traffic signal would be necessary to provide acceptable operations at this intersection under Cumulative Plus Project conditions. This project is not currently included on the Carmel Valley Road Improvement List, so payment of impact fees would not mitigate this impact unless the Improvement List and impact fees are amended.
Intersection Peak HourDelay1
(sec/veh) LOS2Delay1
(sec/veh) LOS2Delay1
(sec/veh) LOS2
Weekday AM 10.9 B 21.5 C 22.3 CWeekday PM 21.6 C 18.9 B 19.5 B
Friday PM 26.6 C 21.1 C 22.2 CSunday Midday 12.9 B 12.5 B 13.0 BWeekday AM 9.2 A 49.8 D 53.9 DWeekday PM 12.3 B 26.7 C 29.1 C
Friday PM 10.6 B 22.8 C 25.3 CSunday Midday 6.7 A 8.2 A 8.8 AWeekday AM 1.1 (21.9) A (C) 6.3 (>200) A (F) 47.5 (>200) E (F)Weekday PM 3.5 (51.8) A (F) 30.1 (>200) D (F) 76.0 (>200) F (F)
Friday PM 3.7 (85.6) A (F) 23.1 (>200) C (F) 163.3 F (F)Sunday Midday 1.7 (38.9) A (E) 6.9 (>200) A (F) 100.1 F (F)
3. Carmel Valley Road/Valley Greens Road1. HCM 2010 average control delay in seconds per vehicle. 2. For side-street-stop controlled intersections the worst approach's delay is reported in parenthesis next to the overall intersection delay. 3. Unacceptable operations are shown in bold text.
Existing
Table 9: Cumulative & Cumulative Plus Project Intersection Levels of Service
CumulativeCumulative Plus
Project
1. Carmel Valley Road/Highway 12. Carmel Valley Road/Rancho San Carlos
Central Coast Transportation Consulting February 2015
20Carmel Canine Sports Center Transportation Impact Study
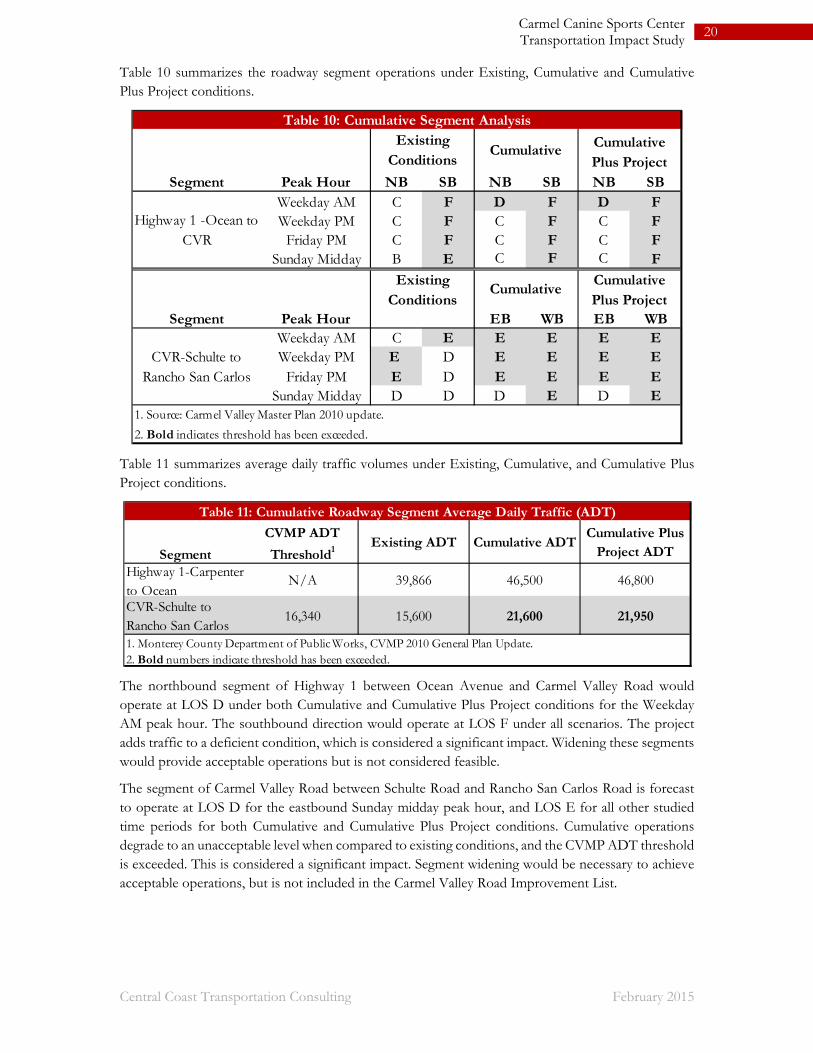
Table 10 summarizes the roadway segment operations under Existing, Cumulative and Cumulative Plus Project conditions.
Table 11 summarizes average daily traffic volumes under Existing, Cumulative, and Cumulative Plus Project conditions.
The northbound segment of Highway 1 between Ocean Avenue and Carmel Valley Road would operate at LOS D under both Cumulative and Cumulative Plus Project conditions for the Weekday AM peak hour. The southbound direction would operate at LOS F under all scenarios. The project adds traffic to a deficient condition, which is considered a significant impact. Widening these segments would provide acceptable operations but is not considered feasible.
The segment of Carmel Valley Road between Schulte Road and Rancho San Carlos Road is forecast to operate at LOS D for the eastbound Sunday midday peak hour, and LOS E for all other studied time periods for both Cumulative and Cumulative Plus Project conditions. Cumulative operations degrade to an unacceptable level when compared to existing conditions, and the CVMP ADT threshold is exceeded. This is considered a significant impact. Segment widening would be necessary to achieve acceptable operations, but is not included in the Carmel Valley Road Improvement List.
NB SB NB SB NB SB Weekday AM C F D F D FWeekday PM C F C F C F
Friday PM C F C F C FSunday Midday B E C F C F
EB WB EB WB Weekday AM C E E E E EWeekday PM E D E E E E
Friday PM E D E E E ESunday Midday D D D E D E
2. Bold indicates threshold has been exceeded.
1. Source: Carmel Valley Master Plan 2010 update.
Highway 1 -Ocean to CVR
Segment Peak Hour
Cumulative Cumulative Plus Project
CVR-Schulte to Rancho San Carlos
Existing Conditions
Segment Peak Hour
Cumulative
Table 10: Cumulative Segment Analysis
Cumulative Plus Project
Existing Conditions
Highway 1-Carpenter to Ocean
N/A 39,866 46,500 46,800
CVR-Schulte to Rancho San Carlos
16,340 15,600 21,600 21,950
1. Monterey County Department of Public Works, CVMP 2010 General Plan Update.
Table 11: Cumulative Roadway Segment Average Daily Traffic (ADT)
2. Bold numbers indicate threshold has been exceeded.
Segment
CVMP ADT
Threshold1Existing ADT Cumulative ADT
Cumulative Plus Project ADT
Carmel Canine
Figure 1: Project and Study Locations
1
2
3
Carmel Canine
Figure 6: Cumulative Volumes
7
Legend:
- Study Intersection
- Project Site- Traffic Volumes
1. 2. 3.
1. 2. 3.
Cumulative Volumes - Weekday AM(PM) Volumes
Cumulative Volumes - Friday PM(Sunday Midday) Volumes
1
2
3
Central Coast Transportation Consulting February 2015
22Carmel Canine Sports Center Transportation Impact Study
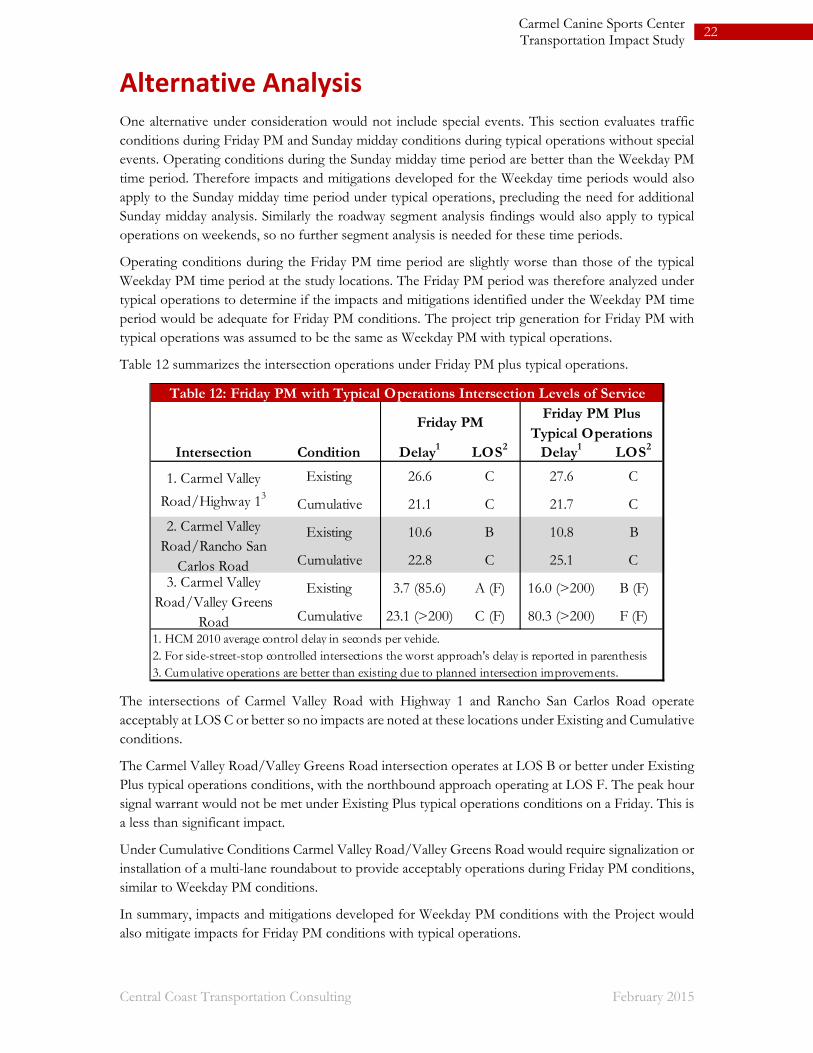
Alternative Analysis One alternative under consideration would not include special events. This section evaluates traffic conditions during Friday PM and Sunday midday conditions during typical operations without special events. Operating conditions during the Sunday midday time period are better than the Weekday PM time period. Therefore impacts and mitigations developed for the Weekday time periods would also apply to the Sunday midday time period under typical operations, precluding the need for additional Sunday midday analysis. Similarly the roadway segment analysis findings would also apply to typical operations on weekends, so no further segment analysis is needed for these time periods.
Operating conditions during the Friday PM time period are slightly worse than those of the typical Weekday PM time period at the study locations. The Friday PM period was therefore analyzed under typical operations to determine if the impacts and mitigations identified under the Weekday PM time period would be adequate for Friday PM conditions. The project trip generation for Friday PM with typical operations was assumed to be the same as Weekday PM with typical operations.
Table 12 summarizes the intersection operations under Friday PM plus typical operations.
The intersections of Carmel Valley Road with Highway 1 and Rancho San Carlos Road operate acceptably at LOS C or better so no impacts are noted at these locations under Existing and Cumulative conditions.
The Carmel Valley Road/Valley Greens Road intersection operates at LOS B or better under Existing Plus typical operations conditions, with the northbound approach operating at LOS F. The peak hour signal warrant would not be met under Existing Plus typical operations conditions on a Friday. This is a less than significant impact.
Under Cumulative Conditions Carmel Valley Road/Valley Greens Road would require signalization or installation of a multi-lane roundabout to provide acceptably operations during Friday PM conditions, similar to Weekday PM conditions.
In summary, impacts and mitigations developed for Weekday PM conditions with the Project would also mitigate impacts for Friday PM conditions with typical operations.
Intersection Condition Delay1 LOS2 Delay1 LOS2
Existing 26.6 C 27.6 C
Cumulative 21.1 C 21.7 C
Existing 10.6 B 10.8 B
Cumulative 22.8 C 25.1 C
Existing 3.7 (85.6) A (F) 16.0 (>200) B (F)
Cumulative 23.1 (>200) C (F) 80.3 (>200) F (F)
Table 12: Friday PM with Typical Operations Intersection Levels of Service
Friday PMFriday PM Plus
Typical Operations
1. HCM 2010 average control delay in seconds per vehicle. 2. For side-street-stop controlled intersections the worst approach's delay is reported in parenthesis 3. Cumulative operations are better than existing due to planned intersection improvements.
1. Carmel Valley
Road/Highway 13
2. Carmel Valley Road/Rancho San
Carlos Road3. Carmel Valley
Road/Valley Greens Road

Central Coast Transportation Consulting February 2015
23Carmel Canine Sports Center Transportation Impact Study
References California Department of Transportation. 2002. Guide for the Preparation of Traffic Impact Studies.
_____. 2011. State Route 1/Rio Road to Carmel Valley Road Operational Improvement Project Initial Study with Proposed Mitigated Negative Declaration.
DKS Associates. 2007. Carmel Valley Master Plan Traffic Study.
Federal Highway Administration. 2014. Managing Travel for Planned Special Events Handbook.
Monterey County. 2012. Amended Sections of the Carmel Valley Master Plan 2010 General Plan Update.
_____. 1995. Carmel Valley Road Improvement List.
_____. 2009. Carmel Valley Traffic Improvement Program Partial Revision of the Draft Subsequent Environmental Impact Report.
_____. 2014. Guide for the Preparation of Traffic Impact Studies.
_____. 1982. Monterey County General Plan.
Transportation Agency for Monterey County. 2011. Bicycle and Pedestrian Master Plan.
_____. 2014. Regional Transportation Improvement Plan.
Transportation Research Board. 2010. Highway Capacity Manual.
Appendix A: Traffic Count Sheets
7600
7800
8000
8200
8400
8600
8800
9000
9200
6/15/2014
6/16/2014
6/17/2014
6/18/2014
6/19/2014
6/20/2014
6/21/2014
Vehicle
sPer
Day(VPD
)
VPDSummary
CVMPThreshold

0
2000
4000
6000
8000
10000
12000
14000
6/15/2014
6/16/2014
6/17/2014
6/18/2014
6/19/2014
6/20/2014
6/21/2014
Vehicle
sPer
Day(VPD
)
VPDSummary
CVMPThreshold


9500
10000
10500
11000
11500
12000
12500
13000
6/15/2014
6/16/2014
6/17/2014
6/18/2014
6/19/2014
6/20/2014
6/21/2014
Vehicle
sPer
Day(VPD
)
VPDSummary
CVMPThreshold


0
2000
4000
6000
8000
10000
12000
14000
16000
18000
6/15/2014
6/16/2014
6/17/2014
6/18/2014
6/19/2014
6/20/2014
6/21/2014
Vehicle
sPer
Day(VPD
)
VPDSummary
CVMPThreshold


0
2000
4000
6000
8000
10000
12000
14000
16000
18000
6/15/2014
6/16/2014
6/17/2014
6/18/2014
6/19/2014
6/20/2014
6/21/2014
Vehicle
sPer
Day(VPD
)
VPDSummary
CVMPThreshold

0
10000
20000
30000
40000
50000
60000
6/15/2014
6/16/2014
6/17/2014
6/18/2014
6/19/2014
6/20/2014
6/21/2014
Vehicle
sPer
Day(VPD
)
VPDSummary
CVMPThreshold


0
5000
10000
15000
20000
25000
30000
6/17/2014
6/18/2014
6/19/2014
6/20/2014
6/21/2014
6/22/2014
6/23/2014
Vehicle
sPer
Day(VPD
)
VPDSummary
CVMPThreshold

0
1000
2000
3000
4000
5000
6000
7000
8000
9000
10000
10/27/2014
10/28/2014
10/29/2014
10/30/2014
10/31/2014
11/1/2014
11/2/2014
Vehicle
sPer
Day(VPD
)
VPDSummary
CVMPThreshold


0
2000
4000
6000
8000
10000
12000
14000
10/27/2014
10/28/2014
10/29/2014
10/30/2014
10/31/2014
11/1/2014
11/2/2014
Vehicle
sPer
Day(VPD
)
VPDSummary
CVMPThreshold


9500
10000
10500
11000
11500
12000
12500
13000
10/27/2014
10/28/2014
10/29/2014
10/30/2014
10/31/2014
11/1/2014
11/2/2014
Vehicle
sPer
Day(VPD
)
VPDSummary
CVMPThreshold


0
2000
4000
6000
8000
10000
12000
14000
16000
18000
10/27/2014
10/28/2014
10/29/2014
10/30/2014
10/31/2014
11/1/2014
11/2/2014
Vehicle
sPer
Day(VPD
)
VPDSummary
CVMPThreshold

0
2000
4000
6000
8000
10000
12000
14000
16000
18000
10/27/2014
10/28/2014
10/29/2014
10/30/2014
10/31/2014
11/1/2014
11/2/2014
Vehicle
sPer
Day(VPD
)
VPDSummary
CVMPThreshold

0
5000
10000
15000
20000
25000
30000
10/27/2014
10/28/2014
10/29/2014
10/30/2014
10/31/2014
11/1/2014
11/2/2014
Vehicle
sPer
Day(VPD
)
VPDSummary
CVMPThreshold


Volumes for: & City: Carmel
Location : Highway 1 btwn. Carmel Valley Rd. & Ocean Ave.
AM Period NB SB EB WB PM Period NB SB EB WB
00:00 35 23 0 0 12:00 348 376 0 0 00:15 26 16 0 0 12:15 415 384 0 0 00:30 21 18 0 0 12:30 386 330 0 0 00:45 15 96 13 69 0 0 0 0 165 12:45 373 1522 379 1468 0 0 0 0 2990
01:00 10 5 0 0 13:00 353 386 0 0 01:15 8 7 0 0 13:15 353 379 0 0 01:30 6 8 0 0 13:30 362 390 0 0 01:45 6 30 6 25 0 0 0 0 54 13:45 362 1429 387 1541 0 0 0 0 2970
02:00 4 6 0 0 14:00 371 395 0 0 02:15 5 7 0 0 14:15 384 371 0 0 02:30 4 4 0 0 14:30 379 354 0 0 02:45 5 18 7 23 0 0 0 0 41 14:45 413 1547 363 1483 0 0 0 0 3029
03:00 5 6 0 0 15:00 406 377 0 0 03:15 7 5 0 0 15:15 385 346 0 0 03:30 4 7 0 0 15:30 405 350 0 0 03:45 7 23 6 23 0 0 0 0 46 15:45 372 1567 370 1442 0 0 0 0 3009
04:00 5 14 0 0 16:00 411 348 0 0 04:15 10 12 0 0 16:15 391 327 0 0 04:30 12 20 0 0 16:30 355 344 0 0 04:45 17 44 24 70 0 0 0 0 113 16:45 328 1484 341 1359 0 0 0 0 2843
05:00 19 25 0 0 17:00 341 337 0 0 05:15 27 47 0 0 17:15 325 354 0 0 05:30 29 34 0 0 17:30 360 337 0 0 05:45 32 106 62 167 0 0 0 0 273 17:45 393 1418 325 1352 0 0 0 0 2770
06:00 35 78 0 0 18:00 336 299 0 0 06:15 52 115 0 0 18:15 313 313 0 0 06:30 82 192 0 0 18:30 281 246 0 0 06:45 124 292 228 613 0 0 0 0 904 18:45 297 1226 247 1104 0 0 0 0 2329
07:00 145 261 0 0 19:00 267 239 0 0 07:15 170 312 0 0 19:15 213 203 0 0 07:30 322 348 0 0 19:30 191 177 0 0 07:45 272 908 411 1332 0 0 0 0 2240 19:45 192 862 146 764 0 0 0 0 1626
08:00 276 427 0 0 20:00 184 139 0 0 08:15 296 396 0 0 20:15 186 151 0 0 08:30 294 355 0 0 20:30 168 152 0 0 08:45 323 1189 375 1553 0 0 0 0 2742 20:45 146 683 117 558 0 0 0 0 1240
09:00 284 333 0 0 21:00 135 121 0 0 09:15 284 340 0 0 21:15 132 116 0 0 09:30 271 360 0 0 21:30 111 90 0 0 09:45 304 1142 391 1423 0 0 0 0 2565 21:45 86 463 82 408 0 0 0 0 871
10:00 320 366 0 0 22:00 89 81 0 0 10:15 349 380 0 0 22:15 76 66 0 0 10:30 347 416 0 0 22:30 78 61 0 0 10:45 352 1367 395 1556 0 0 0 0 2923 22:45 77 320 57 264 0 0 0 0 584
11:00 370 390 0 0 23:00 57 50 0 0 11:15 383 423 0 0 23:15 53 49 0 0 11:30 380 382 0 0 23:30 58 46 0 0 11:45 427 1560 412 1607 0 0 0 0 3166 23:45 31 199 35 180 0 0 0 0 378
Total Vol. 6771 8459 15229 12717 11920 24637
NB SB Combined
19488 20378 39866
Split % 44.5% 55.5% 38.2% 51.6% 48.4% 61.8%
Peak Hour 11:45 10:30 11:00 14:45 13:15 14:15
Volume 1576 1623 3166 1609 1550 3046P.H.F. 0.92 0.96 0.94 0.97 0.98 0.97
14-1256-013Project#Tuesday, August 19, 2014Wednesday, August 20, 2014
AM PM
Daily Totals
2-DAY AVERAGE

Volumes for: & City: Carmel
Location : Carmel Valley Rd. btwn. Schulte Rd. & Rancho San Carlos Rd.
AM Period NB SB EB WB PM Period NB SB EB WB
00:00 0 0 6 8 12:00 0 0 195 205 00:15 0 0 3 5 12:15 0 0 186 221 00:30 0 0 5 3 12:30 0 0 202 238 00:45 0 0 0 0 2 15 7 23 38 12:45 0 0 0 0 224 806 233 896 1702
01:00 0 0 5 5 13:00 0 0 232 236 01:15 0 0 3 8 13:15 0 0 250 268 01:30 0 0 2 9 13:30 0 0 243 243 01:45 0 0 0 0 5 13 7 28 41 13:45 0 0 0 0 250 973 214 960 1933
02:00 0 0 5 5 14:00 0 0 274 185 02:15 0 0 5 5 14:15 0 0 251 214 02:30 0 0 3 7 14:30 0 0 214 209 02:45 0 0 0 0 6 19 7 23 42 14:45 0 0 0 0 251 990 215 823 1813
03:00 0 0 10 12 15:00 0 0 242 261 03:15 0 0 8 12 15:15 0 0 252 229 03:30 0 0 9 14 15:30 0 0 228 198 03:45 0 0 0 0 9 35 17 54 89 15:45 0 0 0 0 252 973 159 846 1819
04:00 0 0 10 13 16:00 0 0 198 148 04:15 0 0 18 17 16:15 0 0 177 147 04:30 0 0 22 22 16:30 0 0 214 157 04:45 0 0 0 0 26 76 31 82 158 16:45 0 0 0 0 247 835 148 599 1434
05:00 0 0 33 32 17:00 0 0 221 138 05:15 0 0 43 37 17:15 0 0 238 131 05:30 0 0 48 38 17:30 0 0 241 121 05:45 0 0 0 0 47 170 52 158 328 17:45 0 0 0 0 259 958 95 484 1442
06:00 0 0 62 50 18:00 0 0 214 91 06:15 0 0 50 53 18:15 0 0 209 93 06:30 0 0 69 75 18:30 0 0 190 97 06:45 0 0 0 0 62 243 83 261 503 18:45 0 0 0 0 170 783 94 374 1156
07:00 0 0 60 93 19:00 0 0 155 102 07:15 0 0 122 214 19:15 0 0 128 97 07:30 0 0 211 242 19:30 0 0 125 73 07:45 0 0 0 0 174 567 226 774 1341 19:45 0 0 0 0 113 521 57 328 849
08:00 0 0 161 204 20:00 0 0 106 57 08:15 0 0 141 170 20:15 0 0 85 48 08:30 0 0 145 214 20:30 0 0 63 42 08:45 0 0 0 0 146 592 210 798 1390 20:45 0 0 0 0 63 317 36 182 498
09:00 0 0 164 230 21:00 0 0 58 31 09:15 0 0 154 229 21:15 0 0 54 27 09:30 0 0 151 247 21:30 0 0 41 23 09:45 0 0 0 0 142 611 251 957 1567 21:45 0 0 0 0 42 195 18 98 293
10:00 0 0 146 241 22:00 0 0 35 17 10:15 0 0 132 238 22:15 0 0 25 15 10:30 0 0 129 228 22:30 0 0 19 11 10:45 0 0 0 0 125 531 213 919 1450 22:45 0 0 0 0 15 93 10 51 144
11:00 0 0 148 229 23:00 0 0 10 11 11:15 0 0 187 222 23:15 0 0 15 11 11:30 0 0 193 236 23:30 0 0 15 11 11:45 0 0 0 0 178 705 203 890 1595 23:45 0 0 0 0 13 53 10 42 94
Total Vol. 3574 4964 8538 7494 5681 13174
NB SB Combined
11067 10645 21712
Split % 41.9% 58.1% 39.3% 56.9% 43.1% 60.7%
Peak Hour 11:45 09:30 11:45 13:30 12:45 13:00
Volume 760 977 1626 1017 979 1933P.H.F. 0.94 0.97 0.93 0.93 0.91 0.93
Daily Totals
2-DAY AVERAGE
AM PM
14-1256-007Project#Tuesday, August 19, 2014Wednesday, August 20, 2014

0 1 2 N
0
1130
1799
AM MD PM TOTAL
TOTAL AM MD PM
0 0 846 836 1682 2
1 0 0 0 0 0
0 0 0 0 0
MD
0 1 1
AM 700AM -
NOON -
PM 400PM -
AM PEAK HOUR
NOON PEAK HOUR
PM PEAK HOUR
0
400 PM
08/21/2014
715 AM
900AM
Date
600PM
TMC SUMMARY OF Hwy 1 & Carmel Valley Rd.
Carmel Valley Rd.
APPR
OAC
H L
ANES
0
APPRO
ACH LAN
ES
APPROACH LANES
0
0
AM
8020 611
TOTA
L
519
Hw
y 1
0
APPROACH LANES
302
9900
1018
168
PMAM
997
716
69
0
TOTA
LM
D
0
Project #: 14-1256-001
0
Hw
y 1
Carmel Valley Rd.
0
MD
PM
THURSDAYDay
Hwy 1 & Carmel Valley Rd.
14-1256-001
CONTROL
Signalized
(Intersection Name)
TURNING MOVEMENT COUNT
LOCATION #:

0 0 0 N
0 0 0
AM MD PM TOTAL
TOTAL AM MD PM
0 0 0 0 0 0
1 1534 869 570 1439 1
1 39 9 48 1
MD
0 1 1
AM 700AM -
NOON -
PM 400PM -
AM PEAK HOUR
NOON PEAK HOUR
PM PEAK HOUR
0
430 PM
08/21/2014
715 AM
900AM
Date
600PM
TMC SUMMARY OF Rancho San Carlos Rd. & Carmel Valley Rd.
Carmel Valley Rd.
APPR
OAC
H L
ANES
140
APPRO
ACH LAN
ES
APPROACH LANES
0
593
AM
00 0
TOTA
L
0
Ran
cho
San
Car
los
Rd
121
APPROACH LANES
0 148123
2 0 48
PMAM
0
0 34
0
TOTA
LM
D
151
Project #: 14-1256-006
261
Ran
cho
San
Car
los
Rd.
Carmel Valley Rd.
941
MD
PM
THURSDAYDay
Rancho San Carlos Rd. & Carmel Valley Rd.
14-1256-006
CONTROL
Signalized
(Intersection Name)
TURNING MOVEMENT COUNT
LOCATION #:

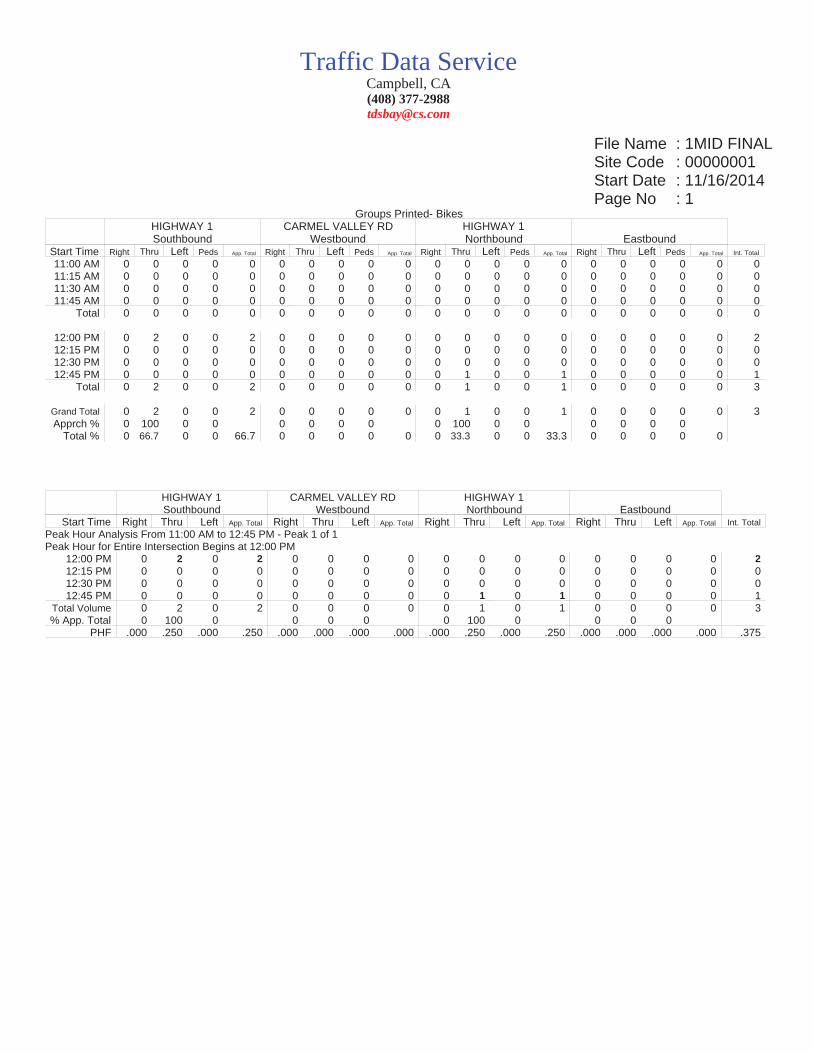
File Name : 1MID FINALSite Code : 00000001Start Date : 11/16/2014Page No : 1
Groups Printed- VehiclesHIGHWAY 1Southbound
CARMEL VALLEY RDWestbound
HIGHWAY 1Northbound Eastbound
Start Time Right Thru Left Peds App. Total Right Thru Left Peds App. Total Right Thru Left Peds App. Total Right Thru Left Peds App. Total Int. Total
11:00 AM 0 157 131 0 288 145 0 0 0 145 13 147 0 0 160 0 0 0 0 0 59311:15 AM 0 164 152 0 316 121 0 0 0 121 13 139 0 0 152 0 0 0 0 0 58911:30 AM 0 168 150 0 318 164 0 0 0 164 10 132 0 0 142 0 0 0 0 0 62411:45 AM 0 180 143 0 323 163 0 0 0 163 24 168 0 0 192 0 0 0 0 0 678
Total 0 669 576 0 1245 593 0 0 0 593 60 586 0 0 646 0 0 0 0 0 2484
12:00 PM 0 150 126 0 276 144 0 0 0 144 16 159 0 0 175 0 0 0 0 0 59512:15 PM 0 165 163 0 328 168 0 0 0 168 20 147 0 0 167 0 0 0 0 0 66312:30 PM 0 155 152 0 307 173 0 0 0 173 18 158 0 0 176 0 0 0 0 0 65612:45 PM 0 143 191 0 334 164 0 0 0 164 19 170 0 0 189 0 0 0 0 0 687
Total 0 613 632 0 1245 649 0 0 0 649 73 634 0 0 707 0 0 0 0 0 2601
Grand Total 0 1282 1208 0 2490 1242 0 0 0 1242 133 1220 0 0 1353 0 0 0 0 0 5085Apprch % 0 51.5 48.5 0 100 0 0 0 9.8 90.2 0 0 0 0 0 0
Total % 0 25.2 23.8 0 49 24.4 0 0 0 24.4 2.6 24 0 0 26.6 0 0 0 0 0
HIGHWAY 1Southbound
CARMEL VALLEY RDWestbound
HIGHWAY 1Northbound Eastbound
Start Time Right Thru Left App. Total Right Thru Left App. Total Right Thru Left App. Total Right Thru Left App. Total Int. Total
Peak Hour Analysis From 11:00 AM to 12:45 PM - Peak 1 of 1Peak Hour for Entire Intersection Begins at 12:00 PM
12:00 PM 0 150 126 276 144 0 0 144 16 159 0 175 0 0 0 0 59512:15 PM 0 165 163 328 168 0 0 168 20 147 0 167 0 0 0 0 66312:30 PM 0 155 152 307 173 0 0 173 18 158 0 176 0 0 0 0 65612:45 PM 0 143 191 334 164 0 0 164 19 170 0 189 0 0 0 0 687
Total Volume 0 613 632 1245 649 0 0 649 73 634 0 707 0 0 0 0 2601% App. Total 0 49.2 50.8 100 0 0 10.3 89.7 0 0 0 0
PHF .000 .929 .827 .932 .938 .000 .000 .938 .913 .932 .000 .935 .000 .000 .000 .000 .947
Traffic Data ServiceCampbell, CA(408) [email protected]

File Name : 1MID FINALSite Code : 00000001Start Date : 11/16/2014Page No : 2
HIGHWAY 1
CA
RM
EL V
ALLE
Y R
D
HIGHWAY 1
Right0
Thru613
Left632
InOut Total1283 1245 2528
Right649
Thru 0
Left 0
Out
Total
In705
6491354
Left0
Thru634
Right73
Out TotalIn613 707 1320
Left0
Thr
u0R
ight0
Tot
alO
utIn
00
0
Peak Hour Begins at 12:00 PM
Vehicles
Peak Hour Data
North
Traffic Data ServiceCampbell, CA(408) [email protected]
File Name : 1MID FINALSite Code : 00000001Start Date : 11/16/2014Page No : 1
Groups Printed- BikesHIGHWAY 1Southbound
CARMEL VALLEY RDWestbound
HIGHWAY 1Northbound Eastbound
Start Time Right Thru Left Peds App. Total Right Thru Left Peds App. Total Right Thru Left Peds App. Total Right Thru Left Peds App. Total Int. Total
11:00 AM 0 0 0 0 0 0 0 0 0 0 0 0 0 0 0 0 0 0 0 0 011:15 AM 0 0 0 0 0 0 0 0 0 0 0 0 0 0 0 0 0 0 0 0 011:30 AM 0 0 0 0 0 0 0 0 0 0 0 0 0 0 0 0 0 0 0 0 011:45 AM 0 0 0 0 0 0 0 0 0 0 0 0 0 0 0 0 0 0 0 0 0
Total 0 0 0 0 0 0 0 0 0 0 0 0 0 0 0 0 0 0 0 0 0
12:00 PM 0 2 0 0 2 0 0 0 0 0 0 0 0 0 0 0 0 0 0 0 212:15 PM 0 0 0 0 0 0 0 0 0 0 0 0 0 0 0 0 0 0 0 0 012:30 PM 0 0 0 0 0 0 0 0 0 0 0 0 0 0 0 0 0 0 0 0 012:45 PM 0 0 0 0 0 0 0 0 0 0 0 1 0 0 1 0 0 0 0 0 1
Total 0 2 0 0 2 0 0 0 0 0 0 1 0 0 1 0 0 0 0 0 3
Grand Total 0 2 0 0 2 0 0 0 0 0 0 1 0 0 1 0 0 0 0 0 3Apprch % 0 100 0 0 0 0 0 0 0 100 0 0 0 0 0 0
Total % 0 66.7 0 0 66.7 0 0 0 0 0 0 33.3 0 0 33.3 0 0 0 0 0
HIGHWAY 1Southbound
CARMEL VALLEY RDWestbound
HIGHWAY 1Northbound Eastbound
Start Time Right Thru Left App. Total Right Thru Left App. Total Right Thru Left App. Total Right Thru Left App. Total Int. Total
Peak Hour Analysis From 11:00 AM to 12:45 PM - Peak 1 of 1Peak Hour for Entire Intersection Begins at 12:00 PM
12:00 PM 0 2 0 2 0 0 0 0 0 0 0 0 0 0 0 0 212:15 PM 0 0 0 0 0 0 0 0 0 0 0 0 0 0 0 0 012:30 PM 0 0 0 0 0 0 0 0 0 0 0 0 0 0 0 0 012:45 PM 0 0 0 0 0 0 0 0 0 1 0 1 0 0 0 0 1
Total Volume 0 2 0 2 0 0 0 0 0 1 0 1 0 0 0 0 3% App. Total 0 100 0 0 0 0 0 100 0 0 0 0
PHF .000 .250 .000 .250 .000 .000 .000 .000 .000 .250 .000 .250 .000 .000 .000 .000 .375
Traffic Data ServiceCampbell, CA(408) [email protected]

File Name : 1MID FINALSite Code : 00000001Start Date : 11/16/2014Page No : 2
HIGHWAY 1
CA
RM
EL V
ALLE
Y R
D
HIGHWAY 1
Right0
Thru2
Left0
InOut Total1 2 3
Right 0
Thru 0
Left 0
Out
Total
In0
00
Left0
Thru1
Right0
Out TotalIn2 1 3
Left0
Thr
u0R
ight0
Tot
alO
utIn
00
0
Peak Hour Begins at 12:00 PM
Bikes
Peak Hour Data
North
Traffic Data ServiceCampbell, CA(408) [email protected]
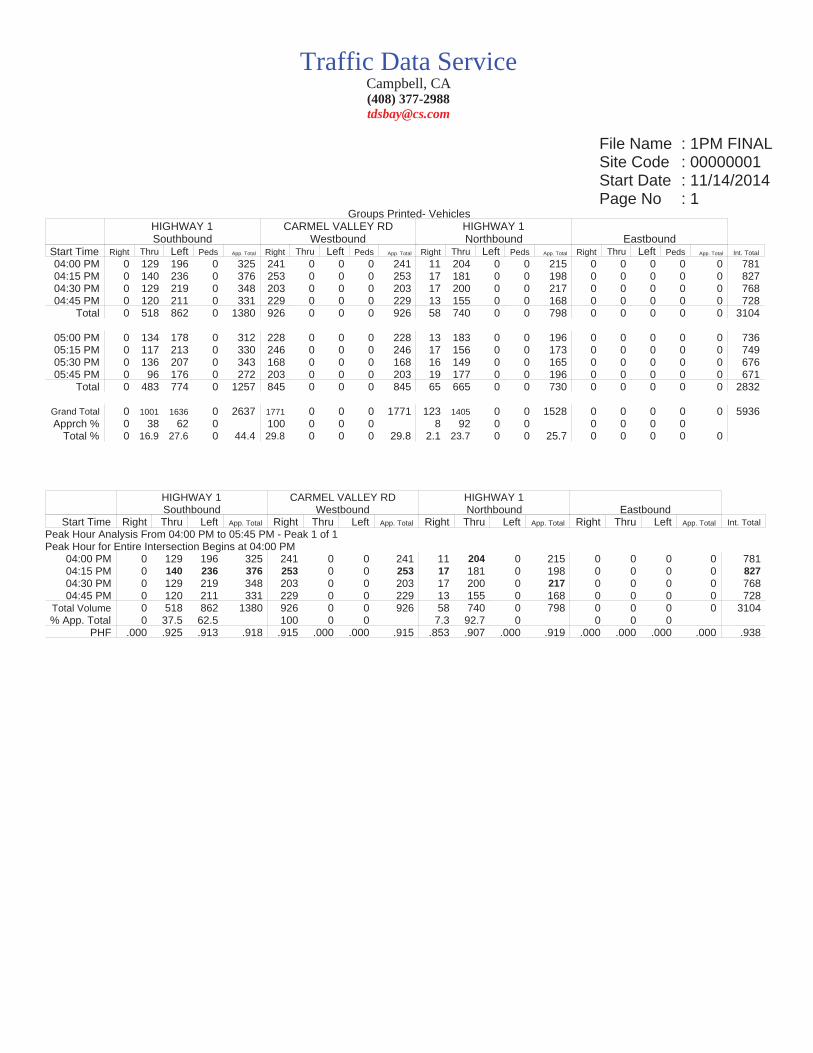
File Name : 1PM FINALSite Code : 00000001Start Date : 11/14/2014Page No : 1
Groups Printed- VehiclesHIGHWAY 1Southbound
CARMEL VALLEY RDWestbound
HIGHWAY 1Northbound Eastbound
Start Time Right Thru Left Peds App. Total Right Thru Left Peds App. Total Right Thru Left Peds App. Total Right Thru Left Peds App. Total Int. Total
04:00 PM 0 129 196 0 325 241 0 0 0 241 11 204 0 0 215 0 0 0 0 0 78104:15 PM 0 140 236 0 376 253 0 0 0 253 17 181 0 0 198 0 0 0 0 0 82704:30 PM 0 129 219 0 348 203 0 0 0 203 17 200 0 0 217 0 0 0 0 0 76804:45 PM 0 120 211 0 331 229 0 0 0 229 13 155 0 0 168 0 0 0 0 0 728
Total 0 518 862 0 1380 926 0 0 0 926 58 740 0 0 798 0 0 0 0 0 3104
05:00 PM 0 134 178 0 312 228 0 0 0 228 13 183 0 0 196 0 0 0 0 0 73605:15 PM 0 117 213 0 330 246 0 0 0 246 17 156 0 0 173 0 0 0 0 0 74905:30 PM 0 136 207 0 343 168 0 0 0 168 16 149 0 0 165 0 0 0 0 0 67605:45 PM 0 96 176 0 272 203 0 0 0 203 19 177 0 0 196 0 0 0 0 0 671
Total 0 483 774 0 1257 845 0 0 0 845 65 665 0 0 730 0 0 0 0 0 2832
Grand Total 0 1001 1636 0 2637 1771 0 0 0 1771 123 1405 0 0 1528 0 0 0 0 0 5936Apprch % 0 38 62 0 100 0 0 0 8 92 0 0 0 0 0 0
Total % 0 16.9 27.6 0 44.4 29.8 0 0 0 29.8 2.1 23.7 0 0 25.7 0 0 0 0 0
HIGHWAY 1Southbound
CARMEL VALLEY RDWestbound
HIGHWAY 1Northbound Eastbound
Start Time Right Thru Left App. Total Right Thru Left App. Total Right Thru Left App. Total Right Thru Left App. Total Int. Total
Peak Hour Analysis From 04:00 PM to 05:45 PM - Peak 1 of 1Peak Hour for Entire Intersection Begins at 04:00 PM
04:00 PM 0 129 196 325 241 0 0 241 11 204 0 215 0 0 0 0 78104:15 PM 0 140 236 376 253 0 0 253 17 181 0 198 0 0 0 0 82704:30 PM 0 129 219 348 203 0 0 203 17 200 0 217 0 0 0 0 76804:45 PM 0 120 211 331 229 0 0 229 13 155 0 168 0 0 0 0 728
Total Volume 0 518 862 1380 926 0 0 926 58 740 0 798 0 0 0 0 3104% App. Total 0 37.5 62.5 100 0 0 7.3 92.7 0 0 0 0
PHF .000 .925 .913 .918 .915 .000 .000 .915 .853 .907 .000 .919 .000 .000 .000 .000 .938
Traffic Data ServiceCampbell, CA(408) [email protected]

File Name : 1PM FINALSite Code : 00000001Start Date : 11/14/2014Page No : 2
HIGHWAY 1
CA
RM
EL V
ALLE
Y R
D
HIGHWAY 1
Right0
Thru518
Left862
InOut Total1666 1380 3046
Right926
Thru 0
Left 0
Out
Total
In920
9261846
Left0
Thru740
Right58
Out TotalIn518 798 1316
Left0
Thr
u0R
ight0
Tot
alO
utIn
00
0
Peak Hour Begins at 04:00 PM
Vehicles
Peak Hour Data
North
Traffic Data ServiceCampbell, CA(408) [email protected]

File Name : 1PM FINALSite Code : 00000001Start Date : 11/14/2014Page No : 1
Groups Printed- BikesHIGHWAY 1Southbound
CARMEL VALLEY RDWestbound
HIGHWAY 1Northbound Eastbound
Start Time Right Thru Left Peds App. Total Right Thru Left Peds App. Total Right Thru Left Peds App. Total Right Thru Left Peds App. Total Int. Total
04:00 PM 0 0 0 0 0 0 0 0 0 0 0 1 0 0 1 0 0 0 0 0 104:15 PM 0 0 0 0 0 0 0 0 0 0 0 0 0 0 0 0 0 0 0 0 004:30 PM 0 0 0 0 0 0 0 0 0 0 0 0 0 0 0 0 0 0 0 0 004:45 PM 0 0 0 0 0 0 0 0 0 0 0 0 0 0 0 0 0 0 0 0 0
Total 0 0 0 0 0 0 0 0 0 0 0 1 0 0 1 0 0 0 0 0 1
05:00 PM 0 1 0 0 1 0 0 0 0 0 0 0 0 0 0 0 0 0 0 0 105:15 PM 0 3 0 0 3 0 0 0 0 0 0 0 0 0 0 0 0 0 0 0 305:30 PM 0 0 0 0 0 0 0 0 0 0 0 0 0 0 0 0 0 0 0 0 005:45 PM 0 1 0 0 1 0 0 0 0 0 0 0 0 0 0 0 0 0 0 0 1
Total 0 5 0 0 5 0 0 0 0 0 0 0 0 0 0 0 0 0 0 0 5
Grand Total 0 5 0 0 5 0 0 0 0 0 0 1 0 0 1 0 0 0 0 0 6Apprch % 0 100 0 0 0 0 0 0 0 100 0 0 0 0 0 0
Total % 0 83.3 0 0 83.3 0 0 0 0 0 0 16.7 0 0 16.7 0 0 0 0 0
HIGHWAY 1Southbound
CARMEL VALLEY RDWestbound
HIGHWAY 1Northbound Eastbound
Start Time Right Thru Left App. Total Right Thru Left App. Total Right Thru Left App. Total Right Thru Left App. Total Int. Total
Peak Hour Analysis From 04:00 PM to 05:45 PM - Peak 1 of 1Peak Hour for Entire Intersection Begins at 05:00 PM
05:00 PM 0 1 0 1 0 0 0 0 0 0 0 0 0 0 0 0 105:15 PM 0 3 0 3 0 0 0 0 0 0 0 0 0 0 0 0 305:30 PM 0 0 0 0 0 0 0 0 0 0 0 0 0 0 0 0 005:45 PM 0 1 0 1 0 0 0 0 0 0 0 0 0 0 0 0 1
Total Volume 0 5 0 5 0 0 0 0 0 0 0 0 0 0 0 0 5% App. Total 0 100 0 0 0 0 0 0 0 0 0 0
PHF .000 .417 .000 .417 .000 .000 .000 .000 .000 .000 .000 .000 .000 .000 .000 .000 .417
Traffic Data ServiceCampbell, CA(408) [email protected]

File Name : 1PM FINALSite Code : 00000001Start Date : 11/14/2014Page No : 2
HIGHWAY 1
CA
RM
EL V
ALLE
Y R
D
HIGHWAY 1
Right0
Thru5
Left0
InOut Total0 5 5
Right 0
Thru 0
Left 0
Out
Total
In0
00
Left0
Thru0
Right0
Out TotalIn5 0 5
Left0
Thr
u0R
ight0
Tot
alO
utIn
00
0
Peak Hour Begins at 05:00 PM
Bikes
Peak Hour Data
North
Traffic Data ServiceCampbell, CA(408) [email protected]
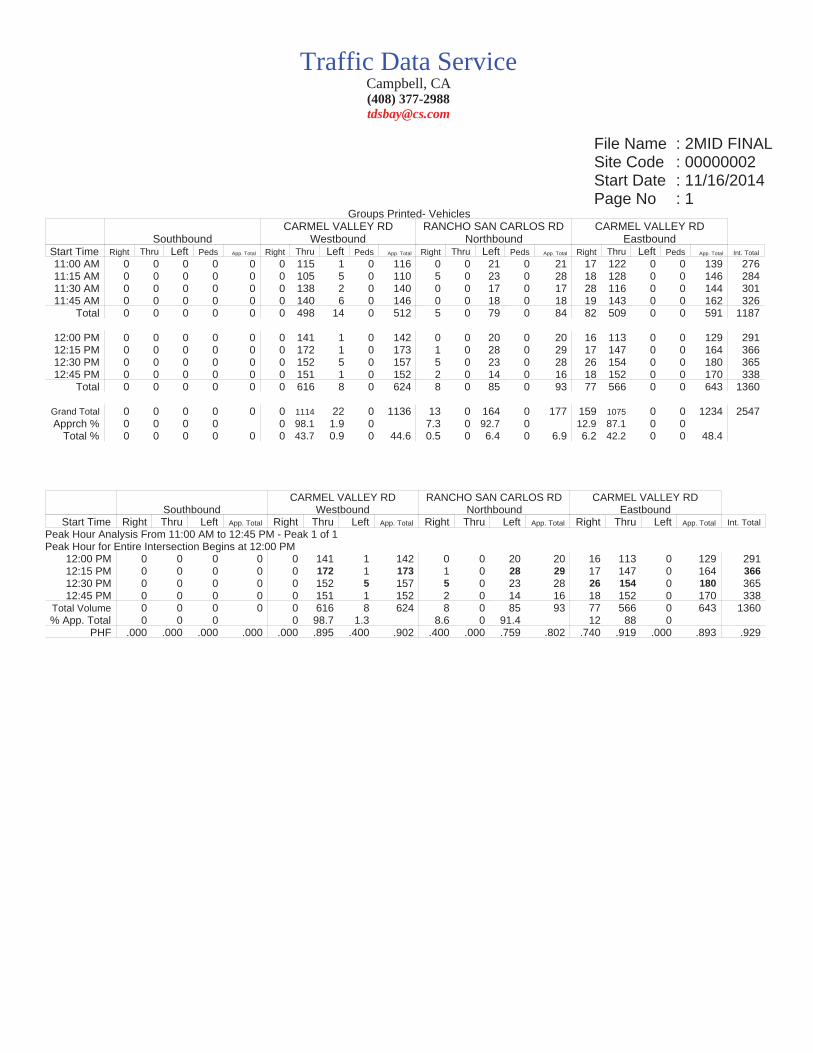
File Name : 2MID FINALSite Code : 00000002Start Date : 11/16/2014Page No : 1
Groups Printed- Vehicles
SouthboundCARMEL VALLEY RD
WestboundRANCHO SAN CARLOS RD
NorthboundCARMEL VALLEY RD
EastboundStart Time Right Thru Left Peds App. Total Right Thru Left Peds App. Total Right Thru Left Peds App. Total Right Thru Left Peds App. Total Int. Total
11:00 AM 0 0 0 0 0 0 115 1 0 116 0 0 21 0 21 17 122 0 0 139 27611:15 AM 0 0 0 0 0 0 105 5 0 110 5 0 23 0 28 18 128 0 0 146 28411:30 AM 0 0 0 0 0 0 138 2 0 140 0 0 17 0 17 28 116 0 0 144 30111:45 AM 0 0 0 0 0 0 140 6 0 146 0 0 18 0 18 19 143 0 0 162 326
Total 0 0 0 0 0 0 498 14 0 512 5 0 79 0 84 82 509 0 0 591 1187
12:00 PM 0 0 0 0 0 0 141 1 0 142 0 0 20 0 20 16 113 0 0 129 29112:15 PM 0 0 0 0 0 0 172 1 0 173 1 0 28 0 29 17 147 0 0 164 36612:30 PM 0 0 0 0 0 0 152 5 0 157 5 0 23 0 28 26 154 0 0 180 36512:45 PM 0 0 0 0 0 0 151 1 0 152 2 0 14 0 16 18 152 0 0 170 338
Total 0 0 0 0 0 0 616 8 0 624 8 0 85 0 93 77 566 0 0 643 1360
Grand Total 0 0 0 0 0 0 1114 22 0 1136 13 0 164 0 177 159 1075 0 0 1234 2547Apprch % 0 0 0 0 0 98.1 1.9 0 7.3 0 92.7 0 12.9 87.1 0 0
Total % 0 0 0 0 0 0 43.7 0.9 0 44.6 0.5 0 6.4 0 6.9 6.2 42.2 0 0 48.4
SouthboundCARMEL VALLEY RD
WestboundRANCHO SAN CARLOS RD
NorthboundCARMEL VALLEY RD
EastboundStart Time Right Thru Left App. Total Right Thru Left App. Total Right Thru Left App. Total Right Thru Left App. Total Int. Total
Peak Hour Analysis From 11:00 AM to 12:45 PM - Peak 1 of 1Peak Hour for Entire Intersection Begins at 12:00 PM
12:00 PM 0 0 0 0 0 141 1 142 0 0 20 20 16 113 0 129 29112:15 PM 0 0 0 0 0 172 1 173 1 0 28 29 17 147 0 164 36612:30 PM 0 0 0 0 0 152 5 157 5 0 23 28 26 154 0 180 36512:45 PM 0 0 0 0 0 151 1 152 2 0 14 16 18 152 0 170 338
Total Volume 0 0 0 0 0 616 8 624 8 0 85 93 77 566 0 643 1360% App. Total 0 0 0 0 98.7 1.3 8.6 0 91.4 12 88 0
PHF .000 .000 .000 .000 .000 .895 .400 .902 .400 .000 .759 .802 .740 .919 .000 .893 .929
Traffic Data ServiceCampbell, CA(408) [email protected]

File Name : 2MID FINALSite Code : 00000002Start Date : 11/16/2014Page No : 2
CA
RM
EL
VA
LLE
Y R
D C
AR
ME
L VA
LLEY
RD
RANCHO SAN CARLOS RD
Right0
Thru0
Left0
InOut Total0 0 0
Right 0
Thru616
Left 8
Out
Total
In574
6241198
Left85
Thru0
Right8
Out TotalIn85 93 178
Left0
Thr
u56
6R
ight77
Tot
alO
utIn
701
643
1344
Peak Hour Begins at 12:00 PM
Vehicles
Peak Hour Data
North
Traffic Data ServiceCampbell, CA(408) [email protected]

File Name : 2MID FINALSite Code : 00000002Start Date : 11/16/2014Page No : 1
Groups Printed- Bikes
SouthboundCARMEL VALLEY RD
WestboundRANCHO SAN CARLOS RD
NorthboundCARMEL VALLEY RD
EastboundStart Time Right Thru Left Peds App. Total Right Thru Left Peds App. Total Right Thru Left Peds App. Total Right Thru Left Peds App. Total Int. Total
11:00 AM 0 0 0 0 0 0 0 0 0 0 0 0 0 0 0 0 0 0 0 0 011:15 AM 0 0 0 0 0 0 0 0 0 0 0 0 5 0 5 2 0 0 0 2 711:30 AM 0 0 0 0 0 0 1 0 0 1 0 0 0 0 0 1 1 0 0 2 311:45 AM 0 0 0 0 0 0 1 0 0 1 0 0 1 0 1 0 1 0 0 1 3
Total 0 0 0 0 0 0 2 0 0 2 0 0 6 0 6 3 2 0 0 5 13
12:00 PM 0 0 0 0 0 0 0 0 0 0 0 0 0 0 0 0 0 0 0 0 012:15 PM 0 0 0 0 0 0 0 0 0 0 0 0 0 0 0 0 1 0 0 1 112:30 PM 0 0 0 0 0 0 0 0 0 0 0 0 0 0 0 0 0 0 0 0 012:45 PM 0 0 0 0 0 0 1 0 0 1 0 0 0 0 0 0 1 0 0 1 2
Total 0 0 0 0 0 0 1 0 0 1 0 0 0 0 0 0 2 0 0 2 3
Grand Total 0 0 0 0 0 0 3 0 0 3 0 0 6 0 6 3 4 0 0 7 16Apprch % 0 0 0 0 0 100 0 0 0 0 100 0 42.9 57.1 0 0
Total % 0 0 0 0 0 0 18.8 0 0 18.8 0 0 37.5 0 37.5 18.8 25 0 0 43.8
SouthboundCARMEL VALLEY RD
WestboundRANCHO SAN CARLOS RD
NorthboundCARMEL VALLEY RD
EastboundStart Time Right Thru Left App. Total Right Thru Left App. Total Right Thru Left App. Total Right Thru Left App. Total Int. Total
Peak Hour Analysis From 11:00 AM to 12:45 PM - Peak 1 of 1Peak Hour for Entire Intersection Begins at 11:00 AM
11:00 AM 0 0 0 0 0 0 0 0 0 0 0 0 0 0 0 0 011:15 AM 0 0 0 0 0 0 0 0 0 0 5 5 2 0 0 2 711:30 AM 0 0 0 0 0 1 0 1 0 0 0 0 1 1 0 2 311:45 AM 0 0 0 0 0 1 0 1 0 0 1 1 0 1 0 1 3
Total Volume 0 0 0 0 0 2 0 2 0 0 6 6 3 2 0 5 13% App. Total 0 0 0 0 100 0 0 0 100 60 40 0
PHF .000 .000 .000 .000 .000 .500 .000 .500 .000 .000 .300 .300 .375 .500 .000 .625 .464
Traffic Data ServiceCampbell, CA(408) [email protected]

File Name : 2MID FINALSite Code : 00000002Start Date : 11/16/2014Page No : 2
CA
RM
EL
VA
LLE
Y R
D C
AR
ME
L VA
LLEY
RD
RANCHO SAN CARLOS RD
Right0
Thru0
Left0
InOut Total0 0 0
Right 0
Thru 2
Left 0
Out
Total
In2
24
Left6
Thru0
Right0
Out TotalIn3 6 9
Left0
Thr
u2R
ight3
Tot
alO
utIn
85
13
Peak Hour Begins at 11:00 AM
Bikes
Peak Hour Data
North
Traffic Data ServiceCampbell, CA(408) [email protected]

File Name : 2PM FINALSite Code : 00000002Start Date : 11/14/2014Page No : 1
Groups Printed- Vehicles
SouthboundCARMEL VALLEY RD
WestboundRANCHO SAN CARLOS RD
NorthboundCARMEL VALLEY RD
EastboundStart Time Right Thru Left Peds App. Total Right Thru Left Peds App. Total Right Thru Left Peds App. Total Right Thru Left Peds App. Total Int. Total
04:00 PM 0 0 0 0 0 0 159 2 0 161 13 0 46 0 59 25 220 0 0 245 46504:15 PM 0 0 0 0 0 0 143 6 0 149 9 0 55 0 64 29 210 0 0 239 45204:30 PM 0 0 0 0 0 0 150 5 0 155 11 0 38 0 49 28 208 0 0 236 44004:45 PM 0 0 0 0 0 0 135 3 0 138 10 0 34 0 44 25 233 0 0 258 440
Total 0 0 0 0 0 0 587 16 0 603 43 0 173 0 216 107 871 0 0 978 1797
05:00 PM 0 0 0 0 0 0 142 5 0 147 5 0 39 0 44 35 203 0 0 238 42905:15 PM 0 0 0 0 0 0 129 5 0 134 6 0 33 0 39 24 231 0 0 255 42805:30 PM 0 0 0 0 0 0 121 2 0 123 5 0 25 0 30 33 195 0 0 228 38105:45 PM 0 0 0 0 0 0 124 6 0 130 7 0 25 0 32 23 173 0 0 196 358
Total 0 0 0 0 0 0 516 18 0 534 23 0 122 0 145 115 802 0 0 917 1596
Grand Total 0 0 0 0 0 0 1103 34 0 1137 66 0 295 0 361 222 1673 0 0 1895 3393Apprch % 0 0 0 0 0 97 3 0 18.3 0 81.7 0 11.7 88.3 0 0
Total % 0 0 0 0 0 0 32.5 1 0 33.5 1.9 0 8.7 0 10.6 6.5 49.3 0 0 55.9
SouthboundCARMEL VALLEY RD
WestboundRANCHO SAN CARLOS RD
NorthboundCARMEL VALLEY RD
EastboundStart Time Right Thru Left App. Total Right Thru Left App. Total Right Thru Left App. Total Right Thru Left App. Total Int. Total
Peak Hour Analysis From 04:00 PM to 05:45 PM - Peak 1 of 1Peak Hour for Entire Intersection Begins at 04:00 PM
04:00 PM 0 0 0 0 0 159 2 161 13 0 46 59 25 220 0 245 46504:15 PM 0 0 0 0 0 143 6 149 9 0 55 64 29 210 0 239 45204:30 PM 0 0 0 0 0 150 5 155 11 0 38 49 28 208 0 236 44004:45 PM 0 0 0 0 0 135 3 138 10 0 34 44 25 233 0 258 440
Total Volume 0 0 0 0 0 587 16 603 43 0 173 216 107 871 0 978 1797% App. Total 0 0 0 0 97.3 2.7 19.9 0 80.1 10.9 89.1 0
PHF .000 .000 .000 .000 .000 .923 .667 .936 .827 .000 .786 .844 .922 .935 .000 .948 .966
Traffic Data ServiceCampbell, CA(408) [email protected]

File Name : 2PM FINALSite Code : 00000002Start Date : 11/14/2014Page No : 2
CA
RM
EL
VA
LLE
Y R
D C
AR
ME
L VA
LLEY
RD
RANCHO SAN CARLOS RD
Right0
Thru0
Left0
InOut Total0 0 0
Right 0
Thru587
Left 16
Out
Total
In914
6031517
Left173
Thru0
Right43
Out TotalIn123 216 339
Left0
Thr
u87
1R
ight
107
Tot
alO
utIn
760
978
1738
Peak Hour Begins at 04:00 PM
Vehicles
Peak Hour Data
North
Traffic Data ServiceCampbell, CA(408) [email protected]

File Name : 2PM FINALSite Code : 00000002Start Date : 11/14/2014Page No : 1
Groups Printed- Bikes
SouthboundCARMEL VALLEY RD
WestboundRANCHO SAN CARLOS RD
NorthboundCARMEL VALLEY RD
EastboundStart Time Right Thru Left Peds App. Total Right Thru Left Peds App. Total Right Thru Left Peds App. Total Right Thru Left Peds App. Total Int. Total
04:00 PM 0 0 0 0 0 0 0 0 0 0 0 0 0 0 0 0 0 0 0 0 004:15 PM 0 0 0 0 0 0 0 0 0 0 0 0 0 0 0 0 0 0 0 0 004:30 PM 0 0 0 0 0 0 0 0 0 0 0 0 0 0 0 0 0 0 0 0 004:45 PM 0 0 0 0 0 0 0 0 0 0 0 0 0 0 0 0 0 0 0 0 0
Total 0 0 0 0 0 0 0 0 0 0 0 0 0 0 0 0 0 0 0 0 0
05:00 PM 0 0 0 0 0 0 0 0 0 0 0 0 0 0 0 0 0 0 0 0 005:15 PM 0 0 0 0 0 0 0 0 0 0 0 0 0 0 0 0 0 0 0 0 005:30 PM 0 0 0 0 0 0 0 0 0 0 0 0 0 0 0 0 0 0 0 0 005:45 PM 0 0 0 0 0 0 0 0 0 0 0 0 0 0 0 0 0 0 0 0 0
Total 0 0 0 0 0 0 0 0 0 0 0 0 0 0 0 0 0 0 0 0 0
Grand Total 0 0 0 0 0 0 0 0 0 0 0 0 0 0 0 0 0 0 0 0 0Apprch % 0 0 0 0 0 0 0 0 0 0 0 0 0 0 0 0
Total %
SouthboundCARMEL VALLEY RD
WestboundRANCHO SAN CARLOS RD
NorthboundCARMEL VALLEY RD
EastboundStart Time Right Thru Left App. Total Right Thru Left App. Total Right Thru Left App. Total Right Thru Left App. Total Int. Total
Peak Hour Analysis From 04:00 PM to 05:45 PM - Peak 1 of 1Peak Hour for Entire Intersection Begins at 04:00 PM
04:00 PM 0 0 0 0 0 0 0 0 0 0 0 0 0 0 0 0 004:15 PM 0 0 0 0 0 0 0 0 0 0 0 0 0 0 0 0 004:30 PM 0 0 0 0 0 0 0 0 0 0 0 0 0 0 0 0 004:45 PM 0 0 0 0 0 0 0 0 0 0 0 0 0 0 0 0 0
Total Volume 0 0 0 0 0 0 0 0 0 0 0 0 0 0 0 0 0% App. Total 0 0 0 0 0 0 0 0 0 0 0 0
PHF .000 .000 .000 .000 .000 .000 .000 .000 .000 .000 .000 .000 .000 .000 .000 .000 .000
Traffic Data ServiceCampbell, CA(408) [email protected]

File Name : 2PM FINALSite Code : 00000002Start Date : 11/14/2014Page No : 2
CA
RM
EL
VA
LLE
Y R
D C
AR
ME
L VA
LLEY
RD
RANCHO SAN CARLOS RD
Right0
Thru0
Left0
InOut Total0 0 0
Right 0
Thru 0
Left 0
Out
Total
In0
00
Left0
Thru0
Right0
Out TotalIn0 0 0
Left0
Thr
u0R
ight0
Tot
alO
utIn
00
0
Peak Hour Begins at 04:00 PM
Bikes
Peak Hour Data
North
Traffic Data ServiceCampbell, CA(408) [email protected]

File Name : 3MID FINALSite Code : 00000003Start Date : 11/16/2014Page No : 1
Groups Printed- VehiclesTEHAMA
SouthboundCARMEL VALLEY RD
WestboundVALLEY GREENS DR
NorthboundCARMEL VALLEY RD
EastboundStart Time Right Thru Left Peds App. Total Right Thru Left Peds App. Total Right Thru Left Peds App. Total Right Thru Left Peds App. Total Int. Total
11:00 AM 0 0 0 0 0 2 105 3 0 110 2 0 1 0 3 6 115 1 0 122 23511:15 AM 0 0 0 0 0 0 96 3 0 99 5 0 8 0 13 3 124 0 0 127 23911:30 AM 0 0 1 0 1 1 141 3 0 145 2 1 5 0 8 8 103 2 0 113 26711:45 AM 2 0 1 0 3 0 136 6 0 142 5 0 3 0 8 3 147 1 0 151 304
Total 2 0 2 0 4 3 478 15 0 496 14 1 17 0 32 20 489 4 0 513 1045
12:00 PM 1 0 0 0 1 0 128 6 0 134 6 0 4 0 10 4 109 0 0 113 25812:15 PM 0 0 0 0 0 1 175 11 0 187 9 0 5 0 14 3 131 0 0 134 33512:30 PM 4 0 0 0 4 2 137 2 0 141 6 0 6 0 12 7 146 3 0 156 31312:45 PM 0 0 1 0 1 0 146 2 0 148 5 0 3 0 8 6 165 1 0 172 329
Total 5 0 1 0 6 3 586 21 0 610 26 0 18 0 44 20 551 4 0 575 1235
Grand Total 7 0 3 0 10 6 1064 36 0 1106 40 1 35 0 76 40 1040 8 0 1088 2280Apprch % 70 0 30 0 0.5 96.2 3.3 0 52.6 1.3 46.1 0 3.7 95.6 0.7 0
Total % 0.3 0 0.1 0 0.4 0.3 46.7 1.6 0 48.5 1.8 0 1.5 0 3.3 1.8 45.6 0.4 0 47.7
TEHAMASouthbound
CARMEL VALLEY RDWestbound
VALLEY GREENS DRNorthbound
CARMEL VALLEY RDEastbound
Start Time Right Thru Left App. Total Right Thru Left App. Total Right Thru Left App. Total Right Thru Left App. Total Int. Total
Peak Hour Analysis From 11:00 AM to 12:45 PM - Peak 1 of 1Peak Hour for Entire Intersection Begins at 12:00 PM
12:00 PM 1 0 0 1 0 128 6 134 6 0 4 10 4 109 0 113 25812:15 PM 0 0 0 0 1 175 11 187 9 0 5 14 3 131 0 134 33512:30 PM 4 0 0 4 2 137 2 141 6 0 6 12 7 146 3 156 31312:45 PM 0 0 1 1 0 146 2 148 5 0 3 8 6 165 1 172 329
Total Volume 5 0 1 6 3 586 21 610 26 0 18 44 20 551 4 575 1235% App. Total 83.3 0 16.7 0.5 96.1 3.4 59.1 0 40.9 3.5 95.8 0.7
PHF .313 .000 .250 .375 .375 .837 .477 .816 .722 .000 .750 .786 .714 .835 .333 .836 .922
Traffic Data ServiceCampbell, CA(408) [email protected]

File Name : 3MID FINALSite Code : 00000003Start Date : 11/16/2014Page No : 2
TEHAMA
CA
RM
EL
VA
LLE
Y R
D C
AR
ME
L VA
LLEY
RD
VALLEY GREENS DR
Right5
Thru0
Left1
InOut Total7 6 13
Right 3
Thru586
Left 21
Out
Total
In578
6101188
Left18
Thru0
Right26
Out TotalIn41 44 85
Left4
Thr
u55
1R
ight20
Tot
alO
utIn
609
575
1184
Peak Hour Begins at 12:00 PM
Vehicles
Peak Hour Data
North
Traffic Data ServiceCampbell, CA(408) [email protected]
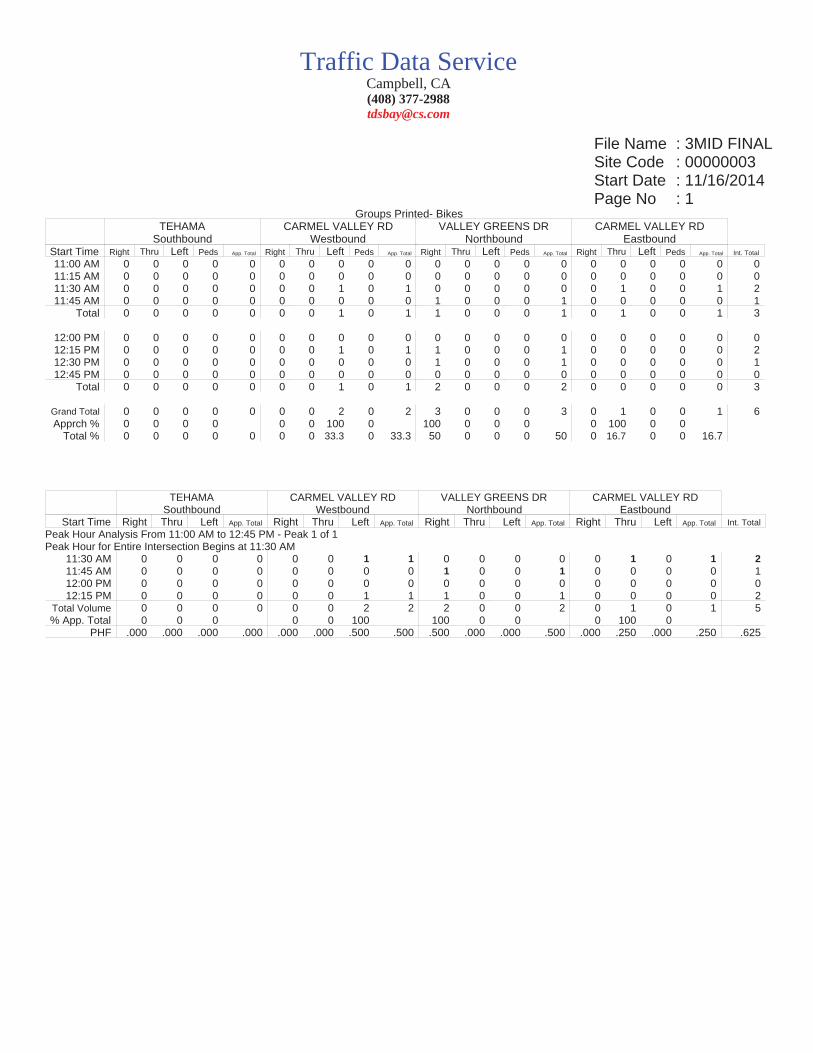
File Name : 3MID FINALSite Code : 00000003Start Date : 11/16/2014Page No : 1
Groups Printed- BikesTEHAMA
SouthboundCARMEL VALLEY RD
WestboundVALLEY GREENS DR
NorthboundCARMEL VALLEY RD
EastboundStart Time Right Thru Left Peds App. Total Right Thru Left Peds App. Total Right Thru Left Peds App. Total Right Thru Left Peds App. Total Int. Total
11:00 AM 0 0 0 0 0 0 0 0 0 0 0 0 0 0 0 0 0 0 0 0 011:15 AM 0 0 0 0 0 0 0 0 0 0 0 0 0 0 0 0 0 0 0 0 011:30 AM 0 0 0 0 0 0 0 1 0 1 0 0 0 0 0 0 1 0 0 1 211:45 AM 0 0 0 0 0 0 0 0 0 0 1 0 0 0 1 0 0 0 0 0 1
Total 0 0 0 0 0 0 0 1 0 1 1 0 0 0 1 0 1 0 0 1 3
12:00 PM 0 0 0 0 0 0 0 0 0 0 0 0 0 0 0 0 0 0 0 0 012:15 PM 0 0 0 0 0 0 0 1 0 1 1 0 0 0 1 0 0 0 0 0 212:30 PM 0 0 0 0 0 0 0 0 0 0 1 0 0 0 1 0 0 0 0 0 112:45 PM 0 0 0 0 0 0 0 0 0 0 0 0 0 0 0 0 0 0 0 0 0
Total 0 0 0 0 0 0 0 1 0 1 2 0 0 0 2 0 0 0 0 0 3
Grand Total 0 0 0 0 0 0 0 2 0 2 3 0 0 0 3 0 1 0 0 1 6Apprch % 0 0 0 0 0 0 100 0 100 0 0 0 0 100 0 0
Total % 0 0 0 0 0 0 0 33.3 0 33.3 50 0 0 0 50 0 16.7 0 0 16.7
TEHAMASouthbound
CARMEL VALLEY RDWestbound
VALLEY GREENS DRNorthbound
CARMEL VALLEY RDEastbound
Start Time Right Thru Left App. Total Right Thru Left App. Total Right Thru Left App. Total Right Thru Left App. Total Int. Total
Peak Hour Analysis From 11:00 AM to 12:45 PM - Peak 1 of 1Peak Hour for Entire Intersection Begins at 11:30 AM
11:30 AM 0 0 0 0 0 0 1 1 0 0 0 0 0 1 0 1 211:45 AM 0 0 0 0 0 0 0 0 1 0 0 1 0 0 0 0 112:00 PM 0 0 0 0 0 0 0 0 0 0 0 0 0 0 0 0 012:15 PM 0 0 0 0 0 0 1 1 1 0 0 1 0 0 0 0 2
Total Volume 0 0 0 0 0 0 2 2 2 0 0 2 0 1 0 1 5% App. Total 0 0 0 0 0 100 100 0 0 0 100 0
PHF .000 .000 .000 .000 .000 .000 .500 .500 .500 .000 .000 .500 .000 .250 .000 .250 .625
Traffic Data ServiceCampbell, CA(408) [email protected]
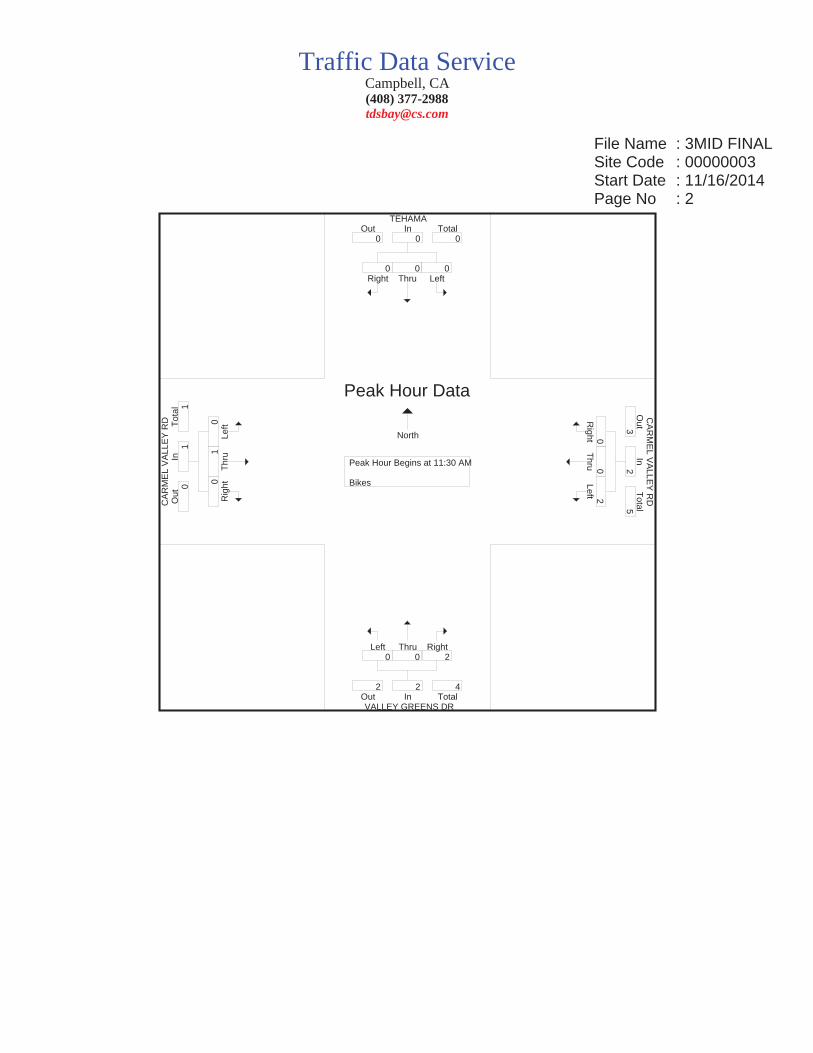
File Name : 3MID FINALSite Code : 00000003Start Date : 11/16/2014Page No : 2
TEHAMA
CA
RM
EL
VA
LLE
Y R
D C
AR
ME
L VA
LLEY
RD
VALLEY GREENS DR
Right0
Thru0
Left0
InOut Total0 0 0
Right 0
Thru 0
Left 2
Out
Total
In3
25
Left0
Thru0
Right2
Out TotalIn2 2 4
Left0
Thr
u1R
ight0
Tot
alO
utIn
01
1
Peak Hour Begins at 11:30 AM
Bikes
Peak Hour Data
North
Traffic Data ServiceCampbell, CA(408) [email protected]

File Name : 3PM FINALSite Code : 00000003Start Date : 11/14/2014Page No : 1
Groups Printed- VehiclesTEHAMA
SouthboundCARMEL VALLEY RD
WestboundVALLEY GREENS DR
NorthboundCARMEL VALLEY RD
EastboundStart Time Right Thru Left Peds App. Total Right Thru Left Peds App. Total Right Thru Left Peds App. Total Right Thru Left Peds App. Total Int. Total
04:00 PM 3 0 4 0 7 0 147 6 0 153 7 0 8 0 15 4 217 2 0 223 39804:15 PM 3 0 2 0 5 2 124 4 0 130 8 0 3 0 11 6 209 0 0 215 36104:30 PM 4 1 2 0 7 0 148 6 0 154 6 0 11 0 17 9 206 2 0 217 39504:45 PM 4 0 3 0 7 0 116 3 0 119 10 0 1 0 11 10 224 0 0 234 371
Total 14 1 11 0 26 2 535 19 0 556 31 0 23 0 54 29 856 4 0 889 1525
05:00 PM 4 1 3 0 8 3 138 7 0 148 4 1 11 0 16 7 193 0 0 200 37205:15 PM 1 0 1 0 2 0 122 4 0 126 5 0 3 0 8 6 223 1 0 230 36605:30 PM 1 0 0 0 1 0 119 4 0 123 9 1 12 0 22 7 182 1 0 190 33605:45 PM 0 0 1 0 1 1 107 6 0 114 8 0 5 0 13 11 179 1 0 191 319
Total 6 1 5 0 12 4 486 21 0 511 26 2 31 0 59 31 777 3 0 811 1393
Grand Total 20 2 16 0 38 6 1021 40 0 1067 57 2 54 0 113 60 1633 7 0 1700 2918Apprch % 52.6 5.3 42.1 0 0.6 95.7 3.7 0 50.4 1.8 47.8 0 3.5 96.1 0.4 0
Total % 0.7 0.1 0.5 0 1.3 0.2 35 1.4 0 36.6 2 0.1 1.9 0 3.9 2.1 56 0.2 0 58.3
TEHAMASouthbound
CARMEL VALLEY RDWestbound
VALLEY GREENS DRNorthbound
CARMEL VALLEY RDEastbound
Start Time Right Thru Left App. Total Right Thru Left App. Total Right Thru Left App. Total Right Thru Left App. Total Int. Total
Peak Hour Analysis From 04:00 PM to 05:45 PM - Peak 1 of 1Peak Hour for Entire Intersection Begins at 04:00 PM
04:00 PM 3 0 4 7 0 147 6 153 7 0 8 15 4 217 2 223 39804:15 PM 3 0 2 5 2 124 4 130 8 0 3 11 6 209 0 215 36104:30 PM 4 1 2 7 0 148 6 154 6 0 11 17 9 206 2 217 39504:45 PM 4 0 3 7 0 116 3 119 10 0 1 11 10 224 0 234 371
Total Volume 14 1 11 26 2 535 19 556 31 0 23 54 29 856 4 889 1525% App. Total 53.8 3.8 42.3 0.4 96.2 3.4 57.4 0 42.6 3.3 96.3 0.4
PHF .875 .250 .688 .929 .250 .904 .792 .903 .775 .000 .523 .794 .725 .955 .500 .950 .958
Traffic Data ServiceCampbell, CA(408) [email protected]

File Name : 3PM FINALSite Code : 00000003Start Date : 11/14/2014Page No : 2
TEHAMA
CA
RM
EL
VA
LLE
Y R
D C
AR
ME
L VA
LLEY
RD
VALLEY GREENS DR
Right14
Thru1
Left11
InOut Total6 26 32
Right 2
Thru535
Left 19
Out
Total
In898
5561454
Left23
Thru0
Right31
Out TotalIn49 54 103
Left4
Thr
u85
6R
ight29
Tot
alO
utIn
572
889
1461
Peak Hour Begins at 04:00 PM
Vehicles
Peak Hour Data
North
Traffic Data ServiceCampbell, CA(408) [email protected]

File Name : 3PM FINALSite Code : 00000003Start Date : 11/14/2014Page No : 1
Groups Printed- BikesTEHAMA
SouthboundCARMEL VALLEY RD
WestboundVALLEY GREENS DR
NorthboundCARMEL VALLEY RD
EastboundStart Time Right Thru Left Peds App. Total Right Thru Left Peds App. Total Right Thru Left Peds App. Total Right Thru Left Peds App. Total Int. Total
04:00 PM 0 0 0 0 0 0 0 0 0 0 0 0 0 0 0 0 0 0 0 0 004:15 PM 0 0 0 0 0 0 0 0 0 0 0 0 0 0 0 0 0 0 0 0 004:30 PM 0 0 0 0 0 0 0 0 0 0 0 0 0 0 0 0 0 0 0 0 004:45 PM 0 0 0 0 0 0 0 1 0 1 0 0 0 0 0 0 0 0 0 0 1
Total 0 0 0 0 0 0 0 1 0 1 0 0 0 0 0 0 0 0 0 0 1
05:00 PM 0 0 0 0 0 0 0 0 0 0 0 0 0 0 0 0 0 0 0 0 005:15 PM 0 0 0 0 0 0 0 0 0 0 0 0 0 0 0 0 0 0 0 0 005:30 PM 0 0 0 0 0 0 0 0 0 0 0 0 0 0 0 0 0 0 0 0 005:45 PM 0 0 0 0 0 0 0 0 0 0 0 0 0 0 0 0 0 0 0 0 0
Total 0 0 0 0 0 0 0 0 0 0 0 0 0 0 0 0 0 0 0 0 0
Grand Total 0 0 0 0 0 0 0 1 0 1 0 0 0 0 0 0 0 0 0 0 1Apprch % 0 0 0 0 0 0 100 0 0 0 0 0 0 0 0 0
Total % 0 0 0 0 0 0 0 100 0 100 0 0 0 0 0 0 0 0 0 0
TEHAMASouthbound
CARMEL VALLEY RDWestbound
VALLEY GREENS DRNorthbound
CARMEL VALLEY RDEastbound
Start Time Right Thru Left App. Total Right Thru Left App. Total Right Thru Left App. Total Right Thru Left App. Total Int. Total
Peak Hour Analysis From 04:00 PM to 05:45 PM - Peak 1 of 1Peak Hour for Entire Intersection Begins at 04:00 PM
04:00 PM 0 0 0 0 0 0 0 0 0 0 0 0 0 0 0 0 004:15 PM 0 0 0 0 0 0 0 0 0 0 0 0 0 0 0 0 004:30 PM 0 0 0 0 0 0 0 0 0 0 0 0 0 0 0 0 004:45 PM 0 0 0 0 0 0 1 1 0 0 0 0 0 0 0 0 1
Total Volume 0 0 0 0 0 0 1 1 0 0 0 0 0 0 0 0 1% App. Total 0 0 0 0 0 100 0 0 0 0 0 0
PHF .000 .000 .000 .000 .000 .000 .250 .250 .000 .000 .000 .000 .000 .000 .000 .000 .250
Traffic Data ServiceCampbell, CA(408) [email protected]
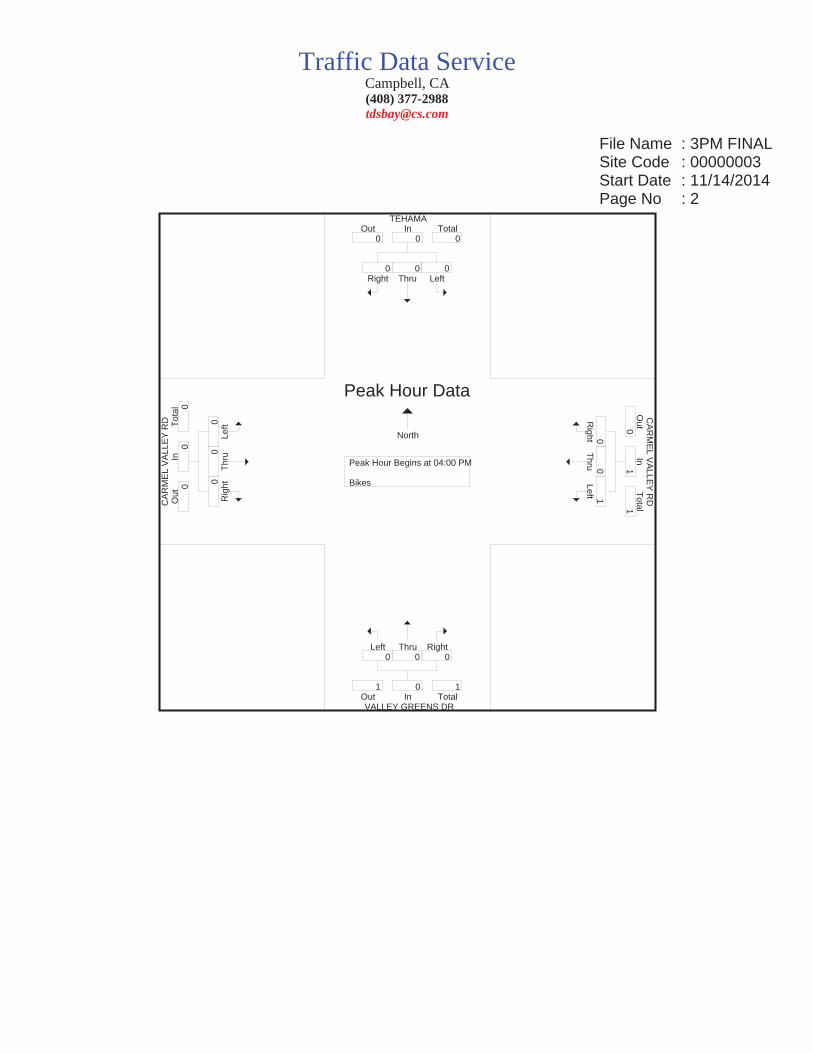
File Name : 3PM FINALSite Code : 00000003Start Date : 11/14/2014Page No : 2
TEHAMA
CA
RM
EL
VA
LLE
Y R
D C
AR
ME
L VA
LLEY
RD
VALLEY GREENS DR
Right0
Thru0
Left0
InOut Total0 0 0
Right 0
Thru 0
Left 1
Out
Total
In0
11
Left0
Thru0
Right0
Out TotalIn1 0 1
Left0
Thr
u0R
ight0
Tot
alO
utIn
00
0
Peak Hour Begins at 04:00 PM
Bikes
Peak Hour Data
North
Traffic Data ServiceCampbell, CA(408) [email protected]

Appendix B: LOS Calculation Sheets

12/30
/2014
Centr
al Co
ast T
rans
porta
tion C
onsu
lting
Sync
hro 8
Rep
ort
Queu
es
Lane
Gro
upW
BRNB
TNB
RSB
LSB
TLa
ne G
roup
Flow
(vph
)10
4437
312
212
3164
1v/c
Rati
o0.7
40.7
00.2
50.7
20.3
7Co
ntrol
Delay
15.2
26.7
12.3
13.9
0.6Qu
eue D
elay
0.00.0
0.00.0
0.0To
tal D
elay
15.2
26.7
12.3
13.9
0.6Qu
eue L
ength
50th
(ft)
147
122
2015
50
Queu
e Len
gth 95
th (ft
)21
718
849
220
0Int
erna
l Link
Dist
(ft)
1614
2081
Turn
Bay
Leng
th (ft
)11
037
0Ba
se C
apac
ity (v
ph)
1795
763
674
2178
1745
Star
vatio
n Cap
Red
uctn
00
00
0Sp
illbac
k Cap
Red
uctn
00
00
0St
orag
e Cap
Red
uctn
00
00
0Re
duce
d v/c
Ratio
0.58
0.49
0.18
0.57
0.37
Inter
secti
on S
umma
ry
12/30
/2014
Centr
al Co
ast T
rans
porta
tion C
onsu
lting
Sync
hro 8
Rep
ort
HCM
Sign
alize
d Inte
rsecti
on C
apac
ity A
nalys
is
Move
ment
WBL
WBR
NBT
NBR
SBL
SBT
Lane
Con
figur
ation
sVo
lume (
vph)
084
630
299
997
519
Ideal
Flow
(vphp
l)19
0019
0019
0019
0019
0019
00Gr
ade (
%)
6%10
%9%
Total
Lost
time (
s)4.0
5.05.0
4.04.0
Lane
Util.
Fac
tor0.8
81.0
01.0
00.9
71.0
0Fr
t0.8
51.0
00.8
51.0
01.0
0Flt
Pro
tected
1.00
1.00
1.00
0.95
1.00
Satd.
Flow
(pro
t)26
5117
3614
7532
1617
45Flt
Per
mitte
d1.0
01.0
01.0
00.9
51.0
0Sa
td. F
low (p
erm)
2651
1736
1475
3216
1745
Peak
-hou
r fac
tor, P
HF0.8
10.8
10.8
10.8
10.8
10.8
1Ad
j. Flow
(vph
)0
1044
373
122
1231
641
RTOR
Red
uctio
n (vp
h)0
00
330
0La
ne G
roup
Flow
(vph
)0
1044
373
8912
3164
1He
avy V
ehicl
es (%
)4%
4%4%
4%4%
4%Tu
rn T
ype
Over
NAPe
rmPr
otNA
Prote
cted P
hase
s1
21
Free
Perm
itted P
hase
s2
Actua
ted G
reen
, G (s
)30
.517
.717
.730
.557
.2Ef
fectiv
e Gre
en, g
(s)
30.5
17.7
17.7
30.5
57.2
Actua
ted g/
C Ra
tio0.5
30.3
10.3
10.5
31.0
0Cl
eara
nce T
ime (
s)4.0
5.05.0
4.0Ve
hicle
Exten
sion (
s)3.0
3.03.0
3.0La
ne G
rp C
ap (v
ph)
1413
537
456
1714
1745
v/s R
atio P
rot
c0.39
c0.21
0.38
0.37
v/s R
atio P
erm
0.06
v/c R
atio
0.74
0.69
0.19
0.72
0.37
Unifo
rm D
elay,
d110
.317
.414
.510
.10.0
Prog
ress
ion F
actor
1.00
1.00
1.00
1.00
1.00
Incre
menta
l Dela
y, d2
2.13.9
0.21.5
0.6De
lay (s
)12
.321
.314
.711
.60.6
Leve
l of S
ervic
eB
CB
BA
Appr
oach
Dela
y (s)
12.3
19.6
7.8Ap
proa
ch LO
SB
BA
Inter
secti
on S
umma
ryHC
M 20
00 C
ontro
l Dela
y10
.9HC
M 20
00 Le
vel o
f Ser
vice
BHC
M 20
00 V
olume
to C
apac
ity ra
tio0.7
2Ac
tuated
Cyc
le Le
ngth
(s)
57.2
Sum
of los
t time
(s)
9.0Int
erse
ction
Cap
acity
Utili
zatio
n53
.0%IC
U Le
vel o
f Ser
vice
AAn
alysis
Per
iod (m
in)15
c C
ritica
l Lan
e Gro
up

12/30
/2014
Centr
al Co
ast T
rans
porta
tion C
onsu
lting
Sync
hro 8
Rep
ort
Queu
es
Lane
Gro
upEB
TEB
RW
BLW
BTNB
LNB
RLa
ne G
roup
Flow
(vph
)73
217
348
1073
100
17v/c
Rati
o0.6
00.1
60.5
30.7
90.4
70.0
8Co
ntrol
Delay
11.6
1.656
.613
.435
.913
.1Qu
eue D
elay
0.00.0
0.00.0
0.00.0
Total
Dela
y11
.61.6
56.6
13.4
35.9
13.1
Queu
e Len
gth 50
th (ft
)18
60
2125
741
0Qu
eue L
ength
95th
(ft)
284
17#5
742
674
13Int
erna
l Link
Dist
(ft)
3171
365
801
Turn
Bay
Leng
th (ft
)32
037
050
Base
Cap
acity
(vph
)12
1710
8890
1363
640
582
Star
vatio
n Cap
Red
uctn
00
00
00
Spillb
ack C
ap R
educ
tn0
00
00
0St
orag
e Cap
Red
uctn
00
00
00
Redu
ced v
/c Ra
tio0.6
00.1
60.5
30.7
90.1
60.0
3
Inter
secti
on S
umma
ry#
95th
perce
ntile
volum
e exc
eeds
capa
city,
queu
e may
be lo
nger
.
Que
ue sh
own i
s max
imum
after
two c
ycles
.
12/30
/2014
Centr
al Co
ast T
rans
porta
tion C
onsu
lting
Sync
hro 8
Rep
ort
HCM
2010
Sign
alize
d Inte
rsecti
on S
umma
ry
Move
ment
EBT
EBR
WBL
WBT
NBL
NBR
Lane
Con
figur
ation
sVo
lume (
veh/h
)59
314
039
869
8114
Numb
er4
143
85
12Ini
tial Q
(Qb)
, veh
00
00
00
Ped-
Bike
Adj(
A_pb
T)1.0
01.0
01.0
01.0
0Pa
rking
Bus
, Adj
1.00
1.00
1.00
1.00
1.00
1.00
Adj S
at Flo
w, ve
h/h/ln
1759
1759
1750
1750
1645
1645
Adj F
low R
ate, v
eh/h
732
173
4810
7310
00
Adj N
o. of
Lane
s1
11
11
1Pe
ak H
our F
actor
0.81
0.81
0.81
0.81
0.81
0.81
Perce
nt He
avy V
eh, %
88
88
88
Cap,
veh/h
1107
941
6412
9812
711
3Ar
rive O
n Gre
en0.6
30.6
30.0
40.7
40.0
80.0
0Sa
t Flow
, veh
/h17
5914
9516
6717
5015
6713
98Gr
p Volu
me(v)
, veh
/h73
217
348
1073
100
0Gr
p Sat
Flow(
s),ve
h/h/ln
1759
1495
1667
1750
1567
1398
Q Se
rve(g
_s),
s14
.22.6
1.521
.93.4
0.0Cy
cle Q
Clea
r(g_c
), s
14.2
2.61.5
21.9
3.40.0
Prop
In La
ne1.0
01.0
01.0
01.0
0La
ne G
rp C
ap(c)
, veh
/h11
0794
164
1298
127
113
V/C
Ratio
(X)
0.66
0.18
0.76
0.83
0.79
0.00
Avail
Cap
(c_a)
, veh
/h13
9511
8612
416
4987
778
3HC
M Pl
atoon
Rati
o1.0
01.0
01.0
01.0
01.0
01.0
0Up
strea
m Fil
ter(I)
1.00
1.00
1.00
1.00
1.00
0.00
Unifo
rm D
elay (
d), s
/veh
6.34.2
25.5
4.624
.20.0
Incr D
elay (
d2),
s/veh
0.80.1
16.5
2.910
.30.0
Initia
l Q D
elay(d
3),s/
veh
0.00.0
0.00.0
0.00.0
%ile
Bac
kOfQ
(50%
),veh
/ln7.0
1.11.0
11.2
1.80.0
LnGr
p Dela
y(d),s
/veh
7.14.3
42.0
7.534
.50.0
LnGr
p LOS
AA
DA
CAp
proa
ch V
ol, ve
h/h90
511
2110
0Ap
proa
ch D
elay,
s/veh
6.69.0
34.5
Appr
oach
LOS
AA
C
Timer
12
34
56
78
Assig
ned P
hs2
34
8Ph
s Dur
ation
(G+Y
+Rc),
s8.3
6.039
.245
.3Ch
ange
Per
iod (Y
+Rc),
s4.0
4.05.5
5.5Ma
x Gre
en S
etting
(Gma
x), s
30.0
4.042
.550
.5Ma
x Q C
lear T
ime (
g_c+
I1), s
5.43.5
16.2
23.9
Gree
n Ext
Time (
p_c),
s0.2
0.015
.715
.8
Inter
secti
on S
umma
ryHC
M 20
10 C
trl De
lay9.2
HCM
2010
LOS
A

12/30
/2014
Centr
al Co
ast T
rans
porta
tion C
onsu
lting
Sync
hro 8
Rep
ort
HCM
2010
TW
SC
Inter
secti
onInt
Dela
y, s/v
eh1.1
Move
ment
EBL
EBT
EBR
WBL
WBT
WBR
NBL
NBT
NBR
SBL
SBT
SBR
Vol, v
eh/h
338
826
3262
610
80
223
46
Confl
icting
Ped
s, #/h
r0
00
00
00
00
00
0Si
gn C
ontro
l Fr
eeFr
eeFr
eeFr
eeFr
eeFr
eeSt
opSt
opSt
opSt
opSt
opSt
opRT
Cha
nneli
zed
--
None
--
None
--
None
--
None
Stor
age L
ength
400
-70
210
--
--
--
-60
Veh i
n Med
ian S
torag
e, #
-0
--
0-
-0
--
0-
Grad
e, %
-4
--
2-
-7
--
1-
Peak
Hou
r Fac
tor93
9393
9393
9393
9393
9393
93He
avy V
ehicl
es, %
88
88
88
88
88
88
Mvmt
Flow
341
728
3467
311
90
243
46
Major
/Mino
rMa
jor1
Major
2Mi
nor1
Mino
r2Co
nflict
ing F
low A
ll68
40
041
70
011
7311
7741
711
8211
7167
8
S
tage 1
--
--
--
424
424
-74
774
7-
Stag
e 2-
--
--
-74
975
3-
435
424
-Cr
itical
Hdwy
4.18
--
4.18
--
8.58
7.98
6.98
7.38
6.78
6.38
Critic
al Hd
wy S
tg 1
--
--
--
7.58
6.98
-6.3
85.7
8-
Critic
al Hd
wy S
tg 2
--
--
--
7.58
6.98
-6.3
85.7
8-
Follo
w-up
Hdw
y2.2
72-
-2.2
72-
-3.5
724.0
723.3
723.5
724.0
723.3
72Po
t Cap
-1 M
aneu
ver
882
--
1110
--
104
118
575
152
176
434
Stag
e 1-
--
--
-50
648
9-
380
395
-
S
tage 2
--
--
--
295
305
-57
456
3-
Plato
on bl
ocke
d, %
--
--
Mov C
ap-1
Man
euve
r88
2-
-11
10-
-98
114
575
142
170
434
Mov C
ap-2
Man
euve
r-
--
--
-98
114
-14
217
0-
Stag
e 1-
--
--
-50
448
7-
379
383
-
S
tage 2
--
--
--
279
296
-54
956
1-
Appr
oach
EBW
BNB
SBHC
M Co
ntrol
Delay
, s0.1
0.421
.521
.9HC
M LO
SC
C
Mino
r Lan
e/Majo
r Mvm
tNB
Ln1
EBL
EBT
EBR
WBL
WBT
WBR
SBLn
1SBL
n2Ca
pacit
y (ve
h/h)
250
882
--
1110
--
157
434
HCM
Lane
V/C
Rati
o0.1
290.0
04-
-0.0
31-
-0.0
480.0
15HC
M Co
ntrol
Delay
(s)
21.5
9.1-
-8.3
--
29.1
13.4
HCM
Lane
LOS
CA
--
A-
-D
BHC
M 95
th %
tile Q
(veh)
0.40
--
0.1-
-0.1
0
1/2/20
15
Centr
al Co
ast T
rans
porta
tion C
onsu
lting
Sync
hro 8
Rep
ort
Queu
es
Lane
Gro
upW
BRNB
TNB
RSB
LSB
TLa
ne G
roup
Flow
(vph
)89
977
074
862
657
v/c R
atio
0.87
0.90
0.10
0.68
0.38
Contr
ol De
lay34
.234
.66.4
24.7
0.6Qu
eue D
elay
0.00.0
0.00.0
0.0To
tal D
elay
34.2
34.6
6.424
.70.6
Queu
e Len
gth 50
th (ft
)26
336
59
206
0Qu
eue L
ength
95th
(ft)
#390
#609
3027
30
Inter
nal L
ink D
ist (f
t)16
1420
81Tu
rn B
ay Le
ngth
(ft)
110
370
Base
Cap
acity
(vph
)11
7910
1587
914
3017
45St
arva
tion C
ap R
educ
tn0
00
00
Spillb
ack C
ap R
educ
tn0
00
00
Stor
age C
ap R
educ
tn0
00
00
Redu
ced v
/c Ra
tio0.7
60.7
60.0
80.6
00.3
8
Inter
secti
on S
umma
ry#
95th
perce
ntile
volum
e exc
eeds
capa
city,
queu
e may
be lo
nger
.
Que
ue sh
own i
s max
imum
after
two c
ycles
.

1/2/20
15
Centr
al Co
ast T
rans
porta
tion C
onsu
lting
Sync
hro 8
Rep
ort
HCM
Sign
alize
d Inte
rsecti
on C
apac
ity A
nalys
is
Move
ment
WBL
WBR
NBT
NBR
SBL
SBT
Lane
Con
figur
ation
sVo
lume (
vph)
083
671
669
802
611
Ideal
Flow
(vphp
l)19
0019
0019
0019
0019
0019
00Gr
ade (
%)
6%10
%9%
Total
Lost
time (
s)4.0
5.05.0
4.04.0
Lane
Util.
Fac
tor0.8
81.0
01.0
00.9
71.0
0Fr
t0.8
51.0
00.8
51.0
01.0
0Flt
Pro
tected
1.00
1.00
1.00
0.95
1.00
Satd.
Flow
(pro
t)26
5117
3614
7532
1617
45Flt
Per
mitte
d1.0
01.0
01.0
00.9
51.0
0Sa
td. F
low (p
erm)
2651
1736
1475
3216
1745
Peak
-hou
r fac
tor, P
HF0.9
30.9
30.9
30.9
30.9
30.9
3Ad
j. Flow
(vph
)0
899
770
7486
265
7RT
OR R
educ
tion (
vph)
00
021
00
Lane
Gro
up F
low (v
ph)
089
977
053
862
657
Heav
y Veh
icles
(%)
4%4%
4%4%
4%4%
Turn
Typ
eOv
erNA
Perm
Prot
NAPr
otecte
d Pha
ses
12
1Fr
eePe
rmitte
d Pha
ses
2Ac
tuated
Gre
en, G
(s)
31.9
40.1
40.1
31.9
81.0
Effec
tive G
reen
, g (s
)31
.940
.140
.131
.981
.0Ac
tuated
g/C
Ratio
0.39
0.50
0.50
0.39
1.00
Clea
ranc
e Tim
e (s)
4.05.0
5.04.0
Vehic
le Ex
tensio
n (s)
3.03.0
3.03.0
Lane
Grp
Cap
(vph
)10
4485
973
012
6617
45v/s
Rati
o Pro
tc0
.34c0
.440.2
70.3
8v/s
Rati
o Per
m0.0
4v/c
Rati
o0.8
60.9
00.0
70.6
80.3
8Un
iform
Dela
y, d1
22.5
18.6
10.7
20.3
0.0Pr
ogre
ssion
Fac
tor1.0
01.0
01.0
01.0
01.0
0Inc
reme
ntal D
elay,
d27.4
11.9
0.01.5
0.6De
lay (s
)29
.930
.510
.821
.90.6
Leve
l of S
ervic
eC
CB
CA
Appr
oach
Dela
y (s)
29.9
28.7
12.7
Appr
oach
LOS
CC
B
Inter
secti
on S
umma
ryHC
M 20
00 C
ontro
l Dela
y21
.6HC
M 20
00 Le
vel o
f Ser
vice
CHC
M 20
00 V
olume
to C
apac
ity ra
tio0.8
8Ac
tuated
Cyc
le Le
ngth
(s)
81.0
Sum
of los
t time
(s)
9.0Int
erse
ction
Cap
acity
Utili
zatio
n74
.4%IC
U Le
vel o
f Ser
vice
DAn
alysis
Per
iod (m
in)15
c C
ritica
l Lan
e Gro
up
1/2/20
15
Centr
al Co
ast T
rans
porta
tion C
onsu
lting
Sync
hro 8
Rep
ort
Queu
es
Lane
Gro
upEB
TEB
RW
BLW
BTNB
LNB
RLa
ne G
roup
Flow
(vph
)97
012
59
588
156
35v/c
Rati
o0.8
20.1
20.1
00.4
80.5
80.1
3Co
ntrol
Delay
18.5
1.935
.17.3
35.8
10.1
Queu
e Dela
y0.0
0.00.0
0.00.0
0.0To
tal D
elay
18.5
1.935
.17.3
35.8
10.1
Queu
e Len
gth 50
th (ft
)23
20
495
600
Queu
e Len
gth 95
th (ft
)#7
2322
1920
512
022
Inter
nal L
ink D
ist (f
t)31
7136
580
1Tu
rn B
ay Le
ngth
(ft)
320
370
50Ba
se C
apac
ity (v
ph)
1188
1050
9212
7665
360
4St
arva
tion C
ap R
educ
tn0
00
00
0Sp
illbac
k Cap
Red
uctn
00
00
00
Stor
age C
ap R
educ
tn0
00
00
0Re
duce
d v/c
Ratio
0.82
0.12
0.10
0.46
0.24
0.06
Inter
secti
on S
umma
ry#
95th
perce
ntile
volum
e exc
eeds
capa
city,
queu
e may
be lo
nger
.
Que
ue sh
own i
s max
imum
after
two c
ycles
.

1/2/20
15
Centr
al Co
ast T
rans
porta
tion C
onsu
lting
Sync
hro 8
Rep
ort
HCM
2010
Sign
alize
d Inte
rsecti
on S
umma
ry
Move
ment
EBT
EBR
WBL
WBT
NBL
NBR
Lane
Con
figur
ation
sVo
lume (
veh/h
)94
112
19
570
151
34Nu
mber
414
38
512
Initia
l Q (Q
b), v
eh0
00
00
0Pe
d-Bi
ke A
dj(A_
pbT)
1.00
1.00
1.00
1.00
Parki
ng B
us, A
dj1.0
01.0
01.0
01.0
01.0
01.0
0Ad
j Sat
Flow,
veh/h
/ln17
5917
5917
5017
5016
4516
45Ad
j Flow
Rate
, veh
/h97
012
59
588
156
0Ad
j No.
of La
nes
11
11
11
Peak
Hou
r Fac
tor0.9
70.9
70.9
70.9
70.9
70.9
7Pe
rcent
Heav
y Veh
, %8
88
88
8Ca
p, ve
h/h11
1494
716
1244
199
177
Arriv
e On G
reen
0.63
0.63
0.01
0.71
0.13
0.00
Sat F
low, v
eh/h
1759
1495
1667
1750
1567
1398
Grp V
olume
(v), v
eh/h
970
125
958
815
60
Grp S
at Flo
w(s),
veh/h
/ln17
5914
9516
6717
5015
6713
98Q
Serve
(g_s
), s
26.4
2.00.3
8.65.7
0.0Cy
cle Q
Clea
r(g_c
), s
26.4
2.00.3
8.65.7
0.0Pr
op In
Lane
1.00
1.00
1.00
1.00
Lane
Grp
Cap
(c), v
eh/h
1114
947
1612
4419
917
7V/
C Ra
tio(X
)0.8
70.1
30.5
80.4
70.7
80.0
0Av
ail C
ap(c_
a), v
eh/h
1276
1085
114
1509
802
716
HCM
Plato
on R
atio
1.00
1.00
1.00
1.00
1.00
1.00
Upstr
eam
Filter
(I)1.0
01.0
01.0
01.0
01.0
00.0
0Un
iform
Dela
y (d)
, s/ve
h8.8
4.328
.93.7
24.8
0.0Inc
r Dela
y (d2
), s/v
eh6.1
0.129
.90.3
6.70.0
Initia
l Q D
elay(d
3),s/
veh
0.00.0
0.00.0
0.00.0
%ile
Bac
kOfQ
(50%
),veh
/ln14
.30.8
0.34.2
2.80.0
LnGr
p Dela
y(d),s
/veh
14.9
4.458
.84.0
31.5
0.0Ln
Grp L
OSB
AE
AC
Appr
oach
Vol,
veh/h
1095
597
156
Appr
oach
Dela
y, s/v
eh13
.74.8
31.5
Appr
oach
LOS
BA
C
Timer
12
34
56
78
Assig
ned P
hs2
34
8Ph
s Dur
ation
(G+Y
+Rc),
s11
.44.5
42.6
47.2
Chan
ge P
eriod
(Y+R
c), s
4.04.0
5.55.5
Max G
reen
Sett
ing (G
max),
s30
.04.0
42.5
50.5
Max Q
Clea
r Tim
e (g_
c+I1)
, s7.7
2.328
.410
.6Gr
een E
xt Tim
e (p_
c), s
0.40.0
8.715
.0
Inter
secti
on S
umma
ryHC
M 20
10 C
trl De
lay12
.3HC
M 20
10 LO
SB
1/2/20
15
Centr
al Co
ast T
rans
porta
tion C
onsu
lting
Sync
hro 8
Rep
ort
HCM
2010
TW
SC
Inter
secti
onInt
Dela
y, s/v
eh3.5
Move
ment
EBL
EBT
EBR
WBL
WBT
WBR
NBL
NBT
NBR
SBL
SBT
SBR
Vol, v
eh/h
674
528
2150
68
202
558
36
Confl
icting
Ped
s, #/h
r0
00
00
00
00
00
0Si
gn C
ontro
l Fr
eeFr
eeFr
eeFr
eeFr
eeFr
eeSt
opSt
opSt
opSt
opSt
opSt
opRT
Cha
nneli
zed
--
None
--
None
--
None
--
None
Stor
age L
ength
400
-70
210
--
--
--
-60
Veh i
n Med
ian S
torag
e, #
-0
--
0-
-0
--
0-
Grad
e, %
-4
--
2-
-7
--
1-
Peak
Hou
r Fac
tor95
9595
9595
9595
9595
9595
95He
avy V
ehicl
es, %
88
88
88
88
88
88
Mvmt
Flow
678
429
2253
38
212
588
36
Major
/Mino
rMa
jor1
Major
2Mi
nor1
Mino
r2Co
nflict
ing F
low A
ll54
10
078
40
013
8013
8278
414
0813
7853
7
S
tage 1
--
--
--
797
797
-58
158
1-
Stag
e 2-
--
--
-58
358
5-
827
797
-Cr
itical
Hdwy
4.18
--
4.18
--
8.58
7.98
6.98
7.38
6.78
6.38
Critic
al Hd
wy S
tg 1
--
--
--
7.58
6.98
-6.3
85.7
8-
Critic
al Hd
wy S
tg 2
--
--
--
7.58
6.98
-6.3
85.7
8-
Follo
w-up
Hdw
y2.2
72-
-2.2
72-
-3.5
724.0
723.3
723.5
724.0
723.3
72Po
t Cap
-1 M
aneu
ver
998
--
808
--
6982
330
104
130
525
Stag
e 1-
--
--
-27
228
6-
474
475
-
S
tage 2
--
--
--
389
389
-34
137
3-
Plato
on bl
ocke
d, %
--
--
Mov C
ap-1
Man
euve
r99
8-
-80
8-
-65
7933
082
126
525
Mov C
ap-2
Man
euve
r-
--
--
-65
79-
8212
6-
Stag
e 1-
--
--
-27
028
4-
471
462
-
S
tage 2
--
--
--
371
378
-27
737
1-
Appr
oach
EBW
BNB
SBHC
M Co
ntrol
Delay
, s0.1
0.451
.836
.7HC
M LO
SF
E
Mino
r Lan
e/Majo
r Mvm
tNB
Ln1
EBL
EBT
EBR
WBL
WBT
WBR
SBLn
1SBL
n2Ca
pacit
y (ve
h/h)
154
998
--
808
--
9152
5HC
M La
ne V
/C R
atio
0.526
0.006
--
0.027
--
0.127
0.012
HCM
Contr
ol De
lay (s
)51
.88.6
--
9.6-
-50
.211
.9HC
M La
ne LO
SF
A-
-A
--
FB
HCM
95th
%tile
Q(ve
h)2.6
0-
-0.1
--
0.40

12/30
/2014
Centr
al Co
ast T
rans
porta
tion C
onsu
lting
Sync
hro 8
Rep
ort
Queu
es
Lane
Gro
upW
BRNB
TNB
RSB
LSB
TLa
ne G
roup
Flow
(vph
)98
578
762
917
551
v/c R
atio
0.90
0.93
0.08
0.69
0.32
Contr
ol De
lay38
.941
.48.1
26.4
0.5Qu
eue D
elay
0.00.0
0.00.0
0.0To
tal D
elay
38.9
41.4
8.126
.40.5
Queu
e Len
gth 50
th (ft
)32
744
010
243
0Qu
eue L
ength
95th
(ft)
#472
#699
3131
40
Inter
nal L
ink D
ist (f
t)16
1420
81Tu
rn B
ay Le
ngth
(ft)
110
370
Base
Cap
acity
(vph
)11
8094
281
514
3117
45St
arva
tion C
ap R
educ
tn0
00
00
Spillb
ack C
ap R
educ
tn0
00
00
Stor
age C
ap R
educ
tn0
00
00
Redu
ced v
/c Ra
tio0.8
30.8
40.0
80.6
40.3
2
Inter
secti
on S
umma
ry#
95th
perce
ntile
volum
e exc
eeds
capa
city,
queu
e may
be lo
nger
.
Que
ue sh
own i
s max
imum
after
two c
ycles
.
12/30
/2014
Centr
al Co
ast T
rans
porta
tion C
onsu
lting
Sync
hro 8
Rep
ort
HCM
Sign
alize
d Inte
rsecti
on C
apac
ity A
nalys
is
Move
ment
WBL
WBR
NBT
NBR
SBL
SBT
Lane
Con
figur
ation
sVo
lume (
vph)
092
674
058
862
518
Ideal
Flow
(vphp
l)19
0019
0019
0019
0019
0019
00Gr
ade (
%)
6%10
%9%
Total
Lost
time (
s)4.0
5.05.0
4.04.0
Lane
Util.
Fac
tor0.8
81.0
01.0
00.9
71.0
0Fr
t0.8
51.0
00.8
51.0
01.0
0Flt
Pro
tected
1.00
1.00
1.00
0.95
1.00
Satd.
Flow
(pro
t)26
5117
3614
7532
1617
45Flt
Per
mitte
d1.0
01.0
01.0
00.9
51.0
0Sa
td. F
low (p
erm)
2651
1736
1475
3216
1745
Peak
-hou
r fac
tor, P
HF0.9
40.9
40.9
40.9
40.9
40.9
4Ad
j. Flow
(vph
)0
985
787
6291
755
1RT
OR R
educ
tion (
vph)
00
016
00
Lane
Gro
up F
low (v
ph)
098
578
746
917
551
Heav
y Veh
icles
(%)
4%4%
4%4%
4%4%
Turn
Typ
eOv
erNA
Perm
Prot
NAPr
otecte
d Pha
ses
12
1Fr
eePe
rmitte
d Pha
ses
2Ac
tuated
Gre
en, G
(s)
38.7
45.8
45.8
38.7
93.5
Effec
tive G
reen
, g (s
)38
.745
.845
.838
.793
.5Ac
tuated
g/C
Ratio
0.41
0.49
0.49
0.41
1.00
Clea
ranc
e Tim
e (s)
4.05.0
5.04.0
Vehic
le Ex
tensio
n (s)
3.03.0
3.03.0
Lane
Grp
Cap
(vph
)10
9785
072
213
3117
45v/s
Rati
o Pro
tc0
.37c0
.450.2
90.3
2v/s
Rati
o Per
m0.0
3v/c
Rati
o0.9
00.9
30.0
60.6
90.3
2Un
iform
Dela
y, d1
25.6
22.3
12.6
22.5
0.0Pr
ogre
ssion
Fac
tor1.0
01.0
01.0
01.0
01.0
0Inc
reme
ntal D
elay,
d29.8
15.7
0.01.5
0.5De
lay (s
)35
.438
.012
.624
.00.5
Leve
l of S
ervic
eD
DB
CA
Appr
oach
Dela
y (s)
35.4
36.1
15.2
Appr
oach
LOS
DD
B
Inter
secti
on S
umma
ryHC
M 20
00 C
ontro
l Dela
y26
.6HC
M 20
00 Le
vel o
f Ser
vice
CHC
M 20
00 V
olume
to C
apac
ity ra
tio0.9
1Ac
tuated
Cyc
le Le
ngth
(s)
93.5
Sum
of los
t time
(s)
9.0Int
erse
ction
Cap
acity
Utili
zatio
n78
.8%IC
U Le
vel o
f Ser
vice
DAn
alysis
Per
iod (m
in)15
c C
ritica
l Lan
e Gro
up
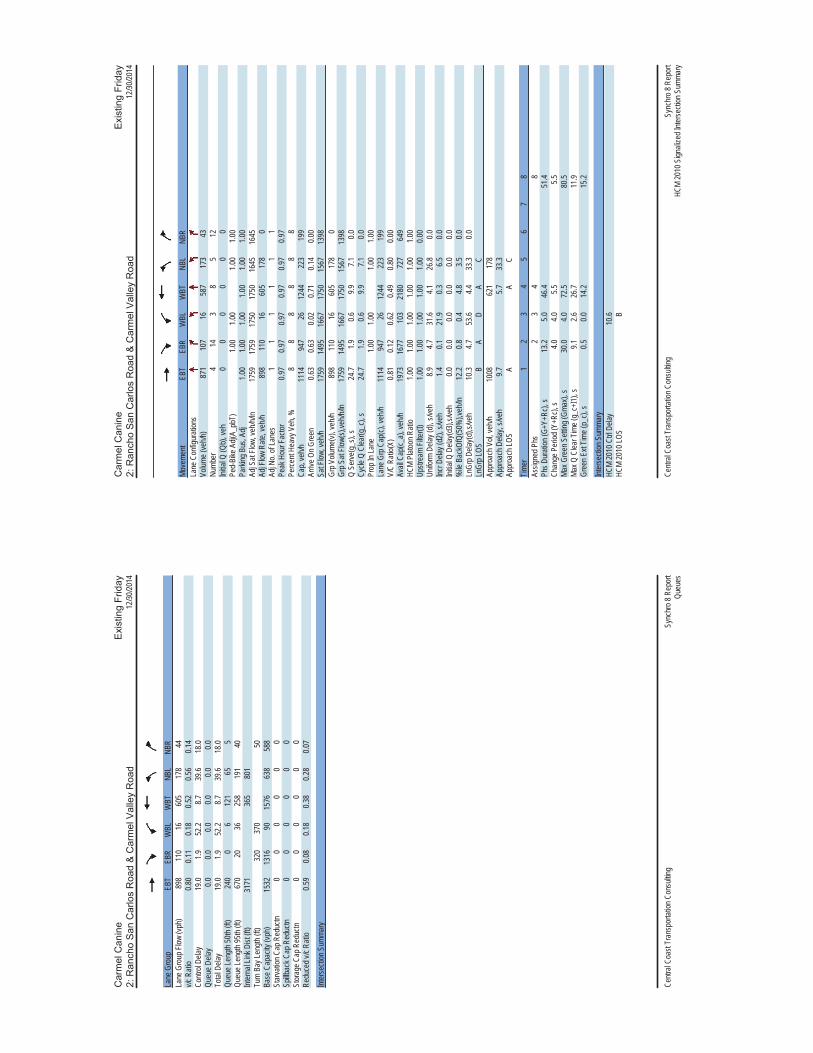
12/30
/2014
Centr
al Co
ast T
rans
porta
tion C
onsu
lting
Sync
hro 8
Rep
ort
Queu
es
Lane
Gro
upEB
TEB
RW
BLW
BTNB
LNB
RLa
ne G
roup
Flow
(vph
)89
811
016
605
178
44v/c
Rati
o0.8
00.1
10.1
80.5
20.5
60.1
4Co
ntrol
Delay
19.0
1.952
.28.7
39.6
18.0
Queu
e Dela
y0.0
0.00.0
0.00.0
0.0To
tal D
elay
19.0
1.952
.28.7
39.6
18.0
Queu
e Len
gth 50
th (ft
)24
00
612
165
5Qu
eue L
ength
95th
(ft)
670
2036
258
191
40Int
erna
l Link
Dist
(ft)
3171
365
801
Turn
Bay
Leng
th (ft
)32
037
050
Base
Cap
acity
(vph
)15
3213
1690
1576
638
588
Star
vatio
n Cap
Red
uctn
00
00
00
Spillb
ack C
ap R
educ
tn0
00
00
0St
orag
e Cap
Red
uctn
00
00
00
Redu
ced v
/c Ra
tio0.5
90.0
80.1
80.3
80.2
80.0
7
Inter
secti
on S
umma
ry
12/30
/2014
Centr
al Co
ast T
rans
porta
tion C
onsu
lting
Sync
hro 8
Rep
ort
HCM
2010
Sign
alize
d Inte
rsecti
on S
umma
ry
Move
ment
EBT
EBR
WBL
WBT
NBL
NBR
Lane
Con
figur
ation
sVo
lume (
veh/h
)87
110
716
587
173
43Nu
mber
414
38
512
Initia
l Q (Q
b), v
eh0
00
00
0Pe
d-Bi
ke A
dj(A_
pbT)
1.00
1.00
1.00
1.00
Parki
ng B
us, A
dj1.0
01.0
01.0
01.0
01.0
01.0
0Ad
j Sat
Flow,
veh/h
/ln17
5917
5917
5017
5016
4516
45Ad
j Flow
Rate
, veh
/h89
811
016
605
178
0Ad
j No.
of La
nes
11
11
11
Peak
Hou
r Fac
tor0.9
70.9
70.9
70.9
70.9
70.9
7Pe
rcent
Heav
y Veh
, %8
88
88
8Ca
p, ve
h/h11
1494
726
1244
223
199
Arriv
e On G
reen
0.63
0.63
0.02
0.71
0.14
0.00
Sat F
low, v
eh/h
1759
1495
1667
1750
1567
1398
Grp V
olume
(v), v
eh/h
898
110
1660
517
80
Grp S
at Flo
w(s),
veh/h
/ln17
5914
9516
6717
5015
6713
98Q
Serve
(g_s
), s
24.7
1.90.6
9.97.1
0.0Cy
cle Q
Clea
r(g_c
), s
24.7
1.90.6
9.97.1
0.0Pr
op In
Lane
1.00
1.00
1.00
1.00
Lane
Grp
Cap
(c), v
eh/h
1114
947
2612
4422
319
9V/
C Ra
tio(X
)0.8
10.1
20.6
20.4
90.8
00.0
0Av
ail C
ap(c_
a), v
eh/h
1973
1677
103
2180
727
649
HCM
Plato
on R
atio
1.00
1.00
1.00
1.00
1.00
1.00
Upstr
eam
Filter
(I)1.0
01.0
01.0
01.0
01.0
00.0
0Un
iform
Dela
y (d)
, s/ve
h8.9
4.731
.64.1
26.8
0.0Inc
r Dela
y (d2
), s/v
eh1.4
0.121
.90.3
6.50.0
Initia
l Q D
elay(d
3),s/
veh
0.00.0
0.00.0
0.00.0
%ile
Bac
kOfQ
(50%
),veh
/ln12
.20.8
0.44.8
3.50.0
LnGr
p Dela
y(d),s
/veh
10.3
4.753
.64.4
33.3
0.0Ln
Grp L
OSB
AD
AC
Appr
oach
Vol,
veh/h
1008
621
178
Appr
oach
Dela
y, s/v
eh9.7
5.733
.3Ap
proa
ch LO
SA
AC
Timer
12
34
56
78
Assig
ned P
hs2
34
8Ph
s Dur
ation
(G+Y
+Rc),
s13
.25.0
46.4
51.4
Chan
ge P
eriod
(Y+R
c), s
4.04.0
5.55.5
Max G
reen
Sett
ing (G
max),
s30
.04.0
72.5
80.5
Max Q
Clea
r Tim
e (g_
c+I1)
, s9.1
2.626
.711
.9Gr
een E
xt Tim
e (p_
c), s
0.50.0
14.2
15.2
Inter
secti
on S
umma
ryHC
M 20
10 C
trl De
lay10
.6HC
M 20
10 LO
SB
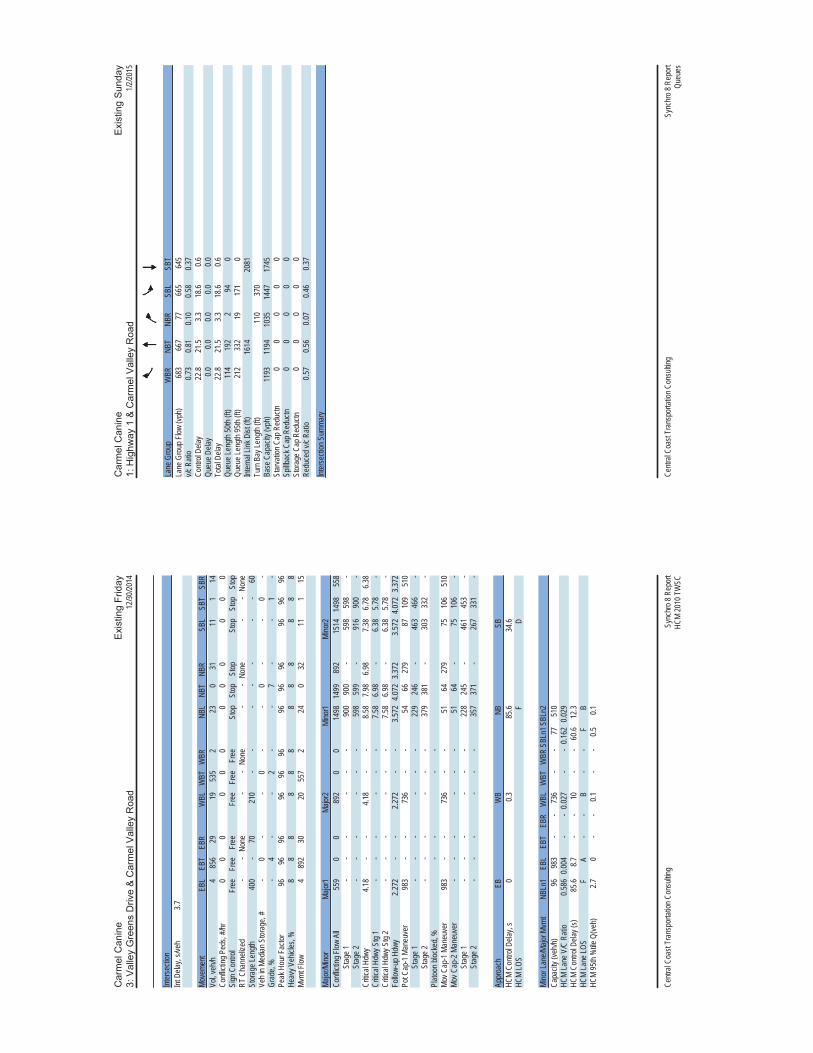
12/30
/2014
Centr
al Co
ast T
rans
porta
tion C
onsu
lting
Sync
hro 8
Rep
ort
HCM
2010
TW
SC
Inter
secti
onInt
Dela
y, s/v
eh3.7
Move
ment
EBL
EBT
EBR
WBL
WBT
WBR
NBL
NBT
NBR
SBL
SBT
SBR
Vol, v
eh/h
485
629
1953
52
230
3111
114
Confl
icting
Ped
s, #/h
r0
00
00
00
00
00
0Si
gn C
ontro
l Fr
eeFr
eeFr
eeFr
eeFr
eeFr
eeSt
opSt
opSt
opSt
opSt
opSt
opRT
Cha
nneli
zed
--
None
--
None
--
None
--
None
Stor
age L
ength
400
-70
210
--
--
--
-60
Veh i
n Med
ian S
torag
e, #
-0
--
0-
-0
--
0-
Grad
e, %
-4
--
2-
-7
--
1-
Peak
Hou
r Fac
tor96
9696
9696
9696
9696
9696
96He
avy V
ehicl
es, %
88
88
88
88
88
88
Mvmt
Flow
489
230
2055
72
240
3211
115
Major
/Mino
rMa
jor1
Major
2Mi
nor1
Mino
r2Co
nflict
ing F
low A
ll55
90
089
20
014
9814
9989
215
1414
9855
8
S
tage 1
--
--
--
900
900
-59
859
8-
Stag
e 2-
--
--
-59
859
9-
916
900
-Cr
itical
Hdwy
4.18
--
4.18
--
8.58
7.98
6.98
7.38
6.78
6.38
Critic
al Hd
wy S
tg 1
--
--
--
7.58
6.98
-6.3
85.7
8-
Critic
al Hd
wy S
tg 2
--
--
--
7.58
6.98
-6.3
85.7
8-
Follo
w-up
Hdw
y2.2
72-
-2.2
72-
-3.5
724.0
723.3
723.5
724.0
723.3
72Po
t Cap
-1 M
aneu
ver
983
--
736
--
5466
279
8710
951
0
S
tage 1
--
--
--
229
246
-46
346
6-
Stag
e 2-
--
--
-37
938
1-
303
332
-Pl
atoon
bloc
ked,
%-
--
-Mo
v Cap
-1 M
aneu
ver
983
--
736
--
5164
279
7510
651
0Mo
v Cap
-2 M
aneu
ver
--
--
--
5164
-75
106
-
S
tage 1
--
--
--
228
245
-46
145
3-
Stag
e 2-
--
--
-35
737
1-
267
331
-
Appr
oach
EBW
BNB
SBHC
M Co
ntrol
Delay
, s0
0.385
.634
.6HC
M LO
SF
D
Mino
r Lan
e/Majo
r Mvm
tNB
Ln1
EBL
EBT
EBR
WBL
WBT
WBR
SBLn
1SBL
n2Ca
pacit
y (ve
h/h)
9698
3-
-73
6-
-77
510
HCM
Lane
V/C
Rati
o0.5
860.0
04-
-0.0
27-
-0.1
620.0
29HC
M Co
ntrol
Delay
(s)
85.6
8.7-
-10
--
60.6
12.3
HCM
Lane
LOS
FA
--
B-
-F
BHC
M 95
th %
tile Q
(veh)
2.70
--
0.1-
-0.5
0.1
1/2/20
15
Centr
al Co
ast T
rans
porta
tion C
onsu
lting
Sync
hro 8
Rep
ort
Queu
es
Lane
Gro
upW
BRNB
TNB
RSB
LSB
TLa
ne G
roup
Flow
(vph
)68
366
777
665
645
v/c R
atio
0.73
0.81
0.10
0.58
0.37
Contr
ol De
lay22
.821
.53.3
18.6
0.6Qu
eue D
elay
0.00.0
0.00.0
0.0To
tal D
elay
22.8
21.5
3.318
.60.6
Queu
e Len
gth 50
th (ft
)11
419
22
940
Queu
e Len
gth 95
th (ft
)21
233
219
171
0Int
erna
l Link
Dist
(ft)
1614
2081
Turn
Bay
Leng
th (ft
)11
037
0Ba
se C
apac
ity (v
ph)
1193
1194
1035
1447
1745
Star
vatio
n Cap
Red
uctn
00
00
0Sp
illbac
k Cap
Red
uctn
00
00
0St
orag
e Cap
Red
uctn
00
00
0Re
duce
d v/c
Ratio
0.57
0.56
0.07
0.46
0.37
Inter
secti
on S
umma
ry

1/2/20
15
Centr
al Co
ast T
rans
porta
tion C
onsu
lting
Sync
hro 8
Rep
ort
HCM
Sign
alize
d Inte
rsecti
on C
apac
ity A
nalys
is
Move
ment
WBL
WBR
NBT
NBR
SBL
SBT
Lane
Con
figur
ation
sVo
lume (
vph)
064
963
473
632
613
Ideal
Flow
(vphp
l)19
0019
0019
0019
0019
0019
00Gr
ade (
%)
6%10
%9%
Total
Lost
time (
s)4.0
5.05.0
4.04.0
Lane
Util.
Fac
tor0.8
81.0
01.0
00.9
71.0
0Fr
t0.8
51.0
00.8
51.0
01.0
0Flt
Pro
tected
1.00
1.00
1.00
0.95
1.00
Satd.
Flow
(pro
t)26
5117
3614
7532
1617
45Flt
Per
mitte
d1.0
01.0
01.0
00.9
51.0
0Sa
td. F
low (p
erm)
2651
1736
1475
3216
1745
Peak
-hou
r fac
tor, P
HF0.9
50.9
50.9
50.9
50.9
50.9
5Ad
j. Flow
(vph
)0
683
667
7766
564
5RT
OR R
educ
tion (
vph)
00
035
00
Lane
Gro
up F
low (v
ph)
068
366
742
665
645
Heav
y Veh
icles
(%)
4%4%
4%4%
4%4%
Turn
Typ
eOv
erNA
Perm
Prot
NAPr
otecte
d Pha
ses
12
1Fr
eePe
rmitte
d Pha
ses
2Ac
tuated
Gre
en, G
(s)
20.1
27.1
27.1
20.1
56.2
Effec
tive G
reen
, g (s
)20
.127
.127
.120
.156
.2Ac
tuated
g/C
Ratio
0.36
0.48
0.48
0.36
1.00
Clea
ranc
e Tim
e (s)
4.05.0
5.04.0
Vehic
le Ex
tensio
n (s)
3.03.0
3.03.0
Lane
Grp
Cap
(vph
)94
883
771
111
5017
45v/s
Rati
o Pro
tc0
.26c0
.380.2
10.3
7v/s
Rati
o Per
m0.0
3v/c
Rati
o0.7
20.8
00.0
60.5
80.3
7Un
iform
Dela
y, d1
15.6
12.2
7.814
.60.0
Prog
ress
ion F
actor
1.00
1.00
1.00
1.00
1.00
Incre
menta
l Dela
y, d2
2.75.3
0.00.7
0.6De
lay (s
)18
.317
.57.8
15.3
0.6Le
vel o
f Ser
vice
BB
AB
AAp
proa
ch D
elay (
s)18
.316
.58.1
Appr
oach
LOS
BB
A
Inter
secti
on S
umma
ryHC
M 20
00 C
ontro
l Dela
y12
.9HC
M 20
00 Le
vel o
f Ser
vice
BHC
M 20
00 V
olume
to C
apac
ity ra
tio0.7
6Ac
tuated
Cyc
le Le
ngth
(s)
56.2
Sum
of los
t time
(s)
9.0Int
erse
ction
Cap
acity
Utili
zatio
n63
.6%IC
U Le
vel o
f Ser
vice
BAn
alysis
Per
iod (m
in)15
c C
ritica
l Lan
e Gro
up
1/2/20
15
Centr
al Co
ast T
rans
porta
tion C
onsu
lting
Sync
hro 8
Rep
ort
Queu
es
Lane
Gro
upEB
TEB
RW
BLW
BTNB
LNB
RLa
ne G
roup
Flow
(vph
)60
983
966
291
9v/c
Rati
o0.5
00.0
80.0
60.5
30.3
10.0
3Co
ntrol
Delay
8.62.1
27.4
7.323
.512
.5Qu
eue D
elay
0.00.0
0.00.0
0.00.0
Total
Dela
y8.6
2.127
.47.3
23.5
12.5
Queu
e Len
gth 50
th (ft
)82
03
9425
0Qu
eue L
ength
95th
(ft)
259
1717
201
7011
Inter
nal L
ink D
ist (f
t)31
7136
580
1Tu
rn B
ay Le
ngth
(ft)
320
370
50Ba
se C
apac
ity (v
ph)
1462
1257
144
1647
1009
906
Star
vatio
n Cap
Red
uctn
00
00
00
Spillb
ack C
ap R
educ
tn0
00
00
0St
orag
e Cap
Red
uctn
00
00
00
Redu
ced v
/c Ra
tio0.4
20.0
70.0
60.4
00.0
90.0
1
Inter
secti
on S
umma
ry

1/2/20
15
Centr
al Co
ast T
rans
porta
tion C
onsu
lting
Sync
hro 8
Rep
ort
HCM
2010
Sign
alize
d Inte
rsecti
on S
umma
ry
Move
ment
EBT
EBR
WBL
WBT
NBL
NBR
Lane
Con
figur
ation
sVo
lume (
veh/h
)56
677
861
685
8Nu
mber
414
38
512
Initia
l Q (Q
b), v
eh0
00
00
0Pe
d-Bi
ke A
dj(A_
pbT)
1.00
1.00
1.00
1.00
Parki
ng B
us, A
dj1.0
01.0
01.0
01.0
01.0
01.0
0Ad
j Sat
Flow,
veh/h
/ln17
5917
5917
5017
5016
4516
45Ad
j Flow
Rate
, veh
/h60
983
966
291
0Ad
j No.
of La
nes
11
11
11
Peak
Hou
r Fac
tor0.9
30.9
30.9
30.9
30.9
30.9
3Pe
rcent
Heav
y Veh
, %8
88
88
8Ca
p, ve
h/h96
982
416
1172
112
100
Arriv
e On G
reen
0.55
0.55
0.01
0.67
0.07
0.00
Sat F
low, v
eh/h
1759
1495
1667
1750
1567
1398
Grp V
olume
(v), v
eh/h
609
839
662
910
Grp S
at Flo
w(s),
veh/h
/ln17
5914
9516
6717
5015
6713
98Q
Serve
(g_s
), s
8.71.0
0.27.4
2.10.0
Cycle
Q C
lear(g
_c),
s8.7
1.00.2
7.42.1
0.0Pr
op In
Lane
1.00
1.00
1.00
1.00
Lane
Grp
Cap
(c), v
eh/h
969
824
1611
7211
210
0V/
C Ra
tio(X
)0.6
30.1
00.5
60.5
60.8
20.0
0Av
ail C
ap(c_
a), v
eh/h
2039
1733
182
2411
1282
1144
HCM
Plato
on R
atio
1.00
1.00
1.00
1.00
1.00
1.00
Upstr
eam
Filter
(I)1.0
01.0
01.0
01.0
01.0
00.0
0Un
iform
Dela
y (d)
, s/ve
h5.7
3.918
.13.2
16.8
0.0Inc
r Dela
y (d2
), s/v
eh0.7
0.127
.80.4
13.2
0.0Ini
tial Q
Dela
y(d3)
,s/ve
h0.0
0.00.0
0.00.0
0.0%
ile B
ackO
fQ(5
0%),v
eh/ln
4.20.4
0.23.6
1.30.0
LnGr
p Dela
y(d),s
/veh
6.34.0
45.9
3.630
.00.0
LnGr
p LOS
AA
DA
CAp
proa
ch V
ol, ve
h/h69
267
191
Appr
oach
Dela
y, s/v
eh6.0
4.230
.0Ap
proa
ch LO
SA
AC
Timer
12
34
56
78
Assig
ned P
hs2
34
8Ph
s Dur
ation
(G+Y
+Rc),
s6.6
4.425
.730
.1Ch
ange
Per
iod (Y
+Rc),
s4.0
4.05.5
5.5Ma
x Gre
en S
etting
(Gma
x), s
30.0
4.042
.550
.5Ma
x Q C
lear T
ime (
g_c+
I1), s
4.12.2
10.7
9.4Gr
een E
xt Tim
e (p_
c), s
0.20.0
9.510
.0
Inter
secti
on S
umma
ryHC
M 20
10 C
trl De
lay6.7
HCM
2010
LOS
A
1/2/20
15
Centr
al Co
ast T
rans
porta
tion C
onsu
lting
Sync
hro 8
Rep
ort
HCM
2010
TW
SC
Inter
secti
onInt
Dela
y, s/v
eh1.7
Move
ment
EBL
EBT
EBR
WBL
WBT
WBR
NBL
NBT
NBR
SBL
SBT
SBR
Vol, v
eh/h
455
120
2158
63
180
261
05
Confl
icting
Ped
s, #/h
r0
00
00
00
00
00
0Si
gn C
ontro
l Fr
eeFr
eeFr
eeFr
eeFr
eeFr
eeSt
opSt
opSt
opSt
opSt
opSt
opRT
Cha
nneli
zed
--
None
--
None
--
None
--
None
Stor
age L
ength
400
-70
210
--
--
--
-60
Veh i
n Med
ian S
torag
e, #
-0
--
0-
-0
--
0-
Grad
e, %
-4
--
2-
-7
--
1-
Peak
Hou
r Fac
tor92
9292
9292
9292
9292
9292
92He
avy V
ehicl
es, %
88
88
88
88
88
88
Mvmt
Flow
459
922
2363
73
200
281
05
Major
/Mino
rMa
jor1
Major
2Mi
nor1
Mino
r2Co
nflict
ing F
low A
ll64
00
059
90
012
9212
9459
913
0612
9263
9
S
tage 1
--
--
--
608
608
-68
468
4-
Stag
e 2-
--
--
-68
468
6-
622
608
-Cr
itical
Hdwy
4.18
--
4.18
--
8.58
7.98
6.98
7.38
6.78
6.38
Critic
al Hd
wy S
tg 1
--
--
--
7.58
6.98
-6.3
85.7
8-
Critic
al Hd
wy S
tg 2
--
--
--
7.58
6.98
-6.3
85.7
8-
Follo
w-up
Hdw
y2.2
72-
-2.2
72-
-3.5
724.0
723.3
723.5
724.0
723.3
72Po
t Cap
-1 M
aneu
ver
916
--
949
--
8296
437
124
148
457
Stag
e 1-
--
--
-37
337
6-
413
423
-
S
tage 2
--
--
--
329
336
-44
946
1-
Plato
on bl
ocke
d, %
--
--
Mov C
ap-1
Man
euve
r91
6-
-94
9-
-79
9343
711
314
445
7Mo
v Cap
-2 M
aneu
ver
--
--
--
7993
-11
314
4-
Stag
e 1-
--
--
-37
137
4-
411
413
-
S
tage 2
--
--
--
317
328
-41
845
9-
Appr
oach
EBW
BNB
SBHC
M Co
ntrol
Delay
, s0.1
0.338
.917
HCM
LOS
EC
Mino
r Lan
e/Majo
r Mvm
tNB
Ln1
EBL
EBT
EBR
WBL
WBT
WBR
SBLn
1SBL
n2Ca
pacit
y (ve
h/h)
153
916
--
949
--
113
457
HCM
Lane
V/C
Rati
o0.3
130.0
05-
-0.0
24-
-0.0
10.0
12HC
M Co
ntrol
Delay
(s)
38.9
8.9-
-8.9
--
37.2
13HC
M La
ne LO
SE
A-
-A
--
EB
HCM
95th
%tile
Q(ve
h)1.2
0-
-0.1
--
00

1/2/20
15
Centr
al Co
ast T
rans
porta
tion C
onsu
lting
Sync
hro 8
Rep
ort
Queu
es
Lane
Gro
upW
BRNB
TNB
RSB
LSB
TLa
ne G
roup
Flow
(vph
)10
6937
312
512
5964
1v/c
Rati
o0.7
50.7
10.2
60.7
30.3
7Co
ntrol
Delay
15.4
27.3
13.1
14.1
0.6Qu
eue D
elay
0.00.0
0.00.0
0.0To
tal D
elay
15.4
27.3
13.1
14.1
0.6Qu
eue L
ength
50th
(ft)
153
128
2316
00
Queu
e Len
gth 95
th (ft
)22
618
851
227
0Int
erna
l Link
Dist
(ft)
1614
2081
Turn
Bay
Leng
th (ft
)11
037
0Ba
se C
apac
ity (v
ph)
1759
747
660
2133
1745
Star
vatio
n Cap
Red
uctn
00
00
0Sp
illbac
k Cap
Red
uctn
00
00
0St
orag
e Cap
Red
uctn
00
00
0Re
duce
d v/c
Ratio
0.61
0.50
0.19
0.59
0.37
Inter
secti
on S
umma
ry
1/2/20
15
Centr
al Co
ast T
rans
porta
tion C
onsu
lting
Sync
hro 8
Rep
ort
HCM
Sign
alize
d Inte
rsecti
on C
apac
ity A
nalys
is
Move
ment
WBL
WBR
NBT
NBR
SBL
SBT
Lane
Con
figur
ation
sVo
lume (
vph)
086
630
210
110
2051
9Ide
al Flo
w (vp
hpl)
1900
1900
1900
1900
1900
1900
Grad
e (%
)6%
10%
9%To
tal Lo
st tim
e (s)
4.05.0
5.04.0
4.0La
ne U
til. F
actor
0.88
1.00
1.00
0.97
1.00
Frt
0.85
1.00
0.85
1.00
1.00
Flt P
rotec
ted1.0
01.0
01.0
00.9
51.0
0Sa
td. F
low (p
rot)
2651
1736
1475
3216
1745
Flt P
ermi
tted
1.00
1.00
1.00
0.95
1.00
Satd.
Flow
(per
m)26
5117
3614
7532
1617
45Pe
ak-h
our f
actor
, PHF
0.81
0.81
0.81
0.81
0.81
0.81
Adj. F
low (v
ph)
010
6937
312
512
5964
1RT
OR R
educ
tion (
vph)
00
031
00
Lane
Gro
up F
low (v
ph)
010
6937
394
1259
641
Heav
y Veh
icles
(%)
4%4%
4%4%
4%4%
Turn
Typ
eOv
erNA
Perm
Prot
NAPr
otecte
d Pha
ses
12
1Fr
eePe
rmitte
d Pha
ses
2Ac
tuated
Gre
en, G
(s)
31.4
17.8
17.8
31.4
58.2
Effec
tive G
reen
, g (s
)31
.417
.817
.831
.458
.2Ac
tuated
g/C
Ratio
0.54
0.31
0.31
0.54
1.00
Clea
ranc
e Tim
e (s)
4.05.0
5.04.0
Vehic
le Ex
tensio
n (s)
3.03.0
3.03.0
Lane
Grp
Cap
(vph
)14
3053
045
117
3517
45v/s
Rati
o Pro
tc0
.40c0
.210.3
90.3
7v/s
Rati
o Per
m0.0
6v/c
Rati
o0.7
50.7
00.2
10.7
30.3
7Un
iform
Dela
y, d1
10.3
17.9
15.0
10.1
0.0Pr
ogre
ssion
Fac
tor1.0
01.0
01.0
01.0
01.0
0Inc
reme
ntal D
elay,
d22.2
4.20.2
1.50.6
Delay
(s)
12.5
22.1
15.2
11.7
0.6Le
vel o
f Ser
vice
BC
BB
AAp
proa
ch D
elay (
s)12
.520
.47.9
Appr
oach
LOS
BC
A
Inter
secti
on S
umma
ryHC
M 20
00 C
ontro
l Dela
y11
.1HC
M 20
00 Le
vel o
f Ser
vice
BHC
M 20
00 V
olume
to C
apac
ity ra
tio0.7
3Ac
tuated
Cyc
le Le
ngth
(s)
58.2
Sum
of los
t time
(s)
9.0Int
erse
ction
Cap
acity
Utili
zatio
n53
.7%IC
U Le
vel o
f Ser
vice
AAn
alysis
Per
iod (m
in)15
c C
ritica
l Lan
e Gro
up

1/2/20
15
Centr
al Co
ast T
rans
porta
tion C
onsu
lting
Sync
hro 8
Rep
ort
Queu
es
Lane
Gro
upEB
TEB
RW
BLW
BTNB
LNB
RLa
ne G
roup
Flow
(vph
)76
517
348
1101
100
17v/c
Rati
o0.6
30.1
60.5
30.8
10.4
70.0
8Co
ntrol
Delay
12.2
1.656
.614
.435
.913
.1Qu
eue D
elay
0.00.0
0.00.0
0.00.0
Total
Dela
y12
.21.6
56.6
14.4
35.9
13.1
Queu
e Len
gth 50
th (ft
)20
10
2127
541
0Qu
eue L
ength
95th
(ft)
305
17#5
7#4
5774
13Int
erna
l Link
Dist
(ft)
3171
365
801
Turn
Bay
Leng
th (ft
)32
037
050
Base
Cap
acity
(vph
)12
1710
8890
1363
640
582
Star
vatio
n Cap
Red
uctn
00
00
00
Spillb
ack C
ap R
educ
tn0
00
00
0St
orag
e Cap
Red
uctn
00
00
00
Redu
ced v
/c Ra
tio0.6
30.1
60.5
30.8
10.1
60.0
3
Inter
secti
on S
umma
ry#
95th
perce
ntile
volum
e exc
eeds
capa
city,
queu
e may
be lo
nger
.
Que
ue sh
own i
s max
imum
after
two c
ycles
.
1/2/20
15
Centr
al Co
ast T
rans
porta
tion C
onsu
lting
Sync
hro 8
Rep
ort
HCM
2010
Sign
alize
d Inte
rsecti
on S
umma
ry
Move
ment
EBT
EBR
WBL
WBT
NBL
NBR
Lane
Con
figur
ation
sVo
lume (
veh/h
)62
014
039
892
8114
Numb
er4
143
85
12Ini
tial Q
(Qb)
, veh
00
00
00
Ped-
Bike
Adj(
A_pb
T)1.0
01.0
01.0
01.0
0Pa
rking
Bus
, Adj
1.00
1.00
1.00
1.00
1.00
1.00
Adj S
at Flo
w, ve
h/h/ln
1759
1759
1750
1750
1645
1645
Adj F
low R
ate, v
eh/h
765
173
4811
0110
00
Adj N
o. of
Lane
s1
11
11
1Pe
ak H
our F
actor
0.81
0.81
0.81
0.81
0.81
0.81
Perce
nt He
avy V
eh, %
88
88
88
Cap,
veh/h
1123
954
6313
0912
711
3Ar
rive O
n Gre
en0.6
40.6
40.0
40.7
50.0
80.0
0Sa
t Flow
, veh
/h17
5914
9516
6717
5015
6713
98Gr
p Volu
me(v)
, veh
/h76
517
348
1101
100
0Gr
p Sat
Flow(
s),ve
h/h/ln
1759
1495
1667
1750
1567
1398
Q Se
rve(g
_s),
s15
.52.6
1.623
.73.5
0.0Cy
cle Q
Clea
r(g_c
), s
15.5
2.61.6
23.7
3.50.0
Prop
In La
ne1.0
01.0
01.0
01.0
0La
ne G
rp C
ap(c)
, veh
/h11
2395
463
1309
127
113
V/C
Ratio
(X)
0.68
0.18
0.76
0.84
0.79
0.00
Avail
Cap
(c_a)
, veh
/h13
4611
4412
015
9184
675
5HC
M Pl
atoon
Rati
o1.0
01.0
01.0
01.0
01.0
01.0
0Up
strea
m Fil
ter(I)
1.00
1.00
1.00
1.00
1.00
0.00
Unifo
rm D
elay (
d), s
/veh
6.44.1
26.5
4.825
.10.0
Incr D
elay (
d2),
s/veh
1.10.1
17.3
3.610
.20.0
Initia
l Q D
elay(d
3),s/
veh
0.00.0
0.00.0
0.00.0
%ile
Bac
kOfQ
(50%
),veh
/ln7.6
1.11.0
12.3
1.90.0
LnGr
p Dela
y(d),s
/veh
7.54.2
43.8
8.335
.30.0
LnGr
p LOS
AA
DA
DAp
proa
ch V
ol, ve
h/h93
811
4910
0Ap
proa
ch D
elay,
s/veh
6.99.8
35.3
Appr
oach
LOS
AA
D
Timer
12
34
56
78
Assig
ned P
hs2
34
8Ph
s Dur
ation
(G+Y
+Rc),
s8.5
6.141
.047
.1Ch
ange
Per
iod (Y
+Rc),
s4.0
4.05.5
5.5Ma
x Gre
en S
etting
(Gma
x), s
30.0
4.042
.550
.5Ma
x Q C
lear T
ime (
g_c+
I1), s
5.53.6
17.5
25.7
Gree
n Ext
Time (
p_c),
s0.2
0.015
.915
.8
Inter
secti
on S
umma
ryHC
M 20
10 C
trl De
lay9.7
HCM
2010
LOS
A

1/2/20
15
Centr
al Co
ast T
rans
porta
tion C
onsu
lting
Sync
hro 8
Rep
ort
HCM
2010
TW
SC
Inter
secti
onInt
Dela
y, s/v
eh2.8
Move
ment
EBL
EBT
EBR
WBL
WBT
WBR
NBL
NBT
NBR
SBL
SBT
SBR
Vol, v
eh/h
338
853
4262
610
310
303
46
Confl
icting
Ped
s, #/h
r0
00
00
00
00
00
0Si
gn C
ontro
l Fr
eeFr
eeFr
eeFr
eeFr
eeFr
eeSt
opSt
opSt
opSt
opSt
opSt
opRT
Cha
nneli
zed
--
None
--
None
--
None
--
None
Stor
age L
ength
400
-70
210
--
--
--
-60
Veh i
n Med
ian S
torag
e, #
-0
--
0-
-0
--
0-
Grad
e, %
-4
--
2-
-7
--
1-
Peak
Hou
r Fac
tor93
9393
9393
9393
9393
9393
93He
avy V
ehicl
es, %
88
88
88
88
88
88
Mvmt
Flow
341
757
4567
311
330
323
46
Major
/Mino
rMa
jor1
Major
2Mi
nor1
Mino
r2Co
nflict
ing F
low A
ll68
40
041
70
011
9511
9841
712
0911
9367
8
S
tage 1
--
--
--
424
424
-76
976
9-
Stag
e 2-
--
--
-77
177
4-
440
424
-Cr
itical
Hdwy
4.18
--
4.18
--
8.58
7.98
6.98
7.38
6.78
6.38
Critic
al Hd
wy S
tg 1
--
--
--
7.58
6.98
-6.3
85.7
8-
Critic
al Hd
wy S
tg 2
--
--
--
7.58
6.98
-6.3
85.7
8-
Follo
w-up
Hdw
y2.2
72-
-2.2
72-
-3.5
724.0
723.3
723.5
724.0
723.3
72Po
t Cap
-1 M
aneu
ver
882
--
1110
--
100
113
575
145
170
434
Stag
e 1-
--
--
-50
648
9-
369
385
-
S
tage 2
--
--
--
284
296
-57
056
3-
Plato
on bl
ocke
d, %
--
--
Mov C
ap-1
Man
euve
r88
2-
-11
10-
-93
108
575
132
163
434
Mov C
ap-2
Man
euve
r-
--
--
-93
108
-13
216
3-
Stag
e 1-
--
--
-50
448
7-
368
369
-
S
tage 2
--
--
--
265
284
-53
656
1-
Appr
oach
EBW
BNB
SBHC
M Co
ntrol
Delay
, s0.1
0.543
.122
.7HC
M LO
SE
C
Mino
r Lan
e/Majo
r Mvm
tNB
Ln1
EBL
EBT
EBR
WBL
WBT
WBR
SBLn
1SBL
n2Ca
pacit
y (ve
h/h)
158
882
--
1110
--
148
434
HCM
Lane
V/C
Rati
o0.4
150.0
04-
-0.0
41-
-0.0
510.0
15HC
M Co
ntrol
Delay
(s)
43.1
9.1-
-8.4
--
30.6
13.4
HCM
Lane
LOS
EA
--
A-
-D
BHC
M 95
th %
tile Q
(veh)
1.80
--
0.1-
-0.2
0
1/2/20
15
Centr
al Co
ast T
rans
porta
tion C
onsu
lting
Sync
hro 8
Rep
ort
Queu
es
Lane
Gro
upW
BRNB
TNB
RSB
LSB
TLa
ne G
roup
Flow
(vph
)92
477
076
884
657
v/c R
atio
0.88
0.91
0.10
0.69
0.38
Contr
ol De
lay35
.135
.66.3
24.9
0.6Qu
eue D
elay
0.00.0
0.00.0
0.0To
tal D
elay
35.1
35.6
6.324
.90.6
Queu
e Len
gth 50
th (ft
)27
436
59
213
0Qu
eue L
ength
95th
(ft)
#407
#609
3028
20
Inter
nal L
ink D
ist (f
t)16
1420
81Tu
rn B
ay Le
ngth
(ft)
110
370
Base
Cap
acity
(vph
)11
5399
386
214
0017
45St
arva
tion C
ap R
educ
tn0
00
00
Spillb
ack C
ap R
educ
tn0
00
00
Stor
age C
ap R
educ
tn0
00
00
Redu
ced v
/c Ra
tio0.8
00.7
80.0
90.6
30.3
8
Inter
secti
on S
umma
ry#
95th
perce
ntile
volum
e exc
eeds
capa
city,
queu
e may
be lo
nger
.
Que
ue sh
own i
s max
imum
after
two c
ycles
.

1/2/20
15
Centr
al Co
ast T
rans
porta
tion C
onsu
lting
Sync
hro 8
Rep
ort
HCM
Sign
alize
d Inte
rsecti
on C
apac
ity A
nalys
is
Move
ment
WBL
WBR
NBT
NBR
SBL
SBT
Lane
Con
figur
ation
sVo
lume (
vph)
085
971
671
822
611
Ideal
Flow
(vphp
l)19
0019
0019
0019
0019
0019
00Gr
ade (
%)
6%10
%9%
Total
Lost
time (
s)4.0
5.05.0
4.04.0
Lane
Util.
Fac
tor0.8
81.0
01.0
00.9
71.0
0Fr
t0.8
51.0
00.8
51.0
01.0
0Flt
Pro
tected
1.00
1.00
1.00
0.95
1.00
Satd.
Flow
(pro
t)26
5117
3614
7532
1617
45Flt
Per
mitte
d1.0
01.0
01.0
00.9
51.0
0Sa
td. F
low (p
erm)
2651
1736
1475
3216
1745
Peak
-hou
r fac
tor, P
HF0.9
30.9
30.9
30.9
30.9
30.9
3Ad
j. Flow
(vph
)0
924
770
7688
465
7RT
OR R
educ
tion (
vph)
00
022
00
Lane
Gro
up F
low (v
ph)
092
477
054
884
657
Heav
y Veh
icles
(%)
4%4%
4%4%
4%4%
Turn
Typ
eOv
erNA
Perm
Prot
NAPr
otecte
d Pha
ses
12
1Fr
eePe
rmitte
d Pha
ses
2Ac
tuated
Gre
en, G
(s)
32.8
40.4
40.4
32.8
82.2
Effec
tive G
reen
, g (s
)32
.840
.440
.432
.882
.2Ac
tuated
g/C
Ratio
0.40
0.49
0.49
0.40
1.00
Clea
ranc
e Tim
e (s)
4.05.0
5.04.0
Vehic
le Ex
tensio
n (s)
3.03.0
3.03.0
Lane
Grp
Cap
(vph
)10
5785
372
412
8317
45v/s
Rati
o Pro
tc0
.35c0
.440.2
70.3
8v/s
Rati
o Per
m0.0
4v/c
Rati
o0.8
70.9
00.0
70.6
90.3
8Un
iform
Dela
y, d1
22.8
19.1
11.0
20.5
0.0Pr
ogre
ssion
Fac
tor1.0
01.0
01.0
01.0
01.0
0Inc
reme
ntal D
elay,
d28.2
12.7
0.01.6
0.6De
lay (s
)31
.031
.811
.122
.00.6
Leve
l of S
ervic
eC
CB
CA
Appr
oach
Dela
y (s)
31.0
30.0
12.9
Appr
oach
LOS
CC
B
Inter
secti
on S
umma
ryHC
M 20
00 C
ontro
l Dela
y22
.3HC
M 20
00 Le
vel o
f Ser
vice
CHC
M 20
00 V
olume
to C
apac
ity ra
tio0.8
9Ac
tuated
Cyc
le Le
ngth
(s)
82.2
Sum
of los
t time
(s)
9.0Int
erse
ction
Cap
acity
Utili
zatio
n75
.2%IC
U Le
vel o
f Ser
vice
DAn
alysis
Per
iod (m
in)15
c C
ritica
l Lan
e Gro
up
1/2/20
15
Centr
al Co
ast T
rans
porta
tion C
onsu
lting
Sync
hro 8
Rep
ort
Queu
es
Lane
Gro
upEB
TEB
RW
BLW
BTNB
LNB
RLa
ne G
roup
Flow
(vph
)99
412
59
615
156
35v/c
Rati
o0.8
40.1
20.1
00.5
00.5
80.1
3Co
ntrol
Delay
19.6
1.935
.17.5
35.8
10.1
Queu
e Dela
y0.0
0.00.0
0.00.0
0.0To
tal D
elay
19.6
1.935
.17.5
35.8
10.1
Queu
e Len
gth 50
th (ft
)24
50
410
160
0Qu
eue L
ength
95th
(ft)
#749
2219
219
120
22Int
erna
l Link
Dist
(ft)
3171
365
801
Turn
Bay
Leng
th (ft
)32
037
050
Base
Cap
acity
(vph
)11
8810
5092
1276
653
604
Star
vatio
n Cap
Red
uctn
00
00
00
Spillb
ack C
ap R
educ
tn0
00
00
0St
orag
e Cap
Red
uctn
00
00
00
Redu
ced v
/c Ra
tio0.8
40.1
20.1
00.4
80.2
40.0
6
Inter
secti
on S
umma
ry#
95th
perce
ntile
volum
e exc
eeds
capa
city,
queu
e may
be lo
nger
.
Que
ue sh
own i
s max
imum
after
two c
ycles
.
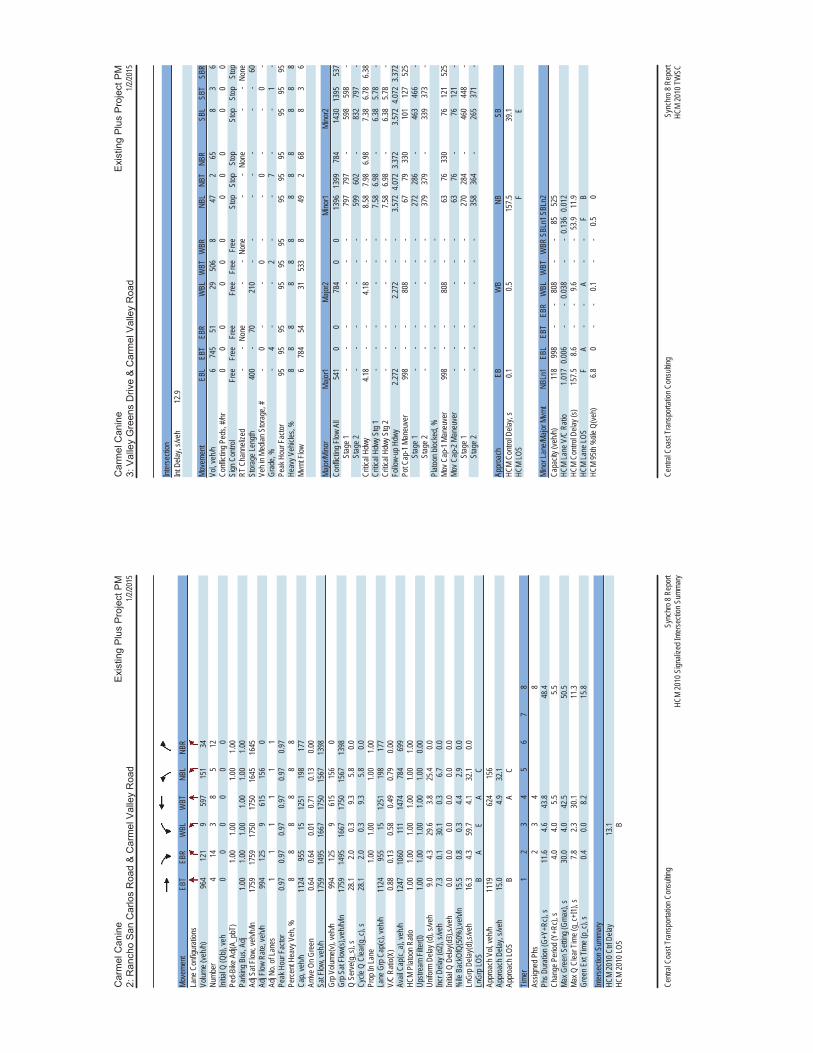
1/2/20
15
Centr
al Co
ast T
rans
porta
tion C
onsu
lting
Sync
hro 8
Rep
ort
HCM
2010
Sign
alize
d Inte
rsecti
on S
umma
ry
Move
ment
EBT
EBR
WBL
WBT
NBL
NBR
Lane
Con
figur
ation
sVo
lume (
veh/h
)96
412
19
597
151
34Nu
mber
414
38
512
Initia
l Q (Q
b), v
eh0
00
00
0Pe
d-Bi
ke A
dj(A_
pbT)
1.00
1.00
1.00
1.00
Parki
ng B
us, A
dj1.0
01.0
01.0
01.0
01.0
01.0
0Ad
j Sat
Flow,
veh/h
/ln17
5917
5917
5017
5016
4516
45Ad
j Flow
Rate
, veh
/h99
412
59
615
156
0Ad
j No.
of La
nes
11
11
11
Peak
Hou
r Fac
tor0.9
70.9
70.9
70.9
70.9
70.9
7Pe
rcent
Heav
y Veh
, %8
88
88
8Ca
p, ve
h/h11
2495
515
1251
198
177
Arriv
e On G
reen
0.64
0.64
0.01
0.71
0.13
0.00
Sat F
low, v
eh/h
1759
1495
1667
1750
1567
1398
Grp V
olume
(v), v
eh/h
994
125
961
515
60
Grp S
at Flo
w(s),
veh/h
/ln17
5914
9516
6717
5015
6713
98Q
Serve
(g_s
), s
28.1
2.00.3
9.35.8
0.0Cy
cle Q
Clea
r(g_c
), s
28.1
2.00.3
9.35.8
0.0Pr
op In
Lane
1.00
1.00
1.00
1.00
Lane
Grp
Cap
(c), v
eh/h
1124
955
1512
5119
817
7V/
C Ra
tio(X
)0.8
80.1
30.5
80.4
90.7
90.0
0Av
ail C
ap(c_
a), v
eh/h
1247
1060
111
1474
784
699
HCM
Plato
on R
atio
1.00
1.00
1.00
1.00
1.00
1.00
Upstr
eam
Filter
(I)1.0
01.0
01.0
01.0
01.0
00.0
0Un
iform
Dela
y (d)
, s/ve
h9.0
4.329
.63.8
25.4
0.0Inc
r Dela
y (d2
), s/v
eh7.3
0.130
.10.3
6.70.0
Initia
l Q D
elay(d
3),s/
veh
0.00.0
0.00.0
0.00.0
%ile
Bac
kOfQ
(50%
),veh
/ln15
.50.8
0.34.4
2.90.0
LnGr
p Dela
y(d),s
/veh
16.3
4.359
.74.1
32.1
0.0Ln
Grp L
OSB
AE
AC
Appr
oach
Vol,
veh/h
1119
624
156
Appr
oach
Dela
y, s/v
eh15
.04.9
32.1
Appr
oach
LOS
BA
C
Timer
12
34
56
78
Assig
ned P
hs2
34
8Ph
s Dur
ation
(G+Y
+Rc),
s11
.64.6
43.8
48.4
Chan
ge P
eriod
(Y+R
c), s
4.04.0
5.55.5
Max G
reen
Sett
ing (G
max),
s30
.04.0
42.5
50.5
Max Q
Clea
r Tim
e (g_
c+I1)
, s7.8
2.330
.111
.3Gr
een E
xt Tim
e (p_
c), s
0.40.0
8.215
.8
Inter
secti
on S
umma
ryHC
M 20
10 C
trl De
lay13
.1HC
M 20
10 LO
SB
1/2/20
15
Centr
al Co
ast T
rans
porta
tion C
onsu
lting
Sync
hro 8
Rep
ort
HCM
2010
TW
SC
Inter
secti
onInt
Dela
y, s/v
eh12
.9
Move
ment
EBL
EBT
EBR
WBL
WBT
WBR
NBL
NBT
NBR
SBL
SBT
SBR
Vol, v
eh/h
674
551
2950
68
472
658
36
Confl
icting
Ped
s, #/h
r0
00
00
00
00
00
0Si
gn C
ontro
l Fr
eeFr
eeFr
eeFr
eeFr
eeFr
eeSt
opSt
opSt
opSt
opSt
opSt
opRT
Cha
nneli
zed
--
None
--
None
--
None
--
None
Stor
age L
ength
400
-70
210
--
--
--
-60
Veh i
n Med
ian S
torag
e, #
-0
--
0-
-0
--
0-
Grad
e, %
-4
--
2-
-7
--
1-
Peak
Hou
r Fac
tor95
9595
9595
9595
9595
9595
95He
avy V
ehicl
es, %
88
88
88
88
88
88
Mvmt
Flow
678
454
3153
38
492
688
36
Major
/Mino
rMa
jor1
Major
2Mi
nor1
Mino
r2Co
nflict
ing F
low A
ll54
10
078
40
013
9613
9978
414
3013
9553
7
S
tage 1
--
--
--
797
797
-59
859
8-
Stag
e 2-
--
--
-59
960
2-
832
797
-Cr
itical
Hdwy
4.18
--
4.18
--
8.58
7.98
6.98
7.38
6.78
6.38
Critic
al Hd
wy S
tg 1
--
--
--
7.58
6.98
-6.3
85.7
8-
Critic
al Hd
wy S
tg 2
--
--
--
7.58
6.98
-6.3
85.7
8-
Follo
w-up
Hdw
y2.2
72-
-2.2
72-
-3.5
724.0
723.3
723.5
724.0
723.3
72Po
t Cap
-1 M
aneu
ver
998
--
808
--
6779
330
101
127
525
Stag
e 1-
--
--
-27
228
6-
463
466
-
S
tage 2
--
--
--
379
379
-33
937
3-
Plato
on bl
ocke
d, %
--
--
Mov C
ap-1
Man
euve
r99
8-
-80
8-
-63
7633
076
121
525
Mov C
ap-2
Man
euve
r-
--
--
-63
76-
7612
1-
Stag
e 1-
--
--
-27
028
4-
460
448
-
S
tage 2
--
--
--
358
364
-26
537
1-
Appr
oach
EBW
BNB
SBHC
M Co
ntrol
Delay
, s0.1
0.515
7.539
.1HC
M LO
SF
E
Mino
r Lan
e/Majo
r Mvm
tNB
Ln1
EBL
EBT
EBR
WBL
WBT
WBR
SBLn
1SBL
n2Ca
pacit
y (ve
h/h)
118
998
--
808
--
8552
5HC
M La
ne V
/C R
atio
1.017
0.006
--
0.038
--
0.136
0.012
HCM
Contr
ol De
lay (s
)15
7.58.6
--
9.6-
-53
.911
.9HC
M La
ne LO
SF
A-
-A
--
FB
HCM
95th
%tile
Q(ve
h)6.8
0-
-0.1
--
0.50

1/5/20
15
Centr
al Co
ast T
rans
porta
tion C
onsu
lting
Sync
hro 8
Rep
ort
HCM
Unsig
naliz
ed In
terse
ction
Cap
acity
Ana
lysis
Move
ment
EBL
EBT
EBR
WBL
WBT
WBR
NBL
NBT
NBR
SBL
SBT
SBR
Lane
Con
figur
ation
sVo
lume (
veh/h
)6
745
5129
506
847
265
83
6Si
gn C
ontro
lFr
eeFr
eeSt
opSt
opGr
ade
4%2%
7%1%
Peak
Hou
r Fac
tor0.9
50.9
50.9
50.9
50.9
50.9
50.9
50.9
50.9
50.9
50.9
50.9
5Ho
urly
flow
rate
(vph)
678
454
3153
38
492
688
36
Pede
strian
sLa
ne W
idth (
ft)W
alking
Spe
ed (f
t/s)
Perce
nt Bl
ocka
geRi
ght tu
rn fla
re (v
eh)
2Me
dian t
ype
None
None
Media
n stor
age v
eh)
Upstr
eam
signa
l (ft)
pX, p
latoo
n unb
locke
dvC
, con
flictin
g volu
me54
183
813
9513
9978
414
6414
4853
7vC
1, sta
ge 1
conf
vol
vC2,
stage
2 co
nf vo
lvC
u, un
block
ed vo
l54
183
813
9513
9978
414
6414
4853
7tC
, sing
le (s)
4.24.2
7.26.6
6.37.2
6.66.3
tC, 2
stag
e (s)
tF (s
)2.3
2.33.6
4.13.4
3.64.1
3.4p0
queu
e fre
e %99
9654
9882
9097
99cM
capa
city (
veh/h
)99
877
110
713
038
381
121
532
Dire
ction
, Lan
e #EB
1EB
2EB
3W
B 1
WB
2NB
1NB
2SB
1Vo
lume T
otal
678
454
3154
152
6818
Volum
e Left
60
031
049
08
Volum
e Righ
t0
054
08
068
6cS
H99
817
0017
0077
117
0010
838
314
2Vo
lume t
o Cap
acity
0.01
0.46
0.03
0.04
0.32
0.48
0.18
0.13
Queu
e Len
gth 95
th (ft
)0
00
30
5316
11Co
ntrol
Delay
(s)
8.60.0
0.09.9
0.065
.816
.436
.4La
ne LO
SA
AF
CE
Appr
oach
Dela
y (s)
0.10.5
37.6
36.4
Appr
oach
LOS
EE
Inter
secti
on S
umma
ryAv
erag
e Dela
y 3.6
Inter
secti
on C
apac
ity U
tiliza
tion
56.6%
ICU
Leve
l of S
ervic
e B
Analy
sis P
eriod
(min)
15
1/5/20
15
Centr
al Co
ast T
rans
porta
tion C
onsu
lting
Sync
hro 8
Rep
ort
HCM
2010
TW
SC
Inter
secti
onInt
Dela
y, s/v
eh7.2
Move
ment
EBL
EBT
EBR
WBL
WBT
WBR
NBL
NBT
NBR
SBL
SBT
SBR
Vol, v
eh/h
674
551
2950
68
472
658
36
Confl
icting
Ped
s, #/h
r0
00
00
00
00
00
0Si
gn C
ontro
l Fr
eeFr
eeFr
eeFr
eeFr
eeFr
eeSt
opSt
opSt
opSt
opSt
opSt
opRT
Cha
nneli
zed
--
None
--
None
--
None
--
None
Stor
age L
ength
400
-70
210
--
100
-0
--
60Ve
h in M
edian
Stor
age,
#-
0-
-0
--
0-
-0
-Gr
ade,
%-
4-
-2
--
7-
-1
-Pe
ak H
our F
actor
9595
9595
9595
9595
9595
9595
Heav
y Veh
icles
, %8
88
88
88
88
88
8Mv
mt F
low6
784
5431
533
849
268
83
6
Major
/Mino
rMa
jor1
Major
2Mi
nor1
Mino
r2Co
nflict
ing F
low A
ll54
10
078
40
013
9613
9978
413
9613
9553
7
S
tage 1
--
--
--
797
797
-59
859
8-
Stag
e 2-
--
--
-59
960
2-
798
797
-Cr
itical
Hdwy
4.18
--
4.18
--
8.58
7.98
6.98
7.38
6.78
6.38
Critic
al Hd
wy S
tg 1
--
--
--
7.58
6.98
-6.3
85.7
8-
Critic
al Hd
wy S
tg 2
--
--
--
7.58
6.98
-6.3
85.7
8-
Follo
w-up
Hdw
y2.2
72-
-2.2
72-
-3.5
724.0
723.3
723.5
724.0
723.3
72Po
t Cap
-1 M
aneu
ver
998
--
808
--
6779
330
106
127
525
Stag
e 1-
--
--
-27
228
6-
463
466
-
S
tage 2
--
--
--
379
379
-35
537
3-
Plato
on bl
ocke
d, %
--
--
Mov C
ap-1
Man
euve
r99
8-
-80
8-
-63
7633
079
121
525
Mov C
ap-2
Man
euve
r-
--
--
-63
76-
7912
1-
Stag
e 1-
--
--
-27
028
4-
460
448
-
S
tage 2
--
--
--
358
364
-27
837
1-
Appr
oach
EBW
BNB
SBHC
M Co
ntrol
Delay
, s0.1
0.584
.638
.2HC
M LO
SF
E
Mino
r Lan
e/Majo
r Mvm
tNB
Ln1N
BLn2
EBL
EBT
EBR
WBL
WBT
WBR
SBLn
1SBL
n2Ca
pacit
y (ve
h/h)
6333
099
8-
-80
8-
-87
525
HCM
Lane
V/C
Rati
o0.8
190.2
070.0
06-
-0.0
38-
-0.1
330.0
12HC
M Co
ntrol
Delay
(s)
172.1
18.7
8.6-
-9.6
--
52.6
11.9
HCM
Lane
LOS
FC
A-
-A
--
FB
HCM
95th
%tile
Q(ve
h)3.7
0.80
--
0.1-
-0.4
0

1/2/20
15
Centr
al Co
ast T
rans
porta
tion C
onsu
lting
Sync
hro 8
Rep
ort
Queu
es
Lane
Gro
upW
BRNB
TNB
RSB
LSB
TLa
ne G
roup
Flow
(vph
)10
3178
764
940
551
v/c R
atio
0.93
0.93
0.09
0.70
0.32
Contr
ol De
lay43
.242
.28.1
26.8
0.5Qu
eue D
elay
0.00.0
0.00.0
0.0To
tal D
elay
43.2
42.2
8.126
.80.5
Queu
e Len
gth 50
th (ft
)35
244
010
252
0Qu
eue L
ength
95th
(ft)
#507
#699
3232
50
Inter
nal L
ink D
ist (f
t)16
1420
81Tu
rn B
ay Le
ngth
(ft)
110
370
Base
Cap
acity
(vph
)11
5692
480
014
0317
45St
arva
tion C
ap R
educ
tn0
00
00
Spillb
ack C
ap R
educ
tn0
00
00
Stor
age C
ap R
educ
tn0
00
00
Redu
ced v
/c Ra
tio0.8
90.8
50.0
80.6
70.3
2
Inter
secti
on S
umma
ry#
95th
perce
ntile
volum
e exc
eeds
capa
city,
queu
e may
be lo
nger
.
Que
ue sh
own i
s max
imum
after
two c
ycles
.
1/2/20
15
Centr
al Co
ast T
rans
porta
tion C
onsu
lting
Sync
hro 8
Rep
ort
HCM
Sign
alize
d Inte
rsecti
on C
apac
ity A
nalys
is
Move
ment
WBL
WBR
NBT
NBR
SBL
SBT
Lane
Con
figur
ation
sVo
lume (
vph)
096
974
060
884
518
Ideal
Flow
(vphp
l)19
0019
0019
0019
0019
0019
00Gr
ade (
%)
6%10
%9%
Total
Lost
time (
s)4.0
5.05.0
4.04.0
Lane
Util.
Fac
tor0.8
81.0
01.0
00.9
71.0
0Fr
t0.8
51.0
00.8
51.0
01.0
0Flt
Pro
tected
1.00
1.00
1.00
0.95
1.00
Satd.
Flow
(pro
t)26
5117
3614
7532
1617
45Flt
Per
mitte
d1.0
01.0
01.0
00.9
51.0
0Sa
td. F
low (p
erm)
2651
1736
1475
3216
1745
Peak
-hou
r fac
tor, P
HF0.9
40.9
40.9
40.9
40.9
40.9
4Ad
j. Flow
(vph
)0
1031
787
6494
055
1RT
OR R
educ
tion (
vph)
00
016
00
Lane
Gro
up F
low (v
ph)
010
3178
748
940
551
Heav
y Veh
icles
(%)
4%4%
4%4%
4%4%
Turn
Typ
eOv
erNA
Perm
Prot
NAPr
otecte
d Pha
ses
12
1Fr
eePe
rmitte
d Pha
ses
2Ac
tuated
Gre
en, G
(s)
39.5
46.2
46.2
39.5
94.7
Effec
tive G
reen
, g (s
)39
.546
.246
.239
.594
.7Ac
tuated
g/C
Ratio
0.42
0.49
0.49
0.42
1.00
Clea
ranc
e Tim
e (s)
4.05.0
5.04.0
Vehic
le Ex
tensio
n (s)
3.03.0
3.03.0
Lane
Grp
Cap
(vph
)11
0584
671
913
4117
45v/s
Rati
o Pro
tc0
.39c0
.450.2
90.3
2v/s
Rati
o Per
m0.0
3v/c
Rati
o0.9
30.9
30.0
70.7
00.3
2Un
iform
Dela
y, d1
26.3
22.7
12.8
22.7
0.0Pr
ogre
ssion
Fac
tor1.0
01.0
01.0
01.0
01.0
0Inc
reme
ntal D
elay,
d213
.816
.50.0
1.70.5
Delay
(s)
40.2
39.3
12.9
24.4
0.5Le
vel o
f Ser
vice
DD
BC
AAp
proa
ch D
elay (
s)40
.237
.315
.6Ap
proa
ch LO
SD
DB
Inter
secti
on S
umma
ryHC
M 20
00 C
ontro
l Dela
y28
.6HC
M 20
00 Le
vel o
f Ser
vice
CHC
M 20
00 V
olume
to C
apac
ity ra
tio0.9
3Ac
tuated
Cyc
le Le
ngth
(s)
94.7
Sum
of los
t time
(s)
9.0Int
erse
ction
Cap
acity
Utili
zatio
n80
.3%IC
U Le
vel o
f Ser
vice
DAn
alysis
Per
iod (m
in)15
c C
ritica
l Lan
e Gro
up

1/2/20
15
Centr
al Co
ast T
rans
porta
tion C
onsu
lting
Sync
hro 8
Rep
ort
Queu
es
Lane
Gro
upEB
TEB
RW
BLW
BTNB
LNB
RLa
ne G
roup
Flow
(vph
)92
411
016
657
178
44v/c
Rati
o0.8
10.1
10.1
80.5
60.5
70.1
5Co
ntrol
Delay
19.6
1.953
.79.2
41.1
18.3
Queu
e Dela
y0.0
0.00.0
0.00.0
0.0To
tal D
elay
19.6
1.953
.79.2
41.1
18.3
Queu
e Len
gth 50
th (ft
)26
10
714
169
5Qu
eue L
ength
95th
(ft)
715
2036
293
191
40Int
erna
l Link
Dist
(ft)
3171
365
801
Turn
Bay
Leng
th (ft
)32
037
050
Base
Cap
acity
(vph
)15
2113
0787
1564
615
568
Star
vatio
n Cap
Red
uctn
00
00
00
Spillb
ack C
ap R
educ
tn0
00
00
0St
orag
e Cap
Red
uctn
00
00
00
Redu
ced v
/c Ra
tio0.6
10.0
80.1
80.4
20.2
90.0
8
Inter
secti
on S
umma
ry
1/2/20
15
Centr
al Co
ast T
rans
porta
tion C
onsu
lting
Sync
hro 8
Rep
ort
HCM
2010
Sign
alize
d Inte
rsecti
on S
umma
ry
Move
ment
EBT
EBR
WBL
WBT
NBL
NBR
Lane
Con
figur
ation
sVo
lume (
veh/h
)89
610
716
637
173
43Nu
mber
414
38
512
Initia
l Q (Q
b), v
eh0
00
00
0Pe
d-Bi
ke A
dj(A_
pbT)
1.00
1.00
1.00
1.00
Parki
ng B
us, A
dj1.0
01.0
01.0
01.0
01.0
01.0
0Ad
j Sat
Flow,
veh/h
/ln17
5917
5917
5017
5016
4516
45Ad
j Flow
Rate
, veh
/h92
411
016
657
178
0Ad
j No.
of La
nes
11
11
11
Peak
Hou
r Fac
tor0.9
70.9
70.9
70.9
70.9
70.9
7Pe
rcent
Heav
y Veh
, %8
88
88
8Ca
p, ve
h/h11
3696
626
1260
221
198
Arriv
e On G
reen
0.65
0.65
0.02
0.72
0.14
0.00
Sat F
low, v
eh/h
1759
1495
1667
1750
1567
1398
Grp V
olume
(v), v
eh/h
924
110
1665
717
80
Grp S
at Flo
w(s),
veh/h
/ln17
5914
9516
6717
5015
6713
98Q
Serve
(g_s
), s
26.8
1.90.7
11.5
7.50.0
Cycle
Q C
lear(g
_c),
s26
.81.9
0.711
.57.5
0.0Pr
op In
Lane
1.00
1.00
1.00
1.00
Lane
Grp
Cap
(c), v
eh/h
1136
966
2612
6022
119
8V/
C Ra
tio(X
)0.8
10.1
10.6
30.5
20.8
00.0
0Av
ail C
ap(c_
a), v
eh/h
1865
1585
9820
6168
761
3HC
M Pl
atoon
Rati
o1.0
01.0
01.0
01.0
01.0
01.0
0Up
strea
m Fil
ter(I)
1.00
1.00
1.00
1.00
1.00
0.00
Unifo
rm D
elay (
d), s
/veh
9.04.6
33.5
4.328
.40.0
Incr D
elay (
d2),
s/veh
1.50.1
22.5
0.36.7
0.0Ini
tial Q
Dela
y(d3)
,s/ve
h0.0
0.00.0
0.00.0
0.0%
ile B
ackO
fQ(5
0%),v
eh/ln
13.3
0.80.5
5.63.7
0.0Ln
Grp D
elay(d
),s/ve
h10
.54.7
55.9
4.635
.10.0
LnGr
p LOS
BA
EA
DAp
proa
ch V
ol, ve
h/h10
3467
317
8Ap
proa
ch D
elay,
s/veh
9.95.9
35.1
Appr
oach
LOS
AA
D
Timer
12
34
56
78
Assig
ned P
hs2
34
8Ph
s Dur
ation
(G+Y
+Rc),
s13
.75.0
49.7
54.7
Chan
ge P
eriod
(Y+R
c), s
4.04.0
5.55.5
Max G
reen
Sett
ing (G
max),
s30
.04.0
72.5
80.5
Max Q
Clea
r Tim
e (g_
c+I1)
, s9.5
2.728
.813
.5Gr
een E
xt Tim
e (p_
c), s
0.50.0
15.4
16.8
Inter
secti
on S
umma
ryHC
M 20
10 C
trl De
lay10
.8HC
M 20
10 LO
SB

1/2/20
15
Centr
al Co
ast T
rans
porta
tion C
onsu
lting
Sync
hro 8
Rep
ort
HCM
2010
TW
SC
Inter
secti
onInt
Dela
y, s/v
eh37
.6
Move
ment
EBL
EBT
EBR
WBL
WBT
WBR
NBL
NBT
NBR
SBL
SBT
SBR
Vol, v
eh/h
485
654
2853
52
730
4911
114
Confl
icting
Ped
s, #/h
r0
00
00
00
00
00
0Si
gn C
ontro
l Fr
eeFr
eeFr
eeFr
eeFr
eeFr
eeSt
opSt
opSt
opSt
opSt
opSt
opRT
Cha
nneli
zed
--
None
--
None
--
None
--
None
Stor
age L
ength
400
-70
210
--
--
--
-60
Veh i
n Med
ian S
torag
e, #
-0
--
0-
-0
--
0-
Grad
e, %
-4
--
2-
-7
--
1-
Peak
Hou
r Fac
tor96
9696
9696
9696
9696
9696
96He
avy V
ehicl
es, %
88
88
88
88
88
88
Mvmt
Flow
489
256
2955
72
760
5111
115
Major
/Mino
rMa
jor1
Major
2Mi
nor1
Mino
r2Co
nflict
ing F
low A
ll55
90
089
20
015
1715
1889
215
4315
1755
8
S
tage 1
--
--
--
900
900
-61
761
7-
Stag
e 2-
--
--
-61
761
8-
926
900
-Cr
itical
Hdwy
4.18
--
4.18
--
8.58
7.98
6.98
7.38
6.78
6.38
Critic
al Hd
wy S
tg 1
--
--
--
7.58
6.98
-6.3
85.7
8-
Critic
al Hd
wy S
tg 2
--
--
--
7.58
6.98
-6.3
85.7
8-
Follo
w-up
Hdw
y2.2
72-
-2.2
72-
-3.5
724.0
723.3
723.5
724.0
723.3
72Po
t Cap
-1 M
aneu
ver
983
--
736
--
~ 52
6427
983
106
510
Stag
e 1-
--
--
-22
924
6-
452
456
-
S
tage 2
--
--
--
368
371
-29
933
2-
Plato
on bl
ocke
d, %
--
--
Mov C
ap-1
Man
euve
r98
3-
-73
6-
-~
4861
279
6610
151
0Mo
v Cap
-2 M
aneu
ver
--
--
--
~ 48
61-
6610
1-
Stag
e 1-
--
--
-22
824
5-
450
438
-
S
tage 2
--
--
--
343
356
-24
333
1-
Appr
oach
EBW
BNB
SBHC
M Co
ntrol
Delay
, s0
0.5$ 4
90.5
38.7
HCM
LOS
FE
Mino
r Lan
e/Majo
r Mvm
tNB
Ln1
EBL
EBT
EBR
WBL
WBT
WBR
SBLn
1SBL
n2Ca
pacit
y (ve
h/h)
7298
3-
-73
6-
-68
510
HCM
Lane
V/C
Rati
o1.7
650.0
04-
-0.0
4-
-0.1
840.0
29HC
M Co
ntrol
Delay
(s)
$ 490
.58.7
--
10.1
--
69.5
12.3
HCM
Lane
LOS
FA
--
B-
-F
BHC
M 95
th %
tile Q
(veh)
11.2
0-
-0.1
--
0.60.1
Notes
~: V
olume
exce
eds c
apac
ity
$: D
elay e
xcee
ds 30
0s
+: C
ompu
tation
Not
Defin
ed
*: A
ll majo
r volu
me in
plato
on
1/5/20
15
Centr
al Co
ast T
rans
porta
tion C
onsu
lting
Sync
hro 8
Rep
ort
Queu
es
Lane
Gro
upEB
TEB
RW
BLW
BTNB
LNB
RLa
ne G
roup
Flow
(vph
)92
411
016
581
254
44v/c
Rati
o0.8
50.1
10.2
00.5
20.6
80.1
3Co
ntrol
Delay
24.5
2.258
.210
.444
.321
.6Qu
eue D
elay
0.00.0
0.00.0
0.00.0
Total
Dela
y24
.52.2
58.2
10.4
44.3
21.6
Queu
e Len
gth 50
th (ft
)32
80
814
711
39
Queu
e Len
gth 95
th (ft
)#8
3322
3728
427
145
Inter
nal L
ink D
ist (f
t)31
7136
580
1Tu
rn B
ay Le
ngth
(ft)
320
370
50Ba
se C
apac
ity (v
ph)
1450
1252
8215
2458
153
3St
arva
tion C
ap R
educ
tn0
00
00
0Sp
illbac
k Cap
Red
uctn
00
00
00
Stor
age C
ap R
educ
tn0
00
00
0Re
duce
d v/c
Ratio
0.64
0.09
0.20
0.38
0.44
0.08
Inter
secti
on S
umma
ry#
95th
perce
ntile
volum
e exc
eeds
capa
city,
queu
e may
be lo
nger
.
Que
ue sh
own i
s max
imum
after
two c
ycles
.

1/5/20
15
Centr
al Co
ast T
rans
porta
tion C
onsu
lting
Sync
hro 8
Rep
ort
HCM
2010
Sign
alize
d Inte
rsecti
on S
umma
ry
Move
ment
EBT
EBR
WBL
WBT
NBL
NBR
Lane
Con
figur
ation
sVo
lume (
veh/h
)89
610
716
564
246
43Nu
mber
414
38
512
Initia
l Q (Q
b), v
eh0
00
00
0Pe
d-Bi
ke A
dj(A_
pbT)
1.00
1.00
1.00
1.00
Parki
ng B
us, A
dj1.0
01.0
01.0
01.0
01.0
01.0
0Ad
j Sat
Flow,
veh/h
/ln17
5917
5917
5017
5016
4516
45Ad
j Flow
Rate
, veh
/h92
411
016
581
254
0Ad
j No.
of La
nes
11
11
11
Peak
Hou
r Fac
tor0.9
70.9
70.9
70.9
70.9
70.9
7Pe
rcent
Heav
y Veh
, %8
88
88
8Ca
p, ve
h/h10
9392
925
1204
298
266
Arriv
e On G
reen
0.62
0.62
0.02
0.69
0.19
0.00
Sat F
low, v
eh/h
1759
1495
1667
1750
1567
1398
Grp V
olume
(v), v
eh/h
924
110
1658
125
40
Grp S
at Flo
w(s),
veh/h
/ln17
5914
9516
6717
5015
6713
98Q
Serve
(g_s
), s
32.6
2.30.7
12.1
12.2
0.0Cy
cle Q
Clea
r(g_c
), s
32.6
2.30.7
12.1
12.2
0.0Pr
op In
Lane
1.00
1.00
1.00
1.00
Lane
Grp
Cap
(c), v
eh/h
1093
929
2512
0429
826
6V/
C Ra
tio(X
)0.8
50.1
20.6
40.4
80.8
50.0
0Av
ail C
ap(c_
a), v
eh/h
1641
1394
8618
1260
454
0HC
M Pl
atoon
Rati
o1.0
01.0
01.0
01.0
01.0
01.0
0Up
strea
m Fil
ter(I)
1.00
1.00
1.00
1.00
1.00
0.00
Unifo
rm D
elay (
d), s
/veh
11.8
6.038
.15.7
30.4
0.0Inc
r Dela
y (d2
), s/v
eh2.7
0.123
.90.3
6.80.0
Initia
l Q D
elay(d
3),s/
veh
0.00.0
0.00.0
0.00.0
%ile
Bac
kOfQ
(50%
),veh
/ln16
.51.0
0.55.7
5.80.0
LnGr
p Dela
y(d),s
/veh
14.5
6.162
.06.0
37.2
0.0Ln
Grp L
OSB
AE
AD
Appr
oach
Vol,
veh/h
1034
597
254
Appr
oach
Dela
y, s/v
eh13
.67.5
37.2
Appr
oach
LOS
BA
D
Timer
12
34
56
78
Assig
ned P
hs2
34
8Ph
s Dur
ation
(G+Y
+Rc),
s18
.85.2
53.8
59.0
Chan
ge P
eriod
(Y+R
c), s
4.04.0
5.55.5
Max G
reen
Sett
ing (G
max),
s30
.04.0
72.5
80.5
Max Q
Clea
r Tim
e (g_
c+I1)
, s14
.22.7
34.6
14.1
Gree
n Ext
Time (
p_c),
s0.7
0.013
.715
.4
Inter
secti
on S
umma
ryHC
M 20
10 C
trl De
lay14
.8HC
M 20
10 LO
SB
1/5/20
15
Centr
al Co
ast T
rans
porta
tion C
onsu
lting
Sync
hro 8
Rep
ort
HCM
2010
TW
SC
Inter
secti
onInt
Dela
y, s/v
eh1.5
Move
ment
EBL
EBT
EBR
WBL
WBT
WBR
NBL
NBT
NBR
SBL
SBT
SBR
Vol, v
eh/h
485
654
2853
52
00
4911
114
Confl
icting
Ped
s, #/h
r0
00
00
00
00
00
0Si
gn C
ontro
l Fr
eeFr
eeFr
eeFr
eeFr
eeFr
eeSt
opSt
opSt
opSt
opSt
opSt
opRT
Cha
nneli
zed
--
None
--
None
--
None
--
None
Stor
age L
ength
400
-70
210
--
100
-0
--
60Ve
h in M
edian
Stor
age,
#-
0-
-0
--
0-
-0
-Gr
ade,
%-
4-
-2
--
7-
-1
-Pe
ak H
our F
actor
9696
9696
9696
9696
9696
9696
Heav
y Veh
icles
, %8
88
88
88
88
88
8Mv
mt F
low4
892
5629
557
20
051
111
15
Major
/Mino
rMa
jor1
Major
2Mi
nor1
Mino
r2Co
nflict
ing F
low A
ll55
90
089
20
015
1715
1889
215
1715
1755
8
S
tage 1
--
--
--
900
900
-61
761
7-
Stag
e 2-
--
--
-61
761
8-
900
900
-Cr
itical
Hdwy
4.18
--
4.18
--
8.58
7.98
6.98
7.38
6.78
6.38
Critic
al Hd
wy S
tg 1
--
--
--
7.58
6.98
-6.3
85.7
8-
Critic
al Hd
wy S
tg 2
--
--
--
7.58
6.98
-6.3
85.7
8-
Follo
w-up
Hdw
y2.2
72-
-2.2
72-
-3.5
724.0
723.3
723.5
724.0
723.3
72Po
t Cap
-1 M
aneu
ver
983
--
736
--
5264
279
8710
651
0
S
tage 1
--
--
--
229
246
-45
245
6-
Stag
e 2-
--
--
-36
837
1-
309
332
-Pl
atoon
bloc
ked,
%-
--
-Mo
v Cap
-1 M
aneu
ver
983
--
736
--
4861
279
6910
151
0Mo
v Cap
-2 M
aneu
ver
--
--
--
4861
-69
101
-
S
tage 1
--
--
--
228
245
-45
043
8-
Stag
e 2-
--
--
-34
335
6-
251
331
-
Appr
oach
EBW
BNB
SBHC
M Co
ntrol
Delay
, s0
0.520
.837
.2HC
M LO
SC
E
Mino
r Lan
e/Majo
r Mvm
tNB
Ln1N
BLn2
EBL
EBT
EBR
WBL
WBT
WBR
SBLn
1SBL
n2Ca
pacit
y (ve
h/h)
-27
998
3-
-73
6-
-71
510
HCM
Lane
V/C
Rati
o-
0.183
0.004
--
0.04
--
0.176
0.029
HCM
Contr
ol De
lay (s
)0
20.8
8.7-
-10
.1-
-66
.212
.3HC
M La
ne LO
SA
CA
--
B-
-F
BHC
M 95
th %
tile Q
(veh)
-0.7
0-
-0.1
--
0.60.1

1/2/20
15
Centr
al Co
ast T
rans
porta
tion C
onsu
lting
Sync
hro 8
Rep
ort
Queu
es
Lane
Gro
upW
BRNB
TNB
RSB
LSB
TLa
ne G
roup
Flow
(vph
)73
366
778
683
645
v/c R
atio
0.76
0.81
0.11
0.59
0.37
Contr
ol De
lay24
.322
.23.3
18.6
0.6Qu
eue D
elay
0.00.0
0.00.0
0.0To
tal D
elay
24.3
22.2
3.318
.60.6
Queu
e Len
gth 50
th (ft
)12
620
32
970
Queu
e Len
gth 95
th (ft
)#2
5633
219
176
0Int
erna
l Link
Dist
(ft)
1614
2081
Turn
Bay
Leng
th (ft
)11
037
0Ba
se C
apac
ity (v
ph)
1160
1171
1018
1408
1745
Star
vatio
n Cap
Red
uctn
00
00
0Sp
illbac
k Cap
Red
uctn
00
00
0St
orag
e Cap
Red
uctn
00
00
0Re
duce
d v/c
Ratio
0.63
0.57
0.08
0.49
0.37
Inter
secti
on S
umma
ry#
95th
perce
ntile
volum
e exc
eeds
capa
city,
queu
e may
be lo
nger
.
Que
ue sh
own i
s max
imum
after
two c
ycles
.
1/2/20
15
Centr
al Co
ast T
rans
porta
tion C
onsu
lting
Sync
hro 8
Rep
ort
HCM
Sign
alize
d Inte
rsecti
on C
apac
ity A
nalys
is
Move
ment
WBL
WBR
NBT
NBR
SBL
SBT
Lane
Con
figur
ation
sVo
lume (
vph)
069
663
474
649
613
Ideal
Flow
(vphp
l)19
0019
0019
0019
0019
0019
00Gr
ade (
%)
6%10
%9%
Total
Lost
time (
s)4.0
5.05.0
4.04.0
Lane
Util.
Fac
tor0.8
81.0
01.0
00.9
71.0
0Fr
t0.8
51.0
00.8
51.0
01.0
0Flt
Pro
tected
1.00
1.00
1.00
0.95
1.00
Satd.
Flow
(pro
t)26
5117
3614
7532
1617
45Flt
Per
mitte
d1.0
01.0
01.0
00.9
51.0
0Sa
td. F
low (p
erm)
2651
1736
1475
3216
1745
Peak
-hou
r fac
tor, P
HF0.9
50.9
50.9
50.9
50.9
50.9
5Ad
j. Flow
(vph
)0
733
667
7868
364
5RT
OR R
educ
tion (
vph)
00
036
00
Lane
Gro
up F
low (v
ph)
073
366
742
683
645
Heav
y Veh
icles
(%)
4%4%
4%4%
4%4%
Turn
Typ
eOv
erNA
Perm
Prot
NAPr
otecte
d Pha
ses
12
1Fr
eePe
rmitte
d Pha
ses
2Ac
tuated
Gre
en, G
(s)
20.9
27.4
27.4
20.9
57.3
Effec
tive G
reen
, g (s
)20
.927
.427
.420
.957
.3Ac
tuated
g/C
Ratio
0.36
0.48
0.48
0.36
1.00
Clea
ranc
e Tim
e (s)
4.05.0
5.04.0
Vehic
le Ex
tensio
n (s)
3.03.0
3.03.0
Lane
Grp
Cap
(vph
)96
683
070
511
7317
45v/s
Rati
o Pro
tc0
.28c0
.380.2
10.3
7v/s
Rati
o Per
m0.0
3v/c
Rati
o0.7
60.8
00.0
60.5
80.3
7Un
iform
Dela
y, d1
16.0
12.7
8.014
.70.0
Prog
ress
ion F
actor
1.00
1.00
1.00
1.00
1.00
Incre
menta
l Dela
y, d2
3.55.7
0.00.7
0.6De
lay (s
)19
.518
.38.1
15.4
0.6Le
vel o
f Ser
vice
BB
AB
AAp
proa
ch D
elay (
s)19
.517
.38.2
Appr
oach
LOS
BB
A
Inter
secti
on S
umma
ryHC
M 20
00 C
ontro
l Dela
y13
.6HC
M 20
00 Le
vel o
f Ser
vice
BHC
M 20
00 V
olume
to C
apac
ity ra
tio0.7
8Ac
tuated
Cyc
le Le
ngth
(s)
57.3
Sum
of los
t time
(s)
9.0Int
erse
ction
Cap
acity
Utili
zatio
n65
.2%IC
U Le
vel o
f Ser
vice
CAn
alysis
Per
iod (m
in)15
c C
ritica
l Lan
e Gro
up

1/2/20
15
Centr
al Co
ast T
rans
porta
tion C
onsu
lting
Sync
hro 8
Rep
ort
Queu
es
Lane
Gro
upEB
TEB
RW
BLW
BTNB
LNB
RLa
ne G
roup
Flow
(vph
)63
083
972
291
9v/c
Rati
o0.5
10.0
80.0
60.5
70.3
20.0
3Co
ntrol
Delay
8.52.0
28.6
7.824
.813
.1Qu
eue D
elay
0.00.0
0.00.0
0.00.0
Total
Dela
y8.5
2.028
.67.8
24.8
13.1
Queu
e Len
gth 50
th (ft
)87
03
110
270
Queu
e Len
gth 95
th (ft
)27
116
1723
272
11Int
erna
l Link
Dist
(ft)
3171
365
801
Turn
Bay
Leng
th (ft
)32
037
050
Base
Cap
acity
(vph
)14
1512
1813
916
0297
987
9St
arva
tion C
ap R
educ
tn0
00
00
0Sp
illbac
k Cap
Red
uctn
00
00
00
Stor
age C
ap R
educ
tn0
00
00
0Re
duce
d v/c
Ratio
0.45
0.07
0.06
0.45
0.09
0.01
Inter
secti
on S
umma
ry
1/2/20
15
Centr
al Co
ast T
rans
porta
tion C
onsu
lting
Sync
hro 8
Rep
ort
HCM
2010
Sign
alize
d Inte
rsecti
on S
umma
ry
Move
ment
EBT
EBR
WBL
WBT
NBL
NBR
Lane
Con
figur
ation
sVo
lume (
veh/h
)58
677
867
185
8Nu
mber
414
38
512
Initia
l Q (Q
b), v
eh0
00
00
0Pe
d-Bi
ke A
dj(A_
pbT)
1.00
1.00
1.00
1.00
Parki
ng B
us, A
dj1.0
01.0
01.0
01.0
01.0
01.0
0Ad
j Sat
Flow,
veh/h
/ln17
5917
5917
5017
5016
4516
45Ad
j Flow
Rate
, veh
/h63
083
972
291
0Ad
j No.
of La
nes
11
11
11
Peak
Hou
r Fac
tor0.9
30.9
30.9
30.9
30.9
30.9
3Pe
rcent
Heav
y Veh
, %8
88
88
8Ca
p, ve
h/h99
684
616
1191
112
100
Arriv
e On G
reen
0.57
0.57
0.01
0.68
0.07
0.00
Sat F
low, v
eh/h
1759
1495
1667
1750
1567
1398
Grp V
olume
(v), v
eh/h
630
839
722
910
Grp S
at Flo
w(s),
veh/h
/ln17
5914
9516
6717
5015
6713
98Q
Serve
(g_s
), s
9.31.0
0.28.6
2.20.0
Cycle
Q C
lear(g
_c),
s9.3
1.00.2
8.62.2
0.0Pr
op In
Lane
1.00
1.00
1.00
1.00
Lane
Grp
Cap
(c), v
eh/h
996
846
1611
9111
210
0V/
C Ra
tio(X
)0.6
30.1
00.5
70.6
10.8
10.0
0Av
ail C
ap(c_
a), v
eh/h
1955
1661
174
2311
1229
1097
HCM
Plato
on R
atio
1.00
1.00
1.00
1.00
1.00
1.00
Upstr
eam
Filter
(I)1.0
01.0
01.0
01.0
01.0
00.0
0Un
iform
Dela
y (d)
, s/ve
h5.6
3.818
.93.3
17.5
0.0Inc
r Dela
y (d2
), s/v
eh0.7
0.027
.90.5
13.0
0.0Ini
tial Q
Dela
y(d3)
,s/ve
h0.0
0.00.0
0.00.0
0.0%
ile B
ackO
fQ(5
0%),v
eh/ln
4.60.4
0.24.2
1.30.0
LnGr
p Dela
y(d),s
/veh
6.33.9
46.8
3.830
.50.0
LnGr
p LOS
AA
DA
CAp
proa
ch V
ol, ve
h/h71
373
191
Appr
oach
Dela
y, s/v
eh6.0
4.430
.5Ap
proa
ch LO
SA
AC
Timer
12
34
56
78
Assig
ned P
hs2
34
8Ph
s Dur
ation
(G+Y
+Rc),
s6.7
4.427
.231
.5Ch
ange
Per
iod (Y
+Rc),
s4.0
4.05.5
5.5Ma
x Gre
en S
etting
(Gma
x), s
30.0
4.042
.550
.5Ma
x Q C
lear T
ime (
g_c+
I1), s
4.22.2
11.3
10.6
Gree
n Ext
Time (
p_c),
s0.2
0.010
.411
.1
Inter
secti
on S
umma
ryHC
M 20
10 C
trl De
lay6.7
HCM
2010
LOS
A

1/2/20
15
Centr
al Co
ast T
rans
porta
tion C
onsu
lting
Sync
hro 8
Rep
ort
HCM
2010
TW
SC
Inter
secti
onInt
Dela
y, s/v
eh18
.3
Move
ment
EBL
EBT
EBR
WBL
WBT
WBR
NBL
NBT
NBR
SBL
SBT
SBR
Vol, v
eh/h
455
140
2858
63
730
461
05
Confl
icting
Ped
s, #/h
r0
00
00
00
00
00
0Si
gn C
ontro
l Fr
eeFr
eeFr
eeFr
eeFr
eeFr
eeSt
opSt
opSt
opSt
opSt
opSt
opRT
Cha
nneli
zed
--
None
--
None
--
None
--
None
Stor
age L
ength
400
-70
210
--
--
--
-60
Veh i
n Med
ian S
torag
e, #
-0
--
0-
-0
--
0-
Grad
e, %
-4
--
2-
-7
--
1-
Peak
Hou
r Fac
tor92
9292
9292
9292
9292
9292
92He
avy V
ehicl
es, %
88
88
88
88
88
88
Mvmt
Flow
459
943
3063
73
790
501
05
Major
/Mino
rMa
jor1
Major
2Mi
nor1
Mino
r2Co
nflict
ing F
low A
ll64
00
059
90
013
0713
0959
913
3213
0763
9
S
tage 1
--
--
--
608
608
-69
969
9-
Stag
e 2-
--
--
-69
970
1-
633
608
-Cr
itical
Hdwy
4.18
--
4.18
--
8.58
7.98
6.98
7.38
6.78
6.38
Critic
al Hd
wy S
tg 1
--
--
--
7.58
6.98
-6.3
85.7
8-
Critic
al Hd
wy S
tg 2
--
--
--
7.58
6.98
-6.3
85.7
8-
Follo
w-up
Hdw
y2.2
72-
-2.2
72-
-3.5
724.0
723.3
723.5
724.0
723.3
72Po
t Cap
-1 M
aneu
ver
916
--
949
--
8093
437
118
144
457
Stag
e 1-
--
--
-37
337
6-
405
416
-
S
tage 2
--
--
--
321
329
-44
246
1-
Plato
on bl
ocke
d, %
--
--
Mov C
ap-1
Man
euve
r91
6-
-94
9-
-~
7790
437
102
139
457
Mov C
ap-2
Man
euve
r-
--
--
-~
7790
-10
213
9-
Stag
e 1-
--
--
-37
137
4-
403
403
-
S
tage 2
--
--
--
307
319
-39
045
9-
Appr
oach
EBW
BNB
SBHC
M Co
ntrol
Delay
, s0.1
0.420
1.617
.6HC
M LO
SF
C
Mino
r Lan
e/Majo
r Mvm
tNB
Ln1
EBL
EBT
EBR
WBL
WBT
WBR
SBLn
1SBL
n2Ca
pacit
y (ve
h/h)
113
916
--
949
--
102
457
HCM
Lane
V/C
Rati
o1.1
450.0
05-
-0.0
32-
-0.0
110.0
12HC
M Co
ntrol
Delay
(s)
201.6
8.9-
-8.9
--
40.7
13HC
M La
ne LO
SF
A-
-A
--
EB
HCM
95th
%tile
Q(ve
h)8.1
0-
-0.1
--
00
Notes
~: V
olume
exce
eds c
apac
ity
$: D
elay e
xcee
ds 30
0s
+: C
ompu
tation
Not
Defin
ed
*: A
ll majo
r volu
me in
plato
on
1/2/20
15
Centr
al Co
ast T
rans
porta
tion C
onsu
lting
Sync
hro 8
Rep
ort
Queu
es
Lane
Gro
upW
BRNB
TSB
LSB
TLa
ne G
roup
Flow
(vph
)15
5082
713
8359
8v/c
Rati
o0.9
40.9
10.6
90.3
4Co
ntrol
Delay
28.5
44.5
13.4
0.5Qu
eue D
elay
0.00.0
0.00.0
Total
Dela
y28
.544
.513
.40.5
Queu
e Len
gth 50
th (ft
)41
222
524
30
Queu
e Len
gth 95
th (ft
)#6
38#3
3831
70
Inter
nal L
ink D
ist (f
t)16
1420
81Tu
rn B
ay Le
ngth
(ft)
370
Base
Cap
acity
(vph
)16
8693
620
4617
45St
arva
tion C
ap R
educ
tn0
00
0Sp
illbac
k Cap
Red
uctn
00
00
Stor
age C
ap R
educ
tn0
00
0Re
duce
d v/c
Ratio
0.92
0.88
0.68
0.34
Inter
secti
on S
umma
ry#
95th
perce
ntile
volum
e exc
eeds
capa
city,
queu
e may
be lo
nger
.
Que
ue sh
own i
s max
imum
after
two c
ycles
.

1/2/20
15
Centr
al Co
ast T
rans
porta
tion C
onsu
lting
Sync
hro 8
Rep
ort
HCM
Sign
alize
d Inte
rsecti
on C
apac
ity A
nalys
is
Move
ment
WBL
WBR
NBT
NBR
SBL
SBT
Lane
Con
figur
ation
sVo
lume (
vph)
014
2657
019
012
7255
0Ide
al Flo
w (vp
hpl)
1900
1900
1900
1900
1900
1900
Grad
e (%
)6%
10%
9%To
tal Lo
st tim
e (s)
4.05.0
4.04.0
Lane
Util.
Fac
tor0.8
80.9
50.9
71.0
0Fr
t0.8
50.9
61.0
01.0
0Flt
Pro
tected
1.00
1.00
0.95
1.00
Satd.
Flow
(pro
t)26
5131
7432
1617
45Flt
Per
mitte
d1.0
01.0
00.9
51.0
0Sa
td. F
low (p
erm)
2651
3174
3216
1745
Peak
-hou
r fac
tor, P
HF0.9
20.9
20.9
20.9
20.9
20.9
2Ad
j. Flow
(vph
)0
1550
620
207
1383
598
RTOR
Red
uctio
n (vp
h)0
036
00
0La
ne G
roup
Flow
(vph
)0
1550
791
013
8359
8He
avy V
ehicl
es (%
)4%
4%4%
4%4%
4%Tu
rn T
ype
Over
NAPr
otNA
Prote
cted P
hase
s1
21
Free
Perm
itted P
hase
sAc
tuated
Gre
en, G
(s)
54.8
24.3
54.8
88.1
Effec
tive G
reen
, g (s
)54
.824
.354
.888
.1Ac
tuated
g/C
Ratio
0.62
0.28
0.62
1.00
Clea
ranc
e Tim
e (s)
4.05.0
4.0Ve
hicle
Exten
sion (
s)3.0
3.03.0
Lane
Grp
Cap
(vph
)16
4887
520
0017
45v/s
Rati
o Pro
tc0
.58c0
.250.4
30.3
4v/s
Rati
o Per
mv/c
Rati
o0.9
40.9
00.6
90.3
4Un
iform
Dela
y, d1
15.2
30.8
11.0
0.0Pr
ogre
ssion
Fac
tor1.0
01.0
01.0
01.0
0Inc
reme
ntal D
elay,
d211
.112
.61.0
0.5De
lay (s
)26
.243
.312
.10.5
Leve
l of S
ervic
eC
DB
AAp
proa
ch D
elay (
s)26
.243
.38.6
Appr
oach
LOS
CD
A
Inter
secti
on S
umma
ryHC
M 20
00 C
ontro
l Dela
y21
.5HC
M 20
00 Le
vel o
f Ser
vice
CHC
M 20
00 V
olume
to C
apac
ity ra
tio0.9
3Ac
tuated
Cyc
le Le
ngth
(s)
88.1
Sum
of los
t time
(s)
9.0Int
erse
ction
Cap
acity
Utili
zatio
n79
.2%IC
U Le
vel o
f Ser
vice
DAn
alysis
Per
iod (m
in)15
c C
ritica
l Lan
e Gro
up
1/2/20
15
Centr
al Co
ast T
rans
porta
tion C
onsu
lting
Sync
hro 8
Rep
ort
Queu
es
Lane
Gro
upEB
TEB
RW
BLW
BTNB
LNB
RLa
ne G
roup
Flow
(vph
)10
0316
343
1536
164
54v/c
Rati
o0.8
10.1
50.4
81.1
50.6
90.2
2Co
ntrol
Delay
20.4
1.867
.295
.558
.218
.1Qu
eue D
elay
0.00.0
0.00.0
0.00.0
Total
Dela
y20
.41.8
67.2
95.5
58.2
18.1
Queu
e Len
gth 50
th (ft
)48
11
28~1
219
104
8Qu
eue L
ength
95th
(ft)
#933
27#7
3#1
627
174
43Int
erna
l Link
Dist
(ft)
3171
365
801
Turn
Bay
Leng
th (ft
)32
037
050
Base
Cap
acity
(vph
)12
3911
0091
1331
461
440
Star
vatio
n Cap
Red
uctn
00
00
00
Spillb
ack C
ap R
educ
tn0
00
00
0St
orag
e Cap
Red
uctn
00
00
00
Redu
ced v
/c Ra
tio0.8
10.1
50.4
71.1
50.3
60.1
2
Inter
secti
on S
umma
ry~
Volu
me ex
ceed
s cap
acity
, que
ue is
theo
retic
ally i
nfinit
e.
Que
ue sh
own i
s max
imum
after
two c
ycles
.#
95th
perce
ntile
volum
e exc
eeds
capa
city,
queu
e may
be lo
nger
.
Que
ue sh
own i
s max
imum
after
two c
ycles
.

1/2/20
15
Centr
al Co
ast T
rans
porta
tion C
onsu
lting
Sync
hro 8
Rep
ort
HCM
2010
Sign
alize
d Inte
rsecti
on S
umma
ry
Move
ment
EBT
EBR
WBL
WBT
NBL
NBR
Lane
Con
figur
ation
sVo
lume (
veh/h
)92
315
040
1413
151
50Nu
mber
414
38
512
Initia
l Q (Q
b), v
eh0
00
00
0Pe
d-Bi
ke A
dj(A_
pbT)
1.00
1.00
1.00
1.00
Parki
ng B
us, A
dj1.0
01.0
01.0
01.0
01.0
01.0
0Ad
j Sat
Flow,
veh/h
/ln17
5917
5917
5017
5016
4516
45Ad
j Flow
Rate
, veh
/h10
0316
343
1536
164
0Ad
j No.
of La
nes
11
11
11
Peak
Hou
r Fac
tor0.9
20.9
20.9
20.9
20.9
20.9
2Pe
rcent
Heav
y Veh
, %8
88
88
8Ca
p, ve
h/h12
4710
6053
1366
196
175
Arriv
e On G
reen
0.71
0.71
0.03
0.78
0.13
0.00
Sat F
low, v
eh/h
1759
1495
1667
1750
1567
1398
Grp V
olume
(v), v
eh/h
1003
163
4315
3616
40
Grp S
at Flo
w(s),
veh/h
/ln17
5914
9516
6717
5015
6713
98Q
Serve
(g_s
), s
38.8
3.62.6
78.5
10.3
0.0Cy
cle Q
Clea
r(g_c
), s
38.8
3.62.6
78.5
10.3
0.0Pr
op In
Lane
1.00
1.00
1.00
1.00
Lane
Grp
Cap
(c), v
eh/h
1247
1060
5313
6619
617
5V/
C Ra
tio(X
)0.8
00.1
50.8
11.1
20.8
40.0
0Av
ail C
ap(c_
a), v
eh/h
1247
1060
9913
6649
844
5HC
M Pl
atoon
Rati
o1.0
01.0
01.0
01.0
01.0
01.0
0Up
strea
m Fil
ter(I)
1.00
1.00
1.00
1.00
1.00
0.00
Unifo
rm D
elay (
d), s
/veh
9.94.8
48.4
11.0
43.0
0.0Inc
r Dela
y (d2
), s/v
eh3.9
0.124
.266
.09.1
0.0Ini
tial Q
Dela
y(d3)
,s/ve
h0.0
0.00.0
0.00.0
0.0%
ile B
ackO
fQ(5
0%),v
eh/ln
19.8
1.51.5
61.9
5.00.0
LnGr
p Dela
y(d),s
/veh
13.9
4.972
.677
.152
.10.0
LnGr
p LOS
BA
EF
DAp
proa
ch V
ol, ve
h/h11
6615
7916
4Ap
proa
ch D
elay,
s/veh
12.6
77.0
52.1
Appr
oach
LOS
BE
D
Timer
12
34
56
78
Assig
ned P
hs2
34
8Ph
s Dur
ation
(G+Y
+Rc),
s16
.67.2
76.8
84.0
Chan
ge P
eriod
(Y+R
c), s
4.04.0
5.55.5
Max G
reen
Sett
ing (G
max),
s32
.06.0
68.5
78.5
Max Q
Clea
r Tim
e (g_
c+I1)
, s12
.34.6
40.8
80.5
Gree
n Ext
Time (
p_c),
s0.4
0.024
.90.0
Inter
secti
on S
umma
ryHC
M 20
10 C
trl De
lay49
.8HC
M 20
10 LO
SD
1/2/20
15
Centr
al Co
ast T
rans
porta
tion C
onsu
lting
Sync
hro 8
Rep
ort
HCM
2010
TW
SC
Inter
secti
onInt
Dela
y, s/v
eh6.3
Move
ment
EBL
EBT
EBR
WBL
WBT
WBR
NBL
NBT
NBR
SBL
SBT
SBR
Vol, v
eh/h
575
030
4011
7010
100
303
46
Confl
icting
Ped
s, #/h
r0
00
00
00
00
00
0Si
gn C
ontro
l Fr
eeFr
eeFr
eeFr
eeFr
eeFr
eeSt
opSt
opSt
opSt
opSt
opSt
opRT
Cha
nneli
zed
--
None
--
None
--
None
--
None
Stor
age L
ength
400
-70
210
--
--
--
-60
Veh i
n Med
ian S
torag
e, #
-0
--
0-
-0
--
0-
Grad
e, %
-4
--
2-
-7
--
1-
Peak
Hou
r Fac
tor93
9393
9393
9393
9393
9393
93He
avy V
ehicl
es, %
88
88
88
88
88
88
Mvmt
Flow
580
632
4312
5811
110
323
46
Major
/Mino
rMa
jor1
Major
2Mi
nor1
Mino
r2Co
nflict
ing F
low A
ll12
690
080
60
021
6921
7280
621
8221
6612
63
S
tage 1
--
--
--
817
817
-13
4913
49-
Stag
e 2-
--
--
-13
5213
55-
833
817
-Cr
itical
Hdwy
4.18
--
4.18
--
8.58
7.98
6.98
7.38
6.78
6.38
Critic
al Hd
wy S
tg 1
--
--
--
7.58
6.98
-6.3
85.7
8-
Critic
al Hd
wy S
tg 2
--
--
--
7.58
6.98
-6.3
85.7
8-
Follo
w-up
Hdw
y2.2
72-
-2.2
72-
-3.5
724.0
723.3
723.5
724.0
723.3
72Po
t Cap
-1 M
aneu
ver
528
--
793
--
1419
319
2840
194
Stag
e 1-
--
--
-26
327
8-
167
198
-
S
tage 2
--
--
--
106
125
-33
836
5-
Plato
on bl
ocke
d, %
--
--
Mov C
ap-1
Man
euve
r52
8-
-79
3-
-12
1831
924
3719
4Mo
v Cap
-2 M
aneu
ver
--
--
--
1218
-24
37-
Stag
e 1-
--
--
-26
127
5-
165
187
-
S
tage 2
--
--
--
9511
8-
301
362
-
Appr
oach
EBW
BNB
SBHC
M Co
ntrol
Delay
, s0.1
0.328
2.998
HCM
LOS
FF
Mino
r Lan
e/Majo
r Mvm
tNB
Ln1
EBL
EBT
EBR
WBL
WBT
WBR
SBLn
1SBL
n2Ca
pacit
y (ve
h/h)
4352
8-
-79
3-
-30
194
HCM
Lane
V/C
Rati
o1
0.01
--
0.054
--
0.251
0.033
HCM
Contr
ol De
lay (s
)28
2.911
.9-
-9.8
--
161.3
24.2
HCM
Lane
LOS
FB
--
A-
-F
CHC
M 95
th %
tile Q
(veh)
40
--
0.2-
-0.8
0.1

1/2/20
15
Centr
al Co
ast T
rans
porta
tion C
onsu
lting
Sync
hro 8
Rep
ort
Queu
es
Lane
Gro
upW
BRNB
TSB
LSB
TLa
ne G
roup
Flow
(vph
)10
8611
0711
2971
0v/c
Rati
o0.8
50.8
40.7
30.4
1Co
ntrol
Delay
26.7
28.9
20.5
0.7Qu
eue D
elay
0.00.0
0.00.0
Total
Dela
y26
.728
.920
.50.7
Queu
e Len
gth 50
th (ft
)29
027
824
80
Queu
e Len
gth 95
th (ft
)39
436
632
50
Inter
nal L
ink D
ist (f
t)16
1420
81Tu
rn B
ay Le
ngth
(ft)
370
Base
Cap
acity
(vph
)14
6815
1217
8117
45St
arva
tion C
ap R
educ
tn0
00
0Sp
illbac
k Cap
Red
uctn
00
00
Stor
age C
ap R
educ
tn0
00
0Re
duce
d v/c
Ratio
0.74
0.73
0.63
0.41
Inter
secti
on S
umma
ry
1/2/20
15
Centr
al Co
ast T
rans
porta
tion C
onsu
lting
Sync
hro 8
Rep
ort
HCM
Sign
alize
d Inte
rsecti
on C
apac
ity A
nalys
is
Move
ment
WBL
WBR
NBT
NBR
SBL
SBT
Lane
Con
figur
ation
sVo
lume (
vph)
010
1083
020
010
5066
0Ide
al Flo
w (vp
hpl)
1900
1900
1900
1900
1900
1900
Grad
e (%
)6%
10%
9%To
tal Lo
st tim
e (s)
4.05.0
4.04.0
Lane
Util.
Fac
tor0.8
80.9
50.9
71.0
0Fr
t0.8
50.9
71.0
01.0
0Flt
Pro
tected
1.00
1.00
0.95
1.00
Satd.
Flow
(pro
t)26
5132
0232
1617
45Flt
Per
mitte
d1.0
01.0
00.9
51.0
0Sa
td. F
low (p
erm)
2651
3202
3216
1745
Peak
-hou
r fac
tor, P
HF0.9
30.9
30.9
30.9
30.9
30.9
3Ad
j. Flow
(vph
)0
1086
892
215
1129
710
RTOR
Red
uctio
n (vp
h)0
024
00
0La
ne G
roup
Flow
(vph
)0
1086
1083
011
2971
0He
avy V
ehicl
es (%
)4%
4%4%
4%4%
4%Tu
rn T
ype
Over
NAPr
otNA
Prote
cted P
hase
s1
21
Free
Perm
itted P
hase
sAc
tuated
Gre
en, G
(s)
39.5
32.9
39.5
81.4
Effec
tive G
reen
, g (s
)39
.532
.939
.581
.4Ac
tuated
g/C
Ratio
0.49
0.40
0.49
1.00
Clea
ranc
e Tim
e (s)
4.05.0
4.0Ve
hicle
Exten
sion (
s)3.0
3.03.0
Lane
Grp
Cap
(vph
)12
8612
9415
6017
45v/s
Rati
o Pro
tc0
.41c0
.340.3
50.4
1v/s
Rati
o Per
mv/c
Rati
o0.8
40.8
40.7
20.4
1Un
iform
Dela
y, d1
18.3
21.8
16.6
0.0Pr
ogre
ssion
Fac
tor1.0
01.0
01.0
01.0
0Inc
reme
ntal D
elay,
d25.3
4.91.7
0.7De
lay (s
)23
.526
.718
.30.7
Leve
l of S
ervic
eC
CB
AAp
proa
ch D
elay (
s)23
.526
.711
.5Ap
proa
ch LO
SC
CB
Inter
secti
on S
umma
ryHC
M 20
00 C
ontro
l Dela
y18
.9HC
M 20
00 Le
vel o
f Ser
vice
BHC
M 20
00 V
olume
to C
apac
ity ra
tio0.8
4Ac
tuated
Cyc
le Le
ngth
(s)
81.4
Sum
of los
t time
(s)
9.0Int
erse
ction
Cap
acity
Utili
zatio
n72
.2%IC
U Le
vel o
f Ser
vice
CAn
alysis
Per
iod (m
in)15
c C
ritica
l Lan
e Gro
up

1/2/20
15
Centr
al Co
ast T
rans
porta
tion C
onsu
lting
Sync
hro 8
Rep
ort
Queu
es
Lane
Gro
upEB
TEB
RW
BLW
BTNB
LNB
RLa
ne G
roup
Flow
(vph
)12
8915
510
876
165
41v/c
Rati
o0.9
90.1
40.1
60.6
60.6
80.1
7Co
ntrol
Delay
38.6
2.055
.910
.256
.118
.6Qu
eue D
elay
0.00.0
0.00.0
0.00.0
Total
Dela
y38
.62.0
55.9
10.2
56.1
18.6
Queu
e Len
gth 50
th (ft
)64
74
623
610
16
Queu
e Len
gth 95
th (ft
)#1
367
3126
476
179
37Int
erna
l Link
Dist
(ft)
3171
365
801
Turn
Bay
Leng
th (ft
)32
037
050
Base
Cap
acity
(vph
)13
0211
4063
1364
446
420
Star
vatio
n Cap
Red
uctn
00
00
00
Spillb
ack C
ap R
educ
tn0
00
00
0St
orag
e Cap
Red
uctn
00
00
00
Redu
ced v
/c Ra
tio0.9
90.1
40.1
60.6
40.3
70.1
0
Inter
secti
on S
umma
ry#
95th
perce
ntile
volum
e exc
eeds
capa
city,
queu
e may
be lo
nger
.
Que
ue sh
own i
s max
imum
after
two c
ycles
.
1/2/20
15
Centr
al Co
ast T
rans
porta
tion C
onsu
lting
Sync
hro 8
Rep
ort
HCM
2010
Sign
alize
d Inte
rsecti
on S
umma
ry
Move
ment
EBT
EBR
WBL
WBT
NBL
NBR
Lane
Con
figur
ation
sVo
lume (
veh/h
)12
5015
010
850
160
40Nu
mber
414
38
512
Initia
l Q (Q
b), v
eh0
00
00
0Pe
d-Bi
ke A
dj(A_
pbT)
1.00
1.00
1.00
1.00
Parki
ng B
us, A
dj1.0
01.0
01.0
01.0
01.0
01.0
0Ad
j Sat
Flow,
veh/h
/ln17
5917
5917
5017
5016
4516
45Ad
j Flow
Rate
, veh
/h12
8915
510
876
165
0Ad
j No.
of La
nes
11
11
11
Peak
Hou
r Fac
tor0.9
70.9
70.9
70.9
70.9
70.9
7Pe
rcent
Heav
y Veh
, %8
88
88
8Ca
p, ve
h/h12
8210
9016
1363
197
176
Arriv
e On G
reen
0.73
0.73
0.01
0.78
0.13
0.00
Sat F
low, v
eh/h
1759
1495
1667
1750
1567
1398
Grp V
olume
(v), v
eh/h
1289
155
1087
616
50
Grp S
at Flo
w(s),
veh/h
/ln17
5914
9516
6717
5015
6713
98Q
Serve
(g_s
), s
72.5
3.10.6
22.1
10.2
0.0Cy
cle Q
Clea
r(g_c
), s
72.5
3.10.6
22.1
10.2
0.0Pr
op In
Lane
1.00
1.00
1.00
1.00
Lane
Grp
Cap
(c), v
eh/h
1282
1090
1613
6319
717
6V/
C Ra
tio(X
)1.0
10.1
40.6
20.6
40.8
40.0
0Av
ail C
ap(c_
a), v
eh/h
1282
1090
6714
1647
242
2HC
M Pl
atoon
Rati
o1.0
01.0
01.0
01.0
01.0
01.0
0Up
strea
m Fil
ter(I)
1.00
1.00
1.00
1.00
1.00
0.00
Unifo
rm D
elay (
d), s
/veh
13.5
4.149
.14.9
42.5
0.0Inc
r Dela
y (d2
), s/v
eh26
.40.1
32.7
0.99.0
0.0Ini
tial Q
Dela
y(d3)
,s/ve
h0.0
0.00.0
0.00.0
0.0%
ile B
ackO
fQ(5
0%),v
eh/ln
43.6
1.30.4
10.8
4.90.0
LnGr
p Dela
y(d),s
/veh
39.9
4.181
.75.8
51.5
0.0Ln
Grp L
OSF
AF
AD
Appr
oach
Vol,
veh/h
1444
886
165
Appr
oach
Dela
y, s/v
eh36
.16.7
51.5
Appr
oach
LOS
DA
D
Timer
12
34
56
78
Assig
ned P
hs2
34
8Ph
s Dur
ation
(G+Y
+Rc),
s16
.55.0
78.0
83.0
Chan
ge P
eriod
(Y+R
c), s
4.04.0
5.55.5
Max G
reen
Sett
ing (G
max),
s30
.04.0
72.5
80.5
Max Q
Clea
r Tim
e (g_
c+I1)
, s12
.22.6
74.5
24.1
Gree
n Ext
Time (
p_c),
s0.4
0.00.0
33.8
Inter
secti
on S
umma
ryHC
M 20
10 C
trl De
lay26
.7HC
M 20
10 LO
SC

1/2/20
15
Centr
al Co
ast T
rans
porta
tion C
onsu
lting
Sync
hro 8
Rep
ort
HCM
2010
TW
SC
Inter
secti
onInt
Dela
y, s/v
eh30
.1
Move
ment
EBL
EBT
EBR
WBL
WBT
WBR
NBL
NBT
NBR
SBL
SBT
SBR
Vol, v
eh/h
1011
9030
2176
010
202
608
36
Confl
icting
Ped
s, #/h
r0
00
00
00
00
00
0Si
gn C
ontro
l Fr
eeFr
eeFr
eeFr
eeFr
eeFr
eeSt
opSt
opSt
opSt
opSt
opSt
opRT
Cha
nneli
zed
--
None
--
None
--
None
--
None
Stor
age L
ength
400
-70
210
--
--
--
-60
Veh i
n Med
ian S
torag
e, #
-0
--
0-
-0
--
0-
Grad
e, %
-4
--
2-
-7
--
1-
Peak
Hou
r Fac
tor95
9595
9595
9595
9595
9595
95He
avy V
ehicl
es, %
88
88
88
88
88
88
Mvmt
Flow
1112
5332
2280
011
212
638
36
Major
/Mino
rMa
jor1
Major
2Mi
nor1
Mino
r2Co
nflict
ing F
low A
ll81
10
012
530
021
2521
2912
5321
5521
2380
5
S
tage 1
--
--
--
1274
1274
-84
984
9-
Stag
e 2-
--
--
-85
185
5-
1306
1274
-Cr
itical
Hdwy
4.18
--
4.18
--
8.58
7.98
6.98
7.38
6.78
6.38
Critic
al Hd
wy S
tg 1
--
--
--
7.58
6.98
-6.3
85.7
8-
Critic
al Hd
wy S
tg 2
--
--
--
7.58
6.98
-6.3
85.7
8-
Follo
w-up
Hdw
y2.2
72-
-2.2
72-
-3.5
724.0
723.3
723.5
724.0
723.3
72Po
t Cap
-1 M
aneu
ver
789
--
535
--
~ 15
2116
029
4336
5
S
tage 1
--
--
--
121
141
-33
135
2-
Stag
e 2-
--
--
-24
926
3-
178
216
-Pl
atoon
bloc
ked,
%-
--
-Mo
v Cap
-1 M
aneu
ver
789
--
535
--
~ 13
2016
015
4136
5Mo
v Cap
-2 M
aneu
ver
--
--
--
~ 13
20-
1541
-
S
tage 1
--
--
--
119
139
-32
633
8-
Stag
e 2-
--
--
-23
225
2-
105
213
-
Appr
oach
EBW
BNB
SBHC
M Co
ntrol
Delay
, s0.1
0.3$ 7
22.3
250.1
HCM
LOS
FF
Mino
r Lan
e/Majo
r Mvm
tNB
Ln1
EBL
EBT
EBR
WBL
WBT
WBR
SBLn
1SBL
n2Ca
pacit
y (ve
h/h)
4178
9-
-53
5-
-18
365
HCM
Lane
V/C
Rati
o2.1
050.0
13-
-0.0
41-
-0.6
430.0
17HC
M Co
ntrol
Delay
(s)
$ 722
.39.6
--
12-
-$ 37
8.415
HCM
Lane
LOS
FA
--
B-
-F
CHC
M 95
th %
tile Q
(veh)
9.20
--
0.1-
-1.7
0.1
Notes
~: V
olume
exce
eds c
apac
ity
$: D
elay e
xcee
ds 30
0s
+: C
ompu
tation
Not
Defin
ed
*: A
ll majo
r volu
me in
plato
on
1/2/20
15
Centr
al Co
ast T
rans
porta
tion C
onsu
lting
Sync
hro 8
Rep
ort
Queu
es
Lane
Gro
upW
BRNB
TSB
LSB
TLa
ne G
roup
Flow
(vph
)11
8111
0111
9160
0v/c
Rati
o0.8
80.8
80.7
30.3
4Co
ntrol
Delay
28.1
33.5
19.9
0.5Qu
eue D
elay
0.00.0
0.00.0
Total
Dela
y28
.133
.519
.90.5
Queu
e Len
gth 50
th (ft
)31
929
025
70
Queu
e Len
gth 95
th (ft
)#4
55#4
1333
60
Inter
nal L
ink D
ist (f
t)16
1420
81Tu
rn B
ay Le
ngth
(ft)
370
Base
Cap
acity
(vph
)14
5913
6417
7117
45St
arva
tion C
ap R
educ
tn0
00
0Sp
illbac
k Cap
Red
uctn
00
00
Stor
age C
ap R
educ
tn0
00
0Re
duce
d v/c
Ratio
0.81
0.81
0.67
0.34
Inter
secti
on S
umma
ry#
95th
perce
ntile
volum
e exc
eeds
capa
city,
queu
e may
be lo
nger
.
Que
ue sh
own i
s max
imum
after
two c
ycles
.

1/2/20
15
Centr
al Co
ast T
rans
porta
tion C
onsu
lting
Sync
hro 8
Rep
ort
HCM
Sign
alize
d Inte
rsecti
on C
apac
ity A
nalys
is
Move
ment
WBL
WBR
NBT
NBR
SBL
SBT
Lane
Con
figur
ation
sVo
lume (
vph)
011
1085
617
911
2056
4Ide
al Flo
w (vp
hpl)
1900
1900
1900
1900
1900
1900
Grad
e (%
)6%
10%
9%To
tal Lo
st tim
e (s)
4.05.0
4.04.0
Lane
Util.
Fac
tor0.8
80.9
50.9
71.0
0Fr
t0.8
50.9
71.0
01.0
0Flt
Pro
tected
1.00
1.00
0.95
1.00
Satd.
Flow
(pro
t)26
5132
1232
1617
45Flt
Per
mitte
d1.0
01.0
00.9
51.0
0Sa
td. F
low (p
erm)
2651
3212
3216
1745
Peak
-hou
r fac
tor, P
HF0.9
40.9
40.9
40.9
40.9
40.9
4Ad
j. Flow
(vph
)0
1181
911
190
1191
600
RTOR
Red
uctio
n (vp
h)0
020
00
0La
ne G
roup
Flow
(vph
)0
1181
1081
011
9160
0He
avy V
ehicl
es (%
)4%
4%4%
4%4%
4%Tu
rn T
ype
Over
NAPr
otNA
Prote
cted P
hase
s1
21
Free
Perm
itted P
hase
sAc
tuated
Gre
en, G
(s)
43.1
32.7
43.1
84.8
Effec
tive G
reen
, g (s
)43
.132
.743
.184
.8Ac
tuated
g/C
Ratio
0.51
0.39
0.51
1.00
Clea
ranc
e Tim
e (s)
4.05.0
4.0Ve
hicle
Exten
sion (
s)3.0
3.03.0
Lane
Grp
Cap
(vph
)13
4712
3816
3417
45v/s
Rati
o Pro
tc0
.45c0
.340.3
70.3
4v/s
Rati
o Per
mv/c
Rati
o0.8
80.8
70.7
30.3
4Un
iform
Dela
y, d1
18.5
24.1
16.3
0.0Pr
ogre
ssion
Fac
tor1.0
01.0
01.0
01.0
0Inc
reme
ntal D
elay,
d26.7
7.11.7
0.5De
lay (s
)25
.231
.217
.90.5
Leve
l of S
ervic
eC
CB
AAp
proa
ch D
elay (
s)25
.231
.212
.1Ap
proa
ch LO
SC
CB
Inter
secti
on S
umma
ryHC
M 20
00 C
ontro
l Dela
y21
.1HC
M 20
00 Le
vel o
f Ser
vice
CHC
M 20
00 V
olume
to C
apac
ity ra
tio0.8
8Ac
tuated
Cyc
le Le
ngth
(s)
84.8
Sum
of los
t time
(s)
9.0Int
erse
ction
Cap
acity
Utili
zatio
n75
.7%IC
U Le
vel o
f Ser
vice
DAn
alysis
Per
iod (m
in)15
c C
ritica
l Lan
e Gro
up
1/2/20
15
Centr
al Co
ast T
rans
porta
tion C
onsu
lting
Sync
hro 8
Rep
ort
Queu
es
Lane
Gro
upEB
TEB
RW
BLW
BTNB
LNB
RLa
ne G
roup
Flow
(vph
)12
0513
919
898
189
52v/c
Rati
o0.9
60.1
30.3
10.6
90.7
20.2
0Co
ntrol
Delay
34.5
2.265
.411
.957
.620
.2Qu
eue D
elay
0.00.0
0.00.0
0.00.0
Total
Dela
y34
.52.2
65.4
11.9
57.6
20.2
Queu
e Len
gth 50
th (ft
)55
43
1226
711
510
Queu
e Len
gth 95
th (ft
)#1
282
2840
548
203
45Int
erna
l Link
Dist
(ft)
3171
365
801
Turn
Bay
Leng
th (ft
)32
037
050
Base
Cap
acity
(vph
)12
5711
0362
1334
436
414
Star
vatio
n Cap
Red
uctn
00
00
00
Spillb
ack C
ap R
educ
tn0
00
00
0St
orag
e Cap
Red
uctn
00
00
00
Redu
ced v
/c Ra
tio0.9
60.1
30.3
10.6
70.4
30.1
3
Inter
secti
on S
umma
ry#
95th
perce
ntile
volum
e exc
eeds
capa
city,
queu
e may
be lo
nger
.
Que
ue sh
own i
s max
imum
after
two c
ycles
.

1/2/20
15
Centr
al Co
ast T
rans
porta
tion C
onsu
lting
Sync
hro 8
Rep
ort
HCM
2010
Sign
alize
d Inte
rsecti
on S
umma
ry
Move
ment
EBT
EBR
WBL
WBT
NBL
NBR
Lane
Con
figur
ation
sVo
lume (
veh/h
)11
6913
518
871
183
50Nu
mber
414
38
512
Initia
l Q (Q
b), v
eh0
00
00
0Pe
d-Bi
ke A
dj(A_
pbT)
1.00
1.00
1.00
1.00
Parki
ng B
us, A
dj1.0
01.0
01.0
01.0
01.0
01.0
0Ad
j Sat
Flow,
veh/h
/ln17
5917
5917
5017
5016
4516
45Ad
j Flow
Rate
, veh
/h12
0513
919
898
189
0Ad
j No.
of La
nes
11
11
11
Peak
Hou
r Fac
tor0.9
70.9
70.9
70.9
70.9
70.9
7Pe
rcent
Heav
y Veh
, %8
88
88
8Ca
p, ve
h/h12
4710
6027
1339
222
198
Arriv
e On G
reen
0.71
0.71
0.02
0.76
0.14
0.00
Sat F
low, v
eh/h
1759
1495
1667
1750
1567
1398
Grp V
olume
(v), v
eh/h
1205
139
1989
818
90
Grp S
at Flo
w(s),
veh/h
/ln17
5914
9516
6717
5015
6713
98Q
Serve
(g_s
), s
64.1
3.01.1
25.1
11.9
0.0Cy
cle Q
Clea
r(g_c
), s
64.1
3.01.1
25.1
11.9
0.0Pr
op In
Lane
1.00
1.00
1.00
1.00
Lane
Grp
Cap
(c), v
eh/h
1247
1060
2713
3922
219
8V/
C Ra
tio(X
)0.9
70.1
30.7
00.6
70.8
50.0
0Av
ail C
ap(c_
a), v
eh/h
1260
1071
6613
9246
441
4HC
M Pl
atoon
Rati
o1.0
01.0
01.0
01.0
01.0
01.0
0Up
strea
m Fil
ter(I)
1.00
1.00
1.00
1.00
1.00
0.00
Unifo
rm D
elay (
d), s
/veh
13.6
4.749
.55.8
42.4
0.0Inc
r Dela
y (d2
), s/v
eh17
.80.1
27.3
1.29.0
0.0Ini
tial Q
Dela
y(d3)
,s/ve
h0.0
0.00.0
0.00.0
0.0%
ile B
ackO
fQ(5
0%),v
eh/ln
36.6
1.30.7
12.4
5.70.0
LnGr
p Dela
y(d),s
/veh
31.4
4.876
.97.0
51.4
0.0Ln
Grp L
OSC
AE
AD
Appr
oach
Vol,
veh/h
1344
917
189
Appr
oach
Dela
y, s/v
eh28
.68.4
51.4
Appr
oach
LOS
CA
D
Timer
12
34
56
78
Assig
ned P
hs2
34
8Ph
s Dur
ation
(G+Y
+Rc),
s18
.35.7
77.3
82.9
Chan
ge P
eriod
(Y+R
c), s
4.04.0
5.55.5
Max G
reen
Sett
ing (G
max),
s30
.04.0
72.5
80.5
Max Q
Clea
r Tim
e (g_
c+I1)
, s13
.93.1
66.1
27.1
Gree
n Ext
Time (
p_c),
s0.5
0.05.7
30.0
Inter
secti
on S
umma
ryHC
M 20
10 C
trl De
lay22
.8HC
M 20
10 LO
SC
1/2/20
15
Centr
al Co
ast T
rans
porta
tion C
onsu
lting
Sync
hro 8
Rep
ort
HCM
2010
TW
SC
Inter
secti
onInt
Dela
y, s/v
eh23
.1
Move
ment
EBL
EBT
EBR
WBL
WBT
WBR
NBL
NBT
NBR
SBL
SBT
SBR
Vol, v
eh/h
811
8431
1982
74
230
3511
114
Confl
icting
Ped
s, #/h
r0
00
00
00
00
00
0Si
gn C
ontro
l Fr
eeFr
eeFr
eeFr
eeFr
eeFr
eeSt
opSt
opSt
opSt
opSt
opSt
opRT
Cha
nneli
zed
--
None
--
None
--
None
--
None
Stor
age L
ength
400
-70
210
--
--
--
-60
Veh i
n Med
ian S
torag
e, #
-0
--
0-
-0
--
0-
Grad
e, %
-4
--
2-
-7
--
1-
Peak
Hou
r Fac
tor96
9696
9696
9696
9696
9696
96He
avy V
ehicl
es, %
88
88
88
88
88
88
Mvmt
Flow
812
3332
2086
14
240
3611
115
Major
/Mino
rMa
jor1
Major
2Mi
nor1
Mino
r2Co
nflict
ing F
low A
ll86
60
012
330
021
5421
5512
3321
7121
5386
4
S
tage 1
--
--
--
1250
1250
-90
390
3-
Stag
e 2-
--
--
-90
490
5-
1268
1250
-Cr
itical
Hdwy
4.18
--
4.18
--
8.58
7.98
6.98
7.38
6.78
6.38
Critic
al Hd
wy S
tg 1
--
--
--
7.58
6.98
-6.3
85.7
8-
Critic
al Hd
wy S
tg 2
--
--
--
7.58
6.98
-6.3
85.7
8-
Follo
w-up
Hdw
y2.2
72-
-2.2
72-
-3.5
724.0
723.3
723.5
724.0
723.3
72Po
t Cap
-1 M
aneu
ver
752
--
545
--
~ 14
2016
529
4133
7
S
tage 1
--
--
--
127
146
-30
833
1-
Stag
e 2-
--
--
-22
824
4-
187
222
-Pl
atoon
bloc
ked,
%-
--
-Mo
v Cap
-1 M
aneu
ver
752
--
545
--
~ 13
1916
522
3933
7Mo
v Cap
-2 M
aneu
ver
--
--
--
~ 13
19-
2239
-
S
tage 1
--
--
--
126
144
-30
531
9-
Stag
e 2-
--
--
-20
923
5-
144
220
-
Appr
oach
EBW
BNB
SBHC
M Co
ntrol
Delay
, s0.1
0.3$ 7
92.2
137.9
HCM
LOS
FF
Mino
r Lan
e/Majo
r Mvm
tNB
Ln1
EBL
EBT
EBR
WBL
WBT
WBR
SBLn
1SBL
n2Ca
pacit
y (ve
h/h)
2975
2-
-54
5-
-23
337
HCM
Lane
V/C
Rati
o2.0
830.0
11-
-0.0
36-
-0.5
430.0
43HC
M Co
ntrol
Delay
(s)
$ 792
.29.8
--
11.9
--
279.8
16.2
HCM
Lane
LOS
FA
--
B-
-F
CHC
M 95
th %
tile Q
(veh)
7.10
--
0.1-
-1.6
0.1
Notes
~: V
olume
exce
eds c
apac
ity
$: D
elay e
xcee
ds 30
0s
+: C
ompu
tation
Not
Defin
ed
*: A
ll majo
r volu
me in
plato
on

1/2/20
15
Centr
al Co
ast T
rans
porta
tion C
onsu
lting
Sync
hro 8
Rep
ort
Queu
es
Lane
Gro
upW
BRNB
TSB
LSB
TLa
ne G
roup
Flow
(vph
)84
610
0089
969
7v/c
Rati
o0.7
30.7
60.6
40.4
0Co
ntrol
Delay
18.4
19.3
15.7
0.7Qu
eue D
elay
0.00.0
0.00.0
Total
Dela
y18
.419
.315
.70.7
Queu
e Len
gth 50
th (ft
)14
215
512
90
Queu
e Len
gth 95
th (ft
)22
624
219
90
Inter
nal L
ink D
ist (f
t)16
1420
81Tu
rn B
ay Le
ngth
(ft)
370
Base
Cap
acity
(vph
)15
1316
8018
3617
45St
arva
tion C
ap R
educ
tn0
00
0Sp
illbac
k Cap
Red
uctn
00
00
Stor
age C
ap R
educ
tn0
00
0Re
duce
d v/c
Ratio
0.56
0.60
0.49
0.40
Inter
secti
on S
umma
ry
1/2/20
15
Centr
al Co
ast T
rans
porta
tion C
onsu
lting
Sync
hro 8
Rep
ort
HCM
Sign
alize
d Inte
rsecti
on C
apac
ity A
nalys
is
Move
ment
WBL
WBR
NBT
NBR
SBL
SBT
Lane
Con
figur
ation
sVo
lume (
vph)
080
474
220
885
466
2Ide
al Flo
w (vp
hpl)
1900
1900
1900
1900
1900
1900
Grad
e (%
)6%
10%
9%To
tal Lo
st tim
e (s)
4.05.0
4.04.0
Lane
Util.
Fac
tor0.8
80.9
50.9
71.0
0Fr
t0.8
50.9
71.0
01.0
0Flt
Pro
tected
1.00
1.00
0.95
1.00
Satd.
Flow
(pro
t)26
5131
8932
1617
45Flt
Per
mitte
d1.0
01.0
00.9
51.0
0Sa
td. F
low (p
erm)
2651
3189
3216
1745
Peak
-hou
r fac
tor, P
HF0.9
50.9
50.9
50.9
50.9
50.9
5Ad
j. Flow
(vph
)0
846
781
219
899
697
RTOR
Red
uctio
n (vp
h)0
038
00
0La
ne G
roup
Flow
(vph
)0
846
962
089
969
7He
avy V
ehicl
es (%
)4%
4%4%
4%4%
4%Tu
rn T
ype
Over
NAPr
otNA
Prote
cted P
hase
s1
21
Free
Perm
itted P
hase
sAc
tuated
Gre
en, G
(s)
25.9
23.5
25.9
58.4
Effec
tive G
reen
, g (s
)25
.923
.525
.958
.4Ac
tuated
g/C
Ratio
0.44
0.40
0.44
1.00
Clea
ranc
e Tim
e (s)
4.05.0
4.0Ve
hicle
Exten
sion (
s)3.0
3.03.0
Lane
Grp
Cap
(vph
)11
7512
8314
2617
45v/s
Rati
o Pro
tc0
.32c0
.300.2
80.4
0v/s
Rati
o Per
mv/c
Rati
o0.7
20.7
50.6
30.4
0Un
iform
Dela
y, d1
13.3
14.9
12.6
0.0Pr
ogre
ssion
Fac
tor1.0
01.0
01.0
01.0
0Inc
reme
ntal D
elay,
d22.1
2.50.9
0.7De
lay (s
)15
.417
.413
.50.7
Leve
l of S
ervic
eB
BB
AAp
proa
ch D
elay (
s)15
.417
.47.9
Appr
oach
LOS
BB
A
Inter
secti
on S
umma
ryHC
M 20
00 C
ontro
l Dela
y12
.5HC
M 20
00 Le
vel o
f Ser
vice
BHC
M 20
00 V
olume
to C
apac
ity ra
tio0.7
3Ac
tuated
Cyc
le Le
ngth
(s)
58.4
Sum
of los
t time
(s)
9.0Int
erse
ction
Cap
acity
Utili
zatio
n62
.8%IC
U Le
vel o
f Ser
vice
BAn
alysis
Per
iod (m
in)15
c C
ritica
l Lan
e Gro
up

1/2/20
15
Centr
al Co
ast T
rans
porta
tion C
onsu
lting
Sync
hro 8
Rep
ort
Queu
es
Lane
Gro
upEB
TEB
RW
BLW
BTNB
LNB
RLa
ne G
roup
Flow
(vph
)87
510
910
976
9913
v/c R
atio
0.65
0.09
0.11
0.71
0.47
0.07
Contr
ol De
lay10
.91.6
37.2
10.3
37.5
14.5
Queu
e Dela
y0.0
0.00.0
0.00.0
0.0To
tal D
elay
10.9
1.637
.210
.337
.514
.5Qu
eue L
ength
50th
(ft)
170
05
215
480
Queu
e Len
gth 95
th (ft
)#5
6718
19#4
5982
14Int
erna
l Link
Dist
(ft)
3171
365
801
Turn
Bay
Leng
th (ft
)32
037
050
Base
Cap
acity
(vph
)13
4511
6889
1376
631
572
Star
vatio
n Cap
Red
uctn
00
00
00
Spillb
ack C
ap R
educ
tn0
00
00
0St
orag
e Cap
Red
uctn
00
00
00
Redu
ced v
/c Ra
tio0.6
50.0
90.1
10.7
10.1
60.0
2
Inter
secti
on S
umma
ry#
95th
perce
ntile
volum
e exc
eeds
capa
city,
queu
e may
be lo
nger
.
Que
ue sh
own i
s max
imum
after
two c
ycles
.
1/2/20
15
Centr
al Co
ast T
rans
porta
tion C
onsu
lting
Sync
hro 8
Rep
ort
HCM
2010
Sign
alize
d Inte
rsecti
on S
umma
ry
Move
ment
EBT
EBR
WBL
WBT
NBL
NBR
Lane
Con
figur
ation
sVo
lume (
veh/h
)81
410
19
908
9212
Numb
er4
143
85
12Ini
tial Q
(Qb)
, veh
00
00
00
Ped-
Bike
Adj(
A_pb
T)1.0
01.0
01.0
01.0
0Pa
rking
Bus
, Adj
1.00
1.00
1.00
1.00
1.00
1.00
Adj S
at Flo
w, ve
h/h/ln
1759
1759
1750
1750
1645
1645
Adj F
low R
ate, v
eh/h
875
109
1097
699
0Ad
j No.
of La
nes
11
11
11
Peak
Hou
r Fac
tor0.9
30.9
30.9
30.9
30.9
30.9
3Pe
rcent
Heav
y Veh
, %8
88
88
8Ca
p, ve
h/h11
4797
517
1293
125
112
Arriv
e On G
reen
0.65
0.65
0.01
0.74
0.08
0.00
Sat F
low, v
eh/h
1759
1495
1667
1750
1567
1398
Grp V
olume
(v), v
eh/h
875
109
1097
699
0Gr
p Sat
Flow(
s),ve
h/h/ln
1759
1495
1667
1750
1567
1398
Q Se
rve(g
_s),
s18
.11.4
0.317
.33.3
0.0Cy
cle Q
Clea
r(g_c
), s
18.1
1.40.3
17.3
3.30.0
Prop
In La
ne1.0
01.0
01.0
01.0
0La
ne G
rp C
ap(c)
, veh
/h11
4797
517
1293
125
112
V/C
Ratio
(X)
0.76
0.11
0.58
0.75
0.79
0.00
Avail
Cap
(c_a)
, veh
/h14
2612
1212
716
8689
680
0HC
M Pl
atoon
Rati
o1.0
01.0
01.0
01.0
01.0
01.0
0Up
strea
m Fil
ter(I)
1.00
1.00
1.00
1.00
1.00
0.00
Unifo
rm D
elay (
d), s
/veh
6.33.4
25.8
4.023
.70.0
Incr D
elay (
d2),
s/veh
2.00.1
27.2
1.410
.50.0
Initia
l Q D
elay(d
3),s/
veh
0.00.0
0.00.0
0.00.0
%ile
Bac
kOfQ
(50%
),veh
/ln9.1
0.60.3
8.41.8
0.0Ln
Grp D
elay(d
),s/ve
h8.3
3.553
.15.5
34.1
0.0Ln
Grp L
OSA
AD
AC
Appr
oach
Vol,
veh/h
984
986
99Ap
proa
ch D
elay,
s/veh
7.76.0
34.1
Appr
oach
LOS
AA
C
Timer
12
34
56
78
Assig
ned P
hs2
34
8Ph
s Dur
ation
(G+Y
+Rc),
s8.2
4.539
.744
.2Ch
ange
Per
iod (Y
+Rc),
s4.0
4.05.5
5.5Ma
x Gre
en S
etting
(Gma
x), s
30.0
4.042
.550
.5Ma
x Q C
lear T
ime (
g_c+
I1), s
5.32.3
20.1
19.3
Gree
n Ext
Time (
p_c),
s0.2
0.014
.117
.3
Inter
secti
on S
umma
ryHC
M 20
10 C
trl De
lay8.2
HCM
2010
LOS
A

1/2/20
15
Centr
al Co
ast T
rans
porta
tion C
onsu
lting
Sync
hro 8
Rep
ort
HCM
2010
TW
SC
Inter
secti
onInt
Dela
y, s/v
eh6.9
Move
ment
EBL
EBT
EBR
WBL
WBT
WBR
NBL
NBT
NBR
SBL
SBT
SBR
Vol, v
eh/h
881
722
2189
35
180
301
05
Confl
icting
Ped
s, #/h
r0
00
00
00
00
00
0Si
gn C
ontro
l Fr
eeFr
eeFr
eeFr
eeFr
eeFr
eeSt
opSt
opSt
opSt
opSt
opSt
opRT
Cha
nneli
zed
--
None
--
None
--
None
--
None
Stor
age L
ength
400
-70
210
--
--
--
-60
Veh i
n Med
ian S
torag
e, #
-0
--
0-
-0
--
0-
Grad
e, %
-4
--
2-
-7
--
1-
Peak
Hou
r Fac
tor92
9292
9292
9292
9292
9292
92He
avy V
ehicl
es, %
88
88
88
88
88
88
Mvmt
Flow
988
824
2397
15
200
331
05
Major
/Mino
rMa
jor1
Major
2Mi
nor1
Mino
r2Co
nflict
ing F
low A
ll97
60
088
80
019
2419
2788
819
4119
2497
3
S
tage 1
--
--
--
905
905
-10
1910
19-
Stag
e 2-
--
--
-10
1910
22-
922
905
-Cr
itical
Hdwy
4.18
--
4.18
--
8.58
7.98
6.98
7.38
6.78
6.38
Critic
al Hd
wy S
tg 1
--
--
--
7.58
6.98
-6.3
85.7
8-
Critic
al Hd
wy S
tg 2
--
--
--
7.58
6.98
-6.3
85.7
8-
Follo
w-up
Hdw
y2.2
72-
-2.2
72-
-3.5
724.0
723.3
723.5
724.0
723.3
72Po
t Cap
-1 M
aneu
ver
683
--
738
--
2330
281
4258
290
Stag
e 1-
--
--
-22
724
4-
263
290
-
S
tage 2
--
--
--
187
206
-30
033
0-
Plato
on bl
ocke
d, %
--
--
Mov C
ap-1
Man
euve
r68
3-
-73
8-
-22
2928
136
5529
0Mo
v Cap
-2 M
aneu
ver
--
--
--
2229
-36
55-
Stag
e 1-
--
--
-22
424
1-
260
281
-
S
tage 2
--
--
--
178
200
-26
232
6-
Appr
oach
EBW
BNB
SBHC
M Co
ntrol
Delay
, s0.1
0.225
1.832
.8HC
M LO
SF
D
Mino
r Lan
e/Majo
r Mvm
tNB
Ln1
EBL
EBT
EBR
WBL
WBT
WBR
SBLn
1SBL
n2Ca
pacit
y (ve
h/h)
5268
3-
-73
8-
-36
290
HCM
Lane
V/C
Rati
o1.0
030.0
13-
-0.0
31-
-0.0
30.0
19HC
M Co
ntrol
Delay
(s)
251.8
10.3
--
10-
-10
8.117
.7HC
M La
ne LO
SF
B-
-B
--
FC
HCM
95th
%tile
Q(ve
h)4.4
0-
-0.1
--
0.10.1
1/2/20
15
Centr
al Co
ast T
rans
porta
tion C
onsu
lting
Sync
hro 8
Rep
ort
Queu
es
Lane
Gro
upW
BRNB
TSB
LSB
TLa
ne G
roup
Flow
(vph
)15
7282
914
0859
8v/c
Rati
o0.9
50.9
10.7
00.3
4Co
ntrol
Delay
30.1
45.1
13.7
0.5Qu
eue D
elay
0.00.0
0.00.0
Total
Dela
y30
.145
.113
.70.5
Queu
e Len
gth 50
th (ft
)42
722
525
10
Queu
e Len
gth 95
th (ft
)#6
52#3
3932
60
Inter
nal L
ink D
ist (f
t)16
1420
81Tu
rn B
ay Le
ngth
(ft)
370
Base
Cap
acity
(vph
)16
7192
920
2817
45St
arva
tion C
ap R
educ
tn0
00
0Sp
illbac
k Cap
Red
uctn
00
00
Stor
age C
ap R
educ
tn0
00
0Re
duce
d v/c
Ratio
0.94
0.89
0.69
0.34
Inter
secti
on S
umma
ry#
95th
perce
ntile
volum
e exc
eeds
capa
city,
queu
e may
be lo
nger
.
Que
ue sh
own i
s max
imum
after
two c
ycles
.
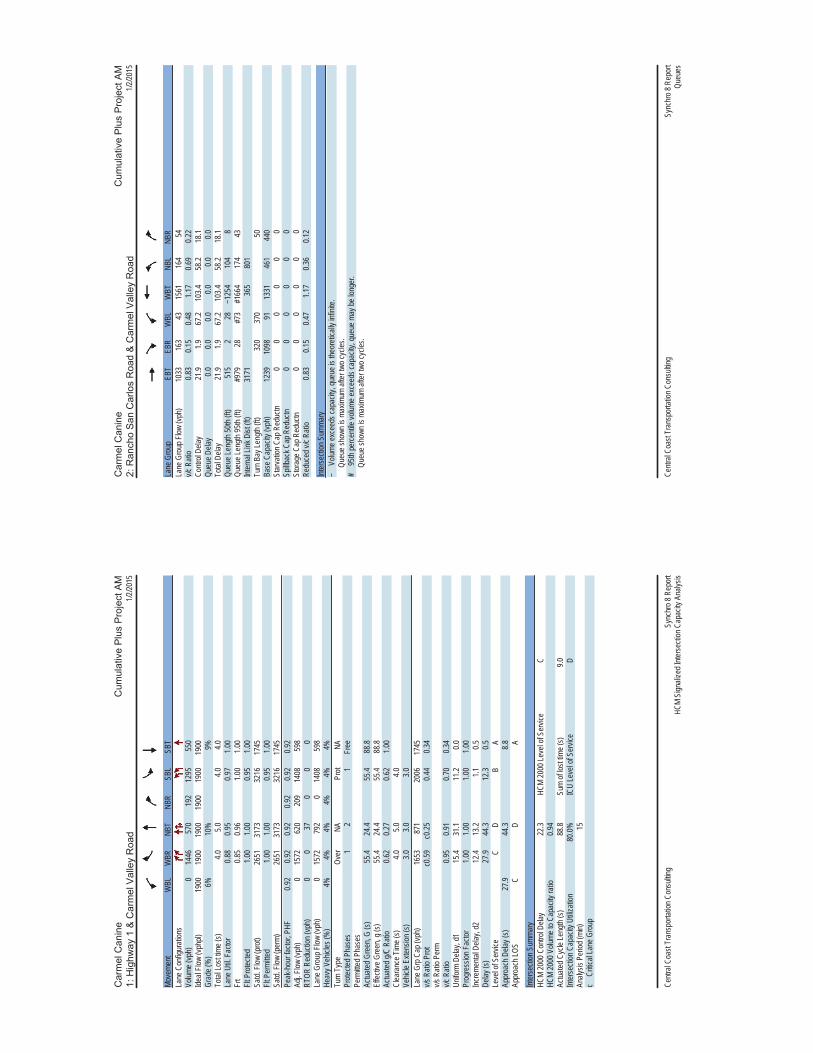
1/2/20
15
Centr
al Co
ast T
rans
porta
tion C
onsu
lting
Sync
hro 8
Rep
ort
HCM
Sign
alize
d Inte
rsecti
on C
apac
ity A
nalys
is
Move
ment
WBL
WBR
NBT
NBR
SBL
SBT
Lane
Con
figur
ation
sVo
lume (
vph)
014
4657
019
212
9555
0Ide
al Flo
w (vp
hpl)
1900
1900
1900
1900
1900
1900
Grad
e (%
)6%
10%
9%To
tal Lo
st tim
e (s)
4.05.0
4.04.0
Lane
Util.
Fac
tor0.8
80.9
50.9
71.0
0Fr
t0.8
50.9
61.0
01.0
0Flt
Pro
tected
1.00
1.00
0.95
1.00
Satd.
Flow
(pro
t)26
5131
7332
1617
45Flt
Per
mitte
d1.0
01.0
00.9
51.0
0Sa
td. F
low (p
erm)
2651
3173
3216
1745
Peak
-hou
r fac
tor, P
HF0.9
20.9
20.9
20.9
20.9
20.9
2Ad
j. Flow
(vph
)0
1572
620
209
1408
598
RTOR
Red
uctio
n (vp
h)0
037
00
0La
ne G
roup
Flow
(vph
)0
1572
792
014
0859
8He
avy V
ehicl
es (%
)4%
4%4%
4%4%
4%Tu
rn T
ype
Over
NAPr
otNA
Prote
cted P
hase
s1
21
Free
Perm
itted P
hase
sAc
tuated
Gre
en, G
(s)
55.4
24.4
55.4
88.8
Effec
tive G
reen
, g (s
)55
.424
.455
.488
.8Ac
tuated
g/C
Ratio
0.62
0.27
0.62
1.00
Clea
ranc
e Tim
e (s)
4.05.0
4.0Ve
hicle
Exten
sion (
s)3.0
3.03.0
Lane
Grp
Cap
(vph
)16
5387
120
0617
45v/s
Rati
o Pro
tc0
.59c0
.250.4
40.3
4v/s
Rati
o Per
mv/c
Rati
o0.9
50.9
10.7
00.3
4Un
iform
Dela
y, d1
15.4
31.1
11.2
0.0Pr
ogre
ssion
Fac
tor1.0
01.0
01.0
01.0
0Inc
reme
ntal D
elay,
d212
.413
.21.1
0.5De
lay (s
)27
.944
.312
.30.5
Leve
l of S
ervic
eC
DB
AAp
proa
ch D
elay (
s)27
.944
.38.8
Appr
oach
LOS
CD
A
Inter
secti
on S
umma
ryHC
M 20
00 C
ontro
l Dela
y22
.3HC
M 20
00 Le
vel o
f Ser
vice
CHC
M 20
00 V
olume
to C
apac
ity ra
tio0.9
4Ac
tuated
Cyc
le Le
ngth
(s)
88.8
Sum
of los
t time
(s)
9.0Int
erse
ction
Cap
acity
Utili
zatio
n80
.0%IC
U Le
vel o
f Ser
vice
DAn
alysis
Per
iod (m
in)15
c C
ritica
l Lan
e Gro
up
1/2/20
15
Centr
al Co
ast T
rans
porta
tion C
onsu
lting
Sync
hro 8
Rep
ort
Queu
es
Lane
Gro
upEB
TEB
RW
BLW
BTNB
LNB
RLa
ne G
roup
Flow
(vph
)10
3316
343
1561
164
54v/c
Rati
o0.8
30.1
50.4
81.1
70.6
90.2
2Co
ntrol
Delay
21.9
1.967
.210
3.458
.218
.1Qu
eue D
elay
0.00.0
0.00.0
0.00.0
Total
Dela
y21
.91.9
67.2
103.4
58.2
18.1
Queu
e Len
gth 50
th (ft
)51
52
28~1
254
104
8Qu
eue L
ength
95th
(ft)
#979
28#7
3#1
664
174
43Int
erna
l Link
Dist
(ft)
3171
365
801
Turn
Bay
Leng
th (ft
)32
037
050
Base
Cap
acity
(vph
)12
3910
9891
1331
461
440
Star
vatio
n Cap
Red
uctn
00
00
00
Spillb
ack C
ap R
educ
tn0
00
00
0St
orag
e Cap
Red
uctn
00
00
00
Redu
ced v
/c Ra
tio0.8
30.1
50.4
71.1
70.3
60.1
2
Inter
secti
on S
umma
ry~
Volu
me ex
ceed
s cap
acity
, que
ue is
theo
retic
ally i
nfinit
e.
Que
ue sh
own i
s max
imum
after
two c
ycles
.#
95th
perce
ntile
volum
e exc
eeds
capa
city,
queu
e may
be lo
nger
.
Que
ue sh
own i
s max
imum
after
two c
ycles
.

1/2/20
15
Centr
al Co
ast T
rans
porta
tion C
onsu
lting
Sync
hro 8
Rep
ort
HCM
2010
Sign
alize
d Inte
rsecti
on S
umma
ry
Move
ment
EBT
EBR
WBL
WBT
NBL
NBR
Lane
Con
figur
ation
sVo
lume (
veh/h
)95
015
040
1436
151
50Nu
mber
414
38
512
Initia
l Q (Q
b), v
eh0
00
00
0Pe
d-Bi
ke A
dj(A_
pbT)
1.00
1.00
1.00
1.00
Parki
ng B
us, A
dj1.0
01.0
01.0
01.0
01.0
01.0
0Ad
j Sat
Flow,
veh/h
/ln17
5917
5917
5017
5016
4516
45Ad
j Flow
Rate
, veh
/h10
3316
343
1561
164
0Ad
j No.
of La
nes
11
11
11
Peak
Hou
r Fac
tor0.9
20.9
20.9
20.9
20.9
20.9
2Pe
rcent
Heav
y Veh
, %8
88
88
8Ca
p, ve
h/h12
4710
6053
1366
196
175
Arriv
e On G
reen
0.71
0.71
0.03
0.78
0.13
0.00
Sat F
low, v
eh/h
1759
1495
1667
1750
1567
1398
Grp V
olume
(v), v
eh/h
1033
163
4315
6116
40
Grp S
at Flo
w(s),
veh/h
/ln17
5914
9516
6717
5015
6713
98Q
Serve
(g_s
), s
41.7
3.62.6
78.5
10.3
0.0Cy
cle Q
Clea
r(g_c
), s
41.7
3.62.6
78.5
10.3
0.0Pr
op In
Lane
1.00
1.00
1.00
1.00
Lane
Grp
Cap
(c), v
eh/h
1247
1060
5313
6619
617
5V/
C Ra
tio(X
)0.8
30.1
50.8
11.1
40.8
40.0
0Av
ail C
ap(c_
a), v
eh/h
1247
1060
9913
6649
844
5HC
M Pl
atoon
Rati
o1.0
01.0
01.0
01.0
01.0
01.0
0Up
strea
m Fil
ter(I)
1.00
1.00
1.00
1.00
1.00
0.00
Unifo
rm D
elay (
d), s
/veh
10.3
4.848
.411
.043
.00.0
Incr D
elay (
d2),
s/veh
4.80.1
24.2
73.4
9.10.0
Initia
l Q D
elay(d
3),s/
veh
0.00.0
0.00.0
0.00.0
%ile
Bac
kOfQ
(50%
),veh
/ln21
.51.5
1.564
.75.0
0.0Ln
Grp D
elay(d
),s/ve
h15
.14.9
72.6
84.5
52.1
0.0Ln
Grp L
OSB
AE
FD
Appr
oach
Vol,
veh/h
1196
1604
164
Appr
oach
Dela
y, s/v
eh13
.784
.152
.1Ap
proa
ch LO
SB
FD
Timer
12
34
56
78
Assig
ned P
hs2
34
8Ph
s Dur
ation
(G+Y
+Rc),
s16
.67.2
76.8
84.0
Chan
ge P
eriod
(Y+R
c), s
4.04.0
5.55.5
Max G
reen
Sett
ing (G
max),
s32
.06.0
68.5
78.5
Max Q
Clea
r Tim
e (g_
c+I1)
, s12
.34.6
43.7
80.5
Gree
n Ext
Time (
p_c),
s0.4
0.022
.90.0
Inter
secti
on S
umma
ryHC
M 20
10 C
trl De
lay53
.9HC
M 20
10 LO
SD
1/2/20
15
Centr
al Co
ast T
rans
porta
tion C
onsu
lting
Sync
hro 8
Rep
ort
HCM
2010
TW
SC
Inter
secti
onInt
Dela
y, s/v
eh47
.5
Move
ment
EBL
EBT
EBR
WBL
WBT
WBR
NBL
NBT
NBR
SBL
SBT
SBR
Vol, v
eh/h
575
057
5011
7010
330
383
46
Confl
icting
Ped
s, #/h
r0
00
00
00
00
00
0Si
gn C
ontro
l Fr
eeFr
eeFr
eeFr
eeFr
eeFr
eeSt
opSt
opSt
opSt
opSt
opSt
opRT
Cha
nneli
zed
--
None
--
None
--
None
--
None
Stor
age L
ength
400
-70
210
--
--
--
-60
Veh i
n Med
ian S
torag
e, #
-0
--
0-
-0
--
0-
Grad
e, %
-4
--
2-
-7
--
1-
Peak
Hou
r Fac
tor93
9393
9393
9393
9393
9393
93He
avy V
ehicl
es, %
88
88
88
88
88
88
Mvmt
Flow
580
661
5412
5811
350
413
46
Major
/Mino
rMa
jor1
Major
2Mi
nor1
Mino
r2Co
nflict
ing F
low A
ll12
690
080
60
021
9021
9380
622
0921
8812
63
S
tage 1
--
--
--
817
817
-13
7113
71-
Stag
e 2-
--
--
-13
7313
76-
838
817
-Cr
itical
Hdwy
4.18
--
4.18
--
8.58
7.98
6.98
7.38
6.78
6.38
Critic
al Hd
wy S
tg 1
--
--
--
7.58
6.98
-6.3
85.7
8-
Critic
al Hd
wy S
tg 2
--
--
--
7.58
6.98
-6.3
85.7
8-
Follo
w-up
Hdw
y2.2
72-
-2.2
72-
-3.5
724.0
723.3
723.5
724.0
723.3
72Po
t Cap
-1 M
aneu
ver
528
--
793
--
~ 13
1931
927
3919
4
S
tage 1
--
--
--
263
278
-16
219
3-
Stag
e 2-
--
--
-10
212
1-
336
365
-Pl
atoon
bloc
ked,
%-
--
-Mo
v Cap
-1 M
aneu
ver
528
--
793
--
~ 11
1831
922
3619
4Mo
v Cap
-2 M
aneu
ver
--
--
--
~ 11
18-
2236
-
S
tage 1
--
--
--
261
275
-16
018
0-
Stag
e 2-
--
--
-90
113
-29
036
2-
Appr
oach
EBW
BNB
SBHC
M Co
ntrol
Delay
, s0.1
0.4$ 1
394.8
105.7
HCM
LOS
FF
Mino
r Lan
e/Majo
r Mvm
tNB
Ln1
EBL
EBT
EBR
WBL
WBT
WBR
SBLn
1SBL
n2Ca
pacit
y (ve
h/h)
2352
8-
-79
3-
-28
194
HCM
Lane
V/C
Rati
o3.3
190.0
1-
-0.0
68-
-0.2
690.0
33HC
M Co
ntrol
Delay
(s)
$ 139
4.811
.9-
-9.9
--
175.5
24.2
HCM
Lane
LOS
FB
--
A-
-F
CHC
M 95
th %
tile Q
(veh)
9.60
--
0.2-
-0.8
0.1
Notes
~: V
olume
exce
eds c
apac
ity
$: D
elay e
xcee
ds 30
0s
+: C
ompu
tation
Not
Defin
ed
*: A
ll majo
r volu
me in
plato
on

1/2/20
15
Centr
al Co
ast T
rans
porta
tion C
onsu
lting
Sync
hro 8
Rep
ort
Queu
es
Lane
Gro
upW
BRNB
TSB
LSB
TLa
ne G
roup
Flow
(vph
)11
1111
0911
5171
0v/c
Rati
o0.8
60.8
50.7
30.4
1Co
ntrol
Delay
27.7
29.4
20.8
0.7Qu
eue D
elay
0.00.0
0.00.0
Total
Dela
y27
.729
.420
.80.7
Queu
e Len
gth 50
th (ft
)30
128
025
60
Queu
e Len
gth 95
th (ft
)#4
2036
733
50
Inter
nal L
ink D
ist (f
t)16
1420
81Tu
rn B
ay Le
ngth
(ft)
370
Base
Cap
acity
(vph
)14
4114
8517
4917
45St
arva
tion C
ap R
educ
tn0
00
0Sp
illbac
k Cap
Red
uctn
00
00
Stor
age C
ap R
educ
tn0
00
0Re
duce
d v/c
Ratio
0.77
0.75
0.66
0.41
Inter
secti
on S
umma
ry#
95th
perce
ntile
volum
e exc
eeds
capa
city,
queu
e may
be lo
nger
.
Que
ue sh
own i
s max
imum
after
two c
ycles
.
1/2/20
15
Centr
al Co
ast T
rans
porta
tion C
onsu
lting
Sync
hro 8
Rep
ort
HCM
Sign
alize
d Inte
rsecti
on C
apac
ity A
nalys
is
Move
ment
WBL
WBR
NBT
NBR
SBL
SBT
Lane
Con
figur
ation
sVo
lume (
vph)
010
3383
020
210
7066
0Ide
al Flo
w (vp
hpl)
1900
1900
1900
1900
1900
1900
Grad
e (%
)6%
10%
9%To
tal Lo
st tim
e (s)
4.05.0
4.04.0
Lane
Util.
Fac
tor0.8
80.9
50.9
71.0
0Fr
t0.8
50.9
71.0
01.0
0Flt
Pro
tected
1.00
1.00
0.95
1.00
Satd.
Flow
(pro
t)26
5132
0132
1617
45Flt
Per
mitte
d1.0
01.0
00.9
51.0
0Sa
td. F
low (p
erm)
2651
3201
3216
1745
Peak
-hou
r fac
tor, P
HF0.9
30.9
30.9
30.9
30.9
30.9
3Ad
j. Flow
(vph
)0
1111
892
217
1151
710
RTOR
Red
uctio
n (vp
h)0
024
00
0La
ne G
roup
Flow
(vph
)0
1111
1085
011
5171
0He
avy V
ehicl
es (%
)4%
4%4%
4%4%
4%Tu
rn T
ype
Over
NAPr
otNA
Prote
cted P
hase
s1
21
Free
Perm
itted P
hase
sAc
tuated
Gre
en, G
(s)
40.3
33.2
40.3
82.5
Effec
tive G
reen
, g (s
)40
.333
.240
.382
.5Ac
tuated
g/C
Ratio
0.49
0.40
0.49
1.00
Clea
ranc
e Tim
e (s)
4.05.0
4.0Ve
hicle
Exten
sion (
s)3.0
3.03.0
Lane
Grp
Cap
(vph
)12
9412
8815
7017
45v/s
Rati
o Pro
tc0
.42c0
.340.3
60.4
1v/s
Rati
o Per
mv/c
Rati
o0.8
60.8
40.7
30.4
1Un
iform
Dela
y, d1
18.6
22.3
16.8
0.0Pr
ogre
ssion
Fac
tor1.0
01.0
01.0
01.0
0Inc
reme
ntal D
elay,
d25.9
5.21.8
0.7De
lay (s
)24
.527
.518
.60.7
Leve
l of S
ervic
eC
CB
AAp
proa
ch D
elay (
s)24
.527
.511
.8Ap
proa
ch LO
SC
CB
Inter
secti
on S
umma
ryHC
M 20
00 C
ontro
l Dela
y19
.5HC
M 20
00 Le
vel o
f Ser
vice
BHC
M 20
00 V
olume
to C
apac
ity ra
tio0.8
5Ac
tuated
Cyc
le Le
ngth
(s)
82.5
Sum
of los
t time
(s)
9.0Int
erse
ction
Cap
acity
Utili
zatio
n73
.0%IC
U Le
vel o
f Ser
vice
DAn
alysis
Per
iod (m
in)15
c C
ritica
l Lan
e Gro
up

1/2/20
15
Centr
al Co
ast T
rans
porta
tion C
onsu
lting
Sync
hro 8
Rep
ort
Queu
es
Lane
Gro
upEB
TEB
RW
BLW
BTNB
LNB
RLa
ne G
roup
Flow
(vph
)13
1215
510
904
165
41v/c
Rati
o1.0
10.1
40.1
60.6
80.6
80.1
7Co
ntrol
Delay
43.1
2.055
.910
.856
.118
.6Qu
eue D
elay
0.00.0
0.00.0
0.00.0
Total
Dela
y43
.12.0
55.9
10.8
56.1
18.6
Queu
e Len
gth 50
th (ft
)69
44
625
110
16
Queu
e Len
gth 95
th (ft
)#1
402
3126
511
179
37Int
erna
l Link
Dist
(ft)
3171
365
801
Turn
Bay
Leng
th (ft
)32
037
050
Base
Cap
acity
(vph
)13
0211
3963
1364
446
420
Star
vatio
n Cap
Red
uctn
00
00
00
Spillb
ack C
ap R
educ
tn0
00
00
0St
orag
e Cap
Red
uctn
00
00
00
Redu
ced v
/c Ra
tio1.0
10.1
40.1
60.6
60.3
70.1
0
Inter
secti
on S
umma
ry#
95th
perce
ntile
volum
e exc
eeds
capa
city,
queu
e may
be lo
nger
.
Que
ue sh
own i
s max
imum
after
two c
ycles
.
1/2/20
15
Centr
al Co
ast T
rans
porta
tion C
onsu
lting
Sync
hro 8
Rep
ort
HCM
2010
Sign
alize
d Inte
rsecti
on S
umma
ry
Move
ment
EBT
EBR
WBL
WBT
NBL
NBR
Lane
Con
figur
ation
sVo
lume (
veh/h
)12
7315
010
877
160
40Nu
mber
414
38
512
Initia
l Q (Q
b), v
eh0
00
00
0Pe
d-Bi
ke A
dj(A_
pbT)
1.00
1.00
1.00
1.00
Parki
ng B
us, A
dj1.0
01.0
01.0
01.0
01.0
01.0
0Ad
j Sat
Flow,
veh/h
/ln17
5917
5917
5017
5016
4516
45Ad
j Flow
Rate
, veh
/h13
1215
510
904
165
0Ad
j No.
of La
nes
11
11
11
Peak
Hou
r Fac
tor0.9
70.9
70.9
70.9
70.9
70.9
7Pe
rcent
Heav
y Veh
, %8
88
88
8Ca
p, ve
h/h12
8210
9016
1363
197
176
Arriv
e On G
reen
0.73
0.73
0.01
0.78
0.13
0.00
Sat F
low, v
eh/h
1759
1495
1667
1750
1567
1398
Grp V
olume
(v), v
eh/h
1312
155
1090
416
50
Grp S
at Flo
w(s),
veh/h
/ln17
5914
9516
6717
5015
6713
98Q
Serve
(g_s
), s
72.5
3.10.6
23.5
10.2
0.0Cy
cle Q
Clea
r(g_c
), s
72.5
3.10.6
23.5
10.2
0.0Pr
op In
Lane
1.00
1.00
1.00
1.00
Lane
Grp
Cap
(c), v
eh/h
1282
1090
1613
6319
717
6V/
C Ra
tio(X
)1.0
20.1
40.6
20.6
60.8
40.0
0Av
ail C
ap(c_
a), v
eh/h
1282
1090
6714
1647
242
2HC
M Pl
atoon
Rati
o1.0
01.0
01.0
01.0
01.0
01.0
0Up
strea
m Fil
ter(I)
1.00
1.00
1.00
1.00
1.00
0.00
Unifo
rm D
elay (
d), s
/veh
13.5
4.149
.15.0
42.5
0.0Inc
r Dela
y (d2
), s/v
eh31
.20.1
32.7
1.19.0
0.0Ini
tial Q
Dela
y(d3)
,s/ve
h0.0
0.00.0
0.00.0
0.0%
ile B
ackO
fQ(5
0%),v
eh/ln
45.3
1.30.4
11.5
4.90.0
LnGr
p Dela
y(d),s
/veh
44.7
4.181
.76.2
51.5
0.0Ln
Grp L
OSF
AF
AD
Appr
oach
Vol,
veh/h
1467
914
165
Appr
oach
Dela
y, s/v
eh40
.47.0
51.5
Appr
oach
LOS
DA
D
Timer
12
34
56
78
Assig
ned P
hs2
34
8Ph
s Dur
ation
(G+Y
+Rc),
s16
.55.0
78.0
83.0
Chan
ge P
eriod
(Y+R
c), s
4.04.0
5.55.5
Max G
reen
Sett
ing (G
max),
s30
.04.0
72.5
80.5
Max Q
Clea
r Tim
e (g_
c+I1)
, s12
.22.6
74.5
25.5
Gree
n Ext
Time (
p_c),
s0.4
0.00.0
34.8
Inter
secti
on S
umma
ryHC
M 20
10 C
trl De
lay29
.1HC
M 20
10 LO
SC

1/2/20
15
Centr
al Co
ast T
rans
porta
tion C
onsu
lting
Sync
hro 8
Rep
ort
HCM
2010
TW
SC
Inter
secti
onInt
Dela
y, s/v
eh76
Move
ment
EBL
EBT
EBR
WBL
WBT
WBR
NBL
NBT
NBR
SBL
SBT
SBR
Vol, v
eh/h
1010
5053
2979
010
472
708
36
Confl
icting
Ped
s, #/h
r0
00
00
00
00
00
0Si
gn C
ontro
l Fr
eeFr
eeFr
eeFr
eeFr
eeFr
eeSt
opSt
opSt
opSt
opSt
opSt
opRT
Cha
nneli
zed
--
None
--
None
--
None
--
None
Stor
age L
ength
400
-70
210
--
--
--
-60
Veh i
n Med
ian S
torag
e, #
-0
--
0-
-0
--
0-
Grad
e, %
-4
--
2-
-7
--
1-
Peak
Hou
r Fac
tor95
9595
9595
9595
9595
9595
95He
avy V
ehicl
es, %
88
88
88
88
88
88
Mvmt
Flow
1111
0556
3183
211
492
748
36
Major
/Mino
rMa
jor1
Major
2Mi
nor1
Mino
r2Co
nflict
ing F
low A
ll84
20
011
050
020
2520
2911
0520
6220
2483
7
S
tage 1
--
--
--
1126
1126
-89
889
8-
Stag
e 2-
--
--
-89
990
3-
1164
1126
-Cr
itical
Hdwy
4.18
--
4.18
--
8.58
7.98
6.98
7.38
6.78
6.38
Critic
al Hd
wy S
tg 1
--
--
--
7.58
6.98
-6.3
85.7
8-
Critic
al Hd
wy S
tg 2
--
--
--
7.58
6.98
-6.3
85.7
8-
Follo
w-up
Hdw
y2.2
72-
-2.2
72-
-3.5
724.0
723.3
723.5
724.0
723.3
72Po
t Cap
-1 M
aneu
ver
768
--
610
--
~ 19
2520
135
5034
9
S
tage 1
--
--
--
156
176
-31
033
3-
Stag
e 2-
--
--
-22
924
5-
216
256
-Pl
atoon
bloc
ked,
%-
--
-Mo
v Cap
-1 M
aneu
ver
768
--
610
--
~ 17
2320
120
4734
9Mo
v Cap
-2 M
aneu
ver
--
--
--
~ 17
23-
2047
-
S
tage 1
--
--
--
154
173
-30
631
6-
Stag
e 2-
--
--
-21
123
3-
133
252
-
Appr
oach
EBW
BNB
SBHC
M Co
ntrol
Delay
, s0.1
0.4$ 1
299.6
169.4
HCM
LOS
FF
Mino
r Lan
e/Majo
r Mvm
tNB
Ln1
EBL
EBT
EBR
WBL
WBT
WBR
SBLn
1SBL
n2Ca
pacit
y (ve
h/h)
3776
8-
-61
0-
-24
349
HCM
Lane
V/C
Rati
o3.3
850.0
14-
-0.0
5-
-0.4
820.0
18HC
M Co
ntrol
Delay
(s)
$ 129
9.69.8
--
11.2
--
253.3
15.5
HCM
Lane
LOS
FA
--
B-
-F
CHC
M 95
th %
tile Q
(veh)
14.3
0-
-0.2
--
1.40.1
Notes
~: V
olume
exce
eds c
apac
ity
$: D
elay e
xcee
ds 30
0s
+: C
ompu
tation
Not
Defin
ed
*: A
ll majo
r volu
me in
plato
on
1/2/20
15
Centr
al Co
ast T
rans
porta
tion C
onsu
lting
Sync
hro 8
Rep
ort
Queu
es
Lane
Gro
upW
BRNB
TSB
LSB
TLa
ne G
roup
Flow
(vph
)12
2711
0412
1560
0v/c
Rati
o0.9
10.8
80.7
40.3
4Co
ntrol
Delay
30.8
34.1
20.2
0.5Qu
eue D
elay
0.00.0
0.00.0
Total
Dela
y30
.834
.120
.20.5
Queu
e Len
gth 50
th (ft
)34
329
126
50
Queu
e Len
gth 95
th (ft
)#5
12#4
1534
50
Inter
nal L
ink D
ist (f
t)16
1420
81Tu
rn B
ay Le
ngth
(ft)
370
Base
Cap
acity
(vph
)14
3213
3917
3717
45St
arva
tion C
ap R
educ
tn0
00
0Sp
illbac
k Cap
Red
uctn
00
00
Stor
age C
ap R
educ
tn0
00
0Re
duce
d v/c
Ratio
0.86
0.82
0.70
0.34
Inter
secti
on S
umma
ry#
95th
perce
ntile
volum
e exc
eeds
capa
city,
queu
e may
be lo
nger
.
Que
ue sh
own i
s max
imum
after
two c
ycles
.

1/2/20
15
Centr
al Co
ast T
rans
porta
tion C
onsu
lting
Sync
hro 8
Rep
ort
HCM
Sign
alize
d Inte
rsecti
on C
apac
ity A
nalys
is
Move
ment
WBL
WBR
NBT
NBR
SBL
SBT
Lane
Con
figur
ation
sVo
lume (
vph)
011
5385
618
111
4256
4Ide
al Flo
w (vp
hpl)
1900
1900
1900
1900
1900
1900
Grad
e (%
)6%
10%
9%To
tal Lo
st tim
e (s)
4.05.0
4.04.0
Lane
Util.
Fac
tor0.8
80.9
50.9
71.0
0Fr
t0.8
50.9
71.0
01.0
0Flt
Pro
tected
1.00
1.00
0.95
1.00
Satd.
Flow
(pro
t)26
5132
1132
1617
45Flt
Per
mitte
d1.0
01.0
00.9
51.0
0Sa
td. F
low (p
erm)
2651
3211
3216
1745
Peak
-hou
r fac
tor, P
HF0.9
40.9
40.9
40.9
40.9
40.9
4Ad
j. Flow
(vph
)0
1227
911
193
1215
600
RTOR
Red
uctio
n (vp
h)0
020
00
0La
ne G
roup
Flow
(vph
)0
1227
1084
012
1560
0He
avy V
ehicl
es (%
)4%
4%4%
4%4%
4%Tu
rn T
ype
Over
NAPr
otNA
Prote
cted P
hase
s1
21
Free
Perm
itted P
hase
sAc
tuated
Gre
en, G
(s)
43.9
32.9
43.9
85.8
Effec
tive G
reen
, g (s
)43
.932
.943
.985
.8Ac
tuated
g/C
Ratio
0.51
0.38
0.51
1.00
Clea
ranc
e Tim
e (s)
4.05.0
4.0Ve
hicle
Exten
sion (
s)3.0
3.03.0
Lane
Grp
Cap
(vph
)13
5612
3116
4517
45v/s
Rati
o Pro
tc0
.46c0
.340.3
80.3
4v/s
Rati
o Per
mv/c
Rati
o0.9
00.8
80.7
40.3
4Un
iform
Dela
y, d1
19.1
24.6
16.4
0.0Pr
ogre
ssion
Fac
tor1.0
01.0
01.0
01.0
0Inc
reme
ntal D
elay,
d28.8
7.61.8
0.5De
lay (s
)27
.832
.218
.20.5
Leve
l of S
ervic
eC
CB
AAp
proa
ch D
elay (
s)27
.832
.212
.4Ap
proa
ch LO
SC
CB
Inter
secti
on S
umma
ryHC
M 20
00 C
ontro
l Dela
y22
.2HC
M 20
00 Le
vel o
f Ser
vice
CHC
M 20
00 V
olume
to C
apac
ity ra
tio0.8
9Ac
tuated
Cyc
le Le
ngth
(s)
85.8
Sum
of los
t time
(s)
9.0Int
erse
ction
Cap
acity
Utili
zatio
n77
.3%IC
U Le
vel o
f Ser
vice
DAn
alysis
Per
iod (m
in)15
c C
ritica
l Lan
e Gro
up
1/2/20
15
Centr
al Co
ast T
rans
porta
tion C
onsu
lting
Sync
hro 8
Rep
ort
Queu
es
Lane
Gro
upEB
TEB
RW
BLW
BTNB
LNB
RLa
ne G
roup
Flow
(vph
)12
3113
919
949
189
52v/c
Rati
o0.9
80.1
30.3
10.7
30.7
20.2
0Co
ntrol
Delay
38.6
2.365
.413
.257
.620
.2Qu
eue D
elay
0.00.0
0.00.0
0.00.0
Total
Dela
y38
.62.3
65.4
13.2
57.6
20.2
Queu
e Len
gth 50
th (ft
)59
33
1230
011
510
Queu
e Len
gth 95
th (ft
)#1
322
2940
624
203
45Int
erna
l Link
Dist
(ft)
3171
365
801
Turn
Bay
Leng
th (ft
)32
037
050
Base
Cap
acity
(vph
)12
5711
0262
1334
436
414
Star
vatio
n Cap
Red
uctn
00
00
00
Spillb
ack C
ap R
educ
tn0
00
00
0St
orag
e Cap
Red
uctn
00
00
00
Redu
ced v
/c Ra
tio0.9
80.1
30.3
10.7
10.4
30.1
3
Inter
secti
on S
umma
ry#
95th
perce
ntile
volum
e exc
eeds
capa
city,
queu
e may
be lo
nger
.
Que
ue sh
own i
s max
imum
after
two c
ycles
.

1/2/20
15
Centr
al Co
ast T
rans
porta
tion C
onsu
lting
Sync
hro 8
Rep
ort
HCM
2010
Sign
alize
d Inte
rsecti
on S
umma
ry
Move
ment
EBT
EBR
WBL
WBT
NBL
NBR
Lane
Con
figur
ation
sVo
lume (
veh/h
)11
9413
518
921
183
50Nu
mber
414
38
512
Initia
l Q (Q
b), v
eh0
00
00
0Pe
d-Bi
ke A
dj(A_
pbT)
1.00
1.00
1.00
1.00
Parki
ng B
us, A
dj1.0
01.0
01.0
01.0
01.0
01.0
0Ad
j Sat
Flow,
veh/h
/ln17
5917
5917
5017
5016
4516
45Ad
j Flow
Rate
, veh
/h12
3113
919
949
189
0Ad
j No.
of La
nes
11
11
11
Peak
Hou
r Fac
tor0.9
70.9
70.9
70.9
70.9
70.9
7Pe
rcent
Heav
y Veh
, %8
88
88
8Ca
p, ve
h/h12
4910
6227
1340
221
198
Arriv
e On G
reen
0.71
0.71
0.02
0.77
0.14
0.00
Sat F
low, v
eh/h
1759
1495
1667
1750
1567
1398
Grp V
olume
(v), v
eh/h
1231
139
1994
918
90
Grp S
at Flo
w(s),
veh/h
/ln17
5914
9516
6717
5015
6713
98Q
Serve
(g_s
), s
68.9
3.01.2
28.3
12.0
0.0Cy
cle Q
Clea
r(g_c
), s
68.9
3.01.2
28.3
12.0
0.0Pr
op In
Lane
1.00
1.00
1.00
1.00
Lane
Grp
Cap
(c), v
eh/h
1249
1062
2713
4022
119
8V/
C Ra
tio(X
)0.9
90.1
30.7
00.7
10.8
50.0
0Av
ail C
ap(c_
a), v
eh/h
1251
1063
6513
8246
141
1HC
M Pl
atoon
Rati
o1.0
01.0
01.0
01.0
01.0
01.0
0Up
strea
m Fil
ter(I)
1.00
1.00
1.00
1.00
1.00
0.00
Unifo
rm D
elay (
d), s
/veh
14.3
4.749
.96.1
42.8
0.0Inc
r Dela
y (d2
), s/v
eh21
.90.1
27.5
1.69.0
0.0Ini
tial Q
Dela
y(d3)
,s/ve
h0.0
0.00.0
0.00.0
0.0%
ile B
ackO
fQ(5
0%),v
eh/ln
40.4
1.30.7
14.1
5.80.0
LnGr
p Dela
y(d),s
/veh
36.2
4.877
.47.8
51.8
0.0Ln
Grp L
OSD
AE
AD
Appr
oach
Vol,
veh/h
1370
968
189
Appr
oach
Dela
y, s/v
eh33
.09.1
51.8
Appr
oach
LOS
CA
D
Timer
12
34
56
78
Assig
ned P
hs2
34
8Ph
s Dur
ation
(G+Y
+Rc),
s18
.45.7
77.9
83.6
Chan
ge P
eriod
(Y+R
c), s
4.04.0
5.55.5
Max G
reen
Sett
ing (G
max),
s30
.04.0
72.5
80.5
Max Q
Clea
r Tim
e (g_
c+I1)
, s14
.03.2
70.9
30.3
Gree
n Ext
Time (
p_c),
s0.5
0.01.5
31.0
Inter
secti
on S
umma
ryHC
M 20
10 C
trl De
lay25
.3HC
M 20
10 LO
SC
1/2/20
15
Centr
al Co
ast T
rans
porta
tion C
onsu
lting
Sync
hro 8
Rep
ort
HCM
2010
TW
SC
Inter
secti
onInt
Dela
y, s/v
eh16
3.3
Move
ment
EBL
EBT
EBR
WBL
WBT
WBR
NBL
NBT
NBR
SBL
SBT
SBR
Vol, v
eh/h
811
8456
2882
74
730
5311
114
Confl
icting
Ped
s, #/h
r0
00
00
00
00
00
0Si
gn C
ontro
l Fr
eeFr
eeFr
eeFr
eeFr
eeFr
eeSt
opSt
opSt
opSt
opSt
opSt
opRT
Cha
nneli
zed
--
None
--
None
--
None
--
None
Stor
age L
ength
400
-70
210
--
--
--
-60
Veh i
n Med
ian S
torag
e, #
-0
--
0-
-0
--
0-
Grad
e, %
-4
--
2-
-7
--
1-
Peak
Hou
r Fac
tor96
9696
9696
9696
9696
9696
96He
avy V
ehicl
es, %
88
88
88
88
88
88
Mvmt
Flow
812
3358
2986
14
760
5511
115
Major
/Mino
rMa
jor1
Major
2Mi
nor1
Mino
r2Co
nflict
ing F
low A
ll86
60
012
330
021
7221
7412
3322
0021
7286
4
S
tage 1
--
--
--
1250
1250
-92
292
2-
Stag
e 2-
--
--
-92
292
4-
1278
1250
-Cr
itical
Hdwy
4.18
--
4.18
--
8.58
7.98
6.98
7.38
6.78
6.38
Critic
al Hd
wy S
tg 1
--
--
--
7.58
6.98
-6.3
85.7
8-
Critic
al Hd
wy S
tg 2
--
--
--
7.58
6.98
-6.3
85.7
8-
Follo
w-up
Hdw
y2.2
72-
-2.2
72-
-3.5
724.0
723.3
723.5
724.0
723.3
72Po
t Cap
-1 M
aneu
ver
752
--
545
--
~ 14
1916
527
4033
7
S
tage 1
--
--
--
127
146
-30
032
4-
Stag
e 2-
--
--
-22
123
8-
185
222
-Pl
atoon
bloc
ked,
%-
--
-Mo
v Cap
-1 M
aneu
ver
752
--
545
--
~ 12
1816
517
3733
7Mo
v Cap
-2 M
aneu
ver
--
--
--
~ 12
18-
1737
-
S
tage 1
--
--
--
126
144
-29
730
7-
Stag
e 2-
--
--
-20
022
5-
122
220
-
Appr
oach
EBW
BNB
SBHC
M Co
ntrol
Delay
, s0.1
0.4$ 2
885
191.3
HCM
LOS
FF
Mino
r Lan
e/Majo
r Mvm
tNB
Ln1
EBL
EBT
EBR
WBL
WBT
WBR
SBLn
1SBL
n2Ca
pacit
y (ve
h/h)
2075
2-
-54
5-
-18
337
HCM
Lane
V/C
Rati
o6.5
630.0
11-
-0.0
54-
-0.6
940.0
43HC
M Co
ntrol
Delay
(s)
$ 288
59.8
--
12-
-$ 39
5.516
.2HC
M La
ne LO
SF
A-
-B
--
FC
HCM
95th
%tile
Q(ve
h)16
.80
--
0.2-
-1.8
0.1
Notes
~: V
olume
exce
eds c
apac
ity
$: D
elay e
xcee
ds 30
0s
+: C
ompu
tation
Not
Defin
ed
*: A
ll majo
r volu
me in
plato
on

1/2/20
15
Centr
al Co
ast T
rans
porta
tion C
onsu
lting
Sync
hro 8
Rep
ort
Queu
es
Lane
Gro
upW
BRNB
TSB
LSB
TLa
ne G
roup
Flow
(vph
)89
610
0191
769
7v/c
Rati
o0.7
60.7
70.6
40.4
0Co
ntrol
Delay
19.5
19.8
15.8
0.7Qu
eue D
elay
0.00.0
0.00.0
Total
Dela
y19
.519
.815
.80.7
Queu
e Len
gth 50
th (ft
)15
916
413
60
Queu
e Len
gth 95
th (ft
)24
624
320
40
Inter
nal L
ink D
ist (f
t)16
1420
81Tu
rn B
ay Le
ngth
(ft)
370
Base
Cap
acity
(vph
)14
8116
4617
9717
45St
arva
tion C
ap R
educ
tn0
00
0Sp
illbac
k Cap
Red
uctn
00
00
Stor
age C
ap R
educ
tn0
00
0Re
duce
d v/c
Ratio
0.60
0.61
0.51
0.40
Inter
secti
on S
umma
ry
1/2/20
15
Centr
al Co
ast T
rans
porta
tion C
onsu
lting
Sync
hro 8
Rep
ort
HCM
Sign
alize
d Inte
rsecti
on C
apac
ity A
nalys
is
Move
ment
WBL
WBR
NBT
NBR
SBL
SBT
Lane
Con
figur
ation
sVo
lume (
vph)
085
174
220
987
166
2Ide
al Flo
w (vp
hpl)
1900
1900
1900
1900
1900
1900
Grad
e (%
)6%
10%
9%To
tal Lo
st tim
e (s)
4.05.0
4.04.0
Lane
Util.
Fac
tor0.8
80.9
50.9
71.0
0Fr
t0.8
50.9
71.0
01.0
0Flt
Pro
tected
1.00
1.00
0.95
1.00
Satd.
Flow
(pro
t)26
5131
8932
1617
45Flt
Per
mitte
d1.0
01.0
00.9
51.0
0Sa
td. F
low (p
erm)
2651
3189
3216
1745
Peak
-hou
r fac
tor, P
HF0.9
50.9
50.9
50.9
50.9
50.9
5Ad
j. Flow
(vph
)0
896
781
220
917
697
RTOR
Red
uctio
n (vp
h)0
038
00
0La
ne G
roup
Flow
(vph
)0
896
963
091
769
7He
avy V
ehicl
es (%
)4%
4%4%
4%4%
4%Tu
rn T
ype
Over
NAPr
otNA
Prote
cted P
hase
s1
21
Free
Perm
itted P
hase
sAc
tuated
Gre
en, G
(s)
26.7
23.8
26.7
59.5
Effec
tive G
reen
, g (s
)26
.723
.826
.759
.5Ac
tuated
g/C
Ratio
0.45
0.40
0.45
1.00
Clea
ranc
e Tim
e (s)
4.05.0
4.0Ve
hicle
Exten
sion (
s)3.0
3.03.0
Lane
Grp
Cap
(vph
)11
8912
7514
4317
45v/s
Rati
o Pro
tc0
.34c0
.300.2
90.4
0v/s
Rati
o Per
mv/c
Rati
o0.7
50.7
60.6
40.4
0Un
iform
Dela
y, d1
13.7
15.3
12.6
0.0Pr
ogre
ssion
Fac
tor1.0
01.0
01.0
01.0
0Inc
reme
ntal D
elay,
d22.8
2.60.9
0.7De
lay (s
)16
.417
.913
.60.7
Leve
l of S
ervic
eB
BB
AAp
proa
ch D
elay (
s)16
.417
.98.0
Appr
oach
LOS
BB
A
Inter
secti
on S
umma
ryHC
M 20
00 C
ontro
l Dela
y13
.0HC
M 20
00 Le
vel o
f Ser
vice
BHC
M 20
00 V
olume
to C
apac
ity ra
tio0.7
5Ac
tuated
Cyc
le Le
ngth
(s)
59.5
Sum
of los
t time
(s)
9.0Int
erse
ction
Cap
acity
Utili
zatio
n64
.5%IC
U Le
vel o
f Ser
vice
CAn
alysis
Per
iod (m
in)15
c C
ritica
l Lan
e Gro
up

1/2/20
15
Centr
al Co
ast T
rans
porta
tion C
onsu
lting
Sync
hro 8
Rep
ort
Queu
es
Lane
Gro
upEB
TEB
RW
BLW
BTNB
LNB
RLa
ne G
roup
Flow
(vph
)89
710
910
1035
9913
v/c R
atio
0.66
0.09
0.12
0.75
0.48
0.07
Contr
ol De
lay11
.31.6
37.6
11.7
38.7
14.4
Queu
e Dela
y0.0
0.00.0
0.00.0
0.0To
tal D
elay
11.3
1.637
.611
.738
.714
.4Qu
eue L
ength
50th
(ft)
179
05
247
490
Queu
e Len
gth 95
th (ft
)#5
9018
19#6
4382
14Int
erna
l Link
Dist
(ft)
3171
365
801
Turn
Bay
Leng
th (ft
)32
037
050
Base
Cap
acity
(vph
)13
5111
7485
1382
605
549
Star
vatio
n Cap
Red
uctn
00
00
00
Spillb
ack C
ap R
educ
tn0
00
00
0St
orag
e Cap
Red
uctn
00
00
00
Redu
ced v
/c Ra
tio0.6
60.0
90.1
20.7
50.1
60.0
2
Inter
secti
on S
umma
ry#
95th
perce
ntile
volum
e exc
eeds
capa
city,
queu
e may
be lo
nger
.
Que
ue sh
own i
s max
imum
after
two c
ycles
.
1/2/20
15
Centr
al Co
ast T
rans
porta
tion C
onsu
lting
Sync
hro 8
Rep
ort
HCM
2010
Sign
alize
d Inte
rsecti
on S
umma
ry
Move
ment
EBT
EBR
WBL
WBT
NBL
NBR
Lane
Con
figur
ation
sVo
lume (
veh/h
)83
410
19
963
9212
Numb
er4
143
85
12Ini
tial Q
(Qb)
, veh
00
00
00
Ped-
Bike
Adj(
A_pb
T)1.0
01.0
01.0
01.0
0Pa
rking
Bus
, Adj
1.00
1.00
1.00
1.00
1.00
1.00
Adj S
at Flo
w, ve
h/h/ln
1759
1759
1750
1750
1645
1645
Adj F
low R
ate, v
eh/h
897
109
1010
3599
0Ad
j No.
of La
nes
11
11
11
Peak
Hou
r Fac
tor0.9
30.9
30.9
30.9
30.9
30.9
3Pe
rcent
Heav
y Veh
, %8
88
88
8Ca
p, ve
h/h11
6098
617
1302
126
112
Arriv
e On G
reen
0.66
0.66
0.01
0.74
0.08
0.00
Sat F
low, v
eh/h
1759
1495
1667
1750
1567
1398
Grp V
olume
(v), v
eh/h
897
109
1010
3599
0Gr
p Sat
Flow(
s),ve
h/h/ln
1759
1495
1667
1750
1567
1398
Q Se
rve(g
_s),
s19
.11.4
0.320
.03.3
0.0Cy
cle Q
Clea
r(g_c
), s
19.1
1.40.3
20.0
3.30.0
Prop
In La
ne1.0
01.0
01.0
01.0
0La
ne G
rp C
ap(c)
, veh
/h11
6098
617
1302
126
112
V/C
Ratio
(X)
0.77
0.11
0.58
0.79
0.79
0.00
Avail
Cap
(c_a)
, veh
/h13
8611
7812
416
3887
177
7HC
M Pl
atoon
Rati
o1.0
01.0
01.0
01.0
01.0
01.0
0Up
strea
m Fil
ter(I)
1.00
1.00
1.00
1.00
1.00
0.00
Unifo
rm D
elay (
d), s
/veh
6.43.4
26.6
4.324
.40.0
Incr D
elay (
d2),
s/veh
2.30.0
27.4
2.210
.40.0
Initia
l Q D
elay(d
3),s/
veh
0.00.0
0.00.0
0.00.0
%ile
Bac
kOfQ
(50%
),veh
/ln9.7
0.60.3
10.0
1.80.0
LnGr
p Dela
y(d),s
/veh
8.73.4
54.0
6.534
.80.0
LnGr
p LOS
AA
DA
CAp
proa
ch V
ol, ve
h/h10
0610
4599
Appr
oach
Dela
y, s/v
eh8.1
7.034
.8Ap
proa
ch LO
SA
AC
Timer
12
34
56
78
Assig
ned P
hs2
34
8Ph
s Dur
ation
(G+Y
+Rc),
s8.3
4.641
.145
.6Ch
ange
Per
iod (Y
+Rc),
s4.0
4.05.5
5.5Ma
x Gre
en S
etting
(Gma
x), s
30.0
4.042
.550
.5Ma
x Q C
lear T
ime (
g_c+
I1), s
5.32.3
21.1
22.0
Gree
n Ext
Time (
p_c),
s0.2
0.014
.517
.5
Inter
secti
on S
umma
ryHC
M 20
10 C
trl De
lay8.8
HCM
2010
LOS
A

1/2/20
15
Centr
al Co
ast T
rans
porta
tion C
onsu
lting
Sync
hro 8
Rep
ort
HCM
2010
TW
SC
Inter
secti
onInt
Dela
y, s/v
eh10
0.1
Move
ment
EBL
EBT
EBR
WBL
WBT
WBR
NBL
NBT
NBR
SBL
SBT
SBR
Vol, v
eh/h
881
742
2889
35
730
501
05
Confl
icting
Ped
s, #/h
r0
00
00
00
00
00
0Si
gn C
ontro
l Fr
eeFr
eeFr
eeFr
eeFr
eeFr
eeSt
opSt
opSt
opSt
opSt
opSt
opRT
Cha
nneli
zed
--
None
--
None
--
None
--
None
Stor
age L
ength
400
-70
210
--
--
--
-60
Veh i
n Med
ian S
torag
e, #
-0
--
0-
-0
--
0-
Grad
e, %
-4
--
2-
-7
--
1-
Peak
Hou
r Fac
tor92
9292
9292
9292
9292
9292
92He
avy V
ehicl
es, %
88
88
88
88
88
88
Mvmt
Flow
988
846
3097
15
790
541
05
Major
/Mino
rMa
jor1
Major
2Mi
nor1
Mino
r2Co
nflict
ing F
low A
ll97
60
088
80
019
3919
4288
819
6719
3997
3
S
tage 1
--
--
--
905
905
-10
3410
34-
Stag
e 2-
--
--
-10
3410
37-
933
905
-Cr
itical
Hdwy
4.18
--
4.18
--
8.58
7.98
6.98
7.38
6.78
6.38
Critic
al Hd
wy S
tg 1
--
--
--
7.58
6.98
-6.3
85.7
8-
Critic
al Hd
wy S
tg 2
--
--
--
7.58
6.98
-6.3
85.7
8-
Follo
w-up
Hdw
y2.2
72-
-2.2
72-
-3.5
724.0
723.3
723.5
724.0
723.3
72Po
t Cap
-1 M
aneu
ver
683
--
738
--
~ 22
3028
141
5729
0
S
tage 1
--
--
--
227
244
-25
828
5-
Stag
e 2-
--
--
-18
320
1-
296
330
-Pl
atoon
bloc
ked,
%-
--
-Mo
v Cap
-1 M
aneu
ver
683
--
738
--
~ 21
2828
132
5429
0Mo
v Cap
-2 M
aneu
ver
--
--
--
~ 21
28-
3254
-
S
tage 1
--
--
--
224
241
-25
527
3-
Stag
e 2-
--
--
-17
219
3-
236
326
-
Appr
oach
EBW
BNB
SBHC
M Co
ntrol
Delay
, s0.1
0.3$ 1
559.7
35HC
M LO
SF
E
Mino
r Lan
e/Majo
r Mvm
tNB
Ln1
EBL
EBT
EBR
WBL
WBT
WBR
SBLn
1SBL
n2Ca
pacit
y (ve
h/h)
3468
3-
-73
8-
-32
290
HCM
Lane
V/C
Rati
o3.9
320.0
13-
-0.0
41-
-0.0
340.0
19HC
M Co
ntrol
Delay
(s)
$ 155
9.710
.3-
-10
.1-
-12
1.417
.7HC
M La
ne LO
SF
B-
-B
--
FC
HCM
95th
%tile
Q(ve
h)15
.70
--
0.1-
-0.1
0.1
Notes
~: V
olume
exce
eds c
apac
ity
$: D
elay e
xcee
ds 30
0s
+: C
ompu
tation
Not
Defin
ed
*: A
ll majo
r volu
me in
plato
on

1/5/20
15
Centr
al Co
ast T
rans
porta
tion C
onsu
lting
Sync
hro 8
Rep
ort
HCM
Unsig
naliz
ed In
terse
ction
Cap
acity
Ana
lysis
Move
ment
EBL
EBT
EBR
WBL
WBT
WBR
NBL
NBT
NBR
SBL
SBT
SBR
Lane
Con
figur
ation
sVo
lume (
veh/h
)6
745
5129
506
847
265
83
6Si
gn C
ontro
lFr
eeFr
eeSt
opSt
opGr
ade
4%2%
7%1%
Peak
Hou
r Fac
tor0.9
50.9
50.9
50.9
50.9
50.9
50.9
50.9
50.9
50.9
50.9
50.9
5Ho
urly
flow
rate
(vph)
678
454
3153
38
492
688
36
Pede
strian
sLa
ne W
idth (
ft)W
alking
Spe
ed (f
t/s)
Perce
nt Bl
ocka
geRi
ght tu
rn fla
re (v
eh)
2Me
dian t
ype
None
None
Media
n stor
age v
eh)
Upstr
eam
signa
l (ft)
pX, p
latoo
n unb
locke
dvC
, con
flictin
g volu
me54
183
813
9513
9978
414
6414
4853
7vC
1, sta
ge 1
conf
vol
vC2,
stage
2 co
nf vo
lvC
u, un
block
ed vo
l54
183
813
9513
9978
414
6414
4853
7tC
, sing
le (s)
4.24.2
7.26.6
6.37.2
6.66.3
tC, 2
stag
e (s)
tF (s
)2.3
2.33.6
4.13.4
3.64.1
3.4p0
queu
e fre
e %99
9654
9882
9097
99cM
capa
city (
veh/h
)99
877
110
713
038
381
121
532
Dire
ction
, Lan
e #EB
1EB
2EB
3W
B 1
WB
2NB
1NB
2SB
1Vo
lume T
otal
678
454
3154
152
6818
Volum
e Left
60
031
049
08
Volum
e Righ
t0
054
08
068
6cS
H99
817
0017
0077
117
0010
838
314
2Vo
lume t
o Cap
acity
0.01
0.46
0.03
0.04
0.32
0.48
0.18
0.13
Queu
e Len
gth 95
th (ft
)0
00
30
5316
11Co
ntrol
Delay
(s)
8.60.0
0.09.9
0.065
.816
.436
.4La
ne LO
SA
AF
CE
Appr
oach
Dela
y (s)
0.10.5
37.6
36.4
Appr
oach
LOS
EE
Inter
secti
on S
umma
ryAv
erag
e Dela
y 3.6
Inter
secti
on C
apac
ity U
tiliza
tion
56.6%
ICU
Leve
l of S
ervic
e B
Analy
sis P
eriod
(min)
15
1/5/20
15
Centr
al Co
ast T
rans
porta
tion C
onsu
lting
Sync
hro 8
Rep
ort
HCM
2010
TW
SC
Inter
secti
onInt
Dela
y, s/v
eh7.2
Move
ment
EBL
EBT
EBR
WBL
WBT
WBR
NBL
NBT
NBR
SBL
SBT
SBR
Vol, v
eh/h
674
551
2950
68
472
658
36
Confl
icting
Ped
s, #/h
r0
00
00
00
00
00
0Si
gn C
ontro
l Fr
eeFr
eeFr
eeFr
eeFr
eeFr
eeSt
opSt
opSt
opSt
opSt
opSt
opRT
Cha
nneli
zed
--
None
--
None
--
None
--
None
Stor
age L
ength
400
-70
210
--
100
-0
--
60Ve
h in M
edian
Stor
age,
#-
0-
-0
--
0-
-0
-Gr
ade,
%-
4-
-2
--
7-
-1
-Pe
ak H
our F
actor
9595
9595
9595
9595
9595
9595
Heav
y Veh
icles
, %8
88
88
88
88
88
8Mv
mt F
low6
784
5431
533
849
268
83
6
Major
/Mino
rMa
jor1
Major
2Mi
nor1
Mino
r2Co
nflict
ing F
low A
ll54
10
078
40
013
9613
9978
413
9613
9553
7
S
tage 1
--
--
--
797
797
-59
859
8-
Stag
e 2-
--
--
-59
960
2-
798
797
-Cr
itical
Hdwy
4.18
--
4.18
--
8.58
7.98
6.98
7.38
6.78
6.38
Critic
al Hd
wy S
tg 1
--
--
--
7.58
6.98
-6.3
85.7
8-
Critic
al Hd
wy S
tg 2
--
--
--
7.58
6.98
-6.3
85.7
8-
Follo
w-up
Hdw
y2.2
72-
-2.2
72-
-3.5
724.0
723.3
723.5
724.0
723.3
72Po
t Cap
-1 M
aneu
ver
998
--
808
--
6779
330
106
127
525
Stag
e 1-
--
--
-27
228
6-
463
466
-
S
tage 2
--
--
--
379
379
-35
537
3-
Plato
on bl
ocke
d, %
--
--
Mov C
ap-1
Man
euve
r99
8-
-80
8-
-63
7633
079
121
525
Mov C
ap-2
Man
euve
r-
--
--
-63
76-
7912
1-
Stag
e 1-
--
--
-27
028
4-
460
448
-
S
tage 2
--
--
--
358
364
-27
837
1-
Appr
oach
EBW
BNB
SBHC
M Co
ntrol
Delay
, s0.1
0.584
.638
.2HC
M LO
SF
E
Mino
r Lan
e/Majo
r Mvm
tNB
Ln1N
BLn2
EBL
EBT
EBR
WBL
WBT
WBR
SBLn
1SBL
n2Ca
pacit
y (ve
h/h)
6333
099
8-
-80
8-
-87
525
HCM
Lane
V/C
Rati
o0.8
190.2
070.0
06-
-0.0
38-
-0.1
330.0
12HC
M Co
ntrol
Delay
(s)
172.1
18.7
8.6-
-9.6
--
52.6
11.9
HCM
Lane
LOS
FC
A-
-A
--
FB
HCM
95th
%tile
Q(ve
h)3.7
0.80
--
0.1-
-0.4
0
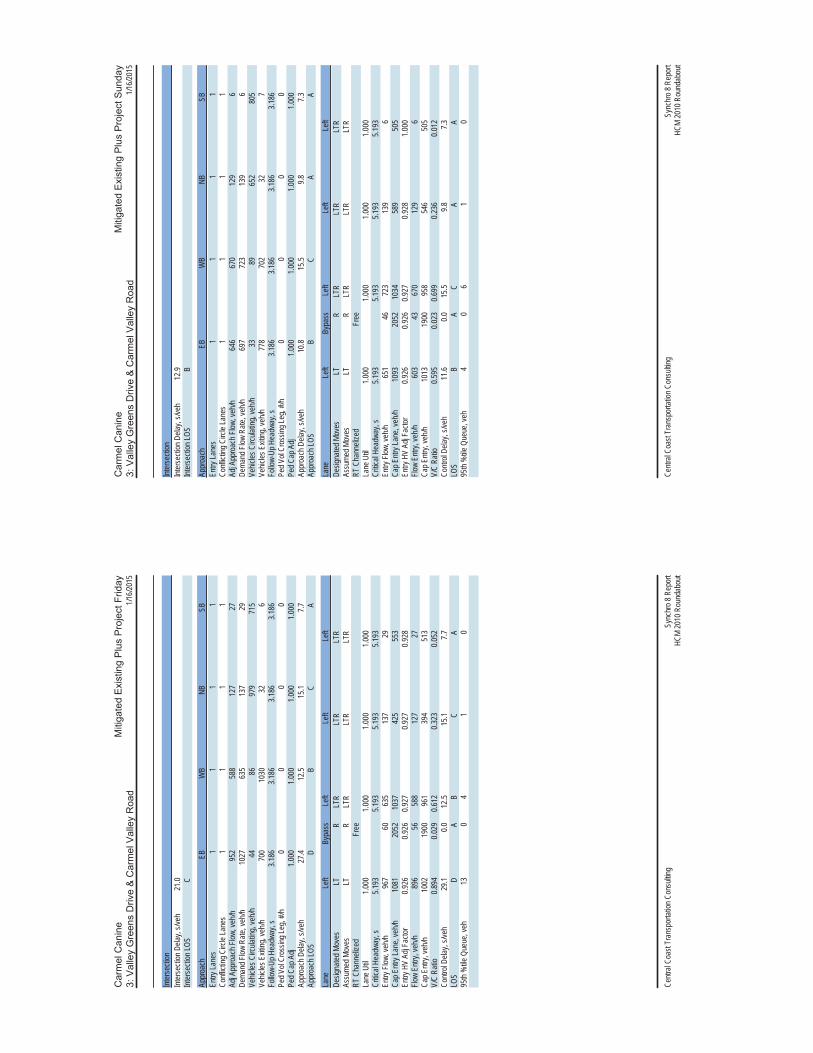
1/16/2
015
Centr
al Co
ast T
rans
porta
tion C
onsu
lting
Sync
hro 8
Rep
ort
HCM
2010
Rou
ndab
out
Inter
secti
onInt
erse
ction
Dela
y, s/v
eh21
.0Int
erse
ction
LOS
C
Appr
oach
EBW
BNB
SBEn
try La
nes
11
11
Confl
icting
Circ
le La
nes
11
11
Adj A
ppro
ach F
low, v
eh/h
952
588
127
27De
mand
Flow
Rate
, veh
/h10
2763
513
729
Vehic
les C
ircula
ting,
veh/h
4486
979
715
Vehic
les E
xiting
, veh
/h70
010
3032
6Fo
llow-
Up H
eadw
ay, s
3.186
3.186
3.186
3.186
Ped V
ol Cr
ossin
g Leg
, #/h
00
00
Ped C
ap A
dj1.0
001.0
001.0
001.0
00Ap
proa
ch D
elay,
s/veh
27.4
12.5
15.1
7.7Ap
proa
ch LO
SD
BC
A
Lane
Left
Bypa
ssLe
ftLe
ftLe
ftDe
signa
ted M
oves
LTR
LTR
LTR
LTR
Assu
med M
oves
LTR
LTR
LTR
LTR
RT C
hann
elize
dFr
eeLa
ne U
til1.0
001.0
001.0
001.0
00Cr
itical
Head
way,
s5.1
935.1
935.1
935.1
93En
try F
low, v
eh/h
967
6063
513
729
Cap E
ntry L
ane,
veh/h
1081
2052
1037
425
553
Entry
HV
Adj F
actor
0.926
0.926
0.927
0.927
0.928
Flow
Entry
, veh
/h89
656
588
127
27Ca
p Entr
y, ve
h/h10
0219
0096
139
451
3V/
C Ra
tio0.8
940.0
290.6
120.3
230.0
52Co
ntrol
Delay
, s/ve
h29
.10.0
12.5
15.1
7.7LO
SD
AB
CA
95th
%tile
Que
ue, v
eh13
04
10
1/16/2
015
Centr
al Co
ast T
rans
porta
tion C
onsu
lting
Sync
hro 8
Rep
ort
HCM
2010
Rou
ndab
out
Inter
secti
onInt
erse
ction
Dela
y, s/v
eh12
.9Int
erse
ction
LOS
B
Appr
oach
EBW
BNB
SBEn
try La
nes
11
11
Confl
icting
Circ
le La
nes
11
11
Adj A
ppro
ach F
low, v
eh/h
646
670
129
6De
mand
Flow
Rate
, veh
/h69
772
313
96
Vehic
les C
ircula
ting,
veh/h
3389
652
805
Vehic
les E
xiting
, veh
/h77
870
232
7Fo
llow-
Up H
eadw
ay, s
3.186
3.186
3.186
3.186
Ped V
ol Cr
ossin
g Leg
, #/h
00
00
Ped C
ap A
dj1.0
001.0
001.0
001.0
00Ap
proa
ch D
elay,
s/veh
10.8
15.5
9.87.3
Appr
oach
LOS
BC
AA
Lane
Left
Bypa
ssLe
ftLe
ftLe
ftDe
signa
ted M
oves
LTR
LTR
LTR
LTR
Assu
med M
oves
LTR
LTR
LTR
LTR
RT C
hann
elize
dFr
eeLa
ne U
til1.0
001.0
001.0
001.0
00Cr
itical
Head
way,
s5.1
935.1
935.1
935.1
93En
try F
low, v
eh/h
651
4672
313
96
Cap E
ntry L
ane,
veh/h
1093
2052
1034
589
505
Entry
HV
Adj F
actor
0.926
0.926
0.927
0.928
1.000
Flow
Entry
, veh
/h60
343
670
129
6Ca
p Entr
y, ve
h/h10
1319
0095
854
650
5V/
C Ra
tio0.5
950.0
230.6
990.2
360.0
12Co
ntrol
Delay
, s/ve
h11
.60.0
15.5
9.87.3
LOS
BA
CA
A95
th %
tile Q
ueue
, veh
40
61
0

1/5/20
15
Centr
al Co
ast T
rans
porta
tion C
onsu
lting
Sync
hro 8
Rep
ort
Queu
es
Lane
Gro
upEB
TEB
RW
BLW
BTNB
LNB
RLa
ne G
roup
Flow
(vph
)92
411
016
581
254
44v/c
Rati
o0.8
50.1
10.2
00.5
20.6
80.1
3Co
ntrol
Delay
24.5
2.258
.210
.444
.321
.6Qu
eue D
elay
0.00.0
0.00.0
0.00.0
Total
Dela
y24
.52.2
58.2
10.4
44.3
21.6
Queu
e Len
gth 50
th (ft
)32
80
814
711
39
Queu
e Len
gth 95
th (ft
)#8
3322
3728
427
145
Inter
nal L
ink D
ist (f
t)31
7136
580
1Tu
rn B
ay Le
ngth
(ft)
320
370
50Ba
se C
apac
ity (v
ph)
1450
1252
8215
2458
153
3St
arva
tion C
ap R
educ
tn0
00
00
0Sp
illbac
k Cap
Red
uctn
00
00
00
Stor
age C
ap R
educ
tn0
00
00
0Re
duce
d v/c
Ratio
0.64
0.09
0.20
0.38
0.44
0.08
Inter
secti
on S
umma
ry#
95th
perce
ntile
volum
e exc
eeds
capa
city,
queu
e may
be lo
nger
.
Que
ue sh
own i
s max
imum
after
two c
ycles
.
1/5/20
15
Centr
al Co
ast T
rans
porta
tion C
onsu
lting
Sync
hro 8
Rep
ort
HCM
2010
Sign
alize
d Inte
rsecti
on S
umma
ry
Move
ment
EBT
EBR
WBL
WBT
NBL
NBR
Lane
Con
figur
ation
sVo
lume (
veh/h
)89
610
716
564
246
43Nu
mber
414
38
512
Initia
l Q (Q
b), v
eh0
00
00
0Pe
d-Bi
ke A
dj(A_
pbT)
1.00
1.00
1.00
1.00
Parki
ng B
us, A
dj1.0
01.0
01.0
01.0
01.0
01.0
0Ad
j Sat
Flow,
veh/h
/ln17
5917
5917
5017
5016
4516
45Ad
j Flow
Rate
, veh
/h92
411
016
581
254
0Ad
j No.
of La
nes
11
11
11
Peak
Hou
r Fac
tor0.9
70.9
70.9
70.9
70.9
70.9
7Pe
rcent
Heav
y Veh
, %8
88
88
8Ca
p, ve
h/h10
9392
925
1204
298
266
Arriv
e On G
reen
0.62
0.62
0.02
0.69
0.19
0.00
Sat F
low, v
eh/h
1759
1495
1667
1750
1567
1398
Grp V
olume
(v), v
eh/h
924
110
1658
125
40
Grp S
at Flo
w(s),
veh/h
/ln17
5914
9516
6717
5015
6713
98Q
Serve
(g_s
), s
32.6
2.30.7
12.1
12.2
0.0Cy
cle Q
Clea
r(g_c
), s
32.6
2.30.7
12.1
12.2
0.0Pr
op In
Lane
1.00
1.00
1.00
1.00
Lane
Grp
Cap
(c), v
eh/h
1093
929
2512
0429
826
6V/
C Ra
tio(X
)0.8
50.1
20.6
40.4
80.8
50.0
0Av
ail C
ap(c_
a), v
eh/h
1641
1394
8618
1260
454
0HC
M Pl
atoon
Rati
o1.0
01.0
01.0
01.0
01.0
01.0
0Up
strea
m Fil
ter(I)
1.00
1.00
1.00
1.00
1.00
0.00
Unifo
rm D
elay (
d), s
/veh
11.8
6.038
.15.7
30.4
0.0Inc
r Dela
y (d2
), s/v
eh2.7
0.123
.90.3
6.80.0
Initia
l Q D
elay(d
3),s/
veh
0.00.0
0.00.0
0.00.0
%ile
Bac
kOfQ
(50%
),veh
/ln16
.51.0
0.55.7
5.80.0
LnGr
p Dela
y(d),s
/veh
14.5
6.162
.06.0
37.2
0.0Ln
Grp L
OSB
AE
AD
Appr
oach
Vol,
veh/h
1034
597
254
Appr
oach
Dela
y, s/v
eh13
.67.5
37.2
Appr
oach
LOS
BA
D
Timer
12
34
56
78
Assig
ned P
hs2
34
8Ph
s Dur
ation
(G+Y
+Rc),
s18
.85.2
53.8
59.0
Chan
ge P
eriod
(Y+R
c), s
4.04.0
5.55.5
Max G
reen
Sett
ing (G
max),
s30
.04.0
72.5
80.5
Max Q
Clea
r Tim
e (g_
c+I1)
, s14
.22.7
34.6
14.1
Gree
n Ext
Time (
p_c),
s0.7
0.013
.715
.4
Inter
secti
on S
umma
ryHC
M 20
10 C
trl De
lay14
.8HC
M 20
10 LO
SB
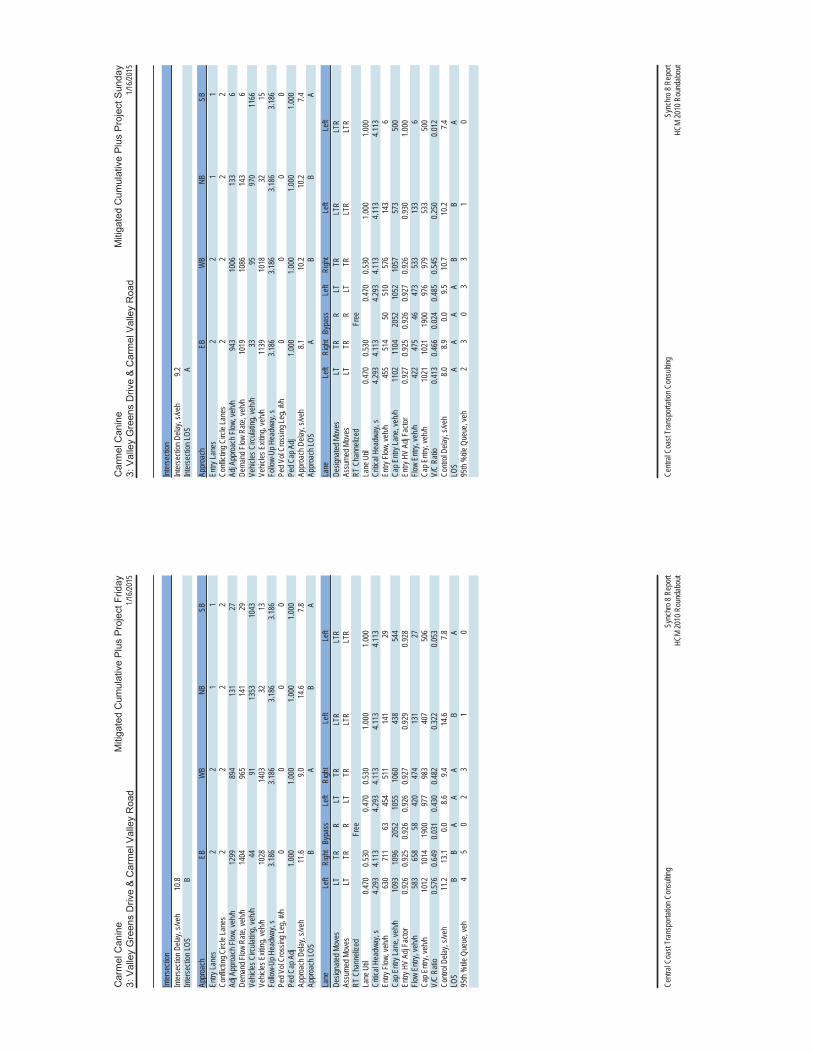
1/16/2
015
Centr
al Co
ast T
rans
porta
tion C
onsu
lting
Sync
hro 8
Rep
ort
HCM
2010
Rou
ndab
out
Inter
secti
onInt
erse
ction
Dela
y, s/v
eh10
.8Int
erse
ction
LOS
B
Appr
oach
EBW
BNB
SBEn
try La
nes
22
11
Confl
icting
Circ
le La
nes
22
22
Adj A
ppro
ach F
low, v
eh/h
1299
894
131
27De
mand
Flow
Rate
, veh
/h14
0496
514
129
Vehic
les C
ircula
ting,
veh/h
4491
1353
1043
Vehic
les E
xiting
, veh
/h10
2814
0332
13Fo
llow-
Up H
eadw
ay, s
3.186
3.186
3.186
3.186
Ped V
ol Cr
ossin
g Leg
, #/h
00
00
Ped C
ap A
dj1.0
001.0
001.0
001.0
00Ap
proa
ch D
elay,
s/veh
11.6
9.014
.67.8
Appr
oach
LOS
BA
BA
Lane
Left
Righ
tBy
pass
Left
Righ
tLe
ftLe
ftDe
signa
ted M
oves
LTTR
RLT
TRLT
RLT
RAs
sume
d Mov
esLT
TRR
LTTR
LTR
LTR
RT C
hann
elize
dFr
eeLa
ne U
til0.4
700.5
300.4
700.5
301.0
001.0
00Cr
itical
Head
way,
s4.2
934.1
134.2
934.1
134.1
134.1
13En
try F
low, v
eh/h
630
711
6345
451
114
129
Cap E
ntry L
ane,
veh/h
1093
1096
2052
1055
1060
438
544
Entry
HV
Adj F
actor
0.926
0.925
0.926
0.926
0.927
0.929
0.928
Flow
Entry
, veh
/h58
365
858
420
474
131
27Ca
p Entr
y, ve
h/h10
1210
1419
0097
798
340
750
6V/
C Ra
tio0.5
760.6
490.0
310.4
300.4
820.3
220.0
53Co
ntrol
Delay
, s/ve
h11
.213
.10.0
8.69.4
14.6
7.8LO
SB
BA
AA
BA
95th
%tile
Que
ue, v
eh4
50
23
10
1/16/2
015
Centr
al Co
ast T
rans
porta
tion C
onsu
lting
Sync
hro 8
Rep
ort
HCM
2010
Rou
ndab
out
Inter
secti
onInt
erse
ction
Dela
y, s/v
eh9.2
Inter
secti
on LO
SA
Appr
oach
EBW
BNB
SBEn
try La
nes
22
11
Confl
icting
Circ
le La
nes
22
22
Adj A
ppro
ach F
low, v
eh/h
943
1006
133
6De
mand
Flow
Rate
, veh
/h10
1910
8614
36
Vehic
les C
ircula
ting,
veh/h
3395
970
1166
Vehic
les E
xiting
, veh
/h11
3910
1832
15Fo
llow-
Up H
eadw
ay, s
3.186
3.186
3.186
3.186
Ped V
ol Cr
ossin
g Leg
, #/h
00
00
Ped C
ap A
dj1.0
001.0
001.0
001.0
00Ap
proa
ch D
elay,
s/veh
8.110
.210
.27.4
Appr
oach
LOS
AB
BA
Lane
Left
Righ
tBy
pass
Left
Righ
tLe
ftLe
ftDe
signa
ted M
oves
LTTR
RLT
TRLT
RLT
RAs
sume
d Mov
esLT
TRR
LTTR
LTR
LTR
RT C
hann
elize
dFr
eeLa
ne U
til0.4
700.5
300.4
700.5
301.0
001.0
00Cr
itical
Head
way,
s4.2
934.1
134.2
934.1
134.1
134.1
13En
try F
low, v
eh/h
455
514
5051
057
614
36
Cap E
ntry L
ane,
veh/h
1102
1104
2052
1052
1057
573
500
Entry
HV
Adj F
actor
0.927
0.925
0.926
0.927
0.926
0.930
1.000
Flow
Entry
, veh
/h42
247
546
473
533
133
6Ca
p Entr
y, ve
h/h10
2110
2119
0097
697
953
350
0V/
C Ra
tio0.4
130.4
660.0
240.4
850.5
450.2
500.0
12Co
ntrol
Delay
, s/ve
h8.0
8.90.0
9.510
.710
.27.4
LOS
AA
AA
BB
A95
th %
tile Q
ueue
, veh
23
03
31
0

1/5/20
15
Centr
al Co
ast T
rans
porta
tion C
onsu
lting
Sync
hro 8
Rep
ort
HCM
2010
TW
SC
Inter
secti
onInt
Dela
y, s/v
eh1.5
Move
ment
EBL
EBT
EBR
WBL
WBT
WBR
NBL
NBT
NBR
SBL
SBT
SBR
Vol, v
eh/h
485
654
2853
52
00
4911
114
Confl
icting
Ped
s, #/h
r0
00
00
00
00
00
0Si
gn C
ontro
l Fr
eeFr
eeFr
eeFr
eeFr
eeFr
eeSt
opSt
opSt
opSt
opSt
opSt
opRT
Cha
nneli
zed
--
None
--
None
--
None
--
None
Stor
age L
ength
400
-70
210
--
100
-0
--
60Ve
h in M
edian
Stor
age,
#-
0-
-0
--
0-
-0
-Gr
ade,
%-
4-
-2
--
7-
-1
-Pe
ak H
our F
actor
9696
9696
9696
9696
9696
9696
Heav
y Veh
icles
, %8
88
88
88
88
88
8Mv
mt F
low4
892
5629
557
20
051
111
15
Major
/Mino
rMa
jor1
Major
2Mi
nor1
Mino
r2Co
nflict
ing F
low A
ll55
90
089
20
015
1715
1889
215
1715
1755
8
S
tage 1
--
--
--
900
900
-61
761
7-
Stag
e 2-
--
--
-61
761
8-
900
900
-Cr
itical
Hdwy
4.18
--
4.18
--
8.58
7.98
6.98
7.38
6.78
6.38
Critic
al Hd
wy S
tg 1
--
--
--
7.58
6.98
-6.3
85.7
8-
Critic
al Hd
wy S
tg 2
--
--
--
7.58
6.98
-6.3
85.7
8-
Follo
w-up
Hdw
y2.2
72-
-2.2
72-
-3.5
724.0
723.3
723.5
724.0
723.3
72Po
t Cap
-1 M
aneu
ver
983
--
736
--
5264
279
8710
651
0
S
tage 1
--
--
--
229
246
-45
245
6-
Stag
e 2-
--
--
-36
837
1-
309
332
-Pl
atoon
bloc
ked,
%-
--
-Mo
v Cap
-1 M
aneu
ver
983
--
736
--
4861
279
6910
151
0Mo
v Cap
-2 M
aneu
ver
--
--
--
4861
-69
101
-
S
tage 1
--
--
--
228
245
-45
043
8-
Stag
e 2-
--
--
-34
335
6-
251
331
-
Appr
oach
EBW
BNB
SBHC
M Co
ntrol
Delay
, s0
0.520
.837
.2HC
M LO
SC
E
Mino
r Lan
e/Majo
r Mvm
tNB
Ln1N
BLn2
EBL
EBT
EBR
WBL
WBT
WBR
SBLn
1SBL
n2Ca
pacit
y (ve
h/h)
-27
998
3-
-73
6-
-71
510
HCM
Lane
V/C
Rati
o-
0.183
0.004
--
0.04
--
0.176
0.029
HCM
Contr
ol De
lay (s
)0
20.8
8.7-
-10
.1-
-66
.212
.3HC
M La
ne LO
SA
CA
--
B-
-F
BHC
M 95
th %
tile Q
(veh)
-0.7
0-
-0.1
--
0.60.1
1/16/2
015
Centr
al Co
ast T
rans
porta
tion C
onsu
lting
Sync
hro 8
Rep
ort
HCM
2010
Rou
ndab
out
Inter
secti
onInt
erse
ction
Dela
y, s/v
eh10
.9Int
erse
ction
LOS
B
Appr
oach
EBW
BNB
SBEn
try La
nes
22
11
Confl
icting
Circ
le La
nes
22
22
Adj A
ppro
ach F
low, v
eh/h
872
1323
7613
Dema
nd F
low R
ate, v
eh/h
941
1429
8213
Vehic
les C
ircula
ting,
veh/h
6543
878
1455
Vehic
les E
xiting
, veh
/h14
0391
762
17Fo
llow-
Up H
eadw
ay, s
3.186
3.186
3.186
3.186
Ped V
ol Cr
ossin
g Leg
, #/h
00
00
Ped C
ap A
dj1.0
001.0
001.0
001.0
00Ap
proa
ch D
elay,
s/veh
7.513
.48.0
9.5Ap
proa
ch LO
SA
BA
A
Lane
Left
Righ
tBy
pass
Left
Righ
tLe
ftLe
ftDe
signa
ted M
oves
LTTR
RLT
TRLT
RLT
RAs
sume
d Mov
esLT
TRR
LTTR
LTR
LTR
RT C
hann
elize
dFr
eeLa
ne U
til0.4
700.5
300.4
700.5
301.0
001.0
00Cr
itical
Head
way,
s4.2
934.1
134.2
934.1
134.1
134.1
13En
try F
low, v
eh/h
411
464
6667
275
782
13Ca
p Entr
y Lan
e, ve
h/h10
7610
8020
5210
9410
9661
140
8En
try H
V Ad
j Fac
tor0.9
270.9
260.9
260.9
260.9
270.9
270.9
77Flo
w En
try, v
eh/h
381
430
6162
270
176
13Ca
p Entr
y, ve
h/h99
810
0019
0010
1310
1656
639
9V/
C Ra
tio0.3
820.4
300.0
320.6
140.6
900.1
340.0
32Co
ntrol
Delay
, s/ve
h7.7
8.40.0
12.1
14.5
8.09.5
LOS
AA
AB
BA
A95
th %
tile Q
ueue
, veh
22
04
60
0

1/16/2
015
Centr
al Co
ast T
rans
porta
tion C
onsu
lting
Sync
hro 8
Rep
ort
HCM
2010
Rou
ndab
out
Inter
secti
onInt
erse
ction
Dela
y, s/v
eh11
.3Int
erse
ction
LOS
B
Appr
oach
EBW
BNB
SBEn
try La
nes
22
11
Confl
icting
Circ
le La
nes
22
22
Adj A
ppro
ach F
low, v
eh/h
872
1323
7613
Dema
nd F
low R
ate, v
eh/h
941
1429
8213
Vehic
les C
ircula
ting,
veh/h
6543
878
1455
Vehic
les E
xiting
, veh
/h14
0391
712
817
Follo
w-Up
Hea
dway
, s3.1
863.1
863.1
863.1
86Pe
d Vol
Cros
sing L
eg, #
/h0
00
0Pe
d Cap
Adj
1.000
1.000
1.000
1.000
Appr
oach
Dela
y, s/v
eh8.6
13.4
8.09.5
Appr
oach
LOS
AB
AA
Lane
Left
Righ
tLe
ftRi
ght
Left
Left
Desig
nated
Mov
esLT
TRLT
TRLT
RLT
RAs
sume
d Mov
esLT
TRLT
TRLT
RLT
RRT
Cha
nneli
zed
Lane
Util
0.470
0.530
0.470
0.530
1.000
1.000
Critic
al He
adwa
y, s
4.293
4.113
4.293
4.113
4.113
4.113
Entry
Flow
, veh
/h44
249
967
275
782
13Ca
p Entr
y Lan
e, ve
h/h10
7610
8010
9410
9661
140
8En
try H
V Ad
j Fac
tor0.9
270.9
260.9
260.9
270.9
270.9
77Flo
w En
try, v
eh/h
410
462
622
701
7613
Cap E
ntry,
veh/h
997
999
1013
1016
566
399
V/C
Ratio
0.411
0.462
0.614
0.690
0.134
0.032
Contr
ol De
lay, s
/veh
8.29.0
12.1
14.5
8.09.5
LOS
AA
BB
AA
95th
%tile
Que
ue, v
eh2
24
60
0
1/16/2
015
Centr
al Co
ast T
rans
porta
tion C
onsu
lting
Sync
hro 8
Rep
ort
HCM
2010
Rou
ndab
out
Inter
secti
onInt
erse
ction
Dela
y, s/v
eh9.7
Inter
secti
on LO
SA
Appr
oach
EBW
BNB
SBEn
try La
nes
22
11
Confl
icting
Circ
le La
nes
22
22
Adj A
ppro
ach F
low, v
eh/h
1172
874
125
17De
mand
Flow
Rate
, veh
/h12
6594
413
518
Vehic
les C
ircula
ting,
veh/h
4567
1214
985
Vehic
les E
xiting
, veh
/h95
812
8236
26Fo
llow-
Up H
eadw
ay, s
3.186
3.186
3.186
3.186
Ped V
ol Cr
ossin
g Leg
, #/h
00
00
Ped C
ap A
dj1.0
001.0
001.0
001.0
00Ap
proa
ch D
elay,
s/veh
10.1
8.612
.67.2
Appr
oach
LOS
BA
BA
Lane
Left
Righ
tBy
pass
Left
Righ
tLe
ftLe
ftDe
signa
ted M
oves
LTTR
RLT
TRLT
RLT
RAs
sume
d Mov
esLT
TRR
LTTR
LTR
LTR
RT C
hann
elize
dFr
eeLa
ne U
til0.4
700.5
300.4
700.5
301.0
001.0
00Cr
itical
Head
way,
s4.2
934.1
134.2
934.1
134.1
134.1
13En
try F
low, v
eh/h
566
639
6044
450
013
518
Cap E
ntry L
ane,
veh/h
1092
1095
2052
1075
1078
483
567
Entry
HV
Adj F
actor
0.926
0.925
0.926
0.926
0.927
0.925
0.932
Flow
Entry
, veh
/h52
459
156
411
463
125
17Ca
p Entr
y, ve
h/h10
1210
1319
0099
599
944
752
9V/
C Ra
tio0.5
180.5
840.0
290.4
130.4
640.2
790.0
32Co
ntrol
Delay
, s/ve
h9.9
11.3
0.08.2
9.012
.67.2
LOS
AB
AA
AB
A95
th %
tile Q
ueue
, veh
34
02
31
0
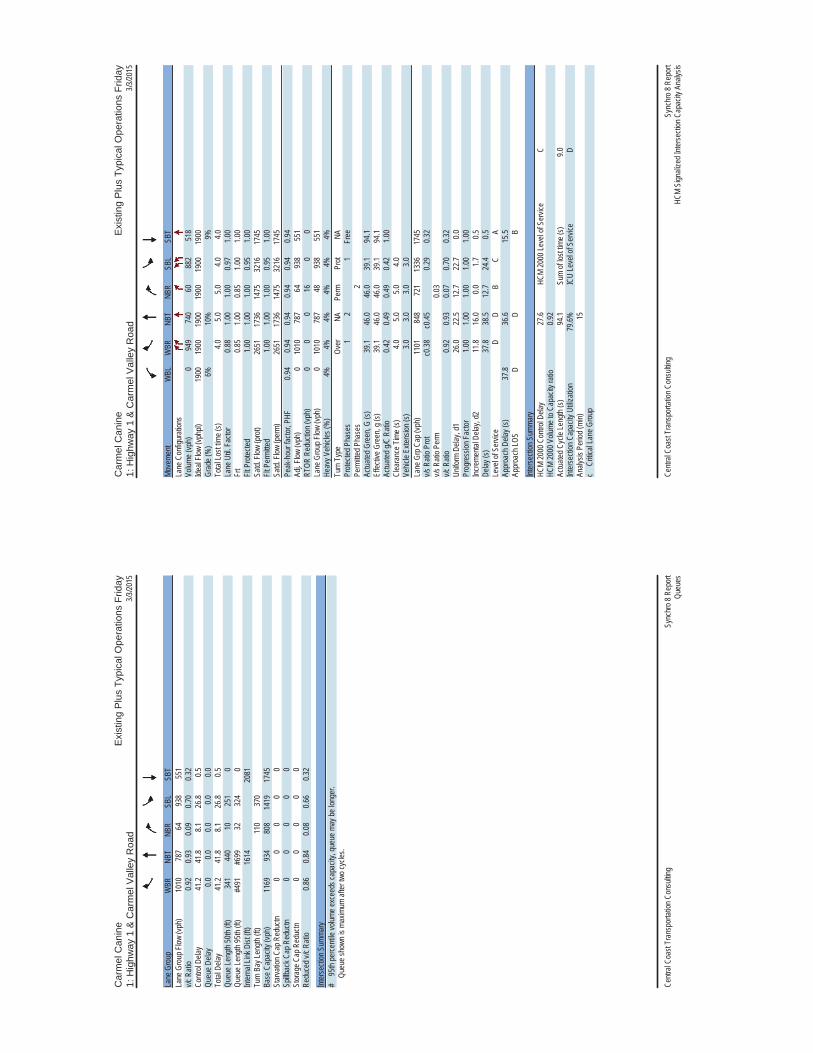
Car
mel
Can
ine
Exi
stin
g P
lus
Typ
ical
Ope
ratio
ns F
riday
1: H
ighw
ay 1
& C
arm
el V
alle
y R
oad
3/3/20
15
Centr
al Co
ast T
rans
porta
tion C
onsu
lting
Sync
hro 8
Rep
ort
Queu
es
Lane
Gro
upW
BRNB
TNB
RSB
LSB
TLa
ne G
roup
Flow
(vph
)10
1078
764
938
551
v/c R
atio
0.92
0.93
0.09
0.70
0.32
Contr
ol De
lay41
.241
.88.1
26.8
0.5Qu
eue D
elay
0.00.0
0.00.0
0.0To
tal D
elay
41.2
41.8
8.126
.80.5
Queu
e Len
gth 50
th (ft
)34
144
010
251
0Qu
eue L
ength
95th
(ft)
#491
#699
3232
40
Inter
nal L
ink D
ist (f
t)16
1420
81Tu
rn B
ay Le
ngth
(ft)
110
370
Base
Cap
acity
(vph
)11
6993
480
814
1917
45St
arva
tion C
ap R
educ
tn0
00
00
Spillb
ack C
ap R
educ
tn0
00
00
Stor
age C
ap R
educ
tn0
00
00
Redu
ced v
/c Ra
tio0.8
60.8
40.0
80.6
60.3
2
Inter
secti
on S
umma
ry#
95th
perce
ntile
volum
e exc
eeds
capa
city,
queu
e may
be lo
nger
.
Que
ue sh
own i
s max
imum
after
two c
ycles
.
Car
mel
Can
ine
Exi
stin
g P
lus
Typ
ical
Ope
ratio
ns F
riday
1: H
ighw
ay 1
& C
arm
el V
alle
y R
oad
3/3/20
15
Centr
al Co
ast T
rans
porta
tion C
onsu
lting
Sync
hro 8
Rep
ort
HCM
Sign
alize
d Inte
rsecti
on C
apac
ity A
nalys
is
Move
ment
WBL
WBR
NBT
NBR
SBL
SBT
Lane
Con
figur
ation
sVo
lume (
vph)
094
974
060
882
518
Ideal
Flow
(vphp
l)19
0019
0019
0019
0019
0019
00Gr
ade (
%)
6%10
%9%
Total
Lost
time (
s)4.0
5.05.0
4.04.0
Lane
Util.
Fac
tor0.8
81.0
01.0
00.9
71.0
0Fr
t0.8
51.0
00.8
51.0
01.0
0Flt
Pro
tected
1.00
1.00
1.00
0.95
1.00
Satd.
Flow
(pro
t)26
5117
3614
7532
1617
45Flt
Per
mitte
d1.0
01.0
01.0
00.9
51.0
0Sa
td. F
low (p
erm)
2651
1736
1475
3216
1745
Peak
-hou
r fac
tor, P
HF0.9
40.9
40.9
40.9
40.9
40.9
4Ad
j. Flow
(vph
)0
1010
787
6493
855
1RT
OR R
educ
tion (
vph)
00
016
00
Lane
Gro
up F
low (v
ph)
010
1078
748
938
551
Heav
y Veh
icles
(%)
4%4%
4%4%
4%4%
Turn
Typ
eOv
erNA
Perm
Prot
NAPr
otecte
d Pha
ses
12
1Fr
eePe
rmitte
d Pha
ses
2Ac
tuated
Gre
en, G
(s)
39.1
46.0
46.0
39.1
94.1
Effec
tive G
reen
, g (s
)39
.146
.046
.039
.194
.1Ac
tuated
g/C
Ratio
0.42
0.49
0.49
0.42
1.00
Clea
ranc
e Tim
e (s)
4.05.0
5.04.0
Vehic
le Ex
tensio
n (s)
3.03.0
3.03.0
Lane
Grp
Cap
(vph
)11
0184
872
113
3617
45v/s
Rati
o Pro
tc0
.38c0
.450.2
90.3
2v/s
Rati
o Per
m0.0
3v/c
Rati
o0.9
20.9
30.0
70.7
00.3
2Un
iform
Dela
y, d1
26.0
22.5
12.7
22.7
0.0Pr
ogre
ssion
Fac
tor1.0
01.0
01.0
01.0
01.0
0Inc
reme
ntal D
elay,
d211
.816
.00.0
1.70.5
Delay
(s)
37.8
38.5
12.7
24.4
0.5Le
vel o
f Ser
vice
DD
BC
AAp
proa
ch D
elay (
s)37
.836
.615
.5Ap
proa
ch LO
SD
DB
Inter
secti
on S
umma
ryHC
M 20
00 C
ontro
l Dela
y27
.6HC
M 20
00 Le
vel o
f Ser
vice
CHC
M 20
00 V
olume
to C
apac
ity ra
tio0.9
2Ac
tuated
Cyc
le Le
ngth
(s)
94.1
Sum
of los
t time
(s)
9.0Int
erse
ction
Cap
acity
Utili
zatio
n79
.6%IC
U Le
vel o
f Ser
vice
DAn
alysis
Per
iod (m
in)15
c C
ritica
l Lan
e Gro
up
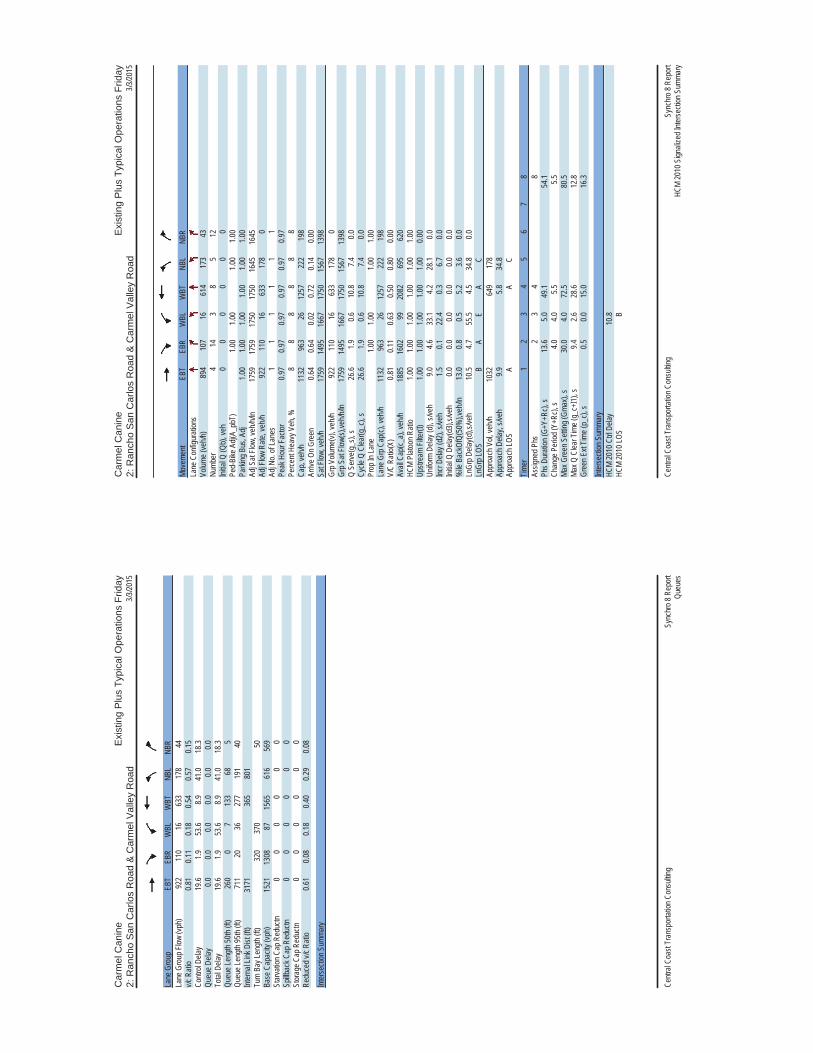
Car
mel
Can
ine
Exi
stin
g P
lus
Typ
ical
Ope
ratio
ns F
riday
2: R
anch
o S
an C
arlo
s R
oad
& C
arm
el V
alle
y R
oad
3/3/20
15
Centr
al Co
ast T
rans
porta
tion C
onsu
lting
Sync
hro 8
Rep
ort
Queu
es
Lane
Gro
upEB
TEB
RW
BLW
BTNB
LNB
RLa
ne G
roup
Flow
(vph
)92
211
016
633
178
44v/c
Rati
o0.8
10.1
10.1
80.5
40.5
70.1
5Co
ntrol
Delay
19.6
1.953
.68.9
41.0
18.3
Queu
e Dela
y0.0
0.00.0
0.00.0
0.0To
tal D
elay
19.6
1.953
.68.9
41.0
18.3
Queu
e Len
gth 50
th (ft
)26
00
713
368
5Qu
eue L
ength
95th
(ft)
711
2036
277
191
40Int
erna
l Link
Dist
(ft)
3171
365
801
Turn
Bay
Leng
th (ft
)32
037
050
Base
Cap
acity
(vph
)15
2113
0887
1565
616
569
Star
vatio
n Cap
Red
uctn
00
00
00
Spillb
ack C
ap R
educ
tn0
00
00
0St
orag
e Cap
Red
uctn
00
00
00
Redu
ced v
/c Ra
tio0.6
10.0
80.1
80.4
00.2
90.0
8
Inter
secti
on S
umma
ry
Car
mel
Can
ine
Exi
stin
g P
lus
Typ
ical
Ope
ratio
ns F
riday
2: R
anch
o S
an C
arlo
s R
oad
& C
arm
el V
alle
y R
oad
3/3/20
15
Centr
al Co
ast T
rans
porta
tion C
onsu
lting
Sync
hro 8
Rep
ort
HCM
2010
Sign
alize
d Inte
rsecti
on S
umma
ry
Move
ment
EBT
EBR
WBL
WBT
NBL
NBR
Lane
Con
figur
ation
sVo
lume (
veh/h
)89
410
716
614
173
43Nu
mber
414
38
512
Initia
l Q (Q
b), v
eh0
00
00
0Pe
d-Bi
ke A
dj(A_
pbT)
1.00
1.00
1.00
1.00
Parki
ng B
us, A
dj1.0
01.0
01.0
01.0
01.0
01.0
0Ad
j Sat
Flow,
veh/h
/ln17
5917
5917
5017
5016
4516
45Ad
j Flow
Rate
, veh
/h92
211
016
633
178
0Ad
j No.
of La
nes
11
11
11
Peak
Hou
r Fac
tor0.9
70.9
70.9
70.9
70.9
70.9
7Pe
rcent
Heav
y Veh
, %8
88
88
8Ca
p, ve
h/h11
3296
326
1257
222
198
Arriv
e On G
reen
0.64
0.64
0.02
0.72
0.14
0.00
Sat F
low, v
eh/h
1759
1495
1667
1750
1567
1398
Grp V
olume
(v), v
eh/h
922
110
1663
317
80
Grp S
at Flo
w(s),
veh/h
/ln17
5914
9516
6717
5015
6713
98Q
Serve
(g_s
), s
26.6
1.90.6
10.8
7.40.0
Cycle
Q C
lear(g
_c),
s26
.61.9
0.610
.87.4
0.0Pr
op In
Lane
1.00
1.00
1.00
1.00
Lane
Grp
Cap
(c), v
eh/h
1132
963
2612
5722
219
8V/
C Ra
tio(X
)0.8
10.1
10.6
30.5
00.8
00.0
0Av
ail C
ap(c_
a), v
eh/h
1885
1602
9920
8269
562
0HC
M Pl
atoon
Rati
o1.0
01.0
01.0
01.0
01.0
01.0
0Up
strea
m Fil
ter(I)
1.00
1.00
1.00
1.00
1.00
0.00
Unifo
rm D
elay (
d), s
/veh
9.04.6
33.1
4.228
.10.0
Incr D
elay (
d2),
s/veh
1.50.1
22.4
0.36.7
0.0Ini
tial Q
Dela
y(d3)
,s/ve
h0.0
0.00.0
0.00.0
0.0%
ile B
ackO
fQ(5
0%),v
eh/ln
13.0
0.80.5
5.23.6
0.0Ln
Grp D
elay(d
),s/ve
h10
.54.7
55.5
4.534
.80.0
LnGr
p LOS
BA
EA
CAp
proa
ch V
ol, ve
h/h10
3264
917
8Ap
proa
ch D
elay,
s/veh
9.95.8
34.8
Appr
oach
LOS
AA
C
Timer
12
34
56
78
Assig
ned P
hs2
34
8Ph
s Dur
ation
(G+Y
+Rc),
s13
.65.0
49.1
54.1
Chan
ge P
eriod
(Y+R
c), s
4.04.0
5.55.5
Max G
reen
Sett
ing (G
max),
s30
.04.0
72.5
80.5
Max Q
Clea
r Tim
e (g_
c+I1)
, s9.4
2.628
.612
.8Gr
een E
xt Tim
e (p_
c), s
0.50.0
15.0
16.3
Inter
secti
on S
umma
ryHC
M 20
10 C
trl De
lay10
.8HC
M 20
10 LO
SB

Car
mel
Can
ine
Exi
stin
g P
lus
Typ
ical
Ope
ratio
ns F
riday
3: V
alle
y G
reen
s D
rive
& C
arm
el V
alle
y R
oad
3/3/20
15
Centr
al Co
ast T
rans
porta
tion C
onsu
lting
Sync
hro 8
Rep
ort
HCM
2010
TW
SC
Inter
secti
onInt
Dela
y, s/v
eh16
Move
ment
EBL
EBT
EBR
WBL
WBT
WBR
NBL
NBT
NBR
SBL
SBT
SBR
Vol, v
eh/h
485
652
2753
52
500
4111
114
Confl
icting
Ped
s, #/h
r0
00
00
00
00
00
0Si
gn C
ontro
l Fr
eeFr
eeFr
eeFr
eeFr
eeFr
eeSt
opSt
opSt
opSt
opSt
opSt
opRT
Cha
nneli
zed
--
None
--
None
--
None
--
None
Stor
age L
ength
400
-70
210
--
--
--
-60
Veh i
n Med
ian S
torag
e, #
-0
--
0-
-0
--
0-
Grad
e, %
-4
--
2-
-7
--
1-
Peak
Hou
r Fac
tor96
9696
9696
9696
9696
9696
96He
avy V
ehicl
es, %
88
88
88
88
88
88
Mvmt
Flow
489
254
2855
72
520
4311
115
Major
/Mino
rMa
jor1
Major
2Mi
nor1
Mino
r2Co
nflict
ing F
low A
ll55
90
089
20
015
1515
1689
215
3615
1555
8
S
tage 1
--
--
--
900
900
-61
561
5-
Stag
e 2-
--
--
-61
561
6-
921
900
-Cr
itical
Hdwy
4.18
--
4.18
--
8.58
7.98
6.98
7.38
6.78
6.38
Critic
al Hd
wy S
tg 1
--
--
--
7.58
6.98
-6.3
85.7
8-
Critic
al Hd
wy S
tg 2
--
--
--
7.58
6.98
-6.3
85.7
8-
Follo
w-up
Hdw
y2.2
72-
-2.2
72-
-3.5
724.0
723.3
723.5
724.0
723.3
72Po
t Cap
-1 M
aneu
ver
983
--
736
--
5364
279
8410
751
0
S
tage 1
--
--
--
229
246
-45
345
7-
Stag
e 2-
--
--
-36
937
2-
301
332
-Pl
atoon
bloc
ked,
%-
--
-Mo
v Cap
-1 M
aneu
ver
983
--
736
--
~ 49
6127
969
103
510
Mov C
ap-2
Man
euve
r-
--
--
-~
4961
-69
103
-
S
tage 1
--
--
--
228
245
-45
144
0-
Stag
e 2-
--
--
-34
435
8-
254
331
-
Appr
oach
EBW
BNB
SBHC
M Co
ntrol
Delay
, s0
0.526
5.737
.2HC
M LO
SF
E
Mino
r Lan
e/Majo
r Mvm
tNB
Ln1
EBL
EBT
EBR
WBL
WBT
WBR
SBLn
1SBL
n2Ca
pacit
y (ve
h/h)
7898
3-
-73
6-
-71
510
HCM
Lane
V/C
Rati
o1.2
150.0
04-
-0.0
38-
-0.1
760.0
29HC
M Co
ntrol
Delay
(s)
265.7
8.7-
-10
.1-
-66
.212
.3HC
M La
ne LO
SF
A-
-B
--
FB
HCM
95th
%tile
Q(ve
h)7.1
0-
-0.1
--
0.60.1
Notes
~: V
olume
exce
eds c
apac
ity
$: D
elay e
xcee
ds 30
0s
+: C
ompu
tation
Not
Defin
ed
*: A
ll majo
r volu
me in
plato
on
Car
mel
Can
ine
Cum
ulat
ive
Plu
s T
ypic
al O
pera
tions
Frid
ay1:
Hig
hway
1 &
Car
mel
Val
ley
Roa
d3/3
/2015
Centr
al Co
ast T
rans
porta
tion C
onsu
lting
Sync
hro 8
Rep
ort
Queu
es
Lane
Gro
upW
BRNB
TSB
LSB
TLa
ne G
roup
Flow
(vph
)12
0511
0412
1360
0v/c
Rati
o0.8
90.8
80.7
40.3
4Co
ntrol
Delay
29.4
33.9
20.2
0.5Qu
eue D
elay
0.00.0
0.00.0
Total
Dela
y29
.433
.920
.20.5
Queu
e Len
gth 50
th (ft
)33
129
126
40
Queu
e Len
gth 95
th (ft
)#4
96#4
1534
50
Inter
nal L
ink D
ist (f
t)16
1420
81Tu
rn B
ay Le
ngth
(ft)
370
Base
Cap
acity
(vph
)14
4213
4917
5017
45St
arva
tion C
ap R
educ
tn0
00
0Sp
illbac
k Cap
Red
uctn
00
00
Stor
age C
ap R
educ
tn0
00
0Re
duce
d v/c
Ratio
0.84
0.82
0.69
0.34
Inter
secti
on S
umma
ry#
95th
perce
ntile
volum
e exc
eeds
capa
city,
queu
e may
be lo
nger
.
Que
ue sh
own i
s max
imum
after
two c
ycles
.

Car
mel
Can
ine
Cum
ulat
ive
Plu
s T
ypic
al O
pera
tions
Frid
ay1:
Hig
hway
1 &
Car
mel
Val
ley
Roa
d3/3
/2015
Centr
al Co
ast T
rans
porta
tion C
onsu
lting
Sync
hro 8
Rep
ort
HCM
Sign
alize
d Inte
rsecti
on C
apac
ity A
nalys
is
Move
ment
WBL
WBR
NBT
NBR
SBL
SBT
Lane
Con
figur
ation
sVo
lume (
vph)
011
3385
618
111
4056
4Ide
al Flo
w (vp
hpl)
1900
1900
1900
1900
1900
1900
Grad
e (%
)6%
10%
9%To
tal Lo
st tim
e (s)
4.05.0
4.04.0
Lane
Util.
Fac
tor0.8
80.9
50.9
71.0
0Fr
t0.8
50.9
71.0
01.0
0Flt
Pro
tected
1.00
1.00
0.95
1.00
Satd.
Flow
(pro
t)26
5132
1132
1617
45Flt
Per
mitte
d1.0
01.0
00.9
51.0
0Sa
td. F
low (p
erm)
2651
3211
3216
1745
Peak
-hou
r fac
tor, P
HF0.9
40.9
40.9
40.9
40.9
40.9
4Ad
j. Flow
(vph
)0
1205
911
193
1213
600
RTOR
Red
uctio
n (vp
h)0
020
00
0La
ne G
roup
Flow
(vph
)0
1205
1084
012
1360
0He
avy V
ehicl
es (%
)4%
4%4%
4%4%
4%Tu
rn T
ype
Over
NAPr
otNA
Prote
cted P
hase
s1
21
Free
Perm
itted P
hase
sAc
tuated
Gre
en, G
(s)
43.6
32.8
43.6
85.4
Effec
tive G
reen
, g (s
)43
.632
.843
.685
.4Ac
tuated
g/C
Ratio
0.51
0.38
0.51
1.00
Clea
ranc
e Tim
e (s)
4.05.0
4.0Ve
hicle
Exten
sion (
s)3.0
3.03.0
Lane
Grp
Cap
(vph
)13
5312
3316
4117
45v/s
Rati
o Pro
tc0
.45c0
.340.3
80.3
4v/s
Rati
o Per
mv/c
Rati
o0.8
90.8
80.7
40.3
4Un
iform
Dela
y, d1
18.8
24.5
16.4
0.0Pr
ogre
ssion
Fac
tor1.0
01.0
01.0
01.0
0Inc
reme
ntal D
elay,
d27.7
7.41.8
0.5De
lay (s
)26
.531
.818
.20.5
Leve
l of S
ervic
eC
CB
AAp
proa
ch D
elay (
s)26
.531
.812
.4Ap
proa
ch LO
SC
CB
Inter
secti
on S
umma
ryHC
M 20
00 C
ontro
l Dela
y21
.7HC
M 20
00 Le
vel o
f Ser
vice
CHC
M 20
00 V
olume
to C
apac
ity ra
tio0.8
9Ac
tuated
Cyc
le Le
ngth
(s)
85.4
Sum
of los
t time
(s)
9.0Int
erse
ction
Cap
acity
Utili
zatio
n76
.6%IC
U Le
vel o
f Ser
vice
DAn
alysis
Per
iod (m
in)15
c C
ritica
l Lan
e Gro
up
Car
mel
Can
ine
Cum
ulat
ive
Plu
s T
ypic
al O
pera
tions
Frid
ay2:
Ran
cho
San
Car
los
Roa
d &
Car
mel
Val
ley
Roa
d3/3
/2015
Centr
al Co
ast T
rans
porta
tion C
onsu
lting
Sync
hro 8
Rep
ort
Queu
es
Lane
Gro
upEB
TEB
RW
BLW
BTNB
LNB
RLa
ne G
roup
Flow
(vph
)12
2913
919
926
189
52v/c
Rati
o0.9
80.1
30.3
10.7
10.7
20.2
0Co
ntrol
Delay
38.3
2.365
.412
.557
.620
.2Qu
eue D
elay
0.00.0
0.00.0
0.00.0
Total
Dela
y38
.32.3
65.4
12.5
57.6
20.2
Queu
e Len
gth 50
th (ft
)59
03
1228
511
510
Queu
e Len
gth 95
th (ft
)#1
319
2940
590
203
45Int
erna
l Link
Dist
(ft)
3171
365
801
Turn
Bay
Leng
th (ft
)32
037
050
Base
Cap
acity
(vph
)12
5711
0262
1334
436
414
Star
vatio
n Cap
Red
uctn
00
00
00
Spillb
ack C
ap R
educ
tn0
00
00
0St
orag
e Cap
Red
uctn
00
00
00
Redu
ced v
/c Ra
tio0.9
80.1
30.3
10.6
90.4
30.1
3
Inter
secti
on S
umma
ry#
95th
perce
ntile
volum
e exc
eeds
capa
city,
queu
e may
be lo
nger
.
Que
ue sh
own i
s max
imum
after
two c
ycles
.

Car
mel
Can
ine
Cum
ulat
ive
Plu
s T
ypic
al O
pera
tions
Frid
ay2:
Ran
cho
San
Car
los
Roa
d &
Car
mel
Val
ley
Roa
d3/3
/2015
Centr
al Co
ast T
rans
porta
tion C
onsu
lting
Sync
hro 8
Rep
ort
HCM
2010
Sign
alize
d Inte
rsecti
on S
umma
ry
Move
ment
EBT
EBR
WBL
WBT
NBL
NBR
Lane
Con
figur
ation
sVo
lume (
veh/h
)11
9213
518
898
183
50Nu
mber
414
38
512
Initia
l Q (Q
b), v
eh0
00
00
0Pe
d-Bi
ke A
dj(A_
pbT)
1.00
1.00
1.00
1.00
Parki
ng B
us, A
dj1.0
01.0
01.0
01.0
01.0
01.0
0Ad
j Sat
Flow,
veh/h
/ln17
5917
5917
5017
5016
4516
45Ad
j Flow
Rate
, veh
/h12
2913
919
926
189
0Ad
j No.
of La
nes
11
11
11
Peak
Hou
r Fac
tor0.9
70.9
70.9
70.9
70.9
70.9
7Pe
rcent
Heav
y Veh
, %8
88
88
8Ca
p, ve
h/h12
4910
6227
1340
221
198
Arriv
e On G
reen
0.71
0.71
0.02
0.77
0.14
0.00
Sat F
low, v
eh/h
1759
1495
1667
1750
1567
1398
Grp V
olume
(v), v
eh/h
1229
139
1992
618
90
Grp S
at Flo
w(s),
veh/h
/ln17
5914
9516
6717
5015
6713
98Q
Serve
(g_s
), s
68.5
3.01.2
26.9
12.0
0.0Cy
cle Q
Clea
r(g_c
), s
68.5
3.01.2
26.9
12.0
0.0Pr
op In
Lane
1.00
1.00
1.00
1.00
Lane
Grp
Cap
(c), v
eh/h
1249
1062
2713
4022
119
8V/
C Ra
tio(X
)0.9
80.1
30.7
00.6
90.8
50.0
0Av
ail C
ap(c_
a), v
eh/h
1251
1063
6513
8246
141
1HC
M Pl
atoon
Rati
o1.0
01.0
01.0
01.0
01.0
01.0
0Up
strea
m Fil
ter(I)
1.00
1.00
1.00
1.00
1.00
0.00
Unifo
rm D
elay (
d), s
/veh
14.2
4.749
.96.0
42.7
0.0Inc
r Dela
y (d2
), s/v
eh21
.60.1
27.5
1.49.0
0.0Ini
tial Q
Dela
y(d3)
,s/ve
h0.0
0.00.0
0.00.0
0.0%
ile B
ackO
fQ(5
0%),v
eh/ln
39.9
1.30.7
13.1
5.80.0
LnGr
p Dela
y(d),s
/veh
35.8
4.877
.47.4
51.8
0.0Ln
Grp L
OSD
AE
AD
Appr
oach
Vol,
veh/h
1368
945
189
Appr
oach
Dela
y, s/v
eh32
.78.8
51.8
Appr
oach
LOS
CA
D
Timer
12
34
56
78
Assig
ned P
hs2
34
8Ph
s Dur
ation
(G+Y
+Rc),
s18
.45.7
77.9
83.5
Chan
ge P
eriod
(Y+R
c), s
4.04.0
5.55.5
Max G
reen
Sett
ing (G
max),
s30
.04.0
72.5
80.5
Max Q
Clea
r Tim
e (g_
c+I1)
, s14
.03.2
70.5
28.9
Gree
n Ext
Time (
p_c),
s0.5
0.01.8
30.9
Inter
secti
on S
umma
ryHC
M 20
10 C
trl De
lay25
.1HC
M 20
10 LO
SC
Car
mel
Can
ine
Cum
ulat
ive
Plu
s T
ypic
al O
pera
tions
Frid
ay3:
Val
ley
Gre
ens
Driv
e &
Car
mel
Val
ley
Roa
d3/3
/2015
Centr
al Co
ast T
rans
porta
tion C
onsu
lting
Sync
hro 8
Rep
ort
HCM
2010
TW
SC
Inter
secti
onInt
Dela
y, s/v
eh80
.3
Move
ment
EBL
EBT
EBR
WBL
WBT
WBR
NBL
NBT
NBR
SBL
SBT
SBR
Vol, v
eh/h
811
8454
2782
74
500
4511
114
Confl
icting
Ped
s, #/h
r0
00
00
00
00
00
0Si
gn C
ontro
l Fr
eeFr
eeFr
eeFr
eeFr
eeFr
eeSt
opSt
opSt
opSt
opSt
opSt
opRT
Cha
nneli
zed
--
None
--
None
--
None
--
None
Stor
age L
ength
400
-70
210
--
--
--
-60
Veh i
n Med
ian S
torag
e, #
-0
--
0-
-0
--
0-
Grad
e, %
-4
--
2-
-7
--
1-
Peak
Hou
r Fac
tor96
9696
9696
9696
9696
9696
96He
avy V
ehicl
es, %
88
88
88
88
88
88
Mvmt
Flow
812
3356
2886
14
520
4711
115
Major
/Mino
rMa
jor1
Major
2Mi
nor1
Mino
r2Co
nflict
ing F
low A
ll86
60
012
330
021
7021
7212
3321
9321
7086
4
S
tage 1
--
--
--
1250
1250
-92
092
0-
Stag
e 2-
--
--
-92
092
2-
1273
1250
-Cr
itical
Hdwy
4.18
--
4.18
--
8.58
7.98
6.98
7.38
6.78
6.38
Critic
al Hd
wy S
tg 1
--
--
--
7.58
6.98
-6.3
85.7
8-
Critic
al Hd
wy S
tg 2
--
--
--
7.58
6.98
-6.3
85.7
8-
Follo
w-up
Hdw
y2.2
72-
-2.2
72-
-3.5
724.0
723.3
723.5
724.0
723.3
72Po
t Cap
-1 M
aneu
ver
752
--
545
--
~ 14
1916
528
4033
7
S
tage 1
--
--
--
127
146
-30
132
5-
Stag
e 2-
--
--
-22
123
8-
186
222
-Pl
atoon
bloc
ked,
%-
--
-Mo
v Cap
-1 M
aneu
ver
752
--
545
--
~ 13
1816
519
3833
7Mo
v Cap
-2 M
aneu
ver
--
--
--
~ 13
18-
1938
-
S
tage 1
--
--
--
126
144
-29
830
8-
Stag
e 2-
--
--
-20
022
6-
132
220
-
Appr
oach
EBW
BNB
SBHC
M Co
ntrol
Delay
, s0.1
0.4$ 1
829.4
166.1
HCM
LOS
FF
Mino
r Lan
e/Majo
r Mvm
tNB
Ln1
EBL
EBT
EBR
WBL
WBT
WBR
SBLn
1SBL
n2Ca
pacit
y (ve
h/h)
2375
2-
-54
5-
-20
337
HCM
Lane
V/C
Rati
o4.3
030.0
11-
-0.0
52-
-0.6
250.0
43HC
M Co
ntrol
Delay
(s)
$ 182
9.49.8
--
12-
-$ 34
0.916
.2HC
M La
ne LO
SF
A-
-B
--
FC
HCM
95th
%tile
Q(ve
h)12
.50
--
0.2-
-1.7
0.1
Notes
~: V
olume
exce
eds c
apac
ity
$: D
elay e
xcee
ds 30
0s
+: C
ompu
tation
Not
Defin
ed
*: A
ll majo
r volu
me in
plato
on

Pro
ject
aspr
opos
ed,A
M.
No
clas
ses
star
ting
inA
Mpe
akho
ur
Pro
ject
aspr
opos
ed,P
M. No
clas
ses
star
ting
inP
Mpe
akho
ur

Appendix C: Roadway Segment Analysis


HCS 2010: Two-Lane Highways Release 6.60
Phone: Fax:
E-Mail:
_________________Directional Two-Lane Highway Segment Analysis________________
Analyst KP
Agency/Co. CCTC
Date Performed 1/22/2015
Analysis Time Period Existing AM
Highway Highway 1
From/To Ocean/Carmel Valley
Jurisdiction Monterey County
Analysis Year 2014
Description Carmel Canine
__________________________________Input Data__________________________________
Highway class Class 2 Peak hour factor, PHF 0.94
Shoulder width 6.0 ft % Trucks and buses 8 %
Lane width 12.0 ft % Trucks crawling 0.0 %
Segment length 2.4 mi Truck crawl speed 0.0 mi/hr
Terrain type Specific Grade % Recreational vehicles 1 %
Grade: Length 0.25 mi % No-passing zones 100 %
Up/down -6.0 % Access point density 10 /mi
Analysis direction volume, Vd 1623 veh/h
Opposing direction volume, Vo 1576 veh/h
____________________________Average Travel Speed______________________________
Direction Analysis(d) Opposing (o)
PCE for trucks, ET 1.2* 1.2*
PCE for RVs, ER 1.0 1.0
Heavy-vehicle adj. factor,(note-5) fHV 0.984 0.984
Grade adj. factor,(note-1) fg 1.00 1.00
Directional flow rate,(note-2) vi 1754 pc/h 1704 pc/h
Free-Flow Speed from Field Measurement:
Field measured speed,(note-3) S FM - mi/h
Observed total demand,(note-3) V - veh/h
Estimated Free-Flow Speed:
Base free-flow speed,(note-3) BFFS 45.0 mi/h
Adj. for lane and shoulder width,(note-3) fLS 0.0 mi/h
Adj. for access point density,(note-3) fA 2.5 mi/h
Free-flow speed, FFSd 42.5 mi/h
Adjustment for no-passing zones, fnp 0.6 mi/h
Average travel speed, ATSd 15.1 mi/h
Percent Free Flow Speed, PFFS 35.4 %
_________________________Percent Time-Spent-Following_________________________
Direction Analysis(d) Opposing (o)
PCE for trucks, ET 1.0* 1.0*
PCE for RVs, ER 1.0 1.0
Heavy-vehicle adjustment factor, fHV 1.000 1.000
Grade adjustment factor,(note-1) fg 1.00 1.00
Directional flow rate,(note-2) vi 1727 pc/h 1677 pc/h
Base percent time-spent-following,(note-4) BPTSFd 93.5 %
Adjustment for no-passing zones, fnp 6.4
Percent time-spent-following, PTSFd 96.7 %
________________Level of Service and Other Performance Measures_______________
Level of service, LOS F
Volume to capacity ratio, v/c 1.02
Peak 15-min vehicle-miles of travel, VMT15 1036 veh-mi
Peak-hour vehicle-miles of travel, VMT60 3895 veh-mi
Peak 15-min total travel time, TT15 68.8 veh-h
Capacity from ATS, CdATS 0 veh/h
Capacity from PTSF, CdPTSF 1700 veh/h
Directional Capacity 1700 veh/h
_____________________________Passing Lane Analysis____________________________
Total length of analysis segment, Lt 2.4 mi
Length of two-lane highway upstream of the passing lane, Lu - mi
Length of passing lane including tapers, Lpl - mi
Average travel speed, ATSd (from above) 15.1 mi/h
Percent time-spent-following, PTSFd (from above) 96.7
Level of service, LOSd (from above) F
___________________Average Travel Speed with Passing Lane____________________
Downstream length of two-lane highway within effective
length of passing lane for average travel speed, Lde - mi
Length of two-lane highway downstream of effective
length of the passing lane for average travel speed, Ld - mi
Adj. factor for the effect of passing lane
on average speed, fpl -
Average travel speed including passing lane, ATSpl -
Percent free flow speed including passing lane, PFFSpl 0.0 %
________________Percent Time-Spent-Following with Passing Lane________________
Downstream length of two-lane highway within effective length
of passing lane for percent time-spent-following, Lde - mi
Length of two-lane highway downstream of effective length of
the passing lane for percent time-spent-following, Ld - mi
Adj. factor for the effect of passing lane
on percent time-spent-following, fpl -
Percent time-spent-following
including passing lane, PTSFpl - %
______Level of Service and Other Performance Measures with Passing Lane ______
Level of service including passing lane, LOSpl A
Peak 15-min total travel time, TT15 - veh-h
__________________________ Bicycle Level of Service __________________________

Posted speed limit, Sp 55
Percent of segment with occupied on-highway parking 0
Pavement rating, P 3
Flow rate in outside lane, vOL 1726.6
Effective width of outside lane, We 24.00
Effective speed factor, St 4.79
Bicycle LOS Score, BLOS 4.95
Bicycle LOS E
Notes:
1. Note that the adjustment factor for level terrain is 1.00, as level terrain
is one of the base conditions. For the purpose of grade adjustment, specific
dewngrade segments are treated as level terrain.
2. If vi (vd or vo ) >= 1,700 pc/h, terminate analysis-the LOS is F.
3. For the analysis direction only and for v>200 veh/h.
4. For the analysis direction only.
5. Use alternative Exhibit 15-14 if some trucks operate at crawl speeds on a
specific downgrade.
* These items have been entered or edited to override calculated value
HCS 2010: Multilane Highways Release 6.60
Phone: Fax:
E-mail:
___________________________OPERATIONAL ANALYSIS________________________________
Analyst: KP
Agency/Co: CCTC
Date: 12/9/2014
Analysis Period: Existing AM
Highway: Highway 1
From/To: Ocean/Carmel Valley
Jurisdiction: Monterey County
Analysis Year: 2014
Project ID: Carmel Canine
_______________________________FREE-FLOW SPEED_________________________________
Direction 1 2
Lane width 12.0 ft 12.0 ft
Lateral clearance:
Right edge 6.0 ft 6.0 ft
Left edge 6.0 ft 6.0 ft
Total lateral clearance 12.0 ft 12.0 ft
Access points per mile 10 10
Median type Divided Divided
Free-flow speed: Base Base
FFS or BFFS 45.0 mph 45.0 mph
Lane width adjustment, FLW 0.0 mph 0.0 mph
Lateral clearance adjustment, FLC 0.0 mph 0.0 mph
Median type adjustment, FM 0.0 mph 0.0 mph
Access points adjustment, FA 2.5 mph 2.5 mph
Free-flow speed 42.5 mph 42.5 mph
____________________________________VOLUME_____________________________________
Direction 1 2
Volume, V 1576 vph 1623 vph
Peak-hour factor, PHF 0.94 0.94
Peak 15-minute volume, v15 419 432
Trucks and buses 8 % 8 %
Recreational vehicles 1 % 1 %
Terrain type Grade Grade
Grade 6.00 % 6.00 %
Segment length 0.00 mi 0.00 mi
Number of lanes 2 2
Driver population adjustment, fP 1.00 1.00
Trucks and buses PCE, ET 1.5 1.5
Recreational vehicles PCE, ER 4.0 4.0
Heavy vehicle adjustment, fHV 0.935 0.935
Flow rate, vp 896 pcphpl 923 pcphpl
____________________________________RESULTS____________________________________

Direction 1 2
Flow rate, vp 896 pcphpl 923 pcphpl
Free-flow speed, FFS 42.5 mph 42.5 mph
Avg. passenger-car travel speed, S 45.0 mph 45.0 mph
Level of service, LOS C C
Density, D 19.9 pc/mi/ln 20.5 pc/mi/ln
__________________________ Bicycle Level of Service __________________________
Posted speed limit, Sp 55 55
Percent of segment with occupied
on-highway parking 0 0
Pavement rating, P 3 3
Flow rate in outside lane, vOL 838.3 863.3
Effective width of outside lane, We 24.00 24.00
Effective speed factor, St 4.79 4.79
Bicycle LOS Score, BLOS 4.58 4.60
Bicycle LOS E E
Overall results are not computed when free-flow speed is less than 45 mph.
HCS 2010: Two-Lane Highways Release 6.60
Phone: Fax:
E-Mail:
_________________Directional Two-Lane Highway Segment Analysis________________
Analyst KP
Agency/Co. CCTC
Date Performed 1/22/2015
Analysis Time Period Existing PM
Highway Highway 1
From/To Ocean/Carmel Valley
Jurisdiction Monterey County
Analysis Year 2014
Description Carmel Canine
__________________________________Input Data__________________________________
Highway class Class 2 Peak hour factor, PHF 0.94
Shoulder width 6.0 ft % Trucks and buses 8 %
Lane width 12.0 ft % Trucks crawling 0.0 %
Segment length 2.4 mi Truck crawl speed 0.0 mi/hr
Terrain type Specific Grade % Recreational vehicles 1 %
Grade: Length 0.25 mi % No-passing zones 100 %
Up/down -6.0 % Access point density 10 /mi
Analysis direction volume, Vd 1550 veh/h
Opposing direction volume, Vo 1609 veh/h
____________________________Average Travel Speed______________________________
Direction Analysis(d) Opposing (o)
PCE for trucks, ET 1.2* 1.2*
PCE for RVs, ER 1.0 1.0
Heavy-vehicle adj. factor,(note-5) fHV 0.984 0.984
Grade adj. factor,(note-1) fg 1.00 1.00
Directional flow rate,(note-2) vi 1675 pc/h 1740 pc/h
Free-Flow Speed from Field Measurement:
Field measured speed,(note-3) S FM - mi/h
Observed total demand,(note-3) V - veh/h
Estimated Free-Flow Speed:
Base free-flow speed,(note-3) BFFS 45.0 mi/h
Adj. for lane and shoulder width,(note-3) fLS 0.0 mi/h
Adj. for access point density,(note-3) fA 2.5 mi/h
Free-flow speed, FFSd 42.5 mi/h
Adjustment for no-passing zones, fnp 0.6 mi/h
Average travel speed, ATSd 15.4 mi/h
Percent Free Flow Speed, PFFS 36.2 %

_________________________Percent Time-Spent-Following_________________________
Direction Analysis(d) Opposing (o)
PCE for trucks, ET 1.0* 1.0*
PCE for RVs, ER 1.0 1.0
Heavy-vehicle adjustment factor, fHV 1.000 1.000
Grade adjustment factor,(note-1) fg 1.00 1.00
Directional flow rate,(note-2) vi 1649 pc/h 1712 pc/h
Base percent time-spent-following,(note-4) BPTSFd 92.8 %
Adjustment for no-passing zones, fnp 6.5
Percent time-spent-following, PTSFd 96.0 %
________________Level of Service and Other Performance Measures_______________
Level of service, LOS F
Volume to capacity ratio, v/c 0.97
Peak 15-min vehicle-miles of travel, VMT15 989 veh-mi
Peak-hour vehicle-miles of travel, VMT60 3720 veh-mi
Peak 15-min total travel time, TT15 64.2 veh-h
Capacity from ATS, CdATS 1700 veh/h
Capacity from PTSF, CdPTSF 1700 veh/h
Directional Capacity 1700 veh/h
_____________________________Passing Lane Analysis____________________________
Total length of analysis segment, Lt 2.4 mi
Length of two-lane highway upstream of the passing lane, Lu - mi
Length of passing lane including tapers, Lpl - mi
Average travel speed, ATSd (from above) 15.4 mi/h
Percent time-spent-following, PTSFd (from above) 96.0
Level of service, LOSd (from above) F
___________________Average Travel Speed with Passing Lane____________________
Downstream length of two-lane highway within effective
length of passing lane for average travel speed, Lde - mi
Length of two-lane highway downstream of effective
length of the passing lane for average travel speed, Ld - mi
Adj. factor for the effect of passing lane
on average speed, fpl -
Average travel speed including passing lane, ATSpl -
Percent free flow speed including passing lane, PFFSpl 0.0 %
________________Percent Time-Spent-Following with Passing Lane________________
Downstream length of two-lane highway within effective length
of passing lane for percent time-spent-following, Lde - mi
Length of two-lane highway downstream of effective length of
the passing lane for percent time-spent-following, Ld - mi
Adj. factor for the effect of passing lane
on percent time-spent-following, fpl -
Percent time-spent-following
including passing lane, PTSFpl - %
______Level of Service and Other Performance Measures with Passing Lane ______
Level of service including passing lane, LOSpl A
Peak 15-min total travel time, TT15 - veh-h
__________________________ Bicycle Level of Service __________________________
Posted speed limit, Sp 55
Percent of segment with occupied on-highway parking 0
Pavement rating, P 3
Flow rate in outside lane, vOL 1648.9
Effective width of outside lane, We 24.00
Effective speed factor, St 4.79
Bicycle LOS Score, BLOS 4.93
Bicycle LOS E
Notes:
1. Note that the adjustment factor for level terrain is 1.00, as level terrain
is one of the base conditions. For the purpose of grade adjustment, specific
dewngrade segments are treated as level terrain.
2. If vi (vd or vo ) >= 1,700 pc/h, terminate analysis-the LOS is F.
3. For the analysis direction only and for v>200 veh/h.
4. For the analysis direction only.
5. Use alternative Exhibit 15-14 if some trucks operate at crawl speeds on a
specific downgrade.
* These items have been entered or edited to override calculated value

HCS 2010: Multilane Highways Release 6.60
Phone: Fax:
E-mail:
___________________________OPERATIONAL ANALYSIS________________________________
Analyst: KP
Agency/Co: CCTC
Date: 12/9/2014
Analysis Period: Existing PM
Highway: Highway 1
From/To: Ocean/Carmel Valley
Jurisdiction: Monterey County
Analysis Year: 2014
Project ID: Carmel Canine
_______________________________FREE-FLOW SPEED_________________________________
Direction 1 2
Lane width 12.0 ft 12.0 ft
Lateral clearance:
Right edge 6.0 ft 6.0 ft
Left edge 6.0 ft 6.0 ft
Total lateral clearance 12.0 ft 12.0 ft
Access points per mile 10 10
Median type Divided Divided
Free-flow speed: Base Base
FFS or BFFS 45.0 mph 45.0 mph
Lane width adjustment, FLW 0.0 mph 0.0 mph
Lateral clearance adjustment, FLC 0.0 mph 0.0 mph
Median type adjustment, FM 0.0 mph 0.0 mph
Access points adjustment, FA 2.5 mph 2.5 mph
Free-flow speed 42.5 mph 42.5 mph
____________________________________VOLUME_____________________________________
Direction 1 2
Volume, V 1609 vph 1550 vph
Peak-hour factor, PHF 0.97 0.97
Peak 15-minute volume, v15 415 399
Trucks and buses 8 % 8 %
Recreational vehicles 1 % 1 %
Terrain type Grade Grade
Grade 6.00 % 6.00 %
Segment length 0.00 mi 0.00 mi
Number of lanes 2 2
Driver population adjustment, fP 1.00 1.00
Trucks and buses PCE, ET 1.5 1.5
Recreational vehicles PCE, ER 4.0 4.0
Heavy vehicle adjustment, fHV 0.935 0.935
Flow rate, vp 887 pcphpl 854 pcphpl
____________________________________RESULTS____________________________________
Direction 1 2
Flow rate, vp 887 pcphpl 854 pcphpl
Free-flow speed, FFS 42.5 mph 42.5 mph
Avg. passenger-car travel speed, S 45.0 mph 45.0 mph
Level of service, LOS C C
Density, D 19.7 pc/mi/ln 19.0 pc/mi/ln
__________________________ Bicycle Level of Service __________________________
Posted speed limit, Sp 55 55
Percent of segment with occupied
on-highway parking 0 0
Pavement rating, P 3 3
Flow rate in outside lane, vOL 829.4 799.0
Effective width of outside lane, We 24.00 24.00
Effective speed factor, St 4.79 4.79
Bicycle LOS Score, BLOS 4.58 4.56
Bicycle LOS E E
Overall results are not computed when free-flow speed is less than 45 mph.

HCS 2010: Two-Lane Highways Release 6.60
Phone: Fax:
E-Mail:
_________________Directional Two-Lane Highway Segment Analysis________________
Analyst KP
Agency/Co. CCTC
Date Performed 1/22/2015
Analysis Time Period Existing Friday
Highway Highway 1
From/To Ocean/Carmel Valley
Jurisdiction Monterey County
Analysis Year 2014
Description Carmel Canine
__________________________________Input Data__________________________________
Highway class Class 2 Peak hour factor, PHF 0.94
Shoulder width 6.0 ft % Trucks and buses 8 %
Lane width 12.0 ft % Trucks crawling 0.0 %
Segment length 2.4 mi Truck crawl speed 0.0 mi/hr
Terrain type Specific Grade % Recreational vehicles 1 %
Grade: Length 0.25 mi % No-passing zones 100 %
Up/down -6.0 % Access point density 10 /mi
Analysis direction volume, Vd 1380 veh/h
Opposing direction volume, Vo 1666 veh/h
____________________________Average Travel Speed______________________________
Direction Analysis(d) Opposing (o)
PCE for trucks, ET 1.2* 1.2*
PCE for RVs, ER 1.0 1.0
Heavy-vehicle adj. factor,(note-5) fHV 0.984 0.984
Grade adj. factor,(note-1) fg 1.00 1.00
Directional flow rate,(note-2) vi 1492 pc/h 1801 pc/h
Free-Flow Speed from Field Measurement:
Field measured speed,(note-3) S FM - mi/h
Observed total demand,(note-3) V - veh/h
Estimated Free-Flow Speed:
Base free-flow speed,(note-3) BFFS 45.0 mi/h
Adj. for lane and shoulder width,(note-3) fLS 0.0 mi/h
Adj. for access point density,(note-3) fA 2.5 mi/h
Free-flow speed, FFSd 42.5 mi/h
Adjustment for no-passing zones, fnp 0.6 mi/h
Average travel speed, ATSd 16.3 mi/h
Percent Free Flow Speed, PFFS 38.5 %
_________________________Percent Time-Spent-Following_________________________
Direction Analysis(d) Opposing (o)
PCE for trucks, ET 1.0* 1.0*
PCE for RVs, ER 1.0 1.0
Heavy-vehicle adjustment factor, fHV 1.000 1.000
Grade adjustment factor,(note-1) fg 1.00 1.00
Directional flow rate,(note-2) vi 1468 pc/h 1772 pc/h
Base percent time-spent-following,(note-4) BPTSFd 90.9 %
Adjustment for no-passing zones, fnp 8.0
Percent time-spent-following, PTSFd 94.5 %
________________Level of Service and Other Performance Measures_______________
Level of service, LOS F
Volume to capacity ratio, v/c 0.86
Peak 15-min vehicle-miles of travel, VMT15 881 veh-mi
Peak-hour vehicle-miles of travel, VMT60 3312 veh-mi
Peak 15-min total travel time, TT15 53.9 veh-h
Capacity from ATS, CdATS 1700 veh/h
Capacity from PTSF, CdPTSF 1700 veh/h
Directional Capacity 1700 veh/h
_____________________________Passing Lane Analysis____________________________
Total length of analysis segment, Lt 2.4 mi
Length of two-lane highway upstream of the passing lane, Lu - mi
Length of passing lane including tapers, Lpl - mi
Average travel speed, ATSd (from above) 16.3 mi/h
Percent time-spent-following, PTSFd (from above) 94.5
Level of service, LOSd (from above) F
___________________Average Travel Speed with Passing Lane____________________
Downstream length of two-lane highway within effective
length of passing lane for average travel speed, Lde - mi
Length of two-lane highway downstream of effective
length of the passing lane for average travel speed, Ld - mi
Adj. factor for the effect of passing lane
on average speed, fpl -
Average travel speed including passing lane, ATSpl -
Percent free flow speed including passing lane, PFFSpl 0.0 %
________________Percent Time-Spent-Following with Passing Lane________________
Downstream length of two-lane highway within effective length
of passing lane for percent time-spent-following, Lde - mi
Length of two-lane highway downstream of effective length of
the passing lane for percent time-spent-following, Ld - mi
Adj. factor for the effect of passing lane
on percent time-spent-following, fpl -
Percent time-spent-following
including passing lane, PTSFpl - %
______Level of Service and Other Performance Measures with Passing Lane ______
Level of service including passing lane, LOSpl A
Peak 15-min total travel time, TT15 - veh-h
__________________________ Bicycle Level of Service __________________________

Posted speed limit, Sp 55
Percent of segment with occupied on-highway parking 0
Pavement rating, P 3
Flow rate in outside lane, vOL 1468.1
Effective width of outside lane, We 24.00
Effective speed factor, St 4.79
Bicycle LOS Score, BLOS 4.87
Bicycle LOS E
Notes:
1. Note that the adjustment factor for level terrain is 1.00, as level terrain
is one of the base conditions. For the purpose of grade adjustment, specific
dewngrade segments are treated as level terrain.
2. If vi (vd or vo ) >= 1,700 pc/h, terminate analysis-the LOS is F.
3. For the analysis direction only and for v>200 veh/h.
4. For the analysis direction only.
5. Use alternative Exhibit 15-14 if some trucks operate at crawl speeds on a
specific downgrade.
* These items have been entered or edited to override calculated value
HCS 2010: Multilane Highways Release 6.60
Phone: Fax:
E-mail:
___________________________OPERATIONAL ANALYSIS________________________________
Analyst: KP
Agency/Co: CCTC
Date: 12/30/2014
Analysis Period: Existing Friday
Highway: Highway 1
From/To: Ocean/Carmel Valley
Jurisdiction: Monterey County
Analysis Year: 2014
Project ID: Carmel Canine
_______________________________FREE-FLOW SPEED_________________________________
Direction 1 2
Lane width 12.0 ft 12.0 ft
Lateral clearance:
Right edge 6.0 ft 6.0 ft
Left edge 6.0 ft 6.0 ft
Total lateral clearance 12.0 ft 12.0 ft
Access points per mile 10 10
Median type Divided Divided
Free-flow speed: Base Base
FFS or BFFS 45.0 mph 45.0 mph
Lane width adjustment, FLW 0.0 mph 0.0 mph
Lateral clearance adjustment, FLC 0.0 mph 0.0 mph
Median type adjustment, FM 0.0 mph 0.0 mph
Access points adjustment, FA 2.5 mph 2.5 mph
Free-flow speed 42.5 mph 42.5 mph
____________________________________VOLUME_____________________________________
Direction 1 2
Volume, V 1666 vph 1380 vph
Peak-hour factor, PHF 0.97 0.97
Peak 15-minute volume, v15 429 356
Trucks and buses 8 % 8 %
Recreational vehicles 1 % 1 %
Terrain type Grade Grade
Grade 6.00 % 6.00 %
Segment length 0.00 mi 0.00 mi
Number of lanes 2 2
Driver population adjustment, fP 1.00 1.00
Trucks and buses PCE, ET 1.5 1.5
Recreational vehicles PCE, ER 4.0 4.0
Heavy vehicle adjustment, fHV 0.935 0.935
Flow rate, vp 918 pcphpl 761 pcphpl
____________________________________RESULTS____________________________________

Direction 1 2
Flow rate, vp 918 pcphpl 761 pcphpl
Free-flow speed, FFS 42.5 mph 42.5 mph
Avg. passenger-car travel speed, S 45.0 mph 45.0 mph
Level of service, LOS C B
Density, D 20.4 pc/mi/ln 16.9 pc/mi/ln
__________________________ Bicycle Level of Service __________________________
Posted speed limit, Sp 55 55
Percent of segment with occupied
on-highway parking 0 0
Pavement rating, P 3 3
Flow rate in outside lane, vOL 858.8 711.3
Effective width of outside lane, We 24.00 24.00
Effective speed factor, St 4.79 4.79
Bicycle LOS Score, BLOS 4.60 4.50
Bicycle LOS E E
Overall results are not computed when free-flow speed is less than 45 mph.
HCS 2010: Two-Lane Highways Release 6.60
Phone: Fax:
E-Mail:
_________________Directional Two-Lane Highway Segment Analysis________________
Analyst KP
Agency/Co. CCTC
Date Performed 1/22/2015
Analysis Time Period Existing Sunday
Highway Highway 1
From/To Ocean/Carmel Valley
Jurisdiction Monterey County
Analysis Year 2014
Description Carmel Canine
__________________________________Input Data__________________________________
Highway class Class 2 Peak hour factor, PHF 0.94
Shoulder width 6.0 ft % Trucks and buses 8 %
Lane width 12.0 ft % Trucks crawling 0.0 %
Segment length 2.4 mi Truck crawl speed 0.0 mi/hr
Terrain type Specific Grade % Recreational vehicles 1 %
Grade: Length 0.25 mi % No-passing zones 100 %
Up/down -6.0 % Access point density 10 /mi
Analysis direction volume, Vd 1245 veh/h
Opposing direction volume, Vo 1283 veh/h
____________________________Average Travel Speed______________________________
Direction Analysis(d) Opposing (o)
PCE for trucks, ET 1.2* 1.2*
PCE for RVs, ER 1.0 1.0
Heavy-vehicle adj. factor,(note-5) fHV 0.984 0.984
Grade adj. factor,(note-1) fg 1.00 1.00
Directional flow rate,(note-2) vi 1346 pc/h 1387 pc/h
Free-Flow Speed from Field Measurement:
Field measured speed,(note-3) S FM - mi/h
Observed total demand,(note-3) V - veh/h
Estimated Free-Flow Speed:
Base free-flow speed,(note-3) BFFS 45.0 mi/h
Adj. for lane and shoulder width,(note-3) fLS 0.0 mi/h
Adj. for access point density,(note-3) fA 2.5 mi/h
Free-flow speed, FFSd 42.5 mi/h
Adjustment for no-passing zones, fnp 0.7 mi/h
Average travel speed, ATSd 20.6 mi/h
Percent Free Flow Speed, PFFS 48.4 %

_________________________Percent Time-Spent-Following_________________________
Direction Analysis(d) Opposing (o)
PCE for trucks, ET 1.0* 1.0*
PCE for RVs, ER 1.0 1.0
Heavy-vehicle adjustment factor, fHV 1.000 1.000
Grade adjustment factor,(note-1) fg 1.00 1.00
Directional flow rate,(note-2) vi 1324 pc/h 1365 pc/h
Base percent time-spent-following,(note-4) BPTSFd 87.7 %
Adjustment for no-passing zones, fnp 9.7
Percent time-spent-following, PTSFd 92.5 %
________________Level of Service and Other Performance Measures_______________
Level of service, LOS E
Volume to capacity ratio, v/c 0.78
Peak 15-min vehicle-miles of travel, VMT15 795 veh-mi
Peak-hour vehicle-miles of travel, VMT60 2988 veh-mi
Peak 15-min total travel time, TT15 38.6 veh-h
Capacity from ATS, CdATS 1700 veh/h
Capacity from PTSF, CdPTSF 1700 veh/h
Directional Capacity 1700 veh/h
_____________________________Passing Lane Analysis____________________________
Total length of analysis segment, Lt 2.4 mi
Length of two-lane highway upstream of the passing lane, Lu - mi
Length of passing lane including tapers, Lpl - mi
Average travel speed, ATSd (from above) 20.6 mi/h
Percent time-spent-following, PTSFd (from above) 92.5
Level of service, LOSd (from above) E
___________________Average Travel Speed with Passing Lane____________________
Downstream length of two-lane highway within effective
length of passing lane for average travel speed, Lde - mi
Length of two-lane highway downstream of effective
length of the passing lane for average travel speed, Ld - mi
Adj. factor for the effect of passing lane
on average speed, fpl -
Average travel speed including passing lane, ATSpl -
Percent free flow speed including passing lane, PFFSpl 0.0 %
________________Percent Time-Spent-Following with Passing Lane________________
Downstream length of two-lane highway within effective length
of passing lane for percent time-spent-following, Lde - mi
Length of two-lane highway downstream of effective length of
the passing lane for percent time-spent-following, Ld - mi
Adj. factor for the effect of passing lane
on percent time-spent-following, fpl -
Percent time-spent-following
including passing lane, PTSFpl - %
______Level of Service and Other Performance Measures with Passing Lane ______
Level of service including passing lane, LOSpl A
Peak 15-min total travel time, TT15 - veh-h
__________________________ Bicycle Level of Service __________________________
Posted speed limit, Sp 55
Percent of segment with occupied on-highway parking 0
Pavement rating, P 3
Flow rate in outside lane, vOL 1324.5
Effective width of outside lane, We 24.00
Effective speed factor, St 4.79
Bicycle LOS Score, BLOS 4.82
Bicycle LOS E
Notes:
1. Note that the adjustment factor for level terrain is 1.00, as level terrain
is one of the base conditions. For the purpose of grade adjustment, specific
dewngrade segments are treated as level terrain.
2. If vi (vd or vo ) >= 1,700 pc/h, terminate analysis-the LOS is F.
3. For the analysis direction only and for v>200 veh/h.
4. For the analysis direction only.
5. Use alternative Exhibit 15-14 if some trucks operate at crawl speeds on a
specific downgrade.
* These items have been entered or edited to override calculated value

HCS 2010: Multilane Highways Release 6.60
Phone: Fax:
E-mail:
___________________________OPERATIONAL ANALYSIS________________________________
Analyst: KP
Agency/Co: CCTC
Date: 12/30/2014
Analysis Period: Existing Sunday
Highway: Highway 1
From/To: Ocean/Carmel Valley
Jurisdiction: Monterey County
Analysis Year: 2014
Project ID: Carmel Canine
_______________________________FREE-FLOW SPEED_________________________________
Direction 1 2
Lane width 12.0 ft 12.0 ft
Lateral clearance:
Right edge 6.0 ft 6.0 ft
Left edge 6.0 ft 6.0 ft
Total lateral clearance 12.0 ft 12.0 ft
Access points per mile 10 10
Median type Divided Divided
Free-flow speed: Base Base
FFS or BFFS 45.0 mph 45.0 mph
Lane width adjustment, FLW 0.0 mph 0.0 mph
Lateral clearance adjustment, FLC 0.0 mph 0.0 mph
Median type adjustment, FM 0.0 mph 0.0 mph
Access points adjustment, FA 2.5 mph 2.5 mph
Free-flow speed 42.5 mph 42.5 mph
____________________________________VOLUME_____________________________________
Direction 1 2
Volume, V 1283 vph 1245 vph
Peak-hour factor, PHF 0.94 0.94
Peak 15-minute volume, v15 341 331
Trucks and buses 8 % 8 %
Recreational vehicles 1 % 1 %
Terrain type Grade Grade
Grade 6.00 % 6.00 %
Segment length 0.00 mi 0.00 mi
Number of lanes 2 2
Driver population adjustment, fP 1.00 1.00
Trucks and buses PCE, ET 1.5 1.5
Recreational vehicles PCE, ER 4.0 4.0
Heavy vehicle adjustment, fHV 0.935 0.935
Flow rate, vp 730 pcphpl 708 pcphpl
____________________________________RESULTS____________________________________
Direction 1 2
Flow rate, vp 730 pcphpl 708 pcphpl
Free-flow speed, FFS 42.5 mph 42.5 mph
Avg. passenger-car travel speed, S 45.0 mph 45.0 mph
Level of service, LOS B B
Density, D 16.2 pc/mi/ln 15.7 pc/mi/ln
__________________________ Bicycle Level of Service __________________________
Posted speed limit, Sp 55 55
Percent of segment with occupied
on-highway parking 0 0
Pavement rating, P 3 3
Flow rate in outside lane, vOL 682.4 662.2
Effective width of outside lane, We 24.00 24.00
Effective speed factor, St 4.79 4.79
Bicycle LOS Score, BLOS 4.48 4.46
Bicycle LOS D D
Overall results are not computed when free-flow speed is less than 45 mph.

HCS 2010: Two-Lane Highways Release 6.60
Phone: Fax:
E-Mail:
_________________Directional Two-Lane Highway Segment Analysis________________
Analyst KP
Agency/Co. CCTC
Date Performed 1/22/2015
Analysis Time Period Existing Plus Project AM
Highway Highway 1
From/To Ocean/Carmel Valley
Jurisdiction Monterey County
Analysis Year 2014
Description Carmel Canine
__________________________________Input Data__________________________________
Highway class Class 2 Peak hour factor, PHF 0.94
Shoulder width 6.0 ft % Trucks and buses 8 %
Lane width 12.0 ft % Trucks crawling 0.0 %
Segment length 2.4 mi Truck crawl speed 0.0 mi/hr
Terrain type Specific Grade % Recreational vehicles 1 %
Grade: Length 0.25 mi % No-passing zones 100 %
Up/down -6.0 % Access point density 10 /mi
Analysis direction volume, Vd 1646 veh/h
Opposing direction volume, Vo 1596 veh/h
____________________________Average Travel Speed______________________________
Direction Analysis(d) Opposing (o)
PCE for trucks, ET 1.2* 1.2*
PCE for RVs, ER 1.0 1.0
Heavy-vehicle adj. factor,(note-5) fHV 0.984 0.984
Grade adj. factor,(note-1) fg 1.00 1.00
Directional flow rate,(note-2) vi 1779 pc/h 1725 pc/h
Free-Flow Speed from Field Measurement:
Field measured speed,(note-3) S FM - mi/h
Observed total demand,(note-3) V - veh/h
Estimated Free-Flow Speed:
Base free-flow speed,(note-3) BFFS 45.0 mi/h
Adj. for lane and shoulder width,(note-3) fLS 0.0 mi/h
Adj. for access point density,(note-3) fA 2.5 mi/h
Free-flow speed, FFSd 42.5 mi/h
Adjustment for no-passing zones, fnp 0.6 mi/h
Average travel speed, ATSd 14.7 mi/h
Percent Free Flow Speed, PFFS 34.6 %
_________________________Percent Time-Spent-Following_________________________
Direction Analysis(d) Opposing (o)
PCE for trucks, ET 1.0* 1.0*
PCE for RVs, ER 1.0 1.0
Heavy-vehicle adjustment factor, fHV 1.000 1.000
Grade adjustment factor,(note-1) fg 1.00 1.00
Directional flow rate,(note-2) vi 1751 pc/h 1698 pc/h
Base percent time-spent-following,(note-4) BPTSFd 93.7 %
Adjustment for no-passing zones, fnp 6.4
Percent time-spent-following, PTSFd 96.9 %
________________Level of Service and Other Performance Measures_______________
Level of service, LOS F
Volume to capacity ratio, v/c 1.03
Peak 15-min vehicle-miles of travel, VMT15 1051 veh-mi
Peak-hour vehicle-miles of travel, VMT60 3950 veh-mi
Peak 15-min total travel time, TT15 71.5 veh-h
Capacity from ATS, CdATS 0 veh/h
Capacity from PTSF, CdPTSF 1700 veh/h
Directional Capacity 1700 veh/h
_____________________________Passing Lane Analysis____________________________
Total length of analysis segment, Lt 2.4 mi
Length of two-lane highway upstream of the passing lane, Lu - mi
Length of passing lane including tapers, Lpl - mi
Average travel speed, ATSd (from above) 14.7 mi/h
Percent time-spent-following, PTSFd (from above) 96.9
Level of service, LOSd (from above) F
___________________Average Travel Speed with Passing Lane____________________
Downstream length of two-lane highway within effective
length of passing lane for average travel speed, Lde - mi
Length of two-lane highway downstream of effective
length of the passing lane for average travel speed, Ld - mi
Adj. factor for the effect of passing lane
on average speed, fpl -
Average travel speed including passing lane, ATSpl -
Percent free flow speed including passing lane, PFFSpl 0.0 %
________________Percent Time-Spent-Following with Passing Lane________________
Downstream length of two-lane highway within effective length
of passing lane for percent time-spent-following, Lde - mi
Length of two-lane highway downstream of effective length of
the passing lane for percent time-spent-following, Ld - mi
Adj. factor for the effect of passing lane
on percent time-spent-following, fpl -
Percent time-spent-following
including passing lane, PTSFpl - %
______Level of Service and Other Performance Measures with Passing Lane ______
Level of service including passing lane, LOSpl A
Peak 15-min total travel time, TT15 - veh-h
__________________________ Bicycle Level of Service __________________________

Posted speed limit, Sp 55
Percent of segment with occupied on-highway parking 0
Pavement rating, P 3
Flow rate in outside lane, vOL 1751.1
Effective width of outside lane, We 24.00
Effective speed factor, St 4.79
Bicycle LOS Score, BLOS 4.96
Bicycle LOS E
Notes:
1. Note that the adjustment factor for level terrain is 1.00, as level terrain
is one of the base conditions. For the purpose of grade adjustment, specific
dewngrade segments are treated as level terrain.
2. If vi (vd or vo ) >= 1,700 pc/h, terminate analysis-the LOS is F.
3. For the analysis direction only and for v>200 veh/h.
4. For the analysis direction only.
5. Use alternative Exhibit 15-14 if some trucks operate at crawl speeds on a
specific downgrade.
* These items have been entered or edited to override calculated value
HCS 2010: Multilane Highways Release 6.60
Phone: Fax:
E-mail:
___________________________OPERATIONAL ANALYSIS________________________________
Analyst: KP
Agency/Co: CCTC
Date: 1/2/2015
Analysis Period: Existing Plus Project AM
Highway: Highway 1
From/To: Ocean/Carmel Valley
Jurisdiction: Monterey County
Analysis Year: 2014
Project ID: Carmel Canine
_______________________________FREE-FLOW SPEED_________________________________
Direction 1 2
Lane width 12.0 ft 12.0 ft
Lateral clearance:
Right edge 6.0 ft 6.0 ft
Left edge 6.0 ft 6.0 ft
Total lateral clearance 12.0 ft 12.0 ft
Access points per mile 10 10
Median type Divided Divided
Free-flow speed: Base Base
FFS or BFFS 45.0 mph 45.0 mph
Lane width adjustment, FLW 0.0 mph 0.0 mph
Lateral clearance adjustment, FLC 0.0 mph 0.0 mph
Median type adjustment, FM 0.0 mph 0.0 mph
Access points adjustment, FA 2.5 mph 2.5 mph
Free-flow speed 42.5 mph 42.5 mph
____________________________________VOLUME_____________________________________
Direction 1 2
Volume, V 1596 vph 1646 vph
Peak-hour factor, PHF 0.94 0.94
Peak 15-minute volume, v15 424 438
Trucks and buses 8 % 8 %
Recreational vehicles 1 % 1 %
Terrain type Grade Grade
Grade 6.00 % 6.00 %
Segment length 0.00 mi 0.00 mi
Number of lanes 2 2
Driver population adjustment, fP 1.00 1.00
Trucks and buses PCE, ET 1.5 1.5
Recreational vehicles PCE, ER 4.0 4.0
Heavy vehicle adjustment, fHV 0.935 0.935
Flow rate, vp 908 pcphpl 936 pcphpl
____________________________________RESULTS____________________________________

Direction 1 2
Flow rate, vp 908 pcphpl 936 pcphpl
Free-flow speed, FFS 42.5 mph 42.5 mph
Avg. passenger-car travel speed, S 45.0 mph 45.0 mph
Level of service, LOS C C
Density, D 20.2 pc/mi/ln 20.8 pc/mi/ln
__________________________ Bicycle Level of Service __________________________
Posted speed limit, Sp 55 55
Percent of segment with occupied
on-highway parking 0 0
Pavement rating, P 3 3
Flow rate in outside lane, vOL 848.9 875.5
Effective width of outside lane, We 24.00 24.00
Effective speed factor, St 4.79 4.79
Bicycle LOS Score, BLOS 4.59 4.61
Bicycle LOS E E
Overall results are not computed when free-flow speed is less than 45 mph.
HCS 2010: Two-Lane Highways Release 6.60
Phone: Fax:
E-Mail:
_________________Directional Two-Lane Highway Segment Analysis________________
Analyst KP
Agency/Co. CCTC
Date Performed 1/22/2015
Analysis Time Period Existing Plus Project PM
Highway Highway 1
From/To Ocean/Carmel Valley
Jurisdiction Monterey County
Analysis Year 2014
Description Carmel Canine
__________________________________Input Data__________________________________
Highway class Class 2 Peak hour factor, PHF 0.94
Shoulder width 6.0 ft % Trucks and buses 8 %
Lane width 12.0 ft % Trucks crawling 0.0 %
Segment length 2.4 mi Truck crawl speed 0.0 mi/hr
Terrain type Specific Grade % Recreational vehicles 1 %
Grade: Length 0.25 mi % No-passing zones 100 %
Up/down -6.0 % Access point density 10 /mi
Analysis direction volume, Vd 1570 veh/h
Opposing direction volume, Vo 1632 veh/h
____________________________Average Travel Speed______________________________
Direction Analysis(d) Opposing (o)
PCE for trucks, ET 1.2* 1.2*
PCE for RVs, ER 1.0 1.0
Heavy-vehicle adj. factor,(note-5) fHV 0.984 0.984
Grade adj. factor,(note-1) fg 1.00 1.00
Directional flow rate,(note-2) vi 1697 pc/h 1764 pc/h
Free-Flow Speed from Field Measurement:
Field measured speed,(note-3) S FM - mi/h
Observed total demand,(note-3) V - veh/h
Estimated Free-Flow Speed:
Base free-flow speed,(note-3) BFFS 45.0 mi/h
Adj. for lane and shoulder width,(note-3) fLS 0.0 mi/h
Adj. for access point density,(note-3) fA 2.5 mi/h
Free-flow speed, FFSd 42.5 mi/h
Adjustment for no-passing zones, fnp 0.6 mi/h
Average travel speed, ATSd 15.0 mi/h
Percent Free Flow Speed, PFFS 35.4 %

_________________________Percent Time-Spent-Following_________________________
Direction Analysis(d) Opposing (o)
PCE for trucks, ET 1.0* 1.0*
PCE for RVs, ER 1.0 1.0
Heavy-vehicle adjustment factor, fHV 1.000 1.000
Grade adjustment factor,(note-1) fg 1.00 1.00
Directional flow rate,(note-2) vi 1670 pc/h 1736 pc/h
Base percent time-spent-following,(note-4) BPTSFd 93.0 %
Adjustment for no-passing zones, fnp 6.5
Percent time-spent-following, PTSFd 96.2 %
________________Level of Service and Other Performance Measures_______________
Level of service, LOS F
Volume to capacity ratio, v/c 0.98
Peak 15-min vehicle-miles of travel, VMT15 1002 veh-mi
Peak-hour vehicle-miles of travel, VMT60 3768 veh-mi
Peak 15-min total travel time, TT15 66.6 veh-h
Capacity from ATS, CdATS 1700 veh/h
Capacity from PTSF, CdPTSF 1700 veh/h
Directional Capacity 1700 veh/h
_____________________________Passing Lane Analysis____________________________
Total length of analysis segment, Lt 2.4 mi
Length of two-lane highway upstream of the passing lane, Lu - mi
Length of passing lane including tapers, Lpl - mi
Average travel speed, ATSd (from above) 15.0 mi/h
Percent time-spent-following, PTSFd (from above) 96.2
Level of service, LOSd (from above) F
___________________Average Travel Speed with Passing Lane____________________
Downstream length of two-lane highway within effective
length of passing lane for average travel speed, Lde - mi
Length of two-lane highway downstream of effective
length of the passing lane for average travel speed, Ld - mi
Adj. factor for the effect of passing lane
on average speed, fpl -
Average travel speed including passing lane, ATSpl -
Percent free flow speed including passing lane, PFFSpl 0.0 %
________________Percent Time-Spent-Following with Passing Lane________________
Downstream length of two-lane highway within effective length
of passing lane for percent time-spent-following, Lde - mi
Length of two-lane highway downstream of effective length of
the passing lane for percent time-spent-following, Ld - mi
Adj. factor for the effect of passing lane
on percent time-spent-following, fpl -
Percent time-spent-following
including passing lane, PTSFpl - %
______Level of Service and Other Performance Measures with Passing Lane ______
Level of service including passing lane, LOSpl A
Peak 15-min total travel time, TT15 - veh-h
__________________________ Bicycle Level of Service __________________________
Posted speed limit, Sp 55
Percent of segment with occupied on-highway parking 0
Pavement rating, P 3
Flow rate in outside lane, vOL 1670.2
Effective width of outside lane, We 24.00
Effective speed factor, St 4.79
Bicycle LOS Score, BLOS 4.93
Bicycle LOS E
Notes:
1. Note that the adjustment factor for level terrain is 1.00, as level terrain
is one of the base conditions. For the purpose of grade adjustment, specific
dewngrade segments are treated as level terrain.
2. If vi (vd or vo ) >= 1,700 pc/h, terminate analysis-the LOS is F.
3. For the analysis direction only and for v>200 veh/h.
4. For the analysis direction only.
5. Use alternative Exhibit 15-14 if some trucks operate at crawl speeds on a
specific downgrade.
* These items have been entered or edited to override calculated value

HCS 2010: Multilane Highways Release 6.60
Phone: Fax:
E-mail:
___________________________OPERATIONAL ANALYSIS________________________________
Analyst: KP
Agency/Co: CCTC
Date: 1/2/2015
Analysis Period: Existing Plus Project PM
Highway: Highway 1
From/To: Ocean/Carmel Valley
Jurisdiction: Monterey County
Analysis Year: 2014
Project ID: Carmel Canine
_______________________________FREE-FLOW SPEED_________________________________
Direction 1 2
Lane width 12.0 ft 12.0 ft
Lateral clearance:
Right edge 6.0 ft 6.0 ft
Left edge 6.0 ft 6.0 ft
Total lateral clearance 12.0 ft 12.0 ft
Access points per mile 10 10
Median type Divided Divided
Free-flow speed: Base Base
FFS or BFFS 45.0 mph 45.0 mph
Lane width adjustment, FLW 0.0 mph 0.0 mph
Lateral clearance adjustment, FLC 0.0 mph 0.0 mph
Median type adjustment, FM 0.0 mph 0.0 mph
Access points adjustment, FA 2.5 mph 2.5 mph
Free-flow speed 42.5 mph 42.5 mph
____________________________________VOLUME_____________________________________
Direction 1 2
Volume, V 1632 vph 1570 vph
Peak-hour factor, PHF 0.97 0.97
Peak 15-minute volume, v15 421 405
Trucks and buses 8 % 8 %
Recreational vehicles 1 % 1 %
Terrain type Grade Grade
Grade 6.00 % 6.00 %
Segment length 0.00 mi 0.00 mi
Number of lanes 2 2
Driver population adjustment, fP 1.00 1.00
Trucks and buses PCE, ET 1.5 1.5
Recreational vehicles PCE, ER 4.0 4.0
Heavy vehicle adjustment, fHV 0.935 0.935
Flow rate, vp 900 pcphpl 865 pcphpl
____________________________________RESULTS____________________________________
Direction 1 2
Flow rate, vp 900 pcphpl 865 pcphpl
Free-flow speed, FFS 42.5 mph 42.5 mph
Avg. passenger-car travel speed, S 45.0 mph 45.0 mph
Level of service, LOS C C
Density, D 20.0 pc/mi/ln 19.2 pc/mi/ln
__________________________ Bicycle Level of Service __________________________
Posted speed limit, Sp 55 55
Percent of segment with occupied
on-highway parking 0 0
Pavement rating, P 3 3
Flow rate in outside lane, vOL 841.2 809.3
Effective width of outside lane, We 24.00 24.00
Effective speed factor, St 4.79 4.79
Bicycle LOS Score, BLOS 4.59 4.57
Bicycle LOS E E
Overall results are not computed when free-flow speed is less than 45 mph.

HCS 2010: Two-Lane Highways Release 6.60
Phone: Fax:
E-Mail:
_________________Directional Two-Lane Highway Segment Analysis________________
Analyst KP
Agency/Co. CCTC
Date Performed 1/22/2015
Analysis Time Period Existing Plus Project Friday
Highway Highway 1
From/To Ocean/Carmel Valley
Jurisdiction Monterey County
Analysis Year 2014
Description Carmel Canine
__________________________________Input Data__________________________________
Highway class Class 2 Peak hour factor, PHF 0.94
Shoulder width 6.0 ft % Trucks and buses 8 %
Lane width 12.0 ft % Trucks crawling 0.0 %
Segment length 2.4 mi Truck crawl speed 0.0 mi/hr
Terrain type Specific Grade % Recreational vehicles 1 %
Grade: Length 0.25 mi % No-passing zones 100 %
Up/down -6.0 % Access point density 10 /mi
Analysis direction volume, Vd 1402 veh/h
Opposing direction volume, Vo 1709 veh/h
____________________________Average Travel Speed______________________________
Direction Analysis(d) Opposing (o)
PCE for trucks, ET 1.2* 1.2*
PCE for RVs, ER 1.0 1.0
Heavy-vehicle adj. factor,(note-5) fHV 0.984 0.984
Grade adj. factor,(note-1) fg 1.00 1.00
Directional flow rate,(note-2) vi 1515 pc/h 1848 pc/h
Free-Flow Speed from Field Measurement:
Field measured speed,(note-3) S FM - mi/h
Observed total demand,(note-3) V - veh/h
Estimated Free-Flow Speed:
Base free-flow speed,(note-3) BFFS 45.0 mi/h
Adj. for lane and shoulder width,(note-3) fLS 0.0 mi/h
Adj. for access point density,(note-3) fA 2.5 mi/h
Free-flow speed, FFSd 42.5 mi/h
Adjustment for no-passing zones, fnp 0.6 mi/h
Average travel speed, ATSd 15.8 mi/h
Percent Free Flow Speed, PFFS 37.2 %
_________________________Percent Time-Spent-Following_________________________
Direction Analysis(d) Opposing (o)
PCE for trucks, ET 1.0* 1.0*
PCE for RVs, ER 1.0 1.0
Heavy-vehicle adjustment factor, fHV 1.000 1.000
Grade adjustment factor,(note-1) fg 1.00 1.00
Directional flow rate,(note-2) vi 1491 pc/h 1818 pc/h
Base percent time-spent-following,(note-4) BPTSFd 91.2 %
Adjustment for no-passing zones, fnp 8.1
Percent time-spent-following, PTSFd 94.8 %
________________Level of Service and Other Performance Measures_______________
Level of service, LOS F
Volume to capacity ratio, v/c 0.88
Peak 15-min vehicle-miles of travel, VMT15 895 veh-mi
Peak-hour vehicle-miles of travel, VMT60 3365 veh-mi
Peak 15-min total travel time, TT15 56.6 veh-h
Capacity from ATS, CdATS 1700 veh/h
Capacity from PTSF, CdPTSF 1700 veh/h
Directional Capacity 1700 veh/h
_____________________________Passing Lane Analysis____________________________
Total length of analysis segment, Lt 2.4 mi
Length of two-lane highway upstream of the passing lane, Lu - mi
Length of passing lane including tapers, Lpl - mi
Average travel speed, ATSd (from above) 15.8 mi/h
Percent time-spent-following, PTSFd (from above) 94.8
Level of service, LOSd (from above) F
___________________Average Travel Speed with Passing Lane____________________
Downstream length of two-lane highway within effective
length of passing lane for average travel speed, Lde - mi
Length of two-lane highway downstream of effective
length of the passing lane for average travel speed, Ld - mi
Adj. factor for the effect of passing lane
on average speed, fpl -
Average travel speed including passing lane, ATSpl -
Percent free flow speed including passing lane, PFFSpl 0.0 %
________________Percent Time-Spent-Following with Passing Lane________________
Downstream length of two-lane highway within effective length
of passing lane for percent time-spent-following, Lde - mi
Length of two-lane highway downstream of effective length of
the passing lane for percent time-spent-following, Ld - mi
Adj. factor for the effect of passing lane
on percent time-spent-following, fpl -
Percent time-spent-following
including passing lane, PTSFpl - %
______Level of Service and Other Performance Measures with Passing Lane ______
Level of service including passing lane, LOSpl A
Peak 15-min total travel time, TT15 - veh-h
__________________________ Bicycle Level of Service __________________________
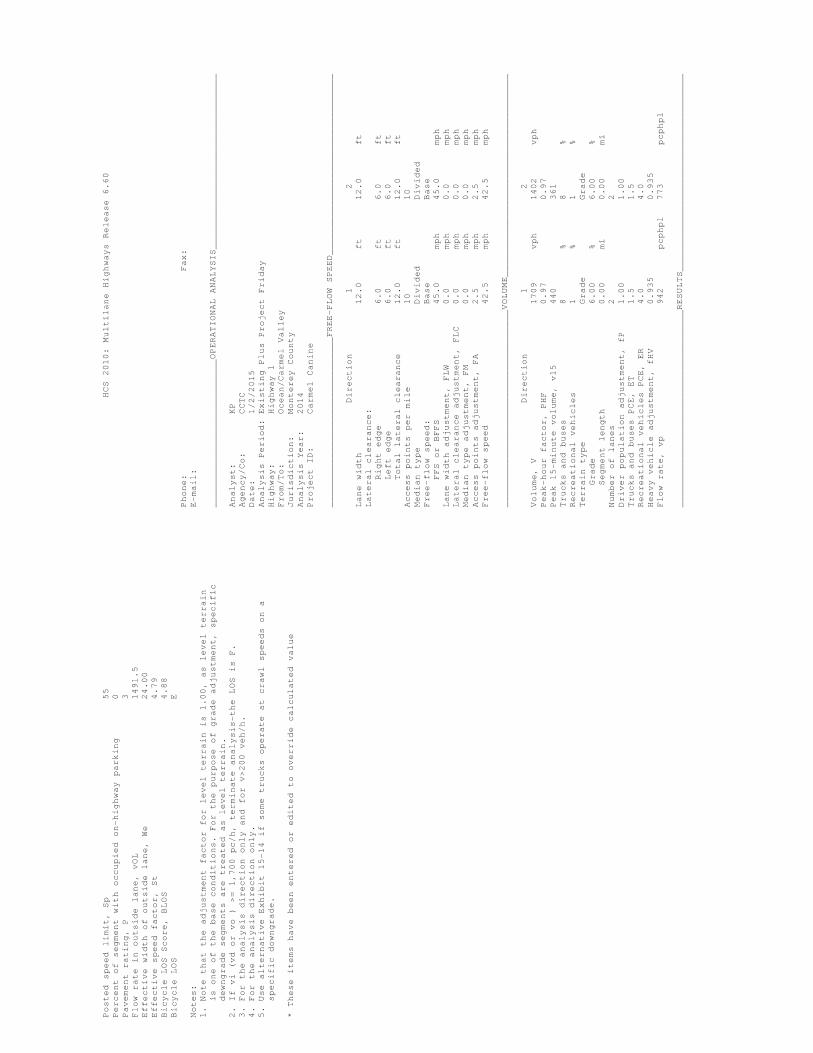
Posted speed limit, Sp 55
Percent of segment with occupied on-highway parking 0
Pavement rating, P 3
Flow rate in outside lane, vOL 1491.5
Effective width of outside lane, We 24.00
Effective speed factor, St 4.79
Bicycle LOS Score, BLOS 4.88
Bicycle LOS E
Notes:
1. Note that the adjustment factor for level terrain is 1.00, as level terrain
is one of the base conditions. For the purpose of grade adjustment, specific
dewngrade segments are treated as level terrain.
2. If vi (vd or vo ) >= 1,700 pc/h, terminate analysis-the LOS is F.
3. For the analysis direction only and for v>200 veh/h.
4. For the analysis direction only.
5. Use alternative Exhibit 15-14 if some trucks operate at crawl speeds on a
specific downgrade.
* These items have been entered or edited to override calculated value
HCS 2010: Multilane Highways Release 6.60
Phone: Fax:
E-mail:
___________________________OPERATIONAL ANALYSIS________________________________
Analyst: KP
Agency/Co: CCTC
Date: 1/2/2015
Analysis Period: Existing Plus Project Friday
Highway: Highway 1
From/To: Ocean/Carmel Valley
Jurisdiction: Monterey County
Analysis Year: 2014
Project ID: Carmel Canine
_______________________________FREE-FLOW SPEED_________________________________
Direction 1 2
Lane width 12.0 ft 12.0 ft
Lateral clearance:
Right edge 6.0 ft 6.0 ft
Left edge 6.0 ft 6.0 ft
Total lateral clearance 12.0 ft 12.0 ft
Access points per mile 10 10
Median type Divided Divided
Free-flow speed: Base Base
FFS or BFFS 45.0 mph 45.0 mph
Lane width adjustment, FLW 0.0 mph 0.0 mph
Lateral clearance adjustment, FLC 0.0 mph 0.0 mph
Median type adjustment, FM 0.0 mph 0.0 mph
Access points adjustment, FA 2.5 mph 2.5 mph
Free-flow speed 42.5 mph 42.5 mph
____________________________________VOLUME_____________________________________
Direction 1 2
Volume, V 1709 vph 1402 vph
Peak-hour factor, PHF 0.97 0.97
Peak 15-minute volume, v15 440 361
Trucks and buses 8 % 8 %
Recreational vehicles 1 % 1 %
Terrain type Grade Grade
Grade 6.00 % 6.00 %
Segment length 0.00 mi 0.00 mi
Number of lanes 2 2
Driver population adjustment, fP 1.00 1.00
Trucks and buses PCE, ET 1.5 1.5
Recreational vehicles PCE, ER 4.0 4.0
Heavy vehicle adjustment, fHV 0.935 0.935
Flow rate, vp 942 pcphpl 773 pcphpl
____________________________________RESULTS____________________________________

Direction 1 2
Flow rate, vp 942 pcphpl 773 pcphpl
Free-flow speed, FFS 42.5 mph 42.5 mph
Avg. passenger-car travel speed, S 45.0 mph 45.0 mph
Level of service, LOS C B
Density, D 20.9 pc/mi/ln 17.2 pc/mi/ln
__________________________ Bicycle Level of Service __________________________
Posted speed limit, Sp 55 55
Percent of segment with occupied
on-highway parking 0 0
Pavement rating, P 3 3
Flow rate in outside lane, vOL 880.9 722.7
Effective width of outside lane, We 24.00 24.00
Effective speed factor, St 4.79 4.79
Bicycle LOS Score, BLOS 4.61 4.51
Bicycle LOS E E
Overall results are not computed when free-flow speed is less than 45 mph.
HCS 2010: Two-Lane Highways Release 6.60
Phone: Fax:
E-Mail:
_________________Directional Two-Lane Highway Segment Analysis________________
Analyst KP
Agency/Co. CCTC
Date Performed 1/22/2015
Analysis Time Period Existing Plus Project Sunday
Highway Highway 1
From/To Ocean/Carmel Valley
Jurisdiction Monterey County
Analysis Year 2014
Description Carmel Canine
__________________________________Input Data__________________________________
Highway class Class 2 Peak hour factor, PHF 0.94
Shoulder width 6.0 ft % Trucks and buses 8 %
Lane width 12.0 ft % Trucks crawling 0.0 %
Segment length 2.4 mi Truck crawl speed 0.0 mi/hr
Terrain type Specific Grade % Recreational vehicles 1 %
Grade: Length 0.25 mi % No-passing zones 100 %
Up/down -6.0 % Access point density 10 /mi
Analysis direction volume, Vd 1262 veh/h
Opposing direction volume, Vo 1330 veh/h
____________________________Average Travel Speed______________________________
Direction Analysis(d) Opposing (o)
PCE for trucks, ET 1.2* 1.2*
PCE for RVs, ER 1.0 1.0
Heavy-vehicle adj. factor,(note-5) fHV 0.984 0.984
Grade adj. factor,(note-1) fg 1.00 1.00
Directional flow rate,(note-2) vi 1364 pc/h 1438 pc/h
Free-Flow Speed from Field Measurement:
Field measured speed,(note-3) S FM - mi/h
Observed total demand,(note-3) V - veh/h
Estimated Free-Flow Speed:
Base free-flow speed,(note-3) BFFS 45.0 mi/h
Adj. for lane and shoulder width,(note-3) fLS 0.0 mi/h
Adj. for access point density,(note-3) fA 2.5 mi/h
Free-flow speed, FFSd 42.5 mi/h
Adjustment for no-passing zones, fnp 0.7 mi/h
Average travel speed, ATSd 20.1 mi/h
Percent Free Flow Speed, PFFS 47.2 %

_________________________Percent Time-Spent-Following_________________________
Direction Analysis(d) Opposing (o)
PCE for trucks, ET 1.0* 1.0*
PCE for RVs, ER 1.0 1.0
Heavy-vehicle adjustment factor, fHV 1.000 1.000
Grade adjustment factor,(note-1) fg 1.00 1.00
Directional flow rate,(note-2) vi 1343 pc/h 1415 pc/h
Base percent time-spent-following,(note-4) BPTSFd 88.3 %
Adjustment for no-passing zones, fnp 9.3
Percent time-spent-following, PTSFd 92.8 %
________________Level of Service and Other Performance Measures_______________
Level of service, LOS E
Volume to capacity ratio, v/c 0.79
Peak 15-min vehicle-miles of travel, VMT15 806 veh-mi
Peak-hour vehicle-miles of travel, VMT60 3029 veh-mi
Peak 15-min total travel time, TT15 40.1 veh-h
Capacity from ATS, CdATS 1700 veh/h
Capacity from PTSF, CdPTSF 1700 veh/h
Directional Capacity 1700 veh/h
_____________________________Passing Lane Analysis____________________________
Total length of analysis segment, Lt 2.4 mi
Length of two-lane highway upstream of the passing lane, Lu - mi
Length of passing lane including tapers, Lpl - mi
Average travel speed, ATSd (from above) 20.1 mi/h
Percent time-spent-following, PTSFd (from above) 92.8
Level of service, LOSd (from above) E
___________________Average Travel Speed with Passing Lane____________________
Downstream length of two-lane highway within effective
length of passing lane for average travel speed, Lde - mi
Length of two-lane highway downstream of effective
length of the passing lane for average travel speed, Ld - mi
Adj. factor for the effect of passing lane
on average speed, fpl -
Average travel speed including passing lane, ATSpl -
Percent free flow speed including passing lane, PFFSpl 0.0 %
________________Percent Time-Spent-Following with Passing Lane________________
Downstream length of two-lane highway within effective length
of passing lane for percent time-spent-following, Lde - mi
Length of two-lane highway downstream of effective length of
the passing lane for percent time-spent-following, Ld - mi
Adj. factor for the effect of passing lane
on percent time-spent-following, fpl -
Percent time-spent-following
including passing lane, PTSFpl - %
______Level of Service and Other Performance Measures with Passing Lane ______
Level of service including passing lane, LOSpl A
Peak 15-min total travel time, TT15 - veh-h
__________________________ Bicycle Level of Service __________________________
Posted speed limit, Sp 55
Percent of segment with occupied on-highway parking 0
Pavement rating, P 3
Flow rate in outside lane, vOL 1342.6
Effective width of outside lane, We 24.00
Effective speed factor, St 4.79
Bicycle LOS Score, BLOS 4.82
Bicycle LOS E
Notes:
1. Note that the adjustment factor for level terrain is 1.00, as level terrain
is one of the base conditions. For the purpose of grade adjustment, specific
dewngrade segments are treated as level terrain.
2. If vi (vd or vo ) >= 1,700 pc/h, terminate analysis-the LOS is F.
3. For the analysis direction only and for v>200 veh/h.
4. For the analysis direction only.
5. Use alternative Exhibit 15-14 if some trucks operate at crawl speeds on a
specific downgrade.
* These items have been entered or edited to override calculated value

HCS 2010: Multilane Highways Release 6.60
Phone: Fax:
E-mail:
___________________________OPERATIONAL ANALYSIS________________________________
Analyst: KP
Agency/Co: CCTC
Date: 1/2/2015
Analysis Period: Existing Plus Project Sunday
Highway: Highway 1
From/To: Ocean/Carmel Valley
Jurisdiction: Monterey County
Analysis Year: 2014
Project ID: Carmel Canine
_______________________________FREE-FLOW SPEED_________________________________
Direction 1 2
Lane width 12.0 ft 12.0 ft
Lateral clearance:
Right edge 6.0 ft 6.0 ft
Left edge 6.0 ft 6.0 ft
Total lateral clearance 12.0 ft 12.0 ft
Access points per mile 10 10
Median type Divided Divided
Free-flow speed: Base Base
FFS or BFFS 45.0 mph 45.0 mph
Lane width adjustment, FLW 0.0 mph 0.0 mph
Lateral clearance adjustment, FLC 0.0 mph 0.0 mph
Median type adjustment, FM 0.0 mph 0.0 mph
Access points adjustment, FA 2.5 mph 2.5 mph
Free-flow speed 42.5 mph 42.5 mph
____________________________________VOLUME_____________________________________
Direction 1 2
Volume, V 1330 vph 1262 vph
Peak-hour factor, PHF 0.94 0.94
Peak 15-minute volume, v15 354 336
Trucks and buses 8 % 8 %
Recreational vehicles 1 % 1 %
Terrain type Grade Grade
Grade 6.00 % 6.00 %
Segment length 0.00 mi 0.00 mi
Number of lanes 2 2
Driver population adjustment, fP 1.00 1.00
Trucks and buses PCE, ET 1.5 1.5
Recreational vehicles PCE, ER 4.0 4.0
Heavy vehicle adjustment, fHV 0.935 0.935
Flow rate, vp 756 pcphpl 718 pcphpl
____________________________________RESULTS____________________________________
Direction 1 2
Flow rate, vp 756 pcphpl 718 pcphpl
Free-flow speed, FFS 42.5 mph 42.5 mph
Avg. passenger-car travel speed, S 45.0 mph 45.0 mph
Level of service, LOS B B
Density, D 16.8 pc/mi/ln 16.0 pc/mi/ln
__________________________ Bicycle Level of Service __________________________
Posted speed limit, Sp 55 55
Percent of segment with occupied
on-highway parking 0 0
Pavement rating, P 3 3
Flow rate in outside lane, vOL 707.4 671.3
Effective width of outside lane, We 24.00 24.00
Effective speed factor, St 4.79 4.79
Bicycle LOS Score, BLOS 4.50 4.47
Bicycle LOS D D
Overall results are not computed when free-flow speed is less than 45 mph.

HCS 2010: Two-Lane Highways Release 6.60
Phone: Fax:
E-Mail:
_________________Directional Two-Lane Highway Segment Analysis________________
Analyst KP
Agency/Co. CCTC
Date Performed 1/22/2015
Analysis Time Period Cumulative AM
Highway Highway 1
From/To Ocean/Carmel Valley
Jurisdiction Monterey County
Analysis Year 2014
Description Carmel Canine
__________________________________Input Data__________________________________
Highway class Class 2 Peak hour factor, PHF 0.94
Shoulder width 6.0 ft % Trucks and buses 8 %
Lane width 12.0 ft % Trucks crawling 0.0 %
Segment length 2.4 mi Truck crawl speed 0.0 mi/hr
Terrain type Specific Grade % Recreational vehicles 1 %
Grade: Length 0.25 mi % No-passing zones 100 %
Up/down -6.0 % Access point density 10 /mi
Analysis direction volume, Vd 1929 veh/h
Opposing direction volume, Vo 2424 veh/h
____________________________Average Travel Speed______________________________
Direction Analysis(d) Opposing (o)
PCE for trucks, ET 1.2* 1.2*
PCE for RVs, ER 1.0 1.0
Heavy-vehicle adj. factor,(note-5) fHV 0.984 0.984
Grade adj. factor,(note-1) fg 1.00 1.00
Directional flow rate,(note-2) vi 2085 pc/h 2621 pc/h
Free-Flow Speed from Field Measurement:
Field measured speed,(note-3) S FM - mi/h
Observed total demand,(note-3) V - veh/h
Estimated Free-Flow Speed:
Base free-flow speed,(note-3) BFFS 45.0 mi/h
Adj. for lane and shoulder width,(note-3) fLS 0.0 mi/h
Adj. for access point density,(note-3) fA 2.5 mi/h
Free-flow speed, FFSd 42.5 mi/h
Adjustment for no-passing zones, fnp 0.6 mi/h
Average travel speed, ATSd 5.4 mi/h
Percent Free Flow Speed, PFFS 12.7 %
_________________________Percent Time-Spent-Following_________________________
Direction Analysis(d) Opposing (o)
PCE for trucks, ET 1.0* 1.0*
PCE for RVs, ER 1.0 1.0
Heavy-vehicle adjustment factor, fHV 1.000 1.000
Grade adjustment factor,(note-1) fg 1.00 1.00
Directional flow rate,(note-2) vi 2052 pc/h 2579 pc/h
Base percent time-spent-following,(note-4) BPTSFd 95.7 %
Adjustment for no-passing zones, fnp 8.4
Percent time-spent-following, PTSFd 99.4 %
________________Level of Service and Other Performance Measures_______________
Level of service, LOS F
Volume to capacity ratio, v/c 1.21
Peak 15-min vehicle-miles of travel, VMT15 1231 veh-mi
Peak-hour vehicle-miles of travel, VMT60 4630 veh-mi
Peak 15-min total travel time, TT15 228.7 veh-h
Capacity from ATS, CdATS 1700 veh/h
Capacity from PTSF, CdPTSF 1700 veh/h
Directional Capacity 1700 veh/h
_____________________________Passing Lane Analysis____________________________
Total length of analysis segment, Lt 2.4 mi
Length of two-lane highway upstream of the passing lane, Lu - mi
Length of passing lane including tapers, Lpl - mi
Average travel speed, ATSd (from above) 5.4 mi/h
Percent time-spent-following, PTSFd (from above) 99.4
Level of service, LOSd (from above) F
___________________Average Travel Speed with Passing Lane____________________
Downstream length of two-lane highway within effective
length of passing lane for average travel speed, Lde - mi
Length of two-lane highway downstream of effective
length of the passing lane for average travel speed, Ld - mi
Adj. factor for the effect of passing lane
on average speed, fpl -
Average travel speed including passing lane, ATSpl -
Percent free flow speed including passing lane, PFFSpl 0.0 %
________________Percent Time-Spent-Following with Passing Lane________________
Downstream length of two-lane highway within effective length
of passing lane for percent time-spent-following, Lde - mi
Length of two-lane highway downstream of effective length of
the passing lane for percent time-spent-following, Ld - mi
Adj. factor for the effect of passing lane
on percent time-spent-following, fpl -
Percent time-spent-following
including passing lane, PTSFpl - %
______Level of Service and Other Performance Measures with Passing Lane ______
Level of service including passing lane, LOSpl A
Peak 15-min total travel time, TT15 - veh-h
__________________________ Bicycle Level of Service __________________________

Posted speed limit, Sp 55
Percent of segment with occupied on-highway parking 0
Pavement rating, P 3
Flow rate in outside lane, vOL 2052.1
Effective width of outside lane, We 24.00
Effective speed factor, St 4.79
Bicycle LOS Score, BLOS 5.04
Bicycle LOS E
Notes:
1. Note that the adjustment factor for level terrain is 1.00, as level terrain
is one of the base conditions. For the purpose of grade adjustment, specific
dewngrade segments are treated as level terrain.
2. If vi (vd or vo ) >= 1,700 pc/h, terminate analysis-the LOS is F.
3. For the analysis direction only and for v>200 veh/h.
4. For the analysis direction only.
5. Use alternative Exhibit 15-14 if some trucks operate at crawl speeds on a
specific downgrade.
* These items have been entered or edited to override calculated value
HCS 2010: Multilane Highways Release 6.60
Phone: Fax:
E-mail:
___________________________OPERATIONAL ANALYSIS________________________________
Analyst: KP
Agency/Co: CCTC
Date: 1/5/2014
Analysis Period: Cumulative AM
Highway: Highway 1
From/To: Ocean/Carmel Valley
Jurisdiction: Monterey County
Analysis Year: 2014
Project ID: Carmel Canine
_______________________________FREE-FLOW SPEED_________________________________
Direction 1 2
Lane width 12.0 ft 12.0 ft
Lateral clearance:
Right edge 6.0 ft 6.0 ft
Left edge 6.0 ft 6.0 ft
Total lateral clearance 12.0 ft 12.0 ft
Access points per mile 10 10
Median type Divided Divided
Free-flow speed: Base Base
FFS or BFFS 45.0 mph 45.0 mph
Lane width adjustment, FLW 0.0 mph 0.0 mph
Lateral clearance adjustment, FLC 0.0 mph 0.0 mph
Median type adjustment, FM 0.0 mph 0.0 mph
Access points adjustment, FA 2.5 mph 2.5 mph
Free-flow speed 42.5 mph 42.5 mph
____________________________________VOLUME_____________________________________
Direction 1 2
Volume, V 2424 vph 1929 vph
Peak-hour factor, PHF 0.94 0.94
Peak 15-minute volume, v15 645 513
Trucks and buses 8 % 8 %
Recreational vehicles 1 % 1 %
Terrain type Grade Grade
Grade 6.00 % 6.00 %
Segment length 0.00 mi 0.00 mi
Number of lanes 2 2
Driver population adjustment, fP 1.00 1.00
Trucks and buses PCE, ET 1.5 1.5
Recreational vehicles PCE, ER 4.0 4.0
Heavy vehicle adjustment, fHV 0.935 0.935
Flow rate, vp 1379 pcphpl 1097 pcphpl
____________________________________RESULTS____________________________________

Direction 1 2
Flow rate, vp 1379 pcphpl 1097 pcphpl
Free-flow speed, FFS 42.5 mph 42.5 mph
Avg. passenger-car travel speed, S 45.0 mph 45.0 mph
Level of service, LOS D C
Density, D 30.6 pc/mi/ln 24.4 pc/mi/ln
__________________________ Bicycle Level of Service __________________________
Posted speed limit, Sp 55 55
Percent of segment with occupied
on-highway parking 0 0
Pavement rating, P 3 3
Flow rate in outside lane, vOL 1289.4 1026.1
Effective width of outside lane, We 24.00 24.00
Effective speed factor, St 4.79 4.79
Bicycle LOS Score, BLOS 4.80 4.69
Bicycle LOS E E
Overall results are not computed when free-flow speed is less than 45 mph.
HCS 2010: Two-Lane Highways Release 6.60
Phone: Fax:
E-Mail:
_________________Directional Two-Lane Highway Segment Analysis________________
Analyst KP
Agency/Co. CCTC
Date Performed 1/22/2015
Analysis Time Period Cumulative PM
Highway Highway 1
From/To Ocean/Carmel Valley
Jurisdiction Monterey County
Analysis Year 2014
Description Carmel Canine
__________________________________Input Data__________________________________
Highway class Class 2 Peak hour factor, PHF 0.94
Shoulder width 6.0 ft % Trucks and buses 8 %
Lane width 12.0 ft % Trucks crawling 0.0 %
Segment length 2.4 mi Truck crawl speed 0.0 mi/hr
Terrain type Specific Grade % Recreational vehicles 1 %
Grade: Length 0.25 mi % No-passing zones 100 %
Up/down -6.0 % Access point density 10 /mi
Analysis direction volume, Vd 1847 veh/h
Opposing direction volume, Vo 1897 veh/h
____________________________Average Travel Speed______________________________
Direction Analysis(d) Opposing (o)
PCE for trucks, ET 1.2* 1.2*
PCE for RVs, ER 1.0 1.0
Heavy-vehicle adj. factor,(note-5) fHV 0.984 0.984
Grade adj. factor,(note-1) fg 1.00 1.00
Directional flow rate,(note-2) vi 1996 pc/h 2051 pc/h
Free-Flow Speed from Field Measurement:
Field measured speed,(note-3) S FM - mi/h
Observed total demand,(note-3) V - veh/h
Estimated Free-Flow Speed:
Base free-flow speed,(note-3) BFFS 45.0 mi/h
Adj. for lane and shoulder width,(note-3) fLS 0.0 mi/h
Adj. for access point density,(note-3) fA 2.5 mi/h
Free-flow speed, FFSd 42.5 mi/h
Adjustment for no-passing zones, fnp 0.6 mi/h
Average travel speed, ATSd 10.5 mi/h
Percent Free Flow Speed, PFFS 24.7 %
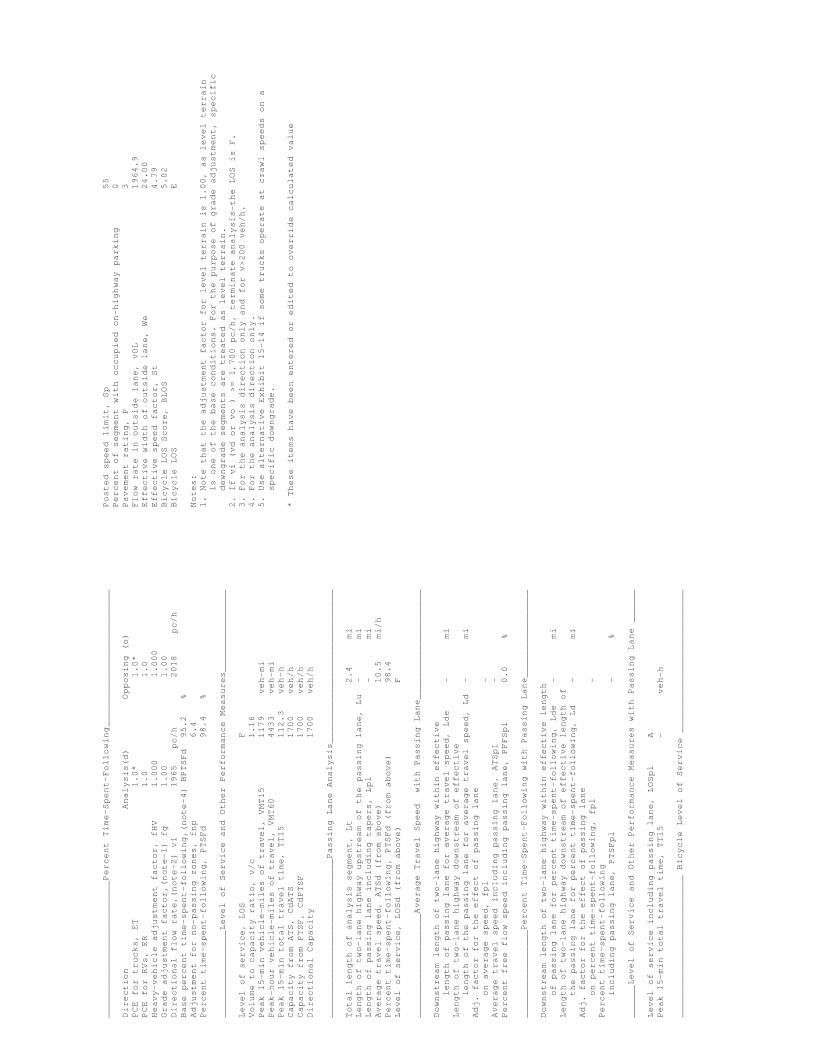
_________________________Percent Time-Spent-Following_________________________
Direction Analysis(d) Opposing (o)
PCE for trucks, ET 1.0* 1.0*
PCE for RVs, ER 1.0 1.0
Heavy-vehicle adjustment factor, fHV 1.000 1.000
Grade adjustment factor,(note-1) fg 1.00 1.00
Directional flow rate,(note-2) vi 1965 pc/h 2018 pc/h
Base percent time-spent-following,(note-4) BPTSFd 95.2 %
Adjustment for no-passing zones, fnp 6.4
Percent time-spent-following, PTSFd 98.4 %
________________Level of Service and Other Performance Measures_______________
Level of service, LOS F
Volume to capacity ratio, v/c 1.16
Peak 15-min vehicle-miles of travel, VMT15 1179 veh-mi
Peak-hour vehicle-miles of travel, VMT60 4433 veh-mi
Peak 15-min total travel time, TT15 112.3 veh-h
Capacity from ATS, CdATS 1700 veh/h
Capacity from PTSF, CdPTSF 1700 veh/h
Directional Capacity 1700 veh/h
_____________________________Passing Lane Analysis____________________________
Total length of analysis segment, Lt 2.4 mi
Length of two-lane highway upstream of the passing lane, Lu - mi
Length of passing lane including tapers, Lpl - mi
Average travel speed, ATSd (from above) 10.5 mi/h
Percent time-spent-following, PTSFd (from above) 98.4
Level of service, LOSd (from above) F
___________________Average Travel Speed with Passing Lane____________________
Downstream length of two-lane highway within effective
length of passing lane for average travel speed, Lde - mi
Length of two-lane highway downstream of effective
length of the passing lane for average travel speed, Ld - mi
Adj. factor for the effect of passing lane
on average speed, fpl -
Average travel speed including passing lane, ATSpl -
Percent free flow speed including passing lane, PFFSpl 0.0 %
________________Percent Time-Spent-Following with Passing Lane________________
Downstream length of two-lane highway within effective length
of passing lane for percent time-spent-following, Lde - mi
Length of two-lane highway downstream of effective length of
the passing lane for percent time-spent-following, Ld - mi
Adj. factor for the effect of passing lane
on percent time-spent-following, fpl -
Percent time-spent-following
including passing lane, PTSFpl - %
______Level of Service and Other Performance Measures with Passing Lane ______
Level of service including passing lane, LOSpl A
Peak 15-min total travel time, TT15 - veh-h
__________________________ Bicycle Level of Service __________________________
Posted speed limit, Sp 55
Percent of segment with occupied on-highway parking 0
Pavement rating, P 3
Flow rate in outside lane, vOL 1964.9
Effective width of outside lane, We 24.00
Effective speed factor, St 4.79
Bicycle LOS Score, BLOS 5.02
Bicycle LOS E
Notes:
1. Note that the adjustment factor for level terrain is 1.00, as level terrain
is one of the base conditions. For the purpose of grade adjustment, specific
dewngrade segments are treated as level terrain.
2. If vi (vd or vo ) >= 1,700 pc/h, terminate analysis-the LOS is F.
3. For the analysis direction only and for v>200 veh/h.
4. For the analysis direction only.
5. Use alternative Exhibit 15-14 if some trucks operate at crawl speeds on a
specific downgrade.
* These items have been entered or edited to override calculated value

HCS 2010: Multilane Highways Release 6.60
Phone: Fax:
E-mail:
___________________________OPERATIONAL ANALYSIS________________________________
Analyst: KP
Agency/Co: CCTC
Date: 1/5/2015
Analysis Period: Cumulative PM
Highway: Highway 1
From/To: Ocean/Carmel Valley
Jurisdiction: Monterey County
Analysis Year: 2014
Project ID: Carmel Canine
_______________________________FREE-FLOW SPEED_________________________________
Direction 1 2
Lane width 12.0 ft 12.0 ft
Lateral clearance:
Right edge 6.0 ft 6.0 ft
Left edge 6.0 ft 6.0 ft
Total lateral clearance 12.0 ft 12.0 ft
Access points per mile 10 10
Median type Divided Divided
Free-flow speed: Base Base
FFS or BFFS 45.0 mph 45.0 mph
Lane width adjustment, FLW 0.0 mph 0.0 mph
Lateral clearance adjustment, FLC 0.0 mph 0.0 mph
Median type adjustment, FM 0.0 mph 0.0 mph
Access points adjustment, FA 2.5 mph 2.5 mph
Free-flow speed 42.5 mph 42.5 mph
____________________________________VOLUME_____________________________________
Direction 1 2
Volume, V 1897 vph 1847 vph
Peak-hour factor, PHF 0.97 0.97
Peak 15-minute volume, v15 489 476
Trucks and buses 8 % 8 %
Recreational vehicles 1 % 1 %
Terrain type Grade Grade
Grade 6.00 % 6.00 %
Segment length 0.00 mi 0.00 mi
Number of lanes 2 2
Driver population adjustment, fP 1.00 1.00
Trucks and buses PCE, ET 1.5 1.5
Recreational vehicles PCE, ER 4.0 4.0
Heavy vehicle adjustment, fHV 0.935 0.935
Flow rate, vp 1046 pcphpl 1018 pcphpl
____________________________________RESULTS____________________________________
Direction 1 2
Flow rate, vp 1046 pcphpl 1018 pcphpl
Free-flow speed, FFS 42.5 mph 42.5 mph
Avg. passenger-car travel speed, S 45.0 mph 45.0 mph
Level of service, LOS C C
Density, D 23.2 pc/mi/ln 22.6 pc/mi/ln
__________________________ Bicycle Level of Service __________________________
Posted speed limit, Sp 55 55
Percent of segment with occupied
on-highway parking 0 0
Pavement rating, P 3 3
Flow rate in outside lane, vOL 977.8 952.1
Effective width of outside lane, We 24.00 24.00
Effective speed factor, St 4.79 4.79
Bicycle LOS Score, BLOS 4.66 4.65
Bicycle LOS E E
Overall results are not computed when free-flow speed is less than 45 mph.

HCS 2010: Two-Lane Highways Release 6.60
Phone: Fax:
E-Mail:
_________________Directional Two-Lane Highway Segment Analysis________________
Analyst KP
Agency/Co. CCTC
Date Performed 1/22/2015
Analysis Time Period Cumulative Friday
Highway Highway 1
From/To Ocean/Carmel Valley
Jurisdiction Monterey County
Analysis Year 2014
Description Carmel Canine
__________________________________Input Data__________________________________
Highway class Class 2 Peak hour factor, PHF 0.94
Shoulder width 6.0 ft % Trucks and buses 8 %
Lane width 12.0 ft % Trucks crawling 0.0 %
Segment length 2.4 mi Truck crawl speed 0.0 mi/hr
Terrain type Specific Grade % Recreational vehicles 1 %
Grade: Length 0.25 mi % No-passing zones 100 %
Up/down -6.0 % Access point density 10 /mi
Analysis direction volume, Vd 1684 veh/h
Opposing direction volume, Vo 1966 veh/h
____________________________Average Travel Speed______________________________
Direction Analysis(d) Opposing (o)
PCE for trucks, ET 1.2* 1.2*
PCE for RVs, ER 1.0 1.0
Heavy-vehicle adj. factor,(note-5) fHV 0.984 0.984
Grade adj. factor,(note-1) fg 1.00 1.00
Directional flow rate,(note-2) vi 1820 pc/h 2125 pc/h
Free-Flow Speed from Field Measurement:
Field measured speed,(note-3) S FM - mi/h
Observed total demand,(note-3) V - veh/h
Estimated Free-Flow Speed:
Base free-flow speed,(note-3) BFFS 45.0 mi/h
Adj. for lane and shoulder width,(note-3) fLS 0.0 mi/h
Adj. for access point density,(note-3) fA 2.5 mi/h
Free-flow speed, FFSd 42.5 mi/h
Adjustment for no-passing zones, fnp 0.6 mi/h
Average travel speed, ATSd 11.3 mi/h
Percent Free Flow Speed, PFFS 26.6 %
_________________________Percent Time-Spent-Following_________________________
Direction Analysis(d) Opposing (o)
PCE for trucks, ET 1.0* 1.0*
PCE for RVs, ER 1.0 1.0
Heavy-vehicle adjustment factor, fHV 1.000 1.000
Grade adjustment factor,(note-1) fg 1.00 1.00
Directional flow rate,(note-2) vi 1791 pc/h 2091 pc/h
Base percent time-spent-following,(note-4) BPTSFd 94.0 %
Adjustment for no-passing zones, fnp 7.7
Percent time-spent-following, PTSFd 97.6 %
________________Level of Service and Other Performance Measures_______________
Level of service, LOS F
Volume to capacity ratio, v/c 1.05
Peak 15-min vehicle-miles of travel, VMT15 1075 veh-mi
Peak-hour vehicle-miles of travel, VMT60 4042 veh-mi
Peak 15-min total travel time, TT15 95.2 veh-h
Capacity from ATS, CdATS 1700 veh/h
Capacity from PTSF, CdPTSF 1700 veh/h
Directional Capacity 1700 veh/h
_____________________________Passing Lane Analysis____________________________
Total length of analysis segment, Lt 2.4 mi
Length of two-lane highway upstream of the passing lane, Lu - mi
Length of passing lane including tapers, Lpl - mi
Average travel speed, ATSd (from above) 11.3 mi/h
Percent time-spent-following, PTSFd (from above) 97.6
Level of service, LOSd (from above) F
___________________Average Travel Speed with Passing Lane____________________
Downstream length of two-lane highway within effective
length of passing lane for average travel speed, Lde - mi
Length of two-lane highway downstream of effective
length of the passing lane for average travel speed, Ld - mi
Adj. factor for the effect of passing lane
on average speed, fpl -
Average travel speed including passing lane, ATSpl -
Percent free flow speed including passing lane, PFFSpl 0.0 %
________________Percent Time-Spent-Following with Passing Lane________________
Downstream length of two-lane highway within effective length
of passing lane for percent time-spent-following, Lde - mi
Length of two-lane highway downstream of effective length of
the passing lane for percent time-spent-following, Ld - mi
Adj. factor for the effect of passing lane
on percent time-spent-following, fpl -
Percent time-spent-following
including passing lane, PTSFpl - %
______Level of Service and Other Performance Measures with Passing Lane ______
Level of service including passing lane, LOSpl A
Peak 15-min total travel time, TT15 - veh-h
__________________________ Bicycle Level of Service __________________________

Posted speed limit, Sp 55
Percent of segment with occupied on-highway parking 0
Pavement rating, P 3
Flow rate in outside lane, vOL 1791.5
Effective width of outside lane, We 24.00
Effective speed factor, St 4.79
Bicycle LOS Score, BLOS 4.97
Bicycle LOS E
Notes:
1. Note that the adjustment factor for level terrain is 1.00, as level terrain
is one of the base conditions. For the purpose of grade adjustment, specific
dewngrade segments are treated as level terrain.
2. If vi (vd or vo ) >= 1,700 pc/h, terminate analysis-the LOS is F.
3. For the analysis direction only and for v>200 veh/h.
4. For the analysis direction only.
5. Use alternative Exhibit 15-14 if some trucks operate at crawl speeds on a
specific downgrade.
* These items have been entered or edited to override calculated value
HCS 2010: Multilane Highways Release 6.60
Phone: Fax:
E-mail:
___________________________OPERATIONAL ANALYSIS________________________________
Analyst: KP
Agency/Co: CCTC
Date: 1/5/2015
Analysis Period: Cumulative Friday
Highway: Highway 1
From/To: Ocean/Carmel Valley
Jurisdiction: Monterey County
Analysis Year: 2014
Project ID: Carmel Canine
_______________________________FREE-FLOW SPEED_________________________________
Direction 1 2
Lane width 12.0 ft 12.0 ft
Lateral clearance:
Right edge 6.0 ft 6.0 ft
Left edge 6.0 ft 6.0 ft
Total lateral clearance 12.0 ft 12.0 ft
Access points per mile 10 10
Median type Divided Divided
Free-flow speed: Base Base
FFS or BFFS 45.0 mph 45.0 mph
Lane width adjustment, FLW 0.0 mph 0.0 mph
Lateral clearance adjustment, FLC 0.0 mph 0.0 mph
Median type adjustment, FM 0.0 mph 0.0 mph
Access points adjustment, FA 2.5 mph 2.5 mph
Free-flow speed 42.5 mph 42.5 mph
____________________________________VOLUME_____________________________________
Direction 1 2
Volume, V 1966 vph 1684 vph
Peak-hour factor, PHF 0.97 0.97
Peak 15-minute volume, v15 507 434
Trucks and buses 8 % 8 %
Recreational vehicles 1 % 1 %
Terrain type Grade Grade
Grade 6.00 % 6.00 %
Segment length 0.00 mi 0.00 mi
Number of lanes 2 2
Driver population adjustment, fP 1.00 1.00
Trucks and buses PCE, ET 1.5 1.5
Recreational vehicles PCE, ER 4.0 4.0
Heavy vehicle adjustment, fHV 0.935 0.935
Flow rate, vp 1084 pcphpl 928 pcphpl
____________________________________RESULTS____________________________________

Direction 1 2
Flow rate, vp 1084 pcphpl 928 pcphpl
Free-flow speed, FFS 42.5 mph 42.5 mph
Avg. passenger-car travel speed, S 45.0 mph 45.0 mph
Level of service, LOS C C
Density, D 24.1 pc/mi/ln 20.6 pc/mi/ln
__________________________ Bicycle Level of Service __________________________
Posted speed limit, Sp 55 55
Percent of segment with occupied
on-highway parking 0 0
Pavement rating, P 3 3
Flow rate in outside lane, vOL 1013.4 868.0
Effective width of outside lane, We 24.00 24.00
Effective speed factor, St 4.79 4.79
Bicycle LOS Score, BLOS 4.68 4.60
Bicycle LOS E E
Overall results are not computed when free-flow speed is less than 45 mph.
HCS 2010: Two-Lane Highways Release 6.60
Phone: Fax:
E-Mail:
_________________Directional Two-Lane Highway Segment Analysis________________
Analyst KP
Agency/Co. CCTC
Date Performed 1/22/2015
Analysis Time Period Cumulative Sunday
Highway Highway 1
From/To Ocean/Carmel Valley
Jurisdiction Monterey County
Analysis Year 2014
Description Carmel Canine
__________________________________Input Data__________________________________
Highway class Class 2 Peak hour factor, PHF 0.94
Shoulder width 6.0 ft % Trucks and buses 8 %
Lane width 12.0 ft % Trucks crawling 0.0 %
Segment length 2.4 mi Truck crawl speed 0.0 mi/hr
Terrain type Specific Grade % Recreational vehicles 1 %
Grade: Length 0.25 mi % No-passing zones 100 %
Up/down -6.0 % Access point density 10 /mi
Analysis direction volume, Vd 1516 veh/h
Opposing direction volume, Vo 1546 veh/h
____________________________Average Travel Speed______________________________
Direction Analysis(d) Opposing (o)
PCE for trucks, ET 1.2* 1.2*
PCE for RVs, ER 1.0 1.0
Heavy-vehicle adj. factor,(note-5) fHV 0.984 0.984
Grade adj. factor,(note-1) fg 1.00 1.00
Directional flow rate,(note-2) vi 1639 pc/h 1671 pc/h
Free-Flow Speed from Field Measurement:
Field measured speed,(note-3) S FM - mi/h
Observed total demand,(note-3) V - veh/h
Estimated Free-Flow Speed:
Base free-flow speed,(note-3) BFFS 45.0 mi/h
Adj. for lane and shoulder width,(note-3) fLS 0.0 mi/h
Adj. for access point density,(note-3) fA 2.5 mi/h
Free-flow speed, FFSd 42.5 mi/h
Adjustment for no-passing zones, fnp 0.6 mi/h
Average travel speed, ATSd 16.2 mi/h
Percent Free Flow Speed, PFFS 38.2 %

_________________________Percent Time-Spent-Following_________________________
Direction Analysis(d) Opposing (o)
PCE for trucks, ET 1.0* 1.0*
PCE for RVs, ER 1.0 1.0
Heavy-vehicle adjustment factor, fHV 1.000 1.000
Grade adjustment factor,(note-1) fg 1.00 1.00
Directional flow rate,(note-2) vi 1613 pc/h 1645 pc/h
Base percent time-spent-following,(note-4) BPTSFd 92.5 %
Adjustment for no-passing zones, fnp 6.3
Percent time-spent-following, PTSFd 95.6 %
________________Level of Service and Other Performance Measures_______________
Level of service, LOS E
Volume to capacity ratio, v/c 0.95
Peak 15-min vehicle-miles of travel, VMT15 968 veh-mi
Peak-hour vehicle-miles of travel, VMT60 3638 veh-mi
Peak 15-min total travel time, TT15 59.7 veh-h
Capacity from ATS, CdATS 1700 veh/h
Capacity from PTSF, CdPTSF 1700 veh/h
Directional Capacity 1700 veh/h
_____________________________Passing Lane Analysis____________________________
Total length of analysis segment, Lt 2.4 mi
Length of two-lane highway upstream of the passing lane, Lu - mi
Length of passing lane including tapers, Lpl - mi
Average travel speed, ATSd (from above) 16.2 mi/h
Percent time-spent-following, PTSFd (from above) 95.6
Level of service, LOSd (from above) E
___________________Average Travel Speed with Passing Lane____________________
Downstream length of two-lane highway within effective
length of passing lane for average travel speed, Lde - mi
Length of two-lane highway downstream of effective
length of the passing lane for average travel speed, Ld - mi
Adj. factor for the effect of passing lane
on average speed, fpl -
Average travel speed including passing lane, ATSpl -
Percent free flow speed including passing lane, PFFSpl 0.0 %
________________Percent Time-Spent-Following with Passing Lane________________
Downstream length of two-lane highway within effective length
of passing lane for percent time-spent-following, Lde - mi
Length of two-lane highway downstream of effective length of
the passing lane for percent time-spent-following, Ld - mi
Adj. factor for the effect of passing lane
on percent time-spent-following, fpl -
Percent time-spent-following
including passing lane, PTSFpl - %
______Level of Service and Other Performance Measures with Passing Lane ______
Level of service including passing lane, LOSpl A
Peak 15-min total travel time, TT15 - veh-h
__________________________ Bicycle Level of Service __________________________
Posted speed limit, Sp 55
Percent of segment with occupied on-highway parking 0
Pavement rating, P 3
Flow rate in outside lane, vOL 1612.8
Effective width of outside lane, We 24.00
Effective speed factor, St 4.79
Bicycle LOS Score, BLOS 4.92
Bicycle LOS E
Notes:
1. Note that the adjustment factor for level terrain is 1.00, as level terrain
is one of the base conditions. For the purpose of grade adjustment, specific
dewngrade segments are treated as level terrain.
2. If vi (vd or vo ) >= 1,700 pc/h, terminate analysis-the LOS is F.
3. For the analysis direction only and for v>200 veh/h.
4. For the analysis direction only.
5. Use alternative Exhibit 15-14 if some trucks operate at crawl speeds on a
specific downgrade.
* These items have been entered or edited to override calculated value

HCS 2010: Multilane Highways Release 6.60
Phone: Fax:
E-mail:
___________________________OPERATIONAL ANALYSIS________________________________
Analyst: KP
Agency/Co: CCTC
Date: 1/5/2015
Analysis Period: Cumulative Sunday
Highway: Highway 1
From/To: Ocean/Carmel Valley
Jurisdiction: Monterey County
Analysis Year: 2014
Project ID: Carmel Canine
_______________________________FREE-FLOW SPEED_________________________________
Direction 1 2
Lane width 12.0 ft 12.0 ft
Lateral clearance:
Right edge 6.0 ft 6.0 ft
Left edge 6.0 ft 6.0 ft
Total lateral clearance 12.0 ft 12.0 ft
Access points per mile 10 10
Median type Divided Divided
Free-flow speed: Base Base
FFS or BFFS 45.0 mph 45.0 mph
Lane width adjustment, FLW 0.0 mph 0.0 mph
Lateral clearance adjustment, FLC 0.0 mph 0.0 mph
Median type adjustment, FM 0.0 mph 0.0 mph
Access points adjustment, FA 2.5 mph 2.5 mph
Free-flow speed 42.5 mph 42.5 mph
____________________________________VOLUME_____________________________________
Direction 1 2
Volume, V 1546 vph 1516 vph
Peak-hour factor, PHF 0.94 0.94
Peak 15-minute volume, v15 411 403
Trucks and buses 8 % 8 %
Recreational vehicles 1 % 1 %
Terrain type Grade Grade
Grade 6.00 % 6.00 %
Segment length 0.00 mi 0.00 mi
Number of lanes 2 2
Driver population adjustment, fP 1.00 1.00
Trucks and buses PCE, ET 1.5 1.5
Recreational vehicles PCE, ER 4.0 4.0
Heavy vehicle adjustment, fHV 0.935 0.935
Flow rate, vp 879 pcphpl 862 pcphpl
____________________________________RESULTS____________________________________
Direction 1 2
Flow rate, vp 879 pcphpl 862 pcphpl
Free-flow speed, FFS 42.5 mph 42.5 mph
Avg. passenger-car travel speed, S 45.0 mph 45.0 mph
Level of service, LOS C C
Density, D 19.5 pc/mi/ln 19.2 pc/mi/ln
__________________________ Bicycle Level of Service __________________________
Posted speed limit, Sp 55 55
Percent of segment with occupied
on-highway parking 0 0
Pavement rating, P 3 3
Flow rate in outside lane, vOL 822.3 806.4
Effective width of outside lane, We 24.00 24.00
Effective speed factor, St 4.79 4.79
Bicycle LOS Score, BLOS 4.57 4.56
Bicycle LOS E E
Overall results are not computed when free-flow speed is less than 45 mph.

HCS 2010: Two-Lane Highways Release 6.60
Phone: Fax:
E-Mail:
_________________Directional Two-Lane Highway Segment Analysis________________
Analyst KP
Agency/Co. CCTC
Date Performed 1/22/2015
Analysis Time Period Cumulative Plus Project AM
Highway Highway 1
From/To Ocean/Carmel Valley
Jurisdiction Monterey County
Analysis Year 2014
Description Carmel Canine
__________________________________Input Data__________________________________
Highway class Class 2 Peak hour factor, PHF 0.94
Shoulder width 6.0 ft % Trucks and buses 8 %
Lane width 12.0 ft % Trucks crawling 0.0 %
Segment length 2.4 mi Truck crawl speed 0.0 mi/hr
Terrain type Specific Grade % Recreational vehicles 1 %
Grade: Length 0.25 mi % No-passing zones 100 %
Up/down -6.0 % Access point density 10 /mi
Analysis direction volume, Vd 1952 veh/h
Opposing direction volume, Vo 2444 veh/h
____________________________Average Travel Speed______________________________
Direction Analysis(d) Opposing (o)
PCE for trucks, ET 1.2* 1.2*
PCE for RVs, ER 1.0 1.0
Heavy-vehicle adj. factor,(note-5) fHV 0.984 0.984
Grade adj. factor,(note-1) fg 1.00 1.00
Directional flow rate,(note-2) vi 2110 pc/h 2642 pc/h
Free-Flow Speed from Field Measurement:
Field measured speed,(note-3) S FM - mi/h
Observed total demand,(note-3) V - veh/h
Estimated Free-Flow Speed:
Base free-flow speed,(note-3) BFFS 45.0 mi/h
Adj. for lane and shoulder width,(note-3) fLS 0.0 mi/h
Adj. for access point density,(note-3) fA 2.5 mi/h
Free-flow speed, FFSd 42.5 mi/h
Adjustment for no-passing zones, fnp 0.6 mi/h
Average travel speed, ATSd 5.0 mi/h
Percent Free Flow Speed, PFFS 11.8 %
_________________________Percent Time-Spent-Following_________________________
Direction Analysis(d) Opposing (o)
PCE for trucks, ET 1.0* 1.0*
PCE for RVs, ER 1.0 1.0
Heavy-vehicle adjustment factor, fHV 1.000 1.000
Grade adjustment factor,(note-1) fg 1.00 1.00
Directional flow rate,(note-2) vi 2077 pc/h 2600 pc/h
Base percent time-spent-following,(note-4) BPTSFd 95.9 %
Adjustment for no-passing zones, fnp 8.4
Percent time-spent-following, PTSFd 99.6 %
________________Level of Service and Other Performance Measures_______________
Level of service, LOS F
Volume to capacity ratio, v/c 1.22
Peak 15-min vehicle-miles of travel, VMT15 1246 veh-mi
Peak-hour vehicle-miles of travel, VMT60 4685 veh-mi
Peak 15-min total travel time, TT15 248.0 veh-h
Capacity from ATS, CdATS 1700 veh/h
Capacity from PTSF, CdPTSF 1700 veh/h
Directional Capacity 1700 veh/h
_____________________________Passing Lane Analysis____________________________
Total length of analysis segment, Lt 2.4 mi
Length of two-lane highway upstream of the passing lane, Lu - mi
Length of passing lane including tapers, Lpl - mi
Average travel speed, ATSd (from above) 5.0 mi/h
Percent time-spent-following, PTSFd (from above) 99.6
Level of service, LOSd (from above) F
___________________Average Travel Speed with Passing Lane____________________
Downstream length of two-lane highway within effective
length of passing lane for average travel speed, Lde - mi
Length of two-lane highway downstream of effective
length of the passing lane for average travel speed, Ld - mi
Adj. factor for the effect of passing lane
on average speed, fpl -
Average travel speed including passing lane, ATSpl -
Percent free flow speed including passing lane, PFFSpl 0.0 %
________________Percent Time-Spent-Following with Passing Lane________________
Downstream length of two-lane highway within effective length
of passing lane for percent time-spent-following, Lde - mi
Length of two-lane highway downstream of effective length of
the passing lane for percent time-spent-following, Ld - mi
Adj. factor for the effect of passing lane
on percent time-spent-following, fpl -
Percent time-spent-following
including passing lane, PTSFpl - %
______Level of Service and Other Performance Measures with Passing Lane ______
Level of service including passing lane, LOSpl A
Peak 15-min total travel time, TT15 - veh-h
__________________________ Bicycle Level of Service __________________________

Posted speed limit, Sp 55
Percent of segment with occupied on-highway parking 0
Pavement rating, P 3
Flow rate in outside lane, vOL 2076.6
Effective width of outside lane, We 24.00
Effective speed factor, St 4.79
Bicycle LOS Score, BLOS 5.04
Bicycle LOS E
Notes:
1. Note that the adjustment factor for level terrain is 1.00, as level terrain
is one of the base conditions. For the purpose of grade adjustment, specific
dewngrade segments are treated as level terrain.
2. If vi (vd or vo ) >= 1,700 pc/h, terminate analysis-the LOS is F.
3. For the analysis direction only and for v>200 veh/h.
4. For the analysis direction only.
5. Use alternative Exhibit 15-14 if some trucks operate at crawl speeds on a
specific downgrade.
* These items have been entered or edited to override calculated value
HCS 2010: Multilane Highways Release 6.60
Phone: Fax:
E-mail:
___________________________OPERATIONAL ANALYSIS________________________________
Analyst: KP
Agency/Co: CCTC
Date: 1/5/2014
Analysis Period: Cumulative Plus Project AM
Highway: Highway 1
From/To: Ocean/Carmel Valley
Jurisdiction: Monterey County
Analysis Year: 2014
Project ID: Carmel Canine
_______________________________FREE-FLOW SPEED_________________________________
Direction 1 2
Lane width 12.0 ft 12.0 ft
Lateral clearance:
Right edge 6.0 ft 6.0 ft
Left edge 6.0 ft 6.0 ft
Total lateral clearance 12.0 ft 12.0 ft
Access points per mile 10 10
Median type Divided Divided
Free-flow speed: Base Base
FFS or BFFS 45.0 mph 45.0 mph
Lane width adjustment, FLW 0.0 mph 0.0 mph
Lateral clearance adjustment, FLC 0.0 mph 0.0 mph
Median type adjustment, FM 0.0 mph 0.0 mph
Access points adjustment, FA 2.5 mph 2.5 mph
Free-flow speed 42.5 mph 42.5 mph
____________________________________VOLUME_____________________________________
Direction 1 2
Volume, V 2444 vph 1952 vph
Peak-hour factor, PHF 0.94 0.94
Peak 15-minute volume, v15 650 519
Trucks and buses 8 % 8 %
Recreational vehicles 1 % 1 %
Terrain type Grade Grade
Grade 6.00 % 6.00 %
Segment length 0.00 mi 0.00 mi
Number of lanes 2 2
Driver population adjustment, fP 1.00 1.00
Trucks and buses PCE, ET 1.5 1.5
Recreational vehicles PCE, ER 4.0 4.0
Heavy vehicle adjustment, fHV 0.935 0.935
Flow rate, vp 1391 pcphpl 1110 pcphpl
____________________________________RESULTS____________________________________

Direction 1 2
Flow rate, vp 1391 pcphpl 1110 pcphpl
Free-flow speed, FFS 42.5 mph 42.5 mph
Avg. passenger-car travel speed, S 45.0 mph 45.0 mph
Level of service, LOS D C
Density, D 30.9 pc/mi/ln 24.7 pc/mi/ln
__________________________ Bicycle Level of Service __________________________
Posted speed limit, Sp 55 55
Percent of segment with occupied
on-highway parking 0 0
Pavement rating, P 3 3
Flow rate in outside lane, vOL 1300.0 1038.3
Effective width of outside lane, We 24.00 24.00
Effective speed factor, St 4.79 4.79
Bicycle LOS Score, BLOS 4.81 4.69
Bicycle LOS E E
Overall results are not computed when free-flow speed is less than 45 mph.
HCS 2010: Two-Lane Highways Release 6.60
Phone: Fax:
E-Mail:
_________________Directional Two-Lane Highway Segment Analysis________________
Analyst KP
Agency/Co. CCTC
Date Performed 1/22/2015
Analysis Time Period Cumulative Plus Project PM
Highway Highway 1
From/To Ocean/Carmel Valley
Jurisdiction Monterey County
Analysis Year 2014
Description Carmel Canine
__________________________________Input Data__________________________________
Highway class Class 2 Peak hour factor, PHF 0.94
Shoulder width 6.0 ft % Trucks and buses 8 %
Lane width 12.0 ft % Trucks crawling 0.0 %
Segment length 2.4 mi Truck crawl speed 0.0 mi/hr
Terrain type Specific Grade % Recreational vehicles 1 %
Grade: Length 0.25 mi % No-passing zones 100 %
Up/down -6.0 % Access point density 10 /mi
Analysis direction volume, Vd 1867 veh/h
Opposing direction volume, Vo 1920 veh/h
____________________________Average Travel Speed______________________________
Direction Analysis(d) Opposing (o)
PCE for trucks, ET 1.2* 1.2*
PCE for RVs, ER 1.0 1.0
Heavy-vehicle adj. factor,(note-5) fHV 0.984 0.984
Grade adj. factor,(note-1) fg 1.00 1.00
Directional flow rate,(note-2) vi 2018 pc/h 2076 pc/h
Free-Flow Speed from Field Measurement:
Field measured speed,(note-3) S FM - mi/h
Observed total demand,(note-3) V - veh/h
Estimated Free-Flow Speed:
Base free-flow speed,(note-3) BFFS 45.0 mi/h
Adj. for lane and shoulder width,(note-3) fLS 0.0 mi/h
Adj. for access point density,(note-3) fA 2.5 mi/h
Free-flow speed, FFSd 42.5 mi/h
Adjustment for no-passing zones, fnp 0.6 mi/h
Average travel speed, ATSd 10.1 mi/h
Percent Free Flow Speed, PFFS 23.8 %

_________________________Percent Time-Spent-Following_________________________
Direction Analysis(d) Opposing (o)
PCE for trucks, ET 1.0* 1.0*
PCE for RVs, ER 1.0 1.0
Heavy-vehicle adjustment factor, fHV 1.000 1.000
Grade adjustment factor,(note-1) fg 1.00 1.00
Directional flow rate,(note-2) vi 1986 pc/h 2043 pc/h
Base percent time-spent-following,(note-4) BPTSFd 95.3 %
Adjustment for no-passing zones, fnp 6.4
Percent time-spent-following, PTSFd 98.5 %
________________Level of Service and Other Performance Measures_______________
Level of service, LOS F
Volume to capacity ratio, v/c 1.17
Peak 15-min vehicle-miles of travel, VMT15 1192 veh-mi
Peak-hour vehicle-miles of travel, VMT60 4481 veh-mi
Peak 15-min total travel time, TT15 117.7 veh-h
Capacity from ATS, CdATS 1700 veh/h
Capacity from PTSF, CdPTSF 1700 veh/h
Directional Capacity 1700 veh/h
_____________________________Passing Lane Analysis____________________________
Total length of analysis segment, Lt 2.4 mi
Length of two-lane highway upstream of the passing lane, Lu - mi
Length of passing lane including tapers, Lpl - mi
Average travel speed, ATSd (from above) 10.1 mi/h
Percent time-spent-following, PTSFd (from above) 98.5
Level of service, LOSd (from above) F
___________________Average Travel Speed with Passing Lane____________________
Downstream length of two-lane highway within effective
length of passing lane for average travel speed, Lde - mi
Length of two-lane highway downstream of effective
length of the passing lane for average travel speed, Ld - mi
Adj. factor for the effect of passing lane
on average speed, fpl -
Average travel speed including passing lane, ATSpl -
Percent free flow speed including passing lane, PFFSpl 0.0 %
________________Percent Time-Spent-Following with Passing Lane________________
Downstream length of two-lane highway within effective length
of passing lane for percent time-spent-following, Lde - mi
Length of two-lane highway downstream of effective length of
the passing lane for percent time-spent-following, Ld - mi
Adj. factor for the effect of passing lane
on percent time-spent-following, fpl -
Percent time-spent-following
including passing lane, PTSFpl - %
______Level of Service and Other Performance Measures with Passing Lane ______
Level of service including passing lane, LOSpl A
Peak 15-min total travel time, TT15 - veh-h
__________________________ Bicycle Level of Service __________________________
Posted speed limit, Sp 55
Percent of segment with occupied on-highway parking 0
Pavement rating, P 3
Flow rate in outside lane, vOL 1986.2
Effective width of outside lane, We 24.00
Effective speed factor, St 4.79
Bicycle LOS Score, BLOS 5.02
Bicycle LOS E
Notes:
1. Note that the adjustment factor for level terrain is 1.00, as level terrain
is one of the base conditions. For the purpose of grade adjustment, specific
dewngrade segments are treated as level terrain.
2. If vi (vd or vo ) >= 1,700 pc/h, terminate analysis-the LOS is F.
3. For the analysis direction only and for v>200 veh/h.
4. For the analysis direction only.
5. Use alternative Exhibit 15-14 if some trucks operate at crawl speeds on a
specific downgrade.
* These items have been entered or edited to override calculated value

HCS 2010: Multilane Highways Release 6.60
Phone: Fax:
E-mail:
___________________________OPERATIONAL ANALYSIS________________________________
Analyst: KP
Agency/Co: CCTC
Date: 1/5/2015
Analysis Period: Cumulative Plus Project PM
Highway: Highway 1
From/To: Ocean/Carmel Valley
Jurisdiction: Monterey County
Analysis Year: 2014
Project ID: Carmel Canine
_______________________________FREE-FLOW SPEED_________________________________
Direction 1 2
Lane width 12.0 ft 12.0 ft
Lateral clearance:
Right edge 6.0 ft 6.0 ft
Left edge 6.0 ft 6.0 ft
Total lateral clearance 12.0 ft 12.0 ft
Access points per mile 10 10
Median type Divided Divided
Free-flow speed: Base Base
FFS or BFFS 45.0 mph 45.0 mph
Lane width adjustment, FLW 0.0 mph 0.0 mph
Lateral clearance adjustment, FLC 0.0 mph 0.0 mph
Median type adjustment, FM 0.0 mph 0.0 mph
Access points adjustment, FA 2.5 mph 2.5 mph
Free-flow speed 42.5 mph 42.5 mph
____________________________________VOLUME_____________________________________
Direction 1 2
Volume, V 1920 vph 1867 vph
Peak-hour factor, PHF 0.97 0.97
Peak 15-minute volume, v15 495 481
Trucks and buses 8 % 8 %
Recreational vehicles 1 % 1 %
Terrain type Grade Grade
Grade 6.00 % 6.00 %
Segment length 0.00 mi 0.00 mi
Number of lanes 2 2
Driver population adjustment, fP 1.00 1.00
Trucks and buses PCE, ET 1.5 1.5
Recreational vehicles PCE, ER 4.0 4.0
Heavy vehicle adjustment, fHV 0.935 0.935
Flow rate, vp 1058 pcphpl 1029 pcphpl
____________________________________RESULTS____________________________________
Direction 1 2
Flow rate, vp 1058 pcphpl 1029 pcphpl
Free-flow speed, FFS 42.5 mph 42.5 mph
Avg. passenger-car travel speed, S 45.0 mph 45.0 mph
Level of service, LOS C C
Density, D 23.5 pc/mi/ln 22.9 pc/mi/ln
__________________________ Bicycle Level of Service __________________________
Posted speed limit, Sp 55 55
Percent of segment with occupied
on-highway parking 0 0
Pavement rating, P 3 3
Flow rate in outside lane, vOL 989.7 962.4
Effective width of outside lane, We 24.00 24.00
Effective speed factor, St 4.79 4.79
Bicycle LOS Score, BLOS 4.67 4.65
Bicycle LOS E E
Overall results are not computed when free-flow speed is less than 45 mph.

HCS 2010: Two-Lane Highways Release 6.60
Phone: Fax:
E-Mail:
_________________Directional Two-Lane Highway Segment Analysis________________
Analyst KP
Agency/Co. CCTC
Date Performed 1/22/2015
Analysis Time Period Cumulative Plus Project Friday
Highway Highway 1
From/To Ocean/Carmel Valley
Jurisdiction Monterey County
Analysis Year 2014
Description Carmel Canine
__________________________________Input Data__________________________________
Highway class Class 2 Peak hour factor, PHF 0.94
Shoulder width 6.0 ft % Trucks and buses 8 %
Lane width 12.0 ft % Trucks crawling 0.0 %
Segment length 2.4 mi Truck crawl speed 0.0 mi/hr
Terrain type Specific Grade % Recreational vehicles 1 %
Grade: Length 0.25 mi % No-passing zones 100 %
Up/down -6.0 % Access point density 10 /mi
Analysis direction volume, Vd 1706 veh/h
Opposing direction volume, Vo 2009 veh/h
____________________________Average Travel Speed______________________________
Direction Analysis(d) Opposing (o)
PCE for trucks, ET 1.2* 1.2*
PCE for RVs, ER 1.0 1.0
Heavy-vehicle adj. factor,(note-5) fHV 0.984 0.984
Grade adj. factor,(note-1) fg 1.00 1.00
Directional flow rate,(note-2) vi 1844 pc/h 2172 pc/h
Free-Flow Speed from Field Measurement:
Field measured speed,(note-3) S FM - mi/h
Observed total demand,(note-3) V - veh/h
Estimated Free-Flow Speed:
Base free-flow speed,(note-3) BFFS 45.0 mi/h
Adj. for lane and shoulder width,(note-3) fLS 0.0 mi/h
Adj. for access point density,(note-3) fA 2.5 mi/h
Free-flow speed, FFSd 42.5 mi/h
Adjustment for no-passing zones, fnp 0.6 mi/h
Average travel speed, ATSd 10.7 mi/h
Percent Free Flow Speed, PFFS 25.3 %
_________________________Percent Time-Spent-Following_________________________
Direction Analysis(d) Opposing (o)
PCE for trucks, ET 1.0* 1.0*
PCE for RVs, ER 1.0 1.0
Heavy-vehicle adjustment factor, fHV 1.000 1.000
Grade adjustment factor,(note-1) fg 1.00 1.00
Directional flow rate,(note-2) vi 1815 pc/h 2137 pc/h
Base percent time-spent-following,(note-4) BPTSFd 94.2 %
Adjustment for no-passing zones, fnp 7.8
Percent time-spent-following, PTSFd 97.8 %
________________Level of Service and Other Performance Measures_______________
Level of service, LOS F
Volume to capacity ratio, v/c 1.07
Peak 15-min vehicle-miles of travel, VMT15 1089 veh-mi
Peak-hour vehicle-miles of travel, VMT60 4094 veh-mi
Peak 15-min total travel time, TT15 101.4 veh-h
Capacity from ATS, CdATS 1700 veh/h
Capacity from PTSF, CdPTSF 1700 veh/h
Directional Capacity 1700 veh/h
_____________________________Passing Lane Analysis____________________________
Total length of analysis segment, Lt 2.4 mi
Length of two-lane highway upstream of the passing lane, Lu - mi
Length of passing lane including tapers, Lpl - mi
Average travel speed, ATSd (from above) 10.7 mi/h
Percent time-spent-following, PTSFd (from above) 97.8
Level of service, LOSd (from above) F
___________________Average Travel Speed with Passing Lane____________________
Downstream length of two-lane highway within effective
length of passing lane for average travel speed, Lde - mi
Length of two-lane highway downstream of effective
length of the passing lane for average travel speed, Ld - mi
Adj. factor for the effect of passing lane
on average speed, fpl -
Average travel speed including passing lane, ATSpl -
Percent free flow speed including passing lane, PFFSpl 0.0 %
________________Percent Time-Spent-Following with Passing Lane________________
Downstream length of two-lane highway within effective length
of passing lane for percent time-spent-following, Lde - mi
Length of two-lane highway downstream of effective length of
the passing lane for percent time-spent-following, Ld - mi
Adj. factor for the effect of passing lane
on percent time-spent-following, fpl -
Percent time-spent-following
including passing lane, PTSFpl - %
______Level of Service and Other Performance Measures with Passing Lane ______
Level of service including passing lane, LOSpl A
Peak 15-min total travel time, TT15 - veh-h
__________________________ Bicycle Level of Service __________________________

Posted speed limit, Sp 55
Percent of segment with occupied on-highway parking 0
Pavement rating, P 3
Flow rate in outside lane, vOL 1814.9
Effective width of outside lane, We 24.00
Effective speed factor, St 4.79
Bicycle LOS Score, BLOS 4.98
Bicycle LOS E
Notes:
1. Note that the adjustment factor for level terrain is 1.00, as level terrain
is one of the base conditions. For the purpose of grade adjustment, specific
dewngrade segments are treated as level terrain.
2. If vi (vd or vo ) >= 1,700 pc/h, terminate analysis-the LOS is F.
3. For the analysis direction only and for v>200 veh/h.
4. For the analysis direction only.
5. Use alternative Exhibit 15-14 if some trucks operate at crawl speeds on a
specific downgrade.
* These items have been entered or edited to override calculated value
HCS 2010: Multilane Highways Release 6.60
Phone: Fax:
E-mail:
___________________________OPERATIONAL ANALYSIS________________________________
Analyst: KP
Agency/Co: CCTC
Date: 1/5/2015
Analysis Period: Cumulative Plus Project Friday
Highway: Highway 1
From/To: Ocean/Carmel Valley
Jurisdiction: Monterey County
Analysis Year: 2014
Project ID: Carmel Canine
_______________________________FREE-FLOW SPEED_________________________________
Direction 1 2
Lane width 12.0 ft 12.0 ft
Lateral clearance:
Right edge 6.0 ft 6.0 ft
Left edge 6.0 ft 6.0 ft
Total lateral clearance 12.0 ft 12.0 ft
Access points per mile 10 10
Median type Divided Divided
Free-flow speed: Base Base
FFS or BFFS 45.0 mph 45.0 mph
Lane width adjustment, FLW 0.0 mph 0.0 mph
Lateral clearance adjustment, FLC 0.0 mph 0.0 mph
Median type adjustment, FM 0.0 mph 0.0 mph
Access points adjustment, FA 2.5 mph 2.5 mph
Free-flow speed 42.5 mph 42.5 mph
____________________________________VOLUME_____________________________________
Direction 1 2
Volume, V 2009 vph 1706 vph
Peak-hour factor, PHF 0.97 0.97
Peak 15-minute volume, v15 518 440
Trucks and buses 8 % 8 %
Recreational vehicles 1 % 1 %
Terrain type Grade Grade
Grade 6.00 % 6.00 %
Segment length 0.00 mi 0.00 mi
Number of lanes 2 2
Driver population adjustment, fP 1.00 1.00
Trucks and buses PCE, ET 1.5 1.5
Recreational vehicles PCE, ER 4.0 4.0
Heavy vehicle adjustment, fHV 0.935 0.935
Flow rate, vp 1108 pcphpl 940 pcphpl
____________________________________RESULTS____________________________________
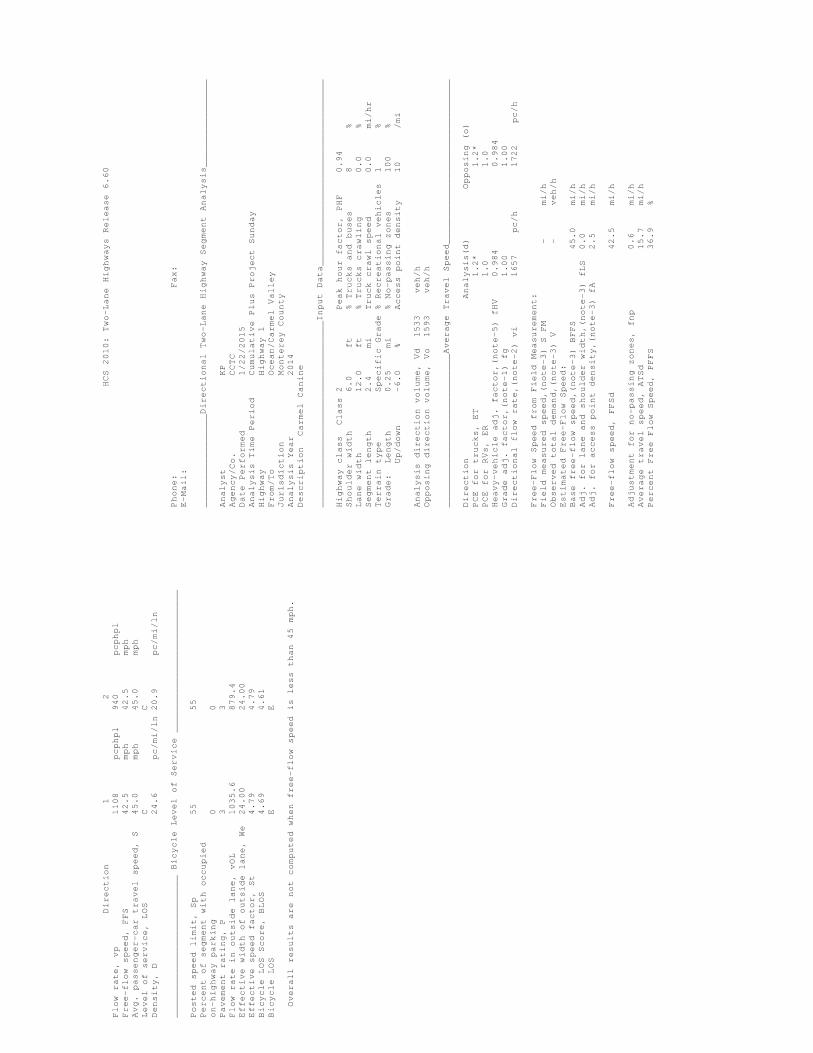
Direction 1 2
Flow rate, vp 1108 pcphpl 940 pcphpl
Free-flow speed, FFS 42.5 mph 42.5 mph
Avg. passenger-car travel speed, S 45.0 mph 45.0 mph
Level of service, LOS C C
Density, D 24.6 pc/mi/ln 20.9 pc/mi/ln
__________________________ Bicycle Level of Service __________________________
Posted speed limit, Sp 55 55
Percent of segment with occupied
on-highway parking 0 0
Pavement rating, P 3 3
Flow rate in outside lane, vOL 1035.6 879.4
Effective width of outside lane, We 24.00 24.00
Effective speed factor, St 4.79 4.79
Bicycle LOS Score, BLOS 4.69 4.61
Bicycle LOS E E
Overall results are not computed when free-flow speed is less than 45 mph.
HCS 2010: Two-Lane Highways Release 6.60
Phone: Fax:
E-Mail:
_________________Directional Two-Lane Highway Segment Analysis________________
Analyst KP
Agency/Co. CCTC
Date Performed 1/22/2015
Analysis Time Period Cumulative Plus Project Sunday
Highway Highway 1
From/To Ocean/Carmel Valley
Jurisdiction Monterey County
Analysis Year 2014
Description Carmel Canine
__________________________________Input Data__________________________________
Highway class Class 2 Peak hour factor, PHF 0.94
Shoulder width 6.0 ft % Trucks and buses 8 %
Lane width 12.0 ft % Trucks crawling 0.0 %
Segment length 2.4 mi Truck crawl speed 0.0 mi/hr
Terrain type Specific Grade % Recreational vehicles 1 %
Grade: Length 0.25 mi % No-passing zones 100 %
Up/down -6.0 % Access point density 10 /mi
Analysis direction volume, Vd 1533 veh/h
Opposing direction volume, Vo 1593 veh/h
____________________________Average Travel Speed______________________________
Direction Analysis(d) Opposing (o)
PCE for trucks, ET 1.2* 1.2*
PCE for RVs, ER 1.0 1.0
Heavy-vehicle adj. factor,(note-5) fHV 0.984 0.984
Grade adj. factor,(note-1) fg 1.00 1.00
Directional flow rate,(note-2) vi 1657 pc/h 1722 pc/h
Free-Flow Speed from Field Measurement:
Field measured speed,(note-3) S FM - mi/h
Observed total demand,(note-3) V - veh/h
Estimated Free-Flow Speed:
Base free-flow speed,(note-3) BFFS 45.0 mi/h
Adj. for lane and shoulder width,(note-3) fLS 0.0 mi/h
Adj. for access point density,(note-3) fA 2.5 mi/h
Free-flow speed, FFSd 42.5 mi/h
Adjustment for no-passing zones, fnp 0.6 mi/h
Average travel speed, ATSd 15.7 mi/h
Percent Free Flow Speed, PFFS 36.9 %

_________________________Percent Time-Spent-Following_________________________
Direction Analysis(d) Opposing (o)
PCE for trucks, ET 1.0* 1.0*
PCE for RVs, ER 1.0 1.0
Heavy-vehicle adjustment factor, fHV 1.000 1.000
Grade adjustment factor,(note-1) fg 1.00 1.00
Directional flow rate,(note-2) vi 1631 pc/h 1695 pc/h
Base percent time-spent-following,(note-4) BPTSFd 92.7 %
Adjustment for no-passing zones, fnp 6.5
Percent time-spent-following, PTSFd 95.9 %
________________Level of Service and Other Performance Measures_______________
Level of service, LOS F
Volume to capacity ratio, v/c 0.96
Peak 15-min vehicle-miles of travel, VMT15 979 veh-mi
Peak-hour vehicle-miles of travel, VMT60 3679 veh-mi
Peak 15-min total travel time, TT15 62.4 veh-h
Capacity from ATS, CdATS 1700 veh/h
Capacity from PTSF, CdPTSF 1700 veh/h
Directional Capacity 1700 veh/h
_____________________________Passing Lane Analysis____________________________
Total length of analysis segment, Lt 2.4 mi
Length of two-lane highway upstream of the passing lane, Lu - mi
Length of passing lane including tapers, Lpl - mi
Average travel speed, ATSd (from above) 15.7 mi/h
Percent time-spent-following, PTSFd (from above) 95.9
Level of service, LOSd (from above) F
___________________Average Travel Speed with Passing Lane____________________
Downstream length of two-lane highway within effective
length of passing lane for average travel speed, Lde - mi
Length of two-lane highway downstream of effective
length of the passing lane for average travel speed, Ld - mi
Adj. factor for the effect of passing lane
on average speed, fpl -
Average travel speed including passing lane, ATSpl -
Percent free flow speed including passing lane, PFFSpl 0.0 %
________________Percent Time-Spent-Following with Passing Lane________________
Downstream length of two-lane highway within effective length
of passing lane for percent time-spent-following, Lde - mi
Length of two-lane highway downstream of effective length of
the passing lane for percent time-spent-following, Ld - mi
Adj. factor for the effect of passing lane
on percent time-spent-following, fpl -
Percent time-spent-following
including passing lane, PTSFpl - %
______Level of Service and Other Performance Measures with Passing Lane ______
Level of service including passing lane, LOSpl A
Peak 15-min total travel time, TT15 - veh-h
__________________________ Bicycle Level of Service __________________________
Posted speed limit, Sp 55
Percent of segment with occupied on-highway parking 0
Pavement rating, P 3
Flow rate in outside lane, vOL 1630.9
Effective width of outside lane, We 24.00
Effective speed factor, St 4.79
Bicycle LOS Score, BLOS 4.92
Bicycle LOS E
Notes:
1. Note that the adjustment factor for level terrain is 1.00, as level terrain
is one of the base conditions. For the purpose of grade adjustment, specific
dewngrade segments are treated as level terrain.
2. If vi (vd or vo ) >= 1,700 pc/h, terminate analysis-the LOS is F.
3. For the analysis direction only and for v>200 veh/h.
4. For the analysis direction only.
5. Use alternative Exhibit 15-14 if some trucks operate at crawl speeds on a
specific downgrade.
* These items have been entered or edited to override calculated value

HCS 2010: Multilane Highways Release 6.60
Phone: Fax:
E-mail:
___________________________OPERATIONAL ANALYSIS________________________________
Analyst: KP
Agency/Co: CCTC
Date: 1/5/2015
Analysis Period: Cumulative Plus Project Sunday
Highway: Highway 1
From/To: Ocean/Carmel Valley
Jurisdiction: Monterey County
Analysis Year: 2014
Project ID: Carmel Canine
_______________________________FREE-FLOW SPEED_________________________________
Direction 1 2
Lane width 12.0 ft 12.0 ft
Lateral clearance:
Right edge 6.0 ft 6.0 ft
Left edge 6.0 ft 6.0 ft
Total lateral clearance 12.0 ft 12.0 ft
Access points per mile 10 10
Median type Divided Divided
Free-flow speed: Base Base
FFS or BFFS 45.0 mph 45.0 mph
Lane width adjustment, FLW 0.0 mph 0.0 mph
Lateral clearance adjustment, FLC 0.0 mph 0.0 mph
Median type adjustment, FM 0.0 mph 0.0 mph
Access points adjustment, FA 2.5 mph 2.5 mph
Free-flow speed 42.5 mph 42.5 mph
____________________________________VOLUME_____________________________________
Direction 1 2
Volume, V 1593 vph 1533 vph
Peak-hour factor, PHF 0.94 0.94
Peak 15-minute volume, v15 424 408
Trucks and buses 8 % 8 %
Recreational vehicles 1 % 1 %
Terrain type Grade Grade
Grade 6.00 % 6.00 %
Segment length 0.00 mi 0.00 mi
Number of lanes 2 2
Driver population adjustment, fP 1.00 1.00
Trucks and buses PCE, ET 1.5 1.5
Recreational vehicles PCE, ER 4.0 4.0
Heavy vehicle adjustment, fHV 0.935 0.935
Flow rate, vp 906 pcphpl 872 pcphpl
____________________________________RESULTS____________________________________
Direction 1 2
Flow rate, vp 906 pcphpl 872 pcphpl
Free-flow speed, FFS 42.5 mph 42.5 mph
Avg. passenger-car travel speed, S 45.0 mph 45.0 mph
Level of service, LOS C C
Density, D 20.1 pc/mi/ln 19.4 pc/mi/ln
__________________________ Bicycle Level of Service __________________________
Posted speed limit, Sp 55 55
Percent of segment with occupied
on-highway parking 0 0
Pavement rating, P 3 3
Flow rate in outside lane, vOL 847.3 815.4
Effective width of outside lane, We 24.00 24.00
Effective speed factor, St 4.79 4.79
Bicycle LOS Score, BLOS 4.59 4.57
Bicycle LOS E E
Overall results are not computed when free-flow speed is less than 45 mph.

HCS 2010: Two-Lane Highways Release 6.60
Phone: Fax:
E-Mail:
_________________Directional Two-Lane Highway Segment Analysis________________
Analyst KP
Agency/Co. CCTC
Date Performed 2/2/2015
Analysis Time Period Existing AM
Highway Carmel Valley Road
From/To Rancho San Carlos/Schulte
Jurisdiction Unincorporated Monterey County
Analysis Year 2014
Description Carmel Canine
__________________________________Input Data__________________________________
Highway class Class 2 Peak hour factor, PHF 0.93
Shoulder width 6.0 ft % Trucks and buses 8 %
Lane width 12.0 ft % Trucks crawling 0.0 %
Segment length 2.4 mi Truck crawl speed 0.0 mi/hr
Terrain type Level % Recreational vehicles 1 %
Grade: Length - mi % No-passing zones 100 %
Up/down - % Access point density 14 /mi
Analysis direction volume, Vd 528 veh/h
Opposing direction volume, Vo 833 veh/h
____________________________Average Travel Speed______________________________
Direction Analysis(d) Opposing (o)
PCE for trucks, ET 1.2* 1.2*
PCE for RVs, ER 1.0 1.0
Heavy-vehicle adj. factor,(note-5) fHV 0.984 0.984
Grade adj. factor,(note-1) fg 1.00 1.00
Directional flow rate,(note-2) vi 577 pc/h 910 pc/h
Free-Flow Speed from Field Measurement:
Field measured speed,(note-3) S FM - mi/h
Observed total demand,(note-3) V - veh/h
Estimated Free-Flow Speed:
Base free-flow speed,(note-3) BFFS 45.0 mi/h
Adj. for lane and shoulder width,(note-3) fLS 0.0 mi/h
Adj. for access point density,(note-3) fA 3.5 mi/h
Free-flow speed, FFSd 41.5 mi/h
Adjustment for no-passing zones, fnp 1.1 mi/h
Average travel speed, ATSd 28.8 mi/h
Percent Free Flow Speed, PFFS 69.4 %
_________________________Percent Time-Spent-Following_________________________
Direction Analysis(d) Opposing (o)
PCE for trucks, ET 1.0* 1.0*
PCE for RVs, ER 1.0 1.0
Heavy-vehicle adjustment factor, fHV 1.000 1.000
Grade adjustment factor,(note-1) fg 1.00 1.00
Directional flow rate,(note-2) vi 568 pc/h 896 pc/h
Base percent time-spent-following,(note-4) BPTSFd 59.9 %
Adjustment for no-passing zones, fnp 25.7
Percent time-spent-following, PTSFd 69.9 %
________________Level of Service and Other Performance Measures_______________
Level of service, LOS C
Volume to capacity ratio, v/c 0.33
Peak 15-min vehicle-miles of travel, VMT15 341 veh-mi
Peak-hour vehicle-miles of travel, VMT60 1267 veh-mi
Peak 15-min total travel time, TT15 11.8 veh-h
Capacity from ATS, CdATS 1700 veh/h
Capacity from PTSF, CdPTSF 1700 veh/h
Directional Capacity 1700 veh/h
_____________________________Passing Lane Analysis____________________________
Total length of analysis segment, Lt 2.4 mi
Length of two-lane highway upstream of the passing lane, Lu - mi
Length of passing lane including tapers, Lpl - mi
Average travel speed, ATSd (from above) 28.8 mi/h
Percent time-spent-following, PTSFd (from above) 69.9
Level of service, LOSd (from above) C
___________________Average Travel Speed with Passing Lane____________________
Downstream length of two-lane highway within effective
length of passing lane for average travel speed, Lde - mi
Length of two-lane highway downstream of effective
length of the passing lane for average travel speed, Ld - mi
Adj. factor for the effect of passing lane
on average speed, fpl -
Average travel speed including passing lane, ATSpl -
Percent free flow speed including passing lane, PFFSpl 0.0 %
________________Percent Time-Spent-Following with Passing Lane________________
Downstream length of two-lane highway within effective length
of passing lane for percent time-spent-following, Lde - mi
Length of two-lane highway downstream of effective length of
the passing lane for percent time-spent-following, Ld - mi
Adj. factor for the effect of passing lane
on percent time-spent-following, fpl -
Percent time-spent-following
including passing lane, PTSFpl - %
______Level of Service and Other Performance Measures with Passing Lane ______
Level of service including passing lane, LOSpl A
Peak 15-min total travel time, TT15 - veh-h
__________________________ Bicycle Level of Service __________________________

Posted speed limit, Sp 55
Percent of segment with occupied on-highway parking 0
Pavement rating, P 3
Flow rate in outside lane, vOL 567.7
Effective width of outside lane, We 24.00
Effective speed factor, St 4.79
Bicycle LOS Score, BLOS 4.39
Bicycle LOS D
Notes:
1. Note that the adjustment factor for level terrain is 1.00, as level terrain
is one of the base conditions. For the purpose of grade adjustment, specific
dewngrade segments are treated as level terrain.
2. If vi (vd or vo ) >= 1,700 pc/h, terminate analysis-the LOS is F.
3. For the analysis direction only and for v>200 veh/h.
4. For the analysis direction only.
5. Use alternative Exhibit 15-14 if some trucks operate at crawl speeds on a
specific downgrade.
* These items have been entered or edited to override calculated value
HCS 2010: Two-Lane Highways Release 6.60
Phone: Fax:
E-Mail:
_________________Directional Two-Lane Highway Segment Analysis________________
Analyst KP
Agency/Co. CCTC
Date Performed 2/2/2015
Analysis Time Period Existing AM
Highway Carmel Valley Road
From/To Rancho San Carlos/Schulte
Jurisdiction Unincorporated Monterey County
Analysis Year 2014
Description Carmel Canine
__________________________________Input Data__________________________________
Highway class Class 2 Peak hour factor, PHF 0.93
Shoulder width 6.0 ft % Trucks and buses 8 %
Lane width 12.0 ft % Trucks crawling 0.0 %
Segment length 2.4 mi Truck crawl speed 0.0 mi/hr
Terrain type Level % Recreational vehicles 1 %
Grade: Length - mi % No-passing zones 100 %
Up/down - % Access point density 14 /mi
Analysis direction volume, Vd 833 veh/h
Opposing direction volume, Vo 528 veh/h
____________________________Average Travel Speed______________________________
Direction Analysis(d) Opposing (o)
PCE for trucks, ET 1.2* 1.2*
PCE for RVs, ER 1.0 1.0
Heavy-vehicle adj. factor,(note-5) fHV 0.984 0.984
Grade adj. factor,(note-1) fg 1.00 1.00
Directional flow rate,(note-2) vi 910 pc/h 577 pc/h
Free-Flow Speed from Field Measurement:
Field measured speed,(note-3) S FM - mi/h
Observed total demand,(note-3) V - veh/h
Estimated Free-Flow Speed:
Base free-flow speed,(note-3) BFFS 45.0 mi/h
Adj. for lane and shoulder width,(note-3) fLS 0.0 mi/h
Adj. for access point density,(note-3) fA 3.5 mi/h
Free-flow speed, FFSd 41.5 mi/h
Adjustment for no-passing zones, fnp 1.9 mi/h
Average travel speed, ATSd 28.1 mi/h
Percent Free Flow Speed, PFFS 67.6 %

_________________________Percent Time-Spent-Following_________________________
Direction Analysis(d) Opposing (o)
PCE for trucks, ET 1.0* 1.0*
PCE for RVs, ER 1.0 1.0
Heavy-vehicle adjustment factor, fHV 1.000 1.000
Grade adjustment factor,(note-1) fg 1.00 1.00
Directional flow rate,(note-2) vi 896 pc/h 568 pc/h
Base percent time-spent-following,(note-4) BPTSFd 70.2 %
Adjustment for no-passing zones, fnp 25.7
Percent time-spent-following, PTSFd 85.9 %
________________Level of Service and Other Performance Measures_______________
Level of service, LOS E
Volume to capacity ratio, v/c 0.53
Peak 15-min vehicle-miles of travel, VMT15 537 veh-mi
Peak-hour vehicle-miles of travel, VMT60 1999 veh-mi
Peak 15-min total travel time, TT15 19.1 veh-h
Capacity from ATS, CdATS 0 veh/h
Capacity from PTSF, CdPTSF 1700 veh/h
Directional Capacity 1700 veh/h
_____________________________Passing Lane Analysis____________________________
Total length of analysis segment, Lt 2.4 mi
Length of two-lane highway upstream of the passing lane, Lu - mi
Length of passing lane including tapers, Lpl - mi
Average travel speed, ATSd (from above) 28.1 mi/h
Percent time-spent-following, PTSFd (from above) 85.9
Level of service, LOSd (from above) E
___________________Average Travel Speed with Passing Lane____________________
Downstream length of two-lane highway within effective
length of passing lane for average travel speed, Lde - mi
Length of two-lane highway downstream of effective
length of the passing lane for average travel speed, Ld - mi
Adj. factor for the effect of passing lane
on average speed, fpl -
Average travel speed including passing lane, ATSpl -
Percent free flow speed including passing lane, PFFSpl 0.0 %
________________Percent Time-Spent-Following with Passing Lane________________
Downstream length of two-lane highway within effective length
of passing lane for percent time-spent-following, Lde - mi
Length of two-lane highway downstream of effective length of
the passing lane for percent time-spent-following, Ld - mi
Adj. factor for the effect of passing lane
on percent time-spent-following, fpl -
Percent time-spent-following
including passing lane, PTSFpl - %
______Level of Service and Other Performance Measures with Passing Lane ______
Level of service including passing lane, LOSpl A
Peak 15-min total travel time, TT15 - veh-h
__________________________ Bicycle Level of Service __________________________
Posted speed limit, Sp 55
Percent of segment with occupied on-highway parking 0
Pavement rating, P 3
Flow rate in outside lane, vOL 895.7
Effective width of outside lane, We 24.00
Effective speed factor, St 4.79
Bicycle LOS Score, BLOS 4.62
Bicycle LOS E
Notes:
1. Note that the adjustment factor for level terrain is 1.00, as level terrain
is one of the base conditions. For the purpose of grade adjustment, specific
dewngrade segments are treated as level terrain.
2. If vi (vd or vo ) >= 1,700 pc/h, terminate analysis-the LOS is F.
3. For the analysis direction only and for v>200 veh/h.
4. For the analysis direction only.
5. Use alternative Exhibit 15-14 if some trucks operate at crawl speeds on a
specific downgrade.
* These items have been entered or edited to override calculated value

HCS 2010: Two-Lane Highways Release 6.60
Phone: Fax:
E-Mail:
_________________Directional Two-Lane Highway Segment Analysis________________
Analyst KP
Agency/Co. CCTC
Date Performed 2/2/2015
Analysis Time Period Existing PM
Highway Carmel Valley Road
From/To Rancho San Carlos/Schulte
Jurisdiction Unincorporated Monterey County
Analysis Year 2014
Description Carmel Canine
__________________________________Input Data__________________________________
Highway class Class 2 Peak hour factor, PHF 0.93
Shoulder width 6.0 ft % Trucks and buses 8 %
Lane width 12.0 ft % Trucks crawling 0.0 %
Segment length 2.4 mi Truck crawl speed 0.0 mi/hr
Terrain type Level % Recreational vehicles 1 %
Grade: Length - mi % No-passing zones 100 %
Up/down - % Access point density 14 /mi
Analysis direction volume, Vd 624 veh/h
Opposing direction volume, Vo 859 veh/h
____________________________Average Travel Speed______________________________
Direction Analysis(d) Opposing (o)
PCE for trucks, ET 1.2* 1.2*
PCE for RVs, ER 1.0 1.0
Heavy-vehicle adj. factor,(note-5) fHV 0.984 0.984
Grade adj. factor,(note-1) fg 1.00 1.00
Directional flow rate,(note-2) vi 682 pc/h 939 pc/h
Free-Flow Speed from Field Measurement:
Field measured speed,(note-3) S FM - mi/h
Observed total demand,(note-3) V - veh/h
Estimated Free-Flow Speed:
Base free-flow speed,(note-3) BFFS 45.0 mi/h
Adj. for lane and shoulder width,(note-3) fLS 0.0 mi/h
Adj. for access point density,(note-3) fA 3.5 mi/h
Free-flow speed, FFSd 41.5 mi/h
Adjustment for no-passing zones, fnp 1.1 mi/h
Average travel speed, ATSd 27.8 mi/h
Percent Free Flow Speed, PFFS 67.0 %
_________________________Percent Time-Spent-Following_________________________
Direction Analysis(d) Opposing (o)
PCE for trucks, ET 1.0* 1.0*
PCE for RVs, ER 1.0 1.0
Heavy-vehicle adjustment factor, fHV 1.000 1.000
Grade adjustment factor,(note-1) fg 1.00 1.00
Directional flow rate,(note-2) vi 671 pc/h 924 pc/h
Base percent time-spent-following,(note-4) BPTSFd 65.0 %
Adjustment for no-passing zones, fnp 24.3
Percent time-spent-following, PTSFd 75.2 %
________________Level of Service and Other Performance Measures_______________
Level of service, LOS D
Volume to capacity ratio, v/c 0.39
Peak 15-min vehicle-miles of travel, VMT15 403 veh-mi
Peak-hour vehicle-miles of travel, VMT60 1498 veh-mi
Peak 15-min total travel time, TT15 14.5 veh-h
Capacity from ATS, CdATS 1700 veh/h
Capacity from PTSF, CdPTSF 1700 veh/h
Directional Capacity 1700 veh/h
_____________________________Passing Lane Analysis____________________________
Total length of analysis segment, Lt 2.4 mi
Length of two-lane highway upstream of the passing lane, Lu - mi
Length of passing lane including tapers, Lpl - mi
Average travel speed, ATSd (from above) 27.8 mi/h
Percent time-spent-following, PTSFd (from above) 75.2
Level of service, LOSd (from above) D
___________________Average Travel Speed with Passing Lane____________________
Downstream length of two-lane highway within effective
length of passing lane for average travel speed, Lde - mi
Length of two-lane highway downstream of effective
length of the passing lane for average travel speed, Ld - mi
Adj. factor for the effect of passing lane
on average speed, fpl -
Average travel speed including passing lane, ATSpl -
Percent free flow speed including passing lane, PFFSpl 0.0 %
________________Percent Time-Spent-Following with Passing Lane________________
Downstream length of two-lane highway within effective length
of passing lane for percent time-spent-following, Lde - mi
Length of two-lane highway downstream of effective length of
the passing lane for percent time-spent-following, Ld - mi
Adj. factor for the effect of passing lane
on percent time-spent-following, fpl -
Percent time-spent-following
including passing lane, PTSFpl - %
______Level of Service and Other Performance Measures with Passing Lane ______
Level of service including passing lane, LOSpl A
Peak 15-min total travel time, TT15 - veh-h
__________________________ Bicycle Level of Service __________________________

Posted speed limit, Sp 55
Percent of segment with occupied on-highway parking 0
Pavement rating, P 3
Flow rate in outside lane, vOL 671.0
Effective width of outside lane, We 24.00
Effective speed factor, St 4.79
Bicycle LOS Score, BLOS 4.47
Bicycle LOS D
Notes:
1. Note that the adjustment factor for level terrain is 1.00, as level terrain
is one of the base conditions. For the purpose of grade adjustment, specific
dewngrade segments are treated as level terrain.
2. If vi (vd or vo ) >= 1,700 pc/h, terminate analysis-the LOS is F.
3. For the analysis direction only and for v>200 veh/h.
4. For the analysis direction only.
5. Use alternative Exhibit 15-14 if some trucks operate at crawl speeds on a
specific downgrade.
* These items have been entered or edited to override calculated value
HCS 2010: Two-Lane Highways Release 6.60
Phone: Fax:
E-Mail:
_________________Directional Two-Lane Highway Segment Analysis________________
Analyst KP
Agency/Co. CCTC
Date Performed 2/2/2015
Analysis Time Period Existing PM
Highway Carmel Valley Road
From/To Rancho San Carlos/Schulte
Jurisdiction Unincorporated Monterey County
Analysis Year 2014
Description Carmel Canine
__________________________________Input Data__________________________________
Highway class Class 2 Peak hour factor, PHF 0.93
Shoulder width 6.0 ft % Trucks and buses 8 %
Lane width 12.0 ft % Trucks crawling 0.0 %
Segment length 2.4 mi Truck crawl speed 0.0 mi/hr
Terrain type Level % Recreational vehicles 1 %
Grade: Length - mi % No-passing zones 100 %
Up/down - % Access point density 14 /mi
Analysis direction volume, Vd 859 veh/h
Opposing direction volume, Vo 624 veh/h
____________________________Average Travel Speed______________________________
Direction Analysis(d) Opposing (o)
PCE for trucks, ET 1.2* 1.2*
PCE for RVs, ER 1.0 1.0
Heavy-vehicle adj. factor,(note-5) fHV 0.984 0.984
Grade adj. factor,(note-1) fg 1.00 1.00
Directional flow rate,(note-2) vi 939 pc/h 682 pc/h
Free-Flow Speed from Field Measurement:
Field measured speed,(note-3) S FM - mi/h
Observed total demand,(note-3) V - veh/h
Estimated Free-Flow Speed:
Base free-flow speed,(note-3) BFFS 45.0 mi/h
Adj. for lane and shoulder width,(note-3) fLS 0.0 mi/h
Adj. for access point density,(note-3) fA 3.5 mi/h
Free-flow speed, FFSd 41.5 mi/h
Adjustment for no-passing zones, fnp 1.6 mi/h
Average travel speed, ATSd 27.4 mi/h
Percent Free Flow Speed, PFFS 65.9 %

_________________________Percent Time-Spent-Following_________________________
Direction Analysis(d) Opposing (o)
PCE for trucks, ET 1.0* 1.0*
PCE for RVs, ER 1.0 1.0
Heavy-vehicle adjustment factor, fHV 1.000 1.000
Grade adjustment factor,(note-1) fg 1.00 1.00
Directional flow rate,(note-2) vi 924 pc/h 671 pc/h
Base percent time-spent-following,(note-4) BPTSFd 72.4 %
Adjustment for no-passing zones, fnp 24.3
Percent time-spent-following, PTSFd 86.5 %
________________Level of Service and Other Performance Measures_______________
Level of service, LOS E
Volume to capacity ratio, v/c 0.54
Peak 15-min vehicle-miles of travel, VMT15 554 veh-mi
Peak-hour vehicle-miles of travel, VMT60 2062 veh-mi
Peak 15-min total travel time, TT15 20.2 veh-h
Capacity from ATS, CdATS 0 veh/h
Capacity from PTSF, CdPTSF 1700 veh/h
Directional Capacity 1700 veh/h
_____________________________Passing Lane Analysis____________________________
Total length of analysis segment, Lt 2.4 mi
Length of two-lane highway upstream of the passing lane, Lu - mi
Length of passing lane including tapers, Lpl - mi
Average travel speed, ATSd (from above) 27.4 mi/h
Percent time-spent-following, PTSFd (from above) 86.5
Level of service, LOSd (from above) E
___________________Average Travel Speed with Passing Lane____________________
Downstream length of two-lane highway within effective
length of passing lane for average travel speed, Lde - mi
Length of two-lane highway downstream of effective
length of the passing lane for average travel speed, Ld - mi
Adj. factor for the effect of passing lane
on average speed, fpl -
Average travel speed including passing lane, ATSpl -
Percent free flow speed including passing lane, PFFSpl 0.0 %
________________Percent Time-Spent-Following with Passing Lane________________
Downstream length of two-lane highway within effective length
of passing lane for percent time-spent-following, Lde - mi
Length of two-lane highway downstream of effective length of
the passing lane for percent time-spent-following, Ld - mi
Adj. factor for the effect of passing lane
on percent time-spent-following, fpl -
Percent time-spent-following
including passing lane, PTSFpl - %
______Level of Service and Other Performance Measures with Passing Lane ______
Level of service including passing lane, LOSpl A
Peak 15-min total travel time, TT15 - veh-h
__________________________ Bicycle Level of Service __________________________
Posted speed limit, Sp 55
Percent of segment with occupied on-highway parking 0
Pavement rating, P 3
Flow rate in outside lane, vOL 923.7
Effective width of outside lane, We 24.00
Effective speed factor, St 4.79
Bicycle LOS Score, BLOS 4.63
Bicycle LOS E
Notes:
1. Note that the adjustment factor for level terrain is 1.00, as level terrain
is one of the base conditions. For the purpose of grade adjustment, specific
dewngrade segments are treated as level terrain.
2. If vi (vd or vo ) >= 1,700 pc/h, terminate analysis-the LOS is F.
3. For the analysis direction only and for v>200 veh/h.
4. For the analysis direction only.
5. Use alternative Exhibit 15-14 if some trucks operate at crawl speeds on a
specific downgrade.
* These items have been entered or edited to override calculated value

HCS 2010: Two-Lane Highways Release 6.60
Phone: Fax:
E-Mail:
_________________Directional Two-Lane Highway Segment Analysis________________
Analyst KP
Agency/Co. CCTC
Date Performed 2/2/2015
Analysis Time Period Existing Friday
Highway Carmel Valley Road
From/To Rancho San Carlos/Schulte
Jurisdiction Unincorporated Monterey County
Analysis Year 2014
Description Carmel Canine
__________________________________Input Data__________________________________
Highway class Class 2 Peak hour factor, PHF 0.93
Shoulder width 6.0 ft % Trucks and buses 8 %
Lane width 12.0 ft % Trucks crawling 0.0 %
Segment length 2.4 mi Truck crawl speed 0.0 mi/hr
Terrain type Level % Recreational vehicles 1 %
Grade: Length - mi % No-passing zones 100 %
Up/down - % Access point density 14 /mi
Analysis direction volume, Vd 603 veh/h
Opposing direction volume, Vo 914 veh/h
____________________________Average Travel Speed______________________________
Direction Analysis(d) Opposing (o)
PCE for trucks, ET 1.2* 1.2*
PCE for RVs, ER 1.0 1.0
Heavy-vehicle adj. factor,(note-5) fHV 0.984 0.984
Grade adj. factor,(note-1) fg 1.00 1.00
Directional flow rate,(note-2) vi 659 pc/h 999 pc/h
Free-Flow Speed from Field Measurement:
Field measured speed,(note-3) S FM - mi/h
Observed total demand,(note-3) V - veh/h
Estimated Free-Flow Speed:
Base free-flow speed,(note-3) BFFS 45.0 mi/h
Adj. for lane and shoulder width,(note-3) fLS 0.0 mi/h
Adj. for access point density,(note-3) fA 3.5 mi/h
Free-flow speed, FFSd 41.5 mi/h
Adjustment for no-passing zones, fnp 1.1 mi/h
Average travel speed, ATSd 27.5 mi/h
Percent Free Flow Speed, PFFS 66.3 %
_________________________Percent Time-Spent-Following_________________________
Direction Analysis(d) Opposing (o)
PCE for trucks, ET 1.0* 1.0*
PCE for RVs, ER 1.0 1.0
Heavy-vehicle adjustment factor, fHV 1.000 1.000
Grade adjustment factor,(note-1) fg 1.00 1.00
Directional flow rate,(note-2) vi 648 pc/h 983 pc/h
Base percent time-spent-following,(note-4) BPTSFd 65.0 %
Adjustment for no-passing zones, fnp 23.3
Percent time-spent-following, PTSFd 74.3 %
________________Level of Service and Other Performance Measures_______________
Level of service, LOS D
Volume to capacity ratio, v/c 0.38
Peak 15-min vehicle-miles of travel, VMT15 389 veh-mi
Peak-hour vehicle-miles of travel, VMT60 1447 veh-mi
Peak 15-min total travel time, TT15 14.1 veh-h
Capacity from ATS, CdATS 1700 veh/h
Capacity from PTSF, CdPTSF 1700 veh/h
Directional Capacity 1700 veh/h
_____________________________Passing Lane Analysis____________________________
Total length of analysis segment, Lt 2.4 mi
Length of two-lane highway upstream of the passing lane, Lu - mi
Length of passing lane including tapers, Lpl - mi
Average travel speed, ATSd (from above) 27.5 mi/h
Percent time-spent-following, PTSFd (from above) 74.3
Level of service, LOSd (from above) D
___________________Average Travel Speed with Passing Lane____________________
Downstream length of two-lane highway within effective
length of passing lane for average travel speed, Lde - mi
Length of two-lane highway downstream of effective
length of the passing lane for average travel speed, Ld - mi
Adj. factor for the effect of passing lane
on average speed, fpl -
Average travel speed including passing lane, ATSpl -
Percent free flow speed including passing lane, PFFSpl 0.0 %
________________Percent Time-Spent-Following with Passing Lane________________
Downstream length of two-lane highway within effective length
of passing lane for percent time-spent-following, Lde - mi
Length of two-lane highway downstream of effective length of
the passing lane for percent time-spent-following, Ld - mi
Adj. factor for the effect of passing lane
on percent time-spent-following, fpl -
Percent time-spent-following
including passing lane, PTSFpl - %
______Level of Service and Other Performance Measures with Passing Lane ______
Level of service including passing lane, LOSpl A
Peak 15-min total travel time, TT15 - veh-h
__________________________ Bicycle Level of Service __________________________

Posted speed limit, Sp 55
Percent of segment with occupied on-highway parking 0
Pavement rating, P 3
Flow rate in outside lane, vOL 648.4
Effective width of outside lane, We 24.00
Effective speed factor, St 4.79
Bicycle LOS Score, BLOS 4.45
Bicycle LOS D
Notes:
1. Note that the adjustment factor for level terrain is 1.00, as level terrain
is one of the base conditions. For the purpose of grade adjustment, specific
dewngrade segments are treated as level terrain.
2. If vi (vd or vo ) >= 1,700 pc/h, terminate analysis-the LOS is F.
3. For the analysis direction only and for v>200 veh/h.
4. For the analysis direction only.
5. Use alternative Exhibit 15-14 if some trucks operate at crawl speeds on a
specific downgrade.
* These items have been entered or edited to override calculated value
HCS 2010: Two-Lane Highways Release 6.60
Phone: Fax:
E-Mail:
_________________Directional Two-Lane Highway Segment Analysis________________
Analyst KP
Agency/Co. CCTC
Date Performed 2/2/2015
Analysis Time Period Existing Friday
Highway Carmel Valley Road
From/To Rancho San Carlos/Schulte
Jurisdiction Unincorporated Monterey County
Analysis Year 2014
Description Carmel Canine
__________________________________Input Data__________________________________
Highway class Class 2 Peak hour factor, PHF 0.93
Shoulder width 6.0 ft % Trucks and buses 8 %
Lane width 12.0 ft % Trucks crawling 0.0 %
Segment length 2.4 mi Truck crawl speed 0.0 mi/hr
Terrain type Level % Recreational vehicles 1 %
Grade: Length - mi % No-passing zones 100 %
Up/down - % Access point density 14 /mi
Analysis direction volume, Vd 914 veh/h
Opposing direction volume, Vo 603 veh/h
____________________________Average Travel Speed______________________________
Direction Analysis(d) Opposing (o)
PCE for trucks, ET 1.2* 1.2*
PCE for RVs, ER 1.0 1.0
Heavy-vehicle adj. factor,(note-5) fHV 0.984 0.984
Grade adj. factor,(note-1) fg 1.00 1.00
Directional flow rate,(note-2) vi 999 pc/h 659 pc/h
Free-Flow Speed from Field Measurement:
Field measured speed,(note-3) S FM - mi/h
Observed total demand,(note-3) V - veh/h
Estimated Free-Flow Speed:
Base free-flow speed,(note-3) BFFS 45.0 mi/h
Adj. for lane and shoulder width,(note-3) fLS 0.0 mi/h
Adj. for access point density,(note-3) fA 3.5 mi/h
Free-flow speed, FFSd 41.5 mi/h
Adjustment for no-passing zones, fnp 1.6 mi/h
Average travel speed, ATSd 27.0 mi/h
Percent Free Flow Speed, PFFS 65.1 %

_________________________Percent Time-Spent-Following_________________________
Direction Analysis(d) Opposing (o)
PCE for trucks, ET 1.0* 1.0*
PCE for RVs, ER 1.0 1.0
Heavy-vehicle adjustment factor, fHV 1.000 1.000
Grade adjustment factor,(note-1) fg 1.00 1.00
Directional flow rate,(note-2) vi 983 pc/h 648 pc/h
Base percent time-spent-following,(note-4) BPTSFd 74.3 %
Adjustment for no-passing zones, fnp 23.3
Percent time-spent-following, PTSFd 88.3 %
________________Level of Service and Other Performance Measures_______________
Level of service, LOS E
Volume to capacity ratio, v/c 0.58
Peak 15-min vehicle-miles of travel, VMT15 590 veh-mi
Peak-hour vehicle-miles of travel, VMT60 2194 veh-mi
Peak 15-min total travel time, TT15 21.8 veh-h
Capacity from ATS, CdATS 0 veh/h
Capacity from PTSF, CdPTSF 1700 veh/h
Directional Capacity 1700 veh/h
_____________________________Passing Lane Analysis____________________________
Total length of analysis segment, Lt 2.4 mi
Length of two-lane highway upstream of the passing lane, Lu - mi
Length of passing lane including tapers, Lpl - mi
Average travel speed, ATSd (from above) 27.0 mi/h
Percent time-spent-following, PTSFd (from above) 88.3
Level of service, LOSd (from above) E
___________________Average Travel Speed with Passing Lane____________________
Downstream length of two-lane highway within effective
length of passing lane for average travel speed, Lde - mi
Length of two-lane highway downstream of effective
length of the passing lane for average travel speed, Ld - mi
Adj. factor for the effect of passing lane
on average speed, fpl -
Average travel speed including passing lane, ATSpl -
Percent free flow speed including passing lane, PFFSpl 0.0 %
________________Percent Time-Spent-Following with Passing Lane________________
Downstream length of two-lane highway within effective length
of passing lane for percent time-spent-following, Lde - mi
Length of two-lane highway downstream of effective length of
the passing lane for percent time-spent-following, Ld - mi
Adj. factor for the effect of passing lane
on percent time-spent-following, fpl -
Percent time-spent-following
including passing lane, PTSFpl - %
______Level of Service and Other Performance Measures with Passing Lane ______
Level of service including passing lane, LOSpl A
Peak 15-min total travel time, TT15 - veh-h
__________________________ Bicycle Level of Service __________________________
Posted speed limit, Sp 55
Percent of segment with occupied on-highway parking 0
Pavement rating, P 3
Flow rate in outside lane, vOL 982.8
Effective width of outside lane, We 24.00
Effective speed factor, St 4.79
Bicycle LOS Score, BLOS 4.66
Bicycle LOS E
Notes:
1. Note that the adjustment factor for level terrain is 1.00, as level terrain
is one of the base conditions. For the purpose of grade adjustment, specific
dewngrade segments are treated as level terrain.
2. If vi (vd or vo ) >= 1,700 pc/h, terminate analysis-the LOS is F.
3. For the analysis direction only and for v>200 veh/h.
4. For the analysis direction only.
5. Use alternative Exhibit 15-14 if some trucks operate at crawl speeds on a
specific downgrade.
* These items have been entered or edited to override calculated value

HCS 2010: Two-Lane Highways Release 6.60
Phone: Fax:
E-Mail:
_________________Directional Two-Lane Highway Segment Analysis________________
Analyst KP
Agency/Co. CCTC
Date Performed 2/2/2015
Analysis Time Period Existing Sunday
Highway Carmel Valley Road
From/To Rancho San Carlos/Schulte
Jurisdiction Unincorporated Monterey County
Analysis Year 2014
Description Carmel Canine
__________________________________Input Data__________________________________
Highway class Class 2 Peak hour factor, PHF 0.93
Shoulder width 6.0 ft % Trucks and buses 8 %
Lane width 12.0 ft % Trucks crawling 0.0 %
Segment length 2.4 mi Truck crawl speed 0.0 mi/hr
Terrain type Level % Recreational vehicles 1 %
Grade: Length - mi % No-passing zones 100 %
Up/down - % Access point density 14 /mi
Analysis direction volume, Vd 624 veh/h
Opposing direction volume, Vo 575 veh/h
____________________________Average Travel Speed______________________________
Direction Analysis(d) Opposing (o)
PCE for trucks, ET 1.2* 1.2*
PCE for RVs, ER 1.0 1.0
Heavy-vehicle adj. factor,(note-5) fHV 0.984 0.984
Grade adj. factor,(note-1) fg 1.00 1.00
Directional flow rate,(note-2) vi 682 pc/h 628 pc/h
Free-Flow Speed from Field Measurement:
Field measured speed,(note-3) S FM - mi/h
Observed total demand,(note-3) V - veh/h
Estimated Free-Flow Speed:
Base free-flow speed,(note-3) BFFS 45.0 mi/h
Adj. for lane and shoulder width,(note-3) fLS 0.0 mi/h
Adj. for access point density,(note-3) fA 3.5 mi/h
Free-flow speed, FFSd 41.5 mi/h
Adjustment for no-passing zones, fnp 1.7 mi/h
Average travel speed, ATSd 29.6 mi/h
Percent Free Flow Speed, PFFS 71.4 %
_________________________Percent Time-Spent-Following_________________________
Direction Analysis(d) Opposing (o)
PCE for trucks, ET 1.0* 1.0*
PCE for RVs, ER 1.0 1.0
Heavy-vehicle adjustment factor, fHV 1.000 1.000
Grade adjustment factor,(note-1) fg 1.00 1.00
Directional flow rate,(note-2) vi 671 pc/h 618 pc/h
Base percent time-spent-following,(note-4) BPTSFd 61.7 %
Adjustment for no-passing zones, fnp 31.5
Percent time-spent-following, PTSFd 78.1 %
________________Level of Service and Other Performance Measures_______________
Level of service, LOS D
Volume to capacity ratio, v/c 0.39
Peak 15-min vehicle-miles of travel, VMT15 403 veh-mi
Peak-hour vehicle-miles of travel, VMT60 1498 veh-mi
Peak 15-min total travel time, TT15 13.6 veh-h
Capacity from ATS, CdATS 0 veh/h
Capacity from PTSF, CdPTSF 1700 veh/h
Directional Capacity 1700 veh/h
_____________________________Passing Lane Analysis____________________________
Total length of analysis segment, Lt 2.4 mi
Length of two-lane highway upstream of the passing lane, Lu - mi
Length of passing lane including tapers, Lpl - mi
Average travel speed, ATSd (from above) 29.6 mi/h
Percent time-spent-following, PTSFd (from above) 78.1
Level of service, LOSd (from above) D
___________________Average Travel Speed with Passing Lane____________________
Downstream length of two-lane highway within effective
length of passing lane for average travel speed, Lde - mi
Length of two-lane highway downstream of effective
length of the passing lane for average travel speed, Ld - mi
Adj. factor for the effect of passing lane
on average speed, fpl -
Average travel speed including passing lane, ATSpl -
Percent free flow speed including passing lane, PFFSpl 0.0 %
________________Percent Time-Spent-Following with Passing Lane________________
Downstream length of two-lane highway within effective length
of passing lane for percent time-spent-following, Lde - mi
Length of two-lane highway downstream of effective length of
the passing lane for percent time-spent-following, Ld - mi
Adj. factor for the effect of passing lane
on percent time-spent-following, fpl -
Percent time-spent-following
including passing lane, PTSFpl - %
______Level of Service and Other Performance Measures with Passing Lane ______
Level of service including passing lane, LOSpl A
Peak 15-min total travel time, TT15 - veh-h
__________________________ Bicycle Level of Service __________________________

Posted speed limit, Sp 55
Percent of segment with occupied on-highway parking 0
Pavement rating, P 3
Flow rate in outside lane, vOL 671.0
Effective width of outside lane, We 24.00
Effective speed factor, St 4.79
Bicycle LOS Score, BLOS 4.47
Bicycle LOS D
Notes:
1. Note that the adjustment factor for level terrain is 1.00, as level terrain
is one of the base conditions. For the purpose of grade adjustment, specific
dewngrade segments are treated as level terrain.
2. If vi (vd or vo ) >= 1,700 pc/h, terminate analysis-the LOS is F.
3. For the analysis direction only and for v>200 veh/h.
4. For the analysis direction only.
5. Use alternative Exhibit 15-14 if some trucks operate at crawl speeds on a
specific downgrade.
* These items have been entered or edited to override calculated value
HCS 2010: Two-Lane Highways Release 6.60
Phone: Fax:
E-Mail:
_________________Directional Two-Lane Highway Segment Analysis________________
Analyst KP
Agency/Co. CCTC
Date Performed 2/2/2015
Analysis Time Period Existing Sunday
Highway Carmel Valley Road
From/To Rancho San Carlos/Schulte
Jurisdiction Unincorporated Monterey County
Analysis Year 2014
Description Carmel Canine
__________________________________Input Data__________________________________
Highway class Class 2 Peak hour factor, PHF 0.93
Shoulder width 6.0 ft % Trucks and buses 8 %
Lane width 12.0 ft % Trucks crawling 0.0 %
Segment length 2.4 mi Truck crawl speed 0.0 mi/hr
Terrain type Level % Recreational vehicles 1 %
Grade: Length - mi % No-passing zones 100 %
Up/down - % Access point density 14 /mi
Analysis direction volume, Vd 575 veh/h
Opposing direction volume, Vo 624 veh/h
____________________________Average Travel Speed______________________________
Direction Analysis(d) Opposing (o)
PCE for trucks, ET 1.2* 1.2*
PCE for RVs, ER 1.0 1.0
Heavy-vehicle adj. factor,(note-5) fHV 0.984 0.984
Grade adj. factor,(note-1) fg 1.00 1.00
Directional flow rate,(note-2) vi 628 pc/h 682 pc/h
Free-Flow Speed from Field Measurement:
Field measured speed,(note-3) S FM - mi/h
Observed total demand,(note-3) V - veh/h
Estimated Free-Flow Speed:
Base free-flow speed,(note-3) BFFS 45.0 mi/h
Adj. for lane and shoulder width,(note-3) fLS 0.0 mi/h
Adj. for access point density,(note-3) fA 3.5 mi/h
Free-flow speed, FFSd 41.5 mi/h
Adjustment for no-passing zones, fnp 1.6 mi/h
Average travel speed, ATSd 29.8 mi/h
Percent Free Flow Speed, PFFS 71.8 %

_________________________Percent Time-Spent-Following_________________________
Direction Analysis(d) Opposing (o)
PCE for trucks, ET 1.0* 1.0*
PCE for RVs, ER 1.0 1.0
Heavy-vehicle adjustment factor, fHV 1.000 1.000
Grade adjustment factor,(note-1) fg 1.00 1.00
Directional flow rate,(note-2) vi 618 pc/h 671 pc/h
Base percent time-spent-following,(note-4) BPTSFd 59.8 %
Adjustment for no-passing zones, fnp 31.5
Percent time-spent-following, PTSFd 74.9 %
________________Level of Service and Other Performance Measures_______________
Level of service, LOS D
Volume to capacity ratio, v/c 0.36
Peak 15-min vehicle-miles of travel, VMT15 371 veh-mi
Peak-hour vehicle-miles of travel, VMT60 1380 veh-mi
Peak 15-min total travel time, TT15 12.5 veh-h
Capacity from ATS, CdATS 1686 veh/h
Capacity from PTSF, CdPTSF 1700 veh/h
Directional Capacity 1700 veh/h
_____________________________Passing Lane Analysis____________________________
Total length of analysis segment, Lt 2.4 mi
Length of two-lane highway upstream of the passing lane, Lu - mi
Length of passing lane including tapers, Lpl - mi
Average travel speed, ATSd (from above) 29.8 mi/h
Percent time-spent-following, PTSFd (from above) 74.9
Level of service, LOSd (from above) D
___________________Average Travel Speed with Passing Lane____________________
Downstream length of two-lane highway within effective
length of passing lane for average travel speed, Lde - mi
Length of two-lane highway downstream of effective
length of the passing lane for average travel speed, Ld - mi
Adj. factor for the effect of passing lane
on average speed, fpl -
Average travel speed including passing lane, ATSpl -
Percent free flow speed including passing lane, PFFSpl 0.0 %
________________Percent Time-Spent-Following with Passing Lane________________
Downstream length of two-lane highway within effective length
of passing lane for percent time-spent-following, Lde - mi
Length of two-lane highway downstream of effective length of
the passing lane for percent time-spent-following, Ld - mi
Adj. factor for the effect of passing lane
on percent time-spent-following, fpl -
Percent time-spent-following
including passing lane, PTSFpl - %
______Level of Service and Other Performance Measures with Passing Lane ______
Level of service including passing lane, LOSpl A
Peak 15-min total travel time, TT15 - veh-h
__________________________ Bicycle Level of Service __________________________
Posted speed limit, Sp 55
Percent of segment with occupied on-highway parking 0
Pavement rating, P 3
Flow rate in outside lane, vOL 618.3
Effective width of outside lane, We 24.00
Effective speed factor, St 4.79
Bicycle LOS Score, BLOS 4.43
Bicycle LOS D
Notes:
1. Note that the adjustment factor for level terrain is 1.00, as level terrain
is one of the base conditions. For the purpose of grade adjustment, specific
dewngrade segments are treated as level terrain.
2. If vi (vd or vo ) >= 1,700 pc/h, terminate analysis-the LOS is F.
3. For the analysis direction only and for v>200 veh/h.
4. For the analysis direction only.
5. Use alternative Exhibit 15-14 if some trucks operate at crawl speeds on a
specific downgrade.
* These items have been entered or edited to override calculated value

HCS 2010: Two-Lane Highways Release 6.60
Phone: Fax:
E-Mail:
_________________Directional Two-Lane Highway Segment Analysis________________
Analyst KP
Agency/Co. CCTC
Date Performed 2/2/2015
Analysis Time Period Existing Plus Project AM
Highway Carmel Valley Road
From/To Rancho San Carlos/Schulte
Jurisdiction Unincorporated Monterey County
Analysis Year 2014
Description Carmel Canine
__________________________________Input Data__________________________________
Highway class Class 2 Peak hour factor, PHF 0.93
Shoulder width 6.0 ft % Trucks and buses 8 %
Lane width 12.0 ft % Trucks crawling 0.0 %
Segment length 2.4 mi Truck crawl speed 0.0 mi/hr
Terrain type Level % Recreational vehicles 1 %
Grade: Length - mi % No-passing zones 100 %
Up/down - % Access point density 14 /mi
Analysis direction volume, Vd 856 veh/h
Opposing direction volume, Vo 555 veh/h
____________________________Average Travel Speed______________________________
Direction Analysis(d) Opposing (o)
PCE for trucks, ET 1.2* 1.2*
PCE for RVs, ER 1.0 1.0
Heavy-vehicle adj. factor,(note-5) fHV 0.984 0.984
Grade adj. factor,(note-1) fg 1.00 1.00
Directional flow rate,(note-2) vi 935 pc/h 606 pc/h
Free-Flow Speed from Field Measurement:
Field measured speed,(note-3) S FM - mi/h
Observed total demand,(note-3) V - veh/h
Estimated Free-Flow Speed:
Base free-flow speed,(note-3) BFFS 45.0 mi/h
Adj. for lane and shoulder width,(note-3) fLS 0.0 mi/h
Adj. for access point density,(note-3) fA 3.5 mi/h
Free-flow speed, FFSd 41.5 mi/h
Adjustment for no-passing zones, fnp 1.8 mi/h
Average travel speed, ATSd 27.8 mi/h
Percent Free Flow Speed, PFFS 66.9 %
_________________________Percent Time-Spent-Following_________________________
Direction Analysis(d) Opposing (o)
PCE for trucks, ET 1.0* 1.0*
PCE for RVs, ER 1.0 1.0
Heavy-vehicle adjustment factor, fHV 1.000 1.000
Grade adjustment factor,(note-1) fg 1.00 1.00
Directional flow rate,(note-2) vi 920 pc/h 597 pc/h
Base percent time-spent-following,(note-4) BPTSFd 71.6 %
Adjustment for no-passing zones, fnp 25.0
Percent time-spent-following, PTSFd 86.8 %
________________Level of Service and Other Performance Measures_______________
Level of service, LOS E
Volume to capacity ratio, v/c 0.54
Peak 15-min vehicle-miles of travel, VMT15 552 veh-mi
Peak-hour vehicle-miles of travel, VMT60 2054 veh-mi
Peak 15-min total travel time, TT15 19.9 veh-h
Capacity from ATS, CdATS 0 veh/h
Capacity from PTSF, CdPTSF 1700 veh/h
Directional Capacity 1700 veh/h
_____________________________Passing Lane Analysis____________________________
Total length of analysis segment, Lt 2.4 mi
Length of two-lane highway upstream of the passing lane, Lu - mi
Length of passing lane including tapers, Lpl - mi
Average travel speed, ATSd (from above) 27.8 mi/h
Percent time-spent-following, PTSFd (from above) 86.8
Level of service, LOSd (from above) E
___________________Average Travel Speed with Passing Lane____________________
Downstream length of two-lane highway within effective
length of passing lane for average travel speed, Lde - mi
Length of two-lane highway downstream of effective
length of the passing lane for average travel speed, Ld - mi
Adj. factor for the effect of passing lane
on average speed, fpl -
Average travel speed including passing lane, ATSpl -
Percent free flow speed including passing lane, PFFSpl 0.0 %
________________Percent Time-Spent-Following with Passing Lane________________
Downstream length of two-lane highway within effective length
of passing lane for percent time-spent-following, Lde - mi
Length of two-lane highway downstream of effective length of
the passing lane for percent time-spent-following, Ld - mi
Adj. factor for the effect of passing lane
on percent time-spent-following, fpl -
Percent time-spent-following
including passing lane, PTSFpl - %
______Level of Service and Other Performance Measures with Passing Lane ______
Level of service including passing lane, LOSpl A
Peak 15-min total travel time, TT15 - veh-h
__________________________ Bicycle Level of Service __________________________

Posted speed limit, Sp 55
Percent of segment with occupied on-highway parking 0
Pavement rating, P 3
Flow rate in outside lane, vOL 920.4
Effective width of outside lane, We 24.00
Effective speed factor, St 4.79
Bicycle LOS Score, BLOS 4.63
Bicycle LOS E
Notes:
1. Note that the adjustment factor for level terrain is 1.00, as level terrain
is one of the base conditions. For the purpose of grade adjustment, specific
dewngrade segments are treated as level terrain.
2. If vi (vd or vo ) >= 1,700 pc/h, terminate analysis-the LOS is F.
3. For the analysis direction only and for v>200 veh/h.
4. For the analysis direction only.
5. Use alternative Exhibit 15-14 if some trucks operate at crawl speeds on a
specific downgrade.
* These items have been entered or edited to override calculated value
HCS 2010: Two-Lane Highways Release 6.60
Phone: Fax:
E-Mail:
_________________Directional Two-Lane Highway Segment Analysis________________
Analyst KP
Agency/Co. CCTC
Date Performed 2/2/2015
Analysis Time Period Existing Plus Project AM
Highway Carmel Valley Road
From/To Rancho San Carlos/Schulte
Jurisdiction Unincorporated Monterey County
Analysis Year 2014
Description Carmel Canine
__________________________________Input Data__________________________________
Highway class Class 2 Peak hour factor, PHF 0.93
Shoulder width 6.0 ft % Trucks and buses 8 %
Lane width 12.0 ft % Trucks crawling 0.0 %
Segment length 2.4 mi Truck crawl speed 0.0 mi/hr
Terrain type Level % Recreational vehicles 1 %
Grade: Length - mi % No-passing zones 100 %
Up/down - % Access point density 14 /mi
Analysis direction volume, Vd 555 veh/h
Opposing direction volume, Vo 856 veh/h
____________________________Average Travel Speed______________________________
Direction Analysis(d) Opposing (o)
PCE for trucks, ET 1.2* 1.2*
PCE for RVs, ER 1.0 1.0
Heavy-vehicle adj. factor,(note-5) fHV 0.984 0.984
Grade adj. factor,(note-1) fg 1.00 1.00
Directional flow rate,(note-2) vi 606 pc/h 935 pc/h
Free-Flow Speed from Field Measurement:
Field measured speed,(note-3) S FM - mi/h
Observed total demand,(note-3) V - veh/h
Estimated Free-Flow Speed:
Base free-flow speed,(note-3) BFFS 45.0 mi/h
Adj. for lane and shoulder width,(note-3) fLS 0.0 mi/h
Adj. for access point density,(note-3) fA 3.5 mi/h
Free-flow speed, FFSd 41.5 mi/h
Adjustment for no-passing zones, fnp 1.1 mi/h
Average travel speed, ATSd 28.4 mi/h
Percent Free Flow Speed, PFFS 68.5 %

_________________________Percent Time-Spent-Following_________________________
Direction Analysis(d) Opposing (o)
PCE for trucks, ET 1.0* 1.0*
PCE for RVs, ER 1.0 1.0
Heavy-vehicle adjustment factor, fHV 1.000 1.000
Grade adjustment factor,(note-1) fg 1.00 1.00
Directional flow rate,(note-2) vi 597 pc/h 920 pc/h
Base percent time-spent-following,(note-4) BPTSFd 61.4 %
Adjustment for no-passing zones, fnp 25.0
Percent time-spent-following, PTSFd 71.2 %
________________Level of Service and Other Performance Measures_______________
Level of service, LOS D
Volume to capacity ratio, v/c 0.35
Peak 15-min vehicle-miles of travel, VMT15 358 veh-mi
Peak-hour vehicle-miles of travel, VMT60 1332 veh-mi
Peak 15-min total travel time, TT15 12.6 veh-h
Capacity from ATS, CdATS 1700 veh/h
Capacity from PTSF, CdPTSF 1700 veh/h
Directional Capacity 1700 veh/h
_____________________________Passing Lane Analysis____________________________
Total length of analysis segment, Lt 2.4 mi
Length of two-lane highway upstream of the passing lane, Lu - mi
Length of passing lane including tapers, Lpl - mi
Average travel speed, ATSd (from above) 28.4 mi/h
Percent time-spent-following, PTSFd (from above) 71.2
Level of service, LOSd (from above) D
___________________Average Travel Speed with Passing Lane____________________
Downstream length of two-lane highway within effective
length of passing lane for average travel speed, Lde - mi
Length of two-lane highway downstream of effective
length of the passing lane for average travel speed, Ld - mi
Adj. factor for the effect of passing lane
on average speed, fpl -
Average travel speed including passing lane, ATSpl -
Percent free flow speed including passing lane, PFFSpl 0.0 %
________________Percent Time-Spent-Following with Passing Lane________________
Downstream length of two-lane highway within effective length
of passing lane for percent time-spent-following, Lde - mi
Length of two-lane highway downstream of effective length of
the passing lane for percent time-spent-following, Ld - mi
Adj. factor for the effect of passing lane
on percent time-spent-following, fpl -
Percent time-spent-following
including passing lane, PTSFpl - %
______Level of Service and Other Performance Measures with Passing Lane ______
Level of service including passing lane, LOSpl A
Peak 15-min total travel time, TT15 - veh-h
__________________________ Bicycle Level of Service __________________________
Posted speed limit, Sp 55
Percent of segment with occupied on-highway parking 0
Pavement rating, P 3
Flow rate in outside lane, vOL 596.8
Effective width of outside lane, We 24.00
Effective speed factor, St 4.79
Bicycle LOS Score, BLOS 4.41
Bicycle LOS D
Notes:
1. Note that the adjustment factor for level terrain is 1.00, as level terrain
is one of the base conditions. For the purpose of grade adjustment, specific
dewngrade segments are treated as level terrain.
2. If vi (vd or vo ) >= 1,700 pc/h, terminate analysis-the LOS is F.
3. For the analysis direction only and for v>200 veh/h.
4. For the analysis direction only.
5. Use alternative Exhibit 15-14 if some trucks operate at crawl speeds on a
specific downgrade.
* These items have been entered or edited to override calculated value

HCS 2010: Two-Lane Highways Release 6.60
Phone: Fax:
E-Mail:
_________________Directional Two-Lane Highway Segment Analysis________________
Analyst KP
Agency/Co. CCTC
Date Performed 2/2/2015
Analysis Time Period Existing Plus Project PM
Highway Carmel Valley Road
From/To Rancho San Carlos/Schulte
Jurisdiction Unincorporated Monterey County
Analysis Year 2014
Description Carmel Canine
__________________________________Input Data__________________________________
Highway class Class 2 Peak hour factor, PHF 0.93
Shoulder width 6.0 ft % Trucks and buses 8 %
Lane width 12.0 ft % Trucks crawling 0.0 %
Segment length 2.4 mi Truck crawl speed 0.0 mi/hr
Terrain type Level % Recreational vehicles 1 %
Grade: Length - mi % No-passing zones 100 %
Up/down - % Access point density 14 /mi
Analysis direction volume, Vd 651 veh/h
Opposing direction volume, Vo 882 veh/h
____________________________Average Travel Speed______________________________
Direction Analysis(d) Opposing (o)
PCE for trucks, ET 1.2* 1.2*
PCE for RVs, ER 1.0 1.0
Heavy-vehicle adj. factor,(note-5) fHV 0.984 0.984
Grade adj. factor,(note-1) fg 1.00 1.00
Directional flow rate,(note-2) vi 711 pc/h 964 pc/h
Free-Flow Speed from Field Measurement:
Field measured speed,(note-3) S FM - mi/h
Observed total demand,(note-3) V - veh/h
Estimated Free-Flow Speed:
Base free-flow speed,(note-3) BFFS 45.0 mi/h
Adj. for lane and shoulder width,(note-3) fLS 0.0 mi/h
Adj. for access point density,(note-3) fA 3.5 mi/h
Free-flow speed, FFSd 41.5 mi/h
Adjustment for no-passing zones, fnp 1.1 mi/h
Average travel speed, ATSd 27.4 mi/h
Percent Free Flow Speed, PFFS 66.0 %
_________________________Percent Time-Spent-Following_________________________
Direction Analysis(d) Opposing (o)
PCE for trucks, ET 1.0* 1.0*
PCE for RVs, ER 1.0 1.0
Heavy-vehicle adjustment factor, fHV 1.000 1.000
Grade adjustment factor,(note-1) fg 1.00 1.00
Directional flow rate,(note-2) vi 700 pc/h 948 pc/h
Base percent time-spent-following,(note-4) BPTSFd 66.8 %
Adjustment for no-passing zones, fnp 23.5
Percent time-spent-following, PTSFd 76.8 %
________________Level of Service and Other Performance Measures_______________
Level of service, LOS D
Volume to capacity ratio, v/c 0.41
Peak 15-min vehicle-miles of travel, VMT15 420 veh-mi
Peak-hour vehicle-miles of travel, VMT60 1562 veh-mi
Peak 15-min total travel time, TT15 15.3 veh-h
Capacity from ATS, CdATS 1700 veh/h
Capacity from PTSF, CdPTSF 1700 veh/h
Directional Capacity 1700 veh/h
_____________________________Passing Lane Analysis____________________________
Total length of analysis segment, Lt 2.4 mi
Length of two-lane highway upstream of the passing lane, Lu - mi
Length of passing lane including tapers, Lpl - mi
Average travel speed, ATSd (from above) 27.4 mi/h
Percent time-spent-following, PTSFd (from above) 76.8
Level of service, LOSd (from above) D
___________________Average Travel Speed with Passing Lane____________________
Downstream length of two-lane highway within effective
length of passing lane for average travel speed, Lde - mi
Length of two-lane highway downstream of effective
length of the passing lane for average travel speed, Ld - mi
Adj. factor for the effect of passing lane
on average speed, fpl -
Average travel speed including passing lane, ATSpl -
Percent free flow speed including passing lane, PFFSpl 0.0 %
________________Percent Time-Spent-Following with Passing Lane________________
Downstream length of two-lane highway within effective length
of passing lane for percent time-spent-following, Lde - mi
Length of two-lane highway downstream of effective length of
the passing lane for percent time-spent-following, Ld - mi
Adj. factor for the effect of passing lane
on percent time-spent-following, fpl -
Percent time-spent-following
including passing lane, PTSFpl - %
______Level of Service and Other Performance Measures with Passing Lane ______
Level of service including passing lane, LOSpl A
Peak 15-min total travel time, TT15 - veh-h
__________________________ Bicycle Level of Service __________________________

Posted speed limit, Sp 55
Percent of segment with occupied on-highway parking 0
Pavement rating, P 3
Flow rate in outside lane, vOL 700.0
Effective width of outside lane, We 24.00
Effective speed factor, St 4.79
Bicycle LOS Score, BLOS 4.49
Bicycle LOS D
Notes:
1. Note that the adjustment factor for level terrain is 1.00, as level terrain
is one of the base conditions. For the purpose of grade adjustment, specific
dewngrade segments are treated as level terrain.
2. If vi (vd or vo ) >= 1,700 pc/h, terminate analysis-the LOS is F.
3. For the analysis direction only and for v>200 veh/h.
4. For the analysis direction only.
5. Use alternative Exhibit 15-14 if some trucks operate at crawl speeds on a
specific downgrade.
* These items have been entered or edited to override calculated value
HCS 2010: Two-Lane Highways Release 6.60
Phone: Fax:
E-Mail:
_________________Directional Two-Lane Highway Segment Analysis________________
Analyst KP
Agency/Co. CCTC
Date Performed 2/2/2015
Analysis Time Period Existing Plus Project PM
Highway Carmel Valley Road
From/To Rancho San Carlos/Schulte
Jurisdiction Unincorporated Monterey County
Analysis Year 2014
Description Carmel Canine
__________________________________Input Data__________________________________
Highway class Class 2 Peak hour factor, PHF 0.93
Shoulder width 6.0 ft % Trucks and buses 8 %
Lane width 12.0 ft % Trucks crawling 0.0 %
Segment length 2.4 mi Truck crawl speed 0.0 mi/hr
Terrain type Level % Recreational vehicles 1 %
Grade: Length - mi % No-passing zones 100 %
Up/down - % Access point density 14 /mi
Analysis direction volume, Vd 882 veh/h
Opposing direction volume, Vo 651 veh/h
____________________________Average Travel Speed______________________________
Direction Analysis(d) Opposing (o)
PCE for trucks, ET 1.2* 1.2*
PCE for RVs, ER 1.0 1.0
Heavy-vehicle adj. factor,(note-5) fHV 0.984 0.984
Grade adj. factor,(note-1) fg 1.00 1.00
Directional flow rate,(note-2) vi 964 pc/h 711 pc/h
Free-Flow Speed from Field Measurement:
Field measured speed,(note-3) S FM - mi/h
Observed total demand,(note-3) V - veh/h
Estimated Free-Flow Speed:
Base free-flow speed,(note-3) BFFS 45.0 mi/h
Adj. for lane and shoulder width,(note-3) fLS 0.0 mi/h
Adj. for access point density,(note-3) fA 3.5 mi/h
Free-flow speed, FFSd 41.5 mi/h
Adjustment for no-passing zones, fnp 1.5 mi/h
Average travel speed, ATSd 27.0 mi/h
Percent Free Flow Speed, PFFS 65.1 %

_________________________Percent Time-Spent-Following_________________________
Direction Analysis(d) Opposing (o)
PCE for trucks, ET 1.0* 1.0*
PCE for RVs, ER 1.0 1.0
Heavy-vehicle adjustment factor, fHV 1.000 1.000
Grade adjustment factor,(note-1) fg 1.00 1.00
Directional flow rate,(note-2) vi 948 pc/h 700 pc/h
Base percent time-spent-following,(note-4) BPTSFd 73.8 %
Adjustment for no-passing zones, fnp 23.5
Percent time-spent-following, PTSFd 87.3 %
________________Level of Service and Other Performance Measures_______________
Level of service, LOS E
Volume to capacity ratio, v/c 0.56
Peak 15-min vehicle-miles of travel, VMT15 569 veh-mi
Peak-hour vehicle-miles of travel, VMT60 2117 veh-mi
Peak 15-min total travel time, TT15 21.0 veh-h
Capacity from ATS, CdATS 0 veh/h
Capacity from PTSF, CdPTSF 1700 veh/h
Directional Capacity 1700 veh/h
_____________________________Passing Lane Analysis____________________________
Total length of analysis segment, Lt 2.4 mi
Length of two-lane highway upstream of the passing lane, Lu - mi
Length of passing lane including tapers, Lpl - mi
Average travel speed, ATSd (from above) 27.0 mi/h
Percent time-spent-following, PTSFd (from above) 87.3
Level of service, LOSd (from above) E
___________________Average Travel Speed with Passing Lane____________________
Downstream length of two-lane highway within effective
length of passing lane for average travel speed, Lde - mi
Length of two-lane highway downstream of effective
length of the passing lane for average travel speed, Ld - mi
Adj. factor for the effect of passing lane
on average speed, fpl -
Average travel speed including passing lane, ATSpl -
Percent free flow speed including passing lane, PFFSpl 0.0 %
________________Percent Time-Spent-Following with Passing Lane________________
Downstream length of two-lane highway within effective length
of passing lane for percent time-spent-following, Lde - mi
Length of two-lane highway downstream of effective length of
the passing lane for percent time-spent-following, Ld - mi
Adj. factor for the effect of passing lane
on percent time-spent-following, fpl -
Percent time-spent-following
including passing lane, PTSFpl - %
______Level of Service and Other Performance Measures with Passing Lane ______
Level of service including passing lane, LOSpl A
Peak 15-min total travel time, TT15 - veh-h
__________________________ Bicycle Level of Service __________________________
Posted speed limit, Sp 55
Percent of segment with occupied on-highway parking 0
Pavement rating, P 3
Flow rate in outside lane, vOL 948.4
Effective width of outside lane, We 24.00
Effective speed factor, St 4.79
Bicycle LOS Score, BLOS 4.65
Bicycle LOS E
Notes:
1. Note that the adjustment factor for level terrain is 1.00, as level terrain
is one of the base conditions. For the purpose of grade adjustment, specific
dewngrade segments are treated as level terrain.
2. If vi (vd or vo ) >= 1,700 pc/h, terminate analysis-the LOS is F.
3. For the analysis direction only and for v>200 veh/h.
4. For the analysis direction only.
5. Use alternative Exhibit 15-14 if some trucks operate at crawl speeds on a
specific downgrade.
* These items have been entered or edited to override calculated value

HCS 2010: Two-Lane Highways Release 6.60
Phone: Fax:
E-Mail:
_________________Directional Two-Lane Highway Segment Analysis________________
Analyst KP
Agency/Co. CCTC
Date Performed 2/2/2015
Analysis Time Period Existing Plus Project Friday
Highway Carmel Valley Road
From/To Rancho San Carlos/Schulte
Jurisdiction Unincorporated Monterey County
Analysis Year 2014
Description Carmel Canine
__________________________________Input Data__________________________________
Highway class Class 2 Peak hour factor, PHF 0.93
Shoulder width 6.0 ft % Trucks and buses 8 %
Lane width 12.0 ft % Trucks crawling 0.0 %
Segment length 2.4 mi Truck crawl speed 0.0 mi/hr
Terrain type Level % Recreational vehicles 1 %
Grade: Length - mi % No-passing zones 100 %
Up/down - % Access point density 14 /mi
Analysis direction volume, Vd 653 veh/h
Opposing direction volume, Vo 939 veh/h
____________________________Average Travel Speed______________________________
Direction Analysis(d) Opposing (o)
PCE for trucks, ET 1.2* 1.2*
PCE for RVs, ER 1.0 1.0
Heavy-vehicle adj. factor,(note-5) fHV 0.984 0.984
Grade adj. factor,(note-1) fg 1.00 1.00
Directional flow rate,(note-2) vi 714 pc/h 1026 pc/h
Free-Flow Speed from Field Measurement:
Field measured speed,(note-3) S FM - mi/h
Observed total demand,(note-3) V - veh/h
Estimated Free-Flow Speed:
Base free-flow speed,(note-3) BFFS 45.0 mi/h
Adj. for lane and shoulder width,(note-3) fLS 0.0 mi/h
Adj. for access point density,(note-3) fA 3.5 mi/h
Free-flow speed, FFSd 41.5 mi/h
Adjustment for no-passing zones, fnp 1.1 mi/h
Average travel speed, ATSd 26.9 mi/h
Percent Free Flow Speed, PFFS 64.8 %
_________________________Percent Time-Spent-Following_________________________
Direction Analysis(d) Opposing (o)
PCE for trucks, ET 1.0* 1.0*
PCE for RVs, ER 1.0 1.0
Heavy-vehicle adjustment factor, fHV 1.000 1.000
Grade adjustment factor,(note-1) fg 1.00 1.00
Directional flow rate,(note-2) vi 702 pc/h 1010 pc/h
Base percent time-spent-following,(note-4) BPTSFd 67.4 %
Adjustment for no-passing zones, fnp 22.2
Percent time-spent-following, PTSFd 76.5 %
________________Level of Service and Other Performance Measures_______________
Level of service, LOS D
Volume to capacity ratio, v/c 0.41
Peak 15-min vehicle-miles of travel, VMT15 421 veh-mi
Peak-hour vehicle-miles of travel, VMT60 1567 veh-mi
Peak 15-min total travel time, TT15 15.6 veh-h
Capacity from ATS, CdATS 1700 veh/h
Capacity from PTSF, CdPTSF 1700 veh/h
Directional Capacity 1700 veh/h
_____________________________Passing Lane Analysis____________________________
Total length of analysis segment, Lt 2.4 mi
Length of two-lane highway upstream of the passing lane, Lu - mi
Length of passing lane including tapers, Lpl - mi
Average travel speed, ATSd (from above) 26.9 mi/h
Percent time-spent-following, PTSFd (from above) 76.5
Level of service, LOSd (from above) D
___________________Average Travel Speed with Passing Lane____________________
Downstream length of two-lane highway within effective
length of passing lane for average travel speed, Lde - mi
Length of two-lane highway downstream of effective
length of the passing lane for average travel speed, Ld - mi
Adj. factor for the effect of passing lane
on average speed, fpl -
Average travel speed including passing lane, ATSpl -
Percent free flow speed including passing lane, PFFSpl 0.0 %
________________Percent Time-Spent-Following with Passing Lane________________
Downstream length of two-lane highway within effective length
of passing lane for percent time-spent-following, Lde - mi
Length of two-lane highway downstream of effective length of
the passing lane for percent time-spent-following, Ld - mi
Adj. factor for the effect of passing lane
on percent time-spent-following, fpl -
Percent time-spent-following
including passing lane, PTSFpl - %
______Level of Service and Other Performance Measures with Passing Lane ______
Level of service including passing lane, LOSpl A
Peak 15-min total travel time, TT15 - veh-h
__________________________ Bicycle Level of Service __________________________

Posted speed limit, Sp 55
Percent of segment with occupied on-highway parking 0
Pavement rating, P 3
Flow rate in outside lane, vOL 702.2
Effective width of outside lane, We 24.00
Effective speed factor, St 4.79
Bicycle LOS Score, BLOS 4.49
Bicycle LOS D
Notes:
1. Note that the adjustment factor for level terrain is 1.00, as level terrain
is one of the base conditions. For the purpose of grade adjustment, specific
dewngrade segments are treated as level terrain.
2. If vi (vd or vo ) >= 1,700 pc/h, terminate analysis-the LOS is F.
3. For the analysis direction only and for v>200 veh/h.
4. For the analysis direction only.
5. Use alternative Exhibit 15-14 if some trucks operate at crawl speeds on a
specific downgrade.
* These items have been entered or edited to override calculated value
HCS 2010: Two-Lane Highways Release 6.60
Phone: Fax:
E-Mail:
_________________Directional Two-Lane Highway Segment Analysis________________
Analyst KP
Agency/Co. CCTC
Date Performed 2/2/2015
Analysis Time Period Existing Plus Project Friday
Highway Carmel Valley Road
From/To Rancho San Carlos/Schulte
Jurisdiction Unincorporated Monterey County
Analysis Year 2014
Description Carmel Canine
__________________________________Input Data__________________________________
Highway class Class 2 Peak hour factor, PHF 0.93
Shoulder width 6.0 ft % Trucks and buses 8 %
Lane width 12.0 ft % Trucks crawling 0.0 %
Segment length 2.4 mi Truck crawl speed 0.0 mi/hr
Terrain type Level % Recreational vehicles 1 %
Grade: Length - mi % No-passing zones 100 %
Up/down - % Access point density 14 /mi
Analysis direction volume, Vd 939 veh/h
Opposing direction volume, Vo 653 veh/h
____________________________Average Travel Speed______________________________
Direction Analysis(d) Opposing (o)
PCE for trucks, ET 1.2* 1.2*
PCE for RVs, ER 1.0 1.0
Heavy-vehicle adj. factor,(note-5) fHV 0.984 0.984
Grade adj. factor,(note-1) fg 1.00 1.00
Directional flow rate,(note-2) vi 1026 pc/h 714 pc/h
Free-Flow Speed from Field Measurement:
Field measured speed,(note-3) S FM - mi/h
Observed total demand,(note-3) V - veh/h
Estimated Free-Flow Speed:
Base free-flow speed,(note-3) BFFS 45.0 mi/h
Adj. for lane and shoulder width,(note-3) fLS 0.0 mi/h
Adj. for access point density,(note-3) fA 3.5 mi/h
Free-flow speed, FFSd 41.5 mi/h
Adjustment for no-passing zones, fnp 1.5 mi/h
Average travel speed, ATSd 26.5 mi/h
Percent Free Flow Speed, PFFS 64.0 %

_________________________Percent Time-Spent-Following_________________________
Direction Analysis(d) Opposing (o)
PCE for trucks, ET 1.0* 1.0*
PCE for RVs, ER 1.0 1.0
Heavy-vehicle adjustment factor, fHV 1.000 1.000
Grade adjustment factor,(note-1) fg 1.00 1.00
Directional flow rate,(note-2) vi 1010 pc/h 702 pc/h
Base percent time-spent-following,(note-4) BPTSFd 75.5 %
Adjustment for no-passing zones, fnp 22.2
Percent time-spent-following, PTSFd 88.6 %
________________Level of Service and Other Performance Measures_______________
Level of service, LOS E
Volume to capacity ratio, v/c 0.59
Peak 15-min vehicle-miles of travel, VMT15 606 veh-mi
Peak-hour vehicle-miles of travel, VMT60 2254 veh-mi
Peak 15-min total travel time, TT15 22.8 veh-h
Capacity from ATS, CdATS 0 veh/h
Capacity from PTSF, CdPTSF 1700 veh/h
Directional Capacity 1700 veh/h
_____________________________Passing Lane Analysis____________________________
Total length of analysis segment, Lt 2.4 mi
Length of two-lane highway upstream of the passing lane, Lu - mi
Length of passing lane including tapers, Lpl - mi
Average travel speed, ATSd (from above) 26.5 mi/h
Percent time-spent-following, PTSFd (from above) 88.6
Level of service, LOSd (from above) E
___________________Average Travel Speed with Passing Lane____________________
Downstream length of two-lane highway within effective
length of passing lane for average travel speed, Lde - mi
Length of two-lane highway downstream of effective
length of the passing lane for average travel speed, Ld - mi
Adj. factor for the effect of passing lane
on average speed, fpl -
Average travel speed including passing lane, ATSpl -
Percent free flow speed including passing lane, PFFSpl 0.0 %
________________Percent Time-Spent-Following with Passing Lane________________
Downstream length of two-lane highway within effective length
of passing lane for percent time-spent-following, Lde - mi
Length of two-lane highway downstream of effective length of
the passing lane for percent time-spent-following, Ld - mi
Adj. factor for the effect of passing lane
on percent time-spent-following, fpl -
Percent time-spent-following
including passing lane, PTSFpl - %
______Level of Service and Other Performance Measures with Passing Lane ______
Level of service including passing lane, LOSpl A
Peak 15-min total travel time, TT15 - veh-h
__________________________ Bicycle Level of Service __________________________
Posted speed limit, Sp 55
Percent of segment with occupied on-highway parking 0
Pavement rating, P 3
Flow rate in outside lane, vOL 1009.7
Effective width of outside lane, We 24.00
Effective speed factor, St 4.79
Bicycle LOS Score, BLOS 4.68
Bicycle LOS E
Notes:
1. Note that the adjustment factor for level terrain is 1.00, as level terrain
is one of the base conditions. For the purpose of grade adjustment, specific
dewngrade segments are treated as level terrain.
2. If vi (vd or vo ) >= 1,700 pc/h, terminate analysis-the LOS is F.
3. For the analysis direction only and for v>200 veh/h.
4. For the analysis direction only.
5. Use alternative Exhibit 15-14 if some trucks operate at crawl speeds on a
specific downgrade.
* These items have been entered or edited to override calculated value

HCS 2010: Two-Lane Highways Release 6.60
Phone: Fax:
E-Mail:
_________________Directional Two-Lane Highway Segment Analysis________________
Analyst KP
Agency/Co. CCTC
Date Performed 2/2/2015
Analysis Time Period Existing Plus Project Sunday
Highway Carmel Valley Road
From/To Rancho San Carlos/Schulte
Jurisdiction Unincorporated Monterey County
Analysis Year 2014
Description Carmel Canine
__________________________________Input Data__________________________________
Highway class Class 2 Peak hour factor, PHF 0.93
Shoulder width 6.0 ft % Trucks and buses 8 %
Lane width 12.0 ft % Trucks crawling 0.0 %
Segment length 2.4 mi Truck crawl speed 0.0 mi/hr
Terrain type Level % Recreational vehicles 1 %
Grade: Length - mi % No-passing zones 100 %
Up/down - % Access point density 14 /mi
Analysis direction volume, Vd 679 veh/h
Opposing direction volume, Vo 595 veh/h
____________________________Average Travel Speed______________________________
Direction Analysis(d) Opposing (o)
PCE for trucks, ET 1.2* 1.2*
PCE for RVs, ER 1.0 1.0
Heavy-vehicle adj. factor,(note-5) fHV 0.984 0.984
Grade adj. factor,(note-1) fg 1.00 1.00
Directional flow rate,(note-2) vi 742 pc/h 650 pc/h
Free-Flow Speed from Field Measurement:
Field measured speed,(note-3) S FM - mi/h
Observed total demand,(note-3) V - veh/h
Estimated Free-Flow Speed:
Base free-flow speed,(note-3) BFFS 45.0 mi/h
Adj. for lane and shoulder width,(note-3) fLS 0.0 mi/h
Adj. for access point density,(note-3) fA 3.5 mi/h
Free-flow speed, FFSd 41.5 mi/h
Adjustment for no-passing zones, fnp 1.6 mi/h
Average travel speed, ATSd 29.0 mi/h
Percent Free Flow Speed, PFFS 70.0 %
_________________________Percent Time-Spent-Following_________________________
Direction Analysis(d) Opposing (o)
PCE for trucks, ET 1.0* 1.0*
PCE for RVs, ER 1.0 1.0
Heavy-vehicle adjustment factor, fHV 1.000 1.000
Grade adjustment factor,(note-1) fg 1.00 1.00
Directional flow rate,(note-2) vi 730 pc/h 640 pc/h
Base percent time-spent-following,(note-4) BPTSFd 64.5 %
Adjustment for no-passing zones, fnp 29.0
Percent time-spent-following, PTSFd 80.0 %
________________Level of Service and Other Performance Measures_______________
Level of service, LOS D
Volume to capacity ratio, v/c 0.43
Peak 15-min vehicle-miles of travel, VMT15 438 veh-mi
Peak-hour vehicle-miles of travel, VMT60 1630 veh-mi
Peak 15-min total travel time, TT15 15.1 veh-h
Capacity from ATS, CdATS 0 veh/h
Capacity from PTSF, CdPTSF 1700 veh/h
Directional Capacity 1700 veh/h
_____________________________Passing Lane Analysis____________________________
Total length of analysis segment, Lt 2.4 mi
Length of two-lane highway upstream of the passing lane, Lu - mi
Length of passing lane including tapers, Lpl - mi
Average travel speed, ATSd (from above) 29.0 mi/h
Percent time-spent-following, PTSFd (from above) 80.0
Level of service, LOSd (from above) D
___________________Average Travel Speed with Passing Lane____________________
Downstream length of two-lane highway within effective
length of passing lane for average travel speed, Lde - mi
Length of two-lane highway downstream of effective
length of the passing lane for average travel speed, Ld - mi
Adj. factor for the effect of passing lane
on average speed, fpl -
Average travel speed including passing lane, ATSpl -
Percent free flow speed including passing lane, PFFSpl 0.0 %
________________Percent Time-Spent-Following with Passing Lane________________
Downstream length of two-lane highway within effective length
of passing lane for percent time-spent-following, Lde - mi
Length of two-lane highway downstream of effective length of
the passing lane for percent time-spent-following, Ld - mi
Adj. factor for the effect of passing lane
on percent time-spent-following, fpl -
Percent time-spent-following
including passing lane, PTSFpl - %
______Level of Service and Other Performance Measures with Passing Lane ______
Level of service including passing lane, LOSpl A
Peak 15-min total travel time, TT15 - veh-h
__________________________ Bicycle Level of Service __________________________

Posted speed limit, Sp 55
Percent of segment with occupied on-highway parking 0
Pavement rating, P 3
Flow rate in outside lane, vOL 730.1
Effective width of outside lane, We 24.00
Effective speed factor, St 4.79
Bicycle LOS Score, BLOS 4.51
Bicycle LOS E
Notes:
1. Note that the adjustment factor for level terrain is 1.00, as level terrain
is one of the base conditions. For the purpose of grade adjustment, specific
dewngrade segments are treated as level terrain.
2. If vi (vd or vo ) >= 1,700 pc/h, terminate analysis-the LOS is F.
3. For the analysis direction only and for v>200 veh/h.
4. For the analysis direction only.
5. Use alternative Exhibit 15-14 if some trucks operate at crawl speeds on a
specific downgrade.
* These items have been entered or edited to override calculated value
HCS 2010: Two-Lane Highways Release 6.60
Phone: Fax:
E-Mail:
_________________Directional Two-Lane Highway Segment Analysis________________
Analyst KP
Agency/Co. CCTC
Date Performed 2/2/2015
Analysis Time Period Existing Plus Project Sunday
Highway Carmel Valley Road
From/To Rancho San Carlos/Schulte
Jurisdiction Unincorporated Monterey County
Analysis Year 2014
Description Carmel Canine
__________________________________Input Data__________________________________
Highway class Class 2 Peak hour factor, PHF 0.93
Shoulder width 6.0 ft % Trucks and buses 8 %
Lane width 12.0 ft % Trucks crawling 0.0 %
Segment length 2.4 mi Truck crawl speed 0.0 mi/hr
Terrain type Level % Recreational vehicles 1 %
Grade: Length - mi % No-passing zones 100 %
Up/down - % Access point density 14 /mi
Analysis direction volume, Vd 595 veh/h
Opposing direction volume, Vo 679 veh/h
____________________________Average Travel Speed______________________________
Direction Analysis(d) Opposing (o)
PCE for trucks, ET 1.2* 1.2*
PCE for RVs, ER 1.0 1.0
Heavy-vehicle adj. factor,(note-5) fHV 0.984 0.984
Grade adj. factor,(note-1) fg 1.00 1.00
Directional flow rate,(note-2) vi 650 pc/h 742 pc/h
Free-Flow Speed from Field Measurement:
Field measured speed,(note-3) S FM - mi/h
Observed total demand,(note-3) V - veh/h
Estimated Free-Flow Speed:
Base free-flow speed,(note-3) BFFS 45.0 mi/h
Adj. for lane and shoulder width,(note-3) fLS 0.0 mi/h
Adj. for access point density,(note-3) fA 3.5 mi/h
Free-flow speed, FFSd 41.5 mi/h
Adjustment for no-passing zones, fnp 1.4 mi/h
Average travel speed, ATSd 29.3 mi/h
Percent Free Flow Speed, PFFS 70.7 %

_________________________Percent Time-Spent-Following_________________________
Direction Analysis(d) Opposing (o)
PCE for trucks, ET 1.0* 1.0*
PCE for RVs, ER 1.0 1.0
Heavy-vehicle adjustment factor, fHV 1.000 1.000
Grade adjustment factor,(note-1) fg 1.00 1.00
Directional flow rate,(note-2) vi 640 pc/h 730 pc/h
Base percent time-spent-following,(note-4) BPTSFd 62.1 %
Adjustment for no-passing zones, fnp 29.0
Percent time-spent-following, PTSFd 75.6 %
________________Level of Service and Other Performance Measures_______________
Level of service, LOS D
Volume to capacity ratio, v/c 0.38
Peak 15-min vehicle-miles of travel, VMT15 384 veh-mi
Peak-hour vehicle-miles of travel, VMT60 1428 veh-mi
Peak 15-min total travel time, TT15 13.1 veh-h
Capacity from ATS, CdATS 1686 veh/h
Capacity from PTSF, CdPTSF 1700 veh/h
Directional Capacity 1700 veh/h
_____________________________Passing Lane Analysis____________________________
Total length of analysis segment, Lt 2.4 mi
Length of two-lane highway upstream of the passing lane, Lu - mi
Length of passing lane including tapers, Lpl - mi
Average travel speed, ATSd (from above) 29.3 mi/h
Percent time-spent-following, PTSFd (from above) 75.6
Level of service, LOSd (from above) D
___________________Average Travel Speed with Passing Lane____________________
Downstream length of two-lane highway within effective
length of passing lane for average travel speed, Lde - mi
Length of two-lane highway downstream of effective
length of the passing lane for average travel speed, Ld - mi
Adj. factor for the effect of passing lane
on average speed, fpl -
Average travel speed including passing lane, ATSpl -
Percent free flow speed including passing lane, PFFSpl 0.0 %
________________Percent Time-Spent-Following with Passing Lane________________
Downstream length of two-lane highway within effective length
of passing lane for percent time-spent-following, Lde - mi
Length of two-lane highway downstream of effective length of
the passing lane for percent time-spent-following, Ld - mi
Adj. factor for the effect of passing lane
on percent time-spent-following, fpl -
Percent time-spent-following
including passing lane, PTSFpl - %
______Level of Service and Other Performance Measures with Passing Lane ______
Level of service including passing lane, LOSpl A
Peak 15-min total travel time, TT15 - veh-h
__________________________ Bicycle Level of Service __________________________
Posted speed limit, Sp 55
Percent of segment with occupied on-highway parking 0
Pavement rating, P 3
Flow rate in outside lane, vOL 639.8
Effective width of outside lane, We 24.00
Effective speed factor, St 4.79
Bicycle LOS Score, BLOS 4.45
Bicycle LOS D
Notes:
1. Note that the adjustment factor for level terrain is 1.00, as level terrain
is one of the base conditions. For the purpose of grade adjustment, specific
dewngrade segments are treated as level terrain.
2. If vi (vd or vo ) >= 1,700 pc/h, terminate analysis-the LOS is F.
3. For the analysis direction only and for v>200 veh/h.
4. For the analysis direction only.
5. Use alternative Exhibit 15-14 if some trucks operate at crawl speeds on a
specific downgrade.
* These items have been entered or edited to override calculated value

HCS 2010: Two-Lane Highways Release 6.60
Phone: Fax:
E-Mail:
_________________Directional Two-Lane Highway Segment Analysis________________
Analyst KP
Agency/Co. CCTC
Date Performed 2/2/2015
Analysis Time Period Cumulative AM
Highway Carmel Valley Road
From/To Rancho San Carlos/Schulte
Jurisdiction Unincorporated Monterey County
Analysis Year 2014
Description Carmel Canine
__________________________________Input Data__________________________________
Highway class Class 2 Peak hour factor, PHF 0.93
Shoulder width 6.0 ft % Trucks and buses 8 %
Lane width 12.0 ft % Trucks crawling 0.0 %
Segment length 2.4 mi Truck crawl speed 0.0 mi/hr
Terrain type Level % Recreational vehicles 1 %
Grade: Length - mi % No-passing zones 100 %
Up/down - % Access point density 14 /mi
Analysis direction volume, Vd 1378 veh/h
Opposing direction volume, Vo 894 veh/h
____________________________Average Travel Speed______________________________
Direction Analysis(d) Opposing (o)
PCE for trucks, ET 1.2* 1.2*
PCE for RVs, ER 1.0 1.0
Heavy-vehicle adj. factor,(note-5) fHV 0.984 0.984
Grade adj. factor,(note-1) fg 1.00 1.00
Directional flow rate,(note-2) vi 1506 pc/h 977 pc/h
Free-Flow Speed from Field Measurement:
Field measured speed,(note-3) S FM - mi/h
Observed total demand,(note-3) V - veh/h
Estimated Free-Flow Speed:
Base free-flow speed,(note-3) BFFS 45.0 mi/h
Adj. for lane and shoulder width,(note-3) fLS 0.0 mi/h
Adj. for access point density,(note-3) fA 3.5 mi/h
Free-flow speed, FFSd 41.5 mi/h
Adjustment for no-passing zones, fnp 1.1 mi/h
Average travel speed, ATSd 21.1 mi/h
Percent Free Flow Speed, PFFS 50.9 %
_________________________Percent Time-Spent-Following_________________________
Direction Analysis(d) Opposing (o)
PCE for trucks, ET 1.0* 1.0*
PCE for RVs, ER 1.0 1.0
Heavy-vehicle adjustment factor, fHV 1.000 1.000
Grade adjustment factor,(note-1) fg 1.00 1.00
Directional flow rate,(note-2) vi 1482 pc/h 961 pc/h
Base percent time-spent-following,(note-4) BPTSFd 87.2 %
Adjustment for no-passing zones, fnp 12.2
Percent time-spent-following, PTSFd 94.6 %
________________Level of Service and Other Performance Measures_______________
Level of service, LOS E
Volume to capacity ratio, v/c 0.87
Peak 15-min vehicle-miles of travel, VMT15 889 veh-mi
Peak-hour vehicle-miles of travel, VMT60 3307 veh-mi
Peak 15-min total travel time, TT15 42.1 veh-h
Capacity from ATS, CdATS 0 veh/h
Capacity from PTSF, CdPTSF 1700 veh/h
Directional Capacity 1700 veh/h
_____________________________Passing Lane Analysis____________________________
Total length of analysis segment, Lt 2.4 mi
Length of two-lane highway upstream of the passing lane, Lu - mi
Length of passing lane including tapers, Lpl - mi
Average travel speed, ATSd (from above) 21.1 mi/h
Percent time-spent-following, PTSFd (from above) 94.6
Level of service, LOSd (from above) E
___________________Average Travel Speed with Passing Lane____________________
Downstream length of two-lane highway within effective
length of passing lane for average travel speed, Lde - mi
Length of two-lane highway downstream of effective
length of the passing lane for average travel speed, Ld - mi
Adj. factor for the effect of passing lane
on average speed, fpl -
Average travel speed including passing lane, ATSpl -
Percent free flow speed including passing lane, PFFSpl 0.0 %
________________Percent Time-Spent-Following with Passing Lane________________
Downstream length of two-lane highway within effective length
of passing lane for percent time-spent-following, Lde - mi
Length of two-lane highway downstream of effective length of
the passing lane for percent time-spent-following, Ld - mi
Adj. factor for the effect of passing lane
on percent time-spent-following, fpl -
Percent time-spent-following
including passing lane, PTSFpl - %
______Level of Service and Other Performance Measures with Passing Lane ______
Level of service including passing lane, LOSpl A
Peak 15-min total travel time, TT15 - veh-h
__________________________ Bicycle Level of Service __________________________

Posted speed limit, Sp 55
Percent of segment with occupied on-highway parking 0
Pavement rating, P 3
Flow rate in outside lane, vOL 1481.7
Effective width of outside lane, We 24.00
Effective speed factor, St 4.79
Bicycle LOS Score, BLOS 4.87
Bicycle LOS E
Notes:
1. Note that the adjustment factor for level terrain is 1.00, as level terrain
is one of the base conditions. For the purpose of grade adjustment, specific
dewngrade segments are treated as level terrain.
2. If vi (vd or vo ) >= 1,700 pc/h, terminate analysis-the LOS is F.
3. For the analysis direction only and for v>200 veh/h.
4. For the analysis direction only.
5. Use alternative Exhibit 15-14 if some trucks operate at crawl speeds on a
specific downgrade.
* These items have been entered or edited to override calculated value
HCS 2010: Two-Lane Highways Release 6.60
Phone: Fax:
E-Mail:
_________________Directional Two-Lane Highway Segment Analysis________________
Analyst KP
Agency/Co. CCTC
Date Performed 2/2/2015
Analysis Time Period Cumulative AM
Highway Carmel Valley Road
From/To Rancho San Carlos/Schulte
Jurisdiction Unincorporated Monterey County
Analysis Year 2014
Description Carmel Canine
__________________________________Input Data__________________________________
Highway class Class 2 Peak hour factor, PHF 0.93
Shoulder width 6.0 ft % Trucks and buses 8 %
Lane width 12.0 ft % Trucks crawling 0.0 %
Segment length 2.4 mi Truck crawl speed 0.0 mi/hr
Terrain type Level % Recreational vehicles 1 %
Grade: Length - mi % No-passing zones 100 %
Up/down - % Access point density 14 /mi
Analysis direction volume, Vd 894 veh/h
Opposing direction volume, Vo 1378 veh/h
____________________________Average Travel Speed______________________________
Direction Analysis(d) Opposing (o)
PCE for trucks, ET 1.2* 1.2*
PCE for RVs, ER 1.0 1.0
Heavy-vehicle adj. factor,(note-5) fHV 0.984 0.984
Grade adj. factor,(note-1) fg 1.00 1.00
Directional flow rate,(note-2) vi 977 pc/h 1506 pc/h
Free-Flow Speed from Field Measurement:
Field measured speed,(note-3) S FM - mi/h
Observed total demand,(note-3) V - veh/h
Estimated Free-Flow Speed:
Base free-flow speed,(note-3) BFFS 45.0 mi/h
Adj. for lane and shoulder width,(note-3) fLS 0.0 mi/h
Adj. for access point density,(note-3) fA 3.5 mi/h
Free-flow speed, FFSd 41.5 mi/h
Adjustment for no-passing zones, fnp 0.6 mi/h
Average travel speed, ATSd 21.6 mi/h
Percent Free Flow Speed, PFFS 52.0 %

_________________________Percent Time-Spent-Following_________________________
Direction Analysis(d) Opposing (o)
PCE for trucks, ET 1.0* 1.0*
PCE for RVs, ER 1.0 1.0
Heavy-vehicle adjustment factor, fHV 1.000 1.000
Grade adjustment factor,(note-1) fg 1.00 1.00
Directional flow rate,(note-2) vi 961 pc/h 1482 pc/h
Base percent time-spent-following,(note-4) BPTSFd 81.1 %
Adjustment for no-passing zones, fnp 12.2
Percent time-spent-following, PTSFd 85.9 %
________________Level of Service and Other Performance Measures_______________
Level of service, LOS E
Volume to capacity ratio, v/c 0.57
Peak 15-min vehicle-miles of travel, VMT15 577 veh-mi
Peak-hour vehicle-miles of travel, VMT60 2146 veh-mi
Peak 15-min total travel time, TT15 26.7 veh-h
Capacity from ATS, CdATS 1700 veh/h
Capacity from PTSF, CdPTSF 1700 veh/h
Directional Capacity 1700 veh/h
_____________________________Passing Lane Analysis____________________________
Total length of analysis segment, Lt 2.4 mi
Length of two-lane highway upstream of the passing lane, Lu - mi
Length of passing lane including tapers, Lpl - mi
Average travel speed, ATSd (from above) 21.6 mi/h
Percent time-spent-following, PTSFd (from above) 85.9
Level of service, LOSd (from above) E
___________________Average Travel Speed with Passing Lane____________________
Downstream length of two-lane highway within effective
length of passing lane for average travel speed, Lde - mi
Length of two-lane highway downstream of effective
length of the passing lane for average travel speed, Ld - mi
Adj. factor for the effect of passing lane
on average speed, fpl -
Average travel speed including passing lane, ATSpl -
Percent free flow speed including passing lane, PFFSpl 0.0 %
________________Percent Time-Spent-Following with Passing Lane________________
Downstream length of two-lane highway within effective length
of passing lane for percent time-spent-following, Lde - mi
Length of two-lane highway downstream of effective length of
the passing lane for percent time-spent-following, Ld - mi
Adj. factor for the effect of passing lane
on percent time-spent-following, fpl -
Percent time-spent-following
including passing lane, PTSFpl - %
______Level of Service and Other Performance Measures with Passing Lane ______
Level of service including passing lane, LOSpl A
Peak 15-min total travel time, TT15 - veh-h
__________________________ Bicycle Level of Service __________________________
Posted speed limit, Sp 55
Percent of segment with occupied on-highway parking 0
Pavement rating, P 3
Flow rate in outside lane, vOL 961.3
Effective width of outside lane, We 24.00
Effective speed factor, St 4.79
Bicycle LOS Score, BLOS 4.65
Bicycle LOS E
Notes:
1. Note that the adjustment factor for level terrain is 1.00, as level terrain
is one of the base conditions. For the purpose of grade adjustment, specific
dewngrade segments are treated as level terrain.
2. If vi (vd or vo ) >= 1,700 pc/h, terminate analysis-the LOS is F.
3. For the analysis direction only and for v>200 veh/h.
4. For the analysis direction only.
5. Use alternative Exhibit 15-14 if some trucks operate at crawl speeds on a
specific downgrade.
* These items have been entered or edited to override calculated value
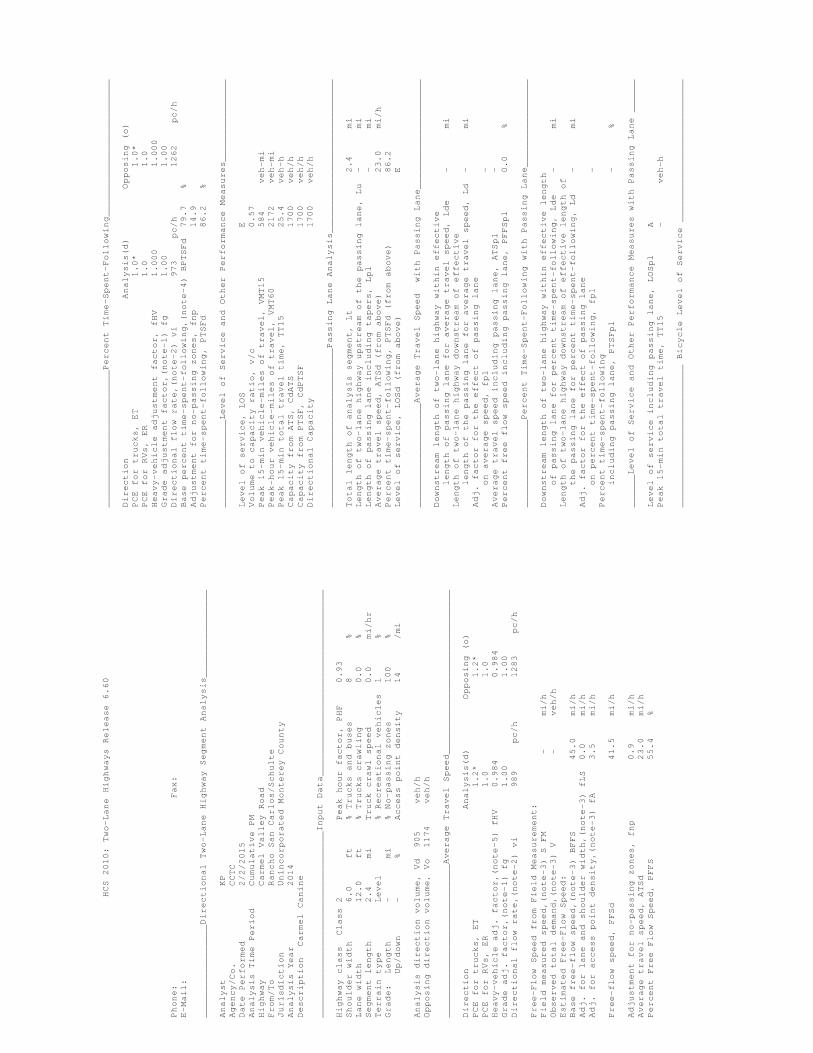
HCS 2010: Two-Lane Highways Release 6.60
Phone: Fax:
E-Mail:
_________________Directional Two-Lane Highway Segment Analysis________________
Analyst KP
Agency/Co. CCTC
Date Performed 2/2/2015
Analysis Time Period Cumulative PM
Highway Carmel Valley Road
From/To Rancho San Carlos/Schulte
Jurisdiction Unincorporated Monterey County
Analysis Year 2014
Description Carmel Canine
__________________________________Input Data__________________________________
Highway class Class 2 Peak hour factor, PHF 0.93
Shoulder width 6.0 ft % Trucks and buses 8 %
Lane width 12.0 ft % Trucks crawling 0.0 %
Segment length 2.4 mi Truck crawl speed 0.0 mi/hr
Terrain type Level % Recreational vehicles 1 %
Grade: Length - mi % No-passing zones 100 %
Up/down - % Access point density 14 /mi
Analysis direction volume, Vd 905 veh/h
Opposing direction volume, Vo 1174 veh/h
____________________________Average Travel Speed______________________________
Direction Analysis(d) Opposing (o)
PCE for trucks, ET 1.2* 1.2*
PCE for RVs, ER 1.0 1.0
Heavy-vehicle adj. factor,(note-5) fHV 0.984 0.984
Grade adj. factor,(note-1) fg 1.00 1.00
Directional flow rate,(note-2) vi 989 pc/h 1283 pc/h
Free-Flow Speed from Field Measurement:
Field measured speed,(note-3) S FM - mi/h
Observed total demand,(note-3) V - veh/h
Estimated Free-Flow Speed:
Base free-flow speed,(note-3) BFFS 45.0 mi/h
Adj. for lane and shoulder width,(note-3) fLS 0.0 mi/h
Adj. for access point density,(note-3) fA 3.5 mi/h
Free-flow speed, FFSd 41.5 mi/h
Adjustment for no-passing zones, fnp 0.9 mi/h
Average travel speed, ATSd 23.0 mi/h
Percent Free Flow Speed, PFFS 55.4 %
_________________________Percent Time-Spent-Following_________________________
Direction Analysis(d) Opposing (o)
PCE for trucks, ET 1.0* 1.0*
PCE for RVs, ER 1.0 1.0
Heavy-vehicle adjustment factor, fHV 1.000 1.000
Grade adjustment factor,(note-1) fg 1.00 1.00
Directional flow rate,(note-2) vi 973 pc/h 1262 pc/h
Base percent time-spent-following,(note-4) BPTSFd 79.7 %
Adjustment for no-passing zones, fnp 14.9
Percent time-spent-following, PTSFd 86.2 %
________________Level of Service and Other Performance Measures_______________
Level of service, LOS E
Volume to capacity ratio, v/c 0.57
Peak 15-min vehicle-miles of travel, VMT15 584 veh-mi
Peak-hour vehicle-miles of travel, VMT60 2172 veh-mi
Peak 15-min total travel time, TT15 25.4 veh-h
Capacity from ATS, CdATS 1700 veh/h
Capacity from PTSF, CdPTSF 1700 veh/h
Directional Capacity 1700 veh/h
_____________________________Passing Lane Analysis____________________________
Total length of analysis segment, Lt 2.4 mi
Length of two-lane highway upstream of the passing lane, Lu - mi
Length of passing lane including tapers, Lpl - mi
Average travel speed, ATSd (from above) 23.0 mi/h
Percent time-spent-following, PTSFd (from above) 86.2
Level of service, LOSd (from above) E
___________________Average Travel Speed with Passing Lane____________________
Downstream length of two-lane highway within effective
length of passing lane for average travel speed, Lde - mi
Length of two-lane highway downstream of effective
length of the passing lane for average travel speed, Ld - mi
Adj. factor for the effect of passing lane
on average speed, fpl -
Average travel speed including passing lane, ATSpl -
Percent free flow speed including passing lane, PFFSpl 0.0 %
________________Percent Time-Spent-Following with Passing Lane________________
Downstream length of two-lane highway within effective length
of passing lane for percent time-spent-following, Lde - mi
Length of two-lane highway downstream of effective length of
the passing lane for percent time-spent-following, Ld - mi
Adj. factor for the effect of passing lane
on percent time-spent-following, fpl -
Percent time-spent-following
including passing lane, PTSFpl - %
______Level of Service and Other Performance Measures with Passing Lane ______
Level of service including passing lane, LOSpl A
Peak 15-min total travel time, TT15 - veh-h
__________________________ Bicycle Level of Service __________________________

Posted speed limit, Sp 55
Percent of segment with occupied on-highway parking 0
Pavement rating, P 3
Flow rate in outside lane, vOL 973.1
Effective width of outside lane, We 24.00
Effective speed factor, St 4.79
Bicycle LOS Score, BLOS 4.66
Bicycle LOS E
Notes:
1. Note that the adjustment factor for level terrain is 1.00, as level terrain
is one of the base conditions. For the purpose of grade adjustment, specific
dewngrade segments are treated as level terrain.
2. If vi (vd or vo ) >= 1,700 pc/h, terminate analysis-the LOS is F.
3. For the analysis direction only and for v>200 veh/h.
4. For the analysis direction only.
5. Use alternative Exhibit 15-14 if some trucks operate at crawl speeds on a
specific downgrade.
* These items have been entered or edited to override calculated value
HCS 2010: Two-Lane Highways Release 6.60
Phone: Fax:
E-Mail:
_________________Directional Two-Lane Highway Segment Analysis________________
Analyst KP
Agency/Co. CCTC
Date Performed 2/2/2015
Analysis Time Period Cumulative PM
Highway Carmel Valley Road
From/To Rancho San Carlos/Schulte
Jurisdiction Unincorporated Monterey County
Analysis Year 2014
Description Carmel Canine
__________________________________Input Data__________________________________
Highway class Class 2 Peak hour factor, PHF 0.93
Shoulder width 6.0 ft % Trucks and buses 8 %
Lane width 12.0 ft % Trucks crawling 0.0 %
Segment length 2.4 mi Truck crawl speed 0.0 mi/hr
Terrain type Level % Recreational vehicles 1 %
Grade: Length - mi % No-passing zones 100 %
Up/down - % Access point density 14 /mi
Analysis direction volume, Vd 1174 veh/h
Opposing direction volume, Vo 905 veh/h
____________________________Average Travel Speed______________________________
Direction Analysis(d) Opposing (o)
PCE for trucks, ET 1.2* 1.2*
PCE for RVs, ER 1.0 1.0
Heavy-vehicle adj. factor,(note-5) fHV 0.984 0.984
Grade adj. factor,(note-1) fg 1.00 1.00
Directional flow rate,(note-2) vi 1283 pc/h 989 pc/h
Free-Flow Speed from Field Measurement:
Field measured speed,(note-3) S FM - mi/h
Observed total demand,(note-3) V - veh/h
Estimated Free-Flow Speed:
Base free-flow speed,(note-3) BFFS 45.0 mi/h
Adj. for lane and shoulder width,(note-3) fLS 0.0 mi/h
Adj. for access point density,(note-3) fA 3.5 mi/h
Free-flow speed, FFSd 41.5 mi/h
Adjustment for no-passing zones, fnp 1.1 mi/h
Average travel speed, ATSd 22.8 mi/h
Percent Free Flow Speed, PFFS 54.9 %

_________________________Percent Time-Spent-Following_________________________
Direction Analysis(d) Opposing (o)
PCE for trucks, ET 1.0* 1.0*
PCE for RVs, ER 1.0 1.0
Heavy-vehicle adjustment factor, fHV 1.000 1.000
Grade adjustment factor,(note-1) fg 1.00 1.00
Directional flow rate,(note-2) vi 1262 pc/h 973 pc/h
Base percent time-spent-following,(note-4) BPTSFd 83.5 %
Adjustment for no-passing zones, fnp 14.9
Percent time-spent-following, PTSFd 91.9 %
________________Level of Service and Other Performance Measures_______________
Level of service, LOS E
Volume to capacity ratio, v/c 0.74
Peak 15-min vehicle-miles of travel, VMT15 757 veh-mi
Peak-hour vehicle-miles of travel, VMT60 2818 veh-mi
Peak 15-min total travel time, TT15 33.3 veh-h
Capacity from ATS, CdATS 0 veh/h
Capacity from PTSF, CdPTSF 1700 veh/h
Directional Capacity 1700 veh/h
_____________________________Passing Lane Analysis____________________________
Total length of analysis segment, Lt 2.4 mi
Length of two-lane highway upstream of the passing lane, Lu - mi
Length of passing lane including tapers, Lpl - mi
Average travel speed, ATSd (from above) 22.8 mi/h
Percent time-spent-following, PTSFd (from above) 91.9
Level of service, LOSd (from above) E
___________________Average Travel Speed with Passing Lane____________________
Downstream length of two-lane highway within effective
length of passing lane for average travel speed, Lde - mi
Length of two-lane highway downstream of effective
length of the passing lane for average travel speed, Ld - mi
Adj. factor for the effect of passing lane
on average speed, fpl -
Average travel speed including passing lane, ATSpl -
Percent free flow speed including passing lane, PFFSpl 0.0 %
________________Percent Time-Spent-Following with Passing Lane________________
Downstream length of two-lane highway within effective length
of passing lane for percent time-spent-following, Lde - mi
Length of two-lane highway downstream of effective length of
the passing lane for percent time-spent-following, Ld - mi
Adj. factor for the effect of passing lane
on percent time-spent-following, fpl -
Percent time-spent-following
including passing lane, PTSFpl - %
______Level of Service and Other Performance Measures with Passing Lane ______
Level of service including passing lane, LOSpl A
Peak 15-min total travel time, TT15 - veh-h
__________________________ Bicycle Level of Service __________________________
Posted speed limit, Sp 55
Percent of segment with occupied on-highway parking 0
Pavement rating, P 3
Flow rate in outside lane, vOL 1262.4
Effective width of outside lane, We 24.00
Effective speed factor, St 4.79
Bicycle LOS Score, BLOS 4.79
Bicycle LOS E
Notes:
1. Note that the adjustment factor for level terrain is 1.00, as level terrain
is one of the base conditions. For the purpose of grade adjustment, specific
dewngrade segments are treated as level terrain.
2. If vi (vd or vo ) >= 1,700 pc/h, terminate analysis-the LOS is F.
3. For the analysis direction only and for v>200 veh/h.
4. For the analysis direction only.
5. Use alternative Exhibit 15-14 if some trucks operate at crawl speeds on a
specific downgrade.
* These items have been entered or edited to override calculated value

HCS 2010: Two-Lane Highways Release 6.60
Phone: Fax:
E-Mail:
_________________Directional Two-Lane Highway Segment Analysis________________
Analyst KP
Agency/Co. CCTC
Date Performed 2/2/2015
Analysis Time Period Cumulative Friday
Highway Carmel Valley Road
From/To Rancho San Carlos/Schulte
Jurisdiction Unincorporated Monterey County
Analysis Year 2014
Description Carmel Canine
__________________________________Input Data__________________________________
Highway class Class 2 Peak hour factor, PHF 0.93
Shoulder width 6.0 ft % Trucks and buses 8 %
Lane width 12.0 ft % Trucks crawling 0.0 %
Segment length 2.4 mi Truck crawl speed 0.0 mi/hr
Terrain type Level % Recreational vehicles 1 %
Grade: Length - mi % No-passing zones 100 %
Up/down - % Access point density 14 /mi
Analysis direction volume, Vd 889 veh/h
Opposing direction volume, Vo 1248 veh/h
____________________________Average Travel Speed______________________________
Direction Analysis(d) Opposing (o)
PCE for trucks, ET 1.2* 1.2*
PCE for RVs, ER 1.0 1.0
Heavy-vehicle adj. factor,(note-5) fHV 0.984 0.984
Grade adj. factor,(note-1) fg 1.00 1.00
Directional flow rate,(note-2) vi 971 pc/h 1364 pc/h
Free-Flow Speed from Field Measurement:
Field measured speed,(note-3) S FM - mi/h
Observed total demand,(note-3) V - veh/h
Estimated Free-Flow Speed:
Base free-flow speed,(note-3) BFFS 45.0 mi/h
Adj. for lane and shoulder width,(note-3) fLS 0.0 mi/h
Adj. for access point density,(note-3) fA 3.5 mi/h
Free-flow speed, FFSd 41.5 mi/h
Adjustment for no-passing zones, fnp 0.8 mi/h
Average travel speed, ATSd 22.6 mi/h
Percent Free Flow Speed, PFFS 54.5 %
_________________________Percent Time-Spent-Following_________________________
Direction Analysis(d) Opposing (o)
PCE for trucks, ET 1.0* 1.0*
PCE for RVs, ER 1.0 1.0
Heavy-vehicle adjustment factor, fHV 1.000 1.000
Grade adjustment factor,(note-1) fg 1.00 1.00
Directional flow rate,(note-2) vi 956 pc/h 1342 pc/h
Base percent time-spent-following,(note-4) BPTSFd 79.9 %
Adjustment for no-passing zones, fnp 13.9
Percent time-spent-following, PTSFd 85.7 %
________________Level of Service and Other Performance Measures_______________
Level of service, LOS E
Volume to capacity ratio, v/c 0.56
Peak 15-min vehicle-miles of travel, VMT15 574 veh-mi
Peak-hour vehicle-miles of travel, VMT60 2134 veh-mi
Peak 15-min total travel time, TT15 25.4 veh-h
Capacity from ATS, CdATS 1700 veh/h
Capacity from PTSF, CdPTSF 1700 veh/h
Directional Capacity 1700 veh/h
_____________________________Passing Lane Analysis____________________________
Total length of analysis segment, Lt 2.4 mi
Length of two-lane highway upstream of the passing lane, Lu - mi
Length of passing lane including tapers, Lpl - mi
Average travel speed, ATSd (from above) 22.6 mi/h
Percent time-spent-following, PTSFd (from above) 85.7
Level of service, LOSd (from above) E
___________________Average Travel Speed with Passing Lane____________________
Downstream length of two-lane highway within effective
length of passing lane for average travel speed, Lde - mi
Length of two-lane highway downstream of effective
length of the passing lane for average travel speed, Ld - mi
Adj. factor for the effect of passing lane
on average speed, fpl -
Average travel speed including passing lane, ATSpl -
Percent free flow speed including passing lane, PFFSpl 0.0 %
________________Percent Time-Spent-Following with Passing Lane________________
Downstream length of two-lane highway within effective length
of passing lane for percent time-spent-following, Lde - mi
Length of two-lane highway downstream of effective length of
the passing lane for percent time-spent-following, Ld - mi
Adj. factor for the effect of passing lane
on percent time-spent-following, fpl -
Percent time-spent-following
including passing lane, PTSFpl - %
______Level of Service and Other Performance Measures with Passing Lane ______
Level of service including passing lane, LOSpl A
Peak 15-min total travel time, TT15 - veh-h
__________________________ Bicycle Level of Service __________________________

Posted speed limit, Sp 55
Percent of segment with occupied on-highway parking 0
Pavement rating, P 3
Flow rate in outside lane, vOL 955.9
Effective width of outside lane, We 24.00
Effective speed factor, St 4.79
Bicycle LOS Score, BLOS 4.65
Bicycle LOS E
Notes:
1. Note that the adjustment factor for level terrain is 1.00, as level terrain
is one of the base conditions. For the purpose of grade adjustment, specific
dewngrade segments are treated as level terrain.
2. If vi (vd or vo ) >= 1,700 pc/h, terminate analysis-the LOS is F.
3. For the analysis direction only and for v>200 veh/h.
4. For the analysis direction only.
5. Use alternative Exhibit 15-14 if some trucks operate at crawl speeds on a
specific downgrade.
* These items have been entered or edited to override calculated value
HCS 2010: Two-Lane Highways Release 6.60
Phone: Fax:
E-Mail:
_________________Directional Two-Lane Highway Segment Analysis________________
Analyst KP
Agency/Co. CCTC
Date Performed 2/2/2015
Analysis Time Period Cumulative Friday
Highway Carmel Valley Road
From/To Rancho San Carlos/Schulte
Jurisdiction Unincorporated Monterey County
Analysis Year 2014
Description Carmel Canine
__________________________________Input Data__________________________________
Highway class Class 2 Peak hour factor, PHF 0.93
Shoulder width 6.0 ft % Trucks and buses 8 %
Lane width 12.0 ft % Trucks crawling 0.0 %
Segment length 2.4 mi Truck crawl speed 0.0 mi/hr
Terrain type Level % Recreational vehicles 1 %
Grade: Length - mi % No-passing zones 100 %
Up/down - % Access point density 14 /mi
Analysis direction volume, Vd 1248 veh/h
Opposing direction volume, Vo 889 veh/h
____________________________Average Travel Speed______________________________
Direction Analysis(d) Opposing (o)
PCE for trucks, ET 1.2* 1.2*
PCE for RVs, ER 1.0 1.0
Heavy-vehicle adj. factor,(note-5) fHV 0.984 0.984
Grade adj. factor,(note-1) fg 1.00 1.00
Directional flow rate,(note-2) vi 1364 pc/h 971 pc/h
Free-Flow Speed from Field Measurement:
Field measured speed,(note-3) S FM - mi/h
Observed total demand,(note-3) V - veh/h
Estimated Free-Flow Speed:
Base free-flow speed,(note-3) BFFS 45.0 mi/h
Adj. for lane and shoulder width,(note-3) fLS 0.0 mi/h
Adj. for access point density,(note-3) fA 3.5 mi/h
Free-flow speed, FFSd 41.5 mi/h
Adjustment for no-passing zones, fnp 1.1 mi/h
Average travel speed, ATSd 22.3 mi/h
Percent Free Flow Speed, PFFS 53.7 %

_________________________Percent Time-Spent-Following_________________________
Direction Analysis(d) Opposing (o)
PCE for trucks, ET 1.0* 1.0*
PCE for RVs, ER 1.0 1.0
Heavy-vehicle adjustment factor, fHV 1.000 1.000
Grade adjustment factor,(note-1) fg 1.00 1.00
Directional flow rate,(note-2) vi 1342 pc/h 956 pc/h
Base percent time-spent-following,(note-4) BPTSFd 84.9 %
Adjustment for no-passing zones, fnp 13.9
Percent time-spent-following, PTSFd 93.0 %
________________Level of Service and Other Performance Measures_______________
Level of service, LOS E
Volume to capacity ratio, v/c 0.79
Peak 15-min vehicle-miles of travel, VMT15 805 veh-mi
Peak-hour vehicle-miles of travel, VMT60 2995 veh-mi
Peak 15-min total travel time, TT15 36.2 veh-h
Capacity from ATS, CdATS 0 veh/h
Capacity from PTSF, CdPTSF 1700 veh/h
Directional Capacity 1700 veh/h
_____________________________Passing Lane Analysis____________________________
Total length of analysis segment, Lt 2.4 mi
Length of two-lane highway upstream of the passing lane, Lu - mi
Length of passing lane including tapers, Lpl - mi
Average travel speed, ATSd (from above) 22.3 mi/h
Percent time-spent-following, PTSFd (from above) 93.0
Level of service, LOSd (from above) E
___________________Average Travel Speed with Passing Lane____________________
Downstream length of two-lane highway within effective
length of passing lane for average travel speed, Lde - mi
Length of two-lane highway downstream of effective
length of the passing lane for average travel speed, Ld - mi
Adj. factor for the effect of passing lane
on average speed, fpl -
Average travel speed including passing lane, ATSpl -
Percent free flow speed including passing lane, PFFSpl 0.0 %
________________Percent Time-Spent-Following with Passing Lane________________
Downstream length of two-lane highway within effective length
of passing lane for percent time-spent-following, Lde - mi
Length of two-lane highway downstream of effective length of
the passing lane for percent time-spent-following, Ld - mi
Adj. factor for the effect of passing lane
on percent time-spent-following, fpl -
Percent time-spent-following
including passing lane, PTSFpl - %
______Level of Service and Other Performance Measures with Passing Lane ______
Level of service including passing lane, LOSpl A
Peak 15-min total travel time, TT15 - veh-h
__________________________ Bicycle Level of Service __________________________
Posted speed limit, Sp 55
Percent of segment with occupied on-highway parking 0
Pavement rating, P 3
Flow rate in outside lane, vOL 1341.9
Effective width of outside lane, We 24.00
Effective speed factor, St 4.79
Bicycle LOS Score, BLOS 4.82
Bicycle LOS E
Notes:
1. Note that the adjustment factor for level terrain is 1.00, as level terrain
is one of the base conditions. For the purpose of grade adjustment, specific
dewngrade segments are treated as level terrain.
2. If vi (vd or vo ) >= 1,700 pc/h, terminate analysis-the LOS is F.
3. For the analysis direction only and for v>200 veh/h.
4. For the analysis direction only.
5. Use alternative Exhibit 15-14 if some trucks operate at crawl speeds on a
specific downgrade.
* These items have been entered or edited to override calculated value

HCS 2010: Two-Lane Highways Release 6.60
Phone: Fax:
E-Mail:
_________________Directional Two-Lane Highway Segment Analysis________________
Analyst KP
Agency/Co. CCTC
Date Performed 2/2/2015
Analysis Time Period Cumulative Sunday
Highway Carmel Valley Road
From/To Rancho San Carlos/Schulte
Jurisdiction Unincorporated Monterey County
Analysis Year 2014
Description Carmel Canine
__________________________________Input Data__________________________________
Highway class Class 2 Peak hour factor, PHF 0.93
Shoulder width 6.0 ft % Trucks and buses 8 %
Lane width 12.0 ft % Trucks crawling 0.0 %
Segment length 2.4 mi Truck crawl speed 0.0 mi/hr
Terrain type Level % Recreational vehicles 1 %
Grade: Length - mi % No-passing zones 100 %
Up/down - % Access point density 14 /mi
Analysis direction volume, Vd 917 veh/h
Opposing direction volume, Vo 827 veh/h
____________________________Average Travel Speed______________________________
Direction Analysis(d) Opposing (o)
PCE for trucks, ET 1.2* 1.2*
PCE for RVs, ER 1.0 1.0
Heavy-vehicle adj. factor,(note-5) fHV 0.984 0.984
Grade adj. factor,(note-1) fg 1.00 1.00
Directional flow rate,(note-2) vi 1002 pc/h 904 pc/h
Free-Flow Speed from Field Measurement:
Field measured speed,(note-3) S FM - mi/h
Observed total demand,(note-3) V - veh/h
Estimated Free-Flow Speed:
Base free-flow speed,(note-3) BFFS 45.0 mi/h
Adj. for lane and shoulder width,(note-3) fLS 0.0 mi/h
Adj. for access point density,(note-3) fA 3.5 mi/h
Free-flow speed, FFSd 41.5 mi/h
Adjustment for no-passing zones, fnp 1.1 mi/h
Average travel speed, ATSd 25.6 mi/h
Percent Free Flow Speed, PFFS 61.6 %
_________________________Percent Time-Spent-Following_________________________
Direction Analysis(d) Opposing (o)
PCE for trucks, ET 1.0* 1.0*
PCE for RVs, ER 1.0 1.0
Heavy-vehicle adjustment factor, fHV 1.000 1.000
Grade adjustment factor,(note-1) fg 1.00 1.00
Directional flow rate,(note-2) vi 986 pc/h 889 pc/h
Base percent time-spent-following,(note-4) BPTSFd 76.4 %
Adjustment for no-passing zones, fnp 20.5
Percent time-spent-following, PTSFd 87.2 %
________________Level of Service and Other Performance Measures_______________
Level of service, LOS E
Volume to capacity ratio, v/c 0.58
Peak 15-min vehicle-miles of travel, VMT15 592 veh-mi
Peak-hour vehicle-miles of travel, VMT60 2201 veh-mi
Peak 15-min total travel time, TT15 23.2 veh-h
Capacity from ATS, CdATS 0 veh/h
Capacity from PTSF, CdPTSF 1700 veh/h
Directional Capacity 1700 veh/h
_____________________________Passing Lane Analysis____________________________
Total length of analysis segment, Lt 2.4 mi
Length of two-lane highway upstream of the passing lane, Lu - mi
Length of passing lane including tapers, Lpl - mi
Average travel speed, ATSd (from above) 25.6 mi/h
Percent time-spent-following, PTSFd (from above) 87.2
Level of service, LOSd (from above) E
___________________Average Travel Speed with Passing Lane____________________
Downstream length of two-lane highway within effective
length of passing lane for average travel speed, Lde - mi
Length of two-lane highway downstream of effective
length of the passing lane for average travel speed, Ld - mi
Adj. factor for the effect of passing lane
on average speed, fpl -
Average travel speed including passing lane, ATSpl -
Percent free flow speed including passing lane, PFFSpl 0.0 %
________________Percent Time-Spent-Following with Passing Lane________________
Downstream length of two-lane highway within effective length
of passing lane for percent time-spent-following, Lde - mi
Length of two-lane highway downstream of effective length of
the passing lane for percent time-spent-following, Ld - mi
Adj. factor for the effect of passing lane
on percent time-spent-following, fpl -
Percent time-spent-following
including passing lane, PTSFpl - %
______Level of Service and Other Performance Measures with Passing Lane ______
Level of service including passing lane, LOSpl A
Peak 15-min total travel time, TT15 - veh-h
__________________________ Bicycle Level of Service __________________________

Posted speed limit, Sp 55
Percent of segment with occupied on-highway parking 0
Pavement rating, P 3
Flow rate in outside lane, vOL 986.0
Effective width of outside lane, We 24.00
Effective speed factor, St 4.79
Bicycle LOS Score, BLOS 4.67
Bicycle LOS E
Notes:
1. Note that the adjustment factor for level terrain is 1.00, as level terrain
is one of the base conditions. For the purpose of grade adjustment, specific
dewngrade segments are treated as level terrain.
2. If vi (vd or vo ) >= 1,700 pc/h, terminate analysis-the LOS is F.
3. For the analysis direction only and for v>200 veh/h.
4. For the analysis direction only.
5. Use alternative Exhibit 15-14 if some trucks operate at crawl speeds on a
specific downgrade.
* These items have been entered or edited to override calculated value
HCS 2010: Two-Lane Highways Release 6.60
Phone: Fax:
E-Mail:
_________________Directional Two-Lane Highway Segment Analysis________________
Analyst KP
Agency/Co. CCTC
Date Performed 2/2/2015
Analysis Time Period Cumulative Sunday
Highway Carmel Valley Road
From/To Rancho San Carlos/Schulte
Jurisdiction Unincorporated Monterey County
Analysis Year 2014
Description Carmel Canine
__________________________________Input Data__________________________________
Highway class Class 2 Peak hour factor, PHF 0.93
Shoulder width 6.0 ft % Trucks and buses 8 %
Lane width 12.0 ft % Trucks crawling 0.0 %
Segment length 2.4 mi Truck crawl speed 0.0 mi/hr
Terrain type Level % Recreational vehicles 1 %
Grade: Length - mi % No-passing zones 100 %
Up/down - % Access point density 14 /mi
Analysis direction volume, Vd 827 veh/h
Opposing direction volume, Vo 917 veh/h
____________________________Average Travel Speed______________________________
Direction Analysis(d) Opposing (o)
PCE for trucks, ET 1.2* 1.2*
PCE for RVs, ER 1.0 1.0
Heavy-vehicle adj. factor,(note-5) fHV 0.984 0.984
Grade adj. factor,(note-1) fg 1.00 1.00
Directional flow rate,(note-2) vi 904 pc/h 1002 pc/h
Free-Flow Speed from Field Measurement:
Field measured speed,(note-3) S FM - mi/h
Observed total demand,(note-3) V - veh/h
Estimated Free-Flow Speed:
Base free-flow speed,(note-3) BFFS 45.0 mi/h
Adj. for lane and shoulder width,(note-3) fLS 0.0 mi/h
Adj. for access point density,(note-3) fA 3.5 mi/h
Free-flow speed, FFSd 41.5 mi/h
Adjustment for no-passing zones, fnp 1.1 mi/h
Average travel speed, ATSd 25.6 mi/h
Percent Free Flow Speed, PFFS 61.7 %

_________________________Percent Time-Spent-Following_________________________
Direction Analysis(d) Opposing (o)
PCE for trucks, ET 1.0* 1.0*
PCE for RVs, ER 1.0 1.0
Heavy-vehicle adjustment factor, fHV 1.000 1.000
Grade adjustment factor,(note-1) fg 1.00 1.00
Directional flow rate,(note-2) vi 889 pc/h 986 pc/h
Base percent time-spent-following,(note-4) BPTSFd 74.4 %
Adjustment for no-passing zones, fnp 20.5
Percent time-spent-following, PTSFd 84.1 %
________________Level of Service and Other Performance Measures_______________
Level of service, LOS D
Volume to capacity ratio, v/c 0.52
Peak 15-min vehicle-miles of travel, VMT15 534 veh-mi
Peak-hour vehicle-miles of travel, VMT60 1985 veh-mi
Peak 15-min total travel time, TT15 20.9 veh-h
Capacity from ATS, CdATS 1700 veh/h
Capacity from PTSF, CdPTSF 1700 veh/h
Directional Capacity 1700 veh/h
_____________________________Passing Lane Analysis____________________________
Total length of analysis segment, Lt 2.4 mi
Length of two-lane highway upstream of the passing lane, Lu - mi
Length of passing lane including tapers, Lpl - mi
Average travel speed, ATSd (from above) 25.6 mi/h
Percent time-spent-following, PTSFd (from above) 84.1
Level of service, LOSd (from above) D
___________________Average Travel Speed with Passing Lane____________________
Downstream length of two-lane highway within effective
length of passing lane for average travel speed, Lde - mi
Length of two-lane highway downstream of effective
length of the passing lane for average travel speed, Ld - mi
Adj. factor for the effect of passing lane
on average speed, fpl -
Average travel speed including passing lane, ATSpl -
Percent free flow speed including passing lane, PFFSpl 0.0 %
________________Percent Time-Spent-Following with Passing Lane________________
Downstream length of two-lane highway within effective length
of passing lane for percent time-spent-following, Lde - mi
Length of two-lane highway downstream of effective length of
the passing lane for percent time-spent-following, Ld - mi
Adj. factor for the effect of passing lane
on percent time-spent-following, fpl -
Percent time-spent-following
including passing lane, PTSFpl - %
______Level of Service and Other Performance Measures with Passing Lane ______
Level of service including passing lane, LOSpl A
Peak 15-min total travel time, TT15 - veh-h
__________________________ Bicycle Level of Service __________________________
Posted speed limit, Sp 55
Percent of segment with occupied on-highway parking 0
Pavement rating, P 3
Flow rate in outside lane, vOL 889.2
Effective width of outside lane, We 24.00
Effective speed factor, St 4.79
Bicycle LOS Score, BLOS 4.61
Bicycle LOS E
Notes:
1. Note that the adjustment factor for level terrain is 1.00, as level terrain
is one of the base conditions. For the purpose of grade adjustment, specific
dewngrade segments are treated as level terrain.
2. If vi (vd or vo ) >= 1,700 pc/h, terminate analysis-the LOS is F.
3. For the analysis direction only and for v>200 veh/h.
4. For the analysis direction only.
5. Use alternative Exhibit 15-14 if some trucks operate at crawl speeds on a
specific downgrade.
* These items have been entered or edited to override calculated value

HCS 2010: Two-Lane Highways Release 6.60
Phone: Fax:
E-Mail:
_________________Directional Two-Lane Highway Segment Analysis________________
Analyst KP
Agency/Co. CCTC
Date Performed 2/2/2015
Analysis Time Period Cumulative Plus Project AM
Highway Carmel Valley Road
From/To Rancho San Carlos/Schulte
Jurisdiction Unincorporated Monterey County
Analysis Year 2014
Description Carmel Canine
__________________________________Input Data__________________________________
Highway class Class 2 Peak hour factor, PHF 0.93
Shoulder width 6.0 ft % Trucks and buses 8 %
Lane width 12.0 ft % Trucks crawling 0.0 %
Segment length 2.4 mi Truck crawl speed 0.0 mi/hr
Terrain type Level % Recreational vehicles 1 %
Grade: Length - mi % No-passing zones 100 %
Up/down - % Access point density 14 /mi
Analysis direction volume, Vd 1401 veh/h
Opposing direction volume, Vo 921 veh/h
____________________________Average Travel Speed______________________________
Direction Analysis(d) Opposing (o)
PCE for trucks, ET 1.2* 1.2*
PCE for RVs, ER 1.0 1.0
Heavy-vehicle adj. factor,(note-5) fHV 0.984 0.984
Grade adj. factor,(note-1) fg 1.00 1.00
Directional flow rate,(note-2) vi 1531 pc/h 1006 pc/h
Free-Flow Speed from Field Measurement:
Field measured speed,(note-3) S FM - mi/h
Observed total demand,(note-3) V - veh/h
Estimated Free-Flow Speed:
Base free-flow speed,(note-3) BFFS 45.0 mi/h
Adj. for lane and shoulder width,(note-3) fLS 0.0 mi/h
Adj. for access point density,(note-3) fA 3.5 mi/h
Free-flow speed, FFSd 41.5 mi/h
Adjustment for no-passing zones, fnp 1.1 mi/h
Average travel speed, ATSd 20.7 mi/h
Percent Free Flow Speed, PFFS 49.9 %
_________________________Percent Time-Spent-Following_________________________
Direction Analysis(d) Opposing (o)
PCE for trucks, ET 1.0* 1.0*
PCE for RVs, ER 1.0 1.0
Heavy-vehicle adjustment factor, fHV 1.000 1.000
Grade adjustment factor,(note-1) fg 1.00 1.00
Directional flow rate,(note-2) vi 1506 pc/h 990 pc/h
Base percent time-spent-following,(note-4) BPTSFd 87.9 %
Adjustment for no-passing zones, fnp 11.5
Percent time-spent-following, PTSFd 94.8 %
________________Level of Service and Other Performance Measures_______________
Level of service, LOS E
Volume to capacity ratio, v/c 0.89
Peak 15-min vehicle-miles of travel, VMT15 904 veh-mi
Peak-hour vehicle-miles of travel, VMT60 3362 veh-mi
Peak 15-min total travel time, TT15 43.6 veh-h
Capacity from ATS, CdATS 0 veh/h
Capacity from PTSF, CdPTSF 1700 veh/h
Directional Capacity 1700 veh/h
_____________________________Passing Lane Analysis____________________________
Total length of analysis segment, Lt 2.4 mi
Length of two-lane highway upstream of the passing lane, Lu - mi
Length of passing lane including tapers, Lpl - mi
Average travel speed, ATSd (from above) 20.7 mi/h
Percent time-spent-following, PTSFd (from above) 94.8
Level of service, LOSd (from above) E
___________________Average Travel Speed with Passing Lane____________________
Downstream length of two-lane highway within effective
length of passing lane for average travel speed, Lde - mi
Length of two-lane highway downstream of effective
length of the passing lane for average travel speed, Ld - mi
Adj. factor for the effect of passing lane
on average speed, fpl -
Average travel speed including passing lane, ATSpl -
Percent free flow speed including passing lane, PFFSpl 0.0 %
________________Percent Time-Spent-Following with Passing Lane________________
Downstream length of two-lane highway within effective length
of passing lane for percent time-spent-following, Lde - mi
Length of two-lane highway downstream of effective length of
the passing lane for percent time-spent-following, Ld - mi
Adj. factor for the effect of passing lane
on percent time-spent-following, fpl -
Percent time-spent-following
including passing lane, PTSFpl - %
______Level of Service and Other Performance Measures with Passing Lane ______
Level of service including passing lane, LOSpl A
Peak 15-min total travel time, TT15 - veh-h
__________________________ Bicycle Level of Service __________________________

Posted speed limit, Sp 55
Percent of segment with occupied on-highway parking 0
Pavement rating, P 3
Flow rate in outside lane, vOL 1506.5
Effective width of outside lane, We 24.00
Effective speed factor, St 4.79
Bicycle LOS Score, BLOS 4.88
Bicycle LOS E
Notes:
1. Note that the adjustment factor for level terrain is 1.00, as level terrain
is one of the base conditions. For the purpose of grade adjustment, specific
dewngrade segments are treated as level terrain.
2. If vi (vd or vo ) >= 1,700 pc/h, terminate analysis-the LOS is F.
3. For the analysis direction only and for v>200 veh/h.
4. For the analysis direction only.
5. Use alternative Exhibit 15-14 if some trucks operate at crawl speeds on a
specific downgrade.
* These items have been entered or edited to override calculated value
HCS 2010: Two-Lane Highways Release 6.60
Phone: Fax:
E-Mail:
_________________Directional Two-Lane Highway Segment Analysis________________
Analyst KP
Agency/Co. CCTC
Date Performed 2/2/2015
Analysis Time Period Cumulative Plus Project AM
Highway Carmel Valley Road
From/To Rancho San Carlos/Schulte
Jurisdiction Unincorporated Monterey County
Analysis Year 2014
Description Carmel Canine
__________________________________Input Data__________________________________
Highway class Class 2 Peak hour factor, PHF 0.93
Shoulder width 6.0 ft % Trucks and buses 8 %
Lane width 12.0 ft % Trucks crawling 0.0 %
Segment length 2.4 mi Truck crawl speed 0.0 mi/hr
Terrain type Level % Recreational vehicles 1 %
Grade: Length - mi % No-passing zones 100 %
Up/down - % Access point density 14 /mi
Analysis direction volume, Vd 921 veh/h
Opposing direction volume, Vo 1401 veh/h
____________________________Average Travel Speed______________________________
Direction Analysis(d) Opposing (o)
PCE for trucks, ET 1.2* 1.2*
PCE for RVs, ER 1.0 1.0
Heavy-vehicle adj. factor,(note-5) fHV 0.984 0.984
Grade adj. factor,(note-1) fg 1.00 1.00
Directional flow rate,(note-2) vi 1006 pc/h 1531 pc/h
Free-Flow Speed from Field Measurement:
Field measured speed,(note-3) S FM - mi/h
Observed total demand,(note-3) V - veh/h
Estimated Free-Flow Speed:
Base free-flow speed,(note-3) BFFS 45.0 mi/h
Adj. for lane and shoulder width,(note-3) fLS 0.0 mi/h
Adj. for access point density,(note-3) fA 3.5 mi/h
Free-flow speed, FFSd 41.5 mi/h
Adjustment for no-passing zones, fnp 0.6 mi/h
Average travel speed, ATSd 21.2 mi/h
Percent Free Flow Speed, PFFS 51.0 %

_________________________Percent Time-Spent-Following_________________________
Direction Analysis(d) Opposing (o)
PCE for trucks, ET 1.0* 1.0*
PCE for RVs, ER 1.0 1.0
Heavy-vehicle adjustment factor, fHV 1.000 1.000
Grade adjustment factor,(note-1) fg 1.00 1.00
Directional flow rate,(note-2) vi 990 pc/h 1506 pc/h
Base percent time-spent-following,(note-4) BPTSFd 81.8 %
Adjustment for no-passing zones, fnp 11.5
Percent time-spent-following, PTSFd 86.4 %
________________Level of Service and Other Performance Measures_______________
Level of service, LOS E
Volume to capacity ratio, v/c 0.58
Peak 15-min vehicle-miles of travel, VMT15 594 veh-mi
Peak-hour vehicle-miles of travel, VMT60 2210 veh-mi
Peak 15-min total travel time, TT15 28.0 veh-h
Capacity from ATS, CdATS 1700 veh/h
Capacity from PTSF, CdPTSF 1700 veh/h
Directional Capacity 1700 veh/h
_____________________________Passing Lane Analysis____________________________
Total length of analysis segment, Lt 2.4 mi
Length of two-lane highway upstream of the passing lane, Lu - mi
Length of passing lane including tapers, Lpl - mi
Average travel speed, ATSd (from above) 21.2 mi/h
Percent time-spent-following, PTSFd (from above) 86.4
Level of service, LOSd (from above) E
___________________Average Travel Speed with Passing Lane____________________
Downstream length of two-lane highway within effective
length of passing lane for average travel speed, Lde - mi
Length of two-lane highway downstream of effective
length of the passing lane for average travel speed, Ld - mi
Adj. factor for the effect of passing lane
on average speed, fpl -
Average travel speed including passing lane, ATSpl -
Percent free flow speed including passing lane, PFFSpl 0.0 %
________________Percent Time-Spent-Following with Passing Lane________________
Downstream length of two-lane highway within effective length
of passing lane for percent time-spent-following, Lde - mi
Length of two-lane highway downstream of effective length of
the passing lane for percent time-spent-following, Ld - mi
Adj. factor for the effect of passing lane
on percent time-spent-following, fpl -
Percent time-spent-following
including passing lane, PTSFpl - %
______Level of Service and Other Performance Measures with Passing Lane ______
Level of service including passing lane, LOSpl A
Peak 15-min total travel time, TT15 - veh-h
__________________________ Bicycle Level of Service __________________________
Posted speed limit, Sp 55
Percent of segment with occupied on-highway parking 0
Pavement rating, P 3
Flow rate in outside lane, vOL 990.3
Effective width of outside lane, We 24.00
Effective speed factor, St 4.79
Bicycle LOS Score, BLOS 4.67
Bicycle LOS E
Notes:
1. Note that the adjustment factor for level terrain is 1.00, as level terrain
is one of the base conditions. For the purpose of grade adjustment, specific
dewngrade segments are treated as level terrain.
2. If vi (vd or vo ) >= 1,700 pc/h, terminate analysis-the LOS is F.
3. For the analysis direction only and for v>200 veh/h.
4. For the analysis direction only.
5. Use alternative Exhibit 15-14 if some trucks operate at crawl speeds on a
specific downgrade.
* These items have been entered or edited to override calculated value

HCS 2010: Two-Lane Highways Release 6.60
Phone: Fax:
E-Mail:
_________________Directional Two-Lane Highway Segment Analysis________________
Analyst KP
Agency/Co. CCTC
Date Performed 2/2/2015
Analysis Time Period Cumulative Plus Project PM
Highway Carmel Valley Road
From/To Rancho San Carlos/Schulte
Jurisdiction Unincorporated Monterey County
Analysis Year 2014
Description Carmel Canine
__________________________________Input Data__________________________________
Highway class Class 2 Peak hour factor, PHF 0.93
Shoulder width 6.0 ft % Trucks and buses 8 %
Lane width 12.0 ft % Trucks crawling 0.0 %
Segment length 2.4 mi Truck crawl speed 0.0 mi/hr
Terrain type Level % Recreational vehicles 1 %
Grade: Length - mi % No-passing zones 100 %
Up/down - % Access point density 14 /mi
Analysis direction volume, Vd 932 veh/h
Opposing direction volume, Vo 1197 veh/h
____________________________Average Travel Speed______________________________
Direction Analysis(d) Opposing (o)
PCE for trucks, ET 1.2* 1.2*
PCE for RVs, ER 1.0 1.0
Heavy-vehicle adj. factor,(note-5) fHV 0.984 0.984
Grade adj. factor,(note-1) fg 1.00 1.00
Directional flow rate,(note-2) vi 1018 pc/h 1308 pc/h
Free-Flow Speed from Field Measurement:
Field measured speed,(note-3) S FM - mi/h
Observed total demand,(note-3) V - veh/h
Estimated Free-Flow Speed:
Base free-flow speed,(note-3) BFFS 45.0 mi/h
Adj. for lane and shoulder width,(note-3) fLS 0.0 mi/h
Adj. for access point density,(note-3) fA 3.5 mi/h
Free-flow speed, FFSd 41.5 mi/h
Adjustment for no-passing zones, fnp 0.8 mi/h
Average travel speed, ATSd 22.6 mi/h
Percent Free Flow Speed, PFFS 54.5 %
_________________________Percent Time-Spent-Following_________________________
Direction Analysis(d) Opposing (o)
PCE for trucks, ET 1.0* 1.0*
PCE for RVs, ER 1.0 1.0
Heavy-vehicle adjustment factor, fHV 1.000 1.000
Grade adjustment factor,(note-1) fg 1.00 1.00
Directional flow rate,(note-2) vi 1002 pc/h 1287 pc/h
Base percent time-spent-following,(note-4) BPTSFd 80.8 %
Adjustment for no-passing zones, fnp 14.2
Percent time-spent-following, PTSFd 87.0 %
________________Level of Service and Other Performance Measures_______________
Level of service, LOS E
Volume to capacity ratio, v/c 0.59
Peak 15-min vehicle-miles of travel, VMT15 601 veh-mi
Peak-hour vehicle-miles of travel, VMT60 2237 veh-mi
Peak 15-min total travel time, TT15 26.6 veh-h
Capacity from ATS, CdATS 1700 veh/h
Capacity from PTSF, CdPTSF 1700 veh/h
Directional Capacity 1700 veh/h
_____________________________Passing Lane Analysis____________________________
Total length of analysis segment, Lt 2.4 mi
Length of two-lane highway upstream of the passing lane, Lu - mi
Length of passing lane including tapers, Lpl - mi
Average travel speed, ATSd (from above) 22.6 mi/h
Percent time-spent-following, PTSFd (from above) 87.0
Level of service, LOSd (from above) E
___________________Average Travel Speed with Passing Lane____________________
Downstream length of two-lane highway within effective
length of passing lane for average travel speed, Lde - mi
Length of two-lane highway downstream of effective
length of the passing lane for average travel speed, Ld - mi
Adj. factor for the effect of passing lane
on average speed, fpl -
Average travel speed including passing lane, ATSpl -
Percent free flow speed including passing lane, PFFSpl 0.0 %
________________Percent Time-Spent-Following with Passing Lane________________
Downstream length of two-lane highway within effective length
of passing lane for percent time-spent-following, Lde - mi
Length of two-lane highway downstream of effective length of
the passing lane for percent time-spent-following, Ld - mi
Adj. factor for the effect of passing lane
on percent time-spent-following, fpl -
Percent time-spent-following
including passing lane, PTSFpl - %
______Level of Service and Other Performance Measures with Passing Lane ______
Level of service including passing lane, LOSpl A
Peak 15-min total travel time, TT15 - veh-h
__________________________ Bicycle Level of Service __________________________
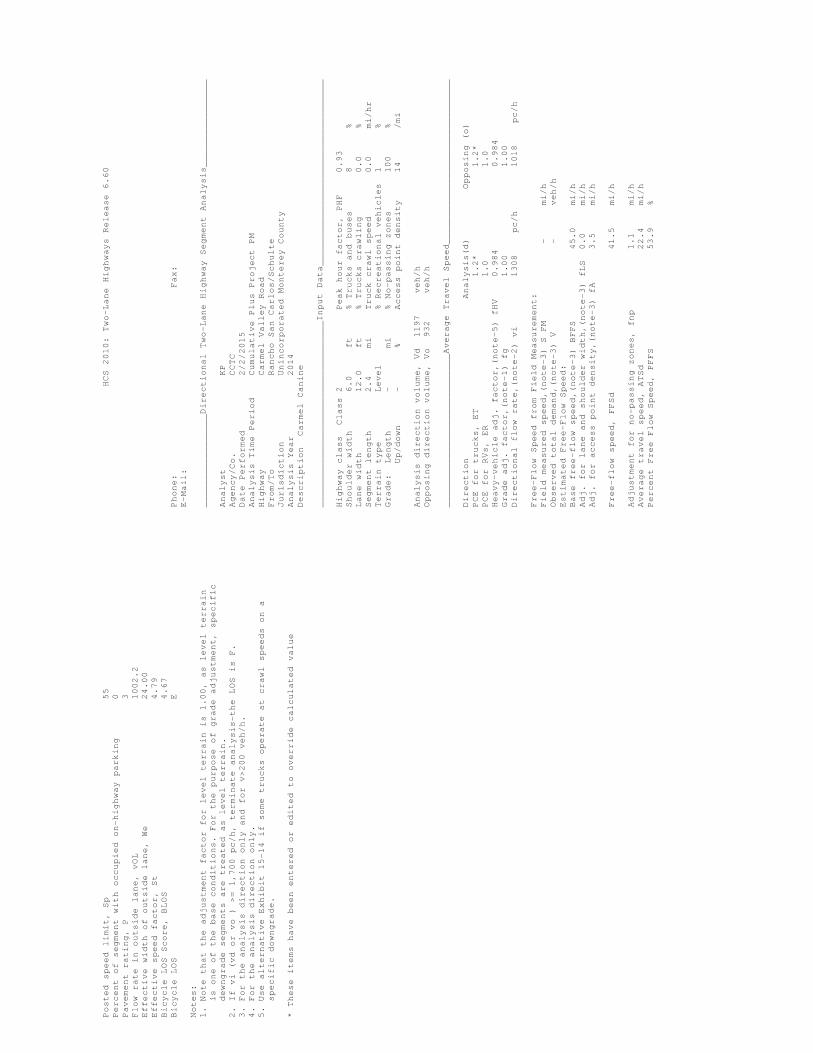
Posted speed limit, Sp 55
Percent of segment with occupied on-highway parking 0
Pavement rating, P 3
Flow rate in outside lane, vOL 1002.2
Effective width of outside lane, We 24.00
Effective speed factor, St 4.79
Bicycle LOS Score, BLOS 4.67
Bicycle LOS E
Notes:
1. Note that the adjustment factor for level terrain is 1.00, as level terrain
is one of the base conditions. For the purpose of grade adjustment, specific
dewngrade segments are treated as level terrain.
2. If vi (vd or vo ) >= 1,700 pc/h, terminate analysis-the LOS is F.
3. For the analysis direction only and for v>200 veh/h.
4. For the analysis direction only.
5. Use alternative Exhibit 15-14 if some trucks operate at crawl speeds on a
specific downgrade.
* These items have been entered or edited to override calculated value
HCS 2010: Two-Lane Highways Release 6.60
Phone: Fax:
E-Mail:
_________________Directional Two-Lane Highway Segment Analysis________________
Analyst KP
Agency/Co. CCTC
Date Performed 2/2/2015
Analysis Time Period Cumulative Plus Project PM
Highway Carmel Valley Road
From/To Rancho San Carlos/Schulte
Jurisdiction Unincorporated Monterey County
Analysis Year 2014
Description Carmel Canine
__________________________________Input Data__________________________________
Highway class Class 2 Peak hour factor, PHF 0.93
Shoulder width 6.0 ft % Trucks and buses 8 %
Lane width 12.0 ft % Trucks crawling 0.0 %
Segment length 2.4 mi Truck crawl speed 0.0 mi/hr
Terrain type Level % Recreational vehicles 1 %
Grade: Length - mi % No-passing zones 100 %
Up/down - % Access point density 14 /mi
Analysis direction volume, Vd 1197 veh/h
Opposing direction volume, Vo 932 veh/h
____________________________Average Travel Speed______________________________
Direction Analysis(d) Opposing (o)
PCE for trucks, ET 1.2* 1.2*
PCE for RVs, ER 1.0 1.0
Heavy-vehicle adj. factor,(note-5) fHV 0.984 0.984
Grade adj. factor,(note-1) fg 1.00 1.00
Directional flow rate,(note-2) vi 1308 pc/h 1018 pc/h
Free-Flow Speed from Field Measurement:
Field measured speed,(note-3) S FM - mi/h
Observed total demand,(note-3) V - veh/h
Estimated Free-Flow Speed:
Base free-flow speed,(note-3) BFFS 45.0 mi/h
Adj. for lane and shoulder width,(note-3) fLS 0.0 mi/h
Adj. for access point density,(note-3) fA 3.5 mi/h
Free-flow speed, FFSd 41.5 mi/h
Adjustment for no-passing zones, fnp 1.1 mi/h
Average travel speed, ATSd 22.4 mi/h
Percent Free Flow Speed, PFFS 53.9 %

_________________________Percent Time-Spent-Following_________________________
Direction Analysis(d) Opposing (o)
PCE for trucks, ET 1.0* 1.0*
PCE for RVs, ER 1.0 1.0
Heavy-vehicle adjustment factor, fHV 1.000 1.000
Grade adjustment factor,(note-1) fg 1.00 1.00
Directional flow rate,(note-2) vi 1287 pc/h 1002 pc/h
Base percent time-spent-following,(note-4) BPTSFd 84.3 %
Adjustment for no-passing zones, fnp 14.2
Percent time-spent-following, PTSFd 92.3 %
________________Level of Service and Other Performance Measures_______________
Level of service, LOS E
Volume to capacity ratio, v/c 0.76
Peak 15-min vehicle-miles of travel, VMT15 772 veh-mi
Peak-hour vehicle-miles of travel, VMT60 2873 veh-mi
Peak 15-min total travel time, TT15 34.5 veh-h
Capacity from ATS, CdATS 0 veh/h
Capacity from PTSF, CdPTSF 1700 veh/h
Directional Capacity 1700 veh/h
_____________________________Passing Lane Analysis____________________________
Total length of analysis segment, Lt 2.4 mi
Length of two-lane highway upstream of the passing lane, Lu - mi
Length of passing lane including tapers, Lpl - mi
Average travel speed, ATSd (from above) 22.4 mi/h
Percent time-spent-following, PTSFd (from above) 92.3
Level of service, LOSd (from above) E
___________________Average Travel Speed with Passing Lane____________________
Downstream length of two-lane highway within effective
length of passing lane for average travel speed, Lde - mi
Length of two-lane highway downstream of effective
length of the passing lane for average travel speed, Ld - mi
Adj. factor for the effect of passing lane
on average speed, fpl -
Average travel speed including passing lane, ATSpl -
Percent free flow speed including passing lane, PFFSpl 0.0 %
________________Percent Time-Spent-Following with Passing Lane________________
Downstream length of two-lane highway within effective length
of passing lane for percent time-spent-following, Lde - mi
Length of two-lane highway downstream of effective length of
the passing lane for percent time-spent-following, Ld - mi
Adj. factor for the effect of passing lane
on percent time-spent-following, fpl -
Percent time-spent-following
including passing lane, PTSFpl - %
______Level of Service and Other Performance Measures with Passing Lane ______
Level of service including passing lane, LOSpl A
Peak 15-min total travel time, TT15 - veh-h
__________________________ Bicycle Level of Service __________________________
Posted speed limit, Sp 55
Percent of segment with occupied on-highway parking 0
Pavement rating, P 3
Flow rate in outside lane, vOL 1287.1
Effective width of outside lane, We 24.00
Effective speed factor, St 4.79
Bicycle LOS Score, BLOS 4.80
Bicycle LOS E
Notes:
1. Note that the adjustment factor for level terrain is 1.00, as level terrain
is one of the base conditions. For the purpose of grade adjustment, specific
dewngrade segments are treated as level terrain.
2. If vi (vd or vo ) >= 1,700 pc/h, terminate analysis-the LOS is F.
3. For the analysis direction only and for v>200 veh/h.
4. For the analysis direction only.
5. Use alternative Exhibit 15-14 if some trucks operate at crawl speeds on a
specific downgrade.
* These items have been entered or edited to override calculated value

HCS 2010: Two-Lane Highways Release 6.60
Phone: Fax:
E-Mail:
_________________Directional Two-Lane Highway Segment Analysis________________
Analyst KP
Agency/Co. CCTC
Date Performed 2/2/2015
Analysis Time Period Cumulative Plus Project Friday
Highway Carmel Valley Road
From/To Rancho San Carlos/Schulte
Jurisdiction Unincorporated Monterey County
Analysis Year 2014
Description Carmel Canine
__________________________________Input Data__________________________________
Highway class Class 2 Peak hour factor, PHF 0.93
Shoulder width 6.0 ft % Trucks and buses 8 %
Lane width 12.0 ft % Trucks crawling 0.0 %
Segment length 2.4 mi Truck crawl speed 0.0 mi/hr
Terrain type Level % Recreational vehicles 1 %
Grade: Length - mi % No-passing zones 100 %
Up/down - % Access point density 14 /mi
Analysis direction volume, Vd 939 veh/h
Opposing direction volume, Vo 1244 veh/h
____________________________Average Travel Speed______________________________
Direction Analysis(d) Opposing (o)
PCE for trucks, ET 1.2* 1.2*
PCE for RVs, ER 1.0 1.0
Heavy-vehicle adj. factor,(note-5) fHV 0.984 0.984
Grade adj. factor,(note-1) fg 1.00 1.00
Directional flow rate,(note-2) vi 1026 pc/h 1359 pc/h
Free-Flow Speed from Field Measurement:
Field measured speed,(note-3) S FM - mi/h
Observed total demand,(note-3) V - veh/h
Estimated Free-Flow Speed:
Base free-flow speed,(note-3) BFFS 45.0 mi/h
Adj. for lane and shoulder width,(note-3) fLS 0.0 mi/h
Adj. for access point density,(note-3) fA 3.5 mi/h
Free-flow speed, FFSd 41.5 mi/h
Adjustment for no-passing zones, fnp 0.8 mi/h
Average travel speed, ATSd 22.2 mi/h
Percent Free Flow Speed, PFFS 53.6 %
_________________________Percent Time-Spent-Following_________________________
Direction Analysis(d) Opposing (o)
PCE for trucks, ET 1.0* 1.0*
PCE for RVs, ER 1.0 1.0
Heavy-vehicle adjustment factor, fHV 1.000 1.000
Grade adjustment factor,(note-1) fg 1.00 1.00
Directional flow rate,(note-2) vi 1010 pc/h 1338 pc/h
Base percent time-spent-following,(note-4) BPTSFd 81.4 %
Adjustment for no-passing zones, fnp 13.4
Percent time-spent-following, PTSFd 87.2 %
________________Level of Service and Other Performance Measures_______________
Level of service, LOS E
Volume to capacity ratio, v/c 0.59
Peak 15-min vehicle-miles of travel, VMT15 606 veh-mi
Peak-hour vehicle-miles of travel, VMT60 2254 veh-mi
Peak 15-min total travel time, TT15 27.3 veh-h
Capacity from ATS, CdATS 1700 veh/h
Capacity from PTSF, CdPTSF 1700 veh/h
Directional Capacity 1700 veh/h
_____________________________Passing Lane Analysis____________________________
Total length of analysis segment, Lt 2.4 mi
Length of two-lane highway upstream of the passing lane, Lu - mi
Length of passing lane including tapers, Lpl - mi
Average travel speed, ATSd (from above) 22.2 mi/h
Percent time-spent-following, PTSFd (from above) 87.2
Level of service, LOSd (from above) E
___________________Average Travel Speed with Passing Lane____________________
Downstream length of two-lane highway within effective
length of passing lane for average travel speed, Lde - mi
Length of two-lane highway downstream of effective
length of the passing lane for average travel speed, Ld - mi
Adj. factor for the effect of passing lane
on average speed, fpl -
Average travel speed including passing lane, ATSpl -
Percent free flow speed including passing lane, PFFSpl 0.0 %
________________Percent Time-Spent-Following with Passing Lane________________
Downstream length of two-lane highway within effective length
of passing lane for percent time-spent-following, Lde - mi
Length of two-lane highway downstream of effective length of
the passing lane for percent time-spent-following, Ld - mi
Adj. factor for the effect of passing lane
on percent time-spent-following, fpl -
Percent time-spent-following
including passing lane, PTSFpl - %
______Level of Service and Other Performance Measures with Passing Lane ______
Level of service including passing lane, LOSpl A
Peak 15-min total travel time, TT15 - veh-h
__________________________ Bicycle Level of Service __________________________

Posted speed limit, Sp 55
Percent of segment with occupied on-highway parking 0
Pavement rating, P 3
Flow rate in outside lane, vOL 1009.7
Effective width of outside lane, We 24.00
Effective speed factor, St 4.79
Bicycle LOS Score, BLOS 4.68
Bicycle LOS E
Notes:
1. Note that the adjustment factor for level terrain is 1.00, as level terrain
is one of the base conditions. For the purpose of grade adjustment, specific
dewngrade segments are treated as level terrain.
2. If vi (vd or vo ) >= 1,700 pc/h, terminate analysis-the LOS is F.
3. For the analysis direction only and for v>200 veh/h.
4. For the analysis direction only.
5. Use alternative Exhibit 15-14 if some trucks operate at crawl speeds on a
specific downgrade.
* These items have been entered or edited to override calculated value
HCS 2010: Two-Lane Highways Release 6.60
Phone: Fax:
E-Mail:
_________________Directional Two-Lane Highway Segment Analysis________________
Analyst KP
Agency/Co. CCTC
Date Performed 2/2/2015
Analysis Time Period Cumulative Plus Project Friday
Highway Carmel Valley Road
From/To Rancho San Carlos/Schulte
Jurisdiction Unincorporated Monterey County
Analysis Year 2014
Description Carmel Canine
__________________________________Input Data__________________________________
Highway class Class 2 Peak hour factor, PHF 0.93
Shoulder width 6.0 ft % Trucks and buses 8 %
Lane width 12.0 ft % Trucks crawling 0.0 %
Segment length 2.4 mi Truck crawl speed 0.0 mi/hr
Terrain type Level % Recreational vehicles 1 %
Grade: Length - mi % No-passing zones 100 %
Up/down - % Access point density 14 /mi
Analysis direction volume, Vd 1244 veh/h
Opposing direction volume, Vo 939 veh/h
____________________________Average Travel Speed______________________________
Direction Analysis(d) Opposing (o)
PCE for trucks, ET 1.2* 1.2*
PCE for RVs, ER 1.0 1.0
Heavy-vehicle adj. factor,(note-5) fHV 0.984 0.984
Grade adj. factor,(note-1) fg 1.00 1.00
Directional flow rate,(note-2) vi 1359 pc/h 1026 pc/h
Free-Flow Speed from Field Measurement:
Field measured speed,(note-3) S FM - mi/h
Observed total demand,(note-3) V - veh/h
Estimated Free-Flow Speed:
Base free-flow speed,(note-3) BFFS 45.0 mi/h
Adj. for lane and shoulder width,(note-3) fLS 0.0 mi/h
Adj. for access point density,(note-3) fA 3.5 mi/h
Free-flow speed, FFSd 41.5 mi/h
Adjustment for no-passing zones, fnp 1.1 mi/h
Average travel speed, ATSd 21.9 mi/h
Percent Free Flow Speed, PFFS 52.8 %

_________________________Percent Time-Spent-Following_________________________
Direction Analysis(d) Opposing (o)
PCE for trucks, ET 1.0* 1.0*
PCE for RVs, ER 1.0 1.0
Heavy-vehicle adjustment factor, fHV 1.000 1.000
Grade adjustment factor,(note-1) fg 1.00 1.00
Directional flow rate,(note-2) vi 1338 pc/h 1010 pc/h
Base percent time-spent-following,(note-4) BPTSFd 85.3 %
Adjustment for no-passing zones, fnp 13.4
Percent time-spent-following, PTSFd 92.9 %
________________Level of Service and Other Performance Measures_______________
Level of service, LOS E
Volume to capacity ratio, v/c 0.79
Peak 15-min vehicle-miles of travel, VMT15 803 veh-mi
Peak-hour vehicle-miles of travel, VMT60 2986 veh-mi
Peak 15-min total travel time, TT15 36.7 veh-h
Capacity from ATS, CdATS 0 veh/h
Capacity from PTSF, CdPTSF 1700 veh/h
Directional Capacity 1700 veh/h
_____________________________Passing Lane Analysis____________________________
Total length of analysis segment, Lt 2.4 mi
Length of two-lane highway upstream of the passing lane, Lu - mi
Length of passing lane including tapers, Lpl - mi
Average travel speed, ATSd (from above) 21.9 mi/h
Percent time-spent-following, PTSFd (from above) 92.9
Level of service, LOSd (from above) E
___________________Average Travel Speed with Passing Lane____________________
Downstream length of two-lane highway within effective
length of passing lane for average travel speed, Lde - mi
Length of two-lane highway downstream of effective
length of the passing lane for average travel speed, Ld - mi
Adj. factor for the effect of passing lane
on average speed, fpl -
Average travel speed including passing lane, ATSpl -
Percent free flow speed including passing lane, PFFSpl 0.0 %
________________Percent Time-Spent-Following with Passing Lane________________
Downstream length of two-lane highway within effective length
of passing lane for percent time-spent-following, Lde - mi
Length of two-lane highway downstream of effective length of
the passing lane for percent time-spent-following, Ld - mi
Adj. factor for the effect of passing lane
on percent time-spent-following, fpl -
Percent time-spent-following
including passing lane, PTSFpl - %
______Level of Service and Other Performance Measures with Passing Lane ______
Level of service including passing lane, LOSpl A
Peak 15-min total travel time, TT15 - veh-h
__________________________ Bicycle Level of Service __________________________
Posted speed limit, Sp 55
Percent of segment with occupied on-highway parking 0
Pavement rating, P 3
Flow rate in outside lane, vOL 1337.6
Effective width of outside lane, We 24.00
Effective speed factor, St 4.79
Bicycle LOS Score, BLOS 4.82
Bicycle LOS E
Notes:
1. Note that the adjustment factor for level terrain is 1.00, as level terrain
is one of the base conditions. For the purpose of grade adjustment, specific
dewngrade segments are treated as level terrain.
2. If vi (vd or vo ) >= 1,700 pc/h, terminate analysis-the LOS is F.
3. For the analysis direction only and for v>200 veh/h.
4. For the analysis direction only.
5. Use alternative Exhibit 15-14 if some trucks operate at crawl speeds on a
specific downgrade.
* These items have been entered or edited to override calculated value

HCS 2010: Two-Lane Highways Release 6.60
Phone: Fax:
E-Mail:
_________________Directional Two-Lane Highway Segment Analysis________________
Analyst KP
Agency/Co. CCTC
Date Performed 2/2/2015
Analysis Time Period Cumulative Plus Project Sunday
Highway Carmel Valley Road
From/To Rancho San Carlos/Schulte
Jurisdiction Unincorporated Monterey County
Analysis Year 2014
Description Carmel Canine
__________________________________Input Data__________________________________
Highway class Class 2 Peak hour factor, PHF 0.93
Shoulder width 6.0 ft % Trucks and buses 8 %
Lane width 12.0 ft % Trucks crawling 0.0 %
Segment length 2.4 mi Truck crawl speed 0.0 mi/hr
Terrain type Level % Recreational vehicles 1 %
Grade: Length - mi % No-passing zones 100 %
Up/down - % Access point density 14 /mi
Analysis direction volume, Vd 972 veh/h
Opposing direction volume, Vo 847 veh/h
____________________________Average Travel Speed______________________________
Direction Analysis(d) Opposing (o)
PCE for trucks, ET 1.2* 1.2*
PCE for RVs, ER 1.0 1.0
Heavy-vehicle adj. factor,(note-5) fHV 0.984 0.984
Grade adj. factor,(note-1) fg 1.00 1.00
Directional flow rate,(note-2) vi 1062 pc/h 926 pc/h
Free-Flow Speed from Field Measurement:
Field measured speed,(note-3) S FM - mi/h
Observed total demand,(note-3) V - veh/h
Estimated Free-Flow Speed:
Base free-flow speed,(note-3) BFFS 45.0 mi/h
Adj. for lane and shoulder width,(note-3) fLS 0.0 mi/h
Adj. for access point density,(note-3) fA 3.5 mi/h
Free-flow speed, FFSd 41.5 mi/h
Adjustment for no-passing zones, fnp 1.1 mi/h
Average travel speed, ATSd 24.9 mi/h
Percent Free Flow Speed, PFFS 60.1 %
_________________________Percent Time-Spent-Following_________________________
Direction Analysis(d) Opposing (o)
PCE for trucks, ET 1.0* 1.0*
PCE for RVs, ER 1.0 1.0
Heavy-vehicle adjustment factor, fHV 1.000 1.000
Grade adjustment factor,(note-1) fg 1.00 1.00
Directional flow rate,(note-2) vi 1045 pc/h 911 pc/h
Base percent time-spent-following,(note-4) BPTSFd 78.1 %
Adjustment for no-passing zones, fnp 19.0
Percent time-spent-following, PTSFd 88.3 %
________________Level of Service and Other Performance Measures_______________
Level of service, LOS E
Volume to capacity ratio, v/c 0.61
Peak 15-min vehicle-miles of travel, VMT15 627 veh-mi
Peak-hour vehicle-miles of travel, VMT60 2333 veh-mi
Peak 15-min total travel time, TT15 25.1 veh-h
Capacity from ATS, CdATS 0 veh/h
Capacity from PTSF, CdPTSF 1700 veh/h
Directional Capacity 1700 veh/h
_____________________________Passing Lane Analysis____________________________
Total length of analysis segment, Lt 2.4 mi
Length of two-lane highway upstream of the passing lane, Lu - mi
Length of passing lane including tapers, Lpl - mi
Average travel speed, ATSd (from above) 24.9 mi/h
Percent time-spent-following, PTSFd (from above) 88.3
Level of service, LOSd (from above) E
___________________Average Travel Speed with Passing Lane____________________
Downstream length of two-lane highway within effective
length of passing lane for average travel speed, Lde - mi
Length of two-lane highway downstream of effective
length of the passing lane for average travel speed, Ld - mi
Adj. factor for the effect of passing lane
on average speed, fpl -
Average travel speed including passing lane, ATSpl -
Percent free flow speed including passing lane, PFFSpl 0.0 %
________________Percent Time-Spent-Following with Passing Lane________________
Downstream length of two-lane highway within effective length
of passing lane for percent time-spent-following, Lde - mi
Length of two-lane highway downstream of effective length of
the passing lane for percent time-spent-following, Ld - mi
Adj. factor for the effect of passing lane
on percent time-spent-following, fpl -
Percent time-spent-following
including passing lane, PTSFpl - %
______Level of Service and Other Performance Measures with Passing Lane ______
Level of service including passing lane, LOSpl A
Peak 15-min total travel time, TT15 - veh-h
__________________________ Bicycle Level of Service __________________________
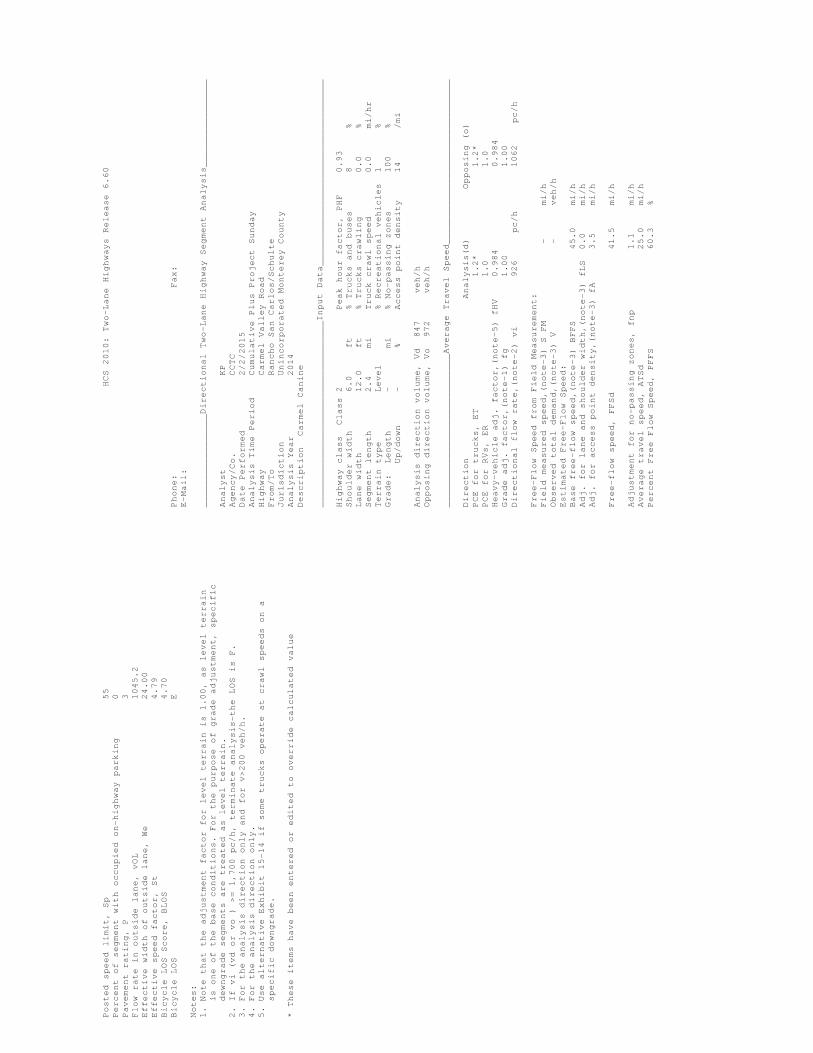
Posted speed limit, Sp 55
Percent of segment with occupied on-highway parking 0
Pavement rating, P 3
Flow rate in outside lane, vOL 1045.2
Effective width of outside lane, We 24.00
Effective speed factor, St 4.79
Bicycle LOS Score, BLOS 4.70
Bicycle LOS E
Notes:
1. Note that the adjustment factor for level terrain is 1.00, as level terrain
is one of the base conditions. For the purpose of grade adjustment, specific
dewngrade segments are treated as level terrain.
2. If vi (vd or vo ) >= 1,700 pc/h, terminate analysis-the LOS is F.
3. For the analysis direction only and for v>200 veh/h.
4. For the analysis direction only.
5. Use alternative Exhibit 15-14 if some trucks operate at crawl speeds on a
specific downgrade.
* These items have been entered or edited to override calculated value
HCS 2010: Two-Lane Highways Release 6.60
Phone: Fax:
E-Mail:
_________________Directional Two-Lane Highway Segment Analysis________________
Analyst KP
Agency/Co. CCTC
Date Performed 2/2/2015
Analysis Time Period Cumulative Plus Project Sunday
Highway Carmel Valley Road
From/To Rancho San Carlos/Schulte
Jurisdiction Unincorporated Monterey County
Analysis Year 2014
Description Carmel Canine
__________________________________Input Data__________________________________
Highway class Class 2 Peak hour factor, PHF 0.93
Shoulder width 6.0 ft % Trucks and buses 8 %
Lane width 12.0 ft % Trucks crawling 0.0 %
Segment length 2.4 mi Truck crawl speed 0.0 mi/hr
Terrain type Level % Recreational vehicles 1 %
Grade: Length - mi % No-passing zones 100 %
Up/down - % Access point density 14 /mi
Analysis direction volume, Vd 847 veh/h
Opposing direction volume, Vo 972 veh/h
____________________________Average Travel Speed______________________________
Direction Analysis(d) Opposing (o)
PCE for trucks, ET 1.2* 1.2*
PCE for RVs, ER 1.0 1.0
Heavy-vehicle adj. factor,(note-5) fHV 0.984 0.984
Grade adj. factor,(note-1) fg 1.00 1.00
Directional flow rate,(note-2) vi 926 pc/h 1062 pc/h
Free-Flow Speed from Field Measurement:
Field measured speed,(note-3) S FM - mi/h
Observed total demand,(note-3) V - veh/h
Estimated Free-Flow Speed:
Base free-flow speed,(note-3) BFFS 45.0 mi/h
Adj. for lane and shoulder width,(note-3) fLS 0.0 mi/h
Adj. for access point density,(note-3) fA 3.5 mi/h
Free-flow speed, FFSd 41.5 mi/h
Adjustment for no-passing zones, fnp 1.1 mi/h
Average travel speed, ATSd 25.0 mi/h
Percent Free Flow Speed, PFFS 60.3 %

_________________________Percent Time-Spent-Following_________________________
Direction Analysis(d) Opposing (o)
PCE for trucks, ET 1.0* 1.0*
PCE for RVs, ER 1.0 1.0
Heavy-vehicle adjustment factor, fHV 1.000 1.000
Grade adjustment factor,(note-1) fg 1.00 1.00
Directional flow rate,(note-2) vi 911 pc/h 1045 pc/h
Base percent time-spent-following,(note-4) BPTSFd 75.6 %
Adjustment for no-passing zones, fnp 19.0
Percent time-spent-following, PTSFd 84.4 %
________________Level of Service and Other Performance Measures_______________
Level of service, LOS D
Volume to capacity ratio, v/c 0.54
Peak 15-min vehicle-miles of travel, VMT15 546 veh-mi
Peak-hour vehicle-miles of travel, VMT60 2033 veh-mi
Peak 15-min total travel time, TT15 21.8 veh-h
Capacity from ATS, CdATS 1700 veh/h
Capacity from PTSF, CdPTSF 1700 veh/h
Directional Capacity 1700 veh/h
_____________________________Passing Lane Analysis____________________________
Total length of analysis segment, Lt 2.4 mi
Length of two-lane highway upstream of the passing lane, Lu - mi
Length of passing lane including tapers, Lpl - mi
Average travel speed, ATSd (from above) 25.0 mi/h
Percent time-spent-following, PTSFd (from above) 84.4
Level of service, LOSd (from above) D
___________________Average Travel Speed with Passing Lane____________________
Downstream length of two-lane highway within effective
length of passing lane for average travel speed, Lde - mi
Length of two-lane highway downstream of effective
length of the passing lane for average travel speed, Ld - mi
Adj. factor for the effect of passing lane
on average speed, fpl -
Average travel speed including passing lane, ATSpl -
Percent free flow speed including passing lane, PFFSpl 0.0 %
________________Percent Time-Spent-Following with Passing Lane________________
Downstream length of two-lane highway within effective length
of passing lane for percent time-spent-following, Lde - mi
Length of two-lane highway downstream of effective length of
the passing lane for percent time-spent-following, Ld - mi
Adj. factor for the effect of passing lane
on percent time-spent-following, fpl -
Percent time-spent-following
including passing lane, PTSFpl - %
______Level of Service and Other Performance Measures with Passing Lane ______
Level of service including passing lane, LOSpl A
Peak 15-min total travel time, TT15 - veh-h
__________________________ Bicycle Level of Service __________________________
Posted speed limit, Sp 55
Percent of segment with occupied on-highway parking 0
Pavement rating, P 3
Flow rate in outside lane, vOL 910.8
Effective width of outside lane, We 24.00
Effective speed factor, St 4.79
Bicycle LOS Score, BLOS 4.63
Bicycle LOS E
Notes:
1. Note that the adjustment factor for level terrain is 1.00, as level terrain
is one of the base conditions. For the purpose of grade adjustment, specific
dewngrade segments are treated as level terrain.
2. If vi (vd or vo ) >= 1,700 pc/h, terminate analysis-the LOS is F.
3. For the analysis direction only and for v>200 veh/h.
4. For the analysis direction only.
5. Use alternative Exhibit 15-14 if some trucks operate at crawl speeds on a
specific downgrade.
* These items have been entered or edited to override calculated value