Embed Size (px)
Citation preview
APPENDIX H
NOISE
Home (/) > Programs (/programs/) > Environmental Review (/programs/environmental-review/)> DNL Calculator
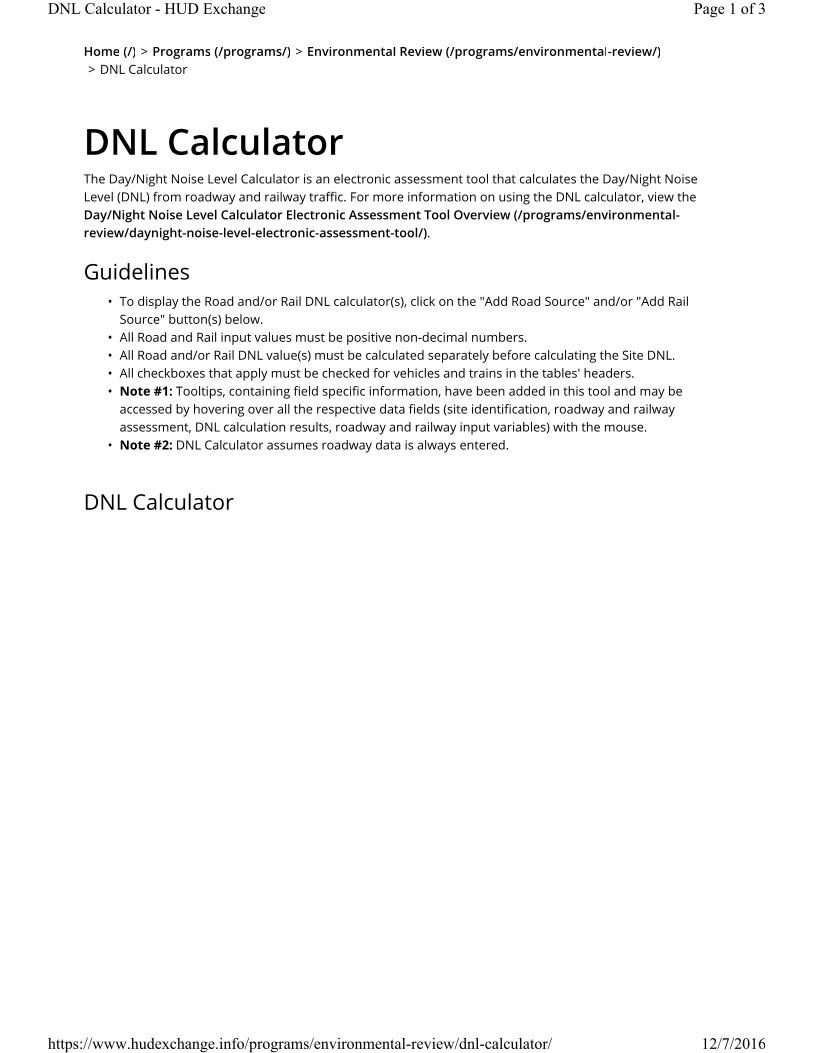
DNL CalculatorThe Day/Night Noise Level Calculator is an electronic assessment tool that calculates the Day/Night Noise Level (DNL) from roadway and railway traffic. For more information on using the DNL calculator, view the Day/Night Noise Level Calculator Electronic Assessment Tool Overview (/programs/environmental-review/daynight-noise-level-electronic-assessment-tool/).
Guidelines• To display the Road and/or Rail DNL calculator(s), click on the "Add Road Source" and/or "Add Rail
Source" button(s) below.• All Road and Rail input values must be positive non-decimal numbers.• All Road and/or Rail DNL value(s) must be calculated separately before calculating the Site DNL.• All checkboxes that apply must be checked for vehicles and trains in the tables' headers.• Note #1: Tooltips, containing field specific information, have been added in this tool and may be
accessed by hovering over all the respective data fields (site identification, roadway and railwayassessment, DNL calculation results, roadway and railway input variables) with the mouse.
• Note #2: DNL Calculator assumes roadway data is always entered.
DNL Calculator
Page 1 of 3DNL Calculator - HUD Exchange
12/7/2016https://www.hudexchange.info/programs/environmental-review/dnl-calculator/
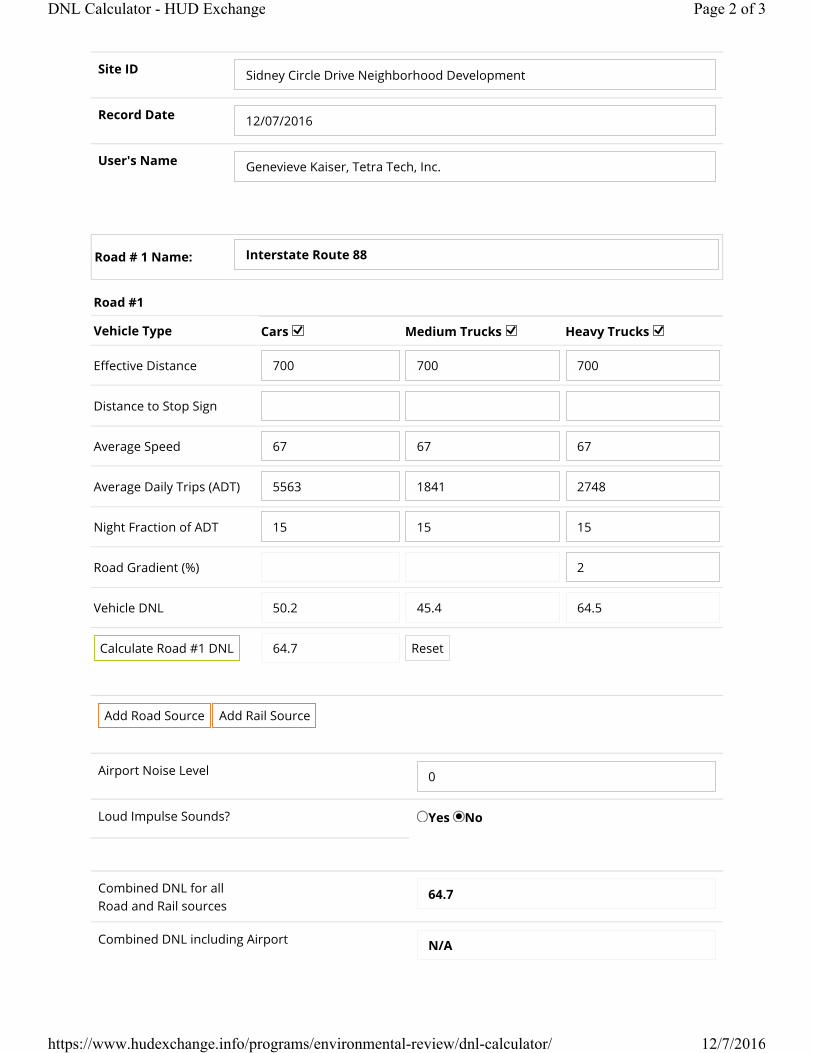
Site ID Sidney Circle Drive Neighborhood Development
Record Date 12/07/2016
User's Name Genevieve Kaiser, Tetra Tech, Inc.
Road # 1 Name: Interstate Route 88
Road #1
Vehicle Type Cars Medium Trucks Heavy Trucks
Effective Distance 700 700 700
Distance to Stop Sign
Average Speed 67 67 67
Average Daily Trips (ADT) 5563 1841 2748
Night Fraction of ADT 15 15 15
Road Gradient (%) 2
Vehicle DNL 50.2 45.4 64.5
Calculate Road #1 DNL 64.7 Reset
Add Road Source Add Rail Source
Airport Noise Level 0
Loud Impulse Sounds? Yes No
Combined DNL for allRoad and Rail sources
64.7
Combined DNL including Airport N/A
Page 2 of 3DNL Calculator - HUD Exchange
12/7/2016https://www.hudexchange.info/programs/environmental-review/dnl-calculator/
S te t oud pu se Sou d
Calculate
Mitigation OptionsIf your site DNL is in Excess of 65 decibels, your options are:
• No Action Alternative: Cancel the project at this location• Other Reasonable Alternatives: Choose an alternate site• Mitigation
◦ Contact your Field or Regional Environmental Officer (/programs/environmental-review/hud-environmental-staff-contacts/)
◦ Increase mitigation in the building walls (only effective if no outdoor, noise sensitive areas)◦ Reconfigure the site plan to increase the distance between the noise source and noise-sensitive
uses◦ Incorporate natural or man-made barriers. See The Noise Guidebook (/resource/313/hud-noise-
guidebook/)◦ Construct noise barrier. See the Barrier Performance Module (/programs/environmental-
review/bpm-calculator/)
Tools and GuidanceDay/Night Noise Level Assessment Tool User Guide (/resource/3822/day-night-noise-level-assessment-tool-user-guide/)
Day/Night Noise Level Assessment Tool Flowcharts (/resource/3823/day-night-noise-level-assessment-tool-flowcharts/)
Page 3 of 3DNL Calculator - HUD Exchange
12/7/2016https://www.hudexchange.info/programs/environmental-review/dnl-calculator/

STATION: 930043 New York State Department of TransportationTraffic Count Hourly Report
Page 1 of 2
ROUTE #: I 88 ROAD NAME: FROM: ACC RT 8 EXIT 9 SIDNEY TO: OTSEGO CO LN COUNTY: DelawareDIRECTION: Eastbound FACTOR GROUP: 40 REC. SERIAL #: 9556 FUNC. CLASS: 01 TOWN: SIDNEYSTATE DIR CODE: 1 WK OF YR: 45 PLACEMENT: 1.5 MI E OF EXIT 9 NHS: yes LION#:DATE OF COUNT: 11/03/2009 @ REF MARKER: 88I93031025 JURIS: NYSDOT BIN: 1095121NOTES LANE 1: WK 44 EB ADDL DATA: Class Speed CC Stn: RR CROSSING:NOTES LANE 2: WK 44 EB COUNT TYPE: VEHICLES BATCH ID: DOT-SJWr9ww44 HPMS SAMPLE: 10153020COUNT TAKEN BY: ORG CODE: TST INITIALS: --- PROCESSED BY: ORG CODE: DOT INITIALS: SJW
12TO1
1TO2
2TO3
3TO4
4TO5
5TO6
6TO7
7TO8
8TO9
9TO10
10TO11
11TO12
12TO1
1TO2
2TO3
3TO4
4TO5
5TO6
6TO7
7TO8
8TO9
9TO10
10TO11
11TO12 DAILY DAILY
DAILY HIGH HIGHAM PMDATE DAY TOTAL COUNT HOUR
1 S2 M3 T4 W5 T6 F7 S8 S9 M
10 T11 W12 T13 F14 S15 S16 M17 T18 W19 T20 F21 S22 S23 M24 T25 W26 T27 F28 S29 S30 M
369 356 312 216 126 132 103 83 6854 45 37 44 81 142 282 371 306 307 289 281 306 315 357 375 373 320 221 159 121 109 82 46 5023 375 1573 39 31 39 58 135 253 366 311 278 267 302 297 333 345 408 430 338 260 174 154 153 89 66 5199 430 1660 57 46 40 58 106 251 348 316 320 332 351 369 436 453 500 526 486 397 228 174 130 97 64 6145 526 1660 45 31 26 30 54 91 185 260 356 429 367 369 393 313 315 332 288 273 231 189 145 118 73 4973 429 1048 24 16 14 24 30 68 75 130 223 304 322 439 456 463 512 471 428 309 279 239 170 101 74 5219 512 1557 43 42 49 67 162 261 359 335 288 288 283 331 302
AVERAGE WEEKDAY HOURS (Axle Factored, Mon 6AM to Fri Noon) ADT62 47 38 41 66 128 262 361 317 298 294 304 311 317 351 384 386 323 232 153 136 122 85 60 5078
DAYSCounted
6
HOURSCounted
143
WEEKDAYSCounted
3
WEEKDAYHours
77
AVERAGE WEEKDAYHigh Hour
386% of day
8%
Axle Adj.Factor1.000
Seasonal/WeekdayAdjustment Factor
0.939
ESTIMATED
AADT
5408
ROUTE #: I 88 ROAD NAME: FROM: ACC RT 8 EXIT 9 SIDNEY TO: OTSEGO CO LN COUNTY: DelawareSTATION: 930043 STATE DIR CODE: 1 PLACEMENT: 1.5 MI E OF EXIT 9 DATE OF COUNT: 11/03/2009
STATION: 930043 New York State Department of TransportationTraffic Count Hourly Report
Page 2 of 2
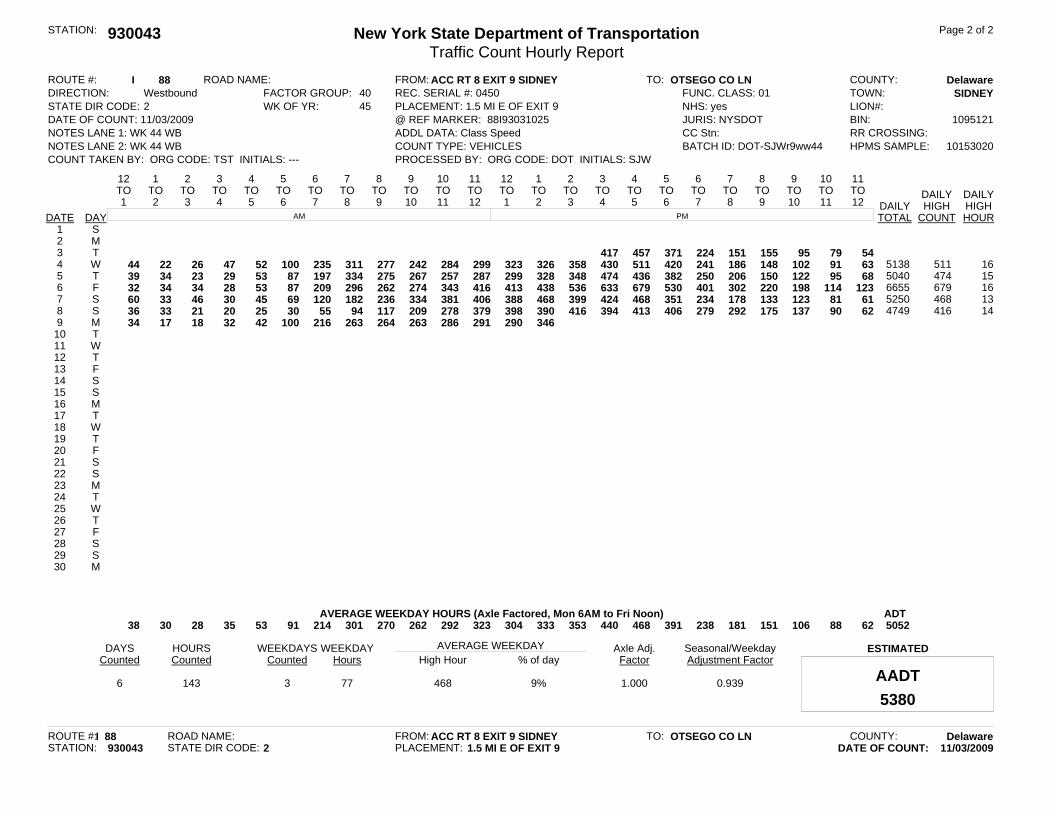
ROUTE #: I 88 ROAD NAME: FROM: ACC RT 8 EXIT 9 SIDNEY TO: OTSEGO CO LN COUNTY: DelawareDIRECTION: Westbound FACTOR GROUP: 40 REC. SERIAL #: 0450 FUNC. CLASS: 01 TOWN: SIDNEYSTATE DIR CODE: 2 WK OF YR: 45 PLACEMENT: 1.5 MI E OF EXIT 9 NHS: yes LION#:DATE OF COUNT: 11/03/2009 @ REF MARKER: 88I93031025 JURIS: NYSDOT BIN: 1095121NOTES LANE 1: WK 44 WB ADDL DATA: Class Speed CC Stn: RR CROSSING:NOTES LANE 2: WK 44 WB COUNT TYPE: VEHICLES BATCH ID: DOT-SJWr9ww44 HPMS SAMPLE: 10153020COUNT TAKEN BY: ORG CODE: TST INITIALS: --- PROCESSED BY: ORG CODE: DOT INITIALS: SJW
12TO1
1TO2
2TO3
3TO4
4TO5
5TO6
6TO7
7TO8
8TO9
9TO10
10TO11
11TO12
12TO1
1TO2
2TO3
3TO4
4TO5
5TO6
6TO7
7TO8
8TO9
9TO10
10TO11
11TO12 DAILY DAILY
DAILY HIGH HIGHAM PMDATE DAY TOTAL COUNT HOUR
1 S2 M3 T4 W5 T6 F7 S8 S9 M
10 T11 W12 T13 F14 S15 S16 M17 T18 W19 T20 F21 S22 S23 M24 T25 W26 T27 F28 S29 S30 M
417 457 371 224 151 155 95 79 5444 22 26 47 52 100 235 311 277 242 284 299 323 326 358 430 511 420 241 186 148 102 91 63 5138 511 1639 34 23 29 53 87 197 334 275 267 257 287 299 328 348 474 436 382 250 206 150 122 95 68 5040 474 1532 34 34 28 53 87 209 296 262 274 343 416 413 438 536 633 679 530 401 302 220 198 114 123 6655 679 1660 33 46 30 45 69 120 182 236 334 381 406 388 468 399 424 468 351 234 178 133 123 81 61 5250 468 1336 33 21 20 25 30 55 94 117 209 278 379 398 390 416 394 413 406 279 292 175 137 90 62 4749 416 1434 17 18 32 42 100 216 263 264 263 286 291 290 346
AVERAGE WEEKDAY HOURS (Axle Factored, Mon 6AM to Fri Noon) ADT38 30 28 35 53 91 214 301 270 262 292 323 304 333 353 440 468 391 238 181 151 106 88 62 5052
DAYSCounted
6
HOURSCounted
143
WEEKDAYSCounted
3
WEEKDAYHours
77
AVERAGE WEEKDAYHigh Hour
468% of day
9%
Axle Adj.Factor1.000
Seasonal/WeekdayAdjustment Factor
0.939
ESTIMATED
AADT
5380
ROUTE #: I 88 ROAD NAME: FROM: ACC RT 8 EXIT 9 SIDNEY TO: OTSEGO CO LN COUNTY: DelawareSTATION: 930043 STATE DIR CODE: 2 PLACEMENT: 1.5 MI E OF EXIT 9 DATE OF COUNT: 11/03/2009

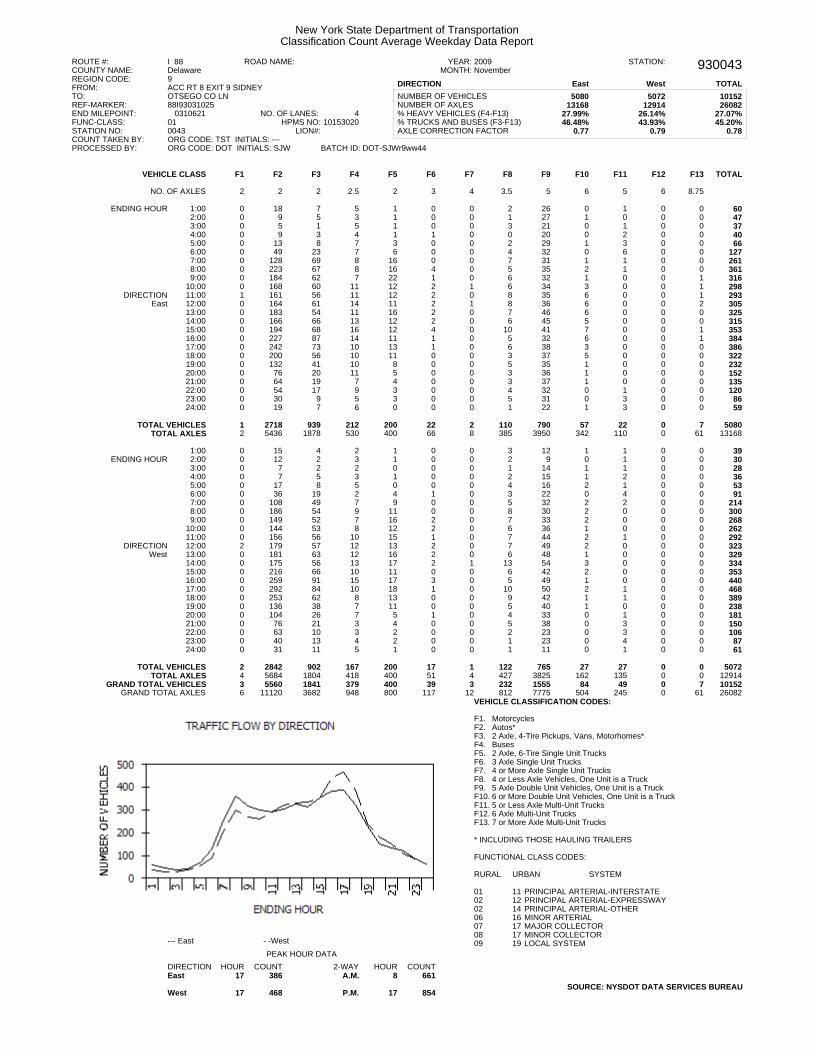
New York State Department of TransportationClassification Count Average Weekday Data Report
ROUTE #: I 88 ROAD NAME: YEAR: 2009 STATION: 930043COUNTY NAME: Delaware MONTH: NovemberREGION CODE: 9FROM: ACC RT 8 EXIT 9 SIDNEYTO: OTSEGO CO LNREF-MARKER: 88I93031025END MILEPOINT: 0310621 NO. OF LANES: 4FUNC-CLASS: 01 HPMS NO: 10153020STATION NO: 0043 LION#:COUNT TAKEN BY: ORG CODE: TST INITIALS: ---PROCESSED BY: ORG CODE: DOT INITIALS: SJW BATCH ID: DOT-SJWr9ww44
DIRECTION
NUMBER OF VEHICLESNUMBER OF AXLES% HEAVY VEHICLES (F4-F13)% TRUCKS AND BUSES (F3-F13)AXLE CORRECTION FACTOR
East
508013168
27.99%46.48%
0.77
West
507212914
26.14%43.93%
0.79
TOTAL
1015226082
27.07%45.20%
0.78
VEHICLE CLASS F1 F2 F3 F4 F5 F6 F7 F8 F9 F10 F11 F12 F13 TOTAL
NO. OF AXLES 2 2 2 2.5 2 3 4 3.5 5 6 5 6 8.75ENDING HOUR
DIRECTIONEast
ENDING HOUR
DIRECTIONWest
1:00 0 18 7 5 1 0 0 2 26 0 1 0 0 602:00 0 9 5 3 1 0 0 1 27 1 0 0 0 473:00 0 5 1 5 1 0 0 3 21 0 1 0 0 374:00 0 9 3 4 1 1 0 0 20 0 2 0 0 405:00 0 13 8 7 3 0 0 2 29 1 3 0 0 666:00 0 49 23 7 6 0 0 4 32 0 6 0 0 1277:00 0 128 69 8 16 0 0 7 31 1 1 0 0 2618:00 0 223 67 8 16 4 0 5 35 2 1 0 0 3619:00 0 184 62 7 22 1 0 6 32 1 0 0 1 316
10:00 0 168 60 11 12 2 1 6 34 3 0 0 1 29811:00 1 161 56 11 12 2 0 8 35 6 0 0 1 29312:00 0 164 61 14 11 2 1 8 36 6 0 0 2 30513:00 0 183 54 11 16 2 0 7 46 6 0 0 0 32514:00 0 166 66 13 12 2 0 6 45 5 0 0 0 31515:00 0 194 68 16 12 4 0 10 41 7 0 0 1 35316:00 0 227 87 14 11 1 0 5 32 6 0 0 1 38417:00 0 242 73 10 13 1 0 6 38 3 0 0 0 38618:00 0 200 56 10 11 0 0 3 37 5 0 0 0 32219:00 0 132 41 10 8 0 0 5 35 1 0 0 0 23220:00 0 76 20 11 5 0 0 3 36 1 0 0 0 15221:00 0 64 19 7 4 0 0 3 37 1 0 0 0 13522:00 0 54 17 9 3 0 0 4 32 0 1 0 0 12023:00 0 30 9 5 3 0 0 5 31 0 3 0 0 8624:00 0 19 7 6 0 0 0 1 22 1 3 0 0 59
TOTAL VEHICLESTOTAL AXLES
12
27185436
9391878
212530
200400
2266
28
110385
7903950
57342
22110
00
761
508013168
1:00 0 15 4 2 1 0 0 3 12 1 1 0 0 392:00 0 12 2 3 1 0 0 2 9 0 1 0 0 303:00 0 7 2 2 0 0 0 1 14 1 1 0 0 284:00 0 7 5 3 1 0 0 2 15 1 2 0 0 365:00 0 17 8 5 0 0 0 4 16 2 1 0 0 536:00 0 36 19 2 4 1 0 3 22 0 4 0 0 917:00 0 108 49 7 9 0 0 5 32 2 2 0 0 2148:00 0 186 54 9 11 0 0 8 30 2 0 0 0 3009:00 0 149 52 7 16 2 0 7 33 2 0 0 0 268
10:00 0 144 53 8 12 2 0 6 36 1 0 0 0 26211:00 0 156 56 10 15 1 0 7 44 2 1 0 0 29212:00 2 179 57 12 13 2 0 7 49 2 0 0 0 32313:00 0 181 63 12 16 2 0 6 48 1 0 0 0 32914:00 0 175 56 13 17 2 1 13 54 3 0 0 0 33415:00 0 216 66 10 11 0 0 6 42 2 0 0 0 35316:00 0 259 91 15 17 3 0 5 49 1 0 0 0 44017:00 0 292 84 10 18 1 0 10 50 2 1 0 0 46818:00 0 253 62 8 13 0 0 9 42 1 1 0 0 38919:00 0 136 38 7 11 0 0 5 40 1 0 0 0 23820:00 0 104 26 7 5 1 0 4 33 0 1 0 0 18121:00 0 76 21 3 4 0 0 5 38 0 3 0 0 15022:00 0 63 10 3 2 0 0 2 23 0 3 0 0 10623:00 0 40 13 4 2 0 0 1 23 0 4 0 0 8724:00 0 31 11 5 1 0 0 1 11 0 1 0 0 61
TOTAL VEHICLESTOTAL AXLES
24
28425684
9021804
167418
200400
1751
14
122427
7653825
27162
27135
00
00
507212914
GRAND TOTAL VEHICLESGRAND TOTAL AXLES
36
556011120
18413682
379948
400800
39117
312
232812
15557775
84504
49245
00
761
1015226082
--- East - -WestPEAK HOUR DATA
DIRECTION HOUR COUNT 2-WAY HOUR COUNTEast 17 386 A.M. 8 661
West 17 468 P.M. 17 854
VEHICLE CLASSIFICATION CODES:
F1. MotorcyclesF2. Autos*F3. 2 Axle, 4-Tire Pickups, Vans, Motorhomes*F4. BusesF5. 2 Axle, 6-Tire Single Unit TrucksF6. 3 Axle Single Unit TrucksF7. 4 or More Axle Single Unit TrucksF8. 4 or Less Axle Vehicles, One Unit is a TruckF9. 5 Axle Double Unit Vehicles, One Unit is a TruckF10. 6 or More Double Unit Vehicles, One Unit is a TruckF11. 5 or Less Axle Multi-Unit TrucksF12. 6 Axle Multi-Unit TrucksF13. 7 or More Axle Multi-Unit Trucks* INCLUDING THOSE HAULING TRAILERSFUNCTIONAL CLASS CODES:RURAL URBAN SYSTEM01020206070809
11121416171719
PRINCIPAL ARTERIAL-INTERSTATEPRINCIPAL ARTERIAL-EXPRESSWAYPRINCIPAL ARTERIAL-OTHERMINOR ARTERIALMAJOR COLLECTORMINOR COLLECTORLOCAL SYSTEM
SOURCE: NYSDOT DATA SERVICES BUREAU
--- East
- - West
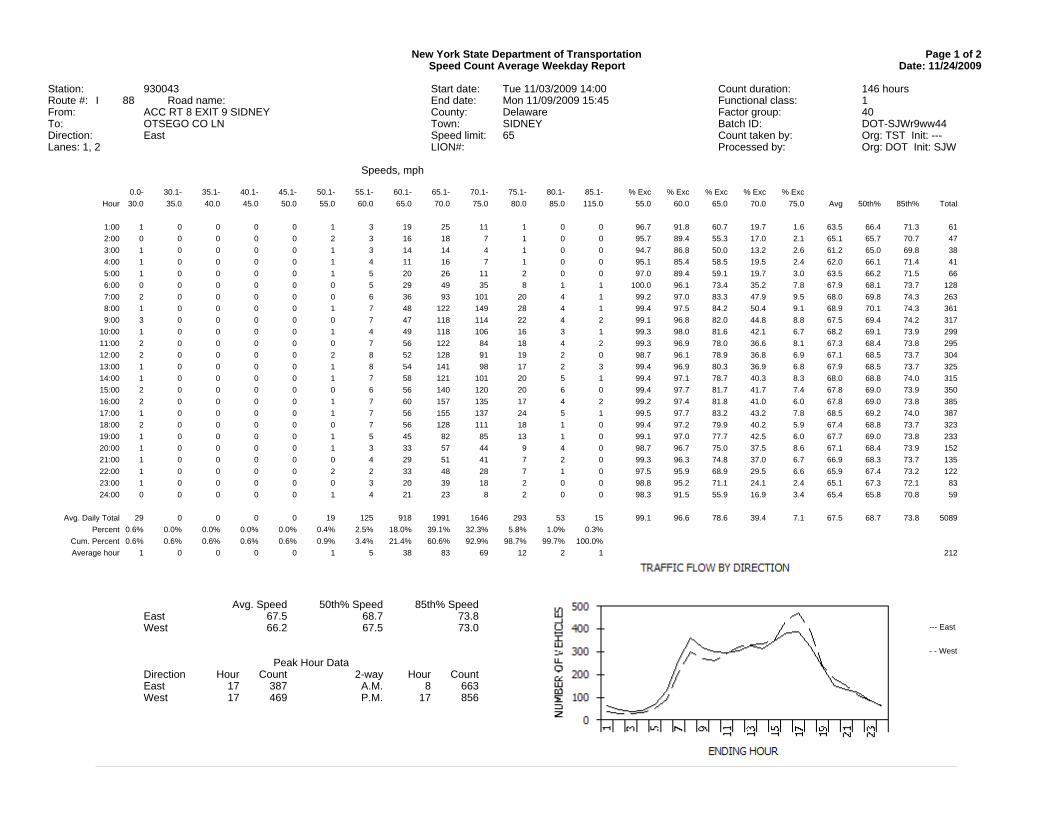
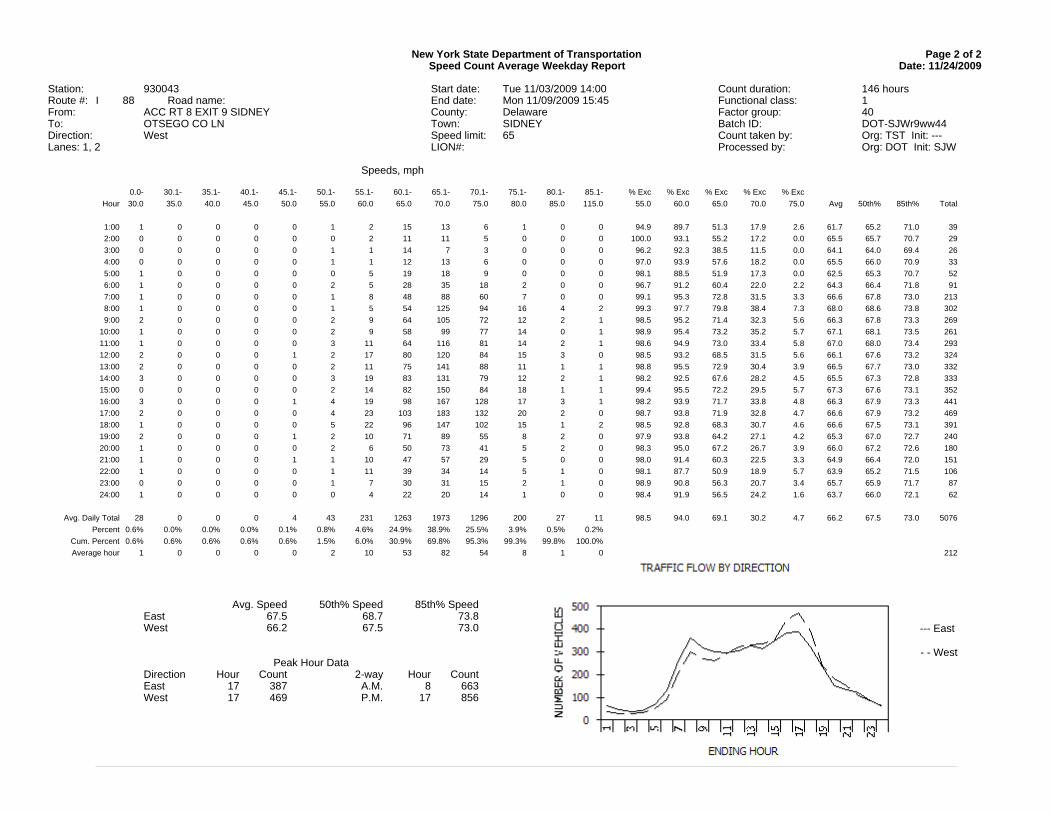
New York State Department of Transportation Page 1 of 2Speed Count Average Weekday Report Date: 11/24/2009
Station: 930043 Start date: Tue 11/03/2009 14:00 Count duration: 146 hoursRoute #: I 88 Road name: End date: Mon 11/09/2009 15:45 Functional class: 1From: ACC RT 8 EXIT 9 SIDNEY County: Delaware Factor group: 40To: OTSEGO CO LN Town: SIDNEY Batch ID: DOT-SJWr9ww44Direction: East Count taken by: Org: TST Init: ---Speed limit: 65Lanes: 1, 2 LION#: Processed by: Org: DOT Init: SJW
Speeds, mph0.0- 30.1- 35.1- 40.1- 45.1- 50.1- 55.1- 60.1- 65.1- 70.1- 75.1- 80.1- 85.1- % Exc % Exc % Exc % Exc % Exc
Hour 30.0 35.0 40.0 45.0 50.0 55.0 60.0 65.0 70.0 75.0 80.0 85.0 115.0 55.0 60.0 65.0 70.0 75.0 Avg 50th% 85th% Total
1:00 1 0 0 0 0 1 3 19 25 11 1 0 0 96.7 91.8 60.7 19.7 1.6 63.5 66.4 71.3 612:00 0 0 0 0 0 2 3 16 18 7 1 0 0 95.7 89.4 55.3 17.0 2.1 65.1 65.7 70.7 473:00 1 0 0 0 0 1 3 14 14 4 1 0 0 94.7 86.8 50.0 13.2 2.6 61.2 65.0 69.8 384:00 1 0 0 0 0 1 4 11 16 7 1 0 0 95.1 85.4 58.5 19.5 2.4 62.0 66.1 71.4 415:00 1 0 0 0 0 1 5 20 26 11 2 0 0 97.0 89.4 59.1 19.7 3.0 63.5 66.2 71.5 666:00 0 0 0 0 0 0 5 29 49 35 8 1 1 100.0 96.1 73.4 35.2 7.8 67.9 68.1 73.7 1287:00 2 0 0 0 0 0 6 36 93 101 20 4 1 99.2 97.0 83.3 47.9 9.5 68.0 69.8 74.3 2638:00 1 0 0 0 0 1 7 48 122 149 28 4 1 99.4 97.5 84.2 50.4 9.1 68.9 70.1 74.3 3619:00 3 0 0 0 0 0 7 47 118 114 22 4 2 99.1 96.8 82.0 44.8 8.8 67.5 69.4 74.2 317
10:00 1 0 0 0 0 1 4 49 118 106 16 3 1 99.3 98.0 81.6 42.1 6.7 68.2 69.1 73.9 29911:00 2 0 0 0 0 0 7 56 122 84 18 4 2 99.3 96.9 78.0 36.6 8.1 67.3 68.4 73.8 29512:00 2 0 0 0 0 2 8 52 128 91 19 2 0 98.7 96.1 78.9 36.8 6.9 67.1 68.5 73.7 30413:00 1 0 0 0 0 1 8 54 141 98 17 2 3 99.4 96.9 80.3 36.9 6.8 67.9 68.5 73.7 32514:00 1 0 0 0 0 1 7 58 121 101 20 5 1 99.4 97.1 78.7 40.3 8.3 68.0 68.8 74.0 31515:00 2 0 0 0 0 0 6 56 140 120 20 6 0 99.4 97.7 81.7 41.7 7.4 67.8 69.0 73.9 35016:00 2 0 0 0 0 1 7 60 157 135 17 4 2 99.2 97.4 81.8 41.0 6.0 67.8 69.0 73.8 38517:00 1 0 0 0 0 1 7 56 155 137 24 5 1 99.5 97.7 83.2 43.2 7.8 68.5 69.2 74.0 38718:00 2 0 0 0 0 0 7 56 128 111 18 1 0 99.4 97.2 79.9 40.2 5.9 67.4 68.8 73.7 32319:00 1 0 0 0 0 1 5 45 82 85 13 1 0 99.1 97.0 77.7 42.5 6.0 67.7 69.0 73.8 23320:00 1 0 0 0 0 1 3 33 57 44 9 4 0 98.7 96.7 75.0 37.5 8.6 67.1 68.4 73.9 15221:00 1 0 0 0 0 0 4 29 51 41 7 2 0 99.3 96.3 74.8 37.0 6.7 66.9 68.3 73.7 13522:00 1 0 0 0 0 2 2 33 48 28 7 1 0 97.5 95.9 68.9 29.5 6.6 65.9 67.4 73.2 12223:00 1 0 0 0 0 0 3 20 39 18 2 0 0 98.8 95.2 71.1 24.1 2.4 65.1 67.3 72.1 8324:00 0 0 0 0 0 1 4 21 23 8 2 0 0 98.3 91.5 55.9 16.9 3.4 65.4 65.8 70.8 59
Avg. Daily Total 29 0 0 0 0 19 125 918 1991 1646 293 53 15 508999.1 96.6 78.6 39.4 7.1 67.5 68.7 73.8Percent
Cum. PercentAverage hour
0.6%0.6%
1
0.0%0.6%
0
0.0%0.6%
0
0.0%0.6%
0
0.0%0.6%
0
0.4%0.9%
1
2.5%3.4%
5
18.0%21.4%
38
39.1%60.6%
83
32.3%92.9%
69
5.8%98.7%
12
1.0%99.7%
2
0.3%100.0%
1 212
Avg. Speed 50th% Speed 85th% SpeedEast 67.5 68.7 73.8West 66.2 67.5 73.0
Peak Hour DataDirection Hour Count 2-way Hour CountEast 17 387 A.M. 8 663West 17 469 P.M. 17 856

--- East - - West
New York State Department of Transportation Page 2 of 2Speed Count Average Weekday Report Date: 11/24/2009
Station: 930043 Start date: Tue 11/03/2009 14:00 Count duration: 146 hoursRoute #: I 88 Road name: End date: Mon 11/09/2009 15:45 Functional class: 1From: ACC RT 8 EXIT 9 SIDNEY County: Delaware Factor group: 40To: OTSEGO CO LN Town: SIDNEY Batch ID: DOT-SJWr9ww44Direction: West Count taken by: Org: TST Init: ---Speed limit: 65Lanes: 1, 2 LION#: Processed by: Org: DOT Init: SJW
Speeds, mph0.0- 30.1- 35.1- 40.1- 45.1- 50.1- 55.1- 60.1- 65.1- 70.1- 75.1- 80.1- 85.1- % Exc % Exc % Exc % Exc % Exc
Hour 30.0 35.0 40.0 45.0 50.0 55.0 60.0 65.0 70.0 75.0 80.0 85.0 115.0 55.0 60.0 65.0 70.0 75.0 Avg 50th% 85th% Total
1:00 1 0 0 0 0 1 2 15 13 6 1 0 0 94.9 89.7 51.3 17.9 2.6 61.7 65.2 71.0 392:00 0 0 0 0 0 0 2 11 11 5 0 0 0 100.0 93.1 55.2 17.2 0.0 65.5 65.7 70.7 293:00 0 0 0 0 0 1 1 14 7 3 0 0 0 96.2 92.3 38.5 11.5 0.0 64.1 64.0 69.4 264:00 0 0 0 0 0 1 1 12 13 6 0 0 0 97.0 93.9 57.6 18.2 0.0 65.5 66.0 70.9 335:00 1 0 0 0 0 0 5 19 18 9 0 0 0 98.1 88.5 51.9 17.3 0.0 62.5 65.3 70.7 526:00 1 0 0 0 0 2 5 28 35 18 2 0 0 96.7 91.2 60.4 22.0 2.2 64.3 66.4 71.8 917:00 1 0 0 0 0 1 8 48 88 60 7 0 0 99.1 95.3 72.8 31.5 3.3 66.6 67.8 73.0 2138:00 1 0 0 0 0 1 5 54 125 94 16 4 2 99.3 97.7 79.8 38.4 7.3 68.0 68.6 73.8 3029:00 2 0 0 0 0 2 9 64 105 72 12 2 1 98.5 95.2 71.4 32.3 5.6 66.3 67.8 73.3 269
10:00 1 0 0 0 0 2 9 58 99 77 14 0 1 98.9 95.4 73.2 35.2 5.7 67.1 68.1 73.5 26111:00 1 0 0 0 0 3 11 64 116 81 14 2 1 98.6 94.9 73.0 33.4 5.8 67.0 68.0 73.4 29312:00 2 0 0 0 1 2 17 80 120 84 15 3 0 98.5 93.2 68.5 31.5 5.6 66.1 67.6 73.2 32413:00 2 0 0 0 0 2 11 75 141 88 11 1 1 98.8 95.5 72.9 30.4 3.9 66.5 67.7 73.0 33214:00 3 0 0 0 0 3 19 83 131 79 12 2 1 98.2 92.5 67.6 28.2 4.5 65.5 67.3 72.8 33315:00 0 0 0 0 0 2 14 82 150 84 18 1 1 99.4 95.5 72.2 29.5 5.7 67.3 67.6 73.1 35216:00 3 0 0 0 1 4 19 98 167 128 17 3 1 98.2 93.9 71.7 33.8 4.8 66.3 67.9 73.3 44117:00 2 0 0 0 0 4 23 103 183 132 20 2 0 98.7 93.8 71.9 32.8 4.7 66.6 67.9 73.2 46918:00 1 0 0 0 0 5 22 96 147 102 15 1 2 98.5 92.8 68.3 30.7 4.6 66.6 67.5 73.1 39119:00 2 0 0 0 1 2 10 71 89 55 8 2 0 97.9 93.8 64.2 27.1 4.2 65.3 67.0 72.7 24020:00 1 0 0 0 0 2 6 50 73 41 5 2 0 98.3 95.0 67.2 26.7 3.9 66.0 67.2 72.6 18021:00 1 0 0 0 1 1 10 47 57 29 5 0 0 98.0 91.4 60.3 22.5 3.3 64.9 66.4 72.0 15122:00 1 0 0 0 0 1 11 39 34 14 5 1 0 98.1 87.7 50.9 18.9 5.7 63.9 65.2 71.5 10623:00 0 0 0 0 0 1 7 30 31 15 2 1 0 98.9 90.8 56.3 20.7 3.4 65.7 65.9 71.7 8724:00 1 0 0 0 0 0 4 22 20 14 1 0 0 98.4 91.9 56.5 24.2 1.6 63.7 66.0 72.1 62
Avg. Daily Total 28 0 0 0 4 43 231 1263 1973 1296 200 27 11 507698.5 94.0 69.1 30.2 4.7 66.2 67.5 73.0Percent
Cum. PercentAverage hour
0.6%0.6%
1
0.0%0.6%
0
0.0%0.6%
0
0.0%0.6%
0
0.1%0.6%
0
0.8%1.5%
2
4.6%6.0%
10
24.9%30.9%
53
38.9%69.8%
82
25.5%95.3%
54
3.9%99.3%
8
0.5%99.8%
1
0.2%100.0%
0 212
Avg. Speed 50th% Speed 85th% SpeedEast 67.5 68.7 73.8West 66.2 67.5 73.0
Peak Hour DataDirection Hour Count 2-way Hour CountEast 17 387 A.M. 8 663West 17 469 P.M. 17 856
New York State Department of TransportationClassification Count Average Weekday Data Report
ROUTE #: I 88 ROAD NAME: YEAR: 2009 STATION: 930043COUNTY NAME: Delaware MONTH: NovemberREGION CODE: 9FROM: ACC RT 8 EXIT 9 SIDNEYTO: OTSEGO CO LNREF-MARKER: 88I93031025END MILEPOINT: 0310621 NO. OF LANES: 4FUNC-CLASS: 01 HPMS NO: 10153020STATION NO: 0043 LION#:COUNT TAKEN BY: ORG CODE: TST INITIALS: ---PROCESSED BY: ORG CODE: DOT INITIALS: SJW BATCH ID: DOT-SJWr9ww44
DIRECTION
NUMBER OF VEHICLESNUMBER OF AXLES% HEAVY VEHICLES (F4-F13)% TRUCKS AND BUSES (F3-F13)AXLE CORRECTION FACTOR
East
508013168
27.99%46.48%
0.77
West
507212914
26.14%43.93%
0.79
TOTAL
1015226082
27.07%45.20%
0.78
VEHICLE CLASS F1 F2 F3 F4 F5 F6 F7 F8 F9 F10 F11 F12 F13 TOTAL
NO. OF AXLES 2 2 2 2.5 2 3 4 3.5 5 6 5 6 8.75ENDING HOUR
DIRECTIONEast
ENDING HOUR
DIRECTIONWest
1:00 0 18 7 5 1 0 0 2 26 0 1 0 0 602:00 0 9 5 3 1 0 0 1 27 1 0 0 0 473:00 0 5 1 5 1 0 0 3 21 0 1 0 0 374:00 0 9 3 4 1 1 0 0 20 0 2 0 0 405:00 0 13 8 7 3 0 0 2 29 1 3 0 0 666:00 0 49 23 7 6 0 0 4 32 0 6 0 0 1277:00 0 128 69 8 16 0 0 7 31 1 1 0 0 2618:00 0 223 67 8 16 4 0 5 35 2 1 0 0 3619:00 0 184 62 7 22 1 0 6 32 1 0 0 1 316
10:00 0 168 60 11 12 2 1 6 34 3 0 0 1 29811:00 1 161 56 11 12 2 0 8 35 6 0 0 1 29312:00 0 164 61 14 11 2 1 8 36 6 0 0 2 30513:00 0 183 54 11 16 2 0 7 46 6 0 0 0 32514:00 0 166 66 13 12 2 0 6 45 5 0 0 0 31515:00 0 194 68 16 12 4 0 10 41 7 0 0 1 35316:00 0 227 87 14 11 1 0 5 32 6 0 0 1 38417:00 0 242 73 10 13 1 0 6 38 3 0 0 0 38618:00 0 200 56 10 11 0 0 3 37 5 0 0 0 32219:00 0 132 41 10 8 0 0 5 35 1 0 0 0 23220:00 0 76 20 11 5 0 0 3 36 1 0 0 0 15221:00 0 64 19 7 4 0 0 3 37 1 0 0 0 13522:00 0 54 17 9 3 0 0 4 32 0 1 0 0 12023:00 0 30 9 5 3 0 0 5 31 0 3 0 0 8624:00 0 19 7 6 0 0 0 1 22 1 3 0 0 59
TOTAL VEHICLESTOTAL AXLES
12
27185436
9391878
212530
200400
2266
28
110385
7903950
57342
22110
00
761
508013168
1:00 0 15 4 2 1 0 0 3 12 1 1 0 0 392:00 0 12 2 3 1 0 0 2 9 0 1 0 0 303:00 0 7 2 2 0 0 0 1 14 1 1 0 0 284:00 0 7 5 3 1 0 0 2 15 1 2 0 0 365:00 0 17 8 5 0 0 0 4 16 2 1 0 0 536:00 0 36 19 2 4 1 0 3 22 0 4 0 0 917:00 0 108 49 7 9 0 0 5 32 2 2 0 0 2148:00 0 186 54 9 11 0 0 8 30 2 0 0 0 3009:00 0 149 52 7 16 2 0 7 33 2 0 0 0 268
10:00 0 144 53 8 12 2 0 6 36 1 0 0 0 26211:00 0 156 56 10 15 1 0 7 44 2 1 0 0 29212:00 2 179 57 12 13 2 0 7 49 2 0 0 0 32313:00 0 181 63 12 16 2 0 6 48 1 0 0 0 32914:00 0 175 56 13 17 2 1 13 54 3 0 0 0 33415:00 0 216 66 10 11 0 0 6 42 2 0 0 0 35316:00 0 259 91 15 17 3 0 5 49 1 0 0 0 44017:00 0 292 84 10 18 1 0 10 50 2 1 0 0 46818:00 0 253 62 8 13 0 0 9 42 1 1 0 0 38919:00 0 136 38 7 11 0 0 5 40 1 0 0 0 23820:00 0 104 26 7 5 1 0 4 33 0 1 0 0 18121:00 0 76 21 3 4 0 0 5 38 0 3 0 0 15022:00 0 63 10 3 2 0 0 2 23 0 3 0 0 10623:00 0 40 13 4 2 0 0 1 23 0 4 0 0 8724:00 0 31 11 5 1 0 0 1 11 0 1 0 0 61
TOTAL VEHICLESTOTAL AXLES
24
28425684
9021804
167418
200400
1751
14
122427
7653825
27162
27135
00
00
507212914
GRAND TOTAL VEHICLESGRAND TOTAL AXLES
36
556011120
18413682
379948
400800
39117
312
232812
15557775
84504
49245
00
761
1015226082
--- East - -WestPEAK HOUR DATA
DIRECTION HOUR COUNT 2-WAY HOUR COUNTEast 17 386 A.M. 8 661
West 17 468 P.M. 17 854
VEHICLE CLASSIFICATION CODES:
F1. MotorcyclesF2. Autos*F3. 2 Axle, 4-Tire Pickups, Vans, Motorhomes*F4. BusesF5. 2 Axle, 6-Tire Single Unit TrucksF6. 3 Axle Single Unit TrucksF7. 4 or More Axle Single Unit TrucksF8. 4 or Less Axle Vehicles, One Unit is a TruckF9. 5 Axle Double Unit Vehicles, One Unit is a TruckF10. 6 or More Double Unit Vehicles, One Unit is a TruckF11. 5 or Less Axle Multi-Unit TrucksF12. 6 Axle Multi-Unit TrucksF13. 7 or More Axle Multi-Unit Trucks* INCLUDING THOSE HAULING TRAILERSFUNCTIONAL CLASS CODES:RURAL URBAN SYSTEM01020206070809
11121416171719
PRINCIPAL ARTERIAL-INTERSTATEPRINCIPAL ARTERIAL-EXPRESSWAYPRINCIPAL ARTERIAL-OTHERMINOR ARTERIALMAJOR COLLECTORMINOR COLLECTORLOCAL SYSTEM
SOURCE: NYSDOT DATA SERVICES BUREAU

--- East
- - West
New York State Department of Transportation Page 1 of 2Speed Count Average Weekday Report Date: 11/24/2009
Station: 930043 Start date: Tue 11/03/2009 14:00 Count duration: 146 hoursRoute #: I 88 Road name: End date: Mon 11/09/2009 15:45 Functional class: 1From: ACC RT 8 EXIT 9 SIDNEY County: Delaware Factor group: 40To: OTSEGO CO LN Town: SIDNEY Batch ID: DOT-SJWr9ww44Direction: East Count taken by: Org: TST Init: ---Speed limit: 65Lanes: 1, 2 LION#: Processed by: Org: DOT Init: SJW
Speeds, mph0.0- 30.1- 35.1- 40.1- 45.1- 50.1- 55.1- 60.1- 65.1- 70.1- 75.1- 80.1- 85.1- % Exc % Exc % Exc % Exc % Exc
Hour 30.0 35.0 40.0 45.0 50.0 55.0 60.0 65.0 70.0 75.0 80.0 85.0 115.0 55.0 60.0 65.0 70.0 75.0 Avg 50th% 85th% Total
1:00 1 0 0 0 0 1 3 19 25 11 1 0 0 96.7 91.8 60.7 19.7 1.6 63.5 66.4 71.3 612:00 0 0 0 0 0 2 3 16 18 7 1 0 0 95.7 89.4 55.3 17.0 2.1 65.1 65.7 70.7 473:00 1 0 0 0 0 1 3 14 14 4 1 0 0 94.7 86.8 50.0 13.2 2.6 61.2 65.0 69.8 384:00 1 0 0 0 0 1 4 11 16 7 1 0 0 95.1 85.4 58.5 19.5 2.4 62.0 66.1 71.4 415:00 1 0 0 0 0 1 5 20 26 11 2 0 0 97.0 89.4 59.1 19.7 3.0 63.5 66.2 71.5 666:00 0 0 0 0 0 0 5 29 49 35 8 1 1 100.0 96.1 73.4 35.2 7.8 67.9 68.1 73.7 1287:00 2 0 0 0 0 0 6 36 93 101 20 4 1 99.2 97.0 83.3 47.9 9.5 68.0 69.8 74.3 2638:00 1 0 0 0 0 1 7 48 122 149 28 4 1 99.4 97.5 84.2 50.4 9.1 68.9 70.1 74.3 3619:00 3 0 0 0 0 0 7 47 118 114 22 4 2 99.1 96.8 82.0 44.8 8.8 67.5 69.4 74.2 317
10:00 1 0 0 0 0 1 4 49 118 106 16 3 1 99.3 98.0 81.6 42.1 6.7 68.2 69.1 73.9 29911:00 2 0 0 0 0 0 7 56 122 84 18 4 2 99.3 96.9 78.0 36.6 8.1 67.3 68.4 73.8 29512:00 2 0 0 0 0 2 8 52 128 91 19 2 0 98.7 96.1 78.9 36.8 6.9 67.1 68.5 73.7 30413:00 1 0 0 0 0 1 8 54 141 98 17 2 3 99.4 96.9 80.3 36.9 6.8 67.9 68.5 73.7 32514:00 1 0 0 0 0 1 7 58 121 101 20 5 1 99.4 97.1 78.7 40.3 8.3 68.0 68.8 74.0 31515:00 2 0 0 0 0 0 6 56 140 120 20 6 0 99.4 97.7 81.7 41.7 7.4 67.8 69.0 73.9 35016:00 2 0 0 0 0 1 7 60 157 135 17 4 2 99.2 97.4 81.8 41.0 6.0 67.8 69.0 73.8 38517:00 1 0 0 0 0 1 7 56 155 137 24 5 1 99.5 97.7 83.2 43.2 7.8 68.5 69.2 74.0 38718:00 2 0 0 0 0 0 7 56 128 111 18 1 0 99.4 97.2 79.9 40.2 5.9 67.4 68.8 73.7 32319:00 1 0 0 0 0 1 5 45 82 85 13 1 0 99.1 97.0 77.7 42.5 6.0 67.7 69.0 73.8 23320:00 1 0 0 0 0 1 3 33 57 44 9 4 0 98.7 96.7 75.0 37.5 8.6 67.1 68.4 73.9 15221:00 1 0 0 0 0 0 4 29 51 41 7 2 0 99.3 96.3 74.8 37.0 6.7 66.9 68.3 73.7 13522:00 1 0 0 0 0 2 2 33 48 28 7 1 0 97.5 95.9 68.9 29.5 6.6 65.9 67.4 73.2 12223:00 1 0 0 0 0 0 3 20 39 18 2 0 0 98.8 95.2 71.1 24.1 2.4 65.1 67.3 72.1 8324:00 0 0 0 0 0 1 4 21 23 8 2 0 0 98.3 91.5 55.9 16.9 3.4 65.4 65.8 70.8 59
Avg. Daily Total 29 0 0 0 0 19 125 918 1991 1646 293 53 15 508999.1 96.6 78.6 39.4 7.1 67.5 68.7 73.8Percent
Cum. PercentAverage hour
0.6%0.6%
1
0.0%0.6%
0
0.0%0.6%
0
0.0%0.6%
0
0.0%0.6%
0
0.4%0.9%
1
2.5%3.4%
5
18.0%21.4%
38
39.1%60.6%
83
32.3%92.9%
69
5.8%98.7%
12
1.0%99.7%
2
0.3%100.0%
1 212
Avg. Speed 50th% Speed 85th% SpeedEast 67.5 68.7 73.8West 66.2 67.5 73.0
Peak Hour DataDirection Hour Count 2-way Hour CountEast 17 387 A.M. 8 663West 17 469 P.M. 17 856
--- East - - West
New York State Department of Transportation Page 2 of 2Speed Count Average Weekday Report Date: 11/24/2009
Station: 930043 Start date: Tue 11/03/2009 14:00 Count duration: 146 hoursRoute #: I 88 Road name: End date: Mon 11/09/2009 15:45 Functional class: 1From: ACC RT 8 EXIT 9 SIDNEY County: Delaware Factor group: 40To: OTSEGO CO LN Town: SIDNEY Batch ID: DOT-SJWr9ww44Direction: West Count taken by: Org: TST Init: ---Speed limit: 65Lanes: 1, 2 LION#: Processed by: Org: DOT Init: SJW
Speeds, mph0.0- 30.1- 35.1- 40.1- 45.1- 50.1- 55.1- 60.1- 65.1- 70.1- 75.1- 80.1- 85.1- % Exc % Exc % Exc % Exc % Exc
Hour 30.0 35.0 40.0 45.0 50.0 55.0 60.0 65.0 70.0 75.0 80.0 85.0 115.0 55.0 60.0 65.0 70.0 75.0 Avg 50th% 85th% Total
1:00 1 0 0 0 0 1 2 15 13 6 1 0 0 94.9 89.7 51.3 17.9 2.6 61.7 65.2 71.0 392:00 0 0 0 0 0 0 2 11 11 5 0 0 0 100.0 93.1 55.2 17.2 0.0 65.5 65.7 70.7 293:00 0 0 0 0 0 1 1 14 7 3 0 0 0 96.2 92.3 38.5 11.5 0.0 64.1 64.0 69.4 264:00 0 0 0 0 0 1 1 12 13 6 0 0 0 97.0 93.9 57.6 18.2 0.0 65.5 66.0 70.9 335:00 1 0 0 0 0 0 5 19 18 9 0 0 0 98.1 88.5 51.9 17.3 0.0 62.5 65.3 70.7 526:00 1 0 0 0 0 2 5 28 35 18 2 0 0 96.7 91.2 60.4 22.0 2.2 64.3 66.4 71.8 917:00 1 0 0 0 0 1 8 48 88 60 7 0 0 99.1 95.3 72.8 31.5 3.3 66.6 67.8 73.0 2138:00 1 0 0 0 0 1 5 54 125 94 16 4 2 99.3 97.7 79.8 38.4 7.3 68.0 68.6 73.8 3029:00 2 0 0 0 0 2 9 64 105 72 12 2 1 98.5 95.2 71.4 32.3 5.6 66.3 67.8 73.3 269
10:00 1 0 0 0 0 2 9 58 99 77 14 0 1 98.9 95.4 73.2 35.2 5.7 67.1 68.1 73.5 26111:00 1 0 0 0 0 3 11 64 116 81 14 2 1 98.6 94.9 73.0 33.4 5.8 67.0 68.0 73.4 29312:00 2 0 0 0 1 2 17 80 120 84 15 3 0 98.5 93.2 68.5 31.5 5.6 66.1 67.6 73.2 32413:00 2 0 0 0 0 2 11 75 141 88 11 1 1 98.8 95.5 72.9 30.4 3.9 66.5 67.7 73.0 33214:00 3 0 0 0 0 3 19 83 131 79 12 2 1 98.2 92.5 67.6 28.2 4.5 65.5 67.3 72.8 33315:00 0 0 0 0 0 2 14 82 150 84 18 1 1 99.4 95.5 72.2 29.5 5.7 67.3 67.6 73.1 35216:00 3 0 0 0 1 4 19 98 167 128 17 3 1 98.2 93.9 71.7 33.8 4.8 66.3 67.9 73.3 44117:00 2 0 0 0 0 4 23 103 183 132 20 2 0 98.7 93.8 71.9 32.8 4.7 66.6 67.9 73.2 46918:00 1 0 0 0 0 5 22 96 147 102 15 1 2 98.5 92.8 68.3 30.7 4.6 66.6 67.5 73.1 39119:00 2 0 0 0 1 2 10 71 89 55 8 2 0 97.9 93.8 64.2 27.1 4.2 65.3 67.0 72.7 24020:00 1 0 0 0 0 2 6 50 73 41 5 2 0 98.3 95.0 67.2 26.7 3.9 66.0 67.2 72.6 18021:00 1 0 0 0 1 1 10 47 57 29 5 0 0 98.0 91.4 60.3 22.5 3.3 64.9 66.4 72.0 15122:00 1 0 0 0 0 1 11 39 34 14 5 1 0 98.1 87.7 50.9 18.9 5.7 63.9 65.2 71.5 10623:00 0 0 0 0 0 1 7 30 31 15 2 1 0 98.9 90.8 56.3 20.7 3.4 65.7 65.9 71.7 8724:00 1 0 0 0 0 0 4 22 20 14 1 0 0 98.4 91.9 56.5 24.2 1.6 63.7 66.0 72.1 62
Avg. Daily Total 28 0 0 0 4 43 231 1263 1973 1296 200 27 11 507698.5 94.0 69.1 30.2 4.7 66.2 67.5 73.0Percent
Cum. PercentAverage hour
0.6%0.6%
1
0.0%0.6%
0
0.0%0.6%
0
0.0%0.6%
0
0.1%0.6%
0
0.8%1.5%
2
4.6%6.0%
10
24.9%30.9%
53
38.9%69.8%
82
25.5%95.3%
54
3.9%99.3%
8
0.5%99.8%
1
0.2%100.0%
0 212
Avg. Speed 50th% Speed 85th% SpeedEast 67.5 68.7 73.8West 66.2 67.5 73.0
Peak Hour DataDirection Hour Count 2-way Hour CountEast 17 387 A.M. 8 663West 17 469 P.M. 17 856
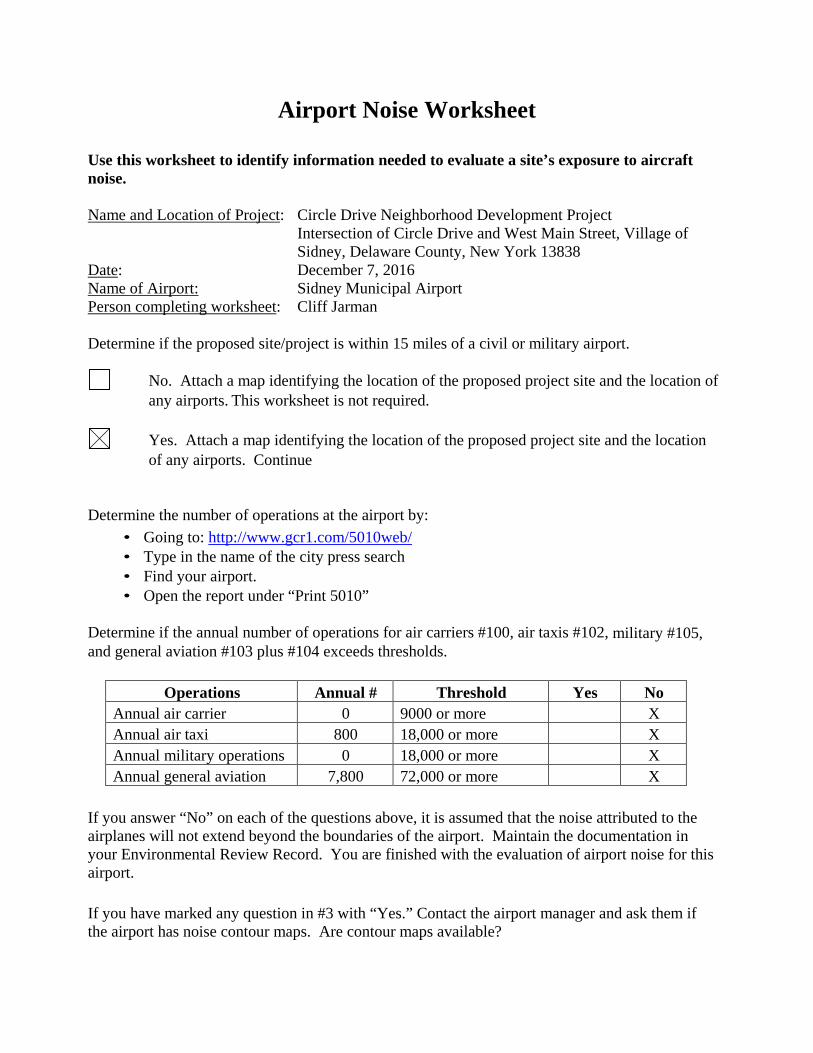
Airport Noise Worksheet
Use this worksheet to identify information needed to evaluate a site’s exposure to aircraft noise.
Name and Location of Project: Circle Drive Neighborhood Development Project Intersection of Circle Drive and West Main Street, Village of Sidney, Delaware County, New York 13838
Date: December 7, 2016 Name of Airport: Sidney Municipal Airport Person completing worksheet: Cliff Jarman
Determine if the proposed site/project is within 15 miles of a civil or military airport.
No. Attach a map identifying the location of the proposed project site and the location of any airports. This worksheet is not required.
Yes. Attach a map identifying the location of the proposed project site and the location of any airports. Continue
Determine the number of operations at the airport by:
• Going to: http://www.gcr1.com/5010web/• Type in the name of the city press search• Find your airport.• Open the report under “Print 5010”
Determine if the annual number of operations for air carriers #100, air taxis #102, military #105, and general aviation #103 plus #104 exceeds thresholds.
Operations Annual # Threshold Yes No Annual air carrier 0 9000 or more X Annual air taxi 800 18,000 or more X Annual military operations 0 18,000 or more X Annual general aviation 7,800 72,000 or more X
If you answer “No” on each of the questions above, it is assumed that the noise attributed to the airplanes will not extend beyond the boundaries of the airport. Maintain the documentation in your Environmental Review Record. You are finished with the evaluation of airport noise for this airport.
If you have marked any question in #3 with “Yes.” Contact the airport manager and ask them if the airport has noise contour maps. Are contour maps available?
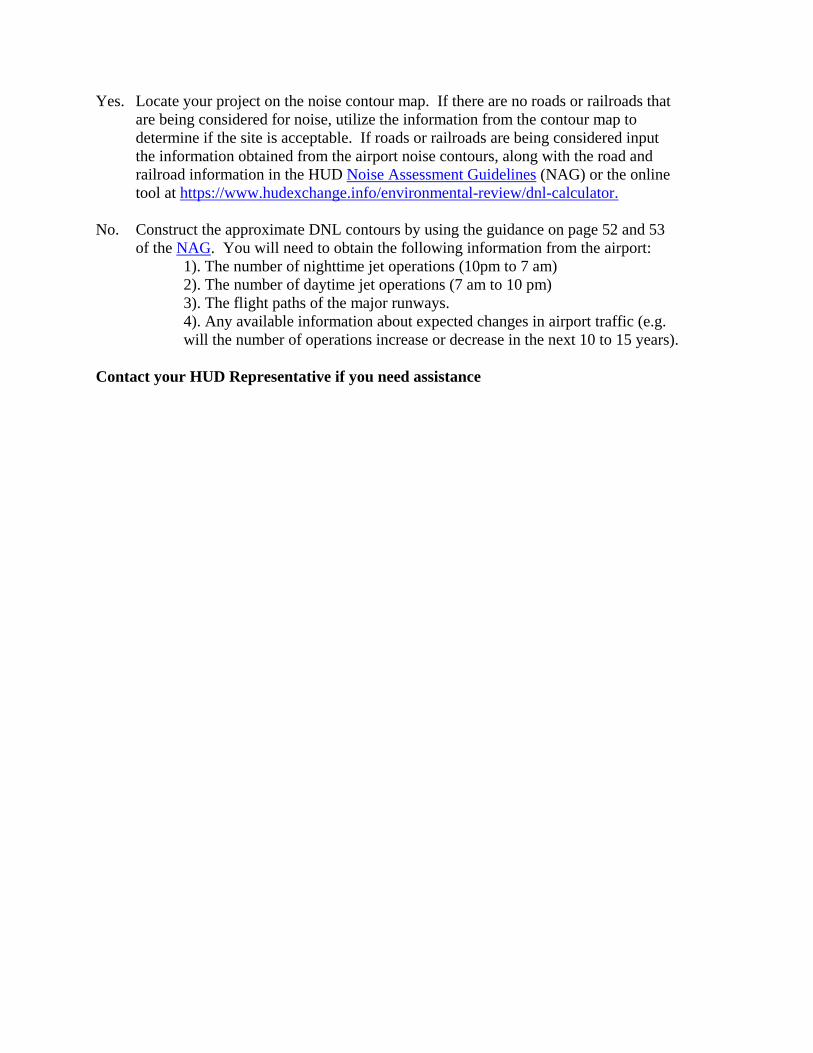
Yes. Locate your project on the noise contour map. If there are no roads or railroads that are being considered for noise, utilize the information from the contour map to determine if the site is acceptable. If roads or railroads are being considered input the information obtained from the airport noise contours, along with the road and railroad information in the HUD Noise Assessment Guidelines (NAG) or the online tool at https://www.hudexchange.info/environmental-review/dnl-calculator.
No. Construct the approximate DNL contours by using the guidance on page 52 and 53
of the NAG. You will need to obtain the following information from the airport: 1). The number of nighttime jet operations (10pm to 7 am) 2). The number of daytime jet operations (7 am to 10 pm) 3). The flight paths of the major runways. 4). Any available information about expected changes in airport traffic (e.g. will the number of operations increase or decrease in the next 10 to 15 years).
Contact your HUD Representative if you need assistance