Embed Size (px)
Citation preview

Page 1 of 43
Appendix H: Appraisal checklists, evidence tables, GRADE and economic profiles
18 January 2022
This aims to give examples of checklists that can be used to assess risk of bias or
quality of studies when developing guidelines. NICE has some preferred checklists
as a result of external collaborations and the endorsement of GRADE. These
preferred checklists are indicated in this appendix. However, where the preferred
checklist is not appropriate to address a particular review question, another
appropriate checklist should be used according to the specific review question. The
reasons for using other non-preferred checklists should be provided in the review
protocol (see the section on planning the evidence review in the chapter of the
manual on developing review questions and planning the evidence review). The
checklist should allow assessment of those features considered important – these
may be study design specific or specific to the topic. As such, additional items may
need to be included, or minor modification made. Where this is the case, this should
be documented, and agreed with members of NICE staff with responsibility for
quality assurance.

Page 2 of 43
Quantitative review question Appraisal checklists: Intervention studies - systematic reviews and meta-analyses (Preferred) Risk of Bias in Systematic Reviews (ROBIS)
http://www.bristol.ac.uk/media-library/sites/social-community-
medicine/robis/robisguidancedocument.pdf
Amstar www.amstar.ca
DSU NMA methodology checklist http://nicedsu.org.uk/wp-
content/uploads/2016/03/TSD7-reviewer-checklist.final_.08.05.12.pdf
CASP systematic review checklist
http://docs.wixstatic.com/ugd/dded87_a02ff2e3445f4952992d5a96ca562576.pdf
Appraisal checklists: Diagnostic test accuracy, clinical prediction and prognostic studies - systematic reviews and meta-analyses (Preferred) ROBIS http://www.bristol.ac.uk/media-library/sites/social-community-
medicine/robis/robisguidancedocument.pdf
Appraisal checklists: Intervention studies - randomised controlled trials (parallel) (Preferred) Cochrane RoB tool (2.0)
https://sites.google.com/site/riskofbiastool/welcome/rob-2-0-tool
Effective Practice and Organisation of Care (EPOC) RoB Tool (for randomised trial)
http://epoc.cochrane.org/resources/epoc-resources-review-authors (Note: for
complex interventions, consider the EPOC RoB Tool)
CASP RCT checklist
http://docs.wixstatic.com/ugd/dded87_40b9ff0bf53840478331915a8ed8b2fb.pdf
Appraisal checklists: Intervention studies - randomised controlled trials (cluster and crossover) Cluster randomised trials: (preferred) Cochrane RoB tool 2 for cluster randomised
trial
Page 3 of 43
https://sites.google.com/site/riskofbiastool/welcome/rob-2-0-tool/rob-2-for-cluster-
randomized-trials
Crossover trials: (preferred) Cochrane RoB tool 2 for crossover trials
https://sites.google.com/site/riskofbiastool/welcome/rob-2-0-tool/rob-2-for-crossover-
trials
Appraisal checklists: Intervention studies – Non-randomised studies A) Non-randomised controlled trials (also called clinical controlled trials) (Preferred) Cochrane ROBINS-I
https://sites.google.com/site/riskofbiastool//welcome/home
EPOC RoB Tool (for studies with a control group)
http://epoc.cochrane.org/resources/epoc-resources-review-authors (Note: for
complex interventions, consider the EPOC RoB Tool)
GATE - Effective Public Health Practice Project Quality assessment tool for
quantitative studies
B) Cohort study (Preferred) Cochrane ROBINS-I
https://sites.google.com/site/riskofbiastool//welcome/home
Effective Practice and Organisation of Care (EPOC) RoB Tool (for studies with a
control group) http://epoc.cochrane.org/resources/epoc-resources-review-authors
(Note: for complex interventions, consider the EPOC RoB Tool)
CASP cohort study checklist
http://docs.wixstatic.com/ugd/dded87_e37a4ab637fe46a0869f9f977dacf134.pdf
Newcastle-Ottowa scale (for cohort study)
http://www.ohri.ca/programs/clinical_epidemiology/nosgen.pdf
Downs & Black checklist for measuring quality
http://jech.bmj.com/content/52/6/377.abstract
Quality assessment for quantitative studies www.ephpp.ca/tools.html
Page 4 of 43
GRACE www.graceprinciples.org
C) Case control study (Preferred) CASP case control checklist
http://docs.wixstatic.com/ugd/dded87_63fb65dd4e0548e2bfd0a982295f839e.pdf
Effective Practice and Organisation of Care (EPOC) RoB Tool (for studies with a
control group) http://epoc.cochrane.org/resources/epoc-resources-review-authors
Newcastle-Ottowa scale (for cohort study)
http://www.ohri.ca/programs/clinical_epidemiology/nosgen.pdf
Downs & Black checklist for measuring quality
http://jech.bmj.com/content/52/6/377.abstract
D) Controlled before-and-after study (Preferred) Effective Practice and Organisation of Care (EPOC) RoB Tool (for
before-and-after study) http://epoc.cochrane.org/resources/epoc-resources-review-
authors
E) Interrupted time series (Preferred) Effective Practice and Organisation of Care (EPOC) RoB Tool (for
interrupted time series study) http://epoc.cochrane.org/resources/epoc-resources-
review-authors
F) Cross sectional study (Preferred) JBI checklist for cross sectional study https://jbi.global/critical-appraisal-
tools
AXIS http://bmjopen.bmj.com/content/6/12/e011458
G) Historical controlled/retrospective cohort study (Preferred) Cochrane ROBINS-I
https://sites.google.com/site/riskofbiastool//welcome/home
Effective Practice and Organisation of Care (EPOC) RoB Tool (for studies with a
control group) http://epoc.cochrane.org/resources/epoc-resources-review-authors
(Note: for complex interventions, consider the EPOC RoB Tool)

Page 5 of 43
CASP cohort study checklist
http://docs.wixstatic.com/ugd/dded87_e37a4ab637fe46a0869f9f977dacf134.pdf
Newcastle-Ottowa scale (for cohort study)
http://www.ohri.ca/programs/clinical_epidemiology/nosgen.pdf
H) Case series (uncontrolled longitudinal study) (Preferred) Institute of Health Economics (IHE) checklist for case series
http://www.ihe.ca/publications/ihe-quality-appraisal-checklist-for-case-series-studies
JBI checklist for case series https://jbi.global/critical-appraisal-tools
NIH tool for case series studies https://www.nhlbi.nih.gov/health-topics/study-quality-
assessment-tools
Appraisal checklists: Diagnostic test accuracy studies Note: This is for diagnostic test accuracy (DTA) review (using cross sectional study,
cohort study or case control study design) where a typical 2x2 table is used to collect
data on TP, FP, TN, FN. No univariate or multivariate regression analysis is
conducted.
(Preferred) QUADAS-2 http://www.bristol.ac.uk/population-health-
sciences/projects/quadas/quadas-2/
CASP diagnostic test accuracy checklist
http://docs.wixstatic.com/ugd/dded87_3815f02af1b34c21b8c3b2b5020024c3.pdf
Appraisal checklists: Prediction studies for a prognosis or diagnosis Note: This is for a prediction rule/model (PM) for a prognosis or a diagnosis (see
TRIPOD statement for classifications: https://www.equator-network.org/reporting-
guidelines/tripod-statement/), these studies often use a cohort, cross sectional, or
case control study design accompanied by multivariate regression modelling.
Examples for PM for a prognosis: QAdmission, PREDICT, risk-prediction model for
falls, etc.
Examples for PM for a diagnosis: QCancer, QRISK, Framingham Risk Score, etc.
Page 6 of 43
(Preferred) PROBAST
https://annals.org/aim/fullarticle/2719961/probast-tool-assess-risk-bias-applicability-
prediction-model-studies
https://annals.org/aim/fullarticle/2719962/probast-tool-assess-risk-bias-applicability-
prediction-model-studies-explanation
CASP clinical prediction rule checklist
http://docs.wixstatic.com/ugd/dded87_a2f74f6cd2f24bd684bb26efe7ad7196.pdf
Cochrane CHARMS
http://methods.cochrane.org/sites/methods.cochrane.org.prognosis/files/public/uploa
ds/CHARMS%20checklist.pdf
Appraisal checklists: Prognostic studies Note: this is for simple association studies for particular risk factor(s)/variable(s) and
its associations with a prognosis (with simple correlational analysis or univariate
regression analysis). These studies often use a cohort, cross sectional and case
control study design.
(Preferred) QUIPS checklist
http://methods.cochrane.org/sites/methods.cochrane.org.prognosis/files/public/uploa
ds/QUIPS%20tool.pdf
Appraisal checklists: Prevalence/incidence studies or epidemiological studies (Preferred) JBI checklist for prevalence studies https://jbi.global/critical-appraisal-
tools
Appraisal checklists: Other quantitative studies A) Cross sectional survey/survey questionnaire study (Preferred) CEBM checklist https://www.cebma.org/wp-content/uploads/Critical-
Appraisal-Questions-for-a-Survey.pdf
Boynton & Greenhalgh checklist (see Box A.4)
http://onlinelibrary.wiley.com/doi/10.1002/9780470987407.app2/pdf

Page 7 of 43
The BMJ checklist
http://www.bmj.com/content/suppl/2004/05/27/328.7451.1312.DC1
Roever checklist https://www.omicsonline.org/open-access/critical-appraisal-of-a-
questionnaire-study-ebmp-1000e110.php?aid=70356
B) Other studies on associations (other than for clinical diagnosis and prognosis) Note: examples: the relationship between gender, age and exercise; the relationship
between city/non-city dwelling and aggressive driving behaviour; the relationship
between social economic status and sedentary lifestyle, etc. These studies usually
used cohort, cross sectional and case control study design.
(Preferred) Newcastle-Ottowa scale
www.ohri.ca/programs/clinical_epidemiology/oxford.asp
Cochrane EPOC risk of bias tool (for studies with a controlled group)
http://epoc.cochrane.org/resources/epoc-resources-review-authors
Downs & Black checklist for measuring quality
http://jech.bmj.com/content/52/6/377.abstract
Quality assessment for quantitative studies www.ephpp.ca/tools.html
Qualitative review question Note: CERQual (http://www.cerqual.org/publications/) is for qualitative evidence
synthesis and presentation after quality assessment of individual studies has been
conducted.
(Preferred) CASP qualitative checklist
http://docs.wixstatic.com/ugd/dded87_29c5b002d99342f788c6ac670e49f274.pdf
Cochrane qualitative checklist http://methods.cochrane.org/qi/supplemental-
handbook-guidance
JBI checklist for qualitative research https://jbi.global/critical-appraisal-tools
Quality Framework: Cabinet Office checklist for social research
http://webarchive.nationalarchives.gov.uk/20140402165901/http://www.civilservice.g

Page 8 of 43
ov.uk/wp-content/uploads/2011/09/a_quality_framework_tcm6-7314.pdf (Note:
consider the Cabinet Office checklist if the study is specific for qualitative 'evaluation'
concerned with the development and implementation of social policy, programmes
and practice)
Mixed methods review question Appraisal checklists: Mixed methods studies Note: for when mixed methods studies are included in their entirety within a mixed
methods review.
(Preferred) Mixed Methods Appraisal Tool (MMAT)
http://mixedmethodsappraisaltoolpublic.pbworks.com/w/page/24607821/FrontPage
Appraisal checklists: economic evaluations This checklist can be used to determine whether an economic evaluation provides
evidence that is useful to inform the decision-making of the Committee (see the
chapter on incorporating economic evaluation). It judges the applicability of the study
and the limitations.
The robustness of the study results to methodological limitations may sometimes be
apparent from reported sensitivity analyses. If not, judgement will be needed to
assess whether a limitation would be likely to change the results and conclusions.
The judgements should be recorded and presented in the guideline. The ‘comments’
column in the checklist should be used to record reasons for these judgements, as
well as additional details about the studies where necessary.
If this checklist is not considered appropriate, other economic evaluation checklists,
such as CHEERS, can be used.
If necessary, the health technology assessment checklist for decision-analytic
models (Philips et al. 2004) may also be used to give a more detailed assessment of
the methodological quality of modelling studies.

Page 9 of 43
Checklist: economic evaluations
Study identification Include author, title, reference, year of publication Guidance topic: Question no: Checklist completed by: Section 1: Applicability (relevance to specific review questions and the NICE reference case as described in section 7.5) This checklist should be used first to filter out irrelevant studies.
Yes/partly/no/unclear/NA Comments
1.1 Is the study population appropriate for the review question?
1.2 Are the interventions appropriate for the review question?
1.3 Is the system in which the study was conducted sufficiently similar to the current UK context?
1.4 Is the perspective for costs appropriate for the review question?
1.5 Is the perspective for outcomes appropriate for the review question?
1.6 Are all future costs and outcomes discounted appropriately?
1.7 Are QALYs, derived using NICE’s preferred methods, or an appropriate social care-related equivalent used as an outcome? If not, describe rationale and outcomes used in line with analytical perspectives taken (item 1.5 above).
1.8 Overall judgement: Directly applicable/partially applicable/not applicable There is no need to use section 2 of the checklist if the study is considered ‘not applicable’. Other comments: Section 2: Study limitations (the level of methodological quality) This checklist should be used once it has been decided that the study is sufficiently applicable to the context of the guideline
Yes/partly/no/unclear/NA Comments
2.1 Does the model structure adequately reflect the nature of the topic under evaluation?
Page 10 of 43
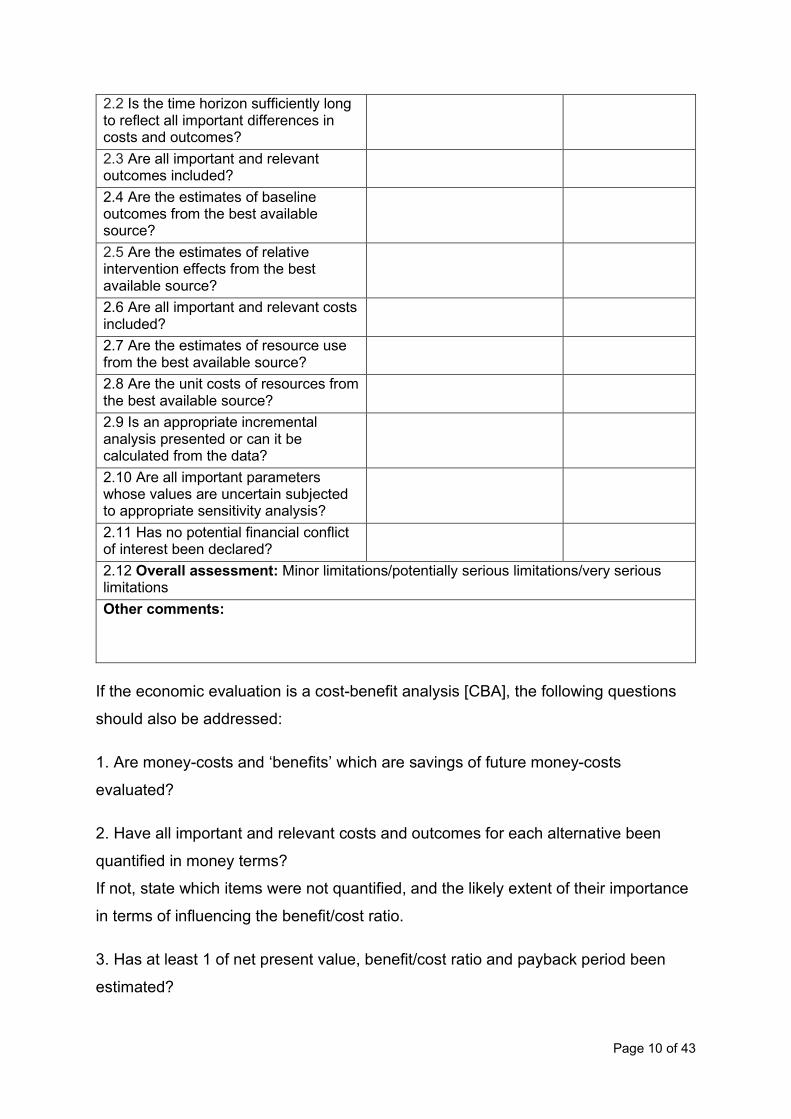
2.2 Is the time horizon sufficiently long to reflect all important differences in costs and outcomes?
2.3 Are all important and relevant outcomes included?
2.4 Are the estimates of baseline outcomes from the best available source?
2.5 Are the estimates of relative intervention effects from the best available source?
2.6 Are all important and relevant costs included?
2.7 Are the estimates of resource use from the best available source?
2.8 Are the unit costs of resources from the best available source?
2.9 Is an appropriate incremental analysis presented or can it be calculated from the data?
2.10 Are all important parameters whose values are uncertain subjected to appropriate sensitivity analysis?
2.11 Has no potential financial conflict of interest been declared?
2.12 Overall assessment: Minor limitations/potentially serious limitations/very serious limitations Other comments:
If the economic evaluation is a cost-benefit analysis [CBA], the following questions
should also be addressed:
1. Are money-costs and ‘benefits’ which are savings of future money-costs
evaluated?
2. Have all important and relevant costs and outcomes for each alternative been
quantified in money terms?
If not, state which items were not quantified, and the likely extent of their importance
in terms of influencing the benefit/cost ratio.
3. Has at least 1 of net present value, benefit/cost ratio and payback period been
estimated?
Page 11 of 43
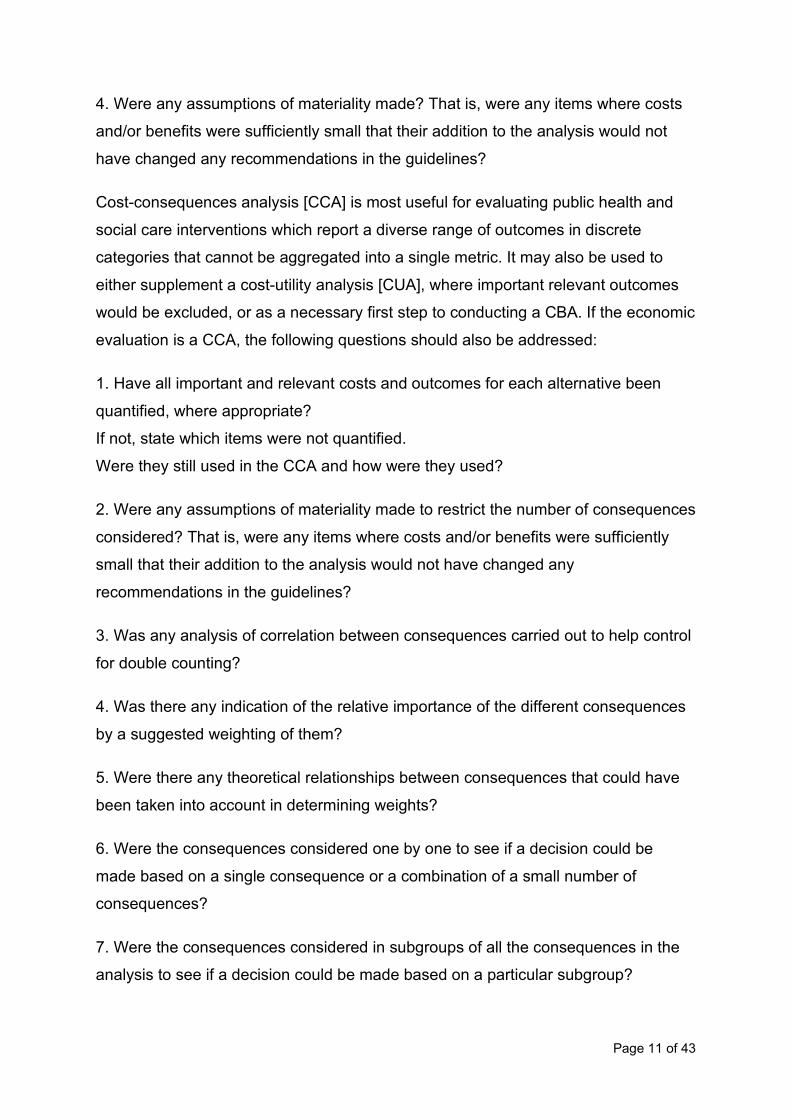
4. Were any assumptions of materiality made? That is, were any items where costs
and/or benefits were sufficiently small that their addition to the analysis would not
have changed any recommendations in the guidelines?
Cost-consequences analysis [CCA] is most useful for evaluating public health and
social care interventions which report a diverse range of outcomes in discrete
categories that cannot be aggregated into a single metric. It may also be used to
either supplement a cost-utility analysis [CUA], where important relevant outcomes
would be excluded, or as a necessary first step to conducting a CBA. If the economic
evaluation is a CCA, the following questions should also be addressed:
1. Have all important and relevant costs and outcomes for each alternative been
quantified, where appropriate?
If not, state which items were not quantified.
Were they still used in the CCA and how were they used?
2. Were any assumptions of materiality made to restrict the number of consequences
considered? That is, were any items where costs and/or benefits were sufficiently
small that their addition to the analysis would not have changed any
recommendations in the guidelines?
3. Was any analysis of correlation between consequences carried out to help control
for double counting?
4. Was there any indication of the relative importance of the different consequences
by a suggested weighting of them?
5. Were there any theoretical relationships between consequences that could have
been taken into account in determining weights?
6. Were the consequences considered one by one to see if a decision could be
made based on a single consequence or a combination of a small number of
consequences?
7. Were the consequences considered in subgroups of all the consequences in the
analysis to see if a decision could be made based on a particular subgroup?
Page 12 of 43
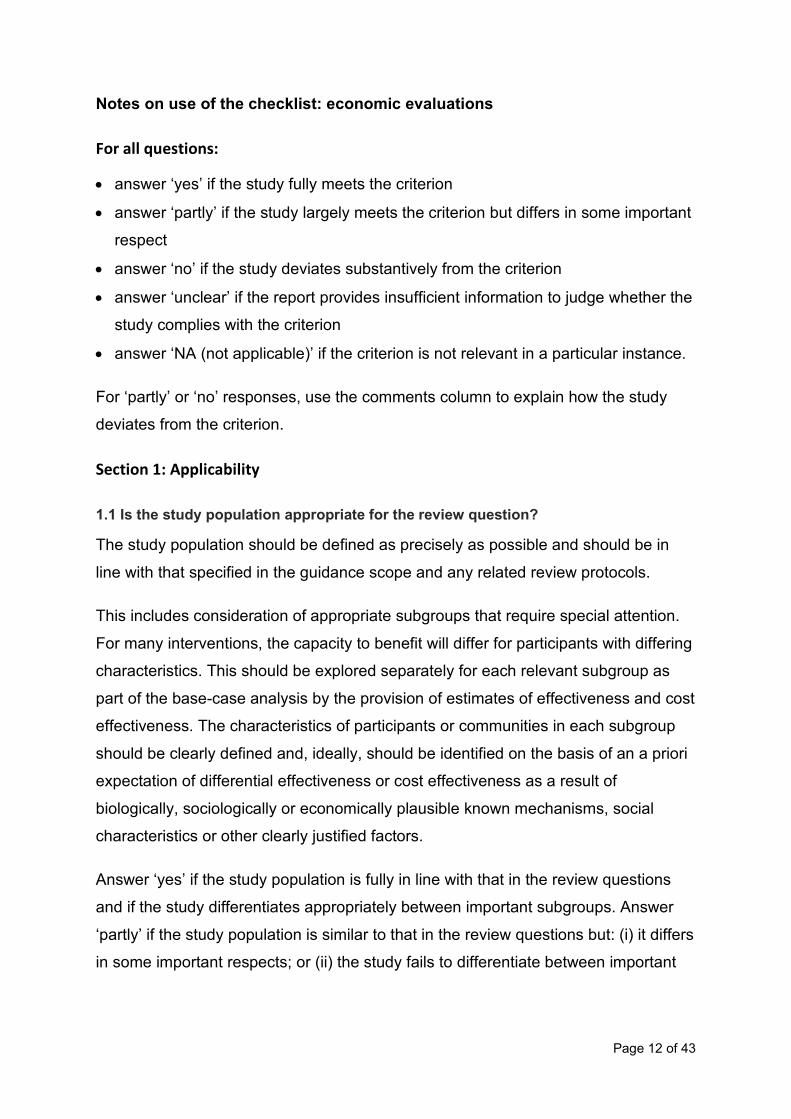
Notes on use of the checklist: economic evaluations
For all questions:
• answer ‘yes’ if the study fully meets the criterion
• answer ‘partly’ if the study largely meets the criterion but differs in some important
respect
• answer ‘no’ if the study deviates substantively from the criterion
• answer ‘unclear’ if the report provides insufficient information to judge whether the
study complies with the criterion
• answer ‘NA (not applicable)’ if the criterion is not relevant in a particular instance.
For ‘partly’ or ‘no’ responses, use the comments column to explain how the study
deviates from the criterion.
Section 1: Applicability
1.1 Is the study population appropriate for the review question?
The study population should be defined as precisely as possible and should be in
line with that specified in the guidance scope and any related review protocols.
This includes consideration of appropriate subgroups that require special attention.
For many interventions, the capacity to benefit will differ for participants with differing
characteristics. This should be explored separately for each relevant subgroup as
part of the base-case analysis by the provision of estimates of effectiveness and cost
effectiveness. The characteristics of participants or communities in each subgroup
should be clearly defined and, ideally, should be identified on the basis of an a priori
expectation of differential effectiveness or cost effectiveness as a result of
biologically, sociologically or economically plausible known mechanisms, social
characteristics or other clearly justified factors.
Answer ‘yes’ if the study population is fully in line with that in the review questions
and if the study differentiates appropriately between important subgroups. Answer
‘partly’ if the study population is similar to that in the review questions but: (i) it differs
in some important respects; or (ii) the study fails to differentiate between important

Page 13 of 43
subgroups. Answer ‘no’ if the study population is substantively different from that in
the review questions.
1.2 Are the interventions/services/programmes appropriate for the review question?
All relevant alternatives should be included, as specified in the guidance scope and
any related review protocols. These should include routine and best practice in UK
settings, existing NICE guidance and other feasible options.
Answer ‘yes’ if the analysis includes all options considered relevant for the review
question, even if it also includes other options that are not relevant. Answer ‘partly’ if
the analysis omits 1 or more relevant options but still contains comparisons likely to
be useful for the guidance. Answer ‘no’ if the analysis does not contain any relevant
comparisons.
1.3 Is the system in which the study was conducted sufficiently similar to the current UK context?
This relates to the overall structure of the system within which the interventions were
delivered. For example, an intervention might be delivered on a residential basis in
one country whereas in the UK it would be provided in the community. This might
significantly influence the use of resources and costs, thus limiting the applicability of
the results to a UK setting. In addition, old UK studies may be severely limited in
terms of their relevance to current practice.
Answer ‘yes’ if the study was conducted within the UK and is sufficiently recent to
reflect current practice. For non-UK or older UK studies, answer ‘partly’ if differences
in the setting are unlikely to substantively change the cost-effectiveness estimates.
Answer ‘no’ if the setting is so different that the results are unlikely to be applicable in
the current UK context.
1.4 Is the perspective for costs appropriate for the review question?
The appropriate perspective will depend on the reference case that is relevant for a
particular guideline or review question (see the chapter of the manual on
incorporating economic evaluation), essentially the decision-making perspective
determines the range of costs that should be included in the analysis. There may
also be some question where consideration of multiple perspectives may be
appropriate, such as for public health interventions delivered across different sectors.

Page 14 of 43
For example, the perspective in the reference case for 'Interventions with health
outcomes funded by the NHS’ is an NHS and PSS perspective. Productivity costs
and costs borne by patients and carers that are not reimbursed by the NHS or PSS
are usually excluded from this reference case (or any other NICE reference case).
Answer ‘yes’ if the perspective used is appropriate for the review question; also
answer ‘yes’ if the study has taken a wider perspective, but the results are presented
in such a way that the cost effectiveness can be calculated from the appropriate
perspective. Answer ‘partly’ if the study has taken a wider or narrower perspective
than that in the appropriate reference case, but the additional/omitted costs are small
in relation to the total expected costs and are considered unlikely to change the cost-
effectiveness result. Answer ‘no’ if the perspective is not appropriate, or the
perspective taken is wider or narrower than that specified in the appropriate
reference case and these costs are considered significant and likely to change cost-
effectiveness.
1.5 Is the perspective for outcomes appropriate for the review question?
The appropriate perspective for outcomes will depend on the reference case that is
relevant for a particular guideline or review question consistent with an objective of
maximising benefits from available public sector resources:
• Interventions funded by the NHS with health outcomes: All direct health effects,
whether for individuals directly affected or, when relevant, other people (often
other family members or carers). Non-health effects: not applicable.
• Interventions funded by the public sector with health and non-health outcomes: All
health effects on individuals. Non-health effects: where deemed appropriate
(decided on case-by-case basis, for example for local government and other non-
health settings).
• Interventions funded by the public sector with a social care focus: Effects on
people for whom services are delivered (people using services and/or carers).
Non-health effects: Capability or social care quality of life measures where an
intervention results in both capability or social care and health outcomes.
There may also be some question where consideration of multiple perspectives for
outcomes may be appropriate where the outcomes of an intervention accrues across
different sectors.

Page 15 of 43
Answer 'yes' if the analysis includes all related effects and excludes non-related
effects (or if such effects can be excluded from the results). Answer 'partly' if the
analysis excludes some related effects or includes some non-related effects but
these are small and unlikely to change the cost-effectiveness results. Answer 'no' if
the analysis excludes significant effects or includes significant non-related effects
that are likely to change the cost-effectiveness results.
1.6 Are all future costs and outcomes discounted appropriately?
The need to discount to a present value is widely accepted in economic evaluation,
although the specific rate is variable across jurisdictions and over time. NICE
considers that it is usually appropriate to discount costs and effects at the same rate.
The annual rate of 3.5%, based on the recommendations of the UK Treasury for the
discounting of costs, should be applied to both costs and effects. Sensitivity analyses
using rates of 1.5% for both costs and effects may be presented alongside the
reference-case analysis, particularly for public health interventions.
Answer ‘yes’ if both costs and effects are discounted at 3.5% per year (or at another
rate considered appropriate). Answer ‘partly’ if costs and effects are discounted at a
rate similar to the rate considered appropriate (for example, costs and effects are
both discounted at 3% per year where the appropriate rate is 3.5% or the
intervention assessed is public health and a discount rate of 1.5% has been applied
to both costs and effects). Answer ‘no’ if costs and/or effects are not discounted, or if
they are discounted at a rate (or rates) different from the rate considered appropriate
(for example, 5% for both costs and effects, or 6% for costs and 1.5% for effects
where the appropriate rate is 3.5%). Note in the comments column what discount
rates have been used. If all costs and effects accrue within a short time (roughly a
year), answer ‘NA’.
1.7 Are QALYs derived using NICE’s preferred methods, or an appropriate social care-related equivalent used as an outcome? If not, describe rationale and outcomes used in line with analytical perspectives taken (item 1.5 above).
The QALY is a measure of a person’s length of life weighted by a valuation of their
health-related quality of life (HRQoL) over that period. For review questions where
the QALY is not be the most appropriate measure of effects, other measures based
on social care-related quality of life or capability may be used.
Page 16 of 43
Answer ‘yes’ if the effectiveness of the intervention is measured using QALYs and
they are derived using EQ-5D administered to people with the condition or receiving
the intervention/comparator with the UK population utility value set applied, or an
appropriate social care-related equivalent; answer 'partly' if the effectiveness of the
intervention is measured using QALYs but derived using methods not in line with
NICE preferred methods; answer ‘no’ if QALYs or a social care-related equivalent
are not used. Use the comments column to describe the measure of effects used.
There may be circumstances when QALYs or a social care-related equivalent
measure cannot be obtained or where the underlying assumptions are considered
inappropriate. In such situations answer ‘no’, but consider retaining the study for
appraisal. Similarly, answer ‘no’ but retain the study for appraisal if it does not
include appropriate measures of effects but is still thought to be useful for Committee
decision-making: for example, if the evidence indicates that an intervention might be
dominant, and estimates of the relative costs of the interventions from a cost-
minimisation study are likely to be useful. When economic evaluations not using
appropriate measures of effects are retained for full critical appraisal, use the
comments column to note why.
1.8 Overall judgement
Classify the applicability of the economic evaluation to the guideline, the current UK
situation and the context for NICE guidance as 1 of the following:
• Directly applicable – the study meets all applicability criteria, or fails to meet 1 or
more applicability criteria but this is unlikely to change the conclusions about cost
effectiveness.
• Partially applicable – the study fails to meet 1 or more of the applicability criteria,
and this could change the conclusions about cost effectiveness.
• Not applicable – the study fails to meet 1 or more of the applicability criteria, and
this is likely to change the conclusions about cost effectiveness. Such studies
would usually be excluded from further consideration and there is no need to
continue with the rest of the checklist.

Page 17 of 43
Section 2: Study limitations
2.1 Does the model structure adequately reflect the nature of the topic under evaluation?
This relates to the choice of model and its structural elements (including cycle length
in discrete time models, if appropriate). Model type and its structural aspects should
be consistent with a coherent theory of the needs under evaluation. The selection of
care pathways, whether individual states or branches in a decision tree, should be
based on the underlying biological, sociological or economic processes of the topic
under study and the potential impact (benefits and adverse consequences) of the
interventions of interest.
Answer ‘yes’ if the model design and assumptions appropriately reflect the condition
and interventions of interest. Answer ‘partly’ if there are aspects of the model design
or assumptions that do not fully reflect the condition or interventions but these are
unlikely to change the cost-effectiveness results. Answer ‘no’ if the model omits
some important aspect of the condition or intervention and this is likely to change the
cost-effectiveness results. Answer ‘NA’ for economic evaluations based on data from
a study which do not extrapolate intervention outcomes or costs beyond the study
context or follow-up period.
2.2 Is the time horizon sufficiently long to reflect all important differences in costs and outcomes?
The time horizon is the period of analysis of the study: the length of follow-up for
participants in a trial-based evaluation, or the period of time over which the costs and
outcomes for a cohort are tracked in a modelling study. This time horizon should
always be the same for costs and outcomes, and should be long enough to include
all relevant costs and outcomes relating to the intervention. A time horizon shorter
than lifetime could be justified if there is no differential mortality effect between
options, and the differences in costs, health/social care-related quality of life or other
relevant outcomes relate to a relatively short period.
Answer ‘yes’ if the time horizon is sufficient to include all relevant costs and
outcomes. Answer ‘partly’ if the time horizon may omit some relevant costs and
outcomes but these are unlikely to change the cost-effectiveness results. Answer

Page 18 of 43
‘no’ if the time horizon omits important costs and outcomes and this is likely to
change the cost-effectiveness results.
2.3 Are all important and relevant outcomes included?
All relevant outcomes should include direct effects relating to harms from the
intervention as well as any potential benefits.
Answer ‘yes’ if the analysis includes all relevant and important harms and benefits.
Answer ‘partly’ if the analysis omits some harms or benefits but these would be
unlikely to change the cost-effectiveness results. Answer ‘no’ if the analysis omits
important harms and/or benefits that would be likely to change the cost-effectiveness
results.
2.4 Are the estimates of baseline outcomes from the best available source?
The sources and methods for eliciting baseline probabilities should be described
clearly. These data can be based on ‘natural history’ (outcomes in the absence of
intervention), sourced from cohort studies. Baseline probabilities may also be
derived from the control arms of experimental studies. Sometimes it may be
necessary to rely on expert opinion for particular parameters.
Answer ‘yes’ if the estimates of baseline outcomes reflect the best available
evidence, for example as identified from a recent well-conducted systematic review
of the literature. Answer ‘partly’ if the estimates are not derived from the best
available estimate but are likely to reflect outcomes for the relevant group of people
in England (for example, if they are derived from a large UK-relevant cohort study).
Answer ‘no’ if the estimates are unlikely to reflect outcomes for the relevant group of
people in England.
2.5 Are the estimates of relative intervention effects from the best available source?
Evidence on outcomes should be obtained from a systematic review with meta-
analysis where appropriate. The best available estimate from the standpoint of
guideline development will usually be one in line with the effectiveness evidence
review undertaken for the guideline.
The methods and assumptions that are used to extrapolate short-term results to final
outcomes should be clearly presented.

Page 19 of 43
Answer ‘yes’ if the estimates of the effect of intervention appropriately reflect all
relevant studies of the best available quality, as identified through a recent well-
conducted systematic review of the literature, that is in line with the effectiveness
evidence review undertaken for the guideline. Answer ‘partly’ if the estimates of the
effect of intervention are not derived from a systematic review but are similar in
magnitude to the best available estimates (for example, if the economic evaluation is
based on a single large study with effects similar to pooled estimates from all
relevant studies). Answer ‘no’ if the estimates of the effect of intervention are likely to
differ substantively from the best available estimates.
2.6 Are all important and relevant costs included?
Costs related to the topic of interest and incurred in additional years of life gained as
a result of intervention should be included in the base-case analysis. Costs that are
considered to be unrelated to the topic or intervention of interest should be excluded.
If introduction of the intervention requires additional infrastructure to be put in place,
consideration should be given to including such costs in the analysis.
Answer ‘yes’ if all important and relevant resource use and costs are included given
the perspective and the research question in the economic study under
consideration. Answer ‘partly’ if some relevant resource items are omitted but these
are unlikely to affect the cost-effectiveness results. Answer ‘no’ if important resource
items are omitted and these are likely to affect the cost-effectiveness results.
2.7 Are the estimates of resource use from the best available source?
It is important to quantify the effect of the interventions on resource use in terms of
physical units (for example, days in care or contacts with practitioners) and valuing
those effects in monetary terms using appropriate prices and unit costs. Evidence on
resource use should be identified systematically. When expert opinion is used as a
source of information, any formal methods used to elicit these data should be clearly
reported.
Answer ‘yes’ if the estimates of resource use appropriately reflect all relevant
evidence sources of the best available quality, as identified through a recent well-
conducted systematic review of the literature. Answer ‘partly’ if the estimates of
resource use are not derived from a systematic review but are similar in magnitude
Page 20 of 43
to the best available estimates. Answer ‘no’ if the estimates of resource use are likely
to differ substantively from the best available estimates.
2.8 Are the unit costs of resources from the best available source?
Resources should be valued using the prices relevant to the agencies that deliver
the interventions. A first point of reference in identifying costs and prices should be
any current official listing published by relevant government departments.
When the acquisition price paid for a resource differs from the public list price, the
public list price should be used in the base-case analysis. Sensitivity analysis should
assess the implications of variations from this price. When cost data are taken from
the literature, the methods used to identify the sources should be defined. When
several alternative sources are available, a justification for the costs chosen should
be provided and discrepancies between the sources explained. When appropriate,
sensitivity analysis should have been undertaken to assess the implications for
results of using alternative data sources.
Answer ‘yes’ if resources are valued using up-to-date prices relevant to the
appropriate sectors. Answer ‘partly’ if the valuations of some resource items differ
from current relevant unit costs but this is unlikely to change the cost-effectiveness
results. Answer ‘no’ if the valuations of some resource items differ substantively from
current relevant unit costs and this is likely to change the cost-effectiveness results.
2.9 Is an appropriate incremental analysis presented or can it be calculated from the data?
An appropriate incremental analysis is one that compares the expected costs and
outcomes of one intervention with the expected costs and outcomes of the next-best
non-dominated alternative.
Standard decision rules should be followed when combining costs and effects, and
should reflect any situation where there is dominance or extended dominance. When
there is a trade-off between costs and effects, the results should be presented as an
incremental cost-effectiveness ratio (ICER): the ratio of the difference in mean costs
to the difference in mean outcomes of a technology or intervention compared with
the next best alternative. Where benefits are expressed as QALYs, in addition to
ICERs, expected net monetary or health benefits can be presented using values
Page 21 of 43
placed on a QALY gained of £20,000 and £30,000. However, it may not be possible
to place such values on other measures of benefits that are used in public health and
social care economic evaluation.
For cost-consequences analyses, appropriate incremental analysis can only be done
by selecting one of the consequences as the primary measure of effectiveness,
providing the consequences are independent of one another.
Answer ‘yes’ if appropriate incremental results are presented, or if data are
presented that allow the reader to calculate the incremental results. Answer ‘no’ if: (i)
simple ratios of costs to effects are presented for each alternative compared with a
standard intervention; or (ii) if options subject to simple or extended dominance are
not excluded from the incremental analyses.
2.10 Are all important parameters whose values are uncertain subjected to appropriate sensitivity analysis?
There are a number of potential selection biases and uncertainties in any evaluation
(trial- or model-based) and these should be identified and quantified where possible.
There are 3 types of bias or uncertainty to consider:
• Structural uncertainty – for example in relation to the categorisation of different
states of capability/wellbeing/health and the representation of different pathways
of care. These structural assumptions should be clearly documented and the
evidence and rationale to support them provided. The impact of structural
uncertainty on estimates of cost effectiveness should be explored by separate
analyses of a representative range of plausible scenarios.
• Source of values to inform parameter estimates – the implications of different
estimates of key parameters (such as estimates of relative effectiveness) must be
reflected in sensitivity analyses (for example, through the inclusion of alternative
scenarios). Inputs must be fully justified, and uncertainty explored by sensitivity
analysis using alternative input values.
• Parameter precision – uncertainty around the mean capability/wellbeing/health
and cost inputs in the model. Distributions should be assigned to characterise the
uncertainty associated with the (precision of) mean parameter values.
Probabilistic sensitivity analysis is preferred, as this enables the uncertainty

Page 22 of 43
associated with parameters to be simultaneously reflected in the results of the
model. In non-linear decision models – when there is not a straight-line
relationship between inputs and outputs of a model (such as Markov models) –
probabilistic methods provide the best estimates of mean costs and outcomes.
Simple decision trees are usually linear. The mean value, distribution around the
mean, and the source and rationale for the supporting evidence should be clearly
described for each parameter included in the model. Evidence about the extent of
correlation between individual parameters should be considered carefully and
reflected in the probabilistic analysis. Assumptions made about the correlations
should be clearly presented.
Answer ‘yes’ if an extensive sensitivity analysis was undertaken that explored all key
uncertainties in the economic evaluation. Answer ‘partly’ if the sensitivity analysis
failed to explore some important uncertainties in the economic evaluation. Answer
‘no’ if the sensitivity analysis was very limited and omitted consideration of a number
of important uncertainties, or if the range of values or distributions around
parameters considered in the sensitivity analysis were not reported.
2.11 Has no potential financial conflict of interest been declared?
The British Medical Journal (BMJ) defines competing interests for its authors as
follows: ‘A competing interest exists when professional judgment concerning a
primary interest (such as patients’ welfare or the validity of research) may be
influenced by a secondary interest (such as financial gain or personal rivalry). It may
arise for the authors of a BMJ article when they have a financial interest that may
influence, probably without their knowing, their interpretation of their results or those
of others.’
Whenever a potential financial conflict of interest is possible, this should be declared.
Answer ‘yes’ if the authors declare that they have no financial conflicts of interest.
Answer ‘no’ if clear financial conflicts of interest are declared or apparent (for
example, from the stated affiliation of the authors). Answer ‘unclear’ if the article
does not indicate whether or not there are financial conflicts of interest.

Page 23 of 43
2.12 Overall assessment
The overall methodological study quality of the economic evaluation should be
classified as 1 of the following:
• Minor limitations – the study meets all quality criteria, or fails to meet 1 or more
quality criteria but this is unlikely to change the conclusions about cost
effectiveness.
• Potentially serious limitations – the study fails to meet 1 or more quality criteria,
and this could change the conclusions about cost effectiveness.
• Very serious limitations – the study fails to meet 1 or more quality criteria, and
this is highly likely to change the conclusions about cost effectiveness.
Supporting references Husereau D, Drummond M, Petrou S, et al. Consolidated health economic
evaluation reporting standards (CHEERS)—Explanation and elaboration: A report of
the ISPOR health economic evaluations publication guidelines good reporting
practices task force. Value Health 2013;16:231-50.
National Institute for Health and Clinical Excellence (2008) Social value judgements:
principles for the development of NICE guidance (second edition). London: National
Institute for Health and Clinical Excellence
Philips Z, Ginnelly L, Sculpher M et al. (2004) Review of guidelines for good practice
in decision-analytic modelling in health technology assessment. Health Technology
Assessment 8 (36)
Evers, S, Goossens M, de Vet H et al. (2005) Criteria list for assessment of
methodological quality of economic evaluations: consensus on health economic
criteria. International Journal of Technology Assessment in Health Care 21: 240–5
Page 24 of 43
Appraisal checklists: generic There may be some reviews where it is not helpful to use different checklists for the
different study designs (for example, in a complex mixed methods review). In such
cases, a single checklist that can be applied to different study designs may be used.
Shepherd J, Kavanagh J, Picot J et al. (2010) The effectiveness and cost-
effectiveness of behavioural interventions for the prevention of sexually transmitted
infections in young people aged 13–19: a systematic review and economic
evaluation. Health Technol Assess 14(7) Appendix 5
Taylor BJ, Dempster M, Donnelly M (2007) Grading gems: appraising the quality of
research for social work and social care. British Journal of Social Work 37: 335
Examples of evidence tables This section includes examples of evidence tables for those study designs that are
expected to be used in the evidence reviews for NICE guidelines.
Below are examples of the type of information and data NICE requires in table
format in evidence reviews. It is not possible to provide a fixed template for all
evidence tables that will suit all topics or that can be produced by different evidence
management software. The range, type, quantity and quality of evidence identified
will inevitably vary and these tables are presented as examples only of how
information and data should be presented.
If additional analysis or additional calculation (e.g. calculating numbers needed to
treat, odds ratios, risk ratios) of data is required and feasible, these must be clearly
noted as ‘calculated by the review team’.
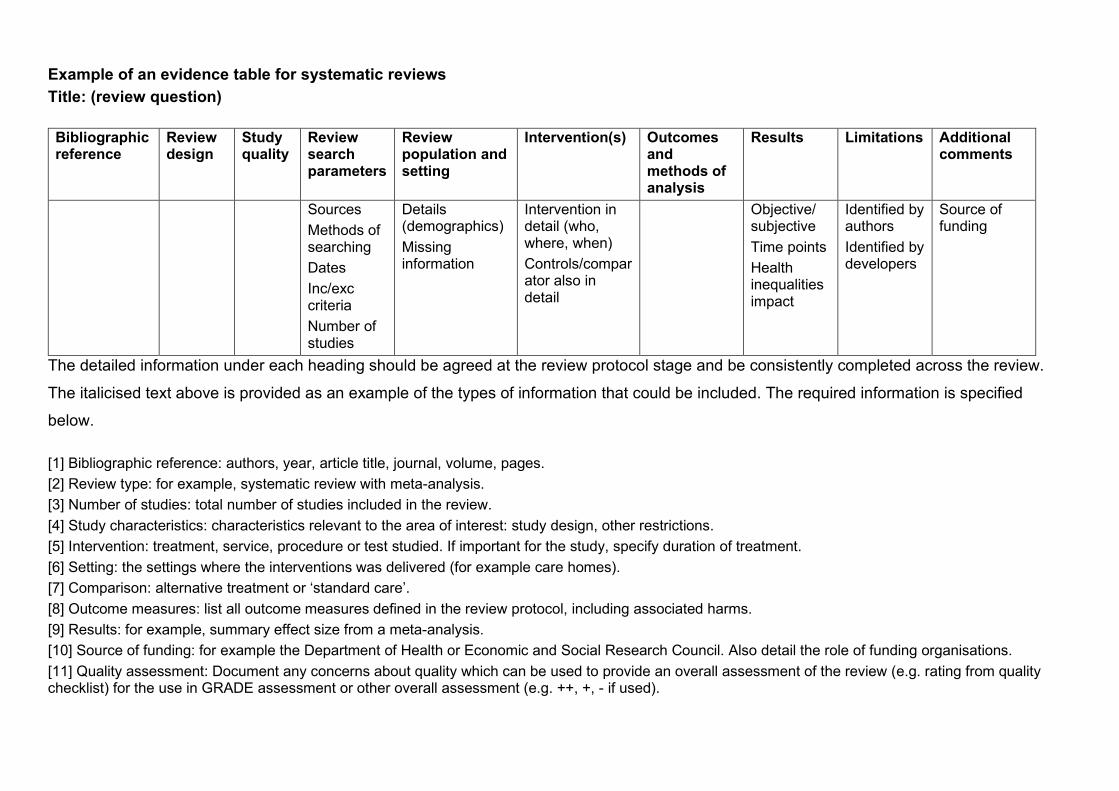
Example of an evidence table for systematic reviews Title: (review question)
Bibliographic reference
Review design
Study quality
Review search parameters
Review population and setting
Intervention(s) Outcomes and methods of analysis
Results Limitations Additional comments
Sources Methods of searching Dates Inc/exc criteria Number of studies
Details (demographics) Missing information
Intervention in detail (who, where, when) Controls/comparator also in detail
Objective/ subjective Time points Health inequalities impact
Identified by authors Identified by developers
Source of funding
The detailed information under each heading should be agreed at the review protocol stage and be consistently completed across the review.
The italicised text above is provided as an example of the types of information that could be included. The required information is specified
below.
[1] Bibliographic reference: authors, year, article title, journal, volume, pages. [2] Review type: for example, systematic review with meta-analysis. [3] Number of studies: total number of studies included in the review. [4] Study characteristics: characteristics relevant to the area of interest: study design, other restrictions. [5] Intervention: treatment, service, procedure or test studied. If important for the study, specify duration of treatment. [6] Setting: the settings where the interventions was delivered (for example care homes). [7] Comparison: alternative treatment or ‘standard care’. [8] Outcome measures: list all outcome measures defined in the review protocol, including associated harms. [9] Results: for example, summary effect size from a meta-analysis. [10] Source of funding: for example the Department of Health or Economic and Social Research Council. Also detail the role of funding organisations. [11] Quality assessment: Document any concerns about quality which can be used to provide an overall assessment of the review (e.g. rating from quality checklist) for the use in GRADE assessment or other overall assessment (e.g. ++, +, - if used).

[12] Additional comments: additional characteristics and/or interpretations of the review that the reviewer wishes to record. These might include important flaws and limitations in the review not identifiable from other data in the table, and additional questions or issues that will need to be considered but do not figure in the results tables in the review

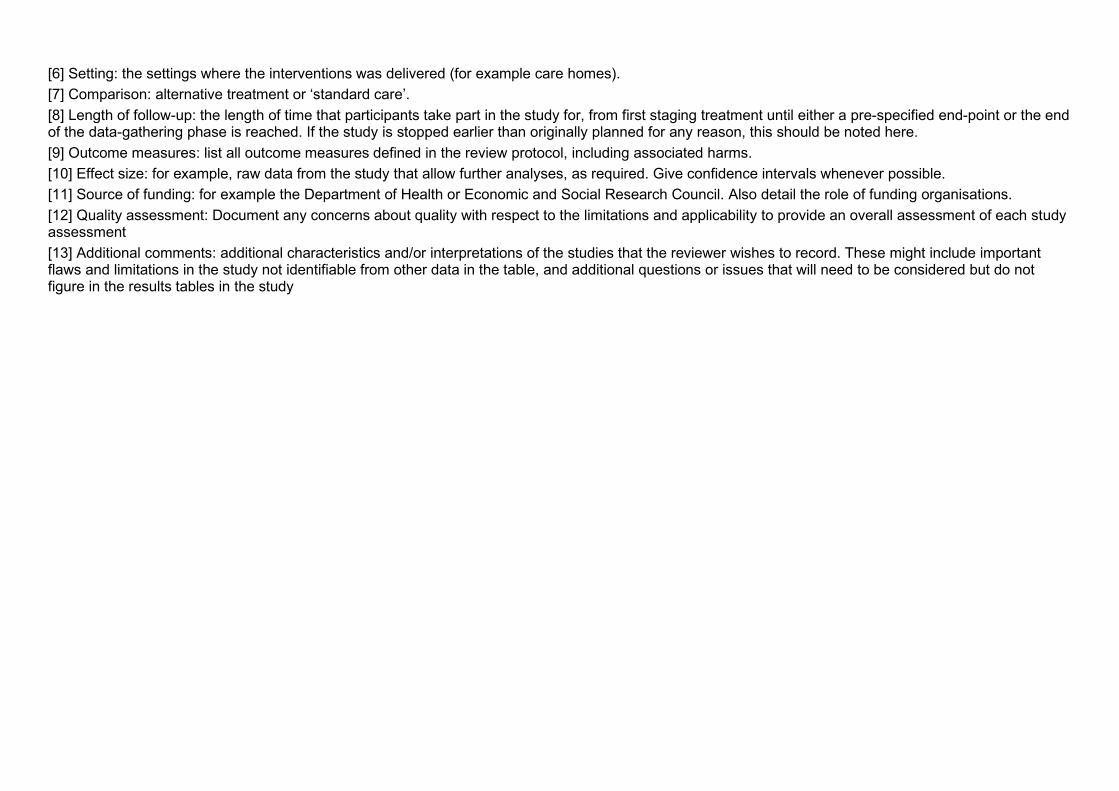
Example of an evidence table for intervention studies Title: (review question)
Bibliographic reference
Study type
Study quality
Intervention
Comparator
Method of allocation
Setting
Number of participants
Participant characteristics
Length of follow-up
Methods of analysis
Outcomes/Results
Limitations
Additional comments
Intervention in detail (who, where, when)
Methods use to minimize confounders
Country Location
Power information Method of recruitment
Information on representativeness
Loss to follow-up
ITT or completer Adjustments for baseline differences
Objective/ subjective Time points Health inequalities impact
Identified by authors Identified by developers
Evidence gaps Further research identified
The detailed information under each heading should be agreed at the review protocol stage and be consistently completed across the review.
The italicised text above is provided as an example of the types of information that could be included. The required information is specified
below.
[1] Bibliographic reference: authors, year, article title, journal, volume, pages. [2] Study type: for example, randomised controlled trial, cohort or case-control studies. [3] Number of participants: total number of participants included in the study, including number of participants in each arm, with inclusion and exclusion criteria. Also record the numbers of participants who started and completed the study. [4] Participant characteristics: characteristics relevant to the area of interest: age, sex, ethnic origin, condition status and comorbidity. [5] Intervention: treatment, service, procedure or test studied. If important for the study, specify duration of treatment. [6] Setting: the settings where the interventions was delivered (for example care homes). [7] Comparison: alternative treatment or ‘standard care’. [8] Length of follow-up: the length of time that participants take part in the study for, from first staging treatment until either a pre-specified end-point or the end of the data-gathering phase is reached. If the study is stopped earlier than originally planned for any reason, this should be noted here. [9] Outcome measures: list all outcome measures defined in the review protocol, including associated harms. [10] Effect size: for example, raw data from the study that allow further analyses, as required. Give confidence intervals whenever possible.

[11] Source of funding: for example the Department of Health or Economic and Social Research Council. Also detail the role of funding organisations. [12] Quality assessment: Document any concerns about quality which can be used to provide an overall assessment of each study (e.g. rating from quality checklist) for use in GRADE assessment [13] Additional comments: additional characteristics and/or interpretations of the studies that the reviewer wishes to record. These might include important flaws and limitations in the study not identifiable from other data in the table, and additional questions or issues that will need to be considered but do not figure in the results tables in the study

Example of an evidence table for studies of diagnostic test accuracy Title: (review question)
Bibliographic reference
Study type
Study quality
Type of test (index test)
Reference standard
Number of participants
Prevalence Participant characteristics
Sensitivity and specificity or raw data for 2x2 table
Other metrics: Positive and negative likelihood ratios and/or Positive and negative predictive values
Additional comments
The detailed information under each heading should be agreed at the review protocol stage and be consistently completed across the review.
The italicised text above is provided as an example of the types of information that could be included. The required information is specified
below.
[1] Bibliographic reference: authors, year, article title, journal, volume, pages. [2] Study type: for example, cross-sectional, cohort or case–control studies. [3] Study quality: note particular strengths and weaknesses. [4] Number of participants: total number of patients included in the study, with inclusion and exclusion criteria. [5] Prevalence: proportion of people with the disease in the population at risk. [6] Participant characteristics: characteristics relevant to the area of interest: age, sex, ethnic origin, comorbidity, disease status, community- or hospital-based. [7] Type of test (index test): description of the diagnostic test used in the study. Specify the test threshold where applicable. [8] Reference standard: used as a measure of outcome. Specify if it is a ‘gold standard’ or ‘current best practice’. [9] Sensitivity: proportion of individuals classified as positive by the gold (or reference) standard who are correctly identified by the study test. Specificity: proportion of individuals classified as negative by the gold (or reference) standard who are correctly identified by the study test.

Raw data for 2x2 table: study data collected from tests to calculate sensitivity, specificity, positive and negative likelihood ratios, and positive and
negative predictive values (see example table)
Example of a 2x2 table
Disease or outcome Present Absent Test + a (true positive) b (false positive)
− c (false negative) d (true negative) [10] Positive likelihood ratio: the likelihood of having the disease, as opposed to not having the disease, having tested positive for it (an estimate of the amount by which a positive test result increases the probability of actually having the disease that was tested for). Negative likelihood ratio: the likelihood of having the disease, as opposed to not having the disease, having tested negative for it (an estimate of the amount by which a negative test result decreases the probability of having the disease that was tested for). [11] Positive predictive value: proportion of individuals with a positive test result who actually have the disease. Negative predictive value: proportion of individuals with a negative test result who do not have the disease. [12] Source of funding: government funding (for example, NHS), voluntary/charity (for example, Wellcome Trust), pharmaceutical company; and the role of funding organisations. [13] Quality assessment: Document any concerns about quality which can be used to provide an overall assessment of each study (e.g. QUADAS-2) for use in GRADE/modified GRADE assessment [14] Additional comments: additional characteristics and/or interpretations of the studies that the reviewer wishes to record. These might include important flaws in the study not identifiable from other data in the table, and additional questions or issues that will need to be considered but do not figure in the results tables in the study (for example, if a test is one of a sequence of tests; if its utility was determined).

Example of an evidence table for prognostic studies or prediction rule/model for prognosis or diagnosis Title: (review question)
Bibliographic reference
Study type
Study quality
Prognostic factor(s) or risk factor(s) or sign(s)/symptom(s)
Number of participants
Participant characteristics
Length of follow-up
Outcome measures
Results Additional comments
The detailed information under each heading should be agreed at the review protocol stage and be consistently completed across the review.
The italicised text above is provided as an example of the types of information that could be included. The required information is specified
below.
[1] Bibliographic reference: authors, year, article title, journal, volume, pages. [2] Study type: for example, cohort, nested cohort, case series. [3] Study quality: note particular strengths and weaknesses. [4] Number of participants: total number of patients included in the study, including number and proportion of patients with prognostic factors or risk factor(s), or sign(s) and symptom(s), with inclusion and exclusion criteria. Also record numbers of patients who started and completed the study. [5] Participant characteristics: characteristics relevant to the area of interest: age, sex, ethnic origin, comorbidity, disease status, community- or hospital-based. Include method used to select participants. [6] Prognostic factors or risk factor(s) or sign(s)/symptom(s): include details of method of measurement. [7] Length of follow-up: the length of time that patients take part in the study for, from entry until either a pre-specified end-point (for example, death, specified length of disease-free remission) or the end of the data-gathering phase is reached. If the study is stopped earlier than originally planned for any reason, this should be noted here. [8] Outcome measures: all outcome measures should be listed, with each on a separate line. [9] Results: odds ratio or adjusted odds ratio or relative risk or hazard ratio associated with the prognostic factor of interest or risk factor(s) or sign(s)/symptom(s), absolute risk of event in baseline group; time-to-event analysis. For clinical prediction rule/model for diagnosis results may be reported as accuracy metrics (e.g. sensitivity, specificity, +LR, -LR, PPV, NPV, etc.). [10] Source of funding: government funding (for example, NHS), voluntary/charity (for example, Wellcome Trust), pharmaceutical company; and the role of funding organisations. [11] Quality assessment: Document any concerns about quality which can be used to provide an overall assessment of each study (e.g. rating from quality checklist) for use in GRADE/modified GRADE assessment

[12] Additional comments: additional characteristics and/or interpretations of the studies that the reviewer wishes to record. These might include important flaws in the study not identifiable from other data in the table, and additional questions or issues that will need to be considered but do not figure in the results tables in the study.

Example of an evidence table for qualitative studies Title: (review question)
Reference Research parameters Population Results Limitations Additional comments Bibliographic
reference Study quality
Research question
Theoretical approach
Data collection
Method and process of analysis
Population and sample collection
Key themes
Quotes, where helpful or illustrative
The detailed information under each heading should be agreed at the review protocol stage and be consistently completed across the review.
The italicised text above is provided as an example of the types of information that could be included. The required information is specified
below.
[1] Bibliographic reference: authors, year, article title, journal, volume, pages. [2] Research question: what were the research questions? [3] Theoretical approach: what theoretical approach (for example, grounded theory, interpretive phenomenological analysis) does the study take (if specified)? [4] Data collection: how were the data collected? Give details of: • methods • by whom • when.
[5] Method and process of analysis: what methods were used to analyse the data (for example, constant comparative method)? [6] Population and sample collection: what population was the sample recruited from? Include the following information: • how they were recruited (for example, specify the type of purposive sampling) • how many participants were recruited • specific exclusion criteria • specific inclusion criteria.
[7] Settings: The settings where the qualitative study was undertaken. [8] Key themes: list all relevant to this review (with illustrative quotes if available).

[9] Source of funding: for example the Department of Health or Economic and Social Research Council, and the role of funding organisations. [10] Quality assessment: Document any concerns about quality which can be used to provide an overall assessment of each study (e.g. rating from quality checklist) for use in CERQual assessment. [11] Limitations: both those identified by the authors and those identified by the reviewer. [12] Evidence gap and/or recommendations for future research.

Example of an evidence table for economic evaluation studies
Bibliographic reference
Study type
Study quality
Setting Intervention
Comparator
Number of participants
Participant characteristics
Methods of analysis
Results Limitations
Additional comments
Applicability
Country Setting Location
Intervention in detail (who, where, when)
As for intervention
Source population
Type of economic analysis Data sources Time horizon Discount rates Perspective Measures of uncertainty
Objective/ subjective Time points Health inequalities impact Primary results Secondary analysis Modelling method
Identified by authors Identified by developers
Source of funding Evidence gaps Further research identified
The detailed information under each heading should be agreed at the review protocol stage and be consistently completed across the review.
The italicised text above is provided as an example of the types of information that could be included. The required information is specified
below.
Please complete for all headings and note where data is ‘Not reported’ or ‘Not applicable’.
[1] Bibliographic reference: authors, year, article title, journal, volume, pages. [2] Study type: for example, randomised controlled trial with economic evaluation. [3] Number of participants: total number of participants included in the study, including number of participants in each arm, with inclusion and exclusion criteria. Also record the numbers of participants who started and completed the study. [4] Participant characteristics: characteristics relevant to the area of interest: age, sex, ethnic origin, condition status and comorbidity. [5] Intervention: treatment, service, procedure or test studied. If important for the study, specify duration of treatment.
[6] Setting: the settings where the interventions was delivered (for example care homes). [7] Comparison: alternative treatment or ‘standard care’. [8] Length of follow-up: the length of time that participants take part in the study for, from first staging treatment until either a pre-specified end-point or the end of the data-gathering phase is reached. If the study is stopped earlier than originally planned for any reason, this should be noted here. [9] Outcome measures: list all outcome measures defined in the review protocol, including associated harms. [10] Effect size: for example, raw data from the study that allow further analyses, as required. Give confidence intervals whenever possible. [11] Source of funding: for example the Department of Health or Economic and Social Research Council. Also detail the role of funding organisations. [12] Quality assessment: Document any concerns about quality with respect to the limitations and applicability to provide an overall assessment of each study assessment [13] Additional comments: additional characteristics and/or interpretations of the studies that the reviewer wishes to record. These might include important flaws and limitations in the study not identifiable from other data in the table, and additional questions or issues that will need to be considered but do not figure in the results tables in the study

GRADE profile and economic evidence profile This aims to give examples of profiles that can be used when developing guidelines. The decision about which information to be included in the
profile should be made as part of the review protocol development. The profile should include features considered important – these may be
study design specific or specific to the topic. As such, additional items may need to be included, or minor modification made. Where this is the
case, this should be documented, agreed with the NICE QA team.
Worked example of a GRADE profile: Review question: Should duloxetine vs placebo be used for painful diabetic neuropathy?
Quality assessment No. of patients Effect Quality Importance No. of
studies
Design Risk of bias
Inconsistency
Indirectness
Imprecision
Other considerations
Duloxetine
Placebo
Relative (95% CI)
Absolute
Patient-reported 30% pain reduction (follow-up 12 weeks) 21 Randomis
ed trials No serious risk of bias
Serious2 No serious indirectness
No serious imprecision
None 220/327 111/215
RR 1.33 (0.95 to 1.88)
17 more per 100 (from 3 fewer to 45 more)
Moderate
Critical
No. of withdrawals due to adverse effects (follow-up 12 weeks) 43 Randomis
ed trials No serious risk of bias
No serious inconsistency
No serious indirectness
No serious imprecision
None 113/906 21/448 RR 2.63 (1.68 to 4.12)
8 more per 100 (from 3 more to 15 more)
High Critical
Dizziness (adverse effects) (follow-up 12 weeks) 36 Randomis
ed trials No serious risk of bias
No serious inconsistency
No serious indirectness
Serious imprecision5
None 90/674 26/332 RR 1.81 (1.17 to 2.79)
6 more per 100 (from 1 more to
Moderate
Critical

14 more)
GI disturbances (adverse effects) (follow-up 12 weeks) 28 Randomis
ed trials No serious risk of bias
No serious inconsistency
No serious indirectness
Serious imprecision5
None 28/332 8/217 RR 2.53 (1.13 to 5.67)
6 more per 100 (from 0 more to 17 more)
Moderate
Important
Any adverse effects (non-specified) (follow-up 12 weeks) 19 Randomis
ed trials No serious risk of bias
No serious inconsistency
No serious indirectness
Very serious imprecision10
None 86/106 78/109 RR 1.13 (0.98 to 1.32)
9 more per 100 (from 1 fewer to 23 more)
Low Critical
1 Gao et al. (2010); Wernicke et al. (2006). 2 Substantial heterogeneity, random-effect model was used. Potential sources of heterogeneity: i) Gao et al. (2010) – ITT data available, used flexible dose between 30 mg and 120 mg, non-pharmaceutical company funded; ii) Wernicke et al. (2006) – only per-protocol data available, combined 2 fixed doses (60 mg and 120 mg), pharmaceutical company funded. 3 Gao et al. (2010); Goldstein et al. (2005); Raskin et al. (2005); Wernicke et al. (2006). 4 Substantial heterogeneity, random-effect model was used. Potential sources of heterogeneity: i) Gao et al. (2010) – used flexible dose between 30 mg and 120 mg, non-pharmaceutical company funded; ii) Goldstein et al. (2005), Raskin et al. (2005) and Wernicke et al. (2006) – combined different fixed doses (20 mg, 60 mg and 120 mg), pharmaceutical company funded. 5 Confidence interval crossed 1 end of default MID. 6Gao et al. (2010); Goldstein et al. (2005); Wernicke et al. (2006). 7 Gao et al. (2010); Goldstein et al. (2005). 8 Gao et al. (2010); Wernicke et al. (2006). 9 Gao et al. (2010). 10 Confidence interval crossed both ends of default MID. Abbreviations: CI, confidence interval; GI, gastrointestinal; ITT, intention to treat; MID, minimal important difference; RR, relative risk.

Example of an uncompleted GRADE profile
Quality assessment No. of patients
Effect Quality Importance
No of studies
Design Risk of bias
Inconsistency Indirectness Imprecision Other considerations
. . Relative (95% CI)
Absolute
X X X X X X [References, abbreviations and other footnotes].
Example of an uncompleted CERQual evidence profile
Summary of review finding (theme)
Studies contributing to the review finding
Methodological limitations
Coherence Adequacy Relevance CERQual assessment of confidence in the evidence
Explanation of CERQual assessment
Finding 1 Finding 2 Finding 3 [References, abbreviations and other footnotes].

Worked example of an economic evidence profile Adapted from Crohn’s disease: management in adults, children and young people (NICE clinical guideline 152).
Systematic review of economic evaluations of budesonide for maintenance of remission in Crohn’s disease
Study Limitations Applicability Other comments
Incremental Uncertainty Costs Effects Cost
effectiveness Noble 1998 Budesonide controlled ileal release versus no maintenance therapy
Potentially serious limitations1,2
Partially applicable3
Study employed a Markov decision-analytic model with a 1-year time horizon
£115 0.017 QALYs5
£6,981 per QALY gained
Incremental cost effectiveness ratio (ICER) decreases significantly if the cost of surgery is increased.
National Clinical Guideline Centre model Oral budesonide versus no maintenance therapy4
Potentially serious limitations2
Directly applicable
Study employed a Markov decision-analytic model with a 2-year time horizon
£4776 £1507
0.012 QALYs6 0.012 QALYs7
£40,392 per QALY gained6 £15,070 per QALY gained7
No treatment most cost-effective option when baseline risk of relapse decreased. In the probabilistic sensitivity analysis (PSA), probability of budesonide being the most cost-effective treatment at willingness-to-pay threshold of £20,000 per QALY gained ranged from 0 to 8%
1 Modelling was undertaken over a short time horizon and no probabilistic sensitivity analysis was conducted. 2 Specific costs and disutilities of drug-related adverse events could not be explicitly modelled. Adverse events were captured by modelling treatment-specific withdrawal rates. This may have overestimated the cost effectiveness of maintenance treatment. 3 The cost-effectiveness model was designed to reflect the management of Crohn’s disease in the Swedish healthcare setting. Although a cost per QALY estimate was reported, it was not based on health-related quality of life values elicited from patients. 4 The NCGC model compared a number of different maintenance treatments. 5 Figures may differ because of rounding off. 6 Conservative 4-line model. Conservative treatment effects were used and people relapsing while on azathioprine maintenance treatment had a different induction sequence. 7 Conservative three-line model. Conservative treatment effects were used and people were assumed to have the same 6 induction sequence regardless of maintenance treatment.

Example of an uncompleted economic evidence profile
Study Limitations Applicability Other comments Incremental Uncertainty Costs Effects Cost effectiveness
.
.
.
.
. [References, abbreviations and other footnotes].

42
Notes on use of economic evidence profiles The economic evidence profile includes columns for the overall assessments of
study limitations and applicability as identified using an appropriate checklist. There
is also a comments column to note particular issues that the Committee should
consider when assessing the economic evidence. Footnotes should be used to
explain the reasons for quality assessments.
The results of the economic evaluations can be presented in the form of a best-
available estimate or range for the incremental cost, the incremental effect and,
where relevant, the incremental cost-effectiveness ratio (ICER) or net benefit
estimate. A summary of the extent of uncertainty about the estimates should also be
presented in the economic evidence profile. This should reflect the results of
deterministic or probabilistic sensitivity analyses or stochastic analyses of trial data,
as appropriate.
Each economic evaluation should usually be presented in a separate row of the
economic evidence profile. If large numbers of economic evaluations of sufficiently
high quality and applicability are available, a single row could be used to summarise
a number of studies based on shared characteristics; this should be explicitly
justified in a footnote.
Inconsistency between the results of economic evaluations will be shown by
differences between rows of the economic evidence profile (a separate column
examining ‘consistency’ is therefore unnecessary). The Committee should consider
the implications of any unexplained differences between model results when
assessing the body of evidence and drawing up recommendations. This includes
clearly explaining the Committee’s preference for certain results when forming
recommendations.
If results are available for 2 or more subgroups, these should be presented in
separate economic evidence profile tables or as separate rows within a single table.
Costs and cost-effectiveness estimates should only be presented for appropriate
incremental comparisons; that is, where an intervention is compared with the next
most expensive non-dominated option. If comparisons are relevant only for some
groups of the population (for example, people who cannot tolerate 1 or more of the

43
other options, or for whom 1 or more of the options is contraindicated), this should be
stated in a footnote to the economic evidence profile.
ISBN: 1-4731-0809-7