Embed Size (px)
Citation preview

Appendix H Acoustics Supporting Information


Joslyn North Mine ProjectAI Project Update Table of Contents
TOTAL E&P Joslyn Ltd. February 2010 Page H-i
Table of Contents
Appendix H Acoustics Supporting Information H1 Assessment Supporting Information............................................................................... H-1
H1.1 Assessment Approach................................................................................... H-1 H1.2 Baseline Case ................................................................................................ H-4 H1.3 Application Case........................................................................................... H-6 H1.4 Permissible Sound Level Calculations........................................................ H-20
H2 Acoustics Baseline ........................................................................................................ H-23 H2.1 Study Objectives ......................................................................................... H-23 H2.2 Noise Monitoring Locations ....................................................................... H-23 H2.3 Methods....................................................................................................... H-25 H2.4 Results......................................................................................................... H-26
H3 References..................................................................................................................... H-39 H3.1 Literature Cited ........................................................................................... H-39
List of Tables
Table H1-1 Developments Included in the Acoustic Assessment ......................................... H-1 Table H1-2 Location of Receptors for Assessment ............................................................... H-2 Table H1-3 Permissible Sound Levels ................................................................................... H-2 Table H1-4 Acoustic Model Configuration Parameters......................................................... H-4 Table H1-5 Daytime and Nighttime ERCB Mandated Ambient Sound Levels .................... H-5 Table H1-6 Daytime and Nighttime Measured Ambient Sound Levels ................................ H-5 Table H1-7 Mine Equipment Sound Sources......................................................................... H-8 Table H1-8 Facility, Ore Preparation Plant and Bird Cannon Sound Sources .................... H-10 Table H1-9 Sound Emission Spectra ................................................................................... H-10 Table H1-10 Spectral Noise Results at Receptors (Project Only) ......................................... H-15 Table H1-11 Sound Source Ranking at R1 (2020) ................................................................ H-16 Table H1-12 Sound Source Ranking at R1 (2033) ................................................................ H-17 Table H1-13 Low Frequency Noise Analysis ........................................................................ H-19 Table H1-14 Permissible Sound Levels at R1 – Trapper Cabin ............................................ H-21 Table H1-15 Permissible Sound Levels at R2 – Fort McKay................................................ H-22 Table H2-1 Noise Monitoring Locations ............................................................................. H-23 Table H2-2 Hourly Noise Levels Recorded at ML1 (August 5 to 6, 2008)......................... H-26 Table H2-3 Hourly Noise Levels Recorded at ML2 (August 5 to 6, 2008)......................... H-29 Table H2-4 Hourly Noise Levels at ML3 (August 6 to 7, 2008) ......................................... H-31 Table H2-5 Hourly Noise Levels at ML3 (August 6 to 7, 2008) ......................................... H-34 Table H2-6 Historical Weather Conditions at ML1 and ML2 (August 5 to 6, 2008).......... H-37 Table H2-7 Historical Weather Conditions at ML3 and ML4 (August 6 to 7, 2008).......... H-38
List of Figures
Figure H1-1 2020 Snapshot Sound Prediction ...................................................................... H-12 Figure H1-2 2033 Snapshot Sound Prediction ...................................................................... H-13 Figure H2-1 Noise Monitoring Locations ............................................................................. H-24

Joslyn North Mine Project Table of Contents AI Project Update
February 2010 TOTAL E&P Joslyn Ltd.Page H-ii
Figure H2-2 One Minute Noise Levels, ML1 ....................................................................... H-28 Figure H2-3 One Minute Noise Levels, ML2 ....................................................................... H-30 Figure H2-4 One Minute Noise Levels, ML3 ....................................................................... H-33 Figure H2-5 One Minute Noise Levels, ML4 ....................................................................... H-36

Joslyn North Mine ProjectAI Project Update Abbreviations
TOTAL E&P Joslyn Ltd. February 2010 Page H-iii
Abbreviations
ASL ambient sound level
CadnaA Computer Aided Noise Attenuation
CNRL Canadian Natural Resources Limited
dBA A-weighted decibel
dBC C-weighted decibel
DDA dedicated disposal area
EBS environmental baseline study
EDA external disposal area
EIA Environmental Impact Assessment
ERCB Energy Resources Conservation Board
Hz hertz (frequency)
ISO International Organization for Standardization
km kilometre
Leq energy equivalent sound level
LFN low-frequency noise
LSA local study area
MRM Muskeg River Mine
MRME Muskeg River Mine Expansion
ML monitoring location
NAD 83 datum for geographic coordinates (supersedes NAD 27, i.e., North American Datum 1927)
OB overburden
OPP ore preparation plant
PDC Planned Development Case
PSL permissible sound level

Joslyn North Mine Project Abbreviations AI Project Update
February 2010 TOTAL E&P Joslyn Ltd.Page H-iv
R1 Receptor 1
R2 Receptor 2
RSA regional study area
SBA sand beach area
UTM universal transverse mercator

Joslyn North Mine ProjectAI Project Update Appendix H: Acoustics Supporting Information
TOTAL E&P Joslyn Ltd. February 2010 Page H-1
H1 Assessment Supporting Information
H1.1 Assessment Approach This appendix includes information on the effects of sound from the project on noise levels at receptors.
H1.1.1 Assessment Cases Sound is considered to have localized effect, as attenuation will diminish sound at distance from a source. Therefore, for the Baseline Case only, other developments within a set distance of the Project Development Area were included in the assessment. The activities that may contribute to noise at receptors are provided in Table H1-1.
Table H1-1 Developments Included in the Acoustic Assessment Scenario Source Treatment in Evaluation
Canadian Natural Resources Limited (CNRL) Horizon Mine
The 2003 CNRL Environmental Impact Assessment (EIA) (CNRL 2003) was not conducted to current Energy Resources Conservation Board (ERCB) standards and therefore is not considered useful for the current assessment. The contribution is discussed qualitatively.
Shell Canada Limited. (Shell) Muskeg River Mine (MRM) and Expansion (MRME)
Results of the MRME EIA (Albian Sands 2005) and MRM operations are included in the existing noise levels used for cumulative analysis.
Baseline Case
Syncrude Aurora North
No public information or noise assessment is available; however, as the mine has been in operation for some time it is considered in the baseline measurements conducted.
Sources listed in the Baseline Case
Predicted noise levels at the receptors from the Baseline Case are used for cumulative analysis. Application
Case Joslyn North Mine Project Predicted noise levels at receptors from the project.
Planned Development Case
There are no planned developments within 5 km of the Project Development Area; therefore, the Planned Development Case (PDC) would be the same as the Application Case.
The Baseline Case assessment assumed a conservative approach by combining Ambient Sound Level (ASLs) as defined in Noise Control Directive 038 (EUB 2007), measurement data for locations already influenced by noise and noise from other approved facilities.
Operations near the project that may result in cumulative noise to receptors, and that were considered in the Baseline Case, are the Horizon Mine, the Aurora North Mine and the Muskeg River Mine and Expansion. However, noise contributions at receptors from the Horizon Mine and the Aurora North Mine cannot be precisely determined. The assessments for both developments were conducted before 2007 using methods that were not current with Directive 038. The MRME noise assessment completed in 2005 is considered to have sufficient information to be compatible with current ERCB methods.
H1.1.2 Receptors The receptor location details for R1 (trapper cabin) and R2 (Fort McKay) are provided in Table H1-2.

Joslyn North Mine Project Appendix H: Acoustics Supporting Information AI Project Update
February 2010 TOTAL E&P Joslyn Ltd.Page H-2
Table H1-2 Location of Receptors for Assessment Site Location Description Easting(a) Northing(a)
R1 Trapper Cabin 455739 6344274
R2 Fort McKay (Community) 461749 6337850
NOTE: (a) UTM NAD83.
H1.1.3 Noise Criteria The ERCB Directive 038 Permissible Sound Levels (PSLs) are summarized in Table H1-3 and are the same as those considered in the 2007 SI Project Update assessment.
Daytime is defined as the period from 7:00 a.m. to 10:00 p.m. and nighttime is defined as the period from 10:00 p.m. to 7:00 a.m. The PSL calculation is shown in Section H1.4.
Table H1-3 Permissible Sound Levels Site Location
Daytime PSL
(dBA) Nighttime PSL
(dBA)
R1 45 40
R2 48 43
ERCB 1.5 km criteria boundary 45 40
The ASL is defined as the value 5 dBA less than the established PSL.
For low frequency noise within the local and regional study areas, the difference between the predicted sound level in C-weighted and A-weighted filter decibels was compared with the 20-dBA guideline described in Directive 038.
H1.1.4 Acoustic Modelling Approach Predictive modelling of sound was conducted using Computer Aided Noise Attenuation (CadnaA), a model based on internationally accepted algorithms for calculating outdoor noise propagation, International Organization for Standardization (ISO) 9613-2:1996 Acoustics - Attenuation of sound during propagation outdoors - Part 2: General method of calculation (ISO 1996). The selected prediction methods, assumptions and limitations are described below.
Model Selection In selecting a prediction model to evaluate noise levels at receptors due to sound emitted from the project, the following key conditions were considered:
• Can the model evaluate the various source types present at the site?
• Can the model predict the necessary environmental noise indicators?
• Does the model have a basis that is scientifically sound, and is in keeping with the current standards regarding environmental sound?
• Is the model suitable to predict noise in accordance with ERCB Directive 038: Noise Control (EUB 2007)?

Joslyn North Mine ProjectAI Project Update Appendix H: Acoustics Supporting Information
TOTAL E&P Joslyn Ltd. February 2010 Page H-3
The CadnaA prediction model developed by DataKustik GmbH was identified as an appropriate model for assessing the noise effects associated with the project. The algorithms used by the model are consistent with ERCB directives and guidelines. The model was used to determine the hourly Leq generated by the project activities at the selected sensitive receptors. It was also used to indicate where noise from the project can occur in the areas surrounding the site, for each key operating scenario.
The model has the capability to simulate emission sources such as roads, railways, airports and industrial facilities, which are represented as a series of point, line and area sources. Each source type can be characterized by entering sound emissions in terms of total sound or as the tonal components of the sound emission. Other parameters such as building dimensions, frequency of use, hours of operation, equipment enclosure noise attenuation ratings, traffic (ground or air) composition and traffic volumes also define the nature of sound emissions. The CadnaA model also accounts for sound attenuation related to meteorological (prevailing wind) conditions, ground cover and physical barriers, either natural (terrain based) or anthropogenic (created by humans).
Acoustic Modelling Limitations The modelling of outdoor sound attenuation is conducted using standard algorithms and assumptions that tend to simplify the acoustic environment. Sound, whether natural or anthropogenic, is normally variable over time. The algorithms and the Leq indicator account for that variability, but do not predict it. The variation of noise over time can be addressed in the CadnaA model in many ways, depending on the sound source being assessed and the level of detail required.
The quality and relevance of predictions from the acoustic model are dependant on the data inputs. For the assessment, sound sources were established with field measurements of similar equipment or vendor sound emission data where available to ensure the accuracy of sources. Where spectral data were not available, typical spectrum data from acoustic literature was used to provide representative data.
The CadnaA model was designed to predict outdoor noise in accordance with International Organization for Standardization (ISO) 9613 (1&2): Attenuation of Sound During Propagation Outdoors (ISO 9613) (ISO 1996) as well as several international and European acoustic standards. The ISO 9613 method will predict noise attenuation to within ±3 dBA. Supplier literature and third-party publications do not verify this level of accuracy for the CadnaA model. To validate that the CadnaA model meets the ISO standard, an independent study (Drew et al. 2005) was completed that verified the model calculates the ISO method correctly and that simulations of outdoor sound levels match field measurements of a known source to within ±3 dBA.
Prediction Confidence Outdoor sound attenuation is modelled using standard algorithms and assumptions that simplify the acoustic environment. Normal variation of noise sources is addressed in the modelling, depending on the sound source being assessed and the level of detail required. Some uncertainty is associated with the establishment of sound power levels (due to variability between individual pieces of equipment of the same make and model) and the accuracy of the instrumentation typically used for precision measurements, as stated in the ANSI S1.43-1997 Standards for Type-1 Instrumentation (ANSI 1997).

Joslyn North Mine Project Appendix H: Acoustics Supporting Information AI Project Update
February 2010 TOTAL E&P Joslyn Ltd.Page H-4
The quality and relevance of predictions from the model is dependent on the data inputs. Sound emissions and site layout data used for the assessment were established with a high level of professional care to ensure the simulations were representative of the project, yet maintained conservatism where project detail was not available.
The CadnaA model used for the assessment predicted sound levels in accordance with ISO 9613 (1&2) (ISO 1996). The ISO 9613 method will predict sound attenuation to within ± 3 dBA for distances up to 1 km.
In general, there is a high degree of confidence that this evaluation is conservative.
Model configuration Table H1-4 lists the configuration of the calculation parameters used to complete acoustic modelling for the project.
Table H1-4 Acoustic Model Configuration Parameters Parameter Model Setting Description/Notes
standards ISO 9613 only all sources and attenuators are treated as required by the cited standard
source directivity bird deterrent cannons vectored towards open water
note the design process is not sufficiently advanced to warrant application of directionality to smaller sources such as building layout and air inlet locations
ground absorption 0.5 project area comprises muskeg and boreal forest
temperature/humidity 10°C/70% relative humidity
average spring/summer/fall condition that allows for the greatest propagation of sound
wind conditions
ISO 9613 – moderate inversion condition plus Cmet wind statistics
the propagation conditions in the ISO standard are valid for wind speeds between 4 and 18 km/h; all points are considered downwind Cmet wind statistics apply an annualized prevailing wind pattern to the downwind calculations
Terrain contour lines 10 m spacing contour lines were incorporated in the model to account for terrain changes during the two modelled mine years
reflections 1 one reflection is taken into account as mirror image sources from reflecting structures (e.g., pre-engineered metal building)
ERCB Directive 038 lists meteorological parameter ranges for acoustic modelling to comply with the above settings. These include temperatures ranging from 0 to 25°C and relative humidity between 70 and 90%. Wind speeds between 5.0 to 7.5 km/h must also be considered. Since the ISO method used for the analysis is valid for all speeds between 4 and 18 km/h, the ERCB wind speed requirement is met. Wind directions and ground cover as noted by ERCB Directive 038 are consistent with site conditions.
H1.2 Baseline Case Directive 038 defines ASLs during the daytime and nighttime periods for rural Alberta through the PSL determination. The presence of heavily travelled roads and/or rail lines, or dwelling density could lead to a higher ASL as defined in the Directive, and therefore to an adjustment to the receptor criteria. However, no adjustment was identified for the receptors in this assessment.
Since the ERCB determined ASL for this assessment is based on the rural or undeveloped background noise level in the absence of regulated development, the pre-industrial sound for the Baseline Case is represented by the ERCB Directive 038 mandated ASL. The

Joslyn North Mine ProjectAI Project Update Appendix H: Acoustics Supporting Information
TOTAL E&P Joslyn Ltd. February 2010 Page H-5
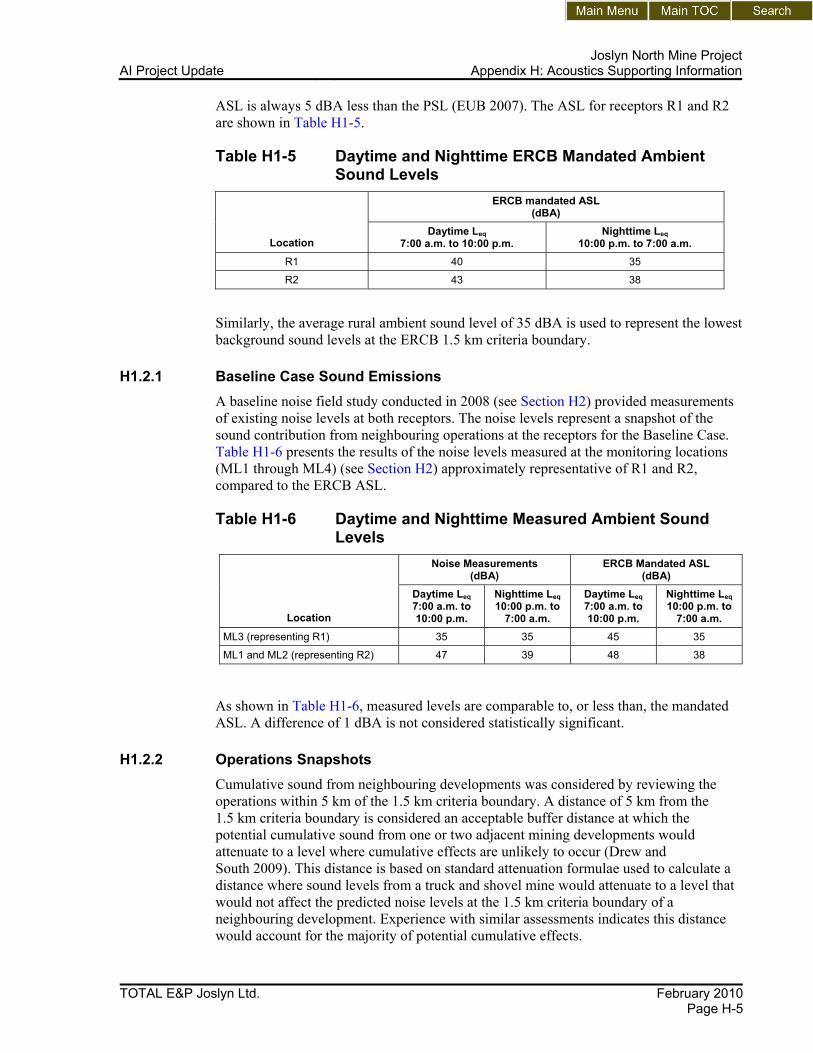
ASL is always 5 dBA less than the PSL (EUB 2007). The ASL for receptors R1 and R2 are shown in Table H1-5.
Table H1-5 Daytime and Nighttime ERCB Mandated Ambient Sound Levels ERCB mandated ASL
(dBA)
Location Daytime Leq
7:00 a.m. to 10:00 p.m. Nighttime Leq
10:00 p.m. to 7:00 a.m. R1 40 35
R2 43 38
Similarly, the average rural ambient sound level of 35 dBA is used to represent the lowest background sound levels at the ERCB 1.5 km criteria boundary.
H1.2.1 Baseline Case Sound Emissions A baseline noise field study conducted in 2008 (see Section H2) provided measurements of existing noise levels at both receptors. The noise levels represent a snapshot of the sound contribution from neighbouring operations at the receptors for the Baseline Case. Table H1-6 presents the results of the noise levels measured at the monitoring locations (ML1 through ML4) (see Section H2) approximately representative of R1 and R2, compared to the ERCB ASL.
Table H1-6 Daytime and Nighttime Measured Ambient Sound Levels Noise Measurements
(dBA) ERCB Mandated ASL
(dBA)
Location
Daytime Leq 7:00 a.m. to 10:00 p.m.
Nighttime Leq 10:00 p.m. to
7:00 a.m.
Daytime Leq 7:00 a.m. to 10:00 p.m.
Nighttime Leq 10:00 p.m. to
7:00 a.m. ML3 (representing R1) 35 35 45 35
ML1 and ML2 (representing R2) 47 39 48 38
As shown in Table H1-6, measured levels are comparable to, or less than, the mandated ASL. A difference of 1 dBA is not considered statistically significant.
H1.2.2 Operations Snapshots Cumulative sound from neighbouring developments was considered by reviewing the operations within 5 km of the 1.5 km criteria boundary. A distance of 5 km from the 1.5 km criteria boundary is considered an acceptable buffer distance at which the potential cumulative sound from one or two adjacent mining developments would attenuate to a level where cumulative effects are unlikely to occur (Drew and South 2009). This distance is based on standard attenuation formulae used to calculate a distance where sound levels from a truck and shovel mine would attenuate to a level that would not affect the predicted noise levels at the 1.5 km criteria boundary of a neighbouring development. Experience with similar assessments indicates this distance would account for the majority of potential cumulative effects.
Joslyn North Mine ProjectAI Project Update Appendix H: Acoustics Supporting Information
TOTAL E&P Joslyn Ltd. February 2010 Page H-5
ASL is always 5 dBA less than the PSL (EUB 2007). The ASL for receptors R1 and R2 are shown in Table H1-5.
Table H1-5 Daytime and Nighttime ERCB Mandated Ambient Sound Levels
ERCB mandated ASL (dBA)
Location Daytime Leq
7:00 a.m. to 10:00 p.m. Nighttime Leq
10:00 p.m. to 7:00 a.m. R1 40 35
R2 43 38
Similarly, the average rural ambient sound level of 35 dBA is used to represent the lowest background sound levels at the ERCB 1.5 km criteria boundary.
H1.2.1 Baseline Case Sound Emissions A baseline noise field study conducted in 2008 (see Section H2) provided measurements of existing noise levels at both receptors. The noise levels represent a snapshot of the sound contribution from neighbouring operations at the receptors for the Baseline Case. Table H1-6 presents the results of the noise levels measured at the monitoring locations (ML1 through ML4) (see Section H2) approximately representative of R1 and R2, compared to the ERCB ASL.
Table H1-6 Daytime and Nighttime Measured Ambient Sound Levels
Noise Measurements (dBA)
ERCB Mandated ASL (dBA)
Location
Daytime Leq 7:00 a.m. to 10:00 p.m.
Nighttime Leq 10:00 p.m. to
7:00 a.m.
Daytime Leq 7:00 a.m. to 10:00 p.m.
Nighttime Leq 10:00 p.m. to
7:00 a.m. ML3 (representing R1) 35 35 45 35
ML1 and ML2 (representing R2) 47 39 48 38
As shown in Table H1-6, measured levels are comparable to, or less than, the mandated ASL. A difference of 1 dBA is not considered statistically significant.
H1.2.2 Operations Snapshots Cumulative sound from neighbouring developments was considered by reviewing the operations within 5 km of the 1.5 km criteria boundary. A distance of 5 km from the 1.5 km criteria boundary is considered an acceptable buffer distance at which the potential cumulative sound from one or two adjacent mining developments would attenuate to a level where cumulative effects are unlikely to occur (Drew and South 2009). This distance is based on standard attenuation formulae used to calculate a distance where sound levels from a truck and shovel mine would attenuate to a level that would not affect the predicted noise levels at the 1.5 km criteria boundary of a neighbouring development. Experience with similar assessments indicates this distance would account for the majority of potential cumulative effects.

Joslyn North Mine ProjectAI Project Update Appendix H: Acoustics Supporting Information
TOTAL E&P Joslyn Ltd. February 2010 Page H-7
At the time of this evaluation, the plant site was designed to a preliminary level; the site location, and the specification for the major areas and equipment listing within the plant site had been outlined, but the detailed engineering and equipment design parameters (i.e., power rating, capacity, run speed) were not available. The sound power from the plant was determined based on the operations from similar developments.
Major plant areas considered were:
• centrifuge plant • substation • cogeneration plant • water treatment • tank farm • froth treatment • froth production • tailings

Joslyn North Mine Project Appendix H: Acoustics Supporting Information AI Project Update
February 2010 TOTAL E&P Joslyn Ltd.Page H-8
Table H1-7 Mine Equipment Sound Sources
Item
Equipment
Model(a)
2020 Quantity
2020 Fleet Allocation
2033 Quantity
2030 Fleet Allocation
Model Source Type
Sound Power Level(b) (dBA)
Reference
1 Cable shovel Bucyrus International 495HF 6 Mine Pit (4x), OB Prestripping
(2x) 7 Mine Pit (7x) area 124 (c)
2 Hydraulic shovel Hitachi EX8000 3 Mine Pit (2x), OB Prestripping (1x) 3 Mine Pit (3x) area 125 (c)
3 Loader CAT 992G 1 OB stockpile and OPP/mine maintenance and extraction areas
1 OB stockpile and OPP/mine maintenance and extraction areas
point 113 (d)
4 Large haul trucks CAT 797 42
between Mine Pit and Crusher (30x) between Mine Pit and EDA_C (3x) between Mine Pit and DDA1 (6x) between OB Prestripping and DDA1 (3x)
30
between Mine Pit and Crusher (24x) between Mine Pit and In pit dumps (2x) between Mine Pit and in pit dumps (2x) between Mine Pit and SBA 2 (2x)
line 118 (loaded) 121 (unloaded)
(c)
5 Haul trucks CAT 777D 2 between OB Prestripping and EDA_C (2x) 2 between OB prestrip and inpit
dumps (2x) line 109 (e)
6 Grader CAT 24H 7 Along haul road 6 Along haul road line 106 (e)
7 Grader CAT 16H 2 between DDA1 and Pond1 (2x) 2 between DDA2 and Pond2 (2x) point 103 (e)
8 Dozer CAT D11 11 Mine Pit (3x), EDA_C (2x), SBA (2x), DDA1 (2x), Pond1 (2x) 11 Mine Pit (7x), SBA (2x),
Pond1 (2x) area 116 (e)
9 Dozer CAT D10 4 EDA_C (1x), SBA (2x), DDA1 (1x) 3 SBA (1x) In pit dumps (2x) area 120 (e)
10 Dozer CAT D8 2 Pond 1 (1x), SBA 91x) 2 Pond 2 (2x) area 108 (f)
11 Rubber tired dozer CAT 844 3 Mine Pit (3x) 3 Mine Pit (3x) area 113 (f)
12 Backhoe Hitachi1100 1 Mine Pit (1x) 1 Mine Pit (1x) area 112 (f)
13 Backhoe CAT 385B 5 Mine Pit (5x) 5 Mine Pit (5x) area 112 (f)
14 Backhoe CAT 335 3 Along haul road (3x) 3 Along haul road (3x) point 108 (f)
15 Cable reeler CAT 988H 2 Mine Pit (2x) 2 Mine Pit (2x) area 118 (f)
16 Pipe handler CAT 583R 2 Pond 1 (1x), SBA1 (1x) 2 Pond2 (1x) DDA2 (1x) area 106 (g)
17 Water truck CAT 793 3 Along haul road (3x) 2 line 116 (g),(h)
18 Tow truck CAT 793 1 Along haul road (1x) 1 Along haul road (1x) line 116 (g),(h)
19 Float truck CAT 784 1 Along haul road (1x) 1 Along haul road (1x) line 116 (g),(h)
20 Scrappers CAT 637G 4 OB Prestripping (4x) 4 Mine Pit (2x) OB prestrip (2x) area 116 (d)

Joslyn North Mine ProjectAI Project Update Appendix H: Acoustics Supporting Information
TOTAL E&P Joslyn Ltd. February 2010 Page H-9
Table H1-7 Mine Equipment Sound Sources (cont’d)
Item
Equipment
Model(a)
2020 Quantity
2020 Fleet Allocation
2033 Quantity
2030 Fleet Allocation
Model Source Type
Sound Power Level(b) (dBA)
Reference
21 Side boom for tailings pipes CAT 583R 2 Pond 1 (1x), SBA1 (1x) 2 Pond 2 (1x), SBA2 (1x) area 106 (g)
22 Compactor CAT 825G 2 SBA (1x) and EDA_C (1x) 1 SBA and inpit dumps (1x) area 110 (i),(j)
NOTES: (a) Brands used for modelling purposes only. (b) Sound power level as per equipment description in source column. (c) Shell (2008). (d) EPCOR (2001). (e) Golder mine equipment noise measurement database. (f) TransAlta (2007). (g) Total (2007). (h) Herring Storer Acoustics (2005). (i) ERM (2008). (j) Hegley Acoustic Consultants (2007). OB – overburden. OPP – ore preparation plant. EDA – external disposal area. DDA – dedicated disposal area. SBA – sand beaching area.

Joslyn North Mine Project Appendix H: Acoustics Supporting Information AI Project Update
February 2010 TOTAL E&P Joslyn Ltd.Page H-10
Table H1-8 Facility, Ore Preparation Plant and Bird Cannon Sound Sources
Item
Equipment
Quantity
Model Source Type
Sound Power Level(a)
(dBA) Reference
23 CoGen (2x) 7EAs 1 area 113 (b)
24 Water treatment/utilities 1 area 117 (b)
25 Tank farm 1 area 113 (b)
26 Froth treatment 1 area 123 (b)
27 Froth production and tailings 1 area 117 (b)
28 Ore preparation plant (OPP) 1 area 121 (b)
29 Centrifuge plant 1 area 117 (b)
30 Water inlet pump station 2 point 76 (c)
31 Bird deterrent cannon 30 point 123 (d)
32 Crusher 1 point 118 (c)
NOTES: (a) Sound power level as per equipment description in source column. (b) Noise emission based on the sound power level of a similar mine facility. (c) Beranek and Ver (1992). (d) Fraser et al. (1998). dBA - “A-weighted” decibels.
Table H1-9 Sound Emission Spectra Octave Band Centre Frequency (Hz),
Sound Levels in dB Item
Emission ID(a)
31.5 63 125 250 500 1,000 2,000 4,000 8,000 (dB) (dBA)
1 Cable shovel Bucyrus International 495HF
120 122 122 115 117 119 121 102 86 129 124
2 Hydraulic shovel Hitachi EX8000 121 124 128 127 121 120 115 106 99 132 125
3 Loader CAT 992G 102 104 118 116 107 106 105 98 90 121 113
4 Large haul trucks CAT 797 (loaded) 121 125 124 119 114 112 108 105 102 129 118
4 Large haul trucks CAT 797 (unloaded) 126 126 126 123 116 115 113 111 109 132 121
5 Haul trucks CAT 777D 106 110 117 108 103 103 101 98 93 119 109
6 Grader CAT 24H 92 104 108 103 102 102 99 94 86 112 106
7 Grader CAT 16H 89 101 105 100 99 99 96 91 83 109 103
8 Dozer CAT D11 108 107 116 117 115 110 105 99 93 122 116
9 Dozer CAT D10 108 117 127 119 119 113 109 104 105 129 120
10 Dozer CAT D8 95 98 116 107 104 102 100 94 85 117 108
11 Rubber tired dozer CAT 844 95 100 116 113 109 109 105 100 92 119 113
12 Backhoe Hitachi1100 105 103 116 106 108 107 105 99 94 118 112
13 Backhoe CAT 385B 104 103 116 106 108 107 105 99 94 118 112
14 Backhoe CAT 335 100 99 112 102 104 103 101 95 90 114 108
15 Cablereeler CAT 988H 103 102 122 113 116 113 110 104 97 124 118

Joslyn North Mine ProjectAI Project Update Appendix H: Acoustics Supporting Information
TOTAL E&P Joslyn Ltd. February 2010 Page H-11
Table H1-9 Sound Emission Spectra (cont’d) Octave Band Centre Frequency (Hz),
Sound Levels in dB Item
Emission ID(a)
31.5 63 125 250 500 1,000 2,000 4,000 8,000 (dB) (dBA)
16 Pipehandler CAT 583R 100 103 105 107 99 101 98 96 90 112 106
17 water truck CAT 793 106 108 115 111 112 112 110 104 96 120 116
18 Tow truck CAT 793 106 108 115 111 112 112 110 104 96 120 116
19 Float truck CAT 784 106 108 115 111 112 112 110 104 96 120 116
20 Scrappers CAT 637G 115 106 117 116 113 111 109 102 94 122 116
21 Side boom for tailings pipes CAT 583R 100 103 105 107 99 101 98 96 90 112 106
22 Compactor CAT 825G 96 108 112 107 106 106 103 98 90 116 110
23 CoGen (2x) 7EAs 131 130 120 114 110 103 101 99 88 134 113
24 Water treatment/utilities 123 116 113 112 112 110 109 108 109 125 117
25 Tank farm 101 103 104 106 108 108 106 102 99 115 113
26 Froth treatment 126 128 117 117 117 119 117 113 107 131 123
27 Froth production and tailings 120 119 119 116 113 112 110 104 98 126 117
28 Ore prep plant (OPP) 125 125 124 120 118 115 114 110 102 130 121
29 Centrifuge plant 120 119 119 116 113 112 110 104 98 126 117
30 Water inlet pump station 92 92 84 79 74 68 61 52 48 95 76
31 Bird deterrent cannon 114 119 120 119 123 119 113 105 102 127 123
32 Crusher 121 121 121 117 115 112 110 106 97 127 118 NOTES: (a) Brands used for modelling purposes only. dB - Decibel. dBA - “A-weighted” decibels. Hz – Hertz.
H1.3.2 Noise Level Predictions
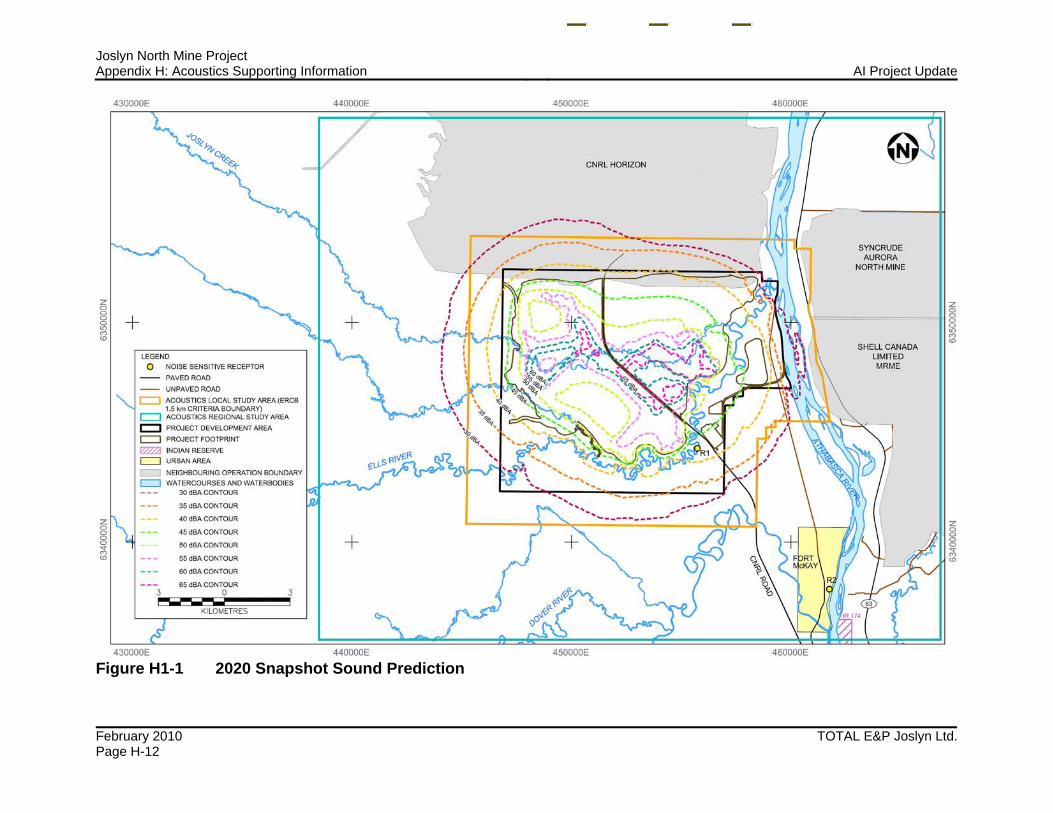
Cumulative Noise Level Predictions at Receptors Maps showing predicted noise level contributions from the project during the two snapshot years (2020 and 2033) modelled are provided in Figures H1-1 and H1-2. The maps show the contribution of sound from the project sources only. Cumulative values for the 1.5 km criteria boundary are further discussed in Section H1.3.3.
Joslyn North Mine Project Appendix H: Acoustics Supporting Information AI Project Update
February 2010 TOTAL E&P Joslyn Ltd.Page H-12
Figure H1-1 2020 Snapshot Sound Prediction

Joslyn North Mine ProjectAI Project Update Appendix H: Acoustics Supporting Information
TOTAL E&P Joslyn Ltd. February 2010 Page H-13
Figure H1-2 2033 Snapshot Sound Prediction

Joslyn North Mine Project Appendix H: Acoustics Supporting Information AI Project Update
February 2010 TOTAL E&P Joslyn Ltd.Page H-14
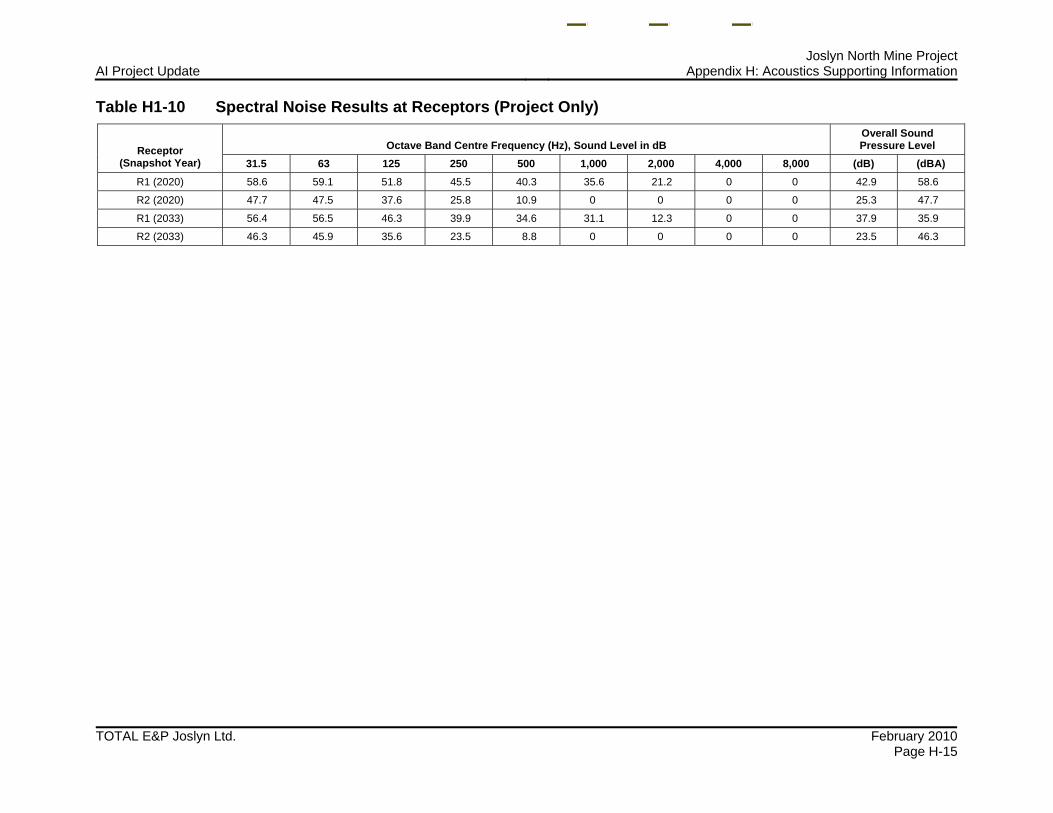
Spectral Model Outputs
Table H1-10 lists the spectral sound results at the boundary receptors for the project.
Sound Contribution Ranking at Receptors Tables H1-11 and H1-12 list the contributing project sound sources at receptor R1 for the snapshots 2020 and 2033. The ranking order is arranged from the most dominant to the least dominant sound contributors. Only the highest 30 contributing sources are included in the tables.
Joslyn North Mine ProjectAI Project Update Appendix H: Acoustics Supporting Information
TOTAL E&P Joslyn Ltd. February 2010 Page H-15
Table H1-10 Spectral Noise Results at Receptors (Project Only)
Octave Band Centre Frequency (Hz), Sound Level in dB Overall Sound Pressure Level Receptor
(Snapshot Year) 31.5 63 125 250 500 1,000 2,000 4,000 8,000 (dB) (dBA) R1 (2020) 58.6 59.1 51.8 45.5 40.3 35.6 21.2 0 0 42.9 58.6
R2 (2020) 47.7 47.5 37.6 25.8 10.9 0 0 0 0 25.3 47.7
R1 (2033) 56.4 56.5 46.3 39.9 34.6 31.1 12.3 0 0 37.9 35.9
R2 (2033) 46.3 45.9 35.6 23.5 8.8 0 0 0 0 23.5 46.3

Joslyn North Mine Project Appendix H: Acoustics Supporting Information AI Project Update
February 2010 TOTAL E&P Joslyn Ltd.Page H-16
Table H1-11 Sound Source Ranking at R1 (2020) Octave Band Centre Frequency (Hz), Sound Level in dB Ranking
Activities
Total Level
(dBA) 31.5 63 125 250 500 1,000 2,000 4,000 8,000 1 EDA 37.3 0 15.5 28.6 29.3 33.6 31.3 21.5 0 0
2 Crusher to pit 35 13.8 26.4 29.3 31 26 23.2 0 0 0
3 Froth treatment 33.2 10.6 25.6 17 23.1 27.2 29.7 12.6 0 0
4 Pit 32.7 4.1 19 25.4 27.7 26.8 25.8 6.6 0 0
5 Pit to crusher 32.3 8.6 25.3 27.1 26.9 23.8 20.1 0 0 0
6 OB stripping 29 2.5 16.6 22.2 24.9 22.5 19.8 0 0 0
7 SBA 28.5 0 11 23.6 22 24 17.7 0 0 0
8 EDA to pit 27.2 5.3 18 21 23.1 18.7 17.5 0.3 0 0
9 DDA1 to pit 27.1 6.2 18.8 21.6 23 17.7 14.5 0 0 0
10 Cogeneration plant 26.2 12 23.9 17.4 17 16.2 9.3 0 0 0
11 Pit to EDA 25.5 0.7 17.6 19.7 20 17.8 15.9 0 0 0
12 Pit to DDA1 24.5 1.2 17.8 19.6 19 15.7 11.5 0 0 0
13 Froth production and tailings 23.8 0.5 12.4 15.8 18.2 18.3 17.1 0 0 0
14 Centrifuge plant 23.5 0.3 12.2 15.5 17.9 17.9 16.6 0 0 0
15 Water float tow truck 23.4 0 4.6 14.6 15.6 19 18.5 0 0 0
16 Water treatment 22.4 4.8 10.7 11.2 16 19.4 18 2 0 0
17 OPP 21.9 42 2.1 14.8 16.5 16.7 16.1 9.9 0 0
18 DDA1 to OB 20.6 1.6 14.3 16.8 17.8 11.7 7.1 0 0 0
19 Tank farm 19.6 0 0 3 10.9 16.4 17.4 1.6 0 0
20 OB to DDA1 16.3 0 13.4 15 14 10.1 4.6 0 0 0
21 OB to EDA_C 22.4 0 3.4 13.4 9.4 6.9 6.7 0 0 0
22 Loader 992 16.1 0 0 10.1 13.4 7 5.4 0 0 0
23 Backhoe 335 16.1 0 0 10 5.8 11.2 11.1 0 0 0
24 Grader 15.9 0 2 9 9 10.4 9.9 0 0 0
25 DDA1 14.5 0 0.9 12.1 8.3 5.9 0 0 0 0
26 Pond 12.1 0 0 6.9 8.6 5.6 0 0 0 0
27 Loader 992 11.9 0 0 6.8 9.3 1.8 0 0 0 0
28 Backhoe 335 7 0 0 3.7 0 1.5 0 0 0 0
29 Bird cannon 3.9 0 0 0 0 1 0 0 0 0
30 Bird cannon 3.9 0 0 0 0 1 0 0 0 0

Joslyn North Mine ProjectAI Project Update Appendix H: Acoustics Supporting Information
TOTAL E&P Joslyn Ltd. February 2010 Page H-17
Table H1-12 Sound Source Ranking at R1 (2033) Octave Band Centre Frequency (Hz), Sound Level in dB
Ranking Activities Total Level
(dBA) 31.5 63 125 250 500 1,000 2,000 4,000 8,000 1 Froth treatment 33.2 10.6 25.6 17 23.1 27.2 29.7 12.6 0 0
2 Crusher to pit 28.8 9.1 21.7 24 24.5 17.7 11.7 0 0 0
3 Pit 27.3 2.2 17 22.9 22.7 19.4 11.9 0 0 0
4 Pit to crusher 26.4 4.1 20.7 22 20.5 15.7 8.7 0 0 0
5 Cogeneration plant 26.2 12 23.9 17.4 17 16.1 9.3 0 0 0
6 Froth production and tailings 23.8 0.5 12.4 15.8 18.2 18.3 17.1 0 0 0
7 Centrifuge plant 23.5 0.3 12.2 15.5 17.9 17.9 16.6 0 0 0
8 Water treatment 23.4 4.8 10.7 11.2 16 19.4 18 2 0 0
9 OPP 22.2 2 14.7 16.3 16.5 15.8 9.6 0 0 0
10 Pond1 20.7 0 0 11.2 16.8 16.6 9.8 0 0 0
11 Tank farm 20.6 0 0 3 10.9 16.4 17.4 1.6 0 0
12 InPit dump to pit 20.5 0 13.6 15.8 16.1 9.1 2.5 0 0 0
13 Loader 18.8 0 0 13 16.1 9.5 7.4 0 0 0
14 SBA2 to pit 18.8 0 11.5 13.9 14.5 7.9 2 0 0 0
15 Pit to Inpit Dump 18.1 0 12.6 13.8 12.1 7.1 0 0 0 0
16 Pit to SBA2 16.3 0 10.5 11.9 10.5 5.9 0 0 0 0
17 Water tow float truck 15.8 0 0.7 10.1 9.7 11.1 6.2 0 0 0
18 Pond 2 14.8 0 0 11 9.7 6.6 4.9 0 0 0
19 Bird cannon 14.5 0 0 1.9 6 12.3 7.1 0 0 0
20 SBA2 14.5 0 0 7.2 11 9.5 0 0 0 0
21 Bird cannon 14.4 0 0 1.9 5.9 12.2 7 0 0 0
22 DDA2 14.3 0 0 5.7 10.8 9.8 1.2 0 0 0
23 Bird cannon 14 0 0 1.5 5.5 11.8 6.4 0 0 0
24 Bird cannon 13.7 0 0 1.4 5.3 11.5 6 0 0 0
25 Bird cannon 13.5 0 0 1.2 5.1 11.3 5.7 0 0 0
26 Bird cannon 13 0 0 0.9 4.8 10.8 5 0 0 0
27 Bird cannon 12.9 0 0 0.9 4.7 10.7 4.9 0 0 0
28 OB 12.5 0 0 7.1 9.1 5.5 0 0 0 0
29 Bird cannon 12.2 0 0 0.4 4.1 10 3.8 0 0 0
30 Bird cannon 12.2 0 0 0.4 4.2 10 3.9 0 0 0
Joslyn North Mine Project Appendix H: Acoustics Supporting Information AI Project Update
February 2010 TOTAL E&P Joslyn Ltd.Page H-18
H1.3.3 Cumulative Effects Along the ERCB 1.5 km Criteria Boundary While cumulative effects from neighbouring operations at the specific receptors R1 and R2 are fully discussed in this update, cumulative effects along the 1.5 km criteria boundary cannot be completely evaluated. Several factors affect the potential to assess the cumulative effects along the criteria boundary:
• availability of data • compatibility of assessment methods • proximity of the neighbouring operation
For the three developments indentified as potentially resulting in cumulative effects outside the project, assessments have been completed. However, only the assessment of sound from the MRME (Albian 2005) was conducted in a manner compatible with Directive 038 methods. The assessment for the Aurora North Mine was conducted to meet to 1994 version of Guide 038. The Horizon Mine assessment was conducted to meet the 1999 version of Guide 038.
The absence of compatible data from the Aurora North Mine is not considered detrimental to the assessment of cumulative effects along the 1.5 km criteria boundary. The Aurora North operation boundary is within the 1.5 km criteria buffer of the project. The effects of one development within another development are not regulated.
There may be potential for cumulative effects at the west edge of the project, where the project 1.5 km criteria boundary meets the 1.5 km criteria boundary of Horizon Mine. The project contribution to noise levels in the “cross-over” area of the 1.5 km boundary is approximately 35 dBA in the 2020 operations snapshot (see Figure H1-1) and 32 dBA in the 2033 snapshot (see Figure H1-2). The Horizon Mine operations were approved under the 1999 version of the noise regulations where compliance with the 1.5 km criteria was not mandatory. Modelling methods used when the assessment was completed in 2002 were not consistent with current approaches and predictions are likely overly conservative. Therefore a direct comparison of the Horizon Mine and project data are not considered practical.
There may also be potential for cumulative effects at the 1.5 km criteria boundary southeast of the project, where the boundary meets the 1.5 km criteria boundary of the MRME. The project contributions in the “cross-over” area of the 1.5 km criteria boundary range from less than 30 dBA in the 2020 snapshot (see Figure H1-1) to 35 dBA in the 2033 snapshot (see Figure H1-2). The MRME was also approved under the 1999 version of the noise regulations when compliance with the 1.5 km criteria was not mandatory. Modelling methods used when the assessment was completed in 2005 were not consistent with current approaches and the predictions are likely overly conservative. Therefore a direct comparison of the MRME and project data are not considered practical.
H1.3.4 Low Frequency Noise Directive 038 recommends that the potential for low frequency noise (LFN) should be evaluated, if data are available. Data regarding the frequency content of project sources has been established either through measurement of similar equipment or empirical formula. This mix of spectral data, while representative of potential overall sound from the site, is not sufficiently detailed for estimation of LFN effects from the project.

Joslyn North Mine ProjectAI Project Update Appendix H: Acoustics Supporting Information
TOTAL E&P Joslyn Ltd. February 2010 Page H-19
Therefore, the potential for LFN will be evaluated during the project detailed design stage of engineering, when vendor-specific data for sources is available.
To evaluate the potential for LFN effects at the identified receptors, the overall sound contributions from the project alone were recalculated with the C weighted filter (see Section H1.3) and compared to the A weighted results as presented in Table H1-13. The results indicate that the difference between the two weightings for both receptors are below the 20 dB guidance set out in Directive 038; hence, there is low potential for LFN contribution for the project at both receptors.
Table H1-13 Low Frequency Noise Analysis
Location
Mine Year Snapshots
Project Sources
(dBA) Project Sources
(dBC)
Difference (dBC – dBA)
(dB) 2020 42.9 56.1 13.2
R1 2033 37.9 56.1 18.2
2020 25.3 42.5 17.2 R2
2033 23.5 42.5 19
In addition to the dBC minus dBA methods described above, the Directive 038 also states that an LFN condition may exist when a clear tonal component exists at a frequency below 250 Hz. Tonal components from the project have not been evaluated, since vendor-supplied or tested spectra for most equipment are not available at this stage of project design. Tonality is defined in Appendix 6 of the Directive 038. During future sound monitoring of the project, LFN and tonal effects will be considered.
H1.3.5 Construction Sound The construction of the mine is integrated with the mining operation itself and therefore has already been considered. Plant construction, however, can be considered apart from operation. The plant construction will include the following sound emitting activities:
• earthworks excavation and construction
• foundation construction, including piling
• assembly of structures
• installation of fixed equipment
• mobile equipment traffic (e.g., haul truck, delivery vehicles, backhoe, dozer, crane, front-end loader, forklift)
• use of diesel generators for welders

Joslyn North Mine Project Appendix H: Acoustics Supporting Information AI Project Update
February 2010 TOTAL E&P Joslyn Ltd.Page H-20
Best management practices will be used to reduce the effect of construction sounds from the project. The following are examples of planned mitigation measures:
• where possible, limiting sound generating construction activities at night, particularly pile driving and truck traffic on public roadways
• reducing activation of vehicle back-up alarms
• scheduling high-impulse noise sources (such as pipe handling and unloading) during daytime hours; use wooden wedge blocks and spacer material between pipes to minimize pipe movement sounds
• fitting diesel engines with muffler or silencing systems, and keeping them in good repair
• using acoustical screening from existing on-site buildings (e.g., trailers) to shield noise receptors from construction equipment sound
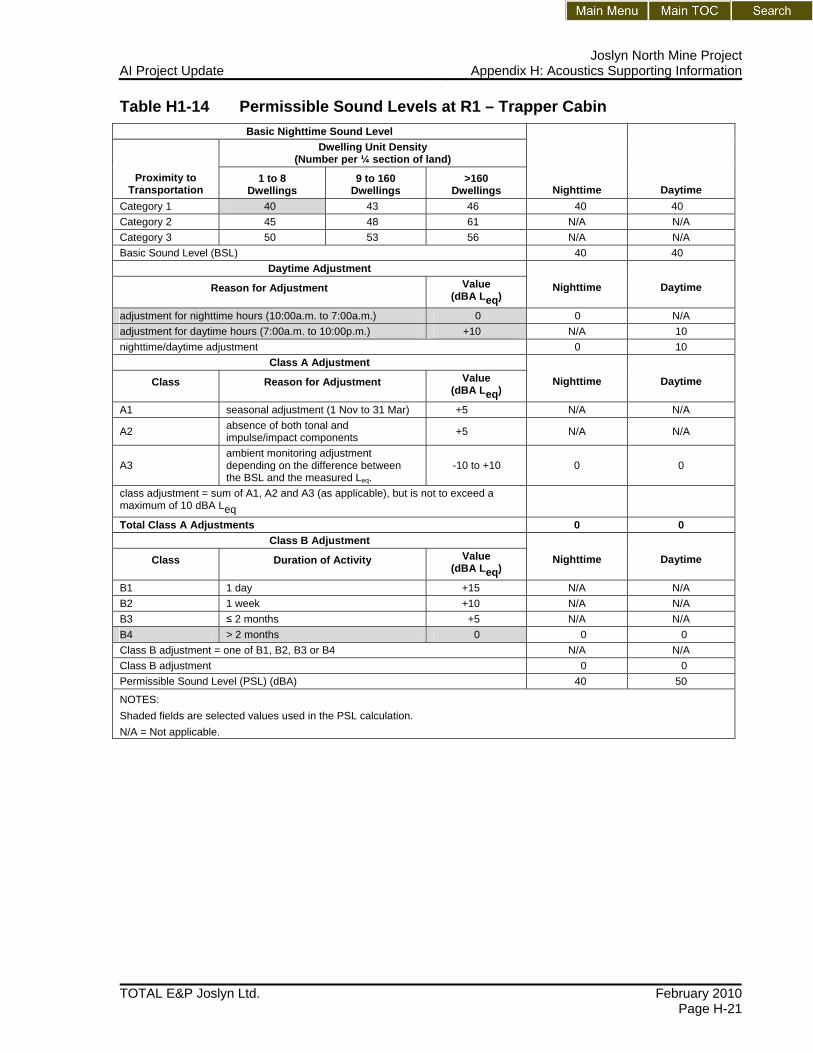
H1.4 Permissible Sound Level Calculations Permissible Sound Level criteria for the identified receptors were calculated using the detailed methodology set out in Directive 038. Tables H1-14 and H1-15 detail the calculations for the project.
Joslyn North Mine ProjectAI Project Update Appendix H: Acoustics Supporting Information
TOTAL E&P Joslyn Ltd. February 2010 Page H-21
Table H1-14 Permissible Sound Levels at R1 – Trapper Cabin Basic Nighttime Sound Level
Dwelling Unit Density (Number per ¼ section of land)
Proximity to Transportation
1 to 8 Dwellings
9 to 160 Dwellings
>160 Dwellings Nighttime Daytime
Category 1 40 43 46 40 40 Category 2 45 48 61 N/A N/A Category 3 50 53 56 N/A N/A Basic Sound Level (BSL) 40 40
Daytime Adjustment
Reason for Adjustment
Value (dBA Leq)
Nighttime
Daytime
adjustment for nighttime hours (10:00a.m. to 7:00a.m.) 0 0 N/A adjustment for daytime hours (7:00a.m. to 10:00p.m.) +10 N/A 10 nighttime/daytime adjustment 0 10
Class A Adjustment
Class
Reason for Adjustment
Value (dBA Leq)
Nighttime
Daytime
A1 seasonal adjustment (1 Nov to 31 Mar) +5 N/A N/A
A2 absence of both tonal and impulse/impact components +5 N/A N/A
A3 ambient monitoring adjustment depending on the difference between the BSL and the measured Leq.
-10 to +10 0 0
class adjustment = sum of A1, A2 and A3 (as applicable), but is not to exceed a maximum of 10 dBA Leq
Total Class A Adjustments 0 0 Class B Adjustment
Class
Duration of Activity
Value (dBA Leq)
Nighttime
Daytime
B1 1 day +15 N/A N/A B2 1 week +10 N/A N/A B3 ≤ 2 months +5 N/A N/A B4 > 2 months 0 0 0 Class B adjustment = one of B1, B2, B3 or B4 N/A N/A Class B adjustment 0 0 Permissible Sound Level (PSL) (dBA) 40 50
NOTES: Shaded fields are selected values used in the PSL calculation. N/A = Not applicable.

Joslyn North Mine Project Appendix H: Acoustics Supporting Information AI Project Update
February 2010 TOTAL E&P Joslyn Ltd.Page H-22
Table H1-15 Permissible Sound Levels at R2 – Fort McKay Basic Nighttime Sound Level
Dwelling Unit Density (Number per ¼ section of land)
Proximity to Transportation
1 to 8 Dwellings
9 to 160 Dwellings
>160 Dwellings Nighttime Daytime
Category 1 40 43 46 43 43 Category 2 45 48 61 N/A N/A Category 3 50 53 56 N/A N/A Basic Sound Level (BSL) 43 53
Daytime Adjustment Reason for Adjustment
Value
(dBA Leq) Nighttime
Daytime
adjustment for nighttime hours (10:00p.m. to 7:00a.m.) 0 0 N/A adjustment for daytime hours (7:00a.m. to 10:00p.m.) +10 N/A 10 nighttime/daytime adjustment 0 10
Class A Adjustment Class
Reason for Adjustment
Value
(dBA Leq) Nighttime
Daytime
A1 seasonal adjustment (1 Nov to 31 Mar) +5 N/A N/A
A2 absence of both tonal and impulse/impact components +5 N/A N/A
A3
ambient monitoring adjustment depending on the difference between the BSL and the measured Leq.
-10 to +10 0 0
class adjustment = sum of A1, A2 and A3 (as applicable), but is not to exceed a maximum of 10 dBA Leq
Total Class A Adjustments 0 0 Class B Adjustment
Class
Duration of Activity
Value (dBA Leq)
Nighttime
Daytime
B1 1 day +15 N/A N/A B2 1 week +10 N/A N/A B3 ≤ 2 months +5 N/A N/A B4 > 2 months 0 0 0 Class B adjustment = one of B1, B2, B3 or B4 N/A N/A Class B adjustment 0 0 Permissible Sound Level (PSL) (dBA) 43 53
NOTES: N/A = Not applicable. Shaded fields are selected values used in the PSL calculation.
Joslyn North Mine ProjectAI Project Update Appendix H: Acoustics Supporting Information
TOTAL E&P Joslyn Ltd. February 2010 Page H-23
H2 Acoustics Baseline The 2008 noise baseline field study focused on four monitoring sites located near the lease area. Data collected throughout the program include sound levels, sound recordings and observations, temperature, wind direction and speed, relative humidity, location and monitoring site photographs.
H2.1 Study Objectives The objective of the field study was to provide existing noise levels for potential receptors as defined by ERCB Directive 038. In most remote areas, hourly sound levels are generally low (between 25 to 30 dBA) throughout the day and night; however, since sound in the lease area may be influenced by human activity, baseline sound levels may be higher.
Surveys to collect representative acoustic data in and around the lease area were conducted from August 5 to 8, 2008. The survey methods used were consistent with the requirements of Directive 038 (EUB 2007).
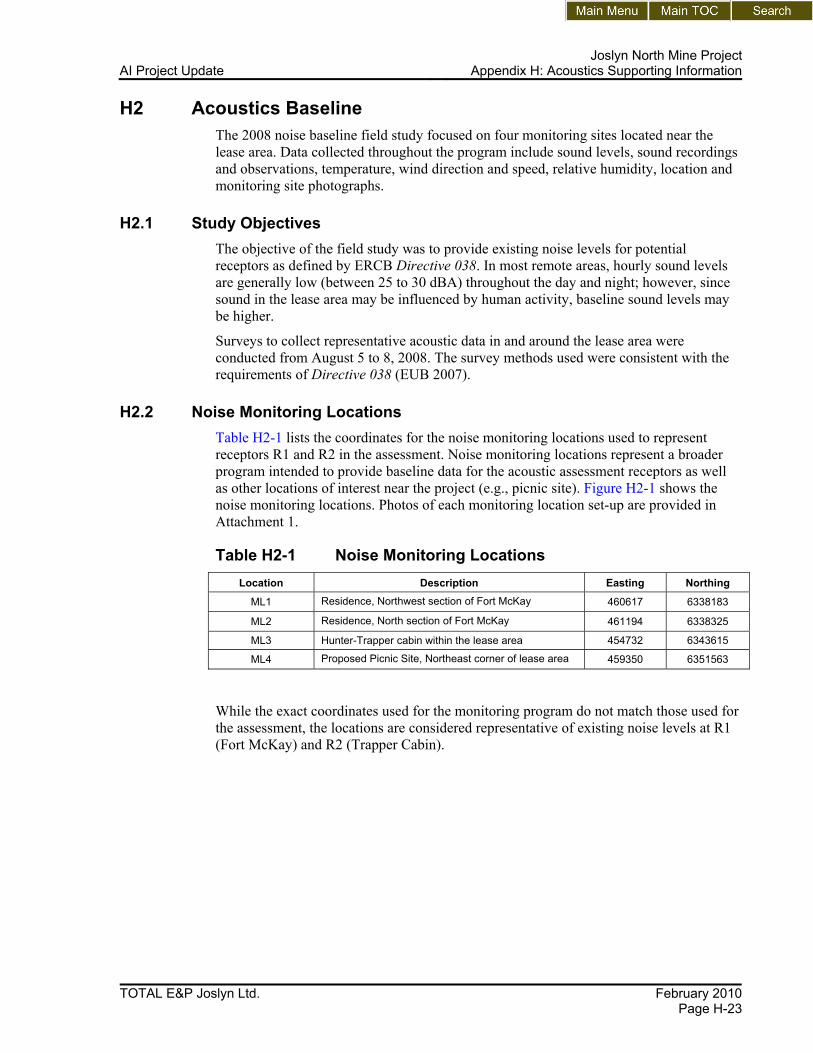
H2.2 Noise Monitoring Locations Table H2-1 lists the coordinates for the noise monitoring locations used to represent receptors R1 and R2 in the assessment. Noise monitoring locations represent a broader program intended to provide baseline data for the acoustic assessment receptors as well as other locations of interest near the project (e.g., picnic site). Figure H2-1 shows the noise monitoring locations. Photos of each monitoring location set-up are provided in Attachment 1.
Table H2-1 Noise Monitoring Locations Location Description Easting Northing
ML1 Residence, Northwest section of Fort McKay 460617 6338183
ML2 Residence, North section of Fort McKay 461194 6338325
ML3 Hunter-Trapper cabin within the lease area 454732 6343615
ML4 Proposed Picnic Site, Northeast corner of lease area 459350 6351563
While the exact coordinates used for the monitoring program do not match those used for the assessment, the locations are considered representative of existing noise levels at R1 (Fort McKay) and R2 (Trapper Cabin).

Joslyn North Mine Project Appendix H: Acoustics Supporting Information AI Project Update
February 2010 TOTAL E&P Joslyn Ltd.Page H-24
Figure H2-1 Noise Monitoring Locations

Joslyn North Mine ProjectAI Project Update Appendix H: Acoustics Supporting Information
TOTAL E&P Joslyn Ltd. February 2010 Page H-25
H2.3 Methods
H2.3.1 Environmental Descriptors An introduction to the concepts and theories used in noise measurement and assessment is provided in this Section.
H2.3.2 Noise Level Measurements One 24-hour survey was conducted at each of the locations described in Section H2.2. Surveys of this type and duration provide information on daily variability in noise levels as well as providing an expected typical or average daily condition.
Model 2250 Brüel and Kjaer Type I integrating sound level meters were used to collect the measurements and noise recordings. The meter logs noise levels and records audible noise over a set monitoring period selected by the user. The logging rate was set for one minute and the monitoring period was set for 24 hours (recordings were saved every 10 minutes).
Data parameters logged every minute for each survey period included:
• integrated average (Leq) in dBA
• 1/3 octave band values in dB
A Brüel and Kjaer Type 4231 Calibrator was used for calibrating the meters before and after each 24-hour monitoring period. The calibrator has an estimated uncertainty for sound pressure level of ±0.12 dB at a 99% confidence level. Calibration was performed before and after each 24-hour monitoring period to ensure the meter variance was within 0.5 dB.
Data were downloaded to a computer for analysis with the Brüel and Kjaer 7820 Evaluator® software program. The data were Quality Assurance/Quality Control (QA/QC) reviewed to identify sources of sound from the recordings and to filter out invalid data such as technician activities, weather conditions and animal interference. Hourly values were then calculated for the 24-hour measurements from the valid 1-minute data. Daily and nightly values were calculated as per ERCB Directive 038; daytime being defined as 7:00 a.m. to 10:00 p.m. and nighttime as 10:00 p.m. to 7:00 a.m. During analysis of the data, sound sources were identified mainly by recordings although observations were also used.
Direct observations and field notes made by the study team recorded precipitation, cloud cover, wind direction and observed audible sources. Weather data were also collected and are discussed in the following section.
H2.3.3 Environmental Conditions at the Time of Measurement Directive 038 requires that monitoring be conducted under conditions acceptable for noise measurement, which include wind speeds of less than 20 km/h and no precipitation. Temperatures must be within instrument tolerances. For this survey, weather data were obtained using a WeatherHawk Portable weather station from Campbell Scientific. Weather data recorded included hourly wind, temperature, precipitation and relative humidity data.

Joslyn North Mine Project Appendix H: Acoustics Supporting Information AI Project Update
February 2010 TOTAL E&P Joslyn Ltd.Page H-26
H2.4 Results The 24-hour measurement data collected for the environmental baseline study (EBS) are summarized in this section. Sound sources that were not representative of expected, typical ambient conditions (e.g., technician activity, animal interference and weather conditions such as rain, thunder, or high wind) were excluded from the calculated hourly daytime or nighttime results. All “hourly” Leq values are based on at least 30 minutes of data. Daytime hours as defined by Directive 038 includes the time from 7:00 a.m. to 10:00 p.m., nighttime hours range from 10:00 p.m. to 7:00 a.m.
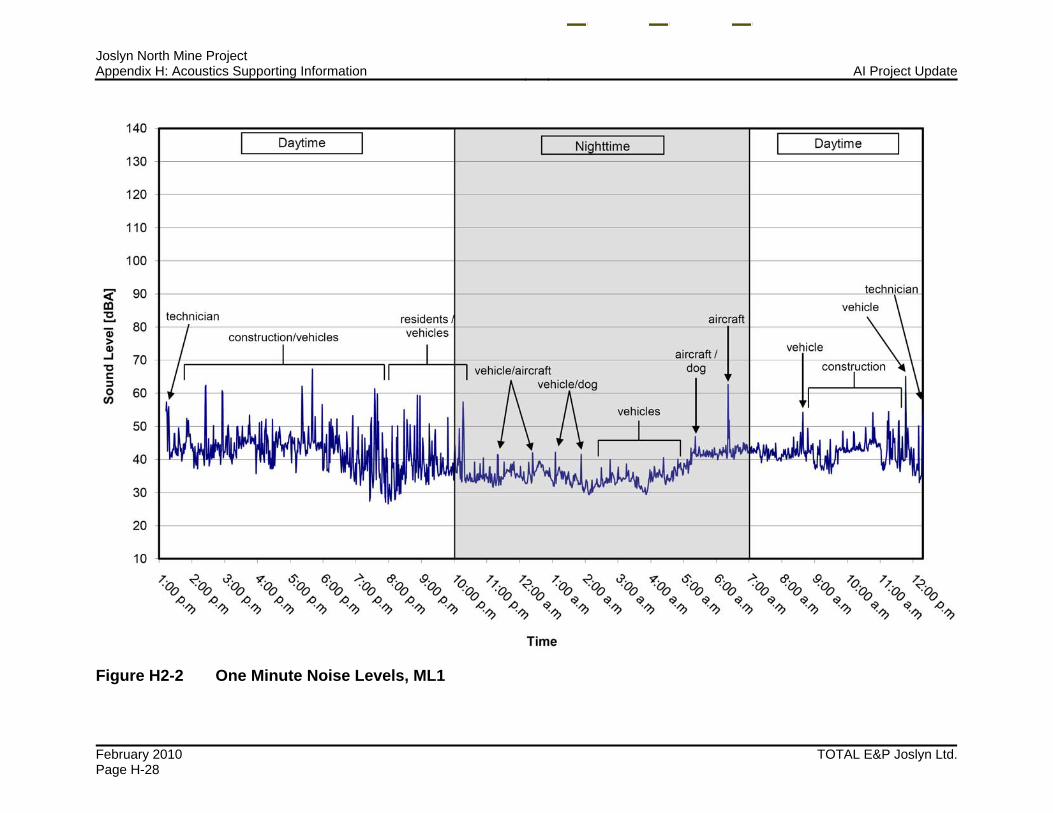
H2.4.1 Monitoring Location ML1 Measured hourly Leq values at ML1 are shown in Table H2-2. The highest hourly Leq during the monitoring period was 52 dBA, which occurred between 5:00 p.m. and 6:00 p.m. on August 5, 2008. The lowest hourly Leq value during the daytime was 41 dBA, which occurred between 9:00 p.m. and 10:00 p.m. on August 5, 2008. The lowest hourly Leq value during the nighttime period was 33 dBA which occurred between 2:00 a.m. and 3:00 a.m. on August 6, 2008.
Table H2-2 Hourly Noise Levels Recorded at ML1 (August 5 to 6, 2008)
Date
Hour(a)
Leq
(dBA) August 5, 2008 1:00 p.m. 46(b) August 5, 2008 2:00 p.m. 50 August 5, 2008 3:00 p.m. 46 August 5, 2008 4:00 p.m. 46 August 5, 2008 5:00 p.m. 52 August 5, 2008 6:00 p.m. 45 August 5, 2008 7:00 p.m. 48 August 5, 2008 8:00 p.m. 44(b) August 5, 2008 9:00 p.m. 41(b) August 5, 2008 10:00 p.m. 43 August 5, 2008 11:00 p.m. 36(b) August 6, 2008 12:00 a.m. 36(b) August 6, 2008 1:00 a.m. 35 August 6, 2008 2:00 a.m. 33 August 6, 2008 3:00 a.m. 34 August 6, 2008 4:00 a.m. 36 August 6, 2008 5:00 a.m. 41 August 6, 2008 6:00 a.m. 43(b) August 6, 2008 7:00 a.m. 42 August 6, 2008 8:00 a.m. 43(b) August 6, 2008 9:00 a.m. 42 August 6, 2008 10:00 a.m. 45 August 6, 2008 11:00 a.m. 49 August 6, 2008 12:00 a.m. –(c) NOTES: Rows that are bold and italicized indicate the nighttime hours. (a) Measurement start hour. (b) Measurement has technician activity, aircraft fly-over, interference from close vehicles and animals,
and wind gust noise excluded, thereby creating a value based on less than 60 minutes but more than 30 minutes of recorded data.
(c) Data filtering resulted in less than 30 minutes of recorded data.

Joslyn North Mine ProjectAI Project Update Appendix H: Acoustics Supporting Information
TOTAL E&P Joslyn Ltd. February 2010 Page H-27
Sound sources identified were predominantly traffic on local roads, operation of nearby equipment and vehicles, domestic animal and human activities in close proximity of the sound measuring equipment. Weather conditions showed acceptable wind and temperature conditions, with no precipitation. At least three hours of valid data were collected during the day and nighttime periods, per Directive 038 requirements.
One-minute noise levels are shown graphically in Figure H2-2. The figure shows the sources of peaks and the noise level range recorded.
Joslyn North Mine Project Appendix H: Acoustics Supporting Information AI Project Update
February 2010 TOTAL E&P Joslyn Ltd.Page H-28
Figure H2-2 One Minute Noise Levels, ML1

Joslyn North Mine ProjectAI Project Update Appendix H: Acoustics Supporting Information
TOTAL E&P Joslyn Ltd. February 2010 Page H-29
H2.4.2 Monitoring Location ML2 Measured hourly Leq values at ML2 are shown in Table H2-3. The highest hourly Leq during the monitoring period was 56 dBA, which occurred between 6:00 p.m. and 7:00 p.m. on August 5, 2008. The lowest noise level found during the daytime period was 38 dBA which occurred between 8:00 p.m. and 9:00 p.m. on August 5, 2008. The lowest hourly Leq value during the nighttime was 37 dBA, which occurred between 1:00 a.m. and 2:00 a.m. on August 6, 2008.
Sound sources identified were predominantly traffic on local roads, operation of nearby equipment and vehicles, domestic animal noise and human activities in close proximity of the measuring equipment. Weather conditions showed acceptable wind and temperature conditions, with no precipitation. At least three hours of valid data were collected during the day and nighttime periods, per Directive 038 requirements.
One-minute noise levels are shown graphically in Figure H2-3. The figure shows the sources of peaks and the noise level range recorded.
Table H2-3 Hourly Noise Levels Recorded at ML2 (August 5 to 6, 2008)
Date
Hour(a)
Leq
(dBA) August 5, 2008 12:00 p.m. –(c) August 5, 2008 1:00 p.m. 52(b) August 5, 2008 2:00 p.m. 51 August 5, 2008 3:00 p.m. 50 August 5, 2008 4:00 p.m. 55 August 5, 2008 5:00 p.m. 45 August 5, 2008 6:00 p.m. 56 August 5, 2008 7:00 p.m. 48 August 5, 2008 8:00 p.m. 38 August 5, 2008 9:00 p.m. 44(b) August 5, 2008 10:00 p.m. 40 August 6, 2008 11:00 p.m. 39 August 6, 2008 12:00 a.m. 40(b) August 6, 2008 1:00 a.m. 37 August 6, 2008 2:00 a.m. 43 August 6, 2008 3:00 a.m. 44 August 6, 2008 4:00 a.m. 44 August 6, 2008 5:00 a.m. 46 August 6, 2008 6:00 a.m. 49(b) August 6, 2008 7:00 a.m. 42 August 6, 2008 8:00 a.m. 40(b) August 6, 2008 9:00 a.m. 46 August 6, 2008 10:00 a.m. 48 August 6, 2008 11:00 a.m. 48(b) NOTES: Rows that are bold and italicized indicate the nighttime hours. (a) Measurement start hour. (b) Measurement has technician activity, aircraft fly-over, interference from close vehicles and animals,
and wind gust noise excluded, thereby creating a value based on less than 60 minutes but more than 30 minutes of recorded data.
(c) Data filtering resulted in less than 30 minutes of recorded data.

Joslyn North Mine Project Appendix H: Acoustics Supporting Information AI Project Update
February 2010 TOTAL E&P Joslyn Ltd.Page H-30
Figure H2-3 One Minute Noise Levels, ML2
Joslyn North Mine ProjectAI Project Update Appendix H: Acoustics Supporting Information
TOTAL E&P Joslyn Ltd. February 2010 Page H-31
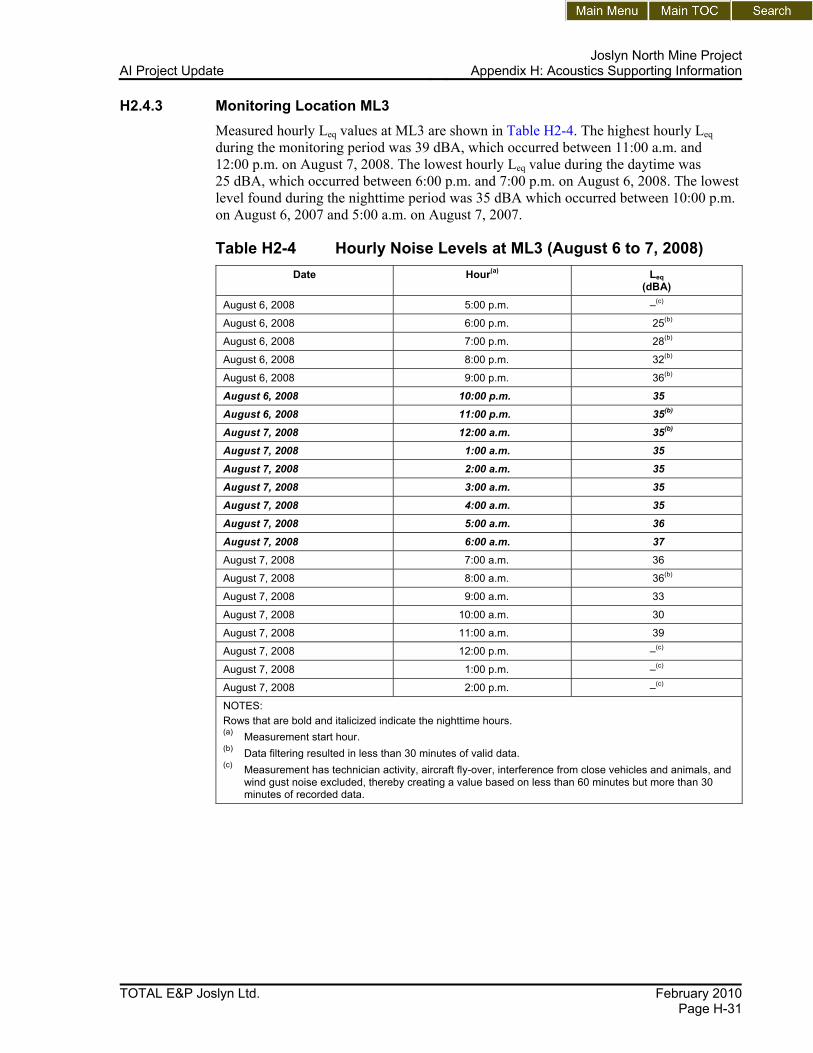
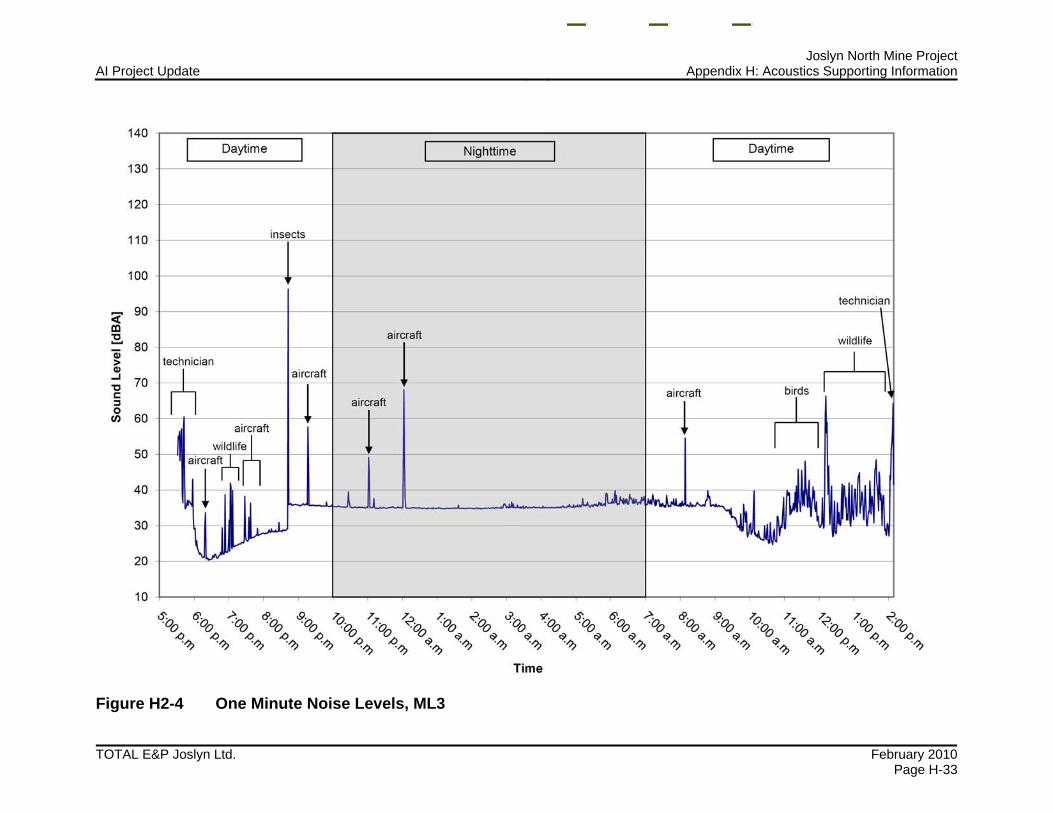
H2.4.3 Monitoring Location ML3 Measured hourly Leq values at ML3 are shown in Table H2-4. The highest hourly Leq during the monitoring period was 39 dBA, which occurred between 11:00 a.m. and 12:00 p.m. on August 7, 2008. The lowest hourly Leq value during the daytime was 25 dBA, which occurred between 6:00 p.m. and 7:00 p.m. on August 6, 2008. The lowest level found during the nighttime period was 35 dBA which occurred between 10:00 p.m. on August 6, 2007 and 5:00 a.m. on August 7, 2007.
Table H2-4 Hourly Noise Levels at ML3 (August 6 to 7, 2008) Date
Hour(a)
Leq
(dBA) August 6, 2008 5:00 p.m. –(c)
August 6, 2008 6:00 p.m. 25(b)
August 6, 2008 7:00 p.m. 28(b)
August 6, 2008 8:00 p.m. 32(b)
August 6, 2008 9:00 p.m. 36(b)
August 6, 2008 10:00 p.m. 35 August 6, 2008 11:00 p.m. 35(b)
August 7, 2008 12:00 a.m. 35(b) August 7, 2008 1:00 a.m. 35 August 7, 2008 2:00 a.m. 35
August 7, 2008 3:00 a.m. 35 August 7, 2008 4:00 a.m. 35 August 7, 2008 5:00 a.m. 36
August 7, 2008 6:00 a.m. 37 August 7, 2008 7:00 a.m. 36
August 7, 2008 8:00 a.m. 36(b)
August 7, 2008 9:00 a.m. 33
August 7, 2008 10:00 a.m. 30
August 7, 2008 11:00 a.m. 39
August 7, 2008 12:00 p.m. –(c)
August 7, 2008 1:00 p.m. –(c)
August 7, 2008 2:00 p.m. –(c)
NOTES: Rows that are bold and italicized indicate the nighttime hours. (a) Measurement start hour. (b) Data filtering resulted in less than 30 minutes of valid data. (c) Measurement has technician activity, aircraft fly-over, interference from close vehicles and animals, and
wind gust noise excluded, thereby creating a value based on less than 60 minutes but more than 30 minutes of recorded data.

Joslyn North Mine Project Appendix H: Acoustics Supporting Information AI Project Update
February 2010 TOTAL E&P Joslyn Ltd.Page H-32
Sound sources identified included water movement from the river (located about 50 m from the monitoring location), wildlife and occasional airplanes and helicopters. Weather conditions showed acceptable wind and temperature conditions, with no precipitation. At least three hours of valid data were collected during the day and nighttime periods, per Directive 038 requirements.
One-minute sound levels are shown graphically in Figure H2-4. The figure shows the sources of peaks and the sound level range recorded. It can also be noted, from Table H2-4 and Figure H2-4, that the nighttime ambient sound levels are fairly constant except for the occasional aircraft flyover. Based on the sound recording, the primary source was the nearby watercourse. This constant watercourse sound seemed to increase at night. This correlates with increased humidity noted in the weather data. From the weather data collected, a temperature inversion condition may have naturally influenced the sound levels at this location (Section H2.4.5). However, the values measured are within the range of 35 dBA expected in undeveloped areas of Alberta (EUB 2007).
Joslyn North Mine ProjectAI Project Update Appendix H: Acoustics Supporting Information
TOTAL E&P Joslyn Ltd. February 2010 Page H-33
Figure H2-4 One Minute Noise Levels, ML3

Joslyn North Mine Project Appendix H: Acoustics Supporting Information AI Project Update
February 2010 TOTAL E&P Joslyn Ltd.Page H-34
H2.4.4 Monitoring Location ML4 Measured hourly Leq values at ML4 are shown in Table H2-5. The highest hourly Leq during the monitoring period was 34 dBA, which occurred between 6:00 a.m. and 10:00 a.m. on August 7, 2008. The lowest hourly Leq value during the daytime was 27 dBA, which occurred between 7:00 p.m. and 9:00 p.m. on August 6, 2008. The lowest noise level found during the nighttime period was 26 dBA which occurred between 11:00 p.m. on August 6, 2008 and 1:00 a.m. on August 7, 2008 and between 2:00 a.m. and 4:00 a.m. on August 7, 2008.
Table H2-5 Hourly Noise Levels at ML3 (August 6 to 7, 2008) Date
Hour(a)
Leq
(dBA) August 6, 2008 2:00 p.m. –(c)
August 6, 2008 3:00 p.m. 32
August 6, 2008 4:00 p.m. 33(b)
August 6, 2008 5:00 p.m. 30(b)
August 6, 2008 6:00 p.m. 30
August 6, 2008 7:00 p.m. 27(b)
August 6, 2008 8:00 p.m. 27
August 6, 2008 9:00 p.m. 29
August 6, 2008 10:00 p.m. 28(b) August 6, 2008 11:00 p.m. 26(b) August 7, 2008 12:00 a.m. 26(b)
August 7, 2008 1:00 a.m. 27 August 7, 2008 2:00 a.m. 26 August 7, 2008 3:00 a.m. 26
August 7, 2008 4:00 a.m. 29 August 7, 2008 5:00 a.m. 32(b) August 7, 2008 6:00 a.m. 34(b)
August 7, 2008 7:00 a.m. 34
August 7, 2008 8:00 a.m. 34(b)
August 7, 2008 9:00 a.m. 34(b)
August 7, 2008 10:00 a.m. 34(b)
August 7, 2008 11:00 a.m. 32
August 7, 2008 12:00 p.m. –(c)
NOTES: Rows that are bold and italicized indicate the nighttime hours. (a) Measurement start hour. (b) Measurement has technician activity, aircraft fly-over, interference from close vehicles and animals,
and wind gust noise excluded, thereby creating a value based on less than 60 minutes but more than 30 minutes of recorded data.
(c) Data filtering resulted in less than 30 minutes of valid data.

Joslyn North Mine ProjectAI Project Update Appendix H: Acoustics Supporting Information
TOTAL E&P Joslyn Ltd. February 2010 Page H-35
The predominant sound sources identified were wildlife, occasional airplanes and helicopters and vehicles from the road adjacent to the monitoring location. Weather conditions showed acceptable wind and temperature conditions, with no precipitation. At least three hours of valid data were collected during the day and nighttime periods, per Directive 038 requirements.
One-minute noise levels are shown graphically in Figure H2-5. The figure shows the sources of peaks and the noise level range recorded.

Joslyn North Mine Project Appendix H: Acoustics Supporting Information AI Project Update
February 2010 TOTAL E&P Joslyn Ltd.Page H-36
Figure H2-5 One Minute Noise Levels, ML4
Joslyn North Mine ProjectAI Project Update Appendix H: Acoustics Supporting Information
TOTAL E&P Joslyn Ltd. February 2010 Page H-37
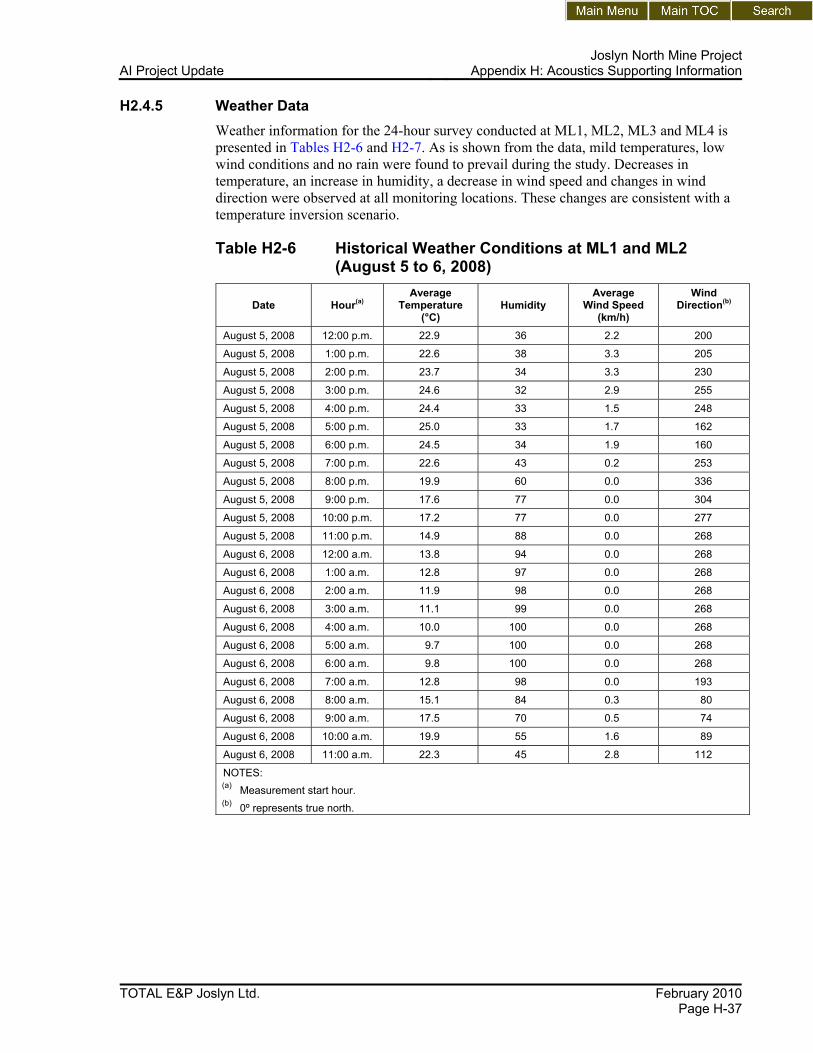
H2.4.5 Weather Data Weather information for the 24-hour survey conducted at ML1, ML2, ML3 and ML4 is presented in Tables H2-6 and H2-7. As is shown from the data, mild temperatures, low wind conditions and no rain were found to prevail during the study. Decreases in temperature, an increase in humidity, a decrease in wind speed and changes in wind direction were observed at all monitoring locations. These changes are consistent with a temperature inversion scenario.
Table H2-6 Historical Weather Conditions at ML1 and ML2 (August 5 to 6, 2008)
Date
Hour(a)
Average Temperature
(°C) Humidity
Average Wind Speed
(km/h)
Wind Direction(b)
August 5, 2008 12:00 p.m. 22.9 36 2.2 200
August 5, 2008 1:00 p.m. 22.6 38 3.3 205
August 5, 2008 2:00 p.m. 23.7 34 3.3 230
August 5, 2008 3:00 p.m. 24.6 32 2.9 255
August 5, 2008 4:00 p.m. 24.4 33 1.5 248
August 5, 2008 5:00 p.m. 25.0 33 1.7 162
August 5, 2008 6:00 p.m. 24.5 34 1.9 160
August 5, 2008 7:00 p.m. 22.6 43 0.2 253
August 5, 2008 8:00 p.m. 19.9 60 0.0 336
August 5, 2008 9:00 p.m. 17.6 77 0.0 304
August 5, 2008 10:00 p.m. 17.2 77 0.0 277
August 5, 2008 11:00 p.m. 14.9 88 0.0 268
August 6, 2008 12:00 a.m. 13.8 94 0.0 268
August 6, 2008 1:00 a.m. 12.8 97 0.0 268
August 6, 2008 2:00 a.m. 11.9 98 0.0 268
August 6, 2008 3:00 a.m. 11.1 99 0.0 268
August 6, 2008 4:00 a.m. 10.0 100 0.0 268
August 6, 2008 5:00 a.m. 9.7 100 0.0 268
August 6, 2008 6:00 a.m. 9.8 100 0.0 268
August 6, 2008 7:00 a.m. 12.8 98 0.0 193
August 6, 2008 8:00 a.m. 15.1 84 0.3 80
August 6, 2008 9:00 a.m. 17.5 70 0.5 74
August 6, 2008 10:00 a.m. 19.9 55 1.6 89
August 6, 2008 11:00 a.m. 22.3 45 2.8 112
NOTES: (a) Measurement start hour. (b) 0º represents true north.

Joslyn North Mine Project Appendix H: Acoustics Supporting Information AI Project Update
February 2010 TOTAL E&P Joslyn Ltd.Page H-38
Table H2-7 Historical Weather Conditions at ML3 and ML4 (August 6 to 7, 2008)
Date
Hour(a)
Average Temperature
(°C) Humidity
Average Wind Speed
(km/h)
Wind Direction(b)
August 6, 2008 2:00 p.m. 26.8 34 1.1 23
August 6, 2008 3:00 p.m. 27.2 31 0.9 39
August 6, 2008 4:00 p.m. 26.7 32 1.2 51
August 6, 2008 5:00 p.m. 25.6 39 0.4 28
August 6, 2008 6:00 p.m. 24.2 46 0.0 195
August 6, 2008 7:00 p.m. 22.3 57 0.0 291
August 6, 2008 8:00 p.m. 20.2 77 0.0 290
August 6, 2008 9:00 p.m. 17.6 89 0.0 290
August 6, 2008 10:00 p.m. 15.9 97 0.0 290
August 6, 2008 11:00 p.m. 15.0 100 0.0 290
August 7, 2008 12:00 a.m. 14.2 100 0.0 290
August 7, 2008 1:00 a.m. 13.2 100 0.0 290
August 7, 2008 2:00 a.m. 12.6 100 0.0 290
August 7, 2008 3:00 a.m. 12.1 100 0.0 290
August 7, 2008 4:00 a.m. 11.6 100 0.0 290
August 7, 2008 5:00 a.m. 11.1 100 0.0 290
August 7, 2008 6:00 a.m. 11.5 100 0.0 290
August 7, 2008 7:00 a.m. 15.1 97 0.0 290
August 7, 2008 8:00 a.m. 18.7 77 0.0 203
August 7, 2008 9:00 a.m. 21.0 53 0.4 55
August 7, 2008 10:00 a.m. 24.0 42 0.2 113
August 7, 2008 11:00 a.m. 25.5 34 0.1 136
NOTES: (a) Measurement start hour. (b) 0º represents true north.

Joslyn North Mine ProjectAI Project Update Appendix H: Acoustics Supporting Information
TOTAL E&P Joslyn Ltd. February 2010 Page H-39
H3 References
H3.1 Literature Cited Albian Sands (Albian Sands Energy Inc.). 2005. Muskeg River Mine Expansion Project Application and
Environmental Impact Assessment. Submitted to Alberta Energy and Utilities Board and Alberta Environment. Prepared by Golder Associates Ltd. and Nichols Applied Management. Volume 1, 2, 3 and 4. Fort McMurray, AB. Submitted April, 2005.
ANSI (American National Standards Institute). 1997. Specifications for Integrating-Averaging Sound Level Meters. S1.43-1997 standard.
Beranek, L.L. and I.L. Ver. 1992. Prediction of Machinery Noise. In noise and Vibration Control Engineering: Principals and Applications. John Wiley & Sons Inc. 804 pp.
CNRL (Canadian Natural Resources Limited). 2003. Horizon Oil Sands Project Update. Submitted to Alberta Energy and Utilities Board and Alberta Environment. Calgary, AB.
Drew, T. and D. South. 2009. Cumulative Effects and the 1.5 km Boundary. Presentation from the Alberta Acoustics and Noise Association Spring Noise Conference, Banff Alberta May 2009.
Drew, T., D. DeSilva and C. Decock. 2005. Commercials Noise Models – Do They Work? A Case Study. Alberta Acoustical Society Spring Conference Proceedings, May 2005.
EPCOR. 2001. Genesee Generating Station, Phase 3, Noise Impact Assessment, June 2001.
ERM (Environmental Resources Management). 2008. Riverside at Tea Gardens – Construction Noise Assessment. Prepared for Crighton Properties Pty Ltd., July 2008.
EUB (Alberta Energy and Utilities Board). 2007. Directive 038: Noise Control Directive (February 16, 2007). Calgary, AB. 56 pp.
Fraser et al. 1998. Bird Control on Grape and Tender Fruit Farms. Ontario Ministry of Agriculture and Food, 17 pp.
Hegley Acoustic Consultants. 2007. Rodney Power Station Inland Road Assessment of Noise. Prepared for Genesis Energy, Auckland, July 2007. Report No. 7465.
Herring Storer Acoustics, 2005. Acoustic Assessment – Golden Pike Development Including Noise Bund Construction. Prepared for Kalgoorlie Consolidated Gold Mines, June 2005. REF: 4389-4-05033-01
ISO (International Organization for Standardization). 1996. ISO 9613-2:1996. Acoustics -- Attenuation of sound during propagation outdoors -- Part 2: General method of calculation. Geneva, Switzerland.
Shell (Shell Canada Limited). 2008. Jackpine Mine Expansion and Pierre River Mine Project Responses to ERCB Request for Supplemental Information Request. Prepared by Shell Canada Limited and Golder Associates Ltd. Calgary, AB. Submitted April 2008.
Total (Total E&P Ltd.). 2007. Total E&P Joslyn Ltd Joslyn North Mine Project Supplemental Information, Volume 1: Project Update – June 2007.
TransAlta (TransAlta Utilities Corporation). 2007. Highvale Mine Pit 08 Environmental Impact Assessment. Appendix J: Noise Impact Assessment.

Joslyn North Mine Project Appendix H: Acoustics Supporting Information AI Project Update
February 2010 TOTAL E&P Joslyn Ltd.Page H-40