Embed Size (px)
Citation preview

Appendix E
Maryland State Agency Phase II WIP Reports
This appendix contains: 1) Maryland State Highway Administration Bay TMDL WIP II Narrative 2) Status of Watershed Management at University System of Maryland Institution Campuses 3) Draft No-Net-Loss of Forest Policy - Maryland Sustainable Forestry Council

Maryland State Highway Administration Bay TMDL WIP II Narrative
03/20/2012 1
1. OVERVIEW OF MARYLAND STATE HIGHWAY ADMINISTRATION PROCESS
1.1 Sectors
The Maryland State Highway Administration (SHA) is committed to meeting the requirements
of the Chesapeake Bay TMDL, issued December 29, 2010, through compliance with the
requirements established in Maryland’s Watershed Implementation Plan for the Chesapeake Bay
Total Maximum Daily Load (WIP I), issued December 3, 2010. SHA has land coverage in three
sectors: Minor Processed Wastewater, Septic and Regulated Urban Stormwater.
The SHA coverage under the processed wastewater sector includes two permits for minor
municipal facilities including the Sideling Hill rest area and the eastbound I-70 rest area; and
seven permits for minor industrial wastewater discharges covering certain maintenance
operations. Coverage under the Regulated Urban Stormwater sector includes both Phase I and II
National Pollutant Discharge Elimination System (NPDES) Municipal Separate Storm Sewer
System (MS4) stormwater discharge permit coverage for the SHA roadway network and
industrial stormwater discharge permits for shops and maintenance facilities. Specific SHA
requirements are discussed below.
Minor Processed Wastewater
According to the Maryland Department of the Environment (MDE) MD WIP I document, the
strategies for non-significant municipal facilities will focus on projected flow and effluent limit
concentrations of 18 mg/l for nitrogen and 3 mg/l for phosphorus with maximum annual
pollutant loads not to exceed 6,100 lbs/yr for nitrogen and 457 lbs/yr for phosphorus. Conditions
specific to total nitrogen and total phosphorus are discussed below for the SHA minor municipal
Waste Water Treatment Plant (WWTP) Permits.
Permit No. MD0023680/07-DP-0650 I-70 Eastbound Rest Stop WWTP
The current permit conditions require that the 0.050 million gallons per day upgrade design meet
target loads of 1,535 lbs/yr total nitrogen and 256 lbs/yr total phosphorus in order to meet the
future TMDL for the Upper Potomac River watershed. Limitations for TSS are included in the
current permit and are met.
Permit No. MD0062821/05-DP-2434 I-68 Sideling Hill Rest Area WWTP & WTP
The current permit conditions require that as the Upper North Potomac River or Little
Tonoloway Creek TMDL documents for nutrients are completed, the permit may be revised to
incorporate limitations. Limitations for TSS are included in the current permit and are met.
Septic
SHA has 25 shops, offices and/or maintenance facilities in the Chesapeake Bay (Bay) watershed
that utilize on-site sewage disposal systems (OSDS).

Maryland State Highway Administration Bay TMDL WIP II Narrative
03/20/2012 2
Regulated Urban Stormwater
Requirements for regulated stormwater represent the largest TMDL compliance challenges for
SHA. SHA maintains MS4 permit coverage for the SHA roadway storm drain systems in all
nine (9) Maryland MS4 Phase I counties (Anne Arundel, Baltimore, Carroll, Charles, Frederick,
Harford, Howard, Montgomery and Prince Georges) and in the two (2) MS4 Phase II counties
(Cecil and Washington). Figure 1 depicts SHA MS4 coverage.
Figure 1 SHA MS4 Permit Coverage
Requirements for SHA in the WIP I document focus on SHA MS4 areas for stormwater. No
specific requirements have been imposed on SHA for non-MS4 areas and the Maryland
Assessment Scenario Tool (MAST) has no land use acreages attributed to SHA outside of MS4
areas. Table 1 lists waste load allocations (WLAs) determined by the MDE for SHA compliance
with the Bay TMDL and are the SHA components of the overall limits of pollutants that can be
discharged to the Bay and still meet water quality standards. The 2017 SHA target load is 60
percent of our reduction requirement based on the MDE 2009 baseline progress scenario.
Table 1. SHA WLA and Impervious Treatment Requirements for
Regulated Urban Stormwater Sector
TN
(LBS/YR) TP
(LBS/YR) TSS
(LBS/YR) Impervious
Surfaces (I/II)
SHA Phase I/II MS4 WLA (DEL) 433,358 25,336 - -
SHA Phase I/II MS4 WLA (EOS) 764,772 43,574 27,270,536 -
2017 SHA Target Load (EOS) (60%
WLA Reduction) 825,095 50,611 30,782,560 30%/20%
Maryland State Highway Administration Bay TMDL WIP II Narrative
03/20/2012 3
The WLAs are expressed as ‘delivered’ (DEL) or ‘edge-of-stream’ (EOS). The DEL loads
reflect losses during transport from the source to the Bay while EOS loads reflect loads
transported from the source to the nearest stream.
1.2 Coordination with Local Teams
Because SHA maintains statewide coverage within Maryland, we are not associated exclusively
with any one local team. As the process unfolded under MDE and MD Department of Natural
Resources (DNR) direction, SHA participated in workshops, webinars and, as our resources
allowed, in local team meetings. In developing strategies for the WIP II process, SHA focused
on the statewide level and will develop county-level strategies as part of the 2012-2013
milestone. This will enable SHA to benefit from the county WIP II documents in developing our
strategies as well as to identify potential partnering opportunities with local and county officials.
SHA will also continue to coordinate with local watershed groups and resource agencies,
including the DNR, MDE, US Fish and Wildlife Service, US Army Corps of Engineers and the
US Environmental Protection Agency (EPA) to explore partnership opportunities that are
beneficial for all parties. SHA has met with a number of these agencies to discuss various
opportunities and will continue to coordinate with them as the process moves forward.
1.3 Internal Process
SHA convened an internal workgroup/oversight committee to bring all design, construction and
operations functions within the SHA together to discuss the requirements, develop strategies and
address programmatic and funding gaps. Training was developed and given to all seven (7) SHA
district offices including design, construction and maintenance managers and TMDL liaisons
have been designated for each District to address local implementation and coordination.
SHA is a modal of the Maryland Department of Transportation (MDOT) and several briefings
have been undertaken with the Secretary and Deputy Secretary in order to alert the Department
of the impact this initiative has on the Department and State budget. An additional briefing was
given to the Maryland Department of Legislative Services on August 31, 2011. The Maryland
Blue Ribbon Commission (BRC) on Transportation Funding completed its deliberations and the
resultant report to the Governor with recommendations for increasing funding to the Maryland
Transportation Trust Fund (TTF) was issued November 1, 2011. The report is available on the
MDOT website at: www.mdot.maryland.gov/Planning/BRC. The Commission was informed
of the TMDL requirements as part of their deliberation process.
MDOT is anticipating the cost to implement the WIP for all of MDOT modes to be
approximately $1.5 billion. MDOT will submit a report to the Chairs of the State committees on
budget and taxation that outlines how MDOT will fit this cost into its capital program including
any changes in project priorities or new funding mechanisms. Furthermore, MDOT will discuss
how it will manage meeting the goals of the WIP. MDOT is currently projecting the SHA
spending for the next few fiscal years as shown in Table 2.

Maryland State Highway Administration Bay TMDL WIP II Narrative
03/20/2012 4
Table 2. MDOT Fiscal Year Funding Projections for
SHA Capital Budget TMDL Expenditures (Millions)
FY 12 FY 13 FY 14 FY 15 FY 16
Existing Funding $7.0 $21.1 $27.9 $16.6 5.6
Needed Funding $59 $90 $141 $150
It must be noted that implementation of the SHA strategy will not result in a straight line
progression with uniform funding levels each year. State procedures from planning to
implementation, including contract procurement, design, right-of-way acquisition and permitting,
will result in a gradual build-up of capacity to deliver this type of program with a greater need
for funding occurring in FY15 and thereafter. It is likely that costs will rise again following the
EPA reevaluation of TMDL implementation progress in FY17. By then it is likely that we will
have exhausted the less expensive and readily available opportunities and increased construction
activity over design activity.
TMDL implementation projects are among the top priorities for MDOT, but they need to be
balanced and therefore financed with other projects in mind as well. MDOT will not
compromise the safety of our citizens to fund these projects, but we also cannot ignore the
requirements of compliance with the Bay TMDL. With these caveats in mind, it is clear that the
WIP goals cannot be met without an increase in revenue to the TTF, no matter how strategically
we approach this initiative. Hence, MDOT is expected to pursue methods or proposals to seek
increase in the TTF starting with the upcoming legislative session. Funding expected in the
Governor’s revenue bill is $613 million per year for state and local purposes.
Along with the need for capital investments, SHA will need in-house and consultant resources to
deliver the program of this magnitude. Currently SHA has initiated additional efforts with
existing resources that are available due to the slower highway capital program. As the highway
program picks up, resource needs for the TMDL program delivery will need to be supplemented.
This need is at odds with on-going efforts towards reduction of State workforces. If not
addressed, simply providing capital funds may not assure a fiscally responsible delivery of the
program for the State.
2. MARYLAND SHA PHASE II WIP STRATEGIES
2.1 MS4 Phase I/II Urban Stormwater Milestones
The SHA compliance efforts within the MS4 permitted areas are shaped by the MDE guidance
for MS4 permit holders entitled Accounting for Stormwater Waste Load Allocations and
Impervious Acres Treated, DRAFT June 2011 (NPDES Accounting Protocol). Over the next
thirteen years, the SHA will focus on bringing Maryland highways into compliance with the
MDE WIP, the NPDES MS4 Phase I and II permits, and local TMDLs by implementing the
following TMDL and stormwater BMPs:
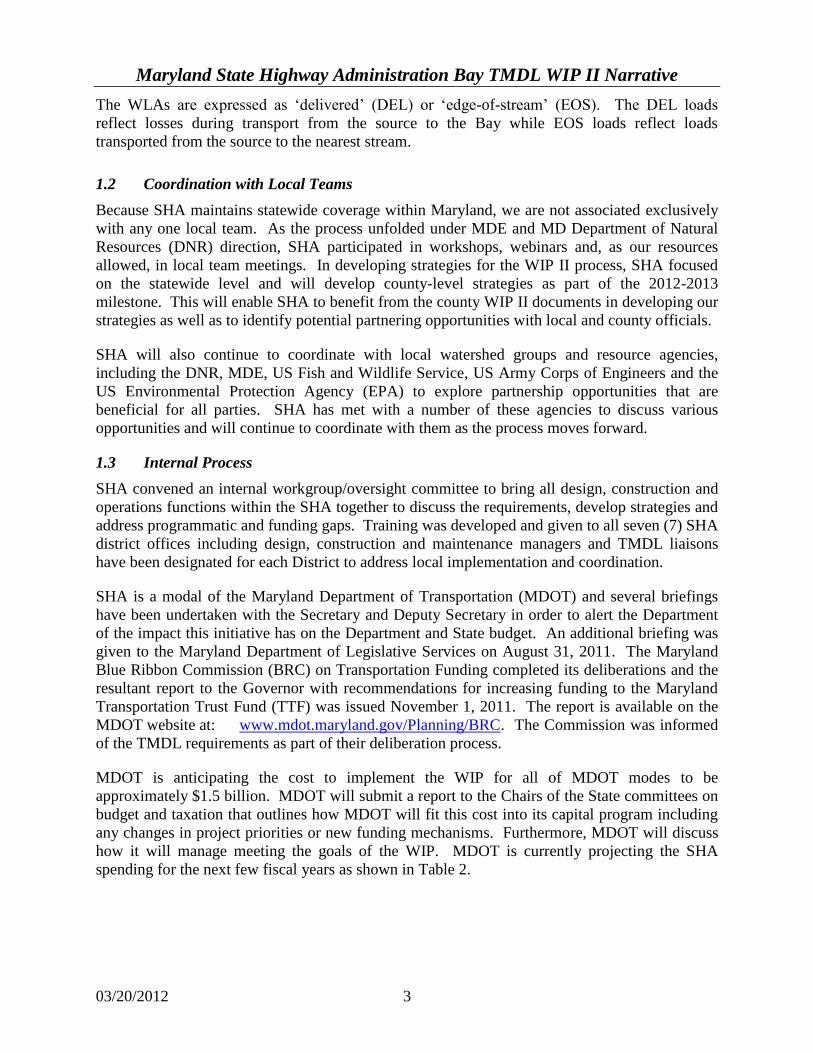
2011 Milestone (July 2009 to June 2011 plus BMPs missing from the Bay model)
Bioretention/Rain Gardens 91 Drainage Area Acres (AC) Restored
Maryland State Highway Administration Bay TMDL WIP II Narrative
03/20/2012 5
Dry Detention 306 Drainage Area AC Restored
Extended Detention Ponds 25 Drainage Area AC Restored
MS4 SW Retrofits 462 Drainage Area AC Restored
Catch Basin Cleaning 7,073,080 LBS Annually
Urban Filtering 175 Drainage Area AC Restored
Urban Infiltration (no sand/UD) 321 Drainage Area AC Restored
Urban Stream Restoration 21,168 LF of Streams Restored
Urban Tree Planting 721 AC Planted
Vegetated Open Channel 6,800 Drainage Area AC Restored (Assuming 6,729 AC
in open section roadways and the remaining in open
channel BMPs)1
Wet Ponds & Wetlands 1,451 Drainage Area AC Restored
2013 Milestone (July 2011 to June 2013) – 10% Implementation
Bioswales 292 Drainage Area AC Restored
MS4 SW Retrofits 273 Drainage Area AC Restored
Urban Stream Restoration 14,000 LF of Stream Restored
Urban Tree Planting 724 Acres Planted
Wet Ponds & Wetlands 12.3 Drainage Area AC Restored
2017 Milestone (July 2013 to June 2017) – 60% Implementation
Bioswale 142 Drainage Area AC Restored
Forest Conservation 50 Acres existing Forest within SHA R/W Conserved
MS4 SWM Retrofit 242 Drainage Area AC Restored
Outfall Stabilization (i.e., RCS) 1,625 Drainage Area AC Restored
Urban Filtering 260 Drainage Area AC Restored
Urban Infiltration (sand/No UD) 98 Drainage Area AC Restored
Urban Stream Restoration 9,300 LF Restored
Urban Tree Planting 1,167 AC Planted
2025 Milestone (July 2017 to June 2025) – 100% Implementation
Bioswale 823 Drainage Area AC Restored
MS4 SW Retrofit 776 Drainage Areas AC Restored
Outfall Stabilization (i.e., RCS) 5,216 Drainage Area AC Restored
Urban Filtering 171 Drainage Area AC Restored
Urban Infiltration (sand/No UD) 315 Drainage Area AC Restored
Urban Stream Restoration 30,000 LF Restored
Urban Tree Planting 3,045 AC Planted
1 SHA is in the process of working with the WMA NPDES regulators to develop a protocol for identifying and
documenting open section roadways and channels that will be considered to be providing impervious treatment
within the MS4 permit requirements. For WLA reduction, we are using the vegetated open channel to model the
reduction in loads.

Maryland State Highway Administration Bay TMDL WIP II Narrative
03/20/2012 6
2.3 Minor Municipal Wastewater Milestones (Non-Significant Municipal WWTP)
No milestones are proposed at this time.
2.2 Industrial Processed Wastewater Milestones (Non-Significant Industrial WWTP)
No milestones are proposed at this time.
2.4 Septic Milestones (OSDS)
No milestones are proposed at this time.
2.5 Programmatic Milestones
2013 Milestone (July 2011 to June 2013)
Allocate current funding to implementation strategies and assess needs for future
milestone funding. Develop implementation plan for future BMPs to become action
items as funding becomes available.
Develop ‘roadway disconnection’ protocol and obtain approval from MDE of
methodology.
Develop and implement program to upgrade outfalls. Obtain full implementation and
completion of outfall inspections within MS4 Phase I counties.
Complete county-level TMDL implementation strategy within MS 4 Phase I and II
counties (in cooperation with NPDES MS4 Phase I Permit requirement for TMDL
Implementation Plan for SHA). Develop county-level MAST scenarios as needed.
Complete development of programmatic funding and resource needs assessment
(program development and implementation staffing/maintenance activities/ dewatering
facilities/ equipment acquisition).
Complete development of tracking tools.
Quantify maintenance erosion & sediment control and permanent stabilization
improvement needs.
Participate and partner with MDE, and other counties towards development of alternative
strategies and establishment of efficiencies for currently known or new BMPs.
Initiate needed research or synthesis efforts.
Develop Memorandums of Agreement (MOAs) or general permits with regulatory
agencies.
2015 Milestone (July 2013 to June 2015)
As funding becomes available, activate next increment of the implementation plan.
Explore partnering or MOAs with interested public agencies for right-of-way dedication
for implementation or other partnership opportunities.
Evaluate existing open section roadways within MS4 Phase I areas according to above
protocol and provide documentation to MDE of available credit.
Completion of outfall inspections within MS4 Phase II counties.

Maryland State Highway Administration Bay TMDL WIP II Narrative
03/20/2012 7
Work with FHWA and others on Watershed Resource Registry (WRR) efforts to identify
watershed-scale opportunities for stormwater management.
Assess the SHA implementation plan effectiveness and make necessary changes and/or
adjustments.
2017 Milestone (July 2015 to June 2017)
As funding becomes available, activate next increment of the implementation plan.
Evaluate existing open section roadways within MS4 Phase II areas according to above
protocol and provide documentation to MDE of available credit.
Outfall remediation within MS4 Phase I counties 60% completed.
60% implementation of street sweeping and catch basin cleaning.
Assess 2017 goal implementation and refine plan for 2025 implementation.
2019 Milestone (July 2017 to June 2019)
Explore trading needs and opportunities.
Additional milestones as identified in 2017 evaluation.
2023 Milestone (July 2019 to June 2023)
Outfall remediation within MS4 Phase II counties 100% completed.
Additional milestones as identified in 2017 evaluation.
2025 Milestone (July 2023 to June 2025)
Outfall remediation within MS4 Phase I counties 100% completed.
Full implementation of street sweeping and catch basin cleaning.
Full implementation of TMDL strategy.
3. TRACKING, VERIFICATION AND REPORTING METHODS
SHA has an established geodatabase that contains the required MS4 storm drain assets that have
been collected over the last ten years in compliance with the Phase I and II MS4 permits. The
data includes stormwater management facilities, major outfall inspections, storm drain
conveyances such as pipes and ditches, storm structures such as manholes, endwalls and inlets,
and illicit discharge sampling results. SHA will continue to deliver this data to MDE according
to required database protocol as annual report delivery for the NPDES MS4 Phase I permit and
to the Bay program annually. This data will also be instrumental in developing and
implementing key components of the strategy including outfall remediation program, MS4
stormwater retrofits and developing county-level strategies.
Spatial data is also being developed for the various TMDL strategies outside the storm drain
MS4 data such as tree planting, stream restoration, street sweeping routes and watershed
restoration. A data review team comprised of staff from the various offices participating in the
TMDL implementation projects will provide quality assurance/quality control reviews of all
spatial and tabular data.

Maryland State Highway Administration Bay TMDL WIP II Narrative
03/20/2012 8
SHA is developing a custom application in a Geographic Information System (GIS) environment
that will track and generate reports for various parameters. Some potential reports can include
TMDL 2-year milestone progress, MS4 database annual delivery, the SHA business plan data,
Bay expenditures data and implementation status for StateStat or BayStat. The application will
be housed in the SHA Enterprise GIS (eGIS) environment and will be accessible by SHA
employees.
Tools developed by MDE or EPA such as MAST or the National Environmental Information
Exchange Network (NEIEN) will continue to be utilized as needed and/or required.
4. TECHNICAL DISCREPANCIES AND RECOMMENDED FUTURE STEPS
4.1 Results from SHA MAST Scenarios
Output from the MAST for our 2025 scenario (Table 3) indicates that the strategy will meet the
delivered loads for sediment and total nitrogen and 90% of the delivered load for phosphorus. In
order to meet the phosphorus WLA at 100%, SHA will need to manage approximately 1,896
LBS/YR more phosphorus (using the 2009 baseline provided by MDE). This additional load
reduction will be worked into our county-level scenarios that will be completed by the 2013
milestone.
Table 3. MAST Output & Pollutant Load Comparisons (LBS/YR)
Source N-EOS N-DEL P-EOS P-DEL S-EOS S-DEL
SHA 2009
Baseline 915,580 541,753 61,166 37,726 36,050,596 29,262,360
SHA 2017
Output 792,956 468,795 50,977 31,194 14,328,809 10,533,952
Target
2017 Load
(60%)
825,095 476,716 50,611 30,292 30,782,560 24,685,077
SHA 2025
Output 703,113 415,250 43,569 26,541 6,569,977 5,142,839
Target –
2025 WLA 764,772 433,357 43,574 25,336 27,270,536 21,633,555
Target
2025
Reduction
150,808 108,395 17,592 12,390 8,780,060 7,628,805
2025
Reduction
Achieved
212,467 126,503 17,597 11,185 29,480,619 24,119,521
Percent of
2025 Goal 141% 117% 100% 90% 336% 316%
A concern SHA has with the 2025 MAST scenario output is the fact that it is not meeting the
phosphorus reduction goal while at the same time exceeding the nitrogen and sediment
Maryland State Highway Administration Bay TMDL WIP II Narrative
03/20/2012 9
reductions. It is known that non-soluble phosphorus is tied to sediment and there would be a
certain level of correlation between the phosphorus and sediment reductions. But what we are
seeing in the output in our scenarios contradicts this expected outcome. In fact, our 2011 current
capacity scenario exceeds the sediment reduction goal without any additional BMPs being
implemented, while the 2025 scenario is not meeting the phosphorus reduction goal after the
strategy is fully implemented. What other explanations or guidance can be offered to help us
dissect the results to develop an equitable solution for meeting the phosphorus load?
Street Sweeping
Currently, the efficiencies used in MAST for Street Sweeping Pounds do not provide nutrient
reductions and sediment is the only pollutant reduced by this BMP. Street Sweeping Mechanical
Monthly provides nutrient reductions and must be swept twice per month or 25 times a year.
SHA has a strong interest in utilizing street sweeping as a strategy for meeting the pollutant load
reductions and will propose and conduct research to evaluate nutrient removal effectiveness
related to both the mass loading method (LBS) and the frequency of sweeping. SHA will
pursue this in cooperation with MDE and as prescribed for approval of BMP efficiencies by the
Chesapeake Bay Program as outlined in the Protocol for the Development, Review and Approval
of Loading and Effectiveness Estimates for Nutrient and Sediment Controls in the Chesapeake
Bay Watershed Model, March 15, 2010.
Street Sweeping Mechanical Monthly will be added to some of the county-level scenarios that
are under development and SHA is committed to provide this sweeping frequency when
possible. Street sweeping cannot be performed during freezing conditions, however, due to the
use of water in the sweeping process there is the potential of causing icy conditions along the
sweeping routes. Also, during winter precipitation events when the application of deicing agents
occurs, sweeping is curtailed in order to allow the deicing agents to remain on the travel lanes.
For these reasons, street sweeping along routes designated for the Street Sweeping Mechanical
Monthly BMP, may be swept less frequently during the winter months.
For streets that are currently swept, but less frequently than twice per month or 25 times per year,
Street Sweeping Pounds will be used until efficiencies are established for nutrient reductions at
less frequent sweeping intervals.
Catch Basin Cleaning
MAST and the Bay Model do not currently include Catch Basin Cleaning as an urban
stormwater BMP, but the NPDES Accounting Protocol does include it in the mass loading
method of calculating reductions. Because SHA will be required to demonstrate pollutant load
reductions and impervious treatment for the MS4 Phase I and II permits using the NPDES
Accounting Protocol, we used the Street Sweeping Pounds for catch basin load reduction in
MAST. Catch basin cleaning is a routine part of SHA maintenance operations and provides
significant sediment reductions at a minimum. To demonstrate this, SHA will pursue developing
research to characterize debris removed during catch basin and pipe cleaning and pursue
inclusion of catch basin cleaning as a BMP in the Bay model according to the review protocol.

Maryland State Highway Administration Bay TMDL WIP II Narrative
03/20/2012 10
4.2 Impervious Equivalencies for Alternative BMPs
Although the urban stormwater sector is provided with WLAs for the pollutants of concern, the
MDE WIP I document lists treatment of pre-1985 impervious surfaces as the requirement for
SHA Bay TMDL compliance for the MS4 phase I and II permit areas (30% for phase I and 20%
for phase II by 2017). For urban BMPs that treat impervious surfaces directly, this accounting
will be straightforward based on the land uses within the area draining to the urban BMP. But
for the alternative BMPs such as stream restoration, urban tree planting, urban forest buffers,
outfall stabilization and forest conservation (including agricultural BMPs that can be applied, see
discussion in Sections 4.4 and 4.5), impervious surfaces may not directly drain to the BMP
because the loads are reduced by land use changes or other methods in the model.
Accounting for impervious surfaces treated for these alternative BMPs is not clearly defined in
MAST but the NPDES Accounting Protocol provides guidance. Table 4 illustrates that the
impervious surface treatment requirement is exceeded in the proposed 2017 and 2025 milestones
using just urban BMPs but that treatment is even greater if impervious equivalencies are applied
to the alternative BMPs as well.
Based on the MAST impervious landuse allocated to SHA and the 20%/30% treatment
requirements, SHA needs to provide treatment for 6,501 acres of impervious to meet the
requirements of the WIP I document.
Table 4. SHA MS4 I/II Impervious Treatment based on MAST3
MAST Total Impervious
(AC)
MAST 2009 Baseline
Treatment Provided
(AC)
MAST 2009 Baseline
Treatment +
SHA Pre-1985 Treatment
Requirement (AC)
2017 Scenario Treatment
without Impervious
Equivalencies (AC)
1
2025 Target Treatment
without Impervious
Equivalencies (AC)
1
2025 Target Treatment
with Impervious
Equivalencies (AC)
2
Impervious Acres
26,988 8,162 14,663 14,236 15,872 20,184
Percent Based on Total SHA Impervious Land Use
100% 30% 54% 53% 59% 75%
Notes:
1. Includes 2009 baseline and all milestones preceding that designated. Does not include impervious equivalencies for
alternative BMPs.
2. Impervious Equivalencies for the 2025 Target treatment strategy are computed below using the 2010 NPDES
Accounting Protocol:
Stream Restoration (100 LF Restored = 1 Imp. AC): 74,468 LF/100 = 745 Imp. AC
Urban Tree Planting (1 AC Planted = 0.38 Imp. AC): 5,657 AC x 0.38 = 2,150 Imp. AC
Catch Basin Cleaning (1 TON = 0.4 Imp. AC): 7,073,080 LBS x. 0002 = 1,415 Imp. AC
Urban Forest Buffers (1 Acres = 0.34 Imp. AC): 6.61 AC x 0.34 = 2 Imp, AC
Total Impervious Equivalent BMPs: 4,312 Imp. AC
3. Evaluation for overlapping drainage areas or BMP treatment trains has not been made at this time. This impervious
treatment evaluation will be adjusted once this evaluation has been performed.

Maryland State Highway Administration Bay TMDL WIP II Narrative
03/20/2012 11
4.3 Acquiring Permits and Environmental Clearances for TMDL Projects
The acquisition of permits is a key component for the successful completion of the 2025
strategies and directly affects the ability to construct BMPs such as stream restoration, outfall
stabilization and urban stormwater BMPs. Permits necessary can include tidal and nontidal
wetlands, US waters, waterway construction, stormwater management (SWM), erosion and
sediment control (ESC), NPDES construction activity, floodplain, water quality certification,
forest conservation and reforestation, roadside tree, and Chesapeake Bay critical areas. In
addition, the National Environmental Policy Act (NEPA) and the Maryland Environmental
Policy Act (MEPA) ensure that properties are investigated for potential negative environmental
and cultural impacts. Two issues are fundamental to the successful acquisition of the necessary
permits: agency concurrence with project scope and permit/clearance acquisition timeframes.
Timeframes range from 6 months for SWM and ESC approvals, to 10-12 months for wetlands
and include not only State regulatory approval but also Federal commenting authorities. SHA
believes that in order to achieve successful implementation given that these are environmentally
beneficial projects, the hefty goals to achieve by 2017 and 2025, and resource limitations, it is
crucial to focus on permit streamlining. Therefore, SHA has begun to pursue general permits
and will rely on other streamlining processes.
4.4 Agricultural Practices Occurring on SHA-Owned Land
SHA owns hundreds of acres of land that are currently undergoing agricultural farming practices.
SHA will need to coordinate with the individual farmers to determine the exact nature of the
farming activities and discuss the possibility of implementing potential agricultural best
management practice strategies in order to receive additional nutrient and sediment reductions.
Potential agricultural strategies that will be investigated include, but are not limited to:
Forest Buffers
Grass Buffers
Tree Plantings
Conservation Tillage
Conservation Plans
Land Retirement
Cover Crops
Continuous No-Till Practices
Decision Agriculture Practices
Enhanced Nutrient Management
Currently, SHA has no mechanism in MAST to report agricultural practices. SHA will work
with MDE to determine the best approach for reporting agriculture practices implemented on
SHA-owned land through MAST.
4.5 Utilizing Agricultural BMPs for SHA WLA Credit
When developing our scenarios in MAST, it was discovered that several of the ‘land use change’
BMPs that SHA currently implements are not available to us because they are based on changes
from agricultural land uses rather than the two urban land uses allocated to SHA (impervious and
pervious).

Maryland State Highway Administration Bay TMDL WIP II Narrative
03/20/2012 12
Non-Urban Stream Restoration
SHA is investigating stream restoration projects that are located outside the SHA right-of-way.
The majority of these opportunities exist within agricultural land uses. For these opportunities,
SHA would like to request the use of the Non-Urban Stream Restoration strategy, which would
require a new agricultural land use option for SHA within the urban sector in MAST. This
would be a more appropriate estimation of the reductions associated with these stream
restoration efforts.
Land Use Changes for Pervious Urban to Forest vs. Agriculture to Forest
In coordination with DNR, the SHA participated in the Million Tree Initiative that resulted in
hundreds of acres of tree plantings throughout Maryland over the past few years. As part of this
effort, SHA planted trees on DNR property in all MS4 counties, in areas located off the SHA
right-of-way. In MAST, SHA does not have a mechanism to report these tree plantings. SHA
would like to request the inclusion of a new agricultural land use in the Urban Sector that would
utilize the same reductions that currently exist within the Agricultural Sector Tree Planting
strategy. Table 5, SHA Million Tree Initiative Plantings, outlines the total acreage per MS4
county for the SHA 2011 and 2013 milestones. Currently, these acreages are included as part of
the Urban Sector Tree Plantings within the SHA MAST scenarios.
Additionally, SHA is currently investigating tree plantings outside of the through-highway right-
of-way that are in rural/agricultural areas that would also be more appropriate under the
agricultural land use discussed above.
Table 5. SHA Million Tree Initiative Plantings
County 2011 - Current Capacity
(AC) 2013 (AC)
Anne Arundel 2.3
Baltimore 87.9 65.9
Carroll 8.0
Cecil 69.0 5.0
Charles 110.0
Frederick 49.0
Harford
Howard 102.0
Montgomery 9.0
Prince George's 31.5
Washington 3.3 13.7
Total 328.2 228.4

Maryland State Highway Administration Bay TMDL WIP II Narrative
03/20/2012 13
Non-Structural Wetland Restoration
Over the past few years, SHA has created 16.5 acres and enhanced 2.8 acres or wetlands, all
within MS4 Phase I Counties. These are man-made wetlands that do not contain structures and
are exclusively stewardship in nature. Table 6, Wetland Creation/Enhancement Sites, highlights
the details for each site.
The Chesapeake Bay Phase 5.3 Community Watershed Model, Section 6.7.6 Wetlands and Wet
Ponds refers to a water impoundment structure that intercepts stormwater runoff and states that:
“wet ponds and wetlands used as a BMP for managing urban stormwater runoff are
man-made landscape features that have characteristics and functions similar to their
natural counterparts.”
Although the SHA man-made wetlands do not contain impoundment structures, they do function
very similar to the wet ponds and wetlands discussed above by providing sediment and flood
flow retention and by providing de-nitrification. The thinking at SHA is that the man-made
wetlands that exist within an urban landscape and intercept stormwater runoff should receive the
same nutrient and sediment reductions as the wet ponds and wetlands discussed above. If this is
an acceptable method, the drainage area for each man-made wetland would need to be
determined so that the credit would be based on the larger drainage area. The efficiencies
associated with urban wetlands and wet ponds would be used to calculate the reductions of
nitrogen, phosphorus, and sediment within MAST. At this point the wetland creation acreages in
Table 6 have not been incorporated into the SHA 2011 capacity or 2013 milestone projections.
Table 6. Wetland Creation/Enhancement Sites
Site Name County Creation
(AC) Enhancement
(AC) Pre-BMP Land Use
2011 Capacity
Magness Farm Harford 5 2 Agriculture
2013 Milestone
Dorsey Run Howard 11.5 0.8 Urban
Agricultural Wetland Restoration
For created wetlands outside of the SHA right-of-way, SHA would like to request the use of the
agricultural efficiencies for wetland creation and enhancement, which would require a new land
use for SHA within the Urban Sector in MAST. These efficiencies are cited in the Chesapeake
Bay Phase 5.3 Community Watershed Model, Section 6.5.9 Agricultural Wetland Restoration.
SHA would like to utilize these efficiencies within MAST when developing strategies; however,
SHA does not currently have access to agricultural land uses. Table 6 differentiates the wetland
sites by urban or agricultural pre-BMP land use.

Maryland State Highway Administration Bay TMDL WIP II Narrative
03/20/2012 14
4.6 Nutrient Management
In support of the Maryland Nutrient Management Law, a Nutrient Management Plan (NMP) is
developed for all fertilizer applications on SHA right-of-way. SHA partners with the Maryland
Department of Agriculture and the University of Maryland to develop specifications and
fertilizer application rates. The default fertilizer application rate is 1,000 lb per acre of the
standard fertilizer analysis [10-22-22 (50% Ureaform) for projects advertised prior to 2008; 20-
16-12 (83% Ureaform with Monoammonium Phosphate and Sulfate of Potash) for projects
advertised in 2008 and later]. Soil tests for nutrient levels are conducted when possible on
topsoil being placed on SHA projects. These soil tests are used to develop custom NMPs to
reduce the amount of phosphorus and potassium being applied for turfgrass establishment
operations on the project (Table 7). Nitrogen levels remain constant at the University of
Maryland recommended levels to ensure optimal growing conditions and successful turfgrass
establishment.
Table 7. Phosphorus Reduction via Nutrient Management Plans
Calendar Year
Turfgrass Establishment
(AC)
Standard Application of Phosphorus
(LB)
Actual Application of Phosphorus
(LB)
Phosphorus Reduction via
NMPs (LB)
2007 162.4 35,728 25,438 10,290
2008 74.7 16,083 12,234 3,849
2009 106.3 20,555 14,996 5,559
2010 135.7 25,931 21,819 4,112
2011 104.8 17,481 8,641 8,840
Specification Change
On September 4, 2007, SHA released a Special Provisions Insert for Sections 705 – Turfgrass
Establishment and 708 – Turfgrass Sod Establishment (herein referred to as the 2008
Specifications). The 2008 Specifications changed the standard fertilizer analysis from 10-22-22
(50% UF) to 20-16-12 (83% UF with MAP & SOP) for projects advertised in 2008 or later. This
specification change resulted in a decrease of 60 pounds of phosphorus per acre for the default
fertilizer application rates when performing turfgrass establishment operations on projects
advertised under the 2008 Specifications (Table 8).

Maryland State Highway Administration Bay TMDL WIP II Narrative
03/20/2012 15
Table 8. Phosphorus Reduction via 2008 Specification Changes
Calendar Year
Turfgrass Establishment (acres)
Phosphorus Reduction (LBS)
2001 Specifications 2008 Specifications
2007 162.4 - -
2008 68.9 5.8 348
2009 59.1 47.2 2832
2010 70.2 65.5 3930
2011 11.9 92.4 5,544
4.7 Turfgrass Maintenance Operations
SHA suspended the roadside turfgrass maintenance program in 2009. The roadside turfgrass
maintenance program applied fertilizer to roadside areas where turfgrass coverage was thin and
additional groundcover was required. The suspension of this program resulted in an average
annual credit of 57,022 lb of nitrogen and 11,679 lb of phosphorus through the elimination of
turfgrass maintenance fertilizer applications (Table 9). Based on these changes, SHA would like
to apply reductions to our 2011 capacity totals.
Table 9. Nitrogen and Phosphorus Reductions via Suspending
Turfgrass Maintenance Operations
Calendar Year Acres
Nitrogen Application
(LB)
Phosphorus Application
(LB)
2007 702.6 50,932 10,329
2008 556.8 63,111 13,028
2-Year Average 629.7 57,022 11,679

Maryland State Highway Administration Bay TMDL WIP II Narrative
03/20/2012 16

STATUS OF WATERSHED MANAGEMENT
AT USM INSTITUTION CAMPUSES 10/18/11
CONSOLIDATED RESPONSES BY INSTITUTION TO GENERAL
STORMWATER AND FORESTATION QUESTIONS
______________________________________________________
Contents
______________________________________________________
BSU (Bowie State University) 1
CSU (Coppin State University) 4
FSU (Frostburg State University) 6
SU (Salisbury University) 8
TU (Towson University) 10
UB (University of Baltimore) 15
UMB (University of Maryland, Baltimore) 17
UMBC (University of Maryland, Baltimore County) 19
UMCES (University of Maryland Center for Environmental Science) 21
UMCP (University of Maryland, College Park) 25
UMES (University of Maryland, Eastern Shore) 28
UMUC (University of Maryland University College) 30
Submitted by Mark Beck, USM Office of Capital Planning, 301-445-1984, [email protected]

1
BOWIE STATE UNIVERSITY
RESPONSE TO STORMWATER AND FORESTATION QUESTIONS
10/11/11
1. What is the general status of your storm water management and reduction/treatment
activities?
The BSU campus is in full compliance with all MDE Erosion and Sediment Control and Storm
water Management and DNR Forestation regulations including full implementation of the new
MDE ESD requirements. The campus is currently completing a major retrofit of existing pond
areas into a storm water management facility which will serve a large part of the campus.
The BSU campus contains four distinct drainage areas. Two significant drainage areas DA-1 and
DA-2 exist at the campus core area where most buildings are located. DA-1 and DA-2 include
approximately 190 acres of land which drain into the storm water management ponds along the
east portion of the campus. The ponds eventually discharge into the Eastern Regional Storm
water Management Facility that exists outside the Loop Road on the northeast corner of the
campus property.
The southern portion of DA-2 drains into the storm water management pond located within the
Henry Circle. This pond eventually flows via an underground storm drain piping network into
the Eastern Regional Storm water Management Facility. The western portion of the campus
represents DA-3 which mainly storm flows off parking lots A,B,C,D,E, and O into a bio-
retention area adjacent to lots D and E then flows across Campus Loop Road to a woodlands
south of the entrance road and in between Route 197 and Jericho Park Road. DA-4 drains into an
existing stream in a southeast direction and flows off the campus land.
2. Do you have specific data to provide regarding storm water waste load allocations and
the amount of impervious acres vs. acres treated, as defined in the State’s guide? If so,
what is available for your campus? The State provides guidance in calculating the impact
of your activities.
Yes, but data is based on each project.
3. Regardless of the response to #2, can you identify general activities tied to the list of
EPA categories (bullets) above? These are things that would be considered “best practices”
like green roofs, removing impervious surfaces, providing retention and treatment for
storm water for new or existing development, stream fencing, tree planting, etc. Are they
or can they be quantified in terms of impact on the whole? Can their impact be state in
terms of when they were implemented?
All Bowie State University projects will embrace the university’s sustainable goals consistent
with new State of Maryland regulations. Sustainable strategies include the following:
Retaining natural wooded areas to maximum extent

2
Supporting the commitment to LEED Silver level construction for future new
construction and renovation projects
Encouraging multi-story buildings, minimizing building footprint
Fully respecting the extensive, natural woodlands leading to the Patuxent National
Wildlife Research Refuge
Safe guarding natural wetlands and environmentally sensitive areas
Building on previously developed areas
Adopt green landscaping practices including composting, organic fertilizer etc.
4. Do you have survey information—specifically quantitative, mapped data that show
topography, the extent of impervious surfaces, forested areas, landscaped (grass) areas,
etc? DNR is willing to help assemble a database of campus lands in a Geographic
Information System (GIS) format that would allow layering, analysis, and calculation of
impacts, if we can provide it to them.
The campus has a comprehensive map of Forest Conservation Easements. (Available upon
request.) See Table on following page.
CAMPUS MASTER PLAN
http://www.bowiestate.edu/about/cabinet/admin_finance/fac_mgmt/facilities_plan/
NOTE: BSU’s master plan was recently updated and presented to the Board of Regents. This is
the previous plan and will be updated soon.
CAMPUS SUSTAINABILITY PAGE
http://www.bowiestate.edu/about/sustainability/

3
4
COPPIN STATE UNIVERSITY
RESPONSE TO STORMWATER AND FORESTATION QUESTIONS
10/3/11
1. What is the general status of your stormwater management and reduction/treatment
activities?
We just recently completed our new quad that was converted from 95% landscape to mostly
green space and reduced the storm water run-off in this area by 50%. That project includes water
harvesting by using of (2) 15,000 gallon cisterns that collect rainwater from the roof tops, and
from condensing units. The collected water is then used for our lawn irrigation. We are in the
design phase of our newest building and are exploring the options of cisterns, green roofs, and
rain gardens.
2. Do you have specific data to provide regarding stormwater wasteload allocations and
the amount of impervious acres vs. acres treated, as defined in the State’s guide? If so,
what is available for your campus? The State provides guidance in calculating the impact
of your activities.
Not available.
3. Regardless of the response to #2, can you identify general activities tied to the list of
EPA categories (bullets) above? These are things that would be considered “best practices”
like green roofs, removing impervious surfaces, providing retention and treatment for
stormwater for new or existing development, stream fencing, tree planting, etc. Are they or
can they be quantified in terms of impact on the whole? Can their impact be state in terms
of when they were implemented?
Construction site runoff control -The use of silt fence, and inlet protection on the job site.
Self monitoring. Compliance with MDE requirements for sediment and erosion controls.
Pollution prevention/good housekeeping - The use of inlet protection. No dumping of
hazardous materials, no washing off of truck or equipment into inlets during construction.
We are in the design phase of our newest building and are exploring the options of cisterns,
green roofs, and rain gardens. We are also are in the process of demolishing the Coppin Center
Building with a hardscape foot print of approximately 60,000 S.F. and replacing it with a
approximately 40,000 S.F. of green space and the planting of 85 new trees and various native
plants. The remaining space will be used for parking..
4. Do you have survey information—specifically quantitative, mapped data that show
topography, the extent of impervious surfaces, forested areas, landscaped (grass) areas,
etc? DNR is willing to help assemble a database of campus lands in a Geographic
Information System (GIS) format that would allow layering, analysis, and calculation of
impacts, if we can provide it to them.
Not available.

5
CAMPUS MASTER PLAN
http://www.coppin.edu/CapitalPlanning/MasterPlan.aspx
CAMPUS SUSTAINABILITY PAGE
http://www.coppin.edu/Green/

6
FROSTBURG STATE UNIVERSITY
RESPONSE TO STORMWATER AND FORESTATION QUESTIONS
10/13/11
1. What is the general status of your storm water management and reduction/treatment
activities?
The campus of Frostburg State University is located on 262 acres. There are 130 acres of
forested land, 71 acres of maintained lawn and athletic areas, 58 acres of impervious area, which
include 15 acres of building roofs, and 3 acres of wetlands. Frostburg State University’s Storm
Water Management (SWM) facilities treat 35 acres of the 58 acres of impervious areas.
There are five SWM facilities located on the property. We are also working with the city of
Frostburg and the Allegany Soil Conservation Department to install a major SWM pond facility
this fall that will treat 3 acres of FSU impervious area and 20 more acres of the City of
Frostburg.
2. Do you have specific data to provide regarding stormwater wasteload allocations and
the amount of impervious acres vs. acres treated, as defined in the State’s guide? If so,
what is available for your campus?
Yes we do have data but not as defined in the State guide. Our data are per the MD SWM
regulations.
3. Regardless of the response to #2, can you identify general activities tied to the list of
EPA categories (bullets) above? These are things that would be considered “best practices”
like green roofs, removing impervious surfaces, providing retention and treatment for
stormwater for new or existing development, stream fencing, tree planting, etc. Are they or
can they be quantified in terms of impact on the whole? Can their impact be state in terms
of when they were implemented?
1999 – Frostburg State University installed a 3 acre parking lot that is pervious system of
recycled plastic material and clean stone. This lot has been in place for 10 years and is still
being used.
2005 - Frostburg State University installed a new storm drain system throughout campus.
The main objective for the project was to separate any combined sanitary sewer drains and
storm drains on campus.
2009 – Frostburg State University was awarded a grant to plant over 5000 trees. The trees
were planted on campus by the Biology Department and volunteers. The trees are
maintained by the Physical Plant personnel.
2010 - Frostburg State University installed a rain garden that captures rain water from the
Gunter Hall roof leader system and replenishes the ground water reserves. This rain garden

7
treats 1 acre of impervious area. We are looking into installing these rain gardens all over
campus. The rain gardens not only replenish the ground water and provide water for the
plants in the gardens, they also decrease the amount of water running into our storm drain
system.
2011 – Frostburg State University is working with the city of Frostburg and the Allegany
Soil Conservation Department to install a major SWM pond facility this fall that will treat 3
acres of FSU impervious area and 20 more acres of the City of Frostburg
4. Do you have survey information—specifically quantitative, mapped data that show
topography, the extent of impervious surfaces, forested areas, landscaped (grass) areas,
etc?
Yes. The Physical Plant Department has aerial mapping with topography for the entire campus.
The different land uses have been delineated on the mapping.
CAMPUS MASTER PLAN + UPDATE (INCLUDES TOPO MAPS)
http://www.frostburg.edu/admin/pplant/downloads.htm
CAMPUS SUSTAINABILITY PAGE
http://www.frostburg.edu/LGLG/
8
SALISBURY UNIVERSITY
RESPONSE TO STORMWATER AND FORESTATION QUESTIONS
10/11/11
1. What is the general status of your storm water management and reduction/treatment
activities?
The existing storm water system is generally in good condition. No major repairs or
improvements are planned. Regular monitoring occurs to ensure that inlets, pipes, and outlets are
operating properly. Issues are addressed on an as needed basis. Construction projects follow
MDE standards. There is, however, no master plan for addressing or improving the campus’
storm water system.
2. Do you have specific data to provide regarding storm water waste load allocations and
the amount of impervious acres vs. acres treated, as defined in the State’s guide? If so,
what is available for your campus? The State provides guidance in calculating the impact
of your activities.
We do not have specific data to provide regarding stormwater wasteload allocations and the
amount of impervious acres vs. acres treated.
3. Regardless of the response to #2, can you identify general activities tied to the list of
EPA categories (bullets) above? These are things that would be considered “best practices”
like green roofs, removing impervious surfaces, providing retention and treatment for
storm water for new or existing development, stream fencing, tree planting, etc. Are they
or can they be quantified in terms of impact on the whole? Can their impact be state in
terms of when they were implemented?
We are actively addressing construction site runoff control, post-construction runoff control, and
pollution prevention/good housekeeping. Construction projects follow all MDE standards and
achieve LEED Silver rating including Stormwater Design credits. Recent projects (after January
2006) have incorporated underground cisterns in order to capture water on site. Our Horticulture
and Grounds department maintains grounds, parking lots, and storm water basins to remove trash
and debris in addition to weeding by hand versus chemical spraying.
4. Do you have survey information—specifically quantitative, mapped data that show
topography, the extent of impervious surfaces, forested areas, landscaped (grass) areas,
etc? DNR is willing to help assemble a database of campus lands in a Geographic
Information System (GIS) format that would allow layering, analysis, and calculation of
impacts, if we can provide it to them.
Yes, we do have survey data that could be used in a GIS format to calculate areas for the
majority of campus. However, significant portions of our East Campus mapping are not accurate
enough for this purpose. Additionally, we have recently acquired new properties for which there
is little to no data.

9
CAMPUS MASTER PLAN
http://www.salisbury.edu/president/fmp/
CAMPUS SUSTAINABILITY PAGE
http://www.salisbury.edu/president/sustainabilityinitiatives/
OTHER RELATED RESOURCES
Excellent presentation from SU Smart Growth Day
http://www.salisbury.edu/geography/smartgrowth/documents/Marsh_Green%20Site%20Design.

10
TOWSON UNIVERSITY
RESPONSE TO STORMWATER AND FORESTATION QUESTIONS
10/6/11
1. What is the general status of your storm water management and
reduction/treatment activities?
Towson University (TU) applied for and was awarded an NPDES general permit for
campus in 2005 and will need to be renewed in 2011. TU completed a Stormwater
Management Master Plan in July 2006 in coordination with and support of its capital
improvement program and NPDES permit. TU also developed an NPDES Strategic Plan
in February 2007 that set forth goals to address the Notice of Intent (NOI) minimum
control measures for compliance issued with the general NPDES Permit. Copies of these
documents have not been attached, but can be provided as needed.
TU has made substantial progress in implementing the Stormwater Master Plan and has
advanced the one-time and on-going goals established in the NPDES Strategic Plan.
Following is a summary of the goals established for each of the NOI control measures
and the progress TU has made to date.
Public Education & Outreach
Use TU webpage to disseminate information to citizens and provide links to sites
with extensive non-point source pollution information. Develop a website banner to
advertise agency’s stormwater program from time to time.
The TU website and the Daily Digest electronic bulletin have been used over the
past six years to disseminate information to the campus community & provide
electronic links to sites containing non-point source pollution information, as well
as providing a designated campus contact for reporting stormwater issues. The
university has also developed environmental case studies, one of which is focused
on the implementation of a major campus stormwater management facility which
was completed in 2010, that are posted on the TU website as an educational
resource for students, faculty, staff, alumni and visitors.
http://www.towson.edu/adminfinance/gogreen/greencampus/documents/Casestud
y_stormwater.pdf
A description of the stormwater management strategies and best practices
proposed for future campus construction projects was provided in the 2009
campus master plan.
http://www.towson.edu/adminfinance/facilities/masterplan/documents/2009Maste
rPlanCompleteupdate11910.pdf
Since 2007, TU has sponsored an annual Environmental Conference open to all
TU students, faculty, staff and alumni that include presentations on a variety of
environmental topics. Although not required, the conference typically includes
presentations that address issues of water quality and stormwater management.
http://www.towson.edu/studentaffairs/civicengagement/environmentalInitiatives/e
nvironmentalConference.asp

11
Public Involvement and Participation
Schedule and promote an annual restoration activity such as stream monitoring, storm
drain stenciling and/or stream side tree plantings.
Over the past six years TU has accomplished the following:
- Annual campus stream(s) clean up and monitoring day in April
- Stenciling of all storm drain inlets across campus to increase awareness
- Annual condition assessment reports for the two restored stream segments on
campus
- Annual tree planting events on campus
- Established numerous student volunteer groups to participate in cleaning up
campus, removing invasive vegetation species, planting trees and promoting
environmental stewardship
http://www.towson.edu/adminfinance/gogreen/involved/
Illicit Discharge Detection & Elimination
Develop a program for identifying and eliminating illicit connections to the storm
drain system including: 1) Mapping of all facilities and water resources, 2) Locate
and inspect 10% of the outfalls annually per MDE’s visual/olfactory inspection sheet,
and 3) Develop a procedure for investigating and eliminating illicit connections to the
storm drain system.
Mapping of all stormwater outfall facilities and water resources was completed
and included in the NPDES Strategic Plan dated February 2007. A copy of this
document can be provided as needed. The TU Office of Environmental Health and
Safety inspects 10% of the outfall facilities annually using the required MDE
inspection method and sheet. The results of the inspection are shared with
Facilities Management and any required action to remediate or eliminate illicit
connections is planned and budgeted.
Construction Site Runoff and Control
Work with the Maryland Department of Environment (MDE) to enforce erosion and
sedimentation control requirements for construction project in compliance with the
terms and conditions of the issued permit.
TU complies with the rules, regulations and requirements of the MDE issued erosion
and sedimentation control permit in the completion of all campus construction
projects.
Post Construction Stormwater Management

12
Work in partnership with MDE to monitor and maintain built stormwater
management facilities after construction to keep them in good working order and in
compliance with all applicable requirements.
TU complies with the rules, regulations and requirements of the MDE issued
erosion and sedimentation control permit in the monitoring and maintenance of
stormwater facilities after completion of construction.
Pollution Prevention & Good Housekeeping
Develop a pollution prevention plan in accordance with the general NPDES permit,
which includes mapping all facility property and the stormwater outfalls and water
resources of campus.
A plan was developed in February of 2007 and can be provided as needed.
2. Do you have specific data to provide regarding storm water waste load allocations
and the amount of impervious acres treated, as defined in the State’s guide? If so,
what is available for your campus?
Yes, this data exists, but needs to be consolidated and summarized and can be as
needed.
3. Regardless of the response to #2 above, can you identify general activities tied to the
list of EPA categories? These are things that would be considered “best practices”
like green roofs, removing impervious surfaces, providing retention and treatment
for storm water for new or existing development, stream fencing, tree planting, etc.
Are they or can they be qualified in terms of impact on the whole? Can their impact
be stated in terms of when they were implemented?
Following is a partial list of some “best practices” that Towson University has employed
and implemented over the past six years. Please note that more detailed information is
available for each and can be provided as necessary.
- Stream Restoration: The Towson Branch stream segment at the Residence Tower was
restored as part of the Towsontown Garage expansion project in 2007. Restoration
included stabilization of bank erosion using soil bioengineering, containing lateral
scouring with boulder toe protection and rock vanes and reforesting of mowed stream
banks, construction of a bio-retention facility, and reconstruction of the storm outlet
structure to stabilize and remediate eroded areas.
- Conversion of Impervious Area to Pervious Area: As part of the College of Liberal
Arts Building project a 1.5 acre surface parking lot (#5) was converted into a
regional stormwater management facility topped with a pervious open green space in
2010. This conversion, along with those achieved through other campus capital
projects, has resulted in a net gain of approximately 2.5 acres of pervious area on

13
campus, which is halfway to the 5 acre goal established in the 2009 campus master
plan.
- http://www.towson.edu/adminfinance/gogreen/greencampus/documents/Casestudy_st
ormwater.pdf
- Regional Stormwater Treatment Facility: The above referenced regional stormwater
management facility addressed the new College of Liberal Arts building, future
buildings in the sub-watershed and 8 existing buildings in the main academic campus
that had no quantitative or qualitative treatment prior to completion of the project.
This facility was used to establish a stormwater quality bank on campus and currently
has 27.6 acres of credits. More specifically, the facility involved the following:
o Existing and future buildings that will drain into and be treated by the new
facility include:
1. Health Professions (future)
2. Glen Esk
3. Prettyman Hall
4. Scarborough Hall
5. Newell Dining Hall
6. Cook Library
7. Power Plant
8. Richmond Hall (partial)
9. Van Bokkelen (partial)
Area draining to proposed SWM facilities ~ 19 acres and of that total 13
acres will be impervious with 9 buildings within SWM facility drainage area
(existing, proposed and future...see above)
Underground Detention Facility (slows down water to allow filtering and a
slow, managed release into the Towson Run Stream to avoid erosion)
* Approximately 330 LF of 7 foot diameter pipe
* Approximately 61,000 cubic feet of storage available
* Provides control for 1-year and 100-year storms
* Provides control for approximately 5 acres of "new" impervious area
Underground Sand Filter (Filters out sediment, oils, greases and other
pollutants that run off parking lots, roofs, and other impervious areas)
* Approximately 150 lineal feet of three chambered concrete vault

14
* Sized to treat 2.6 acres of impervious area
* Approximately 10,800 cubic feet of storage
Recharge Trench (Very important to allowing the stormwater to percolate into
the local aquifer and ground water supply to recharge it versus sweeping it off
site and downstream)
* Approximately 90 lineal feet of 18" perforated pipe
* Provides dead storage for approximately 1000 cubic feet of stormwater
to recharge groundwater levels
- Forest Conservation Bank: Established a forest conservation bank with a total area
of 15 acres of high priority forest stands in perpetual easements. These high priority
areas generally encompass environmentally sensitive areas such as wetlands,
floodplains, steep slopes, hydric soils, and minimum density of mature and specimen
trees established by the Department of Natural Resources to qualify as a high priority
forest stand.
4. Do you have survey information—specifically quantitative, mapped data that show
topography, the extent of impervious surfaces, forested areas, landscaped (grass)
areas etc.?
TU has an electronic base map showing all natural and built surface features, including
ortho-photogrammetric topography at 2’ and 5’ contours. The map is currently being
used in the development of the campus sustainability plan that will include an assessment
of pervious versus impervious areas on campus to identify progress and use for future
monitoring. The results of this assessment and the electronic map can be made available
for use on this initiative.
CAMPUS MASTER PLAN
http://www.towson.edu/adminfinance/facilities/masterplan/
CAMPUS SUSTAINABILITY PAGE
http://www.towson.edu/adminfinance/gogreen/
OTHER RELATED RESOURCES
(see links in text above)

15
UNIVERSITY OF BALTIMORE
RESPONSE TO STORMWATER AND FORESTATION QUESTIONS
10/14/11
1. What is the general status of your storm water management and reduction/treatment
activities?
The University of Baltimore is located in downtown Baltimore in the Mount Vernon
neighborhood and, as such, we do not have separate storm water system. Over the last three
years we have completed a number of projects that directly impacted the storm water runoff on
our campus. We installed a green roof on our existing law school as part of our Energy
Performance Contract and we planted 60 new trees around the campus, which resulted in
reducing the impervious surfaces due to the large tree pits and planters that were a part of this
project. We are also currently in the midst of construction on our new law school, which is
projected to be LEED Platinum certified. The design includes a rain harvesting system
composed of two 10,000 gallon tanks, a significant green roof over the moot courtroom, and a
number of planters and trees on the terraces.
2. Do you have specific data to provide regarding storm water waste load allocations and
the amount of impervious acres vs. acres treated, as defined in the State’s guide? If so,
what is available for your campus? The State provides guidance in calculating the impact
of your activities.
At this point we have not developed storm water waste load allocations or data regarding our
impervious acres vs. acres treated per the State guide.
3. Regardless of the response to #2, can you identify general activities tied to the list of
Control Measures (bullets from original e-mail)? These are things that would be considered
“best practices” like green roofs, removing impervious surfaces, providing retention and
treatment for storm water for new or existing development, stream fencing, tree planting,
etc. Are they or can they be quantified in terms of impact on the whole? Can their impact
be stated in terms of when they were implemented?
The following is a list of “best practices” that have either been fully implemented or are
underway:
Installation of 7,500 sqft green roof on the existing law school (completed in 2009)
Reduced the impervious surfaces by 4000 sqft around the campus by planting 60 trees
and new planters on the sidewalks (completed in 2010)
Constructing a LEED Platinum Law School with two 10,000 gallon rain harvesting tanks,
a green roof and planters at terraces where we used to have a .7 acre parking lot
(completion in Jan, 2013)
Converted a 4.5 acre parking lot into a new private residential complex under a Public
Private Partnership (completed in 2009)
Converted a .36 acre parking lot into a new private residential complex under a Public
Private Partnership (completion in July, 2011)

16
Providing ongoing training to plant staff on regulations relative to how to appropriately
handle chemicals, oils, paints, etc so that they are not introduced to the storm water
system.
Providing educational programs for the public that is focused on the Jones Falls and
Chesapeake Bay watersheds.
Organizing three to four annual tree planting expeditions with the UB Sustainability
Taskforce and the Chesapeake Bay Foundation that have so far resulted in hundreds of
new trees being planted in the Chesapeake Bay watershed.
4. Do you have survey information—specifically quantitative, mapped data that show
topography, the extent of impervious surfaces, forested areas, landscaped (grass) areas,
etc? DNR is willing to help assemble a database of campus lands in a Geographic
Information System (GIS) format that would allow layering, analysis, and calculation of
impacts, if we can provide it to them.
We currently do not have a campus wide survey that details our topography or the extent of
impervious surfaces, forested areas, etc. We would be interested in working with DNR to
develop the necessary data for our campus.
CAMPUS MASTER PLAN
http://www.usmd.edu/BORPortal/Materials/2011/FC/20110317/FCPS3.pdf
CAMPUS SUSTAINABILITY PAGE
http://www.ubalt.edu/about-ub/ub-s-future/ubgreen/index.cfm

17
UNIVERSITY OF MARYLAND, BALTIMORE
RESPONSE TO STORMWATER AND FORESTATION QUESTIONS
10/10/11
1. What is the general status of your storm water management and reduction/treatment
activities?
The University of Maryland Baltimore does not have a separate stormwater management plan.
As a downtown campus, our stormwater is discharged into the Baltimore City stormwater system
and we are covered by their plan. Each of our construction projects usually involves a site that is
already impermeable surface. We then comply with MDE stormwater management requirements
that usually involve additional filtration and sand filters.
2. Do you have specific data to provide regarding storm water waste load allocations and
the amount of impervious acres vs. acres treated, as defined in the State’s guide? If so,
what is available for your campus? The State provides guidance in calculating the impact
of your activities.
We do not track waste load allocations or number of treated acres.
3. Regardless of the response to #2, can you identify general activities tied to the list of
EPA categories (bullets) above? These are things that would be considered “best practices”
like green roofs, removing impervious surfaces, providing retention and treatment for
storm water for new or existing development, stream fencing, tree planting, etc. Are they
or can they be quantified in terms of impact on the whole? Can their impact be state in
terms of when they were implemented?
We have two green roofs installed, one on the School of Social Work and one on Building one in
the BioPark. In addition the roof on the LEED Gold School of Pharmacy Addition uses reflective
roofing and contains elevated drains to collect rainwater and allow for gradual discharge into the
stormwater system. We have been trying to work with the MDE to implement a “Gray to Green”
program that converts currently paved surfaces such as parking areas and unused sidewalks to
permeable surfaces. We have identified about a half acre of potential sites on campus and are
trying to work with MDE to bank the credits.
4. Do you have survey information—specifically quantitative, mapped data that show
topography, the extent of impervious surfaces, forested areas, landscaped (grass) areas,
etc? DNR is willing to help assemble a database of campus lands in a Geographic
Information System (GIS) format that would allow layering, analysis, and calculation of
impacts, if we can provide it to them.
We are starting to survey the campus and calculate the total of permeable and impermeable
surface for our information. We do not currently have that information but should have it in a
few months.

18
CAMPUS MASTER PLAN
http://www.facilitiesplan.umaryland.edu/
CAMPUS SUSTAINABILITY PAGE
http://gogreen.umaryland.edu/

19
UNIVERSITY MARYLAND BALTIMORE COUNTY
RESPONSE TO STORMWATER AND FORESTATION QUESTIONS
10/18/2011
1. What is the general status of your storm water management and reduction/treatment
activities?
UMBC currently has 8 stormwater management facilities within 450 acre main campus which
are regularly maintained and cleaned per Maryland Department of Environment’s guidelines.
These facilities have been constructed over a period of time as per MDE regulations. The recent
construction projects are in conformance with the new Stormwater Management Act of 2007
which are implemented with the new environmental site design (ESD) to the maximum extent
practice (MEP). These projects include the following environmental goals:
a. Performing Arts and Humanities Building
The project is presently under construction within two large parking lots which
encompasses approximately 213,477 square feet (4.9 acres) of 100% impervious surface.
The new 120,000 NASF building construction is to convert the 60,000 square foot area
(1.4 acre) to pervious surface which consists of green roof and grass area. In conjunction
with this project two main outlets and the storm drainage systems were upgraded and
improved.
b. Patapsco Hall Addition
The project was designed and built under the new MDE’s 2009 Stormwater Design
Manual. The project produced eight fully vegetated micro bio-retention facilities, one
grass bio-wale, and one 900 square feet green roof.
c. Campus Access, Parking, Walkway and Wayfingding Project
To minimize runoff, a total of 14,000 square feet of pervious paver is incorporated to the
expanded parking surface.
d. Lot 1 Expansion Project
The project was designed and built under the new MDE’s 2009 Stormwater Design
Manual. The project produced eight fully vegetated micro bio-retention facilities.
2. Do you have specific data to provide regarding storm water waste load allocations and
the amount of impervious acres vs. acres treated, as defined in the State’s guide? If so,
what is available for your campus? The State provides guidance in calculating the impact
of your activities.
UMBC currently has no calculated data ready to use, but the raw database is available to
calculate stormwater baseline loads and BMP pollutant removal efficiencies.
3. Regardless of the response to #2, can you identify general activities tied to the list of
Control Measures (bullets from original e-mail)? These are things that would be considered
“best practices” like green roofs, removing impervious surfaces, providing retention and

20
treatment for storm water for new or existing development, stream fencing, tree planting,
etc. Are they or can they be quantified in terms of impact on the whole? Can their impact
be stated in terms of when they were implemented?
Some additional control measures may include: using pervious paving material such as pervious
asphalt/ pervious concrete/ pervious paver/ grass-crete, deep tilling practice, and soil
amendments
4. Do you have survey information—specifically quantitative, mapped data that show
topography, the extent of impervious surfaces, forested areas, landscaped (grass) areas,
etc? DNR is willing to help assemble a database of campus lands in a Geographic
Information System (GIS) format that would allow layering, analysis, and calculation of
impacts, if we can provide it to them.
UMBC has all necessary data, means to compute the data, and the maps in digital formats. The
analytical and quantitative mapping and calculations can be achieved with outside assistance.

21
UNIVERSITY OF MARYLAND CENTER FOR ENVIRONMENTAL SCIENCE
RESPONSE TO STORMWATER AND FORESTATION QUESTIONS
10/5/11; rev10/10/11
THREE SITES:
AL (Appalachian Lab, Frostburg)
HPL (Horn Point Lab, Cambridge)
CBL (Chesapeake Bay Lab, Solomons)
1. What is the general status of your stormwater management and reduction/treatment
activities?
AL
The Appalachian Laboratory sits on approximately 10.95 acres of partially wooded land in
western Maryland. It is located on the northwest side of Midlothian Road and southwest end of
the Frostburg State University Campus in the city of Frostburg. 3.4 acres is impervious, roofed
or paved. 2.45 has been left undisturbed, mostly wooded. The remaining areas are grassed or
landscaped.
The initial SWM project was reviewed and permitted under MDE # 97-SF-0188. As a result,
two surface sand filters were constructed as part of the Appalachian Laboratory, Center for
Environmental Sciences to provide water quality control for the proposed project development.
These two stormwater management dry pond structures were constructed to control stormwater
runoff from the newly constructed facility. Stormwater Quality Area #1, located at the southeast
corner of the site, off the Administration wing of the building and Stormwater Quality Area #2,
located at the north east corner of the site, off the Laboratory wing of the building adjacent to the
loading dock.
HPL
General status is that Horn Point has maintained the systems that were installed for each new
construction. These systems have been, a sediment trap, level spreader and most recently a rain
garden
CBL
The CBL campus is on-track with their plan. We continue to make improvement to channel
storm water to rain gardens and dedicated landscaping using tools such as rain-barrels with
attached soaker-hoses at all available downspout locations.
2. Do you have specific data to provide regarding stormwater wasteload allocations and
the amount of impervious acres vs. acres treated, as defined in the State’s guide? If so,
what is available for your campus? The State provides guidance in calculating the impact
of your activities.

22
AL
Total Area of AL Property: 10.95 ACRES
Area Disturbed during Construction: 8.5 ACRES
Area Undisturbed (mostly wooded): 2.45 Acres
Building Construction Completed: December 1998
Total Area Roofed or Paved: 3.5 ACRES
Number of Stormwater Management Ponds: 2
These were designed and installed per NRCS-MD Code No. 378 Pond Standards/Specifications.
All ASTM and AASH TO standards were compliant with the most recent version at the time of
original construction.
The sand filters were designed in 1997, which was prior to the MDE having standard design
calculations and standard details for surface sand filters. The filters were designed to provide
Water Quality treatment for 1/2” of run-off over the proposed impervious area. The facilities
were designed as “off-line” facilities with flow splitters located in upstream manholes. Surface
sand filters became an MDE standard practice with the implementation of the 2000
Guidelines for State and Federal Projects as well as the 2000 Maryland Stormwater Management
Design Manual Volumes 1 and 2.
SWM-1 was designed with a 6-inch “flow splitting” pipe located in structure CS/2. As designed,
the 6-inch pipe at elevation of 1914.25, 8-inches lower than the 36-inch outfall pipe with an
invert of 1914.92, will divert approximately 0.61-cfs of run-off to the facility. During an
estimated 10-year storm event, the flow splitter will allow approximately 1.75-cfs to enter the
facility. The design of SWM-1 indicated that the facility was required to treat a minimum Water
Quality Volume of 3,267 cubic feet of run-off with a minimum filter area of 980 sf. Based on the
facility design, a filter surface area of 6,250 sf was provided with a corresponding Water Quality
Volume of 6,250 cubic feet.
SWM-2 was designed with a 6-inch “flow splitting” pipe located in structure CS/24. As
designed, the 6-inch pipe an elevation of 1936.20, approximately 4.5-inches lower than the top of
concrete weir set at an elevation of 1936.57-feet, will divert approximately 0.57-cfs of run-off
into the facility. During an estimated 10-year storm event, the flow splitter will allow
approximately 1.07-cfs to enter the facility. The design of SWM-2 indicated that the facility was
required to treat a minimum Water Quality Volume of 998 cubic feet with a minimum filter area
of 300 sf. Based on the facility design, a filter surface area of 2,500 sf was provided with a
corresponding Water Quality Volume of 4,500 cubic feet.
HPL & CBL
Data are not available.

23
3. Regardless of the response to #2, can you identify general activities tied to the list of
EPA categories (bullets) above? These are things that would be considered “best practices”
like green roofs, removing impervious surfaces, providing retention and treatment for
stormwater for new or existing development, stream fencing, tree planting, etc. Are they or
can they be quantified in terms of impact on the whole? Can their impact be stated in
terms of when they were implemented?
AL
Current AL activities fall under the following EPA categories:
Post-construction runoff control
Pollution prevention/good housekeeping
Stormwater Management Ponds Filter Remediation The existing SWM ponds were reviewed and
permitted under MDE # 97-SF-0188. As mentioned above, under this permit, two surface sand
filters were constructed as part of the Appalachian Laboratory, Center for Environmental
Sciences to provide water quality control for the proposed project development. Since their
construction in 2001, the filters have been experiencing water quality volume draw down issues.
The water quality volume is not filtering within the required time period.
AMT conducted a site investigation to determine the cause of the lack of water quality volume
draw down and prepared the Appalachian Lab – Sand Filter Remediation Report dated August 1,
2011 (this can be provided if necessary for additional detailed information). AMT believes the
insufficient draw down is being caused by the clogging of the filter fabric layer between the
under drain stone layer and the sand filter media. As such, AMT has recommended the removal
of the filter fabric and replacement. AMT has developed remediation plans (this can be provided
if necessary) and has verified that the water quality volume and required filter area still meet the
project’s original design intent. A. Morton Thomas & Associates, Inc, Rockville, MD, submitted
the Appalachian Lab Sandfilter Rehabilitation plans to MDE for their review on August 2, 2011.
Landscaping has been simplified to minimize maintenance and grass has been planted in
previously mulched, bedded or neglected areas to maximize rain water retention and reduce
runoff.
HPL
New construction on Horn Point campus has complied with current MDE and Critical Areas
regulations concerning storm water management. Specifically:
Silt fencing and reseeding of disturbed areas
Tree planting as required for added impervious area.
Construction of a replacement building on the footprint of two buildings that had burned.
Installation of a rain garden in conjunction with the replacement building
CBL

24
General activities at CBL include the addition of 6 new rain-barrels attached to soaker-hoses
strung throughout our native plantings, the addition of 45 new native tree plantings and the
addition of downspouts & gutters on one of the historic homes on campus. No new construction
has occurred on campus that resulted in the creation of additional impervious surface.
4. Do you have survey information—specifically quantitative, mapped data that show
topography, the extent of impervious surfaces, forested areas, landscaped (grass) areas,
etc? DNR is willing to help assemble a database of campus lands in a Geographic
Information System (GIS) format that would allow layering, analysis, and calculation of
impacts, if we can provide it to them.
AL
General (hard copy) maps showing the Appalachian Lab Campus, location of current SWM
facilities and original site topography are available on request.
HPL
We do not have survey information; however, an estimate would be that there are between 10-15
acres of impervious surfaces (buildings and roadways) and 840 acres of woods, grass, marshes,
streams and tidal basins. The roadways do not have curbs. Instead they are bordered by small
grass swales or grass fields to receive and filter run-off from these surfaces. The buildings either
discharge storm water into drains which connect the aforementioned systems or onto surrounding
grass covered areas.
CBL
No official survey information at this time.
LAB LOCATION MAPS AND INDIVIDUAL CAMPUS INFORMATION
http://www.umces.edu/about/maps-directions
CAMPUS SUTAINABILITY PAGE
http://www.umces.edu/about/sustainability

25
UNIVERSITY OF MARYLAND COLLEGE PARK
RESPONSE TO STORMWATER AND FORESTATION QUESTIONS
10/14/11
1. What is the general status of your storm water management and reduction/treatment
activities?
The University of Maryland (UM) holds an individual permit to discharge water through 13
regulated outfalls to surrounding streams through the Maryland Department of the Environment
(MDE). The permit issued under the federal Clean Water Act’s National Pollution Discharge
Elimination System (NPDES) has been in effect at UM for over 20 years and is renewed every 5
years. The NPDES permit is the University’s authorization to discharge industrial wastewater
including non-contact cooling water, boiler blowdown, compressor condensate and steam
condensate, as well as routine stormwater via the outfalls. The permit imposes discharge
pollutant limits by outfall, monthly testing, quarterly reporting, and prohibits certain discharges
to the storm sewer system.
As a requirement in the University’s Individual Permit, the UM developed and implements a
Storm Water Pollution Prevention Plan (SWPPP) to identify potential sources of pollution which
may reasonably be expected to affect the quality of storm water discharges from the University.
The SWPPP describes the practices used to reduce the pollutants in storm water discharges
associated with industrial activity.
As a state-owned university, the University of Maryland also currently holds a Phase II NPDES
General Stormwater Discharge Permit for Small Municipal Separate Storm Sewer Systems
(MS4). This goal of this permit is to reduce the discharge of pollutants to the maximum extent
practicable, protect water quality, and satisfy water quality requirements of the Clean Water Act.
The University submits an annual report to the Maryland Department of the Environment (MDE)
each year which includes descriptions of the best management practices and measurable goals
that will be used to meet the following six minimum measures.
1. Public Education
2. Public Participation
3. Illicit Discharge Detection and Elimination
4. Construction-Site Runoff Control
5. Post Construction Runoff Controls
6. Pollution Prevention and Good Housekeeping
2. Do you have specific data to provide regarding storm water waste load allocations and
the amount of impervious acres vs. acres treated, as defined in the State’s guide? If so,
what is available for your campus? The State provides guidance in calculating the impact
of your activities.
The University currently does not have specific data regarding stormwater waste load allocations
at a Campus wide scale as defined in the state’s guide. The data that do exist relate to a few
26
specific research rain garden/bio-filtration sites that have been developed for research purposes
by Dr. Allen Davis, a professor with the School of Civil and Environmental Engineering.
3. Regardless of the response to #2, can you identify general activities tied to the list of
Control Measures (bullets from original e-mail)? These are things that would be considered
“best practices” like green roofs, removing impervious surfaces, providing retention and
treatment for storm water for new or existing development, stream fencing, tree planting,
etc. Are they or can they be quantified in terms of impact on the whole? Can their impact
be stated in terms of when they were implemented?
All new construction on-Campus is required to be LEED silver. Since the requirement was
implemented many of the newly constructed facilities have incorporated “best practices” such as
green roofs, permeable pavers, and rainwater harvesting. In recent years the University has had a
stormwater bank with MDE in the form of several retention ponds and sand filters constructed
on-Campus, which have been used to address stormwater treatment requirements for new
construction and redevelopment. Moving forward all new construction will comply with the
Environmental Site Design (ESD) requirements per the “Stormwater Management Act of 2007”.
New construction greater than 5,000 SF of disturbed area must include a sediment and erosion
control plan. Construction-site runoff controls are strictly enforced by the project manager.
Construction projects that disturb less than 5,000 SF will often voluntarily include sediment and
erosion control measures. New landscape projects such as gardens and plazas typically
incorporate some degree of “best practices” in the form of rain gardens, permeable paving, rain
water harvesting, and tree planting. Student groups such as Engineers Without Borders, have
constructed bio-retention cells to treat parking lot runoff, Dr. Allen Davis with the School of
Civil and Environmental Engineering has constructed similar “best practice’ control measures
for research purposes, and the University has engaged with local and regional community
watershed stakeholders to construct stormwater treatment facilities on-Campus towards the goal
of watershed restoration (pending 2012 construction). Projects on-Campus that incorporate “best
practices” generally have educational signage in order to raise community awareness.
The University’s state of GIS mapping, catalogue of treatment facilities, and the drainage areas
related to these facilities is incomplete; therefore treatment cannot currently be quantified in
terms of impact on the whole. Impact in terms of when stormwater facilities were implemented
may be stated on a case by case basis.
4. Do you have survey information—specifically quantitative, mapped data that show
topography, the extent of impervious surfaces, forested areas, landscaped (grass) areas,
etc? DNR is willing to help assemble a database of campus lands in a Geographic
Information System (GIS) format that would allow layering, analysis, and calculation of
impacts, if we can provide it to them.
The University has extensive survey data for the entire College Park Campus that includes
topography, forested areas, buildings, streets, parking lots, sidewalks, plazas, utilities, tree
locations, and landscaped areas. These data currently exist in CAD and GIS formats. Beginning
in 2007 with the completion of the “University of Maryland Potential Water Quality
Improvement Study” the University began mapping impervious area percentages by sub-

27
watershed within the College Park Campus. With the pending completion of the Utilities Master
Plan (UMP), detailed GIS data including hydrologic soils mapping, infiltration constraints,
stormwater conveyance systems, and impervious/pervious areas will be updated and
incorporated into the Campus GIS.
CAMPUS MASTER PLAN
http://www.facilities.umd.edu/MasterPlan2/envguide.htm
CAMPUS SUSTAINABILITY PAGE
http://www.sustainability.umd.edu/index.php
OTHER RELATED LINKS
Video re: Guilford Run Bioretention Facility
http://youtu.be/DjoSBSVPM2c
Summary of campus stormwater initiatives
http://www.sustainability.umd.edu/content/campus/stormwater.php
Public outreach, assisting local and regional governments with expertise
http://www.efc.umd.edu/swlidfinancing.html
Award winning student project for energy and water conservation
http://2011.solarteam.org/news/watershed-team-receives-heartfelt-praise-state-wide-and-beyond
28
UNIVERSITY OF MARYLAND EASTERN SHORE
RESPONSE TO STORMWATER AND FORESTATION QUESTIONS
10/13/11
1. What is the general status of your storm water management and reduction/treatment
activities?
Our storm water management practices on projects have been coordinated with State of
Maryland Department of Environment (MDE). The projects have been completed in accordance
with prevailing codes. We have not engaged on a full blown reduction and treatment exercise.
However, in the Wicomico Hall renovation project completed in 2009, we replaced 6 tennis
courts from an impervious surface to a green lawn, under which we installed 72 geothermal
wells.
2. Do you have specific data to provide regarding storm water waste load allocations and
the amount of impervious acres vs. acres treated, as defined in the State’s guide? If so,
what is available for your campus? The State provides guidance in calculating the impact
of your activities.
We do not have specific data regarding storm water waste load allocations. We are in the process
of hiring a consultant to assist us calculate the impervious acres vs. acres treated as defined in
the State guide.
3. Regardless of the response to #2, can you identify general activities tied to the list of
Control Measures? These are things that would be considered “best practices” like green
roofs, removing impervious surfaces, providing retention and treatment for storm water
for new or existing development, stream fencing, tree planting, etc. Are they or can they be
quantified in terms of impact on the whole? Can their impact be stated in terms of when
they were implemented?
UMES replaced 6 tennis courts and converted the impervious area into a green lawn in
2009
UMES provides water retention ponds on completed projects and site improvements
UMES continuously plant trees on campus and around campus facilities including the
Paul Sarbanes Center at Assateague Island
UMES conducts catch basin and storm drain cleaning, but we do not calculate the
residues.
The best practices will be quantified in due course.
4. Do you have survey information—specifically quantitative, mapped data that show
topography, the extent of impervious surfaces, forested areas, landscaped (grass) areas,
etc? DNR is willing to help assemble a database of campus lands in a Geographic
Information System (GIS) format that would allow layering, analysis, and calculation of
impacts, if we can provide it to them.
29
Yes, UMES mapped its campus in the early 1990s showing topography, pervious and impervious
surfaces. This map is being updated to reflect up to date developments. UMES Master Plan
(2008 -2018) reflects the forested areas and landscaped grass areas. Definite calculations of the
different surfaces will be needed. UMES welcomes DNR database assembly of USM campus
lands in a Geographic Information System (GIS) Format that will allow layering, analysis, and
other information required to comply with State mandate.
CAMPUS MASTER PLAN
[Link pending; page being created]
CAMPUS SUSTAINABILITY PAGE
[Link pending; page being created]

30
UNIVERSITY OF MARYLAND UNIVERSITY COLLEGE
RESPONSE TO STORMWATER AND FORESTATION QUESTIONS
10/13/11
1. What is the general status of your storm water management and reduction/treatment
activities?
When the Adelphi Inn & Conference Center hotel addition was developed/constructed UMUC
coordinated through UMCP for the stormwater management system in an adjacent location to the
campuses. For the Sheppard Gallery addition to the Inn & Conference Center stormwater
treatment was a combination of pavement removal and a green roof.
2. Do you have specific data to provide regarding storm water waste load allocations and
the amount of impervious acres vs. acres treated, as defined in the State’s guide? If so,
what is available for your campus? The State provides guidance in calculating the impact
of your activities.
No data to report.
3. Regardless of the response to #2, can you identify general activities tied to the list of
Control Measures (bullets from original e-mail)? These are things that would be considered
“best practices” like green roofs, removing impervious surfaces, providing retention and
treatment for storm water for new or existing development, stream fencing, tree planting,
etc. Are they or can they be quantified in terms of impact on the whole? Can their impact
be stated in terms of when they were implemented?
Green roof on the Sheppard Gallery
White roofs on the UMUC Academic Center at Largo and University Centre building in
College Park, Maryland
Disconnected irrigation systems at the Largo and Adelphi locations
Plant drought tolerant, native plant materials at each site
Planted additional trees at Largo and Adelphi location
Maintenance contracts are in place to maintain grease interceptors and exhaust hoods in the
kitchens at ICC and Largo. The grease interceptors are pumped once a month at both sites
per WSSC regulations.
4. Do you have survey information—specifically quantitative, mapped data that show
topography, the extent of impervious surfaces, forested areas, landscaped (grass) areas,
etc? DNR is willing to help assemble a database of campus lands in a Geographic
Information System (GIS) format that would allow layering, analysis, and calculation of
impacts, if we can provide it to them.
Each of the overall plans for UMUC projects does include some survey information such as
topography.

31
LOCATIONS INFORMATION
http://www.umuc.edu/visitors/locations/
SUSTAINABILITY PAGE
http://www.umuc.edu/gogreen/

STORMWATER MANAGEMENT SYSTEM at THE UNIVERSITIES at SHADY GROVE
Maryland Watershed Implementation Plan
1. General Status:
The Universities at Shady Grove (USG) first educational building opened in 1992. A second educational
building opened in 1997. Both buildings opened prior to MDE adopting the new stormwater best
management practices (BMPs) in 2002. Although activities at this campus are limited to classroom
instruction, the educational building opened in 1997 included two biology labs with very limited chemical
use. The first two buildings each have an emergency power generator powered by separate fuel tanks
located outside the buildings in double walled containers. The third building officially opened in 2007, after
the adoption of the new BMPs, included many features designed to prevent stormwater runoff
contamination. Not only were the new BMPs followed during this construction phase, but the new building
was designed to meet LEED® standards, and it was subsequently awarded certification of LEED ® gold by
the USGBC.
Even though the opening of the institution superseded the adoption of BMP in 2002, the general status of
the stormwater management and reduction/treatment activities is considered satisfactory. This is the result
of an institutional goal to develop capital improvement initiatives, and to institute operational procedures
that adhere to municipal mandates designed to protect and limit the negative influence rainwater runoff
might have on the municipal storm water management system.
Capital Initiatives:
A surface parking facility (Parking Lot I) that reduced the amount of pervious surface but included
the development of a Baysaver water retention system designed to treat rainwater runoff and
control the flow of rainwater runoff into the storm water management system.
A structured parking facility (2009) that was built on an existing impervious surface parking but
included a water retention system that reduced storm water runoff. This system supports an
irrigation system for a nearby planting bed; also included is a second Baysaver water retention
system for treating rainwater runoff and water flow control. This parking facility also included the
installation of an interceptor that also treated interior water flow contaminated with grease/oil from
vehicles.

An educational building (2007) designed with a green roof, a water retention system that reduces storm water runoff, and a Baysaver water retention system. The vegetated green roofing system reduces storm water runoff by 25%. We chose succulent plants to minimize the need for watering.
The modification of the storm water pond that added a second spillway to increase the flexibility for
water flow control and decrease the conditions that promoted possible dam breaches.
The implementation of Sediment Control Plans as mandated by Maryland Department of the
Environment (MDE) specifically designed to control stormwater runoff from any construction
endeavor that would disturb 5,000 square feet of land require less than 100 cubic yards of
earthwork.
A survey is currently being conducted to identity all trees throughout the campus.
Operational Initiatives:
The retention of contractual services to monitor, inspect and clean the storm water management
systems.
Maintain the stormwater pond edge and the pond’s dam as required to eliminate possible water
edge damage and ground erosion to eliminate possible dam breaches.
Maintain and perform monthly inspection of grease trap systems to insure against cross
contamination of the municipal stormwater system.
Monitor the water treatment program for facility cooling systems to insure against the
contamination of the stormwater system.
A “green” cleaning program that established guidelines for housekeeping and landscaping
services, which eliminated the introduction of harmful cleaning and fertilizer agents into the
stormwater system.
Specific Data:
2. USG does not have specific data, at this time, regarding stormwater wasteload allocation and the
amount of impervious acres vs. acres treated. However, subsequent to the adoption of the BMP in 2002,
USG, as noted above, has developed the three capital initiatives that included the development of three (3)
stormwater Baysaver systems designed to treat rainwater runoff before entering the stormwater
management system. Specific materials are being assembled that will allow the university to develop
specific data regarding wasteload allocation and the amount of impervious acres vs. acre treated.
A general review of project plans assembled indicates all stormwater runoff from impervious surfaces
adjacent to projects developed since the adoption of BMP, is treated. Specific data to address the
wasteload allocations and the amount of impervious acre vs. acres treated is being developed.
USG has, and will be utilizing, the following documents to develop specific data to respond to question #2:
Planting Plans
Landscaping Drawing
Erosion and Sediment Control Plans

Campus Storm water Management Areas Plan
Site Development Area, Storm water Management Areas & Tabulation Plans
Site Improvement and Grading Plan
Campus Tree Inventory (upon completion)
3. General Activities/Best Practices
Public education and outreach:
Since 2007, USG has worked to educate the community on the importance of water conservation. We
have achieved that in a variety of ways:
In our tours and in our literature, we point out that the water fixtures installed in The Camille Kendall Academic Center (Building III) have resulted in a water savings of approximately 40% as compared to the baseline fixture performance requirements of the Energy Policy Act of 1992. Small posters are located in the restrooms promoting our water saving initiatives.
A green “touchscreen” installed in the main lobby displays water, electric and natural gas usage.
In 2007, we installed a “smart” irrigation system that relies on soil sensors to determine when we need to water the plants. This highly efficient irrigation system reduces the consumption of our potable water by 50%.
We have installed signs on the landscaped areas to explain the use and benefits of native plants, specifically, how they require less water. We note how the use of hardy and native vegetation minimizes irrigation requirements.
Signs installed in the parking garage educate students about our rainwater capture system in the parking garage structure.
Participation and Involvement:
Green Committee water initiatives: The USG Green Committee is in the process of installing refill stations at the existing water fountains, to encourage students to stop using plastic water bottles and to instead, utilize their reusable water bottles. It’s part of the “Take Back the Tap” initiative. In concert with this, they are planning a “Water for Africa” drive, to raise awareness about water conservation.
In the fall of 2011, students from the UMCP Communications program began a documentary exploring the LEED® EB process going on at USG. This student project will result in a twenty-minute documentary highlight the motivation behind the LEED®EB process as well as showing the initiatives to save water, natural gas, and electricity.

Illicit discharge detection and elimination:
To date, USG has not had an illicit discharge and has implemented the following initiatives to prevent
unlawful discharges:
The installation of self-contained double-wall fuel tanks, which support four (4) emergency
generators.
A comprehensive spill control material to assist with preventing cross contamination of the
stormwater management system in the event of a spill or fuel tank rupture.
The removal (de-commissioning) of a submerged fuel oil tank and replacement with an above
ground tank.
Maintenance of the storm water management pond water edge to eliminate potential plant growth
that promotes dam leaks and potential breaches.
The maintenance of the dam grounds to eliminate erosion issues and the potential for dam
breaches.
The elimination of downstream plant and animal borings that eliminate potential dam breaches.
Maintenance of spillways to feed into the storm water management pond.
Emergency response training for facility staff ; the implementation of an awareness program for
security staff on alerting facility staff and providing the appropriate response in the event of an
eruption during non-operational hours.
Construction of site runoff control:
The adherence to MDE mandate requiring the implementation of a Sediment Control Plan
specifically designed to control stormwater runoff from construction sites that disturb less than
5,000 square feet of land and require less than 100 cubic yards of earthwork. Adhere to the policy
of seeking an exemption on projects that fall within the exception guidelines.
The installation of a storm water capturing system in the parking garage to reduce stormwater
runoff and to support the irrigation system used to water the planting bed adjacent to the parking
garage.
The installation of a grease/oil interceptor to treat interior stormwater runoff from the parking
garage.
The installation of three Baysaver systems constructed a part of three (3) newly developed projects
since the adoption of BMP in 2002. One hundred percent of the stormwater runoff from grounds
adjacent to these developed projects is treated.
Maintain environmental wetland that treats stormwater runoff before entering the storm water
management pond.
The installation of a “Green” roof that reduces storm water runoff.
Maintenance of several spillways the direct flow from the wetland environment to the storm water
management pond.
Post-construction runoff control:
Service contracts for the monitoring, inspection and cleaning the Baysaver systems.
Service contracts for the monitoring, inspection and cleaning of grease/oil interceptor in the parking
garage.
Service contract for monitoring, inspection and cleaning of two (2) grease trap systems to prevent
cross contamination of the storm water management system.
Service contract for water treatment of cooling towers to prevent cross contamination of the storm
water management system.
In conjunction with MDE, an agreement to add an additional spillway for the storm water.
Management of pond to increase the flexibility to control the flow of water from the pond.
Pollution prevention/Good housekeeping:
In 2007, we adopted a green housekeeping plan. We also instituted a green Operations and Maintenance plan.
In 2011, we modified our “No Smoking Policy” to prohibit smoking 50 feet from the buildings. The executive director has approved plans to form an implementation committee to change to a completely “Tobacco Free” campus in late 2012.
In 2010, the campus began composting; efforts are underway to move the composting service to the conferencing operation.
A waste stream audit is planned for the fall of 2011.
In 2011, a campus tree survey was initiated; plans are underway to complete that survey by winter 2011.
4. Survey Information:
USG is hoping to have comprehensive GIS data on the campus in the future. For now, will be utilizing the following documents for survey information:
Planting Plans
Landscaping Drawing
Erosion and Sediment Control Plans
Campus Storm water Management Areas Plan
Site Development Area, Storm water Management Areas & Tabulation Plans
Site Improvement and Grading Plan
Campus Tree Inventory (upon completion)


1
Maryland Sustainable Forestry Council
No-Net-Loss of Forest Policy
Distribution Draft
October 2011
The Task
Over the past several years, multiple reports, directives and laws have made plain that working
lands like forests and farms are critical to Maryland's economy, community and environment.
These have included the Sustainable Forestry Act of 2009, Chesapeake Forest Conservation
Directive 06-1i and The State of Chesapeake Forests report.ii
The Sustainable Forestry Council’s task is to use the findings of these previous efforts and new
information to advise the Department of Natural Resources on timely forest conservation
issues and appropriate actions. This white paper focuses on the actions that can help Maryland
implement a no-net-loss of forest policy. The recommended actions build on existing programs
and regulations including the development of Watershed Implementation Plans to meet the
Total Maximum Daily Load requirements for the Chesapeake Bay, the Forest Conservation Act
and local planning and zoning requirements.
Development pressure, economic markets, pests and pathogens, invasive species and many
other issues influence and unite farms and forests. In many cases, landowners deal with both
land uses at the same time as 40% of all forests in Maryland occur as part of a farm. The Council
has taken care to develop recommendations that support a no-net-loss of forests policy that
are complementary to the state’s broader goals for maintaining healthy and productive farms
and forests and provide numerous opportunities for common action with Maryland forest
landowners.

2
Why act now?
Whether a resident of Maryland lives in a rural, suburban or urban community, they receive
vital benefits daily from working lands like farms and forests. These benefits include clean
water, clean air, drinking water, flood control, wood products, food, wildlife habitat and
recreational opportunities. Despite the fundamental importance of these benefits to the state,
their continued provision is threatened by forest conversion and actions are needed now to
sustain them.
The area of farms and forests throughout the state has fluctuated over the past several decades
and is closely tied to economic conditions. Overall, Maryland lost approximately 873,000 acres
of farmland from 1950 to 2007 and, between 1950 and 2011, an average of 7,000 acres of
forest per year. The state has a high standard of living and will continue to attract new residents
even in a weakened economy. For example, the Department of Defense’s Base Closure and
Realignment Commission (BRAC) projections among others will increase the State’s population
by 1,100,000 people by 2030.
The loss of forests and other working lands is occurring parcel by parcel across the state. In
2006, the Governor’s Commission for Protecting the Chesapeake Bay through Sustainable
Forestry noted the primary threat to forests is the “development of forests due to uninformed
local land use decisions leading to the parcelization and fragmentation of forests and
conversion to non-forest uses.” There are numerous opportunities now for local governments to
better incorporate forest conservation into land use planning. Local governments are currently
developing federally mandated Watershed Implementation Plans that map out their roles in
reducing nutrient and sediment loads to the Chesapeake Bay. In addition, they are currently
updating Local Land Preservation and Recreation Plans and Priority Preservation Area Plan
Elements.
Given the importance of forests to the state’s economy, community, and environment;
vulnerability of forests and working lands to changing economic conditions and opportunities

3
to incorporate forest conservation in land use planning, the Sustainable Forestry Council
presents the following options for implementing a no-net-loss of forests policy to the Secretary
of the Department of Natural Resources.
The Sustainable Forestry Council’s work has been called for through two important acts of the
Maryland General Assembly:
• Sustainable Forestry Act of 2009 (SB 549), which recognizes the role of sustainable
forest management for meeting Chesapeake 2000 Agreement goals and the 2007
Forestry Conservation Initiative, and which establishes the Sustainable Forestry Council
to advise the Department of Natural Resources on forestry matters.
• Forest Conservation Act (SB 666)—No Net Loss of Forest Policy, which requires that DNR
consult with forestry-related stakeholder groups to determine the meaning of no net
loss of forest for state policies and to develop proposals for the creation of a no net loss
of forest policy by December 2011.
Meaning of a No-Net-Loss of Forest Policy
Like the overall restoration of the Chesapeake Bay, a no-net-loss of forest policy must slow the
trend of degradation and loss as well as begin long-term recovery of the resource. Therefore,
the Sustainable Forestry Council defines the no-net-loss of forest policy as the stabilization of
the rate of loss by 2020 with the goal of maintaining the state’s existing 40% forest coverage.
The target of 2020 provides enough time for proposed statutory and planning requirements to
be initiated or enhanced as well as take effect.
The Sustainable Forestry Council further recommends that a no-net-loss of forest policy must
address not just the net loss of forest, but also issues affecting its environmental and economic
health. These issues include low rates of sustainable private forest management, declining
forest industry infrastructure, pests and pathogens, and climate change just to name a few.

4
The Proposal
The Sustainable Forestry Council recommends that the Maryland Department of Natural
Resources work with partners and stakeholders to pursue an integrated set of actions and
measures that seek to stabilize forest loss. These actions and measures will build upon existing
efforts to create jobs, restore the Chesapeake Bay, promote smarter growth and protect the
health of its residents. The recommend actions are organized in four policy elements:
Prioritize Forest Conservation
Maryland has long recognized that larger forested "hubs" and connecting "corridors" provide
greater environmental services for water quality and habitat. Program Open Space currently
prioritizes these areas when making land conservation decisions. The Forest Conservation Act
should also recognize this and provide these areas the highest protection from conversion to
non-forest land cover.
Protect High Quality Forests
Protecting important forest cover from development through land use planning, appropriate
incentives and disincentives and protective zoning will be more successful than relying on site-
by-site development regulations.
Offset all sources of forest loss
While it is not practical to protect all forest from conversion, it is nevertheless important that all
forest losses be offset. A strategic approach to forest loss should include directing reforestation
to priority needs including expanding urban tree canopy and riparian buffers, and to targeting
low-conflict opportunities such as excess lawn on large rural residential lots rather than
productive farmland.
Encourage working land and family-owned forest stewardship
Because 76% of forests in Maryland are owned by families, forest industry and other related
non-governmental organizations, a no-net-loss of forest policy should include financial and

5
technical assistance measures that provide incentives for stewardship, forest retention and the
maintenance of forest health.
The Details
Prioritizing Forest Conservation
The State should develop management strategies that address key functional and spatial
characteristics of forest areas within existing State programmatic frameworks for forest
resource management, smart growth and Chesapeake Bay Program commitments. Attention
should be directed at three spatially significant forest resource area groupings (See map in
Appendix A), each with distinct management objectives:
1. Forest Conservation Areas
Contiguous forest patches greater than 200 acres should be provided enhanced
protection from conversion and parcelization because of their importance to water
quality and watershed health. Forest Conservation Areas complement Maryland’s Green
Infrastructure hubs for water quality at the sub-watershed scale. The primary
mechanism for enhanced protection of these forest areas is an enhanced mitigation
ratio under the Forest Conservation Act for forest conversion, such as 4:1.
2. Urban Tree Canopy Areas
Urban Tree Canopy Areas contain trees, woods and forests within U.S. Census-
designated “urbanized areas.” The goal in Urban Tree Canopy Areas is to achieve and
maintain a minimum 40% Urban Tree Canopy cover in support of the State’s
Chesapeake Bay Program commitments. The primary mechanism for increasing urban
canopies is to reduce Forest Conservation Act mitigation requirements generated
outside urban areas if met within urban areas, such as a 2:1 credit per acre for urban
reforestation, using the Chesapeake Bay Watershed Implementation Plan (WIP) rate of

6
100 urban trees per acre.1
Under this policy element, for example, a forest mitigation
obligation for 2 acres of forest could be met by planting 100 urban trees with a
reasonable maintenance provision.
3. Woodland Conservation Areas
Woodland Conservation Areas are all forested areas outside of Urban Tree Canopy and
Forest Conservation Areas. The management objective in this area is to conserve the
resource to the extent possible. The Forest Conservation Act can be revised to
differentiate forest clearing based on type of development. The Chesapeake Bay Critical
Area Act differentiates development that needs to be located adjacent to the water
(water dependent facilities) from development that can be sited outside of the Bay
buffer. In a similar manner, the Act can be amended to differentiate more “discretionary”
types of land use, such as low- to medium-density housing developments, from those
that are more critical to locate strategically regardless of forest cover, such as critical
public infrastructure and core “smart growth” town centers.
Low and moderate density housing developments that are more discretionary in
location requirements should be discouraged and any associated forest loss should be
mitigated fully, at a mitigation rate of at least 1:1. Non-discretionary development
should be mitigated at a rate of 0.75 acres per forest acre converted.
Protection of High Quality Forests
In order to successfully achieve a no-net-loss of forest policy in Maryland, it will be critical that
local land use decisions better protect forest cover overall, and especially Forest Conservation
Areas, from conversion because of land development pressure. Improved land use planning can
reduce the vulnerability of forests to land conversion and “keeping forest in forest.”
1 The Forest Conservation Act currently equates one acre of forest to 100 trees.

7
For a number of years the State has required local governments with planning and zoning
authority to protect wetlands, steep slopes and other sensitive areas from development
through the incorporation of a Sensitive Area Protection Element in local comprehensive plans.
The Sustainable Forestry Council finds that the State can use the Sensitive Area Protection
Element to incorporate forest conservation in land use planning through two actions:
1. Prepare a revised Models and Guidelines for forest resources
The existing Models and Guidelines document prepared by State agencies in 1993 pre-
dated the inclusion of agricultural and forest resources as defined sensitive areas by the
General Assembly in 2009. A revised Models and Guidelines should include two
component assessments:
• Forest Resource Assessment
This assessment is a basic GIS landscape analysis at the county scale of the
distribution of forest patches by size and a differentiation of their ecological
function through an analysis such as Baltimore County’s “water quality typology.”
For example, the relative value of forest patches to water quality can be
assessed based on their size and location in a watershed.
• Forest Vulnerability Assessment
This assessment is another GIS landscape analysis that assesses forest patch risk
to development. This vulnerability is assessed based on a variety of factors such
as ownership, protected area status and zoning.
2. Require county governments to prepare a “Forest Resource Element.”
A Forest Resource Element would be similar to, but much simpler than the 2007
requirement for a Water Resources Element in local comprehensive plans. Counties
would be responsible for completing these elements for their entire geographic areas
including municipalities. Whereas the State’s Water Resource Element is a more passive
review of water infrastructure capacity issues and pollution impacts at the local level,
the Forest Resource Element can become a priority for local implementation through

8
the use of incentives for local adoption of the land use plan changes. A pollutant
reduction credit can be given to counties in the Phase II Watershed Implementation Plan
for maintaining forests. Because the Chesapeake Bay Program Watershed
Implementation Plan, for the foreseeable future, uses a coarse land cover dataset in the
watershed models for assigning pollutant loads, the actual amount of forest cover on
the ground can be up to 59% more and an additional 10% of tree canopy can be
misplaced.
Counties can be given a forest "best management practice" credit for each acre
adequately protected by 2013 to make up for this discrepancy between what the
Chesapeake Bay Program tracks and actual on the ground conditions. For example, if a
county can demonstrate that 65% of priority forest patches under the Forest Resource
Element are protected to a high degree from conversion (i.e., public ownership,
conservation easements, or development densities of one lot per 20 acres), a credit can
be given for 65% of the forest acreage difference between the Chesapeake Bay Program
estimate forest cover and the actual on-the-ground cover. This credit can provide an
incentive for local governments to adjust zoning to protect forests rather than spend
funds for control of stormwater and pollution loads from land cover assumed to be
impervious urban surfaces due to scale limitations of the land cover data source.
Local governments that have funding in place for water infrastructure upgrades or that
plan to raise funding can use this cost-savings to provide financial and technical
assistance to the forest landowners who provide these credits. This financial incentive
will encourage private landowners to increased protection of their forests.
Offset all forest losses
Maryland's existing Watershed Implementation Plan requires a no-net-loss of forest policy be
put into action to prevent or mitigate the loss of 2,000 acres of forest per year. For this to be
achieved, most of the existing exemptions in the current Forest Conservation Act (FCA) will

9
need to be revised. These existing exemptions include clearing of permitted public rights-of-
way and mining. Over the next decade, over 400 miles of new utility rights-of-way clearings is
proposed. With an average width of 200 feet, this clearing will remove nearly 9,700 acres of
forest which should be mitigated.
In addition to FCA exemptions, county and municipal governments often have difficulty
directing dollars collected from developers as a fee-in-lieu of mitigation to on-the-ground forest
conservation and reforestation projects.
The Sustainable Forestry Council recommends that the Department of Natural Resources
develop a requirement for the mitigation of forest loss due to currently exempt sources and
develop options to assist local governments in using fee-in-lieu funds be developed.
Encourage working land and family-owned forest stewardship
Enhancing the Forest Conservation Act and local planning requirements will help slow
conversion of forest loss, but not stop it all together. Therefore, incentives to encourage
landowner stewardship in Forest Conservation, Urban Tree Canopy and Woodland
Conservation Areas will be important. Maryland’s no-net-loss of forest policy needs to
recognize that despite the focus on the quantity of forest cover in the State, the quality of
forest resources is critical to the long-term provision of the environmental and economic
benefits they provide.
The continued provision of clean water and air, habitat, flood control and other ecosystem
services is primarily in the hands of private citizens who own 76% of the forests in the state.
Within this private forest land base, there are 156,000 different landowners. The majority of
these landowners own small residential parcels (an average of 17 acres) and do not always
consider themselves forest landowners. Using appropriate and focused incentives for these
landowners is critical.

10
The Sustainable Forestry Council recommends the following actions to foster forest retention
and sustainable forest management on private forestland:
• Develop private landowner “on-ramps” to widely recognized third-party forest
certification systems
• Provide technical and financial assistance for programs that promote the conversion of
residential turf to trees. Lowering the minimum parcel size requirements for “current
use” property tax programs can be a strong incentive for homeowners to plant and
manage trees.
• Support emerging markets with appropriate incentives in areas like wood biomass
energy (e.g. fuels for schools, district heating systems and combined heat and power
energy systems) to maintain and enhance the viability of the state’s multi-billion dollar
forest products industry and attract new jobs.
Additional measures are presented in Appendix B.
Defining and Tracking Forest Loss
Regardless of the policy mechanisms used to implement a no-net-loss of forest policy, the state
must be able to track forest losses and gains. However, no consistent and reliable data source
for forest cover is in place for tracking the net change in forest cover as an outcome of
implementation of these recommendations.
The Sustainable Forestry Council reviewed several candidate data sources and recommends
that Maryland use the most reliable source of data for forest canopy. A comparison of the two
leading sources of continuous forest data was made:
• Chesapeake Bay Program land cover data, based on 30-meter Landsat imagery, and
• Forest canopy mapping derived from the National Agricultural Imagery Project (NAIP),
based on one-meter aerial photography.

11
As mentioned earlier, the comparison of these two datasets revealed that up to 60% of true
forest and tree canopy are not visible at the 30-meter scale and that another 10% of canopy is
inaccurately located. Because of these scale issues, the Sustainable Forestry Council
recommends that Maryland adopt one-meter NAIP data as the baseline for determining forest
cover area and tracking forest changes. NAIP photography is available for Maryland from 2007
and is being acquired every three years, so it provides an accurate, reliable and cost-effective
basis for setting a baseline year for a no-net-loss of forest policy and tracking forest cover
changes going forward. NAIP photography is available at no cost to the State, and interpreted
data is currently available for most of the urban corridor and for other areas in Maryland.
Interpretation of data and enhancement using local radar technology (LiDAR) will require some
additional capital investment, and DNR can prioritize classification of forest cover for high
vulnerability areas in the near term.
Conclusion
The Sustainable Forestry Council believes that the integrated set of measures outlined above
can make an important contribution to “bending the curve” for the rate of forest loss in
Maryland. They will also assure that those who influence the quantity of the forest resource
also recognize that without a healthy forest resource that is sustainably managed; all benefits
and values are at risk. The Sustainable Forestry Council stands ready to work in earnest with the
DNR and other stakeholders to further develop these proposals.

12
Appendix A

13
Appendix B
Additional Measures to Encourage Working Forest and Family-owned Forest Stewardship
• Provide adequate resources to the Maryland Forestry Boards to provide stewardship
activities for private landowners including the continued expansion of forest
stewardship plans. The county Boards are nationally unique organizations that can offer
peer-to-peer education and assistance to landowners, but currently lack capacity to fully
achieve their mission.
• Encourage Forest Service and Wildlife staff to collaborate with partners to deliver
technical assistance to landowners. Collaborative conservation will become increasingly
important as state budgets tighten. These partners include Forestry for the Bay and
Pinchot Institute for Conservation’s LandServer and Bay Bank programs.
• Encourage DNR and other state grant programs to recognize the protection of high
quality forests (i.e., avoided deforestation) as an eligible and priority water quality
strategy in grant programs including the Bay Restoration Fund.
• Evaluate the fiscal impacts of lowering the “current use” property tax exemption for
forest landowners from five to three acres. Property tax relief would be a strong
incentive for large lot residential landowners to reforest and manage trees.
• Reserve State riparian buffer cost share funding for only forest cover. Grass buffers do
provide water quality benefits and are inexpensive in the short-run, but forest buffers
provides more environmental outcomes and cost efficiencies in the long-term.
i Protecting the Forests of the Chesapeake Bay Watershed. Chesapeake Bay Program. 2006. http://www.chesapeakebay.net/ec2006.aspx?menuitem=19350 ii Sprague et al. The State of Chesapeake Forests. The Conservation Fund. 2006