Embed Size (px)
Citation preview
Details of Industrial Water Use and Potential Savings, by Sector: Appendix F Page 1
1
Appendix F
Details of Industrial Water Use and Potential Savings, by Sector Meat Processing (SIC code 201)
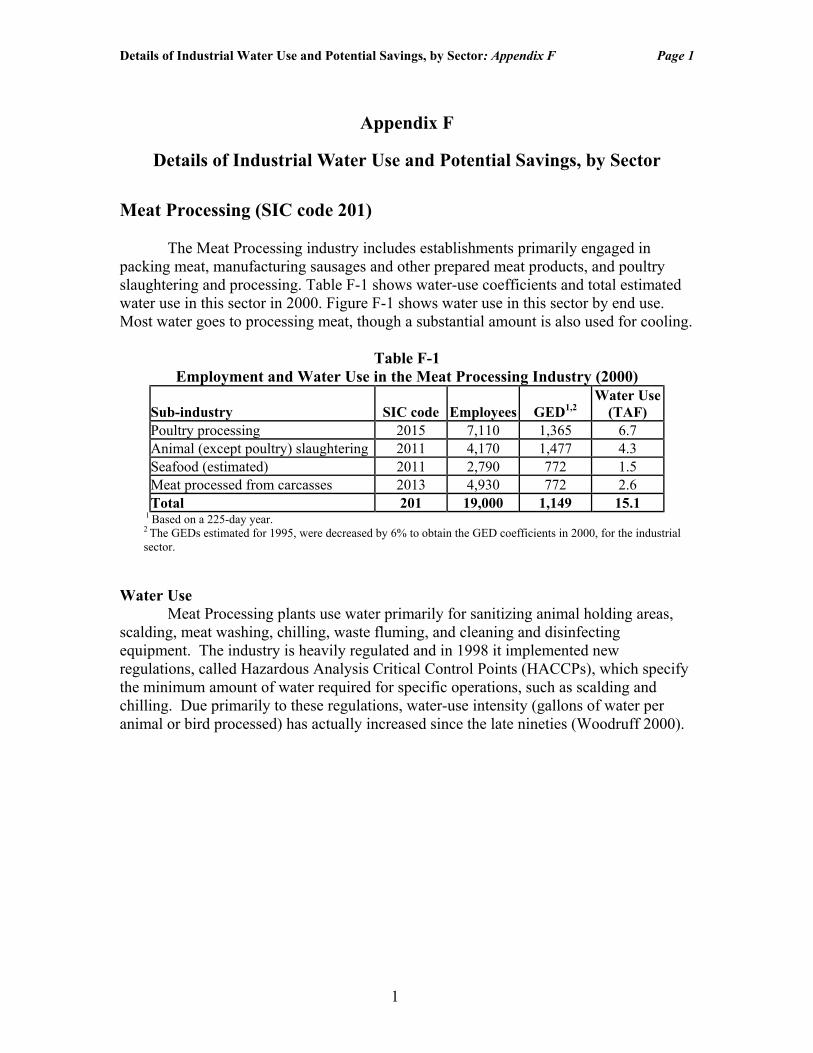
The Meat Processing industry includes establishments primarily engaged in packing meat, manufacturing sausages and other prepared meat products, and poultry slaughtering and processing. Table F-1 shows water-use coefficients and total estimated water use in this sector in 2000. Figure F-1 shows water use in this sector by end use. Most water goes to processing meat, though a substantial amount is also used for cooling.
Table F-1 Employment and Water Use in the Meat Processing Industry (2000)
Sub-industry SIC code Employees GED1,2 Water Use
(TAF) Poultry processing 2015 7,110 1,365 6.7 Animal (except poultry) slaughtering 2011 4,170 1,477 4.3 Seafood (estimated) 2011 2,790 772 1.5 Meat processed from carcasses 2013 4,930 772 2.6 Total 201 19,000 1,149 15.1
1 Based on a 225-day year. 2 The GEDs estimated for 1995, were decreased by 6% to obtain the GED coefficients in 2000, for the industrial sector.
Water Use
Meat Processing plants use water primarily for sanitizing animal holding areas, scalding, meat washing, chilling, waste fluming, and cleaning and disinfecting equipment. The industry is heavily regulated and in 1998 it implemented new regulations, called Hazardous Analysis Critical Control Points (HACCPs), which specify the minimum amount of water required for specific operations, such as scalding and chilling. Due primarily to these regulations, water-use intensity (gallons of water per animal or bird processed) has actually increased since the late nineties (Woodruff 2000).
Details of Industrial Water Use and Potential Savings, by Sector: Appendix F Page 2
2
Figure F-1
Water Use, by End Use, in the Meat Processing Industry
Restroom8%
Cooling33%
Landscaping1%
Process58%
Source: Calculated from MWD audit data of two meat-processing plants (MWD 2002).
Process Water Conservation Potential in Poultry Processing While qualitative information on process water use and potential savings in the
Meat Processing industry was available, quantitative data on water use for sanitation, chilling, and scalding and penetration rates were limited. Sanitation Information on potential sanitation savings in poultry processing included:
• Poultry plants in California are largely located in the Central Valley where water and sewer charges are comparatively low. Data from one case study indicated that while significant savings are possible from basic improvements in housekeeping techniques, these are not economical in the absence of higher wastewater charges (North Carolina Cooperative Extension 1999).
• Some plants are still using water extremely inefficiently because plant managers do not want to risk implementing water conservation measures at the expense of having the plant shut down under the 1998 HACCP regulations (Woodruff 2000). Consequently, the productivity of water use in this sector has actually declined in recent years.
• Potential savings from good housekeeping appear to be moderate in California’s Meat Processing Industry (Lelic, personal communication, 2002).
Based on the information listed above, we assumed that potential savings from
various sanitation measures could range anywhere from 20 to 80 percent, although the sources seemed to point toward the lower end of this range. Consequently, we chose 40 percent as our best estimate of typical savings per site. Chilling and Scalding
In addition to savings from sanitation, some poultry processing plants are using bubbled accelerated floatation (BAF), ultra-filtration, ozone treatment, and recycling for
Details of Industrial Water Use and Potential Savings, by Sector: Appendix F Page 3
3
the clean up and recycling of poultry chilling and scalding water. Chilling and scalding water use can be decreased by up to 80 percent with these techniques and (Carawan and Sheldon 1989), to remain conservative in our estimates; we assumed 70 percent per site. The penetration rate of these technologies was estimated at 30% based on the results of the 1997 CIFAR Survey (Pike 1997). The survey indicated that water reuse technologies averaged about 25% in the “All” Category. Since Fruit and Vegetable Processors had much higher penetration rates, meat and poultry were estimated to have lower penetration rates. Process Water Savings in the Meat Processing Industry
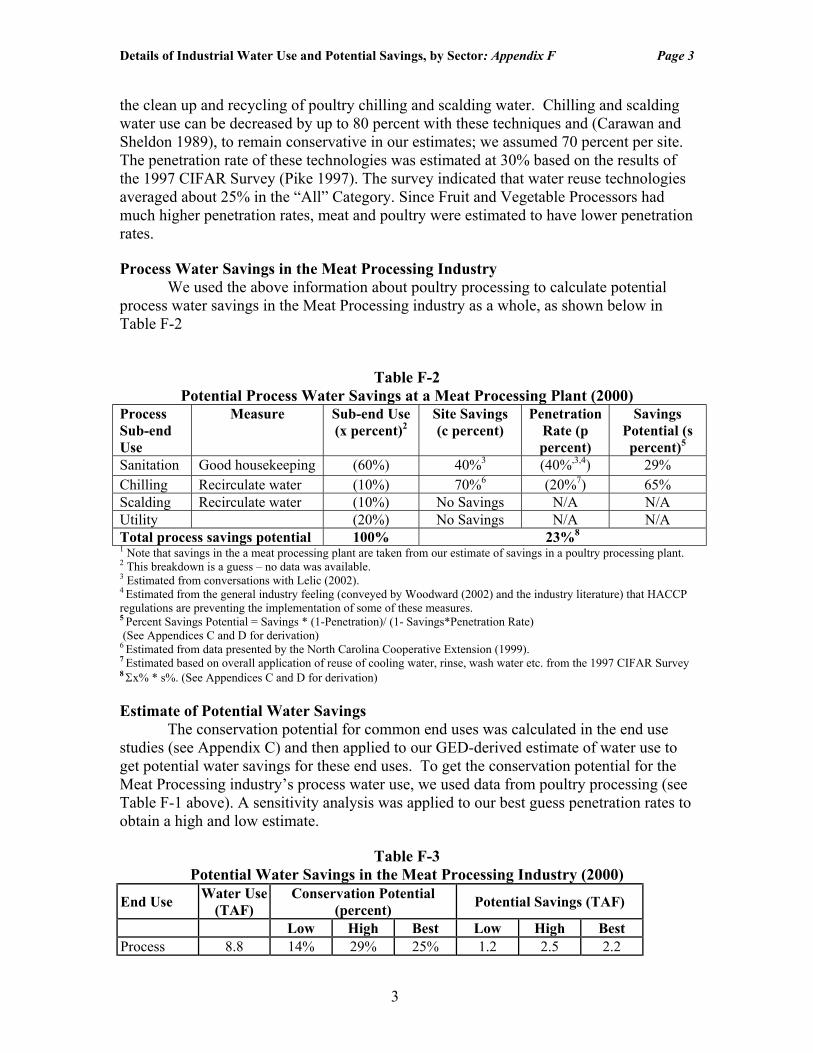
We used the above information about poultry processing to calculate potential process water savings in the Meat Processing industry as a whole, as shown below in Table F-2
Table F-2
Potential Process Water Savings at a Meat Processing Plant (2000) Process Sub-end Use
Measure Sub-end Use (x percent)2
Site Savings (c percent)
Penetration Rate (p percent)
Savings Potential (s percent)5
Sanitation Good housekeeping (60%) 40%3 (40%,3,4) 29% Chilling Recirculate water (10%) 70%6 (20%7) 65% Scalding Recirculate water (10%) No Savings N/A N/A Utility (20%) No Savings N/A N/A Total process savings potential 100% 23%8 1 Note that savings in the a meat processing plant are taken from our estimate of savings in a poultry processing plant. 2 This breakdown is a guess – no data was available. 3 Estimated from conversations with Lelic (2002). 4 Estimated from the general industry feeling (conveyed by Woodward (2002) and the industry literature) that HACCP regulations are preventing the implementation of some of these measures. 5 Percent Savings Potential = Savings * (1-Penetration)/ (1- Savings*Penetration Rate) (See Appendices C and D for derivation) 6 Estimated from data presented by the North Carolina Cooperative Extension (1999). 7 Estimated based on overall application of reuse of cooling water, rinse, wash water etc. from the 1997 CIFAR Survey 8 Σx% * s%. (See Appendices C and D for derivation) Estimate of Potential Water Savings
The conservation potential for common end uses was calculated in the end use studies (see Appendix C) and then applied to our GED-derived estimate of water use to get potential water savings for these end uses. To get the conservation potential for the Meat Processing industry’s process water use, we used data from poultry processing (see Table F-1 above). A sensitivity analysis was applied to our best guess penetration rates to obtain a high and low estimate.
Table F-3 Potential Water Savings in the Meat Processing Industry (2000)
End Use Water Use (TAF)
Conservation Potential (percent) Potential Savings (TAF)
Low High Best Low High Best Process 8.8 14% 29% 25% 1.2 2.5 2.2
Details of Industrial Water Use and Potential Savings, by Sector: Appendix F Page 4
4
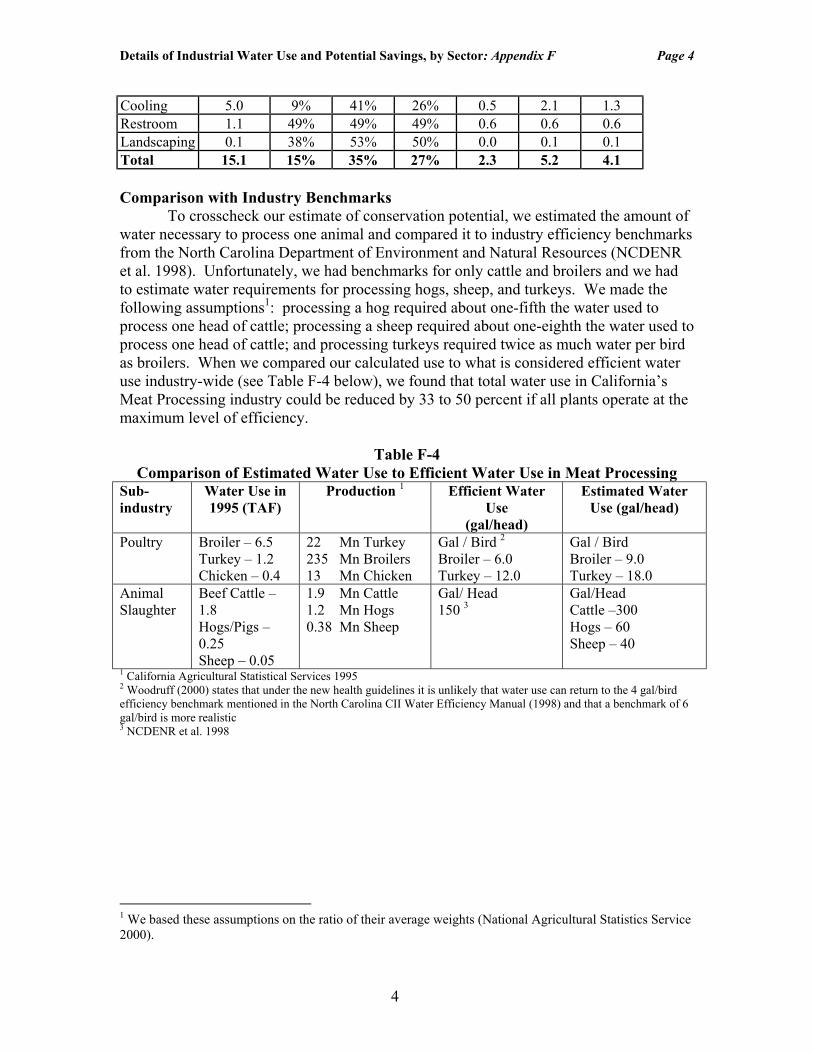
Cooling 5.0 9% 41% 26% 0.5 2.1 1.3 Restroom 1.1 49% 49% 49% 0.6 0.6 0.6 Landscaping 0.1 38% 53% 50% 0.0 0.1 0.1 Total 15.1 15% 35% 27% 2.3 5.2 4.1 Comparison with Industry Benchmarks To crosscheck our estimate of conservation potential, we estimated the amount of water necessary to process one animal and compared it to industry efficiency benchmarks from the North Carolina Department of Environment and Natural Resources (NCDENR et al. 1998). Unfortunately, we had benchmarks for only cattle and broilers and we had to estimate water requirements for processing hogs, sheep, and turkeys. We made the following assumptions1: processing a hog required about one-fifth the water used to process one head of cattle; processing a sheep required about one-eighth the water used to process one head of cattle; and processing turkeys required twice as much water per bird as broilers. When we compared our calculated use to what is considered efficient water use industry-wide (see Table F-4 below), we found that total water use in California’s Meat Processing industry could be reduced by 33 to 50 percent if all plants operate at the maximum level of efficiency.
Table F-4 Comparison of Estimated Water Use to Efficient Water Use in Meat Processing
Sub-industry
Water Use in 1995 (TAF)
Production 1 Efficient Water Use
(gal/head)
Estimated Water Use (gal/head)
Poultry Broiler – 6.5 Turkey – 1.2 Chicken – 0.4
22 Mn Turkey 235 Mn Broilers 13 Mn Chicken
Gal / Bird 2 Broiler – 6.0 Turkey – 12.0
Gal / Bird Broiler – 9.0 Turkey – 18.0
Animal Slaughter
Beef Cattle – 1.8 Hogs/Pigs – 0.25 Sheep – 0.05
1.9 Mn Cattle 1.2 Mn Hogs 0.38 Mn Sheep
Gal/ Head 150 3
Gal/Head Cattle –300 Hogs – 60 Sheep – 40
1 California Agricultural Statistical Services 1995 2 Woodruff (2000) states that under the new health guidelines it is unlikely that water use can return to the 4 gal/bird efficiency benchmark mentioned in the North Carolina CII Water Efficiency Manual (1998) and that a benchmark of 6 gal/bird is more realistic 3 NCDENR et al. 1998
1 We based these assumptions on the ratio of their average weights (National Agricultural Statistics Service 2000).
Details of Industrial Water Use and Potential Savings, by Sector: Appendix F Page 5
5
Dairy Products (SIC code 202) Industry Description The Dairy industry includes establishments primarily engaged in manufacturing: butter; cheese; dry, condensed, and evaporated milk;2 ice cream and frozen dairy desserts; and special dairy products. SIC code 202 covers only milk processing plants and not dairy farms.
Table F-5 Employment and Water Use in the Dairy Products Industry (2000)
Sub-industry SIC code Employment GED1,2 Water Use
(TAF) Creamery butter 2021 540 5,319 2.0 Cheese, natural and processed 2022 4,200 2,078 6.0 Dry, condensed products 2023 2,380 1,071 1.8 Ice cream and frozen desserts 2024 2,350 1,071 1.7 Fluid milk 2026 6,540 1,292 5.8 Total 202 16,010 1,568 17.3
1 Based on a 225-day year. 2 The GEDs estimated for 1995, were decreased by 6% to obtain the GED coefficients in 2000, for the industrial sector.
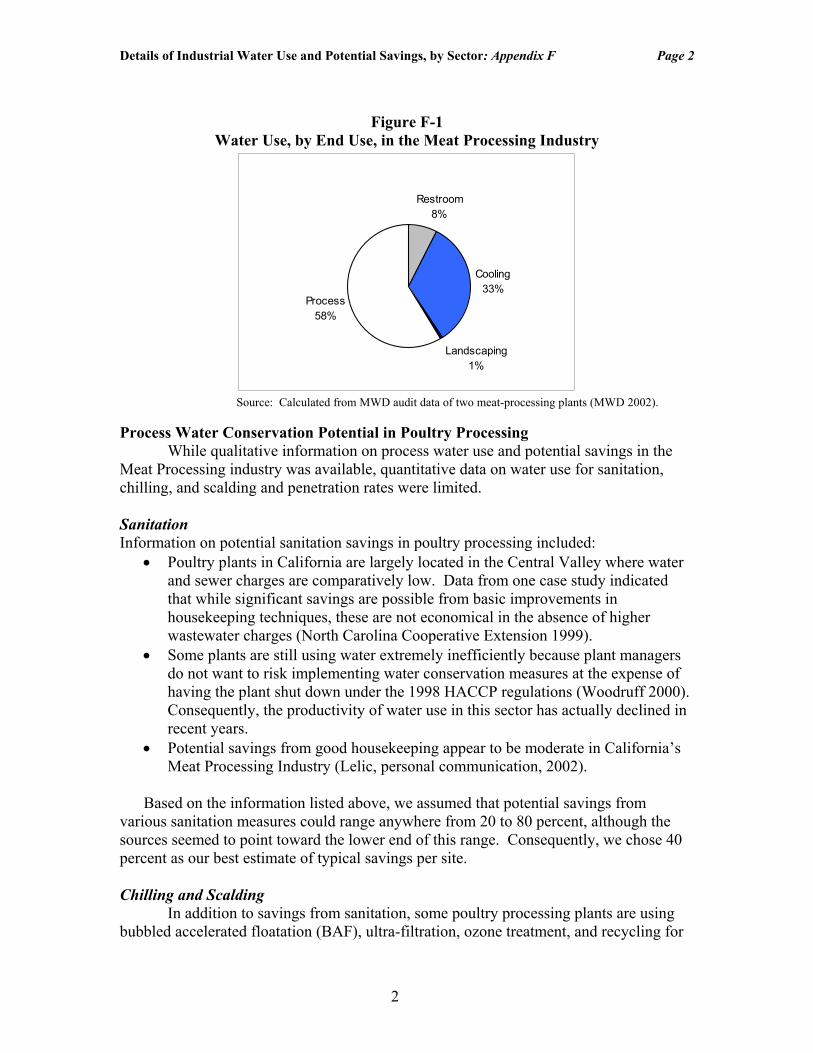
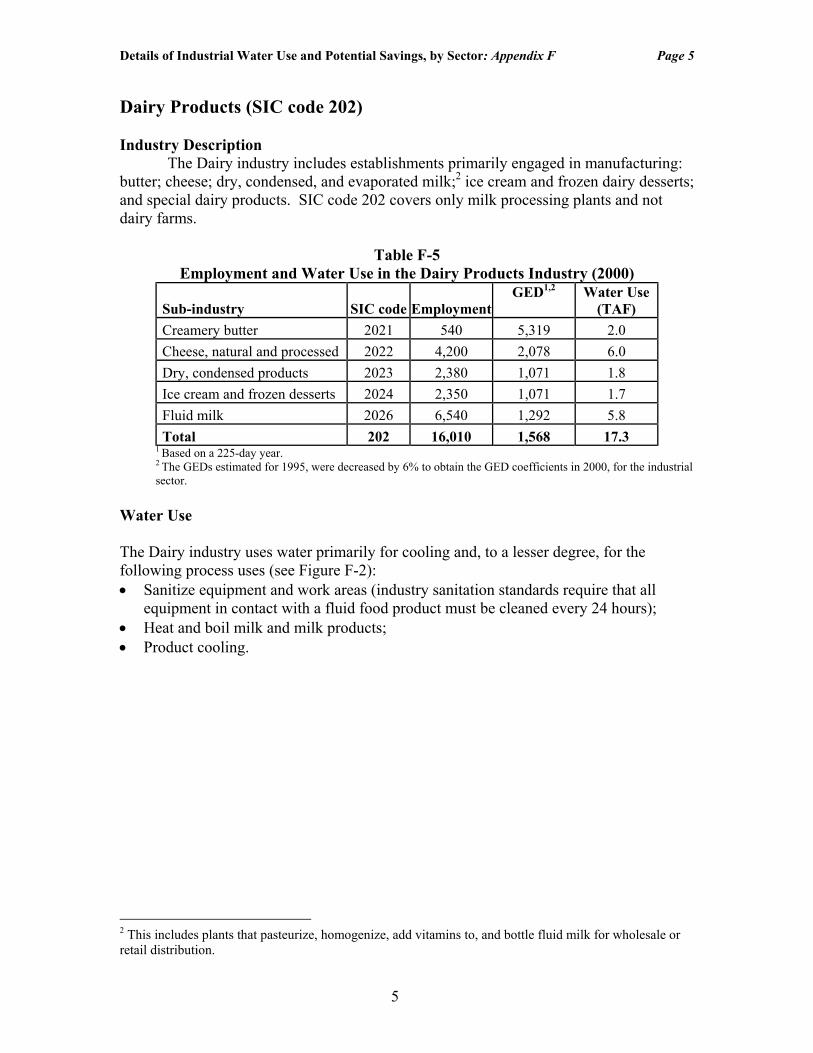
Water Use The Dairy industry uses water primarily for cooling and, to a lesser degree, for the following process uses (see Figure F-2): • Sanitize equipment and work areas (industry sanitation standards require that all
equipment in contact with a fluid food product must be cleaned every 24 hours); • Heat and boil milk and milk products; • Product cooling.
2 This includes plants that pasteurize, homogenize, add vitamins to, and bottle fluid milk for wholesale or retail distribution.
Details of Industrial Water Use and Potential Savings, by Sector: Appendix F Page 6
6
Figure F-2
Water Use, by End Use, in the Dairy Products Industry
Cooling71%
Process23%
Restroom3%
Landscaping3%
source: Calculated from MWD audit data of three dairy processing plants (MWD 2002). Process Water Conservation Potential
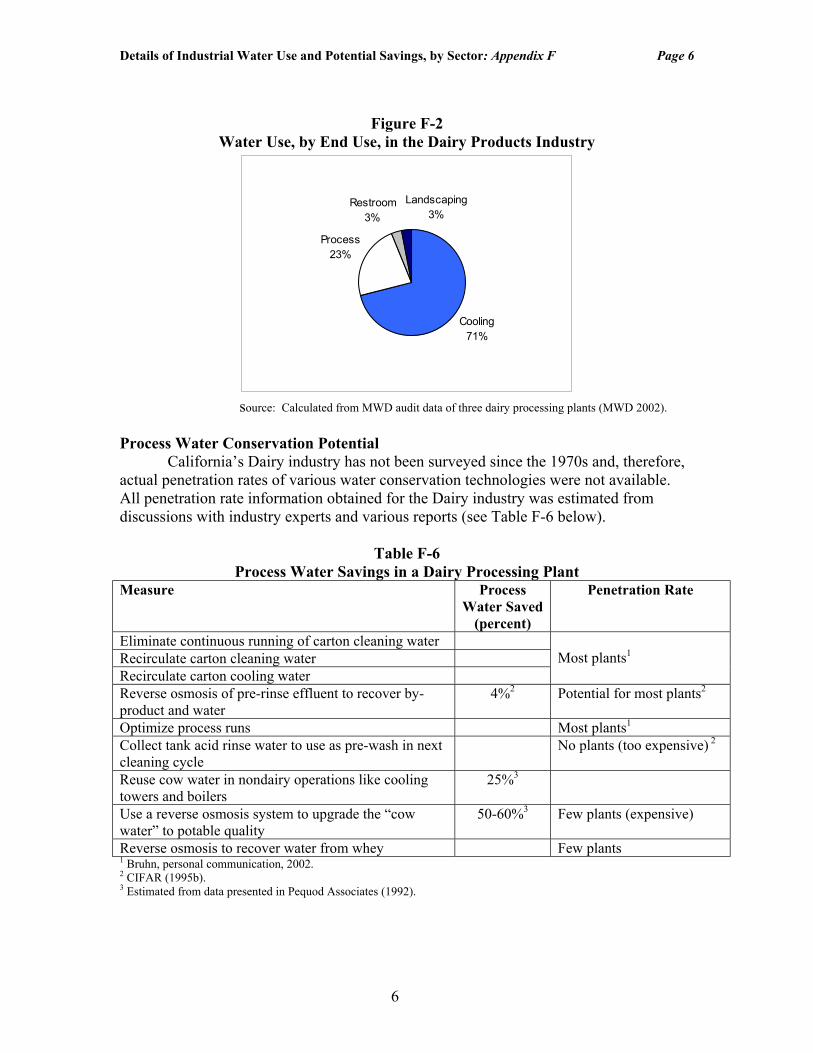
California’s Dairy industry has not been surveyed since the 1970s and, therefore, actual penetration rates of various water conservation technologies were not available. All penetration rate information obtained for the Dairy industry was estimated from discussions with industry experts and various reports (see Table F-6 below).
Table F-6 Process Water Savings in a Dairy Processing Plant
Measure Process Water Saved
(percent)
Penetration Rate
Eliminate continuous running of carton cleaning water Recirculate carton cleaning water Recirculate carton cooling water
Most plants1
Reverse osmosis of pre-rinse effluent to recover by-product and water
4%2 Potential for most plants2
Optimize process runs Most plants1 Collect tank acid rinse water to use as pre-wash in next cleaning cycle
No plants (too expensive) 2
Reuse cow water in nondairy operations like cooling towers and boilers
25%3
Use a reverse osmosis system to upgrade the “cow water” to potable quality
50-60%3 Few plants (expensive)
Reverse osmosis to recover water from whey Few plants 1 Bruhn, personal communication, 2002. 2 CIFAR (1995b). 3 Estimated from data presented in Pequod Associates (1992).
Details of Industrial Water Use and Potential Savings, by Sector: Appendix F Page 7
7
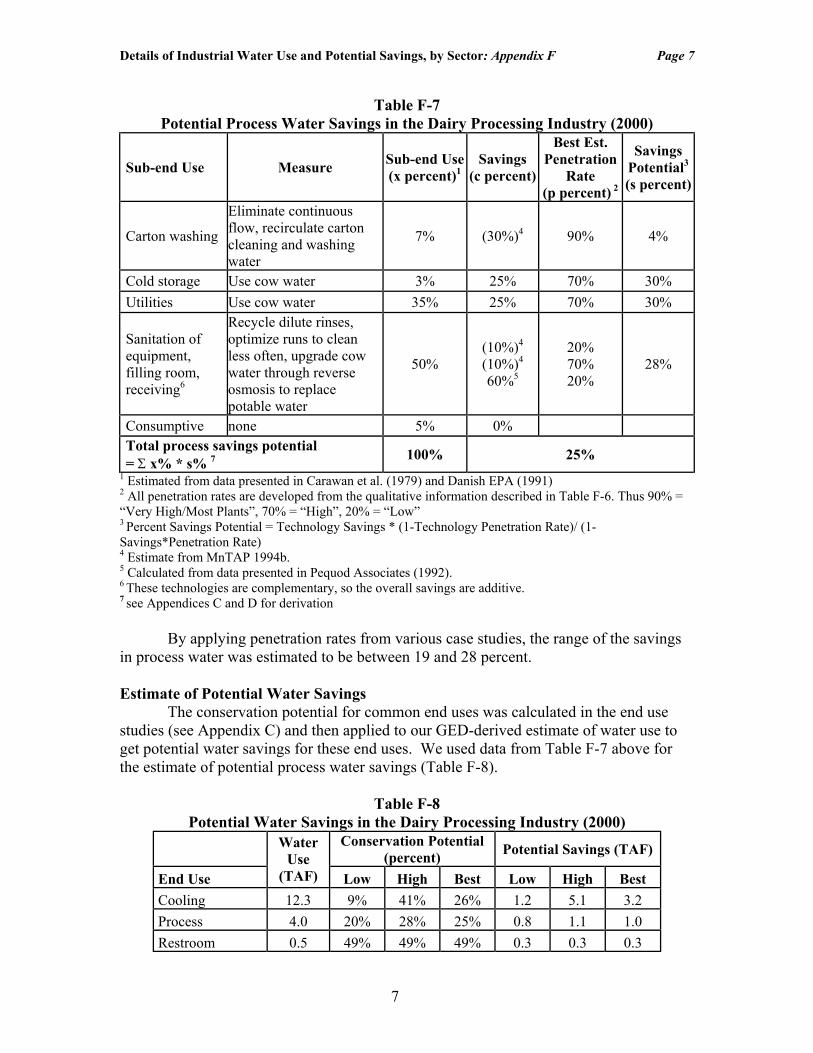
Table F-7 Potential Process Water Savings in the Dairy Processing Industry (2000)
Sub-end Use Measure Sub-end Use (x percent)1
Savings (c percent)
Best Est. Penetration
Rate (p percent) 2
Savings Potential3 (s percent)
Carton washing
Eliminate continuous flow, recirculate carton cleaning and washing water
7% (30%)4 90% 4%
Cold storage Use cow water 3% 25% 70% 30% Utilities Use cow water 35% 25% 70% 30%
Sanitation of equipment, filling room, receiving6
Recycle dilute rinses, optimize runs to clean less often, upgrade cow water through reverse osmosis to replace potable water
50% (10%)4 (10%)4 60%5
20% 70% 20%
28%
Consumptive none 5% 0% Total process savings potential = Σ x% * s% 7 100% 25%
1 Estimated from data presented in Carawan et al. (1979) and Danish EPA (1991) 2 All penetration rates are developed from the qualitative information described in Table F-6. Thus 90% = “Very High/Most Plants”, 70% = “High”, 20% = “Low” 3 Percent Savings Potential = Technology Savings * (1-Technology Penetration Rate)/ (1- Savings*Penetration Rate) 4 Estimate from MnTAP 1994b. 5 Calculated from data presented in Pequod Associates (1992). 6 These technologies are complementary, so the overall savings are additive. 7 see Appendices C and D for derivation
By applying penetration rates from various case studies, the range of the savings in process water was estimated to be between 19 and 28 percent. Estimate of Potential Water Savings The conservation potential for common end uses was calculated in the end use studies (see Appendix C) and then applied to our GED-derived estimate of water use to get potential water savings for these end uses. We used data from Table F-7 above for the estimate of potential process water savings (Table F-8).
Table F-8 Potential Water Savings in the Dairy Processing Industry (2000)
Conservation Potential
(percent) Potential Savings (TAF)
End Use
Water Use
(TAF) Low High Best Low High Best Cooling 12.3 9% 41% 26% 1.2 5.1 3.2 Process 4.0 20% 28% 25% 0.8 1.1 1.0 Restroom 0.5 49% 49% 49% 0.3 0.3 0.3
Details of Industrial Water Use and Potential Savings, by Sector: Appendix F Page 8
8
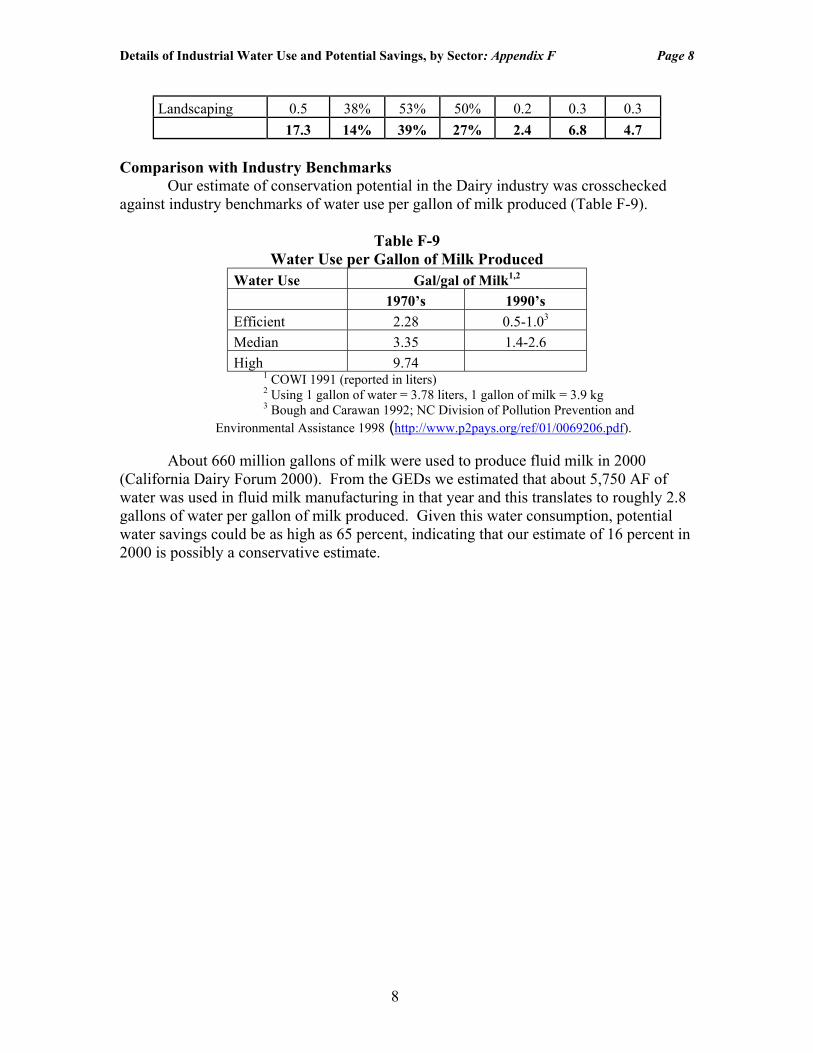
Landscaping 0.5 38% 53% 50% 0.2 0.3 0.3 17.3 14% 39% 27% 2.4 6.8 4.7
Comparison with Industry Benchmarks Our estimate of conservation potential in the Dairy industry was crosschecked against industry benchmarks of water use per gallon of milk produced (Table F-9).
Table F-9 Water Use per Gallon of Milk Produced
Water Use Gal/gal of Milk1,2 1970’s 1990’s Efficient 2.28 0.5-1.03 Median 3.35 1.4-2.6 High 9.74
1 COWI 1991 (reported in liters) 2 Using 1 gallon of water = 3.78 liters, 1 gallon of milk = 3.9 kg 3 Bough and Carawan 1992; NC Division of Pollution Prevention and
Environmental Assistance 1998 (http://www.p2pays.org/ref/01/0069206.pdf).
About 660 million gallons of milk were used to produce fluid milk in 2000 (California Dairy Forum 2000). From the GEDs we estimated that about 5,750 AF of water was used in fluid milk manufacturing in that year and this translates to roughly 2.8 gallons of water per gallon of milk produced. Given this water consumption, potential water savings could be as high as 65 percent, indicating that our estimate of 16 percent in 2000 is possibly a conservative estimate.
Details of Industrial Water Use and Potential Savings, by Sector: Appendix F Page 9
9
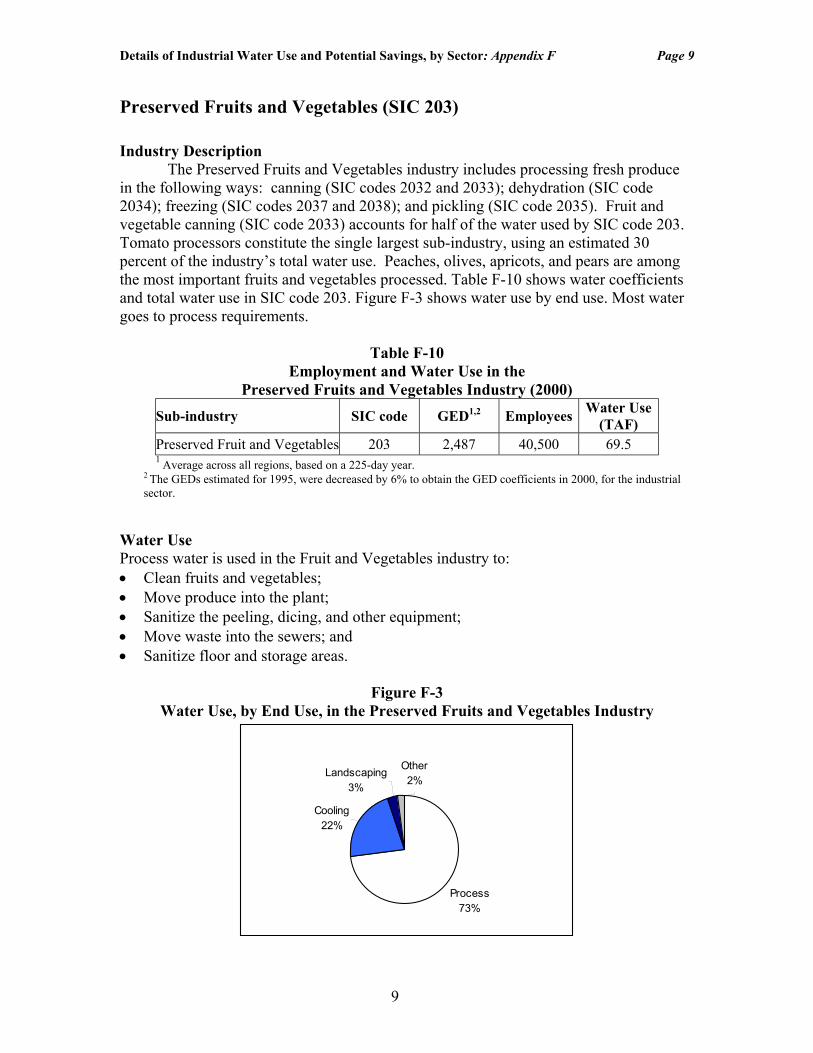
Preserved Fruits and Vegetables (SIC 203) Industry Description The Preserved Fruits and Vegetables industry includes processing fresh produce in the following ways: canning (SIC codes 2032 and 2033); dehydration (SIC code 2034); freezing (SIC codes 2037 and 2038); and pickling (SIC code 2035). Fruit and vegetable canning (SIC code 2033) accounts for half of the water used by SIC code 203. Tomato processors constitute the single largest sub-industry, using an estimated 30 percent of the industry’s total water use. Peaches, olives, apricots, and pears are among the most important fruits and vegetables processed. Table F-10 shows water coefficients and total water use in SIC code 203. Figure F-3 shows water use by end use. Most water goes to process requirements.
Table F-10 Employment and Water Use in the
Preserved Fruits and Vegetables Industry (2000) Sub-industry SIC code GED1,2 Employees Water Use
(TAF) Preserved Fruit and Vegetables 203 2,487 40,500 69.5
1 Average across all regions, based on a 225-day year. 2 The GEDs estimated for 1995, were decreased by 6% to obtain the GED coefficients in 2000, for the industrial sector.
Water Use Process water is used in the Fruit and Vegetables industry to: • Clean fruits and vegetables; • Move produce into the plant; • Sanitize the peeling, dicing, and other equipment; • Move waste into the sewers; and • Sanitize floor and storage areas.
Figure F-3 Water Use, by End Use, in the Preserved Fruits and Vegetables Industry
Process73%
Cooling22%
Landscaping3%
Other2%
Details of Industrial Water Use and Potential Savings, by Sector: Appendix F Page 10
10
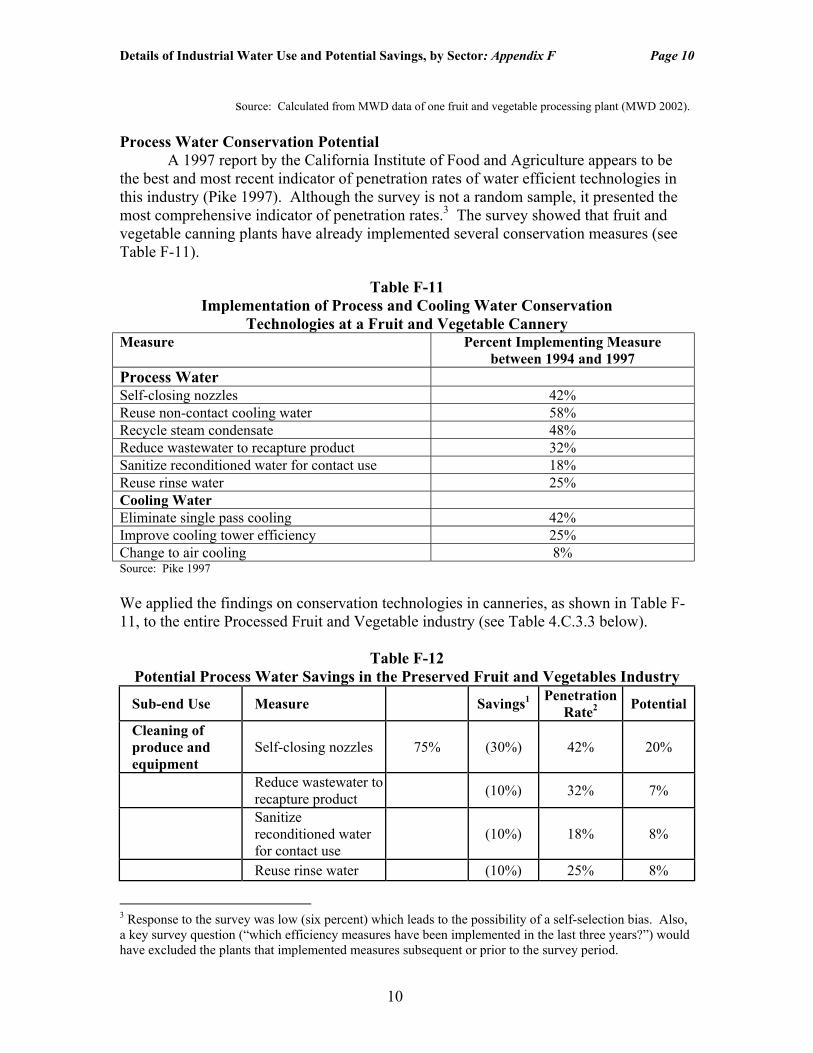
source: Calculated from MWD data of one fruit and vegetable processing plant (MWD 2002). Process Water Conservation Potential A 1997 report by the California Institute of Food and Agriculture appears to be the best and most recent indicator of penetration rates of water efficient technologies in this industry (Pike 1997). Although the survey is not a random sample, it presented the most comprehensive indicator of penetration rates.3 The survey showed that fruit and vegetable canning plants have already implemented several conservation measures (see Table F-11).
Table F-11 Implementation of Process and Cooling Water Conservation
Technologies at a Fruit and Vegetable Cannery Measure Percent Implementing Measure
between 1994 and 1997 Process Water Self-closing nozzles 42% Reuse non-contact cooling water 58% Recycle steam condensate 48% Reduce wastewater to recapture product 32% Sanitize reconditioned water for contact use 18% Reuse rinse water 25% Cooling Water Eliminate single pass cooling 42% Improve cooling tower efficiency 25% Change to air cooling 8% Source: Pike 1997 We applied the findings on conservation technologies in canneries, as shown in Table F-11, to the entire Processed Fruit and Vegetable industry (see Table 4.C.3.3 below).
Table F-12 Potential Process Water Savings in the Preserved Fruit and Vegetables Industry
Sub-end Use Measure Savings1 Penetration Rate2 Potential
Cleaning of produce and equipment
Self-closing nozzles 75% (30%) 42% 20%
Reduce wastewater to recapture product
(10%) 32% 7%
Sanitize reconditioned water for contact use
(10%) 18% 8%
Reuse rinse water (10%) 25% 8%
3 Response to the survey was low (six percent) which leads to the possibility of a self-selection bias. Also, a key survey question (“which efficiency measures have been implemented in the last three years?”) would have excluded the plants that implemented measures subsequent or prior to the survey period.
Details of Industrial Water Use and Potential Savings, by Sector: Appendix F Page 11
11
Membrane filtration of wastewater for reuse
(20%) 0% 20%
Combined3 22% Utilities/Boilers 25% Recycle steam condensate (50%) 48% 34%
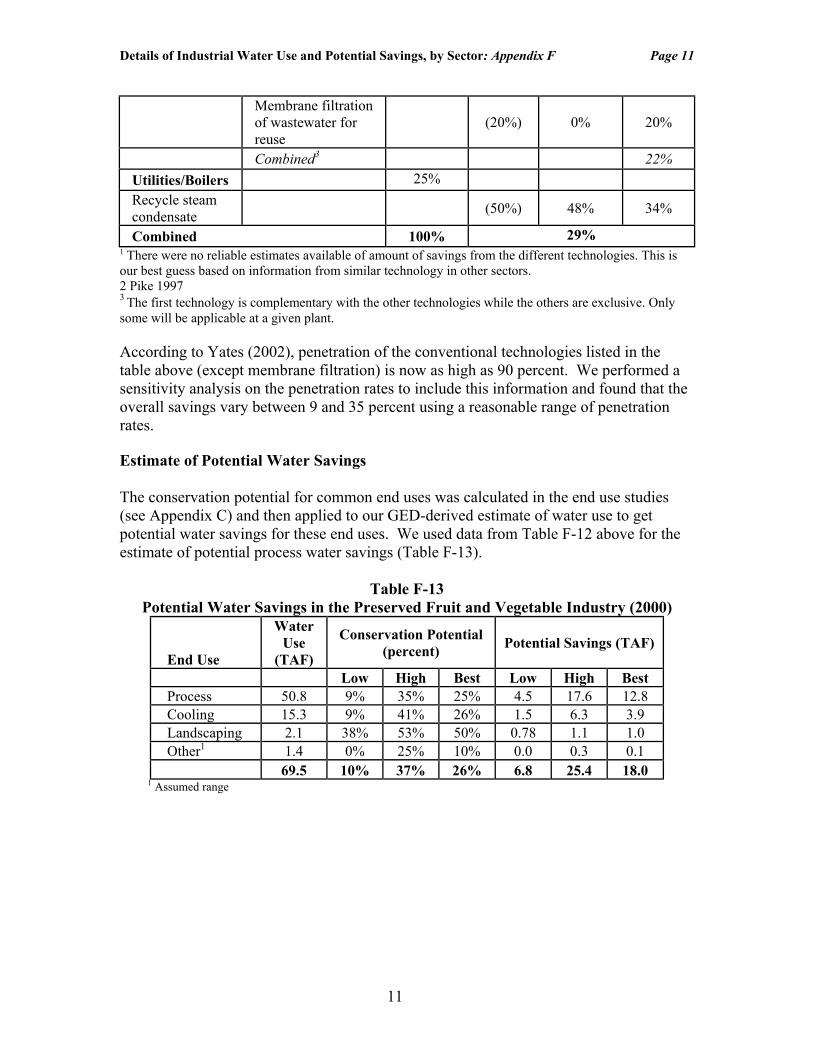
Combined 100% 29% 1 There were no reliable estimates available of amount of savings from the different technologies. This is our best guess based on information from similar technology in other sectors. 2 Pike 1997 3 The first technology is complementary with the other technologies while the others are exclusive. Only some will be applicable at a given plant. According to Yates (2002), penetration of the conventional technologies listed in the table above (except membrane filtration) is now as high as 90 percent. We performed a sensitivity analysis on the penetration rates to include this information and found that the overall savings vary between 9 and 35 percent using a reasonable range of penetration rates. Estimate of Potential Water Savings The conservation potential for common end uses was calculated in the end use studies (see Appendix C) and then applied to our GED-derived estimate of water use to get potential water savings for these end uses. We used data from Table F-12 above for the estimate of potential process water savings (Table F-13).
Table F-13 Potential Water Savings in the Preserved Fruit and Vegetable Industry (2000)
End Use
Water Use
(TAF)
Conservation Potential (percent) Potential Savings (TAF)
Low High Best Low High Best Process 50.8 9% 35% 25% 4.5 17.6 12.8 Cooling 15.3 9% 41% 26% 1.5 6.3 3.9 Landscaping 2.1 38% 53% 50% 0.78 1.1 1.0 Other1 1.4 0% 25% 10% 0.0 0.3 0.1 69.5 10% 37% 26% 6.8 25.4 18.0
1 Assumed range
Details of Industrial Water Use and Potential Savings, by Sector: Appendix F Page 12
12
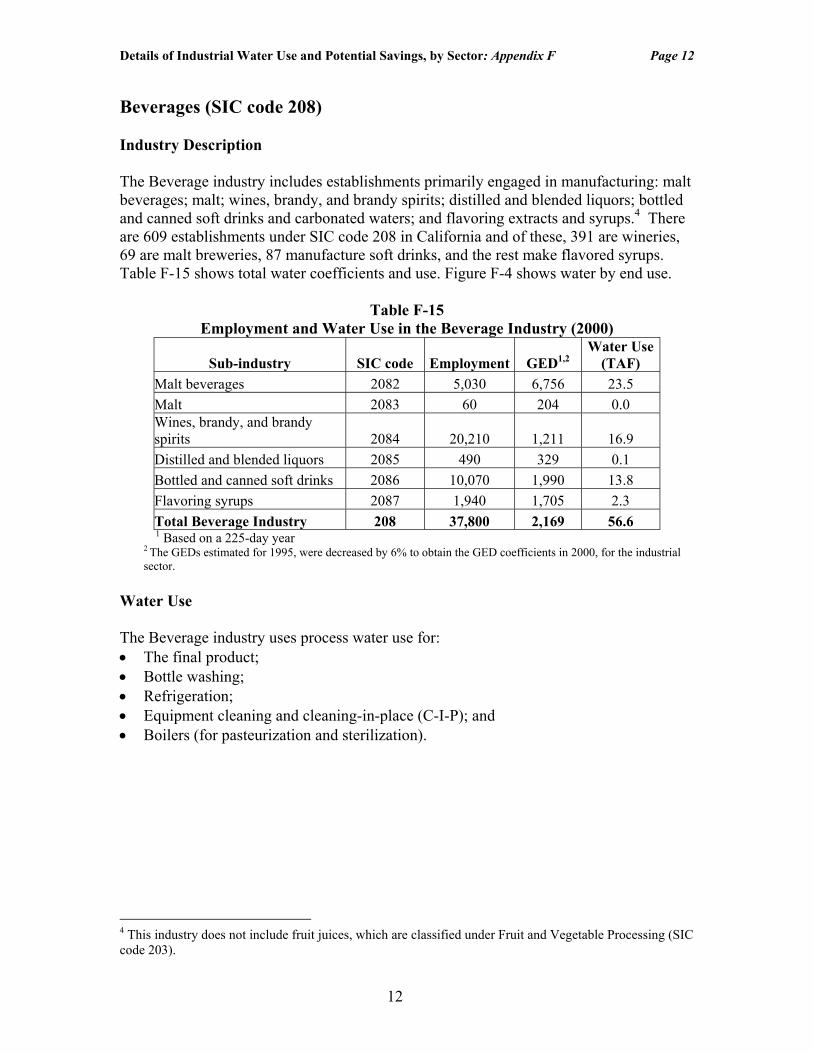
Beverages (SIC code 208) Industry Description The Beverage industry includes establishments primarily engaged in manufacturing: malt beverages; malt; wines, brandy, and brandy spirits; distilled and blended liquors; bottled and canned soft drinks and carbonated waters; and flavoring extracts and syrups.4 There are 609 establishments under SIC code 208 in California and of these, 391 are wineries, 69 are malt breweries, 87 manufacture soft drinks, and the rest make flavored syrups. Table F-15 shows total water coefficients and use. Figure F-4 shows water by end use.
Table F-15 Employment and Water Use in the Beverage Industry (2000)
Sub-industry SIC code
Employment GED1,2 Water Use
(TAF) Malt beverages 2082 5,030 6,756 23.5 Malt 2083 60 204 0.0 Wines, brandy, and brandy spirits 2084 20,210 1,211 16.9 Distilled and blended liquors 2085 490 329 0.1 Bottled and canned soft drinks 2086 10,070 1,990 13.8 Flavoring syrups 2087 1,940 1,705 2.3 Total Beverage Industry 208 37,800 2,169 56.6
1 Based on a 225-day year 2 The GEDs estimated for 1995, were decreased by 6% to obtain the GED coefficients in 2000, for the industrial sector.
Water Use The Beverage industry uses process water use for: • The final product; • Bottle washing; • Refrigeration; • Equipment cleaning and cleaning-in-place (C-I-P); and • Boilers (for pasteurization and sterilization).
4 This industry does not include fruit juices, which are classified under Fruit and Vegetable Processing (SIC code 203).
Details of Industrial Water Use and Potential Savings, by Sector: Appendix F Page 13
13
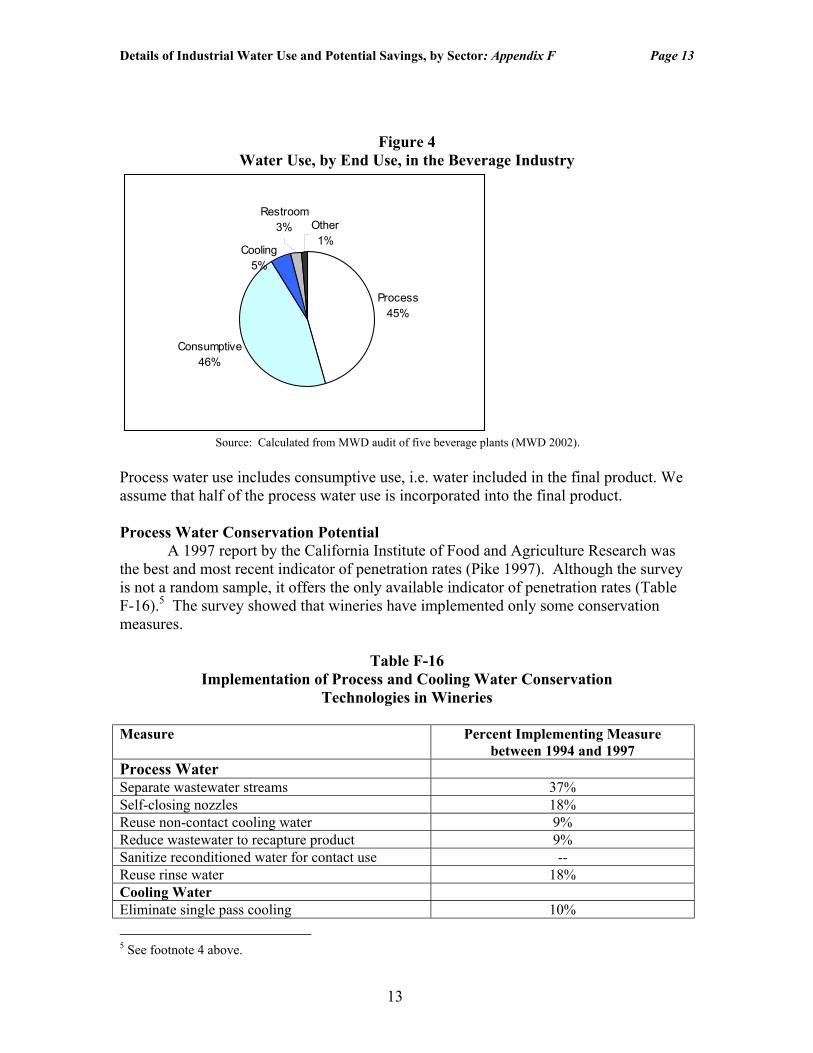
Figure 4 Water Use, by End Use, in the Beverage Industry
Process45%
Consumptive46%
Restroom3%
Cooling5%
Other1%
Source: Calculated from MWD audit of five beverage plants (MWD 2002).
Process water use includes consumptive use, i.e. water included in the final product. We assume that half of the process water use is incorporated into the final product. Process Water Conservation Potential A 1997 report by the California Institute of Food and Agriculture Research was the best and most recent indicator of penetration rates (Pike 1997). Although the survey is not a random sample, it offers the only available indicator of penetration rates (Table F-16).5 The survey showed that wineries have implemented only some conservation measures.
Table F-16 Implementation of Process and Cooling Water Conservation
Technologies in Wineries Measure Percent Implementing Measure
between 1994 and 1997 Process Water Separate wastewater streams 37% Self-closing nozzles 18% Reuse non-contact cooling water 9% Reduce wastewater to recapture product 9% Sanitize reconditioned water for contact use -- Reuse rinse water 18% Cooling Water Eliminate single pass cooling 10% 5 See footnote 4 above.
Details of Industrial Water Use and Potential Savings, by Sector: Appendix F Page 14
14
Source: Pike 1997
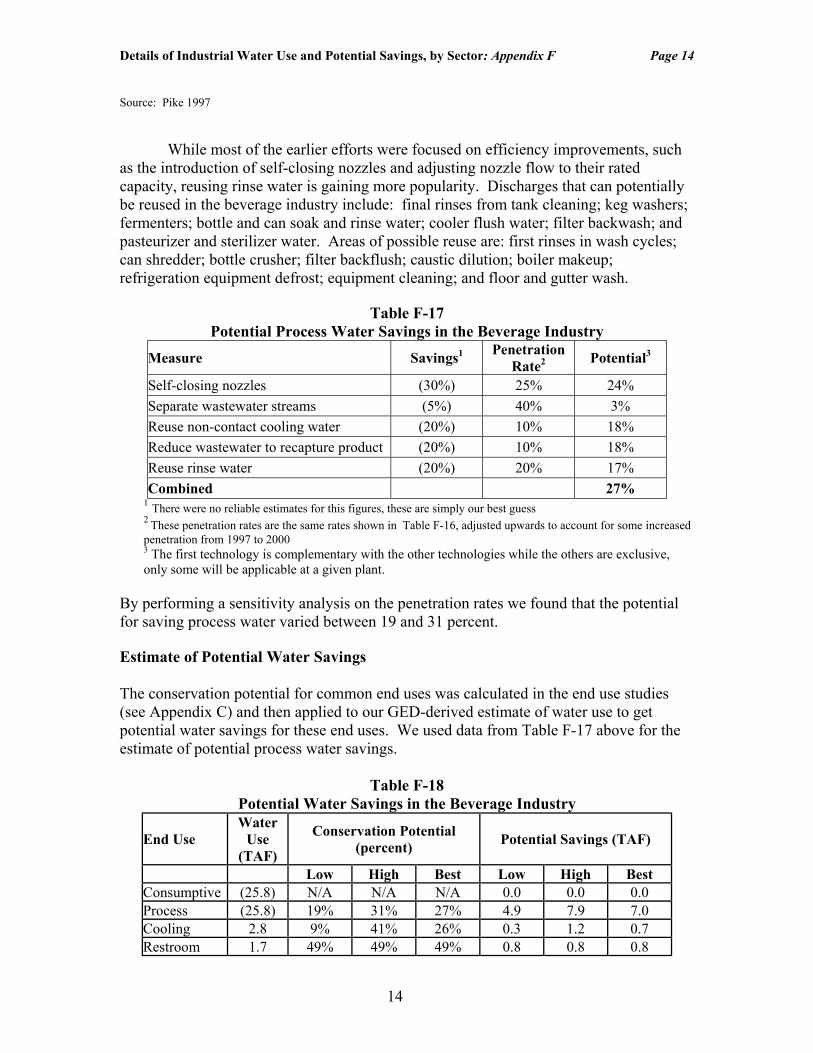
While most of the earlier efforts were focused on efficiency improvements, such as the introduction of self-closing nozzles and adjusting nozzle flow to their rated capacity, reusing rinse water is gaining more popularity. Discharges that can potentially be reused in the beverage industry include: final rinses from tank cleaning; keg washers; fermenters; bottle and can soak and rinse water; cooler flush water; filter backwash; and pasteurizer and sterilizer water. Areas of possible reuse are: first rinses in wash cycles; can shredder; bottle crusher; filter backflush; caustic dilution; boiler makeup; refrigeration equipment defrost; equipment cleaning; and floor and gutter wash.
Table F-17 Potential Process Water Savings in the Beverage Industry
Measure Savings1 Penetration Rate2 Potential3
Self-closing nozzles (30%) 25% 24% Separate wastewater streams (5%) 40% 3% Reuse non-contact cooling water (20%) 10% 18% Reduce wastewater to recapture product (20%) 10% 18% Reuse rinse water (20%) 20% 17% Combined 27%
1 There were no reliable estimates for this figures, these are simply our best guess 2 These penetration rates are the same rates shown in Table F-16, adjusted upwards to account for some increased penetration from 1997 to 2000 3 The first technology is complementary with the other technologies while the others are exclusive, only some will be applicable at a given plant.
By performing a sensitivity analysis on the penetration rates we found that the potential for saving process water varied between 19 and 31 percent. Estimate of Potential Water Savings The conservation potential for common end uses was calculated in the end use studies (see Appendix C) and then applied to our GED-derived estimate of water use to get potential water savings for these end uses. We used data from Table F-17 above for the estimate of potential process water savings.
Table F-18
Potential Water Savings in the Beverage Industry
End Use Water
Use (TAF)
Conservation Potential (percent) Potential Savings (TAF)
Low High Best Low High Best Consumptive (25.8) N/A N/A N/A 0.0 0.0 0.0 Process (25.8) 19% 31% 27% 4.9 7.9 7.0 Cooling 2.8 9% 41% 26% 0.3 1.2 0.7 Restroom 1.7 49% 49% 49% 0.8 0.8 0.8
Details of Industrial Water Use and Potential Savings, by Sector: Appendix F Page 15
15
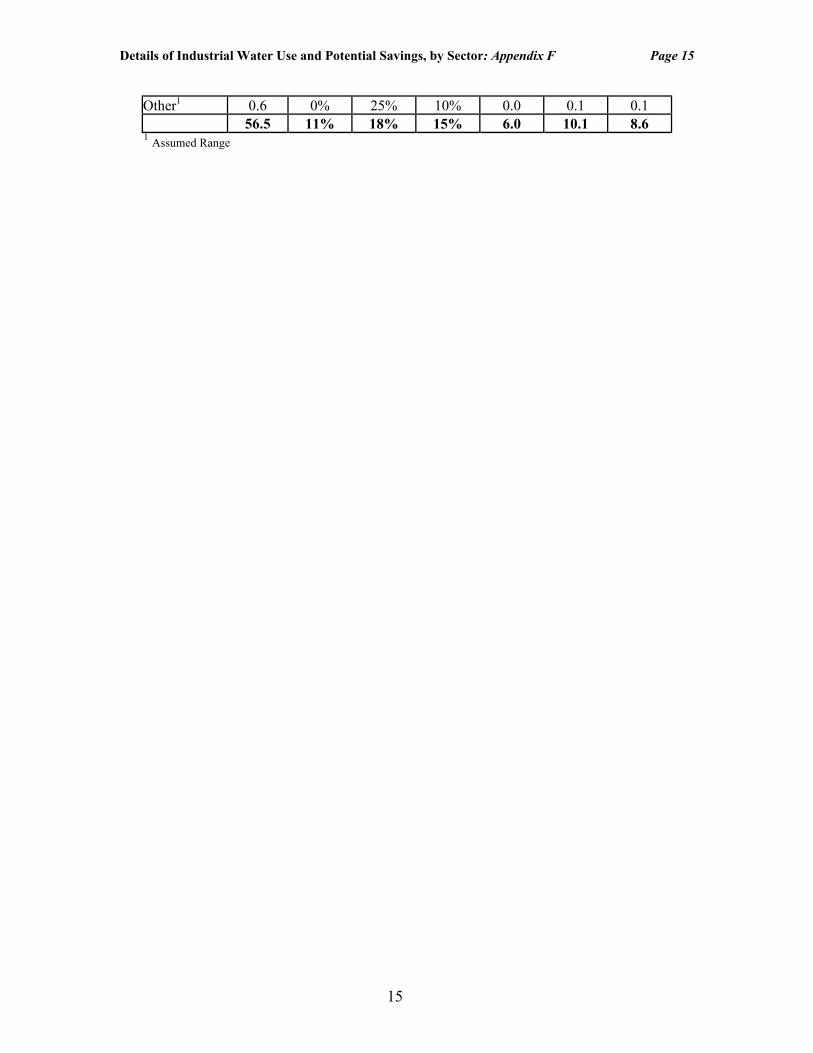
Other1 0.6 0% 25% 10% 0.0 0.1 0.1 56.5 11% 18% 15% 6.0 10.1 8.6 1 Assumed Range
Details of Industrial Water Use and Potential Savings, by Sector: Appendix F Page 16
16
Textile Industry (SIC code 22) Industry Overview
The Textile industry is a relatively new industry in California. In the past three decades, the industry has grown into a $5 billion business located primarily in southern California. The industry is comprised of diverse, fragmented groups of establishments that receive and prepare fibers, transform the fibers into yarn, and then dye or finish the yarn into fabric. Table F-19 shows employment, water coefficients, and total use in the Textile sector.
Table F-19 Employment and Water Use in the Textile Industry (2000)
Sub-industry SIC code Employment GED1,2 Water Use (TAF)
Broad, narrow, knit fabric mills 221, 224 3,180 299 0.7 Knitting mills 225 11,800 1,651 13.5 Textile finishing 226 4,020 910 2.5 Carpets 227 3,200 2,805 6.2 Yarn and thread 228 940 2,805 1.8 Misc. textile goods 229 4,060 2,328 6.5 22 27,200 1,660 31.2
1 Average across all regions, based on a 225-day year. 2 The GEDs estimated for 1995, were decreased by 6% to obtain the GED coefficients in 2000, for the industrial sector.
Water Use
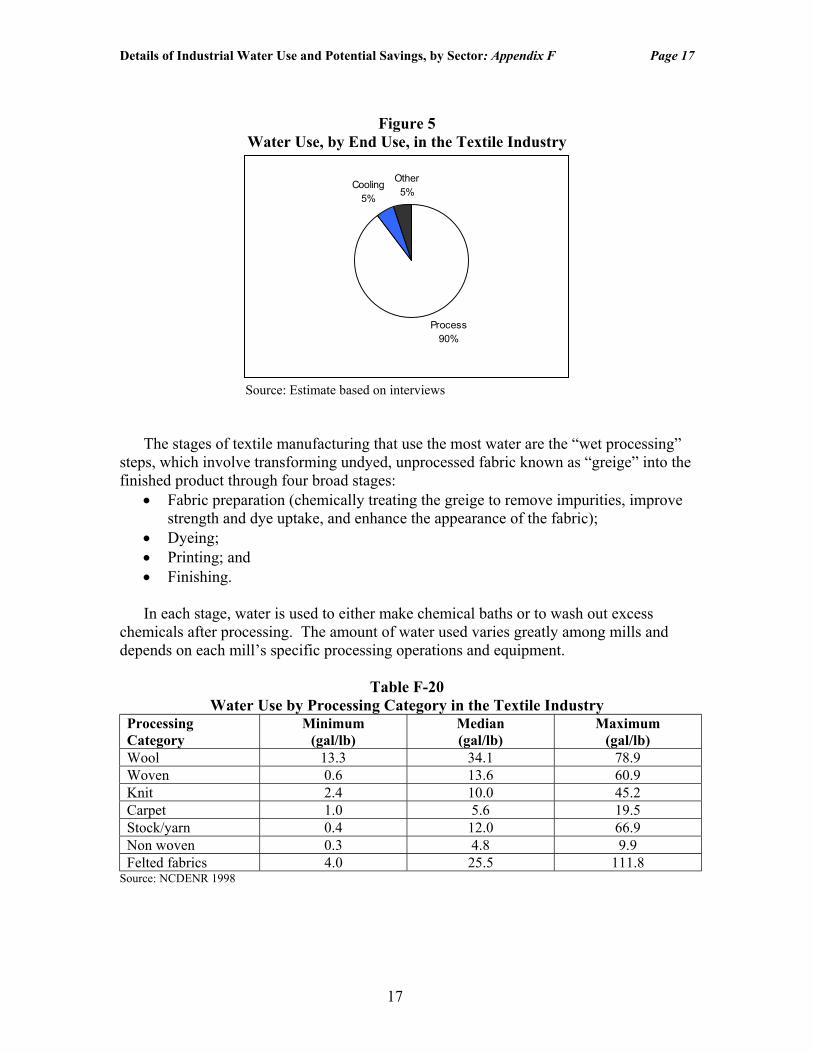
Due to data constraints, an end use breakdown for the textile industry was unavailable. Based on our study of end uses, we assumed that since reasonable restroom and kitchen use would not exceed 50 gallons per employee per day, at least 90 percent of the water use must be for process and cooling. Conversations with Textile industry experts indicated that the residual hot water from the cooling process is reused in various processes (usually dye baths) (Demanyovich 1990). We assumed that only five percent of overall water is used in cooling (Figure F-5).
Details of Industrial Water Use and Potential Savings, by Sector: Appendix F Page 17
17
Figure 5
Water Use, by End Use, in the Textile Industry
Process90%
Cooling5%
Other5%
Source: Estimate based on interviews
The stages of textile manufacturing that use the most water are the “wet processing” steps, which involve transforming undyed, unprocessed fabric known as “greige” into the finished product through four broad stages:
• Fabric preparation (chemically treating the greige to remove impurities, improve strength and dye uptake, and enhance the appearance of the fabric);
• Dyeing; • Printing; and • Finishing.
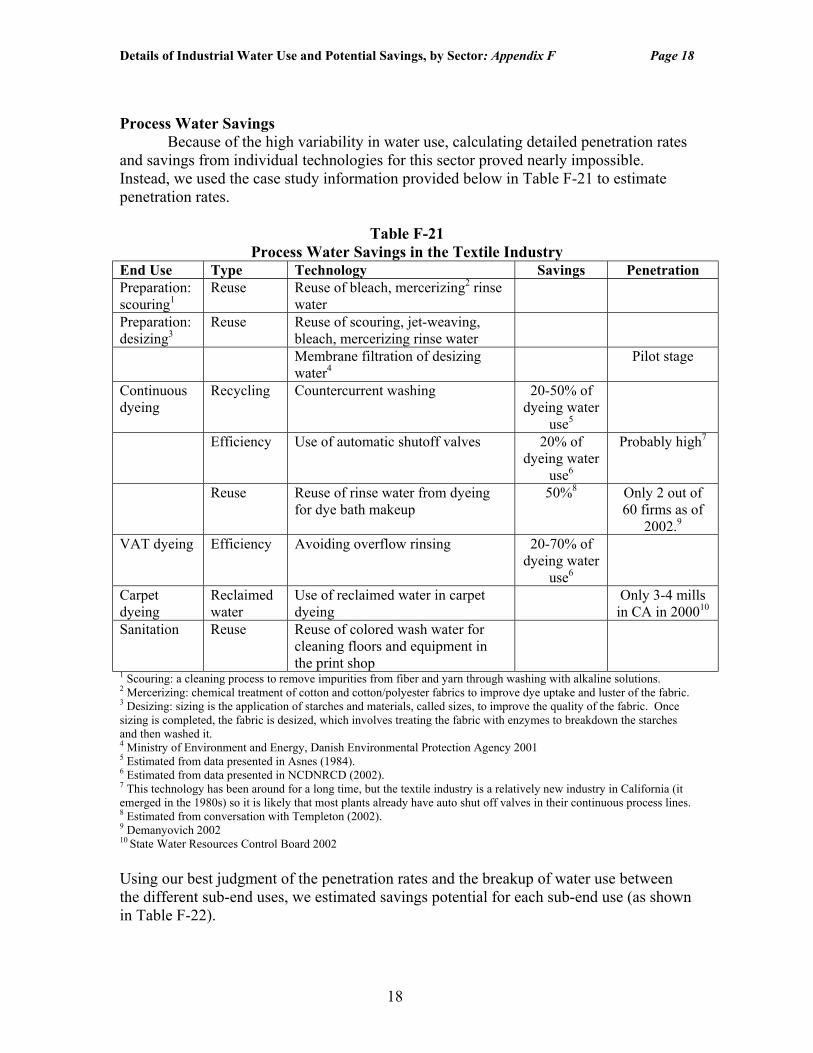
In each stage, water is used to either make chemical baths or to wash out excess
chemicals after processing. The amount of water used varies greatly among mills and depends on each mill’s specific processing operations and equipment.
Table F-20 Water Use by Processing Category in the Textile Industry
Processing Category
Minimum (gal/lb)
Median (gal/lb)
Maximum (gal/lb)
Wool 13.3 34.1 78.9 Woven 0.6 13.6 60.9 Knit 2.4 10.0 45.2 Carpet 1.0 5.6 19.5 Stock/yarn 0.4 12.0 66.9 Non woven 0.3 4.8 9.9 Felted fabrics 4.0 25.5 111.8
Source: NCDENR 1998
Details of Industrial Water Use and Potential Savings, by Sector: Appendix F Page 18
18
Process Water Savings
Because of the high variability in water use, calculating detailed penetration rates and savings from individual technologies for this sector proved nearly impossible. Instead, we used the case study information provided below in Table F-21 to estimate penetration rates.
Table F-21 Process Water Savings in the Textile Industry
End Use Type Technology Savings Penetration Preparation: scouring1
Reuse Reuse of bleach, mercerizing2 rinse water
Preparation: desizing3
Reuse Reuse of scouring, jet-weaving, bleach, mercerizing rinse water
Membrane filtration of desizing water4
Pilot stage
Continuous dyeing
Recycling Countercurrent washing 20-50% of dyeing water
use5
Efficiency Use of automatic shutoff valves 20% of dyeing water
use6
Probably high7
Reuse Reuse of rinse water from dyeing for dye bath makeup
50%8 Only 2 out of 60 firms as of
2002.9 VAT dyeing Efficiency Avoiding overflow rinsing 20-70% of
dyeing water use6
Carpet dyeing
Reclaimed water
Use of reclaimed water in carpet dyeing
Only 3-4 mills in CA in 200010
Sanitation Reuse Reuse of colored wash water for cleaning floors and equipment in the print shop
1 Scouring: a cleaning process to remove impurities from fiber and yarn through washing with alkaline solutions. 2 Mercerizing: chemical treatment of cotton and cotton/polyester fabrics to improve dye uptake and luster of the fabric. 3 Desizing: sizing is the application of starches and materials, called sizes, to improve the quality of the fabric. Once sizing is completed, the fabric is desized, which involves treating the fabric with enzymes to breakdown the starches and then washed it. 4 Ministry of Environment and Energy, Danish Environmental Protection Agency 2001 5 Estimated from data presented in Asnes (1984). 6 Estimated from data presented in NCDNRCD (2002). 7 This technology has been around for a long time, but the textile industry is a relatively new industry in California (it emerged in the 1980s) so it is likely that most plants already have auto shut off valves in their continuous process lines. 8 Estimated from conversation with Templeton (2002). 9 Demanyovich 2002 10 State Water Resources Control Board 2002 Using our best judgment of the penetration rates and the breakup of water use between the different sub-end uses, we estimated savings potential for each sub-end use (as shown in Table F-22).
Details of Industrial Water Use and Potential Savings, by Sector: Appendix F Page 19
19
Table F-22 Potential Process Water Savings in the Textile Industry (2000)
Process Sub-end Use Measure Portion of
Process Use (percent)1
Savings (percent)
Penetration Rate
(percent)
Savings Potential (percent)
Preparation Reuse of scouring, bleach and mercerizing water 15% 33%
Dyeing
Reuse of rinse water from dyeing for dye bath make-up; use of reclaimed water in carpet dyeing; avoiding bath overflow
52% 50%2 100% 50%3
5%4 5%5
50%6
56%7
Printing 6% 10%8
Washing Counter current washing, spray rinsing 27% 30%3 50%6 18%
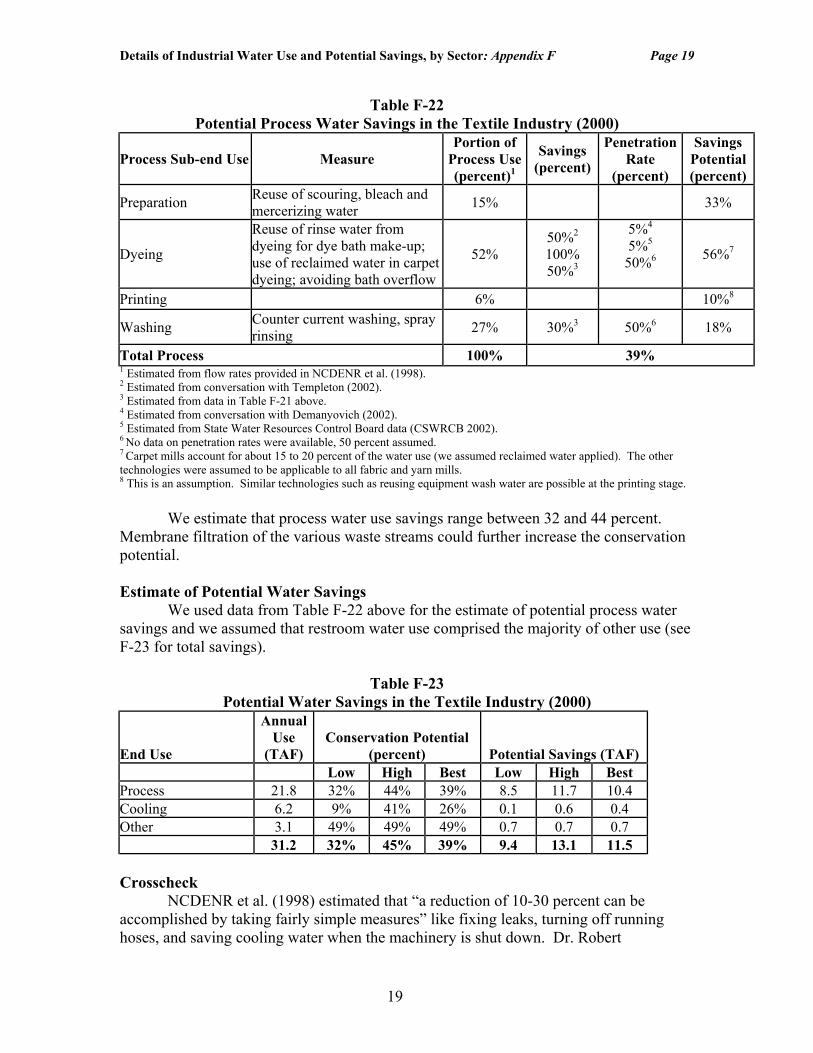
Total Process 100% 39% 1 Estimated from flow rates provided in NCDENR et al. (1998). 2 Estimated from conversation with Templeton (2002). 3 Estimated from data in Table F-21 above. 4 Estimated from conversation with Demanyovich (2002). 5 Estimated from State Water Resources Control Board data (CSWRCB 2002). 6 No data on penetration rates were available, 50 percent assumed. 7 Carpet mills account for about 15 to 20 percent of the water use (we assumed reclaimed water applied). The other technologies were assumed to be applicable to all fabric and yarn mills. 8 This is an assumption. Similar technologies such as reusing equipment wash water are possible at the printing stage.
We estimate that process water use savings range between 32 and 44 percent. Membrane filtration of the various waste streams could further increase the conservation potential. Estimate of Potential Water Savings We used data from Table F-22 above for the estimate of potential process water savings and we assumed that restroom water use comprised the majority of other use (see F-23 for total savings).
Table F-23 Potential Water Savings in the Textile Industry (2000)
End Use
Annual Use
(TAF) Conservation Potential
(percent) Potential Savings (TAF) Low High Best Low High Best Process 21.8 32% 44% 39% 8.5 11.7 10.4 Cooling 6.2 9% 41% 26% 0.1 0.6 0.4 Other 3.1 49% 49% 49% 0.7 0.7 0.7 31.2 32% 45% 39% 9.4 13.1 11.5 Crosscheck NCDENR et al. (1998) estimated that “a reduction of 10-30 percent can be accomplished by taking fairly simple measures” like fixing leaks, turning off running hoses, and saving cooling water when the machinery is shut down. Dr. Robert
Details of Industrial Water Use and Potential Savings, by Sector: Appendix F Page 20
20
Demanyovich (2002) of RJD technologies, an expert in the textile industry, judged the overall savings to be somewhere between 20 to 50 percent. Paper and Pulp (SIC codes 261,262, 263)
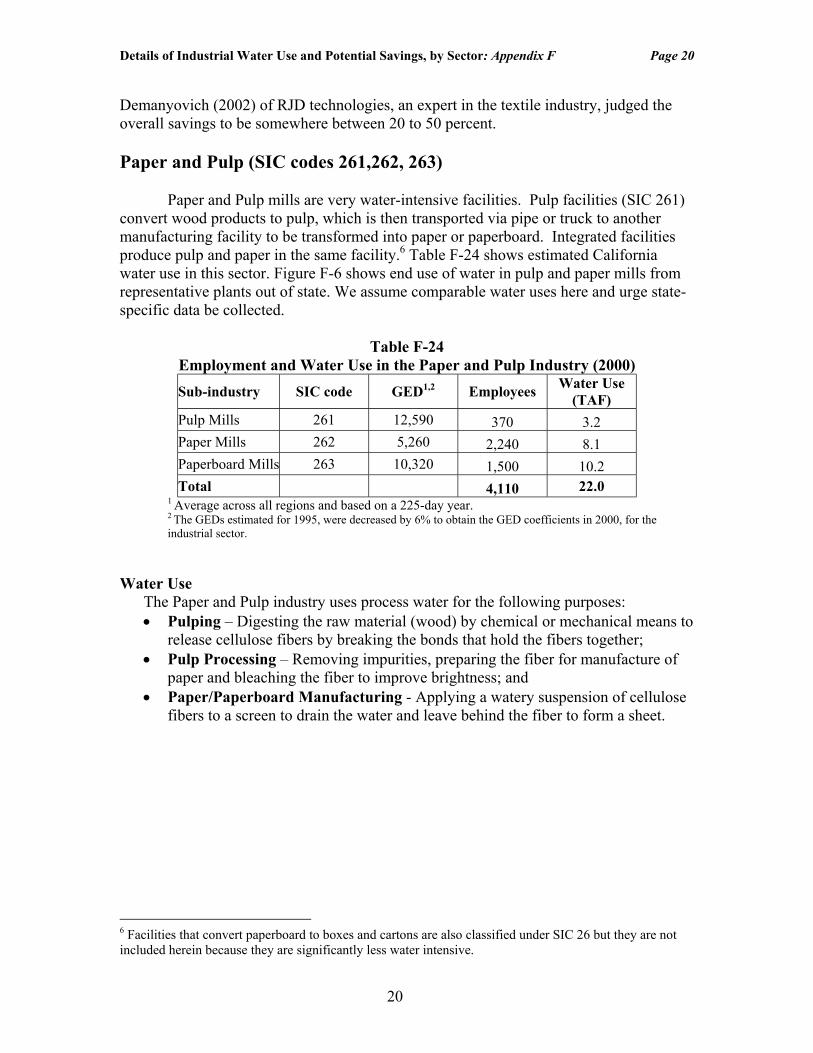
Paper and Pulp mills are very water-intensive facilities. Pulp facilities (SIC 261) convert wood products to pulp, which is then transported via pipe or truck to another manufacturing facility to be transformed into paper or paperboard. Integrated facilities produce pulp and paper in the same facility.6 Table F-24 shows estimated California water use in this sector. Figure F-6 shows end use of water in pulp and paper mills from representative plants out of state. We assume comparable water uses here and urge state-specific data be collected.
Table F-24 Employment and Water Use in the Paper and Pulp Industry (2000) Sub-industry SIC code GED1,2 Employees Water Use
(TAF) Pulp Mills 261 12,590 370 3.2 Paper Mills 262 5,260 2,240 8.1 Paperboard Mills 263 10,320 1,500 10.2 Total 4,110 22.0
1 Average across all regions and based on a 225-day year. 2 The GEDs estimated for 1995, were decreased by 6% to obtain the GED coefficients in 2000, for the industrial sector.
Water Use
The Paper and Pulp industry uses process water for the following purposes: • Pulping – Digesting the raw material (wood) by chemical or mechanical means to
release cellulose fibers by breaking the bonds that hold the fibers together; • Pulp Processing – Removing impurities, preparing the fiber for manufacture of
paper and bleaching the fiber to improve brightness; and • Paper/Paperboard Manufacturing - Applying a watery suspension of cellulose
fibers to a screen to drain the water and leave behind the fiber to form a sheet.
6 Facilities that convert paperboard to boxes and cartons are also classified under SIC 26 but they are not included herein because they are significantly less water intensive.
Details of Industrial Water Use and Potential Savings, by Sector: Appendix F Page 21
21
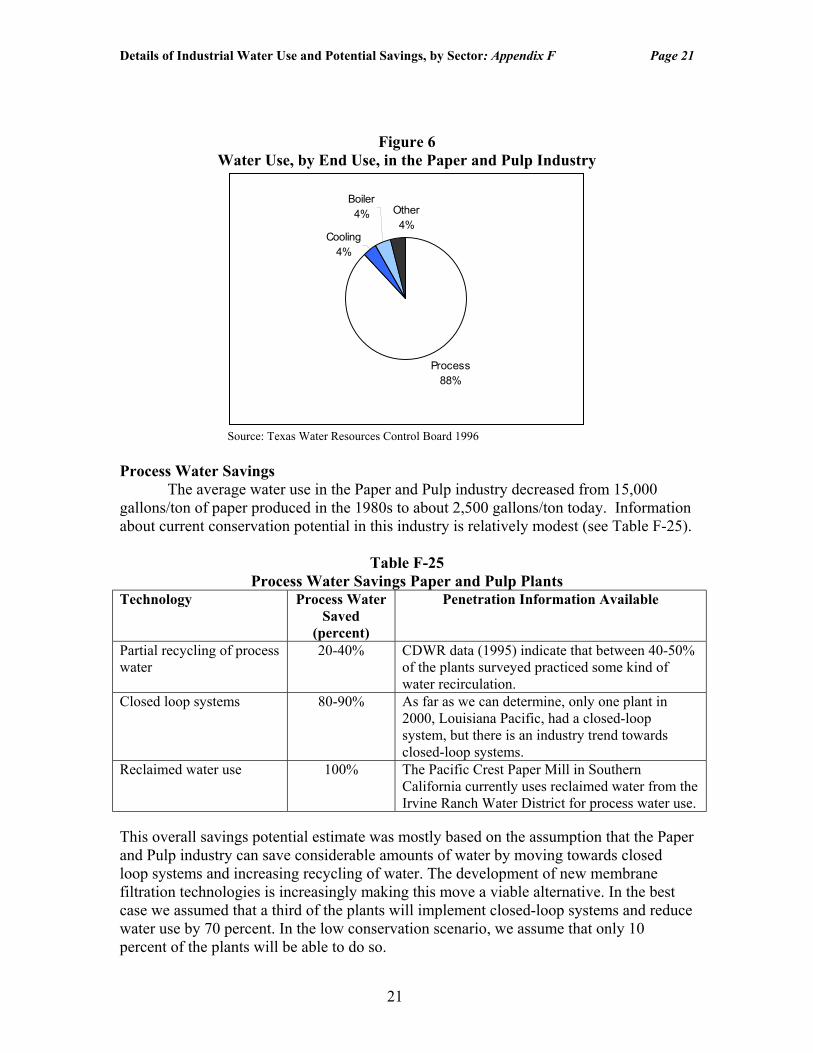
Figure 6 Water Use, by End Use, in the Paper and Pulp Industry
Process88%
Cooling4%
Boiler4% Other
4%
Source: Texas Water Resources Control Board 1996
Process Water Savings The average water use in the Paper and Pulp industry decreased from 15,000 gallons/ton of paper produced in the 1980s to about 2,500 gallons/ton today. Information about current conservation potential in this industry is relatively modest (see Table F-25).
Table F-25 Process Water Savings Paper and Pulp Plants
Technology Process Water Saved
(percent)
Penetration Information Available
Partial recycling of process water
20-40% CDWR data (1995) indicate that between 40-50% of the plants surveyed practiced some kind of water recirculation.
Closed loop systems 80-90% As far as we can determine, only one plant in 2000, Louisiana Pacific, had a closed-loop system, but there is an industry trend towards closed-loop systems.
Reclaimed water use 100% The Pacific Crest Paper Mill in Southern California currently uses reclaimed water from the Irvine Ranch Water District for process water use.
This overall savings potential estimate was mostly based on the assumption that the Paper and Pulp industry can save considerable amounts of water by moving towards closed loop systems and increasing recycling of water. The development of new membrane filtration technologies is increasingly making this move a viable alternative. In the best case we assumed that a third of the plants will implement closed-loop systems and reduce water use by 70 percent. In the low conservation scenario, we assume that only 10 percent of the plants will be able to do so.
Details of Industrial Water Use and Potential Savings, by Sector: Appendix F Page 22
22
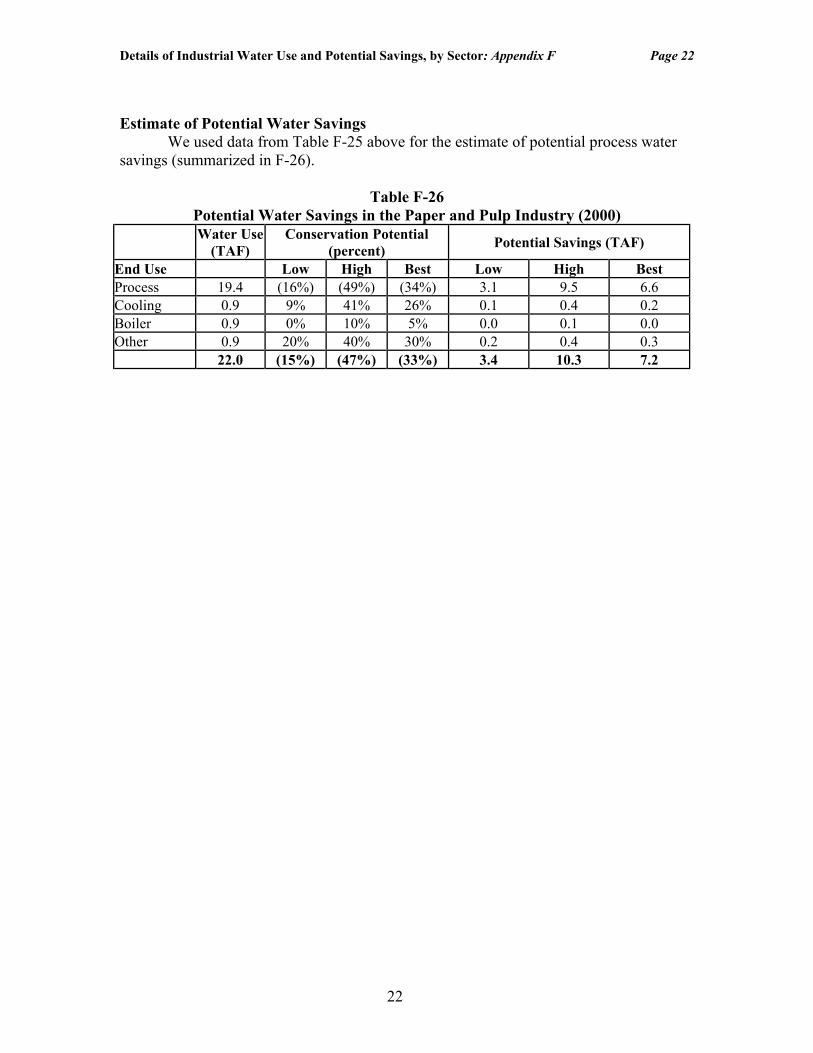
Estimate of Potential Water Savings We used data from Table F-25 above for the estimate of potential process water savings (summarized in F-26).
Table F-26 Potential Water Savings in the Paper and Pulp Industry (2000)
Water Use
(TAF) Conservation Potential
(percent) Potential Savings (TAF)
End Use Low High Best Low High Best Process 19.4 (16%) (49%) (34%) 3.1 9.5 6.6 Cooling 0.9 9% 41% 26% 0.1 0.4 0.2 Boiler 0.9 0% 10% 5% 0.0 0.1 0.0 Other 0.9 20% 40% 30% 0.2 0.4 0.3 22.0 (15%) (47%) (33%) 3.4 10.3 7.2
Details of Industrial Water Use and Potential Savings, by Sector: Appendix F Page 23
23
Fabricated Metals (SIC code 34) Industry Overview
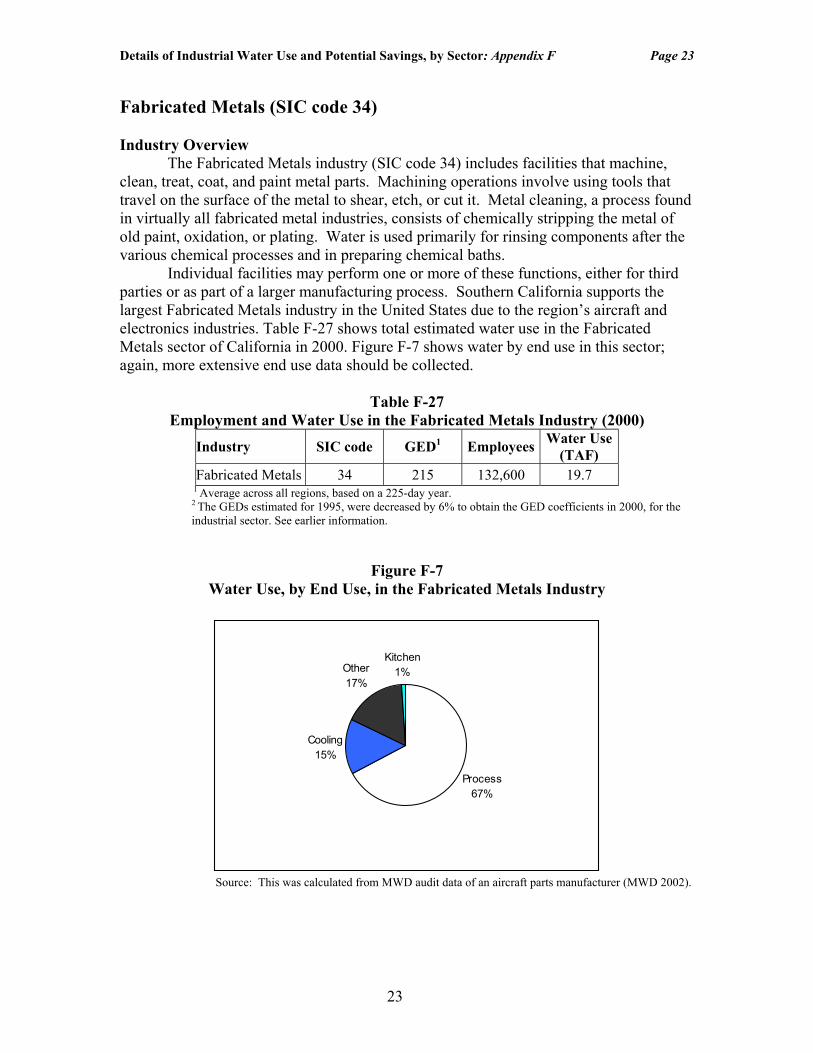
The Fabricated Metals industry (SIC code 34) includes facilities that machine, clean, treat, coat, and paint metal parts. Machining operations involve using tools that travel on the surface of the metal to shear, etch, or cut it. Metal cleaning, a process found in virtually all fabricated metal industries, consists of chemically stripping the metal of old paint, oxidation, or plating. Water is used primarily for rinsing components after the various chemical processes and in preparing chemical baths. Individual facilities may perform one or more of these functions, either for third parties or as part of a larger manufacturing process. Southern California supports the largest Fabricated Metals industry in the United States due to the region’s aircraft and electronics industries. Table F-27 shows total estimated water use in the Fabricated Metals sector of California in 2000. Figure F-7 shows water by end use in this sector; again, more extensive end use data should be collected.
Table F-27 Employment and Water Use in the Fabricated Metals Industry (2000)
Industry SIC code GED1 Employees Water Use (TAF)
Fabricated Metals 34 215 132,600 19.7 1 Average across all regions, based on a 225-day year.
2 The GEDs estimated for 1995, were decreased by 6% to obtain the GED coefficients in 2000, for the industrial sector. See earlier information.
Figure F-7 Water Use, by End Use, in the Fabricated Metals Industry
Process67%
Cooling15%
Other17%
Kitchen1%
Source: This was calculated from MWD audit data of an aircraft parts manufacturer (MWD 2002).
Details of Industrial Water Use and Potential Savings, by Sector: Appendix F Page 24
24
Process Water Savings
A 1994 survey of 318 metal finishers across the U.S. provided background information on the penetration of water conservation technologies (NCDENR et al., 1998). We applied the national averages found in these studies to California (Table F-28).7
Table F-28 Process Water Savings in the Fabricated Metals Industry
Measure Process Water Savings (percent)
Penetration Rate in 1994 (percent) 1
Flow restrictors n/a 70% Counter current rinsing 50-60%2 68% Manually turn of rinse water when not in use n/a 66% Agitated rinse tanks n/a 58% Spray rinses 60%3 39% Reactive or cascade rinses 50%3 24% Conductivity controllers 40%3 16% Flow-meters n/a 12% Timer rinse controls 40%3 11% Acid recovery systems 50%4 (40%) Best Estimate of overall process water savings 33%5 1 NCDENR et al. (1998). 2 Estimated from data provided by the City of San Jose, 1992 (b). 3 Estimated from data provided by the US EPA 1994. 4 A case study from the Office of Technical Assistance (OTA 2002) shows a savings of more than 90 percent of process water. We assume that an average of 50 percent can be saved and a penetration rate of 40 percent for this technology. 5 To obtain the best estimate we assumed that spray rinses and cascade rinses were complementary technologies with about 50 percent market share each. We also assumed that acid recovery systems could be applied to 50 percent of the metal finishing facilities and that timer rinse controls and conductivity controllers can be implemented at all facilities. Estimate of Potential Water Savings The conservation potential for common end uses was calculated in the end use studies (see Appendix C) and then applied to our GED-derived estimate of water use to get potential water savings for these end uses. We used data from Table F-28 above for the estimate of potential process water savings (Table F-29).
7 Detailed 2001 resource recovery information, by state, can be purchased from the National Metal Finishers Association, but the cost of the data exceeded our resources.
Details of Industrial Water Use and Potential Savings, by Sector: Appendix F Page 25
25
Table F-29
Potential Water Savings in the Fabricated Metals Industry (2000)
End Use Water Use
(TAF) Conservation Potential
(percent) Potential Savings (TAF) Low High Best Low High Best Process 13.2 25% 42% 33% 3.3 5.5 4.4 Cooling 3.0 9% 41% 26% 0.3 1.2 0.8 Other 3.3 43% 51% 50% 1.5 1.7 1.7 Kitchen 0.2 20% 20% 20% 0.0 0.0 0.0 Total 19.7 26% 43% 35% 5.0 8.5 6.8
Crosscheck The Fabricated Metals industry has created a National Metal Finishing Strategic Goals Program, which aims to reduce water use by 50 percent compared to 1992 levels. The status for California in 2000 indicates that 65 percent of the goal has been met for water efficiency (National Metal Finishing Strategic Goals Program 2000). These findings imply about a 25-percent reduction in current water use is possible.
Details of Industrial Water Use and Potential Savings, by Sector: Appendix F Page 26
26
High Tech Industry (SIC codes 357, 36, 38) Industry Overview
There is no standard definition of the High Tech industry. In this report, we adopted the definition used by the Portland Water Bureau (Boyko et al. 2000) and included the following sub-industries: computers and office equipment (SIC code 57); electronic equipment and components (except computer equipment) (SIC code 36); and measuring, analyzing, and controlling instruments (SIC code 38). Table F-30 lists total employment and estimated water use in the High Tech industry in 2000.
Table F-30 Employment and Water Use in the High Tech Industry (2000)
Sub-industry SIC code GED1 Employees Water Use (TAF)
Semiconductor devices 3674 356 61,540 15.1 PCB manufacture and assembly 3672, 3679 405 77,790 21.8 Computer and office equipment 357 88 95,000 5.8 Rest of high tech Rest of 36,38 156 300,592 32.4 Total High Tech 357,36,38 203 534,930 75.0 1 Based on a 225-day year 2 The GEDs estimated for 1995, were decreased by 6% to obtain the GED coefficients in 2000, for the industrial sector. See earlier discussion.
Semiconductor devices (SIC code 3674) and printed circuit board manufacturing and assembly (SIC codes 3672 and 3679) use about half of the water used in the High Tech industry. Semiconductor manufacturing consists of growing silicon crystals and then cutting and polishing them into thin silicon wafers. Hundreds of integrated circuits are then etched onto the wafer in an ultra-clean environment. A printed wiring board (PWB) or printed circuit board (PCB) is a device that provides electrical interconnections and a surface for mounting electrical components. The production process consists of etching patterns of conductive material, usually copper, onto a non-conductive base. After each step of surface preparation, electroplating, pattern masking, and etching, water is used for rinsing. The rest of the High Tech industry includes facilities that manufacture and assemble various electrical, electronic, and communication components. Water Use
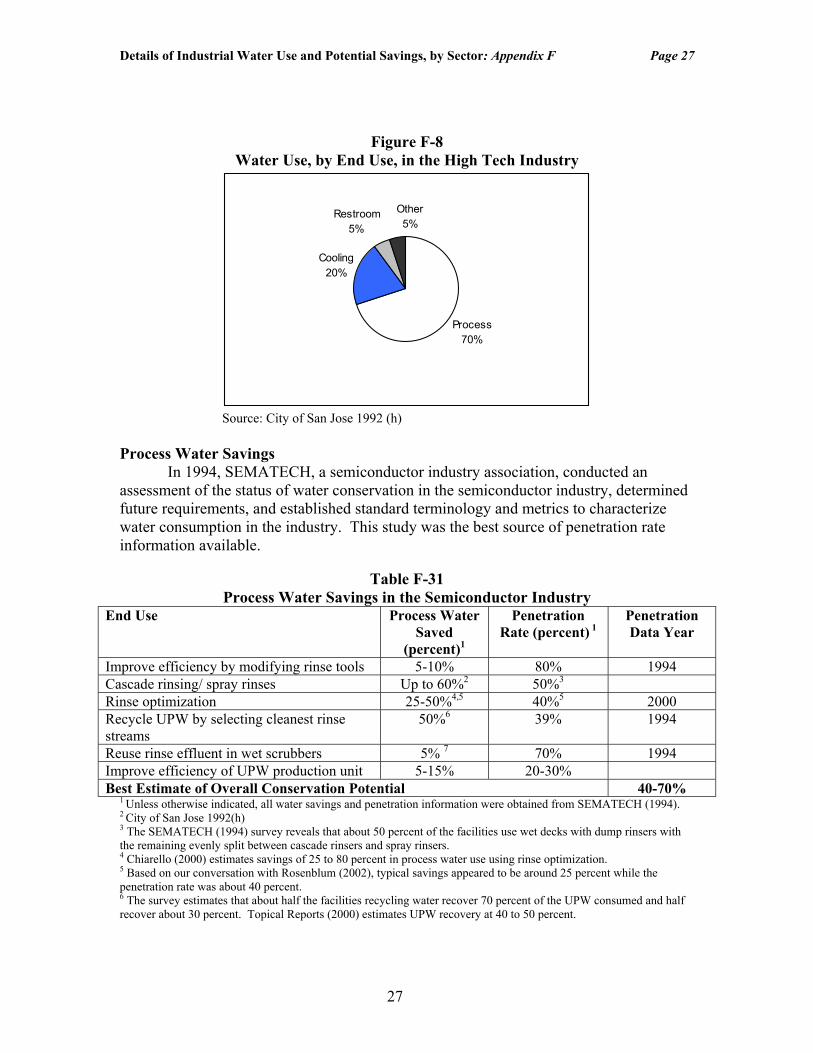
Process water use comprises most of the High Tech industry’s water use (60 to 80 percent), cooling uses 20 to 30 percent, and the rest is domestic and irrigation use (Figure F-8). Process water is used for: • Passing potable city water through a reverse osmosis membrane to remove impurities,
producing ultra-purified water (UPW)8; • Rinsing and tool cleaning (water of an extremely high purity is used to rinse
components after they are treated with solvents and acids); and • Scrubbing (water is used to remove polluting gases from exhaust air).
8 Typically, 1,400 to 1,600 gallons of potable water produce 1,000 gallons of UPW.
Details of Industrial Water Use and Potential Savings, by Sector: Appendix F Page 27
27
Figure F-8 Water Use, by End Use, in the High Tech Industry
Process70%
Cooling20%
Restroom5%
Other5%
Source: City of San Jose 1992 (h)
Process Water Savings
In 1994, SEMATECH, a semiconductor industry association, conducted an assessment of the status of water conservation in the semiconductor industry, determined future requirements, and established standard terminology and metrics to characterize water consumption in the industry. This study was the best source of penetration rate information available.
Table F-31 Process Water Savings in the Semiconductor Industry
End Use Process Water Saved
(percent)1
Penetration Rate (percent) 1
Penetration Data Year
Improve efficiency by modifying rinse tools 5-10% 80% 1994 Cascade rinsing/ spray rinses Up to 60%2 50%3 Rinse optimization 25-50%4,5 40%5 2000 Recycle UPW by selecting cleanest rinse streams
50%6 39% 1994
Reuse rinse effluent in wet scrubbers 5% 7 70% 1994 Improve efficiency of UPW production unit 5-15% 20-30% Best Estimate of Overall Conservation Potential 40-70%
1 Unless otherwise indicated, all water savings and penetration information were obtained from SEMATECH (1994). 2 City of San Jose 1992(h)
3 The SEMATECH (1994) survey reveals that about 50 percent of the facilities use wet decks with dump rinsers with the remaining evenly split between cascade rinsers and spray rinsers. 4 Chiarello (2000) estimates savings of 25 to 80 percent in process water use using rinse optimization. 5 Based on our conversation with Rosenblum (2002), typical savings appeared to be around 25 percent while the penetration rate was about 40 percent. 6 The survey estimates that about half the facilities recycling water recover 70 percent of the UPW consumed and half recover about 30 percent. Topical Reports (2000) estimates UPW recovery at 40 to 50 percent.
Details of Industrial Water Use and Potential Savings, by Sector: Appendix F Page 28
28
7 Scrubbers consume about 5 to 10 percent of process water in semiconductor fabrication. The SEMATECH (1994) survey also indicated that almost 70 percent of facilities surveyed reused wafer rinse water in cooling towers and scrubbers, replacing almost all the fresh water use in these applications.
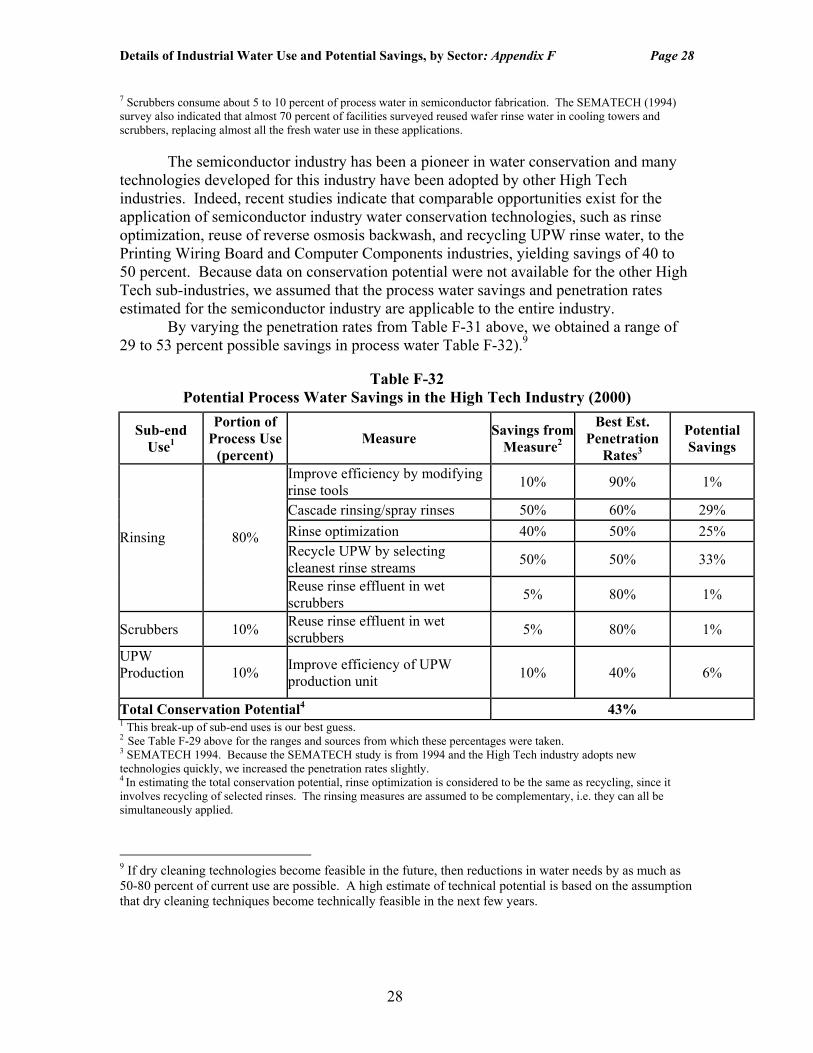
The semiconductor industry has been a pioneer in water conservation and many technologies developed for this industry have been adopted by other High Tech industries. Indeed, recent studies indicate that comparable opportunities exist for the application of semiconductor industry water conservation technologies, such as rinse optimization, reuse of reverse osmosis backwash, and recycling UPW rinse water, to the Printing Wiring Board and Computer Components industries, yielding savings of 40 to 50 percent. Because data on conservation potential were not available for the other High Tech sub-industries, we assumed that the process water savings and penetration rates estimated for the semiconductor industry are applicable to the entire industry. By varying the penetration rates from Table F-31 above, we obtained a range of 29 to 53 percent possible savings in process water Table F-32).9
Table F-32 Potential Process Water Savings in the High Tech Industry (2000)
1 This break-up of sub-end uses is our best guess. 2 See Table F-29 above for the ranges and sources from which these percentages were taken. 3 SEMATECH 1994. Because the SEMATECH study is from 1994 and the High Tech industry adopts new technologies quickly, we increased the penetration rates slightly. 4 In estimating the total conservation potential, rinse optimization is considered to be the same as recycling, since it involves recycling of selected rinses. The rinsing measures are assumed to be complementary, i.e. they can all be simultaneously applied.
9 If dry cleaning technologies become feasible in the future, then reductions in water needs by as much as 50-80 percent of current use are possible. A high estimate of technical potential is based on the assumption that dry cleaning techniques become technically feasible in the next few years.
Sub-end Use1
Portion of Process Use
(percent) Measure Savings from
Measure2
Best Est. Penetration
Rates3
Potential Savings
Improve efficiency by modifying rinse tools 10% 90% 1%
Cascade rinsing/spray rinses 50% 60% 29% Rinse optimization 40% 50% 25% Recycle UPW by selecting cleanest rinse streams 50% 50% 33%
Rinsing 80%
Reuse rinse effluent in wet scrubbers 5% 80% 1%
Scrubbers 10% Reuse rinse effluent in wet scrubbers 5% 80% 1%
UPW Production
10% Improve efficiency of UPW production unit 10% 40% 6%
Total Conservation Potential4 43%
Details of Industrial Water Use and Potential Savings, by Sector: Appendix F Page 29
29
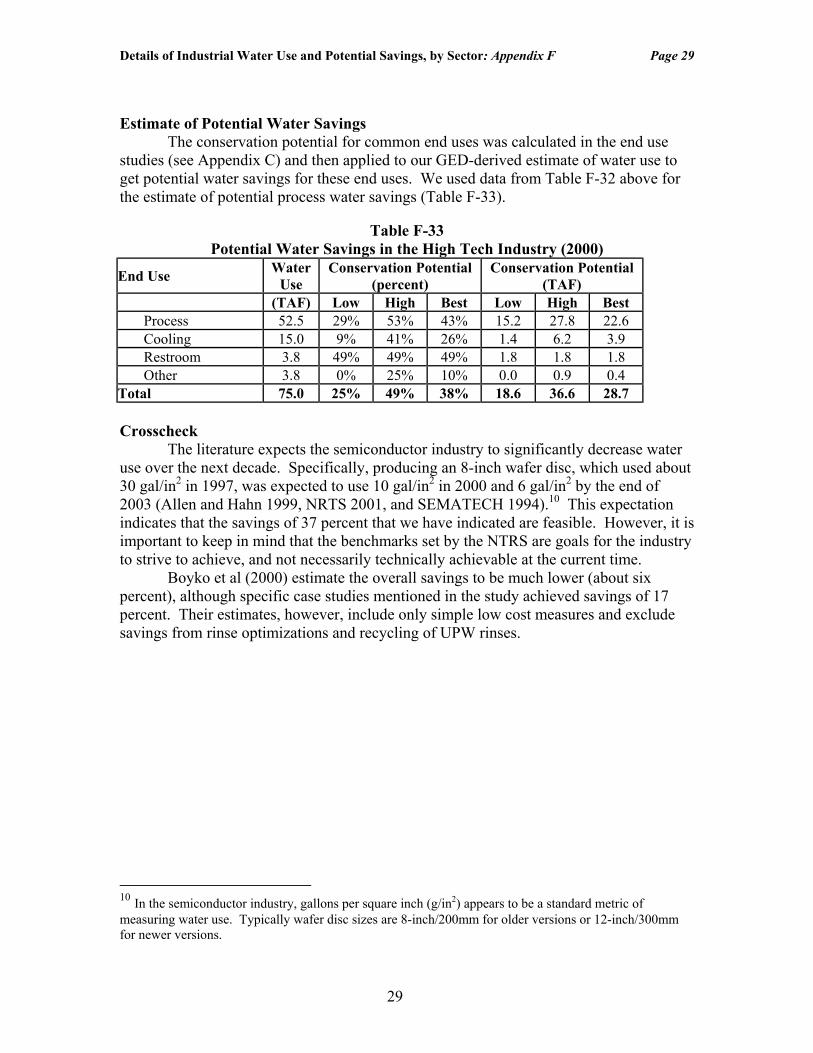
Estimate of Potential Water Savings The conservation potential for common end uses was calculated in the end use studies (see Appendix C) and then applied to our GED-derived estimate of water use to get potential water savings for these end uses. We used data from Table F-32 above for the estimate of potential process water savings (Table F-33).
Table F-33 Potential Water Savings in the High Tech Industry (2000)
End Use Water Use
Conservation Potential (percent)
Conservation Potential (TAF)
(TAF) Low High Best Low High Best Process 52.5 29% 53% 43% 15.2 27.8 22.6 Cooling 15.0 9% 41% 26% 1.4 6.2 3.9 Restroom 3.8 49% 49% 49% 1.8 1.8 1.8 Other 3.8 0% 25% 10% 0.0 0.9 0.4
Total 75.0 25% 49% 38% 18.6 36.6 28.7 Crosscheck The literature expects the semiconductor industry to significantly decrease water use over the next decade. Specifically, producing an 8-inch wafer disc, which used about 30 gal/in2 in 1997, was expected to use 10 gal/in2 in 2000 and 6 gal/in2 by the end of 2003 (Allen and Hahn 1999, NRTS 2001, and SEMATECH 1994).10 This expectation indicates that the savings of 37 percent that we have indicated are feasible. However, it is important to keep in mind that the benchmarks set by the NTRS are goals for the industry to strive to achieve, and not necessarily technically achievable at the current time. Boyko et al (2000) estimate the overall savings to be much lower (about six percent), although specific case studies mentioned in the study achieved savings of 17 percent. Their estimates, however, include only simple low cost measures and exclude savings from rinse optimizations and recycling of UPW rinses.
10 In the semiconductor industry, gallons per square inch (g/in2) appears to be a standard metric of measuring water use. Typically wafer disc sizes are 8-inch/200mm for older versions or 12-inch/300mm for newer versions.
Details of Industrial Water Use and Potential Savings, by Sector: Appendix F Page 30
30
Petroleum Refining (SIC code 291) Industry Description SIC code 291 includes establishments primarily engaged in producing gasoline, kerosene, distillate fuel oils, residual fuel oils, and lubricants, through fractionation or straight distillation of crude oil, redistillation of unfinished petroleum derivatives, cracking, or other processes. In 2000, there were 22 operational refineries in California (Petroleum Supply Annual 2000) employing about 9,900 people. Data from 13 of these facilities were included in the 1995 CDWR survey (Table F-34).
Table F-34 Employment and Water Use in the Petroleum Refining Industry (2000)
Industry SIC code GED Employees Water Use
(TAF) Petroleum Refining 291 14,676 9,890 84.1* * Excludes 11.1 TAF of reclaimed water
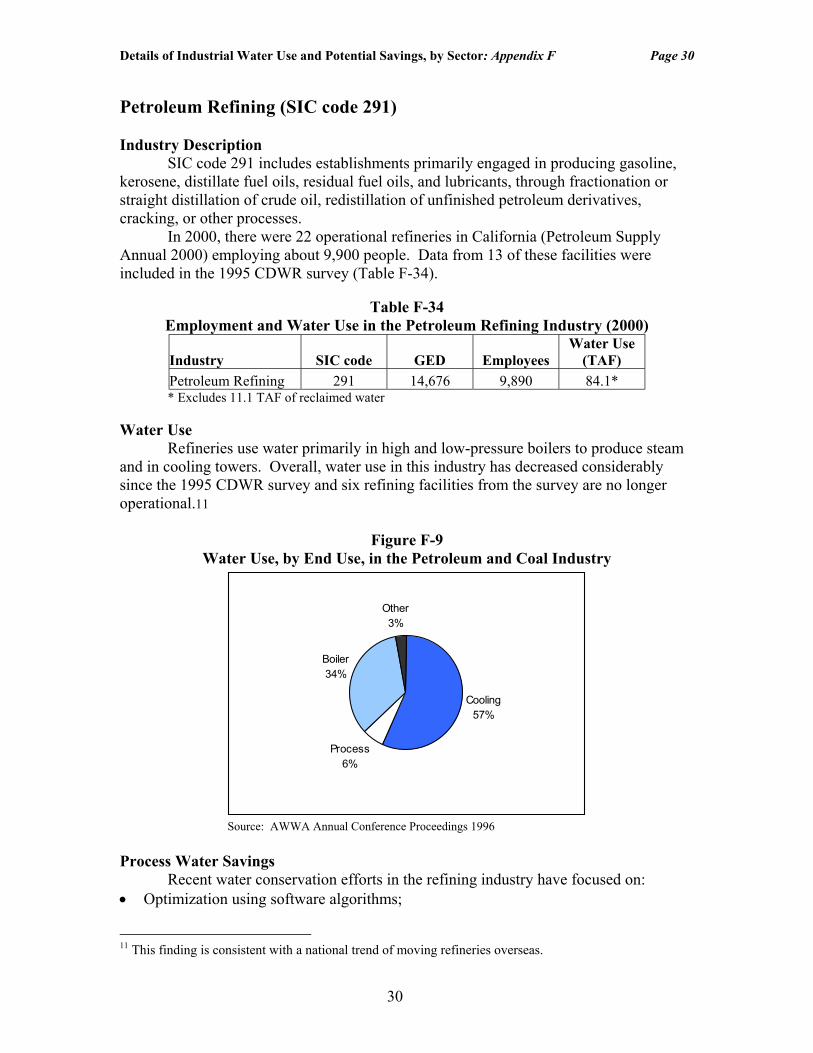
Water Use Refineries use water primarily in high and low-pressure boilers to produce steam and in cooling towers. Overall, water use in this industry has decreased considerably since the 1995 CDWR survey and six refining facilities from the survey are no longer operational.11
Figure F-9 Water Use, by End Use, in the Petroleum and Coal Industry
Cooling57%
Process6%
Boiler34%
Other3%
Source: AWWA Annual Conference Proceedings 1996
Process Water Savings Recent water conservation efforts in the refining industry have focused on: • Optimization using software algorithms;
11 This finding is consistent with a national trend of moving refineries overseas.
Details of Industrial Water Use and Potential Savings, by Sector: Appendix F Page 31
31
• Reusing of secondary effluent; and • Replacing freshwater for cooling tower makeup and boilers with treated reclaimed
water.
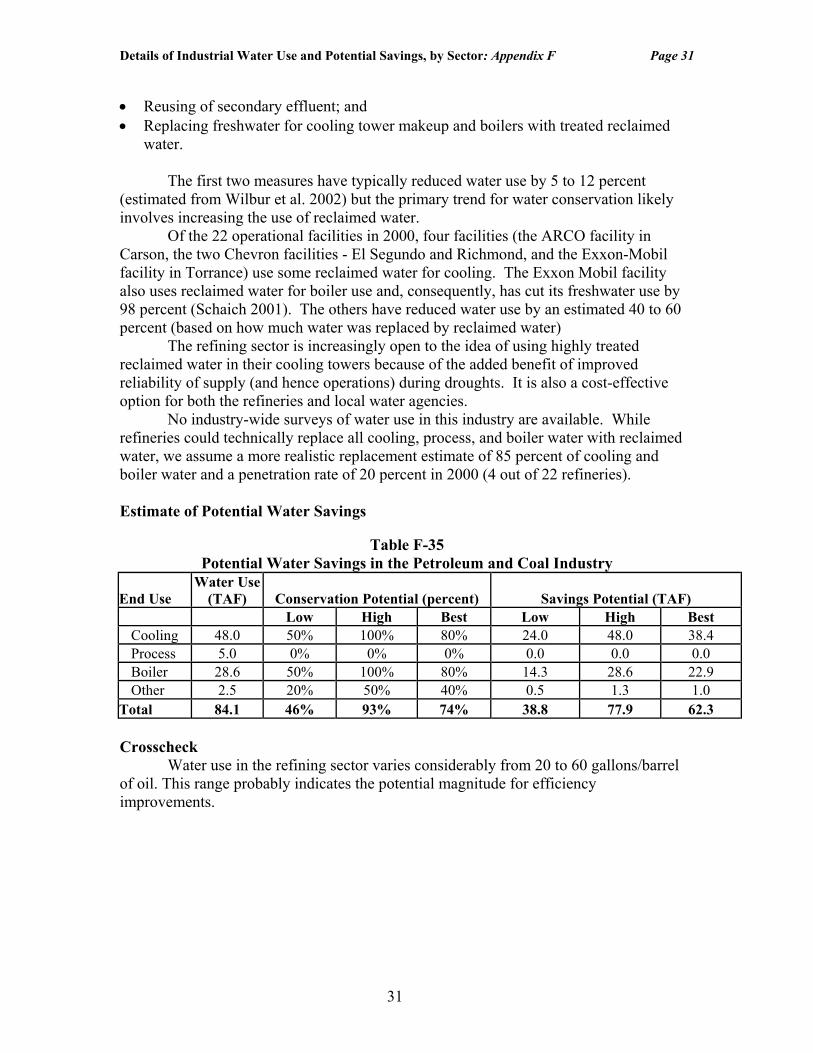
The first two measures have typically reduced water use by 5 to 12 percent (estimated from Wilbur et al. 2002) but the primary trend for water conservation likely involves increasing the use of reclaimed water. Of the 22 operational facilities in 2000, four facilities (the ARCO facility in Carson, the two Chevron facilities - El Segundo and Richmond, and the Exxon-Mobil facility in Torrance) use some reclaimed water for cooling. The Exxon Mobil facility also uses reclaimed water for boiler use and, consequently, has cut its freshwater use by 98 percent (Schaich 2001). The others have reduced water use by an estimated 40 to 60 percent (based on how much water was replaced by reclaimed water) The refining sector is increasingly open to the idea of using highly treated reclaimed water in their cooling towers because of the added benefit of improved reliability of supply (and hence operations) during droughts. It is also a cost-effective option for both the refineries and local water agencies. No industry-wide surveys of water use in this industry are available. While refineries could technically replace all cooling, process, and boiler water with reclaimed water, we assume a more realistic replacement estimate of 85 percent of cooling and boiler water and a penetration rate of 20 percent in 2000 (4 out of 22 refineries). Estimate of Potential Water Savings
Table F-35 Potential Water Savings in the Petroleum and Coal Industry
End Use Water Use
(TAF) Conservation Potential (percent) Savings Potential (TAF) Low High Best Low High Best Cooling 48.0 50% 100% 80% 24.0 48.0 38.4 Process 5.0 0% 0% 0% 0.0 0.0 0.0 Boiler 28.6 50% 100% 80% 14.3 28.6 22.9 Other 2.5 20% 50% 40% 0.5 1.3 1.0
Total 84.1 46% 93% 74% 38.8 77.9 62.3 Crosscheck Water use in the refining sector varies considerably from 20 to 60 gallons/barrel of oil. This range probably indicates the potential magnitude for efficiency improvements.