Embed Size (px)
Citation preview

Appendix F Traffic Analysis Appendices


Appendix
Appendix
Appendix
Appendix
Appendix
x A Inter
x B Inter
x C U.S.
x D Inter
x E “Proj
section Leve
section Sign
50 Freeway
section LOS
ject Only” In
el of Service
nal Warrant A
y Mainline L
S Calculation
ntersection T
AOC N
e (LOS) Calc
Analysis
OS Calculat
n Outputs Sh
Turning Mov
New Placervi
culation Out
tion Output S
heets with M
vement and F
ille Courthou
App
tput Sheets
Sheets
Mitigation Inc
Freeway Ma
use EIR - App
pendic
corporated
ainline Volu
pendix
ces
umes
Appendix F US 50 Westbound Ramp Technical Supplement

AOC New Placerville Courthouse EIR - Appendix
APPENDIX A – INTERSECTION LEVEL OF SERVICE (LOS) CALCULATION OUTPUTS SHEETS

1: Placerville Rd/SR 50 WB On Ramp & Fair Lane Existing AM PeakHCM Signalized Intersection Capacity Analysis 12/10/2014
AOC Courthouse Project EIR Synchro 8 ReportCHS Consulting Group Page 1
Movement EBL EBT EBR WBL WBT WBR NBL NBT NBR SBL SBT SBRLane ConfigurationsVolume (vph) 0 0 0 32 64 20 88 564 236 12 168 444Ideal Flow (vphpl) 1900 1900 1900 1900 1900 1900 1900 1900 1900 1900 1900 1900Total Lost time (s) 4.0 4.0 4.0 4.0 4.0 4.0 4.0Lane Util. Factor 1.00 1.00 1.00 1.00 1.00 1.00 1.00Frt 1.00 0.85 1.00 0.96 1.00 1.00 0.85Flt Protected 0.98 1.00 0.95 1.00 0.95 1.00 1.00Satd. Flow (prot) 1832 1583 1770 1780 1770 1863 1583Flt Permitted 0.98 1.00 0.95 1.00 0.95 1.00 1.00Satd. Flow (perm) 1832 1583 1770 1780 1770 1863 1583Peak-hour factor, PHF 0.92 0.92 0.92 0.92 0.92 0.92 0.92 0.92 0.92 0.92 0.92 0.92Adj. Flow (vph) 0 0 0 35 70 22 96 613 257 13 183 483RTOR Reduction (vph) 0 0 0 0 0 20 0 8 0 0 0 230Lane Group Flow (vph) 0 0 0 0 105 2 96 862 0 13 183 253Turn Type Perm NA Perm Prot NA Prot NA PermProtected Phases 8 5 2 1 6Permitted Phases 8 8 6Actuated Green, G (s) 12.2 12.2 14.0 72.8 2.7 61.5 61.5Effective Green, g (s) 12.2 12.2 14.0 72.8 2.7 61.5 61.5Actuated g/C Ratio 0.10 0.10 0.12 0.62 0.02 0.52 0.52Clearance Time (s) 4.0 4.0 4.0 4.0 4.0 4.0 4.0Vehicle Extension (s) 3.0 3.0 3.0 3.0 3.0 3.0 3.0Lane Grp Cap (vph) 190 164 210 1101 40 974 827v/s Ratio Prot 0.05 c0.48 0.01 0.10v/s Ratio Perm 0.06 0.00 c0.16v/c Ratio 0.55 0.01 0.46 0.78 0.33 0.19 0.31Uniform Delay, d1 50.1 47.3 48.3 16.6 56.6 14.8 15.9Progression Factor 1.00 1.00 0.76 0.40 1.00 1.00 1.00Incremental Delay, d2 3.5 0.0 1.3 4.6 4.7 0.4 1.0Delay (s) 53.6 47.3 38.2 11.3 61.2 15.3 16.9Level of Service D D D B E B BApproach Delay (s) 0.0 52.5 13.9 17.3Approach LOS A D B B
Intersection SummaryHCM 2000 Control Delay 18.0 HCM 2000 Level of Service BHCM 2000 Volume to Capacity ratio 0.64Actuated Cycle Length (s) 117.6 Sum of lost time (s) 16.0Intersection Capacity Utilization 62.5% ICU Level of Service BAnalysis Period (min) 15c Critical Lane Group

2: Placerville Dr/Placerville Rd & SR 50 WB Off Ramp Existing AM PeakHCM Signalized Intersection Capacity Analysis 12/10/2014
AOC Courthouse Project EIR Synchro 8 ReportCHS Consulting Group Page 2
Movement WBL WBR NBT NBR SBL SBTLane ConfigurationsVolume (vph) 120 220 668 0 0 200Ideal Flow (vphpl) 1900 1900 1900 1900 1900 1900Total Lost time (s) 4.0 4.0 4.0 4.0Lane Util. Factor 1.00 1.00 1.00 1.00Frt 1.00 0.85 1.00 1.00Flt Protected 0.95 1.00 1.00 1.00Satd. Flow (prot) 1770 1583 1863 1863Flt Permitted 0.95 1.00 1.00 1.00Satd. Flow (perm) 1770 1583 1863 1863Peak-hour factor, PHF 0.92 0.92 0.92 0.92 0.92 0.92Adj. Flow (vph) 130 239 726 0 0 217RTOR Reduction (vph) 0 214 0 0 0 0Lane Group Flow (vph) 130 25 726 0 0 217Turn Type Prot Perm NA NAProtected Phases 7 2 6Permitted Phases 8Actuated Green, G (s) 13.9 12.2 72.8 61.5Effective Green, g (s) 13.9 12.2 72.8 61.5Actuated g/C Ratio 0.12 0.10 0.62 0.52Clearance Time (s) 4.0 4.0 4.0 4.0Vehicle Extension (s) 3.0 3.0 3.0 3.0Lane Grp Cap (vph) 209 164 1153 974v/s Ratio Prot c0.07 c0.39 c0.12v/s Ratio Perm c0.02v/c Ratio 0.62 0.15 0.63 0.22Uniform Delay, d1 49.3 48.0 14.0 15.1Progression Factor 1.00 1.00 1.00 0.40Incremental Delay, d2 5.7 0.4 2.6 0.5Delay (s) 55.0 48.4 16.6 6.5Level of Service E D B AApproach Delay (s) 50.7 16.6 6.5Approach LOS D B A
Intersection SummaryHCM 2000 Control Delay 24.5 HCM 2000 Level of Service CHCM 2000 Volume to Capacity ratio 0.56Actuated Cycle Length (s) 117.6 Sum of lost time (s) 16.0Intersection Capacity Utilization 55.4% ICU Level of Service BAnalysis Period (min) 15c Critical Lane Group

AOC - Placerville CourthouseExisting AM
US 50 Ramps / Placerville Drive / Fair Lane
L T R L T R L T R L T R L T R L T R
Volume 88 564 236 12 168 444 32 64 20 0 668 0 0 200 0 120 0 220 2,836Average Delay 38.1 11.0 11.0 61.2 15.3 16.9 53.6 53.6 47.3 0.0 16.6 0 0 6.5 0 55 0 48.4Total Delay 3,353 6,204 2,596 734 2,570 7,504 1,715 3,430 946 0 11088.8 0 0 1300 0 6,600 0 10648 58,690
20.7Source: CHS Consulting Group, 2014. C
NB Placerville Dr SB Placerville Dr WB US 50 Off RampSB Placerville DrNB Placerville Dr WB Fair Lane

3: Forni Rd & Placerville Dr Existing AM PeakHCM Unsignalized Intersection Capacity Analysis 12/10/2014
AOC Courthouse Project EIR Synchro 8 ReportCHS Consulting Group Page 3
Movement EBL EBR NBL NBT SBT SBRLane ConfigurationsVolume (veh/h) 24 28 20 644 292 28Sign Control Stop Free FreeGrade 0% 0% 0%Peak Hour Factor 0.92 0.92 0.92 0.92 0.92 0.92Hourly flow rate (vph) 26 30 22 700 317 30PedestriansLane Width (ft)Walking Speed (ft/s)Percent BlockageRight turn flare (veh) 7Median type None NoneMedian storage veh)Upstream signal (ft) 476pX, platoon unblocked 0.94 0.94 0.94vC, conflicting volume 1076 333 348vC1, stage 1 conf volvC2, stage 2 conf volvCu, unblocked vol 1050 261 278tC, single (s) 6.4 6.2 4.1tC, 2 stage (s)tF (s) 3.5 3.3 2.2p0 queue free % 89 96 98cM capacity (veh/h) 233 733 1211Direction, Lane # EB 1 NB 1 NB 2 SB 1Volume Total 57 22 700 348Volume Left 26 22 0 0Volume Right 30 0 0 30cSH 504 1211 1700 1700Volume to Capacity 0.11 0.02 0.41 0.20Queue Length 95th (ft) 9 1 0 0Control Delay (s) 15.8 8.0 0.0 0.0Lane LOS C AApproach Delay (s) 15.8 0.2 0.0Approach LOS CIntersection SummaryAverage Delay 0.9Intersection Capacity Utilization 43.9% ICU Level of Service AAnalysis Period (min) 15

4: Lo Hi Way/SR EB Off Ramp & Forni Rd Existing AM PeakHCM Unsignalized Intersection Capacity Analysis 12/10/2014
AOC Courthouse Project EIR Synchro 8 ReportCHS Consulting Group Page 4
Movement EBL EBT EBR WBL WBT WBR NBL NBT NBR SBL SBT SBRLane ConfigurationsSign Control Stop Stop Stop StopVolume (vph) 138 142 40 16 92 24 44 16 24 188 36 528Peak Hour Factor 0.92 0.92 0.92 0.92 0.92 0.92 0.92 0.92 0.92 0.92 0.92 0.92Hourly flow rate (vph) 150 154 43 17 100 26 48 17 26 204 39 574Direction, Lane # EB 1 EB 2 WB 1 WB 2 NB 1 SB 1 SB 2Volume Total (vph) 150 198 117 26 91 243 574Volume Left (vph) 150 0 17 0 48 204 0Volume Right (vph) 0 43 0 26 26 0 574Hadj (s) 0.53 -0.12 0.06 -0.57 -0.03 0.20 -0.57Departure Headway (s) 6.2 5.5 5.5 3.2 5.5 5.5 3.2Degree Utilization, x 0.26 0.30 0.18 0.02 0.14 0.37 0.51Capacity (veh/h) 561 626 599 1121 596 620 1116Control Delay (s) 10.1 9.7 9.8 6.3 9.4 11.6 9.5Approach Delay (s) 9.8 9.1 9.4 10.1Approach LOS A A A BIntersection SummaryDelay 9.9Level of Service AIntersection Capacity Utilization 53.2% ICU Level of Service AAnalysis Period (min) 15

5: Forni Rd & Ray Lawyer Dr Existing AM PeakHCM Unsignalized Intersection Capacity Analysis 12/10/2014
AOC Courthouse Project EIR Synchro 8 ReportCHS Consulting Group Page 5
Movement EBL EBT WBT WBR SBL SBRLane ConfigurationsSign Control Stop Stop StopVolume (vph) 68 24 40 40 32 28Peak Hour Factor 0.92 0.92 0.92 0.92 0.92 0.92Hourly flow rate (vph) 74 26 43 43 35 30Direction, Lane # EB 1 EB 2 WB 1 WB 2 SB 1 SB 2Volume Total (vph) 74 26 43 43 35 30Volume Left (vph) 74 0 0 0 35 0Volume Right (vph) 0 0 0 43 0 30Hadj (s) 0.53 0.03 0.03 -0.67 0.53 -0.67Departure Headway (s) 5.3 4.8 4.8 4.1 5.5 4.3Degree Utilization, x 0.11 0.03 0.06 0.05 0.05 0.04Capacity (veh/h) 672 735 739 856 632 802Control Delay (s) 7.7 6.7 6.9 6.1 7.6 6.2Approach Delay (s) 7.5 6.5 6.9Approach LOS A A AIntersection SummaryDelay 7.0Level of Service AIntersection Capacity Utilization 20.4% ICU Level of Service AAnalysis Period (min) 15

6: Ray Lawyer Dr & Fair Lane Existing AM PeakHCM Unsignalized Intersection Capacity Analysis 12/10/2014
AOC Courthouse Project EIR Synchro 8 ReportCHS Consulting Group Page 6
Movement EBL EBR NBL NBT SBT SBRLane ConfigurationsSign Control Stop Stop StopVolume (vph) 16 90 62 34 90 72Peak Hour Factor 0.92 0.92 0.92 0.92 0.92 0.92Hourly flow rate (vph) 17 98 67 37 98 78Direction, Lane # EB 1 EB 2 NB 1 NB 2 SB 1 SB 2Volume Total (vph) 17 98 67 37 98 78Volume Left (vph) 17 0 67 0 0 0Volume Right (vph) 0 98 0 0 0 78Hadj (s) 0.53 -0.67 0.53 0.03 0.03 -0.67Departure Headway (s) 5.7 4.5 5.5 5.0 4.9 4.2Degree Utilization, x 0.03 0.12 0.10 0.05 0.13 0.09Capacity (veh/h) 599 758 638 700 707 825Control Delay (s) 7.6 6.9 7.9 7.0 7.5 6.4Approach Delay (s) 7.0 7.6 7.0Approach LOS A A AIntersection SummaryDelay 7.2Level of Service AIntersection Capacity Utilization 20.1% ICU Level of Service AAnalysis Period (min) 15
7: Jail Driveway & Forni Rd Existing AM PeakHCM Unsignalized Intersection Capacity Analysis 12/10/2014
AOC Courthouse Project EIR Synchro 8 ReportCHS Consulting Group Page 7
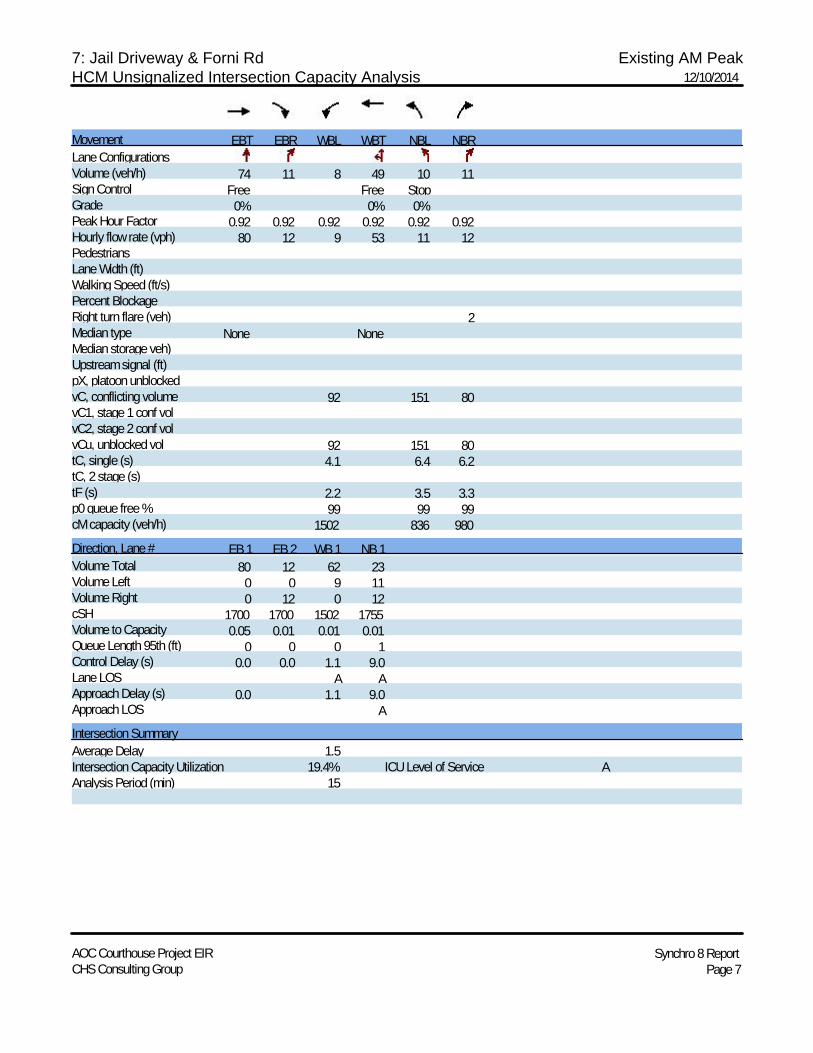
Movement EBT EBR WBL WBT NBL NBRLane ConfigurationsVolume (veh/h) 74 11 8 49 10 11Sign Control Free Free StopGrade 0% 0% 0%Peak Hour Factor 0.92 0.92 0.92 0.92 0.92 0.92Hourly flow rate (vph) 80 12 9 53 11 12PedestriansLane Width (ft)Walking Speed (ft/s)Percent BlockageRight turn flare (veh) 2Median type None NoneMedian storage veh)Upstream signal (ft)pX, platoon unblockedvC, conflicting volume 92 151 80vC1, stage 1 conf volvC2, stage 2 conf volvCu, unblocked vol 92 151 80tC, single (s) 4.1 6.4 6.2tC, 2 stage (s)tF (s) 2.2 3.5 3.3p0 queue free % 99 99 99cM capacity (veh/h) 1502 836 980Direction, Lane # EB 1 EB 2 WB 1 NB 1Volume Total 80 12 62 23Volume Left 0 0 9 11Volume Right 0 12 0 12cSH 1700 1700 1502 1755Volume to Capacity 0.05 0.01 0.01 0.01Queue Length 95th (ft) 0 0 0 1Control Delay (s) 0.0 0.0 1.1 9.0Lane LOS A AApproach Delay (s) 0.0 1.1 9.0Approach LOS AIntersection SummaryAverage Delay 1.5Intersection Capacity Utilization 19.4% ICU Level of Service AAnalysis Period (min) 15

8: Ray Lawyer Dr & US 50 WB On Ramp Existing AM PeakHCM Unsignalized Intersection Capacity Analysis 12/10/2014
AOC Courthouse Project EIR Synchro 8 ReportCHS Consulting Group Page 8
Movement EBL EBR NBL NBT SBT SBRLane ConfigurationsVolume (veh/h) 0 0 12 96 60 120Sign Control Stop Free FreeGrade 0% 0% 0%Peak Hour Factor 0.92 0.92 0.92 0.92 0.92 0.92Hourly flow rate (vph) 0 0 13 104 65 130PedestriansLane Width (ft)Walking Speed (ft/s)Percent BlockageRight turn flare (veh)Median type None NoneMedian storage veh)Upstream signal (ft)pX, platoon unblockedvC, conflicting volume 196 65 196vC1, stage 1 conf volvC2, stage 2 conf volvCu, unblocked vol 196 65 196tC, single (s) 6.4 6.2 4.1tC, 2 stage (s)tF (s) 3.5 3.3 2.2p0 queue free % 100 100 99cM capacity (veh/h) 786 999 1377Direction, Lane # NB 1 NB 2 SB 1 SB 2Volume Total 13 104 65 130Volume Left 13 0 0 0Volume Right 0 0 0 130cSH 1377 1700 1700 1700Volume to Capacity 0.01 0.06 0.04 0.08Queue Length 95th (ft) 1 0 0 0Control Delay (s) 7.6 0.0 0.0 0.0Lane LOS AApproach Delay (s) 0.8 0.0Approach LOS
Intersection SummaryAverage Delay 0.3Intersection Capacity Utilization 17.4% ICU Level of Service AAnalysis Period (min) 15

1: Placerville Rd/SR 50 WB On Ramp & Fair Lane Existing PM PeakHCM Signalized Intersection Capacity Analysis 12/10/2014
AOC Courthouse Project EIR Synchro 8 ReportCHS Consulting Group Page 1
Movement EBL EBT EBR WBL WBT WBR NBL NBT NBR SBL SBT SBRLane ConfigurationsVolume (vph) 0 0 0 60 228 48 193 730 231 12 228 692Ideal Flow (vphpl) 1900 1900 1900 1900 1900 1900 1900 1900 1900 1900 1900 1900Total Lost time (s) 4.0 4.0 4.0 4.0 4.0 4.0 4.0Lane Util. Factor 1.00 1.00 1.00 1.00 1.00 1.00 1.00Frt 1.00 0.85 1.00 0.96 1.00 1.00 0.85Flt Protected 0.99 1.00 0.95 1.00 0.95 1.00 1.00Satd. Flow (prot) 1844 1583 1770 1796 1770 1863 1583Flt Permitted 0.99 1.00 0.95 1.00 0.95 1.00 1.00Satd. Flow (perm) 1844 1583 1770 1796 1770 1863 1583Peak-hour factor, PHF 0.92 0.92 0.92 0.92 0.92 0.92 0.92 0.92 0.92 0.92 0.92 0.92Adj. Flow (vph) 0 0 0 65 248 52 210 793 251 13 248 752RTOR Reduction (vph) 0 0 0 0 0 43 0 6 0 0 0 270Lane Group Flow (vph) 0 0 0 0 313 9 210 1038 0 13 248 482Turn Type Perm NA Perm Prot NA Prot NA PermProtected Phases 8 5 2 1 6Permitted Phases 8 8 6Actuated Green, G (s) 21.0 21.0 18.4 76.5 2.9 61.0 61.0Effective Green, g (s) 21.0 21.0 18.4 76.5 2.9 61.0 61.0Actuated g/C Ratio 0.16 0.16 0.14 0.60 0.02 0.48 0.48Clearance Time (s) 4.0 4.0 4.0 4.0 4.0 4.0 4.0Vehicle Extension (s) 3.0 3.0 3.0 3.0 3.0 3.0 3.0Lane Grp Cap (vph) 302 259 254 1071 40 886 753v/s Ratio Prot 0.12 c0.58 0.01 0.13v/s Ratio Perm 0.17 0.01 c0.30v/c Ratio 1.04 0.03 0.83 0.97 0.33 0.28 0.64Uniform Delay, d1 53.6 45.1 53.4 24.7 61.7 20.3 25.3Progression Factor 1.00 1.00 0.69 0.25 1.00 1.00 1.00Incremental Delay, d2 61.6 0.1 10.3 13.1 4.7 0.8 4.1Delay (s) 115.2 45.1 47.3 19.3 66.4 21.1 29.5Level of Service F D D B E C CApproach Delay (s) 0.0 105.2 24.0 27.9Approach LOS A F C C
Intersection SummaryHCM 2000 Control Delay 36.7 HCM 2000 Level of Service DHCM 2000 Volume to Capacity ratio 0.88Actuated Cycle Length (s) 128.2 Sum of lost time (s) 16.0Intersection Capacity Utilization 81.1% ICU Level of Service DAnalysis Period (min) 15c Critical Lane Group

2: Placerville Dr/Placerville Rd & SR 50 WB Off Ramp Existing PM PeakHCM Signalized Intersection Capacity Analysis 12/10/2014
AOC Courthouse Project EIR Synchro 8 ReportCHS Consulting Group Page 2
Movement WBL WBR NBT NBR SBL SBTLane ConfigurationsVolume (vph) 84 182 972 0 0 288Ideal Flow (vphpl) 1900 1900 1900 1900 1900 1900Total Lost time (s) 4.0 4.0 4.0 4.0Lane Util. Factor 1.00 1.00 1.00 1.00Frt 1.00 0.85 1.00 1.00Flt Protected 0.95 1.00 1.00 1.00Satd. Flow (prot) 1770 1583 1863 1863Flt Permitted 0.95 1.00 1.00 1.00Satd. Flow (perm) 1770 1583 1863 1863Peak-hour factor, PHF 0.92 0.92 0.92 0.92 0.92 0.92Adj. Flow (vph) 91 198 1057 0 0 313RTOR Reduction (vph) 0 166 0 0 0 0Lane Group Flow (vph) 91 32 1057 0 0 313Turn Type Prot Perm NA NAProtected Phases 7 2 6Permitted Phases 8Actuated Green, G (s) 11.8 21.0 76.5 61.0Effective Green, g (s) 11.8 21.0 76.5 61.0Actuated g/C Ratio 0.09 0.16 0.60 0.48Clearance Time (s) 4.0 4.0 4.0 4.0Vehicle Extension (s) 3.0 3.0 3.0 3.0Lane Grp Cap (vph) 162 259 1111 886v/s Ratio Prot c0.05 c0.57 c0.17v/s Ratio Perm c0.02v/c Ratio 0.56 0.13 0.95 0.35Uniform Delay, d1 55.7 45.8 24.1 21.2Progression Factor 1.00 1.00 1.00 0.42Incremental Delay, d2 4.4 0.2 17.6 1.0Delay (s) 60.1 46.0 41.7 9.9Level of Service E D D AApproach Delay (s) 50.4 41.7 9.9Approach LOS D D A
Intersection SummaryHCM 2000 Control Delay 37.2 HCM 2000 Level of Service DHCM 2000 Volume to Capacity ratio 0.74Actuated Cycle Length (s) 128.2 Sum of lost time (s) 16.0Intersection Capacity Utilization 69.1% ICU Level of Service CAnalysis Period (min) 15c Critical Lane Group

AOC - Placerville CourthouseExisting PM
US 50 Ramps / Placerville Drive / Fair Lane
L T R L T R L T R L T R L T R L T R
Volume 193 730 231 12 228 692 60 228 48 0 972 0 0 288 0 84 0 182 3,948Average Delay 47.5 18.8 18.8 66.4 21.1 29.5 115.2 115.2 45.1 0 40.9 0 0 9.9 0 60.1 0 46Total Delay 9,168 13,724 4,343 797 4,811 20,414 6,912 26,266 2,165 0 39,755 0 0 2,851 0 5,048 0 8,372 144,625
36.6Source: CHS Consulting Group, 2014. D
WB US 50 Off RampNB Placerville Dr SB Placerville Dr WB Fair Lane NB Placerville Dr SB Placerville Dr

3: Forni Rd & Placerville Dr Existing PM PeakHCM Unsignalized Intersection Capacity Analysis 12/10/2014
AOC Courthouse Project EIR Synchro 8 ReportCHS Consulting Group Page 3
Movement EBL EBR NBL NBT SBT SBRLane ConfigurationsVolume (veh/h) 60 40 40 912 284 88Sign Control Stop Free FreeGrade 0% 0% 0%Peak Hour Factor 0.92 0.92 0.92 0.92 0.92 0.92Hourly flow rate (vph) 65 43 43 991 309 96PedestriansLane Width (ft)Walking Speed (ft/s)Percent BlockageRight turn flare (veh) 7Median type None NoneMedian storage veh)Upstream signal (ft) 476pX, platoon unblocked 0.89 0.89 0.89vC, conflicting volume 1435 357 404vC1, stage 1 conf volvC2, stage 2 conf volvCu, unblocked vol 1427 220 274tC, single (s) 6.4 6.2 4.1tC, 2 stage (s)tF (s) 3.5 3.3 2.2p0 queue free % 49 94 96cM capacity (veh/h) 128 732 1152Direction, Lane # EB 1 NB 1 NB 2 SB 1Volume Total 109 43 991 404Volume Left 65 43 0 0Volume Right 43 0 0 96cSH 213 1152 1700 1700Volume to Capacity 0.51 0.04 0.58 0.24Queue Length 95th (ft) 65 3 0 0Control Delay (s) 39.6 8.2 0.0 0.0Lane LOS E AApproach Delay (s) 39.6 0.3 0.0Approach LOS EIntersection SummaryAverage Delay 3.0Intersection Capacity Utilization 58.0% ICU Level of Service BAnalysis Period (min) 15

4: Lo Hi Way/SR EB Off Ramp & Forni Rd Existing PM PeakHCM Unsignalized Intersection Capacity Analysis 12/10/2014
AOC Courthouse Project EIR Synchro 8 ReportCHS Consulting Group Page 4
Movement EBL EBT EBR WBL WBT WBR NBL NBT NBR SBL SBT SBRLane ConfigurationsSign Control Stop Stop Stop StopVolume (vph) 176 100 48 20 188 56 72 44 20 92 76 692Peak Hour Factor 0.92 0.92 0.92 0.92 0.92 0.92 0.92 0.92 0.92 0.92 0.92 0.92Hourly flow rate (vph) 191 109 52 22 204 61 78 48 22 100 83 752Direction, Lane # EB 1 EB 2 WB 1 WB 2 NB 1 SB 1 SB 2Volume Total (vph) 191 161 226 61 148 183 752Volume Left (vph) 191 0 22 0 78 100 0Volume Right (vph) 0 52 0 61 22 0 752Hadj (s) 0.53 -0.19 0.05 -0.57 0.05 0.14 -0.57Departure Headway (s) 6.4 5.6 5.6 3.2 5.9 5.9 3.2Degree Utilization, x 0.34 0.25 0.35 0.05 0.24 0.30 0.67Capacity (veh/h) 540 606 600 1121 550 561 1119Control Delay (s) 11.4 9.3 11.6 6.4 10.7 11.4 12.4Approach Delay (s) 10.4 10.5 10.7 12.2Approach LOS B B B BIntersection SummaryDelay 11.4Level of Service BIntersection Capacity Utilization 71.4% ICU Level of Service CAnalysis Period (min) 15

5: Forni Rd & Ray Lawyer Dr Existing PM PeakHCM Unsignalized Intersection Capacity Analysis 12/10/2014
AOC Courthouse Project EIR Synchro 8 ReportCHS Consulting Group Page 5
Movement EBL EBT WBT WBR SBL SBRLane ConfigurationsSign Control Stop Stop StopVolume (vph) 88 88 20 40 104 32Peak Hour Factor 0.92 0.92 0.92 0.92 0.92 0.92Hourly flow rate (vph) 96 96 22 43 113 35Direction, Lane # EB 1 EB 2 WB 1 WB 2 SB 1 SB 2Volume Total (vph) 96 96 22 43 113 35Volume Left (vph) 96 0 0 0 113 0Volume Right (vph) 0 0 0 43 0 35Hadj (s) 0.53 0.03 0.03 -0.67 0.53 -0.67Departure Headway (s) 5.5 5.0 5.1 4.4 5.7 4.5Degree Utilization, x 0.15 0.13 0.03 0.05 0.18 0.04Capacity (veh/h) 627 695 668 774 611 765Control Delay (s) 8.3 7.6 7.1 6.5 8.7 6.5Approach Delay (s) 7.9 6.7 8.1Approach LOS A A AIntersection SummaryDelay 7.8Level of Service AIntersection Capacity Utilization 24.0% ICU Level of Service AAnalysis Period (min) 15

6: Ray Lawyer Dr & Fair Lane Existing PM PeakHCM Unsignalized Intersection Capacity Analysis 12/10/2014
AOC Courthouse Project EIR Synchro 8 ReportCHS Consulting Group Page 6
Movement EBL EBR NBL NBT SBT SBRLane ConfigurationsSign Control Stop Stop StopVolume (vph) 96 165 22 68 165 16Peak Hour Factor 0.92 0.92 0.92 0.92 0.92 0.92Hourly flow rate (vph) 104 179 24 74 179 17Direction, Lane # EB 1 EB 2 NB 1 NB 2 SB 1 SB 2Volume Total (vph) 104 179 24 74 179 17Volume Left (vph) 104 0 24 0 0 0Volume Right (vph) 0 179 0 0 0 17Hadj (s) 0.53 -0.67 0.53 0.03 0.03 -0.67Departure Headway (s) 5.8 4.6 6.0 5.5 5.4 4.7Degree Utilization, x 0.17 0.23 0.04 0.11 0.27 0.02Capacity (veh/h) 591 745 571 622 639 728Control Delay (s) 8.8 7.7 8.0 8.0 9.1 6.6Approach Delay (s) 8.1 8.0 8.9Approach LOS A A AIntersection SummaryDelay 8.4Level of Service AIntersection Capacity Utilization 27.3% ICU Level of Service AAnalysis Period (min) 15

7: Jail Driveway & Forni Rd Existing PM PeakHCM Unsignalized Intersection Capacity Analysis 12/10/2014
AOC Courthouse Project EIR Synchro 8 ReportCHS Consulting Group Page 7
Movement EBT EBR WBL WBT NBL NBRLane ConfigurationsVolume (veh/h) 120 6 2 51 12 6Sign Control Free Free StopGrade 0% 0% 0%Peak Hour Factor 0.92 0.92 0.92 0.92 0.92 0.92Hourly flow rate (vph) 130 7 2 55 13 7PedestriansLane Width (ft)Walking Speed (ft/s)Percent BlockageRight turn flare (veh) 2Median type None NoneMedian storage veh)Upstream signal (ft)pX, platoon unblockedvC, conflicting volume 137 190 130vC1, stage 1 conf volvC2, stage 2 conf volvCu, unblocked vol 137 190 130tC, single (s) 4.1 6.4 6.2tC, 2 stage (s)tF (s) 2.2 3.5 3.3p0 queue free % 100 98 99cM capacity (veh/h) 1447 798 919Direction, Lane # EB 1 EB 2 WB 1 NB 1Volume Total 130 7 58 20Volume Left 0 0 2 13Volume Right 0 7 0 7cSH 1700 1700 1447 1196Volume to Capacity 0.08 0.00 0.00 0.02Queue Length 95th (ft) 0 0 0 1Control Delay (s) 0.0 0.0 0.3 9.4Lane LOS A AApproach Delay (s) 0.0 0.3 9.4Approach LOS AIntersection SummaryAverage Delay 0.9Intersection Capacity Utilization 16.3% ICU Level of Service AAnalysis Period (min) 15

8: Ray Lawyer Dr & US 50 WB On Ramp Existing PM PeakHCM Unsignalized Intersection Capacity Analysis 12/10/2014
AOC Courthouse Project EIR Synchro 8 ReportCHS Consulting Group Page 8
Movement EBL EBR NBL NBT SBT SBRLane ConfigurationsVolume (veh/h) 0 0 38 90 136 194Sign Control Stop Free FreeGrade 0% 0% 0%Peak Hour Factor 0.92 0.92 0.92 0.92 0.92 0.92Hourly flow rate (vph) 0 0 41 98 148 211PedestriansLane Width (ft)Walking Speed (ft/s)Percent BlockageRight turn flare (veh)Median type None NoneMedian storage veh)Upstream signal (ft)pX, platoon unblockedvC, conflicting volume 328 148 359vC1, stage 1 conf volvC2, stage 2 conf volvCu, unblocked vol 328 148 359tC, single (s) 6.4 6.2 4.1tC, 2 stage (s)tF (s) 3.5 3.3 2.2p0 queue free % 100 100 97cM capacity (veh/h) 643 899 1200Direction, Lane # NB 1 NB 2 SB 1 SB 2Volume Total 41 98 148 211Volume Left 41 0 0 0Volume Right 0 0 0 211cSH 1200 1700 1700 1700Volume to Capacity 0.03 0.06 0.09 0.12Queue Length 95th (ft) 3 0 0 0Control Delay (s) 8.1 0.0 0.0 0.0Lane LOS AApproach Delay (s) 2.4 0.0Approach LOS
Intersection SummaryAverage Delay 0.7Intersection Capacity Utilization 22.0% ICU Level of Service AAnalysis Period (min) 15

1: Placerville Rd/SR 50 WB On Ramp & Fair Lane Existing+Project AM PeakHCM Signalized Intersection Capacity Analysis 12/15/2014
AOC Courthouse Project EIR Synchro 8 ReportCHS Consulting Group Page 1
Movement EBL EBT EBR WBL WBT WBR NBL NBT NBR SBL SBT SBRLane ConfigurationsVolume (vph) 0 0 0 32 64 20 92 564 236 12 188 444Ideal Flow (vphpl) 1900 1900 1900 1900 1900 1900 1900 1900 1900 1900 1900 1900Total Lost time (s) 4.0 4.0 4.0 4.0 4.0 4.0 4.0Lane Util. Factor 1.00 1.00 1.00 1.00 1.00 1.00 1.00Frt 1.00 0.85 1.00 0.96 1.00 1.00 0.85Flt Protected 0.98 1.00 0.95 1.00 0.95 1.00 1.00Satd. Flow (prot) 1832 1583 1770 1780 1770 1863 1583Flt Permitted 0.98 1.00 0.95 1.00 0.95 1.00 1.00Satd. Flow (perm) 1832 1583 1770 1780 1770 1863 1583Peak-hour factor, PHF 0.92 0.92 0.92 0.92 0.92 0.92 0.92 0.92 0.92 0.92 0.92 0.92Adj. Flow (vph) 0 0 0 35 70 22 100 613 257 13 204 483RTOR Reduction (vph) 0 0 0 0 0 20 0 8 0 0 0 237Lane Group Flow (vph) 0 0 0 0 105 2 100 862 0 13 204 246Turn Type Perm NA Perm Prot NA Prot NA PermProtected Phases 8 5 2 1 6Permitted Phases 8 8 6Actuated Green, G (s) 12.4 12.4 14.4 73.2 2.8 61.6 61.6Effective Green, g (s) 12.4 12.4 14.4 73.2 2.8 61.6 61.6Actuated g/C Ratio 0.10 0.10 0.12 0.60 0.02 0.51 0.51Clearance Time (s) 4.0 4.0 4.0 4.0 4.0 4.0 4.0Vehicle Extension (s) 3.0 3.0 3.0 3.0 3.0 3.0 3.0Lane Grp Cap (vph) 187 162 210 1075 40 947 805v/s Ratio Prot 0.06 c0.48 0.01 0.11v/s Ratio Perm 0.06 0.00 c0.16v/c Ratio 0.56 0.01 0.48 0.80 0.33 0.22 0.31Uniform Delay, d1 51.8 48.9 49.8 18.4 58.2 16.4 17.3Progression Factor 1.00 1.00 0.74 0.38 1.00 1.00 1.00Incremental Delay, d2 3.8 0.0 1.4 5.1 4.7 0.5 1.0Delay (s) 55.6 48.9 38.2 12.2 62.9 16.9 18.3Level of Service E D D B E B BApproach Delay (s) 0.0 54.4 14.9 18.7Approach LOS A D B B
Intersection SummaryHCM 2000 Control Delay 19.2 HCM 2000 Level of Service BHCM 2000 Volume to Capacity ratio 0.64Actuated Cycle Length (s) 121.1 Sum of lost time (s) 16.0Intersection Capacity Utilization 62.5% ICU Level of Service BAnalysis Period (min) 15c Critical Lane Group

2: Placerville Dr/Placerville Rd & SR 50 WB Off Ramp Existing+Project AM PeakHCM Signalized Intersection Capacity Analysis 12/15/2014
AOC Courthouse Project EIR Synchro 8 ReportCHS Consulting Group Page 2
Movement WBL WBR NBT NBR SBL SBTLane ConfigurationsVolume (vph) 156 220 672 0 0 220Ideal Flow (vphpl) 1900 1900 1900 1900 1900 1900Total Lost time (s) 4.0 4.0 4.0 4.0Lane Util. Factor 1.00 1.00 1.00 1.00Frt 1.00 0.85 1.00 1.00Flt Protected 0.95 1.00 1.00 1.00Satd. Flow (prot) 1770 1583 1863 1863Flt Permitted 0.95 1.00 1.00 1.00Satd. Flow (perm) 1770 1583 1863 1863Peak-hour factor, PHF 0.92 0.92 0.92 0.92 0.92 0.92Adj. Flow (vph) 170 239 730 0 0 239RTOR Reduction (vph) 0 215 0 0 0 0Lane Group Flow (vph) 170 24 730 0 0 239Turn Type Prot Perm NA NAProtected Phases 7 2 6Permitted Phases 8Actuated Green, G (s) 16.7 12.4 73.2 61.6Effective Green, g (s) 16.7 12.4 73.2 61.6Actuated g/C Ratio 0.14 0.10 0.60 0.51Clearance Time (s) 4.0 4.0 4.0 4.0Vehicle Extension (s) 3.0 3.0 3.0 3.0Lane Grp Cap (vph) 244 162 1126 947v/s Ratio Prot c0.10 c0.39 c0.13v/s Ratio Perm c0.02v/c Ratio 0.70 0.15 0.65 0.25Uniform Delay, d1 49.8 49.6 15.6 16.8Progression Factor 1.00 1.00 1.00 0.37Incremental Delay, d2 8.4 0.4 2.9 0.6Delay (s) 58.2 50.0 18.5 6.8Level of Service E D B AApproach Delay (s) 53.4 18.5 6.8Approach LOS D B A
Intersection SummaryHCM 2000 Control Delay 26.8 HCM 2000 Level of Service CHCM 2000 Volume to Capacity ratio 0.59Actuated Cycle Length (s) 121.1 Sum of lost time (s) 16.0Intersection Capacity Utilization 55.7% ICU Level of Service BAnalysis Period (min) 15c Critical Lane Group

AOC - Placerville CourthouseExisting+Project AM
US 50 Ramps / Placerville Drive / Fair Lane
L T R L T R L T R L T R L T R L T R
Volume 92 564 236 12 188 444 32 64 20 0 672 0 0 220 0 156 0 220 2,920Average Delay 38.3 12.3 12.3 63.4 17.4 18.7 56.1 49.3 38.3 0.0 18.8 0 0 6.8 0 58.9 0 50.4Total Delay 3,524 6,937 2,903 761 3,271 8,303 1,795 3,155 766 0 12633.6 0 0 1496 0 9,188 0 11088 65,821
22.5Source: CHS Consulting Group, 2014. C
WB US 50 Off RampNB Placerville Dr SB Placerville Dr WB Fair Lane NB Placerville Dr SB Placerville Dr

3: Forni Rd & Placerville Dr Existing+Project AM PeakHCM Unsignalized Intersection Capacity Analysis 12/15/2014
AOC Courthouse Project EIR Synchro 8 ReportCHS Consulting Group Page 3
Movement EBL EBR NBL NBT SBT SBRLane ConfigurationsVolume (veh/h) 24 38 22 648 348 28Sign Control Stop Free FreeGrade 0% 0% 0%Peak Hour Factor 0.92 0.92 0.92 0.92 0.92 0.92Hourly flow rate (vph) 26 41 24 704 378 30PedestriansLane Width (ft)Walking Speed (ft/s)Percent BlockageRight turn flare (veh) 7Median type None NoneMedian storage veh)Upstream signal (ft) 476pX, platoon unblocked 0.93 0.93 0.93vC, conflicting volume 1146 393 409vC1, stage 1 conf volvC2, stage 2 conf volvCu, unblocked vol 1119 312 328tC, single (s) 6.4 6.2 4.1tC, 2 stage (s)tF (s) 3.5 3.3 2.2p0 queue free % 87 94 98cM capacity (veh/h) 208 678 1147Direction, Lane # EB 1 NB 1 NB 2 SB 1Volume Total 67 24 704 409Volume Left 26 24 0 0Volume Right 41 0 0 30cSH 538 1147 1700 1700Volume to Capacity 0.13 0.02 0.41 0.24Queue Length 95th (ft) 11 2 0 0Control Delay (s) 16.1 8.2 0.0 0.0Lane LOS C AApproach Delay (s) 16.1 0.3 0.0Approach LOS CIntersection SummaryAverage Delay 1.1Intersection Capacity Utilization 44.1% ICU Level of Service AAnalysis Period (min) 15

4: Lo Hi Way/SR EB Off Ramp & Forni Rd Existing+Project AM PeakHCM Unsignalized Intersection Capacity Analysis 12/31/2014
AOC Courthouse Project EIR Synchro 8 ReportCHS Consulting Group Page 1
Movement EBL EBT EBR WBL WBT WBR NBL NBT NBR SBL SBT SBRLane ConfigurationsSign Control Stop Stop Stop StopVolume (vph) 138 208 40 16 98 27 44 16 24 325 36 528Peak Hour Factor 0.92 0.92 0.92 0.92 0.92 0.92 0.92 0.92 0.92 0.92 0.92 0.92Hourly flow rate (vph) 150 226 43 17 107 29 48 17 26 353 39 574
Direction, Lane # EB 1 EB 2 WB 1 WB 2 NB 1 SB 1 SB 2Volume Total (vph) 150 270 124 29 91 392 574Volume Left (vph) 150 0 17 0 48 353 0Volume Right (vph) 0 43 0 29 26 0 574Hadj (s) 0.53 -0.08 0.06 -0.57 -0.03 0.21 -0.57Departure Headway (s) 6.7 6.1 6.3 3.2 6.2 5.8 3.2Degree Utilization, x 0.28 0.46 0.22 0.03 0.16 0.63 0.51Capacity (veh/h) 510 562 514 1121 511 597 1116Control Delay (s) 11.1 13.0 11.0 6.3 10.3 18.2 9.5Approach Delay (s) 12.3 10.1 10.3 13.0Approach LOS B B B B
Intersection SummaryDelay 12.4Level of Service BIntersection Capacity Utilization 53.5% ICU Level of Service AAnalysis Period (min) 15

5: Forni Rd & Ray Lawyer Dr Existing+Project AM PeakHCM Unsignalized Intersection Capacity Analysis 12/15/2014
AOC Courthouse Project EIR Synchro 8 ReportCHS Consulting Group Page 5
Movement EBL EBT WBT WBR SBL SBRLane ConfigurationsSign Control Stop Stop StopVolume (vph) 84 35 80 40 32 38Peak Hour Factor 0.92 0.92 0.92 0.92 0.92 0.92Hourly flow rate (vph) 91 38 87 43 35 41Direction, Lane # EB 1 EB 2 WB 1 WB 2 SB 1 SB 2Volume Total (vph) 91 38 87 43 35 41Volume Left (vph) 91 0 0 0 35 0Volume Right (vph) 0 0 0 43 0 41Hadj (s) 0.53 0.03 0.03 -0.67 0.53 -0.67Departure Headway (s) 5.3 4.8 4.8 4.1 5.6 4.4Degree Utilization, x 0.14 0.05 0.12 0.05 0.05 0.05Capacity (veh/h) 662 724 720 842 608 763Control Delay (s) 8.0 6.9 7.3 6.2 7.8 6.5Approach Delay (s) 7.7 6.9 7.1Approach LOS A A AIntersection SummaryDelay 7.2Level of Service AIntersection Capacity Utilization 21.3% ICU Level of Service AAnalysis Period (min) 15

6: Ray Lawyer Dr & Fair Lane Existing+Project AM PeakHCM Unsignalized Intersection Capacity Analysis 12/15/2014
AOC Courthouse Project EIR Synchro 8 ReportCHS Consulting Group Page 6
Movement EBL EBR NBL NBT SBT SBRLane ConfigurationsSign Control Stop Stop StopVolume (vph) 16 90 62 38 100 72Peak Hour Factor 0.92 0.92 0.92 0.92 0.92 0.92Hourly flow rate (vph) 17 98 67 41 109 78Direction, Lane # EB 1 EB 2 NB 1 NB 2 SB 1 SB 2Volume Total (vph) 17 98 67 41 109 78Volume Left (vph) 17 0 67 0 0 0Volume Right (vph) 0 98 0 0 0 78Hadj (s) 0.53 -0.67 0.53 0.03 0.03 -0.67Departure Headway (s) 5.7 4.5 5.5 5.0 4.9 4.2Degree Utilization, x 0.03 0.12 0.10 0.06 0.15 0.09Capacity (veh/h) 594 751 637 698 706 824Control Delay (s) 7.7 6.9 7.9 7.1 7.6 6.4Approach Delay (s) 7.1 7.6 7.1Approach LOS A A AIntersection SummaryDelay 7.2Level of Service AIntersection Capacity Utilization 20.1% ICU Level of Service AAnalysis Period (min) 15

7: Jail Driveway & Forni Rd Existing+Project AM PeakHCM Unsignalized Intersection Capacity Analysis 12/31/2014
AOC Courthouse Project EIR Synchro 8 ReportCHS Consulting Group Page 1
Movement EBT EBR WBL WBT NBL NBRLane ConfigurationsVolume (veh/h) 74 214 58 49 19 38Sign Control Free Free StopGrade 0% 0% 0%Peak Hour Factor 0.92 0.92 0.92 0.92 0.92 0.92Hourly flow rate (vph) 80 233 63 53 21 41PedestriansLane Width (ft)Walking Speed (ft/s)Percent BlockageRight turn flare (veh) 2Median type None NoneMedian storage veh)Upstream signal (ft)pX, platoon unblockedvC, conflicting volume 313 260 80vC1, stage 1 conf volvC2, stage 2 conf volvCu, unblocked vol 313 260 80tC, single (s) 4.1 6.4 6.2tC, 2 stage (s)tF (s) 2.2 3.5 3.3p0 queue free % 95 97 96cM capacity (veh/h) 1247 692 980
Direction, Lane # EB 1 EB 2 WB 1 NB 1Volume Total 80 233 116 62Volume Left 0 0 63 21Volume Right 0 233 0 41cSH 1700 1700 1247 1469Volume to Capacity 0.05 0.14 0.05 0.04Queue Length 95th (ft) 0 0 4 3Control Delay (s) 0.0 0.0 4.6 9.3Lane LOS A AApproach Delay (s) 0.0 4.6 9.3Approach LOS A
Intersection SummaryAverage Delay 2.3Intersection Capacity Utilization 25.7% ICU Level of Service AAnalysis Period (min) 15
8: Ray Lawyer Dr & US 50 WB On Ramp Existing+Project AM PeakHCM Unsignalized Intersection Capacity Analysis 12/15/2014
AOC Courthouse Project EIR Synchro 8 ReportCHS Consulting Group Page 8
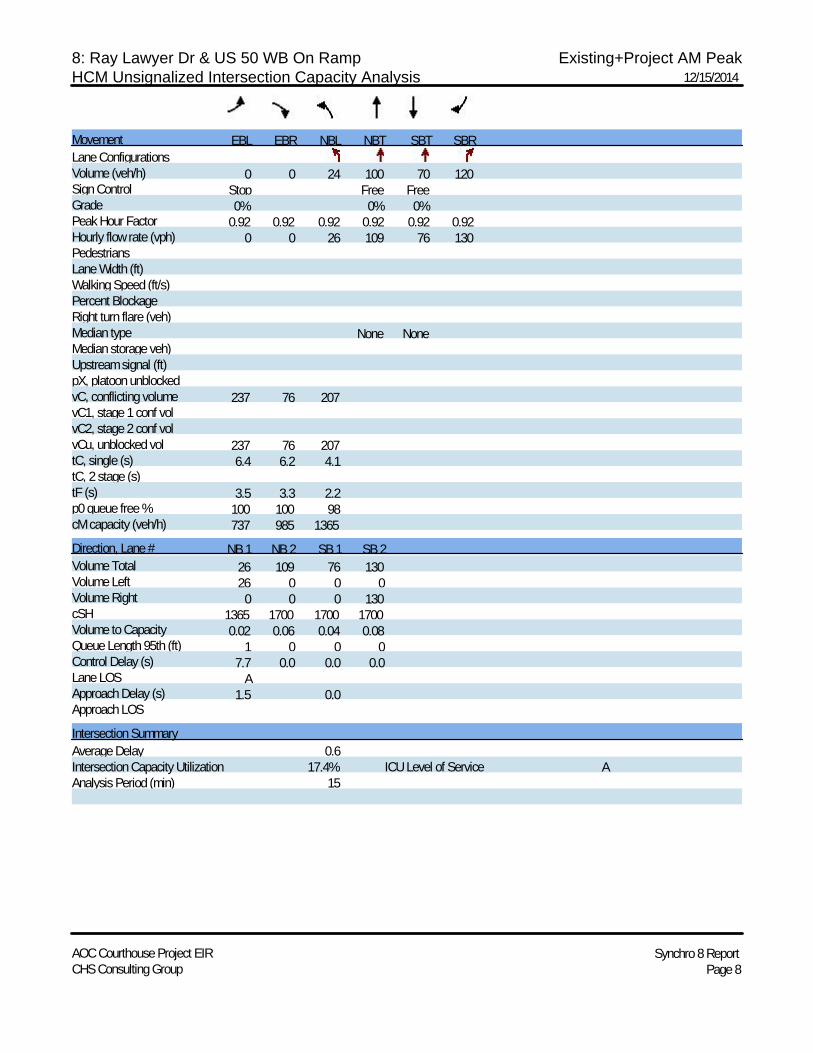
Movement EBL EBR NBL NBT SBT SBRLane ConfigurationsVolume (veh/h) 0 0 24 100 70 120Sign Control Stop Free FreeGrade 0% 0% 0%Peak Hour Factor 0.92 0.92 0.92 0.92 0.92 0.92Hourly flow rate (vph) 0 0 26 109 76 130PedestriansLane Width (ft)Walking Speed (ft/s)Percent BlockageRight turn flare (veh)Median type None NoneMedian storage veh)Upstream signal (ft)pX, platoon unblockedvC, conflicting volume 237 76 207vC1, stage 1 conf volvC2, stage 2 conf volvCu, unblocked vol 237 76 207tC, single (s) 6.4 6.2 4.1tC, 2 stage (s)tF (s) 3.5 3.3 2.2p0 queue free % 100 100 98cM capacity (veh/h) 737 985 1365Direction, Lane # NB 1 NB 2 SB 1 SB 2Volume Total 26 109 76 130Volume Left 26 0 0 0Volume Right 0 0 0 130cSH 1365 1700 1700 1700Volume to Capacity 0.02 0.06 0.04 0.08Queue Length 95th (ft) 1 0 0 0Control Delay (s) 7.7 0.0 0.0 0.0Lane LOS AApproach Delay (s) 1.5 0.0Approach LOS
Intersection SummaryAverage Delay 0.6Intersection Capacity Utilization 17.4% ICU Level of Service AAnalysis Period (min) 15
1: Placerville Rd/SR 50 WB On Ramp & Fair Lane Existing+Project PM PeakHCM Signalized Intersection Capacity Analysis 12/10/2014
AOC Courthouse Project EIR Synchro 8 ReportCHS Consulting Group Page 1
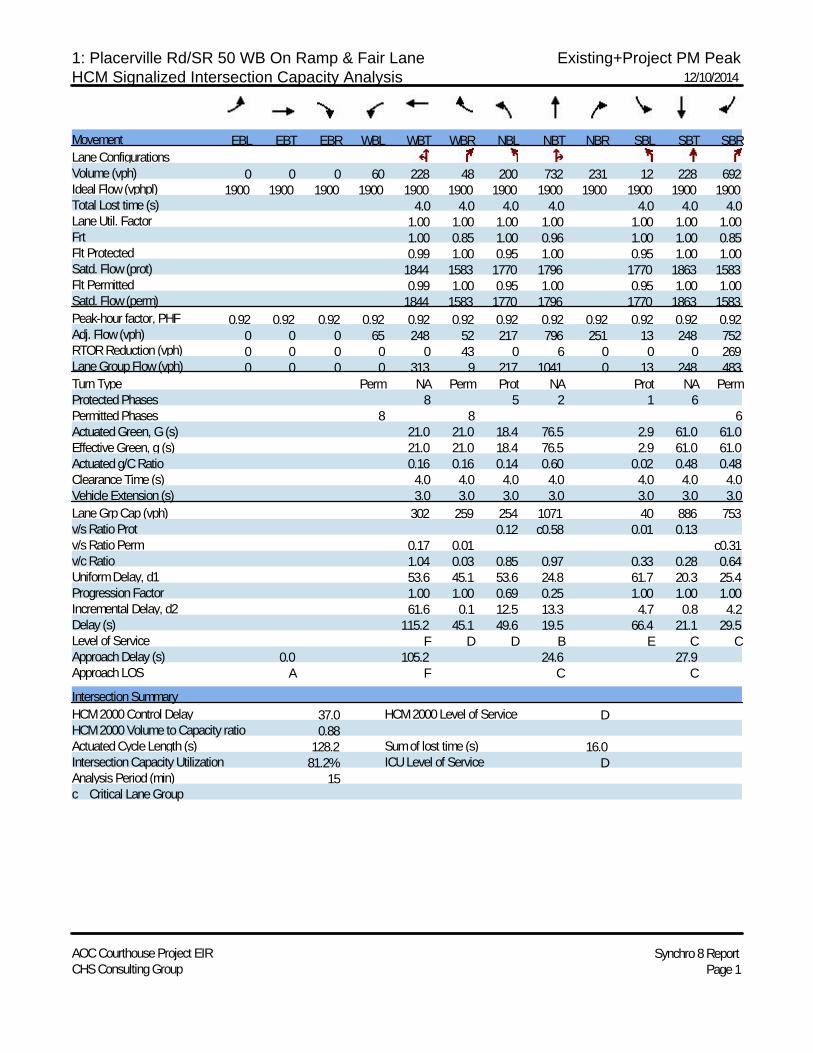
Movement EBL EBT EBR WBL WBT WBR NBL NBT NBR SBL SBT SBRLane ConfigurationsVolume (vph) 0 0 0 60 228 48 200 732 231 12 228 692Ideal Flow (vphpl) 1900 1900 1900 1900 1900 1900 1900 1900 1900 1900 1900 1900Total Lost time (s) 4.0 4.0 4.0 4.0 4.0 4.0 4.0Lane Util. Factor 1.00 1.00 1.00 1.00 1.00 1.00 1.00Frt 1.00 0.85 1.00 0.96 1.00 1.00 0.85Flt Protected 0.99 1.00 0.95 1.00 0.95 1.00 1.00Satd. Flow (prot) 1844 1583 1770 1796 1770 1863 1583Flt Permitted 0.99 1.00 0.95 1.00 0.95 1.00 1.00Satd. Flow (perm) 1844 1583 1770 1796 1770 1863 1583Peak-hour factor, PHF 0.92 0.92 0.92 0.92 0.92 0.92 0.92 0.92 0.92 0.92 0.92 0.92Adj. Flow (vph) 0 0 0 65 248 52 217 796 251 13 248 752RTOR Reduction (vph) 0 0 0 0 0 43 0 6 0 0 0 269Lane Group Flow (vph) 0 0 0 0 313 9 217 1041 0 13 248 483Turn Type Perm NA Perm Prot NA Prot NA PermProtected Phases 8 5 2 1 6Permitted Phases 8 8 6Actuated Green, G (s) 21.0 21.0 18.4 76.5 2.9 61.0 61.0Effective Green, g (s) 21.0 21.0 18.4 76.5 2.9 61.0 61.0Actuated g/C Ratio 0.16 0.16 0.14 0.60 0.02 0.48 0.48Clearance Time (s) 4.0 4.0 4.0 4.0 4.0 4.0 4.0Vehicle Extension (s) 3.0 3.0 3.0 3.0 3.0 3.0 3.0Lane Grp Cap (vph) 302 259 254 1071 40 886 753v/s Ratio Prot 0.12 c0.58 0.01 0.13v/s Ratio Perm 0.17 0.01 c0.31v/c Ratio 1.04 0.03 0.85 0.97 0.33 0.28 0.64Uniform Delay, d1 53.6 45.1 53.6 24.8 61.7 20.3 25.4Progression Factor 1.00 1.00 0.69 0.25 1.00 1.00 1.00Incremental Delay, d2 61.6 0.1 12.5 13.3 4.7 0.8 4.2Delay (s) 115.2 45.1 49.6 19.5 66.4 21.1 29.5Level of Service F D D B E C CApproach Delay (s) 0.0 105.2 24.6 27.9Approach LOS A F C C
Intersection SummaryHCM 2000 Control Delay 37.0 HCM 2000 Level of Service DHCM 2000 Volume to Capacity ratio 0.88Actuated Cycle Length (s) 128.2 Sum of lost time (s) 16.0Intersection Capacity Utilization 81.2% ICU Level of Service DAnalysis Period (min) 15c Critical Lane Group

2: Placerville Dr/Placerville Rd & SR 50 WB Off Ramp Existing+Project PM PeakHCM Signalized Intersection Capacity Analysis 12/10/2014
AOC Courthouse Project EIR Synchro 8 ReportCHS Consulting Group Page 2
Movement WBL WBR NBT NBR SBL SBTLane ConfigurationsVolume (vph) 84 182 981 0 0 288Ideal Flow (vphpl) 1900 1900 1900 1900 1900 1900Total Lost time (s) 4.0 4.0 4.0 4.0Lane Util. Factor 1.00 1.00 1.00 1.00Frt 1.00 0.85 1.00 1.00Flt Protected 0.95 1.00 1.00 1.00Satd. Flow (prot) 1770 1583 1863 1863Flt Permitted 0.95 1.00 1.00 1.00Satd. Flow (perm) 1770 1583 1863 1863Peak-hour factor, PHF 0.92 0.92 0.92 0.92 0.92 0.92Adj. Flow (vph) 91 198 1066 0 0 313RTOR Reduction (vph) 0 166 0 0 0 0Lane Group Flow (vph) 91 32 1066 0 0 313Turn Type Prot Perm NA NAProtected Phases 7 2 6Permitted Phases 8Actuated Green, G (s) 11.8 21.0 76.5 61.0Effective Green, g (s) 11.8 21.0 76.5 61.0Actuated g/C Ratio 0.09 0.16 0.60 0.48Clearance Time (s) 4.0 4.0 4.0 4.0Vehicle Extension (s) 3.0 3.0 3.0 3.0Lane Grp Cap (vph) 162 259 1111 886v/s Ratio Prot c0.05 c0.57 c0.17v/s Ratio Perm c0.02v/c Ratio 0.56 0.13 0.96 0.35Uniform Delay, d1 55.7 45.8 24.4 21.2Progression Factor 1.00 1.00 1.00 0.42Incremental Delay, d2 4.4 0.2 18.9 1.0Delay (s) 60.1 46.0 43.2 9.9Level of Service E D D AApproach Delay (s) 50.4 43.2 9.9Approach LOS D D A
Intersection SummaryHCM 2000 Control Delay 38.2 HCM 2000 Level of Service DHCM 2000 Volume to Capacity ratio 0.75Actuated Cycle Length (s) 128.2 Sum of lost time (s) 16.0Intersection Capacity Utilization 69.6% ICU Level of Service CAnalysis Period (min) 15c Critical Lane Group
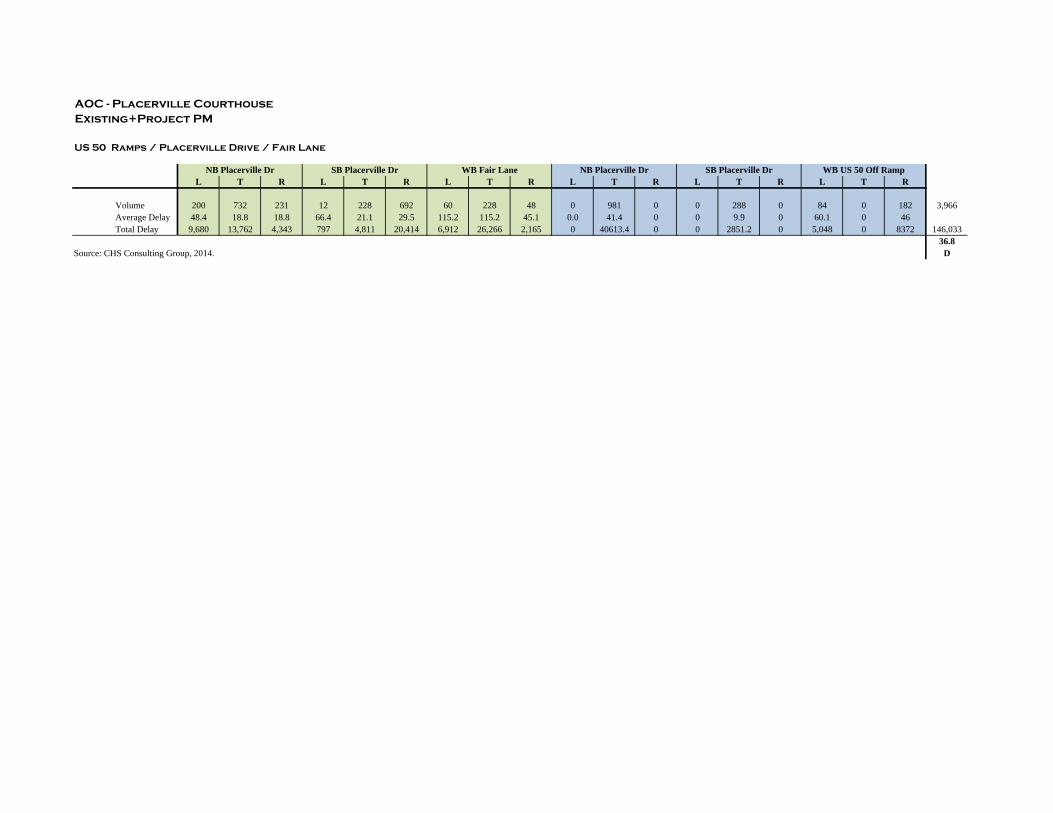
AOC - Placerville CourthouseExisting+Project PM
US 50 Ramps / Placerville Drive / Fair Lane
L T R L T R L T R L T R L T R L T R
Volume 200 732 231 12 228 692 60 228 48 0 981 0 0 288 0 84 0 182 3,966Average Delay 48.4 18.8 18.8 66.4 21.1 29.5 115.2 115.2 45.1 0.0 41.4 0 0 9.9 0 60.1 0 46Total Delay 9,680 13,762 4,343 797 4,811 20,414 6,912 26,266 2,165 0 40613.4 0 0 2851.2 0 5,048 0 8372 146,033
36.8Source: CHS Consulting Group, 2014. D
WB US 50 Off RampNB Placerville Dr SB Placerville Dr WB Fair Lane NB Placerville Dr SB Placerville Dr

3: Forni Rd & Placerville Dr Existing+Project PM PeakHCM Unsignalized Intersection Capacity Analysis 12/10/2014
AOC Courthouse Project EIR Synchro 8 ReportCHS Consulting Group Page 3
Movement EBL EBR NBL NBT SBT SBRLane ConfigurationsVolume (veh/h) 60 40 44 921 284 88Sign Control Stop Free FreeGrade 0% 0% 0%Peak Hour Factor 0.92 0.92 0.92 0.92 0.92 0.92Hourly flow rate (vph) 65 43 48 1001 309 96PedestriansLane Width (ft)Walking Speed (ft/s)Percent BlockageRight turn flare (veh) 7Median type None NoneMedian storage veh)Upstream signal (ft) 476pX, platoon unblocked 0.89 0.89 0.89vC, conflicting volume 1453 357 404vC1, stage 1 conf volvC2, stage 2 conf volvCu, unblocked vol 1448 220 274tC, single (s) 6.4 6.2 4.1tC, 2 stage (s)tF (s) 3.5 3.3 2.2p0 queue free % 47 94 96cM capacity (veh/h) 124 732 1152Direction, Lane # EB 1 NB 1 NB 2 SB 1Volume Total 109 48 1001 404Volume Left 65 48 0 0Volume Right 43 0 0 96cSH 207 1152 1700 1700Volume to Capacity 0.53 0.04 0.59 0.24Queue Length 95th (ft) 68 3 0 0Control Delay (s) 41.6 8.3 0.0 0.0Lane LOS E AApproach Delay (s) 41.6 0.4 0.0Approach LOS EIntersection SummaryAverage Delay 3.1Intersection Capacity Utilization 58.5% ICU Level of Service BAnalysis Period (min) 15

4: Lo Hi Way/SR EB Off Ramp & Forni Rd Existing+Project PM PeakHCM Unsignalized Intersection Capacity Analysis 12/10/2014
AOC Courthouse Project EIR Synchro 8 ReportCHS Consulting Group Page 4
Movement EBL EBT EBR WBL WBT WBR NBL NBT NBR SBL SBT SBRLane ConfigurationsSign Control Stop Stop Stop StopVolume (vph) 176 100 48 20 201 68 72 44 20 92 76 692Peak Hour Factor 0.92 0.92 0.92 0.92 0.92 0.92 0.92 0.92 0.92 0.92 0.92 0.92Hourly flow rate (vph) 191 109 52 22 218 74 78 48 22 100 83 752Direction, Lane # EB 1 EB 2 WB 1 WB 2 NB 1 SB 1 SB 2Volume Total (vph) 191 161 240 74 148 183 752Volume Left (vph) 191 0 22 0 78 100 0Volume Right (vph) 0 52 0 74 22 0 752Hadj (s) 0.53 -0.19 0.05 -0.57 0.05 0.14 -0.57Departure Headway (s) 6.4 5.7 5.6 3.2 5.9 5.9 3.2Degree Utilization, x 0.34 0.25 0.38 0.07 0.24 0.30 0.67Capacity (veh/h) 537 603 600 1121 544 555 1119Control Delay (s) 11.5 9.4 12.0 6.4 10.8 11.4 12.4Approach Delay (s) 10.5 10.7 10.8 12.2Approach LOS B B B BIntersection SummaryDelay 11.5Level of Service BIntersection Capacity Utilization 72.1% ICU Level of Service CAnalysis Period (min) 15

5: Forni Rd & Ray Lawyer Dr Existing+Project PM PeakHCM Unsignalized Intersection Capacity Analysis 12/10/2014
AOC Courthouse Project EIR Synchro 8 ReportCHS Consulting Group Page 5
Movement EBL EBT WBT WBR SBL SBRLane ConfigurationsSign Control Stop Stop StopVolume (vph) 144 116 20 40 104 33Peak Hour Factor 0.92 0.92 0.92 0.92 0.92 0.92Hourly flow rate (vph) 157 126 22 43 113 36Direction, Lane # EB 1 EB 2 WB 1 WB 2 SB 1 SB 2Volume Total (vph) 157 126 22 43 113 36Volume Left (vph) 157 0 0 0 113 0Volume Right (vph) 0 0 0 43 0 36Hadj (s) 0.53 0.03 0.03 -0.67 0.53 -0.67Departure Headway (s) 5.5 5.0 5.3 4.6 5.9 4.7Degree Utilization, x 0.24 0.18 0.03 0.06 0.18 0.05Capacity (veh/h) 627 693 652 752 585 723Control Delay (s) 9.1 7.9 7.2 6.6 9.0 6.7Approach Delay (s) 8.5 6.8 8.4Approach LOS A A AIntersection SummaryDelay 8.3Level of Service AIntersection Capacity Utilization 27.1% ICU Level of Service AAnalysis Period (min) 15

6: Ray Lawyer Dr & Fair Lane Existing+Project PM PeakHCM Unsignalized Intersection Capacity Analysis 12/10/2014
AOC Courthouse Project EIR Synchro 8 ReportCHS Consulting Group Page 6
Movement EBL EBR NBL NBT SBT SBRLane ConfigurationsSign Control Stop Stop StopVolume (vph) 96 165 22 72 165 16Peak Hour Factor 0.92 0.92 0.92 0.92 0.92 0.92Hourly flow rate (vph) 104 179 24 78 179 17Direction, Lane # EB 1 EB 2 NB 1 NB 2 SB 1 SB 2Volume Total (vph) 104 179 24 78 179 17Volume Left (vph) 104 0 24 0 0 0Volume Right (vph) 0 179 0 0 0 17Hadj (s) 0.53 -0.67 0.53 0.03 0.03 -0.67Departure Headway (s) 5.8 4.6 6.0 5.5 5.4 4.7Degree Utilization, x 0.17 0.23 0.04 0.12 0.27 0.02Capacity (veh/h) 590 743 571 622 638 727Control Delay (s) 8.8 7.8 8.0 8.0 9.1 6.6Approach Delay (s) 8.1 8.0 8.9Approach LOS A A AIntersection SummaryDelay 8.4Level of Service AIntersection Capacity Utilization 27.3% ICU Level of Service AAnalysis Period (min) 15

7: Jail Driveway & Forni Rd Existing+Project PM PeakHCM Unsignalized Intersection Capacity Analysis 12/10/2014
AOC Courthouse Project EIR Synchro 8 ReportCHS Consulting Group Page 7
Movement EBT EBR WBL WBT NBL NBRLane ConfigurationsVolume (veh/h) 120 6 2 51 37 90Sign Control Free Free StopGrade 0% 0% 0%Peak Hour Factor 0.92 0.92 0.92 0.92 0.92 0.92Hourly flow rate (vph) 130 7 2 55 40 98PedestriansLane Width (ft)Walking Speed (ft/s)Percent BlockageRight turn flare (veh) 2Median type None NoneMedian storage veh)Upstream signal (ft)pX, platoon unblockedvC, conflicting volume 137 190 130vC1, stage 1 conf volvC2, stage 2 conf volvCu, unblocked vol 137 190 130tC, single (s) 4.1 6.4 6.2tC, 2 stage (s)tF (s) 2.2 3.5 3.3p0 queue free % 100 95 89cM capacity (veh/h) 1447 798 919Direction, Lane # EB 1 EB 2 WB 1 NB 1Volume Total 130 7 58 138Volume Left 0 0 2 40Volume Right 0 7 0 98cSH 1700 1700 1447 1297Volume to Capacity 0.08 0.00 0.00 0.11Queue Length 95th (ft) 0 0 0 9Control Delay (s) 0.0 0.0 0.3 9.5Lane LOS A AApproach Delay (s) 0.0 0.3 9.5Approach LOS AIntersection SummaryAverage Delay 4.0Intersection Capacity Utilization 18.6% ICU Level of Service AAnalysis Period (min) 15

8: Ray Lawyer Dr & US 50 WB On Ramp Existing+Project PM PeakHCM Unsignalized Intersection Capacity Analysis 12/10/2014
AOC Courthouse Project EIR Synchro 8 ReportCHS Consulting Group Page 8
Movement EBL EBR NBL NBT SBT SBRLane ConfigurationsVolume (veh/h) 0 0 90 94 136 194Sign Control Stop Free FreeGrade 0% 0% 0%Peak Hour Factor 0.92 0.92 0.92 0.92 0.92 0.92Hourly flow rate (vph) 0 0 98 102 148 211PedestriansLane Width (ft)Walking Speed (ft/s)Percent BlockageRight turn flare (veh)Median type None NoneMedian storage veh)Upstream signal (ft)pX, platoon unblockedvC, conflicting volume 446 148 359vC1, stage 1 conf volvC2, stage 2 conf volvCu, unblocked vol 446 148 359tC, single (s) 6.4 6.2 4.1tC, 2 stage (s)tF (s) 3.5 3.3 2.2p0 queue free % 100 100 92cM capacity (veh/h) 524 899 1200Direction, Lane # NB 1 NB 2 SB 1 SB 2Volume Total 98 102 148 211Volume Left 98 0 0 0Volume Right 0 0 0 211cSH 1200 1700 1700 1700Volume to Capacity 0.08 0.06 0.09 0.12Queue Length 95th (ft) 7 0 0 0Control Delay (s) 8.3 0.0 0.0 0.0Lane LOS AApproach Delay (s) 4.0 0.0Approach LOS
Intersection SummaryAverage Delay 1.4Intersection Capacity Utilization 23.7% ICU Level of Service AAnalysis Period (min) 15

1: Placerville Rd/SR 50 WB On Ramp & Fair Lane Existing+Approved AMHCM Signalized Intersection Capacity Analysis 4/21/2014
AOC Courthouse Project EIR Synchro 8 ReportCHS Consulting Group Page 1
Movement EBL EBT EBR WBL WBT WBR NBL NBT NBR SBL SBT SBRLane ConfigurationsVolume (vph) 0 0 0 25 60 20 102 706 110 20 336 340Ideal Flow (vphpl) 1900 1900 1900 1900 1900 1900 1900 1900 1900 1900 1900 1900Total Lost time (s) 4.0 4.0 4.0 4.0 4.0 4.0 4.0Lane Util. Factor 1.00 1.00 1.00 1.00 1.00 1.00 1.00Frt 1.00 0.85 1.00 0.98 1.00 1.00 0.85Flt Protected 0.99 1.00 0.95 1.00 0.95 1.00 1.00Satd. Flow (prot) 1836 1583 1770 1825 1770 1863 1583Flt Permitted 0.99 1.00 0.95 1.00 0.95 1.00 1.00Satd. Flow (perm) 1836 1583 1770 1825 1770 1863 1583Peak-hour factor, PHF 0.92 0.92 0.92 0.92 0.92 0.92 0.92 0.92 0.92 0.92 0.92 0.92Adj. Flow (vph) 0 0 0 27 65 22 111 767 120 22 365 370RTOR Reduction (vph) 0 0 0 0 0 20 0 4 0 0 0 194Lane Group Flow (vph) 0 0 0 0 92 2 111 883 0 22 365 176Turn Type Perm NA Perm Prot NA Prot NA PermProtected Phases 8 5 2 1 6Permitted Phases 8 8 6Actuated Green, G (s) 12.4 12.4 14.5 71.2 4.6 61.3 61.3Effective Green, g (s) 12.4 12.4 14.5 71.2 4.6 61.3 61.3Actuated g/C Ratio 0.10 0.10 0.11 0.55 0.04 0.48 0.48Clearance Time (s) 4.0 4.0 4.0 4.0 4.0 4.0 4.0Vehicle Extension (s) 3.0 3.0 3.0 3.0 3.0 3.0 3.0Lane Grp Cap (vph) 177 152 199 1010 63 888 754v/s Ratio Prot 0.06 c0.48 0.01 c0.20v/s Ratio Perm 0.05 0.00 0.11v/c Ratio 0.52 0.01 0.56 0.87 0.35 0.41 0.23Uniform Delay, d1 55.3 52.6 54.0 24.8 60.5 21.9 19.8Progression Factor 1.00 1.00 0.74 0.47 1.00 1.00 1.00Incremental Delay, d2 2.6 0.0 2.6 8.3 3.3 1.4 0.7Delay (s) 57.8 52.6 42.6 20.1 63.9 23.3 20.5Level of Service E D D C E C CApproach Delay (s) 0.0 56.8 22.6 23.1Approach LOS A E C C
Intersection SummaryHCM 2000 Control Delay 24.9 HCM 2000 Level of Service CHCM 2000 Volume to Capacity ratio 0.63Actuated Cycle Length (s) 128.6 Sum of lost time (s) 16.0Intersection Capacity Utilization 61.7% ICU Level of Service BAnalysis Period (min) 15c Critical Lane Group
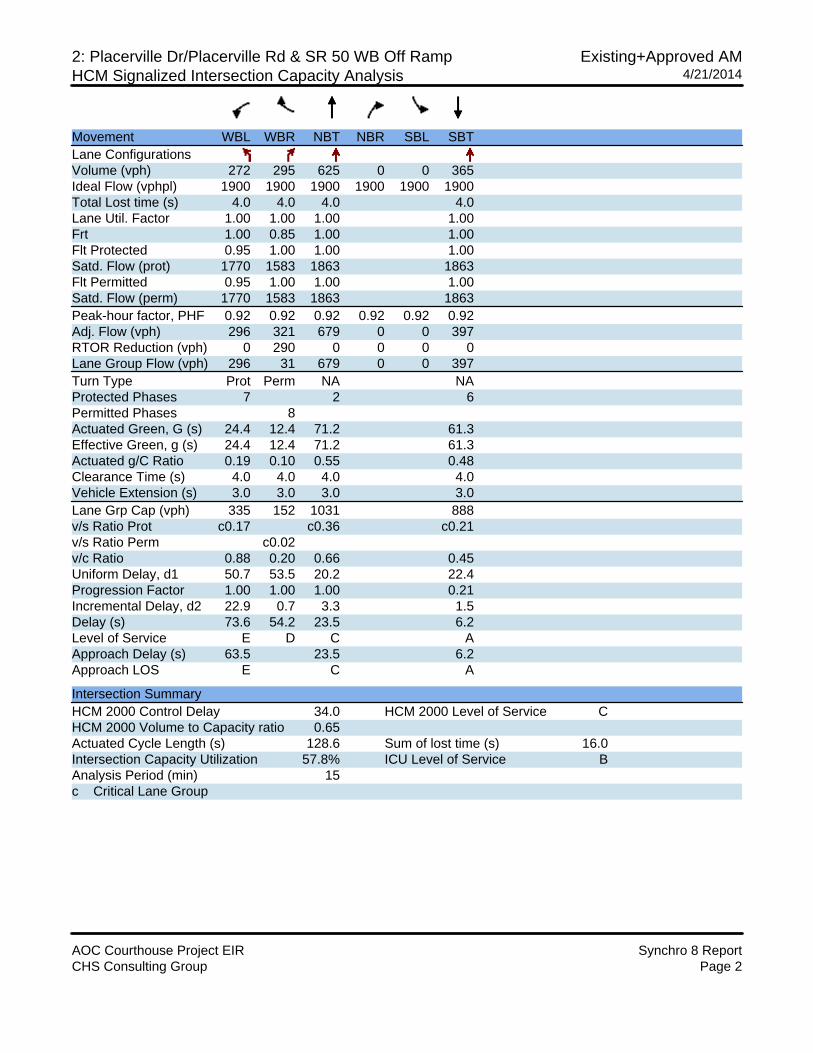
2: Placerville Dr/Placerville Rd & SR 50 WB Off Ramp Existing+Approved AMHCM Signalized Intersection Capacity Analysis 4/21/2014
AOC Courthouse Project EIR Synchro 8 ReportCHS Consulting Group Page 2
Movement WBL WBR NBT NBR SBL SBTLane ConfigurationsVolume (vph) 272 295 625 0 0 365Ideal Flow (vphpl) 1900 1900 1900 1900 1900 1900Total Lost time (s) 4.0 4.0 4.0 4.0Lane Util. Factor 1.00 1.00 1.00 1.00Frt 1.00 0.85 1.00 1.00Flt Protected 0.95 1.00 1.00 1.00Satd. Flow (prot) 1770 1583 1863 1863Flt Permitted 0.95 1.00 1.00 1.00Satd. Flow (perm) 1770 1583 1863 1863Peak-hour factor, PHF 0.92 0.92 0.92 0.92 0.92 0.92Adj. Flow (vph) 296 321 679 0 0 397RTOR Reduction (vph) 0 290 0 0 0 0Lane Group Flow (vph) 296 31 679 0 0 397Turn Type Prot Perm NA NAProtected Phases 7 2 6Permitted Phases 8Actuated Green, G (s) 24.4 12.4 71.2 61.3Effective Green, g (s) 24.4 12.4 71.2 61.3Actuated g/C Ratio 0.19 0.10 0.55 0.48Clearance Time (s) 4.0 4.0 4.0 4.0Vehicle Extension (s) 3.0 3.0 3.0 3.0Lane Grp Cap (vph) 335 152 1031 888v/s Ratio Prot c0.17 c0.36 c0.21v/s Ratio Perm c0.02v/c Ratio 0.88 0.20 0.66 0.45Uniform Delay, d1 50.7 53.5 20.2 22.4Progression Factor 1.00 1.00 1.00 0.21Incremental Delay, d2 22.9 0.7 3.3 1.5Delay (s) 73.6 54.2 23.5 6.2Level of Service E D C AApproach Delay (s) 63.5 23.5 6.2Approach LOS E C A
Intersection SummaryHCM 2000 Control Delay 34.0 HCM 2000 Level of Service CHCM 2000 Volume to Capacity ratio 0.65Actuated Cycle Length (s) 128.6 Sum of lost time (s) 16.0Intersection Capacity Utilization 57.8% ICU Level of Service BAnalysis Period (min) 15c Critical Lane Group

AOC - Placerville CourthouseExisting+Approved Projects AM (Year 2018)
US 50 Ramps / Placerville Drive / Fair Lane
L T R L T R L T R L T R L T R L T R
Volume 102 706 110 20 336 340 25 60 20 0 625 0 0 365 0 272 0 295 3,276Average Delay 42.6 20.1 20.1 63.9 23.3 20.5 57.8 52.6 42.6 0.0 23.5 0 0 6.2 0 73.6 0 54.2Total Delay 4,345 14,191 2,211 1,278 7,829 6,970 1,445 3,156 852 0 14687.5 0 0 2263 0 20,019 0 15989 95,235
29.1Source: CHS Consulting Group, 2014. C
WB US 50 Off RampNB Placerville Dr SB Placerville Dr WB Fair Lane NB Placerville Dr SB Placerville Dr

3: Forni Rd & Placerville Dr Existing+Approved AMHCM Unsignalized Intersection Capacity Analysis 6/10/2014
AOC Courthouse Project EIR Synchro 8 ReportCHS Consulting Group Page 3
Movement EBL EBR NBL NBT SBT SBRLane ConfigurationsVolume (veh/h) 50 45 37 575 656 60Sign Control Stop Free FreeGrade 0% 0% 0%Peak Hour Factor 0.92 0.92 0.92 0.92 0.92 0.92Hourly flow rate (vph) 54 49 40 625 713 65PedestriansLane Width (ft)Walking Speed (ft/s)Percent BlockageRight turn flare (veh) 7Median type None NoneMedian storage veh)Upstream signal (ft) 476pX, platoon unblocked 0.86 0.86 0.86vC, conflicting volume 1451 746 778vC1, stage 1 conf volvC2, stage 2 conf volvCu, unblocked vol 1443 618 656tC, single (s) 6.4 6.2 4.1tC, 2 stage (s)tF (s) 3.5 3.3 2.2p0 queue free % 54 88 95cM capacity (veh/h) 118 418 796
Direction, Lane # EB 1 NB 1 NB 2 SB 1Volume Total 103 40 625 778Volume Left 54 40 0 0Volume Right 49 0 0 65cSH 225 796 1700 1700Volume to Capacity 0.46 0.05 0.37 0.46Queue Length 95th (ft) 56 4 0 0Control Delay (s) 38.0 9.8 0.0 0.0Lane LOS E AApproach Delay (s) 38.0 0.6 0.0Approach LOS E
Intersection SummaryAverage Delay 2.8Intersection Capacity Utilization 48.2% ICU Level of Service AAnalysis Period (min) 15

4: Lo Hi Way/SR EB Off Ramp & Forni Rd Existing+Approved AMHCM Unsignalized Intersection Capacity Analysis 6/10/2014
AOC Courthouse Project EIR Synchro 8 ReportCHS Consulting Group Page 4
Movement EBL EBT EBR WBL WBT WBR NBL NBT NBR SBL SBT SBRLane ConfigurationsSign Control Stop Stop Stop StopVolume (vph) 225 366 125 15 97 55 85 25 30 172 46 430Peak Hour Factor 0.92 0.92 0.92 0.92 0.92 0.92 0.92 0.92 0.92 0.92 0.92 0.92Hourly flow rate (vph) 245 398 136 16 105 60 92 27 33 187 50 467
Direction, Lane # EB 1 EB 2 WB 1 WB 2 NB 1 SB 1 SB 2Volume Total (vph) 245 534 122 60 152 237 467Volume Left (vph) 245 0 16 0 92 187 0Volume Right (vph) 0 136 0 60 33 0 467Hadj (s) 0.53 -0.14 0.06 -0.57 0.03 0.19 -0.57Departure Headway (s) 6.6 5.9 6.5 3.2 6.6 6.6 3.2Degree Utilization, x 0.45 0.87 0.22 0.05 0.28 0.43 0.42Capacity (veh/h) 540 604 516 1121 514 524 1115Control Delay (s) 13.5 34.8 11.3 6.4 12.2 14.4 8.5Approach Delay (s) 28.2 9.7 12.2 10.5Approach LOS D A B B
Intersection SummaryDelay 18.1Level of Service CIntersection Capacity Utilization 50.4% ICU Level of Service AAnalysis Period (min) 15

5: Forni Rd & US 50 EB Off Ramp & Ray Lawyer Dr Existing+Approved AMHCM Unsignalized Intersection Capacity Analysis 12/31/2014
AOC Courthouse Project EIR Synchro 8 ReportCHS Consulting Group Page 1
Movement EBL EBT EBR WBL WBT WBR NBL NBT NBR SBL SBT SBRLane ConfigurationsVolume (veh/h) 200 12 101 80 0 50 0 131 39 65 72 0Sign Control Stop Stop Free FreeGrade 0% 0% 0% 0%Peak Hour Factor 0.92 0.92 0.92 0.92 0.92 0.92 0.92 0.92 0.92 0.92 0.92 0.92Hourly flow rate (vph) 217 13 110 87 0 54 0 142 42 71 78 0PedestriansLane Width (ft)Walking Speed (ft/s)Percent BlockageRight turn flare (veh)Median type None NoneMedian storage veh)Upstream signal (ft)pX, platoon unblockedvC, conflicting volume 416 404 78 478 362 142 78 185vC1, stage 1 conf volvC2, stage 2 conf volvCu, unblocked vol 416 404 78 478 362 142 78 185tC, single (s) 7.1 6.5 6.2 7.1 6.5 6.2 4.1 4.1tC, 2 stage (s)tF (s) 3.5 4.0 3.3 3.5 4.0 3.3 2.2 2.2p0 queue free % 56 97 89 79 100 94 100 95cM capacity (veh/h) 494 508 982 416 537 905 1520 1390
Direction, Lane # EB 1 EB 2 WB 1 WB 2 NB 1 NB 2 SB 1 SB 2Volume Total 217 123 87 54 142 42 71 78Volume Left 217 0 87 0 0 0 71 0Volume Right 0 110 0 54 0 42 0 0cSH 494 894 416 905 1700 1700 1390 1700Volume to Capacity 0.44 0.14 0.21 0.06 0.08 0.02 0.05 0.05Queue Length 95th (ft) 55 12 19 5 0 0 4 0Control Delay (s) 17.9 9.7 15.9 9.2 0.0 0.0 7.7 0.0Lane LOS C A C A AApproach Delay (s) 14.9 13.3 0.0 3.7Approach LOS B B
Intersection SummaryAverage Delay 9.2Intersection Capacity Utilization 35.1% ICU Level of Service AAnalysis Period (min) 15

6: Ray Lawyer Dr & Fair Lane Existing+Approved AMHCM Unsignalized Intersection Capacity Analysis 6/10/2014
AOC Courthouse Project EIR Synchro 8 ReportCHS Consulting Group Page 6
Movement EBL EBR NBL NBT SBT SBRLane ConfigurationsSign Control Stop Stop StopVolume (vph) 20 125 170 87 151 80Peak Hour Factor 0.92 0.92 0.92 0.92 0.92 0.92Hourly flow rate (vph) 22 136 185 95 164 87
Direction, Lane # EB 1 EB 2 NB 1 NB 2 SB 1 SB 2Volume Total (vph) 22 136 185 95 164 87Volume Left (vph) 22 0 185 0 0 0Volume Right (vph) 0 136 0 0 0 87Hadj (s) 0.53 -0.67 0.53 0.03 0.03 -0.67Departure Headway (s) 6.3 5.1 5.7 5.2 5.3 4.6Degree Utilization, x 0.04 0.19 0.29 0.14 0.24 0.11Capacity (veh/h) 532 655 611 664 656 754Control Delay (s) 8.3 8.1 9.9 7.8 8.7 6.9Approach Delay (s) 8.1 9.2 8.1Approach LOS A A A
Intersection SummaryDelay 8.5Level of Service AIntersection Capacity Utilization 30.7% ICU Level of Service AAnalysis Period (min) 15

7: Jail Driveway & Forni Rd Existing+Approved AMHCM Unsignalized Intersection Capacity Analysis 6/10/2014
AOC Courthouse Project EIR Synchro 8 ReportCHS Consulting Group Page 7
Movement EBT EBR WBL WBT NBL NBRLane ConfigurationsVolume (veh/h) 470 245 163 127 77 55Sign Control Free Free StopGrade 0% 0% 0%Peak Hour Factor 0.92 0.92 0.92 0.92 0.92 0.92Hourly flow rate (vph) 511 266 177 138 84 60PedestriansLane Width (ft)Walking Speed (ft/s)Percent BlockageRight turn flare (veh) 2Median type None NoneMedian storage veh)Upstream signal (ft)pX, platoon unblockedvC, conflicting volume 777 1003 511vC1, stage 1 conf volvC2, stage 2 conf volvCu, unblocked vol 777 1003 511tC, single (s) 4.1 6.4 6.2tC, 2 stage (s)tF (s) 2.2 3.5 3.3p0 queue free % 79 60 89cM capacity (veh/h) 839 212 563
Direction, Lane # EB 1 EB 2 WB 1 NB 1Volume Total 511 266 315 143Volume Left 0 0 177 84Volume Right 0 266 0 60cSH 1700 1700 839 363Volume to Capacity 0.30 0.16 0.21 0.40Queue Length 95th (ft) 0 0 20 46Control Delay (s) 0.0 0.0 6.9 24.1Lane LOS A CApproach Delay (s) 0.0 6.9 24.1Approach LOS C
Intersection SummaryAverage Delay 4.6Intersection Capacity Utilization 54.7% ICU Level of Service AAnalysis Period (min) 15
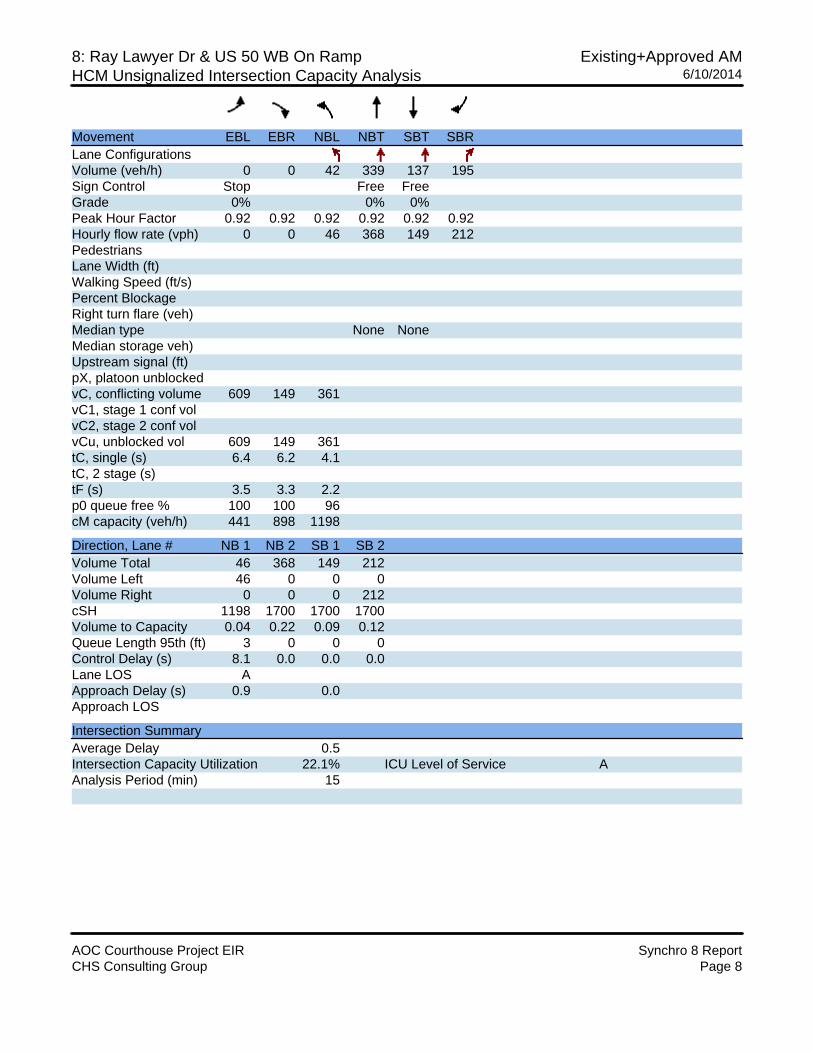
8: Ray Lawyer Dr & US 50 WB On Ramp Existing+Approved AMHCM Unsignalized Intersection Capacity Analysis 6/10/2014
AOC Courthouse Project EIR Synchro 8 ReportCHS Consulting Group Page 8
Movement EBL EBR NBL NBT SBT SBRLane ConfigurationsVolume (veh/h) 0 0 42 339 137 195Sign Control Stop Free FreeGrade 0% 0% 0%Peak Hour Factor 0.92 0.92 0.92 0.92 0.92 0.92Hourly flow rate (vph) 0 0 46 368 149 212PedestriansLane Width (ft)Walking Speed (ft/s)Percent BlockageRight turn flare (veh)Median type None NoneMedian storage veh)Upstream signal (ft)pX, platoon unblockedvC, conflicting volume 609 149 361vC1, stage 1 conf volvC2, stage 2 conf volvCu, unblocked vol 609 149 361tC, single (s) 6.4 6.2 4.1tC, 2 stage (s)tF (s) 3.5 3.3 2.2p0 queue free % 100 100 96cM capacity (veh/h) 441 898 1198
Direction, Lane # NB 1 NB 2 SB 1 SB 2Volume Total 46 368 149 212Volume Left 46 0 0 0Volume Right 0 0 0 212cSH 1198 1700 1700 1700Volume to Capacity 0.04 0.22 0.09 0.12Queue Length 95th (ft) 3 0 0 0Control Delay (s) 8.1 0.0 0.0 0.0Lane LOS AApproach Delay (s) 0.9 0.0Approach LOS
Intersection SummaryAverage Delay 0.5Intersection Capacity Utilization 22.1% ICU Level of Service AAnalysis Period (min) 15

1: Placerville Rd/SR 50 WB On Ramp & Fair Lane Existing+Approved PMHCM Signalized Intersection Capacity Analysis 4/21/2014
AOC Courthouse Project EIR Synchro 8 ReportCHS Consulting Group Page 1
Movement EBL EBT EBR WBL WBT WBR NBL NBT NBR SBL SBT SBRLane ConfigurationsVolume (vph) 0 0 0 75 175 45 241 937 120 15 362 545Ideal Flow (vphpl) 1900 1900 1900 1900 1900 1900 1900 1900 1900 1900 1900 1900Total Lost time (s) 4.0 4.0 4.0 4.0 4.0 4.0 4.0Lane Util. Factor 1.00 1.00 1.00 1.00 1.00 1.00 1.00Frt 1.00 0.85 1.00 0.98 1.00 1.00 0.85Flt Protected 0.99 1.00 0.95 1.00 0.95 1.00 1.00Satd. Flow (prot) 1835 1583 1770 1831 1770 1863 1583Flt Permitted 0.99 1.00 0.95 1.00 0.95 1.00 1.00Satd. Flow (perm) 1835 1583 1770 1831 1770 1863 1583Peak-hour factor, PHF 0.92 0.92 0.92 0.92 0.92 0.92 0.92 0.92 0.92 0.92 0.92 0.92Adj. Flow (vph) 0 0 0 82 190 49 262 1018 130 16 393 592RTOR Reduction (vph) 0 0 0 0 0 41 0 3 0 0 0 290Lane Group Flow (vph) 0 0 0 0 272 8 262 1145 0 16 393 302Turn Type Perm NA Perm Prot NA Prot NA PermProtected Phases 8 5 2 1 6Permitted Phases 8 8 6Actuated Green, G (s) 21.0 21.0 18.4 76.4 3.1 61.1 61.1Effective Green, g (s) 21.0 21.0 18.4 76.4 3.1 61.1 61.1Actuated g/C Ratio 0.16 0.16 0.14 0.57 0.02 0.45 0.45Clearance Time (s) 4.0 4.0 4.0 4.0 4.0 4.0 4.0Vehicle Extension (s) 3.0 3.0 3.0 3.0 3.0 3.0 3.0Lane Grp Cap (vph) 286 247 242 1040 40 846 719v/s Ratio Prot 0.15 c0.63 0.01 c0.21v/s Ratio Perm 0.15 0.00 0.19v/c Ratio 0.95 0.03 1.08 1.10 0.40 0.46 0.42Uniform Delay, d1 56.2 48.1 58.0 29.0 64.8 25.4 24.7Progression Factor 1.00 1.00 0.69 0.31 1.00 1.00 1.00Incremental Delay, d2 40.0 0.1 58.6 51.4 6.4 1.8 1.8Delay (s) 96.2 48.2 98.6 60.5 71.2 27.2 26.5Level of Service F D F E E C CApproach Delay (s) 0.0 88.9 67.5 27.5Approach LOS A F E C
Intersection SummaryHCM 2000 Control Delay 55.4 HCM 2000 Level of Service EHCM 2000 Volume to Capacity ratio 0.90Actuated Cycle Length (s) 134.5 Sum of lost time (s) 16.0Intersection Capacity Utilization 83.3% ICU Level of Service EAnalysis Period (min) 15c Critical Lane Group

2: Placerville Dr/Placerville Rd & SR 50 WB Off Ramp Existing+Approved PMHCM Signalized Intersection Capacity Analysis 4/21/2014
AOC Courthouse Project EIR Synchro 8 ReportCHS Consulting Group Page 2
Movement WBL WBR NBT NBR SBL SBTLane ConfigurationsVolume (vph) 158 280 1018 0 0 437Ideal Flow (vphpl) 1900 1900 1900 1900 1900 1900Total Lost time (s) 4.0 4.0 4.0 4.0Lane Util. Factor 1.00 1.00 1.00 1.00Frt 1.00 0.85 1.00 1.00Flt Protected 0.95 1.00 1.00 1.00Satd. Flow (prot) 1770 1583 1863 1863Flt Permitted 0.95 1.00 1.00 1.00Satd. Flow (perm) 1770 1583 1863 1863Peak-hour factor, PHF 0.92 0.92 0.92 0.92 0.92 0.92Adj. Flow (vph) 172 304 1107 0 0 475RTOR Reduction (vph) 0 257 0 0 0 0Lane Group Flow (vph) 172 47 1107 0 0 475Turn Type Prot Perm NA NAProtected Phases 7 2 6Permitted Phases 8Actuated Green, G (s) 18.0 21.0 76.4 61.1Effective Green, g (s) 18.0 21.0 76.4 61.1Actuated g/C Ratio 0.13 0.16 0.57 0.45Clearance Time (s) 4.0 4.0 4.0 4.0Vehicle Extension (s) 3.0 3.0 3.0 3.0Lane Grp Cap (vph) 236 247 1058 846v/s Ratio Prot c0.10 c0.59 c0.26v/s Ratio Perm c0.03v/c Ratio 0.73 0.19 1.05 0.56Uniform Delay, d1 55.9 49.4 29.0 26.9Progression Factor 1.00 1.00 1.00 0.38Incremental Delay, d2 10.7 0.4 40.6 2.3Delay (s) 66.6 49.8 69.6 12.6Level of Service E D E BApproach Delay (s) 55.8 69.6 12.6Approach LOS E E B
Intersection SummaryHCM 2000 Control Delay 53.3 HCM 2000 Level of Service DHCM 2000 Volume to Capacity ratio 0.84Actuated Cycle Length (s) 134.5 Sum of lost time (s) 16.0Intersection Capacity Utilization 77.6% ICU Level of Service DAnalysis Period (min) 15c Critical Lane Group

AOC - Placerville CourthouseExisting+Approved Projects PM (Year 2018)
US 50 Ramps / Placerville Drive / Fair Lane
L T R L T R L T R L T R L T R L T R
Volume 241 937 120 15 362 545 75 175 45 0 1018 0 0 437 0 158 0 280 4,408Average Delay 98.6 60.5 60.5 71.2 27.2 26.5 96.2 96.2 48.2 0.0 69.6 0 0 12.6 0 66.6 0 49.8Total Delay 23,763 56,689 7,260 1,068 9,846 14,443 7,215 16,835 2,169 0 70852.8 0 0 5506.2 0 10,523 0 13944 240,113
54.5Source: CHS Consulting Group, 2014. D
WB US 50 Off RampNB Placerville Dr SB Placerville Dr WB Fair Lane NB Placerville Dr SB Placerville Dr
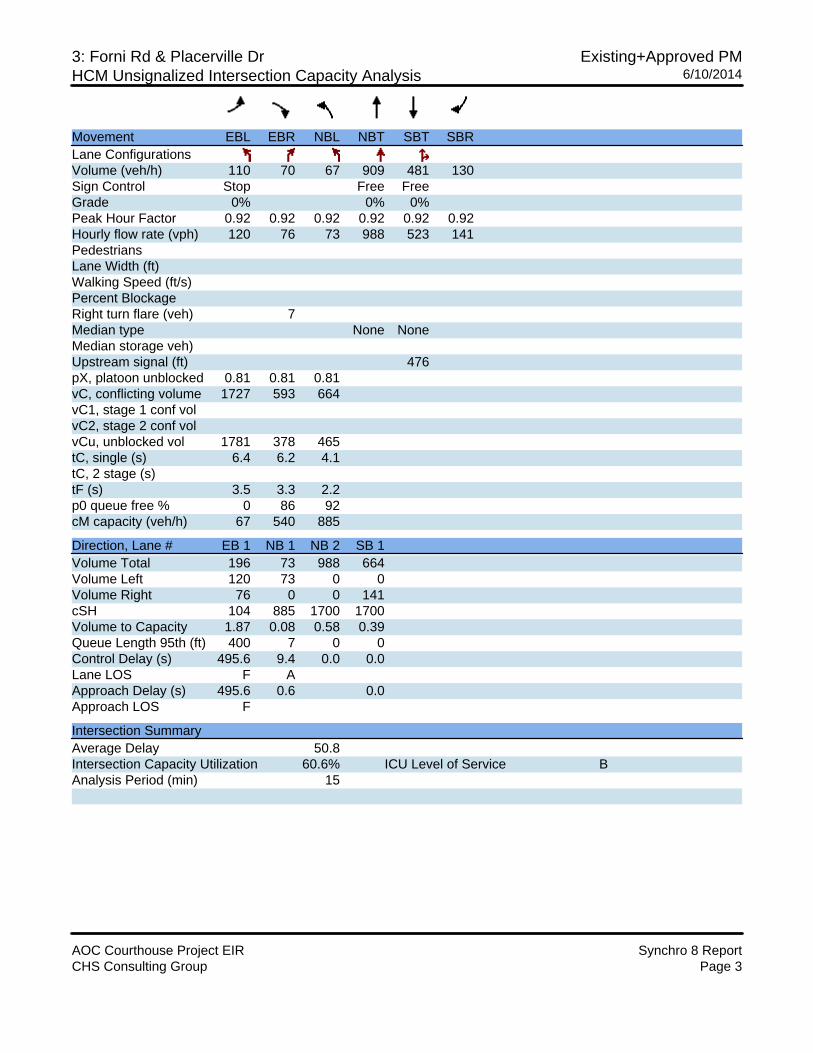
3: Forni Rd & Placerville Dr Existing+Approved PMHCM Unsignalized Intersection Capacity Analysis 6/10/2014
AOC Courthouse Project EIR Synchro 8 ReportCHS Consulting Group Page 3
Movement EBL EBR NBL NBT SBT SBRLane ConfigurationsVolume (veh/h) 110 70 67 909 481 130Sign Control Stop Free FreeGrade 0% 0% 0%Peak Hour Factor 0.92 0.92 0.92 0.92 0.92 0.92Hourly flow rate (vph) 120 76 73 988 523 141PedestriansLane Width (ft)Walking Speed (ft/s)Percent BlockageRight turn flare (veh) 7Median type None NoneMedian storage veh)Upstream signal (ft) 476pX, platoon unblocked 0.81 0.81 0.81vC, conflicting volume 1727 593 664vC1, stage 1 conf volvC2, stage 2 conf volvCu, unblocked vol 1781 378 465tC, single (s) 6.4 6.2 4.1tC, 2 stage (s)tF (s) 3.5 3.3 2.2p0 queue free % 0 86 92cM capacity (veh/h) 67 540 885
Direction, Lane # EB 1 NB 1 NB 2 SB 1Volume Total 196 73 988 664Volume Left 120 73 0 0Volume Right 76 0 0 141cSH 104 885 1700 1700Volume to Capacity 1.87 0.08 0.58 0.39Queue Length 95th (ft) 400 7 0 0Control Delay (s) 495.6 9.4 0.0 0.0Lane LOS F AApproach Delay (s) 495.6 0.6 0.0Approach LOS F
Intersection SummaryAverage Delay 50.8Intersection Capacity Utilization 60.6% ICU Level of Service BAnalysis Period (min) 15

4: Lo Hi Way/SR EB Off Ramp & Forni Rd Existing+Approved PMHCM Unsignalized Intersection Capacity Analysis 6/10/2014
AOC Courthouse Project EIR Synchro 8 ReportCHS Consulting Group Page 4
Movement EBL EBT EBR WBL WBT WBR NBL NBT NBR SBL SBT SBRLane ConfigurationsSign Control Stop Stop Stop StopVolume (vph) 310 151 95 25 206 205 145 75 20 67 85 625Peak Hour Factor 0.92 0.92 0.92 0.92 0.92 0.92 0.92 0.92 0.92 0.92 0.92 0.92Hourly flow rate (vph) 337 164 103 27 224 223 158 82 22 73 92 679
Direction, Lane # EB 1 EB 2 WB 1 WB 2 NB 1 SB 1 SB 2Volume Total (vph) 337 267 251 223 261 165 679Volume Left (vph) 337 0 27 0 158 73 0Volume Right (vph) 0 103 0 223 22 0 679Hadj (s) 0.53 -0.24 0.06 -0.57 0.10 0.12 -0.57Departure Headway (s) 7.1 6.3 6.6 3.2 6.8 7.1 3.2Degree Utilization, x 0.66 0.47 0.46 0.20 0.49 0.32 0.60Capacity (veh/h) 494 558 499 1121 493 446 1118Control Delay (s) 21.5 13.4 15.2 7.0 16.1 13.4 11.0Approach Delay (s) 17.9 11.3 16.1 11.4Approach LOS C B C B
Intersection SummaryDelay 13.8Level of Service BIntersection Capacity Utilization 74.1% ICU Level of Service DAnalysis Period (min) 15

5: Forni Rd & US 50 EB Off Ramp & Ray Lawyer Dr Existing+Approved PMHCM Unsignalized Intersection Capacity Analysis 12/31/2014
AOC Courthouse Project EIR Synchro 8 ReportCHS Consulting Group Page 1
Movement EBL EBT EBR WBL WBT WBR NBL NBT NBR SBL SBT SBRLane ConfigurationsVolume (veh/h) 170 11 33 36 0 55 0 244 143 140 86 0Sign Control Stop Stop Free FreeGrade 0% 0% 0% 0%Peak Hour Factor 0.92 0.92 0.92 0.92 0.92 0.92 0.92 0.92 0.92 0.92 0.92 0.92Hourly flow rate (vph) 185 12 36 39 0 60 0 265 155 152 93 0PedestriansLane Width (ft)Walking Speed (ft/s)Percent BlockageRight turn flare (veh)Median type None NoneMedian storage veh)Upstream signal (ft)pX, platoon unblockedvC, conflicting volume 663 663 93 705 663 265 93 265vC1, stage 1 conf volvC2, stage 2 conf volvCu, unblocked vol 663 663 93 705 663 265 93 265tC, single (s) 7.1 6.5 6.2 7.1 6.5 6.2 4.1 4.1tC, 2 stage (s)tF (s) 3.5 4.0 3.3 3.5 4.0 3.3 2.2 2.2p0 queue free % 42 96 96 87 100 92 100 88cM capacity (veh/h) 317 340 969 302 340 778 1514 1310
Direction, Lane # EB 1 EB 2 WB 1 WB 2 NB 1 NB 2 SB 1 SB 2Volume Total 185 48 39 60 265 155 152 93Volume Left 185 0 39 0 0 0 152 0Volume Right 0 36 0 60 0 155 0 0cSH 317 662 302 778 1700 1700 1310 1700Volume to Capacity 0.58 0.07 0.13 0.08 0.16 0.09 0.12 0.05Queue Length 95th (ft) 86 6 11 6 0 0 10 0Control Delay (s) 31.0 10.9 18.7 10.0 0.0 0.0 8.1 0.0Lane LOS D B C B AApproach Delay (s) 26.9 13.4 0.0 5.0Approach LOS D B
Intersection SummaryAverage Delay 8.8Intersection Capacity Utilization 40.6% ICU Level of Service AAnalysis Period (min) 15

6: Ray Lawyer Dr & Fair Lane Existing+Approved PMHCM Unsignalized Intersection Capacity Analysis 6/10/2014
AOC Courthouse Project EIR Synchro 8 ReportCHS Consulting Group Page 6
Movement EBL EBR NBL NBT SBT SBRLane ConfigurationsSign Control Stop Stop StopVolume (vph) 125 230 240 61 263 15Peak Hour Factor 0.92 0.92 0.92 0.92 0.92 0.92Hourly flow rate (vph) 136 250 261 66 286 16
Direction, Lane # EB 1 EB 2 NB 1 NB 2 SB 1 SB 2Volume Total (vph) 136 250 261 66 286 16Volume Left (vph) 136 0 261 0 0 0Volume Right (vph) 0 250 0 0 0 16Hadj (s) 0.53 -0.67 0.53 0.03 0.03 -0.67Departure Headway (s) 6.8 5.6 6.6 6.1 6.2 5.5Degree Utilization, x 0.26 0.39 0.48 0.11 0.49 0.02Capacity (veh/h) 501 607 518 561 562 622Control Delay (s) 10.9 10.9 14.3 8.7 13.7 7.4Approach Delay (s) 10.9 13.2 13.4Approach LOS B B B
Intersection SummaryDelay 12.4Level of Service BIntersection Capacity Utilization 44.1% ICU Level of Service AAnalysis Period (min) 15

7: Jail Driveway & Forni Rd Existing+Approved PMHCM Unsignalized Intersection Capacity Analysis 6/10/2014
AOC Courthouse Project EIR Synchro 8 ReportCHS Consulting Group Page 7
Movement EBT EBR WBL WBT NBL NBRLane ConfigurationsVolume (veh/h) 419 76 49 158 379 177Sign Control Free Free StopGrade 0% 0% 0%Peak Hour Factor 0.92 0.92 0.92 0.92 0.92 0.92Hourly flow rate (vph) 455 83 53 172 412 192PedestriansLane Width (ft)Walking Speed (ft/s)Percent BlockageRight turn flare (veh) 2Median type None NoneMedian storage veh)Upstream signal (ft)pX, platoon unblockedvC, conflicting volume 538 734 455vC1, stage 1 conf volvC2, stage 2 conf volvCu, unblocked vol 538 734 455tC, single (s) 4.1 6.4 6.2tC, 2 stage (s)tF (s) 2.2 3.5 3.3p0 queue free % 95 0 68cM capacity (veh/h) 1030 367 605
Direction, Lane # EB 1 EB 2 WB 1 NB 1Volume Total 455 83 225 604Volume Left 0 0 53 412Volume Right 0 83 0 192cSH 1700 1700 1030 437Volume to Capacity 0.27 0.05 0.05 1.38Queue Length 95th (ft) 0 0 4 720Control Delay (s) 0.0 0.0 2.4 211.6Lane LOS A FApproach Delay (s) 0.0 2.4 211.6Approach LOS F
Intersection SummaryAverage Delay 93.9Intersection Capacity Utilization 64.1% ICU Level of Service CAnalysis Period (min) 15

8: Ray Lawyer Dr & US 50 WB On Ramp Existing+Approved PMHCM Unsignalized Intersection Capacity Analysis 6/10/2014
AOC Courthouse Project EIR Synchro 8 ReportCHS Consulting Group Page 8
Movement EBL EBR NBL NBT SBT SBRLane ConfigurationsVolume (veh/h) 0 0 144 325 219 350Sign Control Stop Free FreeGrade 0% 0% 0%Peak Hour Factor 0.92 0.92 0.92 0.92 0.92 0.92Hourly flow rate (vph) 0 0 157 353 238 380PedestriansLane Width (ft)Walking Speed (ft/s)Percent BlockageRight turn flare (veh)Median type None NoneMedian storage veh)Upstream signal (ft)pX, platoon unblockedvC, conflicting volume 904 238 618vC1, stage 1 conf volvC2, stage 2 conf volvCu, unblocked vol 904 238 618tC, single (s) 6.4 6.2 4.1tC, 2 stage (s)tF (s) 3.5 3.3 2.2p0 queue free % 100 100 84cM capacity (veh/h) 257 801 962
Direction, Lane # NB 1 NB 2 SB 1 SB 2Volume Total 157 353 238 380Volume Left 157 0 0 0Volume Right 0 0 0 380cSH 962 1700 1700 1700Volume to Capacity 0.16 0.21 0.14 0.22Queue Length 95th (ft) 14 0 0 0Control Delay (s) 9.5 0.0 0.0 0.0Lane LOS AApproach Delay (s) 2.9 0.0Approach LOS
Intersection SummaryAverage Delay 1.3Intersection Capacity Utilization 36.3% ICU Level of Service AAnalysis Period (min) 15

1: Placerville Rd/SR 50 WB On Ramp & Fair Lane Existing+App+Project AMHCM Signalized Intersection Capacity Analysis 12/10/2014
AOC Courthouse Project EIR Synchro 8 ReportCHS Consulting Group Page 1
Movement EBL EBT EBR WBL WBT WBR NBL NBT NBR SBL SBT SBRLane ConfigurationsVolume (vph) 0 0 0 25 60 20 106 706 110 20 356 340Ideal Flow (vphpl) 1900 1900 1900 1900 1900 1900 1900 1900 1900 1900 1900 1900Total Lost time (s) 4.0 4.0 4.0 4.0 4.0 4.0 4.0Lane Util. Factor 1.00 1.00 1.00 1.00 1.00 1.00 1.00Frt 1.00 0.85 1.00 0.98 1.00 1.00 0.85Flt Protected 0.99 1.00 0.95 1.00 0.95 1.00 1.00Satd. Flow (prot) 1836 1583 1770 1825 1770 1863 1583Flt Permitted 0.99 1.00 0.95 1.00 0.95 1.00 1.00Satd. Flow (perm) 1836 1583 1770 1825 1770 1863 1583Peak-hour factor, PHF 0.92 0.92 0.92 0.92 0.92 0.92 0.92 0.92 0.92 0.92 0.92 0.92Adj. Flow (vph) 0 0 0 27 65 22 115 767 120 22 387 370RTOR Reduction (vph) 0 0 0 0 0 20 0 4 0 0 0 196Lane Group Flow (vph) 0 0 0 0 92 2 115 883 0 22 387 174Turn Type Perm NA Perm Prot NA Prot NA PermProtected Phases 8 5 2 1 6Permitted Phases 8 8 6Actuated Green, G (s) 12.5 12.5 14.6 71.1 4.7 61.2 61.2Effective Green, g (s) 12.5 12.5 14.6 71.1 4.7 61.2 61.2Actuated g/C Ratio 0.10 0.10 0.11 0.55 0.04 0.47 0.47Clearance Time (s) 4.0 4.0 4.0 4.0 4.0 4.0 4.0Vehicle Extension (s) 3.0 3.0 3.0 3.0 3.0 3.0 3.0Lane Grp Cap (vph) 175 151 198 995 63 874 742v/s Ratio Prot 0.06 c0.48 0.01 c0.21v/s Ratio Perm 0.05 0.00 0.11v/c Ratio 0.53 0.01 0.58 0.89 0.35 0.44 0.23Uniform Delay, d1 56.1 53.4 55.0 26.1 61.4 23.2 20.6Progression Factor 1.00 1.00 0.74 0.47 1.00 1.00 1.00Incremental Delay, d2 2.8 0.0 3.3 9.2 3.3 1.6 0.7Delay (s) 59.0 53.4 43.9 21.4 64.7 24.8 21.4Level of Service E D D C E C CApproach Delay (s) 0.0 57.9 24.0 24.3Approach LOS A E C C
Intersection SummaryHCM 2000 Control Delay 26.2 HCM 2000 Level of Service CHCM 2000 Volume to Capacity ratio 0.63Actuated Cycle Length (s) 130.4 Sum of lost time (s) 16.0Intersection Capacity Utilization 61.7% ICU Level of Service BAnalysis Period (min) 15c Critical Lane Group

2: Placerville Dr/Placerville Rd & SR 50 WB Off Ramp Existing+App+Project AMHCM Signalized Intersection Capacity Analysis 12/10/2014
AOC Courthouse Project EIR Synchro 8 ReportCHS Consulting Group Page 2
Movement WBL WBR NBT NBR SBL SBTLane ConfigurationsVolume (vph) 308 295 629 0 0 385Ideal Flow (vphpl) 1900 1900 1900 1900 1900 1900Total Lost time (s) 4.0 4.0 4.0 4.0Lane Util. Factor 1.00 1.00 1.00 1.00Frt 1.00 0.85 1.00 1.00Flt Protected 0.95 1.00 1.00 1.00Satd. Flow (prot) 1770 1583 1863 1863Flt Permitted 0.95 1.00 1.00 1.00Satd. Flow (perm) 1770 1583 1863 1863Peak-hour factor, PHF 0.92 0.92 0.92 0.92 0.92 0.92Adj. Flow (vph) 335 321 684 0 0 418RTOR Reduction (vph) 0 288 0 0 0 0Lane Group Flow (vph) 335 33 684 0 0 418Turn Type Prot Perm NA NAProtected Phases 7 2 6Permitted Phases 8Actuated Green, G (s) 26.1 12.5 71.1 61.2Effective Green, g (s) 26.1 12.5 71.1 61.2Actuated g/C Ratio 0.20 0.10 0.55 0.47Clearance Time (s) 4.0 4.0 4.0 4.0Vehicle Extension (s) 3.0 3.0 3.0 3.0Lane Grp Cap (vph) 354 151 1015 874v/s Ratio Prot c0.19 c0.37 c0.22v/s Ratio Perm c0.02v/c Ratio 0.95 0.22 0.67 0.48Uniform Delay, d1 51.5 54.4 21.3 23.7Progression Factor 1.00 1.00 1.00 0.20Incremental Delay, d2 33.8 0.7 3.6 1.7Delay (s) 85.2 55.1 24.9 6.4Level of Service F E C AApproach Delay (s) 70.5 24.9 6.4Approach LOS E C A
Intersection SummaryHCM 2000 Control Delay 37.5 HCM 2000 Level of Service DHCM 2000 Volume to Capacity ratio 0.68Actuated Cycle Length (s) 130.4 Sum of lost time (s) 16.0Intersection Capacity Utilization 58.0% ICU Level of Service BAnalysis Period (min) 15c Critical Lane Group

AOC - Placerville CourthouseExisting+Approved+Project AM (Year 2018)
US 50 Ramps / Placerville Drive / Fair Lane
L T R L T R L T R L T R L T R L T R
Volume 106 706 110 20 356 340 25 60 20 0 629 0 0 385 0 308 0 295 3,360Average Delay 44.5 22.1 22.4 64.8 25.0 21.5 58.6 58.6 53.3 0.0 24.8 0 0 6.5 0 94.4 0 55.7Total Delay 4,717 15,603 2,464 1,296 8,900 7,310 1,465 3,516 1,066 0 15599 0 0 2503 0 29,075 0 16432 109,945
32.7Source: CHS Consulting Group, 2014. C
WB US 50 Off RampNB Placerville Dr SB Placerville Dr WB Fair Lane NB Placerville Dr SB Placerville Dr

3: Forni Rd & Placerville Dr Existing+App+Project AMHCM Unsignalized Intersection Capacity Analysis 12/10/2014
AOC Courthouse Project EIR Synchro 8 ReportCHS Consulting Group Page 3
Movement EBL EBR NBL NBT SBT SBRLane ConfigurationsVolume (veh/h) 50 70 39 579 712 60Sign Control Stop Free FreeGrade 0% 0% 0%Peak Hour Factor 0.92 0.92 0.92 0.92 0.92 0.92Hourly flow rate (vph) 54 76 42 629 774 65PedestriansLane Width (ft)Walking Speed (ft/s)Percent BlockageRight turn flare (veh) 7Median type None NoneMedian storage veh)Upstream signal (ft) 476pX, platoon unblocked 0.84 0.84 0.84vC, conflicting volume 1521 807 839vC1, stage 1 conf volvC2, stage 2 conf volvCu, unblocked vol 1525 677 716tC, single (s) 6.4 6.2 4.1tC, 2 stage (s)tF (s) 3.5 3.3 2.2p0 queue free % 48 80 94cM capacity (veh/h) 104 384 753Direction, Lane # EB 1 NB 1 NB 2 SB 1Volume Total 130 42 629 839Volume Left 54 42 0 0Volume Right 76 0 0 65cSH 250 753 1700 1700Volume to Capacity 0.52 0.06 0.37 0.49Queue Length 95th (ft) 69 4 0 0Control Delay (s) 39.7 10.1 0.0 0.0Lane LOS E BApproach Delay (s) 39.7 0.6 0.0Approach LOS EIntersection SummaryAverage Delay 3.4Intersection Capacity Utilization 52.1% ICU Level of Service AAnalysis Period (min) 15

4: Lo Hi Way/SR EB Off Ramp & Forni Rd Existing+App+Project AMHCM Unsignalized Intersection Capacity Analysis 12/31/2014
AOC Courthouse Project EIR Synchro 8 ReportCHS Consulting Group Page 1
Movement EBL EBT EBR WBL WBT WBR NBL NBT NBR SBL SBT SBRLane ConfigurationsSign Control Stop Stop Stop StopVolume (vph) 225 432 125 15 103 58 85 25 30 217 46 430Peak Hour Factor 0.92 0.92 0.92 0.92 0.92 0.92 0.92 0.92 0.92 0.92 0.92 0.92Hourly flow rate (vph) 245 470 136 16 112 63 92 27 33 236 50 467
Direction, Lane # EB 1 EB 2 WB 1 WB 2 NB 1 SB 1 SB 2Volume Total (vph) 245 605 128 63 152 286 467Volume Left (vph) 245 0 16 0 92 236 0Volume Right (vph) 0 136 0 63 33 0 467Hadj (s) 0.53 -0.12 0.06 -0.57 0.03 0.20 -0.57Departure Headway (s) 6.8 6.2 6.8 3.2 6.9 6.7 3.2Degree Utilization, x 0.46 1.0 0.24 0.06 0.29 0.53 0.42Capacity (veh/h) 522 588 495 1121 498 524 1115Control Delay (s) 14.4 70.5 12.0 6.4 12.7 17.0 8.5Approach Delay (s) 54.4 10.1 12.7 11.7Approach LOS F B B B
Intersection SummaryDelay 30.3Level of Service DIntersection Capacity Utilization 56.6% ICU Level of Service BAnalysis Period (min) 15

5: Forni Rd & US 50 EB Off Ramp & Ray Lawyer Dr Existing+App+Project AMHCM Unsignalized Intersection Capacity Analysis 12/18/2014
AOC Courthouse Project EIR Synchro 8 ReportCHS Consulting Group Page 1
Movement EBL EBT EBR WBL WBT WBR NBL NBT NBR SBL SBT SBRLane ConfigurationsVolume (veh/h) 200 12 193 120 0 50 0 147 50 65 82 0Sign Control Stop Stop Free FreeGrade 0% 0% 0% 0%Peak Hour Factor 0.92 0.92 0.92 0.92 0.92 0.92 0.92 0.92 0.92 0.92 0.92 0.92Hourly flow rate (vph) 217 13 210 130 0 54 0 160 54 71 89 0PedestriansLane Width (ft)Walking Speed (ft/s)Percent BlockageRight turn flare (veh)Median type None NoneMedian storage veh)Upstream signal (ft)pX, platoon unblockedvC, conflicting volume 445 445 89 607 390 160 89 214vC1, stage 1 conf volvC2, stage 2 conf volvCu, unblocked vol 445 445 89 607 390 160 89 214tC, single (s) 7.1 6.5 6.2 7.1 6.5 6.2 4.1 4.1tC, 2 stage (s)tF (s) 3.5 4.0 3.3 3.5 4.0 3.3 2.2 2.2p0 queue free % 54 97 78 57 100 94 100 95cM capacity (veh/h) 472 482 969 301 517 885 1506 1356Direction, Lane # EB 1 EB 2 WB 1 WB 2 NB 1 NB 2 SB 1 SB 2Volume Total 217 223 130 54 160 54 71 89Volume Left 217 0 130 0 0 0 71 0Volume Right 0 210 0 54 0 54 0 0cSH 472 915 301 885 1700 1700 1356 1700Volume to Capacity 0.46 0.24 0.43 0.06 0.09 0.03 0.05 0.05Queue Length 95th (ft) 60 24 52 5 0 0 4 0Control Delay (s) 19.0 10.2 25.8 9.3 0.0 0.0 7.8 0.0Lane LOS C B D A AApproach Delay (s) 14.5 20.9 0.0 3.4Approach LOS B CIntersection SummaryAverage Delay 10.8Intersection Capacity Utilization 43.9% ICU Level of Service AAnalysis Period (min) 15

6: Ray Lawyer Dr & Fair Lane Existing+App+Project AMHCM Unsignalized Intersection Capacity Analysis 12/10/2014
AOC Courthouse Project EIR Synchro 8 ReportCHS Consulting Group Page 6
Movement EBL EBR NBL NBT SBT SBRLane ConfigurationsSign Control Stop Stop StopVolume (vph) 20 125 170 91 161 80Peak Hour Factor 0.92 0.92 0.92 0.92 0.92 0.92Hourly flow rate (vph) 22 136 185 99 175 87Direction, Lane # EB 1 EB 2 NB 1 NB 2 SB 1 SB 2Volume Total (vph) 22 136 185 99 175 87Volume Left (vph) 22 0 185 0 0 0Volume Right (vph) 0 136 0 0 0 87Hadj (s) 0.53 -0.67 0.53 0.03 0.03 -0.67Departure Headway (s) 6.3 5.1 5.7 5.2 5.3 4.6Degree Utilization, x 0.04 0.19 0.29 0.14 0.26 0.11Capacity (veh/h) 528 650 609 663 656 753Control Delay (s) 8.4 8.1 9.9 7.9 8.9 6.9Approach Delay (s) 8.2 9.2 8.2Approach LOS A A AIntersection SummaryDelay 8.6Level of Service AIntersection Capacity Utilization 31.2% ICU Level of Service AAnalysis Period (min) 15
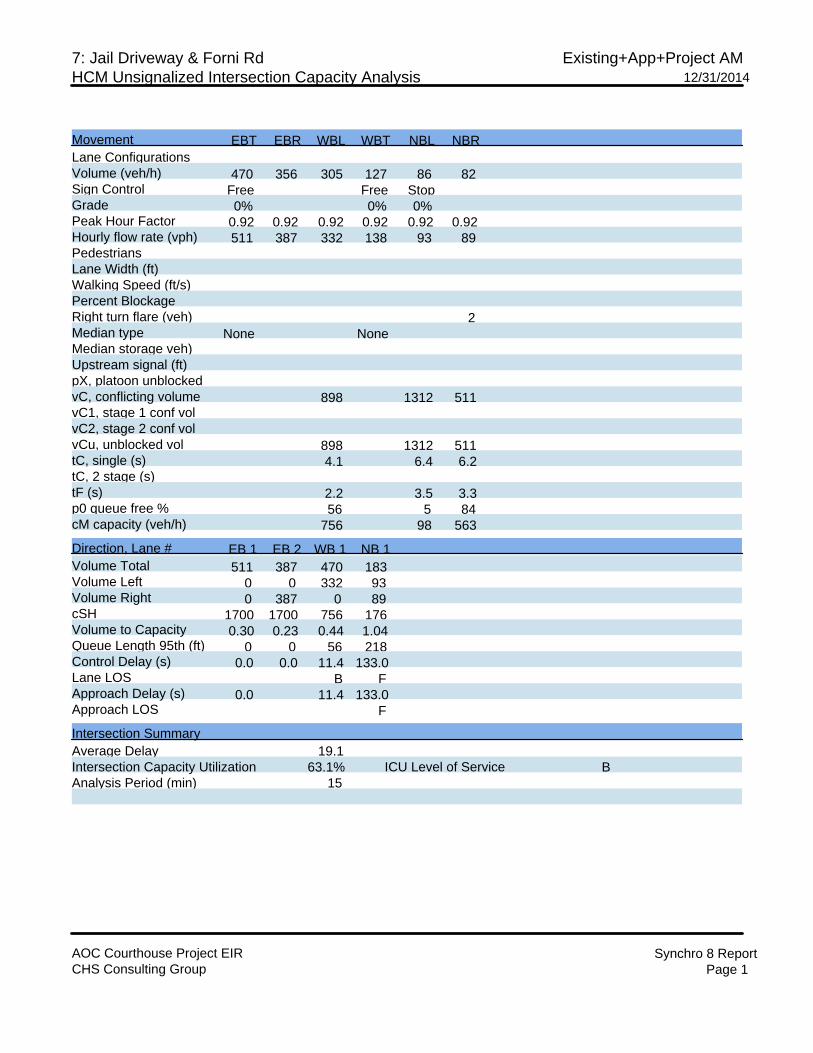
7: Jail Driveway & Forni Rd Existing+App+Project AMHCM Unsignalized Intersection Capacity Analysis 12/31/2014
AOC Courthouse Project EIR Synchro 8 ReportCHS Consulting Group Page 1
Movement EBT EBR WBL WBT NBL NBRLane ConfigurationsVolume (veh/h) 470 356 305 127 86 82Sign Control Free Free StopGrade 0% 0% 0%Peak Hour Factor 0.92 0.92 0.92 0.92 0.92 0.92Hourly flow rate (vph) 511 387 332 138 93 89PedestriansLane Width (ft)Walking Speed (ft/s)Percent BlockageRight turn flare (veh) 2Median type None NoneMedian storage veh)Upstream signal (ft)pX, platoon unblockedvC, conflicting volume 898 1312 511vC1, stage 1 conf volvC2, stage 2 conf volvCu, unblocked vol 898 1312 511tC, single (s) 4.1 6.4 6.2tC, 2 stage (s)tF (s) 2.2 3.5 3.3p0 queue free % 56 5 84cM capacity (veh/h) 756 98 563
Direction, Lane # EB 1 EB 2 WB 1 NB 1Volume Total 511 387 470 183Volume Left 0 0 332 93Volume Right 0 387 0 89cSH 1700 1700 756 176Volume to Capacity 0.30 0.23 0.44 1.04Queue Length 95th (ft) 0 0 56 218Control Delay (s) 0.0 0.0 11.4 133.0Lane LOS B FApproach Delay (s) 0.0 11.4 133.0Approach LOS F
Intersection SummaryAverage Delay 19.1Intersection Capacity Utilization 63.1% ICU Level of Service BAnalysis Period (min) 15

8: Ray Lawyer Dr & US 50 WB On Ramp Existing+App+Project AMHCM Unsignalized Intersection Capacity Analysis 12/10/2014
AOC Courthouse Project EIR Synchro 8 ReportCHS Consulting Group Page 8
Movement EBL EBR NBL NBT SBT SBRLane ConfigurationsVolume (veh/h) 0 0 54 343 147 195Sign Control Stop Free FreeGrade 0% 0% 0%Peak Hour Factor 0.92 0.92 0.92 0.92 0.92 0.92Hourly flow rate (vph) 0 0 59 373 160 212PedestriansLane Width (ft)Walking Speed (ft/s)Percent BlockageRight turn flare (veh)Median type None NoneMedian storage veh)Upstream signal (ft)pX, platoon unblockedvC, conflicting volume 650 160 372vC1, stage 1 conf volvC2, stage 2 conf volvCu, unblocked vol 650 160 372tC, single (s) 6.4 6.2 4.1tC, 2 stage (s)tF (s) 3.5 3.3 2.2p0 queue free % 100 100 95cM capacity (veh/h) 412 885 1187Direction, Lane # NB 1 NB 2 SB 1 SB 2Volume Total 59 373 160 212Volume Left 59 0 0 0Volume Right 0 0 0 212cSH 1187 1700 1700 1700Volume to Capacity 0.05 0.22 0.09 0.12Queue Length 95th (ft) 4 0 0 0Control Delay (s) 8.2 0.0 0.0 0.0Lane LOS AApproach Delay (s) 1.1 0.0Approach LOS
Intersection SummaryAverage Delay 0.6Intersection Capacity Utilization 22.1% ICU Level of Service AAnalysis Period (min) 15

1: Placerville Rd/SR 50 WB On Ramp & Fair Lane Existing+App+Project PMHCM Signalized Intersection Capacity Analysis 12/9/2014
AOC Courthouse Project EIR Synchro 8 ReportCHS Consulting Group Page 1
Movement EBL EBT EBR WBL WBT WBR NBL NBT NBR SBL SBT SBRLane ConfigurationsVolume (vph) 0 0 0 75 175 45 248 939 120 15 362 545Ideal Flow (vphpl) 1900 1900 1900 1900 1900 1900 1900 1900 1900 1900 1900 1900Total Lost time (s) 4.0 4.0 4.0 4.0 4.0 4.0 4.0Lane Util. Factor 1.00 1.00 1.00 1.00 1.00 1.00 1.00Frt 1.00 0.85 1.00 0.98 1.00 1.00 0.85Flt Protected 0.99 1.00 0.95 1.00 0.95 1.00 1.00Satd. Flow (prot) 1835 1583 1770 1831 1770 1863 1583Flt Permitted 0.99 1.00 0.95 1.00 0.95 1.00 1.00Satd. Flow (perm) 1835 1583 1770 1831 1770 1863 1583Peak-hour factor, PHF 0.92 0.92 0.92 0.92 0.92 0.92 0.92 0.92 0.92 0.92 0.92 0.92Adj. Flow (vph) 0 0 0 82 190 49 270 1021 130 16 393 592RTOR Reduction (vph) 0 0 0 0 0 41 0 3 0 0 0 290Lane Group Flow (vph) 0 0 0 0 272 8 270 1148 0 16 393 302Turn Type Perm NA Perm Prot NA Prot NA PermProtected Phases 8 5 2 1 6Permitted Phases 8 8 6Actuated Green, G (s) 21.0 21.0 18.4 76.4 3.1 61.1 61.1Effective Green, g (s) 21.0 21.0 18.4 76.4 3.1 61.1 61.1Actuated g/C Ratio 0.16 0.16 0.14 0.57 0.02 0.45 0.45Clearance Time (s) 4.0 4.0 4.0 4.0 4.0 4.0 4.0Vehicle Extension (s) 3.0 3.0 3.0 3.0 3.0 3.0 3.0Lane Grp Cap (vph) 286 247 242 1040 40 846 719v/s Ratio Prot 0.15 c0.63 0.01 c0.21v/s Ratio Perm 0.15 0.00 0.19v/c Ratio 0.95 0.03 1.12 1.10 0.40 0.46 0.42Uniform Delay, d1 56.2 48.1 58.0 29.0 64.8 25.4 24.8Progression Factor 1.00 1.00 0.69 0.31 1.00 1.00 1.00Incremental Delay, d2 40.0 0.1 69.9 52.4 6.4 1.8 1.8Delay (s) 96.2 48.2 109.8 61.3 71.2 27.2 26.6Level of Service F D F E E C CApproach Delay (s) 0.0 88.9 70.5 27.5Approach LOS A F E C
Intersection SummaryHCM 2000 Control Delay 57.0 HCM 2000 Level of Service EHCM 2000 Volume to Capacity ratio 0.90Actuated Cycle Length (s) 134.5 Sum of lost time (s) 16.0Intersection Capacity Utilization 83.4% ICU Level of Service EAnalysis Period (min) 15c Critical Lane Group

2: Placerville Dr/Placerville Rd & SR 50 WB Off Ramp Existing+App+Project PMHCM Signalized Intersection Capacity Analysis 12/9/2014
AOC Courthouse Project EIR Synchro 8 ReportCHS Consulting Group Page 2
Movement WBL WBR NBT NBR SBL SBTLane ConfigurationsVolume (vph) 158 280 1027 0 0 437Ideal Flow (vphpl) 1900 1900 1900 1900 1900 1900Total Lost time (s) 4.0 4.0 4.0 4.0Lane Util. Factor 1.00 1.00 1.00 1.00Frt 1.00 0.85 1.00 1.00Flt Protected 0.95 1.00 1.00 1.00Satd. Flow (prot) 1770 1583 1863 1863Flt Permitted 0.95 1.00 1.00 1.00Satd. Flow (perm) 1770 1583 1863 1863Peak-hour factor, PHF 0.92 0.92 0.92 0.92 0.92 0.92Adj. Flow (vph) 172 304 1116 0 0 475RTOR Reduction (vph) 0 257 0 0 0 0Lane Group Flow (vph) 172 47 1116 0 0 475Turn Type Prot Perm NA NAProtected Phases 7 2 6Permitted Phases 8Actuated Green, G (s) 18.0 21.0 76.4 61.1Effective Green, g (s) 18.0 21.0 76.4 61.1Actuated g/C Ratio 0.13 0.16 0.57 0.45Clearance Time (s) 4.0 4.0 4.0 4.0Vehicle Extension (s) 3.0 3.0 3.0 3.0Lane Grp Cap (vph) 236 247 1058 846v/s Ratio Prot c0.10 c0.60 c0.26v/s Ratio Perm c0.03v/c Ratio 0.73 0.19 1.05 0.56Uniform Delay, d1 55.9 49.4 29.0 26.9Progression Factor 1.00 1.00 1.00 0.38Incremental Delay, d2 10.7 0.4 43.3 2.3Delay (s) 66.6 49.8 72.4 12.6Level of Service E D E BApproach Delay (s) 55.8 72.4 12.6Approach LOS E E B
Intersection SummaryHCM 2000 Control Delay 54.8 HCM 2000 Level of Service DHCM 2000 Volume to Capacity ratio 0.85Actuated Cycle Length (s) 134.5 Sum of lost time (s) 16.0Intersection Capacity Utilization 78.1% ICU Level of Service DAnalysis Period (min) 15c Critical Lane Group

AOC - Placerville CourthouseExisting+Approved+Project PM (Year 2018)
US 50 Ramps / Placerville Drive / Fair Lane
L T R L T R L T R L T R L T R L T R
Volume 248 939 120 15 362 545 75 175 45 0 1027 0 0 437 0 158 0 280 4,426Average Delay 102.7 60.3 60.3 71.2 27.2 26.5 96.2 96.2 48.2 0.0 70.5 0 0 12.6 0 66.6 0 49.8Total Delay 25,470 56,622 7,236 1,068 9,846 14,443 7,215 16,835 2,169 0 72403.5 0 0 5506.2 0 10,523 0 13944 243,280
54.9Source: CHS Consulting Group, 2014. D
WB US 50 Off RampNB Placerville Dr SB Placerville Dr WB Fair Lane NB Placerville Dr SB Placerville Dr
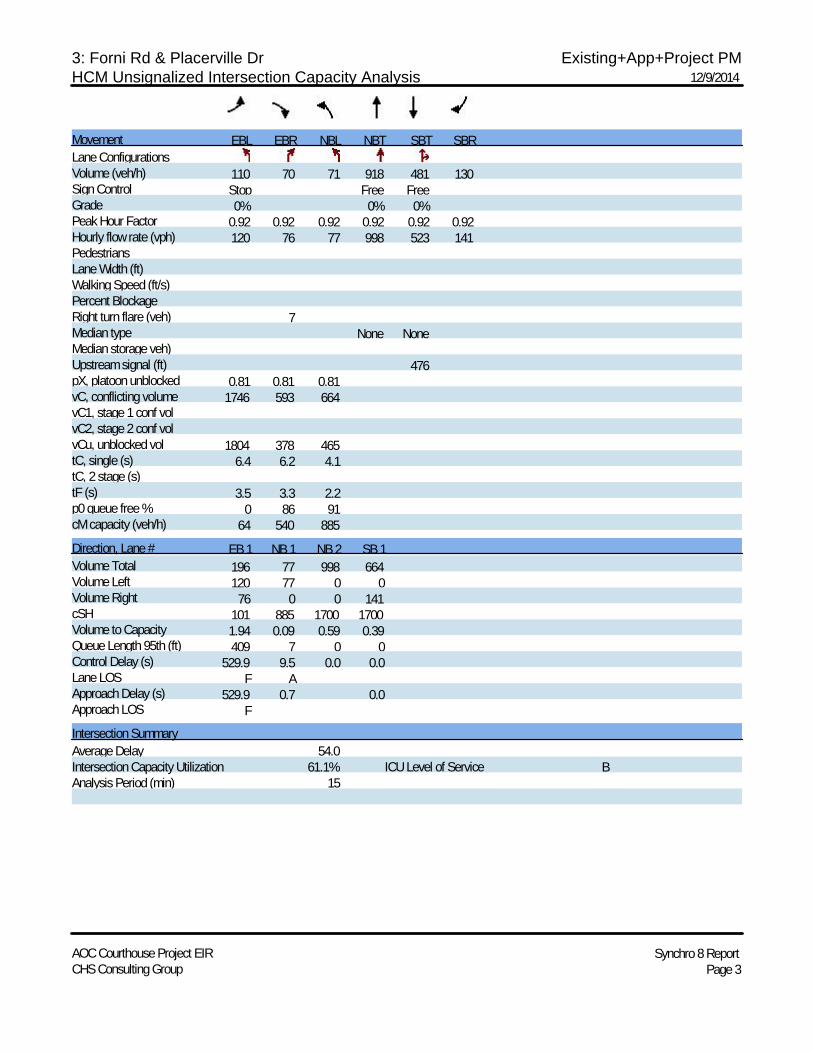
3: Forni Rd & Placerville Dr Existing+App+Project PMHCM Unsignalized Intersection Capacity Analysis 12/9/2014
AOC Courthouse Project EIR Synchro 8 ReportCHS Consulting Group Page 3
Movement EBL EBR NBL NBT SBT SBRLane ConfigurationsVolume (veh/h) 110 70 71 918 481 130Sign Control Stop Free FreeGrade 0% 0% 0%Peak Hour Factor 0.92 0.92 0.92 0.92 0.92 0.92Hourly flow rate (vph) 120 76 77 998 523 141PedestriansLane Width (ft)Walking Speed (ft/s)Percent BlockageRight turn flare (veh) 7Median type None NoneMedian storage veh)Upstream signal (ft) 476pX, platoon unblocked 0.81 0.81 0.81vC, conflicting volume 1746 593 664vC1, stage 1 conf volvC2, stage 2 conf volvCu, unblocked vol 1804 378 465tC, single (s) 6.4 6.2 4.1tC, 2 stage (s)tF (s) 3.5 3.3 2.2p0 queue free % 0 86 91cM capacity (veh/h) 64 540 885Direction, Lane # EB 1 NB 1 NB 2 SB 1Volume Total 196 77 998 664Volume Left 120 77 0 0Volume Right 76 0 0 141cSH 101 885 1700 1700Volume to Capacity 1.94 0.09 0.59 0.39Queue Length 95th (ft) 409 7 0 0Control Delay (s) 529.9 9.5 0.0 0.0Lane LOS F AApproach Delay (s) 529.9 0.7 0.0Approach LOS FIntersection SummaryAverage Delay 54.0Intersection Capacity Utilization 61.1% ICU Level of Service BAnalysis Period (min) 15

4: Lo Hi Way/SR EB Off Ramp & Forni Rd Existing+App+Project PMHCM Unsignalized Intersection Capacity Analysis 12/9/2014
AOC Courthouse Project EIR Synchro 8 ReportCHS Consulting Group Page 4
Movement EBL EBT EBR WBL WBT WBR NBL NBT NBR SBL SBT SBRLane ConfigurationsSign Control Stop Stop Stop StopVolume (vph) 310 151 95 25 219 217 145 75 20 67 85 625Peak Hour Factor 0.92 0.92 0.92 0.92 0.92 0.92 0.92 0.92 0.92 0.92 0.92 0.92Hourly flow rate (vph) 337 164 103 27 238 236 158 82 22 73 92 679Direction, Lane # EB 1 EB 2 WB 1 WB 2 NB 1 SB 1 SB 2Volume Total (vph) 337 267 265 236 261 165 679Volume Left (vph) 337 0 27 0 158 73 0Volume Right (vph) 0 103 0 236 22 0 679Hadj (s) 0.53 -0.24 0.05 -0.57 0.10 0.12 -0.57Departure Headway (s) 7.1 6.3 6.6 3.2 6.8 7.1 3.2Degree Utilization, x 0.66 0.47 0.49 0.21 0.49 0.33 0.60Capacity (veh/h) 491 554 500 1122 488 441 1118Control Delay (s) 21.8 13.6 15.8 7.0 16.3 13.6 11.0Approach Delay (s) 18.2 11.7 16.3 11.5Approach LOS C B C BIntersection SummaryDelay 13.9Level of Service BIntersection Capacity Utilization 74.8% ICU Level of Service DAnalysis Period (min) 15

5: Forni Rd & US 50 EB Off Ramp & Ray Lawyer Dr Existing+App+Project PMHCM Unsignalized Intersection Capacity Analysis 12/18/2014
AOC Courthouse Project EIR Synchro 8 ReportCHS Consulting Group Page 1
Movement EBL EBT EBR WBL WBT WBR NBL NBT NBR SBL SBT SBRLane ConfigurationsVolume (veh/h) 170 11 33 36 0 55 0 300 169 140 86 0Sign Control Stop Stop Free FreeGrade 0% 0% 0% 0%Peak Hour Factor 0.92 0.92 0.92 0.92 0.92 0.92 0.92 0.92 0.92 0.92 0.92 0.92Hourly flow rate (vph) 185 12 36 39 0 60 0 326 184 152 93 0PedestriansLane Width (ft)Walking Speed (ft/s)Percent BlockageRight turn flare (veh)Median type None NoneMedian storage veh)Upstream signal (ft)pX, platoon unblockedvC, conflicting volume 724 724 93 766 724 326 93 326vC1, stage 1 conf volvC2, stage 2 conf volvCu, unblocked vol 724 724 93 766 724 326 93 326tC, single (s) 7.1 6.5 6.2 7.1 6.5 6.2 4.1 4.1tC, 2 stage (s)tF (s) 3.5 4.0 3.3 3.5 4.0 3.3 2.2 2.2p0 queue free % 35 96 96 86 100 92 100 88cM capacity (veh/h) 286 311 969 273 311 720 1514 1245
Direction, Lane # EB 1 EB 2 WB 1 WB 2 NB 1 NB 2 SB 1 SB 2Volume Total 185 48 39 60 326 184 152 93Volume Left 185 0 39 0 0 0 152 0Volume Right 0 36 0 60 0 184 0 0cSH 286 634 273 720 1700 1700 1245 1700Volume to Capacity 0.65 0.08 0.14 0.08 0.19 0.11 0.12 0.05Queue Length 95th (ft) 103 6 12 7 0 0 10 0Control Delay (s) 38.1 11.1 20.4 10.5 0.0 0.0 8.3 0.0Lane LOS E B C B AApproach Delay (s) 32.5 14.4 0.0 5.1Approach LOS D B
Intersection SummaryAverage Delay 9.4Intersection Capacity Utilization 43.5% ICU Level of Service AAnalysis Period (min) 15

6: Ray Lawyer Dr & Fair Lane Existing+App+Project PMHCM Unsignalized Intersection Capacity Analysis 12/9/2014
AOC Courthouse Project EIR Synchro 8 ReportCHS Consulting Group Page 6
Movement EBL EBR NBL NBT SBT SBRLane ConfigurationsSign Control Stop Stop StopVolume (vph) 125 230 240 65 263 15Peak Hour Factor 0.92 0.92 0.92 0.92 0.92 0.92Hourly flow rate (vph) 136 250 261 71 286 16Direction, Lane # EB 1 EB 2 NB 1 NB 2 SB 1 SB 2Volume Total (vph) 136 250 261 71 286 16Volume Left (vph) 136 0 261 0 0 0Volume Right (vph) 0 250 0 0 0 16Hadj (s) 0.53 -0.67 0.53 0.03 0.03 -0.67Departure Headway (s) 6.8 5.6 6.6 6.1 6.2 5.5Degree Utilization, x 0.26 0.39 0.48 0.12 0.49 0.02Capacity (veh/h) 500 606 518 561 561 621Control Delay (s) 11.0 10.9 14.4 8.7 13.8 7.4Approach Delay (s) 10.9 13.2 13.4Approach LOS B B BIntersection SummaryDelay 12.4Level of Service BIntersection Capacity Utilization 44.1% ICU Level of Service AAnalysis Period (min) 15

7: Jail Driveway & Forni Rd Existing+App+Project PMHCM Unsignalized Intersection Capacity Analysis 12/9/2014
AOC Courthouse Project EIR Synchro 8 ReportCHS Consulting Group Page 7
Movement EBT EBR WBL WBT NBL NBRLane ConfigurationsVolume (veh/h) 419 76 49 158 404 261Sign Control Free Free StopGrade 0% 0% 0%Peak Hour Factor 0.92 0.92 0.92 0.92 0.92 0.92Hourly flow rate (vph) 455 83 53 172 439 284PedestriansLane Width (ft)Walking Speed (ft/s)Percent BlockageRight turn flare (veh) 2Median type None NoneMedian storage veh)Upstream signal (ft)pX, platoon unblockedvC, conflicting volume 538 734 455vC1, stage 1 conf volvC2, stage 2 conf volvCu, unblocked vol 538 734 455tC, single (s) 4.1 6.4 6.2tC, 2 stage (s)tF (s) 2.2 3.5 3.3p0 queue free % 95 0 53cM capacity (veh/h) 1030 367 605Direction, Lane # EB 1 EB 2 WB 1 NB 1Volume Total 455 83 225 723Volume Left 0 0 53 439Volume Right 0 83 0 284cSH 1700 1700 1030 452Volume to Capacity 0.27 0.05 0.05 1.60Queue Length 95th (ft) 0 0 4 1013Control Delay (s) 0.0 0.0 2.4 302.0Lane LOS A FApproach Delay (s) 0.0 2.4 302.0Approach LOS FIntersection SummaryAverage Delay 147.3Intersection Capacity Utilization 65.5% ICU Level of Service CAnalysis Period (min) 15

8: Ray Lawyer Dr & US 50 WB On Ramp Existing+App+Project PMHCM Unsignalized Intersection Capacity Analysis 12/9/2014
AOC Courthouse Project EIR Synchro 8 ReportCHS Consulting Group Page 8
Movement EBL EBR NBL NBT SBT SBRLane ConfigurationsVolume (veh/h) 0 0 196 329 219 350Sign Control Stop Free FreeGrade 0% 0% 0%Peak Hour Factor 0.92 0.92 0.92 0.92 0.92 0.92Hourly flow rate (vph) 0 0 213 358 238 380PedestriansLane Width (ft)Walking Speed (ft/s)Percent BlockageRight turn flare (veh)Median type None NoneMedian storage veh)Upstream signal (ft)pX, platoon unblockedvC, conflicting volume 1022 238 618vC1, stage 1 conf volvC2, stage 2 conf volvCu, unblocked vol 1022 238 618tC, single (s) 6.4 6.2 4.1tC, 2 stage (s)tF (s) 3.5 3.3 2.2p0 queue free % 100 100 78cM capacity (veh/h) 204 801 962Direction, Lane # NB 1 NB 2 SB 1 SB 2Volume Total 213 358 238 380Volume Left 213 0 0 0Volume Right 0 0 0 380cSH 962 1700 1700 1700Volume to Capacity 0.22 0.21 0.14 0.22Queue Length 95th (ft) 21 0 0 0Control Delay (s) 9.8 0.0 0.0 0.0Lane LOS AApproach Delay (s) 3.7 0.0Approach LOS
Intersection SummaryAverage Delay 1.8Intersection Capacity Utilization 39.2% ICU Level of Service AAnalysis Period (min) 15

AOC Placerville Courthouse EIRVISSIM Post‐Processor ‐ Average Results from 5 RunsCumulative Year 2045 ‐ AM Peak Hour (No Project)
Delay(s) Volume Delay(s) Volume Delay(s) Volume Delay(s) Volume Delay(s) VolumeRight 2 2 136 3 112 2.6 125 2.7 136 2.6 132 2.6Total 2 136 3 112 2.6 125 2.7 136 2.6 132 2.5U‐turn Marke 1.8 166 1.6 161 1.6 183 1.7 160 1.9 166 1.7Left 2 1.5 686 1.6 670 1.4 634 1.5 660 1.7 621 1.5Right 1 1.5 207 1.7 231 1.6 237 1.8 248 2 272 1.7Total 1.5 1059 1.6 1062 1.5 1054 1.6 1068 1.8 1059 1.6Left 2 6.5 38 7.7 34 4.1 21 5.8 41 6.9 44 6.4Left 1 0 4 0.2 4 0.4 4 0 4 0 4 0.1Through 5.4 498 6.2 489 5.4 478 5 452 5.5 472 5.5Right 1 1.4 489 1.4 510 1.5 526 1.6 526 1.3 513 1.4Total 3.5 1029 3.9 1037 3.4 1029 3.3 1023 3.5 1033 3.5Left 2 4.7 18 3.1 21 3.7 19 2.5 12 4 29 3.7Left 1 4 92 3.1 92 3.5 92 3.6 99 3.3 90 3.5Right 1 2.8 23 1.2 18 2.3 20 1.7 21 2.1 13 2.1Total 3.9 133 2.8 131 3.3 131 3.2 132 3.3 132 3.4Left 3 13.5 142 15.1 161 10.6 156 13.8 156 13 153 13.2Through 6.9 176 9.6 183 7 172 9.3 164 7.4 162 8.1Right 1 0 4 0 4 0 5 0 4 0 4 0Total 9.7 322 12 348 8.6 333 11.4 324 10 319 10.4
Total 3.4 2679 3.9 2690 3.3 2672 3.6 2683 3.5 2675 A 3.5Left 3 6.1 208 7 191 5.9 200 8.3 197 7 204 6.9Right 1 5.9 73 5.5 85 5.9 78 9.9 81 5.9 77 6.7Total 6 281 6.5 276 5.9 278 8.8 278 6.7 281 6.7Left 1 3.9 280 3.4 280 4.5 292 2.6 305 2.6 290 3.4Right 1 3.1 363 3 368 3.2 352 3.2 314 3.3 341 3.2Right 3 3.4 126 4.3 114 3.6 114 3.1 137 3.6 138 3.6Total 3.4 769 3.3 762 3.8 758 2.9 756 3.1 769 3.4Left 3 3.6 213 4.1 254 3.9 232 3.8 251 3.8 256 3.8Left 1 3.4 117 3.8 103 3.9 117 3.8 103 4.4 117 3.8Right 1 1.9 724 1.8 687 1.8 702 2 697 1.8 680 1.9Total 2.4 1054 2.6 1044 2.5 1051 2.6 1051 2.6 1053 2.6Left 3 3.8 15 5.4 18 2.2 23 2.1 21 3.2 14 3.2Left 1 2.6 115 2.9 112 3.2 121 3.3 112 2.7 117 2.9Total 2.7 130 3.2 130 3 144 3.1 133 2.8 131 3Right 2 1.6 74 1.5 76 1.2 60 1.7 71 1.9 74 1.6Total 1.6 74 1.5 76 1.2 60 1.7 71 1.9 74 1.6
Total 3.2 2308 3.3 2288 3.3 2291 3.5 2289 3.3 2308 A 3.3
Average(s)Intersection Approach Movement
Run1 2 3 4
Delay
NB
EB
SB
WB
NWB
US 50 EB Ramps‐Lo‐Hi Way/Forni Rd
NB
NEB
SB
WB
NWB
Placerville Dr/US 50 WB Off‐Ramp‐Fair
Ln
5LOS
Sources: Fehr Peers, March 2014; CHS Consulting Group, 2014.

3: Forni Rd & Placerville Dr Cumulative (2045) AM PeakHCM Unsignalized Intersection Capacity Analysis 4/28/2014
AOC Courthouse Project EIR Synchro 8 ReportCHS Consulting Group Page 1
Movement EBL EBR NBL NBT SBT SBRLane ConfigurationsVolume (veh/h) 0 190 69 1040 570 160Sign Control Stop Free FreeGrade 0% 0% 0%Peak Hour Factor 0.92 0.92 0.92 0.92 0.92 0.92Hourly flow rate (vph) 0 207 75 1130 620 174PedestriansLane Width (ft)Walking Speed (ft/s)Percent BlockageRight turn flare (veh)Median type None NoneMedian storage veh)Upstream signal (ft) 476pX, platoon unblockedvC, conflicting volume 1987 397 793vC1, stage 1 conf volvC2, stage 2 conf volvCu, unblocked vol 1987 397 793tC, single (s) 6.8 6.9 4.1tC, 2 stage (s)tF (s) 3.5 3.3 2.2p0 queue free % 100 66 91cM capacity (veh/h) 48 603 823
Direction, Lane # EB 1 NB 1 NB 2 SB 1 SB 2Volume Total 207 75 1130 413 380Volume Left 0 75 0 0 0Volume Right 207 0 0 0 174cSH 603 823 1700 1700 1700Volume to Capacity 0.34 0.09 0.66 0.24 0.22Queue Length 95th (ft) 38 7 0 0 0Control Delay (s) 14.1 9.8 0.0 0.0 0.0Lane LOS B AApproach Delay (s) 14.1 0.6 0.0Approach LOS B
Intersection SummaryAverage Delay 1.6Intersection Capacity Utilization 58.1% ICU Level of Service BAnalysis Period (min) 15

5: Forni Rd & US 50 EB Off Ramp & Ray Lawyer Dr Cumulative (2045) AM PeakHCM Signalized Intersection Capacity Analysis 7/7/2014
AOC Courthouse Project EIR Synchro 8 ReportCHS Consulting Group Page 1
Movement EBL EBT EBR WBL WBT WBR NBL NBT NBR SBL SBT SBRLane ConfigurationsVolume (vph) 260 30 20 40 110 70 130 200 30 110 80 90Ideal Flow (vphpl) 1900 1900 1900 1900 1900 1900 1900 1900 1900 1900 1900 1900Total Lost time (s) 4.0 4.0 4.0 4.0 4.0 4.0 4.0 4.0 4.0 4.0Lane Util. Factor 1.00 1.00 1.00 1.00 1.00 1.00 1.00 1.00 1.00 1.00Frt 1.00 0.94 1.00 0.94 1.00 1.00 0.85 1.00 1.00 0.85Flt Protected 0.95 1.00 0.95 1.00 0.95 1.00 1.00 0.95 1.00 1.00Satd. Flow (prot) 1770 1751 1770 1754 1770 1863 1583 1770 1863 1583Flt Permitted 0.61 1.00 0.72 1.00 0.95 1.00 1.00 0.95 1.00 1.00Satd. Flow (perm) 1144 1751 1343 1754 1770 1863 1583 1770 1863 1583Peak-hour factor, PHF 0.92 0.92 0.92 0.92 0.92 0.92 0.92 0.92 0.92 0.92 0.92 0.92Adj. Flow (vph) 283 33 22 43 120 76 141 217 33 120 87 98RTOR Reduction (vph) 0 15 0 0 41 0 0 0 21 0 0 63Lane Group Flow (vph) 283 40 0 43 155 0 141 217 12 120 87 35Turn Type Perm NA Perm NA Prot NAcustom Prot NAcustomProtected Phases 4 8 5 2 1Permitted Phases 4 8 2 6 6Actuated Green, G (s) 17.2 17.2 17.2 17.2 6.0 19.4 19.4 5.9 19.3 19.3Effective Green, g (s) 17.2 17.2 17.2 17.2 6.0 19.4 19.4 5.9 19.3 19.3Actuated g/C Ratio 0.32 0.32 0.32 0.32 0.11 0.36 0.36 0.11 0.35 0.35Clearance Time (s) 4.0 4.0 4.0 4.0 4.0 4.0 4.0 4.0 4.0 4.0Vehicle Extension (s) 3.0 3.0 3.0 3.0 3.0 3.0 3.0 3.0 3.0 3.0Lane Grp Cap (vph) 361 552 423 553 194 663 563 191 659 560v/s Ratio Prot 0.02 0.09 c0.08 0.01 0.07v/s Ratio Perm c0.25 0.03 c0.12 0.05 0.02v/c Ratio 0.78 0.07 0.10 0.28 0.73 0.33 0.02 0.63 0.13 0.06Uniform Delay, d1 17.0 13.1 13.2 14.0 23.5 12.8 11.4 23.3 11.9 11.6Progression Factor 1.00 1.00 1.00 1.00 1.00 1.00 1.00 1.00 1.00 1.00Incremental Delay, d2 10.6 0.1 0.1 0.3 12.7 0.3 0.0 6.3 0.4 0.2Delay (s) 27.6 13.1 13.3 14.3 36.2 13.1 11.4 29.6 12.3 11.8Level of Service C B B B D B B C B BApproach Delay (s) 25.2 14.1 21.3 19.0Approach LOS C B C B
Intersection SummaryHCM 2000 Control Delay 20.4 HCM 2000 Level of Service CHCM 2000 Volume to Capacity ratio 0.57Actuated Cycle Length (s) 54.5 Sum of lost time (s) 12.0Intersection Capacity Utilization 54.4% ICU Level of Service AAnalysis Period (min) 15c Critical Lane Group

6: Ray Lawyer Dr & Fair Lane Cumulative (2045) AM PeakHCM Signalized Intersection Capacity Analysis 4/28/2014
AOC Courthouse Project EIR Synchro 8 ReportCHS Consulting Group Page 3
Movement EBL EBR NBL NBT SBT SBRLane ConfigurationsVolume (vph) 30 200 300 327 251 100Ideal Flow (vphpl) 1900 1900 1900 1900 1900 1900Total Lost time (s) 4.0 4.0 4.0 4.0 4.0 4.0Lane Util. Factor 1.00 1.00 1.00 1.00 1.00 1.00Frt 1.00 0.85 1.00 1.00 1.00 0.85Flt Protected 0.95 1.00 0.95 1.00 1.00 1.00Satd. Flow (prot) 1770 1583 1770 1863 1863 1583Flt Permitted 0.95 1.00 0.59 1.00 1.00 1.00Satd. Flow (perm) 1770 1583 1102 1863 1863 1583Peak-hour factor, PHF 0.92 0.92 0.92 0.92 0.92 0.92Adj. Flow (vph) 33 217 326 355 273 109RTOR Reduction (vph) 0 182 0 0 0 44Lane Group Flow (vph) 33 35 326 355 273 65Turn Type Prot Perm Perm NA NA PermProtected Phases 4 2 6Permitted Phases 4 2 6Actuated Green, G (s) 5.4 5.4 19.9 19.9 19.9 19.9Effective Green, g (s) 5.4 5.4 19.9 19.9 19.9 19.9Actuated g/C Ratio 0.16 0.16 0.60 0.60 0.60 0.60Clearance Time (s) 4.0 4.0 4.0 4.0 4.0 4.0Vehicle Extension (s) 3.0 3.0 3.0 3.0 3.0 3.0Lane Grp Cap (vph) 287 256 658 1113 1113 945v/s Ratio Prot 0.02 0.19 0.15v/s Ratio Perm c0.02 c0.30 0.04v/c Ratio 0.11 0.14 0.50 0.32 0.25 0.07Uniform Delay, d1 11.9 12.0 3.8 3.3 3.2 2.8Progression Factor 1.00 1.00 1.00 1.00 1.00 1.00Incremental Delay, d2 0.2 0.2 0.6 0.2 0.1 0.0Delay (s) 12.1 12.2 4.4 3.5 3.3 2.8Level of Service B B A A A AApproach Delay (s) 12.2 3.9 3.2Approach LOS B A A
Intersection SummaryHCM 2000 Control Delay 5.3 HCM 2000 Level of Service AHCM 2000 Volume to Capacity ratio 0.42Actuated Cycle Length (s) 33.3 Sum of lost time (s) 8.0Intersection Capacity Utilization 43.2% ICU Level of Service AAnalysis Period (min) 15c Critical Lane Group
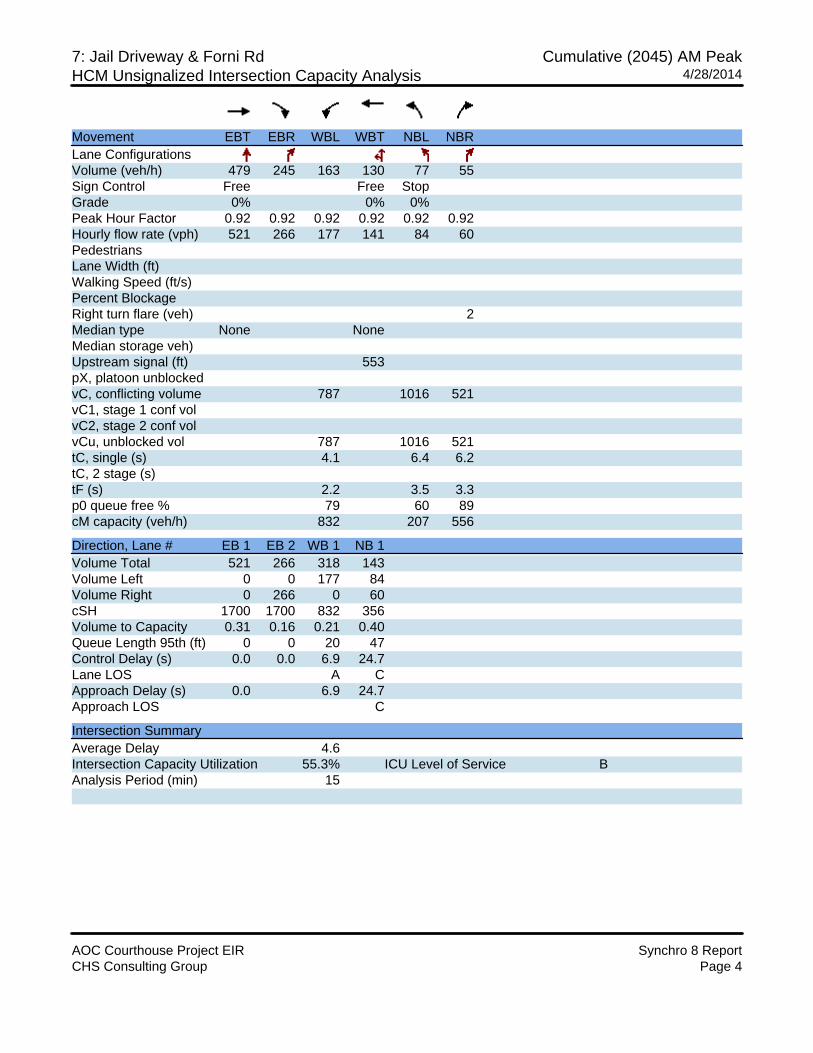
7: Jail Driveway & Forni Rd Cumulative (2045) AM PeakHCM Unsignalized Intersection Capacity Analysis 4/28/2014
AOC Courthouse Project EIR Synchro 8 ReportCHS Consulting Group Page 4
Movement EBT EBR WBL WBT NBL NBRLane ConfigurationsVolume (veh/h) 479 245 163 130 77 55Sign Control Free Free StopGrade 0% 0% 0%Peak Hour Factor 0.92 0.92 0.92 0.92 0.92 0.92Hourly flow rate (vph) 521 266 177 141 84 60PedestriansLane Width (ft)Walking Speed (ft/s)Percent BlockageRight turn flare (veh) 2Median type None NoneMedian storage veh)Upstream signal (ft) 553pX, platoon unblockedvC, conflicting volume 787 1016 521vC1, stage 1 conf volvC2, stage 2 conf volvCu, unblocked vol 787 1016 521tC, single (s) 4.1 6.4 6.2tC, 2 stage (s)tF (s) 2.2 3.5 3.3p0 queue free % 79 60 89cM capacity (veh/h) 832 207 556
Direction, Lane # EB 1 EB 2 WB 1 NB 1Volume Total 521 266 318 143Volume Left 0 0 177 84Volume Right 0 266 0 60cSH 1700 1700 832 356Volume to Capacity 0.31 0.16 0.21 0.40Queue Length 95th (ft) 0 0 20 47Control Delay (s) 0.0 0.0 6.9 24.7Lane LOS A CApproach Delay (s) 0.0 6.9 24.7Approach LOS C
Intersection SummaryAverage Delay 4.6Intersection Capacity Utilization 55.3% ICU Level of Service BAnalysis Period (min) 15

8: Ray Lawyer Dr & US 50 WB On Ramp/US 50 WB Off Ramp Cumulative (2045) AM PeakHCM Signalized Intersection Capacity Analysis 4/28/2014
AOC Courthouse Project EIR Synchro 8 ReportCHS Consulting Group Page 5
Movement EBL EBT EBR WBL WBT WBR NBL NBT NBR SBL SBT SBRLane ConfigurationsVolume (vph) 0 0 0 100 0 220 20 507 0 0 171 290Ideal Flow (vphpl) 1900 1900 1900 1900 1900 1900 1900 1900 1900 1900 1900 1900Total Lost time (s) 4.0 4.0 4.0 4.0 4.0 4.0Lane Util. Factor 1.00 1.00 1.00 1.00 1.00 1.00Frt 1.00 0.85 1.00 1.00 1.00 0.85Flt Protected 0.95 1.00 0.95 1.00 1.00 1.00Satd. Flow (prot) 1770 1583 1770 1863 1863 1583Flt Permitted 0.95 1.00 0.95 1.00 1.00 1.00Satd. Flow (perm) 1770 1583 1770 1863 1863 1583Peak-hour factor, PHF 0.92 0.92 0.92 0.92 0.92 0.92 0.92 0.92 0.92 0.92 0.92 0.92Adj. Flow (vph) 0 0 0 109 0 239 22 551 0 0 186 315RTOR Reduction (vph) 0 0 0 0 0 201 0 0 0 0 0 195Lane Group Flow (vph) 0 0 0 109 0 38 22 551 0 0 186 120Turn Type Perm Perm Prot NA NA PermProtected Phases 5 2 6Permitted Phases 8 8 6Actuated Green, G (s) 8.7 8.7 13.3 38.3 21.0 21.0Effective Green, g (s) 8.7 8.7 13.3 38.3 21.0 21.0Actuated g/C Ratio 0.16 0.16 0.24 0.70 0.38 0.38Clearance Time (s) 4.0 4.0 4.0 4.0 4.0 4.0Vehicle Extension (s) 3.0 3.0 3.0 3.0 3.0 3.0Lane Grp Cap (vph) 279 250 428 1297 711 604v/s Ratio Prot 0.01 c0.30 0.10v/s Ratio Perm c0.06 0.02 0.08v/c Ratio 0.39 0.15 0.05 0.42 0.26 0.20Uniform Delay, d1 20.8 20.0 16.0 3.6 11.7 11.4Progression Factor 1.00 1.00 1.00 1.00 1.00 1.00Incremental Delay, d2 0.9 0.3 0.2 1.0 0.9 0.7Delay (s) 21.7 20.2 16.2 4.6 12.6 12.1Level of Service C C B A B BApproach Delay (s) 0.0 20.7 5.1 12.3Approach LOS A C A B
Intersection SummaryHCM 2000 Control Delay 11.4 HCM 2000 Level of Service BHCM 2000 Volume to Capacity ratio 0.46Actuated Cycle Length (s) 55.0 Sum of lost time (s) 12.0Intersection Capacity Utilization 47.0% ICU Level of Service AAnalysis Period (min) 15c Critical Lane Group

AOC Placerville Courthouse EIRVISSIM Post‐Processor ‐ Average Results from 5 RunsCumulative Year 2045 ‐ PM Peak Hour (No Project)
Delay(s) Volume Delay(s) Volume Delay(s) Volume Delay(s) Volume Delay(s) VolumeRight 2 2.2 92 4 66 2.4 76 1.9 88 2 82 2.4Total 2.2 92 4 66 2.4 76 1.9 88 2 82 2.4U‐turn Marke 2.7 391 3.2 383 3.5 415 3.7 376 2.9 391 3.2Left 2 2.3 945 2.6 922 2.6 883 2.6 931 2.4 900 2.5Right 1 2.3 192 2.6 218 2.2 219 2.7 227 2.1 232 2.4Total 2.4 1528 2.8 1523 2.8 1517 2.9 1534 2.5 1523 2.6Left 2 9.9 15 29.3 17 14.5 12 29.6 22 25.8 19 23.1Left 1 0 4 0 4 0 4 0 4 0 4 0Through 20.8 421 25.5 398 19.1 378 33.2 407 20.6 418 23.9Right 1 2 812 2.4 842 7.4 859 3.5 810 2 816 3.5Total 8.4 1252 10 1261 11 1253 13.7 1243 8.5 1257 10.1Left 2 22.6 120 29.3 110 27.2 107 16.9 112 31.7 110 25.4Left 1 23.9 259 27.2 265 28.5 258 17.1 261 29 269 25.2Right 1 25.6 35 20.3 35 26.1 47 15.4 44 27.3 31 22.7Total 23.7 414 27.2 410 27.9 412 16.9 417 29.6 410 23.9Left 3 17 135 22.9 173 16 158 17.3 160 16.1 144 18Through 11.3 146 16.8 132 10.7 135 12.4 123 10.6 138 12.3Right 1 0 4 0 4 0 5 0 4 0 4 0Total 13.8 285 20 309 13.3 298 15 287 13.2 286 14.9
Total 7.9 3571 9.7 3569 9.5 3556 9.2 3569 8.6 3558 A 9Left 3 20.5 370 24.3 323 16.8 360 20.6 362 32.1 353 22.8Right 1 20.5 195 21.9 218 17.9 199 19.8 197 35.4 211 23.3Total 20.5 565 23.3 541 17.2 559 20.3 559 33.3 564 22.3Left 1 2.6 376 2.7 413 2.7 391 2.9 387 4.4 405 3.1Right 1 1.5 231 1.8 207 1.7 217 1.6 194 1.8 191 1.7Right 3 2.5 252 3.1 235 3 241 3.4 264 4.9 260 3.4Total 2.3 859 2.6 855 2.5 849 2.8 845 4 856 3Left 3 11.6 112 9.4 122 9.8 119 10.4 113 11.8 129 10.6Left 1 9.2 87 9.1 113 10 104 9.9 127 10.4 117 9.7Right 1 2.3 876 2.3 830 2.1 845 2.4 829 2.3 823 2.3Total 3.8 1075 3.8 1065 3.7 1068 4.1 1069 4.3 1069 4Left 3 53.3 38 51.7 33 61.1 40 34 39 61.9 30 52Left 1 45.4 244 53.6 270 63.6 251 31.5 248 63 255 51.6Total 46.5 282 53.4 303 63.3 291 31.8 287 62.9 285 49.6Right 2 3.7 131 4.5 111 11 124 3.5 118 7 129 6Total 3.7 131 4.5 111 11 124 3.5 118 7 129 5.4
Total 10.7 2912 12.4 2875 12.3 2891 9.6 2878 15.7 2903 B 12.2
Average(s)Intersection Approach Movement
Run1 2 3 4
Delay
NB
EB
SB
WB
NWB
US 50 EB Ramps‐Lo‐Hi Way/Forni Rd
NB
NEB
SB
WB
NWB
Placerville Dr/US 50 WB Off‐Ramp‐Fair
Ln
5LOS
Sources: Fehr Peers, March 2014; CHS Consulting Group, 2014.
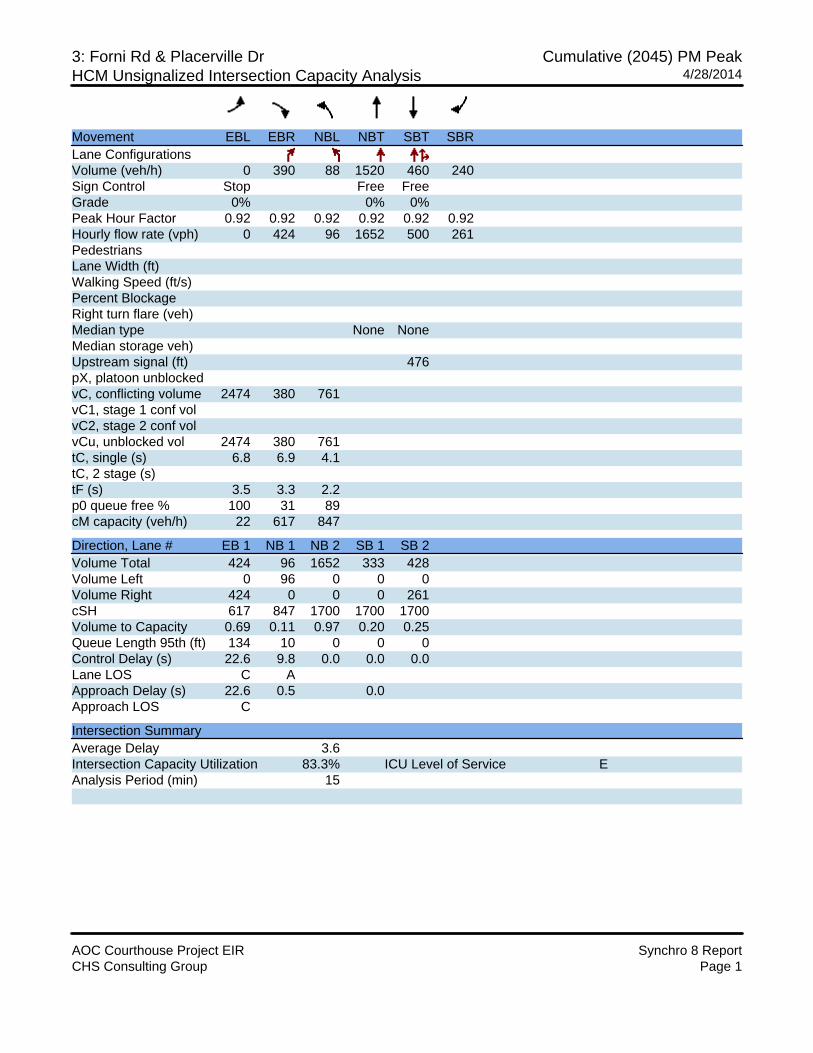
3: Forni Rd & Placerville Dr Cumulative (2045) PM PeakHCM Unsignalized Intersection Capacity Analysis 4/28/2014
AOC Courthouse Project EIR Synchro 8 ReportCHS Consulting Group Page 1
Movement EBL EBR NBL NBT SBT SBRLane ConfigurationsVolume (veh/h) 0 390 88 1520 460 240Sign Control Stop Free FreeGrade 0% 0% 0%Peak Hour Factor 0.92 0.92 0.92 0.92 0.92 0.92Hourly flow rate (vph) 0 424 96 1652 500 261PedestriansLane Width (ft)Walking Speed (ft/s)Percent BlockageRight turn flare (veh)Median type None NoneMedian storage veh)Upstream signal (ft) 476pX, platoon unblockedvC, conflicting volume 2474 380 761vC1, stage 1 conf volvC2, stage 2 conf volvCu, unblocked vol 2474 380 761tC, single (s) 6.8 6.9 4.1tC, 2 stage (s)tF (s) 3.5 3.3 2.2p0 queue free % 100 31 89cM capacity (veh/h) 22 617 847
Direction, Lane # EB 1 NB 1 NB 2 SB 1 SB 2Volume Total 424 96 1652 333 428Volume Left 0 96 0 0 0Volume Right 424 0 0 0 261cSH 617 847 1700 1700 1700Volume to Capacity 0.69 0.11 0.97 0.20 0.25Queue Length 95th (ft) 134 10 0 0 0Control Delay (s) 22.6 9.8 0.0 0.0 0.0Lane LOS C AApproach Delay (s) 22.6 0.5 0.0Approach LOS C
Intersection SummaryAverage Delay 3.6Intersection Capacity Utilization 83.3% ICU Level of Service EAnalysis Period (min) 15
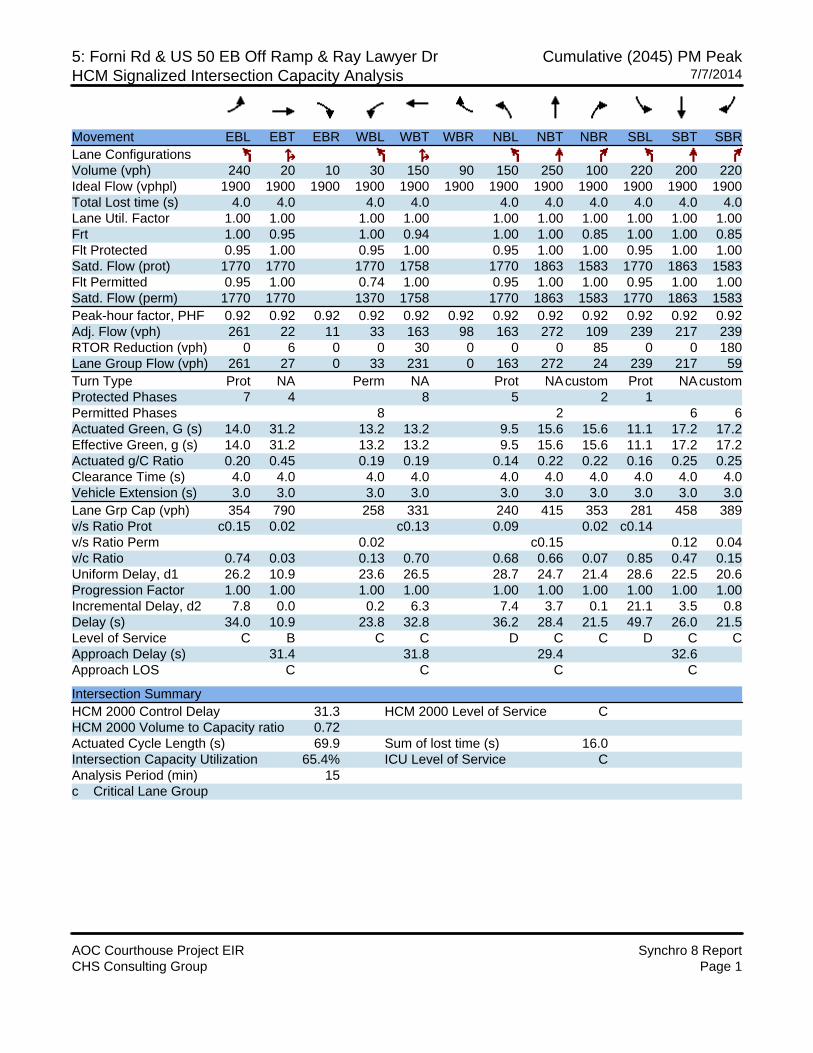
5: Forni Rd & US 50 EB Off Ramp & Ray Lawyer Dr Cumulative (2045) PM PeakHCM Signalized Intersection Capacity Analysis 7/7/2014
AOC Courthouse Project EIR Synchro 8 ReportCHS Consulting Group Page 1
Movement EBL EBT EBR WBL WBT WBR NBL NBT NBR SBL SBT SBRLane ConfigurationsVolume (vph) 240 20 10 30 150 90 150 250 100 220 200 220Ideal Flow (vphpl) 1900 1900 1900 1900 1900 1900 1900 1900 1900 1900 1900 1900Total Lost time (s) 4.0 4.0 4.0 4.0 4.0 4.0 4.0 4.0 4.0 4.0Lane Util. Factor 1.00 1.00 1.00 1.00 1.00 1.00 1.00 1.00 1.00 1.00Frt 1.00 0.95 1.00 0.94 1.00 1.00 0.85 1.00 1.00 0.85Flt Protected 0.95 1.00 0.95 1.00 0.95 1.00 1.00 0.95 1.00 1.00Satd. Flow (prot) 1770 1770 1770 1758 1770 1863 1583 1770 1863 1583Flt Permitted 0.95 1.00 0.74 1.00 0.95 1.00 1.00 0.95 1.00 1.00Satd. Flow (perm) 1770 1770 1370 1758 1770 1863 1583 1770 1863 1583Peak-hour factor, PHF 0.92 0.92 0.92 0.92 0.92 0.92 0.92 0.92 0.92 0.92 0.92 0.92Adj. Flow (vph) 261 22 11 33 163 98 163 272 109 239 217 239RTOR Reduction (vph) 0 6 0 0 30 0 0 0 85 0 0 180Lane Group Flow (vph) 261 27 0 33 231 0 163 272 24 239 217 59Turn Type Prot NA Perm NA Prot NAcustom Prot NAcustomProtected Phases 7 4 8 5 2 1Permitted Phases 8 2 6 6Actuated Green, G (s) 14.0 31.2 13.2 13.2 9.5 15.6 15.6 11.1 17.2 17.2Effective Green, g (s) 14.0 31.2 13.2 13.2 9.5 15.6 15.6 11.1 17.2 17.2Actuated g/C Ratio 0.20 0.45 0.19 0.19 0.14 0.22 0.22 0.16 0.25 0.25Clearance Time (s) 4.0 4.0 4.0 4.0 4.0 4.0 4.0 4.0 4.0 4.0Vehicle Extension (s) 3.0 3.0 3.0 3.0 3.0 3.0 3.0 3.0 3.0 3.0Lane Grp Cap (vph) 354 790 258 331 240 415 353 281 458 389v/s Ratio Prot c0.15 0.02 c0.13 0.09 0.02 c0.14v/s Ratio Perm 0.02 c0.15 0.12 0.04v/c Ratio 0.74 0.03 0.13 0.70 0.68 0.66 0.07 0.85 0.47 0.15Uniform Delay, d1 26.2 10.9 23.6 26.5 28.7 24.7 21.4 28.6 22.5 20.6Progression Factor 1.00 1.00 1.00 1.00 1.00 1.00 1.00 1.00 1.00 1.00Incremental Delay, d2 7.8 0.0 0.2 6.3 7.4 3.7 0.1 21.1 3.5 0.8Delay (s) 34.0 10.9 23.8 32.8 36.2 28.4 21.5 49.7 26.0 21.5Level of Service C B C C D C C D C CApproach Delay (s) 31.4 31.8 29.4 32.6Approach LOS C C C C
Intersection SummaryHCM 2000 Control Delay 31.3 HCM 2000 Level of Service CHCM 2000 Volume to Capacity ratio 0.72Actuated Cycle Length (s) 69.9 Sum of lost time (s) 16.0Intersection Capacity Utilization 65.4% ICU Level of Service CAnalysis Period (min) 15c Critical Lane Group

6: Ray Lawyer Dr & Fair Lane Cumulative (2045) PM PeakHCM Signalized Intersection Capacity Analysis 4/28/2014
AOC Courthouse Project EIR Synchro 8 ReportCHS Consulting Group Page 3
Movement EBL EBR NBL NBT SBT SBRLane ConfigurationsVolume (vph) 200 350 270 411 428 100Ideal Flow (vphpl) 1900 1900 1900 1900 1900 1900Total Lost time (s) 4.0 4.0 4.0 4.0 4.0 4.0Lane Util. Factor 1.00 1.00 1.00 1.00 1.00 1.00Frt 1.00 0.85 1.00 1.00 1.00 0.85Flt Protected 0.95 1.00 0.95 1.00 1.00 1.00Satd. Flow (prot) 1770 1583 1770 1863 1863 1583Flt Permitted 0.95 1.00 0.44 1.00 1.00 1.00Satd. Flow (perm) 1770 1583 811 1863 1863 1583Peak-hour factor, PHF 0.92 0.92 0.92 0.92 0.92 0.92Adj. Flow (vph) 217 380 293 447 465 109RTOR Reduction (vph) 0 276 0 0 0 52Lane Group Flow (vph) 217 104 293 447 465 57Turn Type Prot Perm Perm NA NA PermProtected Phases 4 2 6Permitted Phases 4 2 6Actuated Green, G (s) 10.9 10.9 21.1 21.1 21.1 21.1Effective Green, g (s) 10.9 10.9 21.1 21.1 21.1 21.1Actuated g/C Ratio 0.27 0.27 0.53 0.53 0.53 0.53Clearance Time (s) 4.0 4.0 4.0 4.0 4.0 4.0Vehicle Extension (s) 3.0 3.0 3.0 3.0 3.0 3.0Lane Grp Cap (vph) 482 431 427 982 982 835v/s Ratio Prot c0.12 0.24 0.25v/s Ratio Perm 0.07 c0.36 0.04v/c Ratio 0.45 0.24 0.69 0.46 0.47 0.07Uniform Delay, d1 12.1 11.3 7.0 5.9 6.0 4.6Progression Factor 1.00 1.00 1.00 1.00 1.00 1.00Incremental Delay, d2 0.7 0.3 4.5 0.3 0.4 0.0Delay (s) 12.7 11.6 11.5 6.2 6.3 4.7Level of Service B B B A A AApproach Delay (s) 12.0 8.3 6.0Approach LOS B A A
Intersection SummaryHCM 2000 Control Delay 8.8 HCM 2000 Level of Service AHCM 2000 Volume to Capacity ratio 0.60Actuated Cycle Length (s) 40.0 Sum of lost time (s) 8.0Intersection Capacity Utilization 58.6% ICU Level of Service BAnalysis Period (min) 15c Critical Lane Group

7: Jail Driveway & Forni Rd Cumulative (2045) PM PeakHCM Unsignalized Intersection Capacity Analysis 4/28/2014
AOC Courthouse Project EIR Synchro 8 ReportCHS Consulting Group Page 4
Movement EBT EBR WBL WBT NBL NBRLane ConfigurationsVolume (veh/h) 427 76 49 161 379 177Sign Control Free Free StopGrade 0% 0% 0%Peak Hour Factor 0.92 0.92 0.92 0.92 0.92 0.92Hourly flow rate (vph) 464 83 53 175 412 192PedestriansLane Width (ft)Walking Speed (ft/s)Percent BlockageRight turn flare (veh) 2Median type None NoneMedian storage veh)Upstream signal (ft) 553pX, platoon unblocked 0.97vC, conflicting volume 547 746 464vC1, stage 1 conf volvC2, stage 2 conf volvCu, unblocked vol 547 725 464tC, single (s) 4.1 6.4 6.2tC, 2 stage (s)tF (s) 2.2 3.5 3.3p0 queue free % 95 0 68cM capacity (veh/h) 1023 362 598
Direction, Lane # EB 1 EB 2 WB 1 NB 1Volume Total 464 83 228 604Volume Left 0 0 53 412Volume Right 0 83 0 192cSH 1700 1700 1023 429Volume to Capacity 0.27 0.05 0.05 1.41Queue Length 95th (ft) 0 0 4 739Control Delay (s) 0.0 0.0 2.4 222.3Lane LOS A FApproach Delay (s) 0.0 2.4 222.3Approach LOS F
Intersection SummaryAverage Delay 97.8Intersection Capacity Utilization 64.7% ICU Level of Service CAnalysis Period (min) 15

8: Ray Lawyer Dr & US 50 WB On Ramp/US 50 WB Off Ramp Cumulative (2045) PM PeakHCM Signalized Intersection Capacity Analysis 4/28/2014
AOC Courthouse Project EIR Synchro 8 ReportCHS Consulting Group Page 5
Movement EBL EBT EBR WBL WBT WBR NBL NBT NBR SBL SBT SBRLane ConfigurationsVolume (vph) 0 0 0 220 0 200 60 511 0 0 418 520Ideal Flow (vphpl) 1900 1900 1900 1900 1900 1900 1900 1900 1900 1900 1900 1900Total Lost time (s) 4.0 4.0 4.0 4.0 4.0 4.0Lane Util. Factor 1.00 1.00 1.00 1.00 1.00 1.00Frt 1.00 0.85 1.00 1.00 1.00 0.85Flt Protected 0.95 1.00 0.95 1.00 1.00 1.00Satd. Flow (prot) 1770 1583 1770 1863 1863 1583Flt Permitted 0.95 1.00 0.95 1.00 1.00 1.00Satd. Flow (perm) 1770 1583 1770 1863 1863 1583Peak-hour factor, PHF 0.92 0.92 0.92 0.92 0.92 0.92 0.92 0.92 0.92 0.92 0.92 0.92Adj. Flow (vph) 0 0 0 239 0 217 65 555 0 0 454 565RTOR Reduction (vph) 0 0 0 0 0 168 0 0 0 0 0 349Lane Group Flow (vph) 0 0 0 239 0 49 65 555 0 0 454 216Turn Type Perm Perm Prot NA NA PermProtected Phases 5 2 6Permitted Phases 8 8 6Actuated Green, G (s) 12.3 12.3 9.7 34.7 21.0 21.0Effective Green, g (s) 12.3 12.3 9.7 34.7 21.0 21.0Actuated g/C Ratio 0.22 0.22 0.18 0.63 0.38 0.38Clearance Time (s) 4.0 4.0 4.0 4.0 4.0 4.0Vehicle Extension (s) 3.0 3.0 3.0 3.0 3.0 3.0Lane Grp Cap (vph) 395 354 312 1175 711 604v/s Ratio Prot 0.04 c0.30 c0.24v/s Ratio Perm c0.14 0.03 0.14v/c Ratio 0.61 0.14 0.21 0.47 0.64 0.36Uniform Delay, d1 19.2 17.1 19.4 5.3 13.9 12.2Progression Factor 1.00 1.00 1.00 1.00 1.00 1.00Incremental Delay, d2 2.6 0.2 1.5 1.4 4.4 1.6Delay (s) 21.8 17.3 20.9 6.7 18.3 13.8Level of Service C B C A B BApproach Delay (s) 0.0 19.6 8.2 15.8Approach LOS A B A B
Intersection SummaryHCM 2000 Control Delay 14.4 HCM 2000 Level of Service BHCM 2000 Volume to Capacity ratio 0.62Actuated Cycle Length (s) 55.0 Sum of lost time (s) 12.0Intersection Capacity Utilization 47.5% ICU Level of Service AAnalysis Period (min) 15c Critical Lane Group

AOC Placerville Courthouse EIRVISSIM Post‐Processor ‐ Average Results from 5 RunsCumulative Year ‐ AM Peak Hour With Project
Delay(s) Volume Delay(s) Volume Delay(s) Volume Delay(s) Volume Delay(s) VolumeRight 2 2.7 142 3.5 117 2.4 131 3.6 136 3.3 136 3.1 4 0.1 39.2Total 2.7 142 3.5 117 2.4 131 3.6 136 3.3 136 3 3.8 0.1 39.2U‐turn Marke 1.7 168 1.9 165 1.7 184 1.5 167 1.7 170 1.7 1.5 0.2 11.4Left 2 1.6 686 1.8 668 1.5 634 1.7 651 1.7 620 1.7 1.5 0.1 12.4Right 1 1.8 211 1.8 233 1.6 239 1.9 253 1.9 275 1.8 1.8 0.1 14.4Total 1.7 1065 1.8 1066 1.6 1057 1.7 1071 1.8 1065 1.7 1.6 0.1 14.4Left 2 6.6 38 8.9 34 5.6 21 6.9 42 8 45 7.3 7.3 0.2 41.7Left 1 0.2 4 0 4 0.2 4 0 4 0 4 0.1 0.2 0 0.7Through 6.2 526 5.6 506 5.7 505 5.9 482 6.5 492 6 5.9 0.1 42.4Right 1 1.4 484 1.6 516 1.6 523 1.6 518 1.4 514 1.5 2 0.1 14.2Total 4 1052 3.7 1060 3.6 1053 3.8 1046 4.1 1055 3.8 5 0 42.4Left 2 4.4 18 2.4 21 3.4 19 1.4 12 3.7 29 3.2 4.1 0.1 20.9Left 1 3.2 93 2.3 92 2.9 92 3.7 99 4.6 90 3.4 4.4 0.1 28.8Right 1 1.6 23 0.9 18 1.7 20 1.6 21 2.9 13 1.7 2.1 0.1 8.4Total 3.1 134 2.1 131 2.8 131 3.2 132 4.2 132 3.1 4 0.1 28.8Left 3 12.2 167 16.6 185 13.2 183 13.4 175 12.2 170 13.6 9.5 3.3 61.2Through 8.2 173 12.3 181 8.5 168 9.5 171 8 171 9.3 8.9 0 56Right 1 0 4 0 4 0 5 0 4 0 4 0 0 0 0Total 10 344 14.3 370 10.8 356 11.3 350 10 345 11.3 9.4 0 61.2
Total 3.7 2737 4.3 2744 3.7 2728 3.9 2735 3.9 2733 A 3.9 5.8 0 61.2Left 3 5.6 207 6.1 191 6.9 200 7.7 198 8.1 204 6.9 7.5 0.2 54.7Right 1 7.1 73 7 85 5.5 78 9.7 81 7 77 7.3 8.6 0.2 54.7Total 6 280 6.4 276 6.5 278 8.3 279 7.8 281 7.1 8.1 0.2 54.7Left 1 5.5 297 2.8 295 6.2 307 3.5 322 2.9 309 4.2 9.9 0.2 130.2Right 1 3.4 371 3.3 384 3.8 356 3.4 325 3.7 351 3.5 3.7 0.1 26.8Right 3 6.5 129 3.9 116 8.3 126 4.3 140 3.4 138 5.2 11.8 0.2 129.8Total 4.7 797 3.2 795 5.5 789 3.6 787 3.3 798 4.1 7.9 0.1 130.2Left 3 4.2 245 3.7 277 4.1 257 4.6 280 3.6 295 4 4.3 0.3 27.6Left 1 4.3 106 4 104 3.9 123 4.1 99 4.3 118 4.1 4.6 0.4 35.4Right 1 1.9 739 1.8 700 1.9 706 1.8 706 1.9 676 1.9 1.4 0.2 10Total 2.7 1090 2.5 1081 2.6 1086 2.7 1085 2.6 1089 2.7 3.3 0.2 35.4Left 3 5.3 15 2.1 17 3.3 24 4 23 2.1 13 3.4 4.3 0.1 25.3Left 1 3 110 3.1 113 3 116 2.9 111 3.1 113 3 3.7 0.2 21.6Total 3.3 125 3 130 3.1 140 3.1 134 3 126 3 3.8 0.1 25.3Right 2 1.7 94 1.8 90 1.3 78 1.6 85 2 93 1.7 1.8 0.4 10.7Total 1.7 94 1.8 90 1.3 78 1.6 85 2 93 1.7 1.9 0.4 10.7
Total 3.7 2386 3.2 2372 4 2371 3.6 2370 3.4 2387 A 3.6 6 0.1 130.2
3.7 5123 3.8 5116 3.8 5099 3.8 5105 3.7 5120 3.8 5.9 0 130.2
Average(s) Standard Deviation(s) Min(s) Max(s)Intersection Approach Movement
Run1 2 3 4
NETWORK TOTAL
Delay
NB
EB
SB
WB
NWB
US 50 EB Ramps‐Lo‐Hi Way/Forni Rd
NB
NEB
SB
WB
NWB
Placerville Dr/US 50 WB Off‐Ramp‐Fair
Ln
5LOS
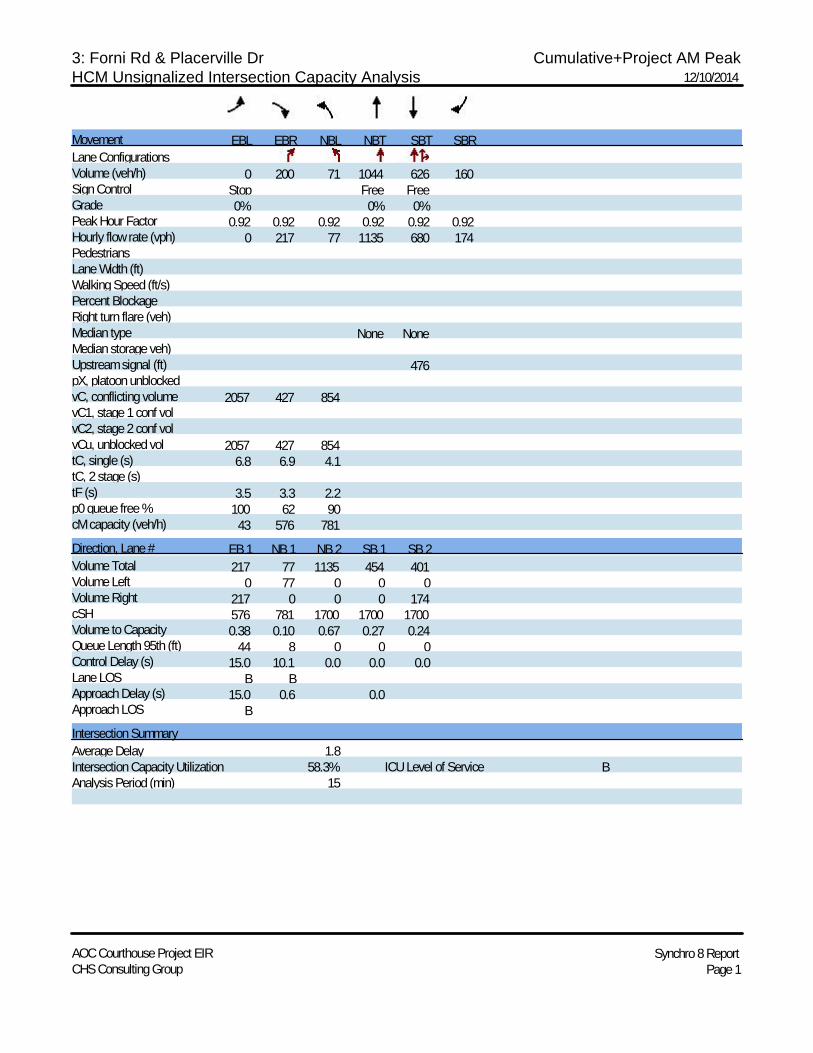
3: Forni Rd & Placerville Dr Cumulative+Project AM PeakHCM Unsignalized Intersection Capacity Analysis 12/10/2014
AOC Courthouse Project EIR Synchro 8 ReportCHS Consulting Group Page 1
Movement EBL EBR NBL NBT SBT SBRLane ConfigurationsVolume (veh/h) 0 200 71 1044 626 160Sign Control Stop Free FreeGrade 0% 0% 0%Peak Hour Factor 0.92 0.92 0.92 0.92 0.92 0.92Hourly flow rate (vph) 0 217 77 1135 680 174PedestriansLane Width (ft)Walking Speed (ft/s)Percent BlockageRight turn flare (veh)Median type None NoneMedian storage veh)Upstream signal (ft) 476pX, platoon unblockedvC, conflicting volume 2057 427 854vC1, stage 1 conf volvC2, stage 2 conf volvCu, unblocked vol 2057 427 854tC, single (s) 6.8 6.9 4.1tC, 2 stage (s)tF (s) 3.5 3.3 2.2p0 queue free % 100 62 90cM capacity (veh/h) 43 576 781Direction, Lane # EB 1 NB 1 NB 2 SB 1 SB 2Volume Total 217 77 1135 454 401Volume Left 0 77 0 0 0Volume Right 217 0 0 0 174cSH 576 781 1700 1700 1700Volume to Capacity 0.38 0.10 0.67 0.27 0.24Queue Length 95th (ft) 44 8 0 0 0Control Delay (s) 15.0 10.1 0.0 0.0 0.0Lane LOS B BApproach Delay (s) 15.0 0.6 0.0Approach LOS BIntersection SummaryAverage Delay 1.8Intersection Capacity Utilization 58.3% ICU Level of Service BAnalysis Period (min) 15

5: Forni Rd & US 50 EB Off Ramp & Ray Lawyer Dr Cumulative+Project AM PeakHCM Signalized Intersection Capacity Analysis 1/5/2015
AOC Courthouse Project EIR Synchro 8 ReportCHS Consulting Group Page 1
Movement EBL EBT EBR WBL WBT WBR NBL NBT NBR SBL SBT SBRLane ConfigurationsVolume (vph) 260 30 112 80 110 70 130 216 41 110 90 90Ideal Flow (vphpl) 1900 1900 1900 1900 1900 1900 1900 1900 1900 1900 1900 1900Total Lost time (s) 4.0 4.0 4.0 4.0 4.0 4.0 4.0 4.0 4.0 4.0Lane Util. Factor 1.00 1.00 1.00 1.00 1.00 1.00 1.00 1.00 1.00 1.00Frt 1.00 0.88 1.00 0.94 1.00 1.00 0.85 1.00 1.00 0.85Flt Protected 0.95 1.00 0.95 1.00 0.95 1.00 1.00 0.95 1.00 1.00Satd. Flow (prot) 1770 1643 1770 1754 1770 1863 1583 1770 1863 1583Flt Permitted 0.95 1.00 0.66 1.00 0.95 1.00 1.00 0.95 1.00 1.00Satd. Flow (perm) 1770 1643 1227 1754 1770 1863 1583 1770 1863 1583Peak-hour factor, PHF 0.92 0.92 0.92 0.92 0.92 0.92 0.92 0.92 0.92 0.92 0.92 0.92Adj. Flow (vph) 283 33 122 87 120 76 141 235 45 120 98 98RTOR Reduction (vph) 0 70 0 0 39 0 0 0 31 0 0 71Lane Group Flow (vph) 283 85 0 87 157 0 141 235 14 120 98 27Turn Type Prot NA Perm NA Prot NA custom Prot NA customProtected Phases 7 4 8 5 2 1Permitted Phases 8 2 6 6Actuated Green, G (s) 11.0 25.5 10.5 10.5 6.0 18.2 18.2 4.7 16.9 16.9Effective Green, g (s) 11.0 25.5 10.5 10.5 6.0 18.2 18.2 4.7 16.9 16.9Actuated g/C Ratio 0.18 0.42 0.17 0.17 0.10 0.30 0.30 0.08 0.28 0.28Clearance Time (s) 4.0 4.0 4.0 4.0 4.0 4.0 4.0 4.0 4.0 4.0Vehicle Extension (s) 3.0 3.0 3.0 3.0 3.0 3.0 3.0 3.0 3.0 3.0Lane Grp Cap (vph) 322 693 213 304 175 561 476 137 521 442v/s Ratio Prot c0.16 0.05 c0.09 c0.08 0.01 0.07v/s Ratio Perm 0.07 c0.13 0.05 0.02v/c Ratio 0.88 0.12 0.41 0.52 0.81 0.42 0.03 0.88 0.19 0.06Uniform Delay, d1 24.1 10.6 22.2 22.6 26.6 16.9 14.9 27.6 16.5 15.9Progression Factor 1.00 1.00 1.00 1.00 1.00 1.00 1.00 1.00 1.00 1.00Incremental Delay, d2 22.7 0.1 1.3 1.5 23.0 0.5 0.0 41.9 0.8 0.3Delay (s) 46.7 10.7 23.5 24.1 49.6 17.4 14.9 69.5 17.3 16.2Level of Service D B C C D B B E B BApproach Delay (s) 34.0 23.9 27.9 36.8Approach LOS C C C D
Intersection SummaryHCM 2000 Control Delay 30.9 HCM 2000 Level of Service CHCM 2000 Volume to Capacity ratio 0.62Actuated Cycle Length (s) 60.4 Sum of lost time (s) 16.0Intersection Capacity Utilization 55.3% ICU Level of Service BAnalysis Period (min) 15c Critical Lane Group

6: Ray Lawyer Dr & Fair Lane Cumulative+Project AM PeakHCM Signalized Intersection Capacity Analysis 12/10/2014
AOC Courthouse Project EIR Synchro 8 ReportCHS Consulting Group Page 3
Movement EBL EBR NBL NBT SBT SBRLane ConfigurationsVolume (vph) 30 200 300 331 261 100Ideal Flow (vphpl) 1900 1900 1900 1900 1900 1900Total Lost time (s) 4.0 4.0 4.0 4.0 4.0 4.0Lane Util. Factor 1.00 1.00 1.00 1.00 1.00 1.00Frt 1.00 0.85 1.00 1.00 1.00 0.85Flt Protected 0.95 1.00 0.95 1.00 1.00 1.00Satd. Flow (prot) 1770 1583 1770 1863 1863 1583Flt Permitted 0.95 1.00 0.59 1.00 1.00 1.00Satd. Flow (perm) 1770 1583 1091 1863 1863 1583Peak-hour factor, PHF 0.92 0.92 0.92 0.92 0.92 0.92Adj. Flow (vph) 33 217 326 360 284 109RTOR Reduction (vph) 0 182 0 0 0 43Lane Group Flow (vph) 33 35 326 360 284 66Turn Type Prot Perm Perm NA NA PermProtected Phases 4 2 6Permitted Phases 4 2 6Actuated Green, G (s) 5.4 5.4 20.2 20.2 20.2 20.2Effective Green, g (s) 5.4 5.4 20.2 20.2 20.2 20.2Actuated g/C Ratio 0.16 0.16 0.60 0.60 0.60 0.60Clearance Time (s) 4.0 4.0 4.0 4.0 4.0 4.0Vehicle Extension (s) 3.0 3.0 3.0 3.0 3.0 3.0Lane Grp Cap (vph) 284 254 655 1120 1120 951v/s Ratio Prot 0.02 0.19 0.15v/s Ratio Perm c0.02 c0.30 0.04v/c Ratio 0.12 0.14 0.50 0.32 0.25 0.07Uniform Delay, d1 12.1 12.1 3.8 3.3 3.2 2.8Progression Factor 1.00 1.00 1.00 1.00 1.00 1.00Incremental Delay, d2 0.2 0.2 0.6 0.2 0.1 0.0Delay (s) 12.2 12.3 4.4 3.5 3.3 2.8Level of Service B B A A A AApproach Delay (s) 12.3 3.9 3.1Approach LOS B A A
Intersection SummaryHCM 2000 Control Delay 5.3 HCM 2000 Level of Service AHCM 2000 Volume to Capacity ratio 0.42Actuated Cycle Length (s) 33.6 Sum of lost time (s) 8.0Intersection Capacity Utilization 43.7% ICU Level of Service AAnalysis Period (min) 15c Critical Lane Group

7: Jail Driveway & Forni Rd Cumulative+Project AM PeakHCM Unsignalized Intersection Capacity Analysis 12/31/2014
AOC Courthouse Project EIR Synchro 8 ReportCHS Consulting Group Page 1
Movement EBT EBR WBL WBT NBL NBRLane ConfigurationsVolume (veh/h) 479 356 305 130 86 82Sign Control Free Free StopGrade 0% 0% 0%Peak Hour Factor 0.92 0.92 0.92 0.92 0.92 0.92Hourly flow rate (vph) 521 387 332 141 93 89PedestriansLane Width (ft)Walking Speed (ft/s)Percent BlockageRight turn flare (veh) 2Median type None NoneMedian storage veh)Upstream signal (ft) 553pX, platoon unblockedvC, conflicting volume 908 1325 521vC1, stage 1 conf volvC2, stage 2 conf volvCu, unblocked vol 908 1325 521tC, single (s) 4.1 6.4 6.2tC, 2 stage (s)tF (s) 2.2 3.5 3.3p0 queue free % 56 2 84cM capacity (veh/h) 750 96 556
Direction, Lane # EB 1 EB 2 WB 1 NB 1Volume Total 521 387 473 183Volume Left 0 0 332 93Volume Right 0 387 0 89cSH 1700 1700 750 171Volume to Capacity 0.31 0.23 0.44 1.07Queue Length 95th (ft) 0 0 57 225Control Delay (s) 0.0 0.0 11.5 142.2Lane LOS B FApproach Delay (s) 0.0 11.5 142.2Approach LOS F
Intersection SummaryAverage Delay 20.1Intersection Capacity Utilization 63.7% ICU Level of Service BAnalysis Period (min) 15

8: Ray Lawyer Dr & US 50 WB On Ramp/US 50 WB Off Ramp Cumulative+Project AM PeakHCM Signalized Intersection Capacity Analysis 12/10/2014
AOC Courthouse Project EIR Synchro 8 ReportCHS Consulting Group Page 5
Movement EBL EBT EBR WBL WBT WBR NBL NBT NBR SBL SBT SBRLane ConfigurationsVolume (vph) 0 0 0 100 0 220 32 511 0 0 181 290Ideal Flow (vphpl) 1900 1900 1900 1900 1900 1900 1900 1900 1900 1900 1900 1900Total Lost time (s) 4.0 4.0 4.0 4.0 4.0 4.0Lane Util. Factor 1.00 1.00 1.00 1.00 1.00 1.00Frt 1.00 0.85 1.00 1.00 1.00 0.85Flt Protected 0.95 1.00 0.95 1.00 1.00 1.00Satd. Flow (prot) 1770 1583 1770 1863 1863 1583Flt Permitted 0.95 1.00 0.95 1.00 1.00 1.00Satd. Flow (perm) 1770 1583 1770 1863 1863 1583Peak-hour factor, PHF 0.92 0.92 0.92 0.92 0.92 0.92 0.92 0.92 0.92 0.92 0.92 0.92Adj. Flow (vph) 0 0 0 109 0 239 35 555 0 0 197 315RTOR Reduction (vph) 0 0 0 0 0 201 0 0 0 0 0 195Lane Group Flow (vph) 0 0 0 109 0 38 35 555 0 0 197 120Turn Type Perm Perm Prot NA NA PermProtected Phases 5 2 6Permitted Phases 8 8 6Actuated Green, G (s) 8.7 8.7 13.3 38.3 21.0 21.0Effective Green, g (s) 8.7 8.7 13.3 38.3 21.0 21.0Actuated g/C Ratio 0.16 0.16 0.24 0.70 0.38 0.38Clearance Time (s) 4.0 4.0 4.0 4.0 4.0 4.0Vehicle Extension (s) 3.0 3.0 3.0 3.0 3.0 3.0Lane Grp Cap (vph) 279 250 428 1297 711 604v/s Ratio Prot 0.02 c0.30 0.11v/s Ratio Perm c0.06 0.02 0.08v/c Ratio 0.39 0.15 0.08 0.43 0.28 0.20Uniform Delay, d1 20.8 20.0 16.1 3.6 11.8 11.4Progression Factor 1.00 1.00 1.00 1.00 1.00 1.00Incremental Delay, d2 0.9 0.3 0.4 1.0 1.0 0.7Delay (s) 21.7 20.2 16.5 4.6 12.7 12.1Level of Service C C B A B BApproach Delay (s) 0.0 20.7 5.3 12.3Approach LOS A C A B
Intersection SummaryHCM 2000 Control Delay 11.5 HCM 2000 Level of Service BHCM 2000 Volume to Capacity ratio 0.46Actuated Cycle Length (s) 55.0 Sum of lost time (s) 12.0Intersection Capacity Utilization 47.2% ICU Level of Service AAnalysis Period (min) 15c Critical Lane Group
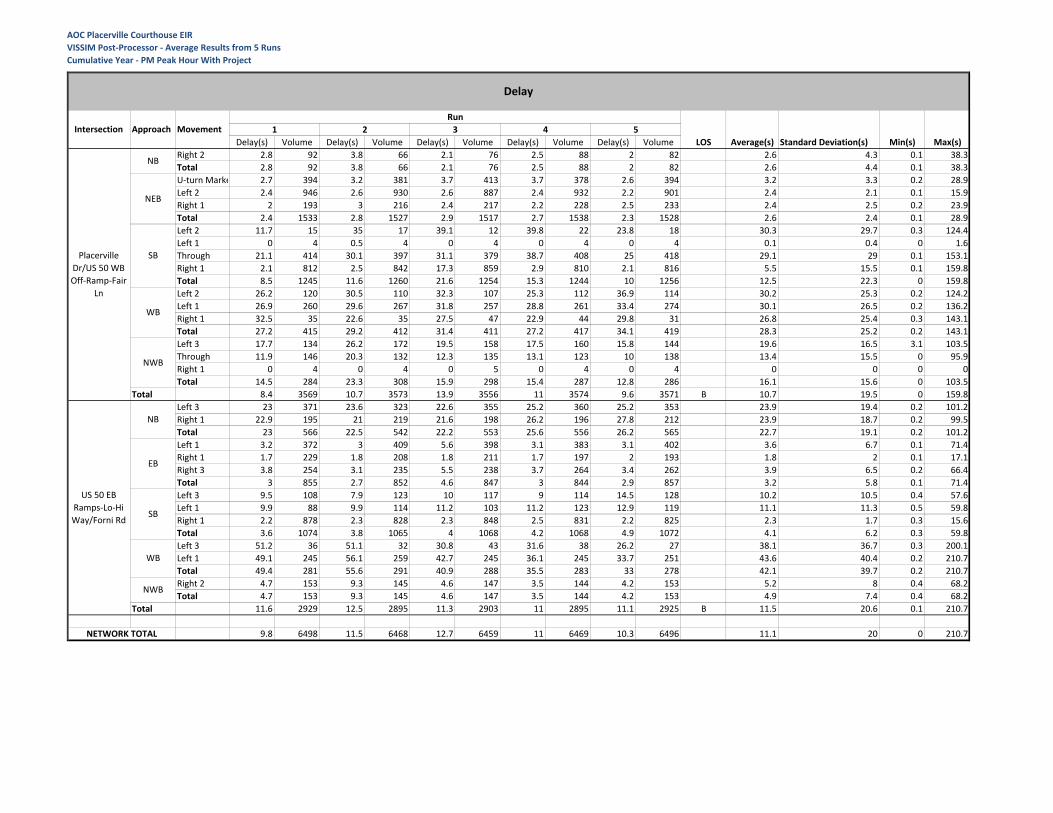
AOC Placerville Courthouse EIRVISSIM Post‐Processor ‐ Average Results from 5 RunsCumulative Year ‐ PM Peak Hour With Project
Delay(s) Volume Delay(s) Volume Delay(s) Volume Delay(s) Volume Delay(s) VolumeRight 2 2.8 92 3.8 66 2.1 76 2.5 88 2 82 2.6 4.3 0.1 38.3Total 2.8 92 3.8 66 2.1 76 2.5 88 2 82 2.6 4.4 0.1 38.3U‐turn Marke 2.7 394 3.2 381 3.7 413 3.7 378 2.6 394 3.2 3.3 0.2 28.9Left 2 2.4 946 2.6 930 2.6 887 2.4 932 2.2 901 2.4 2.1 0.1 15.9Right 1 2 193 3 216 2.4 217 2.2 228 2.5 233 2.4 2.5 0.2 23.9Total 2.4 1533 2.8 1527 2.9 1517 2.7 1538 2.3 1528 2.6 2.4 0.1 28.9Left 2 11.7 15 35 17 39.1 12 39.8 22 23.8 18 30.3 29.7 0.3 124.4Left 1 0 4 0.5 4 0 4 0 4 0 4 0.1 0.4 0 1.6Through 21.1 414 30.1 397 31.1 379 38.7 408 25 418 29.1 29 0.1 153.1Right 1 2.1 812 2.5 842 17.3 859 2.9 810 2.1 816 5.5 15.5 0.1 159.8Total 8.5 1245 11.6 1260 21.6 1254 15.3 1244 10 1256 12.5 22.3 0 159.8Left 2 26.2 120 30.5 110 32.3 107 25.3 112 36.9 114 30.2 25.3 0.2 124.2Left 1 26.9 260 29.6 267 31.8 257 28.8 261 33.4 274 30.1 26.5 0.2 136.2Right 1 32.5 35 22.6 35 27.5 47 22.9 44 29.8 31 26.8 25.4 0.3 143.1Total 27.2 415 29.2 412 31.4 411 27.2 417 34.1 419 28.3 25.2 0.2 143.1Left 3 17.7 134 26.2 172 19.5 158 17.5 160 15.8 144 19.6 16.5 3.1 103.5Through 11.9 146 20.3 132 12.3 135 13.1 123 10 138 13.4 15.5 0 95.9Right 1 0 4 0 4 0 5 0 4 0 4 0 0 0 0Total 14.5 284 23.3 308 15.9 298 15.4 287 12.8 286 16.1 15.6 0 103.5
Total 8.4 3569 10.7 3573 13.9 3556 11 3574 9.6 3571 B 10.7 19.5 0 159.8Left 3 23 371 23.6 323 22.6 355 25.2 360 25.2 353 23.9 19.4 0.2 101.2Right 1 22.9 195 21 219 21.6 198 26.2 196 27.8 212 23.9 18.7 0.2 99.5Total 23 566 22.5 542 22.2 553 25.6 556 26.2 565 22.7 19.1 0.2 101.2Left 1 3.2 372 3 409 5.6 398 3.1 383 3.1 402 3.6 6.7 0.1 71.4Right 1 1.7 229 1.8 208 1.8 211 1.7 197 2 193 1.8 2 0.1 17.1Right 3 3.8 254 3.1 235 5.5 238 3.7 264 3.4 262 3.9 6.5 0.2 66.4Total 3 855 2.7 852 4.6 847 3 844 2.9 857 3.2 5.8 0.1 71.4Left 3 9.5 108 7.9 123 10 117 9 114 14.5 128 10.2 10.5 0.4 57.6Left 1 9.9 88 9.9 114 11.2 103 11.2 123 12.9 119 11.1 11.3 0.5 59.8Right 1 2.2 878 2.3 828 2.3 848 2.5 831 2.2 825 2.3 1.7 0.3 15.6Total 3.6 1074 3.8 1065 4 1068 4.2 1068 4.9 1072 4.1 6.2 0.3 59.8Left 3 51.2 36 51.1 32 30.8 43 31.6 38 26.2 27 38.1 36.7 0.3 200.1Left 1 49.1 245 56.1 259 42.7 245 36.1 245 33.7 251 43.6 40.4 0.2 210.7Total 49.4 281 55.6 291 40.9 288 35.5 283 33 278 42.1 39.7 0.2 210.7Right 2 4.7 153 9.3 145 4.6 147 3.5 144 4.2 153 5.2 8 0.4 68.2Total 4.7 153 9.3 145 4.6 147 3.5 144 4.2 153 4.9 7.4 0.4 68.2
Total 11.6 2929 12.5 2895 11.3 2903 11 2895 11.1 2925 B 11.5 20.6 0.1 210.7
9.8 6498 11.5 6468 12.7 6459 11 6469 10.3 6496 11.1 20 0 210.7
Average(s) Standard Deviation(s) Min(s) Max(s)Intersection Approach Movement
Run1 2 3 4
NETWORK TOTAL
Delay
NB
EB
SB
WB
NWB
US 50 EB Ramps‐Lo‐Hi Way/Forni Rd
NB
NEB
SB
WB
NWB
Placerville Dr/US 50 WB Off‐Ramp‐Fair
Ln
5LOS

3: Forni Rd & Placerville Dr Cumulative+Project PM PeakHCM Unsignalized Intersection Capacity Analysis 12/9/2014
AOC Courthouse Project EIR Synchro 8 ReportCHS Consulting Group Page 1
Movement EBL EBR NBL NBT SBT SBRLane ConfigurationsVolume (veh/h) 0 390 92 1529 460 240Sign Control Stop Free FreeGrade 0% 0% 0%Peak Hour Factor 0.92 0.92 0.92 0.92 0.92 0.92Hourly flow rate (vph) 0 424 100 1662 500 261PedestriansLane Width (ft)Walking Speed (ft/s)Percent BlockageRight turn flare (veh)Median type None NoneMedian storage veh)Upstream signal (ft) 476pX, platoon unblockedvC, conflicting volume 2492 380 761vC1, stage 1 conf volvC2, stage 2 conf volvCu, unblocked vol 2492 380 761tC, single (s) 6.8 6.9 4.1tC, 2 stage (s)tF (s) 3.5 3.3 2.2p0 queue free % 100 31 88cM capacity (veh/h) 21 617 847Direction, Lane # EB 1 NB 1 NB 2 SB 1 SB 2Volume Total 424 100 1662 333 428Volume Left 0 100 0 0 0Volume Right 424 0 0 0 261cSH 617 847 1700 1700 1700Volume to Capacity 0.69 0.12 0.98 0.20 0.25Queue Length 95th (ft) 134 10 0 0 0Control Delay (s) 22.6 9.8 0.0 0.0 0.0Lane LOS C AApproach Delay (s) 22.6 0.6 0.0Approach LOS CIntersection SummaryAverage Delay 3.6Intersection Capacity Utilization 83.8% ICU Level of Service EAnalysis Period (min) 15

5: Forni Rd & US 50 EB Off Ramp & Ray Lawyer Dr Cumulative+Project PM PeakHCM Signalized Intersection Capacity Analysis 12/9/2014
AOC Courthouse Project EIR Synchro 8 ReportCHS Consulting Group Page 2
Movement EBL EBT EBR WBL WBT WBR NBL NBT NBR SBL SBT SBRLane ConfigurationsVolume (vph) 240 20 10 30 150 90 150 306 128 220 200 220Ideal Flow (vphpl) 1900 1900 1900 1900 1900 1900 1900 1900 1900 1900 1900 1900Total Lost time (s) 4.0 4.0 4.0 4.0 4.0 4.0 4.0 4.0 4.0 4.0Lane Util. Factor 1.00 1.00 1.00 1.00 1.00 1.00 1.00 1.00 1.00 1.00Frt 1.00 0.95 1.00 0.94 1.00 1.00 0.85 1.00 1.00 0.85Flt Protected 0.95 1.00 0.95 1.00 0.95 1.00 1.00 0.95 1.00 1.00Satd. Flow (prot) 1770 1770 1770 1758 1770 1863 1583 1770 1863 1583Flt Permitted 0.95 1.00 0.74 1.00 0.95 1.00 1.00 0.95 1.00 1.00Satd. Flow (perm) 1770 1770 1370 1758 1770 1863 1583 1770 1863 1583Peak-hour factor, PHF 0.92 0.92 0.92 0.92 0.92 0.92 0.92 0.92 0.92 0.92 0.92 0.92Adj. Flow (vph) 261 22 11 33 163 98 163 333 139 239 217 239RTOR Reduction (vph) 0 6 0 0 30 0 0 0 108 0 0 180Lane Group Flow (vph) 261 27 0 33 231 0 163 333 31 239 217 59Turn Type Prot NA Perm NA Prot NA custom Prot NA customProtected Phases 7 4 8 5 2 1Permitted Phases 8 2 6 6Actuated Green, G (s) 14.0 31.2 13.2 13.2 9.5 15.6 15.6 11.1 17.2 17.2Effective Green, g (s) 14.0 31.2 13.2 13.2 9.5 15.6 15.6 11.1 17.2 17.2Actuated g/C Ratio 0.20 0.45 0.19 0.19 0.14 0.22 0.22 0.16 0.25 0.25Clearance Time (s) 4.0 4.0 4.0 4.0 4.0 4.0 4.0 4.0 4.0 4.0Vehicle Extension (s) 3.0 3.0 3.0 3.0 3.0 3.0 3.0 3.0 3.0 3.0Lane Grp Cap (vph) 354 790 258 331 240 415 353 281 458 389v/s Ratio Prot c0.15 0.02 c0.13 0.09 0.02 c0.14v/s Ratio Perm 0.02 c0.18 0.12 0.04v/c Ratio 0.74 0.03 0.13 0.70 0.68 0.80 0.09 0.85 0.47 0.15Uniform Delay, d1 26.2 10.9 23.6 26.5 28.7 25.7 21.5 28.6 22.5 20.6Progression Factor 1.00 1.00 1.00 1.00 1.00 1.00 1.00 1.00 1.00 1.00Incremental Delay, d2 7.8 0.0 0.2 6.3 7.4 10.7 0.1 21.1 3.5 0.8Delay (s) 34.0 10.9 23.8 32.8 36.2 36.4 21.6 49.7 26.0 21.5Level of Service C B C C D D C D C CApproach Delay (s) 31.4 31.8 33.1 32.6Approach LOS C C C C
Intersection SummaryHCM 2000 Control Delay 32.4 HCM 2000 Level of Service CHCM 2000 Volume to Capacity ratio 0.77Actuated Cycle Length (s) 69.9 Sum of lost time (s) 16.0Intersection Capacity Utilization 68.3% ICU Level of Service CAnalysis Period (min) 15c Critical Lane Group

6: Ray Lawyer Dr & Fair Lane Cumulative+Project PM PeakHCM Signalized Intersection Capacity Analysis 12/9/2014
AOC Courthouse Project EIR Synchro 8 ReportCHS Consulting Group Page 3
Movement EBL EBR NBL NBT SBT SBRLane ConfigurationsVolume (vph) 200 350 270 415 428 100Ideal Flow (vphpl) 1900 1900 1900 1900 1900 1900Total Lost time (s) 4.0 4.0 4.0 4.0 4.0 4.0Lane Util. Factor 1.00 1.00 1.00 1.00 1.00 1.00Frt 1.00 0.85 1.00 1.00 1.00 0.85Flt Protected 0.95 1.00 0.95 1.00 1.00 1.00Satd. Flow (prot) 1770 1583 1770 1863 1863 1583Flt Permitted 0.95 1.00 0.44 1.00 1.00 1.00Satd. Flow (perm) 1770 1583 811 1863 1863 1583Peak-hour factor, PHF 0.92 0.92 0.92 0.92 0.92 0.92Adj. Flow (vph) 217 380 293 451 465 109RTOR Reduction (vph) 0 276 0 0 0 52Lane Group Flow (vph) 217 104 293 451 465 57Turn Type Prot Perm Perm NA NA PermProtected Phases 4 2 6Permitted Phases 4 2 6Actuated Green, G (s) 10.9 10.9 21.1 21.1 21.1 21.1Effective Green, g (s) 10.9 10.9 21.1 21.1 21.1 21.1Actuated g/C Ratio 0.27 0.27 0.53 0.53 0.53 0.53Clearance Time (s) 4.0 4.0 4.0 4.0 4.0 4.0Vehicle Extension (s) 3.0 3.0 3.0 3.0 3.0 3.0Lane Grp Cap (vph) 482 431 427 982 982 835v/s Ratio Prot c0.12 0.24 0.25v/s Ratio Perm 0.07 c0.36 0.04v/c Ratio 0.45 0.24 0.69 0.46 0.47 0.07Uniform Delay, d1 12.1 11.3 7.0 5.9 6.0 4.6Progression Factor 1.00 1.00 1.00 1.00 1.00 1.00Incremental Delay, d2 0.7 0.3 4.5 0.3 0.4 0.0Delay (s) 12.7 11.6 11.5 6.2 6.3 4.7Level of Service B B B A A AApproach Delay (s) 12.0 8.3 6.0Approach LOS B A A
Intersection SummaryHCM 2000 Control Delay 8.8 HCM 2000 Level of Service AHCM 2000 Volume to Capacity ratio 0.60Actuated Cycle Length (s) 40.0 Sum of lost time (s) 8.0Intersection Capacity Utilization 58.6% ICU Level of Service BAnalysis Period (min) 15c Critical Lane Group

7: Jail Driveway & Forni Rd Cumulative+Project PM PeakHCM Unsignalized Intersection Capacity Analysis 12/9/2014
AOC Courthouse Project EIR Synchro 8 ReportCHS Consulting Group Page 4
Movement EBT EBR WBL WBT NBL NBRLane ConfigurationsVolume (veh/h) 427 76 49 161 404 261Sign Control Free Free StopGrade 0% 0% 0%Peak Hour Factor 0.92 0.92 0.92 0.92 0.92 0.92Hourly flow rate (vph) 464 83 53 175 439 284PedestriansLane Width (ft)Walking Speed (ft/s)Percent BlockageRight turn flare (veh) 2Median type None NoneMedian storage veh)Upstream signal (ft) 553pX, platoon unblocked 0.94vC, conflicting volume 547 746 464vC1, stage 1 conf volvC2, stage 2 conf volvCu, unblocked vol 547 694 464tC, single (s) 4.1 6.4 6.2tC, 2 stage (s)tF (s) 2.2 3.5 3.3p0 queue free % 95 0 53cM capacity (veh/h) 1023 363 598Direction, Lane # EB 1 EB 2 WB 1 NB 1Volume Total 464 83 228 723Volume Left 0 0 53 439Volume Right 0 83 0 284cSH 1700 1700 1023 447Volume to Capacity 0.27 0.05 0.05 1.62Queue Length 95th (ft) 0 0 4 1028Control Delay (s) 0.0 0.0 2.4 311.1Lane LOS A FApproach Delay (s) 0.0 2.4 311.1Approach LOS FIntersection SummaryAverage Delay 150.5Intersection Capacity Utilization 66.0% ICU Level of Service CAnalysis Period (min) 15
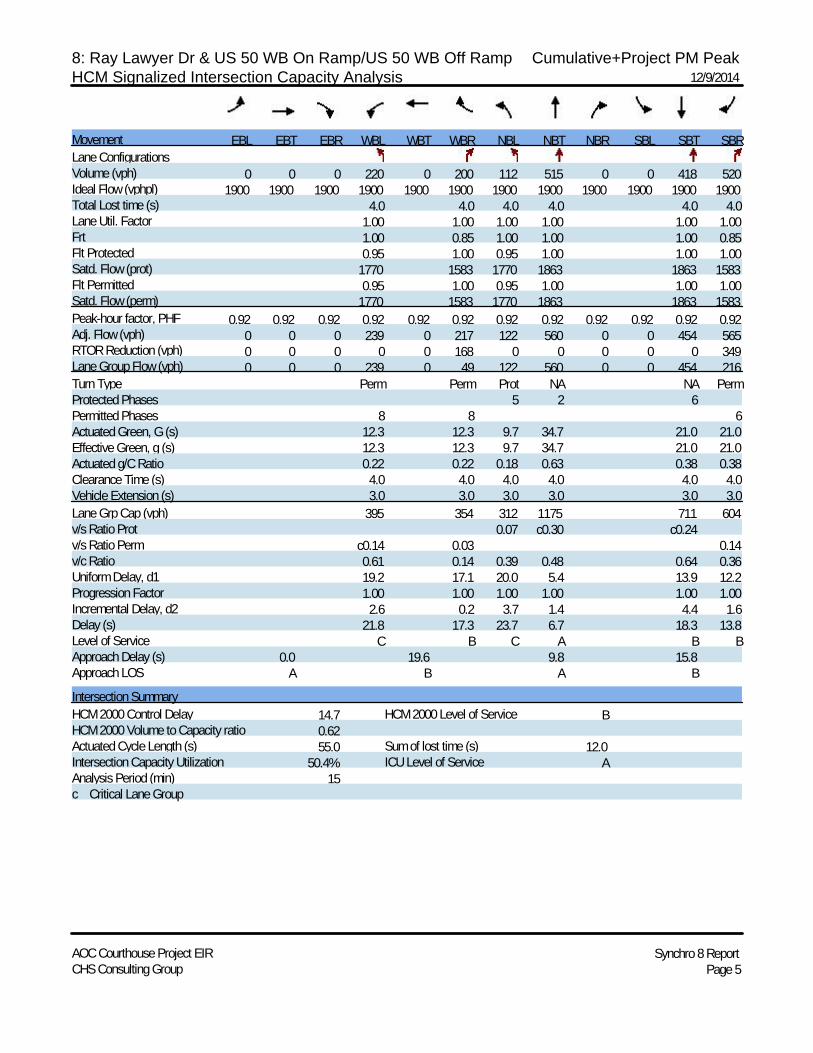
8: Ray Lawyer Dr & US 50 WB On Ramp/US 50 WB Off Ramp Cumulative+Project PM PeakHCM Signalized Intersection Capacity Analysis 12/9/2014
AOC Courthouse Project EIR Synchro 8 ReportCHS Consulting Group Page 5
Movement EBL EBT EBR WBL WBT WBR NBL NBT NBR SBL SBT SBRLane ConfigurationsVolume (vph) 0 0 0 220 0 200 112 515 0 0 418 520Ideal Flow (vphpl) 1900 1900 1900 1900 1900 1900 1900 1900 1900 1900 1900 1900Total Lost time (s) 4.0 4.0 4.0 4.0 4.0 4.0Lane Util. Factor 1.00 1.00 1.00 1.00 1.00 1.00Frt 1.00 0.85 1.00 1.00 1.00 0.85Flt Protected 0.95 1.00 0.95 1.00 1.00 1.00Satd. Flow (prot) 1770 1583 1770 1863 1863 1583Flt Permitted 0.95 1.00 0.95 1.00 1.00 1.00Satd. Flow (perm) 1770 1583 1770 1863 1863 1583Peak-hour factor, PHF 0.92 0.92 0.92 0.92 0.92 0.92 0.92 0.92 0.92 0.92 0.92 0.92Adj. Flow (vph) 0 0 0 239 0 217 122 560 0 0 454 565RTOR Reduction (vph) 0 0 0 0 0 168 0 0 0 0 0 349Lane Group Flow (vph) 0 0 0 239 0 49 122 560 0 0 454 216Turn Type Perm Perm Prot NA NA PermProtected Phases 5 2 6Permitted Phases 8 8 6Actuated Green, G (s) 12.3 12.3 9.7 34.7 21.0 21.0Effective Green, g (s) 12.3 12.3 9.7 34.7 21.0 21.0Actuated g/C Ratio 0.22 0.22 0.18 0.63 0.38 0.38Clearance Time (s) 4.0 4.0 4.0 4.0 4.0 4.0Vehicle Extension (s) 3.0 3.0 3.0 3.0 3.0 3.0Lane Grp Cap (vph) 395 354 312 1175 711 604v/s Ratio Prot 0.07 c0.30 c0.24v/s Ratio Perm c0.14 0.03 0.14v/c Ratio 0.61 0.14 0.39 0.48 0.64 0.36Uniform Delay, d1 19.2 17.1 20.0 5.4 13.9 12.2Progression Factor 1.00 1.00 1.00 1.00 1.00 1.00Incremental Delay, d2 2.6 0.2 3.7 1.4 4.4 1.6Delay (s) 21.8 17.3 23.7 6.7 18.3 13.8Level of Service C B C A B BApproach Delay (s) 0.0 19.6 9.8 15.8Approach LOS A B A B
Intersection SummaryHCM 2000 Control Delay 14.7 HCM 2000 Level of Service BHCM 2000 Volume to Capacity ratio 0.62Actuated Cycle Length (s) 55.0 Sum of lost time (s) 12.0Intersection Capacity Utilization 50.4% ICU Level of Service AAnalysis Period (min) 15c Critical Lane Group
AOC New Placerville Courthouse EIR - Appendix
APPENDIX B – INTERSECTION SIGNAL WARRANT ANALYSIS
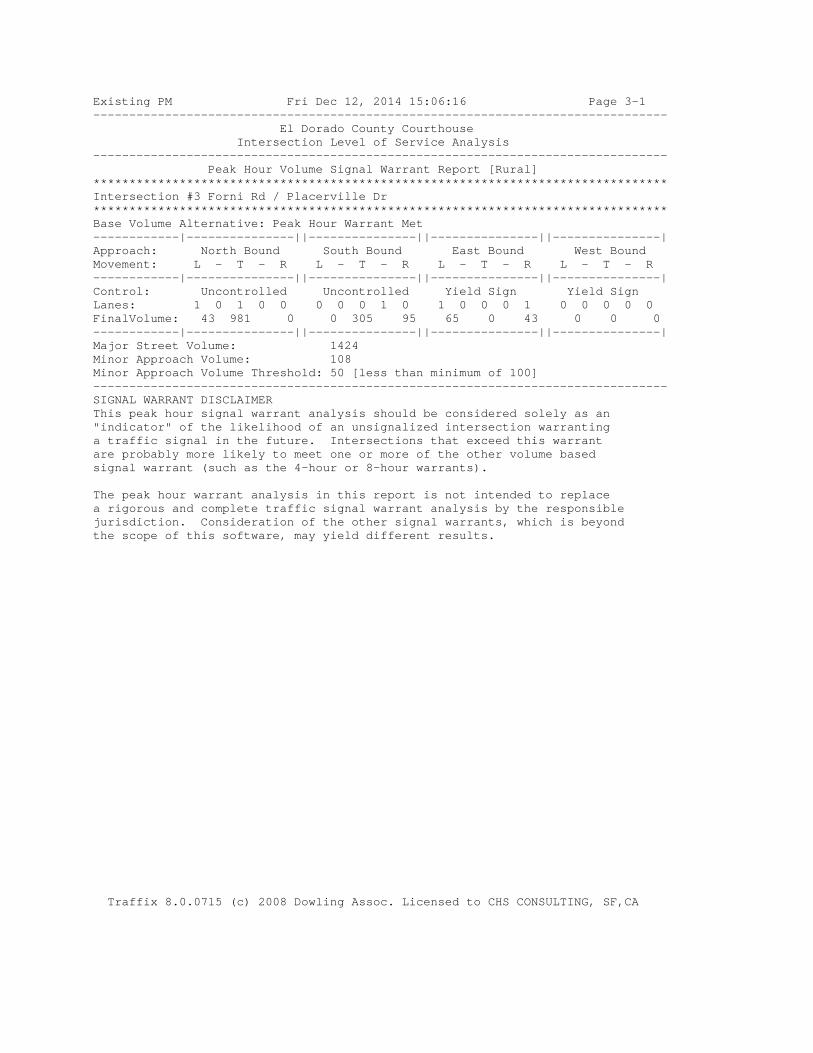
Existing PM Fri Dec 12, 2014 15:06:16 Page 3-1 -------------------------------------------------------------------------------- El Dorado County Courthouse Intersection Level of Service Analysis -------------------------------------------------------------------------------- Peak Hour Volume Signal Warrant Report [Rural] ********************************************************************************Intersection #3 Forni Rd / Placerville Dr ********************************************************************************Base Volume Alternative: Peak Hour Warrant Met------------|---------------||---------------||---------------||---------------|Approach: North Bound South Bound East Bound West Bound Movement: L - T - R L - T - R L - T - R L - T - R ------------|---------------||---------------||---------------||---------------|Control: Uncontrolled Uncontrolled Yield Sign Yield Sign Lanes: 1 0 1 0 0 0 0 0 1 0 1 0 0 0 1 0 0 0 0 0 FinalVolume: 43 981 0 0 305 95 65 0 43 0 0 0 ------------|---------------||---------------||---------------||---------------|Major Street Volume: 1424 Minor Approach Volume: 108 Minor Approach Volume Threshold: 50 [less than minimum of 100] --------------------------------------------------------------------------------SIGNAL WARRANT DISCLAIMERThis peak hour signal warrant analysis should be considered solely as an"indicator" of the likelihood of an unsignalized intersection warrantinga traffic signal in the future. Intersections that exceed this warrantare probably more likely to meet one or more of the other volume basedsignal warrant (such as the 4-hour or 8-hour warrants).
The peak hour warrant analysis in this report is not intended to replacea rigorous and complete traffic signal warrant analysis by the responsiblejurisdiction. Consideration of the other signal warrants, which is beyondthe scope of this software, may yield different results.
Traffix 8.0.0715 (c) 2008 Dowling Assoc. Licensed to CHS CONSULTING, SF,CA

Existing+Approved Projects Fri Dec 12, 2014 15:08:43 Page 3-1 -------------------------------------------------------------------------------- El Dorado County Courthouse Intersection Level of Service Analysis -------------------------------------------------------------------------------- Peak Hour Volume Signal Warrant Report [Rural] ********************************************************************************Intersection #7 Jail Site/Access Road/ Forni Rd ********************************************************************************Future Volume Alternative: Peak Hour Warrant Met------------|---------------||---------------||---------------||---------------|Approach: North Bound South Bound East Bound West Bound Movement: L - T - R L - T - R L - T - R L - T - R ------------|---------------||---------------||---------------||---------------|Control: Stop Sign Stop Sign Uncontrolled UncontrolledLanes: 1 0 0 0 1 0 0 0 0 0 0 0 1 0 1 0 1 0 0 0 FinalVolume: 412 0 192 0 0 0 0 455 83 53 172 0 ------------|---------------||---------------||---------------||---------------|Major Street Volume: 763 Minor Approach Volume: 604 Minor Approach Volume Threshold: 238 --------------------------------------------------------------------------------SIGNAL WARRANT DISCLAIMERThis peak hour signal warrant analysis should be considered solely as an"indicator" of the likelihood of an unsignalized intersection warrantinga traffic signal in the future. Intersections that exceed this warrantare probably more likely to meet one or more of the other volume basedsignal warrant (such as the 4-hour or 8-hour warrants).
The peak hour warrant analysis in this report is not intended to replacea rigorous and complete traffic signal warrant analysis by the responsiblejurisdiction. Consideration of the other signal warrants, which is beyondthe scope of this software, may yield different results.
Traffix 8.0.0715 (c) 2008 Dowling Assoc. Licensed to CHS CONSULTING, SF,CA

Existing+App+Project AM Fri Dec 12, 2014 15:09:34 Page 3-1 -------------------------------------------------------------------------------- El Dorado County Courthouse Intersection Level of Service Analysis -------------------------------------------------------------------------------- Peak Hour Volume Signal Warrant Report [Rural] ********************************************************************************Intersection #7 Jail Site/Access Road/ Forni Rd ********************************************************************************Future Volume Alternative: Peak Hour Warrant Met------------|---------------||---------------||---------------||---------------|Approach: North Bound South Bound East Bound West Bound Movement: L - T - R L - T - R L - T - R L - T - R ------------|---------------||---------------||---------------||---------------|Control: Stop Sign Stop Sign Uncontrolled UncontrolledLanes: 1 0 0 0 1 0 0 0 0 0 0 0 1 0 1 0 1 0 0 0 FinalVolume: 93 0 89 0 0 0 0 511 386 332 138 0 ------------|---------------||---------------||---------------||---------------|Major Street Volume: 1366 Minor Approach Volume: 183 Minor Approach Volume Threshold: 63 [less than minimum of 100] --------------------------------------------------------------------------------SIGNAL WARRANT DISCLAIMERThis peak hour signal warrant analysis should be considered solely as an"indicator" of the likelihood of an unsignalized intersection warrantinga traffic signal in the future. Intersections that exceed this warrantare probably more likely to meet one or more of the other volume basedsignal warrant (such as the 4-hour or 8-hour warrants).
The peak hour warrant analysis in this report is not intended to replacea rigorous and complete traffic signal warrant analysis by the responsiblejurisdiction. Consideration of the other signal warrants, which is beyondthe scope of this software, may yield different results.
Traffix 8.0.0715 (c) 2008 Dowling Assoc. Licensed to CHS CONSULTING, SF,CA

Existing+App+Project PM Fri Dec 12, 2014 15:10:37 Page 3-1 -------------------------------------------------------------------------------- El Dorado County Courthouse Intersection Level of Service Analysis -------------------------------------------------------------------------------- Peak Hour Volume Signal Warrant Report [Rural] ********************************************************************************Intersection #7 Jail Site/Access Road/ Forni Rd ********************************************************************************Future Volume Alternative: Peak Hour Warrant Met------------|---------------||---------------||---------------||---------------|Approach: North Bound South Bound East Bound West Bound Movement: L - T - R L - T - R L - T - R L - T - R ------------|---------------||---------------||---------------||---------------|Control: Stop Sign Stop Sign Uncontrolled UncontrolledLanes: 1 0 0 0 1 0 0 0 0 0 0 0 1 0 1 0 1 0 0 0 FinalVolume: 439 0 284 0 0 0 0 455 83 53 172 0 ------------|---------------||---------------||---------------||---------------|Major Street Volume: 763 Minor Approach Volume: 723 Minor Approach Volume Threshold: 238 --------------------------------------------------------------------------------SIGNAL WARRANT DISCLAIMERThis peak hour signal warrant analysis should be considered solely as an"indicator" of the likelihood of an unsignalized intersection warrantinga traffic signal in the future. Intersections that exceed this warrantare probably more likely to meet one or more of the other volume basedsignal warrant (such as the 4-hour or 8-hour warrants).
The peak hour warrant analysis in this report is not intended to replacea rigorous and complete traffic signal warrant analysis by the responsiblejurisdiction. Consideration of the other signal warrants, which is beyondthe scope of this software, may yield different results.
Traffix 8.0.0715 (c) 2008 Dowling Assoc. Licensed to CHS CONSULTING, SF,CA
AOC New Placerville Courthouse EIR - Appendix
APPENDIX C – U.S. 50 FREEWAY MAINLINE LOS CALCULATION OUTPUT SHEETS

AOC New Placerville Courthouse EIR - Appendix
U.S. 50 FREEWAY MAINLINE – WEST OF PLACERVILLE DRIVE

HCS2000: Basic Freeway Segments Release 4.1f Phone: Fax: E-mail: _________________________Operational Planning Analysis_________________________ Analyst: Peter Costa Agency or Company: CHS Consulting Group Date Performed: 4/25/14 Analysis Time Period: AM Peak Hour Freeway/Direction: US 50 EB From/To: West of Placerville Drive Jurisdiction: El Dorado County Analysis Year: Existing AM Peak Hour Description: AOC Courthouse Project EIR _________________________Flow Inputs and Adjustments___________________________ Annual average daily traffic, AADT 2000 veh/day Peak-hour proportion of AADT, K 1.00 Peak-hour direction percent, D 100 % Volume, DDHV 2000 veh/h Peak-hour factor, PHF 0.92 Trucks and buses 5 % Recreational vehicles 0 % Terrain type: Grade Grade 6.00 % Segment length 0.00 mi Trucks and buses PCE, ET 1.5 Recreational vehicles PCE, ER 4.0 Heavy Vehicle adjustment, fHV 0.976 Driver population factor, fp 1.00 Flow rate, vp 1114 pc/h/ln _________________________Speed Inputs and Adjustments__________________________ Lane width 12.0 ft Right-shoulder lateral clearance 6.0 ft Interchange density 0.50 interchange/mi Number of lanes, N 2 Free-flow speed: Measured FFS or BFFS 70.0 mi/h Lane width adjustment, fLW 0.0 mi/h Lateral clearance adjustment, fLC 0.0 mi/h Interchange density adjustment, fID 0.0 mi/h Number of lanes adjustment, fN 4.5 mi/h Free-flow speed 70.0 mi/h Urban Freeway _________________________LOS and Performance Measures__________________________ Flow rate, vp 1114 pc/h/ln Free-flow speed, FFS 70.0 mi/h

Average passenger-car speed, S 70.0 mi/h Number of lanes, N 2 Density, D 15.9 pc/mi/ln Level of Service, LOS B Overall results are not computed when free-flow speed is less than 55 mph.

HCS2000: Basic Freeway Segments Release 4.1f Phone: Fax: E-mail: _________________________Operational Planning Analysis_________________________ Analyst: Peter Costa Agency or Company: CHS Consulting Group Date Performed: 12/16/14 Analysis Time Period: AM Peak Hour Freeway/Direction: US 50 WB From/To: West of Placerville Drive Jurisdiction: El Dorado County Analysis Year: Existing AM Peak Hour Description: AOC Courthouse Project EIR _________________________Flow Inputs and Adjustments___________________________ Annual average daily traffic, AADT 2091 veh/day Peak-hour proportion of AADT, K 1.00 Peak-hour direction percent, D 100 % Volume, DDHV 2091 veh/h Peak-hour factor, PHF 0.92 Trucks and buses 3 % Recreational vehicles 0 % Terrain type: Rolling Grade 6.00 % Segment length 0.00 mi Trucks and buses PCE, ET 2.5 Recreational vehicles PCE, ER 2.0 Heavy Vehicle adjustment, fHV 0.957 Driver population factor, fp 1.00 Flow rate, vp 1188 pc/h/ln _________________________Speed Inputs and Adjustments__________________________ Lane width 12.0 ft Right-shoulder lateral clearance 6.0 ft Interchange density 0.50 interchange/mi Number of lanes, N 2 Free-flow speed: Measured FFS or BFFS 70.0 mi/h Lane width adjustment, fLW 0.0 mi/h Lateral clearance adjustment, fLC 0.0 mi/h Interchange density adjustment, fID 0.0 mi/h Number of lanes adjustment, fN 4.5 mi/h Free-flow speed 70.0 mi/h Urban Freeway _________________________LOS and Performance Measures__________________________ Flow rate, vp 1188 pc/h/ln Free-flow speed, FFS 70.0 mi/h

Average passenger-car speed, S 70.0 mi/h Number of lanes, N 2 Density, D 17.0 pc/mi/ln Level of Service, LOS B Overall results are not computed when free-flow speed is less than 55 mph.
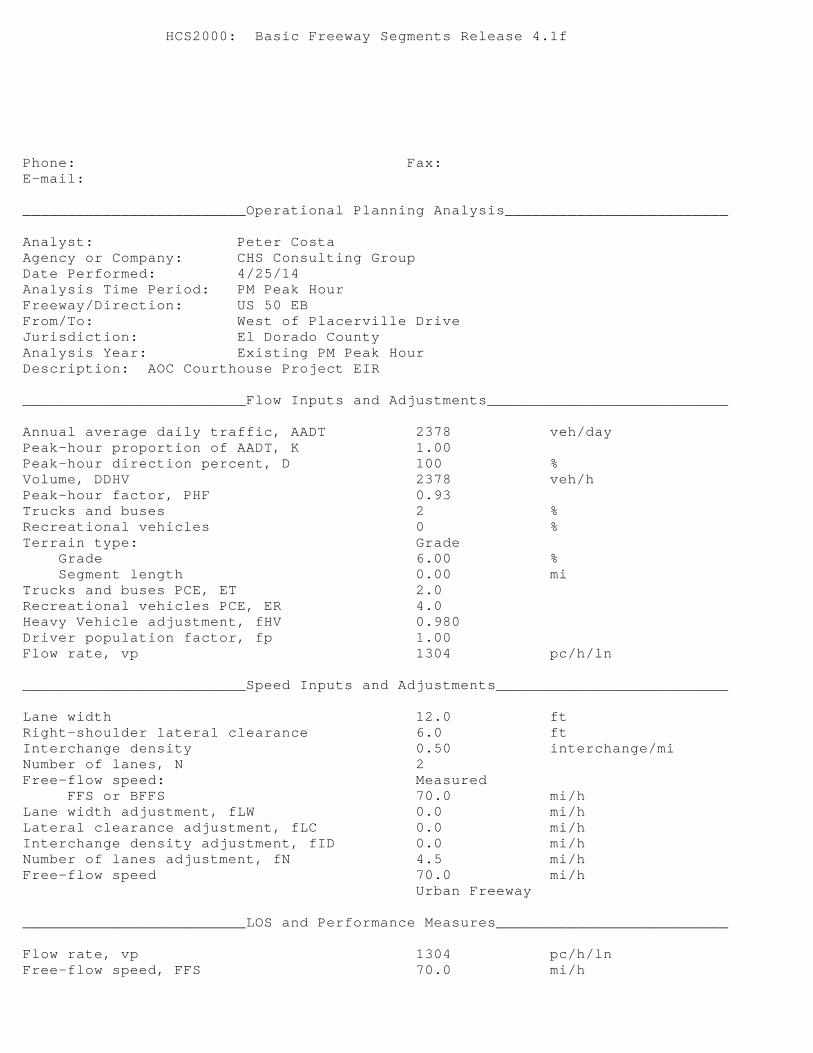
HCS2000: Basic Freeway Segments Release 4.1f Phone: Fax: E-mail: _________________________Operational Planning Analysis_________________________ Analyst: Peter Costa Agency or Company: CHS Consulting Group Date Performed: 4/25/14 Analysis Time Period: PM Peak Hour Freeway/Direction: US 50 EB From/To: West of Placerville Drive Jurisdiction: El Dorado County Analysis Year: Existing PM Peak Hour Description: AOC Courthouse Project EIR _________________________Flow Inputs and Adjustments___________________________ Annual average daily traffic, AADT 2378 veh/day Peak-hour proportion of AADT, K 1.00 Peak-hour direction percent, D 100 % Volume, DDHV 2378 veh/h Peak-hour factor, PHF 0.93 Trucks and buses 2 % Recreational vehicles 0 % Terrain type: Grade Grade 6.00 % Segment length 0.00 mi Trucks and buses PCE, ET 2.0 Recreational vehicles PCE, ER 4.0 Heavy Vehicle adjustment, fHV 0.980 Driver population factor, fp 1.00 Flow rate, vp 1304 pc/h/ln _________________________Speed Inputs and Adjustments__________________________ Lane width 12.0 ft Right-shoulder lateral clearance 6.0 ft Interchange density 0.50 interchange/mi Number of lanes, N 2 Free-flow speed: Measured FFS or BFFS 70.0 mi/h Lane width adjustment, fLW 0.0 mi/h Lateral clearance adjustment, fLC 0.0 mi/h Interchange density adjustment, fID 0.0 mi/h Number of lanes adjustment, fN 4.5 mi/h Free-flow speed 70.0 mi/h Urban Freeway _________________________LOS and Performance Measures__________________________ Flow rate, vp 1304 pc/h/ln Free-flow speed, FFS 70.0 mi/h

Average passenger-car speed, S 70.0 mi/h Number of lanes, N 2 Density, D 18.6 pc/mi/ln Level of Service, LOS C Overall results are not computed when free-flow speed is less than 55 mph.

HCS2000: Basic Freeway Segments Release 4.1f Phone: Fax: E-mail: _________________________Operational Planning Analysis_________________________ Analyst: Peter Costa Agency or Company: CHS Consulting Group Date Performed: 12/16/14 Analysis Time Period: PM Peak Hour Freeway/Direction: US 50 WB From/To: West of Placerville Drive Jurisdiction: El Dorado County Analysis Year: Existing PM Peak Hour Description: AOC Courthouse Project EIR _________________________Flow Inputs and Adjustments___________________________ Annual average daily traffic, AADT 2584 veh/day Peak-hour proportion of AADT, K 1.00 Peak-hour direction percent, D 100 % Volume, DDHV 2584 veh/h Peak-hour factor, PHF 0.93 Trucks and buses 4 % Recreational vehicles 0 % Terrain type: Rolling Grade 6.00 % Segment length 0.00 mi Trucks and buses PCE, ET 2.5 Recreational vehicles PCE, ER 2.0 Heavy Vehicle adjustment, fHV 0.943 Driver population factor, fp 1.00 Flow rate, vp 1473 pc/h/ln _________________________Speed Inputs and Adjustments__________________________ Lane width 12.0 ft Right-shoulder lateral clearance 6.0 ft Interchange density 0.50 interchange/mi Number of lanes, N 2 Free-flow speed: Measured FFS or BFFS 70.0 mi/h Lane width adjustment, fLW 0.0 mi/h Lateral clearance adjustment, fLC 0.0 mi/h Interchange density adjustment, fID 0.0 mi/h Number of lanes adjustment, fN 4.5 mi/h Free-flow speed 70.0 mi/h Urban Freeway _________________________LOS and Performance Measures__________________________ Flow rate, vp 1473 pc/h/ln Free-flow speed, FFS 70.0 mi/h

Average passenger-car speed, S 69.9 mi/h Number of lanes, N 2 Density, D 21.1 pc/mi/ln Level of Service, LOS C Overall results are not computed when free-flow speed is less than 55 mph.

HCS2000: Basic Freeway Segments Release 4.1f Phone: Fax: E-mail: _________________________Operational Planning Analysis_________________________ Analyst: Peter Costa Agency or Company: CHS Consulting Group Date Performed: 12/10/14 Analysis Time Period: AM Peak Hour Freeway/Direction: US 50 EB From/To: West of Placerville Drive Jurisdiction: El Dorado County Analysis Year: Existing+Project AM Peak Hour Description: AOC Courthouse Project EIR _________________________Flow Inputs and Adjustments___________________________ Annual average daily traffic, AADT 2137 veh/day Peak-hour proportion of AADT, K 1.00 Peak-hour direction percent, D 100 % Volume, DDHV 2137 veh/h Peak-hour factor, PHF 0.92 Trucks and buses 5 % Recreational vehicles 0 % Terrain type: Grade Grade 6.00 % Segment length 0.00 mi Trucks and buses PCE, ET 1.5 Recreational vehicles PCE, ER 4.0 Heavy Vehicle adjustment, fHV 0.976 Driver population factor, fp 1.00 Flow rate, vp 1190 pc/h/ln _________________________Speed Inputs and Adjustments__________________________ Lane width 12.0 ft Right-shoulder lateral clearance 6.0 ft Interchange density 0.50 interchange/mi Number of lanes, N 2 Free-flow speed: Measured FFS or BFFS 70.0 mi/h Lane width adjustment, fLW 0.0 mi/h Lateral clearance adjustment, fLC 0.0 mi/h Interchange density adjustment, fID 0.0 mi/h Number of lanes adjustment, fN 4.5 mi/h Free-flow speed 70.0 mi/h Urban Freeway _________________________LOS and Performance Measures__________________________ Flow rate, vp 1190 pc/h/ln Free-flow speed, FFS 70.0 mi/h

Average passenger-car speed, S 70.0 mi/h Number of lanes, N 2 Density, D 17.0 pc/mi/ln Level of Service, LOS B Overall results are not computed when free-flow speed is less than 55 mph.

HCS2000: Basic Freeway Segments Release 4.1f Phone: Fax: E-mail: _________________________Operational Planning Analysis_________________________ Analyst: Peter Costa Agency or Company: CHS Consulting Group Date Performed: 12/16/14 Analysis Time Period: AM Peak Hour Freeway/Direction: US 50 WB From/To: West of Placerville Drive Jurisdiction: El Dorado County Analysis Year: Existing+Project AM Peak Hour Description: AOC Courthouse Project EIR _________________________Flow Inputs and Adjustments___________________________ Annual average daily traffic, AADT 2107 veh/day Peak-hour proportion of AADT, K 1.00 Peak-hour direction percent, D 100 % Volume, DDHV 2107 veh/h Peak-hour factor, PHF 0.92 Trucks and buses 3 % Recreational vehicles 0 % Terrain type: Rolling Grade 6.00 % Segment length 0.00 mi Trucks and buses PCE, ET 2.5 Recreational vehicles PCE, ER 2.0 Heavy Vehicle adjustment, fHV 0.957 Driver population factor, fp 1.00 Flow rate, vp 1197 pc/h/ln _________________________Speed Inputs and Adjustments__________________________ Lane width 12.0 ft Right-shoulder lateral clearance 6.0 ft Interchange density 0.50 interchange/mi Number of lanes, N 2 Free-flow speed: Measured FFS or BFFS 70.0 mi/h Lane width adjustment, fLW 0.0 mi/h Lateral clearance adjustment, fLC 0.0 mi/h Interchange density adjustment, fID 0.0 mi/h Number of lanes adjustment, fN 4.5 mi/h Free-flow speed 70.0 mi/h Urban Freeway _________________________LOS and Performance Measures__________________________ Flow rate, vp 1197 pc/h/ln Free-flow speed, FFS 70.0 mi/h

Average passenger-car speed, S 70.0 mi/h Number of lanes, N 2 Density, D 17.1 pc/mi/ln Level of Service, LOS B Overall results are not computed when free-flow speed is less than 55 mph.

HCS2000: Basic Freeway Segments Release 4.1f Phone: Fax: E-mail: _________________________Operational Planning Analysis_________________________ Analyst: Peter Costa Agency or Company: CHS Consulting Group Date Performed: 4/25/14 Analysis Time Period: PM Peak Hour Freeway/Direction: US 50 EB From/To: West of Placerville Drive Jurisdiction: El Dorado County Analysis Year: Existing+Project PM Peak Hour Description: AOC Courthouse Project EIR _________________________Flow Inputs and Adjustments___________________________ Annual average daily traffic, AADT 2378 veh/day Peak-hour proportion of AADT, K 1.00 Peak-hour direction percent, D 100 % Volume, DDHV 2378 veh/h Peak-hour factor, PHF 0.93 Trucks and buses 2 % Recreational vehicles 0 % Terrain type: Grade Grade 6.00 % Segment length 0.00 mi Trucks and buses PCE, ET 2.0 Recreational vehicles PCE, ER 4.0 Heavy Vehicle adjustment, fHV 0.980 Driver population factor, fp 1.00 Flow rate, vp 1304 pc/h/ln _________________________Speed Inputs and Adjustments__________________________ Lane width 12.0 ft Right-shoulder lateral clearance 6.0 ft Interchange density 0.50 interchange/mi Number of lanes, N 2 Free-flow speed: Measured FFS or BFFS 70.0 mi/h Lane width adjustment, fLW 0.0 mi/h Lateral clearance adjustment, fLC 0.0 mi/h Interchange density adjustment, fID 0.0 mi/h Number of lanes adjustment, fN 4.5 mi/h Free-flow speed 70.0 mi/h Urban Freeway _________________________LOS and Performance Measures__________________________ Flow rate, vp 1304 pc/h/ln Free-flow speed, FFS 70.0 mi/h

Average passenger-car speed, S 70.0 mi/h Number of lanes, N 2 Density, D 18.6 pc/mi/ln Level of Service, LOS C Overall results are not computed when free-flow speed is less than 55 mph.

HCS2000: Basic Freeway Segments Release 4.1f Phone: Fax: E-mail: _________________________Operational Planning Analysis_________________________ Analyst: Peter Costa Agency or Company: CHS Consulting Group Date Performed: 12/16/14 Analysis Time Period: PM Peak Hour Freeway/Direction: US 50 WB From/To: West of Placerville Drive Jurisdiction: El Dorado County Analysis Year: Existing+Project PM Peak Hour Description: AOC Courthouse Project EIR _________________________Flow Inputs and Adjustments___________________________ Annual average daily traffic, AADT 2643 veh/day Peak-hour proportion of AADT, K 1.00 Peak-hour direction percent, D 100 % Volume, DDHV 2643 veh/h Peak-hour factor, PHF 0.93 Trucks and buses 4 % Recreational vehicles 0 % Terrain type: Rolling Grade 6.00 % Segment length 0.00 mi Trucks and buses PCE, ET 2.5 Recreational vehicles PCE, ER 2.0 Heavy Vehicle adjustment, fHV 0.943 Driver population factor, fp 1.00 Flow rate, vp 1506 pc/h/ln _________________________Speed Inputs and Adjustments__________________________ Lane width 12.0 ft Right-shoulder lateral clearance 6.0 ft Interchange density 0.50 interchange/mi Number of lanes, N 2 Free-flow speed: Measured FFS or BFFS 70.0 mi/h Lane width adjustment, fLW 0.0 mi/h Lateral clearance adjustment, fLC 0.0 mi/h Interchange density adjustment, fID 0.0 mi/h Number of lanes adjustment, fN 4.5 mi/h Free-flow speed 70.0 mi/h Urban Freeway _________________________LOS and Performance Measures__________________________ Flow rate, vp 1506 pc/h/ln Free-flow speed, FFS 70.0 mi/h

Average passenger-car speed, S 69.8 mi/h Number of lanes, N 2 Density, D 21.6 pc/mi/ln Level of Service, LOS C Overall results are not computed when free-flow speed is less than 55 mph.

HCS2000: Basic Freeway Segments Release 4.1f Phone: Fax: E-mail: _________________________Operational Planning Analysis_________________________ Analyst: Peter Costa Agency or Company: CHS Consulting Group Date Performed: 12/16/14 Analysis Time Period: AM Peak Hour - 2018 Freeway/Direction: US 50 EB From/To: West of Placerville Drive Jurisdiction: El Dorado County Analysis Year: Existing+Approved Projects AM Description: AOC Courthouse Project EIR _________________________Flow Inputs and Adjustments___________________________ Annual average daily traffic, AADT 2528 veh/day Peak-hour proportion of AADT, K 1.00 Peak-hour direction percent, D 100 % Volume, DDHV 2528 veh/h Peak-hour factor, PHF 0.92 Trucks and buses 5 % Recreational vehicles 0 % Terrain type: Grade Grade 6.00 % Segment length 0.00 mi Trucks and buses PCE, ET 1.5 Recreational vehicles PCE, ER 4.0 Heavy Vehicle adjustment, fHV 0.976 Driver population factor, fp 1.00 Flow rate, vp 939 pc/h/ln _________________________Speed Inputs and Adjustments__________________________ Lane width 12.0 ft Right-shoulder lateral clearance 6.0 ft Interchange density 0.50 interchange/mi Number of lanes, N 3 Free-flow speed: Measured FFS or BFFS 70.0 mi/h Lane width adjustment, fLW 0.0 mi/h Lateral clearance adjustment, fLC 0.0 mi/h Interchange density adjustment, fID 0.0 mi/h Number of lanes adjustment, fN 3.0 mi/h Free-flow speed 70.0 mi/h Urban Freeway _________________________LOS and Performance Measures__________________________ Flow rate, vp 939 pc/h/ln Free-flow speed, FFS 70.0 mi/h

Average passenger-car speed, S 70.0 mi/h Number of lanes, N 3 Density, D 13.4 pc/mi/ln Level of Service, LOS B Overall results are not computed when free-flow speed is less than 55 mph.

HCS2000: Basic Freeway Segments Release 4.1f Phone: Fax: E-mail: _________________________Operational Planning Analysis_________________________ Analyst: Peter Costa Agency or Company: CHS Consulting Group Date Performed: 12/16/14 Analysis Time Period: AM Peak Hour - 2018 Freeway/Direction: US 50 WB From/To: West of Placerville Drive Jurisdiction: El Dorado County Analysis Year: Existing+Approved Projects AM Description: AOC Courthouse Project EIR _________________________Flow Inputs and Adjustments___________________________ Annual average daily traffic, AADT 2417 veh/day Peak-hour proportion of AADT, K 1.00 Peak-hour direction percent, D 100 % Volume, DDHV 2417 veh/h Peak-hour factor, PHF 0.92 Trucks and buses 3 % Recreational vehicles 0 % Terrain type: Rolling Grade 6.00 % Segment length 0.00 mi Trucks and buses PCE, ET 2.5 Recreational vehicles PCE, ER 2.0 Heavy Vehicle adjustment, fHV 0.957 Driver population factor, fp 1.00 Flow rate, vp 915 pc/h/ln _________________________Speed Inputs and Adjustments__________________________ Lane width 12.0 ft Right-shoulder lateral clearance 6.0 ft Interchange density 0.50 interchange/mi Number of lanes, N 3 Free-flow speed: Measured FFS or BFFS 70.0 mi/h Lane width adjustment, fLW 0.0 mi/h Lateral clearance adjustment, fLC 0.0 mi/h Interchange density adjustment, fID 0.0 mi/h Number of lanes adjustment, fN 3.0 mi/h Free-flow speed 70.0 mi/h Urban Freeway _________________________LOS and Performance Measures__________________________ Flow rate, vp 915 pc/h/ln Free-flow speed, FFS 70.0 mi/h

Average passenger-car speed, S 70.0 mi/h Number of lanes, N 3 Density, D 13.1 pc/mi/ln Level of Service, LOS B Overall results are not computed when free-flow speed is less than 55 mph.
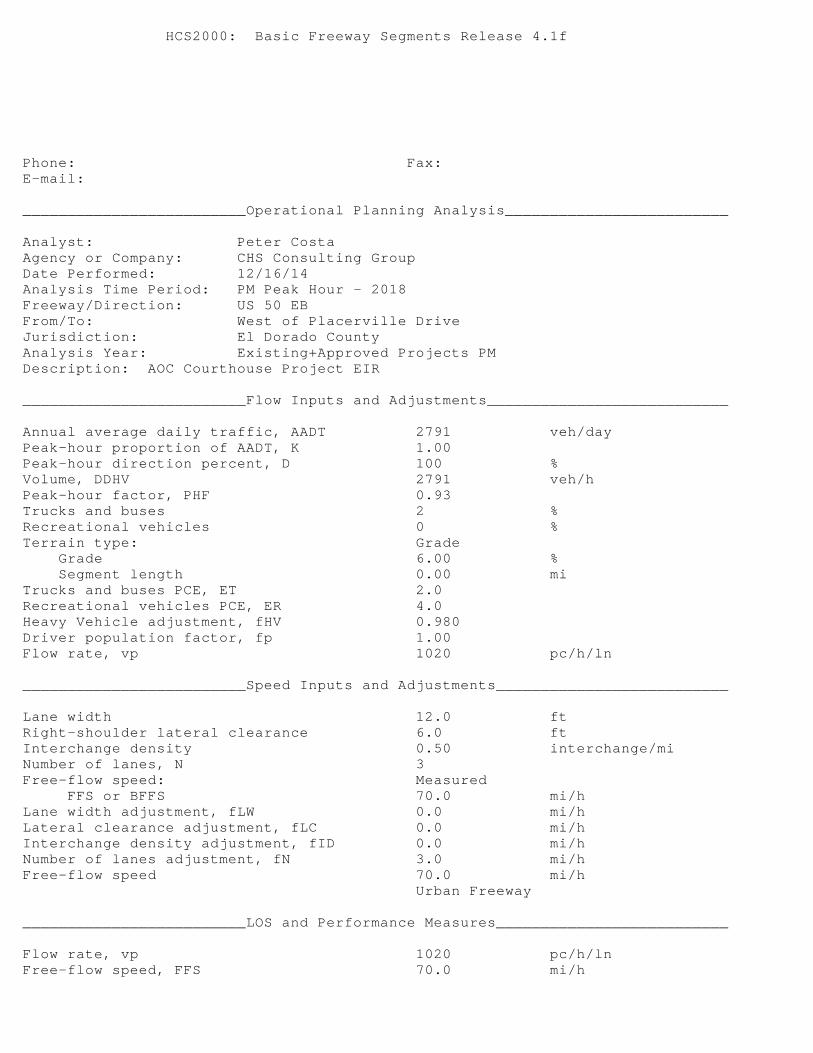
HCS2000: Basic Freeway Segments Release 4.1f Phone: Fax: E-mail: _________________________Operational Planning Analysis_________________________ Analyst: Peter Costa Agency or Company: CHS Consulting Group Date Performed: 12/16/14 Analysis Time Period: PM Peak Hour - 2018 Freeway/Direction: US 50 EB From/To: West of Placerville Drive Jurisdiction: El Dorado County Analysis Year: Existing+Approved Projects PM Description: AOC Courthouse Project EIR _________________________Flow Inputs and Adjustments___________________________ Annual average daily traffic, AADT 2791 veh/day Peak-hour proportion of AADT, K 1.00 Peak-hour direction percent, D 100 % Volume, DDHV 2791 veh/h Peak-hour factor, PHF 0.93 Trucks and buses 2 % Recreational vehicles 0 % Terrain type: Grade Grade 6.00 % Segment length 0.00 mi Trucks and buses PCE, ET 2.0 Recreational vehicles PCE, ER 4.0 Heavy Vehicle adjustment, fHV 0.980 Driver population factor, fp 1.00 Flow rate, vp 1020 pc/h/ln _________________________Speed Inputs and Adjustments__________________________ Lane width 12.0 ft Right-shoulder lateral clearance 6.0 ft Interchange density 0.50 interchange/mi Number of lanes, N 3 Free-flow speed: Measured FFS or BFFS 70.0 mi/h Lane width adjustment, fLW 0.0 mi/h Lateral clearance adjustment, fLC 0.0 mi/h Interchange density adjustment, fID 0.0 mi/h Number of lanes adjustment, fN 3.0 mi/h Free-flow speed 70.0 mi/h Urban Freeway _________________________LOS and Performance Measures__________________________ Flow rate, vp 1020 pc/h/ln Free-flow speed, FFS 70.0 mi/h

Average passenger-car speed, S 70.0 mi/h Number of lanes, N 3 Density, D 14.6 pc/mi/ln Level of Service, LOS B Overall results are not computed when free-flow speed is less than 55 mph.

HCS2000: Basic Freeway Segments Release 4.1f Phone: Fax: E-mail: _________________________Operational Planning Analysis_________________________ Analyst: Peter Costa Agency or Company: CHS Consulting Group Date Performed: 12/16/14 Analysis Time Period: PM Peak Hour - 2018 Freeway/Direction: US 50 WB From/To: West of Placerville Drive Jurisdiction: El Dorado County Analysis Year: Existing+Approved Projects PM Description: AOC Courthouse Project EIR _________________________Flow Inputs and Adjustments___________________________ Annual average daily traffic, AADT 3206 veh/day Peak-hour proportion of AADT, K 1.00 Peak-hour direction percent, D 100 % Volume, DDHV 3206 veh/h Peak-hour factor, PHF 0.93 Trucks and buses 4 % Recreational vehicles 0 % Terrain type: Rolling Grade 6.00 % Segment length 0.00 mi Trucks and buses PCE, ET 2.5 Recreational vehicles PCE, ER 2.0 Heavy Vehicle adjustment, fHV 0.943 Driver population factor, fp 1.00 Flow rate, vp 1218 pc/h/ln _________________________Speed Inputs and Adjustments__________________________ Lane width 12.0 ft Right-shoulder lateral clearance 6.0 ft Interchange density 0.50 interchange/mi Number of lanes, N 3 Free-flow speed: Measured FFS or BFFS 70.0 mi/h Lane width adjustment, fLW 0.0 mi/h Lateral clearance adjustment, fLC 0.0 mi/h Interchange density adjustment, fID 0.0 mi/h Number of lanes adjustment, fN 3.0 mi/h Free-flow speed 70.0 mi/h Urban Freeway _________________________LOS and Performance Measures__________________________ Flow rate, vp 1218 pc/h/ln Free-flow speed, FFS 70.0 mi/h

Average passenger-car speed, S 70.0 mi/h Number of lanes, N 3 Density, D 17.4 pc/mi/ln Level of Service, LOS B Overall results are not computed when free-flow speed is less than 55 mph.

HCS2000: Basic Freeway Segments Release 4.1f Phone: Fax: E-mail: _________________________Operational Planning Analysis_________________________ Analyst: Peter Costa Agency or Company: CHS Consulting Group Date Performed: 12/12/14 Analysis Time Period: AM Peak Hour - 2018 Freeway/Direction: US 50 EB From/To: West of Placerville Drive Jurisdiction: El Dorado County Analysis Year: Existing+App+Project AM Description: AOC Courthouse Project EIR _________________________Flow Inputs and Adjustments___________________________ Annual average daily traffic, AADT 2665 veh/day Peak-hour proportion of AADT, K 1.00 Peak-hour direction percent, D 100 % Volume, DDHV 2665 veh/h Peak-hour factor, PHF 0.92 Trucks and buses 5 % Recreational vehicles 0 % Terrain type: Grade Grade 6.00 % Segment length 0.00 mi Trucks and buses PCE, ET 1.5 Recreational vehicles PCE, ER 4.0 Heavy Vehicle adjustment, fHV 0.976 Driver population factor, fp 1.00 Flow rate, vp 990 pc/h/ln _________________________Speed Inputs and Adjustments__________________________ Lane width 12.0 ft Right-shoulder lateral clearance 6.0 ft Interchange density 0.50 interchange/mi Number of lanes, N 3 Free-flow speed: Measured FFS or BFFS 70.0 mi/h Lane width adjustment, fLW 0.0 mi/h Lateral clearance adjustment, fLC 0.0 mi/h Interchange density adjustment, fID 0.0 mi/h Number of lanes adjustment, fN 3.0 mi/h Free-flow speed 70.0 mi/h Urban Freeway _________________________LOS and Performance Measures__________________________ Flow rate, vp 990 pc/h/ln Free-flow speed, FFS 70.0 mi/h

Average passenger-car speed, S 70.0 mi/h Number of lanes, N 3 Density, D 14.1 pc/mi/ln Level of Service, LOS B Overall results are not computed when free-flow speed is less than 55 mph.

HCS2000: Basic Freeway Segments Release 4.1f Phone: Fax: E-mail: _________________________Operational Planning Analysis_________________________ Analyst: Peter Costa Agency or Company: CHS Consulting Group Date Performed: 12/16/14 Analysis Time Period: AM Peak Hour - 2018 Freeway/Direction: US 50 WB From/To: West of Placerville Drive Jurisdiction: El Dorado County Analysis Year: Existing+App+Project AM Description: AOC Courthouse Project EIR _________________________Flow Inputs and Adjustments___________________________ Annual average daily traffic, AADT 2433 veh/day Peak-hour proportion of AADT, K 1.00 Peak-hour direction percent, D 100 % Volume, DDHV 2433 veh/h Peak-hour factor, PHF 0.92 Trucks and buses 3 % Recreational vehicles 0 % Terrain type: Rolling Grade 6.00 % Segment length 0.00 mi Trucks and buses PCE, ET 2.5 Recreational vehicles PCE, ER 2.0 Heavy Vehicle adjustment, fHV 0.957 Driver population factor, fp 1.00 Flow rate, vp 921 pc/h/ln _________________________Speed Inputs and Adjustments__________________________ Lane width 12.0 ft Right-shoulder lateral clearance 6.0 ft Interchange density 0.50 interchange/mi Number of lanes, N 3 Free-flow speed: Measured FFS or BFFS 70.0 mi/h Lane width adjustment, fLW 0.0 mi/h Lateral clearance adjustment, fLC 0.0 mi/h Interchange density adjustment, fID 0.0 mi/h Number of lanes adjustment, fN 3.0 mi/h Free-flow speed 70.0 mi/h Urban Freeway _________________________LOS and Performance Measures__________________________ Flow rate, vp 921 pc/h/ln Free-flow speed, FFS 70.0 mi/h

Average passenger-car speed, S 70.0 mi/h Number of lanes, N 3 Density, D 13.2 pc/mi/ln Level of Service, LOS B Overall results are not computed when free-flow speed is less than 55 mph.

HCS2000: Basic Freeway Segments Release 4.1f Phone: Fax: E-mail: _________________________Operational Planning Analysis_________________________ Analyst: Peter Costa Agency or Company: CHS Consulting Group Date Performed: 12/16/14 Analysis Time Period: PM Peak Hour - 2018 Freeway/Direction: US 50 EB From/To: West of Placerville Drive Jurisdiction: El Dorado County Analysis Year: Existing+App+Project PM Description: AOC Courthouse Project EIR _________________________Flow Inputs and Adjustments___________________________ Annual average daily traffic, AADT 2791 veh/day Peak-hour proportion of AADT, K 1.00 Peak-hour direction percent, D 100 % Volume, DDHV 2791 veh/h Peak-hour factor, PHF 0.93 Trucks and buses 2 % Recreational vehicles 0 % Terrain type: Grade Grade 6.00 % Segment length 0.00 mi Trucks and buses PCE, ET 2.0 Recreational vehicles PCE, ER 4.0 Heavy Vehicle adjustment, fHV 0.980 Driver population factor, fp 1.00 Flow rate, vp 1020 pc/h/ln _________________________Speed Inputs and Adjustments__________________________ Lane width 12.0 ft Right-shoulder lateral clearance 6.0 ft Interchange density 0.50 interchange/mi Number of lanes, N 3 Free-flow speed: Measured FFS or BFFS 70.0 mi/h Lane width adjustment, fLW 0.0 mi/h Lateral clearance adjustment, fLC 0.0 mi/h Interchange density adjustment, fID 0.0 mi/h Number of lanes adjustment, fN 3.0 mi/h Free-flow speed 70.0 mi/h Urban Freeway _________________________LOS and Performance Measures__________________________ Flow rate, vp 1020 pc/h/ln Free-flow speed, FFS 70.0 mi/h

Average passenger-car speed, S 70.0 mi/h Number of lanes, N 3 Density, D 14.6 pc/mi/ln Level of Service, LOS B Overall results are not computed when free-flow speed is less than 55 mph.

HCS2000: Basic Freeway Segments Release 4.1f Phone: Fax: E-mail: _________________________Operational Planning Analysis_________________________ Analyst: Peter Costa Agency or Company: CHS Consulting Group Date Performed: 12/16/14 Analysis Time Period: PM Peak Hour - 2018 Freeway/Direction: US 50 WB From/To: West of Placerville Drive Jurisdiction: El Dorado County Analysis Year: Existing+App+Project PM Description: AOC Courthouse Project EIR _________________________Flow Inputs and Adjustments___________________________ Annual average daily traffic, AADT 3265 veh/day Peak-hour proportion of AADT, K 1.00 Peak-hour direction percent, D 100 % Volume, DDHV 3265 veh/h Peak-hour factor, PHF 0.93 Trucks and buses 4 % Recreational vehicles 0 % Terrain type: Rolling Grade 6.00 % Segment length 0.00 mi Trucks and buses PCE, ET 2.5 Recreational vehicles PCE, ER 2.0 Heavy Vehicle adjustment, fHV 0.943 Driver population factor, fp 1.00 Flow rate, vp 1240 pc/h/ln _________________________Speed Inputs and Adjustments__________________________ Lane width 12.0 ft Right-shoulder lateral clearance 6.0 ft Interchange density 0.50 interchange/mi Number of lanes, N 3 Free-flow speed: Measured FFS or BFFS 70.0 mi/h Lane width adjustment, fLW 0.0 mi/h Lateral clearance adjustment, fLC 0.0 mi/h Interchange density adjustment, fID 0.0 mi/h Number of lanes adjustment, fN 3.0 mi/h Free-flow speed 70.0 mi/h Urban Freeway _________________________LOS and Performance Measures__________________________ Flow rate, vp 1240 pc/h/ln Free-flow speed, FFS 70.0 mi/h

Average passenger-car speed, S 70.0 mi/h Number of lanes, N 3 Density, D 17.7 pc/mi/ln Level of Service, LOS B Overall results are not computed when free-flow speed is less than 55 mph.

HCS2000: Basic Freeway Segments Release 4.1f Phone: Fax: E-mail: _________________________Operational Planning Analysis_________________________ Analyst: Peter Costa Agency or Company: CHS Consulting Group Date Performed: 12/16/14 Analysis Time Period: AM Peak Hour - 2045 Freeway/Direction: US 50 EB From/To: West of Placerville Drive Jurisdiction: El Dorado County Analysis Year: Cumulative (2045) AM Peak Description: AOC Courthouse Project EIR _________________________Flow Inputs and Adjustments___________________________ Annual average daily traffic, AADT 3721 veh/day Peak-hour proportion of AADT, K 1.00 Peak-hour direction percent, D 100 % Volume, DDHV 3721 veh/h Peak-hour factor, PHF 0.92 Trucks and buses 5 % Recreational vehicles 0 % Terrain type: Grade Grade 6.00 % Segment length 0.00 mi Trucks and buses PCE, ET 1.5 Recreational vehicles PCE, ER 4.0 Heavy Vehicle adjustment, fHV 0.976 Driver population factor, fp 1.00 Flow rate, vp 1382 pc/h/ln _________________________Speed Inputs and Adjustments__________________________ Lane width 12.0 ft Right-shoulder lateral clearance 6.0 ft Interchange density 0.50 interchange/mi Number of lanes, N 3 Free-flow speed: Measured FFS or BFFS 70.0 mi/h Lane width adjustment, fLW 0.0 mi/h Lateral clearance adjustment, fLC 0.0 mi/h Interchange density adjustment, fID 0.0 mi/h Number of lanes adjustment, fN 3.0 mi/h Free-flow speed 70.0 mi/h Urban Freeway _________________________LOS and Performance Measures__________________________ Flow rate, vp 1382 pc/h/ln Free-flow speed, FFS 70.0 mi/h

Average passenger-car speed, S 70.0 mi/h Number of lanes, N 3 Density, D 19.7 pc/mi/ln Level of Service, LOS C Overall results are not computed when free-flow speed is less than 55 mph.

HCS2000: Basic Freeway Segments Release 4.1f Phone: Fax: E-mail: _________________________Operational Planning Analysis_________________________ Analyst: Peter Costa Agency or Company: CHS Consulting Group Date Performed: 12/16/14 Analysis Time Period: AM Peak Hour - 2045 Freeway/Direction: US 50 WB From/To: West of Placerville Drive Jurisdiction: El Dorado County Analysis Year: Cumulative (2045) AM Description: AOC Courthouse Project EIR _________________________Flow Inputs and Adjustments___________________________ Annual average daily traffic, AADT 3330 veh/day Peak-hour proportion of AADT, K 1.00 Peak-hour direction percent, D 100 % Volume, DDHV 3330 veh/h Peak-hour factor, PHF 0.92 Trucks and buses 3 % Recreational vehicles 0 % Terrain type: Rolling Grade 6.00 % Segment length 0.00 mi Trucks and buses PCE, ET 2.5 Recreational vehicles PCE, ER 2.0 Heavy Vehicle adjustment, fHV 0.957 Driver population factor, fp 1.00 Flow rate, vp 1261 pc/h/ln _________________________Speed Inputs and Adjustments__________________________ Lane width 12.0 ft Right-shoulder lateral clearance 6.0 ft Interchange density 0.50 interchange/mi Number of lanes, N 3 Free-flow speed: Measured FFS or BFFS 70.0 mi/h Lane width adjustment, fLW 0.0 mi/h Lateral clearance adjustment, fLC 0.0 mi/h Interchange density adjustment, fID 0.0 mi/h Number of lanes adjustment, fN 3.0 mi/h Free-flow speed 70.0 mi/h Urban Freeway _________________________LOS and Performance Measures__________________________ Flow rate, vp 1261 pc/h/ln Free-flow speed, FFS 70.0 mi/h

Average passenger-car speed, S 70.0 mi/h Number of lanes, N 3 Density, D 18.0+ pc/mi/ln Level of Service, LOS C Overall results are not computed when free-flow speed is less than 55 mph.

HCS2000: Basic Freeway Segments Release 4.1f Phone: Fax: E-mail: _________________________Operational Planning Analysis_________________________ Analyst: Peter Costa Agency or Company: CHS Consulting Group Date Performed: 12/16/14 Analysis Time Period: PM Peak Hour - 2045 Freeway/Direction: US 50 EB From/To: West of Placerville Drive Jurisdiction: El Dorado County Analysis Year: Cumulative (2045) PM Description: AOC Courthouse Project EIR _________________________Flow Inputs and Adjustments___________________________ Annual average daily traffic, AADT 3824 veh/day Peak-hour proportion of AADT, K 1.00 Peak-hour direction percent, D 100 % Volume, DDHV 3824 veh/h Peak-hour factor, PHF 0.93 Trucks and buses 2 % Recreational vehicles 0 % Terrain type: Grade Grade 6.00 % Segment length 0.00 mi Trucks and buses PCE, ET 2.0 Recreational vehicles PCE, ER 4.0 Heavy Vehicle adjustment, fHV 0.980 Driver population factor, fp 1.00 Flow rate, vp 1398 pc/h/ln _________________________Speed Inputs and Adjustments__________________________ Lane width 12.0 ft Right-shoulder lateral clearance 6.0 ft Interchange density 0.50 interchange/mi Number of lanes, N 3 Free-flow speed: Measured FFS or BFFS 70.0 mi/h Lane width adjustment, fLW 0.0 mi/h Lateral clearance adjustment, fLC 0.0 mi/h Interchange density adjustment, fID 0.0 mi/h Number of lanes adjustment, fN 3.0 mi/h Free-flow speed 70.0 mi/h Urban Freeway _________________________LOS and Performance Measures__________________________ Flow rate, vp 1398 pc/h/ln Free-flow speed, FFS 70.0 mi/h

Average passenger-car speed, S 70.0 mi/h Number of lanes, N 3 Density, D 20.0 pc/mi/ln Level of Service, LOS C Overall results are not computed when free-flow speed is less than 55 mph.

HCS2000: Basic Freeway Segments Release 4.1f Phone: Fax: E-mail: _________________________Operational Planning Analysis_________________________ Analyst: Peter Costa Agency or Company: CHS Consulting Group Date Performed: 12/16/14 Analysis Time Period: PM Peak Hour - 2045 Freeway/Direction: US 50 WB From/To: West of Placerville Drive Jurisdiction: El Dorado County Analysis Year: Cumulative (2045) PM Description: AOC Courthouse Project EIR _________________________Flow Inputs and Adjustments___________________________ Annual average daily traffic, AADT 4714 veh/day Peak-hour proportion of AADT, K 1.00 Peak-hour direction percent, D 100 % Volume, DDHV 4714 veh/h Peak-hour factor, PHF 0.93 Trucks and buses 4 % Recreational vehicles 0 % Terrain type: Rolling Grade 6.00 % Segment length 0.00 mi Trucks and buses PCE, ET 2.5 Recreational vehicles PCE, ER 2.0 Heavy Vehicle adjustment, fHV 0.943 Driver population factor, fp 1.00 Flow rate, vp 1791 pc/h/ln _________________________Speed Inputs and Adjustments__________________________ Lane width 12.0 ft Right-shoulder lateral clearance 6.0 ft Interchange density 0.50 interchange/mi Number of lanes, N 3 Free-flow speed: Measured FFS or BFFS 70.0 mi/h Lane width adjustment, fLW 0.0 mi/h Lateral clearance adjustment, fLC 0.0 mi/h Interchange density adjustment, fID 0.0 mi/h Number of lanes adjustment, fN 3.0 mi/h Free-flow speed 70.0 mi/h Urban Freeway _________________________LOS and Performance Measures__________________________ Flow rate, vp 1791 pc/h/ln Free-flow speed, FFS 70.0 mi/h

Average passenger-car speed, S 68.0 mi/h Number of lanes, N 3 Density, D 26.4 pc/mi/ln Level of Service, LOS D Overall results are not computed when free-flow speed is less than 55 mph.

HCS2000: Basic Freeway Segments Release 4.1f Phone: Fax: E-mail: _________________________Operational Planning Analysis_________________________ Analyst: Peter Costa Agency or Company: CHS Consulting Group Date Performed: 12/12/14 Analysis Time Period: AM Peak Hour - 2045 Freeway/Direction: US 50 EB From/To: West of Placerville Drive Jurisdiction: El Dorado County Analysis Year: Cumulative+Project AM Peak Description: AOC Courthouse Project EIR _________________________Flow Inputs and Adjustments___________________________ Annual average daily traffic, AADT 3858 veh/day Peak-hour proportion of AADT, K 1.00 Peak-hour direction percent, D 100 % Volume, DDHV 3858 veh/h Peak-hour factor, PHF 0.92 Trucks and buses 5 % Recreational vehicles 0 % Terrain type: Grade Grade 6.00 % Segment length 0.00 mi Trucks and buses PCE, ET 1.5 Recreational vehicles PCE, ER 4.0 Heavy Vehicle adjustment, fHV 0.976 Driver population factor, fp 1.00 Flow rate, vp 1433 pc/h/ln _________________________Speed Inputs and Adjustments__________________________ Lane width 12.0 ft Right-shoulder lateral clearance 6.0 ft Interchange density 0.50 interchange/mi Number of lanes, N 3 Free-flow speed: Measured FFS or BFFS 70.0 mi/h Lane width adjustment, fLW 0.0 mi/h Lateral clearance adjustment, fLC 0.0 mi/h Interchange density adjustment, fID 0.0 mi/h Number of lanes adjustment, fN 3.0 mi/h Free-flow speed 70.0 mi/h Urban Freeway _________________________LOS and Performance Measures__________________________ Flow rate, vp 1433 pc/h/ln Free-flow speed, FFS 70.0 mi/h

Average passenger-car speed, S 69.9 mi/h Number of lanes, N 3 Density, D 20.5 pc/mi/ln Level of Service, LOS C Overall results are not computed when free-flow speed is less than 55 mph.

HCS2000: Basic Freeway Segments Release 4.1f Phone: Fax: E-mail: _________________________Operational Planning Analysis_________________________ Analyst: Peter Costa Agency or Company: CHS Consulting Group Date Performed: 12/16/14 Analysis Time Period: AM Peak Hour - 2045 Freeway/Direction: US 50 WB From/To: West of Placerville Drive Jurisdiction: El Dorado County Analysis Year: Cumulative+Project AM Peak Description: AOC Courthouse Project EIR _________________________Flow Inputs and Adjustments___________________________ Annual average daily traffic, AADT 3316 veh/day Peak-hour proportion of AADT, K 1.00 Peak-hour direction percent, D 100 % Volume, DDHV 3316 veh/h Peak-hour factor, PHF 0.92 Trucks and buses 3 % Recreational vehicles 0 % Terrain type: Rolling Grade 6.00 % Segment length 0.00 mi Trucks and buses PCE, ET 2.5 Recreational vehicles PCE, ER 2.0 Heavy Vehicle adjustment, fHV 0.957 Driver population factor, fp 1.00 Flow rate, vp 1256 pc/h/ln _________________________Speed Inputs and Adjustments__________________________ Lane width 12.0 ft Right-shoulder lateral clearance 6.0 ft Interchange density 0.50 interchange/mi Number of lanes, N 3 Free-flow speed: Measured FFS or BFFS 70.0 mi/h Lane width adjustment, fLW 0.0 mi/h Lateral clearance adjustment, fLC 0.0 mi/h Interchange density adjustment, fID 0.0 mi/h Number of lanes adjustment, fN 3.0 mi/h Free-flow speed 70.0 mi/h Urban Freeway _________________________LOS and Performance Measures__________________________ Flow rate, vp 1256 pc/h/ln Free-flow speed, FFS 70.0 mi/h

Average passenger-car speed, S 70.0 mi/h Number of lanes, N 3 Density, D 17.9 pc/mi/ln Level of Service, LOS B Overall results are not computed when free-flow speed is less than 55 mph.

HCS2000: Basic Freeway Segments Release 4.1f Phone: Fax: E-mail: _________________________Operational Planning Analysis_________________________ Analyst: Peter Costa Agency or Company: CHS Consulting Group Date Performed: 12/16/14 Analysis Time Period: PM Peak Hour - 2045 Freeway/Direction: US 50 EB From/To: West of Placerville Drive Jurisdiction: El Dorado County Analysis Year: Cumulative+Project PM Peak Description: AOC Courthouse Project EIR _________________________Flow Inputs and Adjustments___________________________ Annual average daily traffic, AADT 3824 veh/day Peak-hour proportion of AADT, K 1.00 Peak-hour direction percent, D 100 % Volume, DDHV 3824 veh/h Peak-hour factor, PHF 0.93 Trucks and buses 2 % Recreational vehicles 0 % Terrain type: Grade Grade 6.00 % Segment length 0.00 mi Trucks and buses PCE, ET 2.0 Recreational vehicles PCE, ER 4.0 Heavy Vehicle adjustment, fHV 0.980 Driver population factor, fp 1.00 Flow rate, vp 1398 pc/h/ln _________________________Speed Inputs and Adjustments__________________________ Lane width 12.0 ft Right-shoulder lateral clearance 6.0 ft Interchange density 0.50 interchange/mi Number of lanes, N 3 Free-flow speed: Measured FFS or BFFS 70.0 mi/h Lane width adjustment, fLW 0.0 mi/h Lateral clearance adjustment, fLC 0.0 mi/h Interchange density adjustment, fID 0.0 mi/h Number of lanes adjustment, fN 3.0 mi/h Free-flow speed 70.0 mi/h Urban Freeway _________________________LOS and Performance Measures__________________________ Flow rate, vp 1398 pc/h/ln Free-flow speed, FFS 70.0 mi/h

Average passenger-car speed, S 70.0 mi/h Number of lanes, N 3 Density, D 20.0 pc/mi/ln Level of Service, LOS C Overall results are not computed when free-flow speed is less than 55 mph.

HCS2000: Basic Freeway Segments Release 4.1f Phone: Fax: E-mail: _________________________Operational Planning Analysis_________________________ Analyst: Peter Costa Agency or Company: CHS Consulting Group Date Performed: 12/16/14 Analysis Time Period: PM Peak Hour - 2045 Freeway/Direction: US 50 WB From/To: West of Placerville Drive Jurisdiction: El Dorado County Analysis Year: Cumulative+Project PM Peak Description: AOC Courthouse Project EIR _________________________Flow Inputs and Adjustments___________________________ Annual average daily traffic, AADT 4773 veh/day Peak-hour proportion of AADT, K 1.00 Peak-hour direction percent, D 100 % Volume, DDHV 4773 veh/h Peak-hour factor, PHF 0.93 Trucks and buses 4 % Recreational vehicles 0 % Terrain type: Rolling Grade 6.00 % Segment length 0.00 mi Trucks and buses PCE, ET 2.5 Recreational vehicles PCE, ER 2.0 Heavy Vehicle adjustment, fHV 0.943 Driver population factor, fp 1.00 Flow rate, vp 1813 pc/h/ln _________________________Speed Inputs and Adjustments__________________________ Lane width 12.0 ft Right-shoulder lateral clearance 6.0 ft Interchange density 0.50 interchange/mi Number of lanes, N 3 Free-flow speed: Measured FFS or BFFS 70.0 mi/h Lane width adjustment, fLW 0.0 mi/h Lateral clearance adjustment, fLC 0.0 mi/h Interchange density adjustment, fID 0.0 mi/h Number of lanes adjustment, fN 3.0 mi/h Free-flow speed 70.0 mi/h Urban Freeway _________________________LOS and Performance Measures__________________________ Flow rate, vp 1813 pc/h/ln Free-flow speed, FFS 70.0 mi/h
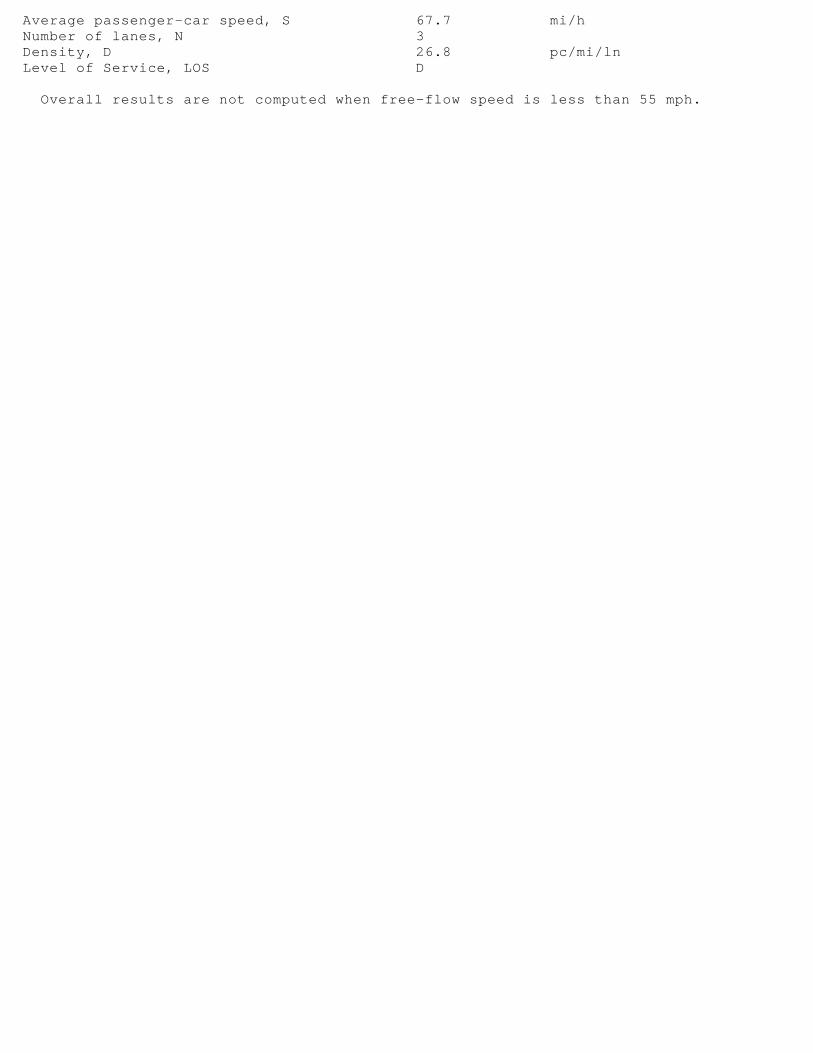
Average passenger-car speed, S 67.7 mi/h Number of lanes, N 3 Density, D 26.8 pc/mi/ln Level of Service, LOS D Overall results are not computed when free-flow speed is less than 55 mph.

AOC New Placerville Courthouse EIR - Appendix
U.S. 50 FREEWAY MAINLINE – BETWEEN PLACERVILLE DRIVE AND RAY LAWYER DRIVE

HCS2000: Basic Freeway Segments Release 4.1f Phone: Fax: E-mail: _________________________Operational Planning Analysis_________________________ Analyst: Peter Costa Agency or Company: CHS Consulting Group Date Performed: 12/16/14 Analysis Time Period: AM Peak Hour Freeway/Direction: US 50 EB From/To: Btwn Placerville-RL Drive Jurisdiction: El Dorado County Analysis Year: Existing AM Peak Hour Description: AOC Courthouse Project EIR _________________________Flow Inputs and Adjustments___________________________ Annual average daily traffic, AADT 1424 veh/day Peak-hour proportion of AADT, K 1.00 Peak-hour direction percent, D 100 % Volume, DDHV 1424 veh/h Peak-hour factor, PHF 0.92 Trucks and buses 5 % Recreational vehicles 0 % Terrain type: Grade Grade 6.00 % Segment length 0.00 mi Trucks and buses PCE, ET 1.5 Recreational vehicles PCE, ER 4.0 Heavy Vehicle adjustment, fHV 0.976 Driver population factor, fp 1.00 Flow rate, vp 793 pc/h/ln _________________________Speed Inputs and Adjustments__________________________ Lane width 12.0 ft Right-shoulder lateral clearance 6.0 ft Interchange density 1.00 interchange/mi Number of lanes, N 2 Free-flow speed: Measured FFS or BFFS 70.0 mi/h Lane width adjustment, fLW 0.0 mi/h Lateral clearance adjustment, fLC 0.0 mi/h Interchange density adjustment, fID 2.5 mi/h Number of lanes adjustment, fN 4.5 mi/h Free-flow speed 70.0 mi/h Urban Freeway _________________________LOS and Performance Measures__________________________ Flow rate, vp 793 pc/h/ln Free-flow speed, FFS 70.0 mi/h

Average passenger-car speed, S 70.0 mi/h Number of lanes, N 2 Density, D 11.3 pc/mi/ln Level of Service, LOS B Overall results are not computed when free-flow speed is less than 55 mph.

HCS2000: Basic Freeway Segments Release 4.1f Phone: Fax: E-mail: _________________________Operational Planning Analysis_________________________ Analyst: Peter Costa Agency or Company: CHS Consulting Group Date Performed: 12/16/14 Analysis Time Period: AM Peak Hour Freeway/Direction: US 50 WB From/To: Btwn Placerville-RL Drive Jurisdiction: El Dorado County Analysis Year: Existing AM Peak Hour Description: AOC Courthouse Project EIR _________________________Flow Inputs and Adjustments___________________________ Annual average daily traffic, AADT 1835 veh/day Peak-hour proportion of AADT, K 1.00 Peak-hour direction percent, D 100 % Volume, DDHV 1835 veh/h Peak-hour factor, PHF 0.92 Trucks and buses 3 % Recreational vehicles 0 % Terrain type: Rolling Grade 6.00 % Segment length 0.00 mi Trucks and buses PCE, ET 2.5 Recreational vehicles PCE, ER 2.0 Heavy Vehicle adjustment, fHV 0.957 Driver population factor, fp 1.00 Flow rate, vp 1042 pc/h/ln _________________________Speed Inputs and Adjustments__________________________ Lane width 12.0 ft Right-shoulder lateral clearance 6.0 ft Interchange density 1.00 interchange/mi Number of lanes, N 2 Free-flow speed: Measured FFS or BFFS 70.0 mi/h Lane width adjustment, fLW 0.0 mi/h Lateral clearance adjustment, fLC 0.0 mi/h Interchange density adjustment, fID 2.5 mi/h Number of lanes adjustment, fN 4.5 mi/h Free-flow speed 70.0 mi/h Urban Freeway _________________________LOS and Performance Measures__________________________ Flow rate, vp 1042 pc/h/ln Free-flow speed, FFS 70.0 mi/h

Average passenger-car speed, S 70.0 mi/h Number of lanes, N 2 Density, D 14.9 pc/mi/ln Level of Service, LOS B Overall results are not computed when free-flow speed is less than 55 mph.

HCS2000: Basic Freeway Segments Release 4.1f Phone: Fax: E-mail: _________________________Operational Planning Analysis_________________________ Analyst: Peter Costa Agency or Company: CHS Consulting Group Date Performed: 12/16/14 Analysis Time Period: PM Peak Hour Freeway/Direction: US 50 EB From/To: Btwn Placerville-RL Drive Jurisdiction: El Dorado County Analysis Year: Existing PM Peak Hour Description: AOC Courthouse Project EIR _________________________Flow Inputs and Adjustments___________________________ Annual average daily traffic, AADT 1792 veh/day Peak-hour proportion of AADT, K 1.00 Peak-hour direction percent, D 100 % Volume, DDHV 1792 veh/h Peak-hour factor, PHF 0.93 Trucks and buses 3 % Recreational vehicles 0 % Terrain type: Grade Grade 6.00 % Segment length 0.00 mi Trucks and buses PCE, ET 2.0 Recreational vehicles PCE, ER 4.0 Heavy Vehicle adjustment, fHV 0.971 Driver population factor, fp 1.00 Flow rate, vp 992 pc/h/ln _________________________Speed Inputs and Adjustments__________________________ Lane width 12.0 ft Right-shoulder lateral clearance 6.0 ft Interchange density 1.00 interchange/mi Number of lanes, N 2 Free-flow speed: Measured FFS or BFFS 70.0 mi/h Lane width adjustment, fLW 0.0 mi/h Lateral clearance adjustment, fLC 0.0 mi/h Interchange density adjustment, fID 2.5 mi/h Number of lanes adjustment, fN 4.5 mi/h Free-flow speed 70.0 mi/h Urban Freeway _________________________LOS and Performance Measures__________________________ Flow rate, vp 992 pc/h/ln Free-flow speed, FFS 70.0 mi/h

Average passenger-car speed, S 70.0 mi/h Number of lanes, N 2 Density, D 14.2 pc/mi/ln Level of Service, LOS B Overall results are not computed when free-flow speed is less than 55 mph.

HCS2000: Basic Freeway Segments Release 4.1f Phone: Fax: E-mail: _________________________Operational Planning Analysis_________________________ Analyst: Peter Costa Agency or Company: CHS Consulting Group Date Performed: 12/16/14 Analysis Time Period: PM Peak Hour Freeway/Direction: US 50 WB From/To: Btwn Placerville-RL Drive Jurisdiction: El Dorado County Analysis Year: Existing PM Peak Hour Description: AOC Courthouse Project EIR _________________________Flow Inputs and Adjustments___________________________ Annual average daily traffic, AADT 1734 veh/day Peak-hour proportion of AADT, K 1.00 Peak-hour direction percent, D 100 % Volume, DDHV 1734 veh/h Peak-hour factor, PHF 0.93 Trucks and buses 4 % Recreational vehicles 0 % Terrain type: Rolling Grade 6.00 % Segment length 0.00 mi Trucks and buses PCE, ET 2.5 Recreational vehicles PCE, ER 2.0 Heavy Vehicle adjustment, fHV 0.943 Driver population factor, fp 1.00 Flow rate, vp 988 pc/h/ln _________________________Speed Inputs and Adjustments__________________________ Lane width 12.0 ft Right-shoulder lateral clearance 6.0 ft Interchange density 1.00 interchange/mi Number of lanes, N 2 Free-flow speed: Measured FFS or BFFS 70.0 mi/h Lane width adjustment, fLW 0.0 mi/h Lateral clearance adjustment, fLC 0.0 mi/h Interchange density adjustment, fID 2.5 mi/h Number of lanes adjustment, fN 4.5 mi/h Free-flow speed 70.0 mi/h Urban Freeway _________________________LOS and Performance Measures__________________________ Flow rate, vp 988 pc/h/ln Free-flow speed, FFS 70.0 mi/h

Average passenger-car speed, S 70.0 mi/h Number of lanes, N 2 Density, D 14.1 pc/mi/ln Level of Service, LOS B Overall results are not computed when free-flow speed is less than 55 mph.

HCS2000: Basic Freeway Segments Release 4.1f Phone: Fax: E-mail: _________________________Operational Planning Analysis_________________________ Analyst: Peter Costa Agency or Company: CHS Consulting Group Date Performed: 12/10/14 Analysis Time Period: AM Peak Hour Freeway/Direction: US 50 EB From/To: Btwn Placerville-RL Drive Jurisdiction: El Dorado County Analysis Year: Existing+Project AM Peak Hour Description: AOC Courthouse Project EIR _________________________Flow Inputs and Adjustments___________________________ Annual average daily traffic, AADT 1427 veh/day Peak-hour proportion of AADT, K 1.00 Peak-hour direction percent, D 100 % Volume, DDHV 1427 veh/h Peak-hour factor, PHF 0.92 Trucks and buses 5 % Recreational vehicles 0 % Terrain type: Grade Grade 6.00 % Segment length 0.00 mi Trucks and buses PCE, ET 1.5 Recreational vehicles PCE, ER 4.0 Heavy Vehicle adjustment, fHV 0.976 Driver population factor, fp 1.00 Flow rate, vp 795 pc/h/ln _________________________Speed Inputs and Adjustments__________________________ Lane width 12.0 ft Right-shoulder lateral clearance 6.0 ft Interchange density 1.00 interchange/mi Number of lanes, N 2 Free-flow speed: Measured FFS or BFFS 70.0 mi/h Lane width adjustment, fLW 0.0 mi/h Lateral clearance adjustment, fLC 0.0 mi/h Interchange density adjustment, fID 2.5 mi/h Number of lanes adjustment, fN 4.5 mi/h Free-flow speed 70.0 mi/h Urban Freeway _________________________LOS and Performance Measures__________________________ Flow rate, vp 795 pc/h/ln Free-flow speed, FFS 70.0 mi/h

Average passenger-car speed, S 70.0 mi/h Number of lanes, N 2 Density, D 11.4 pc/mi/ln Level of Service, LOS B Overall results are not computed when free-flow speed is less than 55 mph.

HCS2000: Basic Freeway Segments Release 4.1f Phone: Fax: E-mail: _________________________Operational Planning Analysis_________________________ Analyst: Peter Costa Agency or Company: CHS Consulting Group Date Performed: 12/16/14 Analysis Time Period: AM Peak Hour Freeway/Direction: US 50 WB From/To: Btwn Placerville-RL Drive Jurisdiction: El Dorado County Analysis Year: Existing+Project AM Peak Hour Description: AOC Courthouse Project EIR _________________________Flow Inputs and Adjustments___________________________ Annual average daily traffic, AADT 1883 veh/day Peak-hour proportion of AADT, K 1.00 Peak-hour direction percent, D 100 % Volume, DDHV 1883 veh/h Peak-hour factor, PHF 0.92 Trucks and buses 3 % Recreational vehicles 0 % Terrain type: Rolling Grade 6.00 % Segment length 0.00 mi Trucks and buses PCE, ET 2.5 Recreational vehicles PCE, ER 2.0 Heavy Vehicle adjustment, fHV 0.957 Driver population factor, fp 1.00 Flow rate, vp 1069 pc/h/ln _________________________Speed Inputs and Adjustments__________________________ Lane width 12.0 ft Right-shoulder lateral clearance 6.0 ft Interchange density 1.00 interchange/mi Number of lanes, N 2 Free-flow speed: Measured FFS or BFFS 70.0 mi/h Lane width adjustment, fLW 0.0 mi/h Lateral clearance adjustment, fLC 0.0 mi/h Interchange density adjustment, fID 2.5 mi/h Number of lanes adjustment, fN 4.5 mi/h Free-flow speed 70.0 mi/h Urban Freeway _________________________LOS and Performance Measures__________________________ Flow rate, vp 1069 pc/h/ln Free-flow speed, FFS 70.0 mi/h

Average passenger-car speed, S 70.0 mi/h Number of lanes, N 2 Density, D 15.3 pc/mi/ln Level of Service, LOS B Overall results are not computed when free-flow speed is less than 55 mph.

HCS2000: Basic Freeway Segments Release 4.1f Phone: Fax: E-mail: _________________________Operational Planning Analysis_________________________ Analyst: Peter Costa Agency or Company: CHS Consulting Group Date Performed: 12/10/14 Analysis Time Period: PM Peak Hour Freeway/Direction: US 50 EB From/To: Btwn Placerville-RL Drive Jurisdiction: El Dorado County Analysis Year: Existing+Project PM Peak Hour Description: AOC Courthouse Project EIR _________________________Flow Inputs and Adjustments___________________________ Annual average daily traffic, AADT 1804 veh/day Peak-hour proportion of AADT, K 1.00 Peak-hour direction percent, D 100 % Volume, DDHV 1804 veh/h Peak-hour factor, PHF 0.93 Trucks and buses 3 % Recreational vehicles 0 % Terrain type: Grade Grade 6.00 % Segment length 0.00 mi Trucks and buses PCE, ET 2.0 Recreational vehicles PCE, ER 4.0 Heavy Vehicle adjustment, fHV 0.971 Driver population factor, fp 1.00 Flow rate, vp 999 pc/h/ln _________________________Speed Inputs and Adjustments__________________________ Lane width 12.0 ft Right-shoulder lateral clearance 6.0 ft Interchange density 1.00 interchange/mi Number of lanes, N 2 Free-flow speed: Measured FFS or BFFS 70.0 mi/h Lane width adjustment, fLW 0.0 mi/h Lateral clearance adjustment, fLC 0.0 mi/h Interchange density adjustment, fID 2.5 mi/h Number of lanes adjustment, fN 4.5 mi/h Free-flow speed 70.0 mi/h Urban Freeway _________________________LOS and Performance Measures__________________________ Flow rate, vp 999 pc/h/ln Free-flow speed, FFS 70.0 mi/h

Average passenger-car speed, S 70.0 mi/h Number of lanes, N 2 Density, D 14.3 pc/mi/ln Level of Service, LOS B Overall results are not computed when free-flow speed is less than 55 mph.

HCS2000: Basic Freeway Segments Release 4.1f Phone: Fax: E-mail: _________________________Operational Planning Analysis_________________________ Analyst: Peter Costa Agency or Company: CHS Consulting Group Date Performed: 12/16/14 Analysis Time Period: PM Peak Hour Freeway/Direction: US 50 WB From/To: Btwn Placerville-RL Drive Jurisdiction: El Dorado County Analysis Year: Existing+Project PM Peak Hour Description: AOC Courthouse Project EIR _________________________Flow Inputs and Adjustments___________________________ Annual average daily traffic, AADT 1786 veh/day Peak-hour proportion of AADT, K 1.00 Peak-hour direction percent, D 100 % Volume, DDHV 1786 veh/h Peak-hour factor, PHF 0.93 Trucks and buses 4 % Recreational vehicles 0 % Terrain type: Rolling Grade 6.00 % Segment length 0.00 mi Trucks and buses PCE, ET 2.5 Recreational vehicles PCE, ER 2.0 Heavy Vehicle adjustment, fHV 0.943 Driver population factor, fp 1.00 Flow rate, vp 1018 pc/h/ln _________________________Speed Inputs and Adjustments__________________________ Lane width 12.0 ft Right-shoulder lateral clearance 6.0 ft Interchange density 1.00 interchange/mi Number of lanes, N 2 Free-flow speed: Measured FFS or BFFS 70.0 mi/h Lane width adjustment, fLW 0.0 mi/h Lateral clearance adjustment, fLC 0.0 mi/h Interchange density adjustment, fID 2.5 mi/h Number of lanes adjustment, fN 4.5 mi/h Free-flow speed 70.0 mi/h Urban Freeway _________________________LOS and Performance Measures__________________________ Flow rate, vp 1018 pc/h/ln Free-flow speed, FFS 70.0 mi/h

Average passenger-car speed, S 70.0 mi/h Number of lanes, N 2 Density, D 14.5 pc/mi/ln Level of Service, LOS B Overall results are not computed when free-flow speed is less than 55 mph.

HCS2000: Basic Freeway Segments Release 4.1f Phone: Fax: E-mail: _________________________Operational Planning Analysis_________________________ Analyst: Peter Costa Agency or Company: CHS Consulting Group Date Performed: 12/16/14 Analysis Time Period: AM Peak Hour - 2018 Freeway/Direction: US 50 EB From/To: Btwn Placerville-RL Drive Jurisdiction: El Dorado County Analysis Year: Existing+Approved Projects AM Description: AOC Courthouse Project EIR _________________________Flow Inputs and Adjustments___________________________ Annual average daily traffic, AADT 2152 veh/day Peak-hour proportion of AADT, K 1.00 Peak-hour direction percent, D 100 % Volume, DDHV 2152 veh/h Peak-hour factor, PHF 0.92 Trucks and buses 5 % Recreational vehicles 0 % Terrain type: Grade Grade 6.00 % Segment length 0.00 mi Trucks and buses PCE, ET 1.5 Recreational vehicles PCE, ER 4.0 Heavy Vehicle adjustment, fHV 0.976 Driver population factor, fp 1.00 Flow rate, vp 1199 pc/h/ln _________________________Speed Inputs and Adjustments__________________________ Lane width 12.0 ft Right-shoulder lateral clearance 6.0 ft Interchange density 1.00 interchange/mi Number of lanes, N 2 Free-flow speed: Measured FFS or BFFS 70.0 mi/h Lane width adjustment, fLW 0.0 mi/h Lateral clearance adjustment, fLC 0.0 mi/h Interchange density adjustment, fID 2.5 mi/h Number of lanes adjustment, fN 4.5 mi/h Free-flow speed 70.0 mi/h Urban Freeway _________________________LOS and Performance Measures__________________________ Flow rate, vp 1199 pc/h/ln Free-flow speed, FFS 70.0 mi/h

Average passenger-car speed, S 70.0 mi/h Number of lanes, N 2 Density, D 17.1 pc/mi/ln Level of Service, LOS B Overall results are not computed when free-flow speed is less than 55 mph.

HCS2000: Basic Freeway Segments Release 4.1f Phone: Fax: E-mail: _________________________Operational Planning Analysis_________________________ Analyst: Peter Costa Agency or Company: CHS Consulting Group Date Performed: 12/16/14 Analysis Time Period: AM Peak Hour - 2018 Freeway/Direction: US 50 WB From/To: Btwn Placerville-RL Drive Jurisdiction: El Dorado County Analysis Year: Existing+Approved Projects AM Description: AOC Courthouse Project EIR _________________________Flow Inputs and Adjustments___________________________ Annual average daily traffic, AADT 2482 veh/day Peak-hour proportion of AADT, K 1.00 Peak-hour direction percent, D 100 % Volume, DDHV 2482 veh/h Peak-hour factor, PHF 0.92 Trucks and buses 3 % Recreational vehicles 0 % Terrain type: Rolling Grade 6.00 % Segment length 0.00 mi Trucks and buses PCE, ET 2.5 Recreational vehicles PCE, ER 2.0 Heavy Vehicle adjustment, fHV 0.957 Driver population factor, fp 1.00 Flow rate, vp 1410 pc/h/ln _________________________Speed Inputs and Adjustments__________________________ Lane width 12.0 ft Right-shoulder lateral clearance 6.0 ft Interchange density 1.00 interchange/mi Number of lanes, N 2 Free-flow speed: Measured FFS or BFFS 70.0 mi/h Lane width adjustment, fLW 0.0 mi/h Lateral clearance adjustment, fLC 0.0 mi/h Interchange density adjustment, fID 2.5 mi/h Number of lanes adjustment, fN 4.5 mi/h Free-flow speed 70.0 mi/h Urban Freeway _________________________LOS and Performance Measures__________________________ Flow rate, vp 1410 pc/h/ln Free-flow speed, FFS 70.0 mi/h

Average passenger-car speed, S 70.0 mi/h Number of lanes, N 2 Density, D 20.2 pc/mi/ln Level of Service, LOS C Overall results are not computed when free-flow speed is less than 55 mph.

HCS2000: Basic Freeway Segments Release 4.1f Phone: Fax: E-mail: _________________________Operational Planning Analysis_________________________ Analyst: Peter Costa Agency or Company: CHS Consulting Group Date Performed: 12/16/14 Analysis Time Period: PM Peak Hour - 2018 Freeway/Direction: US 50 EB From/To: Btwn Placerville-RL Drive Jurisdiction: El Dorado County Analysis Year: Existing+Approved Projects PM Description: AOC Courthouse Project EIR _________________________Flow Inputs and Adjustments___________________________ Annual average daily traffic, AADT 2586 veh/day Peak-hour proportion of AADT, K 1.00 Peak-hour direction percent, D 100 % Volume, DDHV 2586 veh/h Peak-hour factor, PHF 0.93 Trucks and buses 3 % Recreational vehicles 0 % Terrain type: Grade Grade 6.00 % Segment length 0.00 mi Trucks and buses PCE, ET 2.0 Recreational vehicles PCE, ER 4.0 Heavy Vehicle adjustment, fHV 0.971 Driver population factor, fp 1.00 Flow rate, vp 1432 pc/h/ln _________________________Speed Inputs and Adjustments__________________________ Lane width 12.0 ft Right-shoulder lateral clearance 6.0 ft Interchange density 1.00 interchange/mi Number of lanes, N 2 Free-flow speed: Measured FFS or BFFS 70.0 mi/h Lane width adjustment, fLW 0.0 mi/h Lateral clearance adjustment, fLC 0.0 mi/h Interchange density adjustment, fID 2.5 mi/h Number of lanes adjustment, fN 4.5 mi/h Free-flow speed 70.0 mi/h Urban Freeway _________________________LOS and Performance Measures__________________________ Flow rate, vp 1432 pc/h/ln Free-flow speed, FFS 70.0 mi/h
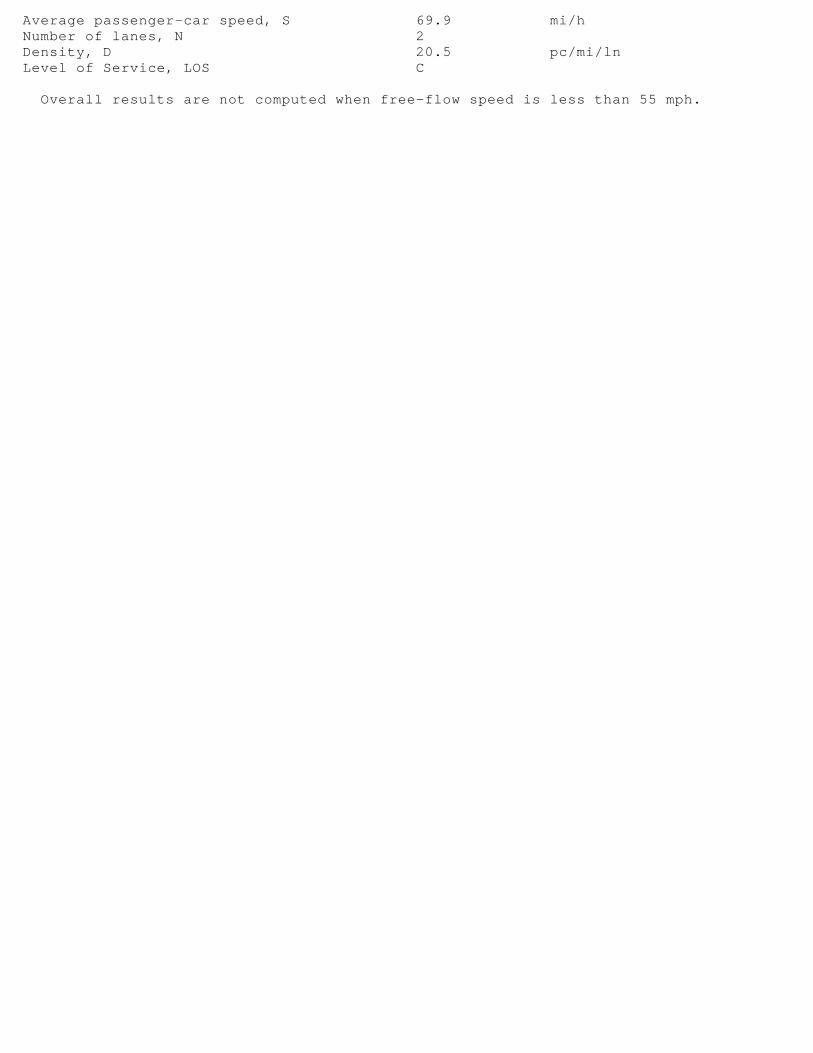
Average passenger-car speed, S 69.9 mi/h Number of lanes, N 2 Density, D 20.5 pc/mi/ln Level of Service, LOS C Overall results are not computed when free-flow speed is less than 55 mph.

HCS2000: Basic Freeway Segments Release 4.1f Phone: Fax: E-mail: _________________________Operational Planning Analysis_________________________ Analyst: Peter Costa Agency or Company: CHS Consulting Group Date Performed: 12/16/14 Analysis Time Period: PM Peak Hour - 2018 Freeway/Direction: US 50 WB From/To: Btwn Placerville-RL Drive Jurisdiction: El Dorado County Analysis Year: Existing+Approved Projects PM Description: AOC Courthouse Project EIR _________________________Flow Inputs and Adjustments___________________________ Annual average daily traffic, AADT 2683 veh/day Peak-hour proportion of AADT, K 1.00 Peak-hour direction percent, D 100 % Volume, DDHV 2683 veh/h Peak-hour factor, PHF 0.93 Trucks and buses 4 % Recreational vehicles 0 % Terrain type: Rolling Grade 6.00 % Segment length 0.00 mi Trucks and buses PCE, ET 2.5 Recreational vehicles PCE, ER 2.0 Heavy Vehicle adjustment, fHV 0.943 Driver population factor, fp 1.00 Flow rate, vp 1529 pc/h/ln _________________________Speed Inputs and Adjustments__________________________ Lane width 12.0 ft Right-shoulder lateral clearance 6.0 ft Interchange density 1.00 interchange/mi Number of lanes, N 2 Free-flow speed: Measured FFS or BFFS 70.0 mi/h Lane width adjustment, fLW 0.0 mi/h Lateral clearance adjustment, fLC 0.0 mi/h Interchange density adjustment, fID 2.5 mi/h Number of lanes adjustment, fN 4.5 mi/h Free-flow speed 70.0 mi/h Urban Freeway _________________________LOS and Performance Measures__________________________ Flow rate, vp 1529 pc/h/ln Free-flow speed, FFS 70.0 mi/h

Average passenger-car speed, S 69.7 mi/h Number of lanes, N 2 Density, D 21.9 pc/mi/ln Level of Service, LOS C Overall results are not computed when free-flow speed is less than 55 mph.

HCS2000: Basic Freeway Segments Release 4.1f Phone: Fax: E-mail: _________________________Operational Planning Analysis_________________________ Analyst: Peter Costa Agency or Company: CHS Consulting Group Date Performed: 12/16/14 Analysis Time Period: AM Peak Hour - 2018 Freeway/Direction: US 50 EB From/To: Btwn Placerville-RL Drive Jurisdiction: El Dorado County Analysis Year: Existing+App+Project AM Description: AOC Courthouse Project EIR _________________________Flow Inputs and Adjustments___________________________ Annual average daily traffic, AADT 2247 veh/day Peak-hour proportion of AADT, K 1.00 Peak-hour direction percent, D 100 % Volume, DDHV 2247 veh/h Peak-hour factor, PHF 0.92 Trucks and buses 5 % Recreational vehicles 0 % Terrain type: Grade Grade 6.00 % Segment length 0.00 mi Trucks and buses PCE, ET 1.5 Recreational vehicles PCE, ER 4.0 Heavy Vehicle adjustment, fHV 0.976 Driver population factor, fp 1.00 Flow rate, vp 1252 pc/h/ln _________________________Speed Inputs and Adjustments__________________________ Lane width 12.0 ft Right-shoulder lateral clearance 6.0 ft Interchange density 1.00 interchange/mi Number of lanes, N 2 Free-flow speed: Measured FFS or BFFS 70.0 mi/h Lane width adjustment, fLW 0.0 mi/h Lateral clearance adjustment, fLC 0.0 mi/h Interchange density adjustment, fID 2.5 mi/h Number of lanes adjustment, fN 4.5 mi/h Free-flow speed 70.0 mi/h Urban Freeway _________________________LOS and Performance Measures__________________________ Flow rate, vp 1252 pc/h/ln Free-flow speed, FFS 70.0 mi/h

Average passenger-car speed, S 70.0 mi/h Number of lanes, N 2 Density, D 17.9 pc/mi/ln Level of Service, LOS B Overall results are not computed when free-flow speed is less than 55 mph.

HCS2000: Basic Freeway Segments Release 4.1f Phone: Fax: E-mail: _________________________Operational Planning Analysis_________________________ Analyst: Peter Costa Agency or Company: CHS Consulting Group Date Performed: 12/16/14 Analysis Time Period: AM Peak Hour - 2018 Freeway/Direction: US 50 WB From/To: Btwn Placerville-RL Drive Jurisdiction: El Dorado County Analysis Year: Existing+App+Project AM Description: AOC Courthouse Project EIR _________________________Flow Inputs and Adjustments___________________________ Annual average daily traffic, AADT 2530 veh/day Peak-hour proportion of AADT, K 1.00 Peak-hour direction percent, D 100 % Volume, DDHV 2530 veh/h Peak-hour factor, PHF 0.92 Trucks and buses 3 % Recreational vehicles 0 % Terrain type: Rolling Grade 6.00 % Segment length 0.00 mi Trucks and buses PCE, ET 2.5 Recreational vehicles PCE, ER 2.0 Heavy Vehicle adjustment, fHV 0.957 Driver population factor, fp 1.00 Flow rate, vp 1437 pc/h/ln _________________________Speed Inputs and Adjustments__________________________ Lane width 12.0 ft Right-shoulder lateral clearance 6.0 ft Interchange density 1.00 interchange/mi Number of lanes, N 2 Free-flow speed: Measured FFS or BFFS 70.0 mi/h Lane width adjustment, fLW 0.0 mi/h Lateral clearance adjustment, fLC 0.0 mi/h Interchange density adjustment, fID 2.5 mi/h Number of lanes adjustment, fN 4.5 mi/h Free-flow speed 70.0 mi/h Urban Freeway _________________________LOS and Performance Measures__________________________ Flow rate, vp 1437 pc/h/ln Free-flow speed, FFS 70.0 mi/h

Average passenger-car speed, S 69.9 mi/h Number of lanes, N 2 Density, D 20.6 pc/mi/ln Level of Service, LOS C Overall results are not computed when free-flow speed is less than 55 mph.

HCS2000: Basic Freeway Segments Release 4.1f Phone: Fax: E-mail: _________________________Operational Planning Analysis_________________________ Analyst: Peter Costa Agency or Company: CHS Consulting Group Date Performed: 12/16/14 Analysis Time Period: PM Peak Hour - 2018 Freeway/Direction: US 50 EB From/To: Btwn Placerville-RL Drive Jurisdiction: El Dorado County Analysis Year: Existing+App+Project PM Description: AOC Courthouse Project EIR _________________________Flow Inputs and Adjustments___________________________ Annual average daily traffic, AADT 2598 veh/day Peak-hour proportion of AADT, K 1.00 Peak-hour direction percent, D 100 % Volume, DDHV 2598 veh/h Peak-hour factor, PHF 0.93 Trucks and buses 3 % Recreational vehicles 0 % Terrain type: Grade Grade 6.00 % Segment length 0.00 mi Trucks and buses PCE, ET 2.0 Recreational vehicles PCE, ER 4.0 Heavy Vehicle adjustment, fHV 0.971 Driver population factor, fp 1.00 Flow rate, vp 1439 pc/h/ln _________________________Speed Inputs and Adjustments__________________________ Lane width 12.0 ft Right-shoulder lateral clearance 6.0 ft Interchange density 1.00 interchange/mi Number of lanes, N 2 Free-flow speed: Measured FFS or BFFS 70.0 mi/h Lane width adjustment, fLW 0.0 mi/h Lateral clearance adjustment, fLC 0.0 mi/h Interchange density adjustment, fID 2.5 mi/h Number of lanes adjustment, fN 4.5 mi/h Free-flow speed 70.0 mi/h Urban Freeway _________________________LOS and Performance Measures__________________________ Flow rate, vp 1439 pc/h/ln Free-flow speed, FFS 70.0 mi/h

Average passenger-car speed, S 69.9 mi/h Number of lanes, N 2 Density, D 20.6 pc/mi/ln Level of Service, LOS C Overall results are not computed when free-flow speed is less than 55 mph.

HCS2000: Basic Freeway Segments Release 4.1f Phone: Fax: E-mail: _________________________Operational Planning Analysis_________________________ Analyst: Peter Costa Agency or Company: CHS Consulting Group Date Performed: 12/16/14 Analysis Time Period: PM Peak Hour - 2018 Freeway/Direction: US 50 WB From/To: Btwn Placerville-RL Drive Jurisdiction: El Dorado County Analysis Year: Existing+App+Project PM Description: AOC Courthouse Project EIR _________________________Flow Inputs and Adjustments___________________________ Annual average daily traffic, AADT 2735 veh/day Peak-hour proportion of AADT, K 1.00 Peak-hour direction percent, D 100 % Volume, DDHV 2735 veh/h Peak-hour factor, PHF 0.93 Trucks and buses 4 % Recreational vehicles 0 % Terrain type: Rolling Grade 6.00 % Segment length 0.00 mi Trucks and buses PCE, ET 2.5 Recreational vehicles PCE, ER 2.0 Heavy Vehicle adjustment, fHV 0.943 Driver population factor, fp 1.00 Flow rate, vp 1559 pc/h/ln _________________________Speed Inputs and Adjustments__________________________ Lane width 12.0 ft Right-shoulder lateral clearance 6.0 ft Interchange density 1.00 interchange/mi Number of lanes, N 2 Free-flow speed: Measured FFS or BFFS 70.0 mi/h Lane width adjustment, fLW 0.0 mi/h Lateral clearance adjustment, fLC 0.0 mi/h Interchange density adjustment, fID 2.5 mi/h Number of lanes adjustment, fN 4.5 mi/h Free-flow speed 70.0 mi/h Urban Freeway _________________________LOS and Performance Measures__________________________ Flow rate, vp 1559 pc/h/ln Free-flow speed, FFS 70.0 mi/h

Average passenger-car speed, S 69.6 mi/h Number of lanes, N 2 Density, D 22.4 pc/mi/ln Level of Service, LOS C Overall results are not computed when free-flow speed is less than 55 mph.

HCS2000: Basic Freeway Segments Release 4.1f Phone: Fax: E-mail: _________________________Operational Planning Analysis_________________________ Analyst: Peter Costa Agency or Company: CHS Consulting Group Date Performed: 12/16/14 Analysis Time Period: AM Peak Hour - 2045 Freeway/Direction: US 50 EB From/To: Btwn Placerville-RL Drive Jurisdiction: El Dorado County Analysis Year: Cumulative (2045) AM Description: AOC Courthouse Project EIR _________________________Flow Inputs and Adjustments___________________________ Annual average daily traffic, AADT 2984 veh/day Peak-hour proportion of AADT, K 1.00 Peak-hour direction percent, D 100 % Volume, DDHV 2984 veh/h Peak-hour factor, PHF 0.92 Trucks and buses 5 % Recreational vehicles 0 % Terrain type: Grade Grade 6.00 % Segment length 0.00 mi Trucks and buses PCE, ET 1.5 Recreational vehicles PCE, ER 4.0 Heavy Vehicle adjustment, fHV 0.976 Driver population factor, fp 1.00 Flow rate, vp 1662 pc/h/ln _________________________Speed Inputs and Adjustments__________________________ Lane width 12.0 ft Right-shoulder lateral clearance 6.0 ft Interchange density 1.00 interchange/mi Number of lanes, N 2 Free-flow speed: Measured FFS or BFFS 70.0 mi/h Lane width adjustment, fLW 0.0 mi/h Lateral clearance adjustment, fLC 0.0 mi/h Interchange density adjustment, fID 2.5 mi/h Number of lanes adjustment, fN 4.5 mi/h Free-flow speed 70.0 mi/h Urban Freeway _________________________LOS and Performance Measures__________________________ Flow rate, vp 1662 pc/h/ln Free-flow speed, FFS 70.0 mi/h

Average passenger-car speed, S 69.1 mi/h Number of lanes, N 2 Density, D 24.1 pc/mi/ln Level of Service, LOS C Overall results are not computed when free-flow speed is less than 55 mph.

HCS2000: Basic Freeway Segments Release 4.1f Phone: Fax: E-mail: _________________________Operational Planning Analysis_________________________ Analyst: Peter Costa Agency or Company: CHS Consulting Group Date Performed: 12/16/14 Analysis Time Period: AM Peak Hour - 2045 Freeway/Direction: US 50 WB From/To: Btwn Placerville-RL Drive Jurisdiction: El Dorado County Analysis Year: Cumulative (2045) AM Description: AOC Courthouse Project EIR _________________________Flow Inputs and Adjustments___________________________ Annual average daily traffic, AADT 3033 veh/day Peak-hour proportion of AADT, K 1.00 Peak-hour direction percent, D 100 % Volume, DDHV 3033 veh/h Peak-hour factor, PHF 0.92 Trucks and buses 3 % Recreational vehicles 0 % Terrain type: Rolling Grade 6.00 % Segment length 0.00 mi Trucks and buses PCE, ET 2.5 Recreational vehicles PCE, ER 2.0 Heavy Vehicle adjustment, fHV 0.957 Driver population factor, fp 1.00 Flow rate, vp 1723 pc/h/ln _________________________Speed Inputs and Adjustments__________________________ Lane width 12.0 ft Right-shoulder lateral clearance 6.0 ft Interchange density 1.00 interchange/mi Number of lanes, N 2 Free-flow speed: Measured FFS or BFFS 70.0 mi/h Lane width adjustment, fLW 0.0 mi/h Lateral clearance adjustment, fLC 0.0 mi/h Interchange density adjustment, fID 2.5 mi/h Number of lanes adjustment, fN 4.5 mi/h Free-flow speed 70.0 mi/h Urban Freeway _________________________LOS and Performance Measures__________________________ Flow rate, vp 1723 pc/h/ln Free-flow speed, FFS 70.0 mi/h

Average passenger-car speed, S 68.6 mi/h Number of lanes, N 2 Density, D 25.1 pc/mi/ln Level of Service, LOS C Overall results are not computed when free-flow speed is less than 55 mph.

HCS2000: Basic Freeway Segments Release 4.1f Phone: Fax: E-mail: _________________________Operational Planning Analysis_________________________ Analyst: Peter Costa Agency or Company: CHS Consulting Group Date Performed: 12/16/14 Analysis Time Period: PM Peak Hour - 2045 Freeway/Direction: US 50 EB From/To: Btwn Placerville-RL Drive Jurisdiction: El Dorado County Analysis Year: Cumulative (2045) PM Description: AOC Courthouse Project EIR _________________________Flow Inputs and Adjustments___________________________ Annual average daily traffic, AADT 3292 veh/day Peak-hour proportion of AADT, K 1.00 Peak-hour direction percent, D 100 % Volume, DDHV 3292 veh/h Peak-hour factor, PHF 0.93 Trucks and buses 3 % Recreational vehicles 0 % Terrain type: Grade Grade 6.00 % Segment length 0.00 mi Trucks and buses PCE, ET 2.0 Recreational vehicles PCE, ER 4.0 Heavy Vehicle adjustment, fHV 0.971 Driver population factor, fp 1.00 Flow rate, vp 1823 pc/h/ln _________________________Speed Inputs and Adjustments__________________________ Lane width 12.0 ft Right-shoulder lateral clearance 6.0 ft Interchange density 1.00 interchange/mi Number of lanes, N 2 Free-flow speed: Measured FFS or BFFS 70.0 mi/h Lane width adjustment, fLW 0.0 mi/h Lateral clearance adjustment, fLC 0.0 mi/h Interchange density adjustment, fID 2.5 mi/h Number of lanes adjustment, fN 4.5 mi/h Free-flow speed 70.0 mi/h Urban Freeway _________________________LOS and Performance Measures__________________________ Flow rate, vp 1823 pc/h/ln Free-flow speed, FFS 70.0 mi/h

Average passenger-car speed, S 67.6 mi/h Number of lanes, N 2 Density, D 27.0 pc/mi/ln Level of Service, LOS D Overall results are not computed when free-flow speed is less than 55 mph.

HCS2000: Basic Freeway Segments Release 4.1f Phone: Fax: E-mail: _________________________Operational Planning Analysis_________________________ Analyst: Peter Costa Agency or Company: CHS Consulting Group Date Performed: 12/16/14 Analysis Time Period: PM Peak Hour - 2045 Freeway/Direction: US 50 WB From/To: Btwn Placerville-RL Drive Jurisdiction: El Dorado County Analysis Year: Cumulative (2045) PM Description: AOC Courthouse Project EIR _________________________Flow Inputs and Adjustments___________________________ Annual average daily traffic, AADT 3644 veh/day Peak-hour proportion of AADT, K 1.00 Peak-hour direction percent, D 100 % Volume, DDHV 3644 veh/h Peak-hour factor, PHF 0.93 Trucks and buses 4 % Recreational vehicles 0 % Terrain type: Rolling Grade 6.00 % Segment length 0.00 mi Trucks and buses PCE, ET 2.5 Recreational vehicles PCE, ER 2.0 Heavy Vehicle adjustment, fHV 0.943 Driver population factor, fp 1.00 Flow rate, vp 2077 pc/h/ln _________________________Speed Inputs and Adjustments__________________________ Lane width 12.0 ft Right-shoulder lateral clearance 6.0 ft Interchange density 1.00 interchange/mi Number of lanes, N 2 Free-flow speed: Measured FFS or BFFS 70.0 mi/h Lane width adjustment, fLW 0.0 mi/h Lateral clearance adjustment, fLC 0.0 mi/h Interchange density adjustment, fID 2.5 mi/h Number of lanes adjustment, fN 4.5 mi/h Free-flow speed 70.0 mi/h Urban Freeway _________________________LOS and Performance Measures__________________________ Flow rate, vp 2077 pc/h/ln Free-flow speed, FFS 70.0 mi/h

Average passenger-car speed, S 63.2 mi/h Number of lanes, N 2 Density, D 32.8 pc/mi/ln Level of Service, LOS D Overall results are not computed when free-flow speed is less than 55 mph.

HCS2000: Basic Freeway Segments Release 4.1f Phone: Fax: E-mail: _________________________Operational Planning Analysis_________________________ Analyst: Peter Costa Agency or Company: CHS Consulting Group Date Performed: 12/16/14 Analysis Time Period: AM Peak Hour - 2045 Freeway/Direction: US 50 EB From/To: Btwn Placerville-RL Drive Jurisdiction: El Dorado County Analysis Year: Cumulative+Project AM Peak Description: AOC Courthouse Project EIR _________________________Flow Inputs and Adjustments___________________________ Annual average daily traffic, AADT 3079 veh/day Peak-hour proportion of AADT, K 1.00 Peak-hour direction percent, D 100 % Volume, DDHV 3079 veh/h Peak-hour factor, PHF 0.92 Trucks and buses 5 % Recreational vehicles 0 % Terrain type: Grade Grade 6.00 % Segment length 0.00 mi Trucks and buses PCE, ET 1.5 Recreational vehicles PCE, ER 4.0 Heavy Vehicle adjustment, fHV 0.976 Driver population factor, fp 1.00 Flow rate, vp 1715 pc/h/ln _________________________Speed Inputs and Adjustments__________________________ Lane width 12.0 ft Right-shoulder lateral clearance 6.0 ft Interchange density 1.00 interchange/mi Number of lanes, N 2 Free-flow speed: Measured FFS or BFFS 70.0 mi/h Lane width adjustment, fLW 0.0 mi/h Lateral clearance adjustment, fLC 0.0 mi/h Interchange density adjustment, fID 2.5 mi/h Number of lanes adjustment, fN 4.5 mi/h Free-flow speed 70.0 mi/h Urban Freeway _________________________LOS and Performance Measures__________________________ Flow rate, vp 1715 pc/h/ln Free-flow speed, FFS 70.0 mi/h

Average passenger-car speed, S 68.7 mi/h Number of lanes, N 2 Density, D 25.0 pc/mi/ln Level of Service, LOS C Overall results are not computed when free-flow speed is less than 55 mph.

HCS2000: Basic Freeway Segments Release 4.1f Phone: Fax: E-mail: _________________________Operational Planning Analysis_________________________ Analyst: Peter Costa Agency or Company: CHS Consulting Group Date Performed: 12/16/14 Analysis Time Period: AM Peak Hour - 2045 Freeway/Direction: US 50 WB From/To: Btwn Placerville-RL Drive Jurisdiction: El Dorado County Analysis Year: Cumulative+Project AM Peak Description: AOC Courthouse Project EIR _________________________Flow Inputs and Adjustments___________________________ Annual average daily traffic, AADT 3081 veh/day Peak-hour proportion of AADT, K 1.00 Peak-hour direction percent, D 100 % Volume, DDHV 3081 veh/h Peak-hour factor, PHF 0.92 Trucks and buses 3 % Recreational vehicles 0 % Terrain type: Rolling Grade 6.00 % Segment length 0.00 mi Trucks and buses PCE, ET 2.5 Recreational vehicles PCE, ER 2.0 Heavy Vehicle adjustment, fHV 0.957 Driver population factor, fp 1.00 Flow rate, vp 1750 pc/h/ln _________________________Speed Inputs and Adjustments__________________________ Lane width 12.0 ft Right-shoulder lateral clearance 6.0 ft Interchange density 1.00 interchange/mi Number of lanes, N 2 Free-flow speed: Measured FFS or BFFS 70.0 mi/h Lane width adjustment, fLW 0.0 mi/h Lateral clearance adjustment, fLC 0.0 mi/h Interchange density adjustment, fID 2.5 mi/h Number of lanes adjustment, fN 4.5 mi/h Free-flow speed 70.0 mi/h Urban Freeway _________________________LOS and Performance Measures__________________________ Flow rate, vp 1750 pc/h/ln Free-flow speed, FFS 70.0 mi/h

Average passenger-car speed, S 68.4 mi/h Number of lanes, N 2 Density, D 25.6 pc/mi/ln Level of Service, LOS C Overall results are not computed when free-flow speed is less than 55 mph.

HCS2000: Basic Freeway Segments Release 4.1f Phone: Fax: E-mail: _________________________Operational Planning Analysis_________________________ Analyst: Peter Costa Agency or Company: CHS Consulting Group Date Performed: 12/16/14 Analysis Time Period: PM Peak Hour - 2045 Freeway/Direction: US 50 EB From/To: Btwn Placerville-RL Drive Jurisdiction: El Dorado County Analysis Year: Cumulative+Project PM Peak Description: AOC Courthouse Project EIR _________________________Flow Inputs and Adjustments___________________________ Annual average daily traffic, AADT 3304 veh/day Peak-hour proportion of AADT, K 1.00 Peak-hour direction percent, D 100 % Volume, DDHV 3304 veh/h Peak-hour factor, PHF 0.93 Trucks and buses 3 % Recreational vehicles 0 % Terrain type: Grade Grade 6.00 % Segment length 0.00 mi Trucks and buses PCE, ET 2.0 Recreational vehicles PCE, ER 4.0 Heavy Vehicle adjustment, fHV 0.971 Driver population factor, fp 1.00 Flow rate, vp 1830 pc/h/ln _________________________Speed Inputs and Adjustments__________________________ Lane width 12.0 ft Right-shoulder lateral clearance 6.0 ft Interchange density 1.00 interchange/mi Number of lanes, N 2 Free-flow speed: Measured FFS or BFFS 70.0 mi/h Lane width adjustment, fLW 0.0 mi/h Lateral clearance adjustment, fLC 0.0 mi/h Interchange density adjustment, fID 2.5 mi/h Number of lanes adjustment, fN 4.5 mi/h Free-flow speed 70.0 mi/h Urban Freeway _________________________LOS and Performance Measures__________________________ Flow rate, vp 1830 pc/h/ln Free-flow speed, FFS 70.0 mi/h

Average passenger-car speed, S 67.5 mi/h Number of lanes, N 2 Density, D 27.1 pc/mi/ln Level of Service, LOS D Overall results are not computed when free-flow speed is less than 55 mph.

HCS2000: Basic Freeway Segments Release 4.1f Phone: Fax: E-mail: _________________________Operational Planning Analysis_________________________ Analyst: Peter Costa Agency or Company: CHS Consulting Group Date Performed: 12/16/14 Analysis Time Period: PM Peak Hour - 2045 Freeway/Direction: US 50 WB From/To: Btwn Placerville-RL Drive Jurisdiction: El Dorado County Analysis Year: Cumulative+Project PM Peak Description: AOC Courthouse Project EIR _________________________Flow Inputs and Adjustments___________________________ Annual average daily traffic, AADT 3696 veh/day Peak-hour proportion of AADT, K 1.00 Peak-hour direction percent, D 100 % Volume, DDHV 3696 veh/h Peak-hour factor, PHF 0.93 Trucks and buses 4 % Recreational vehicles 0 % Terrain type: Rolling Grade 6.00 % Segment length 0.00 mi Trucks and buses PCE, ET 2.5 Recreational vehicles PCE, ER 2.0 Heavy Vehicle adjustment, fHV 0.943 Driver population factor, fp 1.00 Flow rate, vp 2106 pc/h/ln _________________________Speed Inputs and Adjustments__________________________ Lane width 12.0 ft Right-shoulder lateral clearance 6.0 ft Interchange density 1.00 interchange/mi Number of lanes, N 2 Free-flow speed: Measured FFS or BFFS 70.0 mi/h Lane width adjustment, fLW 0.0 mi/h Lateral clearance adjustment, fLC 0.0 mi/h Interchange density adjustment, fID 2.5 mi/h Number of lanes adjustment, fN 4.5 mi/h Free-flow speed 70.0 mi/h Urban Freeway _________________________LOS and Performance Measures__________________________ Flow rate, vp 2106 pc/h/ln Free-flow speed, FFS 70.0 mi/h

Average passenger-car speed, S 62.6 mi/h Number of lanes, N 2 Density, D 33.7 pc/mi/ln Level of Service, LOS D Overall results are not computed when free-flow speed is less than 55 mph.

AOC New Placerville Courthouse EIR - Appendix
APPENDIX D – INTERSECTION (LOS) CALCULATION OUTPUT SHEETS WITH MITIGATION INCORPORATED

3: Forni Rd & Placerville Dr Existing+Project PM MITGHCM Unsignalized Intersection Capacity Analysis 12/9/2014
AOC Courthouse Project EIR Synchro 8 ReportCHS Consulting Group Page 1
Movement EBL EBR NBL NBT SBT SBRLane ConfigurationsVolume (veh/h) 0 100 45 963 280 88Sign Control Stop Free FreeGrade 0% 0% 0%Peak Hour Factor 0.92 0.92 0.92 0.92 0.92 0.92Hourly flow rate (vph) 0 109 49 1047 304 96PedestriansLane Width (ft)Walking Speed (ft/s)Percent BlockageRight turn flare (veh)Median type None NoneMedian storage veh)Upstream signal (ft) 476pX, platoon unblockedvC, conflicting volume 1497 200 400vC1, stage 1 conf volvC2, stage 2 conf volvCu, unblocked vol 1497 200 400tC, single (s) 6.8 6.9 4.1tC, 2 stage (s)tF (s) 3.5 3.3 2.2p0 queue free % 100 87 96cM capacity (veh/h) 109 808 1155Direction, Lane # EB 1 NB 1 NB 2 SB 1 SB 2Volume Total 109 49 1047 203 197Volume Left 0 49 0 0 0Volume Right 109 0 0 0 96cSH 808 1155 1700 1700 1700Volume to Capacity 0.13 0.04 0.62 0.12 0.12Queue Length 95th (ft) 12 3 0 0 0Control Delay (s) 10.2 8.3 0.0 0.0 0.0Lane LOS B AApproach Delay (s) 10.2 0.4 0.0Approach LOS BIntersection SummaryAverage Delay 0.9Intersection Capacity Utilization 54.0% ICU Level of Service AAnalysis Period (min) 15
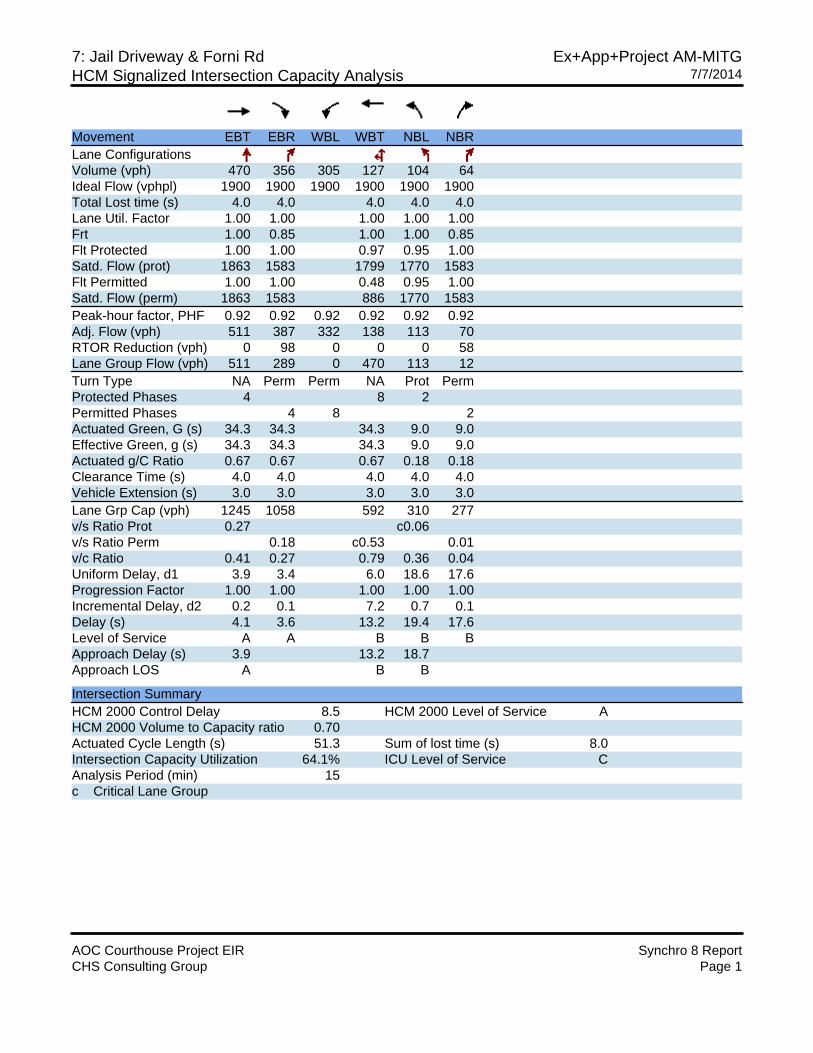
7: Jail Driveway & Forni Rd Ex+App+Project AM-MITGHCM Signalized Intersection Capacity Analysis 7/7/2014
AOC Courthouse Project EIR Synchro 8 ReportCHS Consulting Group Page 1
Movement EBT EBR WBL WBT NBL NBRLane ConfigurationsVolume (vph) 470 356 305 127 104 64Ideal Flow (vphpl) 1900 1900 1900 1900 1900 1900Total Lost time (s) 4.0 4.0 4.0 4.0 4.0Lane Util. Factor 1.00 1.00 1.00 1.00 1.00Frt 1.00 0.85 1.00 1.00 0.85Flt Protected 1.00 1.00 0.97 0.95 1.00Satd. Flow (prot) 1863 1583 1799 1770 1583Flt Permitted 1.00 1.00 0.48 0.95 1.00Satd. Flow (perm) 1863 1583 886 1770 1583Peak-hour factor, PHF 0.92 0.92 0.92 0.92 0.92 0.92Adj. Flow (vph) 511 387 332 138 113 70RTOR Reduction (vph) 0 98 0 0 0 58Lane Group Flow (vph) 511 289 0 470 113 12Turn Type NA Perm Perm NA Prot PermProtected Phases 4 8 2Permitted Phases 4 8 2Actuated Green, G (s) 34.3 34.3 34.3 9.0 9.0Effective Green, g (s) 34.3 34.3 34.3 9.0 9.0Actuated g/C Ratio 0.67 0.67 0.67 0.18 0.18Clearance Time (s) 4.0 4.0 4.0 4.0 4.0Vehicle Extension (s) 3.0 3.0 3.0 3.0 3.0Lane Grp Cap (vph) 1245 1058 592 310 277v/s Ratio Prot 0.27 c0.06v/s Ratio Perm 0.18 c0.53 0.01v/c Ratio 0.41 0.27 0.79 0.36 0.04Uniform Delay, d1 3.9 3.4 6.0 18.6 17.6Progression Factor 1.00 1.00 1.00 1.00 1.00Incremental Delay, d2 0.2 0.1 7.2 0.7 0.1Delay (s) 4.1 3.6 13.2 19.4 17.6Level of Service A A B B BApproach Delay (s) 3.9 13.2 18.7Approach LOS A B B
Intersection SummaryHCM 2000 Control Delay 8.5 HCM 2000 Level of Service AHCM 2000 Volume to Capacity ratio 0.70Actuated Cycle Length (s) 51.3 Sum of lost time (s) 8.0Intersection Capacity Utilization 64.1% ICU Level of Service CAnalysis Period (min) 15c Critical Lane Group

3: Forni Rd & Placerville Dr Ex+App+Project PM-MITGHCM Unsignalized Intersection Capacity Analysis 12/9/2014
AOC Courthouse Project EIR Synchro 8 ReportCHS Consulting Group Page 1
Movement EBL EBR NBL NBT SBT SBRLane ConfigurationsVolume (veh/h) 0 180 71 918 481 130Sign Control Stop Free FreeGrade 0% 0% 0%Peak Hour Factor 0.92 0.92 0.92 0.92 0.92 0.92Hourly flow rate (vph) 0 196 77 998 523 141PedestriansLane Width (ft)Walking Speed (ft/s)Percent BlockageRight turn flare (veh)Median type None NoneMedian storage veh)Upstream signal (ft) 476pX, platoon unblockedvC, conflicting volume 1746 332 664vC1, stage 1 conf volvC2, stage 2 conf volvCu, unblocked vol 1746 332 664tC, single (s) 6.8 6.9 4.1tC, 2 stage (s)tF (s) 3.5 3.3 2.2p0 queue free % 100 71 92cM capacity (veh/h) 71 664 921Direction, Lane # EB 1 NB 1 NB 2 SB 1 SB 2Volume Total 196 77 998 349 316Volume Left 0 77 0 0 0Volume Right 196 0 0 0 141cSH 664 921 1700 1700 1700Volume to Capacity 0.29 0.08 0.59 0.21 0.19Queue Length 95th (ft) 31 7 0 0 0Control Delay (s) 12.7 9.3 0.0 0.0 0.0Lane LOS B AApproach Delay (s) 12.7 0.7 0.0Approach LOS BIntersection SummaryAverage Delay 1.7Intersection Capacity Utilization 51.6% ICU Level of Service AAnalysis Period (min) 15

7: Jail Driveway & Forni Rd Ex+App+Project PM-MITGHCM Signalized Intersection Capacity Analysis 12/9/2014
AOC Courthouse Project EIR Synchro 8 ReportCHS Consulting Group Page 2
Movement EBT EBR WBL WBT NBL NBRLane ConfigurationsVolume (vph) 419 76 49 158 404 261Ideal Flow (vphpl) 1900 1900 1900 1900 1900 1900Total Lost time (s) 4.0 4.0 4.0 4.0 4.0Lane Util. Factor 1.00 1.00 1.00 1.00 1.00Frt 1.00 0.85 1.00 1.00 0.85Flt Protected 1.00 1.00 0.99 0.95 1.00Satd. Flow (prot) 1863 1583 1841 1770 1583Flt Permitted 1.00 1.00 0.84 0.95 1.00Satd. Flow (perm) 1863 1583 1560 1770 1583Peak-hour factor, PHF 0.92 0.92 0.92 0.92 0.92 0.92Adj. Flow (vph) 455 83 53 172 439 284RTOR Reduction (vph) 0 51 0 0 0 153Lane Group Flow (vph) 455 32 0 225 439 131Turn Type NA Perm Perm NA Prot PermProtected Phases 4 8 2Permitted Phases 4 8 2Actuated Green, G (s) 12.8 12.8 12.8 12.9 12.9Effective Green, g (s) 12.8 12.8 12.8 12.9 12.9Actuated g/C Ratio 0.38 0.38 0.38 0.38 0.38Clearance Time (s) 4.0 4.0 4.0 4.0 4.0Vehicle Extension (s) 3.0 3.0 3.0 3.0 3.0Lane Grp Cap (vph) 707 601 592 677 605v/s Ratio Prot c0.24 c0.25v/s Ratio Perm 0.02 0.14 0.08v/c Ratio 0.64 0.05 0.38 0.65 0.22Uniform Delay, d1 8.6 6.6 7.6 8.5 7.0Progression Factor 1.00 1.00 1.00 1.00 1.00Incremental Delay, d2 2.0 0.0 0.4 2.1 0.2Delay (s) 10.6 6.7 8.0 10.7 7.2Level of Service B A A B AApproach Delay (s) 10.0 8.0 9.3Approach LOS A A A
Intersection SummaryHCM 2000 Control Delay 9.4 HCM 2000 Level of Service AHCM 2000 Volume to Capacity ratio 0.65Actuated Cycle Length (s) 33.7 Sum of lost time (s) 8.0Intersection Capacity Utilization 65.5% ICU Level of Service CAnalysis Period (min) 15c Critical Lane Group

7: Jail Driveway & Forni Rd Cum+Project AM Peak-MITGHCM Signalized Intersection Capacity Analysis 7/7/2014
AOC Courthouse Project EIR Synchro 8 ReportCHS Consulting Group Page 1
Movement EBT EBR WBL WBT NBL NBRLane ConfigurationsVolume (vph) 479 325 336 130 104 64Ideal Flow (vphpl) 1900 1900 1900 1900 1900 1900Total Lost time (s) 4.0 4.0 4.0 4.0 4.0Lane Util. Factor 1.00 1.00 1.00 1.00 1.00Frt 1.00 0.85 1.00 1.00 0.85Flt Protected 1.00 1.00 0.97 0.95 1.00Satd. Flow (prot) 1863 1583 1798 1770 1583Flt Permitted 1.00 1.00 0.47 0.95 1.00Satd. Flow (perm) 1863 1583 871 1770 1583Peak-hour factor, PHF 0.92 0.92 0.92 0.92 0.92 0.92Adj. Flow (vph) 521 353 365 141 113 70RTOR Reduction (vph) 0 92 0 0 0 59Lane Group Flow (vph) 521 261 0 506 113 11Turn Type NA Perm Perm NA Prot PermProtected Phases 4 8 2Permitted Phases 4 8 2Actuated Green, G (s) 40.9 40.9 40.9 9.6 9.6Effective Green, g (s) 40.9 40.9 40.9 9.6 9.6Actuated g/C Ratio 0.70 0.70 0.70 0.16 0.16Clearance Time (s) 4.0 4.0 4.0 4.0 4.0Vehicle Extension (s) 3.0 3.0 3.0 3.0 3.0Lane Grp Cap (vph) 1302 1106 608 290 259v/s Ratio Prot 0.28 c0.06v/s Ratio Perm 0.16 c0.58 0.01v/c Ratio 0.40 0.24 0.83 0.39 0.04Uniform Delay, d1 3.7 3.2 6.3 21.8 20.6Progression Factor 1.00 1.00 1.00 1.00 1.00Incremental Delay, d2 0.2 0.1 9.5 0.9 0.1Delay (s) 3.9 3.3 15.8 22.7 20.7Level of Service A A B C CApproach Delay (s) 3.6 15.8 21.9Approach LOS A B C
Intersection SummaryHCM 2000 Control Delay 9.7 HCM 2000 Level of Service AHCM 2000 Volume to Capacity ratio 0.75Actuated Cycle Length (s) 58.5 Sum of lost time (s) 8.0Intersection Capacity Utilization 66.4% ICU Level of Service CAnalysis Period (min) 15c Critical Lane Group

7: Jail Driveway & Forni Rd Cumulative+Project PM Peak-MITGHCM Signalized Intersection Capacity Analysis 12/9/2014
AOC Courthouse Project EIR Synchro 8 ReportCHS Consulting Group Page 1
Movement EBT EBR WBL WBT NBL NBRLane ConfigurationsVolume (vph) 427 76 49 161 404 261Ideal Flow (vphpl) 1900 1900 1900 1900 1900 1900Total Lost time (s) 4.0 4.0 4.0 4.0 4.0Lane Util. Factor 1.00 1.00 1.00 1.00 1.00Frt 1.00 0.85 1.00 1.00 0.85Flt Protected 1.00 1.00 0.99 0.95 1.00Satd. Flow (prot) 1863 1583 1841 1770 1583Flt Permitted 1.00 1.00 0.84 0.95 1.00Satd. Flow (perm) 1863 1583 1560 1770 1583Peak-hour factor, PHF 0.92 0.92 0.92 0.92 0.92 0.92Adj. Flow (vph) 464 83 53 175 439 284RTOR Reduction (vph) 0 49 0 0 0 148Lane Group Flow (vph) 464 34 0 228 439 136Turn Type NA Perm Perm NA Prot PermProtected Phases 4 8 2Permitted Phases 4 8 2Actuated Green, G (s) 12.9 12.9 12.9 12.9 12.9Effective Green, g (s) 12.9 12.9 12.9 12.9 12.9Actuated g/C Ratio 0.38 0.38 0.38 0.38 0.38Clearance Time (s) 4.0 4.0 4.0 4.0 4.0Vehicle Extension (s) 3.0 3.0 3.0 3.0 3.0Lane Grp Cap (vph) 711 604 595 675 604v/s Ratio Prot c0.25 c0.25v/s Ratio Perm 0.02 0.15 0.09v/c Ratio 0.65 0.06 0.38 0.65 0.22Uniform Delay, d1 8.6 6.6 7.6 8.6 7.1Progression Factor 1.00 1.00 1.00 1.00 1.00Incremental Delay, d2 2.2 0.0 0.4 2.2 0.2Delay (s) 10.8 6.6 8.0 10.8 7.3Level of Service B A A B AApproach Delay (s) 10.1 8.0 9.4Approach LOS B A A
Intersection SummaryHCM 2000 Control Delay 9.5 HCM 2000 Level of Service AHCM 2000 Volume to Capacity ratio 0.65Actuated Cycle Length (s) 33.8 Sum of lost time (s) 8.0Intersection Capacity Utilization 66.0% ICU Level of Service CAnalysis Period (min) 15c Critical Lane Group

AOC New Placerville Courthouse EIR - Appendix
APPENDIX E – “PROJECT ONLY” INTERSECTION TURNING MOVEMENT AND FREEWAY MAINLINE VOLUMES

CHS ConsultingGroup Figure E-1
Existing Project Trips AM and PM Peak Hour Traffic Volumes
Placerville AOC Courthouse EIR
A and A Rd
Arm
ory
Rd
Ray Lawyer Dr
Gre
en V
alle
y Rd
Sunset Knoll
Helm
rich L
n
Forni Rd
Lo H
i Way
Briw Ridge Ct
Briw RdTw
elv
e O
ak
s Ln
Bluejay Dr
Go
ld N
ug
ge
t Wa
y
Fair
lane
Ct
Winter Ln
Fair Ln Forn
i Rd
Placerville
Dr
Forni Rd
Heidi House Rd
50
50
Fair
Ln
Ray Law
yer Dr
Forni R
d
Jail Dw
y
0 (0)
40 (0)
10
(0
)
0 (
0)
16 (56)
11 (28)
Forni Rd
Ray Lawyer Dr
1
2
4
6
5
7
8
3
Forni Rd
US-50 EB O!-Ramp
Lo Hi W
ay
US-50 EB On-Ramp
0 (0)
0 (0)
0 (0)
0 (
0)
20
(0
)
0 (
0)
4 (
7)
0 (
2)
0 (
0)
0 (0)
36 (0)
20
(0
)
4 (
9)
Fair LnUS-50 WB On-Ramp
Placerville Dr
4 (9)
2 (4)
0 (
0)
56
(0
)
0 (0)
10 (0)
Forni RdPlacerville Dr
3 (12)
6 (13)
0 (0)
0 (
0)
0 (
0)
13
7 (
0)
0 (0)
66 (0)
0 (0)
Placerville DrUS-50 WB O!-Ramp
0 (
0)
0 (
0)
0 (
0)
0 (
0)
10
(0
)
0 (0)
0 (0)
Fair Ln
Ray Lawyer Dr
0 (
0)
4 (
4)
0 (0)
50 (0)
0 (0)
203 (0)
Forni Rd
Jail Dwy
9 (
25
)
27
(8
4)
1 2
3 4
5 6
7
0 (
0)
10
(0
)
US-50 WB On-Ramp
Ray Lawyer Dr
12
(5
2)
4 (
4)
8
16
(5
9)
13
7 (
0)
48 (52)
3 (12)
LEGEND
Signalized IntersectionX
Unsignalized Intersection
Stop Control
Project Site
X
AM Volumes (PM Volumes)YY (ZZ)Not to Scale

CHS ConsultingGroup Figure E-2
2018 Project Trips AM and PM Peak Hour Traffic Volumes
Placerville AOC Courthouse EIR
A and A Rd
Arm
ory
Rd
Ray Lawyer Dr
Gre
en V
alle
y Rd
Sunset Knoll
Helm
rich L
n
Forni Rd
Lo H
i Way
Briw Ridge Ct
Briw RdTw
elv
e O
ak
s Ln
Bluejay Dr
Go
ld N
ug
ge
t Wa
y
Fair
lane
Ct
Winter Ln
Fair Ln
Forni R
d
Placerville
Dr
Forni Rd
Heidi House Rd
50
50
Fair
Ln
Ray Law
yer Dr
Forn
i R
d
Jail Dw
y
0 (0)
0 (0)
0 (0)
0 (
0)
20
(0
)
0 (
0)
4 (
7)
0 (
2)
0 (
0)
0 (0)
36 (0)
20
(0
)
4 (
9)
Fair LnUS-50 WB On-Ramp
Placerville Dr
4 (9)
2 (4)
0 (
0)
56
(0
)
0 (0)
10 (0)
Forni RdPlacerville Dr
3 (12)
6 (13)
0 (0)
0 (
0)
0 (
0)
45
(0
)
0 (0)
66 (0)
0 (0)
Forni Rd
US-50 EB O!-Ramp
Lo Hi W
ay
US-50 EB On-Ramp
Placerville DrUS-50 WB O!-Ramp
0 (
0)
0 (
0)
0 (
0)
0 (0)
142 (0)
0 (0)
111 (0)
Forni Rd
Jail Dwy
9 (
25
)
27
(8
4)
US-50 EB O!-Ramp
Ray Lawyer Dr
Forni Rd
0 (0)
40 (0)
0 (0)
0 (0)
92 (0)
16
(5
6)
11
(2
8)
10
(0
)
0 (
0)
0 (
0)
10
(0
)
US-50 WB On-Ramp
Ray Lawyer Dr
12
(5
2)
4 (
4)
1 2
3 4
6
7 8
5
1
2
4
6
5
7
8
3
0 (
0)
10
(0
)
0 (0)
0 (0)
Fair Ln
Ray Lawyer Dr
0 (
0)
4 (
4)
16
(5
9)
13
7 (
0)
48 (5
2)
95 (1
2)
LEGEND
Signalized IntersectionX
Unsignalized Intersection
Stop Control
Project Site
X
Auxiliary Lane
AM Volumes (PM Volumes)YY (ZZ)
Not to Scale
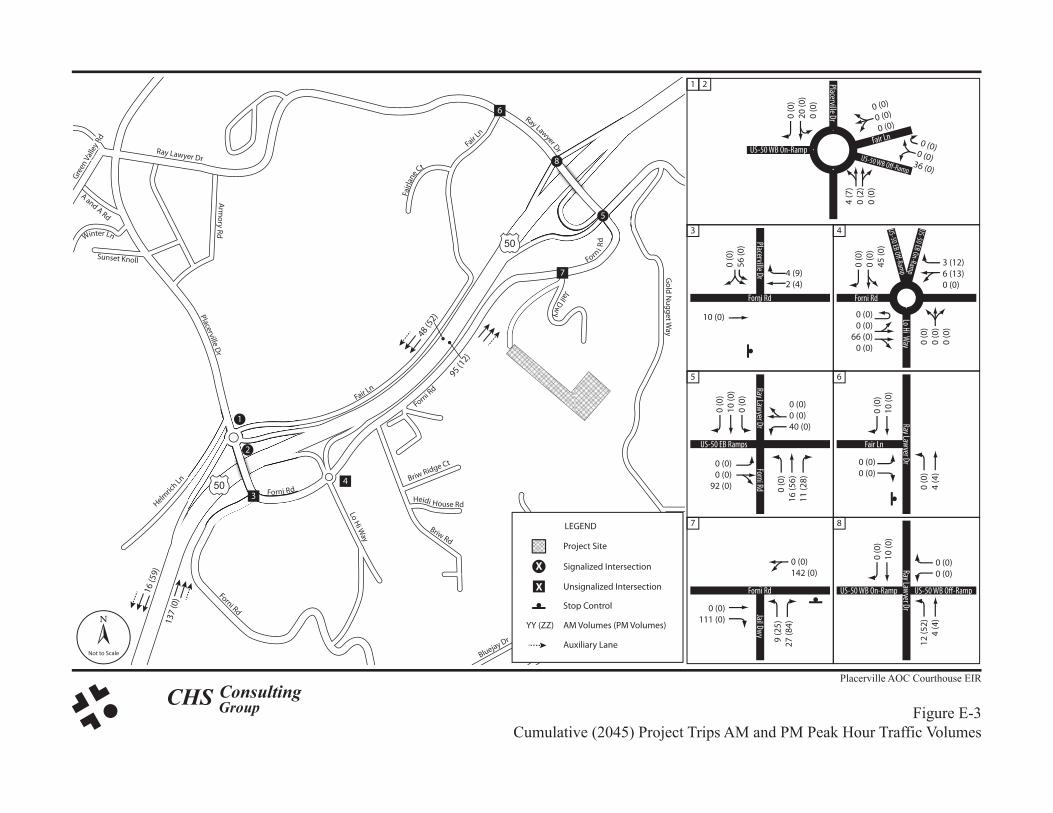
CHS ConsultingGroup Figure E-3
Cumulative (2045) Project Trips AM and PM Peak Hour Traffic Volumes
Placerville AOC Courthouse EIR
A and A Rd
Arm
ory
Rd
Ray Lawyer Dr
Gre
en V
alle
y Rd
Sunset Knoll
Helm
rich L
n
Forni Rd
Lo H
i Way
Briw Ridge Ct
Briw RdTw
elv
e O
ak
s Ln
Bluejay Dr
Go
ld N
ug
ge
t Wa
y
Fair
lane
Ct
Winter Ln
Fair Ln
Placerville
Dr
Forni Rd
Heidi House Rd
50
50
Fair
Ln
Ray Law
yer Dr
Forn
iR
d
Jail Dw
y
Forni R
d
4 (9)
2 (4)
0 (
0)
56
(0
)
10 (0)
Forni RdPlacerville Dr
3 (12)
6 (13)
0 (0)
0 (
0)
0 (
0)
45
(0
)
0 (0)
0 (0)
66 (0)
0 (0)
0 (
0)
0 (
0)
0 (
0)
Forni Rd
US-50 EB O!-Ramp
Lo Hi W
ay
US-50 EB On-Ramp
Placerville Dr
Fair Ln
US-50 WB O!-Ramp
US-50 WB On-Ramp
0 (
0)
20
(0
)
0 (
0)
0 (0)0 (0)
36 (0)
0 (0)
0 (0)
0 (0)
4 (
7)
0 (
2)
0 (
0)
1
3
4
6
7
8
0 (0)
142 (0)
0 (0)
111 (0)
Forni Rd
Jail Dwy
9 (
25
)
27
(8
4)
US-50 EB Ramps
Ray Lawyer Dr
Forni Rd
0 (0)
0 (0)
40 (0)
0 (0)
0 (0)
92 (0) 0 (
0)
16
(5
6)
11
(2
8)
0 (
0)
10
(0
)
0 (
0)
0 (
0)
10
(0
)
US-50 WB On-Ramp US-50 WB O!-Ramp
Ray Lawyer Dr
12
(5
2)
4 (
4)
5
7 8
1
3 4
5
0 (0)
0 (0)
0 (
0)
10
(0
)
0 (0)
0 (0)
Fair Ln
Ray Lawyer Dr
0 (
0)
4 (
4)
6
2
2
16
(59
)
13
7 (
0)
48 (5
2)
95 (12)
LEGEND
Signalized IntersectionX
Unsignalized Intersection
Stop Control
Project Site
X
Auxiliary Lane
AM Volumes (PM Volumes)YY (ZZ)
Not to Scale

Appendix F: US 50 Westbound Ramp Technical Supplement
In Caltrans’ comment letter on the Draft EIR, which is included as Letter 7 in Section 3: Comments and Responses of the Final EIR, Caltrans expressed concerns regarding the methodology used to analyze intersections in the vicinity of the Placerville Drive, Fair Lane, and Westbound US 50 ramp. As a result of additional discussion with Caltrans, more specific information was provided regarding Caltrans’ concerns with the modeling of these intersections and the corresponding results. Caltrans’ statement is included below:
Caltrans disagrees with results for Intersections #1 and #2 of the 2018 scenario and for Intersection #1 (#1 and #2 combined) for the 2045 scenario of the New Placerville Courthouse EIR traffic analysis; these intersections include Placerville Drive/Fair Lane/US 50 Westbound ramps. In regard to the 2018 scenario, the Synchro results are based on Highway Capacity Manual (HCM) methodology, which is limited when analyzing closely spaced intersections. Intersections #1 and #2 have complex operational issues such as storage limitations. Queuing at peak times extends to the eastbound ramp intersection and at times spills onto the mainline. Simulation is the appropriate tool at this location.
In regard to the 2045 scenario, Caltrans determined that the differences in reported performance between the Fehr & Peers model for the Western Placerville Interchange Project and the CHS model provided for the New Placerville Courthouse stem from two major issues, based on a review of the traffic analysis VISSIM files:
1. CHS did not model a network of traffic facilities in VISSIM. CHS removed theroundabout components from the Fehr & Peers network and analyzed them in isolation, with no interaction with the rest of the network. If isolated roundabout analysis were appropriate at this location, SIDRA could have been used instead. Combining simulated results (VISSIM) in some locations with stochastic results (Synchro) in other locations creates internal inconsistency.
2. CHS aggregated their data differently, so the averages of runs reported do notreport the same information.
The Judicial Council of California will continue to consult with Caltrans as needed during the final design and construction phases of the proposed project.


![Solved Scanner Appendix - Sauda.Comsauda.com/companion/pdf/cma/CMA Inter/Appendix/New...Solved Scanner Appendix CMA Inter Gr. I Paper 5 (New Syllabus) 2 2015 - Dec [5] (a) The accounting](https://img.pdfslide.us/doc/110x75/5aecce8d7f8b9ad73f902d79/solved-scanner-appendix-sauda-interappendixnewsolved-scanner-appendix-cma.jpg)


![Solved Scanner Appendix Inter/Appendix/New Syllabus... · Solved Scanner Appendix CMA Inter Gr. II Paper 12 (New Syllabus) 5 2015 - Dec [1] (f) In the Books of Suku ltd. Journal Entries](https://img.pdfslide.us/doc/110x75/5e694a3dbda3b90c052fb389/solved-scanner-appendix-interappendixnew-syllabus-solved-scanner-appendix.jpg)