Embed Size (px)
Citation preview

E-1
Appendix E
Total Dissolved Gas Abatement Plan
For Ice Harbor Dam
March 2010
E-2
Table of Contents Table of Contents .............................................................................................................. 2 Introduction ....................................................................................................................... 3
Project Description.......................................................................................................... 3 Powerhouse Hydraulic Capacity ..................................................................................... 3
Flow Frequency Analysis of the Snake River at Ice Harbor Dam ............................... 4 Water Quality Standards ................................................................................................. 5
TDG Abatement Activities ............................................................................................... 5 Structural Alternatives .................................................................................................... 6 Spill Operation Alternatives ........................................................................................... 7
TDG Properties ................................................................................................................. 7 Results .............................................................................................................................. 11
Structural Configuration ............................................................................................... 12 Spill Operation .............................................................................................................. 13 Total River Flow ........................................................................................................... 14 Forebay TDG Levels..................................................................................................... 14 Ice Harbor 2009 configuration TDG and Flow Summary ............................................ 15
Conclusions ...................................................................................................................... 15 References ........................................................................................................................ 18
E-3
Introduction In its operation of the Federal Columbia River Power System (FCRPS) projects, the U.S. Army Corps of Engineers (Corps) is responsible for providing for the authorized project purposes consistent with applicable laws and regulations. The operation of the Corps FCRPS project has effects on water quality and Endangered Species Act (ESA) listed fish. Accordingly the Corps considers the ecological objectives of the Clean Water Act and the ESA, and complies with the applicable water quality standards to the extent practicable as well conducting operations consistent with applicable Biological Opinions. The 2008 NOAA Fisheries Federal Columbia River Power System (FCRPS) Biological Opinion (BiOp) relies on spill operations at Corps mainstem projects for listed juvenile salmon and steelhead passage. Currently, the spill operations during the juvenile fish passage season (generally early April into August ) at Corps dams are consistent with court-ordered operations and the adaptive management provisions in the 2008 NOAA BiOp as implemented through the Adaptive Management Implementation Plan (AMIP). The intent of the spill operations is to help meet juvenile fish survival performance standards identified in the BiOp. These fish passage spills may result in the generation of total dissolved gas (TDG) supersaturation in the Columbia and lower Snake rivers at levels above current state and federal water quality standards. The states of Washington and Oregon have authorized exceptions to these standards as long as the elevated TDG levels provide for improved fish passage through the spillway without causing more harm to fish populations than through other passage routes. The purpose of this document is to summarize past, present, and future structural and operational TDG abatement measures at Ice Harbor Dam on the Snake river as requested by the State of Washington for their criteria adjustment.
Project Description Ice Harbor is located 9.7 miles above the confluence of the Snake and Columbia Rivers and 31.9 miles downstream of the Lower Monumental project. The main structures include the powerhouse, spillway and stilling basin, navigation lock, fish facilities, and concrete non-overflow sections with rock-fill embankments on the north shore. The dam is 2,822 feet long, including the embankments. The powerhouse includes six generator bays with a maximum total discharge capacity of approximately 98 kcfs. The Ice Harbor spillway is 590 feet long. It has ten 50-foot-wide spillway bays separated by 10-foot-wide piers. The spillway discharge through each bay is controlled by 50-foot-wide by 52.5-foot-high tainter gates. The design capacity of the spillway is 850 kcfs, with a corresponding maximum pool elevation of 446.4 fmsl. It will pass the standard project flood of 685. kcfs at normal full pool elevation 440.0 fmsl.
Powerhouse Hydraulic Capacity The Ice Harbor powerhouse unit hydraulic capacity during the fish passage season was estimated assuming the standard-length submersible traveling screens are installed, a total
E-4
head of 96 ft, and each unit is operated at the upper limit of the peak efficiency constraint as described in the yearly Fish Passage Plan (FPP, 2010). The unit hydraulic capacity for these conditions was estimated to equal 13.93 kcfs for units 1-3 and 16.88 kcfs/unit for units 4-6. The total hydraulic capacity of the Ice Harbor powerhouse with all 6 units available is 92.4 kcfs. If only 5 units are available the hydraulic capacity of the Ice Harbor powerhouse was estimated as 78.5 kcfs. In general, turbine maintenance and repair activities are scheduled to provide for maximum capacity during peak flow periods during each year. A minimum powerhouse discharge of 9.5 kcfs required to meet generation requirements was assumed throughout this evaluation.
Flow Frequency Analysis of the Snake River at Ice Harbor Dam The daily average total river flow, generation flow, and spillway flow was compiled for Ice Harbor Dam as contained in the Corps of Engineers CROHMS database ( http://www.nwd-wc.usace.army.mil/perl/dataquery.pl ) for the time period of October 1974 to October 2007. The time centered seven-day moving average of daily flow was computed throughout this 33 year period. This time period was chosen to correspond with the completion of major storage projects in the Columbia River Basin. This period of record was partitioned into two seasons: Fish Passage Season April 1-August 31 for a total of 5 months; and Non-Fish Passage Season January 1-March 31 and September 1-December 31 for a total of 7 months.
The percent exceedance characteristics for the seven-day moving average of daily average flows for the Snake River at Ice Harbor Dam are shown in Figure E1 during the fish passage season from 1975-2007. The median river flow during this period is about 58 kcfs. The frequency that the Snake River flow will exceed 100 kcfs is 22.5 percent and 200 kcfs is only 0.2 percent as listed in Table E1. The TDG exchange characteristics were evaluated for a typical spring operation when total river flows were 94 kcfs (April 7-May 31) and for a typical summer discharge of 57 kcfs (June 1-August 31).
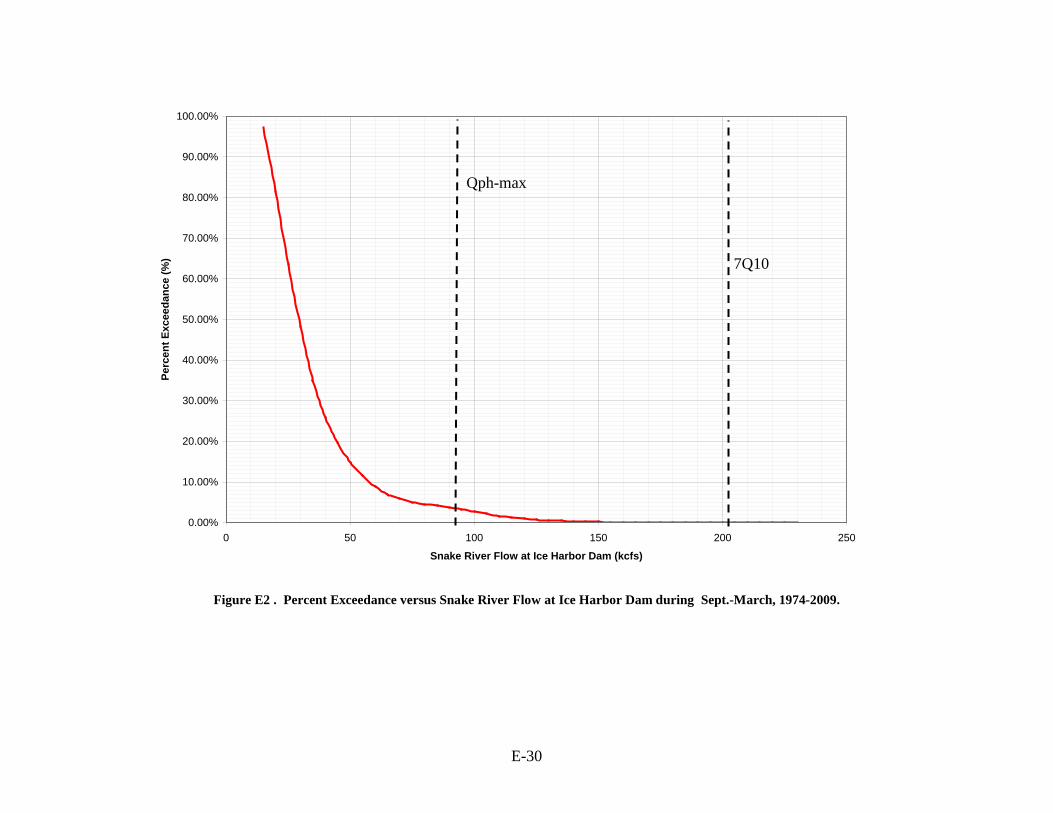
The percent exceedance characteristics for the seven-day moving average of daily average flows for the Snake River at Ice Harbor Dam are shown in Figure E2 outside the fish passage season from 1974-2007. The median river flow during this period is about 29 kcfs. The frequency that the Snake River flow will exceed 100 kcfs is 2.7 percent and 200 kcfs is 0.0 percent. The Washington water quality standards for TDG are applicable during river flows up to the high seven-day average flow with a return period of 10 years (7Q10). The 7Q10 is the average peak annual flow for seven consecutive days that has a recurrence interval of ten years. The WDOE estimated this discharge for the Snake River at Little Goose Dam at 214 kcfs as described in the Total Maximum Daily Load for Lower Snake River Total Dissolved Gas (WDOE, 2002). The period of record used in the TMDL analysis was from 1975-2000. The 7Q10 flow was updated using the extended period of record from 1975-2009 using the methodology described in Bulletin #17B (USGS, 1982) and the data identified in the Lower Snake River TMDL. The updated mean 7Q10 high flow in the
E-5
Snake River at Ice Harbor Dam was estimated to equal 203 kcfs with an 80 percent confidence limit ranging from 184.4 to 247.6 kcfs. This evaluation did not correct the skew coefficient of the station record. A review of the historic records show that the updated 7Q10 flow of 203 kcfs was exceeded in only 2 of the past 35 water years which infers a return period of once every 17.5 years.
Water Quality Standards The current Washington water quality standards allow for operations resulting in TDG levels of up to 120 percent at tailwater monitoring stations and 115 percent at the forebay of the next downstream dam based on a 12 hour moving average of consecutive observations for the purpose of aiding the passage of ESA listed species from April 1 through August 31. The daily maximum TDG saturation is not to exceed 125 percent of saturation during the fish passage season. The Washington water quality outside of the fish passage season is 110 percent of saturation.
TDG Abatement Activities The TDG loading of the Snake River is influenced by both operations and the structural configuration of the Dam. Operational strategies to aid guidance of fisheries past the dam may have a direct influence on the TDG conditions in the river. An alternative spill pattern that more effectively guides fish during spillway operations and at lower spill volumes will also lower the TDG pressures in the receiving waters. Alternatively, a reduction in the injury rate of juvenile passing through the powerhouse may also reduce the reliance on spill for fish guidance resulting in an enhancement in TDG conditions. The general approach for TDG abatement activities focuses on limiting the entrainment of air into the water column, the water flow rate that encounters the bubble plume and thirdly, the effective depth of the air that does become entrained. Spillway flow deflector commonly referred to as flip lips, redirect the spill jet from a plunging flow that transports air bubbles deep into the stilling basin to a horizontal jet that maintains entrained air much closer to the water surface. The influence of spillway flow deflectors is also to transport highly aerated flow conditions well downstream of the stilling basin into the tailrace channel, promoting the exchange of atmospheric gasses at shallow depths. The effectiveness of spillway flow deflectors in abating TDG production has been consistently demonstrated at Corps of Engineers projects from Bonneville Dam to Chief Joseph Dam on the Columbia River and from Ice Harbor Dam to Lower Granite Dam on the Snake River. Other methodologies to reduce TDG loading below main-stem dam involve minimizing the use of spillways for involuntary spill. Limiting the entrainment of powerhouse flows into the turbulence bubbly flow in the stilling basin can also be an effective method of TDG enhancement. A spill pattern that widely distributes spillway flows uniformly across the entire spillway has been found to lower TDG exchange rates.
E-6
Prior to the TDG abatement program, spillway flows of 50 kcfs at Ice Harbor Dam resulted in TDG saturations of 135 percent and higher. Spillway flow deflectors were installed on all ten spill bays over a three year period from 1997-1999 resulting in significant reductions in TDG generation. Spillway releases of 50 kcfs today can result in TDG saturations as low as 113 percent of saturation. Spillway flows as high as 95 kcfs can be maintained at Ice Harbor Dam subject to the TDG tailwater criteria adjustment of 120 percent. Additional structural modifications to the spillway and downstream lock approach were required in conjunction with spillway flow deflectors to provide for suitable flow conditions for navigation and fish passage concerns. A spillway weir was designed and put into operation in 2005 for the purpose of improving fish passage while maintaining effective TDG abatement flow conditions in the tailwater channel. Currently, voluntary spillway flows at Ice Harbor Dam generate the lowest TDG levels of the eight dams included in this study as a consequence of the efficient skimming flow caused by flow deflectors and the shallow tailrace channel properties. It is recognized that a potential outcome of implementing gas abatement measures at a project is for greater reliance on spill to achieve fish passage goals. This is accomplished through increasing the spill discharge capacity generating acceptable TDG levels. The ability to spill significantly larger volumes of water at or below the tailwater TDG criteria of 120 percent has resulted in a net increase in the TDG loading on the Snake River during voluntary flow conditions. This increase in TDG loading results from a higher percentage of the river spilled at safe levels below the TDG criterion causing an increase in the cross sectional average TDG pressures. The following sections will discuss both the operational and structural configuration at Ice Harbor Dam that influences TDG loading in the Snake River during the fish passage season.
Structural Alternatives A total of five different structural alternatives were considered in this evaluation of TDG exchange at Ice Harbor Dam. The base condition “Base No Deflectors” reflects the structural configuration at the beginning of the Total Dissolved Gas Abatement Program in 1995 where the original ten bay spillway was of the conventional ogee design without flow deflectors. The second structural configuration consisted of the state of the spillway at the beginning of the 2000 fish passage season where all 10 spill bays had type 2 spillway flow deflectors “10 Deflectors”. A spillway weir was added in 2005 to the spillway and will be labeled as “10 Deflectors+SW” . The spillway weir (SW) located in spill bay 2 has also resulted in a non-uniform spill pattern over most of the river conditions evaluated in this study. The purpose of this SW structure is to more effectively and efficiency guide juvenile fish past Ice Harbor Dam and represents the current structural configuration at Ice Harbor Dam. The modernization of the Ice Harbor Powerhouse is not expected to change the hydraulic capacity at this project. The fourth structural alternative labeled “Deflectors+SW+Powerhouse Bypass” consisted of a proposed powerhouse surface bypass channel using a sluiceway with a hydraulic capacity of 5 kcfs to the existing structural configuration. This passageway was assumed to discharge into the tailrace channel downstream from the powerhouse. The final structural alternative “Deflectors+SW+Powerhouse Bypass+Spillway Wall ” consisted of the
E-7
existing spillway configuration plus a proposed powerhouse surface bypass and a proposed spillway wall that eliminates the entrainment of powerhouse flows into the aerated spillway flows. The final design of this partition wall was assumed to extent downstream of the stilling basin and limits the mixing of powerhouse and spillway flows to a flow regime outside of highly aerated flow conditions.
Spill Operation Alternatives This study also considered the influence of seven different spill policies that govern the operations of Ice Harbor Dam and resultant generation of TDG supersaturation. The spill policies for the Federal Columbia River Power System are described in the Fish Operations Plan that are devised each year based on the Biological Opinion adaptive management strategy. The first spill operation called for the instantaneous voluntary spill equal to 30 percent of the total river flow “Spill 30 Percent”. The second spill operation required the instantaneous spill to equal 45 percent of the total river flow “Spill 45 Percent”. The third operation assumed a “spill 45 kcfs” subject to powerhouse minimum hydraulic capacity constraints. The forth spill operation limits spill to the capacity of 110 percent saturation (“spill to capacity @ 110% ”). The fifth spill operation of no net increase in TDG loading of the Snake River called for flows to be limited by the either the 110 percent criteria or background TDG level in the Snake River (“spill to capacity @ 110% or Forebay TDG”). The sixth spill operation called for spilling up to the capacity as limited by the 120 percent total dissolved gas saturation criterion at the tailwater fixed monitoring station (FMS). The final spill operation is based on no voluntary spill. These alternative operational plans are listed in Table E2
TDG Properties The TDG exchange properties at Ice Harbor Dam are influenced by the spillway flow deflectors and adjoining shallow tailwater channel. The relationship between TDG saturation and spillway discharge since the installation of spillway flow deflectors in 1998 is shown in Figure E3. The estimates TDG exchange in the Snake River at Ice Harbor Dam were based on applying a set of empirical equations that describe the TDG exchange as a function of the effective depth of flow and specific spillway discharge. The equations for TDG production for the existing spillway with flow deflectors are presented in Equation 1. The TDG exchange was found to be a product of the power function of the tailwater depth of flow and specific spillway discharge. An increase in the tailwater stage from 340 to 341 ft will result in an increase in TDG pressure of 2.5 mm Hg during a specific spillway discharge of 6 kcfs/bay. Alternatively, an increase in the specific spillway discharge from 6 to 7 kcfs/bay will result in a 4.8 mm Hg increase in TDG pressure for a tailwater elevation of 340 ft. Equation 1 also illustrates the influence of bulking spill in several bays such as the RSW with training flow. A total spillway discharge of 45 kcfs uniformly distributed over 10 spill bays will result in a delta pressure of 90 mm Hg at a tailwater elevation of 340 ft. The same 45 kcfs spilled uniformly over 4 bays will result in a delta TDG pressure of 121.8 mm Hg for an increase in TDG saturation of 4.2 percent over the uniform 10 bay spill pattern. An average local
E-8
atmospheric pressure of 756 mm Hg was applied to estimate the total dissolved gas saturation.
Equation 1
)1()(97.6056.1 80.0345.1 HgmmqDP stw +=∆ Dtw=TWE – 320 Tailwater Depth of Flow (ft) TWE = Tailwater elevation (ft) qs = Qspill/Nbays Specific spillway Discharge (kcfs/bay) Qspill = total spillway discharge (kcfs) Nbays=Effective number of active spillway bays. TDGsat = (AP+ΔP)/AP x 100 Total Dissolved Gas Saturation (%) AP = Local Atmospheric Pressure ( mm Hg)
The TDG properties of powerhouse flows were assumed to retain forebay TDG characteristics. However, the fate of the TDG characteristics of powerhouse releases is complicated by the subsequent entrainment of a portion of this discharge into the highly aerated flow conditions downstream of the spillway. The spillway flow deflectors generate a turbulent surface oriented jet that draws water adjacent to and beneath this jet into this flow feature. The associated TDG exchange of the entrained flow ranges from complete incorporation into the spillway flows within the stilling basin attaining identical TDG saturations as spillway flows to mixing with spillway releases in the tailwater channel where TDG exchange is less prominent due to the air/water ratios and shallower depth of entrained bubbles.
The average flow weighted TDG saturation below Ice Harbor Dam was determined for each combination of structural and operation alternative. A simple mass conservation statement can be developed for computing the flow-weighted average TDG saturation exiting the dam by associating a TDG saturation with the powerhouse and spillway flows as shown in Equation 2.
Equation 2
tot
gengenspspavg Q
TDGQTDGQTDG
+= ……………………………………….(2)
where:
Qtot = Total River Flow (kcfs)
Qsp = Spillway discharge (kcfs)
Qgen = Generation discharge (kcfs)
TDGgen = TDG saturation of generation discharges (percent)
TDGavg = Average cross sectional TDG saturation in the Snake River (percent)
E-9
TDGs = TDG saturation of spillway discharges (percent)
To account for the added TDG loading associated with the entrainment of powerhouse releases into the aerated spillway flow, an added mass term was included in the conservation statement as shown in Equation 3. This added mass discharge estimates the effective powerhouse flow entrainment into spillway releases where a portion of powerhouse release encounters the aerated flow conditions caused by spillway flows and experiences a similar level of TDG uptake. This formulation reduces the amount of flow from the powerhouse releases retaining forebay TDG levels available for dilution with spillway releases while increasing the volume of water exposed to highly aerated flow below the spillway.
Equation 3
tot
genentgenspentspavg Q
TDGQQTDGQQTDG
)()( −++= (3)
where:
Qtot = Total River Flow (kcfs)
Qsp = spillway discharge (kcfs)
Qgen = generation discharge (kcfs)
Qent = effective entrainment discharge (kcfs)
TDGgen = TDG saturation of generation discharges (percent)
TDGavg = average TDG saturation on transect USGS (percent)
TDGsp= TDG saturation of spillway discharges (percent)
A simple functional form for the effective entrainment discharge has been estimated from field studies of TDG exchange at Ice Harbor Dam (Schneider, 1997). The effective entrainment discharge was found to be linearly proportional to the spillway discharge in where the constant of proportionality is called the effective entrainment coefficient. The functional form for the estimation of the entrainment discharge is shown in equation 4. The entrainment coefficient for Ice Harbor Dam during the field study conducted in 1998 was 0.50.
Equation 4
Qent = CentQsp (4)

E-10
Where 0 < Qent < Qph The return of diverted flow associated with the powerhouse surface bypass alternatives has the potential to generate elevated TDG pressures in the Snake River. The experience of TDG exchange associated with the ice and trash (IT) chute at The Dalles Dam has been evaluated and was found to cause an increase TDG pressure in the Columbia River by several percent for low background TDG conditions. The outfall below Bonneville Dam associated with the Bonneville 2nd Powerhouse Corner collector (B2CC) was also found to add to the TDG loading in the Columbia River during low tailwater conditions. The type of outfall flow conditions below these two surface bypass systems are quite different. A plunge pool was constructed at the outfall of the B2CC increasing the potential for aerated flow to experience large hydrostatic pressures and TDG uptake. In contrast, the IT chute at The Dalles Dam discharges into a shallow basin and is directed at an angle to releases from the powerhouse. These outfalls do provide some reference for estimating the TDG exchange for surface bypass flows at Ice Harbor Dam. For this study a constant TDG saturation of 119.8 percent was applied for all surface bypass flows. The basis for this estimate was the observed level of TDG exchange associated with surface bypass flows at Bonneville and The Dalles Dams and the additional influence of designing a surface collector outfall that would limit the amount of TDG exchange during operation. The design attributes would involve the receiving channel depth of flow, trajectory, chute width, invert elevation, and proximity to other project flows.
A comprehensive evaluation of TDG exchange at Ice Harbor Dam should consider the existence of elevated background TDG levels from upstream sources. The presence of elevated background TDG levels at Ice Harbor Dam is caused by the voluntary spill at upstream projects to aid fish passage or involuntary spill resulting from river flows exceeding powerhouse capacity or the presence of surplus generation capacity in the system. The forebay TDG levels at Ice Harbor Dam are summarized from 1995-2007 as a function of total river flow in Figure E4. The observed daily average TDG saturation in the forebay of Ice Harbor Dam was summarized for 5 kcfs ranges in total river flow from 30 to 245 kcfs. The average forebay TDG saturation is indicated by the red circle and the range in TDG saturation is defined by the standard deviation indicated by the range bars. A well defined linear relationship was evident between observed TDG saturation in the forebay of Ice Harbor Dam and total river flow. This figure shows that when river flows are approaching the 7Q10 level of 214 kcfs, the background TDG saturation typically ranges from 119 to 128.5 percent of saturation.
The reliability of TDG exchange estimates at Ice Harbor Dam as presented in Equation 1 can be evaluated by reviewing historic operations and the associated TDG response as measured at the tailwater fixed monitoring stations. The tailwater TDG saturation at Ice Harbor as a function of spillway discharge filtered for constant spill events of 3 hours and longer for the last three years are shown in Figure E5. One interesting feature of these data are the large range of TDG response for a given spill discharge. The spill capacity
E-11
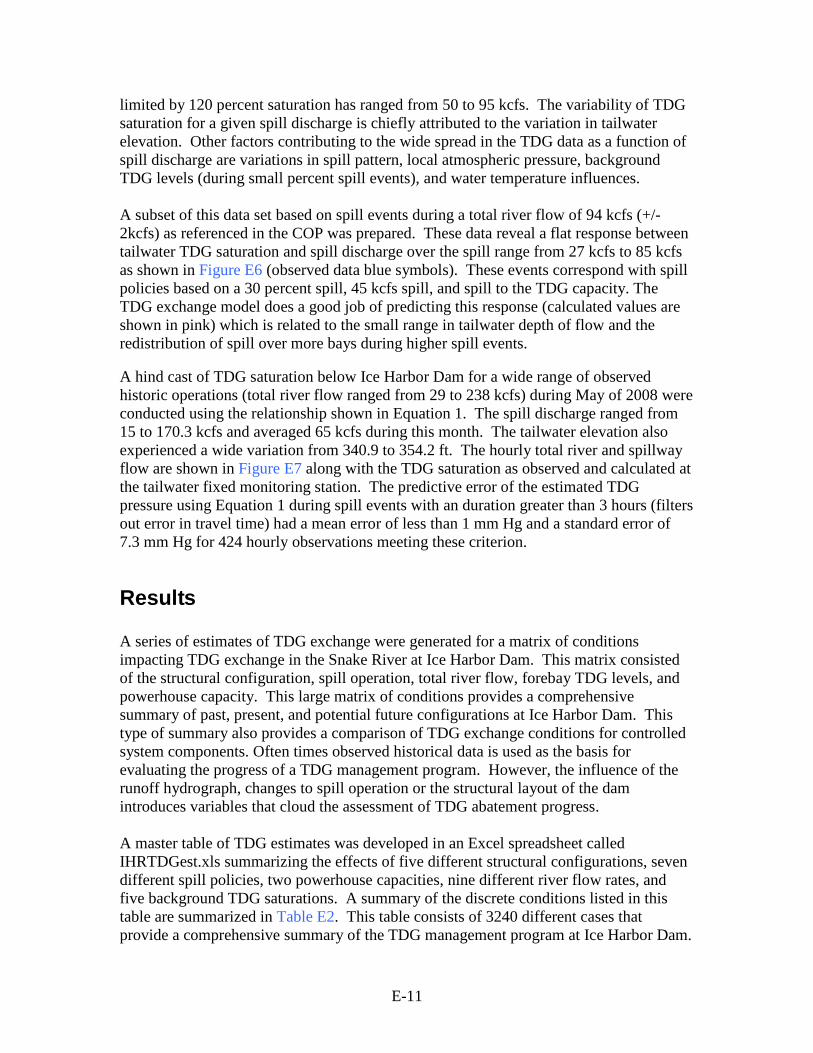
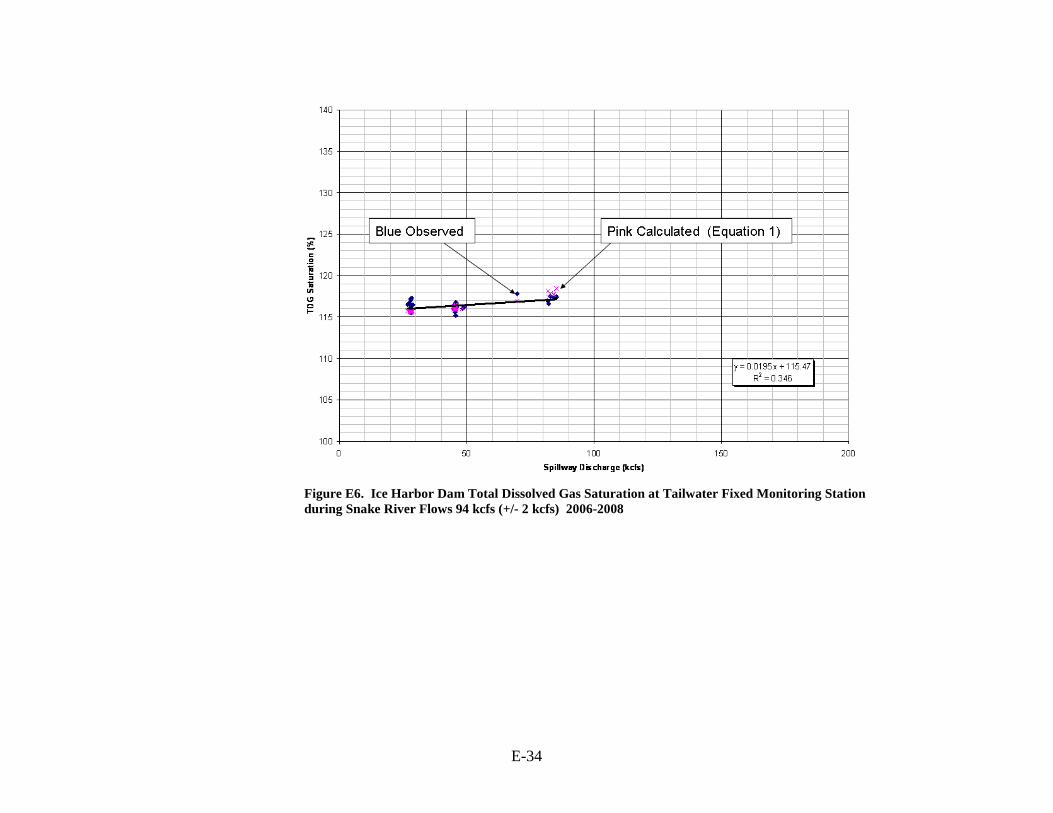
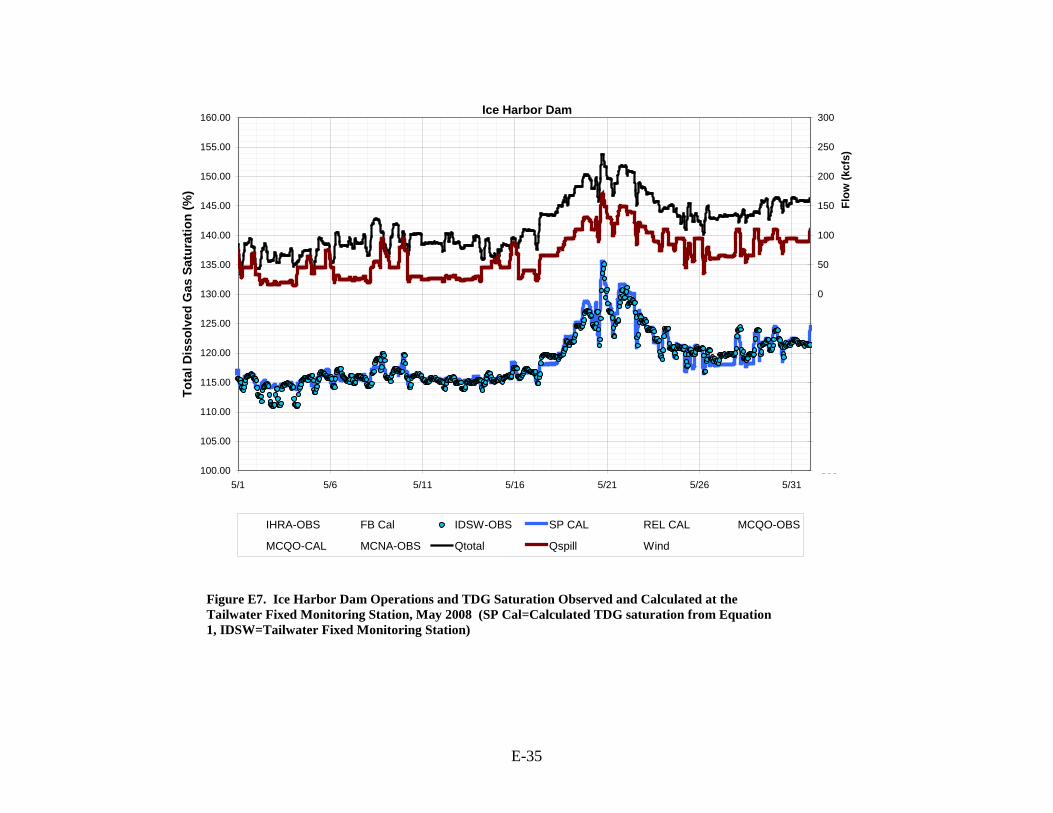
limited by 120 percent saturation has ranged from 50 to 95 kcfs. The variability of TDG saturation for a given spill discharge is chiefly attributed to the variation in tailwater elevation. Other factors contributing to the wide spread in the TDG data as a function of spill discharge are variations in spill pattern, local atmospheric pressure, background TDG levels (during small percent spill events), and water temperature influences. A subset of this data set based on spill events during a total river flow of 94 kcfs (+/-2kcfs) as referenced in the COP was prepared. These data reveal a flat response between tailwater TDG saturation and spill discharge over the spill range from 27 kcfs to 85 kcfs as shown in Figure E6 (observed data blue symbols). These events correspond with spill policies based on a 30 percent spill, 45 kcfs spill, and spill to the TDG capacity. The TDG exchange model does a good job of predicting this response (calculated values are shown in pink) which is related to the small range in tailwater depth of flow and the redistribution of spill over more bays during higher spill events. A hind cast of TDG saturation below Ice Harbor Dam for a wide range of observed historic operations (total river flow ranged from 29 to 238 kcfs) during May of 2008 were conducted using the relationship shown in Equation 1. The spill discharge ranged from 15 to 170.3 kcfs and averaged 65 kcfs during this month. The tailwater elevation also experienced a wide variation from 340.9 to 354.2 ft. The hourly total river and spillway flow are shown in Figure E7 along with the TDG saturation as observed and calculated at the tailwater fixed monitoring station. The predictive error of the estimated TDG pressure using Equation 1 during spill events with an duration greater than 3 hours (filters out error in travel time) had a mean error of less than 1 mm Hg and a standard error of 7.3 mm Hg for 424 hourly observations meeting these criterion.
Results
A series of estimates of TDG exchange were generated for a matrix of conditions impacting TDG exchange in the Snake River at Ice Harbor Dam. This matrix consisted of the structural configuration, spill operation, total river flow, forebay TDG levels, and powerhouse capacity. This large matrix of conditions provides a comprehensive summary of past, present, and potential future configurations at Ice Harbor Dam. This type of summary also provides a comparison of TDG exchange conditions for controlled system components. Often times observed historical data is used as the basis for evaluating the progress of a TDG management program. However, the influence of the runoff hydrograph, changes to spill operation or the structural layout of the dam introduces variables that cloud the assessment of TDG abatement progress.
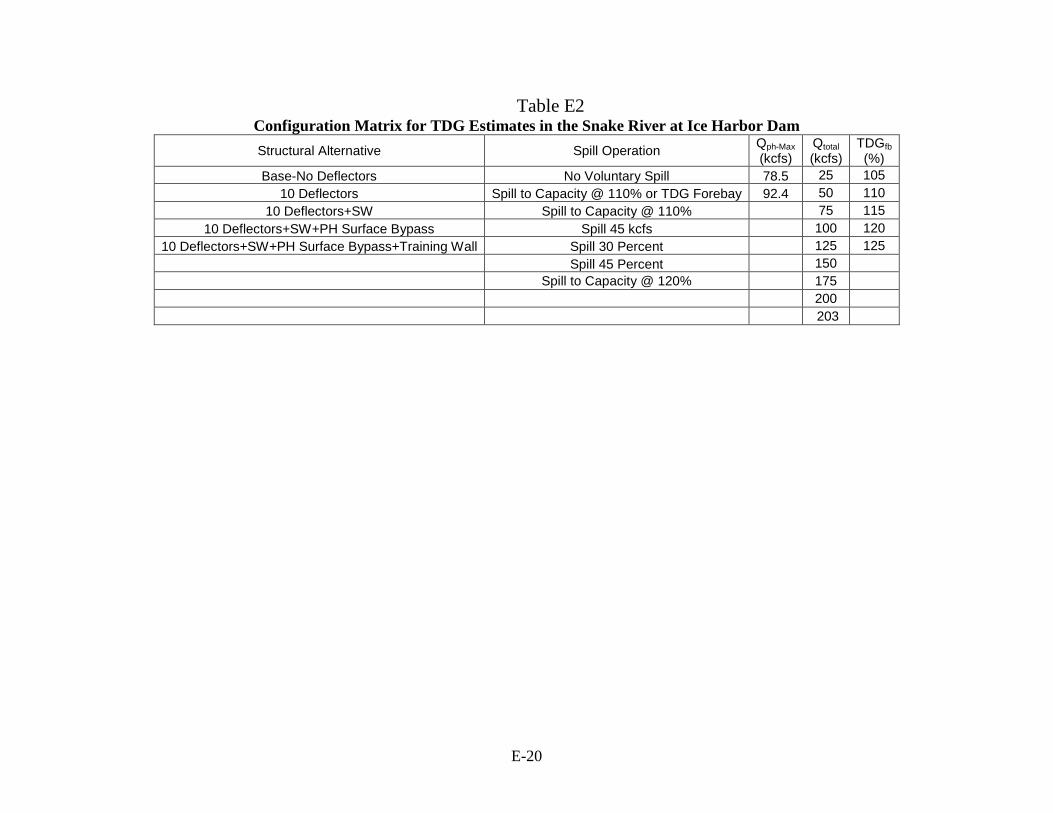
A master table of TDG estimates was developed in an Excel spreadsheet called IHRTDGest.xls summarizing the effects of five different structural configurations, seven different spill policies, two powerhouse capacities, nine different river flow rates, and five background TDG saturations. A summary of the discrete conditions listed in this table are summarized in Table E2. This table consists of 3240 different cases that provide a comprehensive summary of the TDG management program at Ice Harbor Dam.
E-12
The utility of this master table is more manageable when selecting a much smaller subset of conditions to review. It is useful to hold all but one case component constant when reviewing these results. The spreadsheet utility “file/filter/auto” allows the user to reduce this master table into a more meaningful format by allowing the selection of a narrower range of case components. The following discussion provides a general overview of the past, present, and potential future prospects of TDG exchange at Ice Harbor Dam.
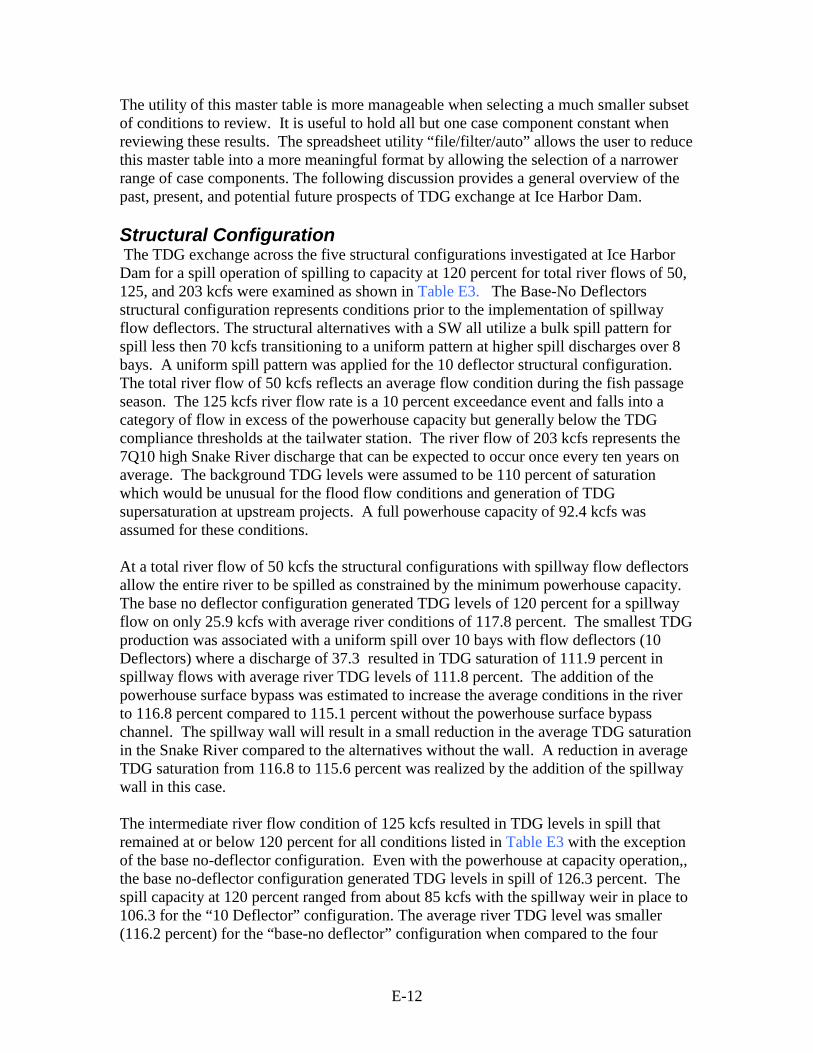
Structural Configuration The TDG exchange across the five structural configurations investigated at Ice Harbor Dam for a spill operation of spilling to capacity at 120 percent for total river flows of 50, 125, and 203 kcfs were examined as shown in Table E3. The Base-No Deflectors structural configuration represents conditions prior to the implementation of spillway flow deflectors. The structural alternatives with a SW all utilize a bulk spill pattern for spill less then 70 kcfs transitioning to a uniform pattern at higher spill discharges over 8 bays. A uniform spill pattern was applied for the 10 deflector structural configuration. The total river flow of 50 kcfs reflects an average flow condition during the fish passage season. The 125 kcfs river flow rate is a 10 percent exceedance event and falls into a category of flow in excess of the powerhouse capacity but generally below the TDG compliance thresholds at the tailwater station. The river flow of 203 kcfs represents the 7Q10 high Snake River discharge that can be expected to occur once every ten years on average. The background TDG levels were assumed to be 110 percent of saturation which would be unusual for the flood flow conditions and generation of TDG supersaturation at upstream projects. A full powerhouse capacity of 92.4 kcfs was assumed for these conditions.
At a total river flow of 50 kcfs the structural configurations with spillway flow deflectors allow the entire river to be spilled as constrained by the minimum powerhouse capacity. The base no deflector configuration generated TDG levels of 120 percent for a spillway flow on only 25.9 kcfs with average river conditions of 117.8 percent. The smallest TDG production was associated with a uniform spill over 10 bays with flow deflectors (10 Deflectors) where a discharge of 37.3 resulted in TDG saturation of 111.9 percent in spillway flows with average river TDG levels of 111.8 percent. The addition of the powerhouse surface bypass was estimated to increase the average conditions in the river to 116.8 percent compared to 115.1 percent without the powerhouse surface bypass channel. The spillway wall will result in a small reduction in the average TDG saturation in the Snake River compared to the alternatives without the wall. A reduction in average TDG saturation from 116.8 to 115.6 percent was realized by the addition of the spillway wall in this case.
The intermediate river flow condition of 125 kcfs resulted in TDG levels in spill that remained at or below 120 percent for all conditions listed in Table E3 with the exception of the base no-deflector configuration. Even with the powerhouse at capacity operation,, the base no-deflector configuration generated TDG levels in spill of 126.3 percent. The spill capacity at 120 percent ranged from about 85 kcfs with the spillway weir in place to 106.3 for the “10 Deflector” configuration. The average river TDG level was smaller (116.2 percent) for the “base-no deflector” configuration when compared to the four

E-13
cases with flow deflectors (117.7 to 120.5 percent). This observation resulted from the much smaller percent of river spilled for the “base no deflector” configuration. The addition of the 10 spillway deflectors allowed a much higher spillway discharge to be scheduled without exceeding the tailwater TDG constraint. The TDG abatement impact of the spillway was much larger for this river discharge than the 50 kcfs flow. The spillway wall caused a reduction in TDG saturation of 2.8 percent in average river conditions when compared to comparable conditions without the wall. The high flow conditions during the 203 kcfs river flows required powerhouse capacity flows with the remainder of the river passing over the spillway or powerhouse surface bypass. The high spill discharges during this flood flow resulted in TDG levels in spill water above 123 percent for spill over bays with flow deflectors and well over 140 percent of saturation for the “Base no deflectors” condition spill. The only case where the cross sectional average TDG saturation was maintained below 120 percent was associated with the “10 Deflector+SW+PH surface bypass+spillway wall scenario (Case 2907). The training wall provided significant benefits during high flow conditions where low TDG forebay levels were available. The training wall resulted in a reduction in the average TDG saturation in the Snake River of 4 percent saturation compared to conditions without the wall. It should be noted that the benefits shown in this case are directly related to the low forebay TDG levels applied for the high river flows. The worst case conditions for TDG can be reduced by implementing a uniform spill pattern over all spill bays. The added TDG contribution from the powerhouse surface bypass are insignificant at the 7Q10 flow.
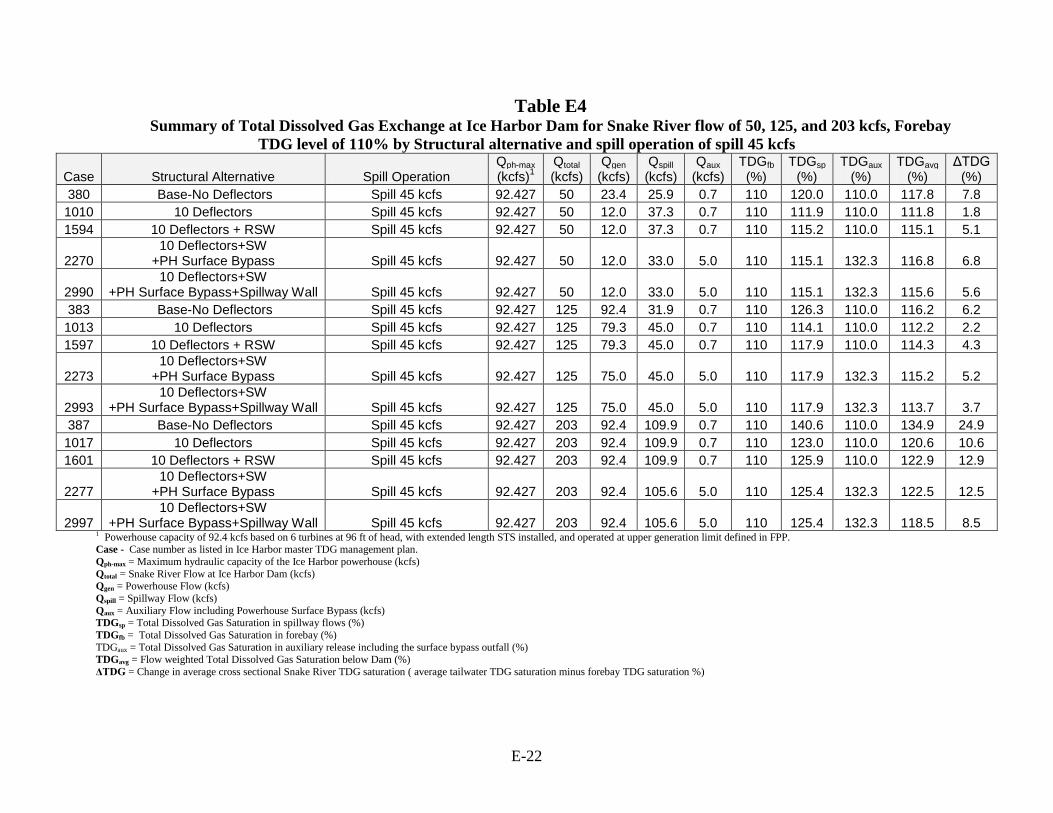
A similar table was produced for river flows of 50, 125, and 203 kcfs for all structural configurations with a fixed “spill 45 kcfs” as listed in Table E4. The flow conditions for the 50 and 203 kcfs are identical in these two cases because other factors constrain the amount of spill at these two river flows. However, for the 125 kcfs river flow the spill operation of spilling 45 kcfs will cause a marked reduction in the average TDG levels estimated in spillway flows and in average river conditions. For structural scenarios with spillway flow deflectors, the reduction in average river TDG conditions ranged from 4.0 percent for “10 Deflectors+SW+PH Surface bypass+Spillway Wall” to 7.7 percent for the “10 Deflectors” configuration.
Spill Operation The influence of spill operation on TDG exchange was explored for the existing 2009 structural configuration of 10 Deflectors+SW for three river flow conditions 50, 125, and 203 kcfs. The maximum powerhouse capacity and forebay TDG level of 110 percent was also held constant for this evaluation as listed in Table E5. The spill operation has considerable influence over the TDG exchange during voluntary spill conditions that exist for 50 and 125 kcfs flows. However, the involuntary spill conditions over ride the influence of the spill operation and the TDG generation is identical for all cases at the 7Q10 flow of 203 kcfs.

E-14
The “No voluntary spill” or “Spill capacity at 110 or Forebay TDG” resulted in no net increase in TDG levels in the Snake River for 50 kcfs. It should be noted that the small spill discharge estimated in this table for the spill operation of “spill capacity at 110 percent” assumes the bulk spill pattern with the SW in place. TDG levels in spill of 110 percent with the SW in operation are not feasible because of the high unit discharge over the SW. The more aggressive “Spill to capacity at 120% “ caused the largest increase (5.2 percent) in average river TDG level for the 50 kcfs river condition and 10 percent saturation for the 125 kcfs river flow. The current spill operation includes both the flat 45 kcfs and spill to capacity at 120 percent. The flat 45 kcfs spill results in average river TDG levels of 114.3 percent compared to 120 percent for the spill to capacity at 120 percent. The 7Q10 flow resulted in a spill of 109.9 kcfs attaining a TDG saturation of 125.9 percent in spillway flows and 122.9 percent in cross sectional average estimates. Most of the powerhouse discharge was entrained into the aerated spillway flows for these conditions causing it to attain similar TDG levels as spillway discharges. The influence of spill operation was not important during these high involuntary spill conditions.
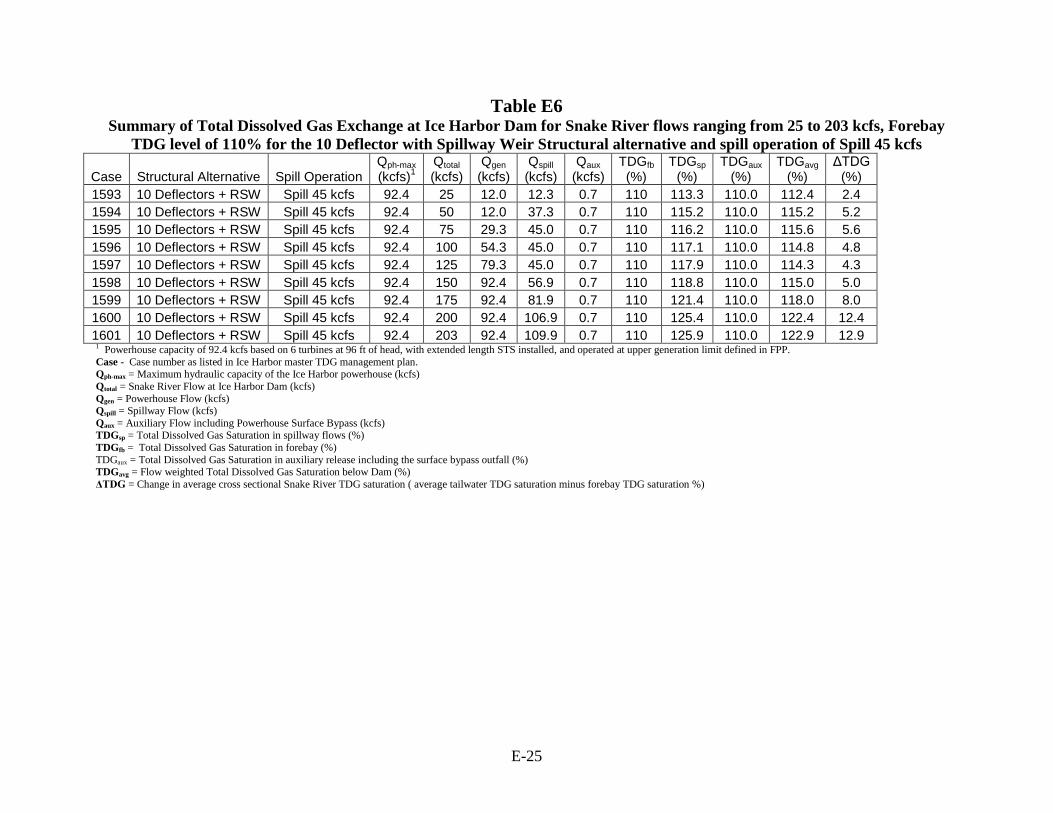
Total River Flow The influence of total river flow on TDG exchange at Ice Harbor Dam for a spill operation of a flat spill of 45 kcfs for river discharges ranging from 25 to 203 kcfs are listed in Table E6 for the current “10 Deflectors + SW” structural configuration. All these conditions assumed a forebay TDG saturation of 110 percent and 6 turbine unit capacity powerhouse flows are available. The TDG saturation in spill reached 121.4 percent during a total river flow of 175 kcfs. The frequency of total river flows exceeding 175 kcfs is less than 6.0 percent of the time. The cross sectional average TDG saturation exceeds 120 percent during a total river flow of 200 kcfs. The spill conditions at Ice Harbor Dam during the 7Q10 event resulted in TDG saturation in spillway flows of 125.9 percent for the existing structural condition. The TDG content in spill continuously increased as a function of total river flow. However, the flow weighted average TDG level in the Snake River reached a local maximum level of 115.6 kcfs at a total river flow of 75 kcfs, remained nearly constant for flows up to 150 kcfs, and increased at a steady rate for involuntary spill river flows.
Forebay TDG Levels Forebay TDG conditions are important in shaping the average conditions below the Ice Harbor dam when spill is a small component of total river flow and diminishes in importance as the percent river spilled becomes large. The higher spillway discharges will entrain larger and larger volumes of powerhouse flow until all powerhouse flows become redirected into the stilling basin and flow recirculation sets up below the powerhouse. The forebay TDG levels become a nearly independent from the TDG loading released from the dam when complete entrainment of powerhouse flows is established. The importance of the initial conditions of powerhouse flow in determining tailwater TDG levels diminishes because of the exposure of powerhouse flows to aerated

E-15
conditions in the stilling basin and adjoining tailwater channel. Spill policies that limit the percent spill allow sufficient powerhouse flows to dilute spillway releases as listed in Table E7. The first three spill policies minimize the size of spillway flows by maximizing powerhouse flow for a river flow of 125 kcfs. The strong correlation between forebay and tailwater TDG levels can be seen in this table. On the other hand, a spill operation of maximizing spill as limited by the tailwater TDG criteria of 120 percent for a river flow of 125 kcfs will be independent of forebay levels. The tailwater TDG saturation for a spill of 85 kcfs out of 125 kcfs in the river will cause tailwater TDG saturation of 120 for background TDG levels ranging from 105 to 125 percent.
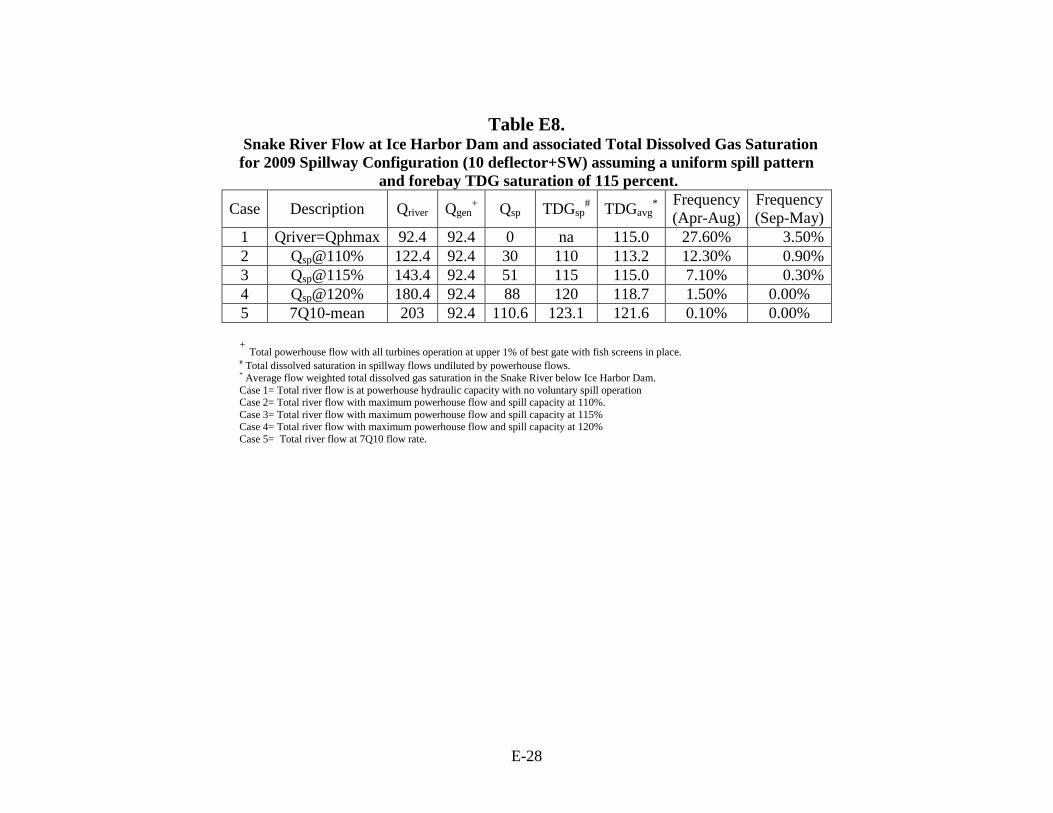
Ice Harbor 2009 configuration TDG and Flow Summary The TDG saturation in Snake River below Ice Harbor Dam was estimated for 5 different river flows assuming the 2009 spillway configuration for a uniform spill pattern and a forebay TDG saturation of 115 percent. In case 1, the total river flow conditions was chosen to correspond with the hydraulic capacity of the powerhouse will all turbines operating at the upper 1 percent range of best gate with fish screens in place. Cases 2-4 correspond with river flows at maximum powerhouse discharge with the spillway capacity limited by TDG saturations of 110, 115, and 120 percent. The final case correspond with the updated mean 7Q10 flow of 203 kcfs. An auxiliary project discharge of 0 kcfs was also assumed in this analysis. The frequency of exceeding the total river flow for each case within the fish passage season (Apr-Aug) and during the non-fish passage season (Sep-Mar) based on observed flows at Ice Harbor Dam from 1974-2009 are also listed in Table E8. The frequency for spilling water above the maximum powerhouse capacity during the fish passage season is nearly 27.6 percent of the time at Ice Harbor Dam but only about 3.5 percent of the time outside of the fish passage season. The powerhouse operations will simply pass the background TDG levels to the receiving pool resulting in no change to the TDG conditions. A uniformly distributed spill of 30 kcfs will generate TDG levels at 110 percent of saturation or 5 percent lower than the initial conditions. Outside of the fish passage season a river flow of 122.4 kcfs occurs less than 1.0 percent of the time. This operation will result in a net decrease in the average TDG conditions of the river to 113.2 percent when forebay levels are 115 percent. The spillway discharges up to 51 kcfs will either reduce or cause no change in the TDG loading of the Snake River for total river flows up to 143.4 kcfs which occurs only about 7 percent of the time during the fish passage season. The spillway flows at Ice Harbor Dam up to 88 kcfs will result in TDG levels of 120 percent and less which corresponds to a total river discharge of 180.4 kcfs and a frequency of occurrence of 1.5 percent during the fish passage season. The worst case conditions will be associated with the 7Q10 flows and a spill discharge of 110.6 kcfs resulting in TDG saturation in spillway flows of 123.1 percent.
Conclusions
E-16
Ice Harbor Dam was the largest producer of TDG supersaturation on the Snake River at the beginning of the TDG abatement program. The TDG content in spillway flow approached 120 percent of saturation for spillway flows of 26 kcfs. At the 7Q10 river flow, the TDG saturation in spill was estimated to exceed 140 percent and average river conditions approaching this same level. Ice Harbor Dam is now recognized at the lowest producer of TDG saturation on either the Snake or Columbia rivers when comparing the TDG generation for a comparable unit spillway discharge. These lower rates of TDG exchange are generally associated with the effectiveness of spillway flow deflectors in conjunction with the shallow tailrace channel. The spillway capacity as limited by the tailwater TDG criteria of 120 percent saturation can range from 85 to 105 kcfs with the spillway weir in operation. The worst case TDG saturation in spill during the 7Q10 river flow was estimated to equal 125.9 percent or about a 15 percent reduction in TDG saturation compared to the same flow conditions without flow deflectors. The optimal reduction in TDG generation can be achieved from the application of a uniform spill pattern across all ten spill bays at Ice Harbor Dam. It was estimated that the spill capacity at 120 percent saturation would be about 88 kcfs under these conditions. The maximum powerhouse capacity along with a spill capacity of 88 kcfs equals a threshold river flow of about 180 kcfs which is exceeded infrequently (1.5 percent of the time) during the fish passage season. The frequency of river flows greater than the hydraulic capacity of the powerhouse outside of the fish passage season were estimated to be 3.5 percent of the time. The spill capacity of Ice Harbor spill using a uniform spill pattern was estimated to be about 30 kcfs. The frequency of river flows exceeding the maximum project release where the TDG levels in spillway flows were 110 percent or less was 0.9 percent of the time outside of the fish passage season. The greatest potential to reduce the TDG loading at Ice Harbor Dam involves lowering the reliance on spill to guide juvenile salmonids. A component of the fish spill operation at Ice Harbor involves “spilling to capacity at 120 percent” which can result in spilling nearly the entire river during moderate to low river flows. A change in the spill operation to 45 kcfs spill, 45 percent spill, or 30 percent spill, will result in an substantial reductions in the TDG loading of the Snake River by Ice Harbor Dam. The inclusion of powerhouse surface bypass channel with a properly designed outfall will further reduce the impact of Ice Harbor operations on TDG levels during voluntary flow conditions. The powerhouse surface bypass channel will be a source for TDG supersaturation but may well promote the improved survival of juvenile salmon during dam passage flows. The adoption of a spillway training wall will provide substantial TDG abatement benefits when background TDG levels are below the content in spillway flows and high percent spill operations are required.

E-17
The system scheduling of spill required due to over generation will provide some TDG abatement opportunities for the Snake river dams. The completion of TDG abatement at Chief Joseph Dam will greatly increase the system capacity to spill water within WDOE TDG standards.

E-18
References CENWP-NWW 2002.“Dissolved Gas Abatement Study Phase II,” Technical Report, US Army Engineer Districts-Portland and Walla Walla, Portland, OR and Walla Walla, WA, respectively.
Schneider, M. L and S.C. Wilhelms, 1997. “Documentation and Analysis of the Near-Field Ice Harbor Tailwater Study, June 27-28, 1996” Memorandum dated 27 January 1997, US Army Waterways Experiment Station, Vicksburg, MS. Schneider, M. L. 1996. “Total Dissolved Gas Data Documentation and Preliminary Analysis: Near-Field Study of the Ice Harbor Tailwater,” CEWESHS- L Memorandum for Record dated 13 June 1996, US Army Waterways Experiment Station, Vicksburg, MS.
Wilhelms, S.C. and Schneider, M. L. 1998. “Documentation and Analysis of the Ice Harbor Near-Field Tailwater Study, March 1998, Post-Deflector Installation,” CEWES-HS-L Memorandum for Record, 8 May 1998, US Army Engineer Waterways Experiment Station, Vicksburg MS.
USGS, March 1982, “Guidelines for Determining Flood Flow Frequency, #17B Bulletin”, U.S. Department of the Interior, Geological Survey, Reston, Virginia WDOE, August 2003, “Total Maximum Daily Load for the Lower Snake River”, Publication No. 03-03-020, Olympia WA 98504-7600

E-19
Table E1 Percent of time the seven-day moving average of daily average flows exceed the reference Snake River Flow
at Ice Harbor Dam, 1975-2009 water years.
Snake River Flow
(kcfs)
Fish Passage Season
April-Aug
(%)
Non-Fish Passage Season
Sept.-March (%)
Comments
25 85.60% 63.50% 50 55.60% 14.90% 75 38.50% 5.10%
78.5 36.10% 4.70% Powerhouse capacity 5 units 92.4 27.10% 3.50% Powerhouse capacity 6 units 100 22.50% 2.70% 125 10.90% 0.70% 150 5.90% 0.20% 175 2.20% 0.00% 200 0.20% 0.00% 203 0.00% 0.00% Updated 7Q10
E-20
Table E2 Configuration Matrix for TDG Estimates in the Snake River at Ice Harbor Dam Structural Alternative Spill Operation Qph-Max
(kcfs) Qtotal (kcfs)
TDGfb (%)
Base-No Deflectors No Voluntary Spill 78.5 25 105 10 Deflectors Spill to Capacity @ 110% or TDG Forebay 92.4 50 110
10 Deflectors+SW Spill to Capacity @ 110% 75 115 10 Deflectors+SW+PH Surface Bypass Spill 45 kcfs 100 120
10 Deflectors+SW+PH Surface Bypass+Training Wall Spill 30 Percent 125 125 Spill 45 Percent 150 Spill to Capacity @ 120% 175 200 203

E-21
Table E3 Summary of Total Dissolved Gas Exchange at Ice Harbor Dam for Snake River flow of 50, 125, and 203 kcfs, Forebay
TDG level of 110% by Structural alternative and spill operation of spill to capacity at 120%
Case Structural Alternative Spill Operation Qph-max (kcfs)1
Qtotal (kcfs)
Qgen (kcfs)
Qspill (kcfs)
Qaux (kcfs)
TDGfb (%)
TDGsp (%)
TDGaux (%)
TDGavg (%)
ΔTDG (%)
290 Base-No Deflectors Spill to Capacity @ 120% 92.4 50 23.4 25.9 0.7 110 120.0 110.0 117.8 7.8 920 10 Deflectors Spill to Capacity @ 120% 92.4 50 12.0 37.3 0.7 110 111.9 110.0 111.8 1.8 1504 10 Deflectors + RSW Spill to Capacity @ 120% 92.4 50 12.0 37.3 0.7 110 115.2 110.0 115.1 5.1
2180 10 Deflectors+SW+ PH Surface Bypass Spill to Capacity @ 120% 92.4 50 12.0 33.0 5.0 110 115.1 132.3 116.8 6.8
2900 10 Deflectors+SW
+PH Surface Bypass+Spillway Wall Spill to Capacity @ 120% 92.4 50 12.0 33.0 5.0 110 115.1 132.3 115.6 5.6 293 Base-No Deflectors Spill to Capacity @ 120% 92.4 125 92.4 31.9 0.7 110 126.3 110.0 116.2 6.2 923 10 Deflectors Spill to Capacity @ 120% 92.4 125 18.0 106.3 0.7 110 120.0 110.0 119.9 9.9 1507 10 Deflectors + RSW Spill to Capacity @ 120% 92.4 125 39.3 85.0 0.7 110 120.0 110.0 119.9 9.9
2183 10 Deflectors+SW
+PH Surface Bypass Spill to Capacity @ 120% 92.4 125 35.0 85.0 5.0 110 120.0 132.3 120.5 10.5
2903 10 Deflectors+SW
+PH Surface Bypass+Spillway Wall Spill to Capacity @ 120% 92.4 125 35.0 85.0 5.0 110 120.0 132.3 117.7 7.7 297 Base-No Deflectors Spill to Capacity @ 120% 92.4 203 92.4 109.9 0.7 110 140.6 110.0 134.9 24.9 927 10 Deflectors Spill to Capacity @ 120% 92.4 203 92.4 109.9 0.7 110 123.0 110.0 120.5 10.5 1511 10 Deflectors + RSW Spill to Capacity @ 120% 92.4 203 92.4 109.9 0.7 110 125.9 110.0 122.9 12.9
2187 10 Deflectors+SW
+PH Surface Bypass Spill to Capacity @ 120% 92.4 203 92.4 105.6 5.0 110 125.4 132.3 122.5 12.5
2907 10 Deflectors+SW
+PH Surface Bypass+Spillway Wall Spill to Capacity @ 120% 92.4 203 92.4 105.6 5.0 110 125.4 132.3 118.5 8.5 1 Powerhouse capacity of 92.4 kcfs based on 6 turbines at 96 ft of head, with extended length STS installed, and operated at upper generation limit defined in FPP. Case - Case number as listed in Ice Harbor master TDG management plan. Qph-max = Maximum hydraulic capacity of the Ice Harbor powerhouse (kcfs) Qtotal = Snake River Flow at Ice Harbor Dam (kcfs) Qgen = Powerhouse Flow (kcfs) Qspill = Spillway Flow (kcfs) Qaux = Auxiliary Flow including Powerhouse Surface Bypass (kcfs) TDGsp = Total Dissolved Gas Saturation in spillway flows (%) TDGfb = Total Dissolved Gas Saturation in forebay (%) TDGaux = Total Dissolved Gas Saturation in auxiliary release including the surface bypass outfall (%) TDGavg = Flow weighted Total Dissolved Gas Saturation below Dam (%) ΔTDG = Change in average cross sectional Snake River TDG saturation ( average tailwater TDG saturation minus forebay TDG saturation %)
E-22
Table E4 Summary of Total Dissolved Gas Exchange at Ice Harbor Dam for Snake River flow of 50, 125, and 203 kcfs, Forebay
TDG level of 110% by Structural alternative and spill operation of spill 45 kcfs
Case Structural Alternative Spill Operation Qph-max (kcfs)1
Qtotal (kcfs)
Qgen (kcfs)
Qspill (kcfs)
Qaux (kcfs)
TDGfb (%)
TDGsp (%)
TDGaux (%)
TDGavg (%)
ΔTDG (%)
380 Base-No Deflectors Spill 45 kcfs 92.427 50 23.4 25.9 0.7 110 120.0 110.0 117.8 7.8 1010 10 Deflectors Spill 45 kcfs 92.427 50 12.0 37.3 0.7 110 111.9 110.0 111.8 1.8 1594 10 Deflectors + RSW Spill 45 kcfs 92.427 50 12.0 37.3 0.7 110 115.2 110.0 115.1 5.1
2270 10 Deflectors+SW
+PH Surface Bypass Spill 45 kcfs 92.427 50 12.0 33.0 5.0 110 115.1 132.3 116.8 6.8
2990 10 Deflectors+SW
+PH Surface Bypass+Spillway Wall Spill 45 kcfs 92.427 50 12.0 33.0 5.0 110 115.1 132.3 115.6 5.6 383 Base-No Deflectors Spill 45 kcfs 92.427 125 92.4 31.9 0.7 110 126.3 110.0 116.2 6.2 1013 10 Deflectors Spill 45 kcfs 92.427 125 79.3 45.0 0.7 110 114.1 110.0 112.2 2.2 1597 10 Deflectors + RSW Spill 45 kcfs 92.427 125 79.3 45.0 0.7 110 117.9 110.0 114.3 4.3
2273 10 Deflectors+SW
+PH Surface Bypass Spill 45 kcfs 92.427 125 75.0 45.0 5.0 110 117.9 132.3 115.2 5.2
2993 10 Deflectors+SW
+PH Surface Bypass+Spillway Wall Spill 45 kcfs 92.427 125 75.0 45.0 5.0 110 117.9 132.3 113.7 3.7 387 Base-No Deflectors Spill 45 kcfs 92.427 203 92.4 109.9 0.7 110 140.6 110.0 134.9 24.9 1017 10 Deflectors Spill 45 kcfs 92.427 203 92.4 109.9 0.7 110 123.0 110.0 120.6 10.6 1601 10 Deflectors + RSW Spill 45 kcfs 92.427 203 92.4 109.9 0.7 110 125.9 110.0 122.9 12.9
2277 10 Deflectors+SW
+PH Surface Bypass Spill 45 kcfs 92.427 203 92.4 105.6 5.0 110 125.4 132.3 122.5 12.5
2997 10 Deflectors+SW
+PH Surface Bypass+Spillway Wall Spill 45 kcfs 92.427 203 92.4 105.6 5.0 110 125.4 132.3 118.5 8.5 1 Powerhouse capacity of 92.4 kcfs based on 6 turbines at 96 ft of head, with extended length STS installed, and operated at upper generation limit defined in FPP. Case - Case number as listed in Ice Harbor master TDG management plan. Qph-max = Maximum hydraulic capacity of the Ice Harbor powerhouse (kcfs) Qtotal = Snake River Flow at Ice Harbor Dam (kcfs) Qgen = Powerhouse Flow (kcfs) Qspill = Spillway Flow (kcfs) Qaux = Auxiliary Flow including Powerhouse Surface Bypass (kcfs) TDGsp = Total Dissolved Gas Saturation in spillway flows (%) TDGfb = Total Dissolved Gas Saturation in forebay (%) TDGaux = Total Dissolved Gas Saturation in auxiliary release including the surface bypass outfall (%) TDGavg = Flow weighted Total Dissolved Gas Saturation below Dam (%) ΔTDG = Change in average cross sectional Snake River TDG saturation ( average tailwater TDG saturation minus forebay TDG saturation %)

E-23
Table E5 Summary of Total Dissolved Gas Exchange at Ice Harbor Dam for Snake River flow of 50, 125, and 203 kcfs, Forebay TDG
level of 110% for the 10 Deflector with Spillway Weir Structural alternative and various spill policies
Case Structural Alternative Spill Operation Qph-max (kcfs)1
Qtotal (kcfs)
Qgen (kcfs)
Qspill (kcfs)
Qaux (kcfs)
TDGfb (%)
TDGsp (%)
TDGaux (%)
TDGavg (%)
ΔTDG (%)
1270 10 Deflectors + RSW No Spill 92.4 50 49.7 0.0 0.7 110 114.9 110.0 110.0 0.0 1324 10 Deflectors + RSW Spill to Capacity @ 110% 92.4 50 47.7 1.6 0.7 110 110.0 110.0 110.0 0.0
1414 10 Deflectors + RSW Spill to Capacity @ 110%
or Forebay TDG 92.4 50 47.7 1.6 0.7 110 110.0 110.0 110.0 0.0 1504 10 Deflectors + RSW Spill to Capacity @ 120% 92.4 50 12.0 37.3 0.7 110 115.2 110.0 115.1 5.1 1594 10 Deflectors + RSW Spill 45 kcfs 92.4 50 12.0 37.3 0.7 110 115.2 110.0 115.1 5.1 1684 10 Deflectors + RSW Spill 30 Percent 92.4 50 34.3 15.0 0.7 110 114.1 110.0 111.9 1.9 1765 10 Deflectors + RSW Spill 45 Percent 92.4 50 26.8 22.5 0.7 110 114.8 110.0 113.3 3.3 1273 10 Deflectors + RSW No Spill 92.4 125 68.1 31.9 0.7 110 118.1 110.0 113.1 5.4 1327 10 Deflectors + RSW Spill to Capacity @ 110% 92.4 125 92.4 31.9 0.7 110 117.6 110.0 112.9 2.9
1417 10 Deflectors + RSW Spill to Capacity @ 110%
or Forebay TDG 92.4 125 92.4 31.9 0.7 110 117.6 110.0 112.9 2.9 1507 10 Deflectors + RSW Spill to Capacity @ 120% 92.4 125 39.3 85.0 0.7 110 120.0 110.0 119.9 9.9 1597 10 Deflectors + RSW Spill 45 kcfs 92.4 125 79.3 45.0 0.7 110 117.9 110.0 114.3 4.3 1687 10 Deflectors + RSW Spill 30 Percent 92.4 125 86.8 37.5 0.7 110 117.8 110.0 113.5 3.5 1768 10 Deflectors + RSW Spill 45 Percent 92.4 125 68.1 56.3 0.7 110 118.1 110.0 115.4 5.4 1277 10 Deflectors + RSW No Spill 92.4 203 92.4 109.9 0.7 110 125.9 110.0 122.9 12.9 1331 10 Deflectors + RSW Spill to Capacity @ 110% 92.4 203 92.4 109.9 0.7 110 125.9 110.0 122.9 12.9
1421 10 Deflectors + RSW Spill to Capacity @ 110%
or Forebay TDG 92.4 203 92.4 109.9 0.7 110 125.9 110.0 122.9 12.9 1511 10 Deflectors + RSW Spill to Capacity @ 120% 92.4 203 92.4 109.9 0.7 110 125.9 110.0 122.9 12.9 1601 10 Deflectors + RSW Spill 45 kcfs 92.4 203 92.4 109.9 0.7 110 125.9 110.0 122.9 12.9 1691 10 Deflectors + RSW Spill 30 Percent 92.4 203 92.4 109.9 0.7 110 125.9 110.0 122.9 12.9 1772 10 Deflectors + RSW Spill 45 Percent 92.4 203 92.4 109.9 0.7 110 125.9 110.0 122.9 12.9 1 Powerhouse capacity of 92.4 kcfs based on 6 turbines at 96 ft of head, with extended length STS installed, and operated at upper generation limit defined in FPP. Case - Case number as listed in Ice Harbor master TDG management plan. Qph-max = Maximum hydraulic capacity of the Ice Harbor powerhouse (kcfs) Qtotal = Snake River Flow at Ice Harbor Dam (kcfs) Qgen = Powerhouse Flow (kcfs) Qspill = Spillway Flow (kcfs) Qaux = Auxiliary Flow including Powerhouse Surface Bypass (kcfs) TDGsp = Total Dissolved Gas Saturation in spillway flows (%) TDGfb = Total Dissolved Gas Saturation in forebay (%)

E-24
TDGaux = Total Dissolved Gas Saturation in auxiliary release including the surface bypass outfall (%) TDGavg = Flow weighted Total Dissolved Gas Saturation below Dam (%) ΔTDG = Change in average cross sectional Snake River TDG saturation ( average tailwater TDG saturation minus forebay TDG saturation %)
E-25
Table E6 Summary of Total Dissolved Gas Exchange at Ice Harbor Dam for Snake River flows ranging from 25 to 203 kcfs, Forebay
TDG level of 110% for the 10 Deflector with Spillway Weir Structural alternative and spill operation of Spill 45 kcfs
Case Structural Alternative Spill Operation Qph-max (kcfs)1
Qtotal (kcfs)
Qgen (kcfs)
Qspill (kcfs)
Qaux (kcfs)
TDGfb (%)
TDGsp (%)
TDGaux (%)
TDGavg (%)
ΔTDG (%)
1593 10 Deflectors + RSW Spill 45 kcfs 92.4 25 12.0 12.3 0.7 110 113.3 110.0 112.4 2.4 1594 10 Deflectors + RSW Spill 45 kcfs 92.4 50 12.0 37.3 0.7 110 115.2 110.0 115.2 5.2 1595 10 Deflectors + RSW Spill 45 kcfs 92.4 75 29.3 45.0 0.7 110 116.2 110.0 115.6 5.6 1596 10 Deflectors + RSW Spill 45 kcfs 92.4 100 54.3 45.0 0.7 110 117.1 110.0 114.8 4.8 1597 10 Deflectors + RSW Spill 45 kcfs 92.4 125 79.3 45.0 0.7 110 117.9 110.0 114.3 4.3 1598 10 Deflectors + RSW Spill 45 kcfs 92.4 150 92.4 56.9 0.7 110 118.8 110.0 115.0 5.0 1599 10 Deflectors + RSW Spill 45 kcfs 92.4 175 92.4 81.9 0.7 110 121.4 110.0 118.0 8.0 1600 10 Deflectors + RSW Spill 45 kcfs 92.4 200 92.4 106.9 0.7 110 125.4 110.0 122.4 12.4 1601 10 Deflectors + RSW Spill 45 kcfs 92.4 203 92.4 109.9 0.7 110 125.9 110.0 122.9 12.9
1 Powerhouse capacity of 92.4 kcfs based on 6 turbines at 96 ft of head, with extended length STS installed, and operated at upper generation limit defined in FPP. Case - Case number as listed in Ice Harbor master TDG management plan. Qph-max = Maximum hydraulic capacity of the Ice Harbor powerhouse (kcfs) Qtotal = Snake River Flow at Ice Harbor Dam (kcfs) Qgen = Powerhouse Flow (kcfs) Qspill = Spillway Flow (kcfs) Qaux = Auxiliary Flow including Powerhouse Surface Bypass (kcfs) TDGsp = Total Dissolved Gas Saturation in spillway flows (%) TDGfb = Total Dissolved Gas Saturation in forebay (%) TDGaux = Total Dissolved Gas Saturation in auxiliary release including the surface bypass outfall (%) TDGavg = Flow weighted Total Dissolved Gas Saturation below Dam (%) ΔTDG = Change in average cross sectional Snake River TDG saturation ( average tailwater TDG saturation minus forebay TDG saturation %)

E-26
Table E7 Summary of Total Dissolved Gas Exchange at Ice Harbor Dam for Snake River flow of 125 kcfs, Forebay TDG levels ranging
from 105 to 125 % for the 10 Deflector with Spillway Weir Structural alternative and various spill policies Case Structural Alternative Spill Operation Qph-max
(kcfs)1 Qtotal (kcfs)
Qgen (kcfs)
Qspill (kcfs)
Qaux (kcfs)
TDGfb (%)
TDGsp (%)
TDGaux (%)
TDGavg (%)
ΔTDG (%)
1263 10 Deflectors + RSW No Spill 92.4 125 92.4 31.9 0.7 105 117.6 105.0 109.8 8.8 1273 10 Deflectors + RSW No Spill 92.4 125 92.4 31.9 0.7 110 117.6 110.0 112.9 5.4 1283 10 Deflectors + RSW No Spill 92.4 125 92.4 31.9 0.7 115 117.6 115.0 116.0 2.1 1292 10 Deflectors + RSW No Spill 92.4 125 92.4 31.9 0.7 120 117.6 120.0 119.1 -1.3 1301 10 Deflectors + RSW No Spill 92.4 125 92.4 31.9 0.7 125 117.6 125.0 122.2 -4.7 1308 10 Deflectors + RSW Spill to Capacity @ 110% 92.4 125 92.4 31.9 0.7 105 117.6 105.0 109.8 4.8 1327 10 Deflectors + RSW Spill to Capacity @ 110% 92.4 125 92.4 31.9 0.7 110 117.6 110.0 112.9 2.9 1346 10 Deflectors + RSW Spill to Capacity @ 110% 92.4 125 92.4 31.9 0.7 115 117.6 115.0 116.0 1.0 1364 10 Deflectors + RSW Spill to Capacity @ 110% 92.4 125 92.4 31.9 0.7 120 117.6 120.0 119.1 -0.9 1382 10 Deflectors + RSW Spill to Capacity @ 110% 92.4 125 92.4 31.9 0.7 125 117.6 125.0 122.2 -2.8
1398 10 Deflectors + RSW Spill to Capacity @ 110%
or Forebay TDG 92.4 125 92.4 31.9 0.7 105 117.6 105.0 109.8 4.8
1417 10 Deflectors + RSW Spill to Capacity @ 110%
or Forebay TDG 92.4 125 92.4 31.9 0.7 110 117.6 110.0 112.9 2.9
1436 10 Deflectors + RSW Spill to Capacity @ 110%
or Forebay TDG 92.4 125 92.4 31.9 0.7 115 117.6 115.0 116.0 1.0
1454 10 Deflectors + RSW Spill to Capacity @ 110%
or Forebay TDG 92.4 125 39.3 85.0 0.7 120 120.0 120.0 120.0 0.0
1472 10 Deflectors + RSW Spill to Capacity @ 110%
or Forebay TDG 92.4 125 12.0 112.3 0.7 125 123.0 125.0 123.0 -2.0 1488 10 Deflectors + RSW Spill to Capacity @ 120% 92.4 125 39.3 85.0 0.7 105 120.0 105.0 120.0 15.0 1507 10 Deflectors + RSW Spill to Capacity @ 120% 92.4 125 39.3 85.0 0.7 110 120.0 110.0 120.0 10.0 1526 10 Deflectors + RSW Spill to Capacity @ 120% 92.4 125 39.3 85.0 0.7 115 120.0 115.0 120.0 5.0 1544 10 Deflectors + RSW Spill to Capacity @ 120% 92.4 125 39.3 85.0 0.7 120 120.0 120.0 120.0 0.0 1562 10 Deflectors + RSW Spill to Capacity @ 120% 92.4 125 39.3 85.0 0.7 125 120.0 125.0 120.0 -5.0 1578 10 Deflectors + RSW Spill 45 kcfs 92.4 125 79.3 45.0 0.7 105 117.9 105.0 112.0 7.0 1597 10 Deflectors + RSW Spill 45 kcfs 92.4 125 79.3 45.0 0.7 110 117.9 110.0 114.3 4.3 1616 10 Deflectors + RSW Spill 45 kcfs 92.4 125 79.3 45.0 0.7 115 117.9 115.0 116.6 1.6 1634 10 Deflectors + RSW Spill 45 kcfs 92.4 125 79.3 45.0 0.7 120 117.9 120.0 118.9 -1.1 1652 10 Deflectors + RSW Spill 45 kcfs 92.4 125 79.3 45.0 0.7 125 117.9 125.0 121.2 -3.8 1668 10 Deflectors + RSW Spill 30 Percent 92.4 125 86.8 37.5 0.7 105 117.8 105.0 110.7 5.7

E-27
Case Structural Alternative Spill Operation Qph-max (kcfs)1
Qtotal (kcfs)
Qgen (kcfs)
Qspill (kcfs)
Qaux (kcfs)
TDGfb (%)
TDGsp (%)
TDGaux (%)
TDGavg (%)
ΔTDG (%)
1687 10 Deflectors + RSW Spill 30 Percent 92.4 125 86.8 37.5 0.7 110 117.8 110.0 113.5 3.5 1706 10 Deflectors + RSW Spill 30 Percent 92.4 125 86.8 37.5 0.7 115 117.8 115.0 116.2 1.2 1724 10 Deflectors + RSW Spill 30 Percent 92.4 125 86.8 37.5 0.7 120 117.8 120.0 119.0 -1.0 1742 10 Deflectors + RSW Spill 30 Percent 92.4 125 86.8 37.5 0.7 125 117.8 125.0 121.7 -3.3 1758 10 Deflectors + RSW Spill 45 Percent 92.4 125 68.1 56.3 0.7 105 118.1 105.0 113.8 8.8 1768 10 Deflectors + RSW Spill 45 Percent 92.4 125 68.1 56.3 0.7 110 118.1 110.0 115.4 5.4 1778 10 Deflectors + RSW Spill 45 Percent 92.4 125 68.1 56.3 0.7 115 118.1 115.0 117.1 2.1 1787 10 Deflectors + RSW Spill 45 Percent 92.4 125 68.1 56.3 0.7 120 118.1 120.0 118.7 -1.3 1796 10 Deflectors + RSW Spill 45 Percent 92.4 125 68.1 56.3 0.7 125 118.1 125.0 120.3 -4.7
1 Powerhouse capacity of 92.4 kcfs based on 6 turbines at 96 ft of head, with extended length STS installed, and operated at upper generation limit defined in FPP. Case - Case number as listed in Ice Harbor master TDG management plan. Qph-max = Maximum hydraulic capacity of the Ice Harbor powerhouse (kcfs) Qtotal = Snake River Flow at Ice Harbor Dam (kcfs) Qgen = Powerhouse Flow (kcfs) Qspill = Spillway Flow (kcfs) Qaux = Auxiliary Flow including Powerhouse Surface Bypass (kcfs) TDGsp = Total Dissolved Gas Saturation in spillway flows (%) TDGfb = Total Dissolved Gas Saturation in forebay (%) TDGaux = Total Dissolved Gas Saturation in auxiliary release including the surface bypass outfall (%) TDGavg = Flow weighted Total Dissolved Gas Saturation below Dam (%) ΔTDG = Change in average cross sectional Snake River TDG saturation ( average tailwater TDG saturation minus forebay TDG saturation %)
E-28
Table E8.
Snake River Flow at Ice Harbor Dam and associated Total Dissolved Gas Saturation for 2009 Spillway Configuration (10 deflector+SW) assuming a uniform spill pattern
and forebay TDG saturation of 115 percent.
Case Description Qriver Qgen+ Qsp TDGsp
# TDGavg* Frequency
(Apr-Aug) Frequency (Sep-May)
1 Qriver=Qphmax 92.4 92.4 0 na 115.0 27.60% 3.50% 2 Qsp@110% 122.4 92.4 30 110 113.2 12.30% 0.90% 3 Qsp@115% 143.4 92.4 51 115 115.0 7.10% 0.30% 4 Qsp@120% 180.4 92.4 88 120 118.7 1.50% 0.00% 5 7Q10-mean 203 92.4 110.6 123.1 121.6 0.10% 0.00%
+ Total powerhouse flow with all turbines operation at upper 1% of best gate with fish screens in place. # Total dissolved saturation in spillway flows undiluted by powerhouse flows. * Average flow weighted total dissolved gas saturation in the Snake River below Ice Harbor Dam. Case 1= Total river flow is at powerhouse hydraulic capacity with no voluntary spill operation Case 2= Total river flow with maximum powerhouse flow and spill capacity at 110%. Case 3= Total river flow with maximum powerhouse flow and spill capacity at 115% Case 4= Total river flow with maximum powerhouse flow and spill capacity at 120% Case 5= Total river flow at 7Q10 flow rate.

E-29
0.00%
10.00%
20.00%
30.00%
40.00%
50.00%
60.00%
70.00%
80.00%
90.00%
100.00%
0 50 100 150 200 250
Snake River Flow at Ice Harbor Dam (kcfs)(Seven-Day Moving Average of Daily Average Flow during April-August,1975-2007)
Perc
ent E
xcee
danc
e (%
)
Figure E1. Percent Exceedance versus Snake River Flow at Ice Harbor Dam during April-August 1975-2009.
Qph-max
7Q10
E-30
0.00%
10.00%
20.00%
30.00%
40.00%
50.00%
60.00%
70.00%
80.00%
90.00%
100.00%
0 50 100 150 200 250
Snake River Flow at Ice Harbor Dam (kcfs)(Seven-Day Moving Average of Daily Average Flow during Sept.-March,1974-2007)
Perc
ent E
xcee
danc
e (%
)
Figure E2 . Percent Exceedance versus Snake River Flow at Ice Harbor Dam during Sept.-March, 1974-2009.
Qph-max
7Q10

E-31
y = 0.1233x + 109.21R2 = 0.9258
100
105
110
115
120
125
130
135
140
0 10 20 30 40 50 60 70 80 90 100 110 120 130 140
Spillway Discharge (kcfs)
TDG
Sat
urat
ion
(%)
Figure E3. Total Dissolved Gas Saturation at the Tailwater Fixed Monitoring Station at Ice Harbor Dam as a function of Spillway Discharge, 2002-2009

E-32
y = 0.1107x + 100.72R2 = 0.9758
95
100
105
110
115
120
125
130
0 50 100 150 200 250 300
Snake River Flow at Ice Harbor Dam
Tota
l Dis
solv
ed G
as S
atur
atio
n (%
)
Figure E4. Total Dissolved Gas Saturation in the Forebay of Ice Harbor Dam as a function of Total Snake River Flow, 1995-2007

E-33
Figure E5. Total Dissolved Gas Saturation at the Tailwater Fixed Monitoring Station at Ice Harbor Dam as a function of Spillway Discharge, 2006-2008
E-34
Figure E6. Ice Harbor Dam Total Dissolved Gas Saturation at Tailwater Fixed Monitoring Station during Snake River Flows 94 kcfs (+/- 2 kcfs) 2006-2008
E-35
Ice Harbor Dam
100.00
105.00
110.00
115.00
120.00
125.00
130.00
135.00
140.00
145.00
150.00
155.00
160.00
5/1 5/6 5/11 5/16 5/21 5/26 5/31
Tota
l Dis
solv
ed G
as S
atur
atio
n (%
)
-300
-250
-200
-150
-100
-50
0
50
100
150
200
250
300
Flow
(kcf
s)
IHRA-OBS FB Cal IDSW-OBS SP CAL REL CAL MCQO-OBS
MCQO-CAL MCNA-OBS Qtotal Qspill Wind
Figure E7. Ice Harbor Dam Operations and TDG Saturation Observed and Calculated at the Tailwater Fixed Monitoring Station, May 2008 (SP Cal=Calculated TDG saturation from Equation 1, IDSW=Tailwater Fixed Monitoring Station)