Embed Size (px)
Citation preview

Appendix E – DEQ Final Report Bluff
Recession Rate Analysis
Final Report
Bluff Recession Rate Analysis at F.J. McLain State Park Houghton County, Michigan
In support of Michigan Coastal Zone Management Program Project #14-CHaz-002
F.J. McLain State Park General Management Plan and Geological Erosion Impact Study
Michigan Coastal Zone Management Program Office of the Great Lakes
Department of Environmental Quality
August 15, 2014

2 | P a g e
Table of Contents I. Introduction ............................................................................................................ 3
A. Background ...................................................................................................... 3
B. Project Scope ................................................................................................... 3
C. Location and Setting ........................................................................................ 4
D. Geology ............................................................................................................ 4
E. Past Studies ..................................................................................................... 5
II. Recession Rate Analysis Methods ......................................................................... 5
A. Field Data Collection ........................................................................................ 5
B. DNR Field Measurement Analysis .................................................................... 6
C. Photogrammetry-based Analysis ..................................................................... 6
Aerial Photograph Acquisition .......................................................................... 6
Rectification of Aerial Imagery .......................................................................... 7
Extraction of Bluff and Shoreline Features ....................................................... 8
Calculation of Recession Rates ...................................................................... 10
III. Results ................................................................................................................. 11
A. DNR Field Measurement Analysis .................................................................. 11
B. Photogrammetry-based Analysis .................................................................... 11
Shoreline Change ........................................................................................... 12
Bluff Line Change ........................................................................................... 12
IV. Discussion – Application of Projected Recession Distances ............................... 14
V. References .......................................................................................................... 16
Appendix A – Map Sheets
Appendix B – DNR Field Recession Measurements

3 | P a g e
I. Introduction
A. Background Erosion of the coastal bluff within F.J. McLain State Park has been a management challenge for decades, with several past research and study efforts devoted towards assessing the mechanics and rates of erosion. Continued chronic erosion and threat of additional loss of campground infrastructure prompted the Department of Natural Resources (DNR), Parks and Recreation Division to apply for grant funds from the Michigan Coastal Zone Management (CZM) Program, Office of the Great Lakes, Department of Environmental Quality for an erosion study and general management plan effort for the park. The purpose of the grant project is to determine where future erosion will likely occur versus those stretches of the park’s coast that will tend to be relatively stable, thus identifying areas within the park where relocation of infrastructure should and should not occur.
The larger project effort consists of three distinct components. First, a field-based geophysical study is being conducted by Materials Testing Consultants, Inc. (MTC) to analyze the subsurface geology to effectively understand the location of near-surface bedrock and other relatively stable geologic areas along with associated effects these areas may have on shore erosion in the future at the park. Second, the shoreline and bluff recession rate provided for in this document serves as an updated, rigorous evaluation of long-term annualized rates of recession within the park. Finally, a park general management plan will be completed (under contract from DNR to Clearzoning) to develop a full assessment of coastal hazards, current natural, historic, cultural, and recreational resources at F.J. McLain State Park. The general management plan will define the park 'Purpose' and 'Significance' as well as specific 'Management Zones' for the park. This general management plan will consider and incorporate the findings of the first two subtasks to plan for wise and sustainable future use and management of the park with respect to the coastal hazards element.
B. Project Scope This recession rate analysis at F.J. McLain State Park combines field-collected and remotely-sensed data within a geographic information system (GIS) to calculate updated annualized bluff and shoreline recession rates within the park. Locations of the bluff and shoreline through time are acquired from three sources including: 1) digitized from digital orthoimagery; 2) field-collected using a global positioning system; and 3) interpreted as based on field notes from DNR staff at F.J. McLain State Park. Projected Recession Distances (PRDs) are provided based on the historic recession rates. PRDs for the bluff line foster the mapping of coastal erosion hazard zones, which the general planning effort might accommodate through the relocation of existing infrastructure and appropriate site planning for future infrastructure investments. This effort advances knowledge from past studies by providing an expanded time period of study. Further improvements are realized through the application of field-collected data and advanced photogrammetry techniques.
4 | P a g e
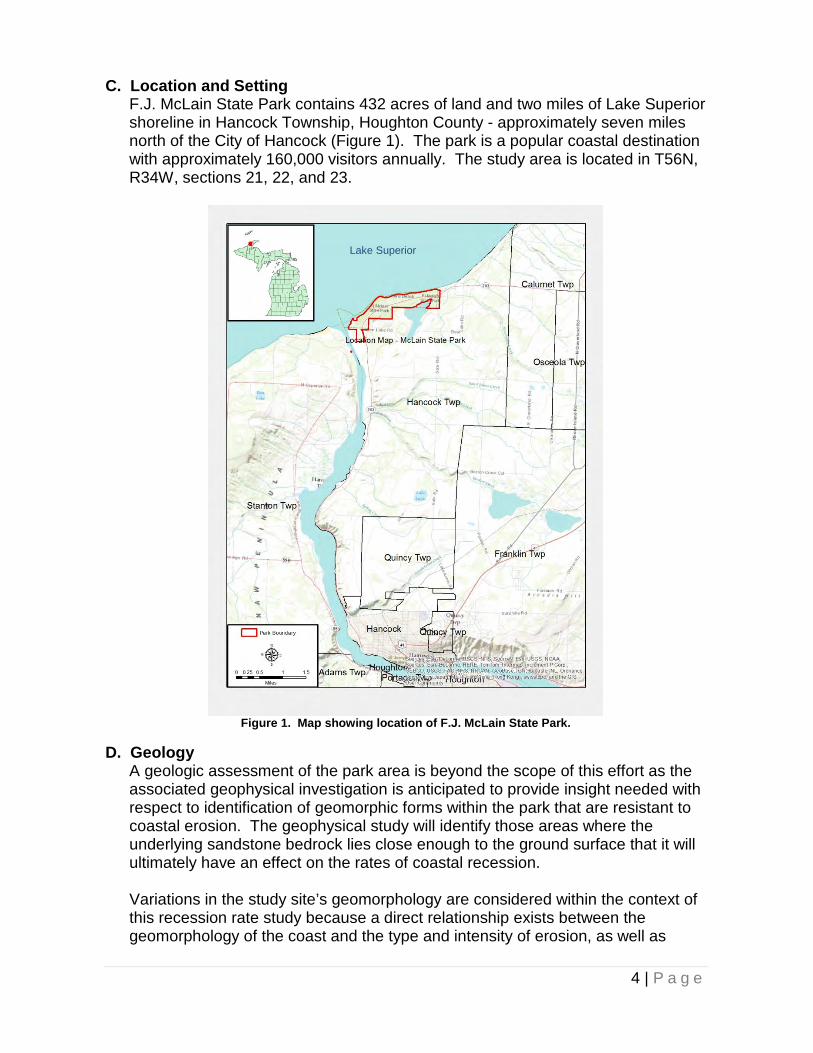
C. Location and Setting F.J. McLain State Park contains 432 acres of land and two miles of Lake Superior shoreline in Hancock Township, Houghton County - approximately seven miles north of the City of Hancock (Figure 1). The park is a popular coastal destination with approximately 160,000 visitors annually. The study area is located in T56N, R34W, sections 21, 22, and 23.
Figure 1. Map showing location of F.J. McLain State Park.
D. Geology A geologic assessment of the park area is beyond the scope of this effort as the associated geophysical investigation is anticipated to provide insight needed with respect to identification of geomorphic forms within the park that are resistant to coastal erosion. The geophysical study will identify those areas where the underlying sandstone bedrock lies close enough to the ground surface that it will ultimately have an effect on the rates of coastal recession.
Variations in the study site’s geomorphology are considered within the context of this recession rate study because a direct relationship exists between the geomorphology of the coast and the type and intensity of erosion, as well as
Lake Superior

5 | P a g e
implications on the approach to be used in identifying an appropriate erosion reference feature.
E. Past Studies Several past studies at F.J. McLain State Park have been conducted including a July 2001 Master Plan conducted by M.C. Smith Associates and Architectural Group, Inc. The 2001 Master plan included a recession rate study contracted to W.F. Baird and Associates. Other studies include a University of Michigan effort which utilized a numerical model to predict erosion within the park and a 1997 U.S. Army Corps of Engineers (USACE) erosion study. Recession rates within the park were also calculated as part of the 1982 High-Risk Erosion Area study conducted by the Department of Natural Resources for Houghton County. Rates of recession calculated in these past efforts are variable as shown in the following table.
Entity Study Title Temporal Period
of Study Projected Maximum Bluff Recession Rate
(feet/year) DNR Division of Land Resource Programs
Bluff Recession Rate Study – High Risk Erosion Area Program
1938 – 1980
2.1
USACE – Detroit District
F.J. McLain State Park Erosion Study
1938 – 1991* 1995 – 1997**
3* 7.5**
W.F. Baird & Associates
Shoreline Stability Study: F.J. McLain State Park, Michigan
1938 – 1998 3.3
*(based on aerial photograph analysis) **(based on DNR field measurements)
II. Recession Rate Analysis Methods Recession rates are calculated using two primary sources: 1) a remote sensing approach utilizing primarily aerial imagery, and 2) interpretation and analysis of DNR-collected field data. Both approaches are aided by the field data collection efforts of the CZM Program conducted May 28-29, 2014.
A. Field Data Collection The CZM Program’s Trimble GeoExplorer GeoXT 6000 series differential GPS unit is used to capture the location of the bluff line. Field data collection at F.J. McLain State Park occurred May 28–29, 2014. The bluff line data collection starts near the pier structure at the southwest end of the study area, heading northeast to the opposite end of the study area – stopping short of the eastern park boundary by approximately 900 feet due to accessibility issues. This easternmost portion of the park is not anticipated to be utilized by the DNR and also is not included in the MTC geophysical survey. A GPS location is collected every meter along the top of the bluff.

6 | P a g e
The shoreline (wetted perimeter) position is collected with the GPS starting at the northeast end of the study area, heading southwest to the opposite end of the study area. A position is collected every five meters along shoreline.
In addition to the GPS data, site photos capturing the general layout of the beach and designated swim area are captured from both ends of the beach, with photographs taken from the shoreline and the landward extent of the beach area. Photographs of the bluff are taken approximately every 200 meters along shore.
Trimble TerraSync software is used to manage field data collection. GPS Pathfinder Office Software Version 5.30 is used for development of the data dictionary used for data collection and also to post-process collected GPS data.
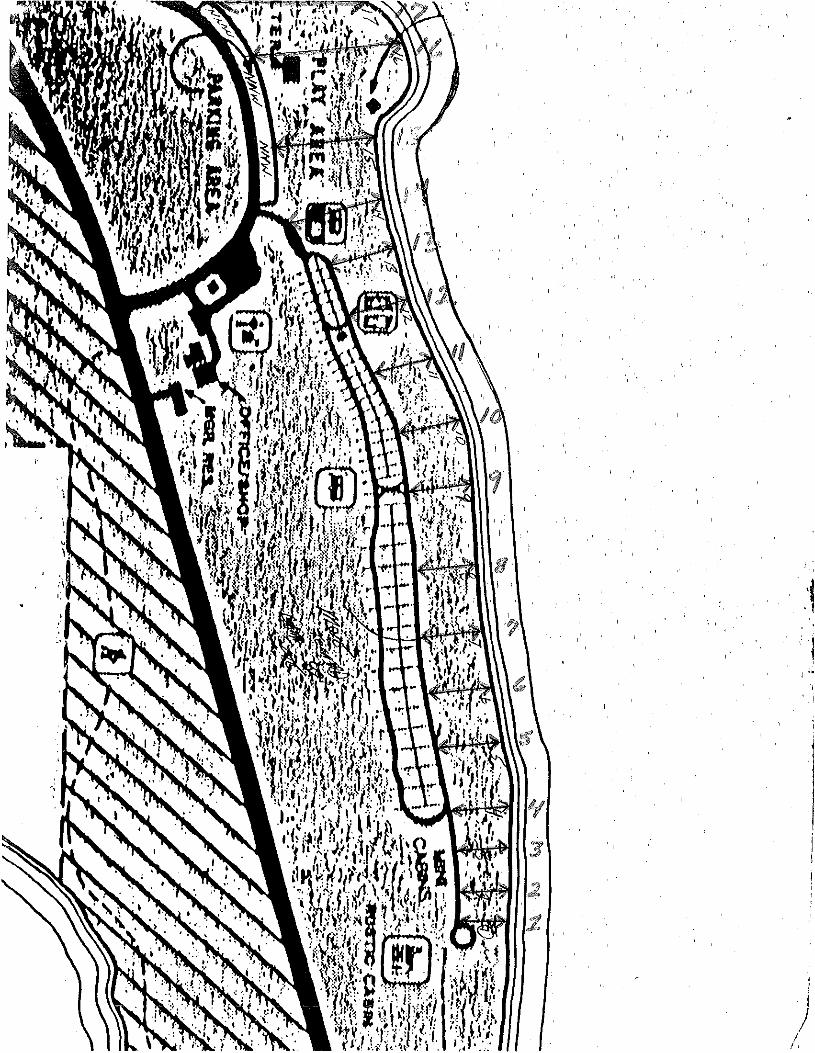
B. DNR Field Measurement Analysis DNR field notes (Appendix B) documenting bluff recession within F.J. McLain State Park contain recession measurements at 22 different sites in the park from 1976 through 2013. The measurements are documented as a measured distance from benchmark features. The majority of the features are nails that have been driven into the road surface; however, landmarks such as the picnic/toilet building and swing in the picnic area are also used. Geographic positions of the benchmark features were collected on-site with the GPS unit fostering the mapping of these benchmarks within the geographic information system (GIS).
Measurements based on the nail benchmarks are represented in Appendix A – Sheet 1. A transect is placed from the benchmark to the oldest recorded position of the bluff/shoreline at each location. The direction of transects from benchmarks is constructed in a direction that is the least distance to the bluff line. A line feature from the oldest recorded position to the most recent field measurement is then created in the GIS to display the total distance of change at each transect. Each feature is attributed with the calculated end-point recession rate.
The GPS-acquired location of the five landmark features from which the DNR measures bluff and shoreline change is shown in Appendix A – Sheet 2. Measurements at the landmark features have been acquired over a variety of time frames and thus the period of data collection is shown along with the calculated end-point rate of recession for each landmark feature.
C. Photogrammetry-based Analysis The photogrammetry-based analysis uses digital imagery within a GIS to track past movement of bluff and shoreline features.
Aerial Photograph Acquisition An assessment of available shoreline aerial prints and digital images is conducted and photo sets utilized determined based on photo scale, season (leaf-on vs. leaf-off conditions), time period represented, associated water level conditions, and quality of the photograph. Recent data sources are available in

7 | P a g e
the form of digital orthoimages, which are geometrically corrected images such that the scale is uniform and the photo has the same lack of distortion as a map. Unlike an uncorrected aerial photograph, an orthophotograph can be used to measure true distances, because it is an accurate representation of the Earth's surface, having been adjusted for displacement errors that may result from topographic relief, lens distortion, and camera tilt. Aerial photographs for the study area are available dating back to 1938. Photographic prints are the common format for the older historic data sets, which are scanned on a high-resolution flatbed scanner. More recent data sets are available as digital orthoimages. Figure 2 provides details for the aerial photographs and images used in this study.
Date of Photograph / Imagery
Entity for Photograph Origin
Photo Numbers
Acquired as Photograph or Digital Image
Image Ground Resolution (ft.)
Estimated Error (Total Root Mean Square error)
Lake Superior Water Level at Time of Photo Acquisition (Feet)*
9/17/2008 Department of Homeland Security (DHS)
Digital Image 1 601.61
5/19/1992 National Aerial Photography Program
4906-133 Photograph 4 0.005 601.44
5/14/1984 Farm Service Agency
789-11 Photograph 5 0.0018 602.00
4/27/1980 USACE 241-3, 241-5, 241-6, 241-8
Photograph 0.49 241-3: 0.0096 241-5: 0.0057 241-6: 0.0047 241-8: 0.0039
601.54
5/8/1977 DNR 544, 545, 548, 549
Photograph 0.81 544: 0.0055 545: 0.0059 548: 0.0053 549: 0.0055
601.28
8/10/1963 DNR 167, 171 Photograph 1 167: 0.0041 171: 0.0053
601.84
7/22/1954 Farm Service Agency
4N-153, 5N-02
Photograph 1 153: 0.0049 02: 0.0038
602.43
6/22/1938 National Archives
A-4-96, A-4-92
Photograph 2 96: 0.0044 92: 0.004
602.75
Figure 2. Aerial photographs and images used in recession rate analysis. *This column shows monthly lake-wide average water levels of Lake Superior at the month of photo acquisition. Vertical reference datum is the International Great Lakes Datum, 1985. Data are from The Great Lakes Water Level Dashboard (http://www.glerl.noaa.gov/data/now/wlevels/dbd/) (Gronewold et al. 2013).
Rectification of Aerial Imagery Accurate orthoimages are necessary prior to extraction of the bluff and shoreline features as this causes all historic images to align geospatially and fosters accurate measurements and change detection. Digital aerial images not orthorectified when acquired are orthorectified in Erdas Imagine 2014 software.
8 | P a g e
This process applies a digital elevation model along with photo-identifiable ground control points to remove the elevation and radiometric distortions inherent in aerial photographs, thereby resulting in a geospatially-accurate photographic base.
To conduct the image orthorectification, a projective transformation is performed with reference to a 10-meter digital elevation model and the 2013 ortho-images of the study site. On average, approximately 15 Ground control points (GCPs) were selected for each image. The selection of GCPs are mostly based on man-made structures where the location of these structures have not changed and can be identified through visual inspection between the 2013 orthoimage and older aerial images, such as road intersections, buildings, or parking lots. Few GCPs are selected based on natural features on the landscape, such as trees or the edge of forest. The location of each GCP is regularly checked for the root mean square (RMS) error, which is the distance between the source GCP and its corresponding transformed GCP. If RMS error of a particular GCP is significantly higher than others, the location of that GCP is re-selected; or the GCP is deleted to ensure the quality of orthorectification. After the selection and validation of GCPs, resampling is applied to produce orthoimages of available photo year.
To assess the consistency of GCPs with reference to the 2013 ortho-images after orthorectification, the total RMS error of an image is calculated based on the X residual (the distance in the X direction between source GCP and transformed GCP) and Y residual (the distance in the Y direction between source GCP and transformed GCP) as follows. Figure 2 includes the result of total RMS error of each image.
𝑇𝑜𝑡𝑎𝑙 𝑅𝑀𝑆 𝑒𝑟𝑟𝑜𝑟 = �1𝑛�(𝑋𝑅𝑖2 + 𝑌𝑅𝑖2)𝑛
𝑖=1
𝑅𝑋𝑖 = The X residual of GCPi 𝑅𝑌𝑖 = The Y residual of GCPi
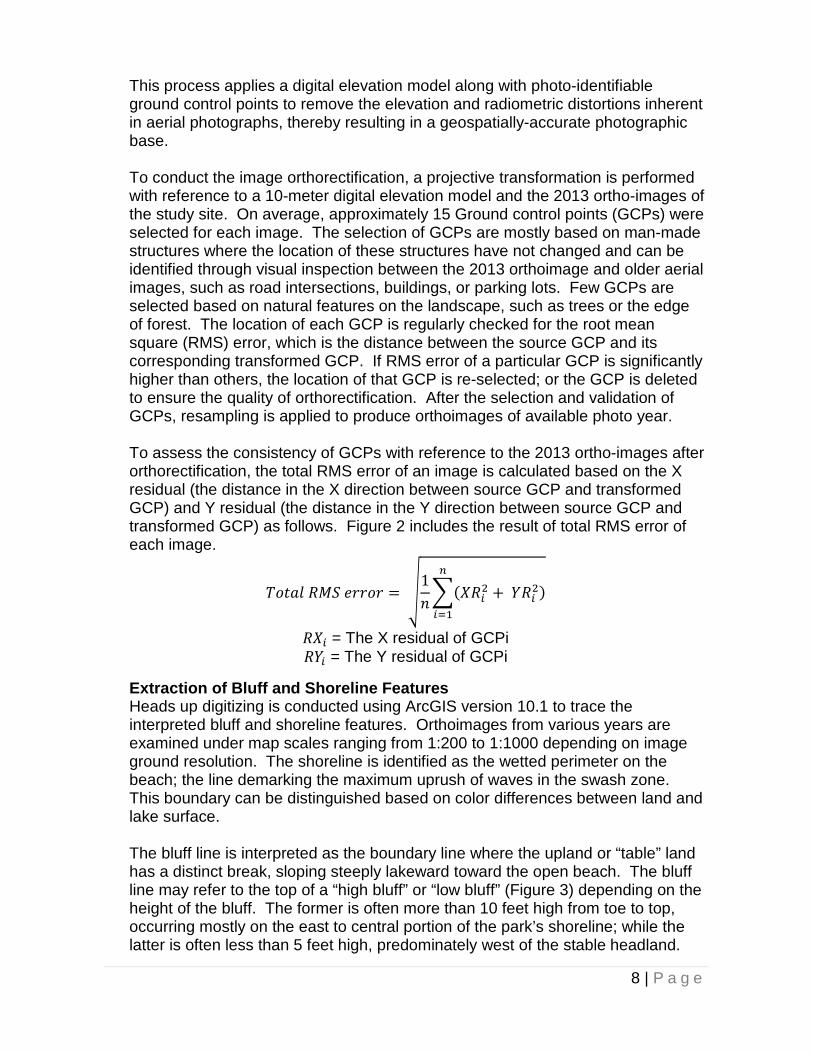
Extraction of Bluff and Shoreline Features Heads up digitizing is conducted using ArcGIS version 10.1 to trace the interpreted bluff and shoreline features. Orthoimages from various years are examined under map scales ranging from 1:200 to 1:1000 depending on image ground resolution. The shoreline is identified as the wetted perimeter on the beach; the line demarking the maximum uprush of waves in the swash zone. This boundary can be distinguished based on color differences between land and lake surface.
The bluff line is interpreted as the boundary line where the upland or “table” land has a distinct break, sloping steeply lakeward toward the open beach. The bluff line may refer to the top of a “high bluff” or “low bluff” (Figure 3) depending on the height of the bluff. The former is often more than 10 feet high from toe to top, occurring mostly on the east to central portion of the park’s shoreline; while the latter is often less than 5 feet high, predominately west of the stable headland.

9 | P a g e
The high bluff line often coincides with the edge of vegetation, so there is usually a clear boundary on the aerial images separating the beach and the vegetation areas. Image interpretation of the high bluff line is thus based primarily on the identification of the vegetation line and/or the existence of a shadow that occurs due to the sharp slope break. The low bluff line is usually on the beach, so the location of low bluff line may be less clear depending on the quality of aerial imagery. We do not digitize or utilize for purpose of calculating recession rates the location of low bluff lines if there is insufficient information in the aerial image for proper feature interpretation.
Figure 3. Photographs showing typical “high bluff” (left) and “low bluff” shore types at F.J. McLain State Park.
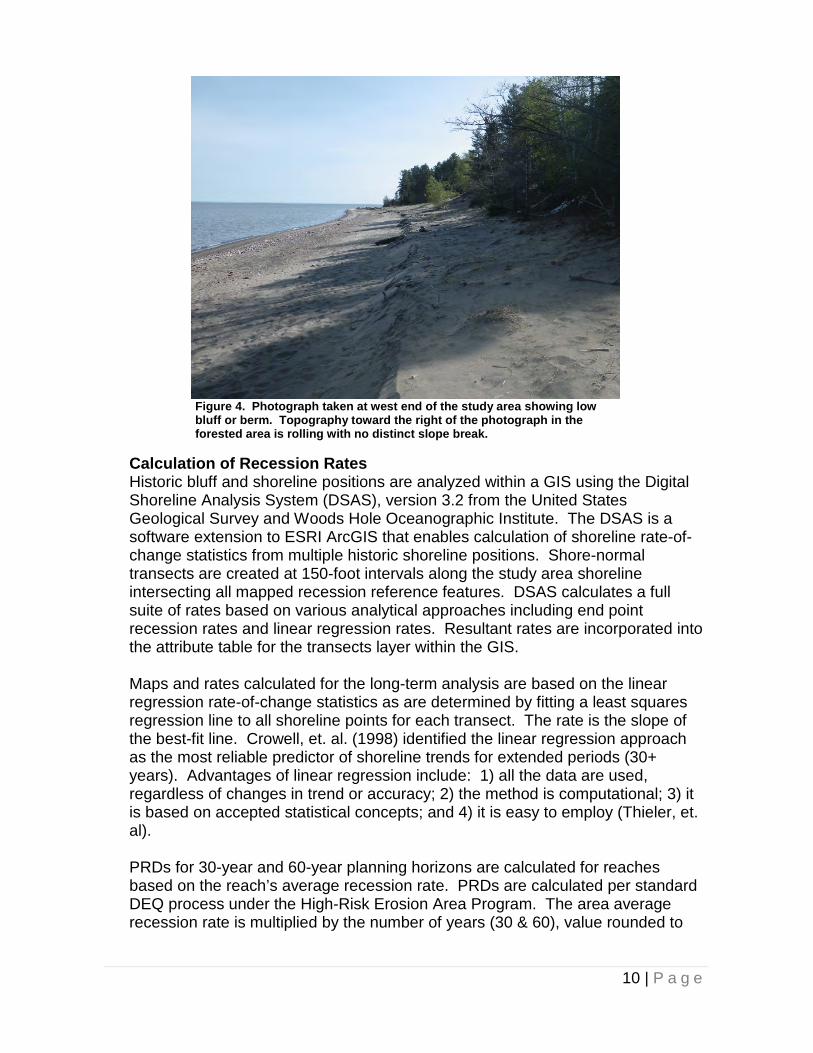
The “low bluff” shoretype at F.J. McLain State Park complicates feature tracking and calculating reliable recession rates because this multi-tiered terrain makes it difficult to consistently choose an erosion reference feature. Figure 4 provides an example where the low bluff or berm is lakeward of the forested area. Topography in the forested area resembles a rolling dune and contains no distinct and continuous slope break that can be tracked over time. Consideration is given to the nature of the modern feature tracked in the field with the GPS unit for a given stretch to ensure that feature extraction from the historic aerial imagery is interpreting the same geomorphic feature. An 800 foot stretch of coast - heading west from the central point of the headland – has no distinct bluff line causing the lakeward extent of perennial vegetation to be collected as the reference feature.
10 | P a g e
Figure 4. Photograph taken at west end of the study area showing low bluff or berm. Topography toward the right of the photograph in the forested area is rolling with no distinct slope break.
Calculation of Recession Rates Historic bluff and shoreline positions are analyzed within a GIS using the Digital Shoreline Analysis System (DSAS), version 3.2 from the United States Geological Survey and Woods Hole Oceanographic Institute. The DSAS is a software extension to ESRI ArcGIS that enables calculation of shoreline rate-of-change statistics from multiple historic shoreline positions. Shore-normal transects are created at 150-foot intervals along the study area shoreline intersecting all mapped recession reference features. DSAS calculates a full suite of rates based on various analytical approaches including end point recession rates and linear regression rates. Resultant rates are incorporated into the attribute table for the transects layer within the GIS.
Maps and rates calculated for the long-term analysis are based on the linear regression rate-of-change statistics as are determined by fitting a least squares regression line to all shoreline points for each transect. The rate is the slope of the best-fit line. Crowell, et. al. (1998) identified the linear regression approach as the most reliable predictor of shoreline trends for extended periods (30+ years). Advantages of linear regression include: 1) all the data are used, regardless of changes in trend or accuracy; 2) the method is computational; 3) it is based on accepted statistical concepts; and 4) it is easy to employ (Thieler, et. al).
PRDs for 30-year and 60-year planning horizons are calculated for reaches based on the reach’s average recession rate. PRDs are calculated per standard DEQ process under the High-Risk Erosion Area Program. The area average recession rate is multiplied by the number of years (30 & 60), value rounded to

11 | P a g e
the nearest 5 feet, and 15 feet is added to account for potential loss due to storm events.
III. Results
A. DNR Field Measurement Analysis Recession distances and resultant end-point rates based on field measurements taken by DNR-Parks and Recreation Division staff are depicted in Appendix A – Sheet 1. These rates are based on measurements taken from nail benchmarks driven into the road and reflect recession over a shorter record (1995 – 2013) than calculations from the aerial image analysis. Rates range from 0.2 feet per year (multiple locations) to 3.7 feet per year measured at benchmark number 14 located approximately 100 feet east of the day use restroom building. Recession hotspots such as the 1,500 foot stretch immediately east of the headland mimic the results of the aerial analysis; however, the field measurements reveal relatively stable stretches in recent times that are masked in the results of the longer study. The first 700 feet of coast east of the gabion shore protection structure (at benchmark N10) has receded less than one foot per year on average since 1995; however this same stretch averages 1.5 feet per year of recession since 1938.
DNR-Parks and Recreation Division staff measures bluff recession from landmark features in addition to the nail benchmarks. Locations of the five landmarks along with dates of available data records and calculated end-point recession rates are displayed in Appendix A – Sheet 2. Rates are highly variable and appear to correlate with the available dates of data capture. Points with high rates (> 4.0 feet per year) captured the record high-water level period of the mid-1980’s while data capture for the lower rates (< 1.0 feet per year at landmarks L2 and L5) did not commence until the 1990’s, which coincides with the beginning of the decade-plus long low-water period. This map reveals the potential for rates over a short-term period to significantly exceed those rates calculated over the longer term.
B. Photogrammetry-based Analysis Results for both shoreline and bluff line change are detailed in the sections to follow. The bluff line feature as the landward-most break in terrain from the table land down to the beach deserves highest consideration because it is this feature which presents the first hazard in terms of potentially undermining infrastructure. Change in the shoreline position may corroborate findings of the bluff analysis and provide insight on locations where beach width is changing at rates that differ from those of the bluff line; however, the shoreline will not be the first feature to cause harm to park infrastructure and, as will be detailed below, Lake Superior water levels may cause false “change” indications if water level variations are not considered in a shoreline change analysis.
12 | P a g e
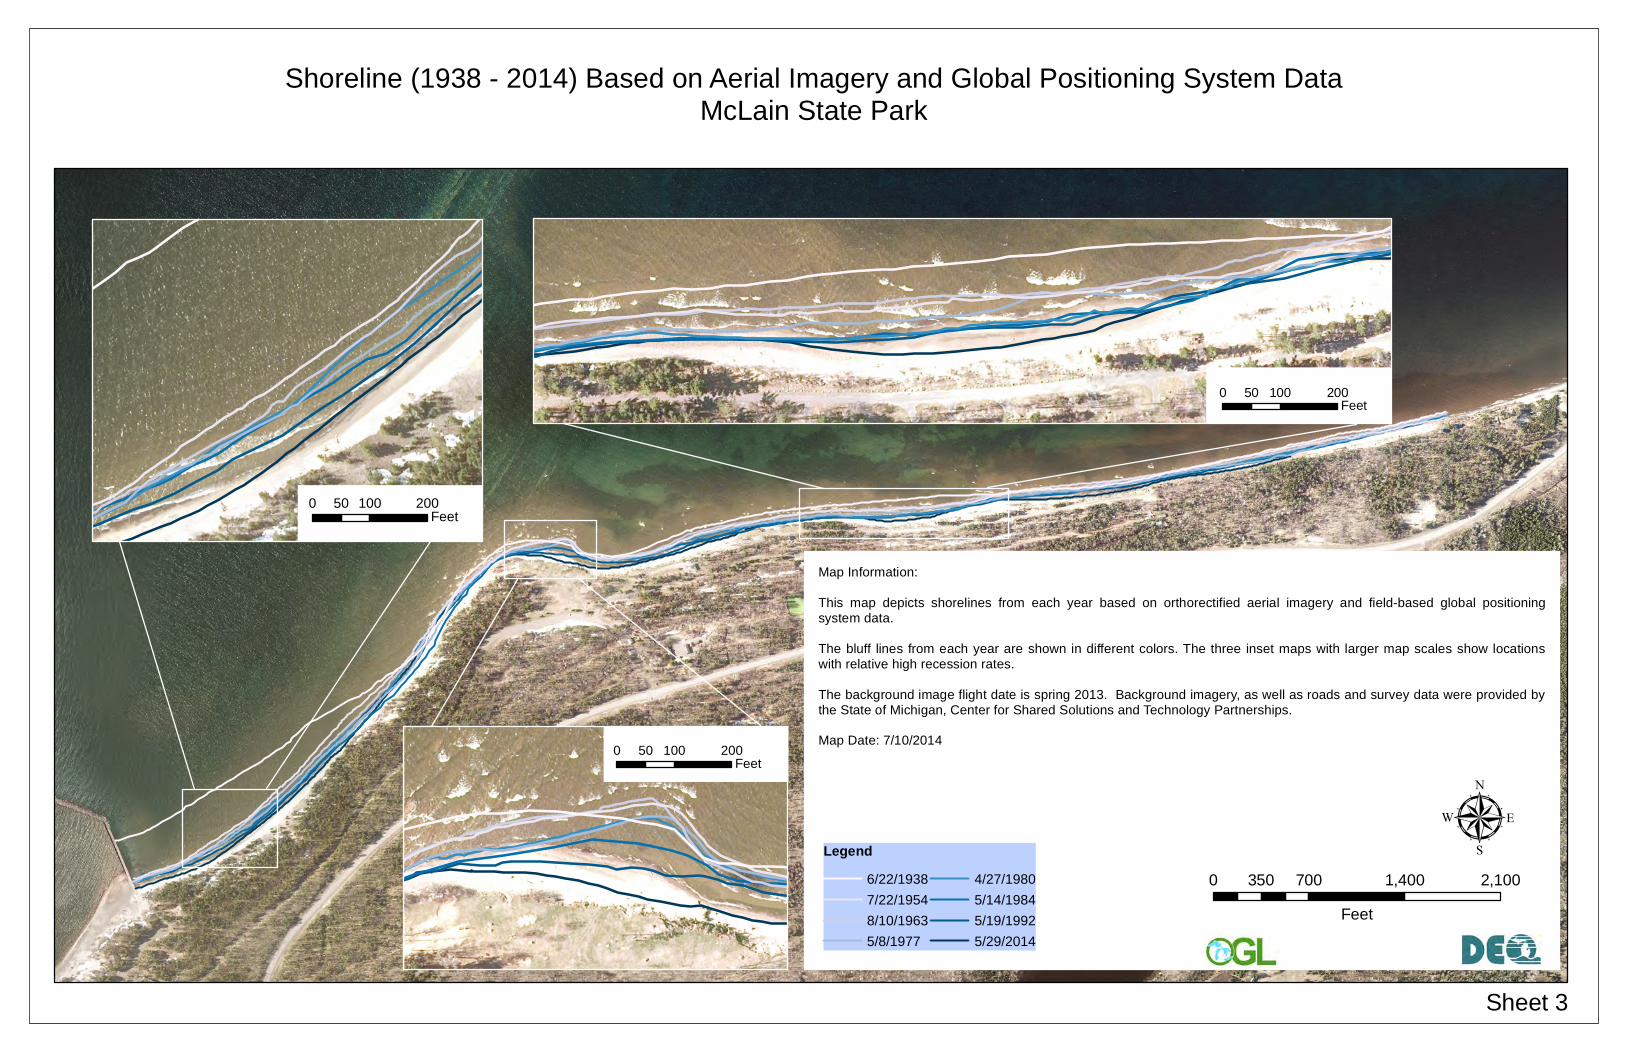
Shoreline Change Extracted shorelines for eight dates between 1938 and 2014 are shown in Appendix A – Sheet 3. A southerly, or landward, movement over time is the general trend for the shoreline; however, lower water levels and resultant accretion of the beach does show up from time to time as a temporary lakeward-movement of the shoreline feature. Dramatic landward-movement of the shoreline occurred during the early 1938 to 1954 time period, especially toward the western extent of the study area. As much as 320 feet of shoreline recession occurred during this 16 year time period at a location 575 feet east of the eastern navigation jetty. An artificial influence may well have contributed to this 20 foot per year rate such as the placement of fine, non-beach compatible dredge materials that are easily eroded.
Appendix A – Sheet 4 shows shoreline recession rates for the 1938 through 2014 time period as calculated through a linear regression approach. Rates are displayed as a heat map with reaches having higher recession rates in hotter (red to orange) colors. The first 2,500 feet of shore east of the navigation jetty has the highest shoreline recession. These rates are certainly influenced by the erosion that occurred during the 1938 to 1954 time period outlined previously. The next reach toward the east, extending almost 1,200 feet to the apex of the headland, conversely has receded on average only half a foot per year during this same time period.
Water level variations on the Great Lakes require user-caution when comparing shoreline positions over time. At an elevation of 602.75 feet (IGLD ’85) the June 1938 shoreline was taken during the highest average monthly water level of all shoreline data presented, and thus the position change between the 1938 date and other time dates including the June 2014 (601.93 feet) would actually be increased somewhat if water levels in the modern time frame returned to the 1938 level. Thus the shoreline recession depicted is somewhat underestimated given that the lake level is currently lower than the historic record. It is possible to adjust and calibrate the rates to a common lake elevation using the beach profile; however, the results would be only slightly altered with a slight increase in the shoreline recession rates. Such adjustments are not conducted here because shoreline recession rates provide additional insight but should not be the primary basis for planning construction setbacks. Bluff line recession rates, which are less affected by water levels and also pose the first threat to park infrastructure, should be the basis for planning future siting of infrastructure.
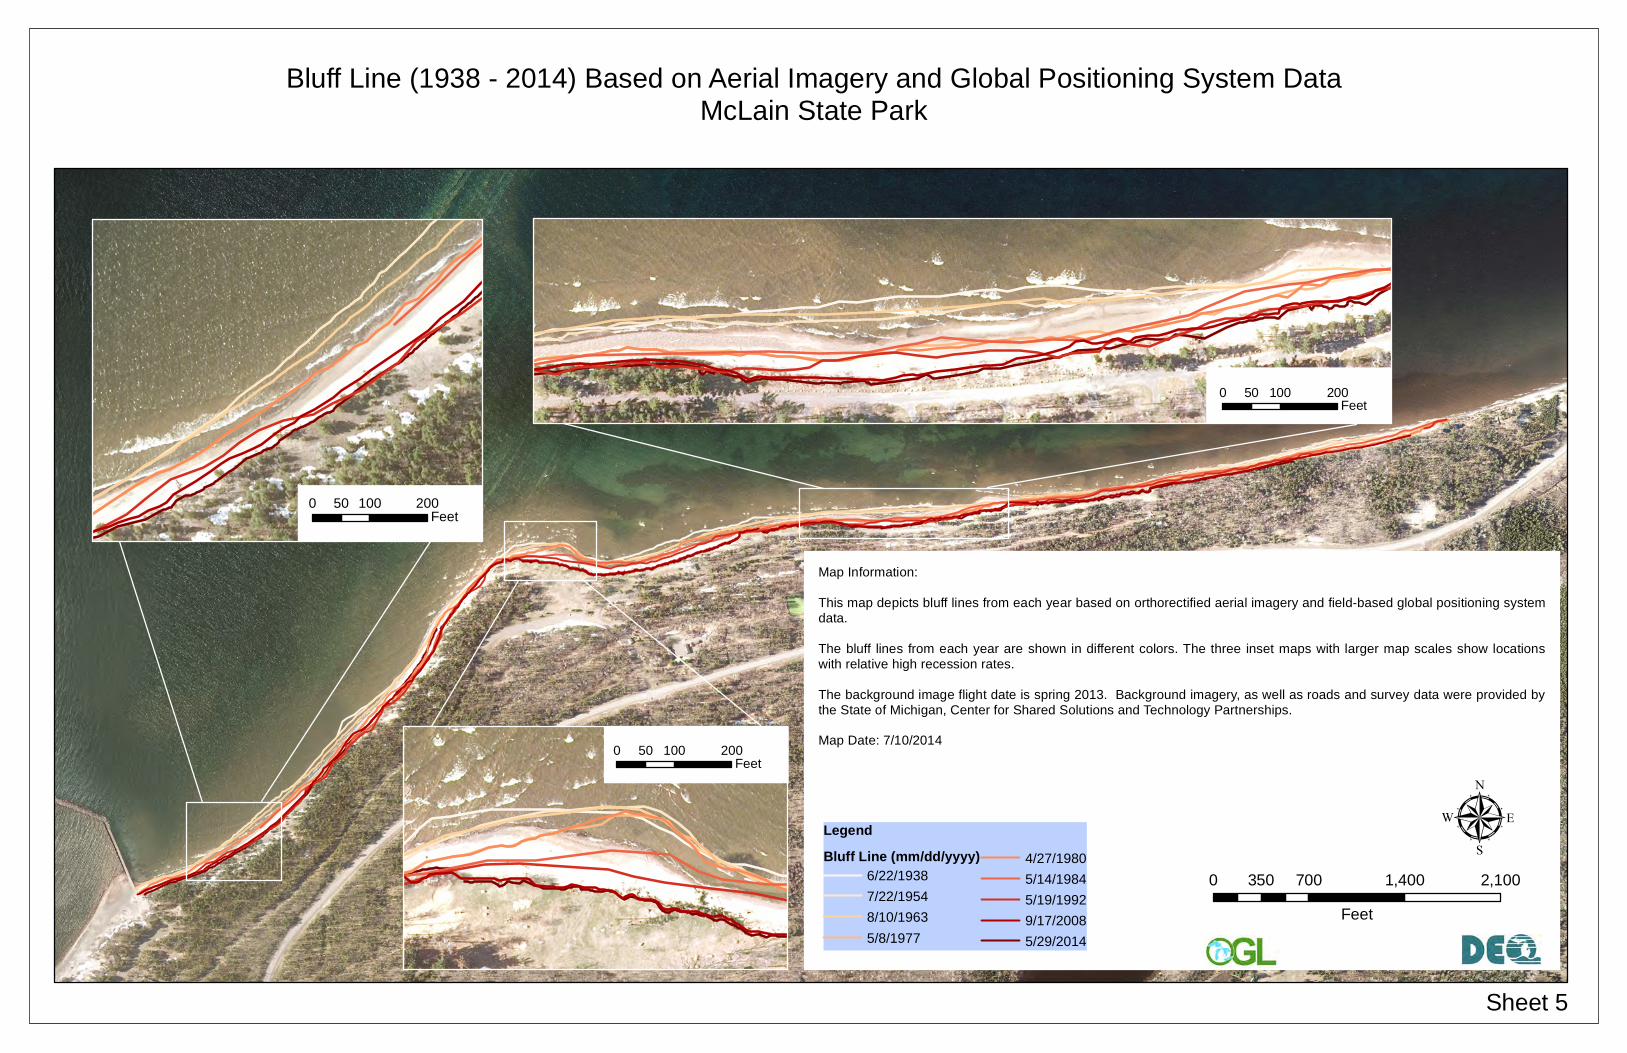
Bluff Line Change Bluff line positions for nine dates between 1938 and 2014 as extracted from aerial imagery and collected via GPS are displayed in Appendix A – Sheet 5. Areas with widely spaced bluff lines indicate significant change in bluff position over time and higher rates of recession (see map insets).
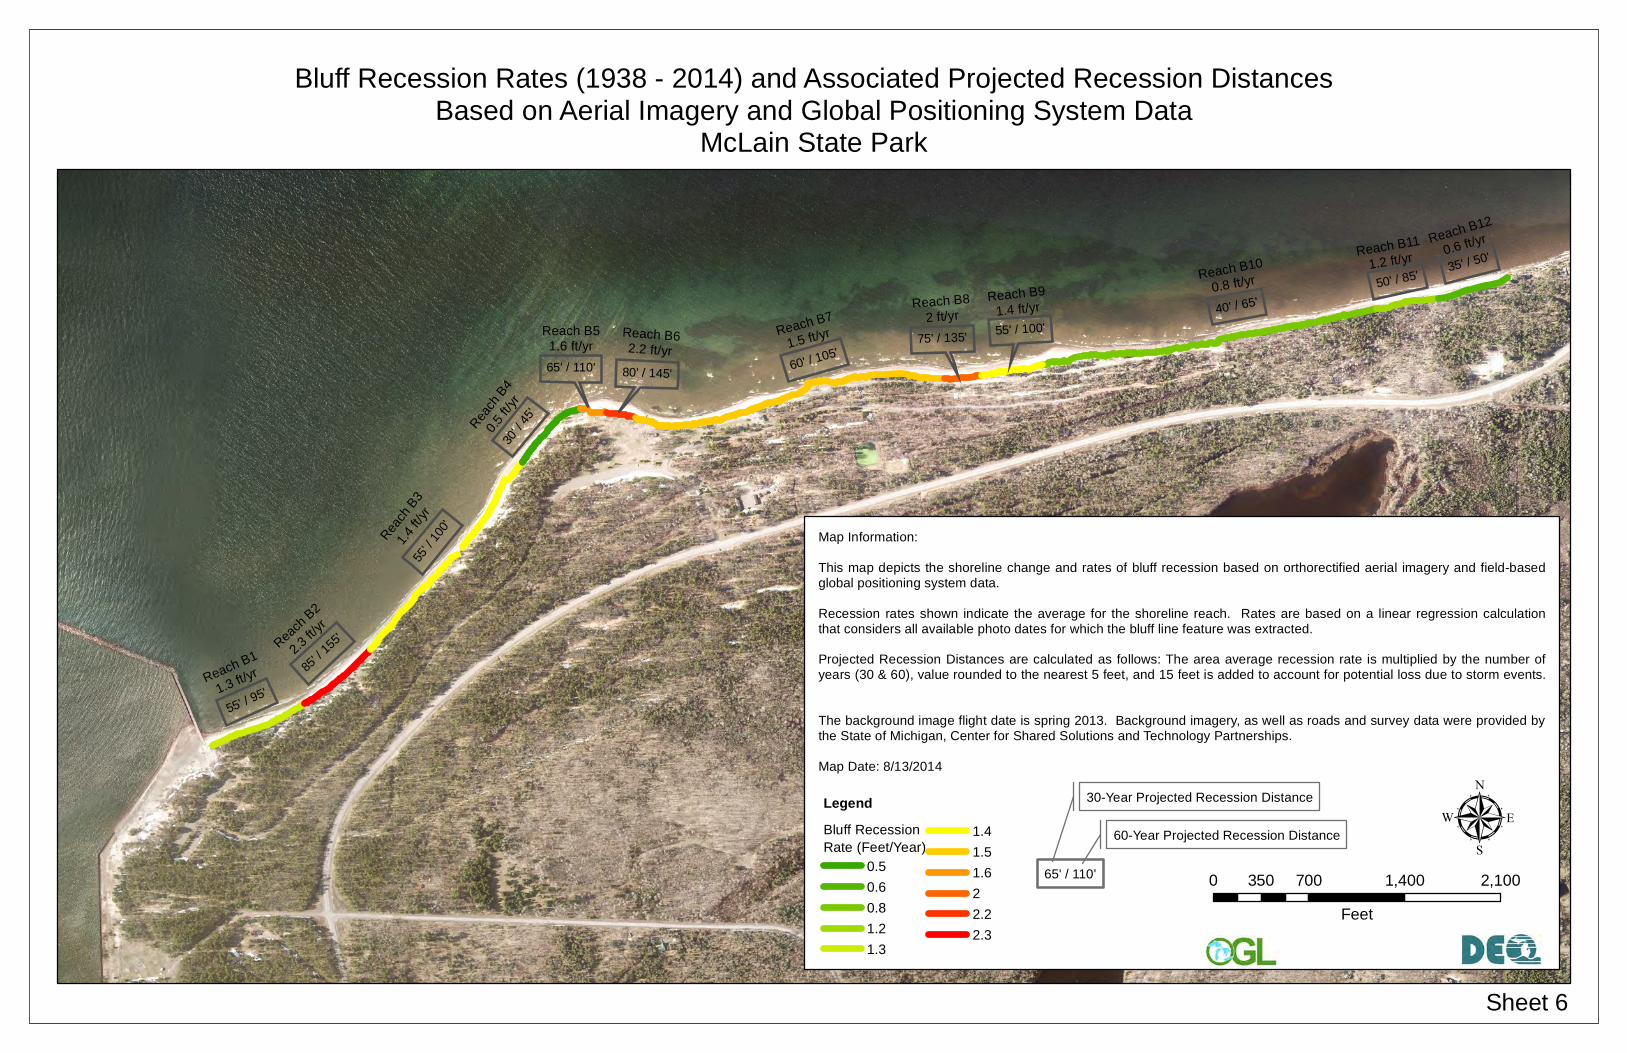
Grouping similar bluff recession rates and calculating area rate averages results in delineation of twelve distinct reaches with calculated annualized rates of recession and projected recession distances (Appendix A – Sheet 6). Reach

13 | P a g e
average rates range from 0.5 feet per year to 2.3 feet per year. Rates of 2.0 feet per year or more occur at reaches B2, B6 and B8 and, in total, extend slightly more than 1,100 feet or 10% of the study area shore. Approximately 3,800 feet (35%) of the shoreline reach length is at or below 1.0 feet per year, leaving 55% percent of the shoreline in the range of 1.1 to 1.9 feet per year. Examination of statewide recession rates provides context to those calculated within the park. Approximately 233 miles (6%) of Michigan’s Great Lakes coast has been documented as receding at a rate of one foot per year or greater. The highest documented long-term rate of recession is 17 feet per year at a location east of Grand Marais, Burt Township, Alger County, Michigan. The table below provides a breakdown of the relative intensity for statewide erosion areas. Coastal Recession
Vulnerability Ranking
Length (miles) Percentage of Michigan’s
Great Lakes Coast
Percentage of High-Risk Erosion Area
coast (receding greater than one
foot per year) Very High (>3.0 ft/yr) 28 1% 12% High (2.0 – 2.9 ft/yr) 47 1% 20% Moderate (1.0 to 1.9 ft/yr)
158 4% 68%
Low (<1.0 ft/yr or not studied)
3608 94% -
Relatively high recession rate reaches are spread amongst the study area rather than being clustered along one stretch of shore that could easily be planned around. Some of the highest long-term recession rates exist to the east of the eastern navigation jetty (Reach B2), immediately east of the headland (Reach B6), and in the campground from the approximate area of campsite number 79 to campsite number 83 (Reach B8).
Relatively low bluff recession rates occur at the headland and immediately to the west for a distance of approximately 800 feet (Reach B4) and along the shore adjacent to the mini-cabins (Reach B10). While rates at reach B10 are relatively low over the long-term, this stretch near the mini-cabins has receded at a higher rate in the recent past two decades than in previous times (see Figure 5).

14 | P a g e
Figure 5. Bluff recession over time toward eastern end of road that serves the mini-cabins. Note relatively large change in bluff position between 1992 and 2008 bluff lines.
Both 30-year and 60-year PRD’s are displayed by reach in Appendix A – Sheet 6. PRD’s may be considered as minimum recommended setback values. Exceeding these minimum recommendations for planning purposes at McLain is strongly advised due to the uncertainty of future conditions and influences on coastal recession. The placement of beach nourishment is one such influence occurring in the past as the U.S. Army Corps of Engineers periodically placed dredged material from the Portage Waterway Entry onto the beach east of the eastern navigation jetty until this practice ceased in 1976 (W.F. Baird & Associates, 2001). Lack of any beach nourishment efforts in the future, along with decreased sediment supply, may cause rates of erosion to increase. Water levels provide another unknown variable into the future as a prolonged high-stand could increase future recession rates.
IV. Discussion – Application of Projected Recession Distances Crowell, et. al. (1993) outlined the reasons long-term recession rate data is preferable to short-term data. Historic recession rates should be projected into the future no longer than the period of duration they cover and hence the DNR field measurements should be projected into the future no further than 18 years (2032). Longer term planning efforts should utilize the longer term rates calculated through the aerial image analysis, which may support as long as a 76-year projection. Variability shown through shorter term values provided in this

15 | P a g e
report (through DNR field measurements and otherwise) along with future uncertainties with respect to variables including water levels and sediment supply, should prompt a more conservative application of the PRDs to the extent possible and increased construction setbacks for future park infrastructure.
Data presented herein should be integrated with results from the on-going geophysical survey being conducted by Materials Testing Consultants, Inc. prior to the development of any final coastal construction setback distances and/or identification of any “no-build” areas within the park. Recession rate data and associated guidance presented in this report are based on historic conditions. As discussed previously, coastal systems such as that at F.J. McLain State Park are dynamic and as such no guarantee is made that future bluff recession will occur at historic rates. Data presented in this report, including rates of recession and projected recession distances, do not affect the property’s current status or designation under the High-Risk Erosion Area Program administered by the Water Resources Division, Department of Environmental Quality under Part 323, Shorelands Protection and Management, of the Natural Resources and Environmental Protection Act, 1994 PA 451, as amended. Additional information regarding the current designation under the High Risk Erosion Area Program is available at www.mi.gov/shorelands.

16 | P a g e
V. References Crowell, M., Douglas, .B.C., and Leatherman, S., 1998. Considerations for shoreline position prediction. Journal of Coastal Research, 14(3): 1025-1033. Crowell, M., Leatherman, S.P., and Buckley, M.K., 1993. Erosion rate analysis: long term versus short term. Shore and Beach, 61(2): 13–20. Gronewold, A.D., Clites, A.H., Smith, J.P., and Hunter, T.S., 2013. A dynamic graphical interface for visualizing projected, measured, and reconstructed surface water elevations on the earth’s largest lakes, Environmental Modeling & Software, Volume 49, Pages 34-39. http://www.glerl.noaa.gov/data/now/wlevels/dbd/ Meadows, L. A. and Gbah, M.B., Numerical Simulation of Nearshore Processes; McLain State Park, Michigan. University of Michigan, Ocean Engineering Laboratory. Michigan Department of Natural Resources, Division of Land Resource Programs, 1982. Bluff Recession Rate Study, Hancock Township, Houghton County, Michigan. Thieler, E.R., Himmelstoss, E.A., Zichichi, J.L., and Miller, T.L., Digital Shoreline Analysis System (DSAS) version 3.0; An ArcGIS© extension for calculating shoreline change: U.S. Geological Survey Open-File Report 2005-1304. United States Army Corps of Engineers, Detroit District, 1997. McLain State Park Erosion Study. W.F. Baird & Associates. 2001. Shoreline Stability Study: McLain State Park, Michigan. In: Master Plan for F.J. McLain State Park, M.C. Smith Associates and Architectural Group, Inc.

Appendix A – Map Sheets

17 ft1 ft/yr
54 ft3 ft/yr7 ft
0.4 ft/yr
4 ft0.2 ft/yr
2 ft0.1 ft/yr
3 ft0.2 ft/yr
8 ft0.4 ft/yr
4 ft0.2 ft/yr
7 ft0.4 ft/yr
45 ft2.5 ft/yr
31 ft1.7 ft/yr
66 ft3.7 ft/yr 19 ft
1.1 ft/yr
34 ft1.9 ft/yr
14 ft0.8 ft/yr
25 ft1.4 ft/yr
28 ft1.6 ft/yr
N7N9 N8 N6N5
N4N3
N2N1
N16
N11
N15
N17
N14
N13
N12
N10
Sheet 1
Map Information:
This map depicts the shoreline change and rates of bluff recession based on field measurements taken by Department ofNatural Resources, Parks and Recreation Division Staff at McLain State Park.
The background image flight date is spring 2013. Background imagery, as well as roads and survey data were provided bythe State of Michigan, Center for Shared Solutions and Technology Partnerships.
Map Date: 8/13/2014
µ0 300 600 900 1,200150
Feet
Bluff Recession Rates (1995 - 2013) Based on DNR Field MeasurementsMcLain State Park
LegendRecession Distance
Nail BenchmarksAPROXIMATED
GPS
Transects
45 ft2.5 ft/yr
= recession distance from 1995 through 2013= recession rate from 1995 through 2013
N7 = Nail Number

L510/21/1998 - 08/13/2013
0.3 ft/yr
L404/28/1978 - 08/13/2013
4.6 ft/yr
L311/05/1984 - 08/13/2013
3.6 ft/yr
L210/17/1997 - 08/13/2013
0.6 ft/yr
L104/22/1976 - 08/13/2013
4.3 ft/yr
Sheet 2
Map Information:
This map depicts the shoreline change and rates of bluff recession based on field measurements taken by Department ofNatural Resources, Parks and Recreation Division Staff at McLain State Park.
The background image flight date is spring 2013. Background imagery, as well as roads and survey data were provided bythe State of Michigan, Center for Shared Solutions and Technology Partnerships.
Map Date: 8/13/2014
µ0 200 400 600100
Feet
Bluff Recession Rates (Various Time Periods) Based on DNR Field Measurements from LandmarksMcLain State Park
LegendLandmarks
L210/17/1997 - 08/13/2013
0.8 ft/yr
Sample Label Landmark Identifier
End Dates of Measurements
Recession Rate
Shoreline (1938 - 2014) Based on Aerial Imagery and Global Positioning System DataMcLain State Park
Map Information:
This map depicts shorelines from each year based on orthorectified aerial imagery and field-based global positioningsystem data.
The bluff lines from each year are shown in different colors. The three inset maps with larger map scales show locationswith relative high recession rates.
The background image flight date is spring 2013. Background imagery, as well as roads and survey data were provided bythe State of Michigan, Center for Shared Solutions and Technology Partnerships.
Map Date: 7/10/2014
0 700 1,400 2,100350
Feet
Sheet 3
µLegend6/22/19387/22/19548/10/19635/8/1977
4/27/19805/14/19845/19/19925/29/2014
0 100 20050Feet
0 100 20050Feet
0 100 20050Feet

40' / 70'
60' / 100'
65' /
110'
145' / 275'
30' /
45'
120'
/ 220
'
30' / 45'
50' / 80'
40' / 70' 45' / 75'Reach S5
1.4 ft/yr
Reach S1
4.3 ft/yr
Reach
S4
0.5 ft/
yr
Reach S8
0.9 ft/yrReach S9
1.1 ft/yr
Reach
S2
3.4 ft/
yr
Reach S10
0.5 ft/yr
Reach S60.9 ft/yr
Reach
S3
1.6 ft/
yr
Reach S71 ft/yr
Shoreline Recession Rates (1938 - 2014) and Associated Projected Recession DistancesBased on Aerial Imagery and Global Positioning System Data
McLain State Park
Map Information:
This map depicts the shoreline change and rates of bluff recession based on orthorectified aerial imagery and field-basedglobal positioning system data.
Recession rates shown indicate the average for the shoreline reach. Rates are based on a linear regression calculationthat considers all available photo dates for which the bluff line feature was extracted.
Projected Recession Distances are calculated as follows: The area average recession rate is multiplied by the number ofyears (30 & 60), value rounded to the nearest 5 feet, and 15 feet is added to account for potential loss due to storm events.
The background image flight date is spring 2013. Background imagery, as well as roads and survey data were provided bythe State of Michigan, Center for Shared Solutions and Technology Partnerships.
Map Date: 8/13/2014
0 700 1,400 2,100350
Feet
Sheet 4
µLegend
0.50.911.1
1.41.63.44.3
65' / 110'
30-Year Projected Recession Distance
60-Year Projected Recession DistanceShoreline Recession Rate(Feet/Year)
Bluff Line (1938 - 2014) Based on Aerial Imagery and Global Positioning System DataMcLain State Park
Map Information:
This map depicts bluff lines from each year based on orthorectified aerial imagery and field-based global positioning systemdata.
The bluff lines from each year are shown in different colors. The three inset maps with larger map scales show locationswith relative high recession rates.
The background image flight date is spring 2013. Background imagery, as well as roads and survey data were provided bythe State of Michigan, Center for Shared Solutions and Technology Partnerships.
Map Date: 7/10/2014
0 700 1,400 2,100350
Feet
Sheet 5
µLegendBluff Line (mm/dd/yyyy)
6/22/19387/22/19548/10/19635/8/1977
4/27/19805/14/19845/19/19929/17/20085/29/2014
0 100 20050Feet
0 100 20050Feet
0 100 20050Feet
60' / 105'
40' / 65'
55' /
100'
55' / 95'
30' /
45'
85' /
155'
35' / 50'
50' / 85'
75' / 135'
80' / 145'65' / 110'
55' / 100'Reach B7
1.5 ft/yr
Reach B10
0.8 ft/yr
Reach
B3
1.4 ft/
yr
Reach B1
1.3 ft/yr
Reach
B2
2.3 ft/
yr
Reach
B4
0.5 ft/
yr
Reach B12
0.6 ft/yr
Reach B91.4 ft/yr
Reach B11
1.2 ft/yr
Reach B82 ft/yr
Reach B62.2 ft/yr
Reach B51.6 ft/yr
Bluff Recession Rates (1938 - 2014) and Associated Projected Recession DistancesBased on Aerial Imagery and Global Positioning System Data
McLain State Park
Map Information:
This map depicts the shoreline change and rates of bluff recession based on orthorectified aerial imagery and field-basedglobal positioning system data.
Recession rates shown indicate the average for the shoreline reach. Rates are based on a linear regression calculationthat considers all available photo dates for which the bluff line feature was extracted.
Projected Recession Distances are calculated as follows: The area average recession rate is multiplied by the number ofyears (30 & 60), value rounded to the nearest 5 feet, and 15 feet is added to account for potential loss due to storm events.
The background image flight date is spring 2013. Background imagery, as well as roads and survey data were provided bythe State of Michigan, Center for Shared Solutions and Technology Partnerships.
Map Date: 8/13/2014
0 700 1,400 2,100350
Feet
Sheet 6
µLegendBluff RecessionRate (Feet/Year)
0.50.60.81.21.3
1.41.51.622.22.3
65' / 110'
30-Year Projected Recession Distance
60-Year Projected Recession Distance

Appendix B – DNR Field Recession Measurements
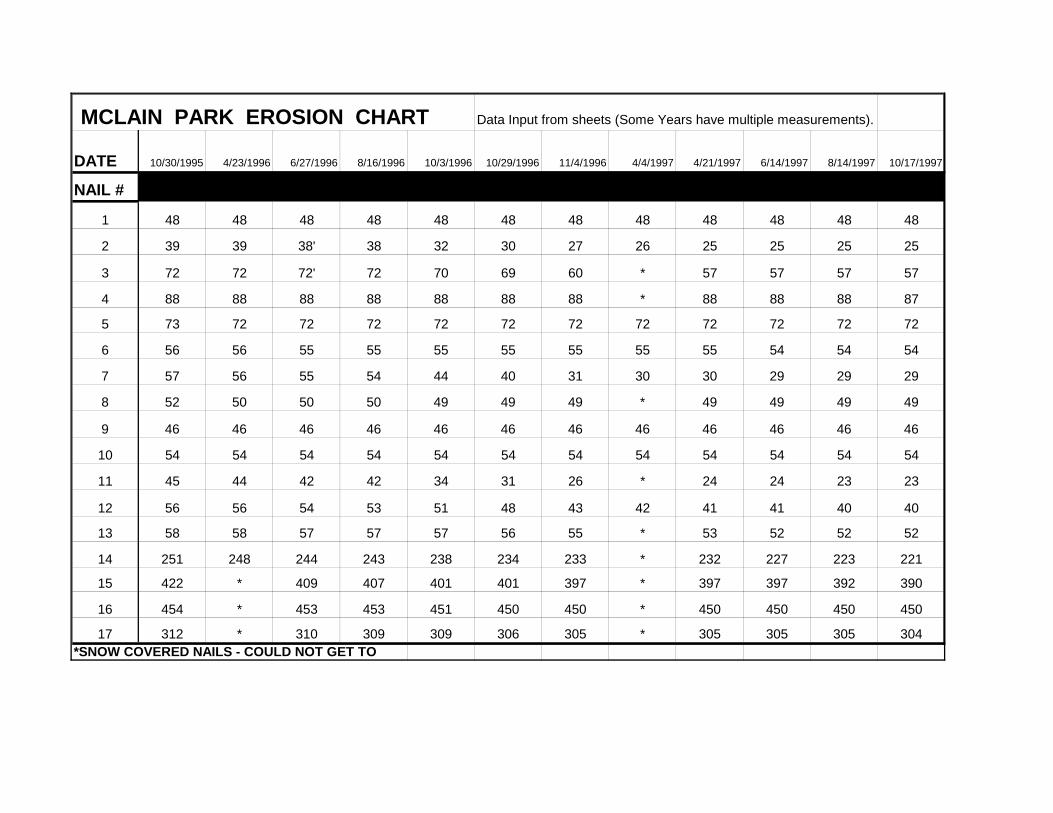
MCLAIN PARK EROSION CHART Data Input from sheets (Some Years have multiple measurements).
DATE 10/30/1995 4/23/1996 6/27/1996 8/16/1996 10/3/1996 10/29/1996 11/4/1996 4/4/1997 4/21/1997 6/14/1997 8/14/1997 10/17/1997
NAIL #
1 48 48 48 48 48 48 48 48 48 48 48 48
2 39 39 38' 38 32 30 27 26 25 25 25 25
3 72 72 72' 72 70 69 60 * 57 57 57 57
4 88 88 88 88 88 88 88 * 88 88 88 87
5 73 72 72 72 72 72 72 72 72 72 72 72
6 56 56 55 55 55 55 55 55 55 54 54 54
7 57 56 55 54 44 40 31 30 30 29 29 29
8 52 50 50 50 49 49 49 * 49 49 49 49
9 46 46 46 46 46 46 46 46 46 46 46 46
10 54 54 54 54 54 54 54 54 54 54 54 54
11 45 44 42 42 34 31 26 * 24 24 23 23
12 56 56 54 53 51 48 43 42 41 41 40 40
13 58 58 57 57 57 56 55 * 53 52 52 52
14 251 248 244 243 238 234 233 * 232 227 223 221
15 422 * 409 407 401 401 397 * 397 397 392 390
16 454 * 453 453 451 450 450 * 450 450 450 450
17 312 * 310 309 309 306 305 * 305 305 305 304*SNOW COVERED NAILS - COULD NOT GET TO
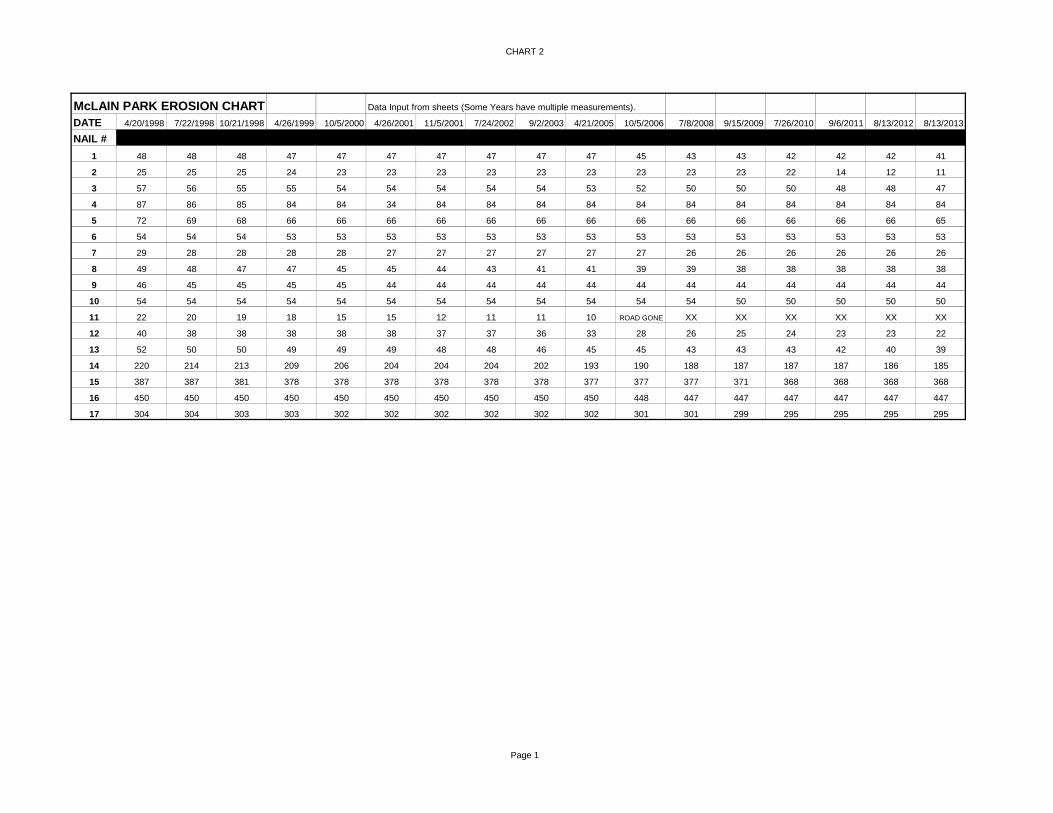
CHART 2
Page 1
McLAIN PARK EROSION CHART Data Input from sheets (Some Years have multiple measurements).
DATE 4/20/1998 7/22/1998 10/21/1998 4/26/1999 10/5/2000 4/26/2001 11/5/2001 7/24/2002 9/2/2003 4/21/2005 10/5/2006 7/8/2008 9/15/2009 7/26/2010 9/6/2011 8/13/2012 8/13/2013
NAIL #1 48 48 48 47 47 47 47 47 47 47 45 43 43 42 42 42 41
2 25 25 25 24 23 23 23 23 23 23 23 23 23 22 14 12 11
3 57 56 55 55 54 54 54 54 54 53 52 50 50 50 48 48 47
4 87 86 85 84 84 34 84 84 84 84 84 84 84 84 84 84 84
5 72 69 68 66 66 66 66 66 66 66 66 66 66 66 66 66 65
6 54 54 54 53 53 53 53 53 53 53 53 53 53 53 53 53 53
7 29 28 28 28 28 27 27 27 27 27 27 26 26 26 26 26 26
8 49 48 47 47 45 45 44 43 41 41 39 39 38 38 38 38 38
9 46 45 45 45 45 44 44 44 44 44 44 44 44 44 44 44 44
10 54 54 54 54 54 54 54 54 54 54 54 54 50 50 50 50 50
11 22 20 19 18 15 15 12 11 11 10 ROAD GONE XX XX XX XX XX XX
12 40 38 38 38 38 38 37 37 36 33 28 26 25 24 23 23 22
13 52 50 50 49 49 49 48 48 46 45 45 43 43 43 42 40 39
14 220 214 213 209 206 204 204 204 202 193 190 188 187 187 187 186 185
15 387 387 381 378 378 378 378 378 378 377 377 377 371 368 368 368 368
16 450 450 450 450 450 450 450 450 450 450 448 447 447 447 447 447 447
17 304 304 303 303 302 302 302 302 302 302 301 301 299 295 295 295 295
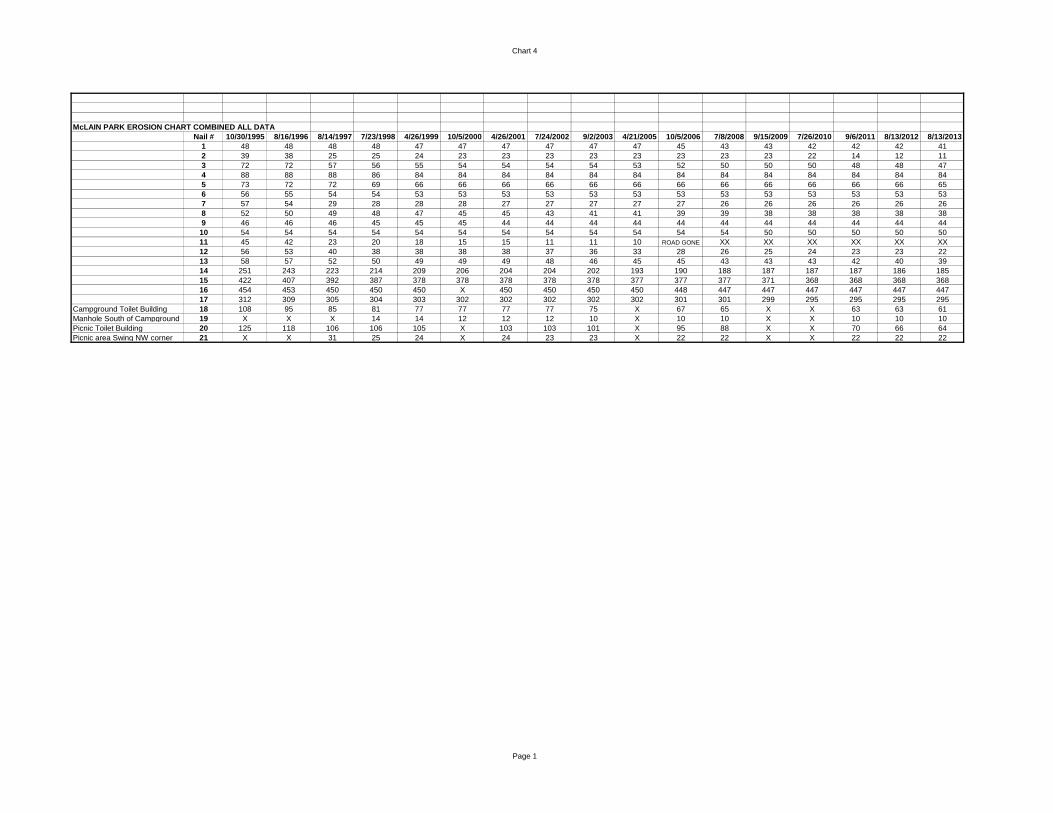
Chart 4
Page 1
McLAIN PARK EROSION CHART COMBINED ALL DATANail # 10/30/1995 8/16/1996 8/14/1997 7/23/1998 4/26/1999 10/5/2000 4/26/2001 7/24/2002 9/2/2003 4/21/2005 10/5/2006 7/8/2008 9/15/2009 7/26/2010 9/6/2011 8/13/2012 8/13/2013
1 48 48 48 48 47 47 47 47 47 47 45 43 43 42 42 42 412 39 38 25 25 24 23 23 23 23 23 23 23 23 22 14 12 113 72 72 57 56 55 54 54 54 54 53 52 50 50 50 48 48 474 88 88 88 86 84 84 84 84 84 84 84 84 84 84 84 84 845 73 72 72 69 66 66 66 66 66 66 66 66 66 66 66 66 656 56 55 54 54 53 53 53 53 53 53 53 53 53 53 53 53 537 57 54 29 28 28 28 27 27 27 27 27 26 26 26 26 26 268 52 50 49 48 47 45 45 43 41 41 39 39 38 38 38 38 389 46 46 46 45 45 45 44 44 44 44 44 44 44 44 44 44 4410 54 54 54 54 54 54 54 54 54 54 54 54 50 50 50 50 5011 45 42 23 20 18 15 15 11 11 10 ROAD GONE XX XX XX XX XX XX12 56 53 40 38 38 38 38 37 36 33 28 26 25 24 23 23 2213 58 57 52 50 49 49 49 48 46 45 45 43 43 43 42 40 3914 251 243 223 214 209 206 204 204 202 193 190 188 187 187 187 186 18515 422 407 392 387 378 378 378 378 378 377 377 377 371 368 368 368 36816 454 453 450 450 450 X 450 450 450 450 448 447 447 447 447 447 44717 312 309 305 304 303 302 302 302 302 302 301 301 299 295 295 295 295
Campground Toilet Building 18 108 95 85 81 77 77 77 77 75 X 67 65 X X 63 63 61Manhole South of Campground 19 X X X 14 14 12 12 12 10 X 10 10 X X 10 10 10Picnic Toilet Building 20 125 118 106 106 105 X 103 103 101 X 95 88 X X 70 66 64Picnic area Swing NW corner 21 X X 31 25 24 X 24 23 23 X 22 22 X X 22 22 22

POINT 1 & 2
Page 1
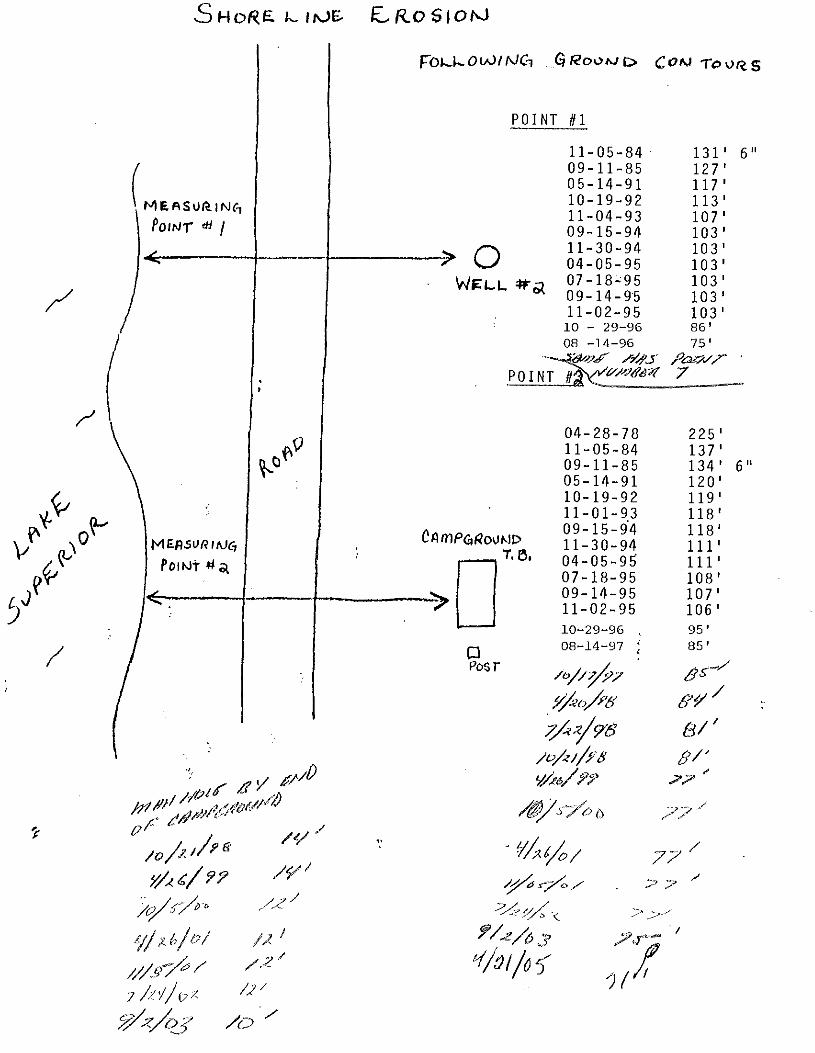
SHORELINE EROSION
FOLLOWING GROUND CONTOURS
WELL #2 CAMPGROUND TOILET BLDG MAN HOLE BY END POINT #1 POINT #2 (18 on chart 4) OF CAMPGROUND (19 on chart 4)
DATE MEASUREMENT DATE MEASUREMENT DATE MEASUREMENT
11/5/1984 131 4/28/1978 225 10/21/1998 149/11/1985 127 11/5/1984 137 4/26/1999 145/14/1991 117 9/11/1985 134 10/5/2000 1210/19/1992 113 5/14/1991 120 4/26/2001 1211/4/1993 107 10/19/1992 119 11/5/2001 129/15/1994 103 11/1/1993 118 7/24/2002 1211/30/1994 103 9/15/1994 118 9/2/2003 104/5/1995 103 11/30/1994 111 10/5/2006 10
7/18/1995 103 4/5/1995 111 7/8/2008 109/14/1995 103 7/18/1995 108 9/6/2011 1011/2/1995 103 9/14/1995 107 8/13/2012 1010/29/1996 86 11/2/1995 106 8/13/2013 108/14/1996 75 10/29/1996 95
8/14/1997 85SAME MEASUREMENT 10/17/1997 85AS POINT NUMBER 7 4/20/1998 84ON CHART 7/22/1998 81
10/21/1998 814/26/1999 7710/5/2000 774/26/2001 7711/5/2001 777/24/2002 779/2/2003 7510/5/2006 677/8/2008 659/6/2011 638/13/2012 638/13/2013 61
L3 L4 L5

POINT 3
Page 1
SHORELINE EROSION
FOLLOWING GROUND CONTOURS
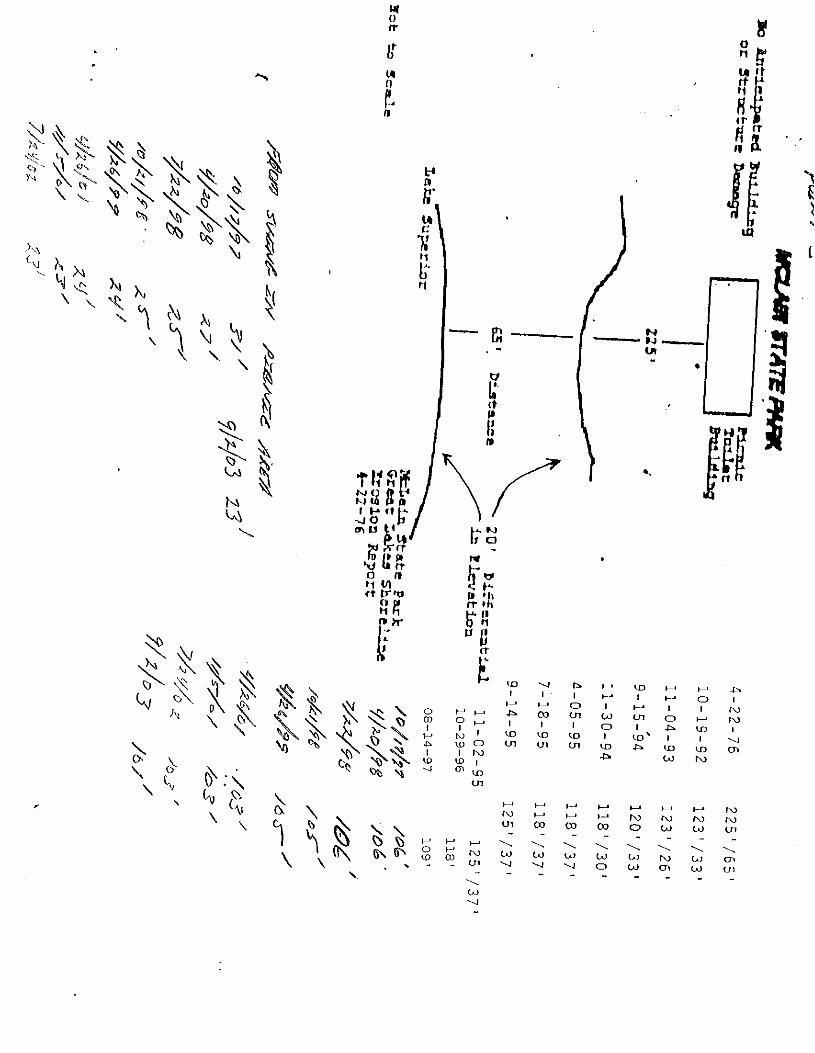
PICNIC TOILET BUILDING FROM SWING IN PICNIC AREA (21 on chart 4)
DATE MEASUREMENT DATE MEASUREMENT
4/22/1976 225 /65 10/17/1997 3110/19/1992 123/33 4/20/1998 2711/4/1993 123/26 7/22/1998 259/15/1994 120/33 10/21/1998 2511/30/1994 118/30 4/26/1999 244/5/1995 118/37 4/26/2001 247/18/1995 118/37 11/5/2001 239/14/1995 125/37 7/24/2002 2311/2/1995 125/37 9/2/2003 2310/29/1996 118 10/5/2006 2210/17/1997 106 7/8/2008 224/20/1998 106 9/6/2011 227/22/1998 106 8/13/2012 2210/21/1998 105 8/13/2013 224/26/1999 1054/26/2001 10311/5/2001 1037/24/2002 1039/2/2003 10110/5/2006 957/8/2008 889/6/2011 708/13/2012 668/13/2013 64
POINT #3 (20 on chart 4)
L1 L2