Embed Size (px)
Citation preview

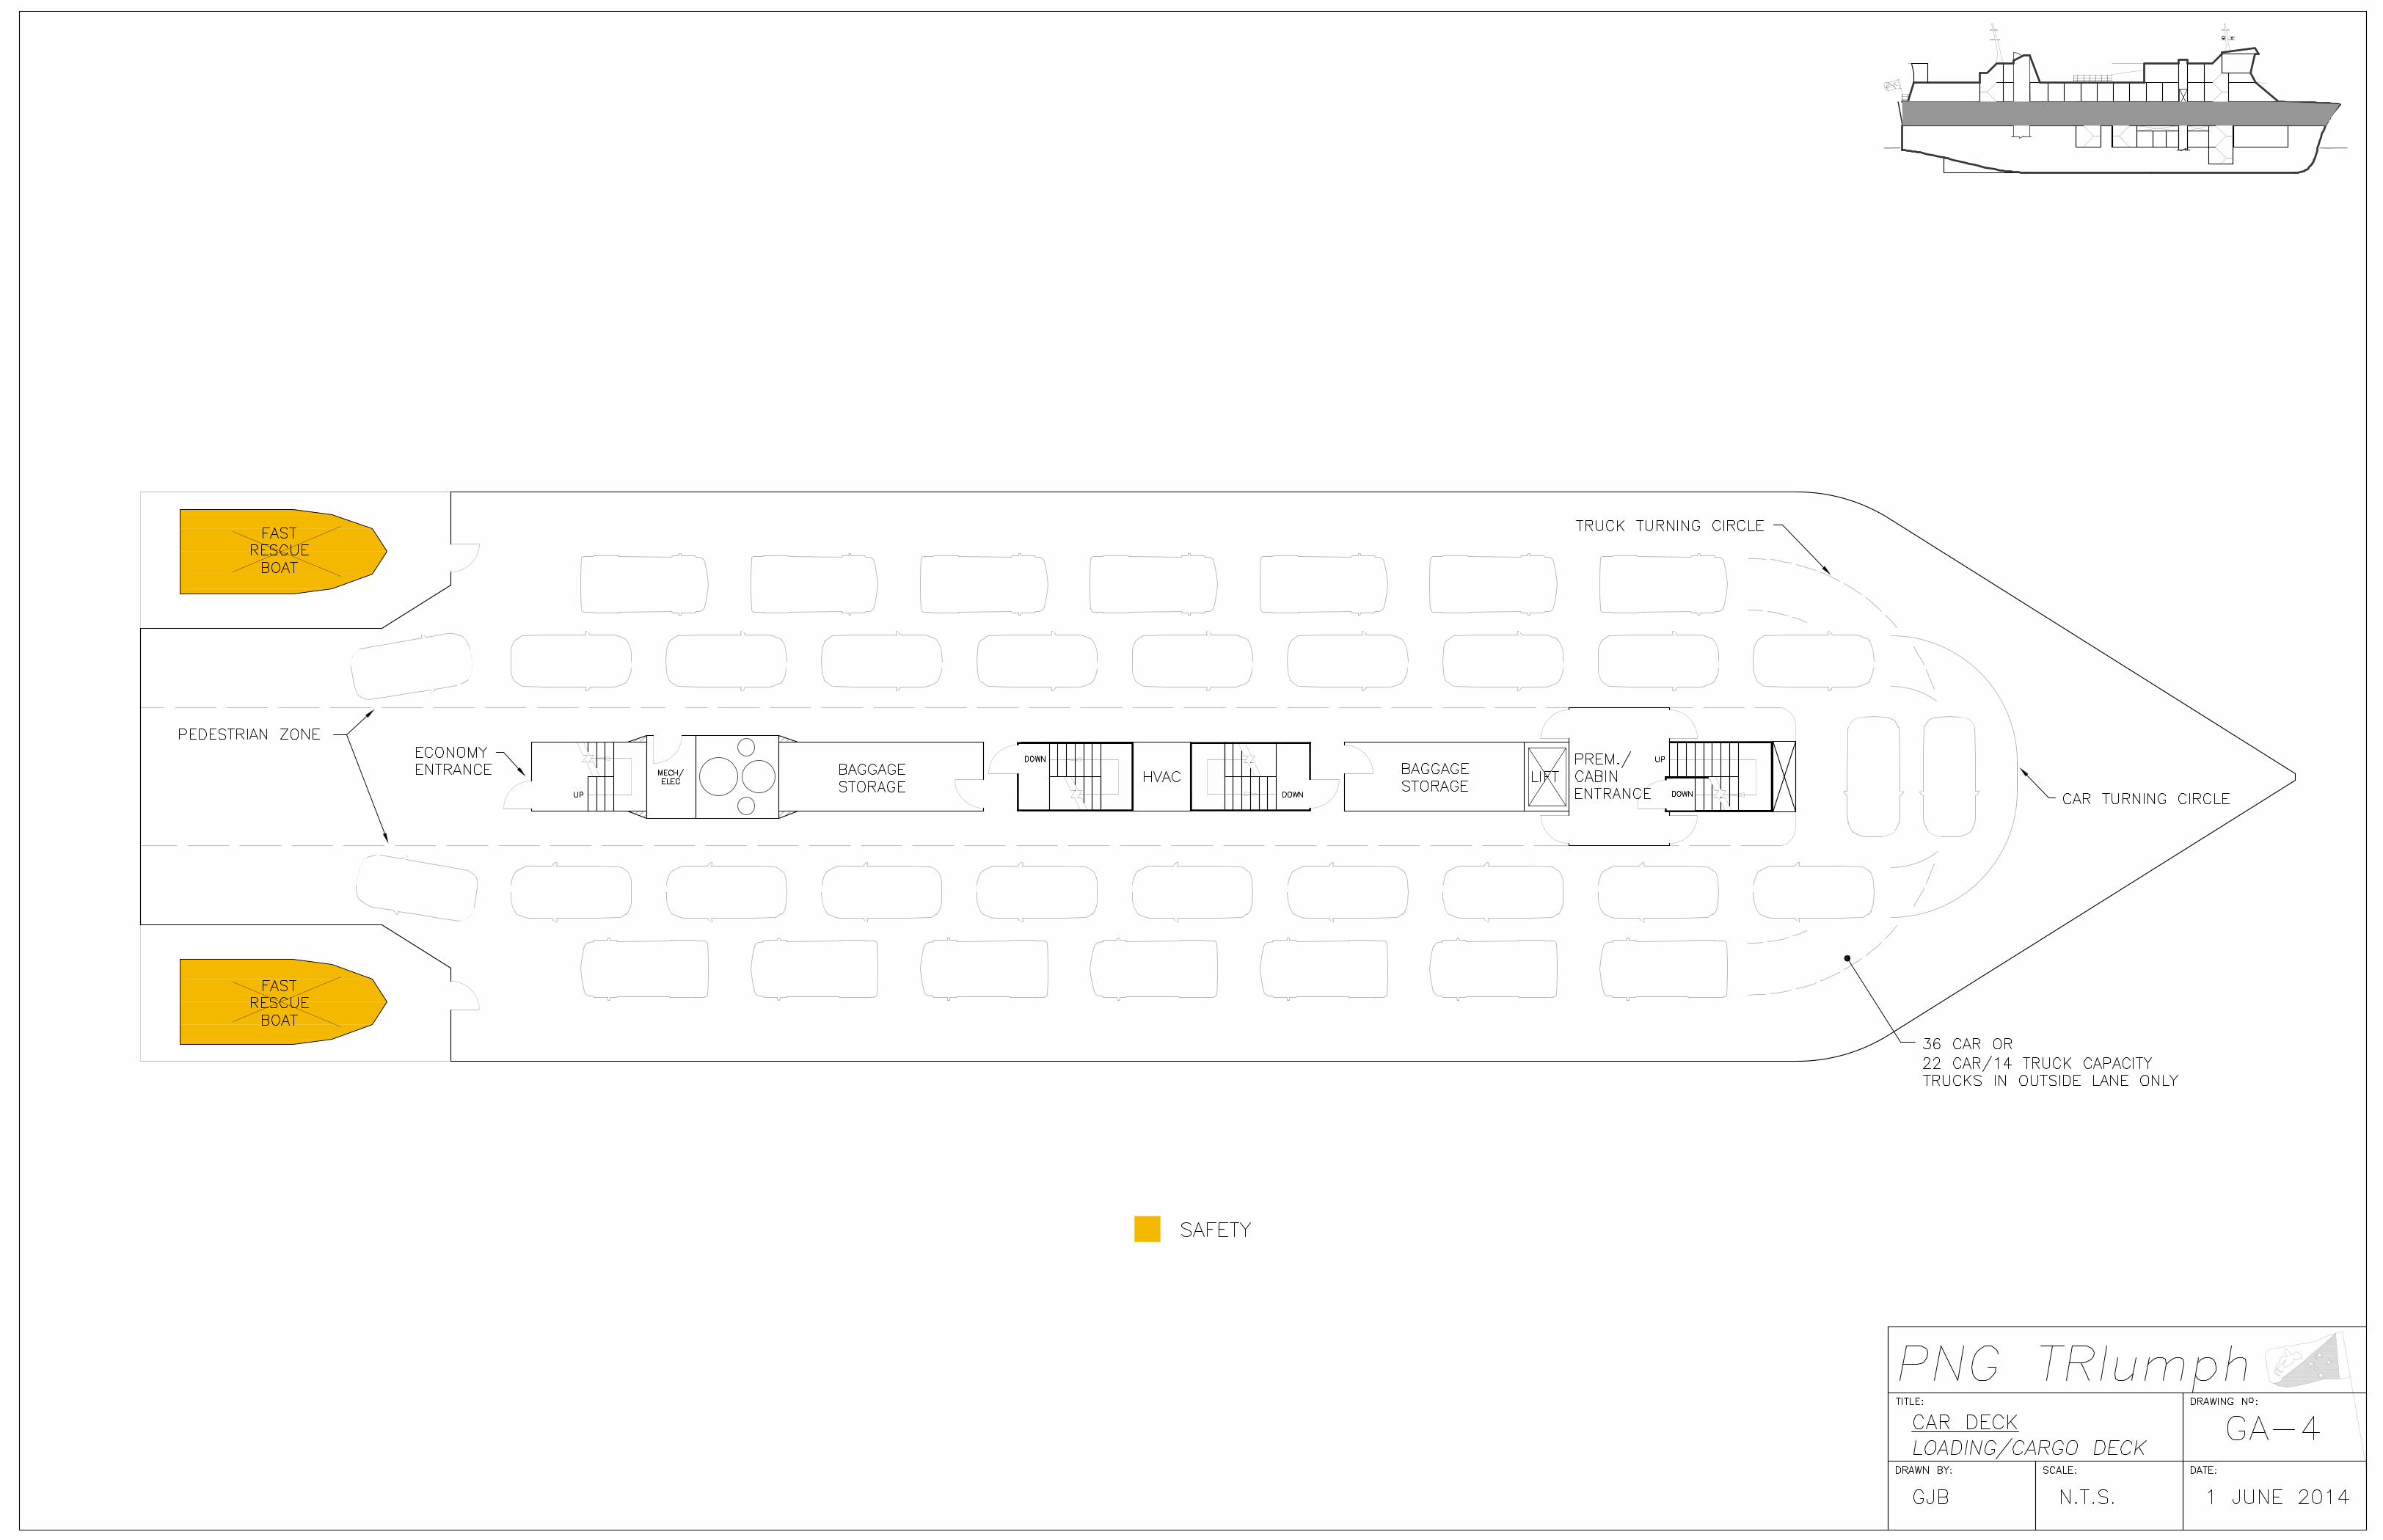
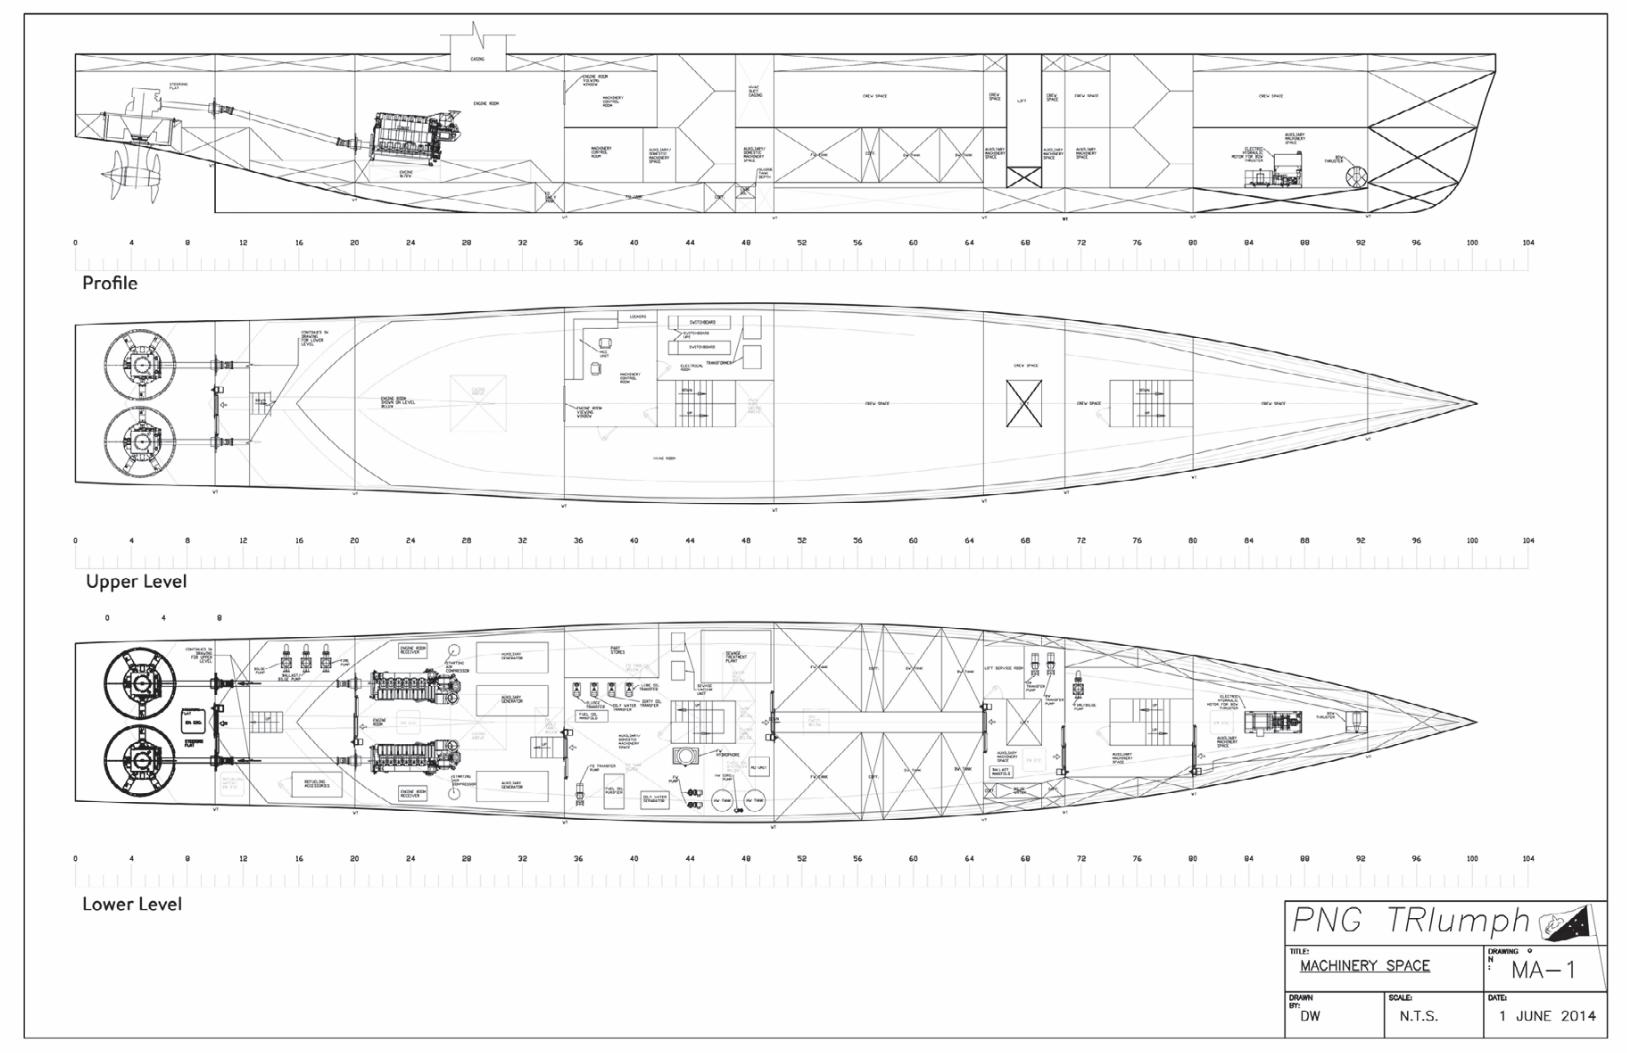
Appendix:
Drawings

PR
OD
UC
ED
B
Y A
N A
UT
OD
ES
K E
DU
CA
TIO
NA
L P
RO
DU
CT
PRODUCED BY AN AUTODESK EDUCATIONAL PRODUCT
PR
OD
UC
ED
B
Y A
N A
UT
OD
ES
K E
DU
CA
TIO
NA
L P
RO
DU
CT
PRODUCED BY AN AUTODESK EDUCATIONAL PRODUCT
PR
OD
UC
ED
B
Y A
N A
UT
OD
ES
K E
DU
CA
TIO
NA
L P
RO
DU
CT
PRODUCED BY AN AUTODESK EDUCATIONAL PRODUCT
PR
OD
UC
ED
B
Y A
N A
UT
OD
ES
K E
DU
CA
TIO
NA
L P
RO
DU
CT
PRODUCED BY AN AUTODESK EDUCATIONAL PRODUCT

PR
OD
UC
ED
B
Y A
N A
UT
OD
ES
K E
DU
CA
TIO
NA
L P
RO
DU
CT
PRODUCED BY AN AUTODESK EDUCATIONAL PRODUCT
PR
OD
UC
ED
B
Y A
N A
UT
OD
ES
K E
DU
CA
TIO
NA
L P
RO
DU
CT
PRODUCED BY AN AUTODESK EDUCATIONAL PRODUCT
PRODUCED BY AN AUTODESK EDUCATIONAL PRODUCT
PR
OD
UC
ED
B
Y A
N A
UT
OD
ES
K E
DU
CA
TIO
NA
L P
RO
DU
CT
PRODUCED BY AN AUTODESK EDUCATIONAL PRODUCT
PR
OD
UC
ED
B
Y A
N A
UT
OD
ES
K E
DU
CA
TIO
NA
L P
RO
DU
CT

PRODUCED BY AN AUTODESK EDUCATIONAL PRODUCT
PR
OD
UC
ED
B
Y A
N A
UT
OD
ES
K E
DU
CA
TIO
NA
L P
RO
DU
CT
PRODUCED BY AN AUTODESK EDUCATIONAL PRODUCT
PR
OD
UC
ED
B
Y A
N A
UT
OD
ES
K E
DU
CA
TIO
NA
L P
RO
DU
CT
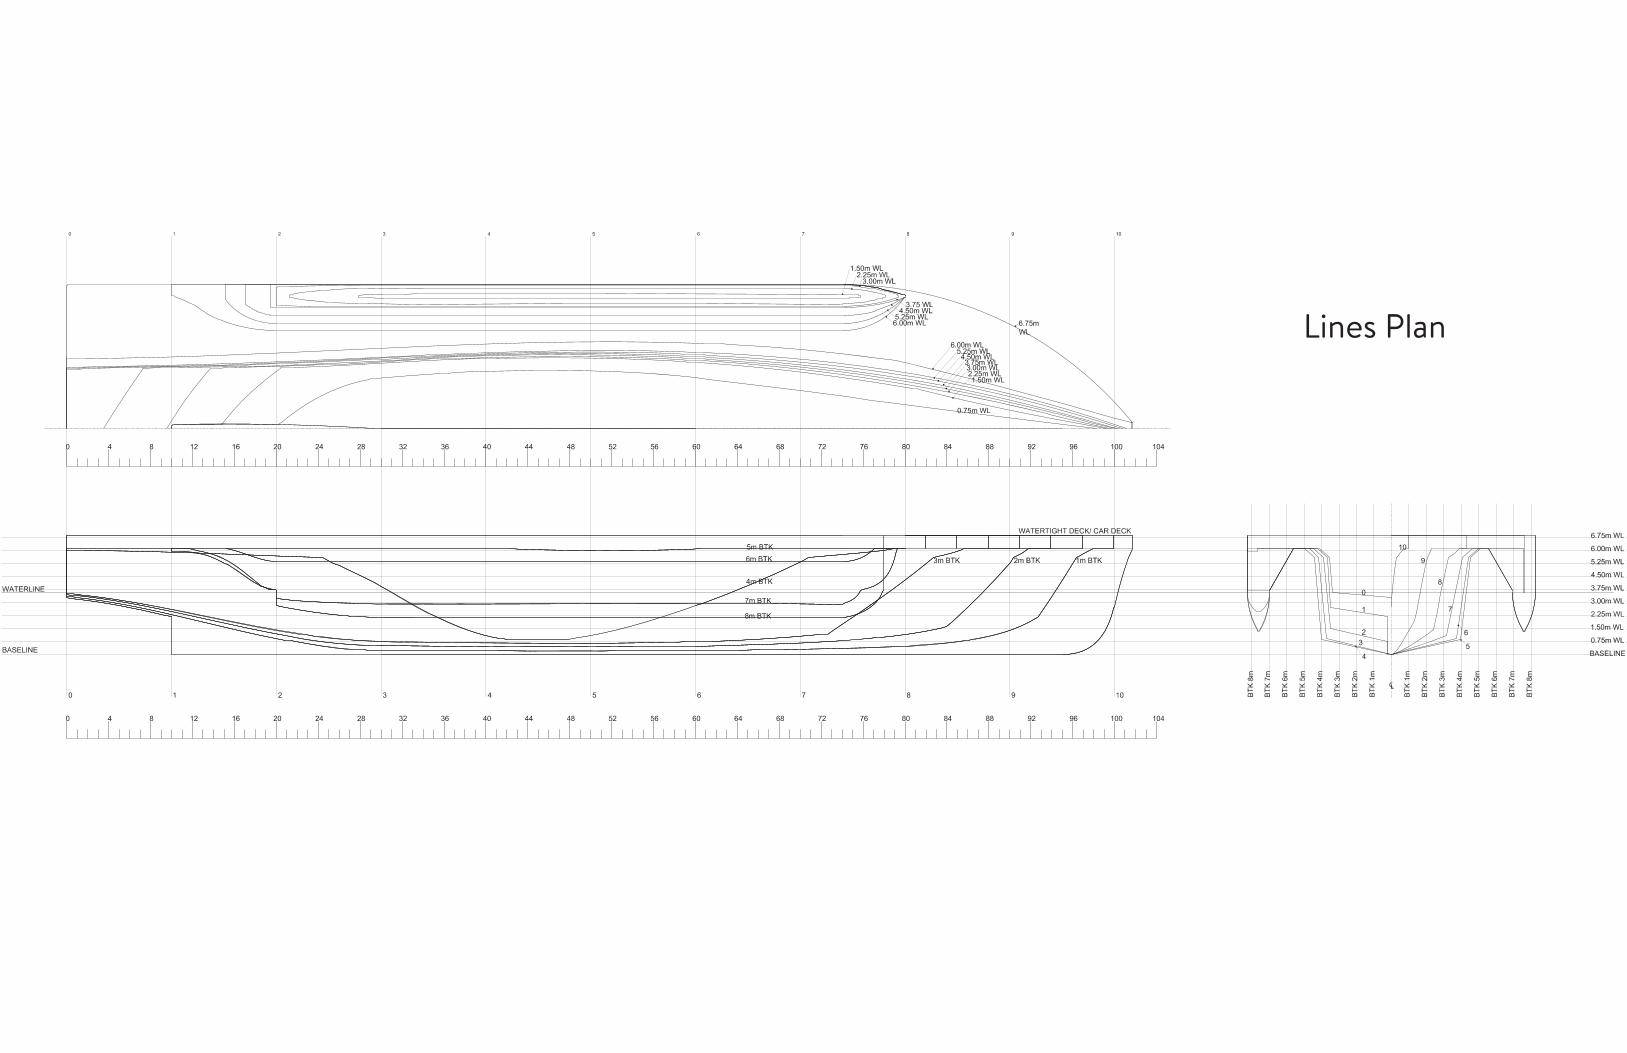
Lines Plan
Appendix:
Calculations
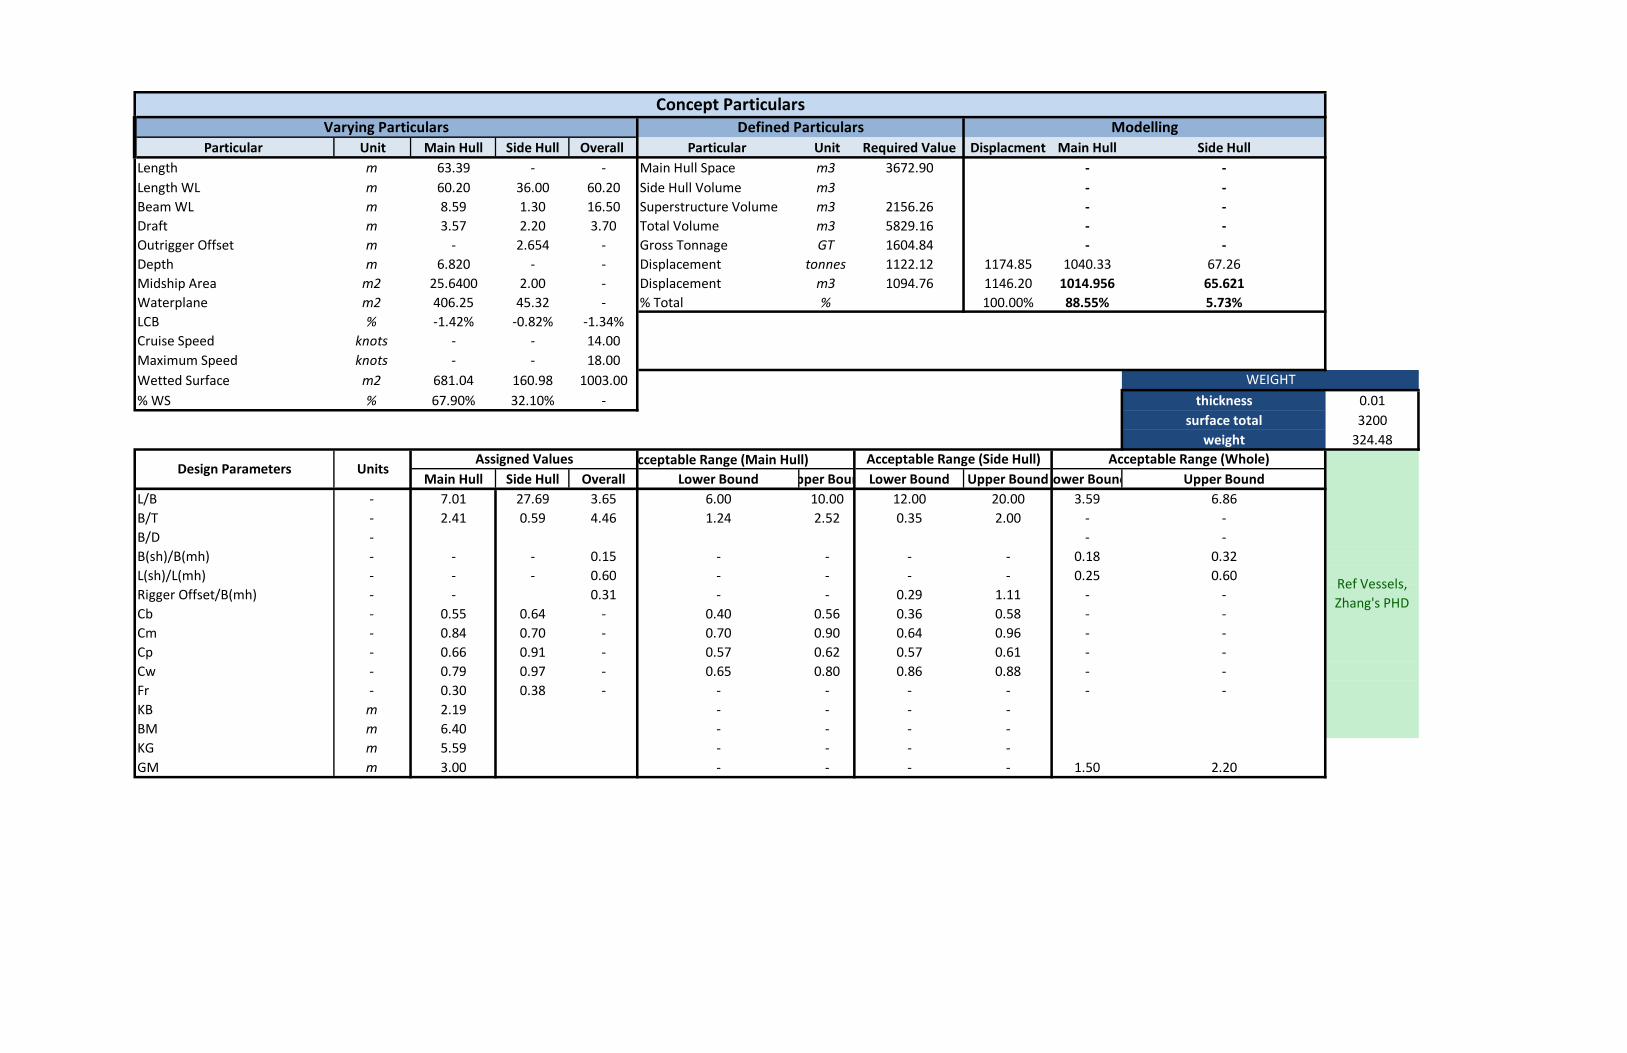
Particular Unit Main Hull Side Hull Overall Particular Unit Required Value Displacment Main Hull Side Hull
Length m 63.39 - - Main Hull Space m3 3672.90 - -
Length WL m 60.20 36.00 60.20 Side Hull Volume m3 - -
Beam WL m 8.59 1.30 16.50 Superstructure Volume m3 2156.26 - -
Draft m 3.57 2.20 3.70 Total Volume m3 5829.16 - -
Outrigger Offset m - 2.654 - Gross Tonnage GT 1604.84 - -
Depth m 6.820 - - Displacement tonnes 1122.12 1174.85 1040.33 67.26
Midship Area m2 25.6400 2.00 - Displacement m3 1094.76 1146.20 1014.956 65.621
Waterplane m2 406.25 45.32 - % Total % 100.00% 88.55% 5.73%
LCB % -1.42% -0.82% -1.34%
Cruise Speed knots - - 14.00
Maximum Speed knots - - 18.00
Wetted Surface m2 681.04 160.98 1003.00
% WS % 67.90% 32.10% - thickness 0.01
surface total 3200
weight 324.48
Acceptable Range (Main Hull)
Main Hull Side Hull Overall Lower Bound Upper BoundLower Bound Upper BoundLower Bound Upper Bound
L/B - 7.01 27.69 3.65 6.00 10.00 12.00 20.00 3.59 6.86
B/T - 2.41 0.59 4.46 1.24 2.52 0.35 2.00 - -
B/D - - -
B(sh)/B(mh) - - - 0.15 - - - - 0.18 0.32
L(sh)/L(mh) - - - 0.60 - - - - 0.25 0.60
Rigger Offset/B(mh) - - 0.31 - - 0.29 1.11 - -
Cb - 0.55 0.64 - 0.40 0.56 0.36 0.58 - -
Cm - 0.84 0.70 - 0.70 0.90 0.64 0.96 - -
Cp - 0.66 0.91 - 0.57 0.62 0.57 0.61 - -
Cw - 0.79 0.97 - 0.65 0.80 0.86 0.88 - -
Fr - 0.30 0.38 - - - - - - -
KB m 2.19 - - - -
BM m 6.40 - - - -
KG m 5.59 - - - -
GM m 3.00 - - - - 1.50 2.20
WEIGHT
Concept Particulars
Acceptable Range (Whole)Acceptable Range (Side Hull)
Defined ParticularsVarying Particulars
Design Parameters UnitsAssigned Values
Modelling
Ref Vessels,
Zhang's PHD
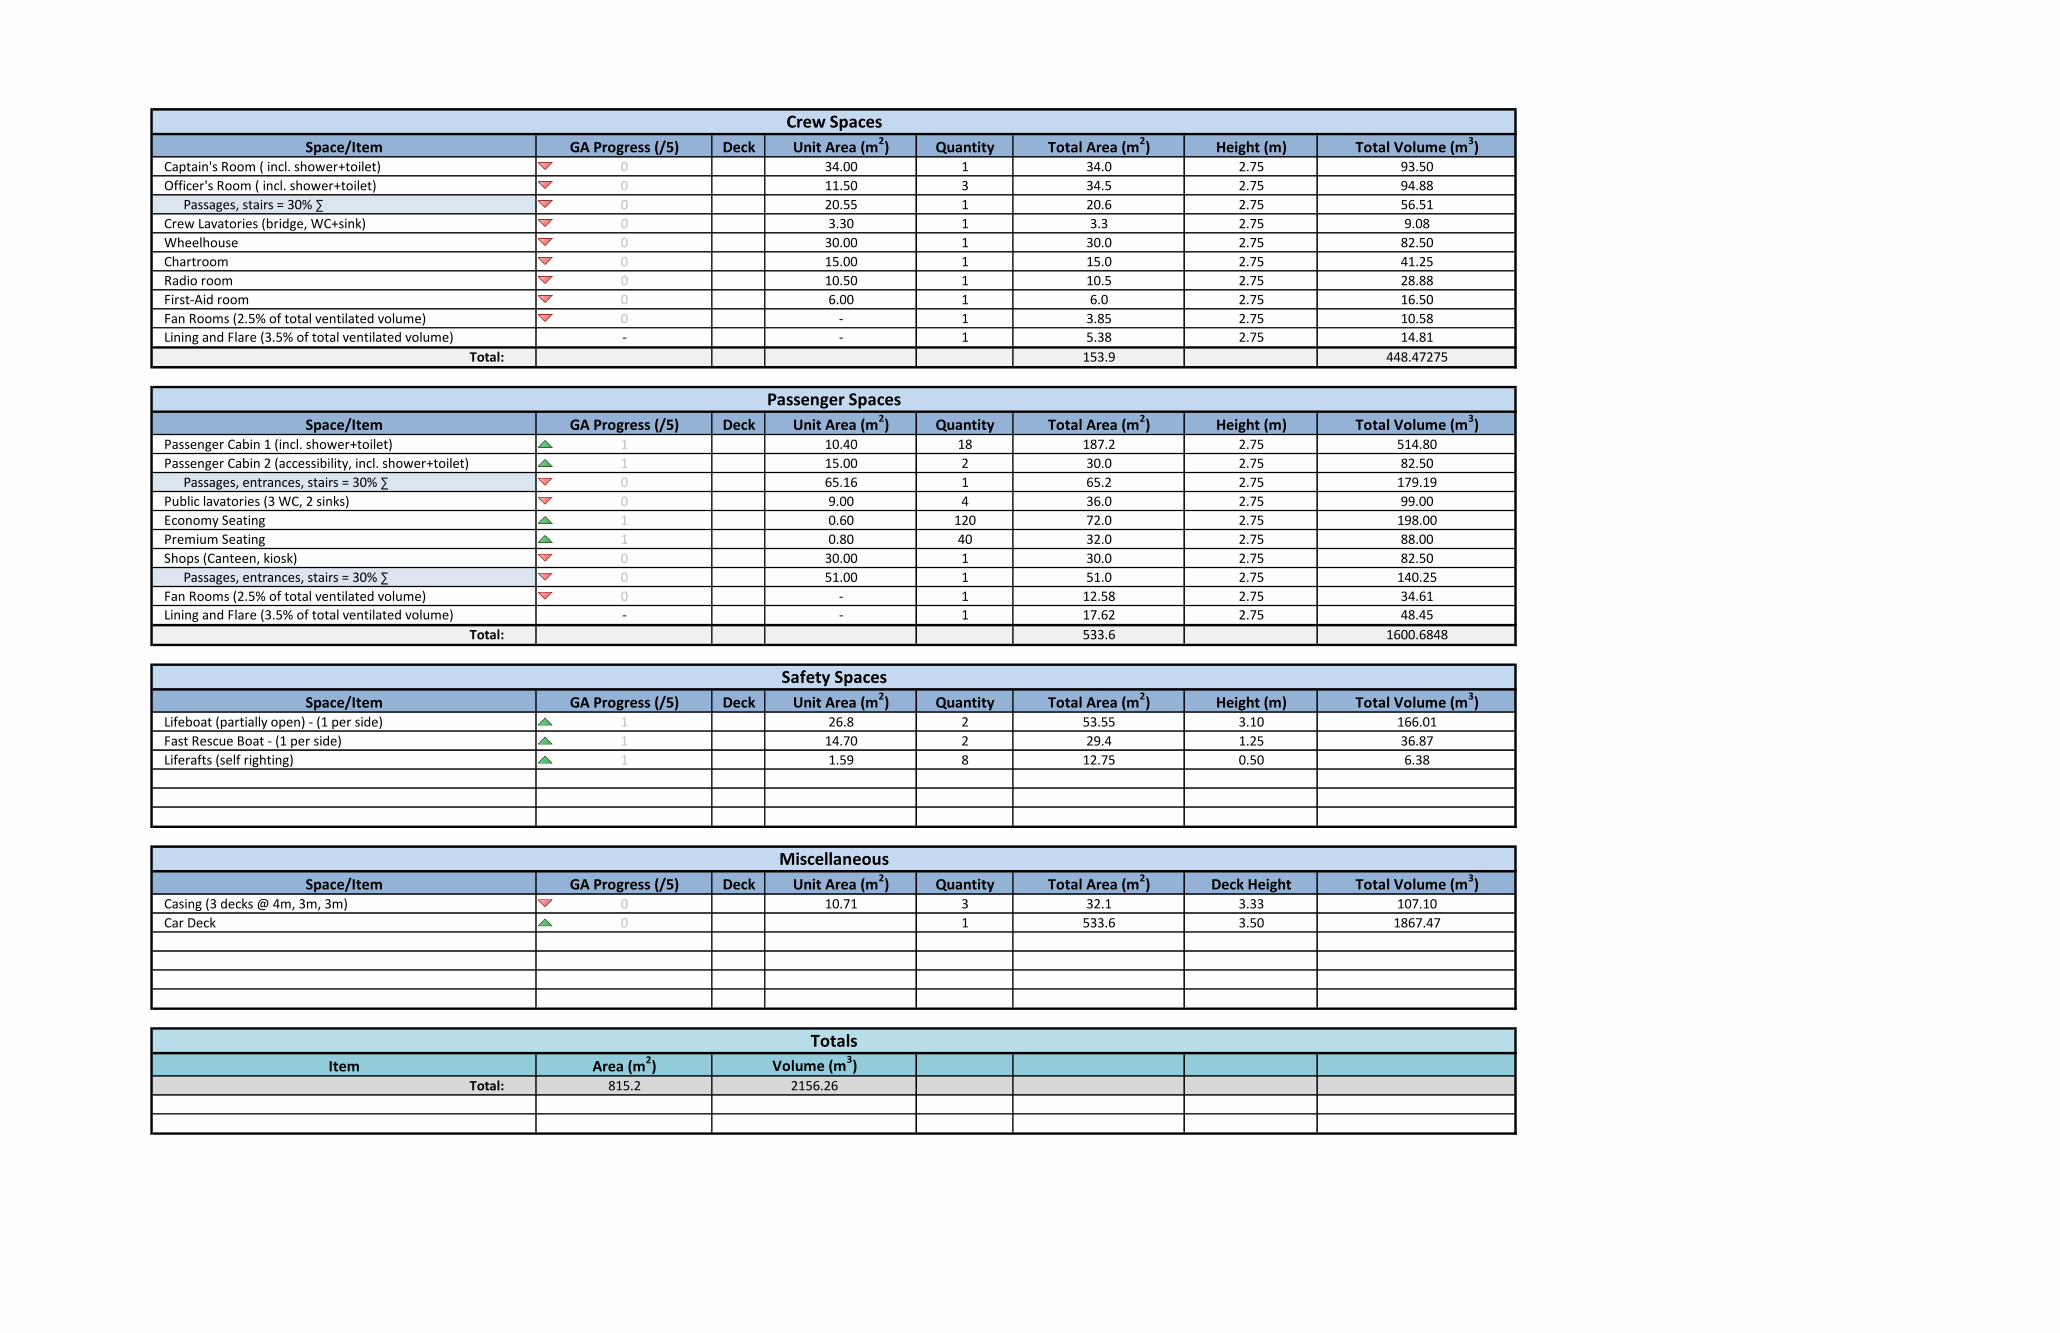
Space/Item GA Progress (/5) Deck Unit Area (m2) Quantity Total Area (m
2) Height (m) Total Volume (m
3)
Captain's Room ( incl. shower+toilet) 0 34.00 1 34.0 2.75 93.50
Officer's Room ( incl. shower+toilet) 0 11.50 3 34.5 2.75 94.88
Passages, stairs = 30% ∑ 0 20.55 1 20.6 2.75 56.51
Crew Lavatories (bridge, WC+sink) 0 3.30 1 3.3 2.75 9.08
Wheelhouse 0 30.00 1 30.0 2.75 82.50
Chartroom 0 15.00 1 15.0 2.75 41.25
Radio room 0 10.50 1 10.5 2.75 28.88
First-Aid room 0 6.00 1 6.0 2.75 16.50
Fan Rooms (2.5% of total ventilated volume) 0 - 1 3.85 2.75 10.58
Lining and Flare (3.5% of total ventilated volume) - - 1 5.38 2.75 14.81
Total: 153.9 448.47275
Space/Item GA Progress (/5) Deck Unit Area (m2) Quantity Total Area (m2) Height (m) Total Volume (m3)Passenger Cabin 1 (incl. shower+toilet) 1 10.40 18 187.2 2.75 514.80
Passenger Cabin 2 (accessibility, incl. shower+toilet) 1 15.00 2 30.0 2.75 82.50
Passages, entrances, stairs = 30% ∑ 0 65.16 1 65.2 2.75 179.19
Public lavatories (3 WC, 2 sinks) 0 9.00 4 36.0 2.75 99.00
Economy Seating 1 0.60 120 72.0 2.75 198.00
Premium Seating 1 0.80 40 32.0 2.75 88.00
Shops (Canteen, kiosk) 0 30.00 1 30.0 2.75 82.50
Passages, entrances, stairs = 30% ∑ 0 51.00 1 51.0 2.75 140.25
Fan Rooms (2.5% of total ventilated volume) 0 - 1 12.58 2.75 34.61
Lining and Flare (3.5% of total ventilated volume) - - 1 17.62 2.75 48.45
Total: 533.6 1600.6848
Space/Item GA Progress (/5) Deck Unit Area (m2) Quantity Total Area (m2) Height (m) Total Volume (m3)Lifeboat (partially open) - (1 per side) 1 26.8 2 53.55 3.10 166.01
Fast Rescue Boat - (1 per side) 1 14.70 2 29.4 1.25 36.87
Liferafts (self righting) 1 1.59 8 12.75 0.50 6.38
Space/Item GA Progress (/5) Deck Unit Area (m2) Quantity Total Area (m
2) Deck Height Total Volume (m
3)
Casing (3 decks @ 4m, 3m, 3m) 0 10.71 3 32.1 3.33 107.10
Car Deck 0 1 533.6 3.50 1867.47
Item Area (m2)Total: 815.2
Passenger Spaces
Safety Spaces
Miscellaneous
Crew Spaces
Totals
Volume (m3)
2156.26

Tank GA Progress (/5) Required Volume Quantity Area on GA SG Weightm3 m2 tonnes/m3 tonnes
Fuel Oil 0 63.54 1 21.2 0.870 55.28
Fuel Oil Day Tank 0 0.24 1 0.1 0.89 0.21
Fresh Water Tank 1 60.00 1 20.0 1.000 60.00
Ballast Water 0 61.77 1 20.6 1.025 0.00
Lubricating Oil 0 0.25 1 0.1 0.920 0.23
Bilge Water 0 2.00 1 0.7 0.975 0.00
Sludge Tank 0 0.11 1 0.0 0.950 0.10
Black Water tank 0 4.00 1 1.3 1.250 0.00
Grey Water Tank 0 64.00 1 21.3 1.000 0.00
Associated Coffer Dams & Voids = 15% ∑ 0 76.77 1 25.6 - -
Total: 332.68 110.89 115.83
Space/Item GA Progress (/5) Unit Area (m2) Quantity Total Area (m2) Height (m) Total Volume (m3)Diesel Engine - 1500 kW 0 0.40 1 150 - 600.00
Emergency Generator - 200 kW 0 0.40 1 20 - 80.00
Auxillary Generators 300 kW 0.40 1 30 120.00
Propeller Shaft 0 - 0 4.00
Gearbox 0 - 0 4.00
Sewage Plant 1 15.00 1 15 4.00 60.00
Engineering Shop 0 16.00 1 16 2.40 38.40
Laundry 10.00 1 10 2.40 24.00
Galley (area/crew) 0.65 15 9.75 2.40 23.40
Messes, Recreation Room (area/crew) 1.70 15 25.5 2.40 61.20
Crew Cabin 1 (double, incl. shower+toilet) 0 10.10 2 20.2 2.40 48.48
Crew Cabin 2 (quad, incl. shower+toilet) 0 14.10 2 28.2 2.40 67.68
Passages, stairs = 35% ∑ 0 8.47 2 16.9 2.40 40.656
Refigerated Stores 0 12.00 1 12.00 2.40 28.80
General Stores 0 12.00 1 12.00 2.40 28.80
Reverse Osmosis Unit 0 1.00 1 1.00 4.00 4.00
Solid Waste Compactor 0 1.00 1 1.00 4.00 4.00
0
0
Total: 367.59 1229.42
Item Area (m2) Volume (m3)Total: 478.5 1562.10
Totals
Machinery Items/Spaces
Tanks
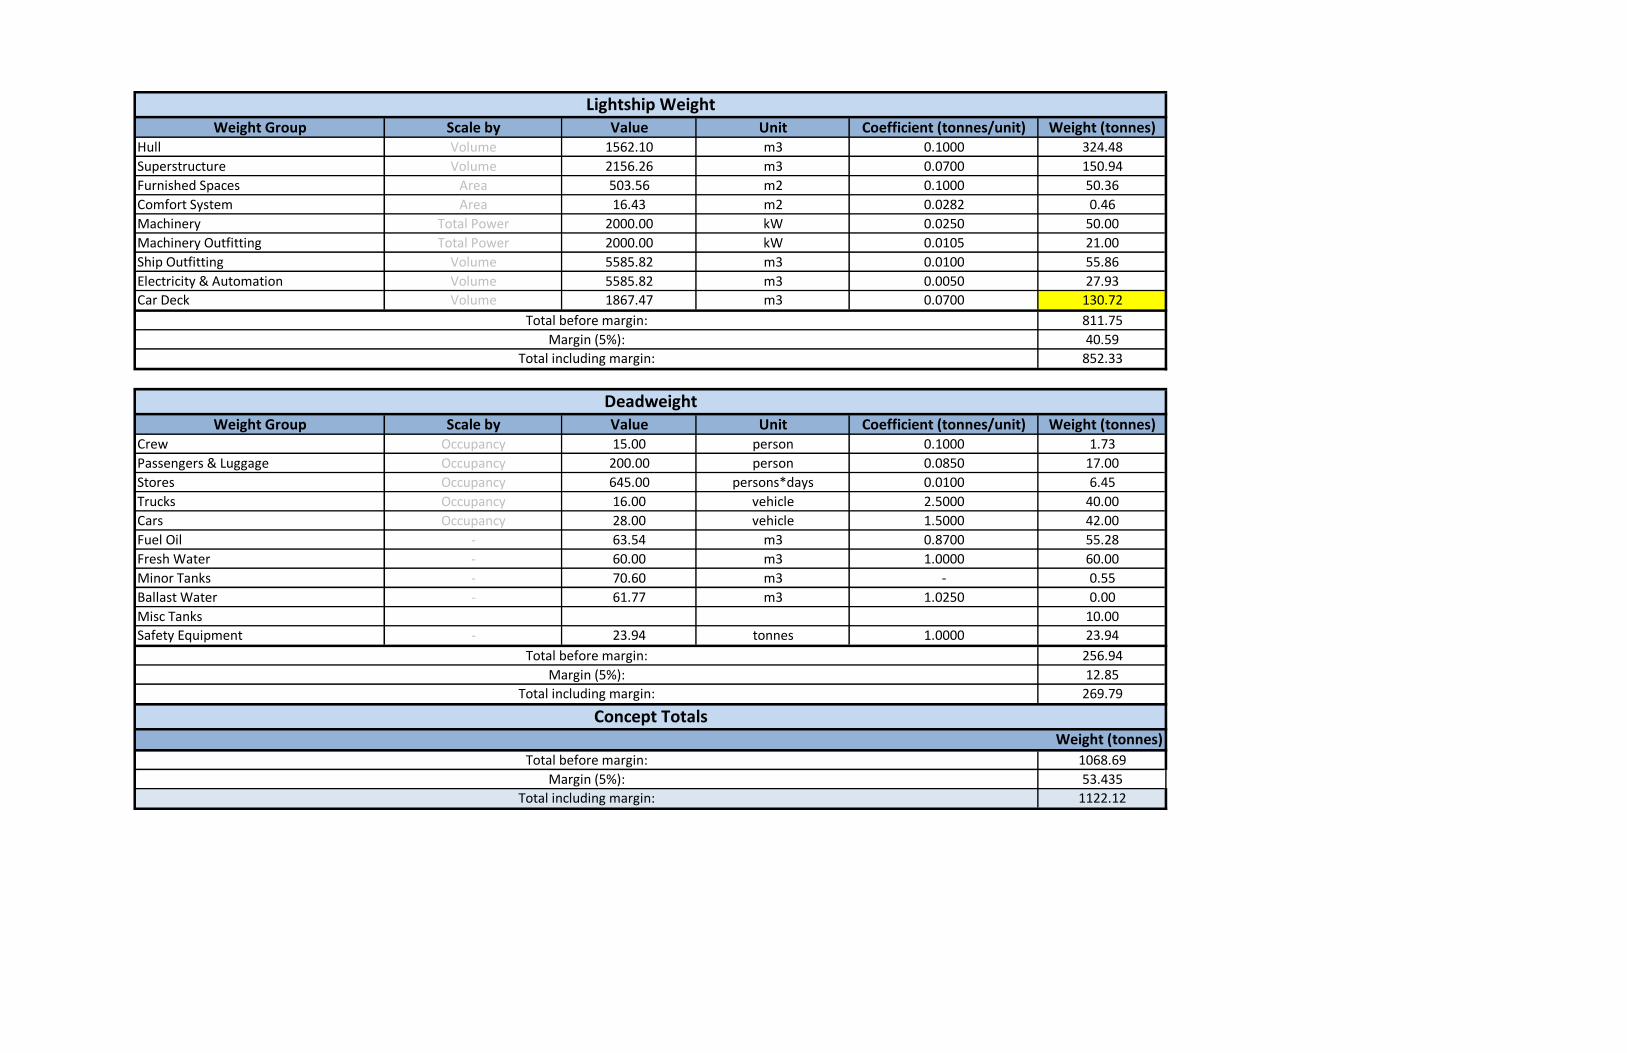
Weight Group Scale by Value Unit Coefficient (tonnes/unit) Weight (tonnes)Hull Volume 1562.10 m3 0.1000 324.48
Superstructure Volume 2156.26 m3 0.0700 150.94
Furnished Spaces Area 503.56 m2 0.1000 50.36
Comfort System Area 16.43 m2 0.0282 0.46
Machinery Total Power 2000.00 kW 0.0250 50.00
Machinery Outfitting Total Power 2000.00 kW 0.0105 21.00
Ship Outfitting Volume 5585.82 m3 0.0100 55.86
Electricity & Automation Volume 5585.82 m3 0.0050 27.93
Car Deck Volume 1867.47 m3 0.0700 130.72
811.75
40.59
852.33
Weight Group Scale by Value Unit Coefficient (tonnes/unit) Weight (tonnes)Crew Occupancy 15.00 person 0.1000 1.73
Passengers & Luggage Occupancy 200.00 person 0.0850 17.00
Stores Occupancy 645.00 persons*days 0.0100 6.45
Trucks Occupancy 16.00 vehicle 2.5000 40.00
Cars Occupancy 28.00 vehicle 1.5000 42.00
Fuel Oil - 63.54 m3 0.8700 55.28
Fresh Water - 60.00 m3 1.0000 60.00
Minor Tanks - 70.60 m3 - 0.55
Ballast Water - 61.77 m3 1.0250 0.00
Misc Tanks 10.00
Safety Equipment - 23.94 tonnes 1.0000 23.94
256.94
12.85
269.79
1068.69
53.435
1122.12
Total before margin:
Margin (5%):
Total including margin:
Total before margin:
Margin (5%):
Total including margin:
Concept TotalsWeight (tonnes)
Lightship Weight
Total before margin:
Margin (5%):
Total including margin:
Deadweight

Weight Group Weight
[tonnes]
LCG
[m]
TCG
[m]
VCG
[m]Weight Group
Weight
[tonnes]
LCG
[m]
TCG
[m]
VCG
[m]
100 ‐ Structure 520 28.510 0.000 5.209 100 ‐ Structure 520 28.510 0.000 5.209
200 ‐ Machinery, Mechanical & Propulsion 94 14.834 0.000 3.552 Hull 380 28.130 0.000 3.197
400 ‐ Communication, Command & Surveillance 28 39.310 0.000 9.223 Superstructure 140 29.540 0.000 10.670
500 ‐ Auxiliary Systems 29 47.780 0.000 4.470 200 ‐ Machinery, Mechanical & Pro 94 14.834 0.000 3.552
600 ‐ Outfit 132 29.913 0.035 8.027 Auxiliary engines 9 18.780 0.000 3.500
SUBTOTAL LIGHTSHIP WEIGHT 803 28.210 0.006 5.589 Generic machinery 63 14.400 0.000 3.578
Main engines 23 14.500 0.000 3.500
Note: 400 ‐ Communication, Command & 28 39.310 0.000 9.223
LCG measured as positive forward of frame 0 Electricity & automation ‐ hull 13 28.130 0.000 3.197
TCG measured as positive port of centreline Electricity & automation ‐ supers 15 49.000 0.000 14.445
VCG measured as positive upward from baseline 500 ‐ Auxiliary Systems 29 47.780 0.000 4.470
Mooring and towing 8 58.000 0.000 6.820
Systems & machinery outfitting 21 43.790 0.000 3.552
600 ‐ Outfit 132 29.913 0.035 8.027
Generic outfitting ‐ Hull 50 28.130 0.000 3.197
Generic outfitting ‐ Superstructur 10 28.130 0.034 8.570
Furnishing ‐ Crew Deck 9 34.680 0.034 4.870
Furnishing ‐ 01 Deck 52 28.030 0.034 11.819
Furnishing ‐ 02 Deck 10 45.690 0.034 14.445
Note:
LCG measured as positive forward of frame 0
TCG measured as positive port of centreline
VCG measured positive from keel
LIGHTSHIP SUMMARY LIGHTSHIP BREAKDOWN
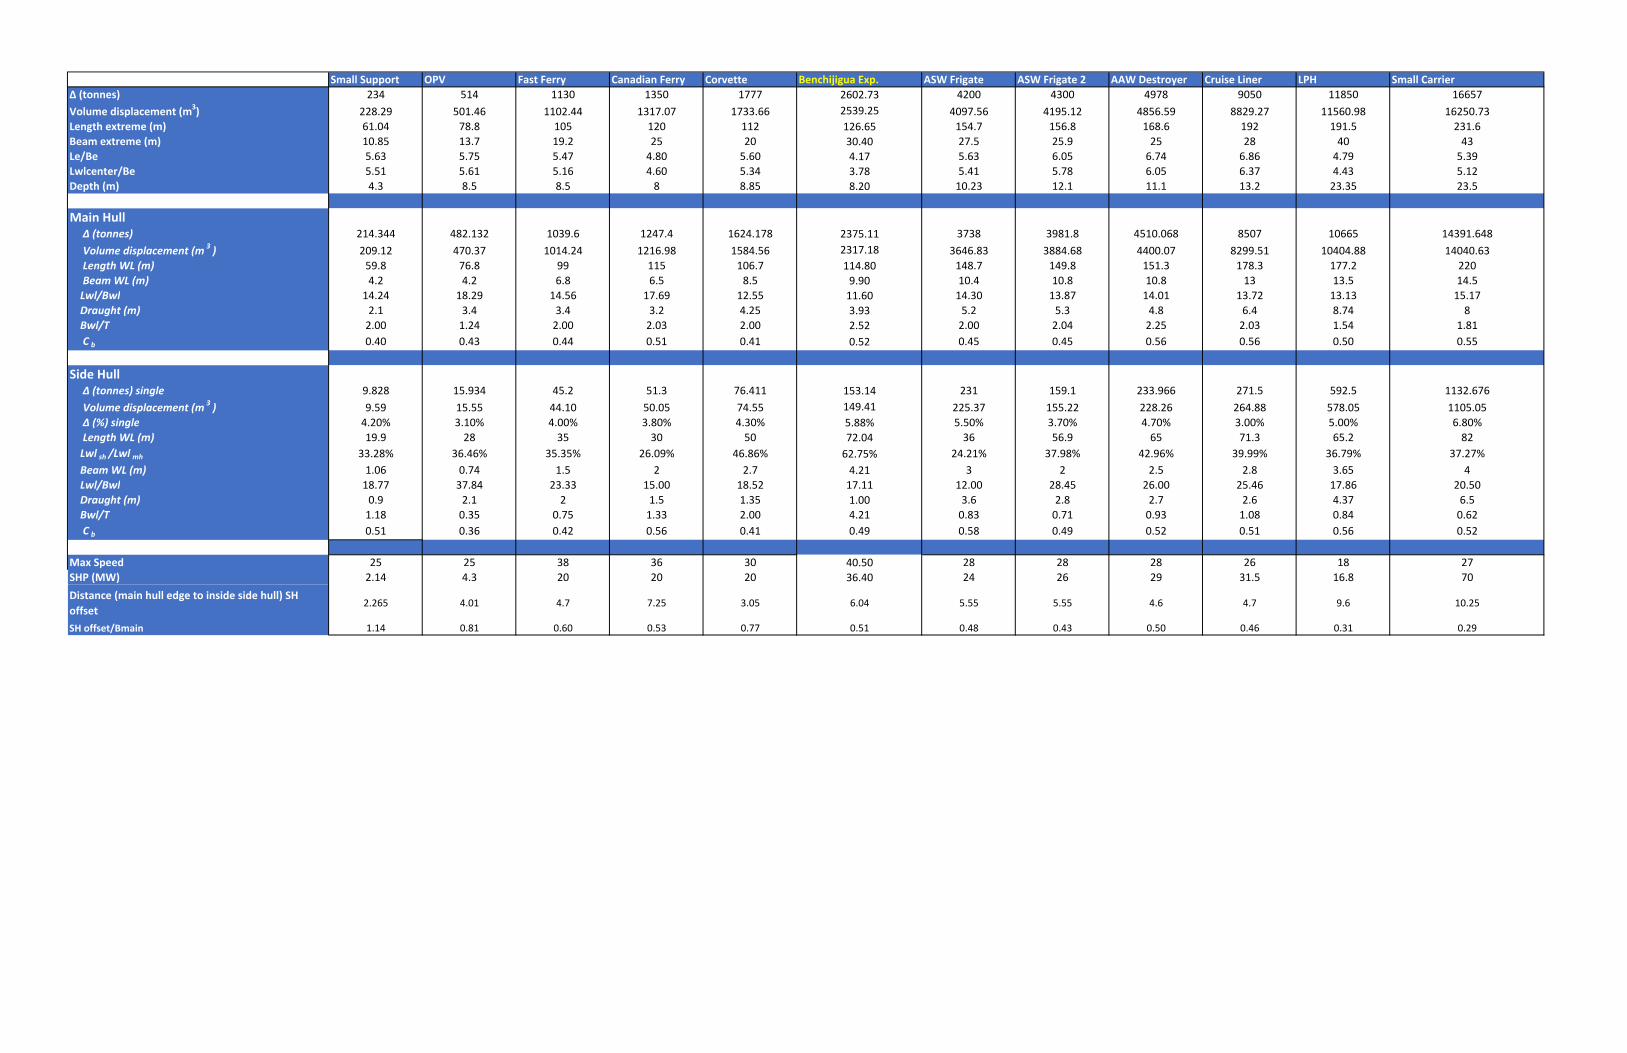
Small Support OPV Fast Ferry Canadian Ferry Corvette Benchijigua Exp. ASW Frigate ASW Frigate 2 AAW Destroyer Cruise Liner LPH Small Carrier
Δ (tonnes) 234 514 1130 1350 1777 2602.73 4200 4300 4978 9050 11850 16657
Volume displacement (m3) 228.29 501.46 1102.44 1317.07 1733.66 2539.25 4097.56 4195.12 4856.59 8829.27 11560.98 16250.73
Length extreme (m) 61.04 78.8 105 120 112 126.65 154.7 156.8 168.6 192 191.5 231.6
Beam extreme (m) 10.85 13.7 19.2 25 20 30.40 27.5 25.9 25 28 40 43
Le/Be 5.63 5.75 5.47 4.80 5.60 4.17 5.63 6.05 6.74 6.86 4.79 5.39
Lwlcenter/Be 5.51 5.61 5.16 4.60 5.34 3.78 5.41 5.78 6.05 6.37 4.43 5.12
Depth (m) 4.3 8.5 8.5 8 8.85 8.20 10.23 12.1 11.1 13.2 23.35 23.5
Main Hull Δ (tonnes) 214.344 482.132 1039.6 1247.4 1624.178 2375.11 3738 3981.8 4510.068 8507 10665 14391.648
Volume displacement (m3 ) 209.12 470.37 1014.24 1216.98 1584.56 2317.18 3646.83 3884.68 4400.07 8299.51 10404.88 14040.63
Length WL (m) 59.8 76.8 99 115 106.7 114.80 148.7 149.8 151.3 178.3 177.2 220
Beam WL (m) 4.2 4.2 6.8 6.5 8.5 9.90 10.4 10.8 10.8 13 13.5 14.5
Lwl/Bwl 14.24 18.29 14.56 17.69 12.55 11.60 14.30 13.87 14.01 13.72 13.13 15.17
Draught (m) 2.1 3.4 3.4 3.2 4.25 3.93 5.2 5.3 4.8 6.4 8.74 8
Bwl/T 2.00 1.24 2.00 2.03 2.00 2.52 2.00 2.04 2.25 2.03 1.54 1.81
C b 0.40 0.43 0.44 0.51 0.41 0.52 0.45 0.45 0.56 0.56 0.50 0.55
Side Hull Δ (tonnes) single 9.828 15.934 45.2 51.3 76.411 153.14 231 159.1 233.966 271.5 592.5 1132.676
Volume displacement (m3 ) 9.59 15.55 44.10 50.05 74.55 149.41 225.37 155.22 228.26 264.88 578.05 1105.05
Δ (%) single 4.20% 3.10% 4.00% 3.80% 4.30% 5.88% 5.50% 3.70% 4.70% 3.00% 5.00% 6.80%
Length WL (m) 19.9 28 35 30 50 72.04 36 56.9 65 71.3 65.2 82
Lwl sh /Lwl mh 33.28% 36.46% 35.35% 26.09% 46.86% 62.75% 24.21% 37.98% 42.96% 39.99% 36.79% 37.27%
Beam WL (m) 1.06 0.74 1.5 2 2.7 4.21 3 2 2.5 2.8 3.65 4
Lwl/Bwl 18.77 37.84 23.33 15.00 18.52 17.11 12.00 28.45 26.00 25.46 17.86 20.50
Draught (m) 0.9 2.1 2 1.5 1.35 1.00 3.6 2.8 2.7 2.6 4.37 6.5
Bwl/T 1.18 0.35 0.75 1.33 2.00 4.21 0.83 0.71 0.93 1.08 0.84 0.62
C b 0.51 0.36 0.42 0.56 0.41 0.49 0.58 0.49 0.52 0.51 0.56 0.52
Max Speed 25 25 38 36 30 40.50 28 28 28 26 18 27
SHP (MW) 2.14 4.3 20 20 20 36.40 24 26 29 31.5 16.8 70
Distance (main hull edge to inside side hull) SH
offset2.265 4.01 4.7 7.25 3.05 6.04 5.55 5.55 4.6 4.7 9.6 10.25
SH offset/Bmain 1.14 0.81 0.60 0.53 0.77 0.51 0.48 0.43 0.50 0.46 0.31 0.29
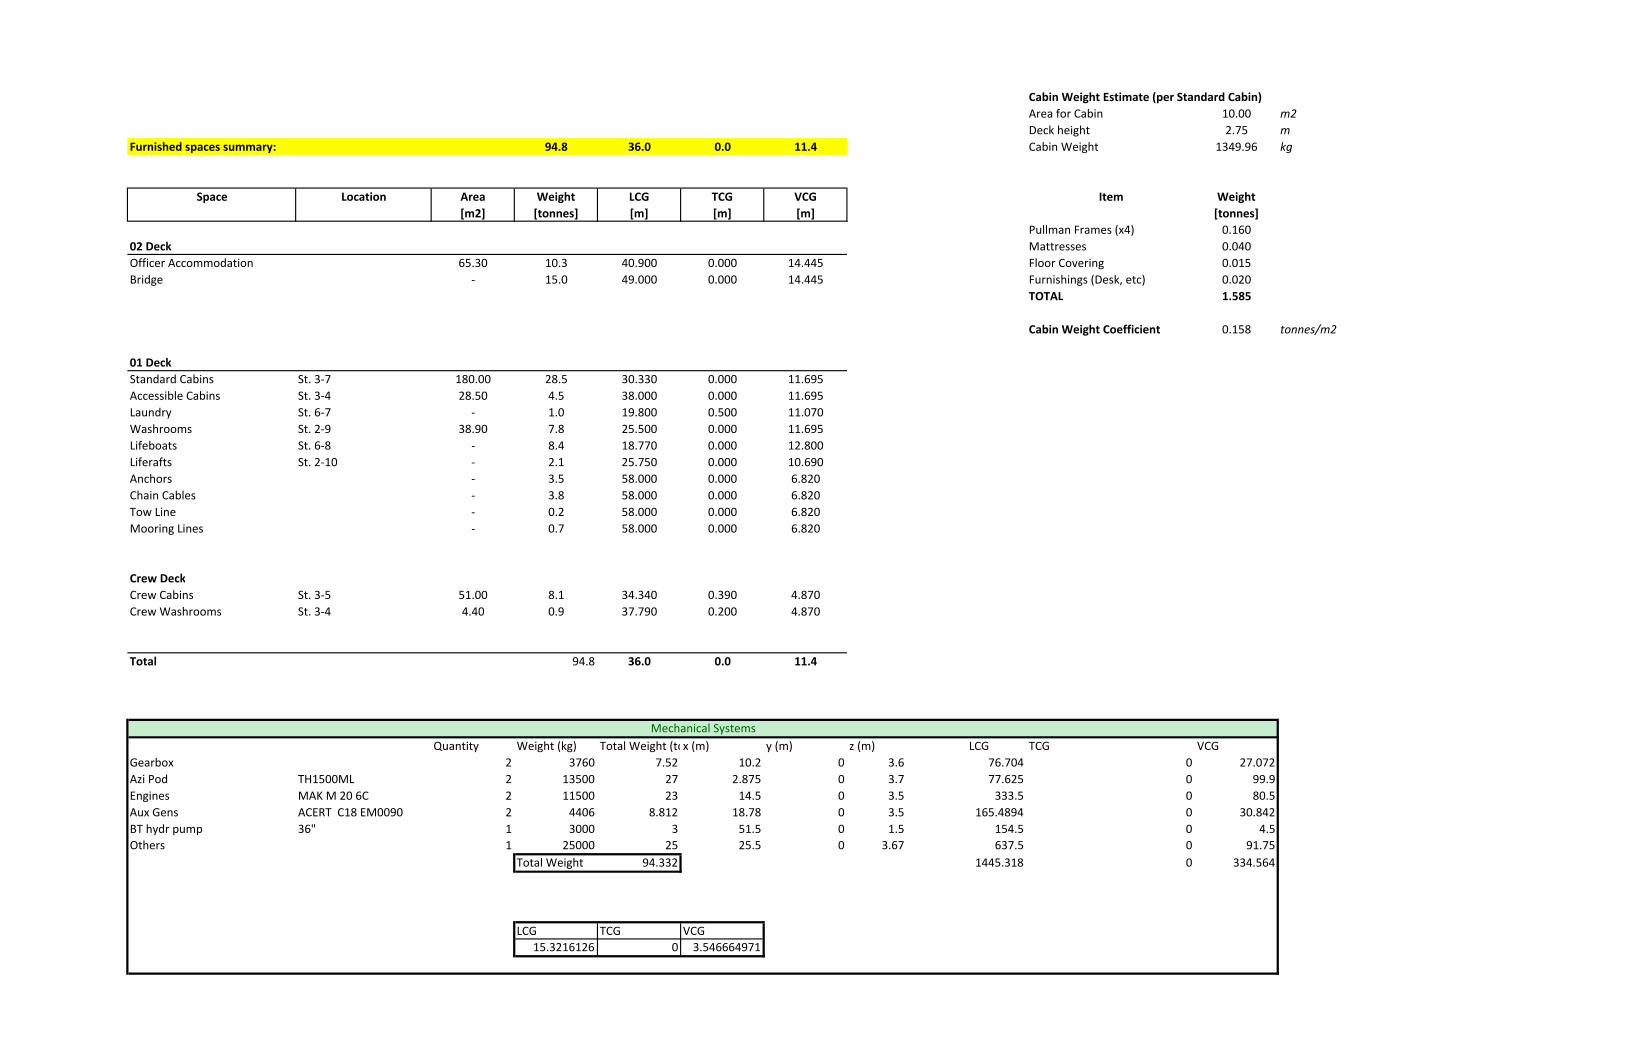
Cabin Weight Estimate (per Standard Cabin)
Area for Cabin 10.00 m2
Deck height 2.75 m
Furnished spaces summary: 94.8 36.0 0.0 11.4 Cabin Weight 1349.96 kg
Space Location Area
[m2]
Weight
[tonnes]
LCG
[m]
TCG
[m]
VCG
[m]
Item Weight
[tonnes]
Pullman Frames (x4) 0.160
02 Deck Mattresses 0.040
Officer Accommodation 65.30 10.3 40.900 0.000 14.445 Floor Covering 0.015
Bridge ‐ 15.0 49.000 0.000 14.445 Furnishings (Desk, etc) 0.020
TOTAL 1.585
Cabin Weight Coefficient 0.158 tonnes/m2
01 Deck
Standard Cabins St. 3‐7 180.00 28.5 30.330 0.000 11.695
Accessible Cabins St. 3‐4 28.50 4.5 38.000 0.000 11.695
Laundry St. 6‐7 ‐ 1.0 19.800 0.500 11.070
Washrooms St. 2‐9 38.90 7.8 25.500 0.000 11.695
Lifeboats St. 6‐8 ‐ 8.4 18.770 0.000 12.800
Liferafts St. 2‐10 ‐ 2.1 25.750 0.000 10.690
Anchors ‐ 3.5 58.000 0.000 6.820
Chain Cables ‐ 3.8 58.000 0.000 6.820
Tow Line ‐ 0.2 58.000 0.000 6.820
Mooring Lines ‐ 0.7 58.000 0.000 6.820
Crew Deck
Crew Cabins St. 3‐5 51.00 8.1 34.340 0.390 4.870
Crew Washrooms St. 3‐4 4.40 0.9 37.790 0.200 4.870
Total 94.8 36.0 0.0 11.4
Quantity Weight (kg) Total Weight (tox (m) y (m) z (m) LCG TCG VCG
Gearbox 2 3760 7.52 10.2 0 3.6 76.704 0 27.072
Azi Pod TH1500ML 2 13500 27 2.875 0 3.7 77.625 0 99.9
Engines MAK M 20 6C 2 11500 23 14.5 0 3.5 333.5 0 80.5
Aux Gens ACERT C18 EM0090 2 4406 8.812 18.78 0 3.5 165.4894 0 30.842
BT hydr pump 36" 1 3000 3 51.5 0 1.5 154.5 0 4.5
Others 1 25000 25 25.5 0 3.67 637.5 0 91.75
Total Weight 94.332 1445.318 0 334.564
LCG TCG VCG
15.3216126 0 3.546664971
Mechanical Systems

Fresh Water Volume Calculation
Papua New Guinea water usage = 64.3 m3/person/year Engine Power (kW): 1000
Source: http://www.fao.org/nr/water/aquastat/countries_regions/PNG/Tables.htm 200
Ship Construction and Design says 170 litres/person/day
Source: Ship Design and Construction, page 11‐26
Upper bound of fresh water consumption for passenger ships = 82.125 m3/person/year
Source: Marine Auxilliary Machinery by H D McGeorge, page 93
→ Assume 73 m3/person/year = 200 litres/person/day (to match with Lloyds Black + Grey water)
Specifications dictate freshwater supplies for 1000 nm; assume 14 knot speed
→ Assume speed of 14 knots
Total travel time = 71.42 hours
Total fresh water volume = 200 litres/person/day x 215 persons x 3 days / 1 m3/1000 l = 129 m3
→ Assume a reverse osmosis unit has been installed which is in use for 12 hours per day.
Required freshwater production rate = 200 l/person/day x 1 day/12 h x 1 h/60 minx 215 p = 60 l/min = 16 gal/min
Choose : Vantage® M41‐006 Reverse Osmosis Systems ‐‐> rated at 7.5 gal/min ‐‐> produces 61.24 m3 over 1000 NM
Dimensions: 0.826 x 0.87 x 1.867; Weight: 245 kg
http://www.water.siemens.com/en/products/membrane_filtration_separation/reverse_osmosis_systems_ro/Pages/vantage‐m41‐ro.aspx
→ Required fresh water tank volume = 129m3 ‐ 61m3 = 68 m3
Sewage Retention Tank with Aeration Calculation
Black water flow rates for passenger ships range around 15 litres/person/day. (Assuming vaccuum flushing)
Grey water flow rates for passenger ships range from 184 litres/person/day. (175+((85+40)*15(Crew)/215 (Total)))
Source: Lloyd's Part 2, Chapter 7, 2.10
→ Assuming use of a Biological Sewage Treatment System ‐ Sludge storage is required.
Liquid wastes are treated and recirculated for toilet and urinal flushing.
Solid waste holding tank capacity is close to 2 litres/person/day.
Source: Marine Auxilliary Machinery by H D McGeorge, page 108
Total sludge retention tank storage = 2 litres/person/day x 215 persons x 3 days / 1000 l/m3 = 1.3 m3
Total black+grey water flow rates = 184 litres/person/day x 215 persons = 39,500 litres/day
→ Choosing model ST25‐C by Wartsila Hamworthy.
Dimensions: 4.62 x 3.22 x 2.50
Weight = 27,830 kg
→ Sewage tank calculation:
Assuming sewage treatment system is broken
for longest trip between ports + 25% extra:
Sewage Tank Size = 200 l/person/day x 215 people x 1.25=
V = 54 m3
Source: http://www.wartsila.com/en/water‐management/waste‐water/sewage‐treatment
Lube Oil Calculations
Lube oil values for medium speed diesels can be approximated at 20 t
Source: Ship Design and Construction, page 11‐26
Typical lube oil consumption for medium speed diesel = 1.0 g/kWh
Assuming 1 1,500 kW engine, lube oil required for 1 trip
= 1.0 g/kWh x 1500 kW x 144 hours/trip x 1 kg/1000 g x 1 m3/890 kg = 0.25 m3
V= m3
Sludge Tank Calculations
Regulation 17(1) of MARPOL states:
V = K*C*D where V = sludge tank volume (m3)
K = 0.005
C = 7200 (daily fuel oil consumption ‐ metric tons)
D = 3 (maximum period of voyage between ports where sludge can be disposed; we need design for 1000 nm)
→ V = 200 g/kWh x 24 h x 1500 kW x 1 ton/1000000 g x 1 m3/1 ton
.
V = m3
Bilge Water Holding Tanks
Source: http://www.imo.org/blast/blastDataHelper.asp?data_id=14478&filename=511.pdf
→ V = 1.5 + (P‐1000)/1500
V = m3
Hot Water Tank
Crew Showers Stalls= 8
Passenger Shower Stalls = 20
Showerhead flow rate = 2.5 gpm or 10 L/min
Say 10 minutes per shower; 10 crew showers per day & 80 passenger showers per day
→ 100 L/shower x 90 showers/day x 10% margin = 10 m3
→ V = 2.5 m3 based on an educated guess
Source: http://www.hubbellheaters.com/model/msh/#dimensions
x2 Dimensions (DxH): 0.9144x2.1336
Weight (kg): 2500
Assumed Pertinent Values
Engine SFR (g/kWh):
0.14
3
0.50
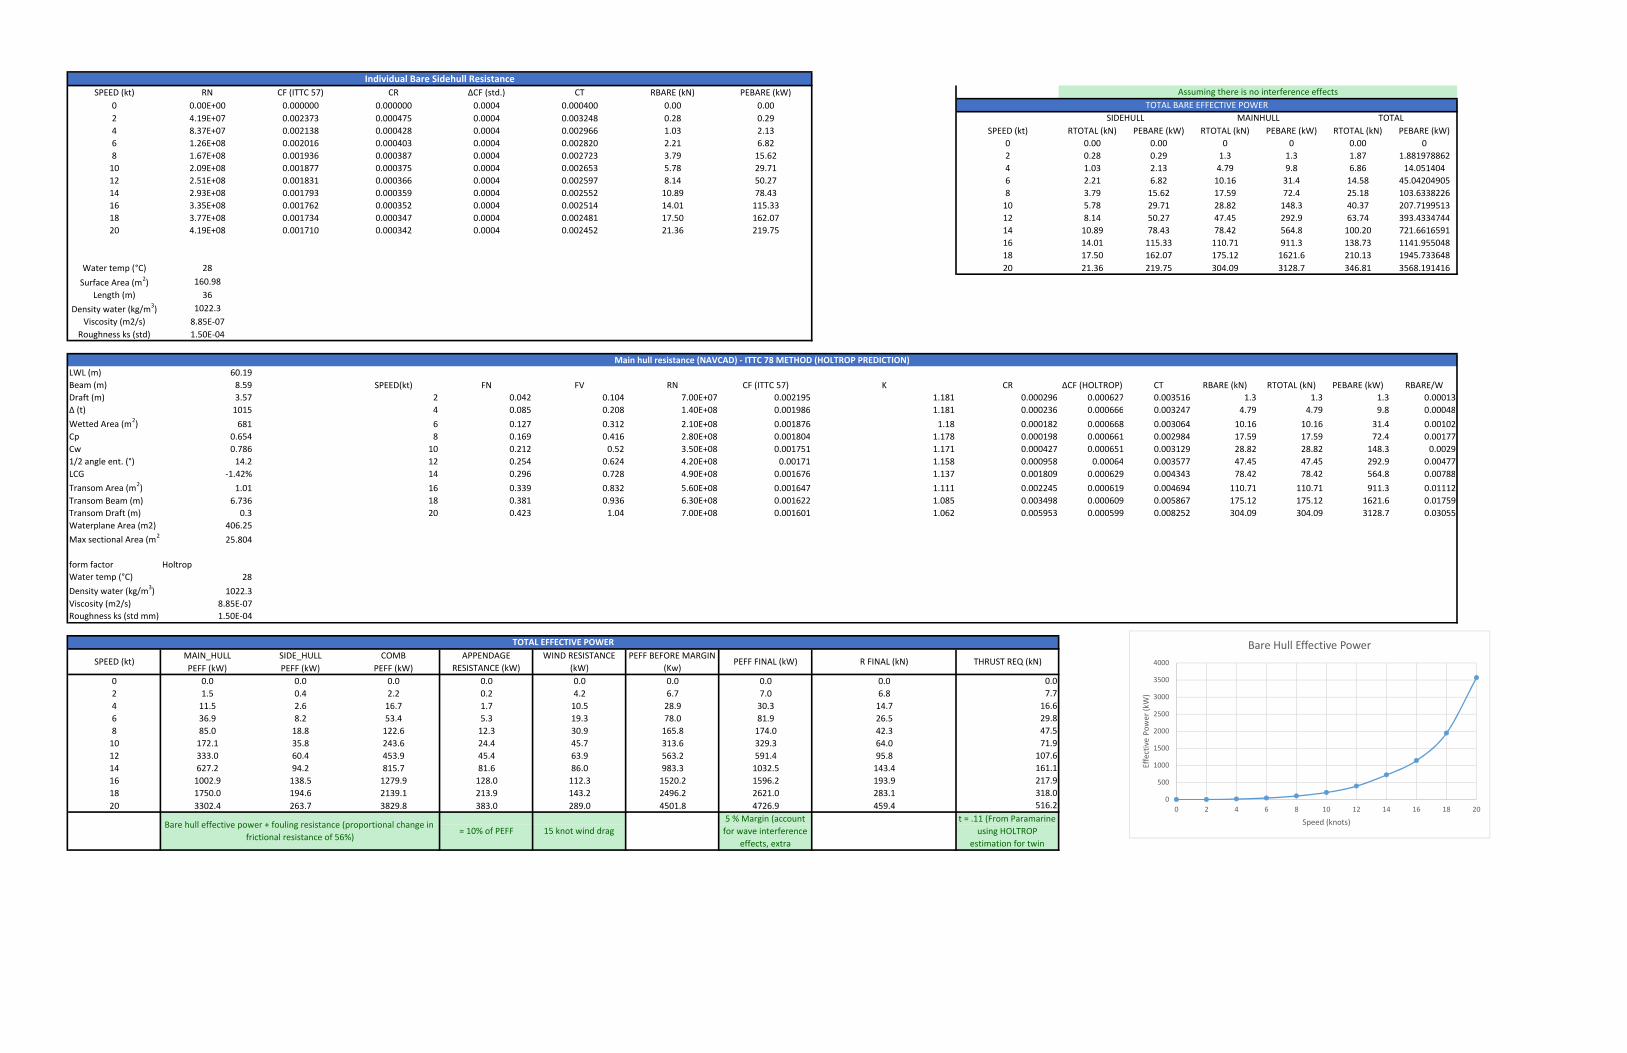
SPEED (kt) RN CF (ITTC 57) CR ΔCF (std.) CT RBARE (kN) PEBARE (kW)
0 0.00E+00 0.000000 0.000000 0.0004 0.000400 0.00 0.00
2 4.19E+07 0.002373 0.000475 0.0004 0.003248 0.28 0.29
4 8.37E+07 0.002138 0.000428 0.0004 0.002966 1.03 2.13 SPEED (kt) RTOTAL (kN) PEBARE (kW) RTOTAL (kN) PEBARE (kW) RTOTAL (kN) PEBARE (kW)
6 1.26E+08 0.002016 0.000403 0.0004 0.002820 2.21 6.82 0 0.00 0.00 0 0 0.00 0
8 1.67E+08 0.001936 0.000387 0.0004 0.002723 3.79 15.62 2 0.28 0.29 1.3 1.3 1.87 1.881978862
10 2.09E+08 0.001877 0.000375 0.0004 0.002653 5.78 29.71 4 1.03 2.13 4.79 9.8 6.86 14.051404
12 2.51E+08 0.001831 0.000366 0.0004 0.002597 8.14 50.27 6 2.21 6.82 10.16 31.4 14.58 45.04204905
14 2.93E+08 0.001793 0.000359 0.0004 0.002552 10.89 78.43 8 3.79 15.62 17.59 72.4 25.18 103.6338226
16 3.35E+08 0.001762 0.000352 0.0004 0.002514 14.01 115.33 10 5.78 29.71 28.82 148.3 40.37 207.7199513
18 3.77E+08 0.001734 0.000347 0.0004 0.002481 17.50 162.07 12 8.14 50.27 47.45 292.9 63.74 393.4334744
20 4.19E+08 0.001710 0.000342 0.0004 0.002452 21.36 219.75 14 10.89 78.43 78.42 564.8 100.20 721.6616591
16 14.01 115.33 110.71 911.3 138.73 1141.955048
18 17.50 162.07 175.12 1621.6 210.13 1945.733648
Water temp (°C) 28 20 21.36 219.75 304.09 3128.7 346.81 3568.191416
Surface Area (m2) 160.98
Length (m) 36
Density water (kg/m3) 1022.3
Viscosity (m2/s) 8.85E‐07
Roughness ks (std) 1.50E‐04
LWL (m) 60.19
Beam (m) 8.59 SPEED(kt) FN FV RN CF (ITTC 57) K CR ΔCF (HOLTROP) CT RBARE (kN) RTOTAL (kN) PEBARE (kW) RBARE/W
Draft (m) 3.57 2 0.042 0.104 7.00E+07 0.002195 1.181 0.000296 0.000627 0.003516 1.3 1.3 1.3 0.00013
Δ (t) 1015 4 0.085 0.208 1.40E+08 0.001986 1.181 0.000236 0.000666 0.003247 4.79 4.79 9.8 0.00048
Wetted Area (m2) 681 6 0.127 0.312 2.10E+08 0.001876 1.18 0.000182 0.000668 0.003064 10.16 10.16 31.4 0.00102
Cp 0.654 8 0.169 0.416 2.80E+08 0.001804 1.178 0.000198 0.000661 0.002984 17.59 17.59 72.4 0.00177
Cw 0.786 10 0.212 0.52 3.50E+08 0.001751 1.171 0.000427 0.000651 0.003129 28.82 28.82 148.3 0.0029
1/2 angle ent. (°) 14.2 12 0.254 0.624 4.20E+08 0.00171 1.158 0.000958 0.00064 0.003577 47.45 47.45 292.9 0.00477
LCG ‐1.42% 14 0.296 0.728 4.90E+08 0.001676 1.137 0.001809 0.000629 0.004343 78.42 78.42 564.8 0.00788
Transom Area (m2) 1.01 16 0.339 0.832 5.60E+08 0.001647 1.111 0.002245 0.000619 0.004694 110.71 110.71 911.3 0.01112
Transom Beam (m) 6.736 18 0.381 0.936 6.30E+08 0.001622 1.085 0.003498 0.000609 0.005867 175.12 175.12 1621.6 0.01759
Transom Draft (m) 0.3 20 0.423 1.04 7.00E+08 0.001601 1.062 0.005953 0.000599 0.008252 304.09 304.09 3128.7 0.03055
Waterplane Area (m2) 406.25
Max sectional Area (m2
25.804
form factor Holtrop
Water temp (°C) 28
Density water (kg/m3) 1022.3
Viscosity (m2/s) 8.85E‐07
Roughness ks (std mm) 1.50E‐04
MAIN_HULL SIDE_HULL COMB
PEFF (kW) PEFF (kW) PEFF (kW)
0 0.0 0.0 0.0 0.0 0.0 0.0 0.0 0.0 0.0
2 1.5 0.4 2.2 0.2 4.2 6.7 7.0 6.8 7.7
4 11.5 2.6 16.7 1.7 10.5 28.9 30.3 14.7 16.6
6 36.9 8.2 53.4 5.3 19.3 78.0 81.9 26.5 29.8
8 85.0 18.8 122.6 12.3 30.9 165.8 174.0 42.3 47.5
10 172.1 35.8 243.6 24.4 45.7 313.6 329.3 64.0 71.9
12 333.0 60.4 453.9 45.4 63.9 563.2 591.4 95.8 107.6
14 627.2 94.2 815.7 81.6 86.0 983.3 1032.5 143.4 161.1
16 1002.9 138.5 1279.9 128.0 112.3 1520.2 1596.2 193.9 217.9
18 1750.0 194.6 2139.1 213.9 143.2 2496.2 2621.0 283.1 318.0
20 3302.4 263.7 3829.8 383.0 289.0 4501.8 4726.9 459.4 516.2
TOTAL BARE EFFECTIVE POWER
Individual Bare Sidehull Resistance
Main hull resistance (NAVCAD) ‐ ITTC 78 METHOD (HOLTROP PREDICTION)
Assuming there is no interference effects
R FINAL (kN) THRUST REQ (kN)
Bare hull effective power + fouling resistance (proportional change in
frictional resistance of 56%)= 10% of PEFF 15 knot wind drag
5 % Margin (account
for wave interference
effects, extra
t = .11 (From Paramarine
using HOLTROP
estimation for twin
SPEED (kt)APPENDAGE
RESISTANCE (kW)
WIND RESISTANCE
(kW)
PEFF BEFORE MARGIN
(Kw)PEFF FINAL (kW)
SIDEHULL MAINHULL TOTAL
TOTAL EFFECTIVE POWER
0
500
1000
1500
2000
2500
3000
3500
4000
0 2 4 6 8 10 12 14 16 18 20
Effective Power (kW)
Speed (knots)
Bare Hull Effective Power
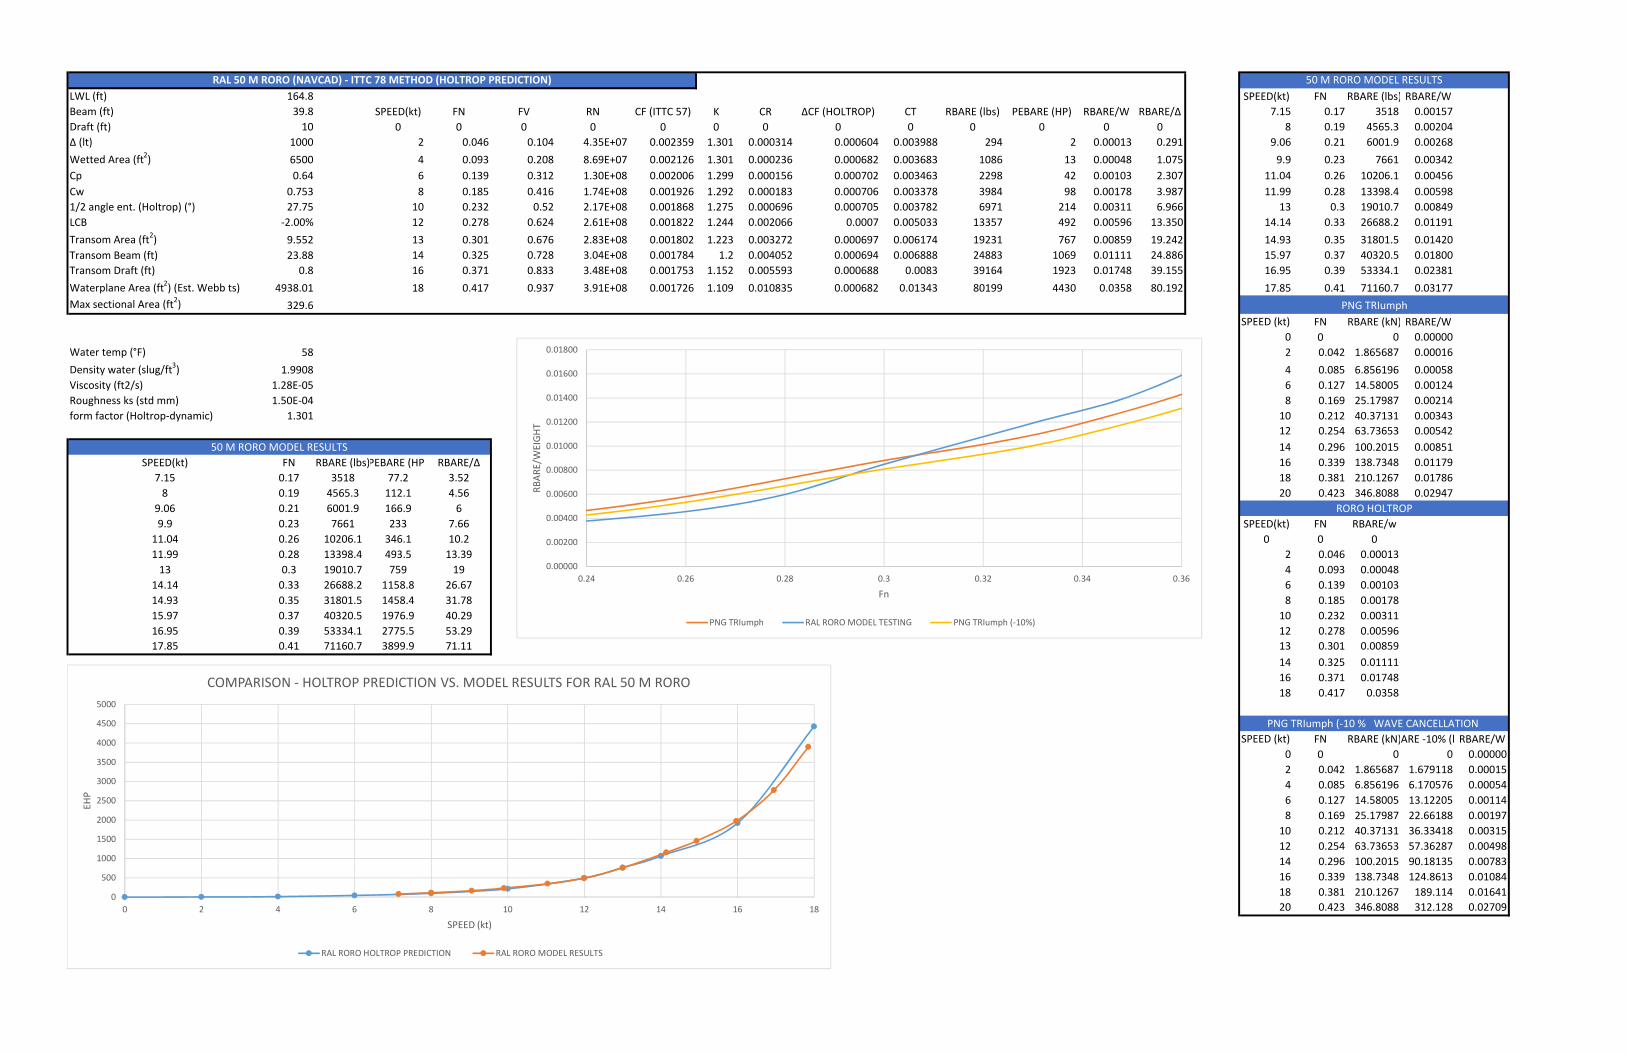
LWL (ft) 164.8 SPEED(kt) FN RBARE (lbs) RBARE/W
Beam (ft) 39.8 SPEED(kt) FN FV RN CF (ITTC 57) K CR ΔCF (HOLTROP) CT RBARE (lbs) PEBARE (HP) RBARE/W RBARE/Δ 7.15 0.17 3518 0.00157
Draft (ft) 10 0 0 0 0 0 0 0 0 0 0 0 0 0 8 0.19 4565.3 0.00204
Δ (lt) 1000 2 0.046 0.104 4.35E+07 0.002359 1.301 0.000314 0.000604 0.003988 294 2 0.00013 0.291 9.06 0.21 6001.9 0.00268
Wetted Area (ft2) 6500 4 0.093 0.208 8.69E+07 0.002126 1.301 0.000236 0.000682 0.003683 1086 13 0.00048 1.075 9.9 0.23 7661 0.00342
Cp 0.64 6 0.139 0.312 1.30E+08 0.002006 1.299 0.000156 0.000702 0.003463 2298 42 0.00103 2.307 11.04 0.26 10206.1 0.00456
Cw 0.753 8 0.185 0.416 1.74E+08 0.001926 1.292 0.000183 0.000706 0.003378 3984 98 0.00178 3.987 11.99 0.28 13398.4 0.00598
1/2 angle ent. (Holtrop) (°) 27.75 10 0.232 0.52 2.17E+08 0.001868 1.275 0.000696 0.000705 0.003782 6971 214 0.00311 6.966 13 0.3 19010.7 0.00849
LCB ‐2.00% 12 0.278 0.624 2.61E+08 0.001822 1.244 0.002066 0.0007 0.005033 13357 492 0.00596 13.350 14.14 0.33 26688.2 0.01191
Transom Area (ft2) 9.552 13 0.301 0.676 2.83E+08 0.001802 1.223 0.003272 0.000697 0.006174 19231 767 0.00859 19.242 14.93 0.35 31801.5 0.01420
Transom Beam (ft) 23.88 14 0.325 0.728 3.04E+08 0.001784 1.2 0.004052 0.000694 0.006888 24883 1069 0.01111 24.886 15.97 0.37 40320.5 0.01800
Transom Draft (ft) 0.8 16 0.371 0.833 3.48E+08 0.001753 1.152 0.005593 0.000688 0.0083 39164 1923 0.01748 39.155 16.95 0.39 53334.1 0.02381
Waterplane Area (ft2) (Est. Webb ts) 4938.01 18 0.417 0.937 3.91E+08 0.001726 1.109 0.010835 0.000682 0.01343 80199 4430 0.0358 80.192 17.85 0.41 71160.7 0.03177
Max sectional Area (ft2) 329.6
SPEED (kt) FN RBARE (kN) RBARE/W
0 0 0 0.00000
Water temp (°F) 58 2 0.042 1.865687 0.00016
Density water (slug/ft3) 1.9908 4 0.085 6.856196 0.00058
Viscosity (ft2/s) 1.28E‐05 6 0.127 14.58005 0.00124
Roughness ks (std mm) 1.50E‐04 8 0.169 25.17987 0.00214
form factor (Holtrop‐dynamic) 1.301 10 0.212 40.37131 0.00343
12 0.254 63.73653 0.00542
14 0.296 100.2015 0.00851
SPEED(kt) FN RBARE (lbs)PEBARE (HP) RBARE/Δ 16 0.339 138.7348 0.01179
7.15 0.17 3518 77.2 3.52 18 0.381 210.1267 0.01786
8 0.19 4565.3 112.1 4.56 20 0.423 346.8088 0.02947
9.06 0.21 6001.9 166.9 6
9.9 0.23 7661 233 7.66 SPEED(kt) FN RBARE/w
11.04 0.26 10206.1 346.1 10.2 0 0 0
11.99 0.28 13398.4 493.5 13.39 2 0.046 0.00013
13 0.3 19010.7 759 19 4 0.093 0.00048
14.14 0.33 26688.2 1158.8 26.67 6 0.139 0.00103
14.93 0.35 31801.5 1458.4 31.78 8 0.185 0.00178
15.97 0.37 40320.5 1976.9 40.29 10 0.232 0.00311
16.95 0.39 53334.1 2775.5 53.29 12 0.278 0.00596
17.85 0.41 71160.7 3899.9 71.11 13 0.301 0.00859
14 0.325 0.01111
16 0.371 0.01748
18 0.417 0.0358
SPEED (kt) FN RBARE (kN)ARE ‐10% (k RBARE/W
0 0 0 0 0.00000
2 0.042 1.865687 1.679118 0.00015
4 0.085 6.856196 6.170576 0.00054
6 0.127 14.58005 13.12205 0.00114
8 0.169 25.17987 22.66188 0.00197
10 0.212 40.37131 36.33418 0.00315
12 0.254 63.73653 57.36287 0.00498
14 0.296 100.2015 90.18135 0.00783
16 0.339 138.7348 124.8613 0.01084
18 0.381 210.1267 189.114 0.01641
20 0.423 346.8088 312.128 0.02709
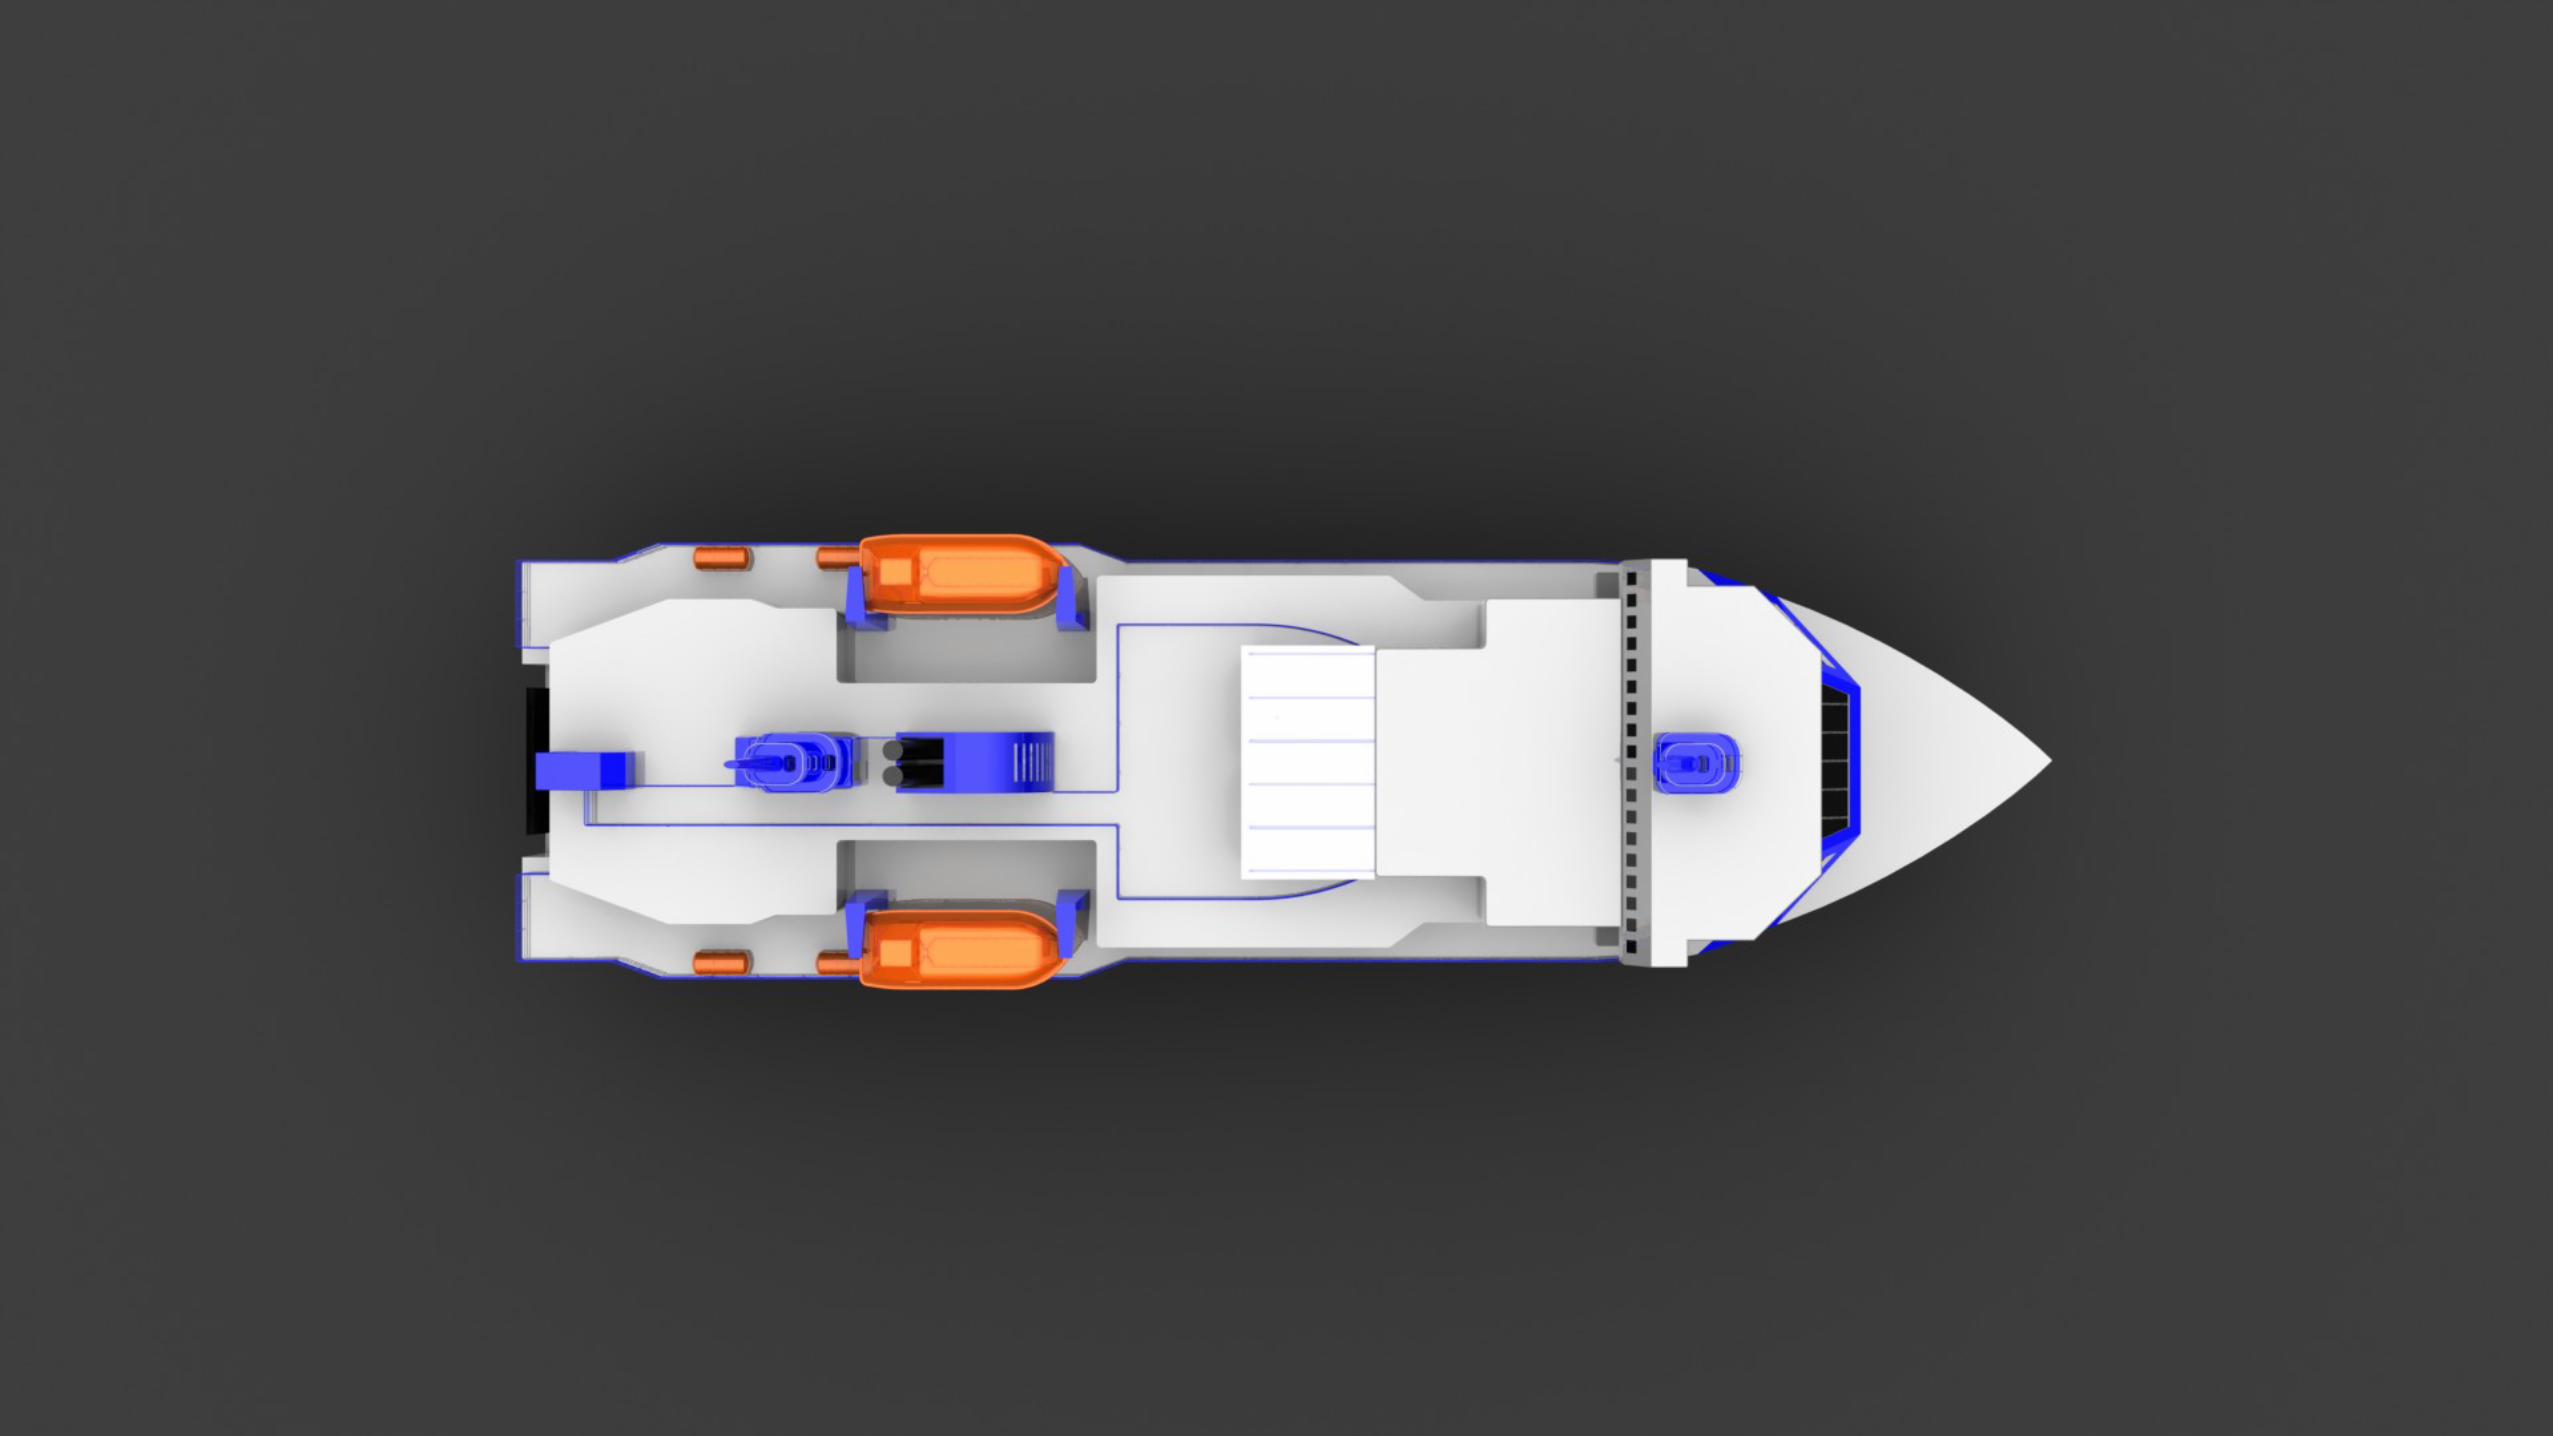
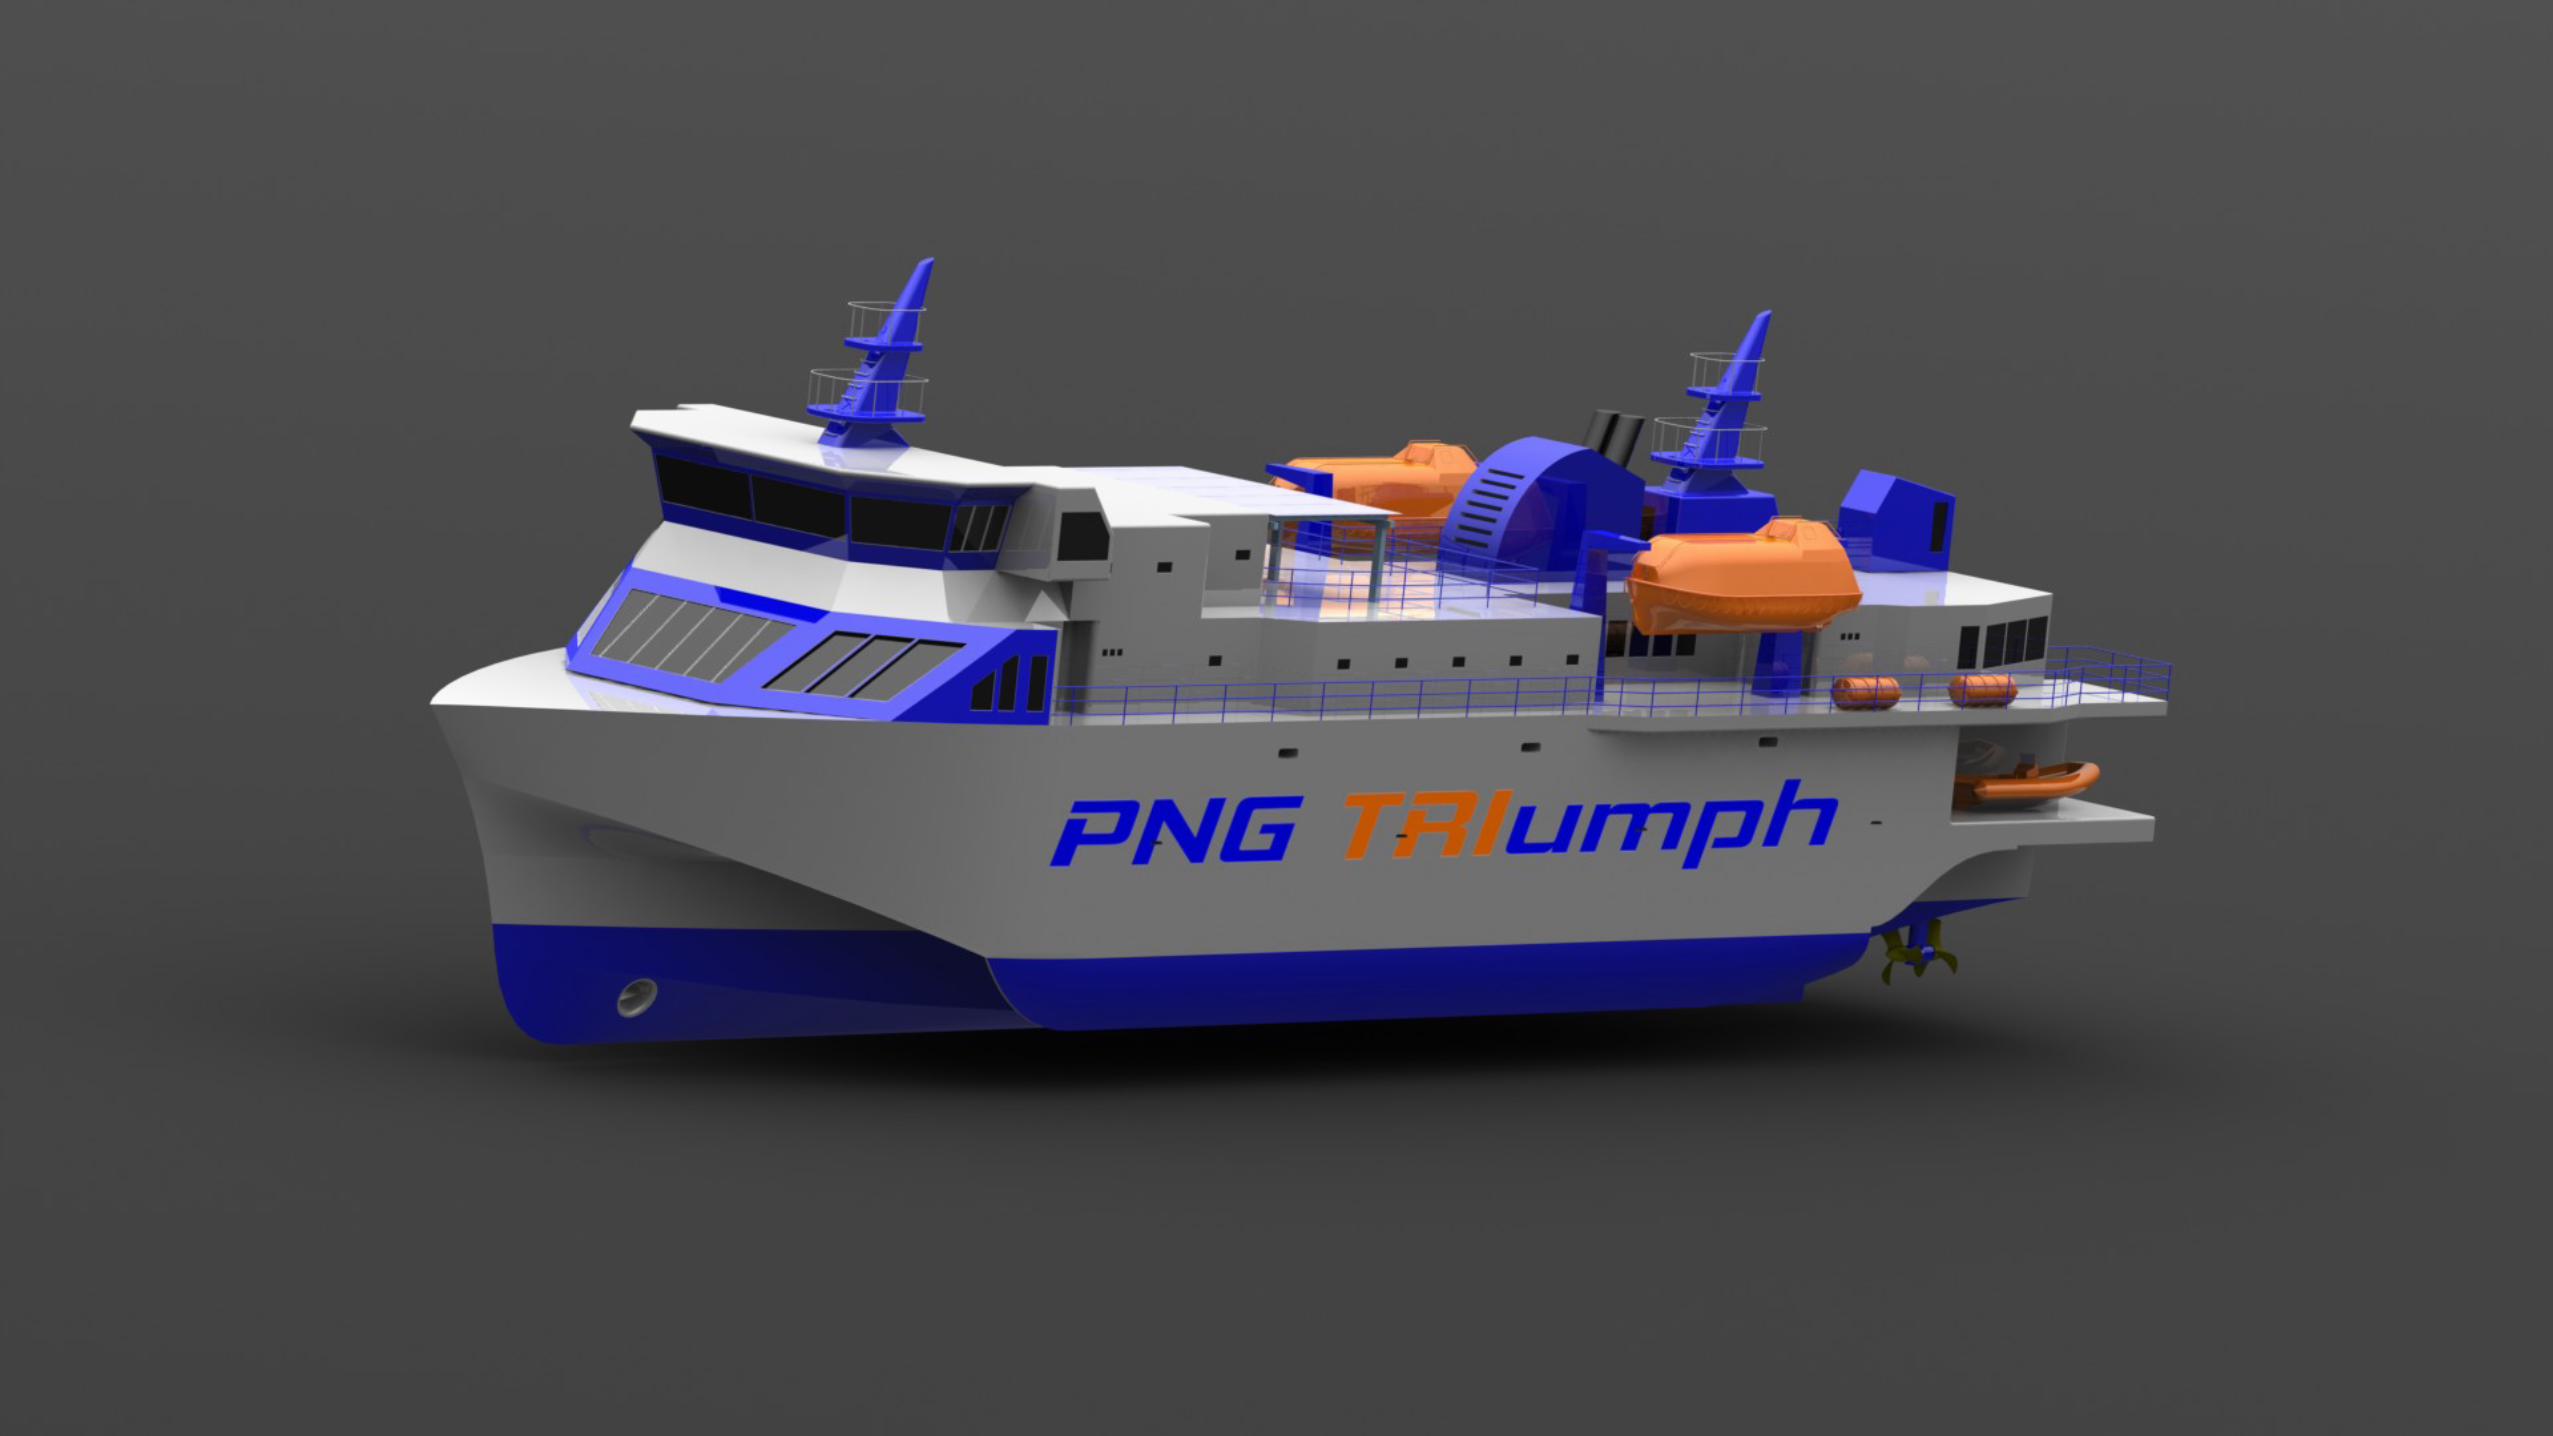
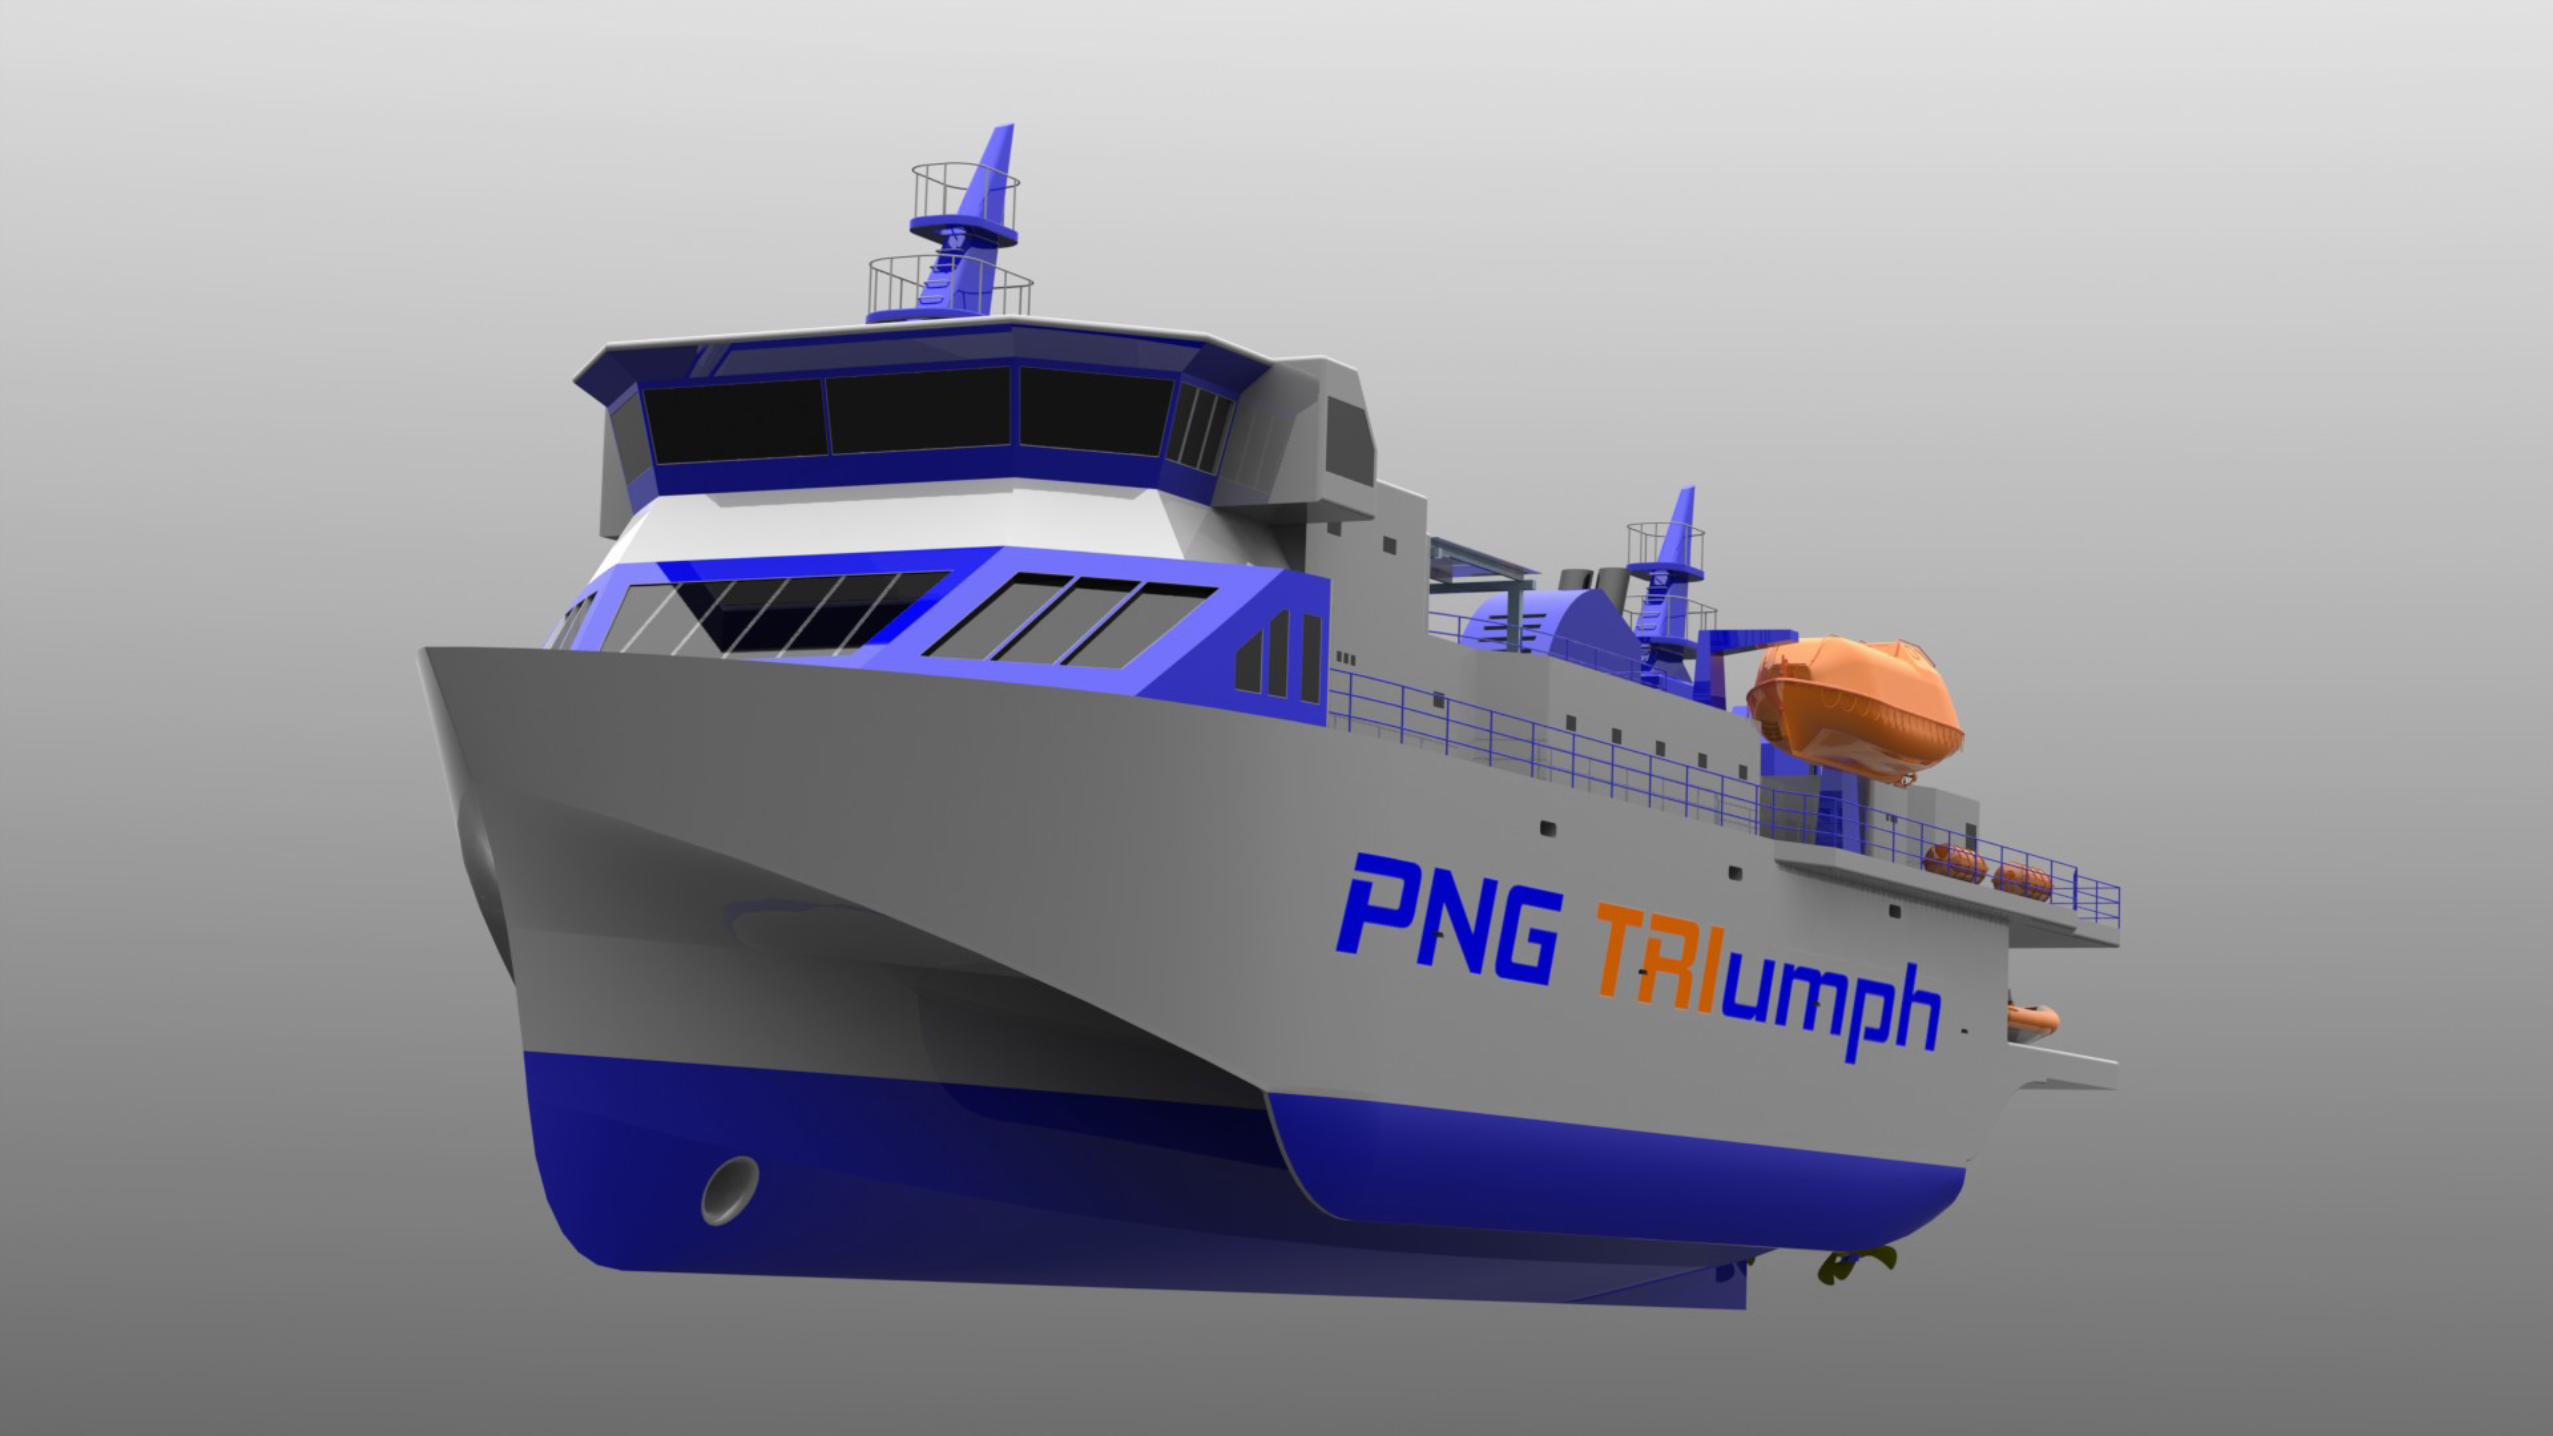
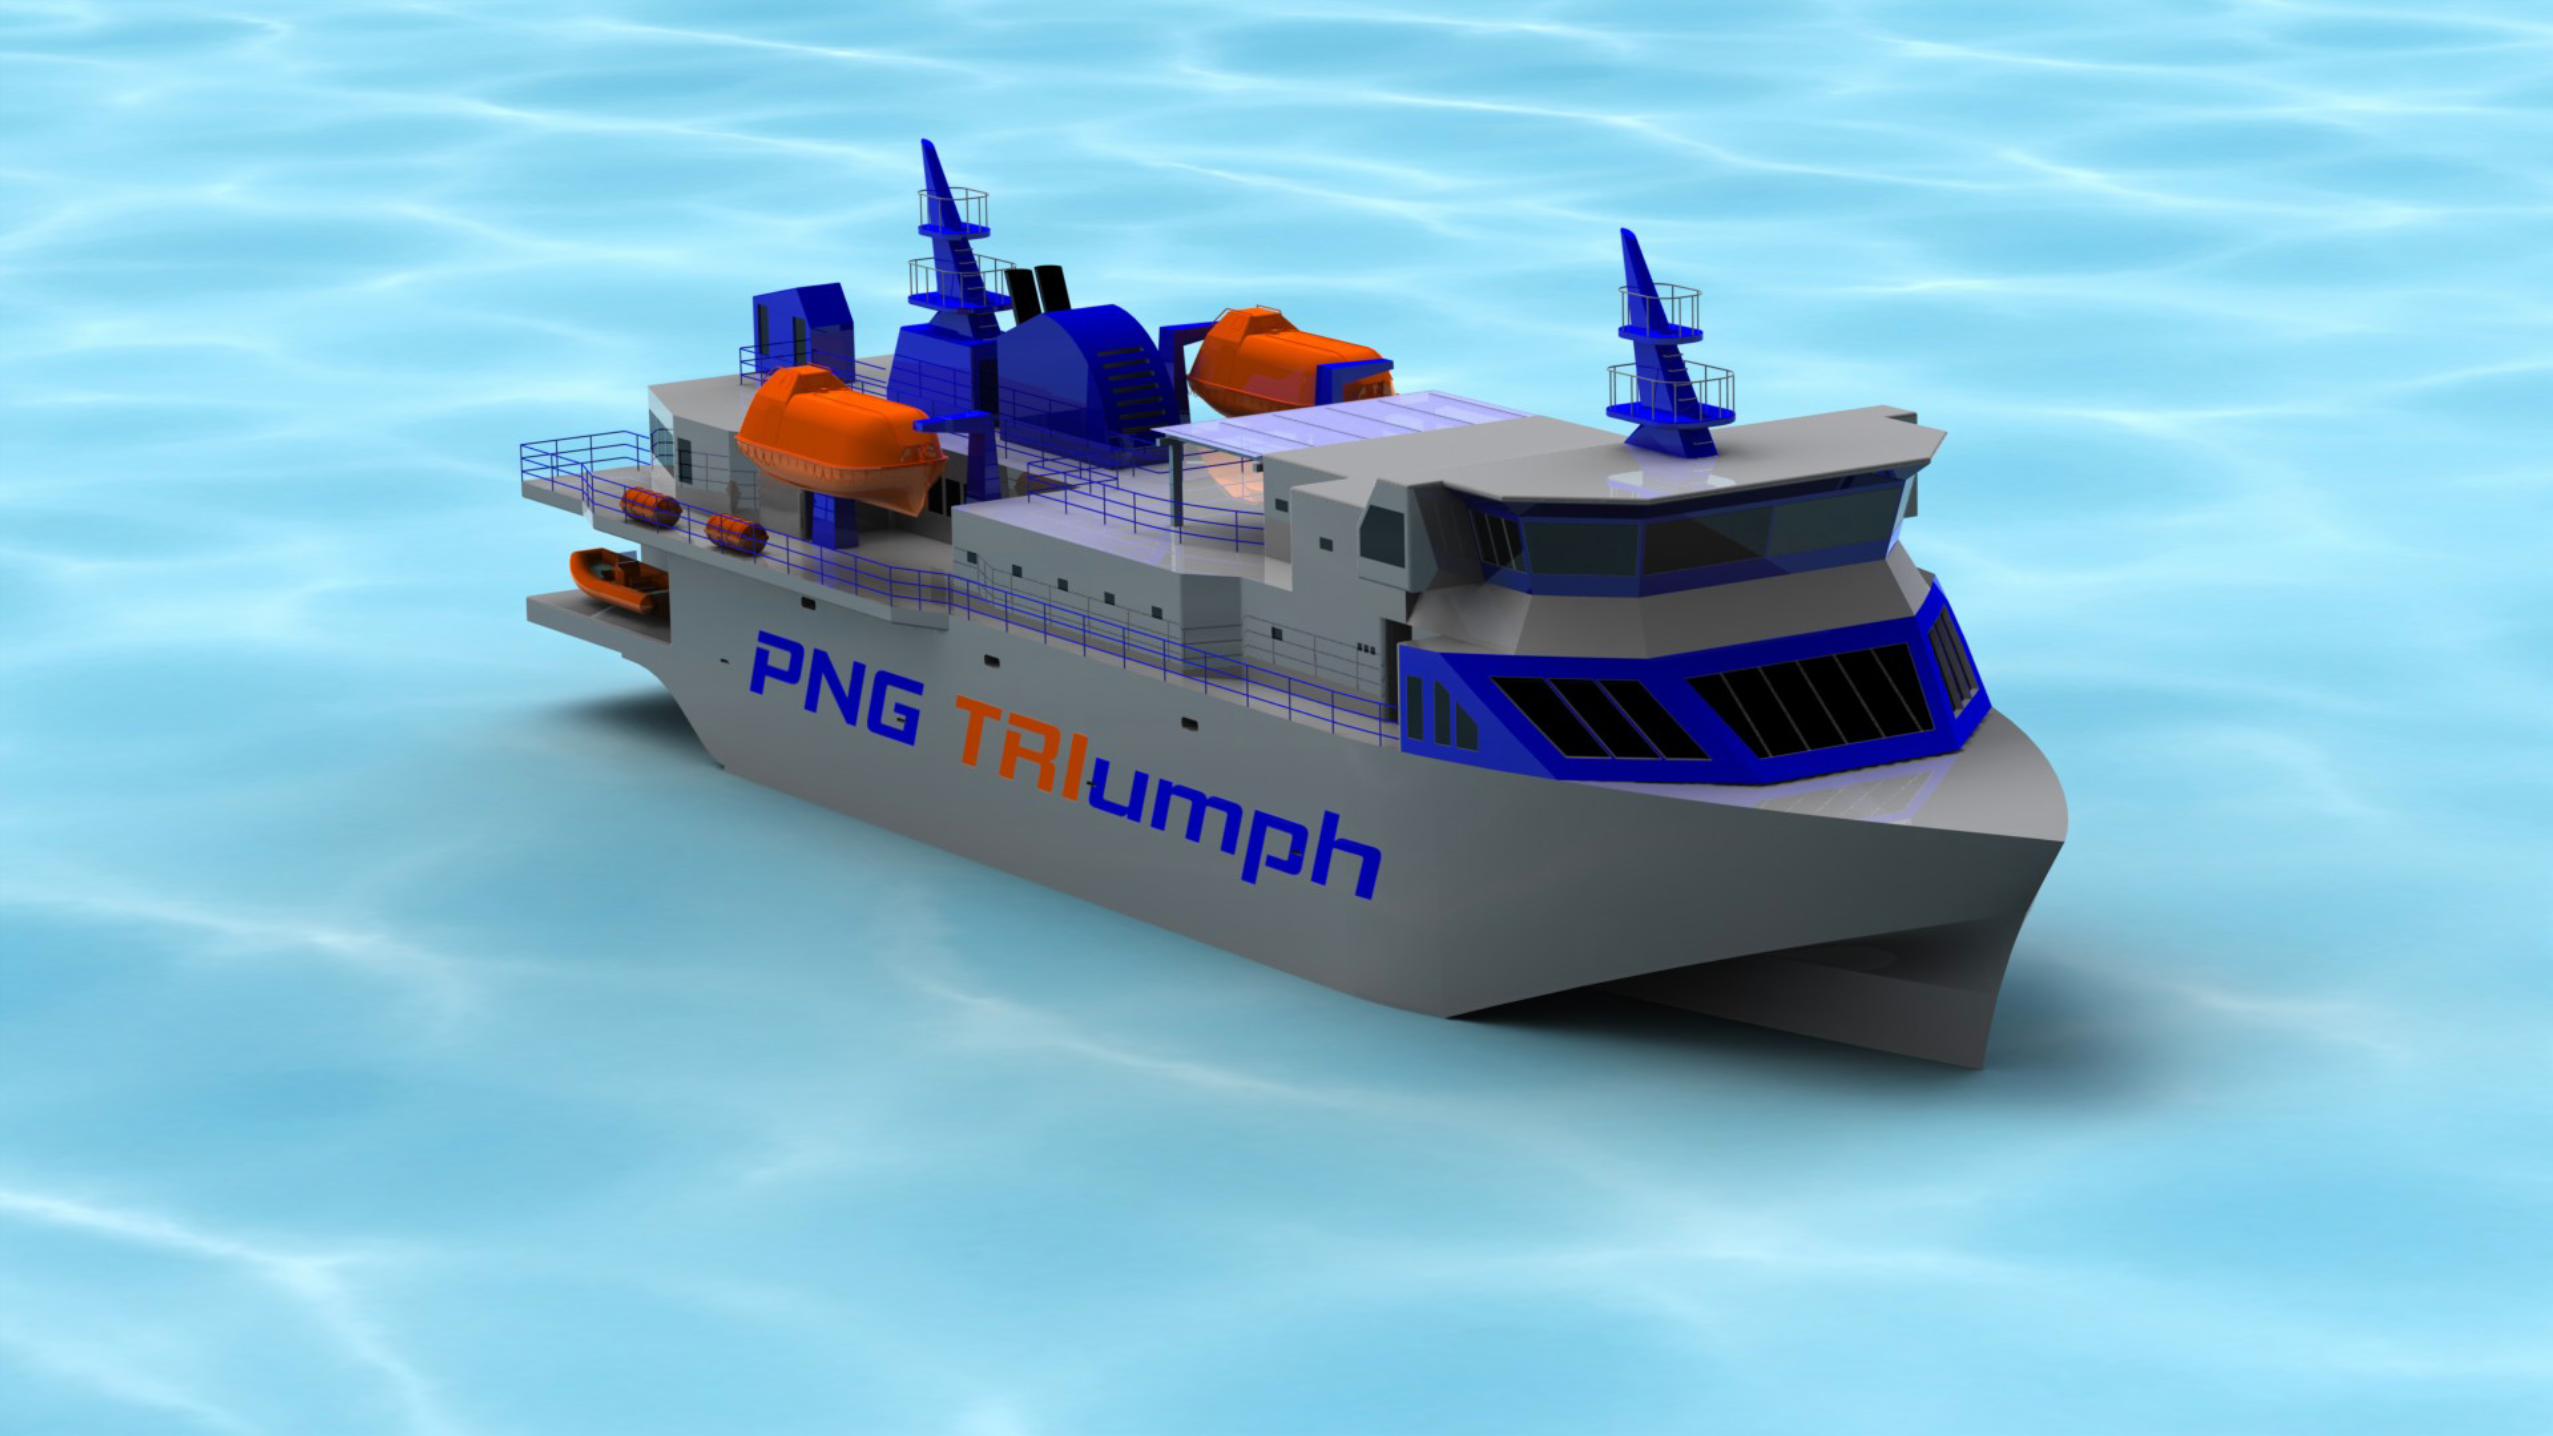
PNG TRIumph (‐10 % WAVE CANCELLATION
PNG TRIumph
RORO HOLTROP
RAL 50 M RORO (NAVCAD) ‐ ITTC 78 METHOD (HOLTROP PREDICTION)
50 M RORO MODEL RESULTS
50 M RORO MODEL RESULTS
0
500
1000
1500
2000
2500
3000
3500
4000
4500
5000
0 2 4 6 8 10 12 14 16 18
EHP
SPEED (kt)
COMPARISON ‐ HOLTROP PREDICTION VS. MODEL RESULTS FOR RAL 50 M RORO
RAL RORO HOLTROP PREDICTION RAL RORO MODEL RESULTS
0.00000
0.00200
0.00400
0.00600
0.00800
0.01000
0.01200
0.01400
0.01600
0.01800
0.24 0.26 0.28 0.3 0.32 0.34 0.36
RBARE/WEIGHT
Fn
PNG TRIumph RAL RORO MODEL TESTING PNG TRIumph (‐10%)
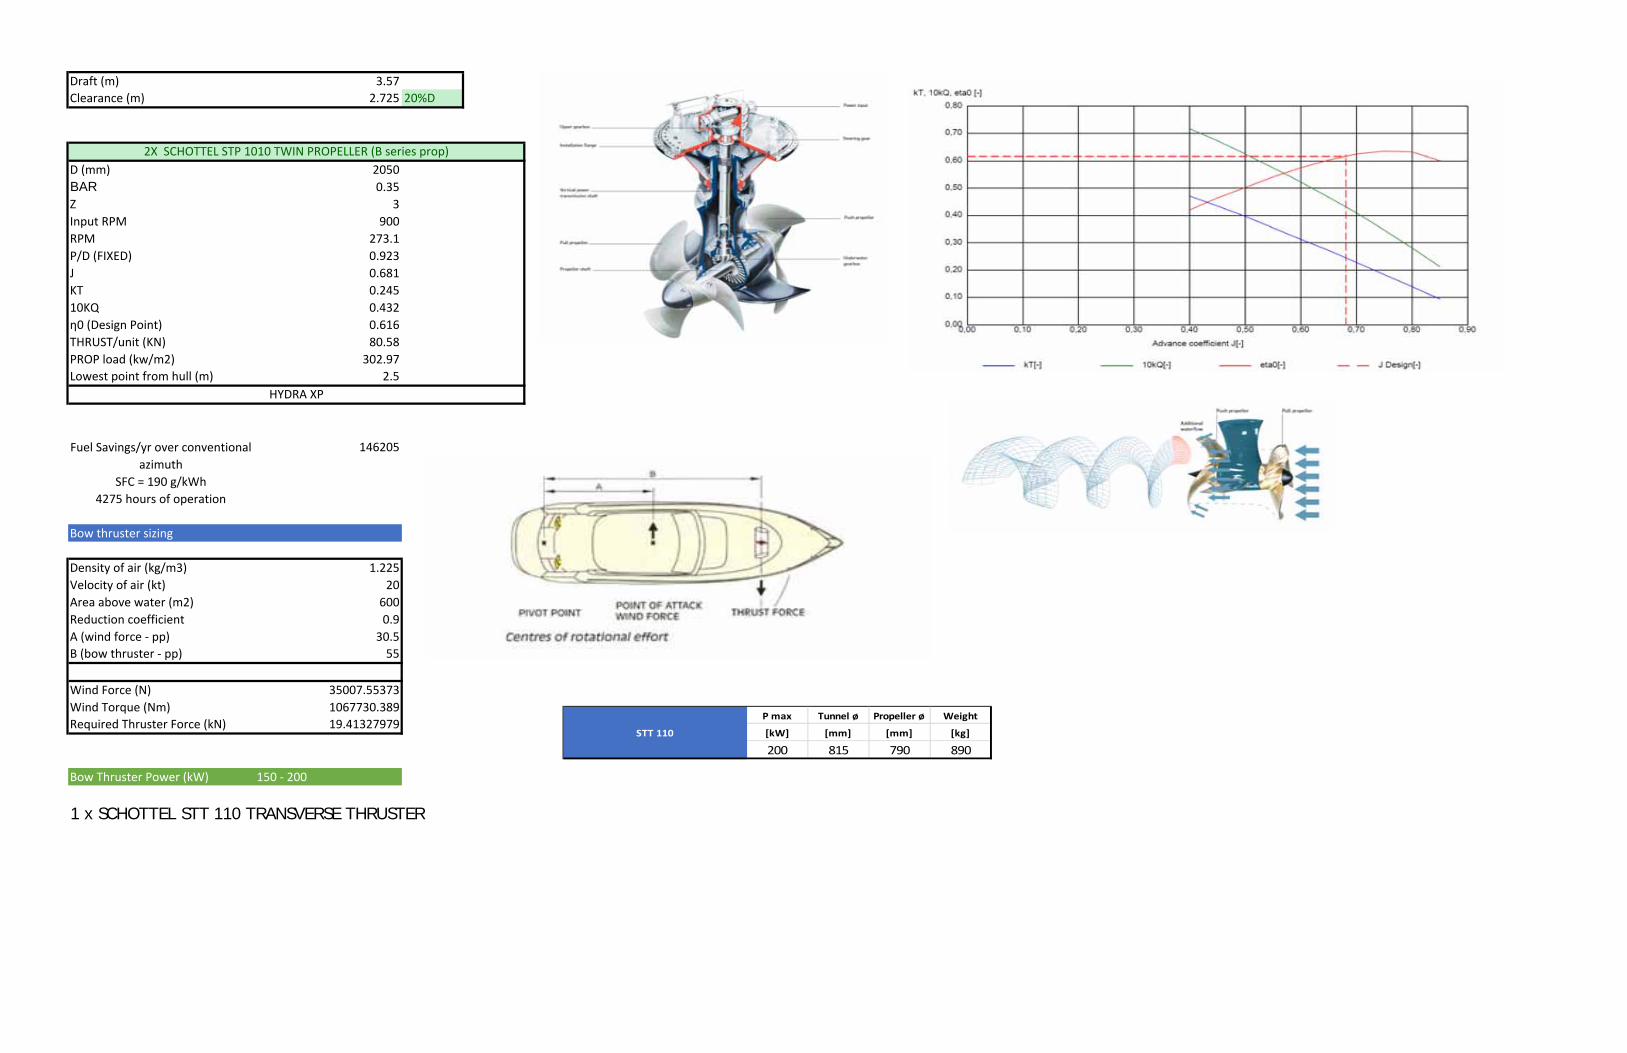
Draft (m) 3.57
Clearance (m) 2.725 20%D
D (mm) 2050
BAR 0.35
Z 3
Input RPM 900
RPM 273.1
P/D (FIXED) 0.923
J 0.681
KT 0.245
10KQ 0.432
η0 (Design Point) 0.616
THRUST/unit (KN) 80.58
PROP load (kw/m2) 302.97
Lowest point from hull (m) 2.5
146205
Bow thruster sizing
Density of air (kg/m3) 1.225
Velocity of air (kt) 20
Area above water (m2) 600
Reduction coefficient 0.9
A (wind force ‐ pp) 30.5
B (bow thruster ‐ pp) 55
Wind Force (N) 35007.55373
Wind Torque (Nm) 1067730.389
Required Thruster Force (kN) 19.41327979
Bow Thruster Power (kW) 150 ‐ 200
1 x SCHOTTEL STT 110 TRANSVERSE THRUSTER
2X SCHOTTEL STP 1010 TWIN PROPELLER (B series prop)
HYDRA XP
Fuel Savings/yr over conventional
azimuth
SFC = 190 g/kWh
4275 hours of operation
P max Tunnel ø Propeller ø Weight
[kW] [mm] [mm] [kg]
200 815 790 890
STT 110

SPEED (kt) PEFF FINAL (kW) η0 PSHAFT (Kw) PBRAKE (kW) (85% Load Medium Speed Diesel) (kW)
0 0.00 0.00 0.00 0.00 0
2 7.02 0.46 16.23 16.56 10
4 30.33 0.57 56.48 57.63 34
6 81.93 0.61 142.50 145.41 86
8 174.04 0.62 293.50 299.49 176
10 329.31 0.63 549.19 560.40 330
12 591.39 0.63 990.48 1010.69 595
14 1032.49 0.62 1764.33 1800.34 1059
16 1596.23 0.60 2792.61 2849.60 1676
18 2621.03 0.59 4712.83 4809.01 2829
20 4726.87 0.57 8748.45 8926.99 5251
η0 (design point) 61.6% FROM HYDRA XP
ηS 95.0%
ηR 100.0% t = .11 w = .118 From Paramarine
ηT 98.0% Difference between Manufacture output and reality
shaft losses due to gears within z‐drive and shaft bearings (From Schottel)
0.00
1000.00
2000.00
3000.00
4000.00
5000.00
6000.00
7000.00
8000.00
9000.00
10000.00
0 2 4 6 8 10 12 14 16 18 20
Requ
ired
Pow
er (k
W)
Speed (knots)
EFF POWER BRAKE POWER

Distance travelled per trip (nm) 750
Hours/trip @ 14 knots 53.57
Trips/week 2
Weeks of operation/year 42.00
Hours of operation/year 4500
Hours of operation (@14 knots) 4275
Engine MAK 6M20C CAT 3512CEngine Type Medium speed High SpeedL (m) 4.05 2.63W (m) 1.56 2.04H (m) 2.10 2.11Weight (tonnes) 10.90 7.40SFC (g/kWh) @ design condition 190.00 201.00Installed kW 1080.00 1040.00Engine cost ($/kW) 650.00 325.00Capitital Cost ($) 702000.00 338000.00Fuel/yr (2 engines) (tonnes) @ 1000 kW 1624.50 1718.55Cost of fuel/tonne ($) 950.00 950.00Fuel cost/year ($) 1543275.00 1632622.50MAK Medium Speed Capital Payback (yrs)
ENGINE COMPARISON
4.07
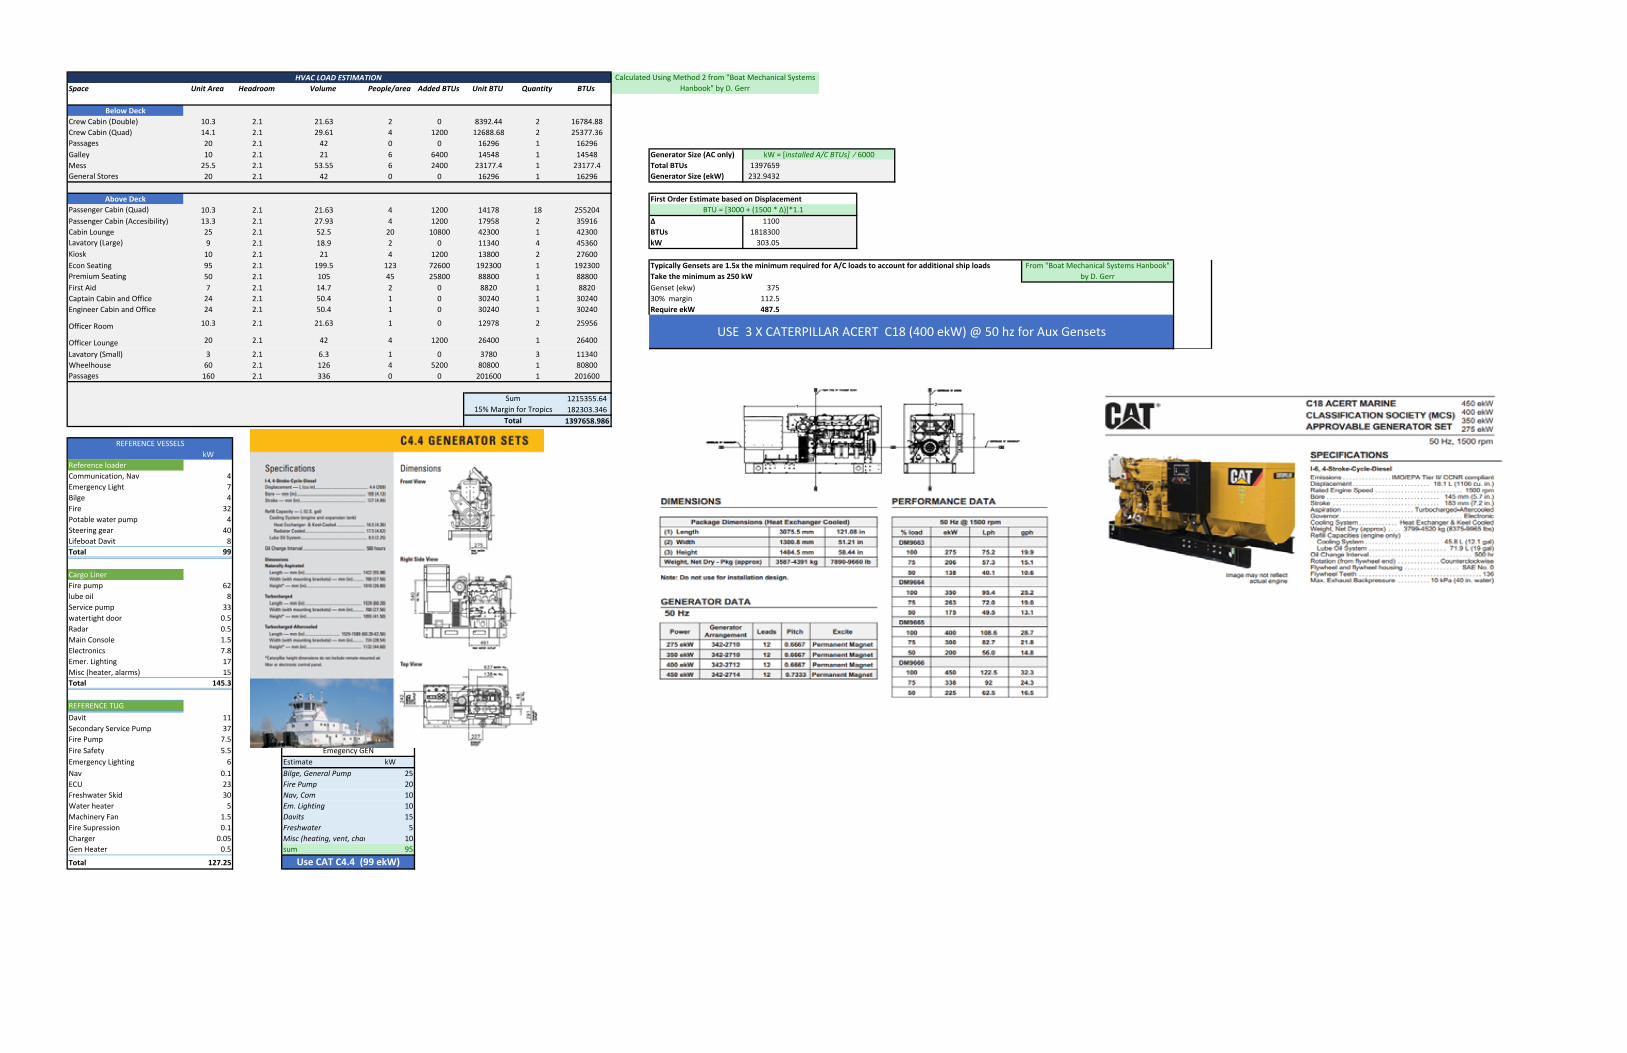
Space Unit Area Headroom Volume People/area Added BTUs Unit BTU Quantity BTUs
Below Deck
Crew Cabin (Double) 10.3 2.1 21.63 2 0 8392.44 2 16784.88
Crew Cabin (Quad) 14.1 2.1 29.61 4 1200 12688.68 2 25377.36
Passages 20 2.1 42 0 0 16296 1 16296
Galley 10 2.1 21 6 6400 14548 1 14548 Generator Size (AC only)
Mess 25.5 2.1 53.55 6 2400 23177.4 1 23177.4 Total BTUs 1397659
General Stores 20 2.1 42 0 0 16296 1 16296 Generator Size (ekW) 232.9432
Above Deck First Order Estimate based on Displacement
Passenger Cabin (Quad) 10.3 2.1 21.63 4 1200 14178 18 255204
Passenger Cabin (Accesibility) 13.3 2.1 27.93 4 1200 17958 2 35916 ∆ 1100
Cabin Lounge 25 2.1 52.5 20 10800 42300 1 42300 BTUs 1818300
Lavatory (Large) 9 2.1 18.9 2 0 11340 4 45360 kW 303.05
Kiosk 10 2.1 21 4 1200 13800 2 27600
Econ Seating 95 2.1 199.5 123 72600 192300 1 192300
Premium Seating 50 2.1 105 45 25800 88800 1 88800
First Aid 7 2.1 14.7 2 0 8820 1 8820 Genset (ekw) 375
Captain Cabin and Office 24 2.1 50.4 1 0 30240 1 30240 30% margin 112.5
Engineer Cabin and Office 24 2.1 50.4 1 0 30240 1 30240 Require ekW 487.5
Officer Room 10.3 2.1 21.63 1 0 12978 2 25956
Officer Lounge 20 2.1 42 4 1200 26400 1 26400
Lavatory (Small) 3 2.1 6.3 1 0 3780 3 11340
Wheelhouse 60 2.1 126 4 5200 80800 1 80800
Passages 160 2.1 336 0 0 201600 1 201600
1215355.64
182303.346
1397658.986
kW
Reference loader
Communication, Nav 4
Emergency Light 7
Bilge 4
Fire 32
Potable water pump 4
Steering gear 40
Lifeboat Davit 8
Total 99
Cargo Liner
Fire pump 62
lube oil 8
Service pump 33
watertight door 0.5
Radar 0.5
Main Console 1.5
Electronics 7.8
Emer. Lighting 17
Misc (heater, alarms) 15
Total 145.3
REFERENCE TUG
Davit 11
Secondary Service Pump 37
Fire Pump 7.5
Fire Safety 5.5
Emergency Lighting 6 Estimate kW
Nav 0.1 Bilge, General Pump 25
ECU 23 Fire Pump 20
Freshwater Skid 30 Nav, Com 10
Water heater 5 Em. Lighting 10
Machinery Fan 1.5 Davits 15
Fire Supression 0.1 Freshwater 5
Charger 0.05 Misc (heating, vent, char 10
Gen Heater 0.5 sum 95
Total 127.25
HVAC LOAD ESTIMATION Calculated Using Method 2 from "Boat Mechanical Systems
Hanbook" by D. Gerr
kW = [installed A/C BTUs] ∕ 6000
BTU = [3000 + (1500 * ∆)]*1.1
Typically Gensets are 1.5x the minimum required for A/C loads to account for additional ship loads
REFERENCE VESSELS
Emegency GEN
Use CAT C4.4 (99 ekW)
From "Boat Mechanical Systems Hanbook"
by D. GerrTake the minimum as 250 kW
USE 3 X CATERPILLAR ACERT C18 (400 ekW) @ 50 hz for Aux Gensets
Sum
15% Margin for Tropics
Total
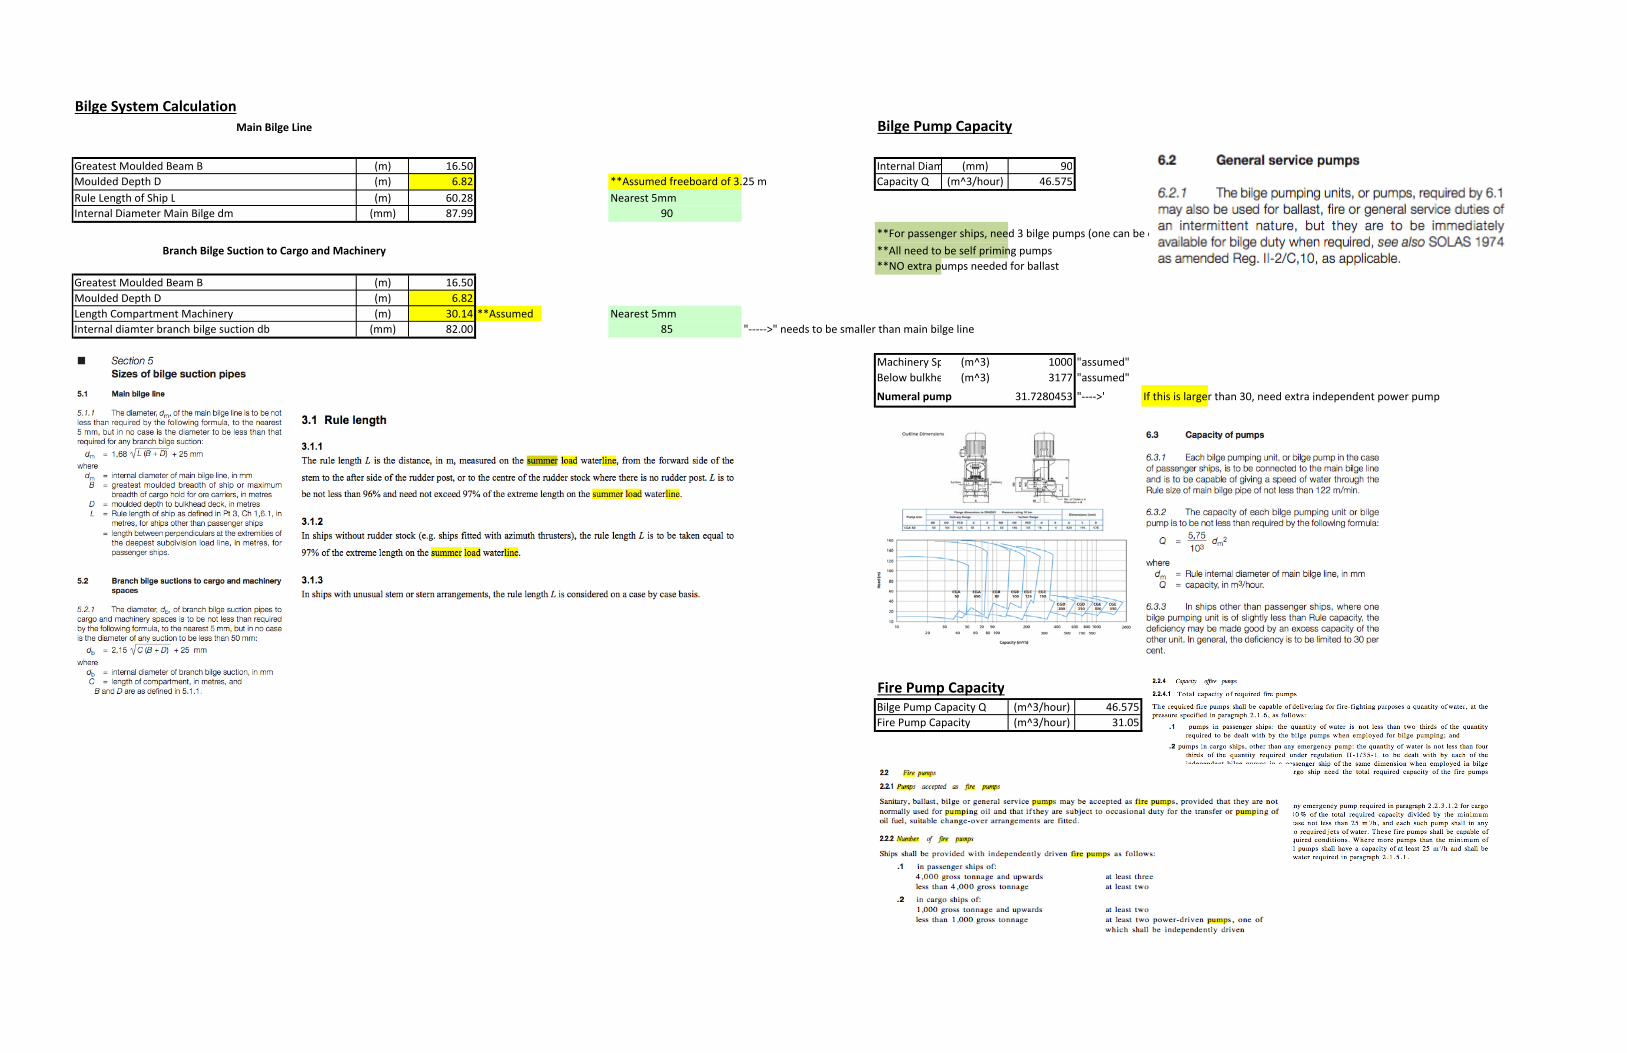
Bilge System CalculationBilge Pump Capacity
Greatest Moulded Beam B (m) 16.50 Internal Diam (mm) 90
Moulded Depth D (m) 6.82 **Assumed freeboard of 3.25 m Capacity Q (m^3/hour) 46.575
Rule Length of Ship L (m) 60.28 Nearest 5mm
Internal Diameter Main Bilge dm (mm) 87.99 90
**For passenger ships, need 3 bilge pumps (one can be operated off engine)
**All need to be self priming pumps
**NO extra pumps needed for ballast
Greatest Moulded Beam B (m) 16.50
Moulded Depth D (m) 6.82
Length Compartment Machinery (m) 30.14 **Assumed Nearest 5mm
Internal diamter branch bilge suction db (mm) 82.00 85 "‐‐‐‐‐>" needs to be smaller than main bilge line
Machinery Sp (m^3) 1000 "assumed"
Below bulkhe (m^3) 3177 "assumed"
Numeral pump 31.7280453 "‐‐‐‐>' If this is larger than 30, need extra independent power pump
Pump
4 x Wartsill 50 m3/hour
Fire Pump CapacityBilge Pump Capacity Q (m^3/hour) 46.575
Fire Pump Capacity (m^3/hour) 31.05
****1 x Wartsilla CGA50
+ bilge pump 50 m3/hour
Main Bilge Line
Branch Bilge Suction to Cargo and Machinery
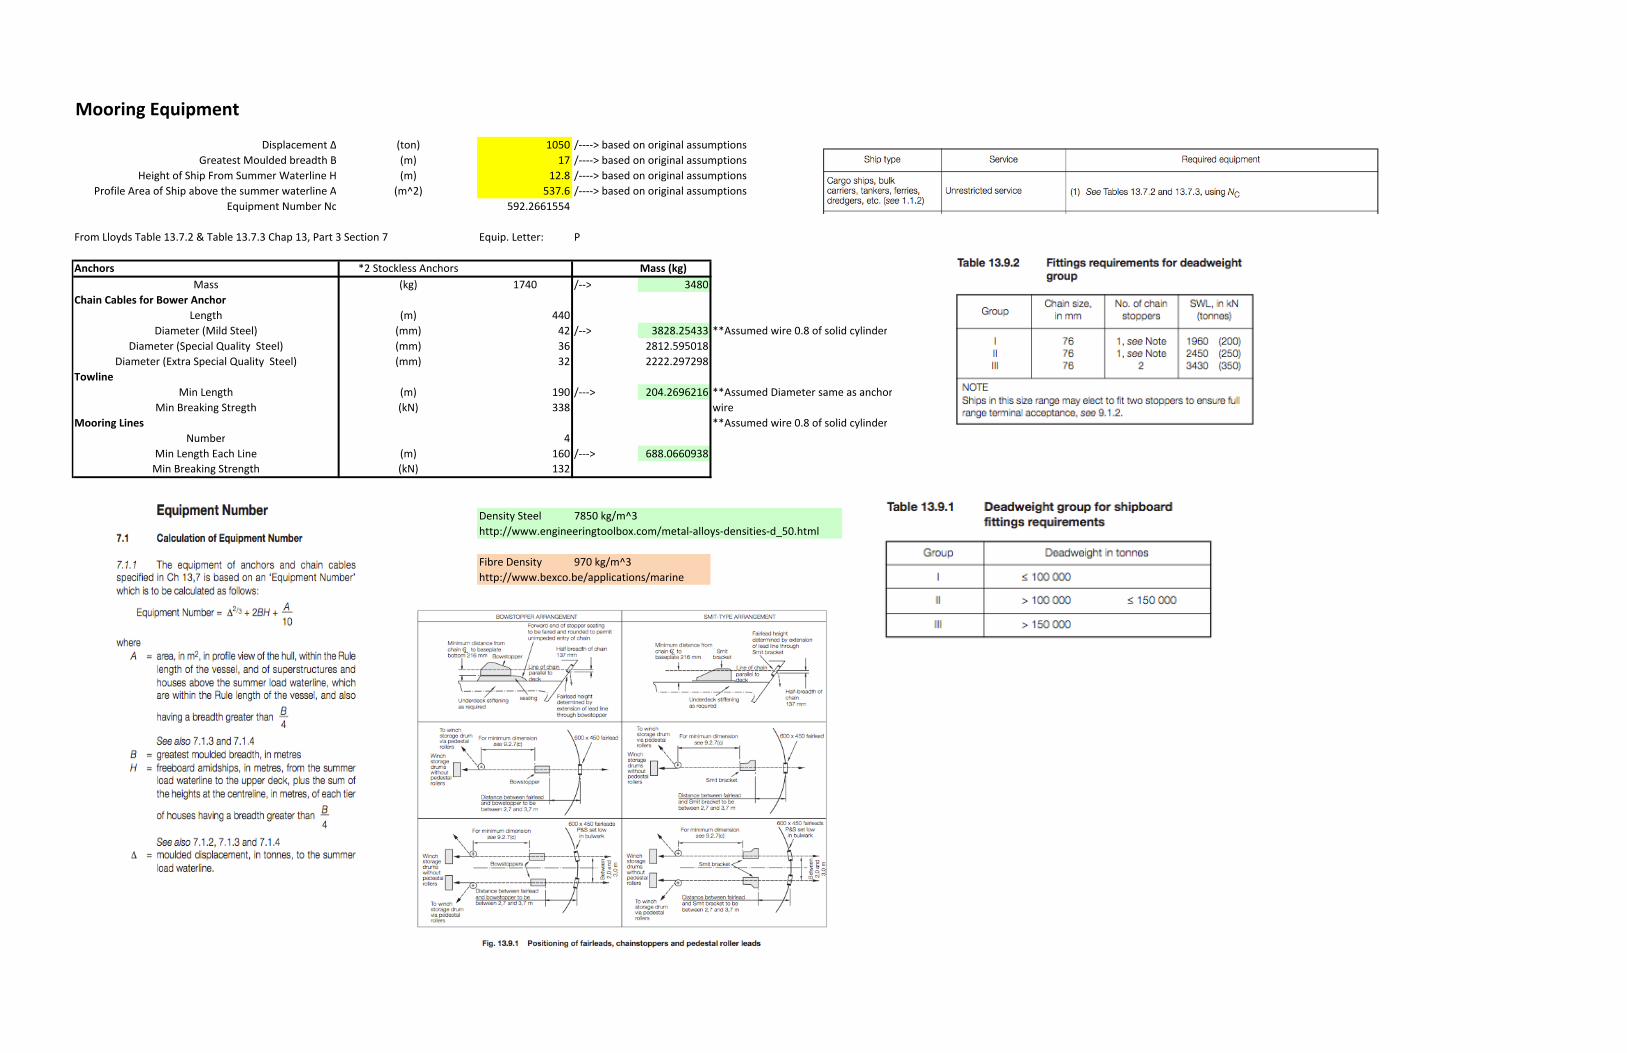
Mooring Equipment
Displacement Δ (ton) 1050 /‐‐‐‐> based on original assumptions
Greatest Moulded breadth B (m) 17 /‐‐‐‐> based on original assumptions
Height of Ship From Summer Waterline H (m) 12.8 /‐‐‐‐> based on original assumptions
Profile Area of Ship above the summer waterline A (m^2) 537.6 /‐‐‐‐> based on original assumptions
Equipment Number Nc 592.2661554
From Lloyds Table 13.7.2 & Table 13.7.3 Chap 13, Part 3 Section 7 Equip. Letter: P
Anchors *2 Stockless Anchors Mass (kg)
Mass (kg) 1740 /‐‐> 3480
Chain Cables for Bower Anchor
Length (m) 440
Diameter (Mild Steel) (mm) 42 /‐‐> 3828.25433 **Assumed wire 0.8 of solid cylinder
Diameter (Special Quality Steel) (mm) 36 2812.595018
Diameter (Extra Special Quality Steel) (mm) 32 2222.297298
Towline
Min Length (m) 190 /‐‐‐> 204.2696216 **Assumed Diameter same as anchor
Min Breaking Stregth (kN) 338 wire
Mooring Lines **Assumed wire 0.8 of solid cylinder
Number 4
Min Length Each Line (m) 160 /‐‐‐> 688.0660938
Min Breaking Strength (kN) 132
Density Steel 7850 kg/m^3
http://www.engineeringtoolbox.com/metal‐alloys‐densities‐d_50.html
Fibre Density 970 kg/m^3
http://www.bexco.be/applications/marine
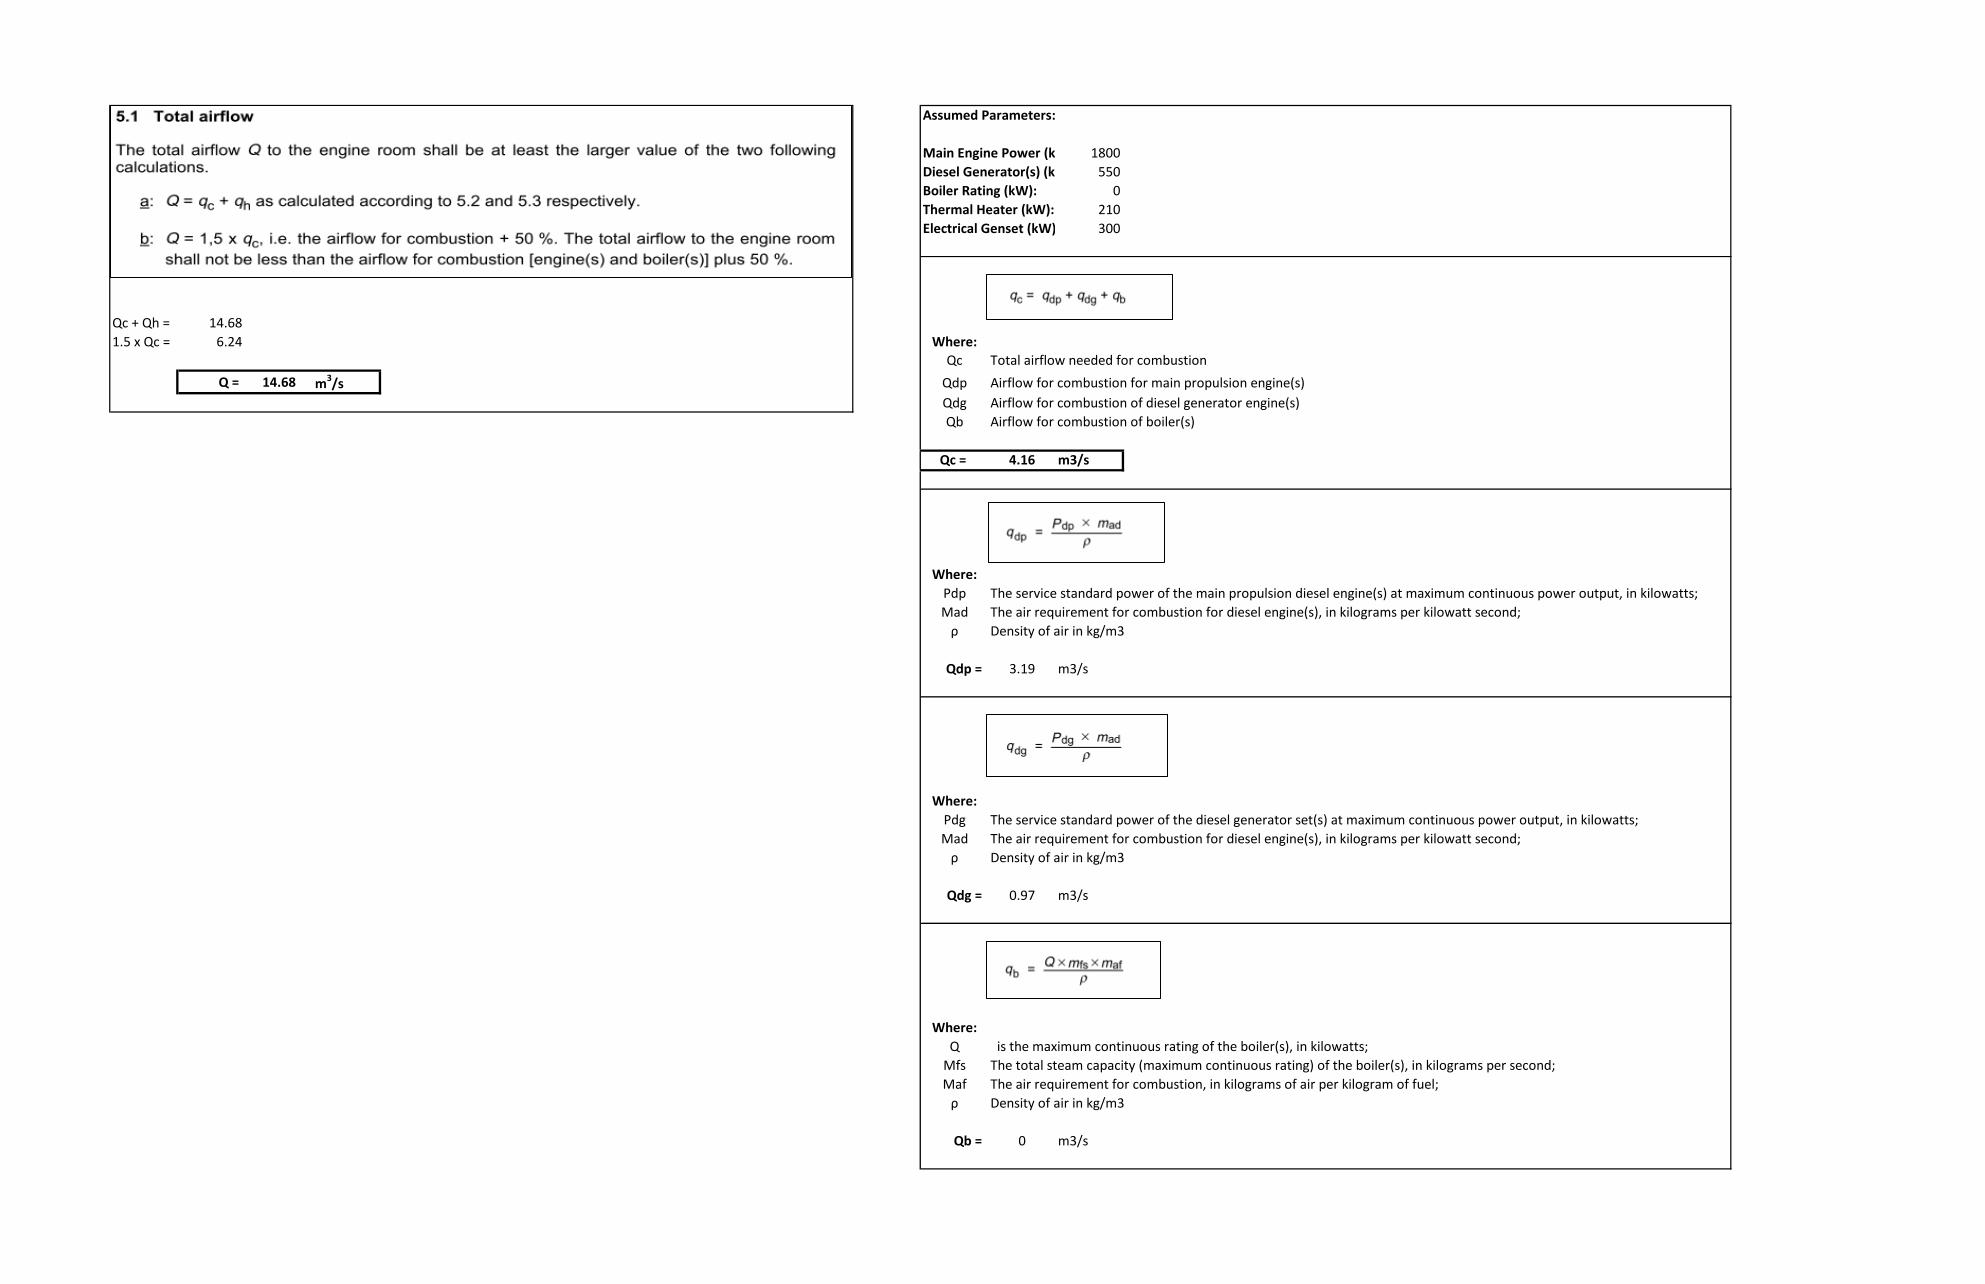
Assumed Parameters:
Main Engine Power (kW): 1800
Diesel Generator(s) (kW): 550
Boiler Rating (kW): 0
Thermal Heater (kW): 210
Electrical Genset (kW): 300
Qc + Qh = 14.68
1.5 x Qc = 6.24 Where:
Qc Total airflow needed for combustion
Q = 14.68 m3/s Qdp Airflow for combustion for main propulsion engine(s)
Qdg Airflow for combustion of diesel generator engine(s)
Qb Airflow for combustion of boiler(s)
Qc = 4.16 m3/s
Where:
Pdp The service standard power of the main propulsion diesel engine(s) at maximum continuous power output, in kilowatts;
Mad The air requirement for combustion for diesel engine(s), in kilograms per kilowatt second;
ρ Density of air in kg/m3
Qdp = 3.19 m3/s
Where:
Pdg The service standard power of the diesel generator set(s) at maximum continuous power output, in kilowatts;
Mad The air requirement for combustion for diesel engine(s), in kilograms per kilowatt second;
ρ Density of air in kg/m3
Qdg = 0.97 m3/s
Where:
Q is the maximum continuous rating of the boiler(s), in kilowatts;
Mfs The total steam capacity (maximum continuous rating) of the boiler(s), in kilograms per second;
Maf The air requirement for combustion, in kilograms of air per kilogram of fuel;
ρ Density of air in kg/m3
Qb = 0 m3/s

Where:
fdp is the heat emission from main propulsion diesel engine(s), in kilowatts (see 6.1);
fdg is the heat emission from diesel generator engine(s), in kilowatts (see 6.2);
fb is the heat emission from boilers and thermal fluid heaters, in kilowatts (see 6.3);
fp is the heat emission from steam and condensate pipes, in kilowatts (see 6.4);
fg is the heat emission from electrical air-cooled generator(s), in kilowatts (see 6.5);
fel is the heat emission from electrical installations, in kilowatts (see 6.6);
fep is the heat emission from exhaust pipes including exhaust gas-fired boilers, in kilowatt (see 6.7);
ft is the heat emission from hot tanks, in kilowatts (see 6.8);
fo is the heat emission from other components, in kilowatts (see 6.9);
Qdp Airflow for combustion for main propulsion engine(s)
Qdg Airflow for combustion of diesel generator engine(s)
Qb Airflow for combustion of boiler(s)
Where:
Pdp The service standard power of the main propulsion diesel engine(s) at maximum continuous rating, in kilowatts;
Dhd The heat loss from the diesel engine(s), in percentage;
NOTE — Where specific data are not available, fdp according to 7.1 may be used for calculation.
fdp = 75.23 kW
fdg = 32.81 kW
Where:
Q The maximum continuous rating of the thermal fluid heater or boiler in kilowatts;
B1 A constant that applies to the location of the boiler(s) in the engine room;
Dhb The heat loss, in percentage, at the maximum continuous rating of the thermal fluid heater;
fb = 0.23 kW
fp = 0 kW
NOTE: No steam pipes are operating in this vessel.
Where:
Pg The power of installed air-cooled generator(s), in kilowatts (stand-by sets shall be ignored);
h The generator efficiency, in percentage;
fg = 18 kW
NOTE: When no info is known, emission is taken as 20% of the rated power of the electrical apparatus and lighting that are in use in the area;
fel = 1 kW (Completely assumed value)
NOTE: Exhaust gas pipes and exhaust gas-fired boiler(s) situated in the casing and funnel shall not betaken into account.
NOTE: Length of exhaust pipes not known at the moment.
fep = 0 kW
Dimensions (B x L x H)
1.32 x 2 x 1.47 60
0.6 x 0.6 x 0.6 100
ft(1) = 1.35 kW
ft(2) = 0.17 kW
ft = 1.53 kW
fo = 45 kW (assumed gearbox efficiency of 2.5%)
fi = 173.79 kW
ρ 1.13 kg/m3
c 1.01 kJ/kgK
DT 12.5 K
Qdp 3.19 m3/s
Qdg 0.97 m3/s
Qb 0 m3/s
Qh 10.52 m3/s
From graph in 7.1 for assumed propulsion power:
From graph in 7.1 for assumed generator power:
Tank
Hot Water Tank
Lube oil Tank
Surface Area
9.66
2.16
Temperature

Use Required Flow (CFM) Model Quantity Diameter (m) Capacity (CFM) Power
Engine & Gen Sets 8815.00 Cincinnati 18-4-30 2 0.46 4837 0.76
Ventilation 22300.00 Cincinnati 36-6-26 1 0.92 24430 6.1
Sizing of Exhaust Pipe
For assumed engine Parameters we have (following Wartsilla and Caterpillar design guides):
V max = 40 m/s
m = 3.6 kg/s
t = 335 C
D = 0.44 m Use D = 0.40 m
D = 0.40 m V = 49.08 m/s
Sizing of Exhaust Silencer
Selecting for DN = 0.40 m Parameter Value Unit
For 25dB attenuation: D = 1.06 m
A = 1.5 m
B = 0.15 m
L = 3.28 m
W = 570 kg
Source: http://www.cincinnatifan.com/catalogs/Tube-Axial-internet.pdf

Particular Value Units
LR 57.9 m σ = 235 N/mm 2 kL , k = 1
LWL 60 m
LSH 36 m
LSHWL 36 m
B 16.5 m
BWL 16.5 m
BWLTOT 16.5 m
BSH 1.3 m
BMH 8.57 m
BMHWL 8.57 m
BSHWL 1.3 m
D 7.1 m
DSH 5.05 m
LCG ‐2.4 m
T 3.57 m
TSH 2.2 m
D 1192.33 tonnes
DMH 1070.68 tonnes
DSH 60.82 tonnes
CB 0.51 ‐
s 600 mm
S 2400 mm
Slong. 2400 mm
σmaterial 235 Mpa
(Defined in Volume 1 ‐ Section 5.2)Principle Particulars Assuming materials utilised are within specifications and standards required by Lloyd's Register.
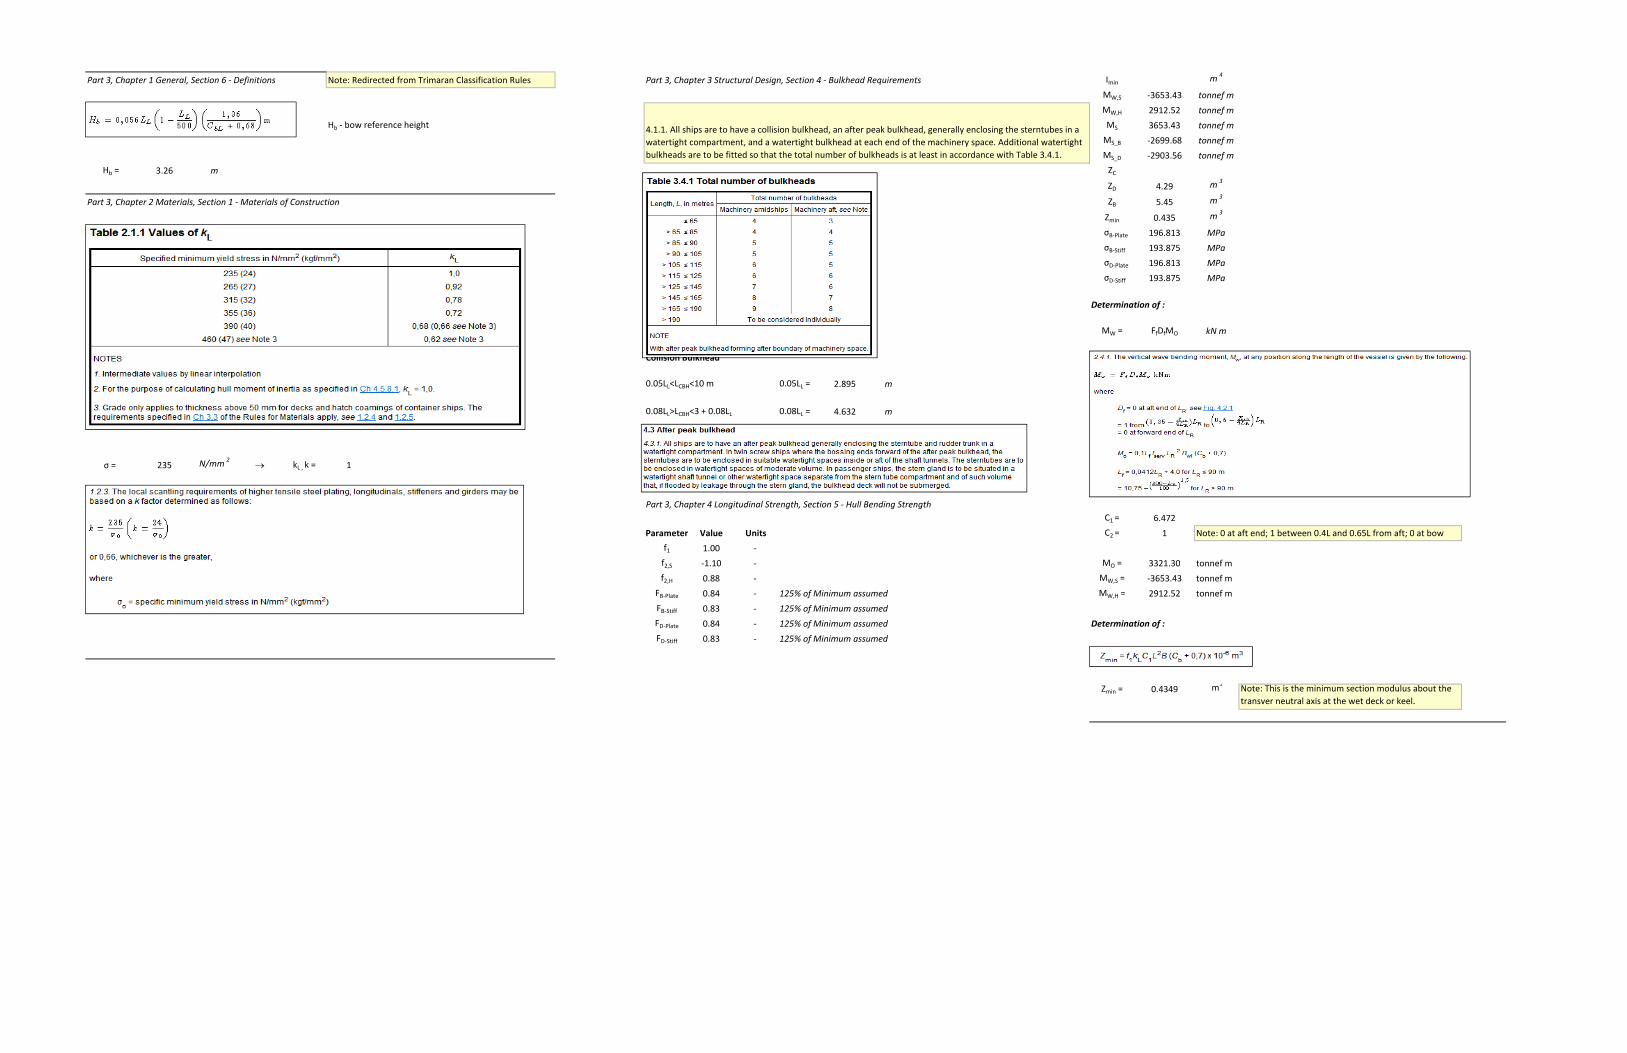
Part 3, Chapter 1 General, Section 6 ‐ Definitions Part 3, Chapter 3 Structural Design, Section 4 ‐ Bulkhead Requirements Imin m 4
MW,S ‐3653.43 tonnef m
MW,H 2912.52 tonnef m
Hb ‐ bow reference height MS 3653.43 tonnef m
MS_B ‐2699.68 tonnef m
MS_D ‐2903.56 tonnef m
Hb = 3.26 m ZC
ZD 4.29 m 3
Part 3, Chapter 2 Materials, Section 1 ‐ Materials of Construction ZB 5.45 m 3
Zmin 0.435 m 3
σB‐Plate 196.813 MPa
σB‐Stiff 193.875 MPa
σD‐Plate 196.813 MPa
σD‐Stiff 193.875 MPa
MW = FfDfMO kN m
Collision Bulkhead
0.05LL<LCBH<10 m 0.05LL = 2.895 m
0.08LL>LCBH<3 + 0.08LL 0.08LL = 4.632 m
σ = 235 N/mm 2 kL , k = 1
Part 3, Chapter 4 Longitudinal Strength, Section 5 ‐ Hull Bending Strength
C1 = 6.472
Parameter Value Units C2 = 1 Note: 0 at aft end; 1 between 0.4L and 0.65L from aft; 0 at bow
f1 1.00 ‐
f2,S ‐1.10 ‐ MO = 3321.30 tonnef m
f2,H 0.88 ‐ MW,S = ‐3653.43 tonnef m
FB‐Plate 0.84 ‐ 125% of Minimum assumed MW,H = 2912.52 tonnef m
FB‐Stiff 0.83 ‐ 125% of Minimum assumed
FD‐Plate 0.84 ‐ 125% of Minimum assumed
FD‐Stiff 0.83 ‐ 125% of Minimum assumed
Zmin = 0.4349 m3
Note: Redirected from Trimaran Classification Rules
Determination of :
Note: This is the minimum section modulus about the
transver neutral axis at the wet deck or keel.
4.1.1. All ships are to have a collision bulkhead, an after peak bulkhead, generally enclosing the sterntubes in a
watertight compartment, and a watertight bulkhead at each end of the machinery space. Additional watertight
bulkheads are to be fitted so that the total number of bulkheads is at least in accordance with Table 3.4.1.
Determination of :
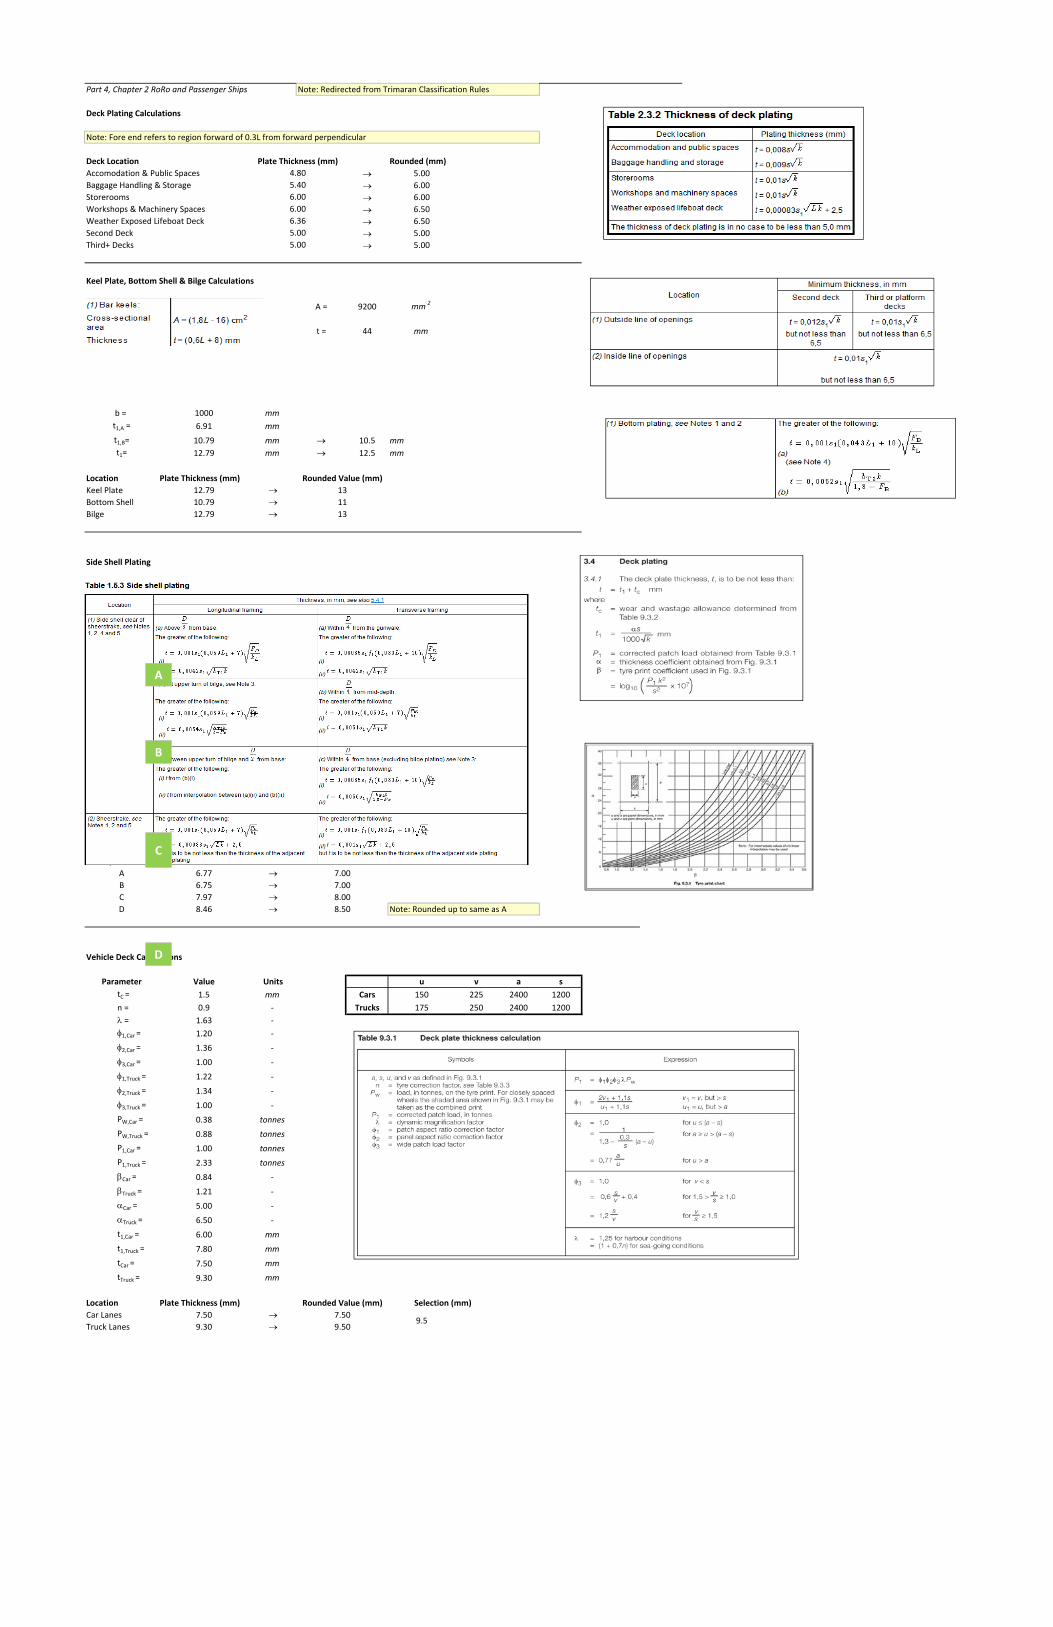
Part 4, Chapter 2 RoRo and Passenger Ships
Deck Plating Calculations
Rounded (mm)
5.00
6.00
6.00
6.50
6.50
5.00
5.00
Keel Plate, Bottom Shell & Bilge Calculations
A = 9200 mm 2
t = 44 mm
b = 1000 mm
t1,A = 6.91 mm
t1,B= 10.79 mm 10.5 mm
t1= 12.79 mm 12.5 mm
Location Plate Thickness (mm)
Keel Plate 12.79 Bottom Shell 10.79 Bilge 12.79
Side Shell Plating
Location (see
above)Plate Thickness (mm)
A 6.77 B 6.75 C 7.97 D 8.46
Vehicle Deck Calculations
Parameter Value Units u v a s
tC = 1.5 mm Cars 150 225 2400 1200
n = 0.9 ‐ Trucks 175 250 2400 1200
= 1.63 ‐
1,Car = 1.20 ‐
2,Car = 1.36 ‐
3,Car = 1.00 ‐
1,Truck = 1.22 ‐
2,Truck = 1.34 ‐
3,Truck = 1.00 ‐
PW,Car = 0.38 tonnes
PW,Truck = 0.88 tonnes
P1,Car = 1.00 tonnes
P1,Truck = 2.33 tonnes
Car = 0.84 ‐
Truck = 1.21 ‐
Car = 5.00 ‐
Truck = 6.50 ‐
t1,Car = 6.00 mm
t1,Truck = 7.80 mm
tCar = 7.50 mm
tTruck = 9.30 mm
Location Plate Thickness (mm)
Car Lanes 7.50 Truck Lanes 9.30
6.00
Note: Rounded up to same as A
6.00
9.5
Selection (mm)
Third+ Decks
5.00
5.00
Rounded Value (mm)
Rounded Value (mm)
Rounded Value (mm)
7.00
7.00
8.50
9.50
8.00
7.50
Note: Redirected from Trimaran Classification Rules
13
11
13
Note: Fore end refers to region forward of 0.3L from forward perpendicular
Deck Location
Accomodation & Public Spaces
Baggage Handling & Storage
Storerooms
Weather Exposed Lifeboat Deck
Plate Thickness (mm)
4.80
Workshops & Machinery Spaces
Second Deck
6.36
5.40
A
B
C
D
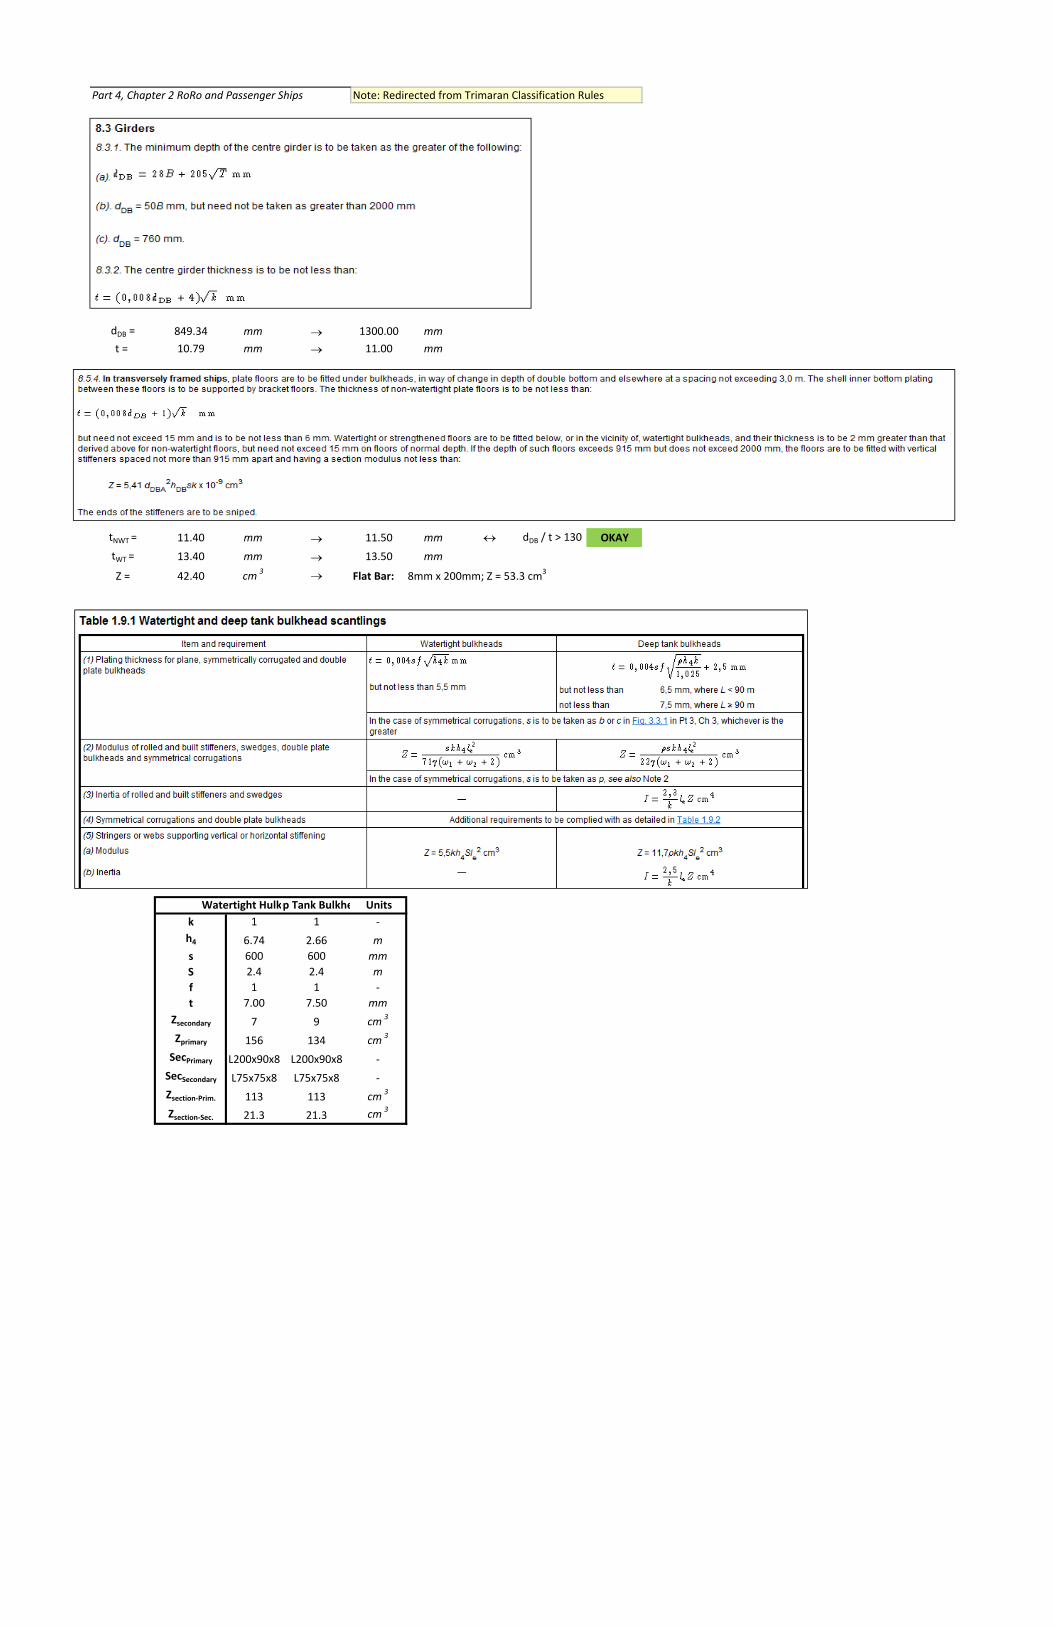
Part 4, Chapter 2 RoRo and Passenger Ships
dDB = 849.34 mm 1300.00 mm
t = 10.79 mm 11.00 mm
tNWT = 11.40 mm 11.50 mm dDB / t > 130 OKAY
tWT = 13.40 mm 13.50 mm
Z = 42.40 cm3
Watertight Hulkep Tank Bulkhe Units
k 1 1 ‐
h4 6.74 2.66 m
s 600 600 mm
S 2.4 2.4 m
f 1 1 ‐
t 7.00 7.50 mm
Zsecondary 7 9 cm3
Zprimary 156 134 cm3
SecPrimary L200x90x8 L200x90x8 ‐
SecSecondary L75x75x8 L75x75x8 ‐
Zsection‐Prim. 113 113 cm3
Zsection‐Sec. 21.3 21.3 cm3
Note: Redirected from Trimaran Classification Rules
Flat Bar: 8mm x 200mm; Z = 53.3 cm3

Part 6, Scantling Determination, Trimaran Calculations
Stiffener Properties
Primary and Secondary Stiffiners
PHYS
PRM
PPM
PHYD
IPBI
IPWI
Pd
Pdes
cZ cI f TX zK HW PHYS PRM PPM PHYD IPBI IPWI Pd Pcomb.‐Part Pdes PCombined (kPa) S,s (m,mm) lassumed (m) le le2 fσ σyd (MPa) E (N/cm2) ZREQ (cm
3) IREQ (mm4) Selection Z (cm3) I (x10
6 mm4) Mass (kg/m)
1 Main hull bottom and bilge longitudinals ‐0.10 0.0035 0.80 3.57 0.00 4.51 35.70 23.10 0.00 23.10 48.88 ‐ 9.00 58.8 107.68 1900.0000 1.10 0.88 0.77 0.75 235.00 2050.00 39.27 156307.08 L152x152x7.9 48.40 5.38 18.5
2 Main hull side longitudinals ‐0.10 0.0035 0.80 3.57 0.00 4.51 ‐ 23.10 0.00 23.10 ‐ ‐ 9.00 23.1 23.10 3400.0000 1.65 1.32 1.74 0.75 235.00 2050.00 62.12 247241.37 L152x152x11 66.40 7.29 25.5
3 Side hull bottom and bilge longitudinals ‐0.10 0.0035 0.80 3.57 0.00 4.51 22.00 26.70 0.00 26.70 35.70 ‐ 9.00 48.7 84.40 600.0000 0.60 0.48 0.23 0.75 235.00 2050.00 3.06 12163.12 L102x102x7.9 21.30 1.57 12.2
4 Side hull side longitudinals ‐0.10 0.0035 0.80 3.57 0.00 4.51 ‐ 26.70 0.00 26.70 ‐ ‐ 9.00 26.7 26.70 600.0000 0.60 0.60 0.36 0.75 235.00 2050.00 2.62 10419.51 L102x102x7.9 21.30 1.57 12.2
1 Main hull bottom transverse frames ‐0.10 0.0035 0.80 3.57 0.00 4.51 35.70 23.10 0.00 23.10 48.88 ‐ 9 58.80 107.68 600.00 4.285 3.43 11.75 0.75 235.00 2050 188 7.49E+05 BP250x12 159 23.6 29.9
2 Main hull side frames ‐0.10 0.0035 0.80 3.57 0.00 4.51 ‐ 23.10 0.00 23.10 ‐ ‐ 9 23.10 23.10 600.00 2.400 1.92 3.69 0.75 235.00 2050 23 9.23E+04 L102x76x9.5 24.1 1.67 11.4
3 Side hull bottom transverse frames ‐0.10 0.0035 0.80 3.57 0.00 4.51 22.00 26.70 0.00 26.70 35.70 ‐ 9 48.70 84.40 600.00 1.300 1.04 1.08 0.75 235.00 2050 14 5.71E+04 L102x102x7.9 21.3 1.57 12.2
4 Side hull side frames ‐0.10 0.0035 0.80 3.57 0.00 4.51 ‐ 26.70 0.00 26.70 ‐ ‐ 9 26.70 26.70 600.00 2.250 1.80 3.24 0.75 235.00 2050 24 9.38E+04 L102x76x9.5 24.1 1.67 11.4
1 Bottom girder ‐0.04 0.0026 0.50 3.57 0.00 4.51 35.70 23.10 0.00 23.10 48.88 ‐ 9 58.80 107.68 8.57 9.600 9.60 92.16 0.75 235.00 2050 5489 3.93E+08 WT1300x300x18x14 5459 4371 185
2 Side stringers ‐0.04 0.0026 0.50 3.57 0.00 4.51 35.70 23.10 0.00 23.10 ‐ ‐ 9 23.10 23.10 3.40 4.800 3.84 14.75 0.75 235.00 2050 137 9.81E+06 WT230x191x16x9.9 141 24.8 41
3 Floors ‐0.04 0.0026 0.50 3.57 0.00 4.51 35.70 23.10 0.00 23.10 48.88 ‐ 9 58.80 107.68 2.40 8.570 6.86 47.00 0.75 235.00 2050 1436 5.62E+07 ‐ ‐ ‐ ‐
4 Bottom transverse web frames ‐0.04 0.0026 0.50 3.57 0.00 4.51 35.70 23.10 0.00 23.10 48.88 ‐ 9.00 58.80 107.68 2.40 4.000 3.20 10.24 0.65 235.00 2050 197 1.41E+07 L350x100x11 314 70.3 42.7
5 Side transverse web frames ‐0.04 0.0026 0.50 3.57 0.00 4.51 ‐ 23.10 0.00 23.10 ‐ ‐ 9 58.80 23.10 2.40 2.400 2.40 5.76 0.65 235.00 2050 111 7.94E+06 WT230x191x16x9.9 141 24.8 41
1 Wet‐deck longitudinals ‐0.10 0.0035 0.80 3.57 0.00 4.51 ‐ 23.10 0.00 21.04 ‐ 1.69 9 34.00 23.10 600.00 0.600 0.48 0.23 0.75 235.00 2050 2 8.49E+03 L127x89x9.5 37.6 3.24 13
2 Wet deck transverse frames ‐0.10 0.0035 0.80 3.57 0.00 4.51 ‐ ‐ 0.00 0.00 ‐ 1.69 9.00 34.00 23.10 2400.00 2.750 2.20 4.84 0.65 235.00 2050 207 8.23E+05 L125x75x10 36 2.99 14.9
1 Wet‐deck transverse web frames ‐0.10 0.0035 0.50 3.57 0.00 4.51 ‐ ‐ 0.00 21.04 ‐ 1.69 9 34.00 10.69 7.20 4.125 4.13 17.02 0.65 235.00 2050 1363 5.43E+07 WT400x250x16x10 460 134 62.6
2 Wet‐deck girders ‐0.04 0.0026 0.50 3.57 0.00 4.51 ‐ ‐ 0.00 21.04 ‐ 1.69 9 34.00 10.69 8.500 4.800 3.84 14.75 0.75 235.00 2050 504 3.61E+07 WT750x150x8x8 969 425 56.4
1 Deck longitudinals ‐0.10 0.0035 0.80 3.57 0.00 4.51 ‐ 23.10 0.00 21.04 ‐ ‐ 6.38 8.44 8.44 600.00 0.600 0.48 0.23 0.65 235.00 2050 1 2.43E+03 L50x50x6 1.44 0.629 9
2 Deck beams ‐0.04 0.0026 0.80 3.57 0.00 4.51 ‐ 23.10 0.00 21.04 ‐ ‐ 6.38 8.44 8.44 2400.00 4.800 3.84 14.75 0.65 235.00 2050 65 4.67E+05 L150x9x12 62.3 6.19 21.5
1 Deck girders ‐0.10 0.0035 0.50 3.57 0.00 4.51 ‐ 23.10 0.00 21.04 ‐ ‐ 6.38 8.44 8.44 2.400 4.800 3.84 14.75 0.75 235.00 2050 85 3.37E+06 WT230x191x16x9.9 141 24.8 41
2 Deck transverses ‐0.04 0.0026 0.50 3.57 0.00 4.51 ‐ 23.10 0.00 21.04 ‐ ‐ 6.38 8.44 8.44 2400.00 4.800 4.80 23.04 0.65 235.00 2050 64 4.56E+05 WT175x100x14x10 88.3 11.4 24.7
3 Deck deep beams ‐0.04 0.0026 0.50 3.57 0.00 4.51 ‐ 23.10 0.00 21.04 ‐ ‐ 6.38 18.34 18.34 2.40 8.570 6.86 47.00 0.75 235.00 2050 245 1.75E+07 L200x90x8 331 57.3 30.7
1 I Inner bottom longitudinals‐0.04
0.0026 0.80 3.57 0.00 ‐ 35.70 23.10 0.00 23.10 ‐ ‐ ‐ 48.19 48.19 2400.00 4.800 3.84 14.75 0.75 235.00 2050 323 2.31E+06 ‐ ‐ ‐ ‐
2 J Inner bottom transverse frames ‐0.04 0.0026 0.50 3.57 0.00 ‐ 35.70 23.10 0.00 23.10 ‐ ‐ ‐ 48.19 48.19 2.40 8.570 6.86 47.00 0.75 235.00 2050 643 4.60E+07 ‐ ‐ ‐ ‐
Wave impact Pressure
Minimum Weather Deck Pressure
Design pressure;combination of above pressures
Hydrostatic pressure
Hydrodynamic pressure due to relative motion
Hydrodynamic pressure due to pitching motion
Hydrodynamic wave pressure
Bottom impact Pressure
Parameters
PHYS, P
HYD, P
D, IPBI, IP
WI
G
Inner
Bottom
PHYS, P
HYD
DEWet Deck
F
Weather &
Exposed Decks
AB
C
Shell Envelope
Location Thickness (mm)
Keel Plate 12
Bottom Shell 10
Bilge 12
Side Shell 6.5
Sheerstrake 7
Machinery Space 6.5
Store Room 5.5
Wet Deck 6.5
Car Lanes 5.5
Truck Lanes 6
Main Deck (Lifeboat) 6
1st deck shell 5
2nd deck shell 5
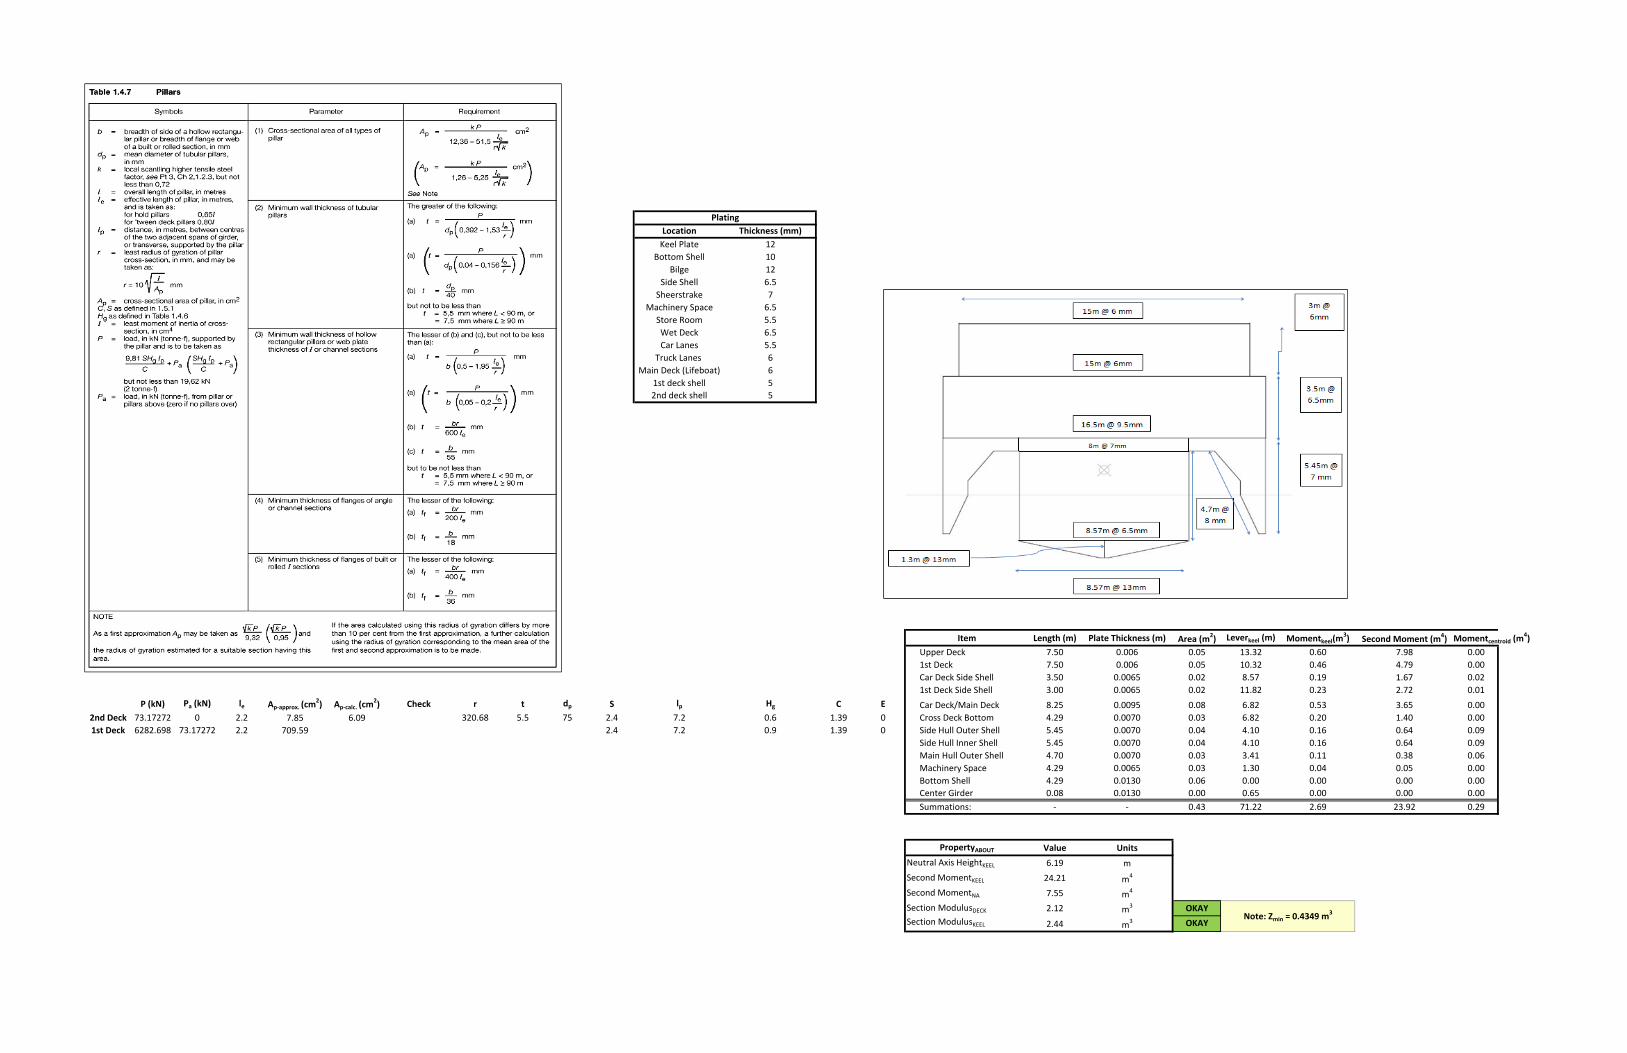
Item Length (m) Plate Thickness (m) Area (m2) Leverkeel (m) Momentkeel(m3) Second Moment (m4) Momentcentroid (m
4)
Upper Deck 7.50 0.006 0.05 13.32 0.60 7.98 0.00
1st Deck 7.50 0.006 0.05 10.32 0.46 4.79 0.00
Car Deck Side Shell 3.50 0.0065 0.02 8.57 0.19 1.67 0.02
1st Deck Side Shell 3.00 0.0065 0.02 11.82 0.23 2.72 0.01
P (kN) Pa (kN) le Ap‐approx. (cm2) Ap‐calc. (cm
2) Check r t dp S lp Hg C E Car Deck/Main Deck 8.25 0.0095 0.08 6.82 0.53 3.65 0.00
2nd Deck 73.17272 0 2.2 7.85 6.09 320.68 5.5 75 2.4 7.2 0.6 1.39 0 Cross Deck Bottom 4.29 0.0070 0.03 6.82 0.20 1.40 0.00
1st Deck 6282.698 73.17272 2.2 709.59 2.4 7.2 0.9 1.39 0 Side Hull Outer Shell 5.45 0.0070 0.04 4.10 0.16 0.64 0.09
Side Hull Inner Shell 5.45 0.0070 0.04 4.10 0.16 0.64 0.09
Main Hull Outer Shell 4.70 0.0070 0.03 3.41 0.11 0.38 0.06
Machinery Space 4.29 0.0065 0.03 1.30 0.04 0.05 0.00
Bottom Shell 4.29 0.0130 0.06 0.00 0.00 0.00 0.00
Center Girder 0.08 0.0130 0.00 0.65 0.00 0.00 0.00
Summations: ‐ ‐ 0.43 71.22 2.69 23.92 0.29
PropertyABOUT Value Units
Neutral Axis HeightKEEL 6.19 m
Second MomentKEEL 24.21 m4
Second MomentNA 7.55 m4
Section ModulusDECK 2.12 m3 OKAY
Section ModulusKEEL 2.44 m3 OKAY
Plating
Note: Zmin = 0.4349 m3
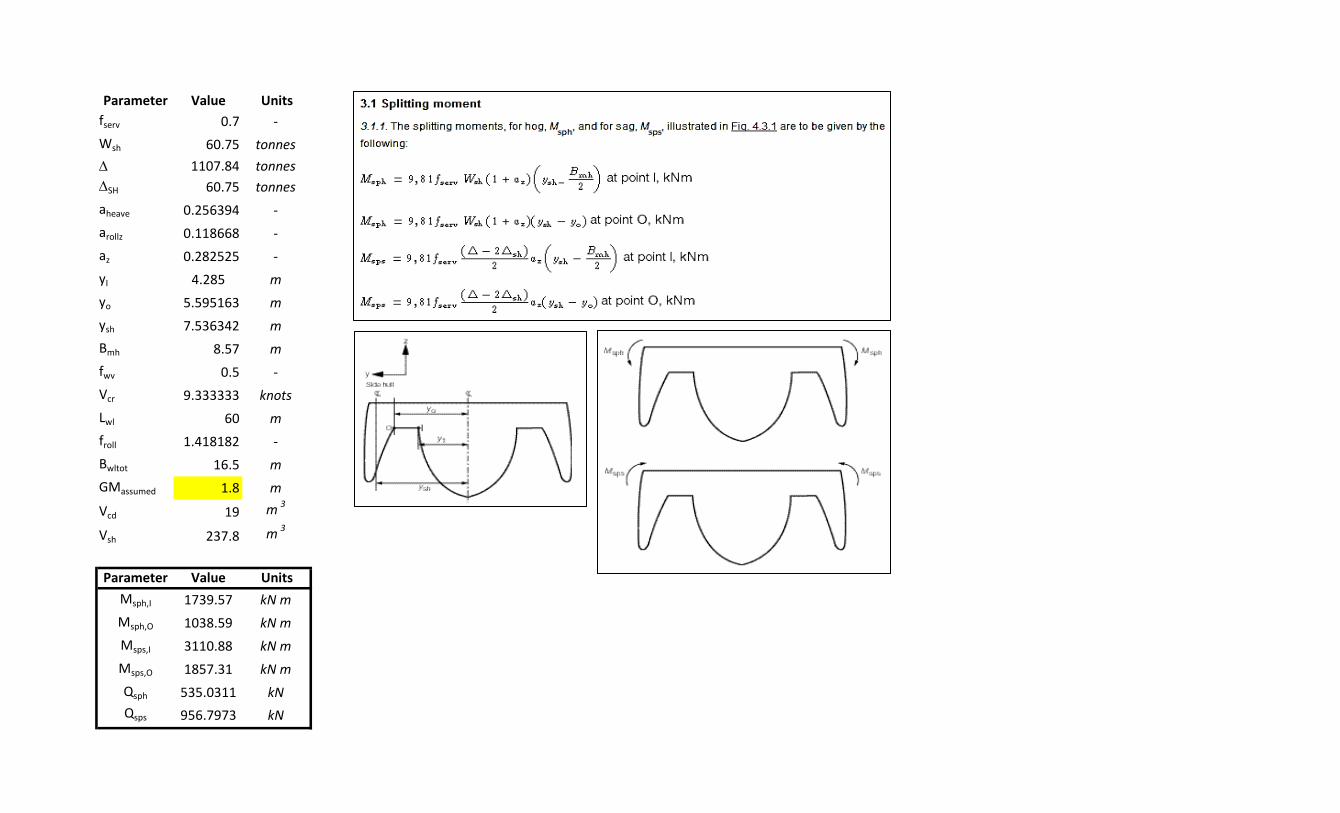
Parameter Value Units
fserv 0.7 -
Wsh 60.75 tonnes
D 1107.84 tonnes
DSH 60.75 tonnes
aheave 0.256394 -
arollz 0.118668 -
az 0.282525 -
yI 4.285 m
yo 5.595163 m
ysh 7.536342 m
Bmh 8.57 m
fwv 0.5 -
Vcr 9.333333 knots
Lwl 60 m
froll 1.418182 -
Bwltot 16.5 m
GMassumed 1.8 m
Vcd 19 m3
Vsh 237.8 m3
Parameter Value Units
Msph,I 1739.57 kN m
Msph,O 1038.59 kN m
Msps,I 3110.88 kN m
Msps,O 1857.31 kN m
Qsph 535.0311 kN
Qsps 956.7973 kN
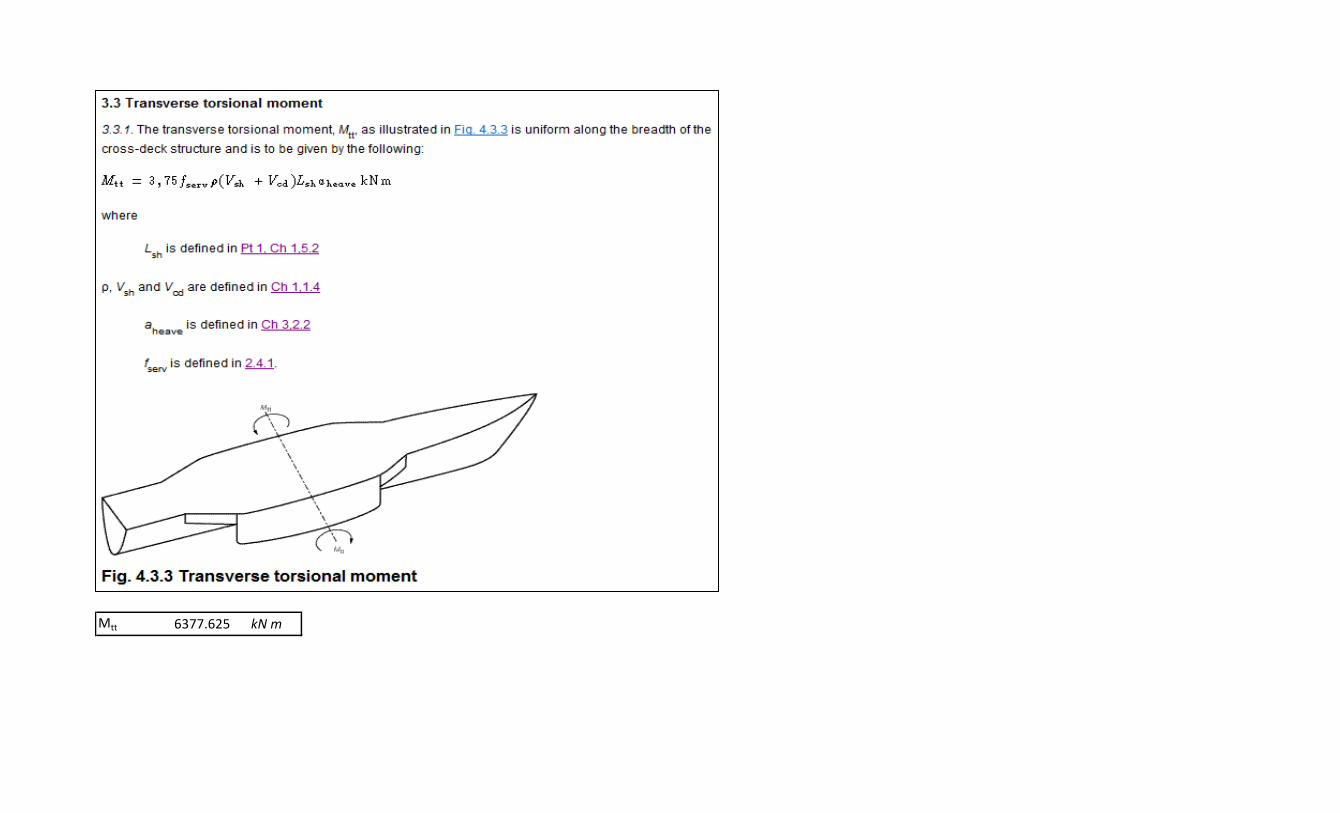
Mtt 6377.625 kN m
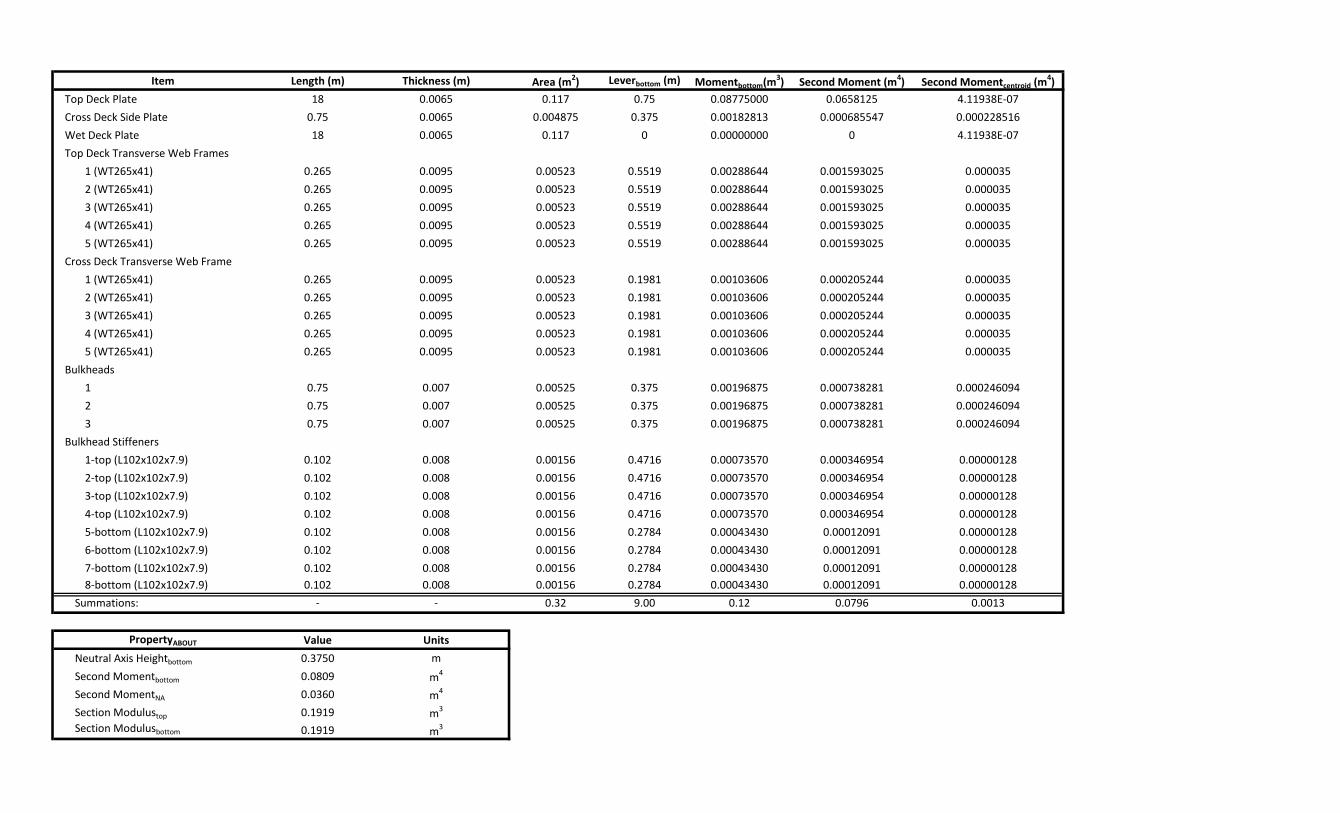
Item Length (m) Thickness (m) Area (m2) Leverbottom (m) Momentbottom(m3) Second Moment (m4) Second Momentcentroid (m4)
Top Deck Plate 18 0.0065 0.117 0.75 0.08775000 0.0658125 4.11938E-07
Cross Deck Side Plate 0.75 0.0065 0.004875 0.375 0.00182813 0.000685547 0.000228516
Wet Deck Plate 18 0.0065 0.117 0 0.00000000 0 4.11938E-07
Top Deck Transverse Web Frames
1 (WT265x41) 0.265 0.0095 0.00523 0.5519 0.00288644 0.001593025 0.000035
2 (WT265x41) 0.265 0.0095 0.00523 0.5519 0.00288644 0.001593025 0.000035
3 (WT265x41) 0.265 0.0095 0.00523 0.5519 0.00288644 0.001593025 0.000035
4 (WT265x41) 0.265 0.0095 0.00523 0.5519 0.00288644 0.001593025 0.000035
5 (WT265x41) 0.265 0.0095 0.00523 0.5519 0.00288644 0.001593025 0.000035
Cross Deck Transverse Web Frame
1 (WT265x41) 0.265 0.0095 0.00523 0.1981 0.00103606 0.000205244 0.000035
2 (WT265x41) 0.265 0.0095 0.00523 0.1981 0.00103606 0.000205244 0.000035
3 (WT265x41) 0.265 0.0095 0.00523 0.1981 0.00103606 0.000205244 0.000035
4 (WT265x41) 0.265 0.0095 0.00523 0.1981 0.00103606 0.000205244 0.000035
5 (WT265x41) 0.265 0.0095 0.00523 0.1981 0.00103606 0.000205244 0.000035
Bulkheads
1 0.75 0.007 0.00525 0.375 0.00196875 0.000738281 0.000246094
2 0.75 0.007 0.00525 0.375 0.00196875 0.000738281 0.000246094
3 0.75 0.007 0.00525 0.375 0.00196875 0.000738281 0.000246094
Bulkhead Stiffeners
1-top (L102x102x7.9) 0.102 0.008 0.00156 0.4716 0.00073570 0.000346954 0.00000128
2-top (L102x102x7.9) 0.102 0.008 0.00156 0.4716 0.00073570 0.000346954 0.00000128
3-top (L102x102x7.9) 0.102 0.008 0.00156 0.4716 0.00073570 0.000346954 0.00000128
4-top (L102x102x7.9) 0.102 0.008 0.00156 0.4716 0.00073570 0.000346954 0.00000128
5-bottom (L102x102x7.9) 0.102 0.008 0.00156 0.2784 0.00043430 0.00012091 0.00000128
6-bottom (L102x102x7.9) 0.102 0.008 0.00156 0.2784 0.00043430 0.00012091 0.00000128
7-bottom (L102x102x7.9) 0.102 0.008 0.00156 0.2784 0.00043430 0.00012091 0.00000128
8-bottom (L102x102x7.9) 0.102 0.008 0.00156 0.2784 0.00043430 0.00012091 0.00000128
Summations: - - 0.32 9.00 0.12 0.0796 0.0013
PropertyABOUT Value Units
Neutral Axis Heightbottom 0.3750 m
Second Momentbottom 0.0809 m4
Second MomentNA 0.0360 m4
Section Modulustop 0.1919 m3
Section Modulusbottom 0.1919 m3

Parameter ValueUnits Value Units
Zcdb 191931.86 cm3 16.21 (N/mm
2)
Zcdt 191931.86 cm3 9.063 (N/mm
2)
Zcd 191931.86 cm 3 22.78 (N/mm2)
Sbhd 9.00 m 12.74 (N/mm2)
Msph 1739.57 kN m 0.52 (N/mm2)
Msps 3110.88 kN m 0.01 (N/mm2)
Qsph 535.03 kN
Qsps 956.80 kN
Mtt 6377.62 kN m
Acd 210.00 cm2
yo 5.60 m
yI 4.29 m
nbhd 5.00 -
zi 180000.00 cm3
K 61.09 m4
R 87.75 m3
k 0.70 m
Ii 3598722.44 cm 4
tdk 6.50 mm
tbhd 7.00 mm
dcd 0.75 m
Qsph
Mtt,bending
Mtt,shear
Msps σsps
Qsps tsps
Component Stress Types
Msph
Nominal Stress
σsph
tsph
σtt
ttt
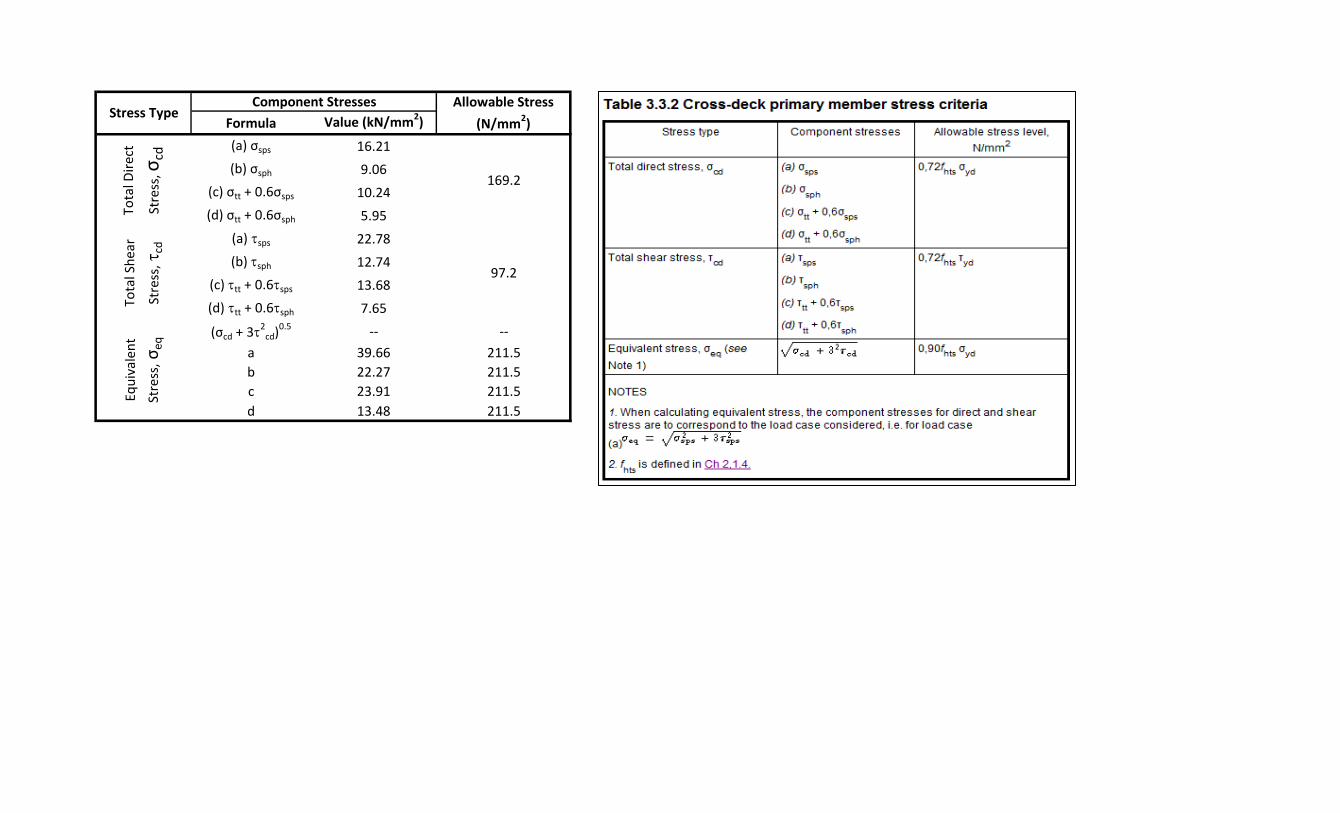
Formula Value (kN/mm2)
(a) σsps 16.21
(b) σsph 9.06
(c) σtt + 0.6σsps 10.24
(d) σtt + 0.6σsph 5.95
(a) tsps 22.78
(b) tsph 12.74
(c) ttt + 0.6tsps 13.68
(d) ttt + 0.6tsph 7.65
(σcd + 3t2
cd)0.5 -- --
a 39.66 211.5
b 22.27 211.5
c 23.91 211.5
d 13.48 211.5
Component StressesStress Type
Allowable Stress
(N/mm2)Eq
uiv
alen
t
Stre
ss, σ
eq
169.2
97.2
Tota
l Dir
ect
Stre
ss, σ
cd
Tota
l Sh
ear
Stre
ss, t
cd
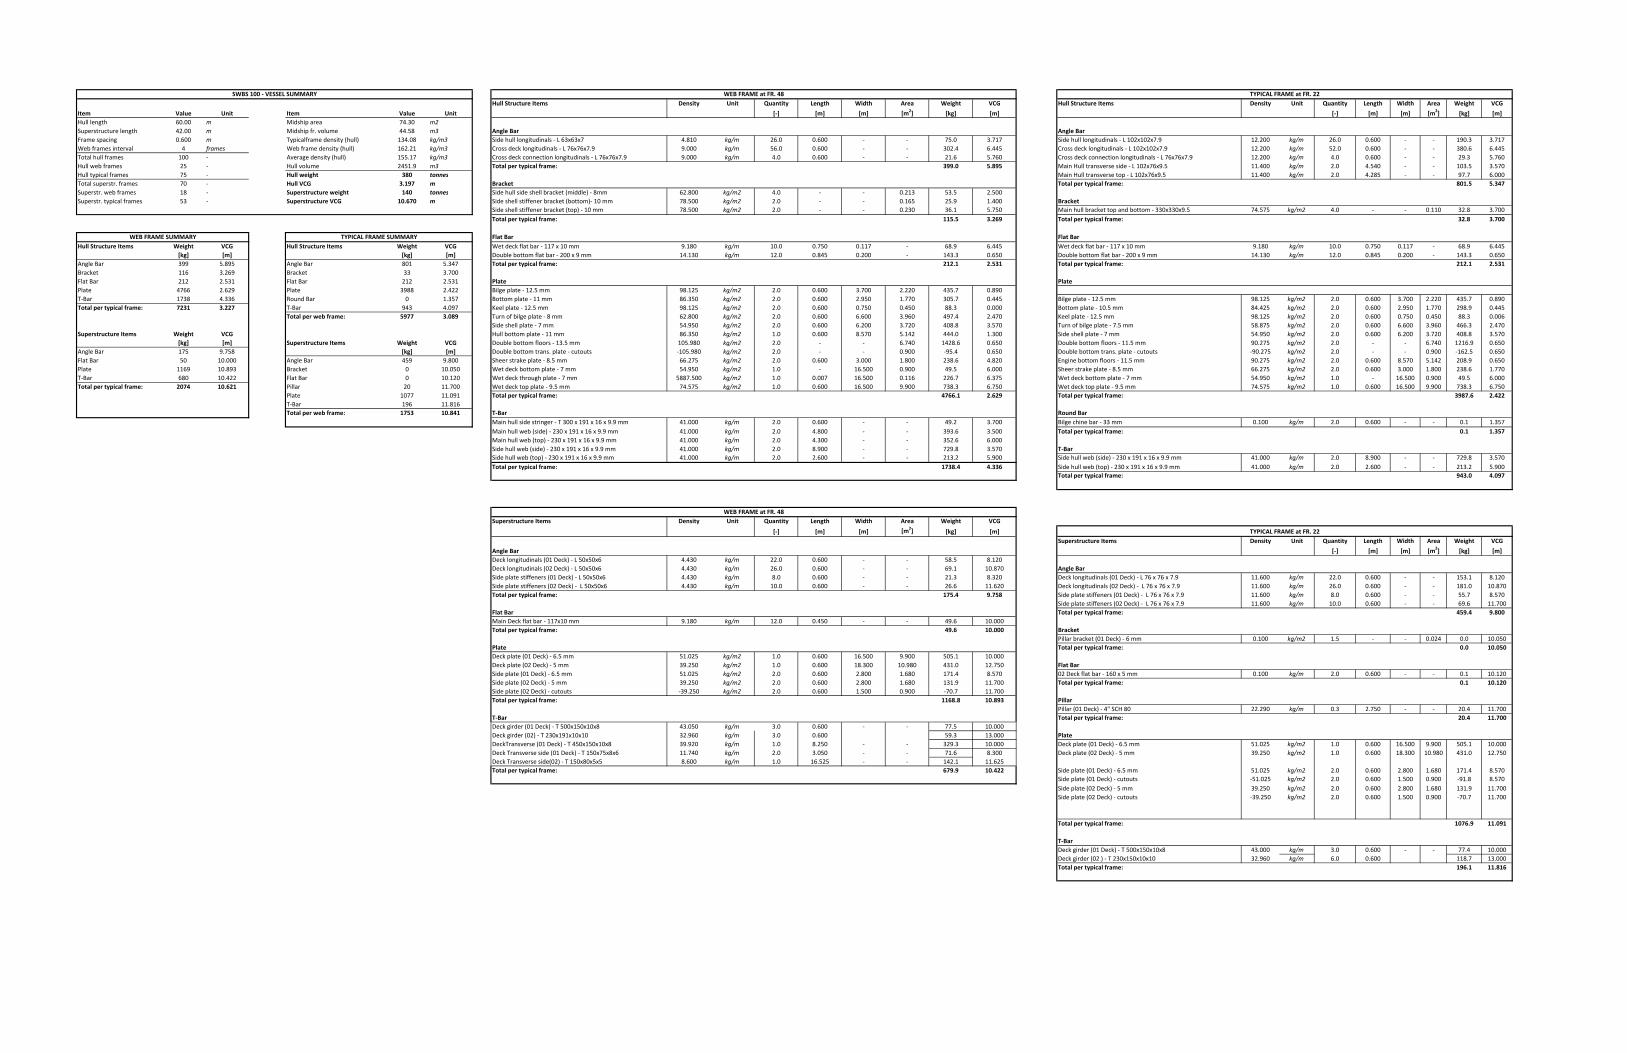
Hull Structure Items Density Unit Quantity Length Width Area Weight VCG Hull Structure Items Density Unit Quantity Length Width Area Weight VCG
Item Value Unit Item Value Unit [‐] [m] [m] [m2] [kg] [m] [‐] [m] [m] [m
2] [kg] [m]
Hull length 60.00 m Midship area 74.30 m2
Superstructure length 42.00 m Midship fr. volume 44.58 m3 Angle Bar Angle Bar
Frame spacing 0.600 m Typicalframe density (hull) 134.08 kg/m3 Side hull longitudinals ‐ L 63x63x7 4.810 kg/m 26.0 0.600 ‐ ‐ 75.0 3.717 Side hull longitudinals ‐ L 102x102x7.9 12.200 kg/m 26.0 0.600 ‐ ‐ 190.3 3.717
Web frames interval 4 frames Web frame density (hull) 162.21 kg/m3 Cross deck longitudinals ‐ L 76x76x7.9 9.000 kg/m 56.0 0.600 ‐ ‐ 302.4 6.445 Cross deck longitudinals ‐ L 102x102x7.9 12.200 kg/m 52.0 0.600 ‐ ‐ 380.6 6.445
Total hull frames 100 ‐ Average density (hull) 155.17 kg/m3 Cross deck connection longitudinals ‐ L 76x76x7.9 9.000 kg/m 4.0 0.600 ‐ ‐ 21.6 5.760 Cross deck connection longitudinals ‐ L 76x76x7.9 12.200 kg/m 4.0 0.600 ‐ ‐ 29.3 5.760
Hull web frames 25 ‐ Hull volume 2451.9 m3 Total per typical frame: 399.0 5.895 Main Hull transverse side ‐ L 102x76x9.5 11.400 kg/m 2.0 4.540 ‐ ‐ 103.5 3.570
Hull typical frames 75 ‐ Hull weight 380 tonnes Main Hull transverse top ‐ L 102x76x9.5 11.400 kg/m 2.0 4.285 ‐ ‐ 97.7 6.000
Total superstr. frames 70 ‐ Hull VCG 3.197 m Bracket Total per typical frame: 801.5 5.347
Superstr. web frames 18 ‐ Superstructure weight 140 tonnes Side hull side shell bracket (middle) ‐ 8mm 62.800 kg/m2 4.0 ‐ ‐ 0.213 53.5 2.500
Superstr. typical frames 53 ‐ Superstructure VCG 10.670 m Side shell stiffener bracket (bottom)‐ 10 mm 78.500 kg/m2 2.0 ‐ ‐ 0.165 25.9 1.400 Bracket
Side shell stiffener bracket (top) ‐ 10 mm 78.500 kg/m2 2.0 ‐ ‐ 0.230 36.1 5.750 Main hull bracket top and bottom ‐ 330x330x9.5 74.575 kg/m2 4.0 ‐ ‐ 0.110 32.8 3.700
Total per typical frame: 115.5 3.269 Total per typical frame: 32.8 3.700
Flat Bar Flat Bar
Hull Structure Items Weight VCG Hull Structure Items Weight VCG Wet deck flat bar ‐ 117 x 10 mm 9.180 kg/m 10.0 0.750 0.117 ‐ 68.9 6.445 Wet deck flat bar ‐ 117 x 10 mm 9.180 kg/m 10.0 0.750 0.117 ‐ 68.9 6.445
[kg] [m] [kg] [m] Double bottom flat bar ‐ 200 x 9 mm 14.130 kg/m 12.0 0.845 0.200 ‐ 143.3 0.650 Double bottom flat bar ‐ 200 x 9 mm 14.130 kg/m 12.0 0.845 0.200 ‐ 143.3 0.650
Angle Bar 399 5.895 Angle Bar 801 5.347 Total per typical frame: 212.1 2.531 Total per typical frame: 212.1 2.531
Bracket 116 3.269 Bracket 33 3.700
Flat Bar 212 2.531 Flat Bar 212 2.531 Plate Plate
Plate 4766 2.629 Plate 3988 2.422 Bilge plate ‐ 12.5 mm 98.125 kg/m2 2.0 0.600 3.700 2.220 435.7 0.890
T‐Bar 1738 4.336 Round Bar 0 1.357 Bottom plate ‐ 11 mm 86.350 kg/m2 2.0 0.600 2.950 1.770 305.7 0.445 Bilge plate ‐ 12.5 mm 98.125 kg/m2 2.0 0.600 3.700 2.220 435.7 0.890
Total per typical frame: 7231 3.227 T‐Bar 943 4.097 Keel plate ‐ 12.5 mm 98.125 kg/m2 2.0 0.600 0.750 0.450 88.3 0.000 Bottom plate ‐ 10.5 mm 84.425 kg/m2 2.0 0.600 2.950 1.770 298.9 0.445
Total per web frame: 5977 3.089 Turn of bilge plate ‐ 8 mm 62.800 kg/m2 2.0 0.600 6.600 3.960 497.4 2.470 Keel plate ‐ 12.5 mm 98.125 kg/m2 2.0 0.600 0.750 0.450 88.3 0.006
Side shell plate ‐ 7 mm 54.950 kg/m2 2.0 0.600 6.200 3.720 408.8 3.570 Turn of bilge plate ‐ 7.5 mm 58.875 kg/m2 2.0 0.600 6.600 3.960 466.3 2.470
Superstructure Items Weight VCG Hull bottom plate ‐ 11 mm 86.350 kg/m2 1.0 0.600 8.570 5.142 444.0 1.300 Side shell plate ‐ 7 mm 54.950 kg/m2 2.0 0.600 6.200 3.720 408.8 3.570
[kg] [m] Superstructure Items Weight VCG Double bottom floors ‐ 13.5 mm 105.980 kg/m2 2.0 ‐ ‐ 6.740 1428.6 0.650 Double bottom floors ‐ 11.5 mm 90.275 kg/m2 2.0 ‐ ‐ 6.740 1216.9 0.650
Angle Bar 175 9.758 [kg] [m] Double bottom trans. plate ‐ cutouts ‐105.980 kg/m2 2.0 ‐ ‐ 0.900 ‐95.4 0.650 Double bottom trans. plate ‐ cutouts ‐90.275 kg/m2 2.0 ‐ ‐ 0.900 ‐162.5 0.650
Flat Bar 50 10.000 Angle Bar 459 9.800 Sheer strake plate ‐ 8.5 mm 66.275 kg/m2 2.0 0.600 3.000 1.800 238.6 4.820 Engine bottom floors ‐ 11.5 mm 90.275 kg/m2 2.0 0.600 8.570 5.142 208.9 0.650
Plate 1169 10.893 Bracket 0 10.050 Wet deck bottom plate ‐ 7 mm 54.950 kg/m2 1.0 ‐ 16.500 0.900 49.5 6.000 Sheer strake plate ‐ 8.5 mm 66.275 kg/m2 2.0 0.600 3.000 1.800 238.6 1.770
T‐Bar 680 10.422 Flat Bar 0 10.120 Wet deck through plate ‐ 7 mm 5887.500 kg/m2 1.0 0.007 16.500 0.116 226.7 6.375 Wet deck bottom plate ‐ 7 mm 54.950 kg/m2 1.0 ‐ 16.500 0.900 49.5 6.000
Total per typical frame: 2074 10.621 Pillar 20 11.700 Wet deck top plate ‐ 9.5 mm 74.575 kg/m2 1.0 0.600 16.500 9.900 738.3 6.750 Wet deck top plate ‐ 9.5 mm 74.575 kg/m2 1.0 0.600 16.500 9.900 738.3 6.750
Plate 1077 11.091 Total per typical frame: 4766.1 2.629 Total per typical frame: 3987.6 2.422
T‐Bar 196 11.816
Total per web frame: 1753 10.841 T‐Bar Round Bar
Main hull side stringer ‐ T 300 x 191 x 16 x 9.9 mm 41.000 kg/m 2.0 0.600 ‐ ‐ 49.2 3.700 Bilge chine bar ‐ 33 mm 0.100 kg/m 2.0 0.600 ‐ ‐ 0.1 1.357
Main hull web (side) ‐ 230 x 191 x 16 x 9.9 mm 41.000 kg/m 2.0 4.800 ‐ ‐ 393.6 3.500 Total per typical frame: 0.1 1.357
Main hull web (top) ‐ 230 x 191 x 16 x 9.9 mm 41.000 kg/m 2.0 4.300 ‐ ‐ 352.6 6.000
Side hull web (side) ‐ 230 x 191 x 16 x 9.9 mm 41.000 kg/m 2.0 8.900 ‐ ‐ 729.8 3.570 T‐Bar
Side hull web (top) ‐ 230 x 191 x 16 x 9.9 mm 41.000 kg/m 2.0 2.600 ‐ ‐ 213.2 5.900 Side hull web (side) ‐ 230 x 191 x 16 x 9.9 mm 41.000 kg/m 2.0 8.900 ‐ ‐ 729.8 3.570
Total per typical frame: 1738.4 4.336 Side hull web (top) ‐ 230 x 191 x 16 x 9.9 mm 41.000 kg/m 2.0 2.600 ‐ ‐ 213.2 5.900
Total per typical frame: 943.0 4.097
Superstructure Items Density Unit Quantity Length Width Area Weight VCG
[‐] [m] [m] [m2] [kg] [m]
Superstructure Items Density Unit Quantity Length Width Area Weight VCG
Angle Bar [‐] [m] [m] [m2] [kg] [m]
Deck longitudinals (01 Deck) ‐ L 50x50x6 4.430 kg/m 22.0 0.600 ‐ ‐ 58.5 8.120
Deck longitudinals (02 Deck) ‐ L 50x50x6 4.430 kg/m 26.0 0.600 ‐ ‐ 69.1 10.870 Angle Bar
Side plate stiffeners (01 Deck) ‐ L 50x50x6 4.430 kg/m 8.0 0.600 ‐ ‐ 21.3 8.320 Deck longitudinals (01 Deck) ‐ L 76 x 76 x 7.9 11.600 kg/m 22.0 0.600 ‐ ‐ 153.1 8.120
Side plate stiffeners (02 Deck) ‐ L 50x50x6 4.430 kg/m 10.0 0.600 ‐ ‐ 26.6 11.620 Deck longitudinals (02 Deck) ‐ L 76 x 76 x 7.9 11.600 kg/m 26.0 0.600 ‐ ‐ 181.0 10.870
Total per typical frame: 175.4 9.758 Side plate stiffeners (01 Deck) ‐ L 76 x 76 x 7.9 11.600 kg/m 8.0 0.600 ‐ ‐ 55.7 8.570
Side plate stiffeners (02 Deck) ‐ L 76 x 76 x 7.9 11.600 kg/m 10.0 0.600 ‐ ‐ 69.6 11.700
Flat Bar Total per typical frame: 459.4 9.800
Main Deck flat bar ‐ 117x10 mm 9.180 kg/m 12.0 0.450 ‐ ‐ 49.6 10.000
Total per typical frame: 49.6 10.000 Bracket
Pillar bracket (01 Deck) ‐ 6 mm 0.100 kg/m2 1.5 ‐ ‐ 0.024 0.0 10.050
Plate Total per typical frame: 0.0 10.050
Deck plate (01 Deck) ‐ 6.5 mm 51.025 kg/m2 1.0 0.600 16.500 9.900 505.1 10.000
Deck plate (02 Deck) ‐ 5 mm 39.250 kg/m2 1.0 0.600 18.300 10.980 431.0 12.750 Flat Bar
Side plate (01 Deck) ‐ 6.5 mm 51.025 kg/m2 2.0 0.600 2.800 1.680 171.4 8.570 02 Deck flat bar ‐ 160 x 5 mm 0.100 kg/m 2.0 0.600 ‐ ‐ 0.1 10.120
Side plate (02 Deck) ‐ 5 mm 39.250 kg/m2 2.0 0.600 2.800 1.680 131.9 11.700 Total per typical frame: 0.1 10.120
Side plate (02 Deck) ‐ cutouts ‐39.250 kg/m2 2.0 0.600 1.500 0.900 ‐70.7 11.700
Total per typical frame: 1168.8 10.893 Pillar
Pillar (01 Deck) ‐ 4" SCH 80 22.290 kg/m 0.3 2.750 ‐ ‐ 20.4 11.700
T‐Bar Total per typical frame: 20.4 11.700
Deck girder (01 Deck) ‐ T 500x150x10x8 43.050 kg/m 3.0 0.600 ‐ ‐ 77.5 10.000
Deck girder (02) ‐ T 230x191x10x10 32.960 kg/m 3.0 0.600 59.3 13.000 Plate
DeckTransverse (01 Deck) ‐ T 450x150x10x8 39.920 kg/m 1.0 8.250 ‐ ‐ 329.3 10.000 Deck plate (01 Deck) ‐ 6.5 mm 51.025 kg/m2 1.0 0.600 16.500 9.900 505.1 10.000
Deck Transverse side (01 Deck) ‐ T 150x75x8x6 11.740 kg/m 2.0 3.050 ‐ ‐ 71.6 8.300 Deck plate (02 Deck) ‐ 5 mm 39.250 kg/m2 1.0 0.600 18.300 10.980 431.0 12.750
Deck Transverse side(02) ‐ T 150x80x5x5 8.600 kg/m 1.0 16.525 ‐ ‐ 142.1 11.625
Total per typical frame: 679.9 10.422 Side plate (01 Deck) ‐ 6.5 mm 51.025 kg/m2 2.0 0.600 2.800 1.680 171.4 8.570
Side plate (01 Deck) ‐ cutouts ‐51.025 kg/m2 2.0 0.600 1.500 0.900 ‐91.8 8.570
Side plate (02 Deck) ‐ 5 mm 39.250 kg/m2 2.0 0.600 2.800 1.680 131.9 11.700
Side plate (02 Deck) ‐ cutouts ‐39.250 kg/m2 2.0 0.600 1.500 0.900 ‐70.7 11.700
Total per typical frame: 1076.9 11.091
T‐Bar
Deck girder (01 Deck) ‐ T 500x150x10x8 43.000 kg/m 3.0 0.600 ‐ ‐ 77.4 10.000
Deck girder (02 ) ‐ T 230x150x10x10 32.960 kg/m 6.0 0.600 118.7 13.000
Total per typical frame: 196.1 11.816
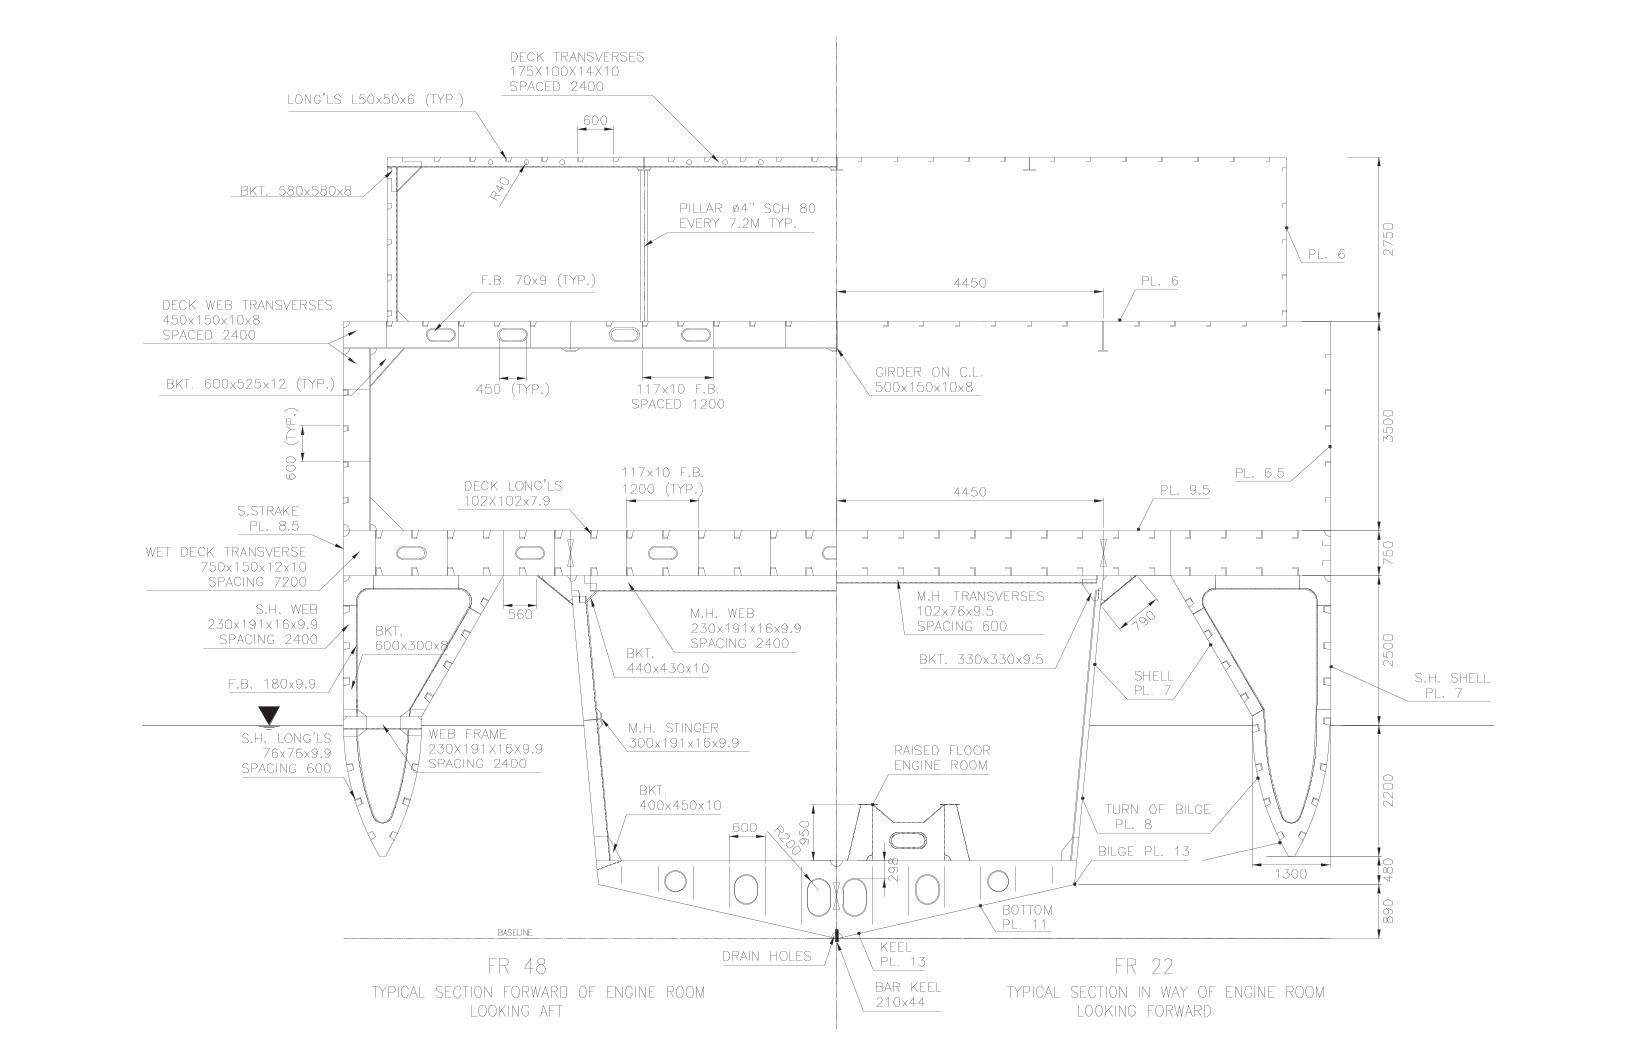
TYPICAL FRAME at FR. 22
SWBS 100 ‐ VESSEL SUMMARY
WEB FRAME SUMMARY TYPICAL FRAME SUMMARY
WEB FRAME at FR. 48
WEB FRAME at FR. 48
TYPICAL FRAME at FR. 22

Verification of Intact Stability Results
0.0
0.2
0.4
0.6
0.8
1.0
1.2
1.4
1.6
0 10 20 30 40 50 60 70 80 90
Rig
hti
ng
Arm
(m)
Roll Angle (°)
AutoCAD
Paramarine
Comparison of Righting Arm Curve obtained manually to Paramarine results
Manual Derivation of Righting Arm Curve (with Displacement Held Constant)
[Heel Angles of 0, 5, 10, 20, 30, ... 80°]
The righting lever curve of a two-dimensional trimaran section was calculated and
compared with that of a similar hullform at the same draft obtained using Paramarine.
The derivation of the manual curve as well as the curves themselves may be found below.
Paramarine Hullform Model
The integrals of the righting arm curves
seen above are approximately 6%
different in magnitude, with the
Paramarine curve providing a more
conservative value for the same
conditions. It can be concluded that the
Paramarine stability software adequately
accounts for the complex hullform of a
trimaran. Paramarine will thus be used
with confidence for stability evaluation
throughout this report.
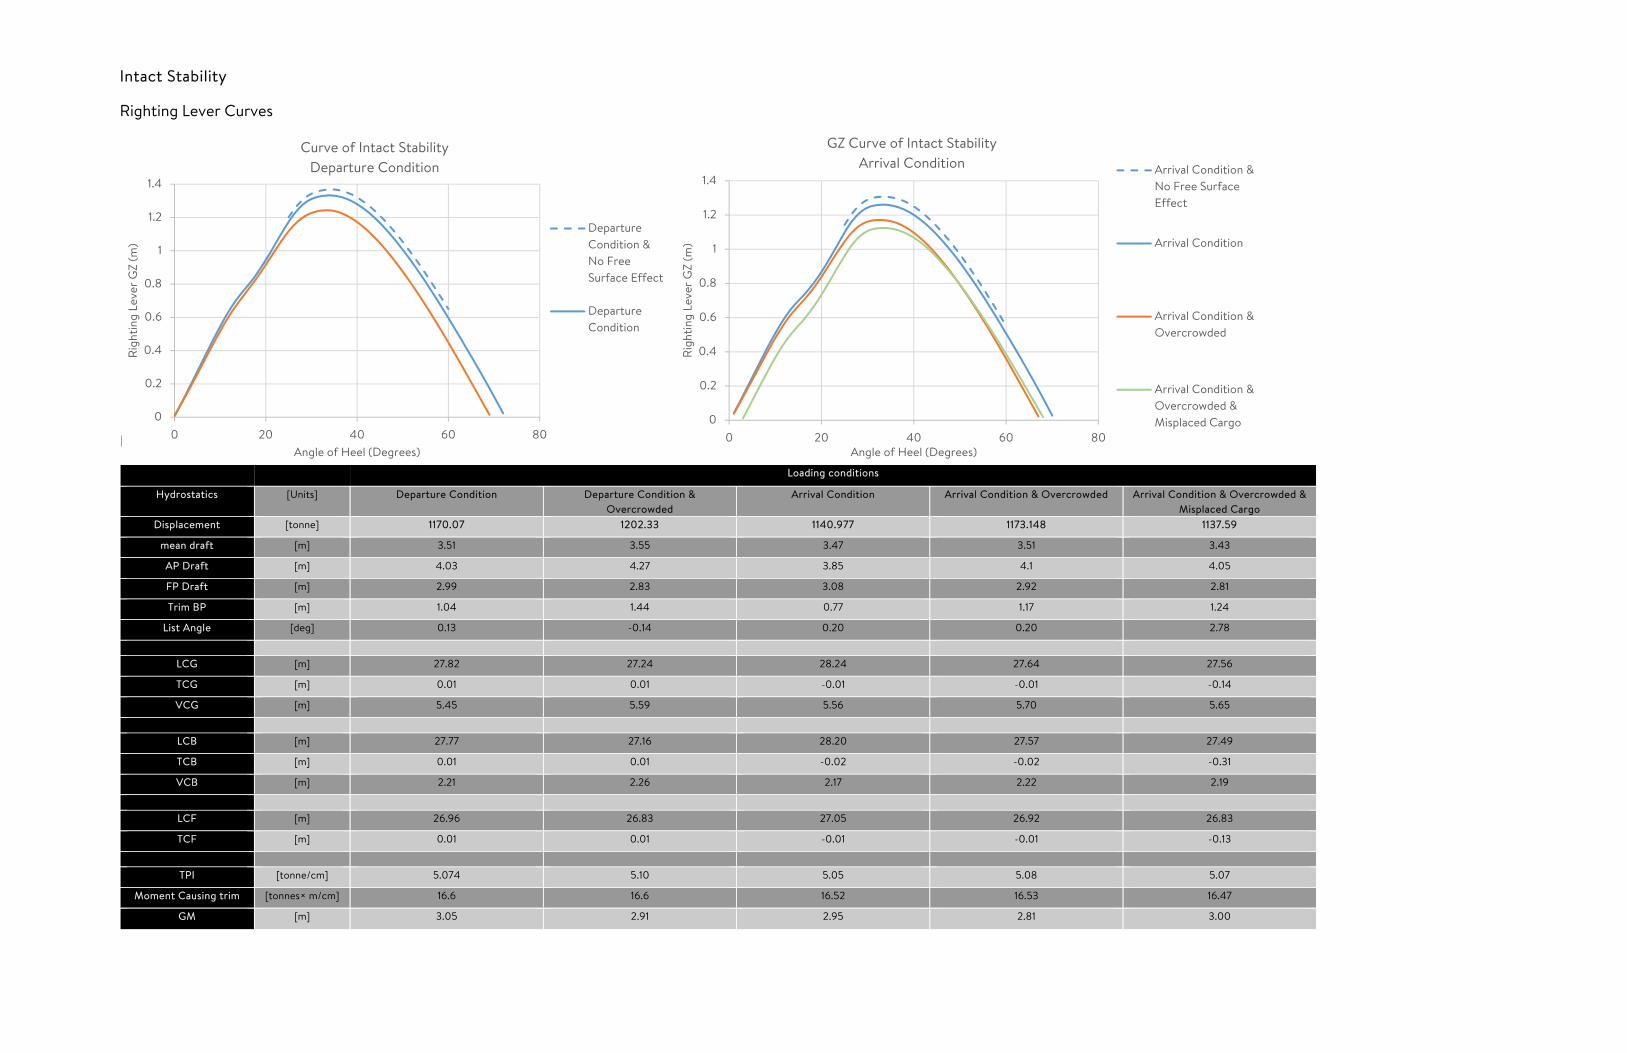
Intact Stability
Righting Lever Curves
Hydrostatics for Various Loading Conditions
Loading conditions
Hydrostatics [Units] Departure Condition Departure Condition & Overcrowded
Arrival Condition Arrival Condition & Overcrowded Arrival Condition & Overcrowded & Misplaced Cargo
Displacement [tonne] 1170.07 1202.33 1140.977 1173.148 1137.59
mean draft [m] 3.51 3.55 3.47 3.51 3.43
AP Draft [m] 4.03 4.27 3.85 4.1 4.05
FP Draft [m] 2.99 2.83 3.08 2.92 2.81
Trim BP [m] 1.04 1.44 0.77 1.17 1.24
List Angle [deg] 0.13 -0.14 0.20 0.20 2.78
LCG [m] 27.82 27.24 28.24 27.64 27.56
TCG [m] 0.01 0.01 -0.01 -0.01 -0.14
VCG [m] 5.45 5.59 5.56 5.70 5.65
LCB [m] 27.77 27.16 28.20 27.57 27.49
TCB [m] 0.01 0.01 -0.02 -0.02 -0.31
VCB [m] 2.21 2.26 2.17 2.22 2.19
LCF [m] 26.96 26.83 27.05 26.92 26.83
TCF [m] 0.01 0.01 -0.01 -0.01 -0.13
TPI [tonne/cm] 5.074 5.10 5.05 5.08 5.07
Moment Causing trim [tonnes× m/cm] 16.6 16.6 16.52 16.53 16.47
GM [m] 3.05 2.91 2.95 2.81 3.00
0
0.2
0.4
0.6
0.8
1
1.2
1.4
0 20 40 60 80
Righ
ting
Leve
r GZ
(m)
Angle of Heel (Degrees)
Curve of Intact StabilityDeparture Condition
DepartureCondition &No FreeSurface Effect
DepartureCondition
0
0.2
0.4
0.6
0.8
1
1.2
1.4
0 20 40 60 80
Righ
ting
Leve
r GZ
(m)
Angle of Heel (Degrees)
GZ Curve of Intact StabilityArrival Condition Arrival Condition &
No Free SurfaceEffect
Arrival Condition
Arrival Condition &Overcrowded
Arrival Condition &Overcrowded &Misplaced Cargo
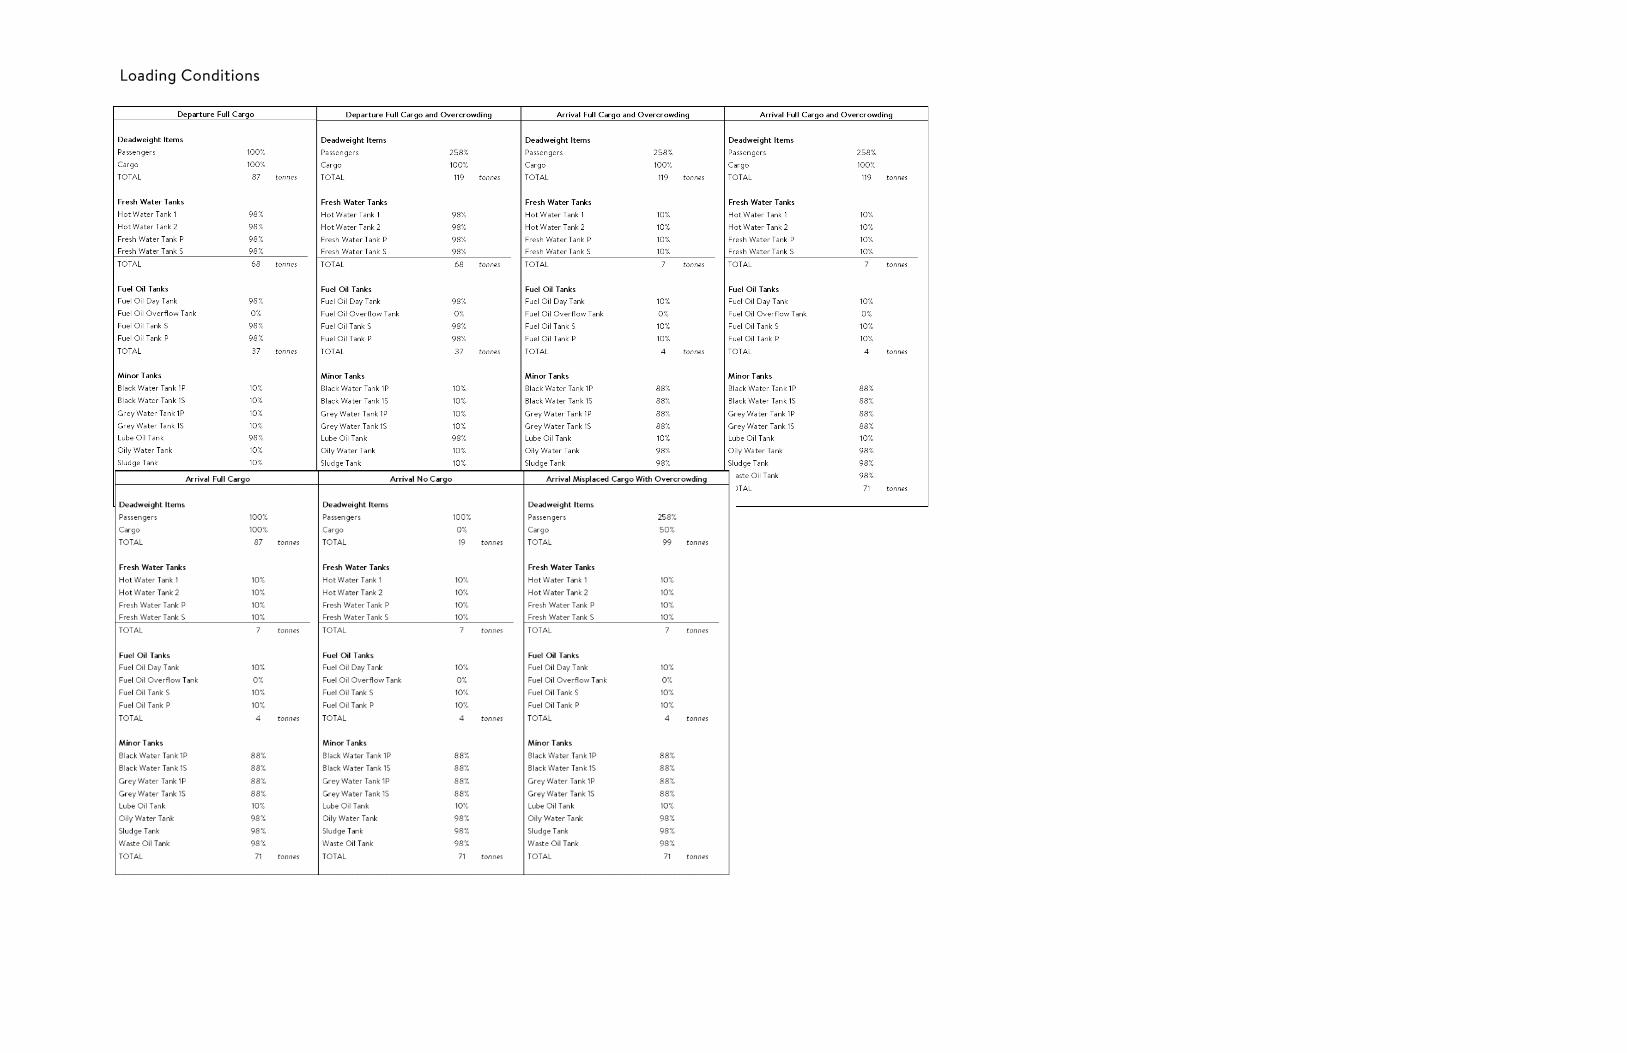
Loading Conditions

Damage Stability
The table at right details the performance of Damage Cases 1 and 8 with the following load conditions:
Arrival Arrival with overcrowding Departure Departure with overcrowding
As seen, the vessel passes SOLAS 90 two-compartment damage criteria. A probabilistic method should be used on further design iterations to verify these results.
Damage Case 1 Damage Case 8

-1.5
-1
-0.5
0
0.5
1
1.5
-100 -50 0 50 100
Righ
ting
Leve
r (m
)
Angle of Heel (Degrees)
Righting Lever CurvesOutrigger Flooding
Three AftCompartmentsFlooded
Three ForwardCompartmentFlooded
The table below details the performance of Damage Case 1 with the following load conditions
Arrival with passenger overcrowding + asymmetric cargo Arrival with passenger overcrowding + passengers assembled at one side
As seen, the vessel still passes SOLAS 90 two-compartment damage criteria under these extreme conditions. The passengers assembled at one side scenario is unlikely as the passengers must be dispersed throughout the vessel to accommodate the high level of overcrowding. Such a passenger-induced heeling moment is likely impossible.
The table below details the performance of outrigger damage with the following load conditions
Arrival with passenger overcrowding The cases analyzed represent the worst survivable damage that the side hull may take. The righting arm curves for these cases as well as their hydrostatics are detailed in the figure and table at right, respectively.
Loading conditions
Hydrostatics [Units] 3 Forward 3 Aft
Displacement [tonne] 1173.278 1173.156
mean draft [m] 3.61 3.61
AP Draft [m] 4.02 4.36
FP Draft [m] 3.20 2.85
Trim BP [m] 0.82 1.51
List Angle [deg] -6.18 -9.88
LCG [m] 27.636 27.634
TCG [m] 0.00 0.00
VCG [m] 5.70 5.70
LCB [m] 27.59 27.63
TCB [m] 0.368 0.6
VCB [m] 2.267 2.32
LCF [m] 26.31 27.3
TCF [m] -0.048 0.06
TPI [tonne/cm] 4.94 4.83
Moment Causing trim [tonnes× m/cm] 16.2 16.35
GM [m] 1.9 1.35

Vessel (qty)Age
(years)Operator Travel Route Schedule
Distance
(nm)Passenger Fees Passengers
Cargo Fees (per
m3 or tonne)Sources
MV Gejamsao (2) 9 Lutheran
Shipping
Lae to Finschhafen ‐ Weekly trips
‐ 3 hour journey
60 ‐deck class (K70)
‐cabin class (K110)
180 K26 to K44 http://www.iccc.gov.pg/docs/Lutheran%20Shippi
ng%20‐%20Submission.pdf
MV Momose
Express
19 Lutheran
Shipping
Lae to Lablab ‐ Leaves Mondays and
Thursdays
‐ Overnight trip
125 ‐deck class (K96)
‐cabin class (K120)
274 K26 to K44
http://www.iccc.gov.pg/docs/Lutheran%20Shippi
ng%20‐%20Submission.pdf
Lae to Wasum ‐ Leaves Mondays and
Thursdays
‐ Overnight trip
150 ‐deck class (K110)
‐cabin class (K120)
274 K26 to K44
http://www.iccc.gov.pg/docs/Lutheran%20Shippi
ng%20‐%20Submission.pdf
Morobe Queen 42 Unknown Alotau to Port
Moresby
‐ Leaves Sunday
(overnight), returns
Tuesday arriving
260 ‐economy (K150)
‐first (K300)
‐tourist (K350)
unknown unknownBook: Papua New Guinea & Solomon Islands
By Rowan McKinnon, Jean‐Bernard Carillet, Dean
Starnes
Rabaul Queen 33 Rabaul Shipping Lae to Kimbe ‐ sails on Monday and
Friday
‐ approx. 20 hour
journey
350 ‐deck class (K210)
‐cabin class (K335)
310 unknown
http://www.lonelyplanet.com/papua‐new‐
guinea/morobe‐and‐madang‐
provinces/lae/transport/other/rabaul‐shipping
Lae to Rabaul ‐ approx. 40 hour
journey
550 ‐deck class (K330)
‐cabin class (K440)
310 unknownhttp://www.lonelyplanet.com/papua‐new‐
guinea/morobe‐and‐madang‐
provinces/lae/transport/other/rabaul‐shipping
Lae to Alotau ‐ approx. 20 hour
journey
350 ‐deck class (K220)?
‐cabin class (K340)
310 unknownhttp://www.lonelyplanet.com/papua‐new‐
guinea/morobe‐and‐madang‐
provinces/lae/transport/other/rabaul‐shipping
Lae to Oro bay
‐ approx. 11 hour journ
200 ‐cabin class (K190)? 310 unknownhttp://www.lonelyplanet.com/papua‐new‐
guinea/morobe‐and‐madang‐
provinces/lae/transport/other/rabaul‐shipping
1 USD = 2.45 kina
Deck Class Cabin Class
nm Price nm Price
60 70 60 110
125 96 125 120
150 110 150 120
260 225 260 300
350 210 350 335
550 330 550 440
350 220 350 340
200 190
y = 0.7704x + 47.444
y = 0.5327x + 39.751
0
50
100
150
200
250
300
350
400
450
500
0 100 200 300 400 500 600
Price (kina) vs Distance (nm)
Cabin Class Deck Class Linear (Cabin Class) Linear (Deck Class)

System Number Title Weight (LT) Labor Man Hours Material Dollars Labor Dollars Variable Value Units
100 Hull 520 $123,468 $832,000 $4,321,383 Lightship Disp. $803 tonnes
200 Propulsion M/C 94 $29,106 $3,790,000 $1,018,701 Lightship Disp. (LT) $790 long tonnes
300 Electrical 14 $10,947 $700,000 $383,130 Ship Type Factor $1 Passenger ferry
400 Command & Comm. 14 $13,819 $1,120,000 $483,655 Size Factor $3 --
500 Auxilliary M/C 29 $1,493 $600,000 $52,250 Complexity Factor $3 --
600 Outfit 132 $21,477 $2,650,000 $751,681 Labor Rate $35 $US/hour
Total: 803 $200,309 $9,692,000 $7,010,799
Item Cost
Material Dollars (x2) $9,692,000
Labour Dollars $7,010,799
Material Overhead (10%) $969,200
Labour Overhead (100%) $7,010,799
Profit $2,468,280
Total: $27,151,078
Conversion Rate 2.67 kina/$US (Apr. 2014)
Average Hourly Rate 0.986380661 $US/hr
Annual Average Earnings 2897 $US
Annual Average Hours 2937 Hours
Vessel Annual Days 292 Days
Vessel Annual Hours 7008 Hours
Vessel Annual Round Trips 42 Roundtrips
Fuel Per Round Trip 50.98325893 tonnes
MDO Price 900 $US/tonne
Crew Number Annual Salary (kina) Annual Salary ($US) Per Trip Salary
Captain 1 10000 $3,745 $89
Chief Officer 1 7500 $2,809 $67
Engineer 1 6000 $2,247 $54
Second Officer 1 5000 $1,873 $45
Kiosk Attendant 2 2500 $936 $22
General Attendant 6 3000 $1,124 $27
Janitor 2 3000 $1,124 $27
Total: $330
Crew Expenses $13,858
Fuel Expenses $1,927,167
Annual Maintenance $481,792
Total: $2,422,817
Lae Kimbe Rabaul Kavieng
Lae $0 $85 $125 $164
Kimbe $85 $0 $55 $95
Rabaul $125 $55 $0 $55
Kavieng $164 $95 $55 $0
Lae Kimbe Rabaul Kavieng
Lae $0 $102 $151 $199
Kimbe $102 $0 $65 $114
Rabaul $151 $65 $0 $65
Kavieng $199 $114 $65 $0
Lae Kimbe Rabaul Kavieng
Lae $0 $119 $176 $234
Kimbe $119 $0 $75 $133
Rabaul $176 $75 $0 $75
Kavieng $234 $133 $75 $0
Lae Kimbe Rabaul Kavieng
Lae $0 $297 $441 $585
Kimbe $297 $0 $189 $333
Rabaul $441 $189 $0 $189
Kavieng $585 $333 $189 $0
Lae Kimbe Rabaul Kavieng
Lae $0 $445 $662 $878
Kimbe $445 $0 $283 $499
Rabaul $662 $283 $0 $283
Kavieng $878 $499 $283 $0
Class Max Capacity Revenue Per Trip100 Revenue Per Trip90 Revenue Per Trip80 Revenue Per Trip70 Revenue Per Trip60 Revenue Per Trip50
Economy 122 $20,064 $18,057 $16,051 $14,044 $12,038 $10,032
Premium 54 $10,763 $9,687 $8,610 $7,534 $6,458 $5,381
Cabin 80 $18,734 $16,861 $14,987 $13,114 $11,240 $9,367
Car 22 $12,880 $11,592 $10,304 $9,016 $7,728 $6,440
Truck 14 $12,294 $11,065 $9,835 $8,606 $7,376 $6,147
Total: $74,734 $67,261 $59,787 $52,314 $44,840 $37,367
Annual Total: $3,138,833.69 $2,824,950.32 $2,511,066.96 $2,197,183.59 $1,883,300.22 $1,569,416.85
Cabin Class Ticket Price ($US)
Premium Class Ticket Price ($US)
Car Rates ($US)
Truck Rates ($US)
Papua New Guinea Statistics
Vessel Annual Operating Expenses
Economy Class Ticket Price ($US)
y = 0.7704x + 47.444
y = ‐0.0002x2 + 0.648x + 27.425
0
50
100
150
200
250
300
350
400
450
500
0 100 200 300 400 500 600
kina
Distance (knots)
Price (kina) vs Distance (nm)
Cabin Class Deck Class Linear (Cabin Class) Poly. (Deck Class)

Appendix:
Renderings