Embed Size (px)
Citation preview
APPENDIX D
LINDBERGH SUBSTATION NOISE IMPACT ASSESSMENT STUDY
NOISE IMPACT ASSESSMENT STUDY
for
PSEG Long Island Proposed Lindbergh Substation
Town of Hempstead, Nassau County, New York
March 2019
Prepared by:
PS&S Engineering, P.C. 1983 Marcus Avenue
Lake Success, New York 11042
i
NOISE IMPACT ASSESSMENT STUDY for
PSEG Long Island Proposed Lindbergh Substation
TABLE OF CONTENTS
EXECUTIVE SUMMARY …………………………………………………………………………………………………………….ES‐1
1.0 INTRODUCTION ....................................................................................................................... 1-1
2.0 NOISE STANDARDS & CRITERIA .............................................................................................. 2-1
3.0 EXISTING NOISE LEVELS ........................................................................................................... 3-1
3.1 Noise Monitoring ................................................................................................. 3‐1 3.2 Noise Monitoring Results ..................................................................................... 3‐2
4.0 NOISE MODELING .................................................................................................................... 4-1
4.1 Introduction ......................................................................................................... 4‐1 4.2 Assumptions and Model Inputs ........................................................................... 4‐1 4.3 Noise Impact Modeling ........................................................................................ 4‐1 4.4 Modeling Results.................................................................................................. 4‐2
5.0 SUMMARY AND CONCLUSIONS .............................................................................................. 5-1
ii
APPENDICES Appendix A NYSDEC Noise Policy Guidance Appendix B Town of Hempstead Noise Code Appendix C Environmental Noise Fundamentals Appendix D 69/13kV Transformer Name Plate
TABLES 3‐1 Noise Monitoring Results 4‐1 Modeled Worst Case Future Noise Impact Levels at Closet Property Lines
FIGURES
3‐1 Lindbergh Substation Noise Monitoring Locations 4‐1 Lindbergh Substation Projected/Modeled Noise Levels
ES-1
NOISE IMPACT ASSESSMENT STUDY for
PSEG Long Island Proposed Lindbergh Substation
EXECUTIVE SUMMARY
PSEG Long Island is proposing to construct the new Lindbergh Substation at the northwest
intersection of Perimeter Road and Charles Lindbergh Boulevard in the Hamlet of Uniondale,
Town of Hempstead, Nassau County, New York. The Proposed Substation will be located on an
approximately 1.7‐acre parcel of vacant, undeveloped land that is predominantly comprised of
natural vegetation. The Proposed Substation will include the installation of two 69/13kV 33 MVA
transformers, two 13kV switchgears, three 69kV gas circuit breakers, four gang‐operated
disconnect switches, two 69kV circuit switches, four lightning masts, as well as other substation
support equipment. An equipment enclosure structure and battery enclosure structure will also
be constructed. The proposed Lindbergh Substation is required to assure an adequate and
reliable power supply to the surrounding area and to support new developments in the area.
Recent engineering studies and analysis by PSEG Long Island have concluded that during peak
summer demand, the existing circuits could become overloaded resulting in voltage reductions
or service disruption. The Proposed Project will address current needs, provide a more reliable
electric supply, and will fulfill future projected loads.
PSEG Long Island requested that PS&S Engineering, PC (PS&S) perform a Noise Impact
Assessment Study for the proposed substation to assess its potential noise level impacts at the
closest property lines in the project area as compared with the New York State Department of
Environmental Conservation (NYSDEC) Noise Policy Guidelines and the Town of Hempstead Noise
Code. PS&S completed the requested assessment in accordance with accepted noise level
evaluation standards, procedures, requirements, and guidelines, and the assessment included:
Measurement of existing (ambient background) noise levels at the closest property lines in the project vicinity, and identification and characterization of existing noise source influences in the area. Note there were no residential properties proximate to the proposed Lindbergh Substation;
ES-2
Computer propagation modeling of worst case potential future noise level impacts at the nearest property lines based on the proposed placement of two transformer banks operating at maximum capacity; and
The results of the assessment were then compared to applicable noise standards, guidelines and limits.
Noise Monitoring Results: The existing ambient background daytime noise levels measured at
the closest property lines in the vicinity of the project site varied between 62 dBA and 74 dBA,
and nighttime ambient background noise levels varied between 56 dBA and 71 dBA, with the
major noise influences in the project area being from traffic noise from Charles Lindbergh
Boulevard.
Noise Modeling Results & Conclusions: The projected (modeled) noise impact levels at the
closest property line receptors based on worst case future noise levels from the planned
installation of new transformer banks operating simultaneously at maximum capacity, were 15.3
dBA at the closest affected property line.
The modeled worst case cumulative total noise level impacts from the proposed new transformer
banks at the closest property line receptor locations are significantly lower than the existing daytime
and nighttime ambient noise levels, and will not result in any perceptible noise increase above
existing ambient noise levels.
The modeled future noise impact levels at the closest property line receptor locations are below the
NYSDEC Noise Policy Guideline sound‐level limit of 65 dBA and will be in compliance with the Town
of Hempstead Noise Code.
The results of the Noise Impact Assessment Study therefore concluded that the proposed
transformers will result in no change to the existing ambient noise levels at the closest property lines
in the project area, and that the proposed transformers will be in compliance with all applicable
noise standards and criteria, and all applicable noise code limits.

SECTION 1.0
INTRODUCTION
1‐1
NOISE IMPACT ASSESSMENT STUDY for
PSEG Long Island Proposed Lindbergh Substation
1.0 INTRODUCTION
PSEG Long Island is proposing to construct the new Lindbergh Substation at the northwest
intersection of Perimeter Road and Charles Lindbergh Boulevard in the Hamlet of Uniondale,
Town of Hempstead, Nassau County, New York. The Proposed Substation will be located on an
approximately 1.7‐acre parcel of vacant, undeveloped land that is predominantly comprised of
natural vegetation. The Proposed Substation will include the installation of two 69/13kV 33 MVA
transformers, two 13kV switchgears, three 69kV gas circuit breakers, four gang‐operated
disconnect switches, two 69kV circuit switches, four lightning masts, as well as other substation
support equipment. An equipment enclosure structure and battery enclosure structure will also
be constructed. The proposed Lindbergh Substation is required to assure an adequate and
reliable power supply to the surrounding area and to support new developments in the area.
Recent engineering studies and analysis by PSEG Long Island have concluded that during peak
summer demand, the existing circuits could become overloaded resulting in voltage reductions
or service disruption. The Proposed Project will address current needs, provide a more reliable
electric supply, and will fulfill future projected loads. The dominant land uses immediately
adjacent to the Lindbergh Substation is commercial, roadways and Nassau Community College
to the north and east.
PSEG Long Island requested that PS&S Engineering, PC (PS&S) perform a Noise Impact
Assessment Study for the proposed substation to assess its potential noise level impacts at the
closest property lines in the project area as compared with the New York State Department of
Environmental Conservation (NYSDEC) Noise Policy Guidelines and the Town of Hempstead Noise
Code. PS&S completed the requested assessment which included the measurement of existing
(ambient background) noise levels at the closest property lines in the project vicinity,
identification and characterization of existing noise source influences in the area, and computer
propagation modeling of worst‐case potential future noise level impacts at the nearest property

1‐2
lines based on the proposed transformer banks operating at maximum capacity. The results of
the assessment were then compared to applicable sound‐level guidelines and limits. This Noise
Impact Evaluation/Assessment was performed by PS&S in accordance with accepted noise level
evaluation standards, procedures, requirements, and guidelines.
SECTION 2.0
NOISE STANDARDS & CRITERIA
2‐1
2.0 NOISE STANDARDS & CRITERIA
New York State Department of Environmental Conservation Noise Guidelines & Criteria
The New York State Department of Environmental Conservation (NYSDEC) Program Policy
Memorandum/Noise Policy Guidelines titled Assessing and Mitigating Noise Impacts,
provides guidance and criteria on when noise levels due to proposed projects have the
potential for adverse impacts and requires review and possible mitigation. This guidance
document states that the goal for any operation should be to minimize increases in sound
pressure levels (SPL) above existing ambient levels at the chosen point of sound reception,
and ideally not exceed the existing ambient noise by more than 6 dBA at the receptor.
Noise impact measurements are primarily obtained using the “A‐weighted” (dBA)
frequency response function because it simulates the response of the human ear to sound
levels. The NYSDEC noise policy guidance document also states that SPL increases ranging
from 0 to 3 dBA should have no appreciable effect on receptors, and that an SPL increase
of 10 dBA, which results in a perceived doubling of loudness, deserves consideration of
avoidance and/or mitigation measures in most cases. The NYSDEC guidance also indicates
that the addition of any new noise generating equipment in a non‐industrial (e.g.,
residential) setting should not raise the ambient noise level above a maximum of 65 dBA,
which is the level that allows for undisturbed speech at a distance of approximately three
feet. A copy of the NYSDEC noise policy guidance, “Assessing and Mitigating Noise
Impacts” is included in Appendix A.
Town of Hempstead Noise Code
The Town of Hempstead Code regulates the following in relation to operation activities:
The operation of any machinery, equipment, pump, fan, exhaust fan, attic fan, air‐
conditioning apparatus or similar mechanical device in such a manner as to create an
unreasonable noise across a real property boundary. A copy of the Town of Hempstead
Noise Code is included in Appendix B.

2‐2
Nassau County
There are no quantitative noise limits or standards adopted within Nassau County, New
York.
SECTION 3.0
EXISTING NOISE LEVELS
3-1
3.0 EXISTING NOISE LEVELS
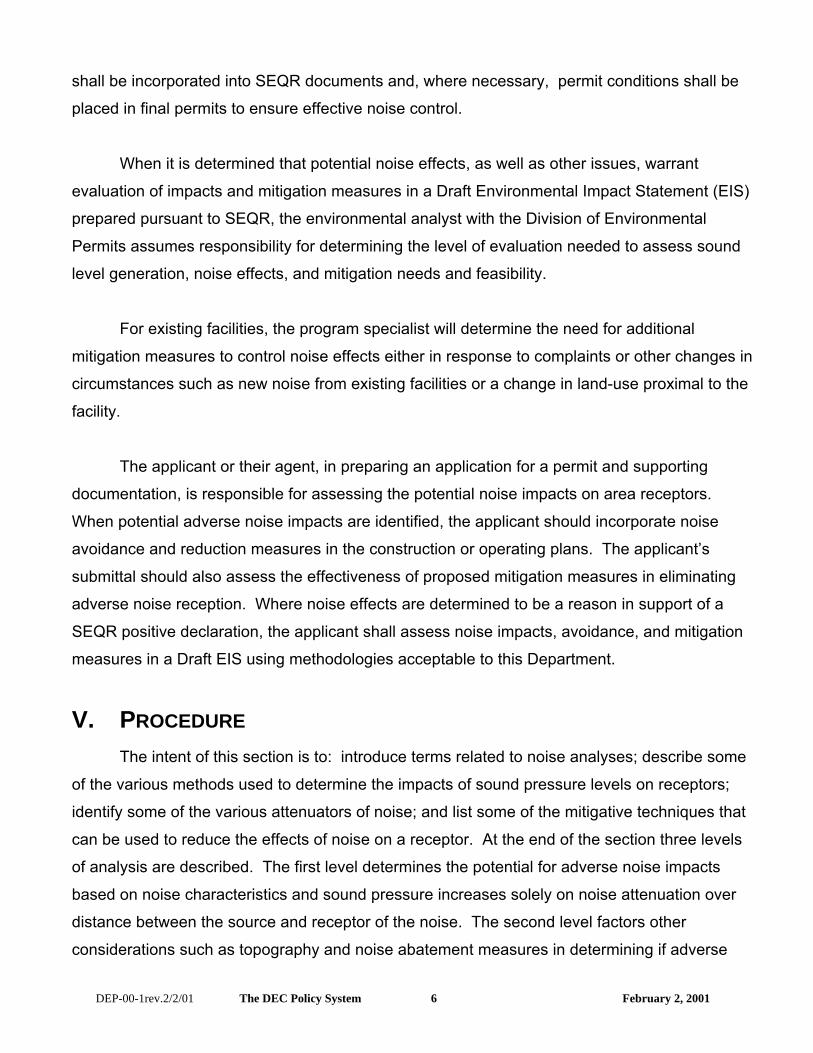
3.1 Noise Monitoring
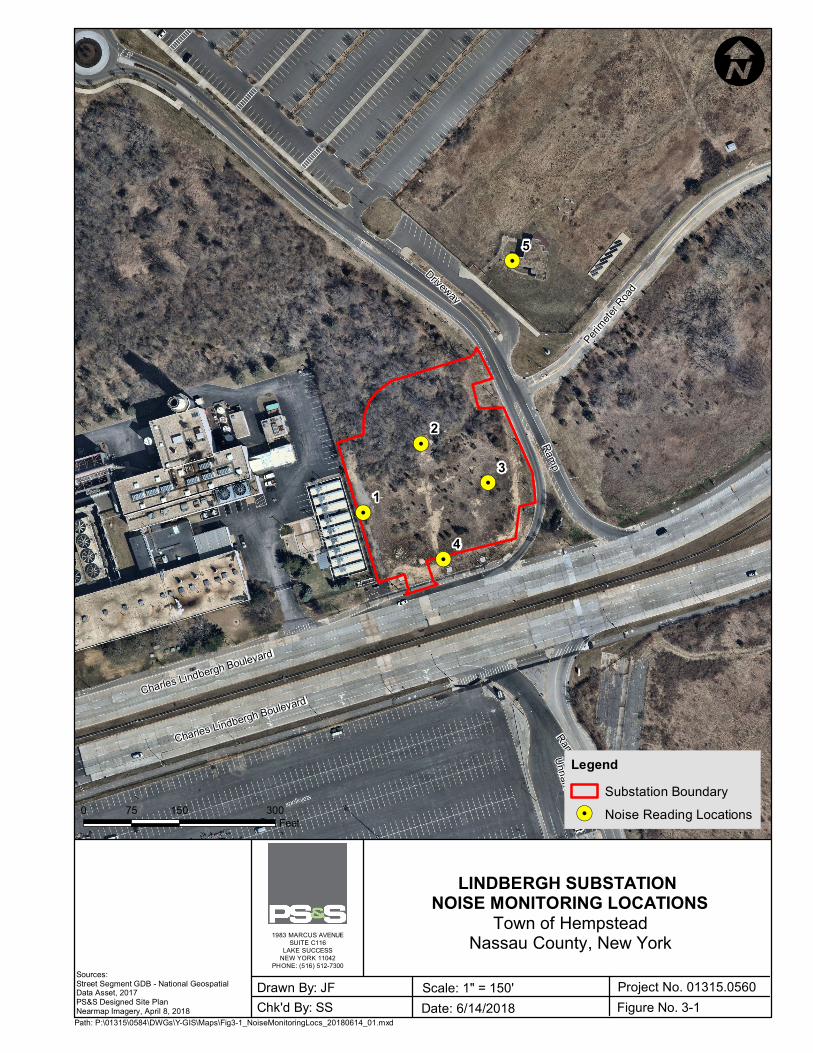
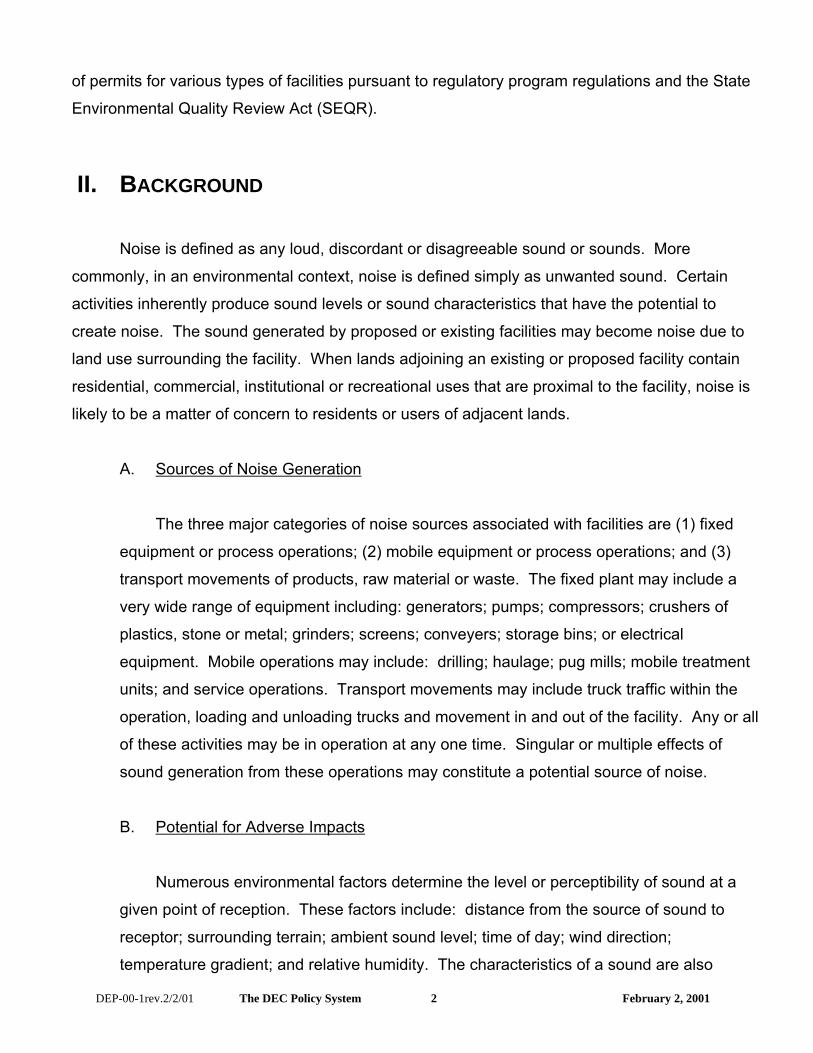
Existing ambient / background noise levels were measured at five locations in the vicinity of
the Lindbergh Substation site on April 17, 2018 during both the daytime (9 am – 10 pm) and
nighttime (10 pm – 9 am) periods. These noise monitoring locations were positioned at the
closest commercial property line, and also at the property lines of the substation. The
locations are shown on Figure 3‐1.
PS&S performed the noise monitoring in accordance with accepted sound‐level standards,
procedures, requirements, and other guidance, and all noise measurements were obtained
by a PS&S acoustical professional trained and certified under the Rutgers Noise Technical
Assistance Center. The following instrumentation was used by PS&S for this noise
monitoring:
Bruel and Kjaer (B&K) Model 2250 “Precision” Sound Level Meter;
Bruel and Kjaer Condenser Microphone and Pre‐Amp;
Bruel and Kjaer Wind Screen;
Bruel and Kjaer Model 4231 Acoustic Calibrator; and
Kestral Wind Meter.
The monitoring instruments were calibrated before and after the measurement period and
operated according to manufacturer's instructions. The certified B&K sound‐level meter was
set to the “A‐weighting” scale and “slow” measurement speed, and the monitored noise
level readings were stored in the sound‐level meter memory, and this noise level data was
then transferred to a computer for compilation and tabulation. The L90 statistical monitoring
mode was used in this assessment to represent the existing ambient background noise levels
which does not include intermittent “Extraneous Sounds”; the L90 descriptor is referred to
as the residual background ambient noise level because it is the sound‐level that is exceeded
90 percent of the time, generally filtering out intermittent “Extraneous Sounds”. The
residual background ambient noise level is the minimum sound‐level reading in the absence
3-2
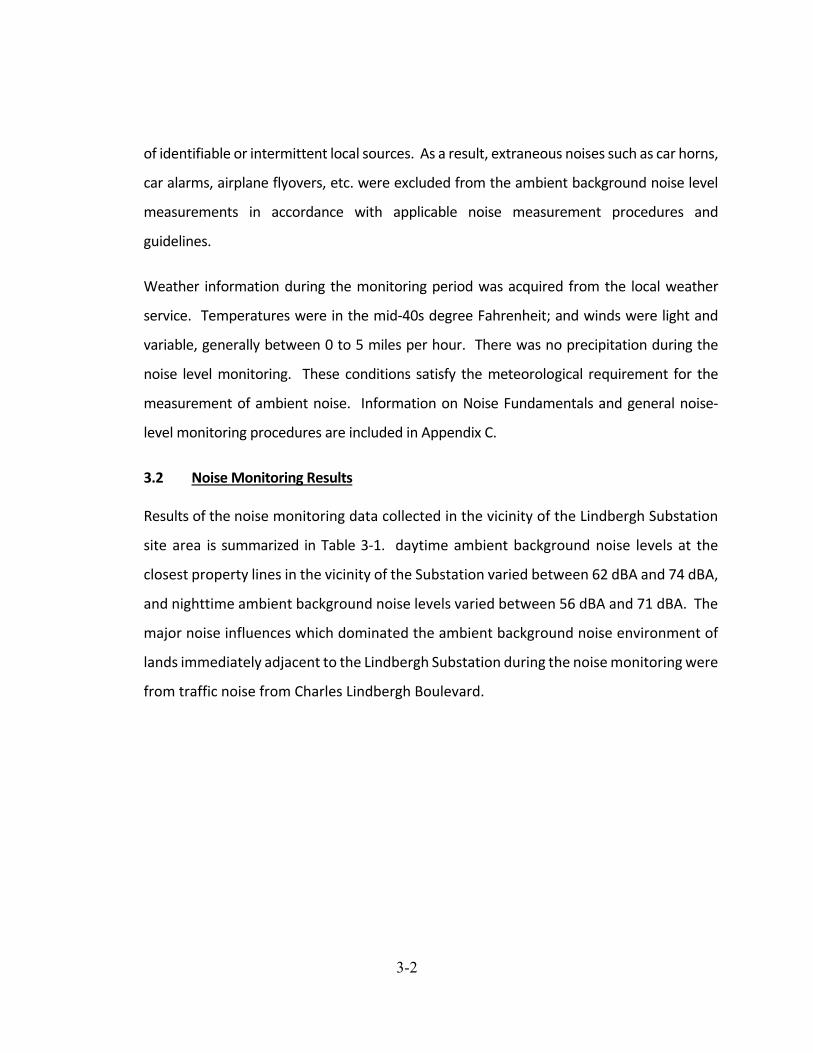
of identifiable or intermittent local sources. As a result, extraneous noises such as car horns,
car alarms, airplane flyovers, etc. were excluded from the ambient background noise level
measurements in accordance with applicable noise measurement procedures and
guidelines.
Weather information during the monitoring period was acquired from the local weather
service. Temperatures were in the mid‐40s degree Fahrenheit; and winds were light and
variable, generally between 0 to 5 miles per hour. There was no precipitation during the
noise level monitoring. These conditions satisfy the meteorological requirement for the
measurement of ambient noise. Information on Noise Fundamentals and general noise‐
level monitoring procedures are included in Appendix C.
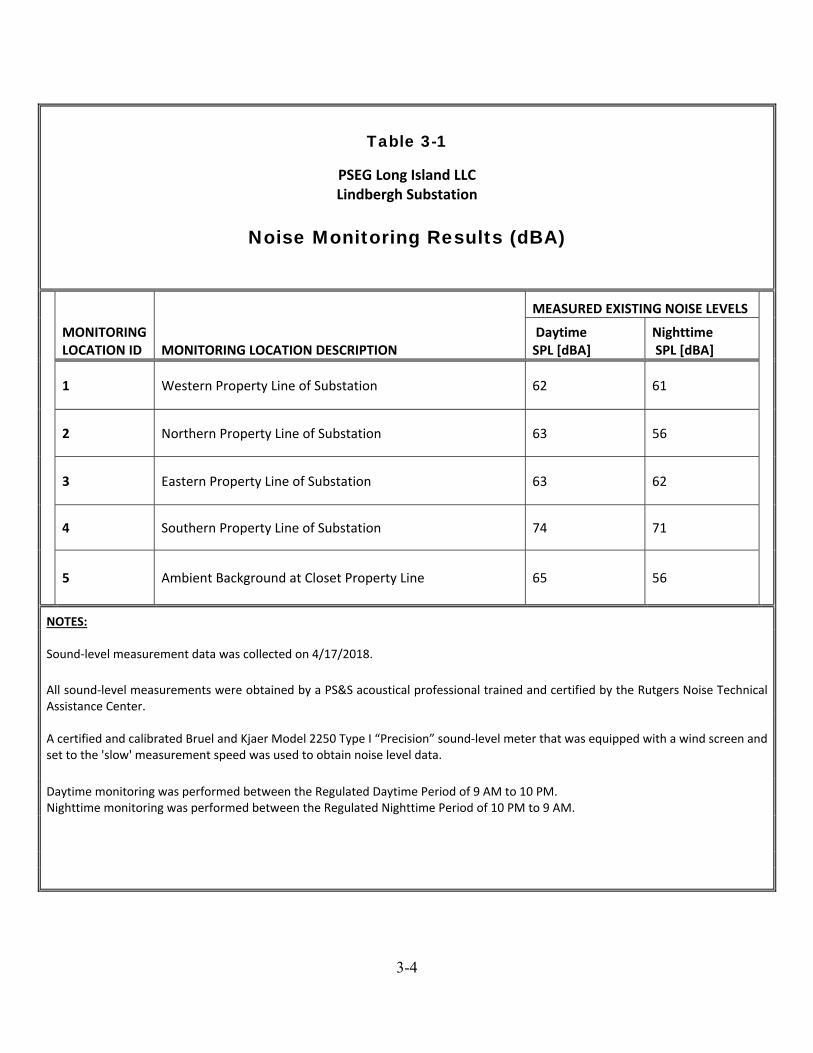
3.2 Noise Monitoring Results
Results of the noise monitoring data collected in the vicinity of the Lindbergh Substation
site area is summarized in Table 3‐1. daytime ambient background noise levels at the
closest property lines in the vicinity of the Substation varied between 62 dBA and 74 dBA,
and nighttime ambient background noise levels varied between 56 dBA and 71 dBA. The
major noise influences which dominated the ambient background noise environment of
lands immediately adjacent to the Lindbergh Substation during the noise monitoring were
from traffic noise from Charles Lindbergh Boulevard.
!.
!.
!.
!.
!.5
3
4
2
1
Driveway
Ramp
Ramp
Charles Lindbergh Boulevard
Perimete
r Road
Unnamed Street
Charles Lindbergh Boulevard
Sources:Street Segment GDB - National GeospatialData Asset, 2017PS&S Designed Site PlanNearmap Imagery, April 8, 2018
LINDBERGH SUBSTATION NOISE MONITORING LOCATIONS
Town of HempsteadNassau County, New York
Figure No. 3-1Project No. 01315.0560Scale: 1" = 150'
Date: 6/14/2018Drawn By: JFChk'd By: SS
I
0 150 30075Feet
LegendSubstation Boundary
!. Noise Reading Locations
Path: P:\01315\0584\DWGs\Y-GIS\Maps\Fig3-1_NoiseMonitoringLocs_20180614_01.mxd
1983 MARCUS AVENUESUITE C116
LAKE SUCCESSNEW YORK 11042
PHONE: (516) 512-7300
3-4
Table 3-1
PSEG Long Island LLC Lindbergh Substation
Noise Monitoring Results (dBA)
MONITORING LOCATION ID MONITORING LOCATION DESCRIPTION
MEASURED EXISTING NOISE LEVELS
Daytime SPL [dBA]
Nighttime SPL [dBA]
1 Western Property Line of Substation 62 61
2 Northern Property Line of Substation 63 56
3 Eastern Property Line of Substation 63 62
4 Southern Property Line of Substation 74 71
5 Ambient Background at Closet Property Line 65 56
NOTES: Sound‐level measurement data was collected on 4/17/2018.
All sound‐level measurements were obtained by a PS&S acoustical professional trained and certified by the Rutgers Noise Technical Assistance Center.
A certified and calibrated Bruel and Kjaer Model 2250 Type I “Precision” sound‐level meter that was equipped with a wind screen and set to the 'slow' measurement speed was used to obtain noise level data.
Daytime monitoring was performed between the Regulated Daytime Period of 9 AM to 10 PM. Nighttime monitoring was performed between the Regulated Nighttime Period of 10 PM to 9 AM.
SECTION 4.0
NOISE MODELING
4-1
4.0 NOISE MODELING
4.1 Introduction
The proposed construction of the Lindbergh Substation is planned to include the placement
of two transformer banks. For the noise impact modeling of the new transformers, PS&S
used manufacturer’s specifications data which indicated a maximum sound pressure level
of 60.9 dBA with the transformers operating “fully loaded” with all cooling fans in
operation, which is expected to occur only occasionally based on load and temperature,
typically only during hot summer days during periods of high power demand. The
manufacturer’s specification 69/13kV transformer nameplate can be found in
Appendix D.
4.2 Assumptions and Model Inputs
The noise impact modeling performed for this assessment assumes that:
All of the specified transformer equipment is installed;
The transformers will operate at maximum load with all fans in operation; and
Existing ambient noise‐level measurements, the NYSDEC Noise Policy Guidelines and the Town of Hempstead Noise Code are used as comparisons to the model projections.
4.3 Noise Impact Modeling
An acoustic (sound) propagation model was used to assess compliance of the proposed
new transformer equipment based on potential worst‐case operating conditions. The
sound propagation modeling was performed using the equipment and maximum sound
pressure level specifications identified above, at the closest property lines in the project
vicinity. Projections of noise impacts from the new transformers were predicted using
the nationally recognized SoundPLAN Essential (V. 3.0) three‐dimensional acoustic
propagation model software (Braunstein and Berndt, GmbH / SoundPLAN LLC, 2013).
The SoundPLAN software calculates noise impacts from multiple noise sources at multiple
receivers while accounting for specific site sound radiation patterns and propagation effects
4-2
of structures. The noise sources are identified in the propagation modeling with x and y
coordinates and a relative height above terrain. The new transformer equipment identified
in this assessment was modeled as point sources and digitized in a referenced coordinate
system based on Site plan dimensions. Modeled receptors were located along the nearest
property lines at an average ear level height of 1.5 meters above ground level in accordance
with applicable modeling guidance. Existing buildings in the project area were digitized
based on actual dimensions and were included in the model calculations (i.e., calculation
of diffraction around buildings). Buildings and Structures may modify the noise radiation
patterns of equipment, and the SoundPLAN software includes calculations to account for
potential sound amplification from reverberation/reflection off exterior building surfaces
based on the structure’s facade. A reflection loss coefficient is assigned to each building
or structure based on the material of the façade, and all structures were conservatively
modeled as “minimally absorbent” (default reflection loss of 1 dB). The modeled noise
impact levels were then compared to the applicable NYSDEC Noise Policy guidelines and
the Town of Hempstead Noise Code.
4.4 Modeling Results
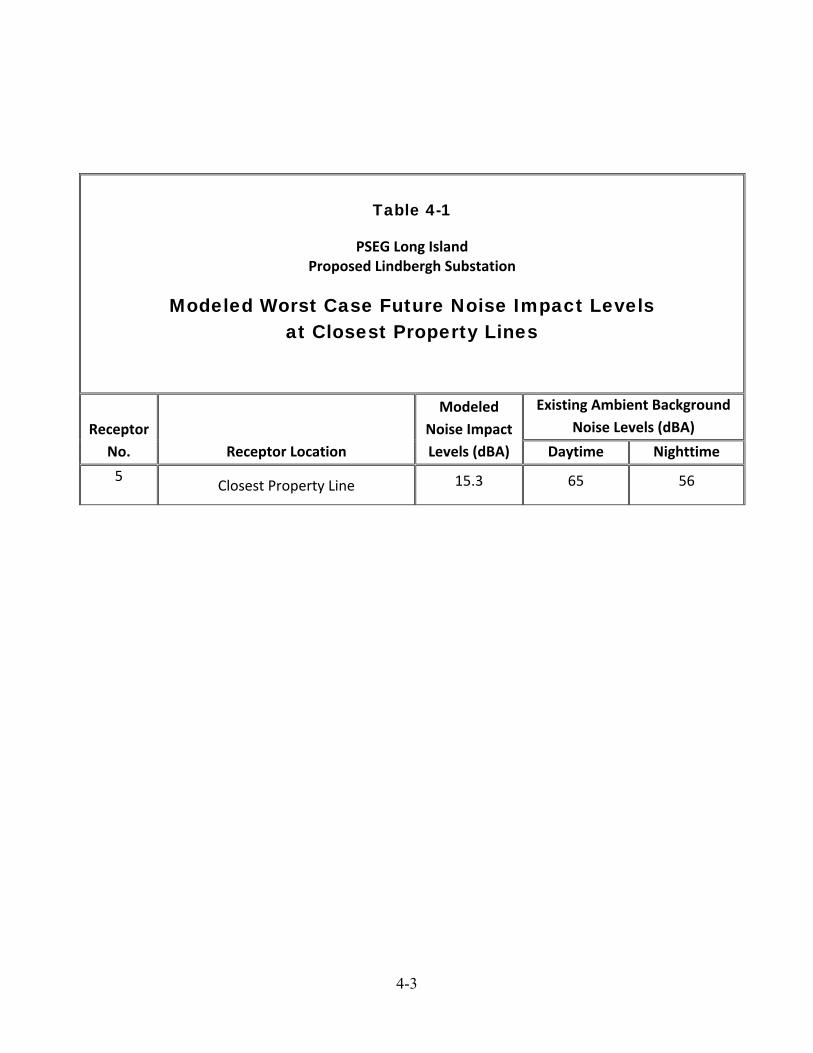
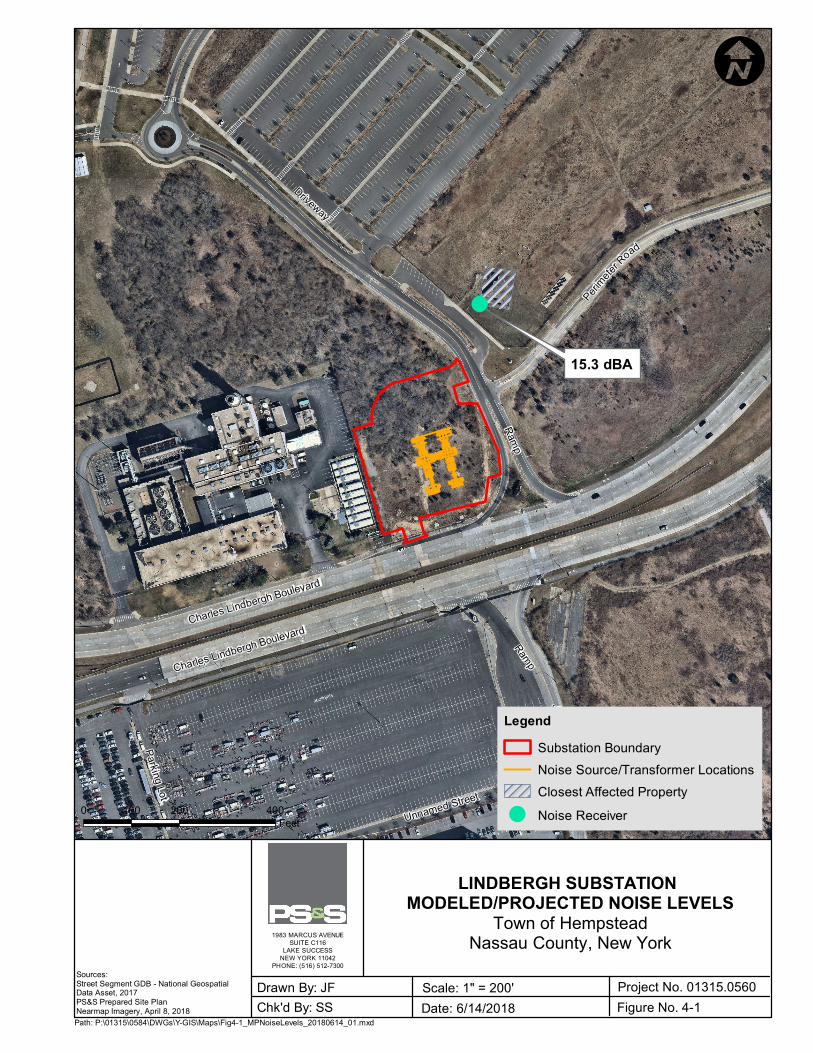
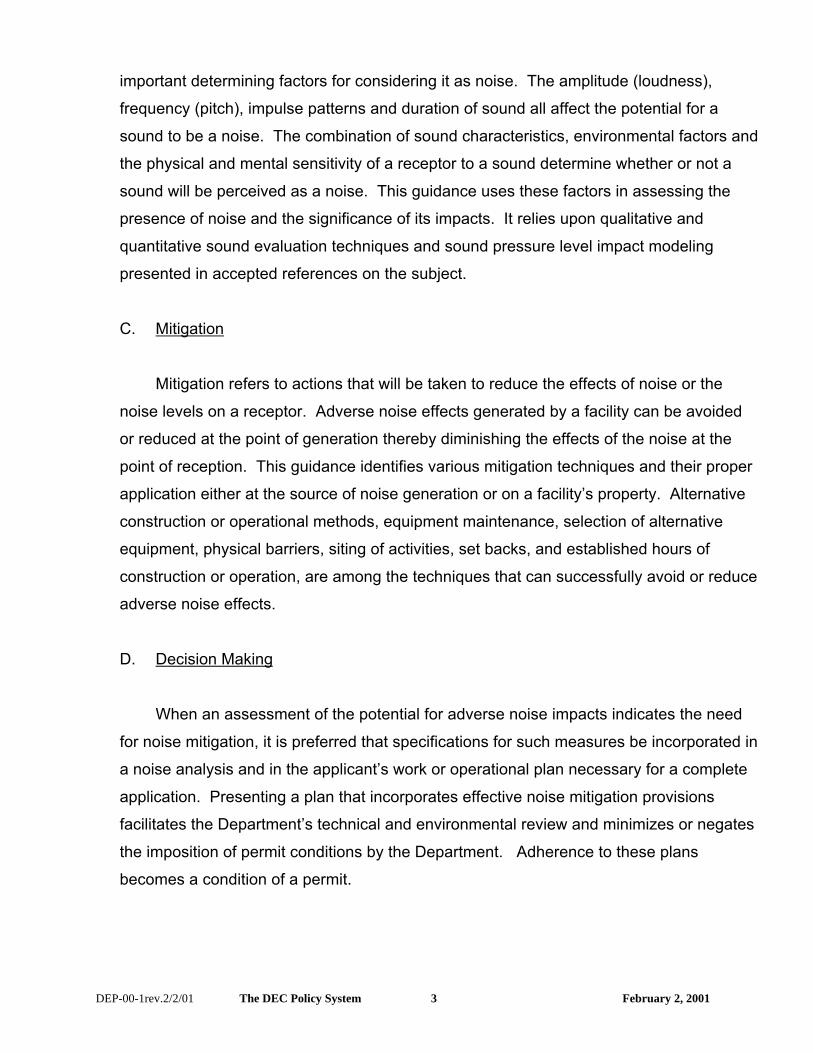
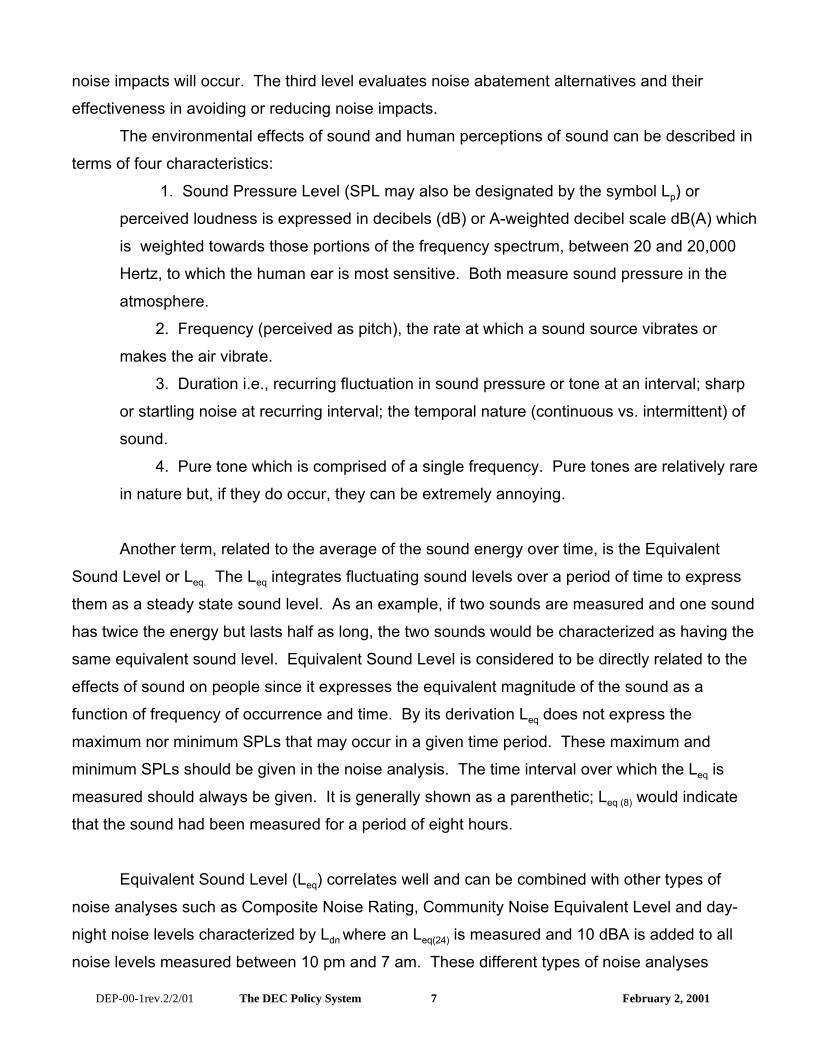
Table 4‐1 presents a summary of the noise impact modeling results at the closest property
line receptors based on worst case future noise levels from the planned new transformers
with all transformer banks operating simultaneously at maximum capacity, and Figure 4‐1
provides a printout of the model results. The modeled worst case future noise level
results were 15.3 dBA at the closest property line. These modeled worst case cumulative
total noise levels from the proposed new transformer equipment at all modeled receptor
locations are significantly lower than the existing daytime and nighttime ambient noise
levels, and will not result in any recordable (<0.1 dBA increase) or perceptible noise
increase above existing ambient noise levels. In addition, the modeled future noise
impact levels are well below the NYSDEC Noise Policy Guideline sound‐level limit of 65
dBA, and will be in compliance with the Town of Hempstead Noise Code.
4-3
Table 4-1
PSEG Long Island Proposed Lindbergh Substation
Modeled Worst Case Future Noise Impact Levels at Closest Property Lines
Receptor
No. Receptor Location
Modeled
Noise Impact
Levels (dBA)
Existing Ambient Background
Noise Levels (dBA)
Daytime Nighttime
5 Closest Property Line 15.3 65 56
!
15.3 dBA
Driveway
Ramp
Charles Lindbergh Boulevard Perim
eter Road
Ramp
Unnamed Street
Parking Lot
James Doolittle Boulevard
Charles Lindbergh Boulevard
Sources:Street Segment GDB - National GeospatialData Asset, 2017PS&S Prepared Site PlanNearmap Imagery, April 8, 2018
LINDBERGH SUBSTATION MODELED/PROJECTED NOISE LEVELS
Town of HempsteadNassau County, New York
Figure No. 4-1Project No. 01315.0560Scale: 1" = 200'
Date: 6/14/2018Drawn By: JFChk'd By: SS
I
0 200 400100Feet
LegendSubstation BoundaryNoise Source/Transformer LocationsClosest Affected Property
! Noise Receiver
Path: P:\01315\0584\DWGs\Y-GIS\Maps\Fig4-1_MPNoiseLevels_20180614_01.mxd
1983 MARCUS AVENUESUITE C116
LAKE SUCCESSNEW YORK 11042
PHONE: (516) 512-7300
SECTION 5.0
SUMMARY AND CONCLUSIONS
5-1
5.0 SUMMARY AND CONCLUSIONS
PS&S performed a Noise Impact Assessment Study for the proposed PSEG Long Island Lindbergh
Substation for improving electric service reliability in the service area, and which is planned to
include the construction of two new transformer banks. The completed Noise Impact Assessment
Study included the evaluation of the potential worst‐case future noise level impacts of the
Substation at the closest property lines in the project area as compared with the New York State
Department of Environmental Conservation (NYSDEC) Noise Policy Guidelines and the Town of
Hempstead Noise Code. The Impact Assessment included performing measurements of existing
ambient background noise levels in the project area, identification and characterization of noise
source influences in the area, noise propagation computer modeling of the anticipated worst case
future noise level contributions from the planned new transformers, and then comparing the results
of the modeling to the applicable NYSDEC Noise Policy Guidelines and measured existing
background noise levels and the Town of Hempstead Noise Code.
The conservative assumptions used in the Noise Impact Modeling evaluation included using the
worst‐case noise level operation (maximum load and cooling fan speed) for the transformers based
on the two new transformer banks operating simultaneously at maximum capacity, which typically
only occurs during hot summer days during periods of high power demand. During the nighttime
period, the transformers will typically operate at less than the maximum load with the cooling fans
not operating or operating at less than maximum capacity, and therefore typically have a reduced
sound‐level impact during the nighttime period.
Conclusions of the Noise Impact Assessment:
The existing ambient background daytime noise levels measured at the closest property lines in
the vicinity of the project site varied between 62 dBA and 74 dBA, and nighttime ambient
background noise levels varied between 56 dBA and 71 dBA, with the major noise influences in
the project area being from traffic noise from Charles Lindbergh Boulevard.
The projected (modeled) noise impact levels at the closest property line receptors based on
worst case future noise levels from the planned new transformers with both new transformer
5-2
banks operating simultaneously at maximum capacity, were 15.3 dBA at the closest property
line.
The modeled worst case cumulative total noise level impacts from the proposed new
transformer equipment at the closest property line receptor locations are significantly lower
than the existing daytime and nighttime ambient noise levels, and will not result in any
recordable (<0.1 dBA increase) or perceptible noise increase above existing ambient noise levels.
The modeled future noise impact levels at the closest property line receptor locations are well
below the NYSDEC Noise Policy Guideline sound‐level limit of 65 dBA, and will be in compliance
with the Town of Hempstead Noise Code.
It is therefore concluded that the proposed transformers will result in no change to the existing
ambient noise levels at the closest property lines in the project area, and that the proposed
transformers will be in compliance with all applicable noise standards and criteria, and all applicable
noise code limits.
APPENDIX A
NYSDEC Noise Policy Guidance
1 A Program Policy Memorandum is designed to provide guidance and clarify program issues for Division staff to ensurecompliance with statutory and regulatory requirements. It provides assistance to New York State Department of Environmental Conservation(DEC) staff and the regulated community in interpreting and applying regulations and statutes to assure that program uniformity is attainedthroughout the State. Nothing set forth in a Program Policy Memorandum prevents DEC staff from varying from that guidance as specificcircumstances may dictate, provided the staff's actions comply with applicable statutory and regulatory requirements. As this guidancedocument is not a fixed rule, it does not create any enforceable right by any party using the Program Policy Memorandum.
New York StateDepartment of Environmental Conservation
Assessing and Mitigating Noise Impacts
PROGRAM POLICY Department ID:DEP-00-1
Program ID:n/a
Issuing Authority: Environmental Conservation LawArticles 3, 8, 23, 27
Originating Unit: Division of EnvironmentalPermits
Name: Jeffrey Sama Office/Division: Environmental Permits
Title: Director Unit:
Signature: /S/ Date: 10/6/00 Phone: (518) 402-9167
Issuance Date: October 6, 2000 Revised: February 2, 2001 Latest Review Date (Office Use):
Abstract: Facility operations regulated by the Department of Environmental Conservationlocated in close proximity to other land uses can produce sound that creates significant noiseimpacts for proximal sound receptors. This policy and guidance presents noise impactassessment methods, examines the circumstances under which sound creates significant noiseimpacts, and identifies avoidance and mitigative measures to reduce or eliminate noise impacts.
Related References: See references pages 27 and 28.
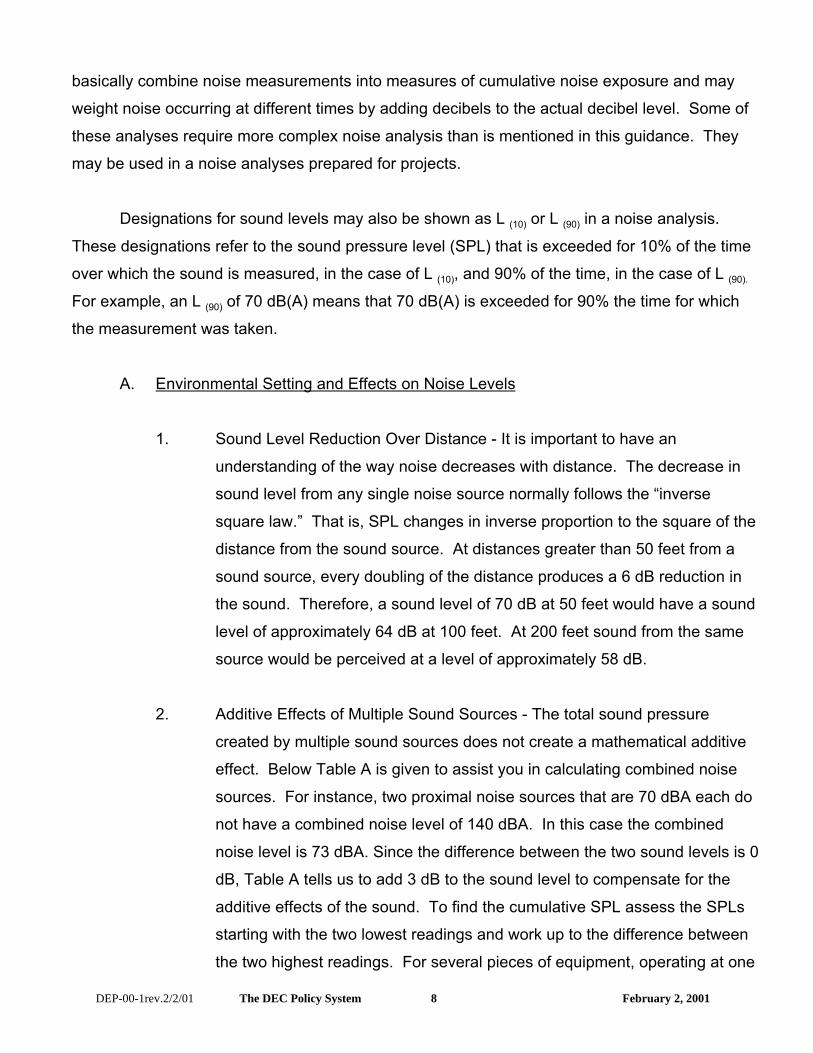
I. PURPOSE1
This policy is intended to provide direction to the staff of the Department of Environmental
Conservation for the evaluation of sound levels and characteristics (such as pitch and duration)
generated from proposed or existing facilities. This guidance also serves to identify when noise
levels may cause a significant environmental impact and gives methods for noise impact
assessment, avoidance, and reduction measures. These methods can serve as a reference to
applicants preparing environmental assessments in support of an application for a permit.
Additionally, this guidance explains the Department’s regulatory authority for undertaking noise
evaluations and for imposing conditions for noise mitigation measures in the agency’s approval
DEP-00-1rev.2/2/01 The DEC Policy System 2 February 2, 2001
of permits for various types of facilities pursuant to regulatory program regulations and the State
Environmental Quality Review Act (SEQR).
II. BACKGROUND
Noise is defined as any loud, discordant or disagreeable sound or sounds. More
commonly, in an environmental context, noise is defined simply as unwanted sound. Certain
activities inherently produce sound levels or sound characteristics that have the potential to
create noise. The sound generated by proposed or existing facilities may become noise due to
land use surrounding the facility. When lands adjoining an existing or proposed facility contain
residential, commercial, institutional or recreational uses that are proximal to the facility, noise is
likely to be a matter of concern to residents or users of adjacent lands.
A. Sources of Noise Generation
The three major categories of noise sources associated with facilities are (1) fixed
equipment or process operations; (2) mobile equipment or process operations; and (3)
transport movements of products, raw material or waste. The fixed plant may include a
very wide range of equipment including: generators; pumps; compressors; crushers of
plastics, stone or metal; grinders; screens; conveyers; storage bins; or electrical
equipment. Mobile operations may include: drilling; haulage; pug mills; mobile treatment
units; and service operations. Transport movements may include truck traffic within the
operation, loading and unloading trucks and movement in and out of the facility. Any or all
of these activities may be in operation at any one time. Singular or multiple effects of
sound generation from these operations may constitute a potential source of noise.
B. Potential for Adverse Impacts
Numerous environmental factors determine the level or perceptibility of sound at a
given point of reception. These factors include: distance from the source of sound to
receptor; surrounding terrain; ambient sound level; time of day; wind direction;
temperature gradient; and relative humidity. The characteristics of a sound are also
DEP-00-1rev.2/2/01 The DEC Policy System 3 February 2, 2001
important determining factors for considering it as noise. The amplitude (loudness),
frequency (pitch), impulse patterns and duration of sound all affect the potential for a
sound to be a noise. The combination of sound characteristics, environmental factors and
the physical and mental sensitivity of a receptor to a sound determine whether or not a
sound will be perceived as a noise. This guidance uses these factors in assessing the
presence of noise and the significance of its impacts. It relies upon qualitative and
quantitative sound evaluation techniques and sound pressure level impact modeling
presented in accepted references on the subject.
C. Mitigation
Mitigation refers to actions that will be taken to reduce the effects of noise or the
noise levels on a receptor. Adverse noise effects generated by a facility can be avoided
or reduced at the point of generation thereby diminishing the effects of the noise at the
point of reception. This guidance identifies various mitigation techniques and their proper
application either at the source of noise generation or on a facility’s property. Alternative
construction or operational methods, equipment maintenance, selection of alternative
equipment, physical barriers, siting of activities, set backs, and established hours of
construction or operation, are among the techniques that can successfully avoid or reduce
adverse noise effects.
D. Decision Making
When an assessment of the potential for adverse noise impacts indicates the need
for noise mitigation, it is preferred that specifications for such measures be incorporated in
a noise analysis and in the applicant’s work or operational plan necessary for a complete
application. Presenting a plan that incorporates effective noise mitigation provisions
facilitates the Department’s technical and environmental review and minimizes or negates
the imposition of permit conditions by the Department. Adherence to these plans
becomes a condition of a permit.
DEP-00-1rev.2/2/01 The DEC Policy System 4 February 2, 2001
Noise avoidance and mitigation measures may also be imposed directly as
conditions of permit issuance. This guidance will review the statutory authority under
which the Department can require the mitigation of noise effects.
III. POLICY
In the review of an application for a permit, the Department of Environmental
Conservation is to evaluate the potential for adverse impacts of sound generated and emanating
to receptors outside of the facility or property. When a sound level evaluation indicates that
receptors may experience sound levels or characteristics that produce significant noise impacts
or impairment of property use, the Department is to require the permittee or applicant to employ
reasonable and necessary measures to either eliminate or mitigate adverse noise effects.
Options to be used to fulfill this guidance should be implemented within the existing regulatory
and environmental review framework of the agency.
Regulatory authority for assessing and controlling noise effects are contained in both
SEQR and specific Department program regulations. Specific regulatory references are as
follows:
Section 3-0301(1)(i) of the Environmental Conservation Law (ECL) states that the
commissioner shall have the power to: “i. Provide for prevention and abatement of all water,
land and air pollution including but not limited to that related to particulates, gases, dust, vapors,
noise, radiation, odor, nutrients and heated liquids.”
To comply with Article 8 of the ECL and 6 NYCRR Part 617, State Environmental Quality
Review Act, consideration of all relevant environmental issues must be undertaken in making a
determination of environmental significance. Noise impact potential is one of many potential
issues for consideration in a SEQR review.
Environmental Conservation Law (ECL) Article 23, Title 27, Mined Land Reclamation Law
(MLRL), requires applicants for permits to prepare and submit a mined land use plan to the
Department for approval. The plan must describe, “the applicant’s mining method and measures
DEP-00-1rev.2/2/01 The DEC Policy System 5 February 2, 2001
to be taken to minimize adverse environmental impacts resulting from the mining operation.”
The provisions to be incorporated in a Mined Land Use Plan, as specified in 6 NYCRR Section
422.2, include the control of noise as a component of the plan.
The solid waste regulations at 6 NYCRR Subdivision 360-1.14(p), establish A-weighted
decibel levels that are not to be exceeded at the property line of a facility.
The Division of Air Resources has regulations in 6 NYCRR Parts 450 through 454 that
regulate the allowable sound level limits on certain motor vehicles. The statutory authority for
these regulations is found in the New York State Vehicle and Traffic Law, Article 10, Section 386.
This guidance does not supercede any local noise ordinances or regulations.
IV. RESPONSIBILITY
The environmental analyst, acting as project manager for the review of applications for
permits or permit modifications and working in concert with the program specialist, is responsible
for ensuring that sound generation and noise emanating from proposed or existing facilities are
properly evaluated. For new permits or significantly modified permits, there should be a
determination as to the potential for noise impacts, and establishment of the requirements for
noise impact assessment to be included in the application for permit. Where the Department is
lead agency, the analyst is responsible for making a determination of significance pursuant to
SEQR with respect to potential noise impacts and include documentation for such determination.
Where impacts are to be avoided or reduced through mitigation measures, the analyst, or
where there are program requirements to address noise, the program specialist, should
determine the effectiveness and feasibility of those measures and ensure that the permit
conditions contain specific details for such measures. It should also be determined if additional
measures to control noise are to be imposed as a condition of permitting. Appropriate permit
language for the permit conditions should be developed by the program specialist and the
analyst. The results of noise impact evaluations and the effectiveness of mitigation measures
DEP-00-1rev.2/2/01 The DEC Policy System 6 February 2, 2001
shall be incorporated into SEQR documents and, where necessary, permit conditions shall be
placed in final permits to ensure effective noise control.
When it is determined that potential noise effects, as well as other issues, warrant
evaluation of impacts and mitigation measures in a Draft Environmental Impact Statement (EIS)
prepared pursuant to SEQR, the environmental analyst with the Division of Environmental
Permits assumes responsibility for determining the level of evaluation needed to assess sound
level generation, noise effects, and mitigation needs and feasibility.
For existing facilities, the program specialist will determine the need for additional
mitigation measures to control noise effects either in response to complaints or other changes in
circumstances such as new noise from existing facilities or a change in land-use proximal to the
facility.
The applicant or their agent, in preparing an application for a permit and supporting
documentation, is responsible for assessing the potential noise impacts on area receptors.
When potential adverse noise impacts are identified, the applicant should incorporate noise
avoidance and reduction measures in the construction or operating plans. The applicant’s
submittal should also assess the effectiveness of proposed mitigation measures in eliminating
adverse noise reception. Where noise effects are determined to be a reason in support of a
SEQR positive declaration, the applicant shall assess noise impacts, avoidance, and mitigation
measures in a Draft EIS using methodologies acceptable to this Department.
V. PROCEDURE
The intent of this section is to: introduce terms related to noise analyses; describe some
of the various methods used to determine the impacts of sound pressure levels on receptors;
identify some of the various attenuators of noise; and list some of the mitigative techniques that
can be used to reduce the effects of noise on a receptor. At the end of the section three levels
of analysis are described. The first level determines the potential for adverse noise impacts
based on noise characteristics and sound pressure increases solely on noise attenuation over
distance between the source and receptor of the noise. The second level factors other
considerations such as topography and noise abatement measures in determining if adverse
DEP-00-1rev.2/2/01 The DEC Policy System 7 February 2, 2001
noise impacts will occur. The third level evaluates noise abatement alternatives and their
effectiveness in avoiding or reducing noise impacts.
The environmental effects of sound and human perceptions of sound can be described in
terms of four characteristics:
1. Sound Pressure Level (SPL may also be designated by the symbol Lp) or
perceived loudness is expressed in decibels (dB) or A-weighted decibel scale dB(A) which
is weighted towards those portions of the frequency spectrum, between 20 and 20,000
Hertz, to which the human ear is most sensitive. Both measure sound pressure in the
atmosphere.
2. Frequency (perceived as pitch), the rate at which a sound source vibrates or
makes the air vibrate.
3. Duration i.e., recurring fluctuation in sound pressure or tone at an interval; sharp
or startling noise at recurring interval; the temporal nature (continuous vs. intermittent) of
sound.
4. Pure tone which is comprised of a single frequency. Pure tones are relatively rare
in nature but, if they do occur, they can be extremely annoying.
Another term, related to the average of the sound energy over time, is the Equivalent
Sound Level or Leq. The Leq integrates fluctuating sound levels over a period of time to express
them as a steady state sound level. As an example, if two sounds are measured and one sound
has twice the energy but lasts half as long, the two sounds would be characterized as having the
same equivalent sound level. Equivalent Sound Level is considered to be directly related to the
effects of sound on people since it expresses the equivalent magnitude of the sound as a
function of frequency of occurrence and time. By its derivation Leq does not express the
maximum nor minimum SPLs that may occur in a given time period. These maximum and
minimum SPLs should be given in the noise analysis. The time interval over which the Leq is
measured should always be given. It is generally shown as a parenthetic; Leq (8) would indicate
that the sound had been measured for a period of eight hours.
Equivalent Sound Level (Leq) correlates well and can be combined with other types of
noise analyses such as Composite Noise Rating, Community Noise Equivalent Level and day-
night noise levels characterized by Ldn where an Leq(24) is measured and 10 dBA is added to all
noise levels measured between 10 pm and 7 am. These different types of noise analyses
DEP-00-1rev.2/2/01 The DEC Policy System 8 February 2, 2001
basically combine noise measurements into measures of cumulative noise exposure and may
weight noise occurring at different times by adding decibels to the actual decibel level. Some of
these analyses require more complex noise analysis than is mentioned in this guidance. They
may be used in a noise analyses prepared for projects.
Designations for sound levels may also be shown as L (10) or L (90) in a noise analysis.
These designations refer to the sound pressure level (SPL) that is exceeded for 10% of the time
over which the sound is measured, in the case of L (10), and 90% of the time, in the case of L (90).
For example, an L (90) of 70 dB(A) means that 70 dB(A) is exceeded for 90% the time for which
the measurement was taken.
A. Environmental Setting and Effects on Noise Levels
1. Sound Level Reduction Over Distance - It is important to have an
understanding of the way noise decreases with distance. The decrease in
sound level from any single noise source normally follows the “inverse
square law.” That is, SPL changes in inverse proportion to the square of the
distance from the sound source. At distances greater than 50 feet from a
sound source, every doubling of the distance produces a 6 dB reduction in
the sound. Therefore, a sound level of 70 dB at 50 feet would have a sound
level of approximately 64 dB at 100 feet. At 200 feet sound from the same
source would be perceived at a level of approximately 58 dB.
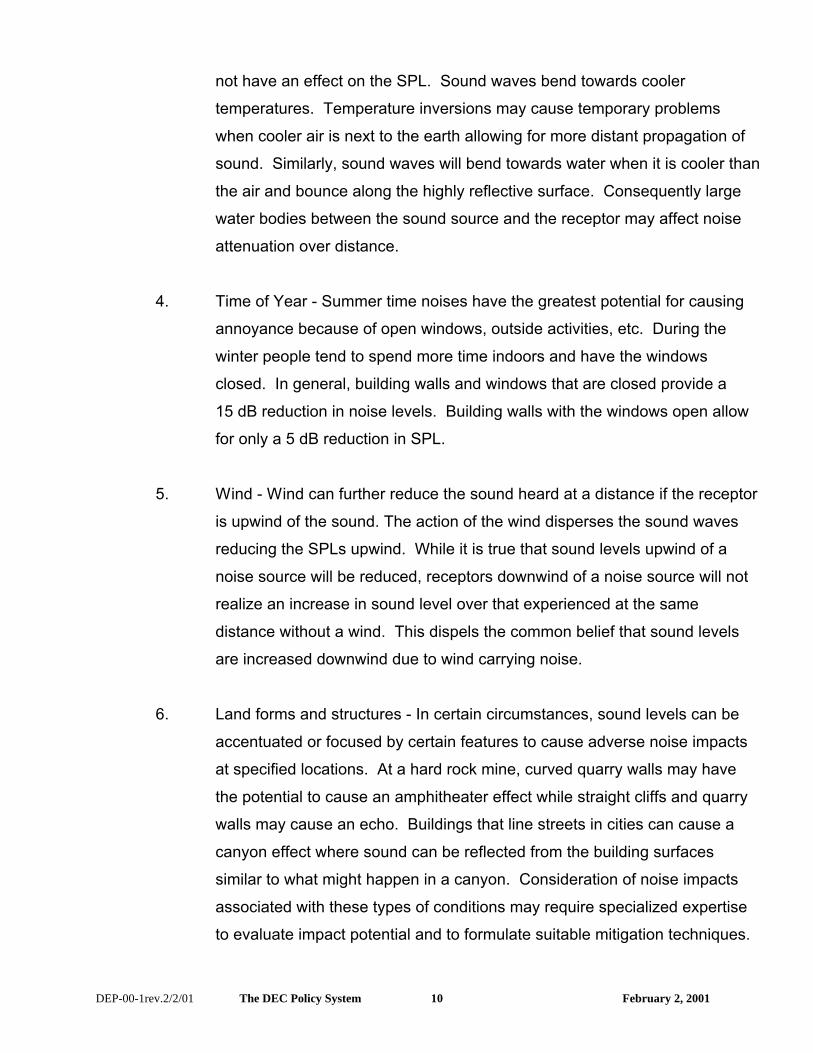
2. Additive Effects of Multiple Sound Sources - The total sound pressure
created by multiple sound sources does not create a mathematical additive
effect. Below Table A is given to assist you in calculating combined noise
sources. For instance, two proximal noise sources that are 70 dBA each do
not have a combined noise level of 140 dBA. In this case the combined
noise level is 73 dBA. Since the difference between the two sound levels is 0
dB, Table A tells us to add 3 dB to the sound level to compensate for the
additive effects of the sound. To find the cumulative SPL assess the SPLs
starting with the two lowest readings and work up to the difference between
the two highest readings. For several pieces of equipment, operating at one
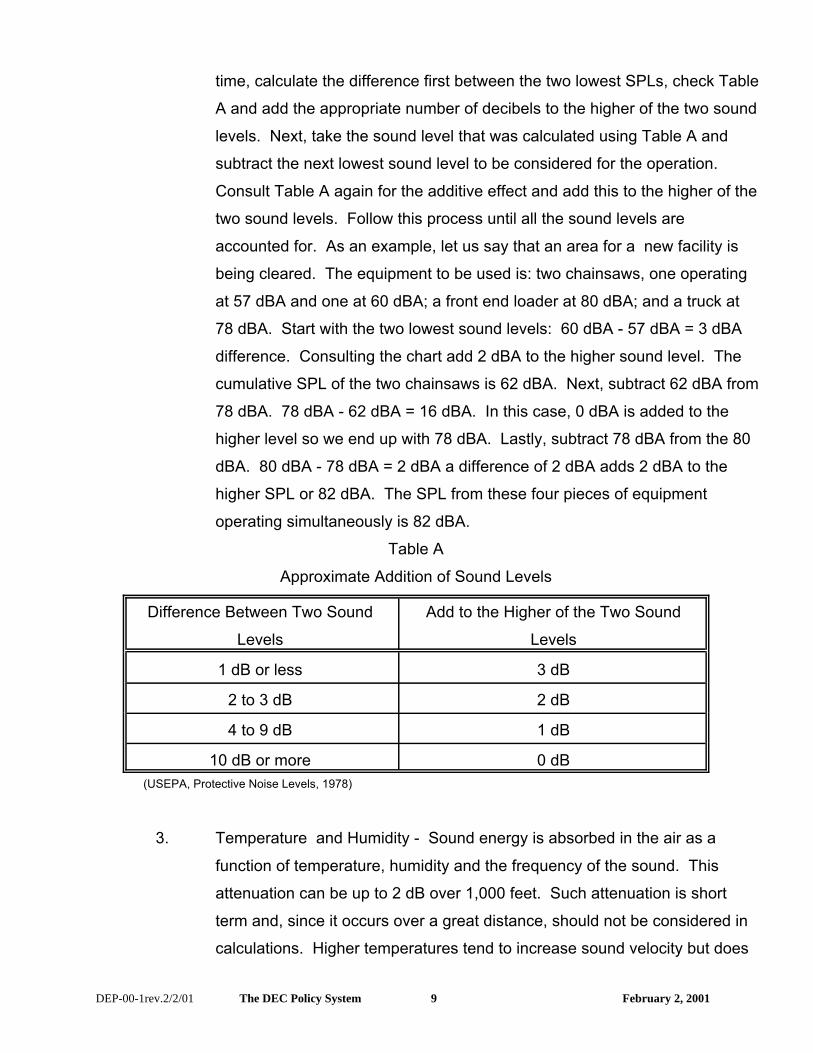
DEP-00-1rev.2/2/01 The DEC Policy System 9 February 2, 2001
time, calculate the difference first between the two lowest SPLs, check Table
A and add the appropriate number of decibels to the higher of the two sound
levels. Next, take the sound level that was calculated using Table A and
subtract the next lowest sound level to be considered for the operation.
Consult Table A again for the additive effect and add this to the higher of the
two sound levels. Follow this process until all the sound levels are
accounted for. As an example, let us say that an area for a new facility is
being cleared. The equipment to be used is: two chainsaws, one operating
at 57 dBA and one at 60 dBA; a front end loader at 80 dBA; and a truck at
78 dBA. Start with the two lowest sound levels: 60 dBA - 57 dBA = 3 dBA
difference. Consulting the chart add 2 dBA to the higher sound level. The
cumulative SPL of the two chainsaws is 62 dBA. Next, subtract 62 dBA from
78 dBA. 78 dBA - 62 dBA = 16 dBA. In this case, 0 dBA is added to the
higher level so we end up with 78 dBA. Lastly, subtract 78 dBA from the 80
dBA. 80 dBA - 78 dBA = 2 dBA a difference of 2 dBA adds 2 dBA to the
higher SPL or 82 dBA. The SPL from these four pieces of equipment
operating simultaneously is 82 dBA.
Table A
Approximate Addition of Sound Levels
Difference Between Two Sound
Levels
Add to the Higher of the Two Sound
Levels
1 dB or less 3 dB
2 to 3 dB 2 dB
4 to 9 dB 1 dB
10 dB or more 0 dB (USEPA, Protective Noise Levels, 1978)
3. Temperature and Humidity - Sound energy is absorbed in the air as a
function of temperature, humidity and the frequency of the sound. This
attenuation can be up to 2 dB over 1,000 feet. Such attenuation is short
term and, since it occurs over a great distance, should not be considered in
calculations. Higher temperatures tend to increase sound velocity but does
DEP-00-1rev.2/2/01 The DEC Policy System 10 February 2, 2001
not have an effect on the SPL. Sound waves bend towards cooler
temperatures. Temperature inversions may cause temporary problems
when cooler air is next to the earth allowing for more distant propagation of
sound. Similarly, sound waves will bend towards water when it is cooler than
the air and bounce along the highly reflective surface. Consequently large
water bodies between the sound source and the receptor may affect noise
attenuation over distance.
4. Time of Year - Summer time noises have the greatest potential for causing
annoyance because of open windows, outside activities, etc. During the
winter people tend to spend more time indoors and have the windows
closed. In general, building walls and windows that are closed provide a
15 dB reduction in noise levels. Building walls with the windows open allow
for only a 5 dB reduction in SPL.
5. Wind - Wind can further reduce the sound heard at a distance if the receptor
is upwind of the sound. The action of the wind disperses the sound waves
reducing the SPLs upwind. While it is true that sound levels upwind of a
noise source will be reduced, receptors downwind of a noise source will not
realize an increase in sound level over that experienced at the same
distance without a wind. This dispels the common belief that sound levels
are increased downwind due to wind carrying noise.
6. Land forms and structures - In certain circumstances, sound levels can be
accentuated or focused by certain features to cause adverse noise impacts
at specified locations. At a hard rock mine, curved quarry walls may have
the potential to cause an amphitheater effect while straight cliffs and quarry
walls may cause an echo. Buildings that line streets in cities can cause a
canyon effect where sound can be reflected from the building surfaces
similar to what might happen in a canyon. Consideration of noise impacts
associated with these types of conditions may require specialized expertise
to evaluate impact potential and to formulate suitable mitigation techniques.
DEP-00-1rev.2/2/01 The DEC Policy System 11 February 2, 2001
Consideration of existing noise sources and sound receptors in proximity to a
proposed activity can be important considerations even when the activity under review is
not a noise source. Topography, vegetation, structures and the relative location of noise
receptors and sources to these features are all aspects of the environmental setting that
can influence noise impact potential. As such, land alteration may also indirectly create
an adverse noise impact where natural land features or manmade features serve as a
noise barrier or provide noise attenuation for existing sources of noise, i.e. highway,
railroads, manufacturing activity. Removal of these features, i.e. hills, vegetation, large
structures or walls, can expose receptors to increased sound pressure levels causing
noise problems where none had previously existed.
B. Impact Assessment
1. Factors to Consider
Factors to consider in determining the impact of noise on humans, are as follows:
a. Evaluation of Sound Characteristics
(1) Ambient noise level - A noise can only intrude if it differs in character or
SPL from the normal ambient sound. Most objective attempts to assess
nuisance noise adopt the technique of comparing the noise with actual
ambient sound levels or with some derived criterion.
(2) Future noise level - The ambient noise level plus the noise level from the
new or proposed source.
(3) Increase In Sound Pressure Level - A significant factor in determining the
annoyance of a noise is Sound Pressure Level (SPL). SPLs are
measured in decibels.
(4) Sharp and Startling Noise - These high frequency and high intensity
noises can be extremely annoying. When initially evaluating the effects
DEP-00-1rev.2/2/01 The DEC Policy System 12 February 2, 2001
of noise from an operation, pay particular attention to noises that can be
particularly annoying. One such noise is the back-up beepers required to
be used on machinery. They definitely catch one’s attention as they
were meant to do. Continual beeping by machinery can be mitigated
(see Section V.C. Mitigation - Best Management Practices). Another
impulse noise source that can be very annoying is the exhaust from
compressed air machinery. This exhaust is usually released in loud
bursts. Compressed air exhaust can also be mitigated if it causes a
noise problem by using readily available mufflers or specifically designed
enclosures.
(5) Frequency and Tone - Frequency is the rate at which a sound source
vibrates or makes the air vibrate. Frequency is measured in Hertz (Hz).
Frequency can also be classified as high (“sharp”), low (“dull”), and
moderate. Pure tones are rare in nature. Tonal sounds usually consist
of pure tones at several frequencies. Pure tones and tonal sounds are
discerned more readily by the human ear. Pure tones and tonal sounds
are compensated for in sound studies by adding a calculated number of
dB(A) to the measured sound pressure.
(6) Percentile of Sound Levels - Fluctuations of SPLs can be expressed as a
percentile level designated as L(n) where a given decibel level is
exceeded n % of the time. A designation of L(10) = 70 dBA means the
measured SPLs exceeded 70 dBA 10% of the time. A designation of L(90)
= 70 dBA means the measured SPLs were exceeded 90% of the time.
L(90) is often used to designate the background noise level.
(7) Expression of Overall Sound - Part of the overall assessment of sound is
the Equivalent Sound Level (Leq) which assigns a single value of sound
level for a period of time in which varying levels of sound are experienced
over that time period. The L eq value provides an indication of the effects
of sound on people. It is also useful in establishing the ambient sound
levels at a potential noise source.
DEP-00-1rev.2/2/01 The DEC Policy System 13 February 2, 2001
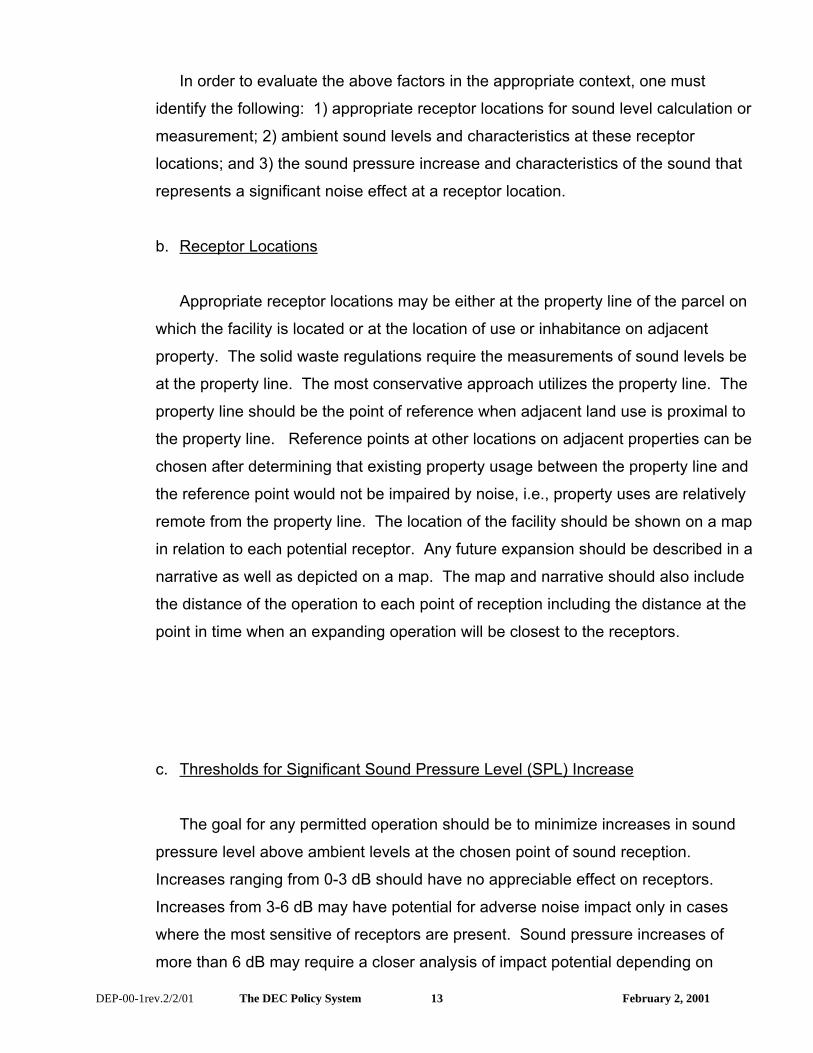
In order to evaluate the above factors in the appropriate context, one must
identify the following: 1) appropriate receptor locations for sound level calculation or
measurement; 2) ambient sound levels and characteristics at these receptor
locations; and 3) the sound pressure increase and characteristics of the sound that
represents a significant noise effect at a receptor location.
b. Receptor Locations
Appropriate receptor locations may be either at the property line of the parcel on
which the facility is located or at the location of use or inhabitance on adjacent
property. The solid waste regulations require the measurements of sound levels be
at the property line. The most conservative approach utilizes the property line. The
property line should be the point of reference when adjacent land use is proximal to
the property line. Reference points at other locations on adjacent properties can be
chosen after determining that existing property usage between the property line and
the reference point would not be impaired by noise, i.e., property uses are relatively
remote from the property line. The location of the facility should be shown on a map
in relation to each potential receptor. Any future expansion should be described in a
narrative as well as depicted on a map. The map and narrative should also include
the distance of the operation to each point of reception including the distance at the
point in time when an expanding operation will be closest to the receptors.
c. Thresholds for Significant Sound Pressure Level (SPL) Increase
The goal for any permitted operation should be to minimize increases in sound
pressure level above ambient levels at the chosen point of sound reception.
Increases ranging from 0-3 dB should have no appreciable effect on receptors.
Increases from 3-6 dB may have potential for adverse noise impact only in cases
where the most sensitive of receptors are present. Sound pressure increases of
more than 6 dB may require a closer analysis of impact potential depending on

DEP-00-1rev.2/2/01 The DEC Policy System 14 February 2, 2001
existing SPLs and the character of surrounding land use and receptors. SPL
increases approaching 10 dB result in a perceived doubling of SPL. The perceived
doubling of the SPL results from the fact that SPLs are measured on a logarithmic
scale. An increase of 10 dB(A) deserves consideration of avoidance and mitigation
measures in most cases. The above thresholds as indicators of impact potential
should be viewed as guidelines subject to adjustment as appropriate for the specific
circumstances one encounters.
Establishing a maximum SPL at the point of reception can be an appropriate
approach to addressing potential adverse noise impacts. Noise thresholds are
established for solid waste management facilities in the Department’s Solid Waste
regulations, 6 NYCRR Part 360. Most humans find a sound level of 60 - 70 dB(A) as
beginning to create a condition of significant noise effect (EPA 550/9-79-100,
November 1978). In general, the EPA’s “Protective Noise Levels” guidance found
that ambient noise levels # 55 dBA L(dn) was sufficient to protect public health and
welfare and, in most cases, did not create an annoyance (EPA 550/9-79-100,
November 1978). In non-industrial settings the SPL should probably not exceed
ambient noise by more than 6 dB(A) at the receptor. An increase of 6 dB(A) may
cause complaints. There may be occasions where an increase in SPLs of greater
than 6 dB(A) might be acceptable. The addition of any noise source, in a non-
industrial setting, should not raise the ambient noise level above a maximum of 65
dB(A). This would be considered the “upper end” limit since 65 dB(A) allows for
undisturbed speech at a distance of approximately three feet. Some outdoor
activities can be conducted at a SPL of 65 dB(A). Still lower ambient noise levels
may be necessary if there are sensitive receptors nearby. These goals can be
attained by using the mitigative techniques outlined in this guidance.
Ambient noise SPLs in industrial or commercial areas may exceed 65 dB(A) with
a high end of approximately 79 dB(A) (EPA 550/9-79-100, November 1979). In
these instances mitigative measures utilizing best management practices should be
used in an effort to ensure that a facility’s generated sound levels are at a minimum.
The goal in an industrial/commercial area, where ambient SPLs are already at a high
level, should be not to exceed the ambient SPL. Remember, if a new source
DEP-00-1rev.2/2/01 The DEC Policy System 15 February 2, 2001
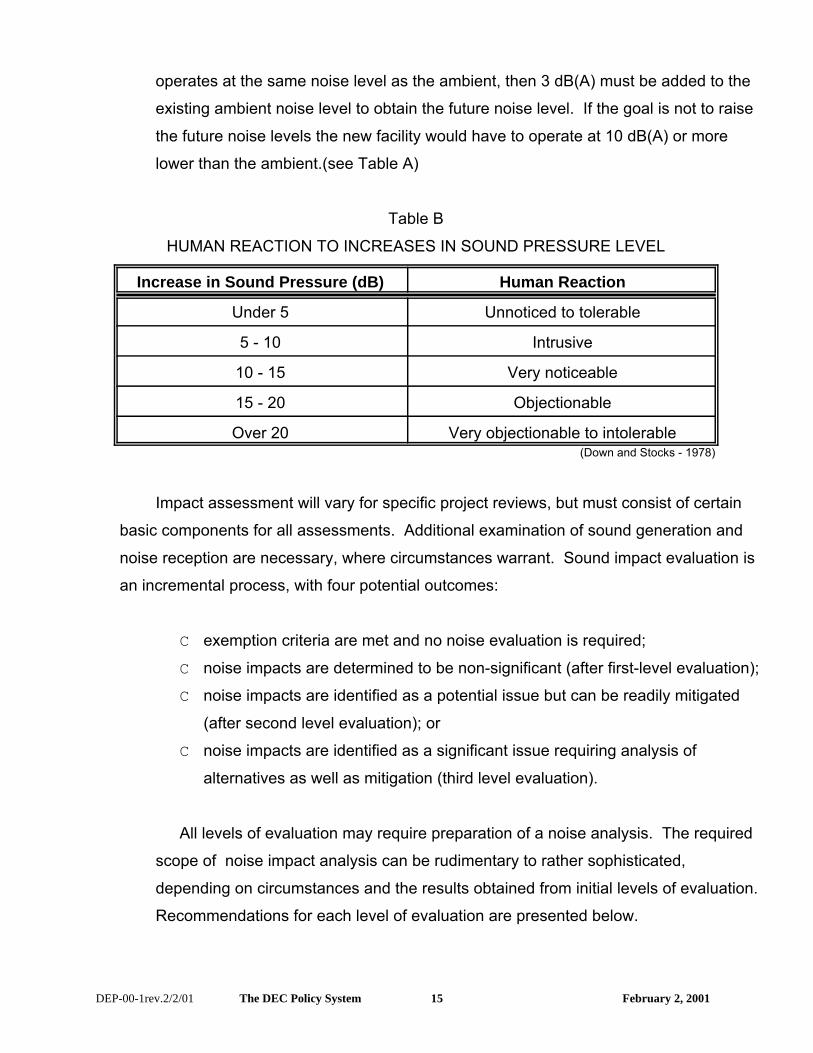
operates at the same noise level as the ambient, then 3 dB(A) must be added to the
existing ambient noise level to obtain the future noise level. If the goal is not to raise
the future noise levels the new facility would have to operate at 10 dB(A) or more
lower than the ambient.(see Table A)
Table B
HUMAN REACTION TO INCREASES IN SOUND PRESSURE LEVEL
Increase in Sound Pressure (dB) Human Reaction
Under 5 Unnoticed to tolerable
5 - 10 Intrusive
10 - 15 Very noticeable
15 - 20 Objectionable
Over 20 Very objectionable to intolerable(Down and Stocks - 1978)
Impact assessment will vary for specific project reviews, but must consist of certain
basic components for all assessments. Additional examination of sound generation and
noise reception are necessary, where circumstances warrant. Sound impact evaluation is
an incremental process, with four potential outcomes:
C exemption criteria are met and no noise evaluation is required;
C noise impacts are determined to be non-significant (after first-level evaluation);
C noise impacts are identified as a potential issue but can be readily mitigated
(after second level evaluation); or
C noise impacts are identified as a significant issue requiring analysis of
alternatives as well as mitigation (third level evaluation).
All levels of evaluation may require preparation of a noise analysis. The required
scope of noise impact analysis can be rudimentary to rather sophisticated,
depending on circumstances and the results obtained from initial levels of evaluation.
Recommendations for each level of evaluation are presented below.

DEP-00-1rev.2/2/01 The DEC Policy System 16 February 2, 2001
2. Situations in Which No Noise Evaluation is Necessary
When certain criteria are satisfied, the need for undertaking a noise impact
analysis at any level is eliminated. These criteria are as follows:
a. The site is contained within an area in which local zoning provides for the
intended use as a “right of use”. It does not apply to activities that are
permissible only after an applicant is granted a special use permit by the local
government; and
b. The applicant’s operational plan incorporates appropriate best management
practices (BMPs [see Section V.C. Mitigation - Best Management Practices])
for noise control for all facets of the operation.
Where activities may be undertaken as a “right of use”, it is presumed that noise
has been addressed in establishing the zoning. Any residual noise that is present
following BMP implementation should be considered an inherent component of the
activity that has been found acceptable in consideration of the zoning designation of
the site.
3. First Level Noise Impact Evaluation
The initial evaluation for most facilities should determine the maximum amount of
sound created at a single point in time by multiple activities for the proposed project.
All facets of the construction and operation that produce noise should be included
such as land clearing activities (chain saw and equipment operation), drilling,
equipment operation for excavating, hauling or conveying materials, pile driving, steel
work, material processing, product storage and removal. Land clearing and
construction may be only temporary noise at the site whereas the ongoing operation
of a facility would be considered permanent noise. An analysis may be required for
DEP-00-1rev.2/2/01 The DEC Policy System 17 February 2, 2001
various phases of the construction and operation of the project to assure that
adverse noise effects do not occur at any phase.
To calculate the sound generated by equipment operation, one can consult the
manufacturers’ specifications for sound generation, available for various types of
equipment. Another option for calculating the sound to be generated by equipment is
to make actual measurements of sound generated by existing similar equipment,
elsewhere.
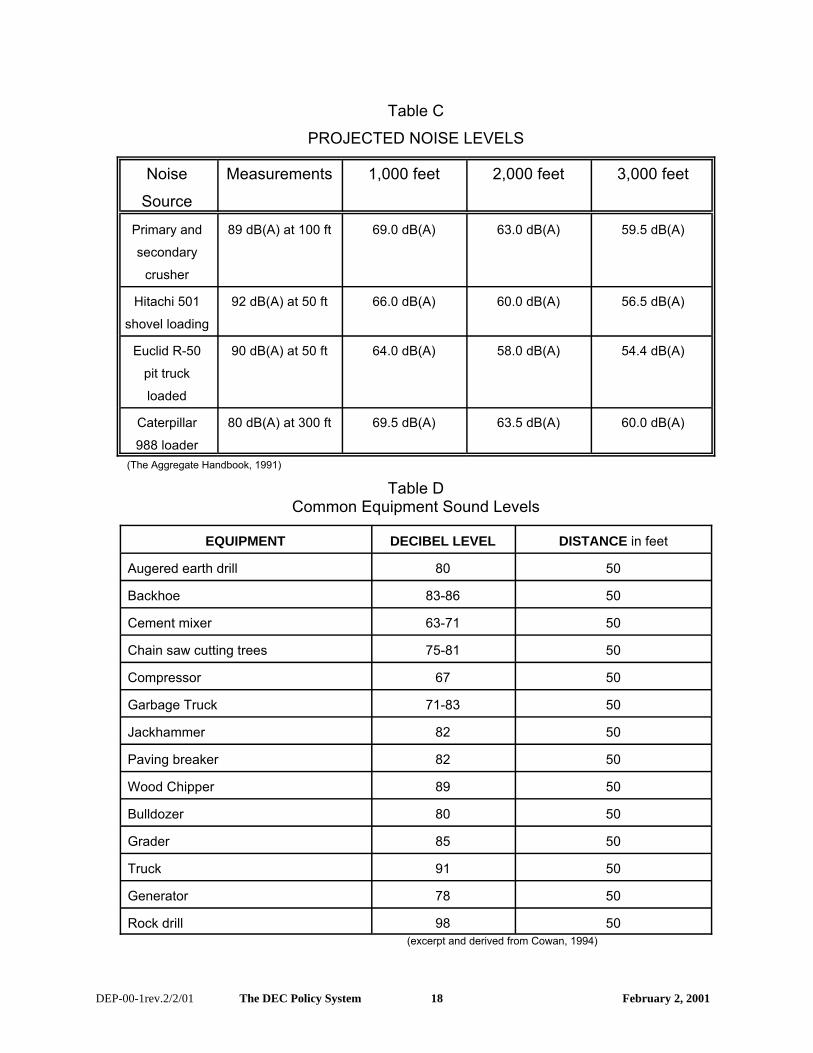
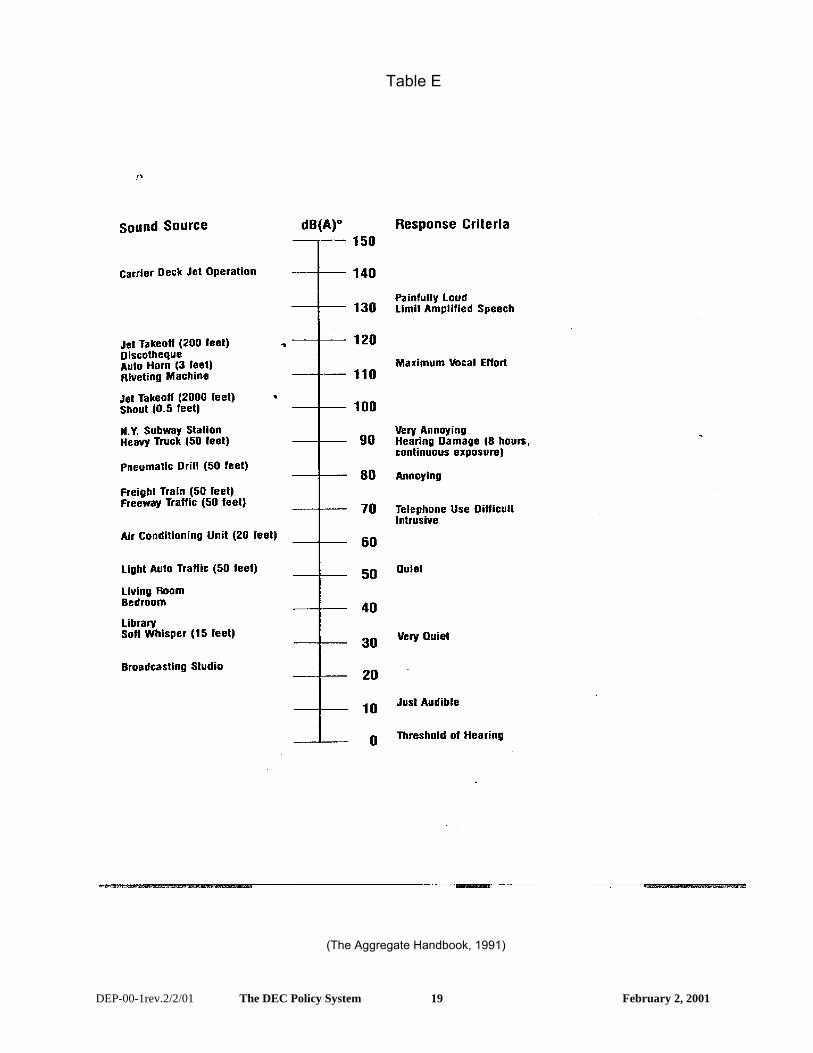
Tables C and D summarize noise measurements from some common equipment
used in construction and mining. Table E summarizes the noise level, in decibels
(dB[A]), from some common sources. This information can be used to assist
Department staff in relating potential noise impacts to sound levels produced by
commercial and industrial activities. Use of these tables in the first level of analysis
will help determine whether or not noise will be an issue and whether actual
measurements should be made to confirm noise levels.
DEP-00-1rev.2/2/01 The DEC Policy System 18 February 2, 2001
Table C
PROJECTED NOISE LEVELS
Noise
Source
Measurements 1,000 feet 2,000 feet 3,000 feet
Primary and
secondary
crusher
89 dB(A) at 100 ft 69.0 dB(A) 63.0 dB(A) 59.5 dB(A)
Hitachi 501
shovel loading
92 dB(A) at 50 ft 66.0 dB(A) 60.0 dB(A) 56.5 dB(A)
Euclid R-50
pit truck
loaded
90 dB(A) at 50 ft 64.0 dB(A) 58.0 dB(A) 54.4 dB(A)
Caterpillar
988 loader
80 dB(A) at 300 ft 69.5 dB(A) 63.5 dB(A) 60.0 dB(A)
(The Aggregate Handbook, 1991)
Table DCommon Equipment Sound Levels
EQUIPMENT DECIBEL LEVEL DISTANCE in feet
Augered earth drill 80 50
Backhoe 83-86 50
Cement mixer 63-71 50
Chain saw cutting trees 75-81 50
Compressor 67 50
Garbage Truck 71-83 50
Jackhammer 82 50
Paving breaker 82 50
Wood Chipper 89 50
Bulldozer 80 50
Grader 85 50
Truck 91 50
Generator 78 50
Rock drill 98 50(excerpt and derived from Cowan, 1994)
DEP-00-1rev.2/2/01 The DEC Policy System 19 February 2, 2001
Table E
(The Aggregate Handbook, 1991)
DEP-00-1rev.2/2/01 The DEC Policy System 20 February 2, 2001
The sound level at receptor locations should be calculated using the inverse
square rule whereby sound is attenuated over distance. Again, each doubling of the
distance from the source of a noise decreases the SPL by 6 dB(A) at distances
greater than 50 feet. This calculation should first consider the straight line distance
between the point of noise generation and the point of noise reception with the
presumption that no natural or manmade features exist along the transect between
the two points that would further attenuate sound level. Calculations should be
performed for each point of reception in all directions being careful to evaluate the
worst case noise impact potential by considering activities at the point where they
would be closest to a receptor. The sound level calculated for the point of reception
should be related to ambient sound levels. Ambient sound levels can be either
measured or assumed based on established references for the environmental setting
and land use at the point of reception. For estimation purposes, ambient SPLs will
vary from approximately 35 dB(A) in a wilderness area to approximately 87 dB(A) in
a highly industrial setting. A quiet seemingly serene setting such as rural farm land
will be at the lower end of the scale at about 45 dB(A), whereas an urban industrial
area will be at the high end of this scale at around 79 dB(A) (EPA 550/9-79-100,
November 1978). If there is any concern that levels based on reference values do
not accurately reflect ambient SPL, field measurements should be undertaken to
determine ambient SPLs.
Where this evaluation indicates that sound levels at the point of reception will not
be perceptible, similar to or only slightly elevated as compared to ambient conditions,
no further evaluation is required. When there is an indication from this initial analysis
that marginal or significant noise impact may occur, further evaluation is required. In
determining the potential for an adverse noise impact, consider not only ambient
noise levels, but also the existing land use, and whether or not an increased noise
level or the introduction of a discernable sound, that is out of character with existing
sounds, will be considered annoying or obtrusive. (see B.1.a Evaluation of Sound
Characteristics)
4. Second Level Noise Impact Evaluation
DEP-00-1rev.2/2/01 The DEC Policy System 21 February 2, 2001
Further refine the evaluation of noise impact potential by factoring in any
additional noise attenuation that will be provided by existing natural topography,
fabricated structures such as buildings, walls or berms or vegetation located between
the point of noise generation and noise reception. This analysis may require
consideration of future conditions and the loss of natural noise buffers over time.
Dense vegetation that is at least 100 feet in depth will reduce the sound levels by
3 to 7 dB(A). Evergreens provide a better vegetative screen than deciduous trees.
Keep in mind that if a vegetative screen does not currently exist, planting a
vegetative screen may require 15 or more years of growth before it becomes
effective.
The degree to which topography attenuates noise depends on how close the
feature is located to the source or the receptor of the noise. Topography can act as
a natural screen. The closer a hill or other barrier is to the noise source or the
receptor, the larger the sound shadow will be on the side opposite the noise source.
Certain operations such as mining and landfills may be able to use topography to
maintain a screen between the operation and receptors as they progress. Mining
operations may be able to create screens by opening a mine in the center of the site
using and maintaining the pit walls as barriers against sound (Aggregate Handbook,
1991).
If after taking into account all the attenuating features the potential still exists for
adverse noise impact, other types of noise analyses or modeling should be used to
characterize the source. An Equivalent Sound Level (L eq ) analysis or a related type
of noise analysis may better define activities or sources that require more mitigation
or isolation so that noise emanating from these sources will not cause an adverse
impact.
Where it is demonstrated that noise absorbing or deflecting features further
attenuate sound reception to a level of no significant increase, no further analysis is
necessary. Where it is determined that noise level or the character of the noise may
DEP-00-1rev.2/2/01 The DEC Policy System 22 February 2, 2001
have a significant adverse effect on receptors, other noise mitigation measures
should be evaluated in an expanded noise analysis.
5. Third Level - Mitigation Measures
When the above analyses indicate significant noise effects may or will occur, the
applicant should evaluate options for implementation of mitigation measures that
avoid, or diminish significant noise effects to acceptable levels (see Section V.C.
Mitigation - Best Management Practices). Adequate details concerning mitigation
measures and an evaluation of the effectiveness of the mitigative measures through
additional sound level calculations should be provided in a noise analysis. These
calculations are to factor in the noise reduction or avoidance capabilities of the
mitigation measures. In circumstances where noise effects cannot readily be
reduced to a level of no significance by project design or operational features in the
application, the applicant must evaluate alternatives and mitigation measures in an
environmental impact statement to avoid or reduce impacts to the maximum extent
practicable per the requirements of the State Environmental Quality Review Act
(SEQR).
The noise analysis should be part of the application or a supplement to it, and will
be part of the SEQR environmental assessment by reference. Duplicative noise
analysis information is not required for the permit application and the assessment of
impacts under SEQR. A proper analysis can satisfy information needs for both
purposes.
DEP-00-1rev.2/2/01 The DEC Policy System 23 February 2, 2001
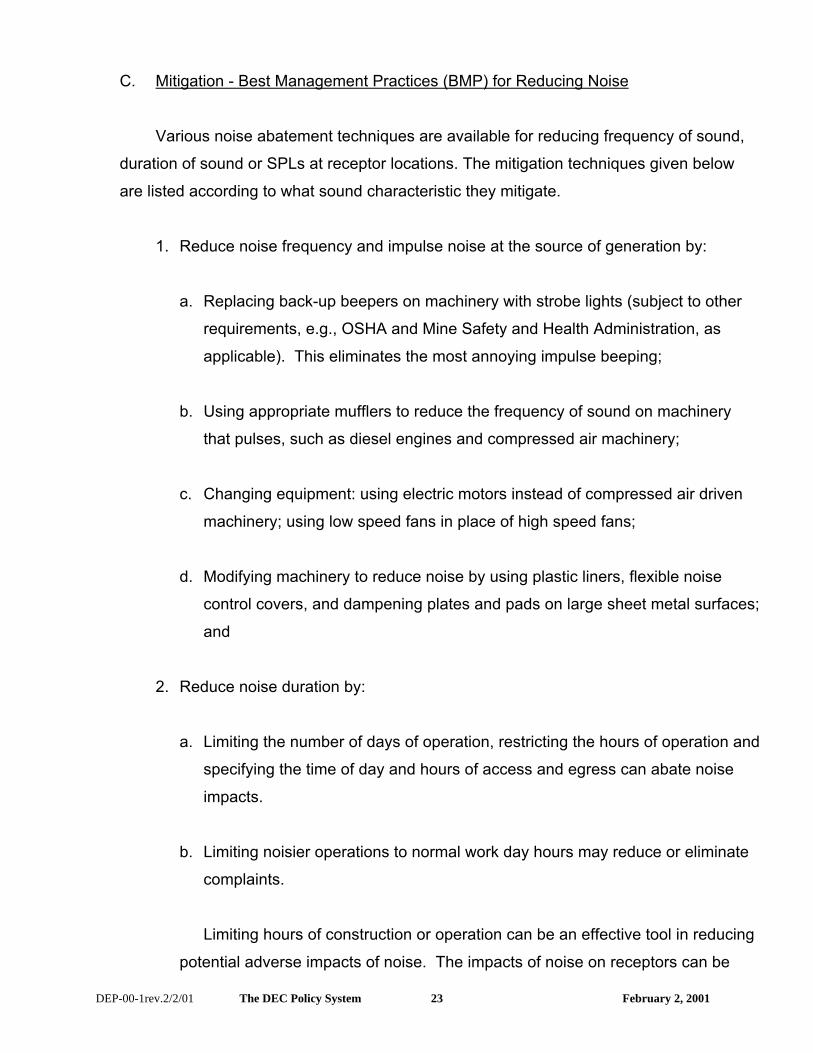
C. Mitigation - Best Management Practices (BMP) for Reducing Noise
Various noise abatement techniques are available for reducing frequency of sound,
duration of sound or SPLs at receptor locations. The mitigation techniques given below
are listed according to what sound characteristic they mitigate.
1. Reduce noise frequency and impulse noise at the source of generation by:
a. Replacing back-up beepers on machinery with strobe lights (subject to other
requirements, e.g., OSHA and Mine Safety and Health Administration, as
applicable). This eliminates the most annoying impulse beeping;
b. Using appropriate mufflers to reduce the frequency of sound on machinery
that pulses, such as diesel engines and compressed air machinery;
c. Changing equipment: using electric motors instead of compressed air driven
machinery; using low speed fans in place of high speed fans;
d. Modifying machinery to reduce noise by using plastic liners, flexible noise
control covers, and dampening plates and pads on large sheet metal surfaces;
and
2. Reduce noise duration by:
a. Limiting the number of days of operation, restricting the hours of operation and
specifying the time of day and hours of access and egress can abate noise
impacts.
b. Limiting noisier operations to normal work day hours may reduce or eliminate
complaints.
Limiting hours of construction or operation can be an effective tool in reducing
potential adverse impacts of noise. The impacts of noise on receptors can be
DEP-00-1rev.2/2/01 The DEC Policy System 24 February 2, 2001
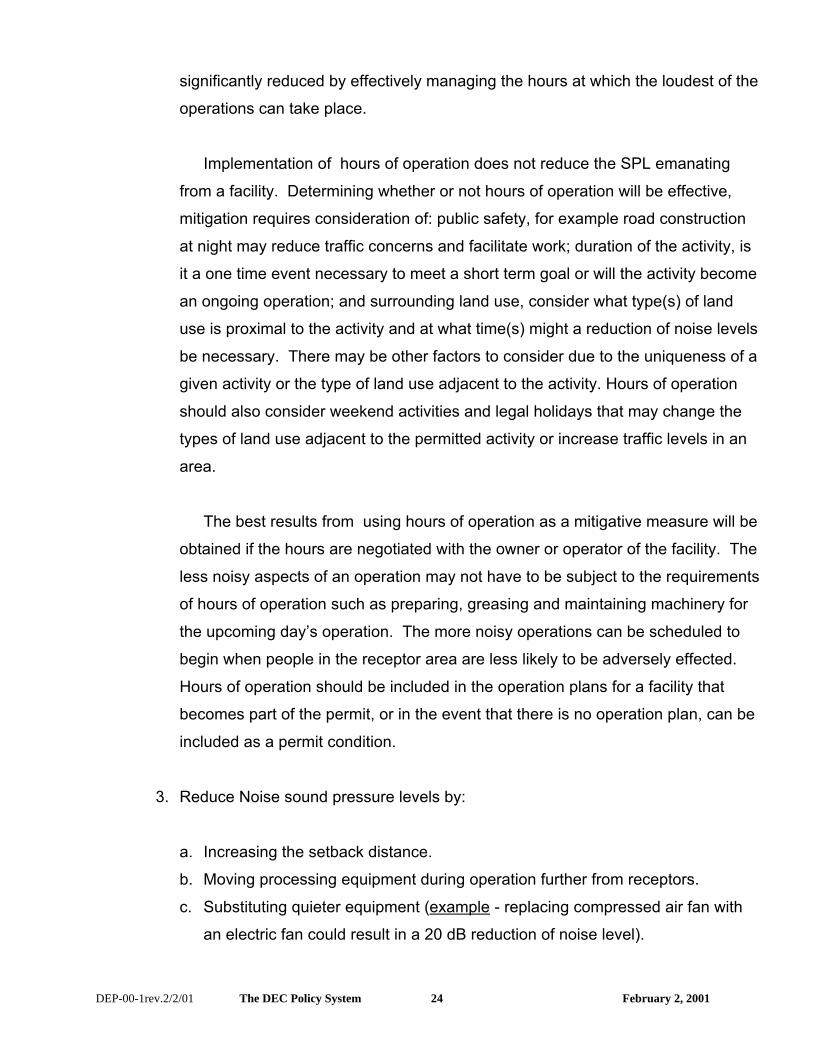
significantly reduced by effectively managing the hours at which the loudest of the
operations can take place.
Implementation of hours of operation does not reduce the SPL emanating
from a facility. Determining whether or not hours of operation will be effective,
mitigation requires consideration of: public safety, for example road construction
at night may reduce traffic concerns and facilitate work; duration of the activity, is
it a one time event necessary to meet a short term goal or will the activity become
an ongoing operation; and surrounding land use, consider what type(s) of land
use is proximal to the activity and at what time(s) might a reduction of noise levels
be necessary. There may be other factors to consider due to the uniqueness of a
given activity or the type of land use adjacent to the activity. Hours of operation
should also consider weekend activities and legal holidays that may change the
types of land use adjacent to the permitted activity or increase traffic levels in an
area.
The best results from using hours of operation as a mitigative measure will be
obtained if the hours are negotiated with the owner or operator of the facility. The
less noisy aspects of an operation may not have to be subject to the requirements
of hours of operation such as preparing, greasing and maintaining machinery for
the upcoming day’s operation. The more noisy operations can be scheduled to
begin when people in the receptor area are less likely to be adversely effected.
Hours of operation should be included in the operation plans for a facility that
becomes part of the permit, or in the event that there is no operation plan, can be
included as a permit condition.
3. Reduce Noise sound pressure levels by:
a. Increasing the setback distance.
b. Moving processing equipment during operation further from receptors.
c. Substituting quieter equipment (example - replacing compressed air fan with
an electric fan could result in a 20 dB reduction of noise level).
DEP-00-1rev.2/2/01 The DEC Policy System 25 February 2, 2001
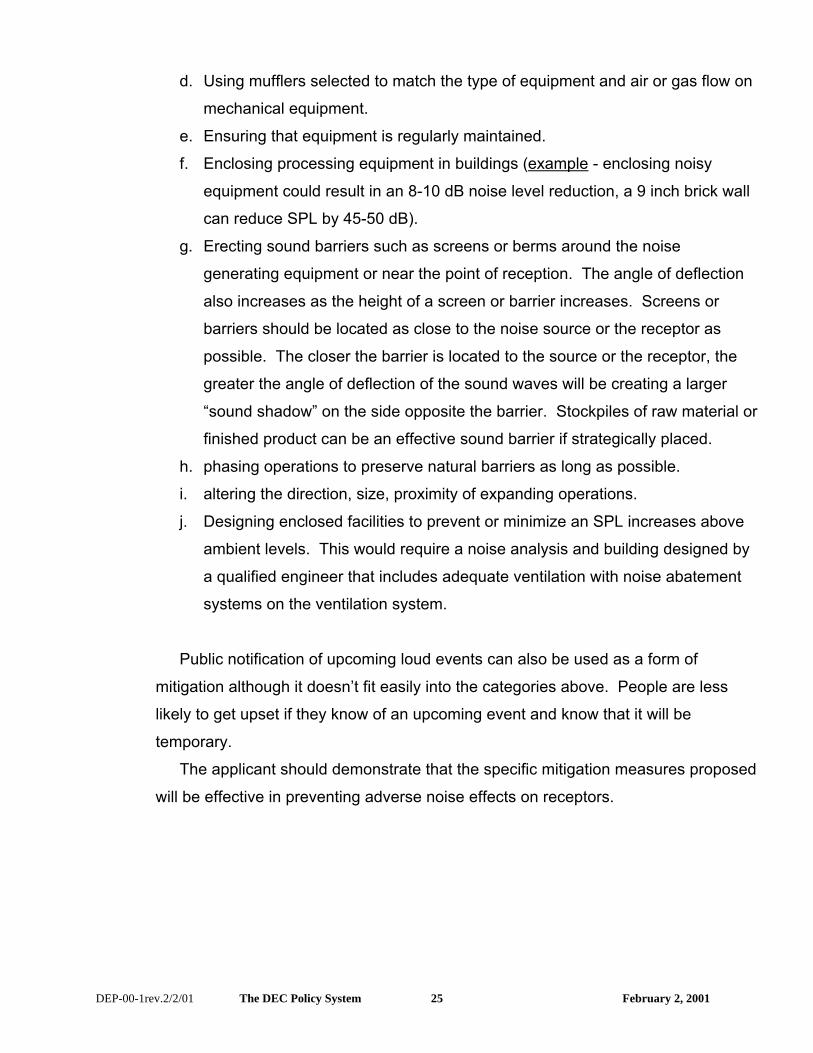
d. Using mufflers selected to match the type of equipment and air or gas flow on
mechanical equipment.
e. Ensuring that equipment is regularly maintained.
f. Enclosing processing equipment in buildings (example - enclosing noisy
equipment could result in an 8-10 dB noise level reduction, a 9 inch brick wall
can reduce SPL by 45-50 dB).
g. Erecting sound barriers such as screens or berms around the noise
generating equipment or near the point of reception. The angle of deflection
also increases as the height of a screen or barrier increases. Screens or
barriers should be located as close to the noise source or the receptor as
possible. The closer the barrier is located to the source or the receptor, the
greater the angle of deflection of the sound waves will be creating a larger
“sound shadow” on the side opposite the barrier. Stockpiles of raw material or
finished product can be an effective sound barrier if strategically placed.
h. phasing operations to preserve natural barriers as long as possible.
i. altering the direction, size, proximity of expanding operations.
j. Designing enclosed facilities to prevent or minimize an SPL increases above
ambient levels. This would require a noise analysis and building designed by
a qualified engineer that includes adequate ventilation with noise abatement
systems on the ventilation system.
Public notification of upcoming loud events can also be used as a form of
mitigation although it doesn’t fit easily into the categories above. People are less
likely to get upset if they know of an upcoming event and know that it will be
temporary.
The applicant should demonstrate that the specific mitigation measures proposed
will be effective in preventing adverse noise effects on receptors.
DEP-00-1rev.2/2/01 The DEC Policy System 26 February 2, 2001
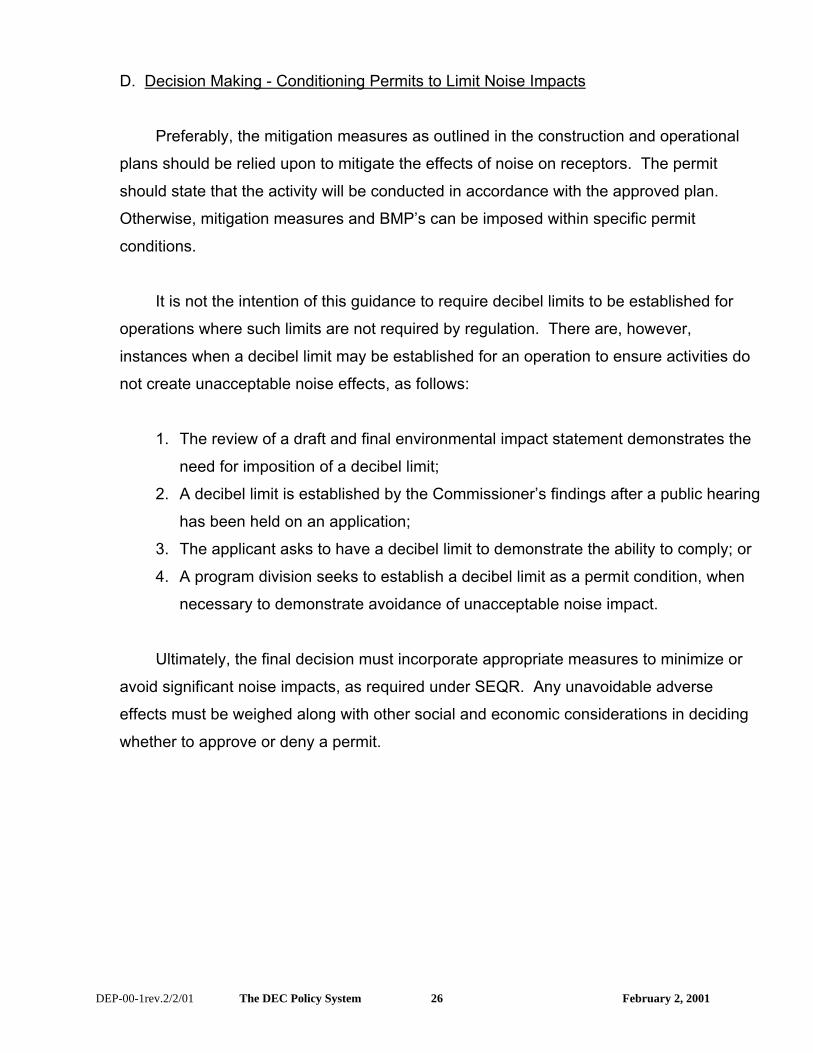
D. Decision Making - Conditioning Permits to Limit Noise Impacts
Preferably, the mitigation measures as outlined in the construction and operational
plans should be relied upon to mitigate the effects of noise on receptors. The permit
should state that the activity will be conducted in accordance with the approved plan.
Otherwise, mitigation measures and BMP’s can be imposed within specific permit
conditions.
It is not the intention of this guidance to require decibel limits to be established for
operations where such limits are not required by regulation. There are, however,
instances when a decibel limit may be established for an operation to ensure activities do
not create unacceptable noise effects, as follows:
1. The review of a draft and final environmental impact statement demonstrates the
need for imposition of a decibel limit;
2. A decibel limit is established by the Commissioner’s findings after a public hearing
has been held on an application;
3. The applicant asks to have a decibel limit to demonstrate the ability to comply; or
4. A program division seeks to establish a decibel limit as a permit condition, when
necessary to demonstrate avoidance of unacceptable noise impact.
Ultimately, the final decision must incorporate appropriate measures to minimize or
avoid significant noise impacts, as required under SEQR. Any unavoidable adverse
effects must be weighed along with other social and economic considerations in deciding
whether to approve or deny a permit.
DEP-00-1rev.2/2/01 The DEC Policy System 27 February 2, 2001
REFERENCES
1) Cowan, James P., Handbook of Environmental Acoustics, Van Nostrand Reinhold, 1994.
2) Down, C.G. and Stocks, J.; Environmental Impact of Mining. Applied Science Publishers
Ltd., ISBN 0853347166, 1978.
3) U.S. Dept of Transportation - Federal Highway Administration Office of Research and
Development; Highway Noise-A Manual for Highway Noise and Land Use, Nov. 1974.
4) New York State Motor Vehicle Law, Chapter IV, Subchapter E, 450.2, Part 450, “Noise
From Heavy Motor Vehicles,” 200.701 CN, February 28, 1997.
5) Beranek, L.A. ed., Noise and Vibration Control. Cambridge, MA: Institute of Noise Control
Engineering, 1971, pp. 164-174 and 182-191.
6) Barksdale, R.D., editor, 1991. The Aggregate Handbook: National Stone Association
(Washington, DC), 1.V.
7) Norman, David K., Wampler , Peter J., Throop, Allen H., Schnitzer, E. Frank, and Roloff,
J., 1996. “Best Management Practices for Reclaiming Surface Mines in Washington and
Oregon.” Oregon Dept. of Geology and Mineral Industries, Open File Report 0-96-2.
8) United States Environmental Protection Agency, Protective Noise Levels, Condensed
Version of EPA Levels document, EPA 550/9-79-100, November 1978, Office of Noise
Abatement & Control, Washington, D.C.
9) United States Environmental Protection Agency, Information on Levels of Environmental
Noise Requisite to Protect Public Health and Welfare with an Adequate Margin of Safety,
EPA 550/9-74-004, March 1974, Office of Noise Abatement and Control, Washington,
D.C.
10) City of Davis General Plan, Appendix E Background Information on Environmental
Acoustics, November 1996.
DEP-00-1rev.2/2/01 The DEC Policy System 28 February 2, 2001
11) The Australian National University, “Physics and Psychophysics of Music”, ACAT 1003,
David Worrall, http://www.anu.edu.au/ITA/ACAT/drw/PPofM/Intensity2.html, 1998.
12) Danish Wind Turbine Manufacturers Association, Measuring and Calculating Sound
Levels, November 18, 1997.
Additional Reading
a. Beranek, Leo L. and Istavan L. Ver, Noise and Vibration Control Engineering, John Wiley
& Sons, Inc. New York, 1992.
b. Beranek, Leo L., Noise and Vibration Control, Institute of Noise Control Engineering,
Revised Edition, Washington, C.C., 1988.
c. Diehl, George, M., Machinery Acoustics, John Wiley & Sons, New York, 1973.
d. Erwin, J.D., Graf, E. R., Industrial Noise and Vibration Control, Prentice Hall, Englewood
Cliffs, New Jersey, 1979.
e. Jensen, Paul, et al, Industrial Noise Control Manual, U.S. Department of Health,
Education and Welfare, Public Health Service, Cincinnati, 1978.
APPENDIX B
Town of Hempstead Noise Code
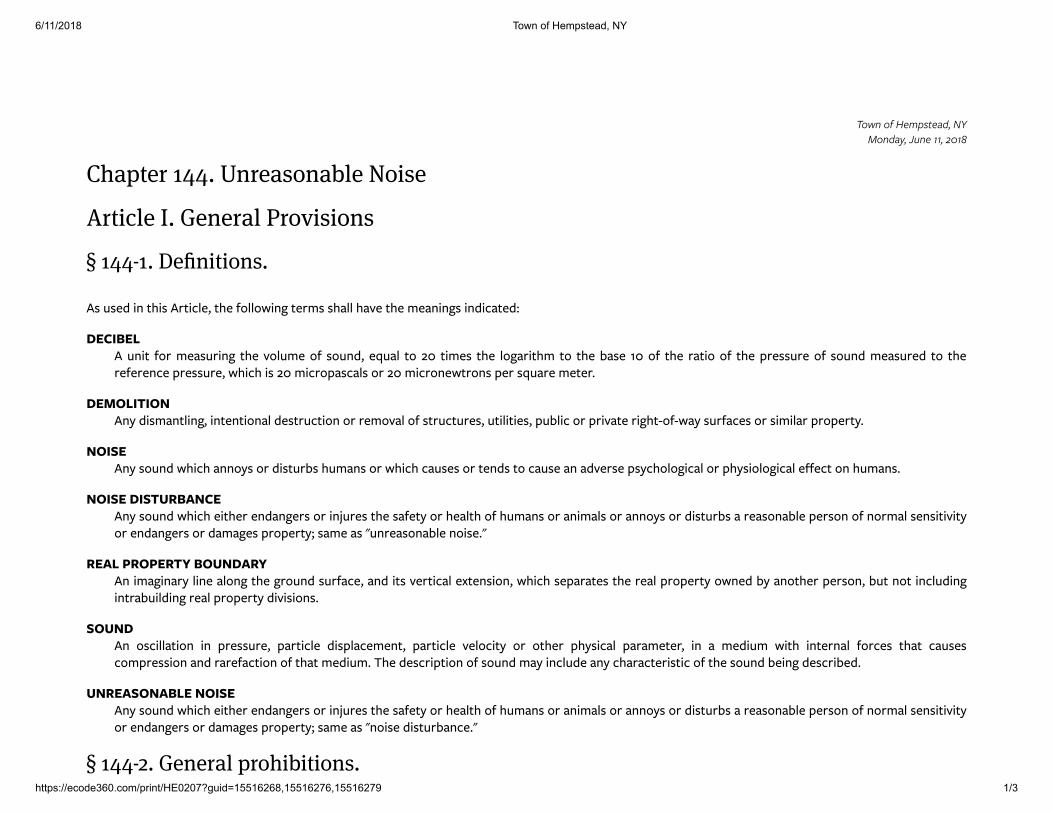
��������� ������ ������������
�������������������������� ���� !"#��$�%%�������%%��� ���%%��� & ���
'()*�(+�,-./01-234�567(*3284�9:*-�;;4�<=;>?@ABCDE�FGGH�IJEDAKLJAMND�OLPKDQECPRND�SH�TDJDEAN�UELVPKPLJKW�FGGXFH�YDZJPCPLJKH[\�]\_�a�bc\�[dbefg�bc�hiffijak�bdl\�\cmff�cmn�bc�l maak\�a_emb_opqrstqu[�]ab�hid�l m\]dak�bc�nif]l �ih�\i]a_g�v]mf�bi�wx�bl \�bc�fikmdbcl�bi�bc�ym\�zx�ih�bc�dmbi�ih�bc�{d\\]d�ih�\i]a_�l m\]d_�bi�bcdhdae�{d\\]dg�jcec�\�wx�ledi{m\emf\�id�wx�lediajbdia\�{d�\v]md�l bd|pq}~us�s~�[a��_\lmabfakg�ababiamf�_\bd]ebia�id�dlinmf�ih�\bd]eb]d\g�]bfb\g�{]yfe�id�{dnmb�dkcb�ih�jm��\]dhme\�id�\lfmd�{di{db�|�~s�q[a��\i]a_�jcec�maai�\�id�_\b]dy\�c]lma\�id�jcec�em]\\�id�ba_\�bi�em]\�ma�m_nd\�{\�ecifikemf�id�{c�\ifikemf��eb�ia�c]lma\|�~s�q�ps����t��rq[a��\i]a_�jcec�bcd�a_makd\�id�a�]d\�bc�\mhb��id�cmfbc�ih�c]lma\�id�malmf\�id�maai�\�id�_\b]dy\�m�dm\iamyf�{d\ia�ih�aidlmf�\a\bnb�id�a_makd\�id�_mlmk\�{di{db���\ml �m\��]adm\iamyf�ai\|��q�u���~�q����t~��p���[a�lmkamd��fa�mfiak�bc�kdi]a_�\]dhmeg�ma_�b\�ndbemf��ba\iag�jcec�\{mdmb\�bc�dmf�{di{db��ija_�y��maibcd�{d\iag�y]b�aib�aef]_akabdmy]f_ak�dmf�{di{db��_n\ia\|�~��p[a�i\effmbia�a�{d\\]dg�{mdbef�_\{fmel abg�{mdbef�nfieb��id�ibcd�{c�\emf�{mdml bdg�a�m�l _]l�jbc�abdamf�hide\�bcmb�em]\\eil{d\\ia�ma_�dmdhmebia�ih�bcmb�l _]l|��c�_\ed{bia�ih�\i]a_�lm��aef]_�ma��ecmdmebd\be�ih�bc�\i]a_�y ak�_\edy_|���q��~��tuq��~s�q[a��\i]a_�jcec�bcd�a_makd\�id�a�]d\�bc�\mhb��id�cmfbc�ih�c]lma\�id�malmf\�id�maai�\�id�_\b]dy\�m�dm\iamyf�{d\ia�ih�aidlmf�\a\bnb�id�a_makd\�id�_mlmk\�{di{db���\ml �m\��ai\�_\b]dymae|�W�FGGX�H�TDJDEAN�BEL@PMPCPLJKH
��������� ������ ������������
�������������������������� ���� !"#��$�%%�������%%��� ���%%��� & ���
'(�)(�'(�)(�*(�+(�,(�-(�.(�/(�0(�1(�2(�3(�
45�67899�:;�<=98>?<9�8=@�8=�AB;=6;�8C8D=65�57D6�E78F5;G�?AG�8=H�F;G6A=�5A�<=G;86A=8:9H�I8J;K�EA=5D=<;�AG�E8<6;�5A�:;�I8@;�AG�EA=5D=<;@�8=H<=G;86A=8:9;�=AD6;�AG�=AD6;�@D65<G:8=E;LMA<=@�;I8=85D=C�?GAI�F<:9DE�6F;8JD=C�8=@�F<:9DE�866;I:9H�8E5DND5D;6�EA=@<E5;@�A=�F<:9DE�FGAF;G5H�67899�:;�;O;IF5�?GAI�57;�FGAND6DA=6�A?�M<:6;E5DA=P�A?�57D6�6;E5DA=LQ�RSSTUV�WXYZ[\Z�X]_[[a[bcVd=H�EA=@<E5�EA=5GD:<5D=C�5A>8G@�F8G5DEDF85DA=�D=�8=H�A?�57;�?A99A>D=C�8E5DND5D;6�7;G;:H�D6�@;E98G;@�5A�:;�AB;=6;6�8C8D=65�57D6�E78F5;Gef7;�6A<=@D=C�A?�8=H�7AG=�AG�6DC=89�@;NDE;�A=�8=H�8<5AIA:D9;K�IA5AGEHE9;K�5G<EJK�:<6�AG�A57;G�N;7DE9;K�;OE;F5�86�8�>8G=D=C�6DC=89�F<G6<8=5�5A�57;FGAND6DA=6�A?�57;�g;7DE9;�8=@�fG8hE�i8>�A?�57;�M585;�A?�j;>�kAGJLlF;G85D=CK�F98HD=C�AG�F;GID55D=C�57;�AF;G85DA=�AG�F98HD=C�A?�8=H�G8@DAK�5;9;ND6DA=K�F7A=ACG8F7K�@G<IK�I<6DE89�D=65G<I;=5K�6A<=@�8IF9Dm;G�AG�6DID98G@;NDE;�>7DE7�FGA@<E;6K�G;FGA@<E;6�AG�8IF9Dm;6�6A<=@�D=�6<E7�8�I8==;G�86�5A�EG;85;�8�=AD6;�@D65<G:8=E;�8EGA66�8�G;89�FGAF;G5H�:A<=@8GHLl>=D=CK�FA66;66D=C�AG�78G:AGD=C�8=H�8=DI89�AG�:DG@�>7DE7�7A>96K�:8GJ6K�I;A>6K�6n<8>J6�AG�I8J;6�8=H�A57;G�6A<=@6�>7DE7�EG;85;6�8�=AD6;�@D65<G:8=E;8EGA66�8�G;6D@;=5D89�G;89�FGAF;G5H�:A<=@8GHLf7;�<6;�A?�8=H�8<5AIA:D9;K�IA5AGEHE9;�AG�A57;G�N;7DE9;�D=�6<E7�8�I8==;G�86�5A�EG;85;�8�=AD6;�@D65<G:8=E;�8EGA66�8�G;6D@;=5D89�G;89�FGAF;G5H�:A<=@8GHLf7;�:9A>D=C�A?�8=H�65;8I�>7D659;�8558E7;@�5A�8=H�6585DA=8GH�:AD9;GK�;OE;F5�5A�CDN;�=A5DE;�A?�57;�5DI;�5A�:;CD=�AG�65AF�>AGJ�AG�86�8�>8G=D=C�A?�@8=C;GLf7;�@D6E78GC;�D=5A�57;�AF;=�8DG�A?�57;�;O78<65�A?�8=H�65;8I�;=CD=;K�6585DA=8GH�D=5;G=89oEAI:<65DA=�;=CD=;�AG�IA5AG�N;7DE9;K�;OE;F5�57GA<C7�8�I<p;GAG�A57;G�6A<=@o@D66DF85DN;�@;NDE;�>7DE7�;B;E5DN;9H�>D99�FG;N;=5�9A<@�AG�;OF9A6DN;�=AD6;6�57;G;?GAILf7;�;G;E5DA=K�D=E9<@D=C�;OE8N85D=CK�@;IA9D5DA=K�895;G85DA=�AG�G;F8DGK�A?�8=H�:<D9@D=C�A57;G�578=�:;5>;;=�57;�7A<G6�A?�qerr�8LIL�8=@�serr�FLIL�A=>;;J@8H6K�;OE;F5�D=�8�E86;�A?�<GC;=5�=;E;66D5H�D=�57;�D=5;G;65�A?�F<:9DE�68?;5HK�8=@�57;=�A=9H�>D57�8�F;GID5�?GAI�57;�t;F8G5I;=5�A?�u<D9@D=C6K�>7DE7F;GID5�I8H�:;�G;=;>;@�?AG�8�F;GDA@�A?�57G;;�@8H6�AG�9;66�>7D9;�57;�;I;GC;=EH�EA=5D=<;6LvG;85D=C�AG�E8<6D=C�57;�EG;85DA=�A?�8=H�6A<=@�A=�8=H�65G;;5�AG�F<:9DE�FGAF;G5H�8@w8E;=5�5A�8=H�6E7AA9K�D=65D5<5DA=�A?�9;8G=D=C�AG�EA<G5�>7D9;�57;D=65D5<5DA=�AG�EA<G5�D6�D=�6;66DA=K�AG�8@w8E;=5�5A�8=H�7A6FD589K�>7DE7�<=G;86A=8:9H�D=5;G?;G;6�>D57�57;�>AGJD=C6�A?�57;�D=65D5<5DA=K�EA<G5�AG�7A6FD589KFGAND@;@�5785�EA=6FDE<A<6�6DC=6�8G;�@D6F98H;@�D=�57;�8G;8�D=@DE85D=C�5785�D5�D6�8�6E7AA9K�7A6FD589�AG�EA<G5�8G;8LiA8@D=CK�<=9A8@D=CK�AF;=D=CK�E9A6D=C�AG�A57;G�78=@9D=C�A?�:AO;6K�EG85;6�AG�A57;G�EA=58D=;G6�D=�6<E7�8�I8==;G�6A�86�5A�EG;85;�<=G;86A=8:9;�=AD6;LlB;GD=C�?AG�689;�AG�6;99D=C�8=H57D=C�:H�67A<5D=C�AG�A<5EGH�AG�I8JD=C�8=H�A57;G�5HF;6�A?�67A<5D=C�AG�A<5EGH�>D57D=�8�G;6D@;=5D89�8G;8K�57<6�EG;85D=C<=G;86A=8:9;�=AD6;�8EGA66�8�G;6D@;=5D89�G;89�FGAF;G5H�:A<=@8GHLf7;�<6;�A?�8=H�9A<@6F;8J;G�AG�8IF9Dm;G�@;NDE;�6<E7�5785�57;�6A<=@�57;G;?GAI�EG;85;6�<=G;86A=8:9;�=AD6;�8EGA66�8�G;89�FGAF;G5H�:A<=@8GHLx6D=C�8=H�G8@DA�8FF8G85<6K�9A<@6F;8J;GK�F<:9DE�8@@G;66�6H65;I�AG�6DID98G�@;NDE;�:;5>;;=�57;�7A<G6�A?�yyerr�FLIL�8=@�zerr�8LIL�FGA@<ED=C�6A<=@�8EGA668�G;89�FGAF;G5H�:A<=@8GHL�jA57D=C�7;G;D=�EA=58D=;@�67899�:;�EA=65G<;@�5A�FG;N;=5�57;�AF;G85DA=�A?�8�G8@DA�8FF8G85<6K�9A<@6F;8J;GK�F<:9DE�8@@G;666H65;I�AG�6DID98G�@;NDE;�<6;@�D=�8=H�G;86A=8:9;�I8==;G�>D57D=�8=H�:<D9@D=C�AG�65G<E5<G;�5785�@A;6�=A5�FGAw;E5�6A<=@�8EGA66�8�G;89�FGAF;G5H�:A<=@8GHL
��������� ������ ������������
�������������������������� ���� !"#��$�%%�������%%��� ���%%��� & ���
'(�)(�*+,�*-,�.(�/01234567�82�0129544567�4:1�801234586�8;�36<�91=:365=3>�08?121@�A3?B�A36@12B�@25>>B�7256@12B�>3?6�82�732@16�488>B�A68?C>8?12�82�A595>32�@1D5=1B�?:5=:=21341A�36�E6213A863C>1�685A1�3=28AA�3�213>�0280124<�C8E6@32<�84:12�4:36�C14?116�4:1�:8E2A�8;�FGHH�3I9I�36@�JGHH�0I9I�86�K34E2@3<A�36@�KE6@3<AB36@�C14?116�4:1�:8E2A�8;�LGHH�3I9I�36@�JGHH�0I9I�86�M86@3<A�4:28E7:�N25@3<AIOP916@1@�QRSHRSHTL�C<�UIUI�V8I�WSRSHTLB�1X1=45D1�QRSJRSHTLYZ:1�801234586�8;�36<�93=:5612<B�1[E509164B�0E90B�;36B�1\:3EA4�;36B�3445=�;36B�352R=86@54586567�3003234EA�82�A595>32�91=:365=3>�@1D5=1�56�AE=:�3�9366123A�48�=21341�36�E6213A863C>1�685A1�3=28AA�3�213>�0280124<�C8E6@32<I]E27>32�82�21�3>329IZ:1�56A43>>34586B�935641636=1�82�EA1�8;�36<�3E@5C>1�CE27>32�3>329�82�21�3>329�4:34�5A�684�028D5@1@�?54:�3�@1D5=1�4:34�?5>>�3E489345=3>><�A:E4�8XAE=:�3>329�3;412�_H�956E41A�8;�=86456E8EA�A8E6@IP>>8?567�82�0129544567�AE=:�CE27>32�3>329�82�21�3>329�48�1954�A8E6@�3E@5C>1�C1<86@�4:1�213>�0280124<�C8E6@3251A�8;�4:1�EA12�8;�A35@�3>329�;82�3=86456E8EA�01258@�8;�9821�4:36�_H�956E41AB�?:14:12�82�684�A35@�3>329�:3A�C116�1[E5001@�?54:�4:1�3E489345=�A:E48X�@1D5=1�:121563C8D121[E521@I
APPENDIX C
Environmental Noise Fundamentals
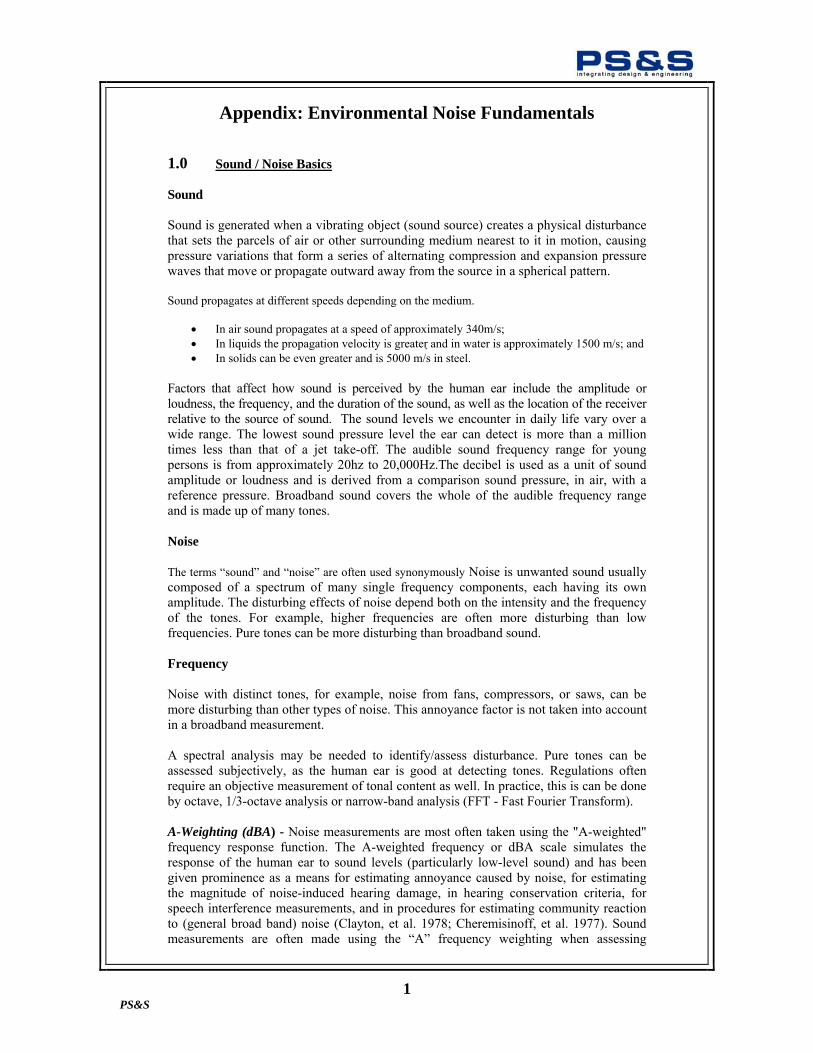
1
PS&S
Appendix: Environmental Noise Fundamentals
1.0 Sound / Noise Basics Sound Sound is generated when a vibrating object (sound source) creates a physical disturbance that sets the parcels of air or other surrounding medium nearest to it in motion, causing pressure variations that form a series of alternating compression and expansion pressure waves that move or propagate outward away from the source in a spherical pattern. Sound propagates at different speeds depending on the medium.
• In air sound propagates at a speed of approximately 340m/s; • In liquids the propagation velocity is greater and in water is approximately 1500 m/s; and • In solids can be even greater and is 5000 m/s in steel.
Factors that affect how sound is perceived by the human ear include the amplitude or loudness, the frequency, and the duration of the sound, as well as the location of the receiver relative to the source of sound. The sound levels we encounter in daily life vary over a wide range. The lowest sound pressure level the ear can detect is more than a million times less than that of a jet take-off. The audible sound frequency range for young persons is from approximately 20hz to 20,000Hz.The decibel is used as a unit of sound amplitude or loudness and is derived from a comparison sound pressure, in air, with a reference pressure. Broadband sound covers the whole of the audible frequency range and is made up of many tones. Noise The terms “sound” and “noise” are often used synonymously Noise is unwanted sound usually composed of a spectrum of many single frequency components, each having its own amplitude. The disturbing effects of noise depend both on the intensity and the frequency of the tones. For example, higher frequencies are often more disturbing than low frequencies. Pure tones can be more disturbing than broadband sound. Frequency Noise with distinct tones, for example, noise from fans, compressors, or saws, can be more disturbing than other types of noise. This annoyance factor is not taken into account in a broadband measurement. A spectral analysis may be needed to identify/assess disturbance. Pure tones can be assessed subjectively, as the human ear is good at detecting tones. Regulations often require an objective measurement of tonal content as well. In practice, this is can be done by octave, 1/3-octave analysis or narrow-band analysis (FFT - Fast Fourier Transform). A-Weighting (dBA) - Noise measurements are most often taken using the "A-weighted" frequency response function. The A-weighted frequency or dBA scale simulates the response of the human ear to sound levels (particularly low-level sound) and has been given prominence as a means for estimating annoyance caused by noise, for estimating the magnitude of noise-induced hearing damage, in hearing conservation criteria, for speech interference measurements, and in procedures for estimating community reaction to (general broad band) noise (Clayton, et al. 1978; Cheremisinoff, et al. 1977). Sound measurements are often made using the “A” frequency weighting when assessing
2
PS&S
environmental noise. The Leq or, better, the LAeq (the A-weighted equivalent continuous sound level) is an important parameter. 1.1 Noise Descriptors There are a number of noise descriptors used to characterize various aspects of noise that take into account the variability of noise levels over time which most environments experience. Various criteria and guidelines used to characterize noise are discussed below. The different descriptors are applicable to different situations. Commonly used descriptors are discussed below. Equivalent Sound Level (Leq) The equivalent sound level (Leq) is the value of a steady-state sound which has the same A-weighted sound energy as that contained in the time-varying sound. The Leq is a single sound level value for a desired duration, which includes all of the time-varying sound energy during the measurement period. The U.S. EPA has selected Leq as the best environmental noise descriptor for several reasons, but primarily because it correlates reasonably well with the effects of noise on people, even for wide variations of environmental sound levels and different time exposure patterns. Also, it is easily measurable with available equipment. Statistical Descriptors Statistical sound level descriptors such as L1, L10, L50, and L90 are used to represent noise levels that are exceeded 1, 10, 50, and 90 percent of the time, respectively. L50, the Sound Pressure Level (SPL) exceeded 50 percent of the time, provides an indication of the median sound level. L90 represents the residual level, or the background noise level without intrusive noises. Residual Noise Level Measurement of the residual or background sound level is useful in characterizing a community with respect to noise. The residual sound level is the minimum sound level in the absence of identifiable or intermittent local sources. It is not the absolute minimum sound level during a long observation period, but rather the lowest reading that is reached repeatedly during a given period. The L90 (referred to as the ambient level) is a statistical descriptor, which represents the level that is exceeded 90 percent of the time. Comparisons of data have shown that the L90, measured with a continuous statistical sound meter, and the residual sound level, measured by trained personnel with a sound-level meter, are closely correlated with one another. (Bolt, Beranek, and Neman, Inc. 1978) Ambient noise is the noise from all sources combined - factory noise, traffic noise, birdsong, running water, etc. Specific noise is the noise from the source under investigation. The specific noise is a component of the ambient noise and can be identified and associated with the specific source. Day/Night Equivalent Sound Level (Ldn) The day/night equivalent sound level (Ldn) is the A-weighted equivalent level for a 24-hour period. (U.S. EPA 1974). The Ldn is estimated from the equivalent daytime Ld and nighttime Ln levels with an additional 10 dBA weighting imposed on the equivalent sound levels occurring during nighttime.

3
PS&S
The U.S. EPA suggests this descriptor be used to relate noise in residential areas to annoyance caused by interference with speech, sleep and other activity. Based on interpretation of available scientific information, U.S. EPA identified an outdoor Ldn of 55 dBA as a level protective of public health and welfare with an adequate margin of safety, without concern for economic and technical feasibility. (U.S. EPA 1978)
1.2 Noise Standards/Criteria
FHWA Noise Abatement Criteria The Federal Highway Administration (FHWA) has established noise abatement criteria for motor vehicle noise on roadways (23 CFR 772). These criteria are intended to apply to highway projects, which this is not. However, these criteria can be used as guidance for assessing traffic noise. These criteria represent maximum desirable noise levels for various land-uses and associated human activities, for use in assessing noise levels from roadway traffic. An exterior Leq of 67 dBA is the Noise Abatement Criterion typically used to evaluate noise levels along highways, Activity Category (B), applicable to residential areas. The FHWA Noise Abatement Criterion for areas not considered sensitive receptors, such as manufacturing zones, is an Leq of 72 dBA, Activity Category (C). Noise sensitivity criteria used by the FHWA for evaluating the significance of noise impacts are presented in Table 1. Generally, a three dBA or smaller change in sound pressure (noise) level would be barely perceptible to most listeners, whereas a ten dBA change is normally perceived as a doubling (or halving) of noise levels. Increases in average or cumulative noise levels of five dBA or more are clearly noticeable. These criteria provide an indication of individual perception of changes in noise levels. A three-dBA increase is commonly used as the threshold for assessing the potential significance of noise impacts. The Federal Highway Administration (FHWA) has established noise abatement criteria for motor vehicle noise on roadways (23 CFR 772). These criteria are intended to apply to highway projects, which this is not. However, these criteria can be used as guidance for assessing traffic noise. These criteria represent maximum desirable noise levels for various land uses and associated human activities, for use in assessing noise levels from roadway traffic. An exterior Leq of 67 dBA is the Noise Abatement Criterion typically used to evaluate noise levels along highways, Activity Category B) applicable to residential areas. The FHWA Noise Abatement Criterion for areas not considered sensitive receptors, such as manufacturing zones, is an Leq of 72 dBA, Activity Category C). New York State The New York State Department of Environmental Conservation (NYSDEC) has published a policy and guidance document titled Assessing and Mitigating Noise Impacts (October 6, 2000). This document provides guidance on when noise due to projects has the potential for adverse impacts and requires review and possible mitigation in the absence of local regulations. The NYSDEC guidance indicates that local noise ordinances or regulations are not superceded by NYSDEC guidance. The New York State Guidance Document contains a Table identifying expected human reaction to various increases in sound pressure levels. This Table is included as Table 2 below. The guidance indicates that a noise increase of 10 dBA deserves consideration of avoidance and mitigation measures in most cases. It is further indicated that the addition of a noise source, in a non-industrial setting, should not raise the ambient noise level above a
4
PS&S
maximum of 65 dBA. The City Environmental Quality Review (CEQR) Noise Code was adopted to prevent unreasonably loud and disturbing noise. New Jersey State Noise Standards The State of New Jersey noise standards (Noise Control Regulations) require that sound from any industrial or commercial operation measured at any residential property line must not exceed a continuous sound level of 65 dBA during the daytime (7:00 a.m. to 10:00 p.m.), or a level of 50 dBA during the nighttime (10:00 p.m. to 7:00 a.m.). These standards also limit continuous sound from any industrial or commercial operation measured at any other commercial property line to 65 dBA (New Jersey Administrative Code 7:29, 2000). Octave band sound levels have been specified by the State of New Jersey, which limit the sound intensity at residential and commercial property boundary lines (New Jersey Administrative Code 7:29, 1997). An octave band sound level limit requires a noise analysis of sound levels at various frequencies. The sound signal energy can be electronically separated into frequency bands, known as octave bands, each of which covers a 2 to 1 range of frequencies. For example, the effective band for the 1,000 Hz octave band center frequency extends from 710 to 1,420 Hz. New Jersey Model Noise Ordinance The Model Noise Ordinance was developed to be adopted, enforced, and adjudicated locally. It is a performance code designed to empower municipalities to respond to noise complaints within their community in a timely manner. The model noise ordinance regulates more sound-source categories than the State’s Noise Control Regulations, including residential and multi-use properties. The noise standards in this model noise ordinance are the same as that for the New Jersey State Noise Control Regulations. Local Municipalities Local municipalities may have their own noise control code or noise ordinance that may regulate noise more stringently than state standards/criteria. Local noise codes will be considered on a project specific basis.

5
PS&S
Table 1 Noise Sensitivity Criteria
Decibel Changes and Loudness Change (dBA)
Relative Loudness
0 3 5
10 20 30
Reference Barely perceptible change Readily perceptible change Half or twice as loud 1/4 or four times as loud 1/8 or eight times as loud
Source: Based on Highway Traffic Noise Analysis and Abatement – Policy and Guidance. (FHWA, June 1995.)
Table 2 HUMAN REACTION TO INCREASES IN SOUND PRESSURE
LEVEL Increase in Sound
Pressure (dB)
Human Reaction
Under 5 Unnoticed to tolerable 5 – 10 Intrusive 10 – 15 Very noticeable 15 – 20 Objectionable Over 20 Very objectionable to
intolerable Source: New York State Department of Environmental Conservation. Assessing and Mitigating Noise Impacts. (NYSDEC October 6, 2000.)
6
PS&S
2.0 NOISE MONITORING SURVEY 2.1 Methodology The following describes the equipment and procedures utilized during this noise survey. 2.2 Equipment The sound-level meter (SLM) is the conventional instrument used to measure the instantaneous sound-pressure level (SPL), in decibels (dB), of sound energy. The SLM contains a microphone, amplifier, weighting and filter networks, detector networks, and indicators. An integrating sound-level meter (ISLM) has the capability to compute the long-term root-mean-square (rms) level of time-varying sound energy. The time-averaged, mean square SPL is referred to as the Leq (equivalent constant SPL). The ISLM used for this assessment can compute Leq measurements automatically, providing greater ease and accuracy of Leq determination. Noise levels were measured and analyzed with a Bruel and Kjaer (B&K) Modular Precision Sound Level Meter Type 2231 and/or a Bruel and Kjaer (B&K) Modular Precision Sound Level Meter Type 2250. A B&K Microphone Type 4189 was used in conjunction with the B&K 2231 and B&K 2250. Both the B&K 2231 and B&K 2250 are Type 1 instruments in accordance with the American National Standards Institute (ANSI), S1.4-1983 Type 1. This instrument can be used to perform a wide range of measurements, take several measurements simultaneously, and automatically store data at the end of a preset time period. The B&K 2231 and 2250 can measure sound levels ranging from 24 to 113 decibels A-weighted (dBA). Measured data can be stored in the instrument memory, which has battery backup, to maintain data integrity. The B&K 2231 and 2250 can be used with modules to enhance the basic functions of the meter. The B&K 2231 can be used in conjunction with a B&K 1625 Octave Band Filter, to perform octave band measurements. The B&K 1625 Band Pass Filter Set contains 10 active filters with center frequencies from 31.5 Hz to 16 kHz. Each octave filter satisfies requirements of IEC Recommendation R 225-1996, DIN 45651 and ANSI S1, 11-1966 Class II. The total frequency range is from 14 Hz to 28 kHz. The B&K 1625 filter set covers the audio-frequency range with center frequencies arranged according to the preferred frequencies of ISO R266, DIN 45401 and ANSI 1.6-1960. The B&K 2250 has a software module that allows real-time frequency measurements in 1/1 and 1/3 Octave Bands. 2.3 Calibration Calibration of the B&K 2231 and/or the B&K 2250 was performed using the B&K Calibrator 4230 and/or B&K 4231. Calibrations of the B&K 2231 and/or B&K 2250 were performed prior to and immediately following noise monitoring. 2.4 Procedures There are many noise monitoring methodologies available for performing baseline noise monitoring studies. Most consist of various data acquisition and analysis procedures, and also include a high degree of subjectivity (Greenberg, et al. 1979). The approach utilized follows appropriate general guidelines and recommended practices. Observations are made, during measurement, such as with regard to temperature, wind, relative humidity, cloud cover, and wind induced noises (i.e., leaves rustling, etc.). Atmospheric conditions such as rainfall (precipitation), high humidity (greater than 90 percent), and high wind (greater than around 12 to 15 miles per hour) are avoided during
7
PS&S
field measurement because of their potential influence to have an adverse effect on noise measurements. A microphone windscreen is utilized (as appropriate) during measurements to minimize potential wind effects. Nearby buildings and other structures can modify outdoor noise radiation patterns. In addition, specific site conditions and equipment layout can influence sound propagation. To characterize sound levels from a facility requires considering site conditions, facility design, and receptor locations. 2.5 Noise Monitoring Locations A-Weighted noise measurements are taken at various locations in the vicinity of the equipment/location of concern. Noise monitoring may be performed at a number of different locations; near the noise source along the site perimeter; along adjoining residential property boundaries. 2.6 Sensitive Receptors Areas or receptors that are considered potentially sensitive to noise include residences, schools, hospitals, and recreational facilities (U.S. Environmental Protection Agency, 1974). Potentially sensitive receptors located near the noise source usually include residential areas near the site. The location of closest residence to the noise source is identified and is commonly a candidate for noise monitoring. 2.7 Other Equipment
A Quest Technologies Q-500 Multi-Function Noise Analyzer (a data-logging dosimeter) is sometimes used for noise monitoring. The Q-500 is a Type 1 instrument in accordance with the American National Standards Institute (ANSI), S1.4-1983 Type 1, and has many of the features of an ISLM. The Q-500 dosimeter can be used to record Leq noise levels in one-minute time history intervals over the course of a 24-hour period. The Q-500 can measure sound levels ranging from 40 to 140 decibels A or C-weighted. The A-weighted (dBA) scale can be utilized with the sound level range set at 40 to 115 decibels. An exchange rate of three (3) was used in conjunction with a slow response. Measured data is stored in the instrument memory, which has battery backup, to maintain data integrity. Calibration of the Q-500 Multi-Function Noise Analyzer is performed using the QC-20 Calibrator set at 94 dB. Calibrations of the dosimeter are usually performed prior to and following noise monitoring.
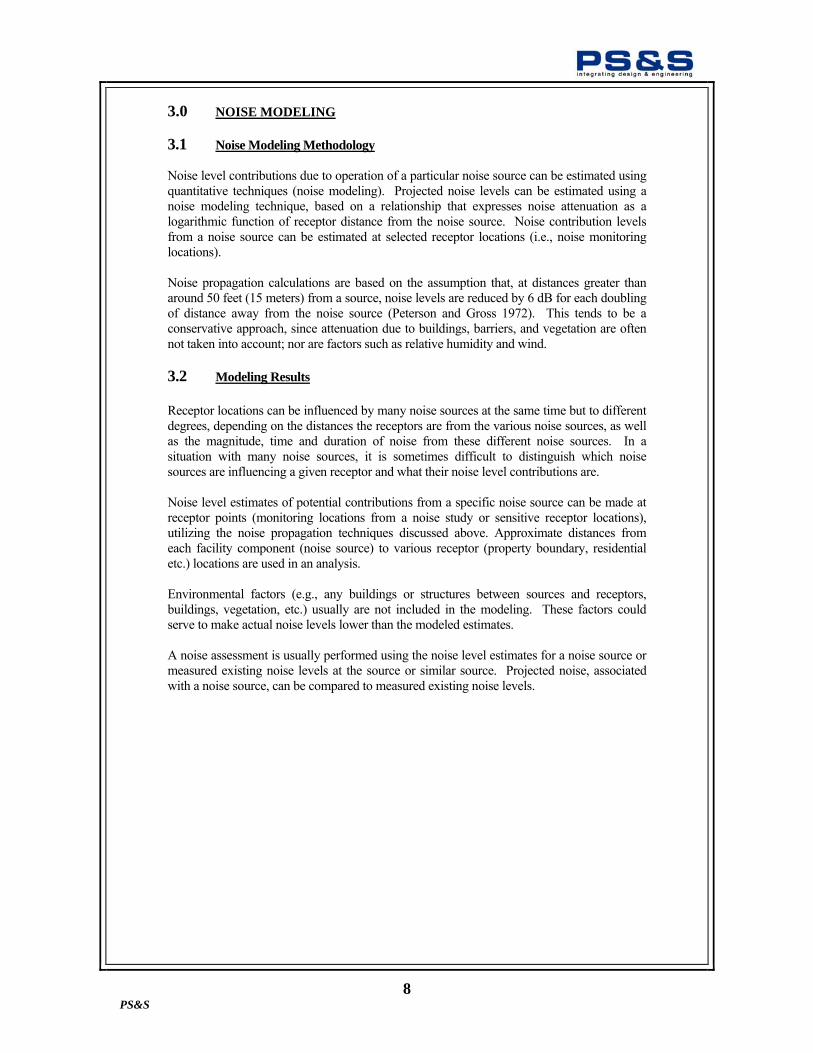
8
PS&S
3.0 NOISE MODELING 3.1 Noise Modeling Methodology Noise level contributions due to operation of a particular noise source can be estimated using quantitative techniques (noise modeling). Projected noise levels can be estimated using a noise modeling technique, based on a relationship that expresses noise attenuation as a logarithmic function of receptor distance from the noise source. Noise contribution levels from a noise source can be estimated at selected receptor locations (i.e., noise monitoring locations). Noise propagation calculations are based on the assumption that, at distances greater than around 50 feet (15 meters) from a source, noise levels are reduced by 6 dB for each doubling of distance away from the noise source (Peterson and Gross 1972). This tends to be a conservative approach, since attenuation due to buildings, barriers, and vegetation are often not taken into account; nor are factors such as relative humidity and wind. 3.2 Modeling Results
Receptor locations can be influenced by many noise sources at the same time but to different degrees, depending on the distances the receptors are from the various noise sources, as well as the magnitude, time and duration of noise from these different noise sources. In a situation with many noise sources, it is sometimes difficult to distinguish which noise sources are influencing a given receptor and what their noise level contributions are. Noise level estimates of potential contributions from a specific noise source can be made at receptor points (monitoring locations from a noise study or sensitive receptor locations), utilizing the noise propagation techniques discussed above. Approximate distances from each facility component (noise source) to various receptor (property boundary, residential etc.) locations are used in an analysis. Environmental factors (e.g., any buildings or structures between sources and receptors, buildings, vegetation, etc.) usually are not included in the modeling. These factors could serve to make actual noise levels lower than the modeled estimates. A noise assessment is usually performed using the noise level estimates for a noise source or measured existing noise levels at the source or similar source. Projected noise, associated with a noise source, can be compared to measured existing noise levels.
9
PS&S
4.0 MITIGATION MEASURES If a review of the noise assessment results suggests that reducing noise levels from existing or proposed new equipment (noise sources) a site may be warranted then mitigation methods should be considered. Mitigation measures to reduce measured or projected noise levels include the following, which may be appropriate for different situations: • Design considerations – specify “quiet equipment designs” depending on
installation and site • Sound absorption panels barrier panels • Check/improve installation • Consider enclosures, buildings, or other structures, isolating equipment, etc. • Interior wall/window treatments Retrofit to improve a noise problem after placement can be difficult, and more costly. The above methods can vary widely in their effectiveness, installation and cost. Installation of indoor mitigation materials/wall treatments: Take the obvious steps to seal off all cracks, crevices, and paths where sound could escape. Sound can pass through cracks and every crack will offer sound an escape route. Unless you are thorough in sealing off the entire room, you will not achieve the maximum benefit of sound-proofing materials. Sometimes this can be difficult to accomplish, depending on the number of vents, electrical plugs, windows, doors, and other breaks in the wall. Doors and windows are often overlooked. Make sure that doors and windows fit their frames snuggly and that they form a tight seal. There must be no loose studs, and the sill plates must really hug the floor. The wallboard must be well fitted and all potential cracks must be caulked. (caulk should be flexible, not rigid, and should not crack when the building settles). Do not put holes in sound walls for outlets or pipes; use surface mount electrical fittings and caulk around any wires that pierce gypsum. Sound can travel through any medium and it passes through solids better than through air. Sound intensity is reduced in the transition from one material to another, as from the air to a wall and back. The amount of reduction (called the transmission loss) is related to the density of the wall, as long as it doesn't move in response to the sound. Any motion caused by sound striking one side of the wall will result in sound radiated by the other side, an effect called coupling. If the sound hits a resonant frequency, the wall will boom like a drum. Most isolation techniques are really ways to reduce coupling and prevent resonances. Mass loaded vinyl (MLV) sound barrier is an effective, relatively inexpensive treatment for airborne noise. For multi-level buildings, mass loaded vinyl can be used as an underlayment beneath the floor. This material can be laid directly on the floor under carpets, between sheets of plywood, or over cement.
10
PS&S
REFERENCES Bolt, Beranek, and Newman, Inc. 1978. Electric Power Plant Environmental Noise Guide - Volume I. Edison Electric Institute. Brüel & Kjær. October 1991. Instruction Manual: Modular Precision Sound Level Meter Type 2231 Plus Statistical Analysis Module BZ7115. Brüel & Kjær. January 1987. Instruction Manual: 1/3 - 1/1 Octave Filter Set Type 1625 Cheremisinoff, P.N. and P.P. Cheremisinoff. 1977. Industrial Noise Control Handbook. Ann Arbor Science Publishers, Inc. Clayton, G.D. and F.E. Clayton (Editors). 1978. Volume I: General Principles - Patty's Industrial Hygiene and Toxicology, Third Revised Edition. John Wiley & Sons, Inc. Greenberg, M.R.; G. Belnay; W. Chesanek; N. Nueman; and G. Sheperd. 1979. A Primer on Industrial Environmental Impact. The Center of Urban Policy Research, Rutgers University. Mayor's Office of Environmental Coordination. December 1993. City Environmental Quality Review Technical Manual. Section 3R: Noise. (Noise Control Guide 1980) Peterson, A.P.G. and E.G. Gross. 1972. Handbook of Noise Measurement. General Radio Company. (SOUND BASICS MPCA May 1983 NPC) U.S. Environmental Protection Agency. 1971. Noise from Construction Equipment. NTID 300.1. U.S. Environmental Protection Agency. March 1974. Information on Levels of Environmental Noise Requisite to Protect Public Health and Welfare with an Adequate Margin of Safety. EPA 550/9-74-004. U.S. Environmental Protection Agency. November 1978. Protective Noise Levels - Condensed Version of EPA Levels Document. EPA 550/9-79-100.
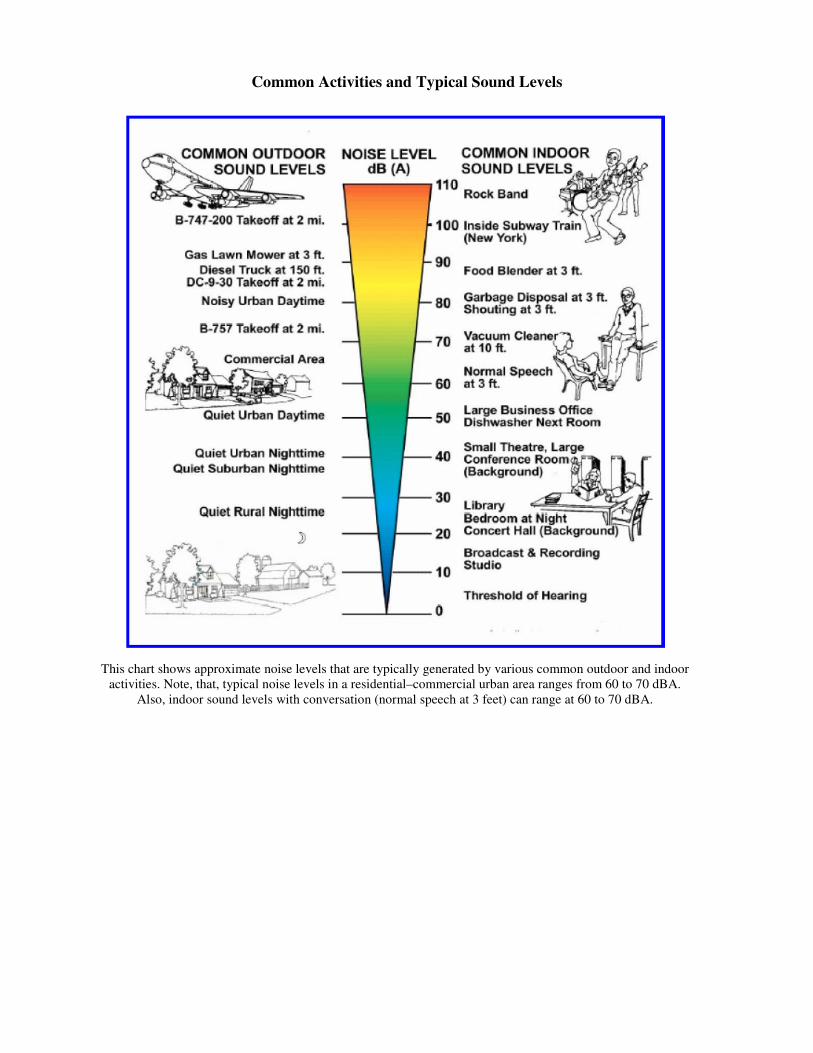
Common Activities and Typical Sound Levels
This chart shows approximate noise levels that are typically generated by various common outdoor and indoor
activities. Note, that, typical noise levels in a residential–commercial urban area ranges from 60 to 70 dBA.
Also, indoor sound levels with conversation (normal speech at 3 feet) can range at 60 to 70 dBA.
APPENDIX D
69/13kV Transformer Name Plate
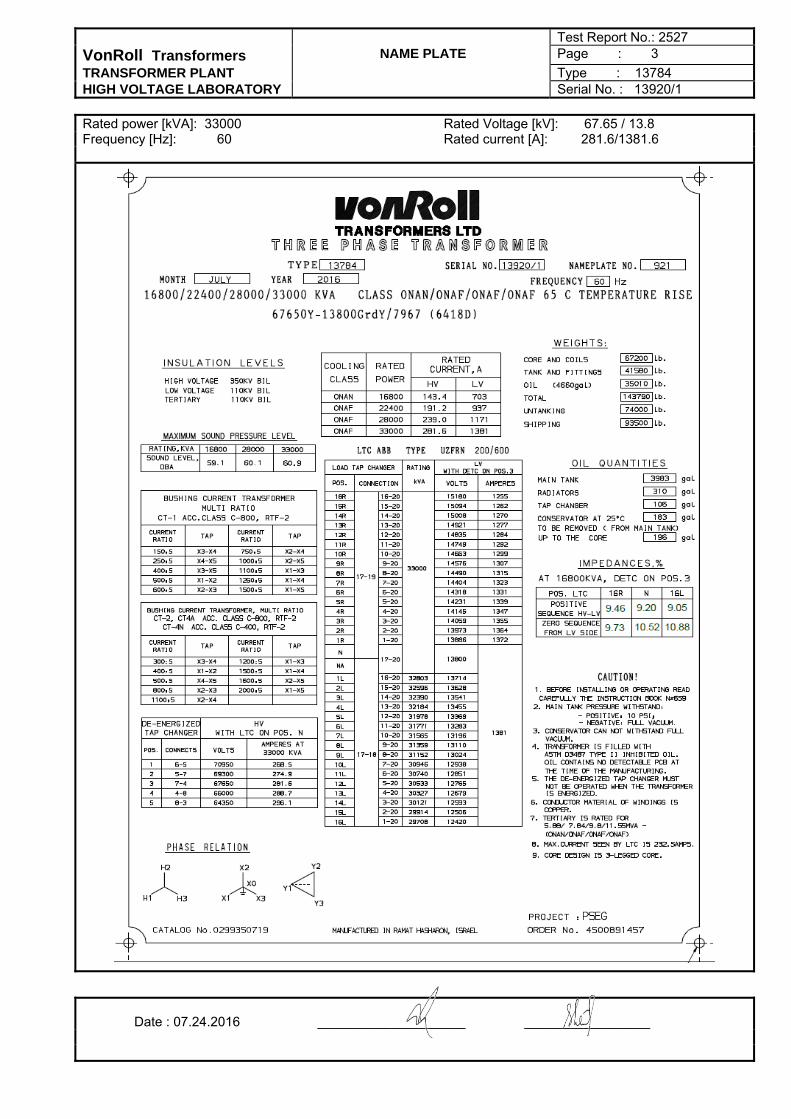
Test Report No.: 2527
VonRoll Transformers NAME PLATE Page : 3
TRANSFORMER PLANT Type : 13784 HIGH VOLTAGE LABORATORY Serial No. : 13920/1
Rated power [kVA]: 33000 Rated Voltage [kV]: 67.65 / 13.8 Frequency [Hz]: 60 Rated current [A]: 281.6/1381.6
Date : 07.24.2016 ____________________ _________________