Embed Size (px)
Citation preview
N
ational Survey of Veterans – Appendix D-1
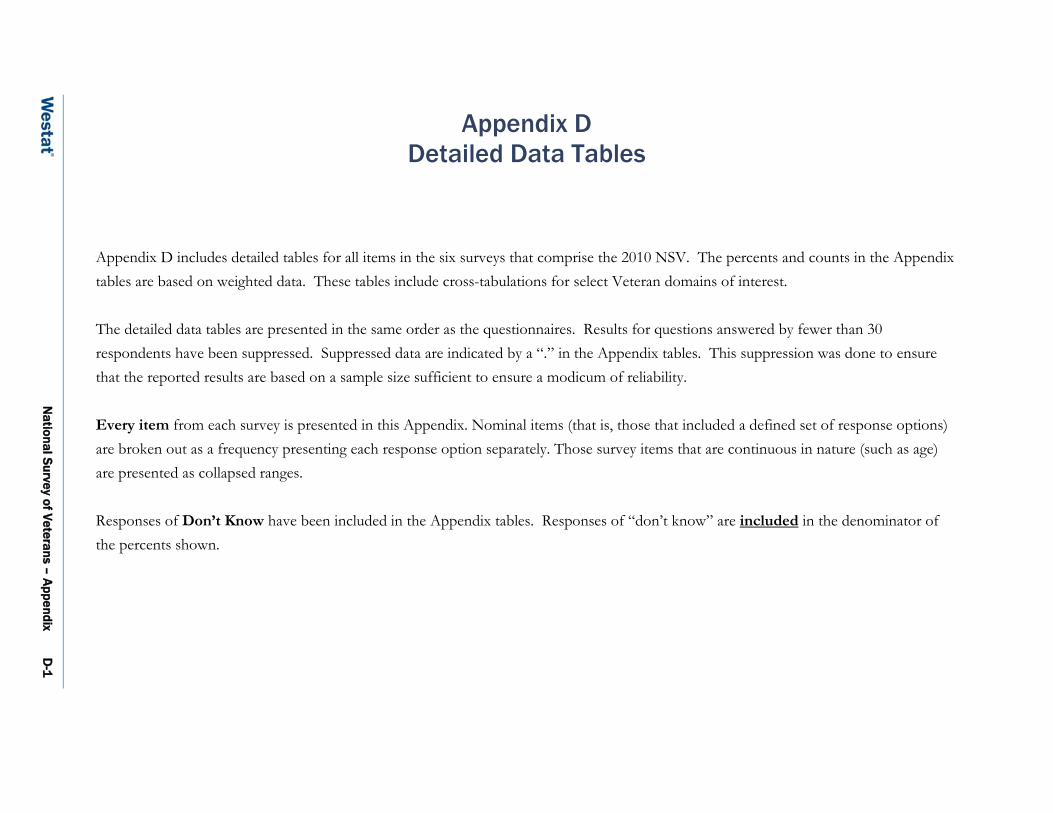
Appendix D Detailed Data Tables
Appendix D includes detailed tables for all items in the six surveys that comprise the 2010 NSV. The percents and counts in the Appendix tables are based on weighted data. These tables include cross-tabulations for select Veteran domains of interest.
The detailed data tables are presented in the same order as the questionnaires. Results for questions answered by fewer than 30 respondents have been suppressed. Suppressed data are indicated by a “.” in the Appendix tables. This suppression was done to ensure that the reported results are based on a sample size sufficient to ensure a modicum of reliability.
Every item from each survey is presented in this Appendix. Nominal items (that is, those that included a defined set of response options) are broken out as a frequency presenting each response option separately. Those survey items that are continuous in nature (such as age) are presented as collapsed ranges.
Responses of Don’t Know have been included in the Appendix tables. Responses of “don’t know” are included in the denominator of the percents shown.

2010 National Survey of Veterans - Appendix D - Detailed Tables
Veterans Survey Page D-2
VE-A1b. Any active duty service while serving as member of National Guard or Reserve (A1b)
Estimated Population Responding to Item 20,286,362
Never served on active duty as a member of the National Guard/Reserve Component 85.0%
Yes, served on active duty while in the National Guard/Reserves (and I am still serving in the National Guard/Reserves) 1.9%
Yes, served on active duty while in the National Guard/Reserves (and have separated/retired from the National Guard/Reserves) 13.2%
SOURCE: 2010 National Survey of Veterans – Veteran Survey
VE-A2. Branches served on during active duty (A2)
% Marked
Estimated Population
Responding to Item
Army 47.3% 21,851,485
Navy 23.0% 21,851,485
Air Force 20.4% 21,851,485
Marine Corps 9.9% 21,851,485
Coast Guard 1.5% 21,851,485
Other 0.4% 21,851,485 SOURCE: 2010 National Survey of Veterans – Veteran Survey

2010 National Survey of Veterans - Appendix D - Detailed Tables
Veterans Survey Page D-3
VE-A3. Periods of service (A3)
% Marked
Estimated Population
Responding to Item
September 2001 or later 11.7% 21,845,643
August 1990 to August 2001 (includes Persian Gulf War) 18.7% 21,845,643
May 1975 to July 1990 27.2% 21,845,643
Vietnam era (August 1964 to April 1975) 33.5% 21,845,643
February 1955 to July 1964 17.5% 21,845,643
Korean War (July 1950 to January 1955) 10.9% 21,845,643
January 1947 to June 1950 1.7% 21,845,643
World War II (December 1941 to December 1946) 8.6% 21,845,643
November 1941 or earlier 0.4% 21,845,643 SOURCE: 2010 National Survey of Veterans – Veteran Survey
VE-A4. Deployed in support of Operation Enduring Freedom (OEF) or Operation Iraqi Freedom (OIF) (A4)
Estimated Population Responding to Item 21,227,454
Yes 8.6%
No 91.4% SOURCE: 2010 National Survey of Veterans – Veteran Survey

2010 National Survey of Veterans - Appendix D - Detailed Tables
Veterans Survey Page D-4
VE-A5. Year first entered active duty (A5)
Estimated Population Responding to Item 21,551,729
1946 or earlier 8.8%
1947 to 1949 1.2%
1950 to 1954 9.7%
1955 to 1959 9.3%
1960 to 1964 10.2%
1965 to 1969 16.3%
1970 to 1974 8.8%
1975 to 1979 9.2%
1980 to 1984 8.0%
1985 to 1989 6.5%
1990 to 1994 3.7%
1995 to 1999 2.9%
2000 to 2004 4.3%
2005 to 2009 1.1% SOURCE: 2010 National Survey of Veterans – Veteran Survey

2010 National Survey of Veterans - Appendix D - Detailed Tables
Veterans Survey Page D-5
VE-A6. Year last released from active duty (A6)
Estimated Population Responding to Item 21,566,578
1946 or earlier 6.8%
1947 to 1949 1.4%
1950 to 1954 5.2%
1955 to 1959 8.7%
1960 to 1964 8.5%
1965 to 1969 12.6%
1970 to 1974 11.9%
1975 to 1979 6.9%
1980 to 1984 6.1%
1985 to 1989 6.3%
1990 to 1994 7.9%
1995 to 1999 5.1%
2000 to 2004 5.3%
2005 to 2009 7.2% SOURCE: 2010 National Survey of Veterans – Veteran Survey

2010 National Survey of Veterans - Appendix D - Detailed Tables
Veterans Survey Page D-6
VE-A7. Ever served in combat or war zone (A7)
Estimated Population Responding to Item 21,732,601
Yes 33.9%
No 66.1% SOURCE: 2010 National Survey of Veterans – Veteran Survey
VE-A8. During military serv: exposure to dead/dying/wounded people (A8)
Estimated Population Responding to Item 21,757,160
Yes 33.9%
No 66.1% SOURCE: 2010 National Survey of Veterans – Veteran Survey
VE-A9. Ever prisoner of war (A9)
Estimated Population Responding to Item 22,012,100
Yes 0.2%
No 99.8% SOURCE: 2010 National Survey of Veterans – Veteran Survey

2010 National Survey of Veterans - Appendix D - Detailed Tables
Veterans Survey Page D-7
VE-A10. During military serv: exposure to environmental hazards (A10)
Estimated Population Responding to Item 21,984,178
Definitely Yes 10.1%
Probably Yes 13.6%
Probably No 26.3%
Definitely No 29.7%
Don't know 20.2% SOURCE: 2010 National Survey of Veterans – Veteran Survey
VE-B1. How much understand VA benefits available (B1)
A lot Some A little Not at all
Estimated Population
Responding to Item
The Veterans benefits that are available to me 8.4% 32.6% 31.0% 27.9% 21,779,460
The Veterans health care benefits I’m entitled to 9.8% 24.3% 24.4% 41.5% 21,777,496
The Veterans burial benefits available to me 7.7% 21.3% 25.5% 45.5% 21,555,127
The Veterans education and training benefits I’m entitled to from VA 12.3% 25.3% 22.8% 39.5% 21,682,772
The Veterans life insurance benefits I’m entitled to 6.2% 13.8% 17.6% 62.4% 21,682,902
The Veterans Home Loan Guaranty benefits I’m entitled to 11.3% 24.1% 23.2% 41.4% 21,720,747 SOURCE: 2010 National Survey of Veterans – Veteran Survey
2010 National Survey of Veterans - Appendix D - Detailed Tables
Veterans Survey Page D-8
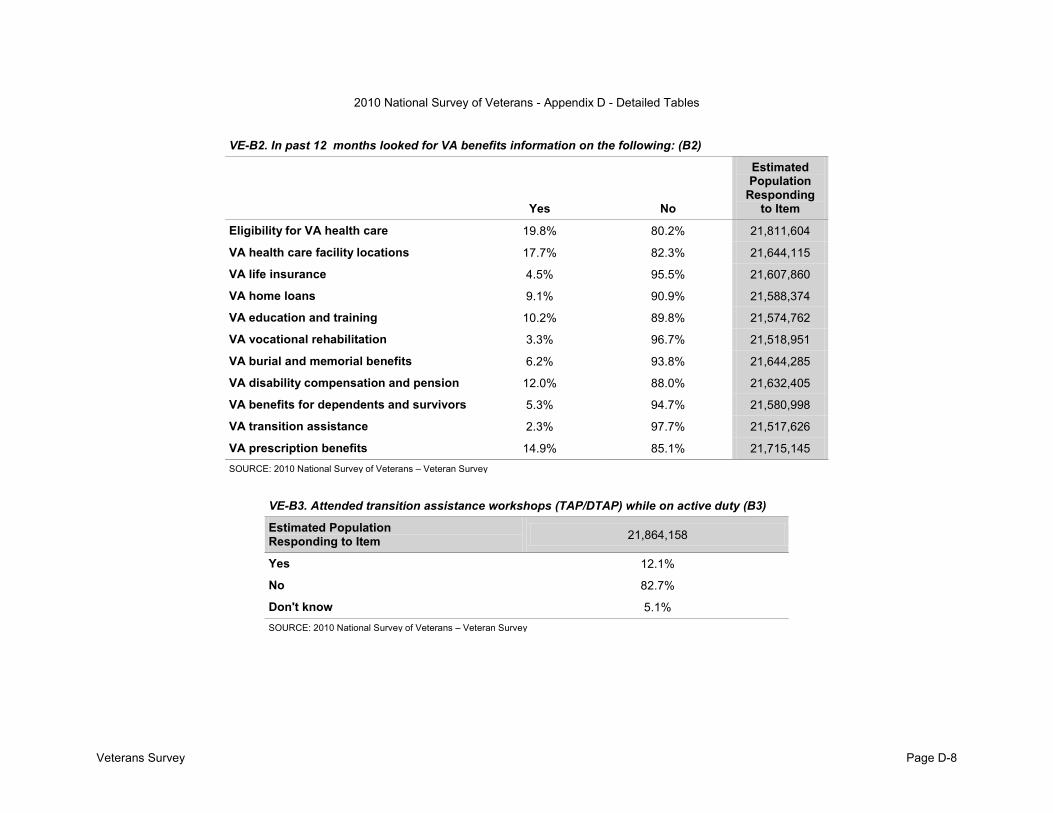
VE-B2. In past 12 months looked for VA benefits information on the following: (B2)
Yes No
Estimated Population
Responding to Item
Eligibility for VA health care 19.8% 80.2% 21,811,604
VA health care facility locations 17.7% 82.3% 21,644,115
VA life insurance 4.5% 95.5% 21,607,860
VA home loans 9.1% 90.9% 21,588,374
VA education and training 10.2% 89.8% 21,574,762
VA vocational rehabilitation 3.3% 96.7% 21,518,951
VA burial and memorial benefits 6.2% 93.8% 21,644,285
VA disability compensation and pension 12.0% 88.0% 21,632,405
VA benefits for dependents and survivors 5.3% 94.7% 21,580,998
VA transition assistance 2.3% 97.7% 21,517,626
VA prescription benefits 14.9% 85.1% 21,715,145 SOURCE: 2010 National Survey of Veterans – Veteran Survey
VE-B3. Attended transition assistance workshops (TAP/DTAP) while on active duty (B3)
Estimated Population Responding to Item 21,864,158
Yes 12.1%
No 82.7%
Don't know 5.1% SOURCE: 2010 National Survey of Veterans – Veteran Survey

2010 National Survey of Veterans - Appendix D - Detailed Tables
Veterans Survey Page D-9
VE-B3a. Usefulness of transition program in providing information about VA benefits/services (B3a)
Estimated Population Responding to Item 2,571,540
Very useful 24.7%
Useful 31.0%
Somewhat useful 32.6%
Not useful 11.7% SOURCE: 2010 National Survey of Veterans – Veteran Survey
VE-B3b. Agreement with statement: VA briefing gave me a thorough understanding of VA benefits (B3b)
Estimated Population Responding to Item 2,584,140
Completely agree 5.8%
Agree 37.4%
Neither agree nor disagree 34.9%
Disagree 15.9%
Completely disagree 5.9% SOURCE: 2010 National Survey of Veterans – Veteran Survey
VE-B3c. Extent that VA benefits portion of briefing was beneficial (B3c)
Estimated Population Responding to Item 2,678,523
Very beneficial 22.7%
Somewhat beneficial 62.4%
Not at all beneficial 14.9% SOURCE: 2010 National Survey of Veterans – Veteran Survey

2010 National Survey of Veterans - Appendix D - Detailed Tables
Veterans Survey Page D-10
VE-B3d. VA benefits presenter was knowledgeable on subject (B3d)
Estimated Population Responding to Item 2,647,373
Very knowledgeable 46.0%
Somewhat knowledgeable 45.6%
Not at all knowledgeable 8.4% SOURCE: 2010 National Survey of Veterans – Veteran Survey
VE-C1. Ever applied for VA disability benefits (C1)
Estimated Population Responding to Item 21,886,226
Yes 21.3%
No 78.7% SOURCE: 2010 National Survey of Veterans – Veteran Survey

2010 National Survey of Veterans - Appendix D - Detailed Tables
Veterans Survey Page D-11
VE-C1a. Reasons never applied for VA disability (C1A)
% Marked
Estimated Population
Responding to Item
Don’t have a service-connected disability 66.2% 15,501,214
Not aware of VA service-connected disability program 17.1% 15,501,214
Don’t think I’m entitled or eligible 36.6% 15,501,214
Getting military disability pay 1.1% 15,501,214
Getting disability income from another source 2.4% 15,501,214
Don’t think disability is severe enough 6.6% 15,501,214
Don’t know how to apply 14.2% 15,501,214
Don’t want any assistance 4.2% 15,501,214
Don’t need assistance 14.7% 15,501,214
Applying is too much trouble or red tape 6.6% 15,501,214
Never thought about it 22.1% 15,501,214
Other specify 2.5% 15,501,214
Don’t know 6.2% 15,501,214 SOURCE: 2010 National Survey of Veterans – Veteran Survey
VE-C2. Has a VA service-connected disability rating (C2)
Estimated Population Responding to Item 4,454,828
Yes 73.4%
No 26.6% SOURCE: 2010 National Survey of Veterans – Veteran Survey
2010 National Survey of Veterans - Appendix D - Detailed Tables
Veterans Survey Page D-12
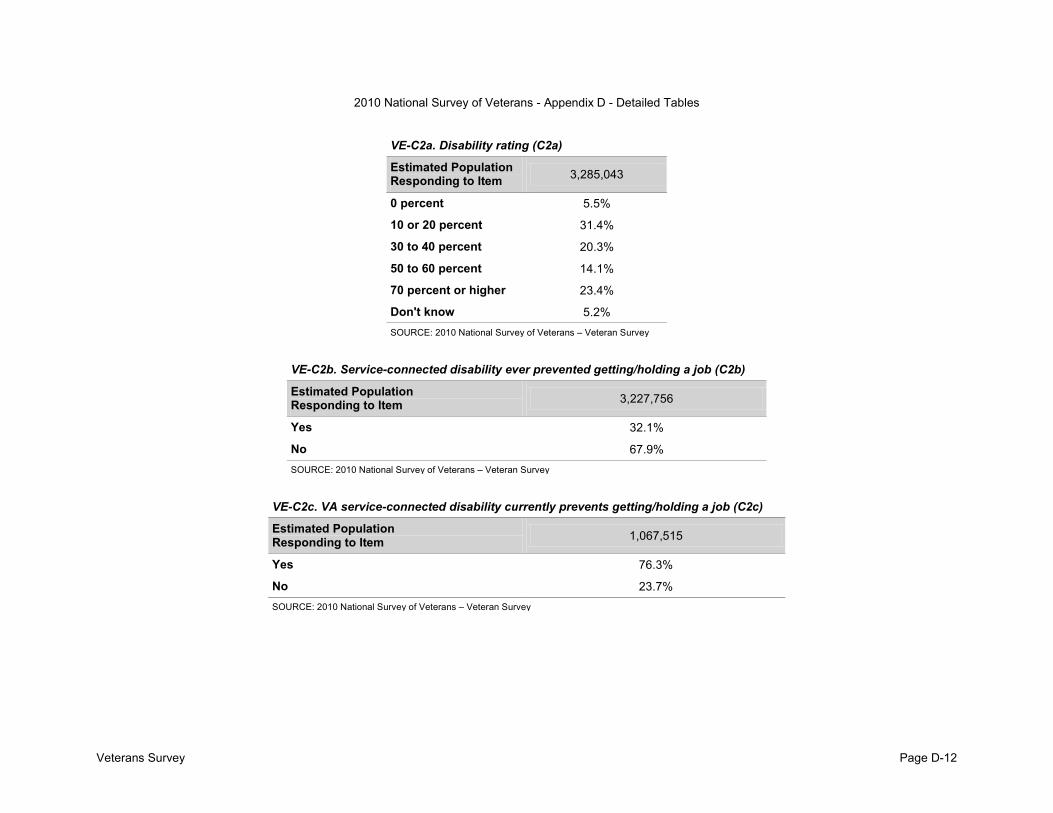
VE-C2a. Disability rating (C2a)
Estimated Population Responding to Item 3,285,043
0 percent 5.5%
10 or 20 percent 31.4%
30 to 40 percent 20.3%
50 to 60 percent 14.1%
70 percent or higher 23.4%
Don't know 5.2% SOURCE: 2010 National Survey of Veterans – Veteran Survey
VE-C2b. Service-connected disability ever prevented getting/holding a job (C2b)
Estimated Population Responding to Item 3,227,756
Yes 32.1%
No 67.9% SOURCE: 2010 National Survey of Veterans – Veteran Survey
VE-C2c. VA service-connected disability currently prevents getting/holding a job (C2c)
Estimated Population Responding to Item 1,067,515
Yes 76.3%
No 23.7% SOURCE: 2010 National Survey of Veterans – Veteran Survey

2010 National Survey of Veterans - Appendix D - Detailed Tables
Veterans Survey Page D-13
VE-C3. Status of most recent claim application (C3)
Estimated Population Responding to Item 4,479,722
Approved 50.0%
Waiting for decision from VA regional office 11.7%
Waiting for decision from the Board of Appeals 4.2%
Denied 21.5%
Don't know 12.6% SOURCE: 2010 National Survey of Veterans – Veteran Survey
VE-C4. Currently receiving monthly disability payments from VA (C4)
Estimated Population Responding to Item 4,735,467
Yes 67.1%
No 32.9% SOURCE: 2010 National Survey of Veterans – Veteran Survey
VE-C5. Type of VA disability income received (C5)
% Marked
Estimated Population
Responding to Item
Service-connected disability compensation 95.4% 2,866,441
Non-service-connected disability pension 4.8% 2,866,441 SOURCE: 2010 National Survey of Veterans – Veteran Survey

2010 National Survey of Veterans - Appendix D - Detailed Tables
Veterans Survey Page D-14
VE-C6. Importance of VA disability payment to help meet financial needs in past year (C6)
Estimated Population Responding to Item 2,932,814
Extremely important 60.5%
Very important 15.8%
Moderately important 9.7%
Slightly important 8.7%
Not at all important 3.6%
Don't know 1.7% SOURCE: 2010 National Survey of Veterans – Veteran Survey
VE-C7. Ever used vocational rehabilitation services from VA (C7)
Estimated Population Responding to Item 4,721,022
Yes 14.8%
No 85.2% SOURCE: 2010 National Survey of Veterans – Veteran Survey

2010 National Survey of Veterans - Appendix D - Detailed Tables
Veterans Survey Page D-15
VE-C8. Reasons not used VA vocational rehabilitation services (C8)
% Marked
Estimated Population
Responding to Item
Don’t have a service-connected disability 13.1% 3,592,501
Didn’t think disability was severe enough 21.5% 3,592,501
Didn’t know how to apply for or get needed benefits 32.3% 3,592,501
Didn’t want financial assistance from VA 1.4% 3,592,501
Didn’t need financial assistance from VA 6.0% 3,592,501
Applying was too much trouble or red tape 12.0% 3,592,501
Never considered applying 31.3% 3,592,501
Got assistance from somewhere else 4.5% 3,592,501
Got better/didn’t need assistance any more 1.3% 3,592,501
Just had claim approved 3.9% 3,592,501
Other specify 16.7% 3,592,501 SOURCE: 2010 National Survey of Veterans – Veteran Survey
VE-C9. Importance of VA vocational rehabilitation services in getting job (C9)
Estimated Population Responding to Item 687,400
Extremely important 31.6%
Very important 29.0%
Moderately important 14.7%
Slightly important 10.7%
Not at all important 13.9% SOURCE: 2010 National Survey of Veterans – Veteran Survey

2010 National Survey of Veterans - Appendix D - Detailed Tables
Veterans Survey Page D-16
VE-C10. If employed - VA services that were helpful in finding job (C10)
% Marked
Estimated Population
Responding to Item
Educational services 26.2% 651,388
Financial assistance 13.8% 651,388
Job development training 7.0% 651,388
Job placement services 3.9% 651,388
Not employed 50.7% 651,388
Other specify 17.1% 651,388 SOURCE: 2010 National Survey of Veterans – Veteran Survey
VE-C11. Reason used vocational rehabilitation when eligible for GI bill benefits (C11)
% Marked
Estimated Population
Responding to Item
Financial benefit 41.6% 581,243
Payment of tuition and books 46.9% 581,243
Length of training program 20.8% 581,243
Support of VA vocational rehabilitation counselor 28.1% 581,243
Assistance in finding employment 19.9% 581,243
Referral for medical or dental benefits 13.7% 581,243
Other specify 13.5% 581,243 SOURCE: 2010 National Survey of Veterans – Veteran Survey

2010 National Survey of Veterans - Appendix D - Detailed Tables
Veterans Survey Page D-17
VE-C12. Reason for stopping participation in vocational rehabilitation program (C12)
Estimated Population Responding to Item 591,137
I am still in the program 16.0%
Completed my program 45.9%
Financial barriers 6.9%
Changed jobs 6.3%
Medical reasons 15.4%
Other 9.5% SOURCE: 2010 National Survey of Veterans – Veteran Survey
VE-C13. Services that could have helped veteran complete program (C13)
% Marked
Estimated Population
Responding to Item
Financial support 56.1% 216,335
Flexible training program 31.0% 216,335
Job placement services 41.4% 216,335
Independent living services 25.1% 216,335
Other specify 24.7% 216,335 SOURCE: 2010 National Survey of Veterans – Veteran Survey

2010 National Survey of Veterans - Appendix D - Detailed Tables
Veterans Survey Page D-18
VE-C14. Services that did help veteran complete program (C14)
% Marked
Estimated Population
Responding to Item
Testing and evaluation 24.3% 256,621
Guidance and counseling 41.2% 256,621
Training and education 66.7% 256,621
Medical and dental referral 7.3% 256,621
Financial support 61.3% 256,621
Job placement 9.1% 256,621
Employment follow-up 7.4% 256,621
Other specify 7.5% 256,621 SOURCE: 2010 National Survey of Veterans – Veteran Survey
VE-D1. General health status (D1)
Estimated Population Responding to Item 21,831,649
Excellent 8.2%
Very good 27.3%
Good 36.7%
Fair 19.6%
Poor 8.1% SOURCE: 2010 National Survey of Veterans – Veteran Survey

2010 National Survey of Veterans - Appendix D - Detailed Tables
Veterans Survey Page D-19
VE-D2. Health status of teeth and gums (D2)
Estimated Population Responding to Item 21,674,209
Excellent 7.5%
Very good 21.0%
Good 30.5%
Fair 23.2%
Poor 17.8% SOURCE: 2010 National Survey of Veterans – Veteran Survey
VE-D3. Amount of assistance needed last week doing the following activities: (D3)
I can do without any assistance
I can do with some assistance
I am completely dependent on
assistance I do not do this activity
Estimated Population
Responding to Item
Bathing 94.1% 3.3% 1.3% 1.4% 20,932,582
Eating 96.5% 1.5% 0.7% 1.3% 20,848,105
Transferring from bed or a chair 95.0% 2.5% 0.8% 1.6% 20,954,688
Using the toilet 96.5% 1.5% 0.8% 1.3% 20,940,230
Walking around your home 93.4% 4.2% 0.9% 1.6% 20,998,521
Dressing 94.2% 3.7% 0.9% 1.3% 21,004,536
Preparing meals 89.3% 5.1% 1.7% 3.9% 20,972,778
Managing your money 89.1% 5.7% 2.2% 2.9% 20,984,258
Doing household chores 85.6% 8.2% 2.6% 3.6% 21,019,324
Using the telephone 94.8% 2.4% 1.0% 1.9% 20,999,987
Taking medications properly 90.2% 4.3% 2.2% 3.3% 21,023,792 SOURCE: 2010 National Survey of Veterans – Veteran Survey

2010 National Survey of Veterans - Appendix D - Detailed Tables
Veterans Survey Page D-20
VE-D4. Currently need aid and attendance of another person (D4)
Estimated Population Responding to Item 21,782,125
Yes 7.3%
No 92.7% SOURCE: 2010 National Survey of Veterans – Veteran Survey
VE-D5. Permanently housebound (D5)
Estimated Population Responding to Item 21,899,359
Yes 1.8%
No 98.2% SOURCE: 2010 National Survey of Veterans – Veteran Survey
VE-D6. Ever smoked at least 100 cigarettes (D6)
Estimated Population Responding to Item 21,969,136
Yes 64.0%
No 36.0% SOURCE: 2010 National Survey of Veterans – Veteran Survey
VE-D7. Current cigarette smoking (D7)
Estimated Population Responding to Item 21,974,850
Every day 13.9%
Some days 5.5%
Not at all 80.6% SOURCE: 2010 National Survey of Veterans – Veteran Survey

2010 National Survey of Veterans - Appendix D - Detailed Tables
Veterans Survey Page D-21
VE-E1. Ever enrolled in VA health care (E1)
Estimated Population Responding to Item 21,920,846
Yes 24.9%
No 68.0%
Don't know 7.1% SOURCE: 2010 National Survey of Veterans – Veteran Survey
VE-E2. Ever used VA health care benefits (E2)
Estimated Population Responding to Item 21,745,644
Yes 27.4%
No 68.9%
Don't know 3.7% SOURCE: 2010 National Survey of Veterans – Veteran Survey

2010 National Survey of Veterans - Appendix D - Detailed Tables
Veterans Survey Page D-22
VE-E2a. Reasons never used VA health care benefits (E2a)
% Marked
Estimated Population
Responding to Item
Did not need any care 41.7% 14,769,895
Not aware of VA health care benefits 42.3% 14,769,895
Not entitled to or eligible for health care benefits 10.5% 14,769,895
Do not know how to apply for health care benefits 26.4% 14,769,895
Did not need or want assistance from VA 8.3% 14,769,895
Too much trouble or red tape 9.8% 14,769,895
Never considered getting any health care from VA 30.0% 14,769,895
Don’t think VA health care would be as good as that available elsewhere 7.6% 14,769,895
I use other sources for health care 41.2% 14,769,895
VA care is difficult to access (parking, distance, appointment availability) 4.8% 14,769,895
Applied, but was told that I am not eligible 4.2% 14,769,895
Other specify 3.5% 14,769,895
Don’t know 5.7% 14,769,895 SOURCE: 2010 National Survey of Veterans – Veteran Survey
VE-E3. Used VA health care services or had VA pay for any health care in last 6 months (E3)
Estimated Population Responding to Item 5,935,208
Yes – I received services at VA, or they were paid for by VA 67.6%
No – I received services, but not from VA and were not paid for by VA 12.7%
No – I did not receive any health care services 18.3%
Don't know/Don't remember 1.4% SOURCE: 2010 National Survey of Veterans – Veteran Survey

2010 National Survey of Veterans - Appendix D - Detailed Tables
Veterans Survey Page D-23
VE-E3a. Reasons did not use VA health care services in the last 6 months (E3a)
% Marked
Estimated Population
Responding to Item
Do not need any care 30.8% 1,924,181
Not aware of the VA health care benefits 17.0% 1,924,181
Do not believe self entitled to or eligible for health care benefits 13.4% 1,924,181
Bad prior experience 11.2% 1,924,181
Do not know how to apply for health care benefits 11.8% 1,924,181
Do not need or want assistance from VA 3.4% 1,924,181
Applying for health care benefits too much trouble or red tape 8.8% 1,924,181
Never considered getting any health care from VA 10.7% 1,924,181
Don’t think VA health care would be as good as that available elsewhere 12.4% 1,924,181
Uses other sources for health care 44.8% 1,924,181
VA care is difficult to access (parking and/or appointment availability) 9.7% 1,924,181
VA care is difficult to access due to distance 15.6% 1,924,181
I do not feel welcome at VA 4.2% 1,924,181
VA does not provide the services that I need 1.3% 1,924,181
Other specify 7.9% 1,924,181
Don’t know 3.8% 1,924,181 SOURCE: 2010 National Survey of Veterans – Veteran Survey

2010 National Survey of Veterans - Appendix D - Detailed Tables
Veterans Survey Page D-24
VE-E4. Stay in hospital for medical/surgical care in last 6 months (E4)
Estimated Population Responding to Item 20,796,125
Yes 12.9%
No 87.1% SOURCE: 2010 National Survey of Veterans – Veteran Survey
VE-E4a. Sources of financial support for medical/surgical care in hospital (E4a)
% Marked
Estimated Population
Responding to Item
VA (Department of Veterans Affairs) 13.1% 3,357,349
CHAMPUS, CHAMPVA, or TRICARE (military) 8.1% 3,357,349
Medicare, including Medigap supplement 41.5% 3,357,349
Medicaid/Medical Assistance 8.6% 3,357,349
Some other federal/state/local government program 3.2% 3,357,349
Private insurance purchased directly or by a family member, through a union, or from a current or former employer 53.4% 3,357,349
Out of pocket by you or your family (copayment) 36.2% 3,357,349
Some other source 3.3% 3,357,349 SOURCE: 2010 National Survey of Veterans – Veteran Survey

2010 National Survey of Veterans - Appendix D - Detailed Tables
Veterans Survey Page D-25
VE-E5. Outpatient medical care in last 6 months (E5)
Estimated Population Responding to Item 20,929,005
Yes 74.9%
No 25.1% SOURCE: 2010 National Survey of Veterans – Veteran Survey
VE-E5a. Sources of financial support for outpatient medical care (E5a)
% Marked
Estimated Population
Responding to Item
VA (Department of Veterans Affairs) 18.3% 14,741,100
CHAMPUS, CHAMPVA, or TRICARE (military) 8.8% 14,741,100
Medicare, including Medigap supplement 34.2% 14,741,100
Medicaid/Medical Assistance 4.8% 14,741,100
Some other federal/state/local government program 3.5% 14,741,100
Private insurance purchased directly or by a family member, through a union, or from a current or former employer 55.1% 14,741,100
Out of pocket by you or your family (copayment) 40.0% 14,741,100
Some other source 2.4% 14,741,100 SOURCE: 2010 National Survey of Veterans – Veteran Survey

2010 National Survey of Veterans - Appendix D - Detailed Tables
Veterans Survey Page D-26
VE-E6. Stay in hospital for mental health/substance abuse in last 6 months (E6)
Estimated Population Responding to Item 21,354,189
Yes 1.0%
No 99.0% SOURCE: 2010 National Survey of Veterans – Veteran Survey
VE-E6a. Sources of financial support for mental health/substance abuse care in hospital (E6a)
% Marked
Estimated Population
Responding to Item
VA (Department of Veterans Affairs) 23.5% 549,862
CHAMPUS, CHAMPVA, or TRICARE (military) 7.4% 549,862
Medicare, including Medigap supplement 31.2% 549,862
Medicaid/Medical Assistance 7.3% 549,862
Some other federal/state/local government program 4.5% 549,862
Private insurance purchased directly or by a family member, through a union, or from a current or former employer 40.7% 549,862
Out of pocket by you or your family (copayment) 34.7% 549,862
Some other source 3.2% 549,862 SOURCE: 2010 National Survey of Veterans – Veteran Survey

2010 National Survey of Veterans - Appendix D - Detailed Tables
Veterans Survey Page D-27
VE-E7. Outpatient mental health/substance abuse counseling in last 6 months (E7)
Estimated Population Responding to Item 21,526,177
Yes 7.8%
No 92.2% SOURCE: 2010 National Survey of Veterans – Veteran Survey
VE-E7a. Sources of financial support for outpatient mental health/substance abuse counseling (E7a)
% Marked
Estimated Population
Responding to Item
VA (Department of Veterans Affairs) 43.0% 1,794,523
CHAMPUS, CHAMPVA, or TRICARE (military) 4.9% 1,794,523
Medicare, including Medigap supplement 16.8% 1,794,523
Medicaid/Medical Assistance 5.2% 1,794,523
Some other federal/state/local government program 6.8% 1,794,523
Private insurance purchased directly or by a family member, through a union, or from a current or former employer 30.8% 1,794,523
Out of pocket by you or your family (copayment) 30.3% 1,794,523
Some other source 4.0% 1,794,523 SOURCE: 2010 National Survey of Veterans – Veteran Survey

2010 National Survey of Veterans - Appendix D - Detailed Tables
Veterans Survey Page D-28
VE-E8. Prescription medicine in last 6 months (E8)
Estimated Population Responding to Item 21,602,473
Yes 80.7%
No 19.3% SOURCE: 2010 National Survey of Veterans – Veteran Survey
VE-E8a. Sources of financial support for prescription medications (E8a)
% Marked
Estimated Population
Responding to Item
VA (Department of Veterans Affairs) 19.2% 16,363,681
CHAMPUS, CHAMPVA, or TRICARE (military) 8.2% 16,363,681
Medicare, including Medigap supplement 22.2% 16,363,681
Medicaid/Medical Assistance 4.0% 16,363,681
Some other federal/state/local government program 3.9% 16,363,681
Private insurance purchased directly or by a family member, through a union, or from a current or former employer 54.7% 16,363,681
Out of pocket by you or your family (copayment) 48.7% 16,363,681
Some other source 2.1% 16,363,681 SOURCE: 2010 National Survey of Veterans – Veteran Survey

2010 National Survey of Veterans - Appendix D - Detailed Tables
Veterans Survey Page D-29
VE-E9. Over-the-counter medications in last 6 months (E9)
Estimated Population Responding to Item 21,231,501
Yes 77.4%
No 22.6% SOURCE: 2010 National Survey of Veterans – Veteran Survey
VE-E9a. Sources of financial support for over-the-counter medications (E9a)
% Marked
Estimated Population
Responding to Item
VA (Department of Veterans Affairs) 3.6% 15,695,023
CHAMPUS, CHAMPVA, or TRICARE (military) 2.1% 15,695,023
Medicare, including Medigap supplement 6.2% 15,695,023
Medicaid/Medical Assistance 1.4% 15,695,023
Some other federal/state/local government program 1.5% 15,695,023
Private insurance purchased directly or by a family member, through a union, or from a current or former employer 17.4% 15,695,023
Out of pocket by you or your family (copayment) 85.8% 15,695,023
Some other source 2.9% 15,695,023 SOURCE: 2010 National Survey of Veterans – Veteran Survey

2010 National Survey of Veterans - Appendix D - Detailed Tables
Veterans Survey Page D-30
VE-E10. In-home health care in the last 6 months (E10)
Estimated Population Responding to Item 21,597,143
Yes 3.5%
No 96.5% SOURCE: 2010 National Survey of Veterans – Veteran Survey
VE-E10a. Sources of financial support for in-home health care (E10a)
% Marked
Estimated Population
Responding to Item
VA (Department of Veterans Affairs) 14.1% 997,258
CHAMPUS, CHAMPVA, or TRICARE (military) 3.6% 997,258
Medicare, including Medigap supplement 42.4% 997,258
Medicaid/Medical Assistance 9.3% 997,258
Some other federal/state/local government program 5.4% 997,258
Private insurance purchased directly or by a family member, through a union, or from a current or former employer 34.1% 997,258
Out of pocket by you or your family (copayment) 38.0% 997,258
Some other source 4.5% 997,258 SOURCE: 2010 National Survey of Veterans – Veteran Survey

2010 National Survey of Veterans - Appendix D - Detailed Tables
Veterans Survey Page D-31
VE-E11. Care for prosthetics/medical equipment in last 6 months (E11)
Estimated Population Responding to Item 21,725,629
Yes 8.0%
No 92.0% SOURCE: 2010 National Survey of Veterans – Veteran Survey
VE-E11a. Sources of financial support for care of prosthetics/medical equipment (E11a)
% Marked
Estimated Population
Responding to Item
VA (Department of Veterans Affairs) 26.4% 1,781,299
CHAMPUS, CHAMPVA, or TRICARE (military) 9.0% 1,781,299
Medicare, including Medigap supplement 38.2% 1,781,299
Medicaid/Medical Assistance 7.1% 1,781,299
Some other federal/state/local government program 3.0% 1,781,299
Private insurance purchased directly or by a family member, through a union, or from a current or former employer 39.9% 1,781,299
Out of pocket by you or your family (copayment) 36.9% 1,781,299
Some other source 2.4% 1,781,299 SOURCE: 2010 National Survey of Veterans – Veteran Survey

2010 National Survey of Veterans - Appendix D - Detailed Tables
Veterans Survey Page D-32
VE-E12. Care for hearing aids/eye glasses in last 6 months (E12)
Estimated Population Responding to Item 21,634,789
Yes 42.9%
No 57.1% SOURCE: 2010 National Survey of Veterans – Veteran Survey
VE-E12a. Sources of financial support for care of hearing aids/eye glasses (E12a)
% Marked
Estimated Population
Responding to Item
VA (Department of Veterans Affairs) 13.8% 9,043,318
CHAMPUS, CHAMPVA, or TRICARE (military) 3.0% 9,043,318
Medicare, including Medigap supplement 16.2% 9,043,318
Medicaid/Medical Assistance 2.8% 9,043,318
Some other federal/state/local government program 2.6% 9,043,318
Private insurance purchased directly or by a family member, through a union, or from a current or former employer 41.1% 9,043,318
Out of pocket by you or your family (copayment) 65.7% 9,043,318
Some other source 1.7% 9,043,318 SOURCE: 2010 National Survey of Veterans – Veteran Survey

2010 National Survey of Veterans - Appendix D - Detailed Tables
Veterans Survey Page D-33
VE-E13. Stayed overnite in a rehabilitation hospital/nursing care in last 6 months (E13)
Estimated Population Responding to Item 21,690,464
Yes 2.4%
No 97.6% SOURCE: 2010 National Survey of Veterans – Veteran Survey
VE-E13a. Sources of financial support for care in rehabilitation hospital/nursing care (E13a)
% Marked
Estimated Population
Responding to Item
VA (Department of Veterans Affairs) 15.2% 636,961
CHAMPUS, CHAMPVA, or TRICARE (military) 4.9% 636,961
Medicare, including Medigap supplement 49.6% 636,961
Medicaid/Medical Assistance 14.5% 636,961
Some other federal/state/local government program 4.1% 636,961
Private insurance purchased directly or by a family member, through a union, or from a current or former employer 41.4% 636,961
Out of pocket by you or your family (copayment) 38.2% 636,961
Some other source 4.2% 636,961 SOURCE: 2010 National Survey of Veterans – Veteran Survey
2010 National Survey of Veterans - Appendix D - Detailed Tables
Veterans Survey Page D-34
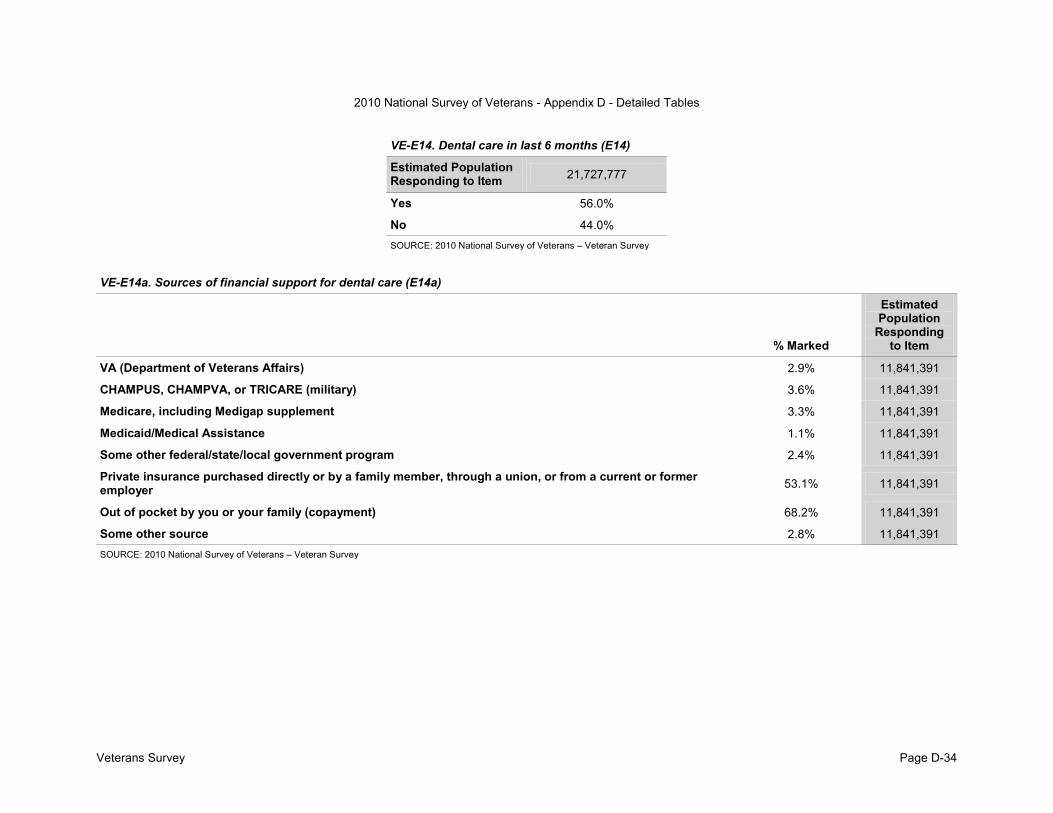
VE-E14. Dental care in last 6 months (E14)
Estimated Population Responding to Item 21,727,777
Yes 56.0%
No 44.0% SOURCE: 2010 National Survey of Veterans – Veteran Survey
VE-E14a. Sources of financial support for dental care (E14a)
% Marked
Estimated Population
Responding to Item
VA (Department of Veterans Affairs) 2.9% 11,841,391
CHAMPUS, CHAMPVA, or TRICARE (military) 3.6% 11,841,391
Medicare, including Medigap supplement 3.3% 11,841,391
Medicaid/Medical Assistance 1.1% 11,841,391
Some other federal/state/local government program 2.4% 11,841,391
Private insurance purchased directly or by a family member, through a union, or from a current or former employer 53.1% 11,841,391
Out of pocket by you or your family (copayment) 68.2% 11,841,391
Some other source 2.8% 11,841,391 SOURCE: 2010 National Survey of Veterans – Veteran Survey

2010 National Survey of Veterans - Appendix D - Detailed Tables
Veterans Survey Page D-35
VE-E15. Visited emergency room in last 6 months (E15)
Estimated Population Responding to Item 21,680,976
Yes 17.0%
No 83.0% SOURCE: 2010 National Survey of Veterans – Veteran Survey
VE-E15a. Sources of financial support for emergency room visit (E15a)
% Marked
Estimated Population
Responding to Item
VA (Department of Veterans Affairs) 14.8% 3,725,884
CHAMPUS, CHAMPVA, or TRICARE (military) 8.0% 3,725,884
Medicare, including Medigap supplement 31.2% 3,725,884
Medicaid/Medical Assistance 7.0% 3,725,884
Some other federal/state/local government program 3.6% 3,725,884
Private insurance purchased directly or by a family member, through a union, or from a current or former employer 47.6% 3,725,884
Out of pocket by you or your family (copayment) 44.0% 3,725,884
Some other source 4.0% 3,725,884 SOURCE: 2010 National Survey of Veterans – Veteran Survey

2010 National Survey of Veterans - Appendix D - Detailed Tables
Veterans Survey Page D-36
VE-E16. Other medical treatment in last 6 months (E16)
Estimated Population Responding to Item 21,494,177
Yes 29.7%
No 70.3% SOURCE: 2010 National Survey of Veterans – Veteran Survey
VE-E16b. Sources of financial support for other medical treatment (E16b)
% Marked
Estimated Population
Responding to Item
VA (Department of Veterans Affairs) 14.8% 6,451,038
CHAMPUS, CHAMPVA, or TRICARE (military) 7.1% 6,451,038
Medicare, including Medigap supplement 39.4% 6,451,038
Medicaid/Medical Assistance 5.9% 6,451,038
Some other federal/state/local government program 4.4% 6,451,038
Private insurance purchased directly or by a family member, through a union, or from a current or former employer 50.4% 6,451,038
Out of pocket by you or your family (copayment) 45.2% 6,451,038
Some other source 2.8% 6,451,038 SOURCE: 2010 National Survey of Veterans – Veteran Survey

2010 National Survey of Veterans - Appendix D - Detailed Tables
Veterans Survey Page D-37
VE-E17. How much agree or disagree on following statements about VA health benefit use (E17)
Strongly
agree Agree
Neither agree nor disagree Disagree
Strongly disagree
Don't know
Estimated Population
Responding to Item
If the cost of health care to me increases, I will use VA more 20.6% 20.0% 17.7% 5.6% 3.2% 32.9% 21,080,035
I would only use VA if I did not have access to any other source of health care 20.5% 26.9% 16.4% 11.2% 6.5% 18.5% 20,977,760
I have a doctor outside VA who I really trust 29.0% 28.7% 16.9% 7.9% 8.2% 9.3% 20,933,054
Veterans who can afford to use other sources of health care should leave VA to those who really need it 18.7% 25.3% 21.8% 13.5% 11.2% 9.5% 21,045,855
Veterans like me who use VA are satisfied with the health care they receive 10.0% 14.3% 19.3% 3.3% 1.9% 51.1% 20,263,580
VA health care providers explain treatment/ diagnoses in a way that patients can understand 9.5% 13.0% 13.7% 2.1% 1.2% 60.6% 20,310,548
There is a VA provider in my area that offers all of the health care services that Veterans like me need 14.0% 17.7% 9.6% 3.6% 2.9% 52.2% 20,620,259
SOURCE: 2010 National Survey of Veterans – Veteran Survey
VE-E18. Veteran has one provider in charge of their care (E18)
Estimated Population Responding to Item 21,388,003
Yes 69.1%
No 30.9% SOURCE: 2010 National Survey of Veterans – Veteran Survey

2010 National Survey of Veterans - Appendix D - Detailed Tables
Veterans Survey Page D-38
VE-E20. Accessed woman's health care (e.g. pap smear/prenatal care) last 12 months (E20)
Estimated Population Responding to Item 1,724,752
Yes 57.9%
No 42.1% SOURCE: 2010 National Survey of Veterans – Veteran Survey
VE-E21. Sources of woman's health care (E21)
Yes No
Estimated Population
Responding to Item
A primary care clinic at a VA facility 25.1% 74.9% 843,800
A women’s health clinic or gynecology clinic at a VA facility 28.4% 71.6% 837,743
Any provider or facility outside VA, but paid for by VA 7.4% 92.6% 798,165
Any provider or facility outside VA, not paid for by VA 61.9% 38.1% 854,193
Any women’s healthcare provider or gynecology clinic outside VA, not paid for by VA 56.2% 43.8% 829,950 SOURCE: 2010 National Survey of Veterans – Veteran Survey

2010 National Survey of Veterans - Appendix D - Detailed Tables
Veterans Survey Page D-39
VE-E22. Would veteran consider VA for long-term nursing home care (E22)
Estimated Population Responding to Item 21,359,203
Definitely go to VA 19.7%
Maybe go to VA 66.1%
Definitely go somewhere else 14.2% SOURCE: 2010 National Survey of Veterans – Veteran Survey
VE-E23. Plans for using VA health care in future (E23)
Estimated Population Responding to Item 17,997,715
As your primary source of health care 16.2%
In addition to non-VA care for some services 11.6%
A "safety net" to use only if I lose other sources of health care 34.8%
For prescriptions 3.4%
For specialized care 0.8%
Some other way 1.5%
No plans to use VA for health care 31.7% SOURCE: 2010 National Survey of Veterans – Veteran Survey

2010 National Survey of Veterans - Appendix D - Detailed Tables
Veterans Survey Page D-40
VE-F1. Current health insurance coverage (F1)
% Marked
Estimated Population
Responding to Item
No health insurance 13.1% 21,856,552
Insurance through a current or former employer or union (of yours or another family member) 53.1% 21,856,552
Insurance purchased directly from an insurance company (by you or another family member) 12.8% 21,856,552
Medicare, for people 65 and older, or people with certain disabilities 39.2% 21,856,552
Medicaid, Medical Assistance, or any kind of government-assistance plan for those with low incomes or a disability 3.5% 21,856,552
VA (including those who have ever used or enrolled for VA health care) 11.1% 21,856,552
TRICARE, TRICARE for Life or other military health care 9.3% 21,856,552
Indian Health Service 0.3% 21,856,552
Any other type of health insurance or health coverage plan Please specify below 2.8% 21,856,552 SOURCE: 2010 National Survey of Veterans – Veteran Survey
VE-F1a. Sources of coverage (F1a)
% Marked
Estimated Population
Responding to Item
No health insurance 13.3% 20,407,963
Current employer, including COBRA coverage 30.1% 20,407,963
Former employer 20.2% 20,407,963
Individually purchased coverage 18.8% 20,407,963
Federal, State, County, or local community health services program 17.5% 20,407,963
Family member, such as a spouse, parent, etc. 10.5% 20,407,963
Or from somewhere else 3.1% 20,407,963 SOURCE: 2010 National Survey of Veterans – Veteran Survey

2010 National Survey of Veterans - Appendix D - Detailed Tables
Veterans Survey Page D-41
VE-F2. Receive Medicare coverage through a Medicare Advantage Plan (F2)
Estimated Population Responding to Item 7,649,794
Yes 43.3%
No 56.7% SOURCE: 2010 National Survey of Veterans – Veteran Survey
VE-F2a. Medicare coverage pays for: (F2a)
Yes No
Estimated Population
Responding to Item
Care if you are hospitalized? 96.6% 3.4% 8,034,324
Doctor’s office visits? 91.4% 8.6% 8,004,676
Prescription drug coverage, ‘Part D’? 47.9% 52.1% 7,670,439 SOURCE: 2010 National Survey of Veterans – Veteran Survey
VE-F3. Purchased Private Health Care to Supplement Medicare (F3)
Estimated Population Responding to Item 8,183,771
Yes 60.3%
No 39.7% SOURCE: 2010 National Survey of Veterans – Veteran Survey

2010 National Survey of Veterans - Appendix D - Detailed Tables
Veterans Survey Page D-42
VE-F4. Insurance includes prescription drug coverage (F4)
Estimated Population Responding to Item 21,441,651
Yes 76.4%
No 23.6% SOURCE: 2010 National Survey of Veterans – Veteran Survey
VE-F5. Currently have prescription drug coverage from VA (F5)
Estimated Population Responding to Item 13,986,956
Yes 12.4%
No 75.1%
Don't know 12.5% SOURCE: 2010 National Survey of Veterans – Veteran Survey
VE-F6. Agreement with the following statements: (F6)
Strongly
agree Agree Neither agree nor disagree Disagree
Strongly disagree
Estimated Population
Responding to Item
I feel I know what is available to me through my VA health coverage 4.6% 13.9% 18.0% 28.7% 34.8% 20,835,279
My family has a health insurance plan that adequately covers me and my family 16.0% 33.5% 16.9% 12.7% 21.0% 20,329,699
SOURCE: 2010 National Survey of Veterans – Veteran Survey
VE-G1. Excluding VA voc rehab, used other VA education/training benefits (G1)
Estimated Population Responding to Item 21,699,417
Yes 36.9%
No 63.1% SOURCE: 2010 National Survey of Veterans – Veteran Survey

2010 National Survey of Veterans - Appendix D - Detailed Tables
Veterans Survey Page D-43
VE-G2. When used VA education/training benefit (G2)
% Marked
Estimated Population
Responding to Item
During active duty service 7.9% 7,462,286
After active duty service 86.4% 7,462,286
Both during and after active duty service 12.3% 7,462,286
Have never used education and training benefits 1.7% 7,462,286 SOURCE: 2010 National Survey of Veterans – Veteran Survey
VE-G2a. How used VA education benefit? (G2a)
% Marked
Estimated Population
Responding to Item
Took college or university coursework leading to a bachelor or graduate degree 64.8% 7,608,332
Attended business, technical or vocational school training leading to a certificate or diploma 23.5% 7,608,332
Participated in an apprenticeship or on-the-job training program 7.5% 7,608,332
Took correspondence courses 7.2% 7,608,332
Took flight training 3.1% 7,608,332
Received tutorial assistance, refresher courses, or deficiency training 1.6% 7,608,332
Attended a teacher certification program 1.6% 7,608,332
Did something else: Please specify below 5.8% 7,608,332 SOURCE: 2010 National Survey of Veterans – Veteran Survey

2010 National Survey of Veterans - Appendix D - Detailed Tables
Veterans Survey Page D-44
VE-G2b. Completed training/received degree/certificate (G2b)
Estimated Population Responding to Item 7,746,860
Yes 66.6%
No 33.4% SOURCE: 2010 National Survey of Veterans – Veteran Survey
VE-G2c. Importance of VA educ benefits for your education goals/getting better job (G2c)
Estimated Population Responding to Item 7,773,561
Extremely important 47.5%
Very important 25.7%
Moderately important 13.5%
Slightly important 7.1%
Not at all important 6.1% SOURCE: 2010 National Survey of Veterans – Veteran Survey

2010 National Survey of Veterans - Appendix D - Detailed Tables
Veterans Survey Page D-45
VE-G3. Reasons did not use VA educational assistance (G3)
% Marked
Estimated Population
Responding to Item
I used state education benefits from the National Guard instead 0.5% 13,108,767
Not aware of VA education or training benefits 36.6% 13,108,767
Don’t believe entitled to or eligible for education or training benefits 24.5% 13,108,767
My period of eligibility expired/ran out 20.6% 13,108,767
Don’t know how to apply for education or training benefits 19.4% 13,108,767
Don’t need any additional education or training 21.5% 13,108,767
Don’t need or want assistance from VA 5.7% 13,108,767
Too much trouble or red tape 6.4% 13,108,767
Never considered getting any education or training from VA 30.0% 13,108,767
Didn’t pay into training funds during active duty 9.3% 13,108,767
Other: Please specify type below 6.4% 13,108,767 SOURCE: 2010 National Survey of Veterans – Veteran Survey
VE-G4. Received other education/training assistance since discharge (G4)
Estimated Population Responding to Item 21,379,833
Yes 13.6%
No 86.4% SOURCE: 2010 National Survey of Veterans – Veteran Survey

2010 National Survey of Veterans - Appendix D - Detailed Tables
Veterans Survey Page D-46
VE-G6. Used military's tuition assistance while on active duty (G6)
Estimated Population Responding to Item 20,562,384
Yes 13.6%
No 86.4% SOURCE: 2010 National Survey of Veterans – Veteran Survey
VE-H1. Work status during the last week (H1)
Estimated Population Responding to Item 20,856,678
Working, or on paid vacation or sick leave from work 45.0%
Not working, but looking for work 9.7%
Not working and not looking for work 45.3% SOURCE: 2010 National Survey of Veterans – Veteran Survey
VE-H1a. Main reason not looking for work (H1a)
Estimated Population Responding to Item 8,940,838
You are retired 81.4%
You are disabled 12.8%
You stopped looking for work because you could not find work 0.7%
You were temporarily laid off from work 0.4%
You were taking care of your home and family 1.8%
You were going to school 1.5%
Other 1.4% SOURCE: 2010 National Survey of Veterans – Veteran Survey

2010 National Survey of Veterans - Appendix D - Detailed Tables
Veterans Survey Page D-47
VE-H2. Recent civilian job matched occupation trained for while in military (H2)
Estimated Population Responding to Item 20,317,550
Yes 21.7%
No 75.3%
Have not had civilian jobs 3.0% SOURCE: 2010 National Survey of Veterans – Veteran Survey
VE-H3. Extent that military training/experience applied to recent civilian job (H3)
Estimated Population Responding to Item 17,906,695
A lot 17.1%
Some 24.0%
A little 17.3%
Not at all 41.6% SOURCE: 2010 National Survey of Veterans – Veteran Survey
VE-H4. How well prepared when leaving military for civilian job market (H4)
Estimated Population Responding to Item 21,269,530
Very well prepared 12.6%
Well prepared 26.8%
Neither well nor poorly prepared 35.8%
Poorly prepared 12.6%
Very poorly prepared 9.6%
Not applicable/I was not interested in entering the civilian job market 2.5% SOURCE: 2010 National Survey of Veterans – Veteran Survey

2010 National Survey of Veterans - Appendix D - Detailed Tables
Veterans Survey Page D-48
VE-H5 Agreement with following statements on transition process: (H5)
Strongly
agree Agree
Neither agree nor disagree Disagree
Strongly disagree
Don't know
Estimated Population
Responding to Item
The military allowed me enough time to prepare for my transition and job search 5.6% 19.7% 27.3% 15.2% 18.0% 14.3% 20,909,980
My chain of command was supportive when I began transition processing 6.1% 19.6% 26.0% 13.4% 18.2% 16.7% 20,628,099
SOURCE: 2010 National Survey of Veterans – Veteran Survey
VE-I1. Currently covered by VA life insurance VGLI/SDVI (I1)
Estimated Population Responding to Item 21,334,170
Yes, covered by VGLI 7.6%
Yes, covered by SDVI 0.7%
No, not covered by VA life insurance 91.7% SOURCE: 2010 National Survey of Veterans – Veteran Survey
VE-I1a. Best way for VA to communicate VGLI program changes (I1a)
Estimated Population Responding to Item 1,359,878
Email 14.2%
Direct mailings 80.5%
Veterans Affairs (VA) insurance web site (www.insurance.VA.gov) 3.3%
Other 2.0% SOURCE: 2010 National Survey of Veterans – Veteran Survey

2010 National Survey of Veterans - Appendix D - Detailed Tables
Veterans Survey Page D-49
VE-I1b. Reasons no VA life insurance (I1b)
% Marked
Estimated Population
Responding to Item
Not aware of VA insurance benefits 65.8% 19,117,396
Not entitled or eligible 9.3% 19,117,396
Don’t know how to apply for benefits 27.4% 19,117,396
Don’t need any insurance 6.8% 19,117,396
Don’t need or want assistance from VA 2.5% 19,117,396
Too much trouble or red tape 4.6% 19,117,396
Never considered getting any insurance from VA 29.9% 19,117,396
Elected to forgo coverage while on active duty 0.9% 19,117,396
Never converted active duty life insurance policy to Veteran’s policy 20.9% 19,117,396
Allowed policy to lapse 6.8% 19,117,396
Other specify 4.1% 19,117,396 SOURCE: 2010 National Survey of Veterans – Veteran Survey
VE-I2. Except VA policy, have life insurance from other source (I2)
Estimated Population Responding to Item 21,076,024
Yes 66.3%
No 33.7% SOURCE: 2010 National Survey of Veterans – Veteran Survey

2010 National Survey of Veterans - Appendix D - Detailed Tables
Veterans Survey Page D-50
VE-I2a. If insurance from other source, coverage amount (I2a)
Estimated Population Responding to Item 12,957,608
Less than $10,000 12.5%
$10,000 to $49,999 28.9%
$50,000 to $99,999 17.7%
$100,000 to $199,999 17.4%
$200,000 to $399,999 12.8%
$400,000 to $599,999 6.1%
$600,000 to $999,999 2.3%
$1,000,000 or more 2.3% SOURCE: 2010 National Survey of Veterans – Veteran Survey
VE-I3. Aware of ability to convert SGLI to VGLI after discharge (I3)
Estimated Population Responding to Item 20,095,606
Yes 21.7%
No 72.9%
SGLI was not available to me 4.8%
SGLI was available, but I did not have it while on active duty 0.7% SOURCE: 2010 National Survey of Veterans – Veteran Survey

2010 National Survey of Veterans - Appendix D - Detailed Tables
Veterans Survey Page D-51
VE-J1. Current living arrangement (J1)
Estimated Population Responding to Item 21,733,607
Rent my home 16.2%
Own my home—with an outstanding mortgage 44.0%
Own my home—no mortgage balance 31.5%
Occupy dwelling with no payment of cash rent 2.8%
Other 5.5% SOURCE: 2010 National Survey of Veterans – Veteran Survey
VE-J2. Aware of VA home loan guaranty program for eligible veterans (J2)
Estimated Population Responding to Item 21,534,769
Yes 68.2%
No 31.8% SOURCE: 2010 National Survey of Veterans – Veteran Survey
VE-J3. Ever obtain home loan (J3)
Estimated Population Responding to Item 21,681,337
Yes 55.2%
No 44.8% SOURCE: 2010 National Survey of Veterans – Veteran Survey

2010 National Survey of Veterans - Appendix D - Detailed Tables
Veterans Survey Page D-52
VE-J3a. Lender discussed VA home loan guaranty as option (J3a)
Estimated Population Responding to Item 11,328,094
Yes 36.1%
No 31.2%
Don't remember 32.7% SOURCE: 2010 National Survey of Veterans – Veteran Survey
VE-J4. Ever used VA home loan guaranty program (J4)
Estimated Population Responding to Item 11,368,544
Yes, currently have VA home loan 13.0%
Yes, not currently, but have had VA home loan in the past 53.7%
No, never have had VA home loan 33.3% SOURCE: 2010 National Survey of Veterans – Veteran Survey
VE-J4a. How long ago obtained most recent home loan (J4a)
Estimated Population Responding to Item 7,899,943
Within last 5 years 20.6%
6-10 years ago 15.8%
11-20 years ago 21.7%
More than 20 years ago 41.9% SOURCE: 2010 National Survey of Veterans – Veteran Survey

2010 National Survey of Veterans - Appendix D - Detailed Tables
Veterans Survey Page D-53
VE-J4b. When used VA home loan guaranty program (J4b)
Estimated Population Responding to Item 7,762,708
During active duty service 13.5%
After active duty service 81.4%
Both during and after active duty service 5.1% SOURCE: 2010 National Survey of Veterans – Veteran Survey
VE-J5. Most important reason used VA home loan (J5)
Estimated Population Responding to Item 5,998,319
VA loan program is offered only to U.S. Veterans 8.1%
No down payment required 46.0%
Convenience 8.3%
No mortgage insurance required 2.5%
Favorable interest rate 22.5%
Loan more likely to be approved 10.9%
VA's assistance to avoid foreclosure 0.1%
Previous experience with the VA loan program 1.6% SOURCE: 2010 National Survey of Veterans – Veteran Survey

2010 National Survey of Veterans - Appendix D - Detailed Tables
Veterans Survey Page D-54
VE-J6. Main reason did not use VA home loan program (J6)
Estimated Population Responding to Item 3,166,938
A conventional FHA mortgage was easier or less expensive for me to obtain 31.8%
I applied for a VA home loan, but did not qualify 1.6%
I did not apply because I did not think that I would qualify 9.9%
I thought that the process for obtaining a VA loan would take too long 5.0%
My lender and/or realtor discouraged the use of the VA program 8.1%
The VA funding fee was too high 1.6%
I didn't know about the program 33.6%
Other 8.4% SOURCE: 2010 National Survey of Veterans – Veteran Survey
VE-K1. Satisfaction with ability to get accurate burial benefit information (K1)
Estimated Population Responding to Item 21,737,972
Very satisfied 4.0%
Satisfied 10.2%
Neither satisfied nor dissatisfied 18.1%
Dissatisfied 5.4%
Very dissatisfied 2.5%
I have not tried to get information 59.7% SOURCE: 2010 National Survey of Veterans – Veteran Survey

2010 National Survey of Veterans - Appendix D - Detailed Tables
Veterans Survey Page D-55
VE-K2. Importance of various aspects of VA cemeteries: (K2)
Very
important Important Not very
important Not at all important
Don't know
Estimated Population
Responding to Item
Maintenance of the cemetery grounds 58.0% 30.1% 2.6% 1.4% 7.9% 21,140,124
Upkeep of headstones, markers, and wall covers for cremated remains 57.8% 30.4% 2.5% 1.3% 8.0% 20,996,920
Maintenance of other landscape features 50.1% 35.6% 4.4% 1.6% 8.3% 20,952,353
Appearance of committal shelters 47.7% 34.0% 4.7% 1.7% 11.9% 20,851,086
Appearance of individual gravesites 54.3% 33.5% 2.9% 1.4% 8.0% 20,952,768
Maintenance of cemetery buildings and roads 51.2% 35.9% 3.6% 1.4% 7.9% 20,926,591
Cemetery’s front gate and entrance area 51.3% 34.3% 4.8% 1.6% 8.1% 20,912,624
Availability of parking and/or restrooms 44.9% 36.4% 8.2% 2.0% 8.5% 20,927,256
Public ceremonies and events that honor Veterans 54.1% 31.2% 4.8% 1.8% 8.1% 20,926,982
Presentation of military funeral honors 57.9% 28.7% 3.9% 1.6% 7.9% 20,971,436
Other specify 28.7% 15.6% 6.0% 3.5% 46.2% 3,112,199 SOURCE: 2010 National Survey of Veterans – Veteran Survey

2010 National Survey of Veterans - Appendix D - Detailed Tables
Veterans Survey Page D-56
VE-K3. Heard of the following burial benefits before today: (K3)
Yes No Don't know
Estimated Population
Responding to Item
Burial at a VA National or State Veterans cemetery 41.5% 42.5% 16.0% 21,335,874
Headstone and burial markers provided by VA at private cemeteries 27.7% 55.4% 16.8% 21,352,481
Presidential Memorial Certificates for next of kin 9.3% 68.7% 22.0% 21,125,902
Cash plot allowance 7.3% 71.1% 21.5% 21,213,686
Cash burial allowance 10.6% 68.3% 21.1% 21,215,629
Military Funeral Honors 37.9% 45.2% 16.9% 21,243,983
Receiving a US Flag 46.1% 39.7% 14.2% 21,347,863 SOURCE: 2010 National Survey of Veterans – Veteran Survey
VE-L1. Plan for type of burial (L1)
Estimated Population Responding to Item 21,264,755
Casket burial, in-ground 41.7%
Cremation, in-ground 15.2%
Cremation, columbarium 8.6%
Mausoleum 1.5%
Something else 9.1%
Don’t know 23.9% SOURCE: 2010 National Survey of Veterans – Veteran Survey
2010 National Survey of Veterans - Appendix D - Detailed Tables
Veterans Survey Page D-57
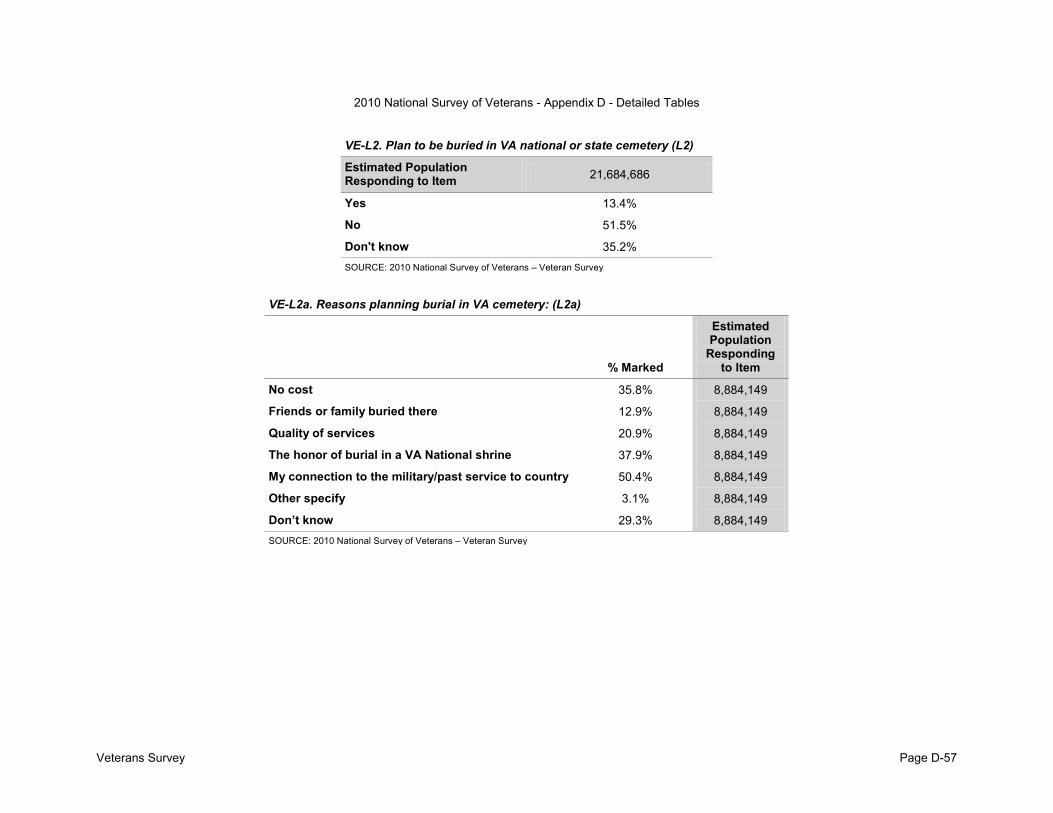
VE-L2. Plan to be buried in VA national or state cemetery (L2)
Estimated Population Responding to Item 21,684,686
Yes 13.4%
No 51.5%
Don't know 35.2% SOURCE: 2010 National Survey of Veterans – Veteran Survey
VE-L2a. Reasons planning burial in VA cemetery: (L2a)
% Marked
Estimated Population
Responding to Item
No cost 35.8% 8,884,149
Friends or family buried there 12.9% 8,884,149
Quality of services 20.9% 8,884,149
The honor of burial in a VA National shrine 37.9% 8,884,149
My connection to the military/past service to country 50.4% 8,884,149
Other specify 3.1% 8,884,149
Don’t know 29.3% 8,884,149 SOURCE: 2010 National Survey of Veterans – Veteran Survey

2010 National Survey of Veterans - Appendix D - Detailed Tables
Veterans Survey Page D-58
VE-L3. Reasons not planning for burial in VA cemetery: (L3)
% Marked
Estimated Population
Responding to Item
Don’t know eligibility criteria 29.1% 10,618,881
Quality of services 0.9% 10,618,881
Don’t know how to make arrangements with VA 14.4% 10,618,881
Made other arrangements 43.5% 10,618,881
VA services don’t accommodate religious preferences 0.9% 10,618,881
Veterans cemetery too far away (distance) 11.0% 10,618,881
Travel time to Veterans cemetery too long 6.3% 10,618,881
Appearance of cemetery doesn’t meet my expectations 0.2% 10,618,881
Want location close to other family members 35.9% 10,618,881
Want services that are not available at Veterans cemetery 1.8% 10,618,881
Too difficult to make arrangements with VA 2.2% 10,618,881
Unable to make advance arrangements with VA 1.4% 10,618,881
Other specify 7.7% 10,618,881
Don’t know 9.6% 10,618,881 SOURCE: 2010 National Survey of Veterans – Veteran Survey

2010 National Survey of Veterans - Appendix D - Detailed Tables
Veterans Survey Page D-59
VE-L4. If burial in private cemetery, plan for headstone/marker from VA (L4)
Estimated Population Responding to Item 10,397,540
Yes 27.5%
No 36.6%
Don't know 35.9% SOURCE: 2010 National Survey of Veterans – Veteran Survey
VE-L4a. Reasons not planning on headstone/marker from VA: (L4a)
% Marked
Estimated Population
Responding to Item
Don’t know about headstones and markers for Veterans 29.7% 3,548,964
Made other arrangements 52.7% 3,548,964
Wants headstone similar to other family members 17.6% 3,548,964
Don’t like VA headstones and markers 1.4% 3,548,964
Other specify 11.0% 3,548,964
Don’t know 5.0% 3,548,964 SOURCE: 2010 National Survey of Veterans – Veteran Survey

2010 National Survey of Veterans - Appendix D - Detailed Tables
Veterans Survey Page D-60
VE-L5. Burial option preference (L5)
Estimated Population Responding to Item 20,040,106
Casket burial, in-ground 50.2%
Casket burial, in a mausoleum 3.1%
Cremation, ashes buried in-ground 12.2%
Cremation, ashes placed in a columbarium 4.8%
Cremation, ashes scattered 19.9%
Cremation, ashes kept by my family 7.2%
Something not listed 2.5% SOURCE: 2010 National Survey of Veterans – Veteran Survey
VE-L5a. Which of the following burial options are acceptable: (L5a)
% Marked
Estimated Population
Responding to Item
Casket burial, in-ground 43.7% 20,802,081
Casket burial, in a mausoleum 24.0% 20,802,081
Cremation, ashes buried in-ground 28.9% 20,802,081
Cremation, ashes places in a columbarium 16.2% 20,802,081
Cremation, ashes scattered 30.2% 20,802,081
Cremation, ashes kept by my family 22.6% 20,802,081
Something not listed 4.1% 20,802,081 SOURCE: 2010 National Survey of Veterans – Veteran Survey

2010 National Survey of Veterans - Appendix D - Detailed Tables
Veterans Survey Page D-61
VE-M1. Use Internet, at least occasionally (M1)
Estimated Population Responding to Item 21,620,419
Yes 72.3%
No 27.7% SOURCE: 2010 National Survey of Veterans – Veteran Survey
VE-M2. How often access Internet/world wide web (M2)
Estimated Population Responding to Item 14,621,154
At least once a day 68.4%
At least once a week but not every day 23.5%
At least once a month but less than once a week 5.3%
At least once a year but less than once a month 2.2%
Less than once a year 0.6% SOURCE: 2010 National Survey of Veterans – Veteran Survey

2010 National Survey of Veterans - Appendix D - Detailed Tables
Veterans Survey Page D-62
VE-M3. Where go online to use Internet: (M3)
% Marked
Estimated Population
Responding to Item
Home 93.4% 14,761,007
Work 35.5% 14,761,007
School 3.5% 14,761,007
Public library 8.5% 14,761,007
Community center 1.1% 14,761,007
Someone else’s house 7.2% 14,761,007
Some other place 5.5% 14,761,007 SOURCE: 2010 National Survey of Veterans – Veteran Survey
VE-M4. Send/receive emails even occasionally (M4)
Estimated Population Responding to Item 20,938,114
Yes 70.6%
No 29.4% SOURCE: 2010 National Survey of Veterans – Veteran Survey

2010 National Survey of Veterans - Appendix D - Detailed Tables
Veterans Survey Page D-63
VE-M4a. Where go online to send/receive emails (M4a)
% Marked
Estimated Population
Responding to Item
Home 93.7% 14,986,526
Work 36.5% 14,986,526
School 3.5% 14,986,526
Public Library 6.1% 14,986,526
Community Center 0.9% 14,986,526
Someone else’s house 6.1% 14,986,526
Some other place 5.7% 14,986,526 SOURCE: 2010 National Survey of Veterans – Veteran Survey
VE-M5. Willingness to use Internet for the following activities: (M5)
Very
willing Somewhat
willing
Neither willing
nor unwilling
Somewhat unwilling
Very unwilling
Estimated Population
Responding to Item
Obtaining news and information 51.5% 22.6% 9.3% 3.8% 12.8% 20,164,183
Carrying out research on services 51.9% 21.7% 9.7% 4.0% 12.7% 19,858,647
Purchasing goods or services 36.9% 25.8% 12.2% 7.7% 17.4% 19,825,914
Responding to polls or surveys 23.4% 21.0% 18.8% 11.8% 24.9% 19,750,192
Obtain information about VA benefits 41.8% 27.0% 13.7% 4.5% 13.0% 19,970,774
Apply for VA benefits 40.7% 24.9% 15.0% 4.6% 14.8% 19,849,769 SOURCE: 2010 National Survey of Veterans – Veteran Survey

2010 National Survey of Veterans - Appendix D - Detailed Tables
Veterans Survey Page D-64
VE-M6. Ever used the MyHealtheVet website to obtain information regarding personal health care (M6)
Estimated Population Responding to Item 21,347,062
Yes 3.2%
No 96.8% SOURCE: 2010 National Survey of Veterans – Veteran Survey
VE-M7. Want to receive VA information via Internet or World Wide Web ((M7)
Estimated Population Responding to Item 20,968,912
Yes 59.2%
No 40.8% SOURCE: 2010 National Survey of Veterans – Veteran Survey

2010 National Survey of Veterans - Appendix D - Detailed Tables
Veterans Survey Page D-65
VE-N1. Sources of family income in last 12 months (N1)
Yes No Don't know
Estimated Population
Responding to Item
Wages, salary, commissions, bonuses, or tips from all jobs 65.1% 33.0% 1.9% 19,564,953
Self-employment income from own nonfarm businesses or farm businesses, including proprietorships and partnerships 17.4% 80.5% 2.1% 17,802,173
Interest, dividends, net rental income, royalty income, or income from estates and trusts 45.6% 51.7% 2.7% 18,839,600
Social Security or Railroad Retirement 48.5% 50.2% 1.3% 19,567,467
Supplemental Security Income (SSI) 7.1% 89.9% 3.0% 17,147,172
Any public assistance or welfare payments from the state or local welfare office 3.8% 94.1% 2.1% 17,170,087
Retirement, survivor, or disability pensions 40.0% 58.1% 1.8% 18,726,084
Veterans’ (VA) service-connected disability compensation payments 16.7% 81.7% 1.6% 17,552,587
All other VA payments (eg, VA education payments) 4.6% 93.2% 2.2% 17,117,834
Any other sources of income received regularly such as unemployment compensation, child support or alimony 10.4% 87.7% 1.9% 17,307,500
SOURCE: 2010 National Survey of Veterans – Veteran Survey

2010 National Survey of Veterans - Appendix D - Detailed Tables
Veterans Survey Page D-66
VE-N2. Total family income range past 12 months (N2)
Estimated Population Responding to Item 20,642,434
Less than $5,000 2.3%
$5,000 to $7,499 1.3%
$7,500 to $9,999 1.6%
$10,000 to $12,499 2.7%
$12,500 to $14,999 2.9%
$15,000 to $19,999 4.6%
$20,000 to $24,999 7.0%
$25,000 to $29,999 5.8%
$30,000 to $34,999 7.0%
$35,000 to $39,999 6.1%
$40,000 to $49,999 10.3%
$50,000 to $59,999 9.5%
$60,000 to $74,999 11.6%
$75,000 to $99,999 11.3%
$100,000 to $149,999 10.3%
$150,000 or more 5.7% SOURCE: 2010 National Survey of Veterans – Veteran Survey

2010 National Survey of Veterans - Appendix D - Detailed Tables
Veterans Survey Page D-67
VE-O1. Gender (O1)
Estimated Population Responding to Item 19,606,351
Male 91.9%
Female 8.1% SOURCE: 2010 National Survey of Veterans – Veteran Survey
VE-O2. Age (O2)
Estimated Population Responding to Item 21,636,831
Younger than 25 0.9%
25 to 29 3.8%
30 to 34 2.6%
35 to 39 3.4%
40 to 44 6.2%
45 to 49 9.2%
50 to 54 10.1%
55 to 59 7.8%
60 to 64 15.2%
65 to 69 11.2%
70 to 74 9.1%
75 to 79 9.5%
80 to 84 6.2%
85 years or older 4.9% SOURCE: 2010 National Survey of Veterans – Veteran Survey

2010 National Survey of Veterans - Appendix D - Detailed Tables
Veterans Survey Page D-68
VE-O3. Number minor children (O3)
Estimated Population Responding to Item 18,299,242
No minor children 76.2%
1 Minor child 23.8%
2 Minor children 0.0% SOURCE: 2010 National Survey of Veterans – Veteran Survey
VE-O3. Number dependent older children (O3)
Estimated Population Responding to Item 17,590,833
No dependent older children 84.7%
1 Dependent older child 15.3%
2 Dependent older children 0.0% SOURCE: 2010 National Survey of Veterans – Veteran Survey

2010 National Survey of Veterans - Appendix D - Detailed Tables
Veterans Survey Page D-69
VE-O4. Highest degree/school level you completed (O4)
Estimated Population Responding to Item 21,720,153
Less than high school 5.4%
High school diploma / GED 26.0%
Some college credit, but less than 1 year of college credit 12.2%
1 or more years of college credit, no degree 17.8%
Associate's degree (for example, AA, AS) 9.1%
Bachelor's degree (for example, BA, BS) 17.8%
Master's degree (for example, MA, MS, MEng, MEd, MSW, MBA) 7.7%
Professional degree beyond a bachelor's degree (for example, MD, DDS, DVM, LLB, JD) 2.7%
Doctorate degree (for example, PhD, EdD) 1.2% SOURCE: 2010 National Survey of Veterans – Veteran Survey
VE-O5. Hispanic/Latino/Spanish origin (O5)
Estimated Population Responding to Item 20,375,182
No, not of Hispanic, Latino, or Spanish origin 94.9%
Yes, Cuban 0.2%
Yes, Mexican, Mexican American, Chicano 3.0%
Yes, Puerto Rican 0.7%
Yes, another Hispanic, Latino, or Spanish origin For example: Argentinean, Colombian, Dominican, Nicaraguan, Salvadoran, Spaniard, and so on. 1.2%
SOURCE: 2010 National Survey of Veterans – Veteran Survey

2010 National Survey of Veterans - Appendix D - Detailed Tables
Veterans Survey Page D-70
VE-O6. Race (O6)
% Marked
Estimated Population
Responding to Item
White 86.8% 21,360,181
Black or African American 11.5% 21,360,181
American Indian or Alaska Native 2.5% 21,360,181
Asian Indian 0.1% 21,360,181
Chinese 0.2% 21,360,181
Filipino 0.5% 21,360,181
Other Asian (for example, Hmong, Laotian, Thai, Pakistani, Cambodian, and so on) 0.6% 21,360,181
Native Hawaiian 0.1% 21,360,181
Guamanian or Chamorro 0.0% 21,360,181
Samoan 0.0% 21,360,181
Other Pacific Islander (for example, Fijian, Tongan, and so on) 0.1% 21,360,181 SOURCE: 2010 National Survey of Veterans – Veteran Survey
VE-O7. Current marital status (O7)
Estimated Population Responding to Item 21,730,982
Now Married 69.7%
Widowed 6.4%
Divorced 13.3%
Separated 1.7%
Never Married 8.1%
Civil Commitment or Union 0.8% SOURCE: 2010 National Survey of Veterans – Veteran Survey
2010 National Survey of Veterans - Appendix D - Detailed Tables
Veterans Survey Page D-71
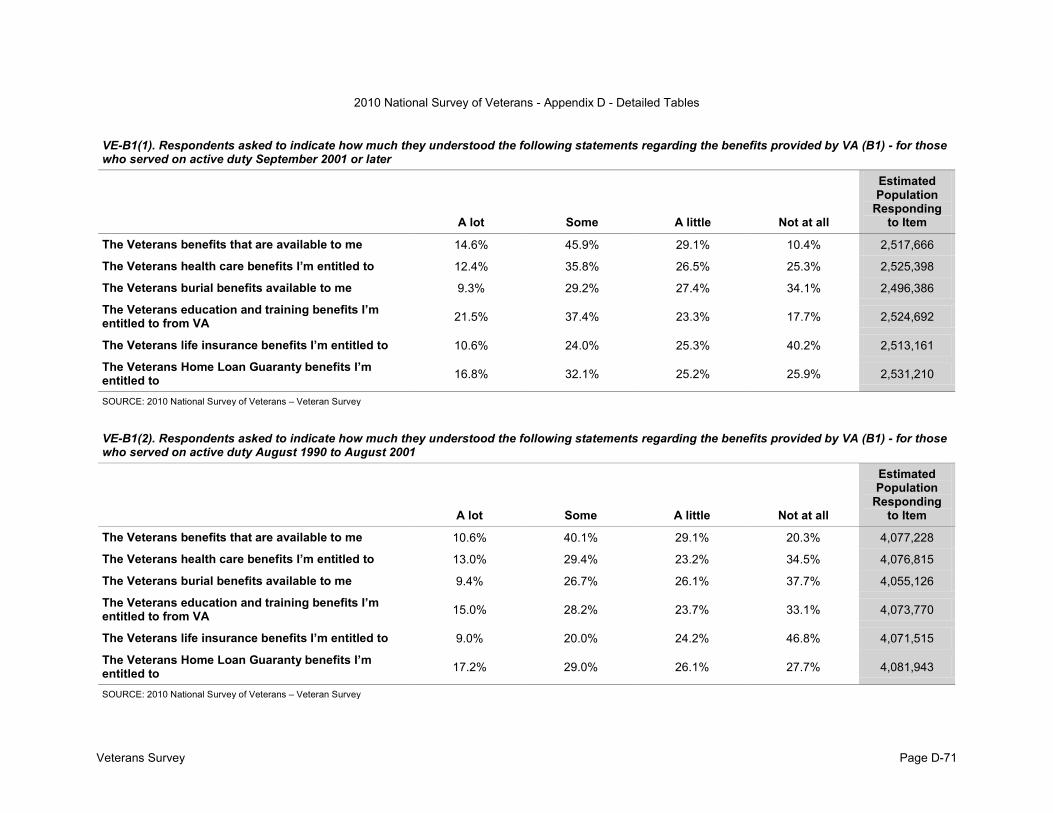
VE-B1(1). Respondents asked to indicate how much they understood the following statements regarding the benefits provided by VA (B1) - for those who served on active duty September 2001 or later
A lot Some A little Not at all
Estimated Population
Responding to Item
The Veterans benefits that are available to me 14.6% 45.9% 29.1% 10.4% 2,517,666
The Veterans health care benefits I’m entitled to 12.4% 35.8% 26.5% 25.3% 2,525,398
The Veterans burial benefits available to me 9.3% 29.2% 27.4% 34.1% 2,496,386
The Veterans education and training benefits I’m entitled to from VA 21.5% 37.4% 23.3% 17.7% 2,524,692
The Veterans life insurance benefits I’m entitled to 10.6% 24.0% 25.3% 40.2% 2,513,161
The Veterans Home Loan Guaranty benefits I’m entitled to 16.8% 32.1% 25.2% 25.9% 2,531,210
SOURCE: 2010 National Survey of Veterans – Veteran Survey
VE-B1(2). Respondents asked to indicate how much they understood the following statements regarding the benefits provided by VA (B1) - for those who served on active duty August 1990 to August 2001
A lot Some A little Not at all
Estimated Population
Responding to Item
The Veterans benefits that are available to me 10.6% 40.1% 29.1% 20.3% 4,077,228
The Veterans health care benefits I’m entitled to 13.0% 29.4% 23.2% 34.5% 4,076,815
The Veterans burial benefits available to me 9.4% 26.7% 26.1% 37.7% 4,055,126
The Veterans education and training benefits I’m entitled to from VA 15.0% 28.2% 23.7% 33.1% 4,073,770
The Veterans life insurance benefits I’m entitled to 9.0% 20.0% 24.2% 46.8% 4,071,515
The Veterans Home Loan Guaranty benefits I’m entitled to 17.2% 29.0% 26.1% 27.7% 4,081,943
SOURCE: 2010 National Survey of Veterans – Veteran Survey

2010 National Survey of Veterans - Appendix D - Detailed Tables
Veterans Survey Page D-72
VE-B1(3). Respondents asked to indicate how much they understood the following statements regarding the benefits provided by VA (B1) - for those who served on active duty May 1975 to July 1990
A lot Some A little Not at all
Estimated Population
Responding to Item
The Veterans benefits that are available to me 8.4% 32.7% 33.2% 25.8% 5,902,361
The Veterans health care benefits I’m entitled to 10.8% 25.0% 23.5% 40.7% 5,912,875
The Veterans burial benefits available to me 8.2% 22.3% 27.5% 41.9% 5,855,607
The Veterans education and training benefits I’m entitled to from VA 9.5% 22.9% 25.0% 42.6% 5,898,512
The Veterans life insurance benefits I’m entitled to 6.2% 16.1% 19.2% 58.6% 5,889,178
The Veterans Home Loan Guaranty benefits I’m entitled to 13.5% 28.0% 26.4% 32.1% 5,903,333
SOURCE: 2010 National Survey of Veterans – Veteran Survey
VE-B1(4). Respondents asked to indicate how much they understood the following statements regarding the benefits provided by VA (B1) - for those who served on active duty during the Vietnam era (August 1964 to April 1975)
A lot Some A little Not at all
Estimated Population
Responding to Item
The Veterans benefits that are available to me 9.1% 35.0% 32.0% 23.9% 7,243,439
The Veterans health care benefits I’m entitled to 10.6% 26.7% 24.8% 37.8% 7,225,005
The Veterans burial benefits available to me 8.6% 22.9% 27.2% 41.3% 7,155,366
The Veterans education and training benefits I’m entitled to from VA 13.1% 29.5% 26.2% 31.2% 7,217,551
The Veterans life insurance benefits I’m entitled to 4.2% 13.6% 18.7% 63.5% 7,205,421
The Veterans Home Loan Guaranty benefits I’m entitled to 12.6% 26.8% 24.8% 35.9% 7,228,283
SOURCE: 2010 National Survey of Veterans – Veteran Survey

2010 National Survey of Veterans - Appendix D - Detailed Tables
Veterans Survey Page D-73
VE-B1(5). Respondents asked to indicate how much they understood the following statements regarding the benefits provided by VA (B1) - for those who served on active duty February 1955 to July 1964
A lot Some A little Not at all
Estimated Population
Responding to Item
The Veterans benefits that are available to me 6.6% 28.0% 29.0% 36.5% 3,749,170
The Veterans health care benefits I’m entitled to 9.1% 22.7% 21.5% 46.8% 3,765,885
The Veterans burial benefits available to me 6.9% 20.8% 19.6% 52.7% 3,728,419
The Veterans education and training benefits I’m entitled to from VA 8.9% 22.8% 19.4% 48.9% 3,749,272
The Veterans life insurance benefits I’m entitled to 3.5% 9.8% 11.1% 75.6% 3,743,044
The Veterans Home Loan Guaranty benefits I’m entitled to 9.0% 19.5% 18.8% 52.7% 3,759,159
SOURCE: 2010 National Survey of Veterans – Veteran Survey
VE-B1(6). Respondents asked to indicate how much they understood the following statements regarding the benefits provided by VA (B1) - for those who served on active duty during the Korean War (July 1950 to January 1955)
A lot Some A little Not at all
Estimated Population
Responding to Item
The Veterans benefits that are available to me 9.8% 34.7% 29.8% 25.6% 2,313,886
The Veterans health care benefits I’m entitled to 11.2% 25.3% 24.4% 39.1% 2,322,076
The Veterans burial benefits available to me 10.5% 24.3% 24.4% 40.8% 2,289,103
The Veterans education and training benefits I’m entitled to from VA 14.3% 26.6% 20.2% 38.9% 2,323,550
The Veterans life insurance benefits I’m entitled to 10.6% 16.0% 16.0% 57.3% 2,320,884
The Veterans Home Loan Guaranty benefits I’m entitled to 10.1% 23.9% 19.8% 46.2% 2,326,156
SOURCE: 2010 National Survey of Veterans – Veteran Survey

2010 National Survey of Veterans - Appendix D - Detailed Tables
Veterans Survey Page D-74
VE-B1(7). Respondents asked to indicate how much they understood the following statements regarding the benefits provided by VA (B1) - for those who served on active duty January 1947 to June 1950
A lot Some A little Not at all
Estimated Population
Responding to Item
The Veterans benefits that are available to me 8.7% 33.5% 20.2% 37.6% 334,171
The Veterans health care benefits I’m entitled to 11.8% 27.6% 13.4% 47.1% 339,942
The Veterans burial benefits available to me 11.3% 28.2% 20.4% 40.1% 336,108
The Veterans education and training benefits I’m entitled to from VA 15.4% 24.6% 17.2% 42.8% 334,385
The Veterans life insurance benefits I’m entitled to 14.1% 21.3% 12.8% 51.9% 339,518
The Veterans Home Loan Guaranty benefits I’m entitled to 12.6% 20.0% 19.5% 47.9% 330,141
SOURCE: 2010 National Survey of Veterans – Veteran Survey
VE-B1(8). Respondents asked to indicate how much they understood the following statements regarding the benefits provided by VA (B1) - for those who served on active duty during World War II (December 1941 to December 1946)
A lot Some A little Not at all
Estimated Population
Responding to Item
The Veterans benefits that are available to me 11.1% 33.5% 25.8% 29.7% 1,766,733
The Veterans health care benefits I’m entitled to 11.4% 26.7% 23.0% 38.9% 1,756,982
The Veterans burial benefits available to me 11.8% 23.4% 23.1% 41.6% 1,751,631
The Veterans education and training benefits I’m entitled to from VA 17.1% 25.1% 17.2% 40.6% 1,717,656
The Veterans life insurance benefits I’m entitled to 15.4% 18.1% 13.8% 52.6% 1,744,368
The Veterans Home Loan Guaranty benefits I’m entitled to 11.2% 17.9% 15.0% 55.9% 1,729,022
SOURCE: 2010 National Survey of Veterans – Veteran Survey

2010 National Survey of Veterans - Appendix D - Detailed Tables
Veterans Survey Page D-75
VE-B1(9). Respondents asked to indicate how much they understood the following statements regarding the benefits provided by VA (B1) - for those who served on active duty November 1941 or earlier
A lot Some A little Not at all
Estimated Population
Responding to Item
The Veterans benefits that are available to me 21.7% 33.8% 24.5% 20.1% 77,909
The Veterans health care benefits I’m entitled to 20.7% 35.7% 11.8% 31.8% 81,579
The Veterans burial benefits available to me * * * * *
The Veterans education and training benefits I’m entitled to from VA * * * * *
The Veterans life insurance benefits I’m entitled to * * * * *
The Veterans Home Loan Guaranty benefits I’m entitled to * * * * *
SOURCE: 2010 National Survey of Veterans – Veteran Survey * Data were suppressed because fewer than 30 respondents answered this survey item.
VE-B1(10). Respondents asked to indicate how much they understood the following statements regarding the benefits provided by VA (B1) - for Males
A lot Some A little Not at all
Estimated Population
Responding to Item
The Veterans benefits that are available to me 8.0% 32.4% 31.6% 27.9% 17,692,054
The Veterans health care benefits I’m entitled to 9.1% 24.5% 25.0% 41.4% 17,688,654
The Veterans burial benefits available to me 7.5% 21.1% 25.5% 45.9% 17,472,698
The Veterans education and training benefits I’m entitled to from VA 11.2% 26.0% 23.2% 39.6% 17,592,120
The Veterans life insurance benefits I’m entitled to 6.1% 13.6% 17.1% 63.2% 17,611,403
The Veterans Home Loan Guaranty benefits I’m entitled to 10.8% 23.5% 23.1% 42.5% 17,630,626 SOURCE: 2010 National Survey of Veterans – Veteran Survey

2010 National Survey of Veterans - Appendix D - Detailed Tables
Veterans Survey Page D-76
VE-B1(11). Respondents asked to indicate how much they understood the following statements regarding the benefits provided by VA (B1) - for Females
A lot Some A little Not at all
Estimated Population
Responding to Item
The Veterans benefits that are available to me 10.7% 30.8% 29.2% 29.3% 1,566,686
The Veterans health care benefits I’m entitled to 13.8% 22.3% 18.7% 45.2% 1,561,818
The Veterans burial benefits available to me 7.9% 22.8% 22.1% 47.2% 1,551,390
The Veterans education and training benefits I’m entitled to from VA 16.5% 20.8% 17.7% 45.1% 1,565,377
The Veterans life insurance benefits I’m entitled to 6.6% 16.7% 18.7% 58.1% 1,564,768
The Veterans Home Loan Guaranty benefits I’m entitled to 12.6% 26.1% 26.5% 34.8% 1,566,548 SOURCE: 2010 National Survey of Veterans – Veteran Survey
VE-B1(12). Respondents asked to indicate how much they understood the following statements regarding the benefits provided by VA (B1) - for responders under age 31
A lot Some A little Not at all
Estimated Population
Responding to Item
The Veterans benefits that are available to me 12.8% 38.6% 33.3% 15.3% 1,142,132
The Veterans health care benefits I’m entitled to 9.2% 24.0% 32.5% 34.4% 1,142,132
The Veterans burial benefits available to me 4.3% 18.9% 28.3% 48.5% 1,135,233
The Veterans education and training benefits I’m entitled to from VA 20.2% 36.0% 21.9% 21.8% 1,142,132
The Veterans life insurance benefits I’m entitled to 6.0% 17.6% 21.5% 55.0% 1,142,132
The Veterans Home Loan Guaranty benefits I’m entitled to 8.4% 27.0% 27.7% 36.8% 1,142,132
SOURCE: 2010 National Survey of Veterans – Veteran Survey

2010 National Survey of Veterans - Appendix D - Detailed Tables
Veterans Survey Page D-77
VE-B1(13). Respondents asked to indicate how much they understood the following statements regarding the benefits provided by VA (B1) - for responders age 31 and older
A lot Some A little Not at all
Estimated Population
Responding to Item
The Veterans benefits that are available to me 8.2% 32.2% 31.0% 28.6% 20,139,853
The Veterans health care benefits I’m entitled to 9.7% 24.3% 24.0% 42.0% 20,153,304
The Veterans burial benefits available to me 8.0% 21.2% 25.5% 45.3% 19,943,183
The Veterans education and training benefits I’m entitled to from VA 11.8% 24.8% 23.0% 40.5% 20,055,999
The Veterans life insurance benefits I’m entitled to 6.2% 13.5% 17.4% 62.8% 20,059,204
The Veterans Home Loan Guaranty benefits I’m entitled to 11.5% 23.9% 23.1% 41.6% 20,097,167
SOURCE: 2010 National Survey of Veterans – Veteran Survey
VE-B1(14). Respondents asked to indicate how much they understood the following statements regarding the benefits provided by VA (B1) - for non-Hispanics
A lot Some A little Not at all
Estimated Population
Responding to Item
The Veterans benefits that are available to me 8.2% 32.5% 31.5% 27.8% 19,093,753
The Veterans health care benefits I’m entitled to 9.5% 23.9% 24.7% 41.9% 19,104,562
The Veterans burial benefits available to me 7.3% 21.0% 25.7% 46.0% 18,895,904
The Veterans education and training benefits I’m entitled to from VA 12.3% 25.1% 23.1% 39.5% 19,035,639
The Veterans life insurance benefits I’m entitled to 6.4% 13.3% 17.5% 62.8% 19,010,073
The Veterans Home Loan Guaranty benefits I’m entitled to 11.3% 23.8% 23.4% 41.5% 19,062,430
SOURCE: 2010 National Survey of Veterans – Veteran Survey

2010 National Survey of Veterans - Appendix D - Detailed Tables
Veterans Survey Page D-78
VE-B1(15). Respondents asked to indicate how much they understood the following statements regarding the benefits provided by VA (B1) - for Hispanics
A lot Some A little Not at all
Estimated Population
Responding to Item
The Veterans benefits that are available to me 9.8% 37.2% 31.2% 21.8% 1,014,155
The Veterans health care benefits I’m entitled to 10.5% 28.9% 23.1% 37.5% 1,006,629
The Veterans burial benefits available to me 7.9% 26.4% 30.3% 35.4% 1,001,319
The Veterans education and training benefits I’m entitled to from VA 14.4% 31.3% 23.3% 31.0% 1,000,949
The Veterans life insurance benefits I’m entitled to 5.1% 17.5% 24.7% 52.7% 1,010,683
The Veterans Home Loan Guaranty benefits I’m entitled to 13.9% 26.7% 31.1% 28.2% 1,012,903 SOURCE: 2010 National Survey of Veterans – Veteran Survey
VE-B1(16). Respondents asked to indicate how much they understood the following statements regarding the benefits provided by VA (B1) - for respondents who are White
A lot Some A little Not at all
Estimated Population
Responding to Item
The Veterans benefits that are available to me 8.2% 32.1% 30.7% 28.9% 17,806,844
The Veterans health care benefits I’m entitled to 9.3% 23.5% 24.6% 42.6% 17,787,598
The Veterans burial benefits available to me 7.7% 20.9% 25.0% 46.4% 17,627,721
The Veterans education and training benefits I’m entitled to from VA 12.6% 24.7% 22.3% 40.4% 17,712,557
The Veterans life insurance benefits I’m entitled to 6.2% 13.2% 17.4% 63.2% 17,703,139
The Veterans Home Loan Guaranty benefits I’m entitled to 11.4% 23.5% 22.6% 42.5% 17,727,799
SOURCE: 2010 National Survey of Veterans – Veteran Survey
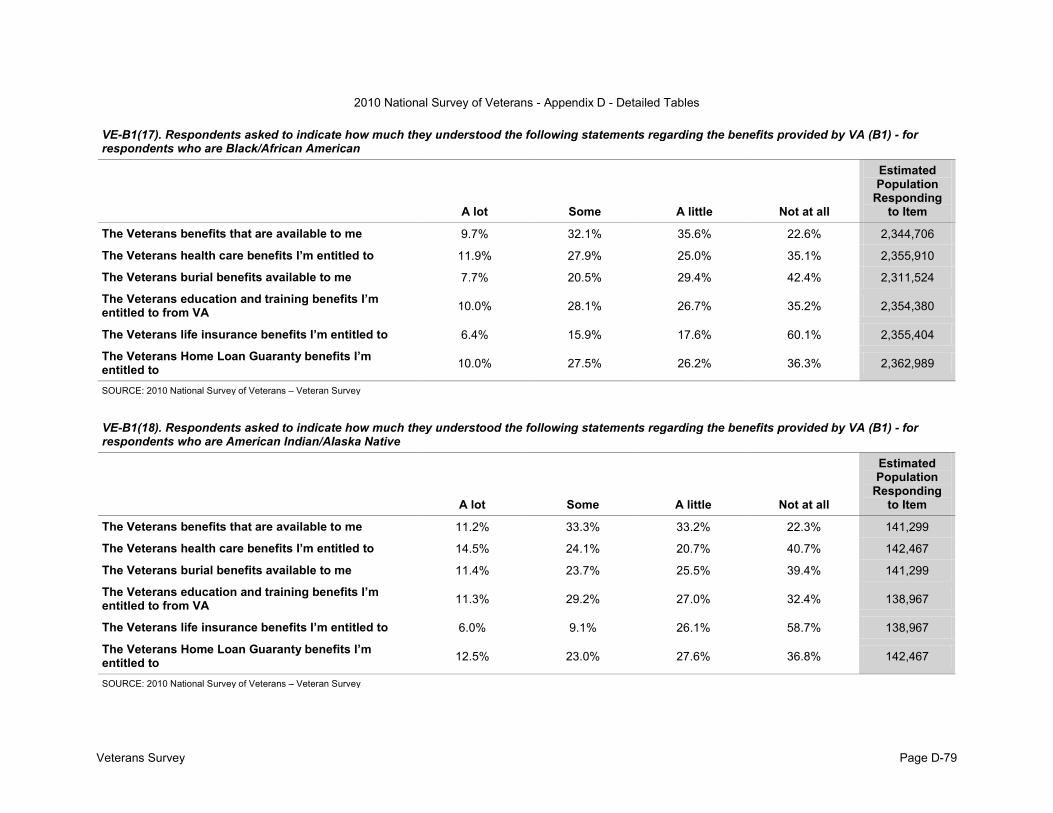
2010 National Survey of Veterans - Appendix D - Detailed Tables
Veterans Survey Page D-79
VE-B1(17). Respondents asked to indicate how much they understood the following statements regarding the benefits provided by VA (B1) - for respondents who are Black/African American
A lot Some A little Not at all
Estimated Population
Responding to Item
The Veterans benefits that are available to me 9.7% 32.1% 35.6% 22.6% 2,344,706
The Veterans health care benefits I’m entitled to 11.9% 27.9% 25.0% 35.1% 2,355,910
The Veterans burial benefits available to me 7.7% 20.5% 29.4% 42.4% 2,311,524
The Veterans education and training benefits I’m entitled to from VA 10.0% 28.1% 26.7% 35.2% 2,354,380
The Veterans life insurance benefits I’m entitled to 6.4% 15.9% 17.6% 60.1% 2,355,404
The Veterans Home Loan Guaranty benefits I’m entitled to 10.0% 27.5% 26.2% 36.3% 2,362,989
SOURCE: 2010 National Survey of Veterans – Veteran Survey
VE-B1(18). Respondents asked to indicate how much they understood the following statements regarding the benefits provided by VA (B1) - for respondents who are American Indian/Alaska Native
A lot Some A little Not at all
Estimated Population
Responding to Item
The Veterans benefits that are available to me 11.2% 33.3% 33.2% 22.3% 141,299
The Veterans health care benefits I’m entitled to 14.5% 24.1% 20.7% 40.7% 142,467
The Veterans burial benefits available to me 11.4% 23.7% 25.5% 39.4% 141,299
The Veterans education and training benefits I’m entitled to from VA 11.3% 29.2% 27.0% 32.4% 138,967
The Veterans life insurance benefits I’m entitled to 6.0% 9.1% 26.1% 58.7% 138,967
The Veterans Home Loan Guaranty benefits I’m entitled to 12.5% 23.0% 27.6% 36.8% 142,467
SOURCE: 2010 National Survey of Veterans – Veteran Survey

2010 National Survey of Veterans - Appendix D - Detailed Tables
Veterans Survey Page D-80
VE-B1(19). Respondents asked to indicate how much they understood the following statements regarding the benefits provided by VA (B1) - for respondents who are Asian
A lot Some A little Not at all
Estimated Population
Responding to Item
The Veterans benefits that are available to me 3.0% 42.1% 28.9% 26.0% 211,259
The Veterans health care benefits I’m entitled to 5.3% 23.7% 36.7% 34.3% 211,259
The Veterans burial benefits available to me 3.7% 26.8% 32.0% 37.4% 211,259
The Veterans education and training benefits I’m entitled to from VA 11.7% 36.0% 23.0% 29.3% 211,259
The Veterans life insurance benefits I’m entitled to 6.6% 13.5% 26.0% 53.9% 211,259
The Veterans Home Loan Guaranty benefits I’m entitled to 9.0% 24.2% 28.9% 37.9% 211,259
SOURCE: 2010 National Survey of Veterans – Veteran Survey
VE-B1(20). Respondents asked to indicate how much they understood the following statements regarding the benefits provided by VA (B1) - for respondents who are Hawaiian/Pacific Islander
A lot Some A little Not at all
Estimated Population
Responding to Item
The Veterans benefits that are available to me * * * * .
The Veterans health care benefits I’m entitled to * * * * *
The Veterans burial benefits available to me * * * * *
The Veterans education and training benefits I’m entitled to from VA * * * * *
The Veterans life insurance benefits I’m entitled to * * * * *
The Veterans Home Loan Guaranty benefits I’m entitled to * * * * *
SOURCE: 2010 National Survey of Veterans – Veteran Survey * Data were suppressed because fewer than 30 respondents answered this survey item.

2010 National Survey of Veterans - Appendix D - Detailed Tables
Veterans Survey Page D-81
VE-B1(21). Respondents asked to indicate how much they understood the following statements regarding the benefits provided by VA (B1) - for respondents who are multiracial
A lot Some A little Not at all
Estimated Population
Responding to Item
The Veterans benefits that are available to me 7.3% 36.0% 29.4% 27.3% 475,529
The Veterans health care benefits I’m entitled to 9.5% 27.4% 21.5% 41.6% 475,529
The Veterans burial benefits available to me 5.1% 21.5% 23.6% 49.8% 465,746
The Veterans education and training benefits I’m entitled to from VA 9.1% 23.7% 21.0% 46.2% 475,529
The Veterans life insurance benefits I’m entitled to 4.6% 14.2% 20.0% 61.2% 469,684
The Veterans Home Loan Guaranty benefits I’m entitled to 9.3% 27.0% 24.9% 38.8% 475,529
SOURCE: 2010 National Survey of Veterans – Veteran Survey
VE-F6a(1). Respondents asked whether they know what is available to them through their VA health coverage (F6a) - for those who served on active duty September 2001 or later
Estimated Population Responding to Item 2,504,504
Strongly agree 3.6%
Agree 18.3%
Neither agree nor disagree 18.5%
Disagree 35.5%
Strongly disagree 24.1% SOURCE: 2010 National Survey of Veterans – Veteran Survey

2010 National Survey of Veterans - Appendix D - Detailed Tables
Veterans Survey Page D-82
VE-F6a(2). Respondents asked whether they know what is available to them through their VA health coverage (F6a) - for those who served on active duty August 1990 to August 2001
Estimated Population Responding to Item 4,015,550
Strongly agree 3.3%
Agree 15.7%
Neither agree nor disagree 15.4%
Disagree 32.0%
Strongly disagree 33.5% SOURCE: 2010 National Survey of Veterans – Veteran Survey
VE-F6a(3). Respondents asked whether they know what is available to them through their VA health coverage (F6a) - for those who served on active duty May 1975 to July 1990
Estimated Population Responding to Item 5,746,646
Strongly agree 4.0%
Agree 12.0%
Neither agree nor disagree 14.2%
Disagree 31.2%
Strongly disagree 38.6% SOURCE: 2010 National Survey of Veterans – Veteran Survey

2010 National Survey of Veterans - Appendix D - Detailed Tables
Veterans Survey Page D-83
VE-F6a(4). Respondents asked whether they know what is available to them through their VA health coverage (F6a) - for those who served on active duty during the Vietnam era (August 1964 to April 1975)
Estimated Population Responding to Item 6,990,811
Strongly agree 5.0%
Agree 14.3%
Neither agree nor disagree 16.5%
Disagree 30.1%
Strongly disagree 34.2% SOURCE: 2010 National Survey of Veterans – Veteran Survey
VE-F6a(5). Respondents asked whether they know what is available to them through their VA health coverage (F6a) - for those who served on active duty February 1955 to July 1964
Estimated Population Responding to Item 3,576,422
Strongly agree 4.3%
Agree 14.0%
Neither agree nor disagree 20.9%
Disagree 24.9%
Strongly disagree 35.9% SOURCE: 2010 National Survey of Veterans – Veteran Survey

2010 National Survey of Veterans - Appendix D - Detailed Tables
Veterans Survey Page D-84
VE-F6a(6). Respondents asked whether they know what is available to them through their VA health coverage (F6a) - for those who served on active duty during the Korean War (July 1950 to January 1955)
Estimated Population Responding to Item 2,157,374
Strongly agree 6.8%
Agree 17.1%
Neither agree nor disagree 24.8%
Disagree 25.1%
Strongly disagree 26.3% SOURCE: 2010 National Survey of Veterans – Veteran Survey
VE-F6a(7). Respondents asked whether they know what is available to them through their VA health coverage (F6a) - for those who served on active duty January 1947 to June 1950
Estimated Population Responding to Item 308,813
Strongly agree 10.4%
Agree 12.6%
Neither agree nor disagree 25.5%
Disagree 26.3%
Strongly disagree 25.2% SOURCE: 2010 National Survey of Veterans – Veteran Survey

2010 National Survey of Veterans - Appendix D - Detailed Tables
Veterans Survey Page D-85
VE-F6a(8). Respondents asked whether they know what is available to them through their VA health coverage (F6a) - for those who served on active duty during World War II (December 1941 to December 1946)
Estimated Population Responding to Item 1,568,241
Strongly agree 7.9%
Agree 17.2%
Neither agree nor disagree 26.4%
Disagree 23.6%
Strongly disagree 25.0% SOURCE: 2010 National Survey of Veterans – Veteran Survey
VE-F6a(9). Respondents asked whether they know what is available to them through their VA health coverage (F6a) - for those who served on active duty November 1941 or earlier
Estimated Population Responding to Item *
SOURCE: 2010 National Survey of Veterans – Veteran Survey * Data were suppressed because fewer than 30 respondents answered this survey item.

2010 National Survey of Veterans - Appendix D - Detailed Tables
Veterans Survey Page D-86
VE-F6a(10). Respondents asked whether they know what is available to them through their VA health coverage (F6a) - for Males
Estimated Population Responding to Item 16,922,226
Strongly agree 4.7%
Agree 13.9%
Neither agree nor disagree 18.4%
Disagree 28.3%
Strongly disagree 34.7% SOURCE: 2010 National Survey of Veterans – Veteran Survey
VE-F6a(11). Respondents asked whether they know what is available to them through their VA health coverage (F6a) - for Females
Estimated Population Responding to Item 1,490,282
Strongly agree 3.2%
Agree 12.5%
Neither agree nor disagree 15.9%
Disagree 25.7%
Strongly disagree 42.7% SOURCE: 2010 National Survey of Veterans – Veteran Survey

2010 National Survey of Veterans - Appendix D - Detailed Tables
Veterans Survey Page D-87
VE-F6a(12). Respondents asked whether they know what is available to them through their VA health coverage (F6a) - for responders under age 31
Estimated Population Responding to Item 1,146,391
Strongly agree 2.9%
Agree 13.1%
Neither agree nor disagree 19.3%
Disagree 32.8%
Strongly disagree 31.8% SOURCE: 2010 National Survey of Veterans – Veteran Survey
VE-F6a(13). Respondents asked whether they know what is available to them through their VA health coverage (F6a) - for responders age 31 and older
Estimated Population Responding to Item 19,303,664
Strongly agree 4.6%
Agree 13.9%
Neither agree nor disagree 17.8%
Disagree 28.5%
Strongly disagree 35.2% SOURCE: 2010 National Survey of Veterans – Veteran Survey

2010 National Survey of Veterans - Appendix D - Detailed Tables
Veterans Survey Page D-88
VE-F6a(14). Respondents asked whether they know what is available to them through their VA health coverage (F6a) - for non-Hispanics
Estimated Population Responding to Item 18,469,476
Strongly agree 4.1%
Agree 13.4%
Neither agree nor disagree 17.7%
Disagree 29.3%
Strongly disagree 35.5% SOURCE: 2010 National Survey of Veterans – Veteran Survey
VE-F6a(15). Respondents asked whether they know what is available to them through their VA health coverage (F6a) - for Hispanics
Estimated Population Responding to Item 980,666
Strongly agree 4.6%
Agree 15.8%
Neither agree nor disagree 19.4%
Disagree 21.4%
Strongly disagree 38.8% SOURCE: 2010 National Survey of Veterans – Veteran Survey

2010 National Survey of Veterans - Appendix D - Detailed Tables
Veterans Survey Page D-89
VE-F6a(16). Respondents asked whether they know what is available to them through their VA health coverage (F6a) - for respondents who are White
Estimated Population Responding to Item 17,128,550
Strongly agree 4.2%
Agree 13.3%
Neither agree nor disagree 18.0%
Disagree 29.7%
Strongly disagree 34.8% SOURCE: 2010 National Survey of Veterans – Veteran Survey
VE-F6a(17). Respondents asked whether they know what is available to them through their VA health coverage (F6a) - for respondents who are Black/African American
Estimated Population Responding to Item 2,236,565
Strongly agree 7.0%
Agree 15.8%
Neither agree nor disagree 17.2%
Disagree 23.0%
Strongly disagree 37.0% SOURCE: 2010 National Survey of Veterans – Veteran Survey

2010 National Survey of Veterans - Appendix D - Detailed Tables
Veterans Survey Page D-90
VE-F6a(18). Respondents asked whether they know what is available to them through their VA health coverage (F6a) - for respondents who are Asian
Estimated Population Responding to Item 142,467
Strongly agree 0.9%
Agree 21.7%
Neither agree nor disagree 16.0%
Disagree 29.6%
Strongly disagree 31.9% SOURCE: 2010 National Survey of Veterans – Veteran Survey
VE-F6a(19). Respondents asked whether they know what is available to them through their VA health coverage (F6a) - for respondents who are Hawaiian/Pacific Islander
Estimated Population Responding to Item 188,161
Strongly agree 9.1%
Agree 12.0%
Neither agree nor disagree 29.0%
Disagree 24.4%
Strongly disagree 25.5% SOURCE: 2010 National Survey of Veterans – Veteran Survey

2010 National Survey of Veterans - Appendix D - Detailed Tables
Veterans Survey Page D-91
VE-F6a(20). Respondents asked whether they know what is available to them through their VA health coverage (F6a) - for respondents who are American Indian/Alaska Native
Estimated Population Responding to Item *
SOURCE: 2010 National Survey of Veterans – Veteran Survey * Data were suppressed because fewer than 30 respondents answered this survey item.
VE-F6a(21). Respondents asked whether they know what is available to them through their VA health coverage (F6a) - for respondents who are multiracial
Estimated Population Responding to Item 460,632
Strongly agree 3.9%
Agree 11.1%
Neither agree nor disagree 13.9%
Disagree 35.1%
Strongly disagree 36.1% SOURCE: 2010 National Survey of Veterans – Veteran Survey

2010 National Survey of Veterans - Appendix D - Detailed Tables
Veterans Survey Page D-92
VE-I3(1). Respondents indicating they knew at discharge that they could convert from SGLI to VGLI (I3) - for those who served on active duty September 2001 or later
Estimated Population Responding to Item 2,436,071
Yes 41.4%
No 56.9%
SGLI was not available to me 1.4%
SGLI was available, but I did not have it while on active duty 0.2% SOURCE: 2010 National Survey of Veterans – Veteran Survey
VE-I3(2). Respondents indicating they knew at discharge that they could convert from SGLI to VGLI (I3) - for those who served on active duty August 1990 to August 2001
Estimated Population Responding to Item 3,869,388
Yes 39.6%
No 58.9%
SGLI was not available to me 1.0%
SGLI was available, but I did not have it while on active duty 0.5% SOURCE: 2010 National Survey of Veterans – Veteran Survey
VE-I3(3). Respondents indicating they knew at discharge that they could convert from SGLI to VGLI (I3) - for those who served on active duty May 1975 to July 1990
Estimated Population Responding to Item 5,571,302
Yes 28.3%
No 69.3%
SGLI was not available to me 1.9%
SGLI was available, but I did not have it while on active duty 0.5% SOURCE: 2010 National Survey of Veterans – Veteran Survey

2010 National Survey of Veterans - Appendix D - Detailed Tables
Veterans Survey Page D-93
VE-I3(4). Respondents indicating they knew at discharge that they could convert from SGLI to VGLI (I3) - for those who served on active duty during the Vietnam era (August 1964 to April 1975)
Estimated Population Responding to Item 6,718,516
Yes 17.7%
No 77.4%
SGLI was not available to me 4.3%
SGLI was available, but I did not have it while on active duty 0.6% SOURCE: 2010 National Survey of Veterans – Veteran Survey
VE-I3(5). Respondents indicating they knew at discharge that they could convert from SGLI to VGLI (I3) - for those who served on active duty February 1955 to July 1964
Estimated Population Responding to Item 3,315,030
Yes 8.9%
No 77.2%
SGLI was not available to me 12.4%
SGLI was available, but I did not have it while on active duty 1.5% SOURCE: 2010 National Survey of Veterans – Veteran Survey
VE-I3(6). Respondents indicating they knew at discharge that they could convert from SGLI to VGLI (I3) - for those who served on active duty during the Korean War (July 1950 to January 1955)
Estimated Population Responding to Item 2,082,333
Yes 27.6%
No 64.2%
SGLI was not available to me 7.3%
SGLI was available, but I did not have it while on active duty 0.9% SOURCE: 2010 National Survey of Veterans – Veteran Survey

2010 National Survey of Veterans - Appendix D - Detailed Tables
Veterans Survey Page D-94
VE-I3(7). Respondents indicating they knew at discharge that they could convert from SGLI to VGLI (I3) - for those who served on active duty January 1947 to June 1950
Estimated Population Responding to Item 305,421
Yes 30.4%
No 62.1%
SGLI was not available to me 7.4%
SGLI was available, but I did not have it while on active duty 0.0% SOURCE: 2010 National Survey of Veterans – Veteran Survey
VE-I3(8). Respondents indicating they knew at discharge that they could convert from SGLI to VGLI (I3) - for those who served on active duty during World War II (December 1941 to December 1946)
Estimated Population Responding to Item 1,568,761
Yes 36.2%
No 56.9%
SGLI was not available to me 6.2%
SGLI was available, but I did not have it while on active duty 0.8% SOURCE: 2010 National Survey of Veterans – Veteran Survey
VE-I3(9). Respondents indicating they knew at discharge that they could convert from SGLI to VGLI (I3) - for those who served on active duty November 1941 or earlier
Estimated Population Responding to Item 78,140
Yes 37.3%
No 55.9%
SGLI was not available to me 6.7%
SGLI was available, but I did not have it while on active duty 0.0% SOURCE: 2010 National Survey of Veterans – Veteran Survey

2010 National Survey of Veterans - Appendix D - Detailed Tables
Veterans Survey Page D-95
VE-I3(10). Respondents indicating they knew at discharge that they could convert from SGLI to VGLI (I3) - for Males
Estimated Population Responding to Item 16,256,982
Yes 20.1%
No 74.4%
SGLI was not available to me 4.8%
SGLI was available, but I did not have it while on active duty 0.7% SOURCE: 2010 National Survey of Veterans – Veteran Survey
VE-I3(11). Respondents indicating they knew at discharge that they could convert from SGLI to VGLI (I3) - for Females
Estimated Population Responding to Item 1,435,145
Yes 22.2%
No 73.5%
SGLI was not available to me 4.0%
SGLI was available, but I did not have it while on active duty 0.3% SOURCE: 2010 National Survey of Veterans – Veteran Survey
VE-I3(12). Respondents indicating they knew at discharge that they could convert from SGLI to VGLI (I3) - for responders under age 31
Estimated Population Responding to Item 1,131,404
Yes 26.5%
No 70.7%
SGLI was not available to me 2.7%
SGLI was available, but I did not have it while on active duty 0.1% SOURCE: 2010 National Survey of Veterans – Veteran Survey

2010 National Survey of Veterans - Appendix D - Detailed Tables
Veterans Survey Page D-96
VE-I3(13). Respondents indicating they knew at discharge that they could convert from SGLI to VGLI (I3) - for responders age 31 and older
Estimated Population Responding to Item 18,611,247
Yes 21.4%
No 72.9%
SGLI was not available to me 4.9%
SGLI was available, but I did not have it while on active duty 0.7% SOURCE: 2010 National Survey of Veterans – Veteran Survey
VE-I3(14). Respondents indicating they knew at discharge that they could convert from SGLI to VGLI (I3) - for non-Hispanics
Estimated Population Responding to Item 17,736,398
Yes 22.1%
No 72.2%
SGLI was not available to me 4.9%
SGLI was available, but I did not have it while on active duty 0.7% SOURCE: 2010 National Survey of Veterans – Veteran Survey
VE-I3(15). Respondents indicating they knew at discharge that they could convert from SGLI to VGLI (I3) - for Hispanics
Estimated Population Responding to Item 950,254
Yes 21.3%
No 75.8%
SGLI was not available to me 2.3%
SGLI was available, but I did not have it while on active duty 0.6% SOURCE: 2010 National Survey of Veterans – Veteran Survey

2010 National Survey of Veterans - Appendix D - Detailed Tables
Veterans Survey Page D-97
VE-I3(16). Respondents indicating they knew at discharge that they could convert from SGLI to VGLI (I3) - for respondents who are White
Estimated Population Responding to Item 16,475,934
Yes 22.2%
No 71.8%
SGLI was not available to me 5.2%
SGLI was available, but I did not have it while on active duty 0.7% SOURCE: 2010 National Survey of Veterans – Veteran Survey
VE-I3(17). Respondents indicating they knew at discharge that they could convert from SGLI to VGLI (I3) - for respondents who are Black/African American
Estimated Population Responding to Item 2,244,230
Yes 17.9%
No 78.8%
SGLI was not available to me 2.3%
SGLI was available, but I did not have it while on active duty 1.0% SOURCE: 2010 National Survey of Veterans – Veteran Survey
VE-I3(18). Respondents indicating they knew at discharge that they could convert from SGLI to VGLI (I3) - for respondents who are Asian
Estimated Population Responding to Item 129,226
Yes 8.6%
No 87.0%
SGLI was not available to me 4.4%
SGLI was available, but I did not have it while on active duty 0.0% SOURCE: 2010 National Survey of Veterans – Veteran Survey

2010 National Survey of Veterans - Appendix D - Detailed Tables
Veterans Survey Page D-98
VE-I3(19). Respondents indicating they knew at discharge that they could convert from SGLI to VGLI (I3) - for respondents who are Hawaiian/Pacific Islander
Estimated Population Responding to Item 185,150
Yes 25.5%
No 72.7%
SGLI was not available to me 1.9%
SGLI was available, but I did not have it while on active duty 0.0% SOURCE: 2010 National Survey of Veterans – Veteran Survey
VE-I3(20). Respondents indicating they knew at discharge that they could convert from SGLI to VGLI (I3) - for respondents who are American Indian/Alaska Native
Estimated Population Responding to Item *
SOURCE: 2010 National Survey of Veterans – Veteran Survey * Data were suppressed because fewer than 30 respondents answered this survey item.
VE-I3(21). Respondents indicating they knew at discharge that they could convert from SGLI to VGLI (I3) - for respondents who are multiracial
Estimated Population Responding to Item 443,613
Yes 20.9%
No 75.2%
SGLI was not available to me 3.2%
SGLI was available, but I did not have it while on active duty 0.6% SOURCE: 2010 National Survey of Veterans – Veteran Survey

2010 National Survey of Veterans - Appendix D - Detailed Tables
Veterans Survey Page D-99
VE-J2(1). Respondents indicating they know VA has a home loan guaranty program for eligible Veterans (J2) - for those who served on active duty September 2001 or later
Estimated Population Responding to Item 2,512,917
Yes 78.7%
No 21.3% SOURCE: 2010 National Survey of Veterans – Veteran Survey
VE-J2(2). Respondents indicating they know VA has a home loan guaranty program for eligible Veterans (J2) - for those who served on active duty August 1990 to August 2001
Estimated Population Responding to Item 4,043,861
Yes 79.7%
No 20.3% SOURCE: 2010 National Survey of Veterans – Veteran Survey
VE-J2(3). Respondents indicating they know VA has a home loan guaranty program for eligible Veterans (J2) - for those who served on active duty May 1975 to July 1990
Estimated Population Responding to Item 5,853,093
Yes 79.0%
No 21.0% SOURCE: 2010 National Survey of Veterans – Veteran Survey

2010 National Survey of Veterans - Appendix D - Detailed Tables
Veterans Survey Page D-100
VE-J2(4). Respondents indicating they know VA has a home loan guaranty program for eligible Veterans (J2) - for those who served on active duty during the Vietnam era (August 1964 to April 1975)
Estimated Population Responding to Item 7,181,234
Yes 71.0%
No 29.0% SOURCE: 2010 National Survey of Veterans – Veteran Survey
VE-J2(5). Respondents indicating they know VA has a home loan guaranty program for eligible Veterans (J2) - for those who served on active duty February 1955 to July 1964
Estimated Population Responding to Item 3,680,546
Yes 60.5%
No 39.5% SOURCE: 2010 National Survey of Veterans – Veteran Survey
VE-J2(6). Respondents indicating they know VA has a home loan guaranty program for eligible Veterans (J2) - for those who served on active duty during the Korean War (July 1950 to January 1955)
Estimated Population Responding to Item 2,290,317
Yes 61.7%
No 38.3% SOURCE: 2010 National Survey of Veterans – Veteran Survey

2010 National Survey of Veterans - Appendix D - Detailed Tables
Veterans Survey Page D-101
VE-J2(7). Respondents indicating they know VA has a home loan guaranty program for eligible Veterans (J2) - for those who served on active duty January 1947 to June 1950
Estimated Population Responding to Item 333,817
Yes 61.9%
No 38.1% SOURCE: 2010 National Survey of Veterans – Veteran Survey
VE-J2(8). Respondents indicating they know VA has a home loan guaranty program for eligible Veterans (J2) - for those who served on active duty during World War II (December 1941 to December 1946)
Estimated Population Responding to Item 1,708,077
Yes 53.5%
No 46.5% SOURCE: 2010 National Survey of Veterans – Veteran Survey
VE-J2(9). Respondents indicating they know VA has a home loan guaranty program for eligible Veterans (J2) - for those who served on active duty November 1941 or earlier
Estimated Population Responding to Item *
SOURCE: 2010 National Survey of Veterans – Veteran Survey * Data were suppressed because fewer than 30 respondents answered this survey item.

2010 National Survey of Veterans - Appendix D - Detailed Tables
Veterans Survey Page D-102
VE-J2(10). Respondents indicating they know VA has a home loan guaranty program for eligible Veterans (J2) - for Males
Estimated Population Responding to Item 17,575,907
Yes 66.7%
No 33.3% SOURCE: 2010 National Survey of Veterans – Veteran Survey
VE-J2(11). Respondents indicating they know VA has a home loan guaranty program for eligible Veterans (J2) - for Females
Estimated Population Responding to Item 1,548,032
Yes 74.1%
No 25.9% SOURCE: 2010 National Survey of Veterans – Veteran Survey
VE-J2(12). Respondents indicating they know VA has a home loan guaranty program for eligible Veterans (J2) - for responders under age 31
Estimated Population Responding to Item 1,150,684
Yes 67.8%
No 32.2% SOURCE: 2010 National Survey of Veterans – Veteran Survey

2010 National Survey of Veterans - Appendix D - Detailed Tables
Veterans Survey Page D-103
VE-J2(13). Respondents indicating they know VA has a home loan guaranty program for eligible Veterans (J2) - for responders age 31 and older
Estimated Population Responding to Item 19,999,214
Yes 68.3%
No 31.7% SOURCE: 2010 National Survey of Veterans – Veteran Survey
VE-J2(14). Respondents indicating they know VA has a home loan guaranty program for eligible Veterans (J2) - for non-Hispanics
Estimated Population Responding to Item 19,013,981
Yes 68.5%
No 31.5% SOURCE: 2010 National Survey of Veterans – Veteran Survey
VE-J2(15). Respondents indicating they know VA has a home loan guaranty program for eligible Veterans (J2) - for Hispanics
Estimated Population Responding to Item 1,008,623
Yes 71.8%
No 28.2% SOURCE: 2010 National Survey of Veterans – Veteran Survey

2010 National Survey of Veterans - Appendix D - Detailed Tables
Veterans Survey Page D-104
VE-J2(16). Respondents indicating they know VA has a home loan guaranty program for eligible Veterans (J2) - for respondents who are White
Estimated Population Responding to Item 17,695,200
Yes 67.8%
No 32.2% SOURCE: 2010 National Survey of Veterans – Veteran Survey
VE-J2(17). Respondents indicating they know VA has a home loan guaranty program for eligible Veterans (J2) - for respondents who are Black/African American
Estimated Population Responding to Item 2,361,256
Yes 71.5%
No 28.5% SOURCE: 2010 National Survey of Veterans – Veteran Survey
VE-J2(18). Respondents indicating they know VA has a home loan guaranty program for eligible Veterans (J2) - for respondents who are Asian
Estimated Population Responding to Item 142,467
Yes 60.7%
No 39.3% SOURCE: 2010 National Survey of Veterans – Veteran Survey

2010 National Survey of Veterans - Appendix D - Detailed Tables
Veterans Survey Page D-105
VE-J2(19). Respondents indicating they know VA has a home loan guaranty program for eligible Veterans (J2) - for respondents who are Hawaiian/Pacific Islander
Estimated Population Responding to Item 212,522
Yes 55.7%
No 44.3% SOURCE: 2010 National Survey of Veterans – Veteran Survey
VE-J2(20). Respondents indicating they know VA has a home loan guaranty program for eligible Veterans (J2) - for respondents who are American Indian/Alaska Native
Estimated Population Responding to Item *
SOURCE: 2010 National Survey of Veterans – Veteran Survey * Data were suppressed because fewer than 30 respondents answered this survey item.
VE-J2(21). Respondents indicating they know VA has a home loan guaranty program for eligible Veterans (J2) - for respondents who are multiracial
Estimated Population Responding to Item 473,010
Yes 67.9%
No 32.1% SOURCE: 2010 National Survey of Veterans – Veteran Survey

2010 National Survey of Veterans - Appendix D - Detailed Tables
Veterans Survey Page D-106
VE-K1(1). Satisfaction with ability to get accurate information about burial benefits (K1) - for those who served on active duty September 2001 or later
Estimated Population Responding to Item 2,501,606
Very satisfied 5.5%
Satisfied 13.1%
Neither satisfied nor dissatisfied 23.9%
Dissatisfied 7.3%
Very dissatisfied 3.0%
I have not tried to get information 47.3% SOURCE: 2010 National Survey of Veterans – Veteran Survey
VE-K1(2). Satisfaction with ability to get accurate information about burial benefits (K1) - for those who served on active duty August 1990 to August 2001
Estimated Population Responding to Item 4,054,110
Very satisfied 5.3%
Satisfied 11.8%
Neither satisfied nor dissatisfied 21.8%
Dissatisfied 6.4%
Very dissatisfied 3.0%
I have not tried to get information 51.7% SOURCE: 2010 National Survey of Veterans – Veteran Survey

2010 National Survey of Veterans - Appendix D - Detailed Tables
Veterans Survey Page D-107
VE-K1(3). Satisfaction with ability to get accurate information about burial benefits (K1) - for those who served on active duty May 1975 to July 1990
Estimated Population Responding to Item 5,867,006
Very satisfied 4.5%
Satisfied 9.7%
Neither satisfied nor dissatisfied 20.8%
Dissatisfied 6.2%
Very dissatisfied 2.9%
I have not tried to get information 56.0% SOURCE: 2010 National Survey of Veterans – Veteran Survey
VE-K1(4). Satisfaction with ability to get accurate information about burial benefits (K1) - for those who served on active duty during the Vietnam era (August 1964 to April 1975)
Estimated Population Responding to Item 7,207,703
Very satisfied 3.6%
Satisfied 10.3%
Neither satisfied nor dissatisfied 18.5%
Dissatisfied 5.6%
Very dissatisfied 2.6%
I have not tried to get information 59.5% SOURCE: 2010 National Survey of Veterans – Veteran Survey

2010 National Survey of Veterans - Appendix D - Detailed Tables
Veterans Survey Page D-108
VE-K1(5). Satisfaction with ability to get accurate information about burial benefits (K1) - for those who served on active duty February 1955 to July 1964
Estimated Population Responding to Item 3,740,450
Very satisfied 3.9%
Satisfied 10.6%
Neither satisfied nor dissatisfied 15.9%
Dissatisfied 3.7%
Very dissatisfied 1.9%
I have not tried to get information 63.9% SOURCE: 2010 National Survey of Veterans – Veteran Survey
VE-K1(6). Satisfaction with ability to get accurate information about burial benefits (K1) - for those who served on active duty during the Korean War (July 1950 to January 1955)
Estimated Population Responding to Item 2,343,810
Very satisfied 5.8%
Satisfied 15.3%
Neither satisfied nor dissatisfied 15.2%
Dissatisfied 3.5%
Very dissatisfied 1.6%
I have not tried to get information 58.6% SOURCE: 2010 National Survey of Veterans – Veteran Survey

2010 National Survey of Veterans - Appendix D - Detailed Tables
Veterans Survey Page D-109
VE-K1(7). Satisfaction with ability to get accurate information about burial benefits (K1) - for those who served on active duty January 1947 to June 1950
Estimated Population Responding to Item 342,947
Very satisfied 10.5%
Satisfied 9.8%
Neither satisfied nor dissatisfied 17.4%
Dissatisfied 4.3%
Very dissatisfied 0.6%
I have not tried to get information 57.4% SOURCE: 2010 National Survey of Veterans – Veteran Survey
VE-K1(8). Satisfaction with ability to get accurate information about burial benefits (K1) - for those who served on active duty during World War II (December 1941 to December 1946)
Estimated Population Responding to Item 1,802,177
Very satisfied 7.6%
Satisfied 16.8%
Neither satisfied nor dissatisfied 13.5%
Dissatisfied 4.0%
Very dissatisfied 1.3%
I have not tried to get information 56.8% SOURCE: 2010 National Survey of Veterans – Veteran Survey

2010 National Survey of Veterans - Appendix D - Detailed Tables
Veterans Survey Page D-110
VE-K1(9). Satisfaction with ability to get accurate information about burial benefits (K1) - for those who served on active duty November 1941 or earlier
Estimated Population Responding to Item 83,336
Very satisfied 11.5%
Satisfied 17.3%
Neither satisfied nor dissatisfied 22.6%
Dissatisfied 4.4%
Very dissatisfied 0.0%
I have not tried to get information 44.1% SOURCE: 2010 National Survey of Veterans – Veteran Survey
VE-K1(10). Satisfaction with ability to get accurate information about burial benefits (K1) - for Males
Estimated Population Responding to Item 17,770,166
Very satisfied 3.8%
Satisfied 10.3%
Neither satisfied nor dissatisfied 18.0%
Dissatisfied 5.5%
Very dissatisfied 2.7%
I have not tried to get information 59.7% SOURCE: 2010 National Survey of Veterans – Veteran Survey

2010 National Survey of Veterans - Appendix D - Detailed Tables
Veterans Survey Page D-111
VE-K1(11). Satisfaction with ability to get accurate information about burial benefits (K1) - for Females
Estimated Population Responding to Item 1,554,842
Very satisfied 2.5%
Satisfied 10.4%
Neither satisfied nor dissatisfied 16.7%
Dissatisfied 6.9%
Very dissatisfied 2.2%
I have not tried to get information 61.3% SOURCE: 2010 National Survey of Veterans – Veteran Survey
VE-K1(12). Satisfaction with ability to get accurate information about burial benefits (K1) - for responders under age 31
Estimated Population Responding to Item 1,129,920
Very satisfied 1.0%
Satisfied 9.9%
Neither satisfied nor dissatisfied 25.1%
Dissatisfied 6.4%
Very dissatisfied 3.4%
I have not tried to get information 54.1% SOURCE: 2010 National Survey of Veterans – Veteran Survey

2010 National Survey of Veterans - Appendix D - Detailed Tables
Veterans Survey Page D-112
VE-K1(13). Satisfaction with ability to get accurate information about burial benefits (K1) - for responders age 31 and older
Estimated Population Responding to Item 20,216,760
Very satisfied 4.2%
Satisfied 10.3%
Neither satisfied nor dissatisfied 17.7%
Dissatisfied 5.4%
Very dissatisfied 2.4%
I have not tried to get information 60.0% SOURCE: 2010 National Survey of Veterans – Veteran Survey
VE-K1(14). Satisfaction with ability to get accurate information about burial benefits (K1) - for non-Hispanics
Estimated Population Responding to Item 19,137,714
Very satisfied 3.8%
Satisfied 10.1%
Neither satisfied nor dissatisfied 18.7%
Dissatisfied 5.3%
Very dissatisfied 2.4%
I have not tried to get information 59.8% SOURCE: 2010 National Survey of Veterans – Veteran Survey

2010 National Survey of Veterans - Appendix D - Detailed Tables
Veterans Survey Page D-113
VE-K1(15). Satisfaction with ability to get accurate information about burial benefits (K1) - for Hispanics
Estimated Population Responding to Item 1,029,877
Very satisfied 4.8%
Satisfied 9.8%
Neither satisfied nor dissatisfied 16.2%
Dissatisfied 6.4%
Very dissatisfied 2.7%
I have not tried to get information 60.1% SOURCE: 2010 National Survey of Veterans – Veteran Survey
VE-K1(16). Satisfaction with ability to get accurate information about burial benefits (K1) - for respondents who are White
Estimated Population Responding to Item 17,885,026
Very satisfied 3.8%
Satisfied 10.5%
Neither satisfied nor dissatisfied 18.6%
Dissatisfied 4.8%
Very dissatisfied 2.1%
I have not tried to get information 60.3% SOURCE: 2010 National Survey of Veterans – Veteran Survey

2010 National Survey of Veterans - Appendix D - Detailed Tables
Veterans Survey Page D-114
VE-K1(17). Satisfaction with ability to get accurate information about burial benefits (K1) - for respondents who are Black/African American
Estimated Population Responding to Item 2,357,854
Very satisfied 5.5%
Satisfied 8.7%
Neither satisfied nor dissatisfied 14.9%
Dissatisfied 8.6%
Very dissatisfied 4.9%
I have not tried to get information 57.3% SOURCE: 2010 National Survey of Veterans – Veteran Survey
VE-K1(18). Satisfaction with ability to get accurate information about burial benefits (K1) - for respondents who are Asian
Estimated Population Responding to Item 142,467
Very satisfied 5.5%
Satisfied 4.5%
Neither satisfied nor dissatisfied 16.2%
Dissatisfied 4.9%
Very dissatisfied 0.0%
I have not tried to get information 69.0% SOURCE: 2010 National Survey of Veterans – Veteran Survey

2010 National Survey of Veterans - Appendix D - Detailed Tables
Veterans Survey Page D-115
VE-K1(19). Satisfaction with ability to get accurate information about burial benefits (K1) - for respondents who are Hawaiian/Pacific Islander
Estimated Population Responding to Item 201,877
Very satisfied 0.8%
Satisfied 10.9%
Neither satisfied nor dissatisfied 16.9%
Dissatisfied 6.8%
Very dissatisfied 0.5%
I have not tried to get information 64.1% SOURCE: 2010 National Survey of Veterans – Veteran Survey
VE-K1(20). Satisfaction with ability to get accurate information about burial benefits (K1) - for respondents who are American Indian/Alaska Native
Estimated Population Responding to Item *
SOURCE: 2010 National Survey of Veterans – Veteran Survey * Data were suppressed because fewer than 30 respondents answered this survey item.

2010 National Survey of Veterans - Appendix D - Detailed Tables
Veterans Survey Page D-116
VE-K1(21). Satisfaction with ability to get accurate information about burial benefits (K1) - for respondents who are multiracial
Estimated Population Responding to Item 475,529
Very satisfied 3.7%
Satisfied 6.8%
Neither satisfied nor dissatisfied 19.3%
Dissatisfied 8.8%
Very dissatisfied 8.6%
I have not tried to get information 52.7% SOURCE: 2010 National Survey of Veterans – Veteran Survey
VE-K3(1). Heard of the following burial benefits before today: (K3) - for those who served on active duty September 2001 or later
Yes No Don't know
Estimated Population
Responding to Item
Burial at a VA National or State Veterans cemetery 50.5% 37.5% 12.0% 2,496,955
Headstone and burial markers provided by VA at private cemeteries 33.2% 52.4% 14.4% 2,493,285
Presidential Memorial Certificates for next of kin 15.5% 66.6% 17.9% 2,493,285
Cash plot allowance 13.7% 68.7% 17.6% 2,487,912
Cash burial allowance 15.6% 67.4% 17.0% 2,486,788
Military Funeral Honors 50.4% 37.7% 11.8% 2,493,285
Receiving a US Flag 57.4% 33.6% 8.9% 2,489,932 SOURCE: 2010 National Survey of Veterans – Veteran Survey

2010 National Survey of Veterans - Appendix D - Detailed Tables
Veterans Survey Page D-117
VE-K3(2). Heard of the following burial benefits before today: (K3) - for those who served on active duty August 1990 to August 2001
Yes No Don't know
Estimated Population
Responding to Item
Burial at a VA National or State Veterans cemetery 51.4% 37.6% 11.0% 4,029,212
Headstone and burial markers provided by VA at private cemeteries 33.0% 53.7% 13.3% 4,027,612
Presidential Memorial Certificates for next of kin 15.2% 69.0% 15.8% 4,025,947
Cash plot allowance 11.9% 73.0% 15.2% 4,017,443
Cash burial allowance 15.5% 69.6% 15.0% 4,010,750
Military Funeral Honors 51.9% 37.4% 10.7% 4,018,681
Receiving a US Flag 57.4% 32.6% 10.0% 4,025,146 SOURCE: 2010 National Survey of Veterans – Veteran Survey
VE-K3(3). Heard of the following burial benefits before today: (K3) - for those who served on active duty May 1975 to July 1990
Yes No Don't know
Estimated Population
Responding to Item
Burial at a VA National or State Veterans cemetery 45.5% 40.6% 13.9% 5,860,211
Headstone and burial markers provided by VA at private cemeteries 30.2% 54.1% 15.7% 5,852,749
Presidential Memorial Certificates for next of kin 11.8% 68.9% 19.4% 5,843,922
Cash plot allowance 8.7% 73.1% 18.3% 5,852,631
Cash burial allowance 12.2% 69.7% 18.0% 5,830,437
Military Funeral Honors 44.9% 41.2% 13.9% 5,844,737
Receiving a US Flag 51.7% 36.4% 11.9% 5,850,284 SOURCE: 2010 National Survey of Veterans – Veteran Survey

2010 National Survey of Veterans - Appendix D - Detailed Tables
Veterans Survey Page D-118
VE-K3(4). Heard of the following burial benefits before today: (K3) - for those who served on active duty during the Vietnam era (August 1964 to April 1975)
Yes No Don't know
Estimated Population
Responding to Item
Burial at a VA National or State Veterans cemetery 44.2% 40.9% 15.0% 7,144,014
Headstone and burial markers provided by VA at private cemeteries 30.9% 53.9% 15.3% 7,149,921
Presidential Memorial Certificates for next of kin 9.8% 69.4% 20.8% 7,109,374
Cash plot allowance 7.5% 71.9% 20.6% 7,120,594
Cash burial allowance 11.7% 68.1% 20.1% 7,112,874
Military Funeral Honors 40.4% 44.3% 15.3% 7,138,474
Receiving a US Flag 49.7% 37.9% 12.4% 7,141,710 SOURCE: 2010 National Survey of Veterans – Veteran Survey
VE-K3(5). Heard of the following burial benefits before today: (K3) - for those who served on active duty February 1955 to July 1964
Yes No Don't know
Estimated Population
Responding to Item
Burial at a VA National or State Veterans cemetery 39.5% 43.3% 17.2% 3,655,205
Headstone and burial markers provided by VA at private cemeteries 25.6% 55.7% 18.8% 3,660,298
Presidential Memorial Certificates for next of kin 7.2% 68.7% 24.0% 3,642,660
Cash plot allowance 5.7% 70.3% 24.0% 3,642,357
Cash burial allowance 9.8% 66.7% 23.5% 3,642,574
Military Funeral Honors 34.4% 46.7% 18.9% 3,656,941
Receiving a US Flag 42.5% 41.6% 15.9% 3,667,526 SOURCE: 2010 National Survey of Veterans – Veteran Survey
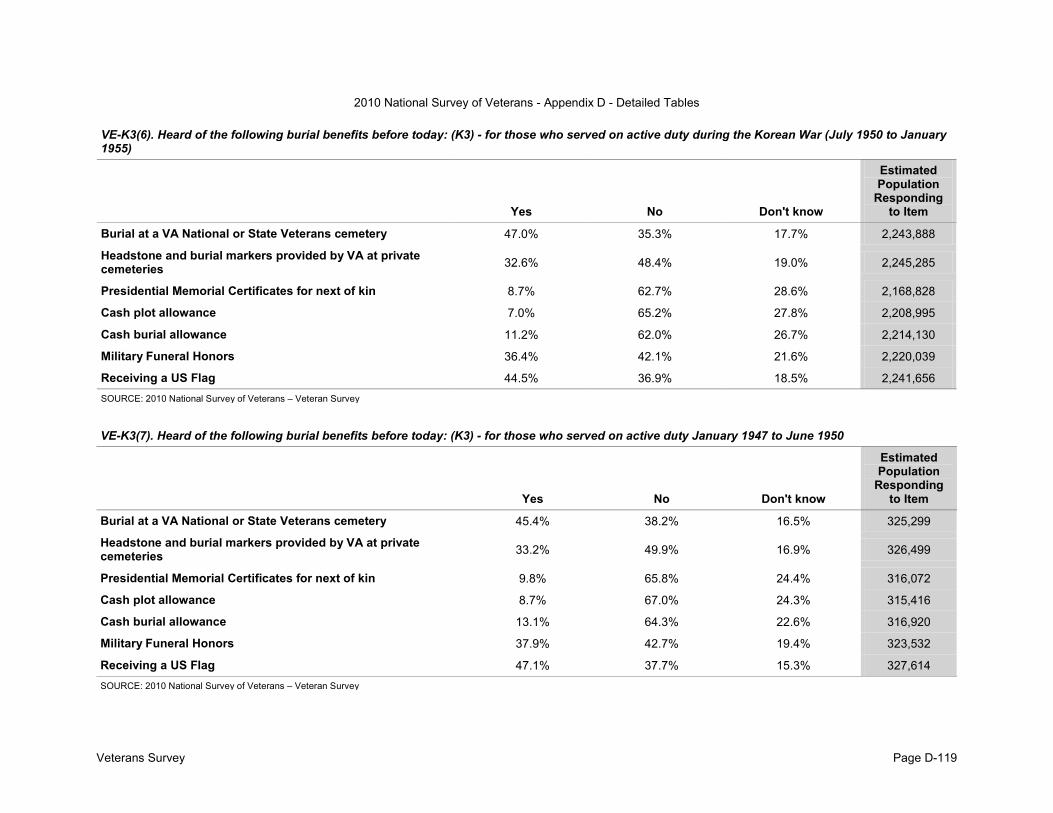
2010 National Survey of Veterans - Appendix D - Detailed Tables
Veterans Survey Page D-119
VE-K3(6). Heard of the following burial benefits before today: (K3) - for those who served on active duty during the Korean War (July 1950 to January 1955)
Yes No Don't know
Estimated Population
Responding to Item
Burial at a VA National or State Veterans cemetery 47.0% 35.3% 17.7% 2,243,888
Headstone and burial markers provided by VA at private cemeteries 32.6% 48.4% 19.0% 2,245,285
Presidential Memorial Certificates for next of kin 8.7% 62.7% 28.6% 2,168,828
Cash plot allowance 7.0% 65.2% 27.8% 2,208,995
Cash burial allowance 11.2% 62.0% 26.7% 2,214,130
Military Funeral Honors 36.4% 42.1% 21.6% 2,220,039
Receiving a US Flag 44.5% 36.9% 18.5% 2,241,656 SOURCE: 2010 National Survey of Veterans – Veteran Survey
VE-K3(7). Heard of the following burial benefits before today: (K3) - for those who served on active duty January 1947 to June 1950
Yes No Don't know
Estimated Population
Responding to Item
Burial at a VA National or State Veterans cemetery 45.4% 38.2% 16.5% 325,299
Headstone and burial markers provided by VA at private cemeteries 33.2% 49.9% 16.9% 326,499
Presidential Memorial Certificates for next of kin 9.8% 65.8% 24.4% 316,072
Cash plot allowance 8.7% 67.0% 24.3% 315,416
Cash burial allowance 13.1% 64.3% 22.6% 316,920
Military Funeral Honors 37.9% 42.7% 19.4% 323,532
Receiving a US Flag 47.1% 37.7% 15.3% 327,614 SOURCE: 2010 National Survey of Veterans – Veteran Survey
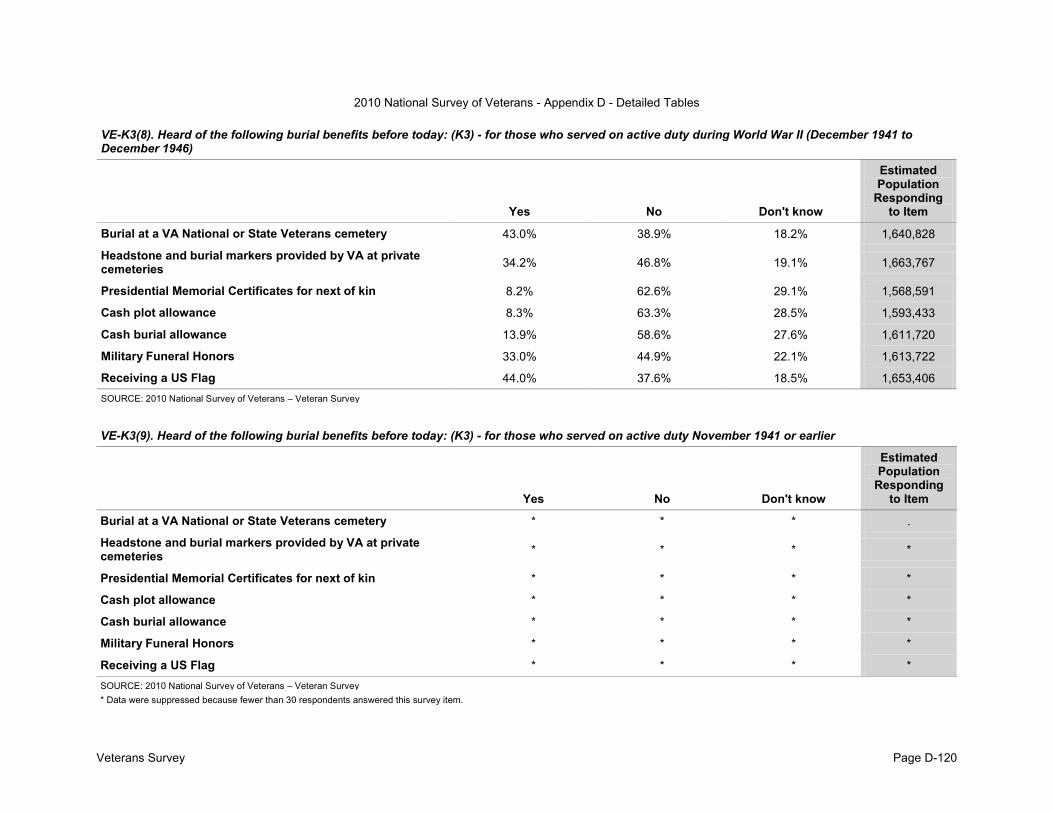
2010 National Survey of Veterans - Appendix D - Detailed Tables
Veterans Survey Page D-120
VE-K3(8). Heard of the following burial benefits before today: (K3) - for those who served on active duty during World War II (December 1941 to December 1946)
Yes No Don't know
Estimated Population
Responding to Item
Burial at a VA National or State Veterans cemetery 43.0% 38.9% 18.2% 1,640,828
Headstone and burial markers provided by VA at private cemeteries 34.2% 46.8% 19.1% 1,663,767
Presidential Memorial Certificates for next of kin 8.2% 62.6% 29.1% 1,568,591
Cash plot allowance 8.3% 63.3% 28.5% 1,593,433
Cash burial allowance 13.9% 58.6% 27.6% 1,611,720
Military Funeral Honors 33.0% 44.9% 22.1% 1,613,722
Receiving a US Flag 44.0% 37.6% 18.5% 1,653,406 SOURCE: 2010 National Survey of Veterans – Veteran Survey
VE-K3(9). Heard of the following burial benefits before today: (K3) - for those who served on active duty November 1941 or earlier
Yes No Don't know
Estimated Population
Responding to Item
Burial at a VA National or State Veterans cemetery * * * .
Headstone and burial markers provided by VA at private cemeteries * * * *
Presidential Memorial Certificates for next of kin * * * *
Cash plot allowance * * * *
Cash burial allowance * * * *
Military Funeral Honors * * * *
Receiving a US Flag * * * * SOURCE: 2010 National Survey of Veterans – Veteran Survey * Data were suppressed because fewer than 30 respondents answered this survey item.

2010 National Survey of Veterans - Appendix D - Detailed Tables
Veterans Survey Page D-121
VE-K3(10). Heard of the following burial benefits before today: (K3) - for Males
Yes No Don't know
Estimated Population
Responding to Item
Burial at a VA National or State Veterans cemetery 40.0% 43.2% 16.9% 17,428,124
Headstone and burial markers provided by VA at private cemeteries 27.5% 54.8% 17.7% 17,439,116
Presidential Memorial Certificates for next of kin 8.6% 68.1% 23.3% 17,241,132
Cash plot allowance 6.9% 70.3% 22.8% 17,329,200
Cash burial allowance 10.0% 67.7% 22.3% 17,325,782
Military Funeral Honors 36.6% 45.6% 17.8% 17,348,399
Receiving a US Flag 44.9% 40.1% 14.9% 17,460,234 SOURCE: 2010 National Survey of Veterans – Veteran Survey
VE-K3(11). Heard of the following burial benefits before today: (K3) - for Females
Yes No Don't know
Estimated Population
Responding to Item
Burial at a VA National or State Veterans cemetery 48.1% 37.2% 14.8% 1,522,937
Headstone and burial markers provided by VA at private cemeteries 26.9% 57.8% 15.3% 1,538,571
Presidential Memorial Certificates for next of kin 11.3% 69.2% 19.5% 1,522,550
Cash plot allowance 7.4% 72.3% 20.2% 1,523,648
Cash burial allowance 10.3% 69.6% 20.1% 1,525,011
Military Funeral Honors 39.5% 44.3% 16.2% 1,523,551
Receiving a US Flag 47.6% 39.0% 13.5% 1,527,518 SOURCE: 2010 National Survey of Veterans – Veteran Survey

2010 National Survey of Veterans - Appendix D - Detailed Tables
Veterans Survey Page D-122
VE-K3(12). Heard of the following burial benefits before today: (K3) - for responders under age 31
Yes No Don't know
Estimated Population
Responding to Item
Burial at a VA National or State Veterans cemetery 35.3% 48.8% 15.9% 1,147,432
Headstone and burial markers provided by VA at private cemeteries 19.1% 64.5% 16.4% 1,147,432
Presidential Memorial Certificates for next of kin 9.6% 71.4% 19.0% 1,147,432
Cash plot allowance 10.0% 70.4% 19.6% 1,142,059
Cash burial allowance 8.7% 72.3% 19.0% 1,147,432
Military Funeral Honors 33.9% 50.1% 16.0% 1,147,432
Receiving a US Flag 42.7% 44.9% 12.4% 1,139,725 SOURCE: 2010 National Survey of Veterans – Veteran Survey
VE-K3(13). Heard of the following burial benefits before today: (K3) - for responders age 31 and older
Yes No Don't know
Estimated Population
Responding to Item
Burial at a VA National or State Veterans cemetery 42.1% 42.0% 15.9% 19,842,482
Headstone and burial markers provided by VA at private cemeteries 28.3% 54.9% 16.8% 19,860,059
Presidential Memorial Certificates for next of kin 9.3% 68.6% 22.1% 19,647,292
Cash plot allowance 7.2% 71.3% 21.5% 19,734,601
Cash burial allowance 10.7% 68.1% 21.1% 19,728,678
Military Funeral Honors 38.3% 44.8% 16.8% 19,755,428
Receiving a US Flag 46.3% 39.5% 14.2% 19,867,738 SOURCE: 2010 National Survey of Veterans – Veteran Survey

2010 National Survey of Veterans - Appendix D - Detailed Tables
Veterans Survey Page D-123
VE-K3(14). Heard of the following burial benefits before today: (K3) - for non-Hispanics
Yes No Don't know
Estimated Population
Responding to Item
Burial at a VA National or State Veterans cemetery 41.6% 43.0% 15.4% 18,889,296
Headstone and burial markers provided by VA at private cemeteries 27.5% 56.3% 16.2% 18,941,339
Presidential Memorial Certificates for next of kin 8.9% 69.7% 21.4% 18,779,102
Cash plot allowance 7.1% 72.1% 20.8% 18,839,472
Cash burial allowance 10.6% 69.0% 20.4% 18,835,530
Military Funeral Honors 37.8% 45.7% 16.5% 18,851,305
Receiving a US Flag 45.9% 40.2% 13.8% 18,914,900 SOURCE: 2010 National Survey of Veterans – Veteran Survey
VE-K3(15). Heard of the following burial benefits before today: (K3) - for Hispanics
Yes No Don't know
Estimated Population
Responding to Item
Burial at a VA National or State Veterans cemetery 43.3% 38.0% 18.7% 1,013,617
Headstone and burial markers provided by VA at private cemeteries 27.7% 50.5% 21.8% 996,014
Presidential Memorial Certificates for next of kin 10.2% 63.4% 26.4% 998,596
Cash plot allowance 7.6% 65.4% 27.0% 993,087
Cash burial allowance 8.8% 65.4% 25.8% 994,166
Military Funeral Honors 41.4% 40.7% 17.9% 1,010,750
Receiving a US Flag 48.6% 36.8% 14.6% 1,008,463 SOURCE: 2010 National Survey of Veterans – Veteran Survey

2010 National Survey of Veterans - Appendix D - Detailed Tables
Veterans Survey Page D-124
VE-K3(16). Heard of the following burial benefits before today: (K3) - for respondents who are White
Yes No Don't know
Estimated Population
Responding to Item
Burial at a VA National or State Veterans cemetery 41.4% 42.8% 15.9% 17,520,279
Headstone and burial markers provided by VA at private cemeteries 28.2% 55.2% 16.5% 17,552,440
Presidential Memorial Certificates for next of kin 8.8% 69.4% 21.8% 17,346,263
Cash plot allowance 7.2% 71.3% 21.5% 17,430,795
Cash burial allowance 10.6% 68.3% 21.1% 17,455,671
Military Funeral Honors 37.7% 45.5% 16.8% 17,479,697
Receiving a US Flag 45.2% 40.3% 14.5% 17,566,176 SOURCE: 2010 National Survey of Veterans – Veteran Survey
VE-K3(17). Heard of the following burial benefits before today: (K3) - for respondents who are Black/African American
Yes No Don't know
Estimated Population
Responding to Item
Burial at a VA National or State Veterans cemetery 43.1% 42.8% 14.0% 2,372,039
Headstone and burial markers provided by VA at private cemeteries 25.2% 57.8% 17.0% 2,361,027
Presidential Memorial Certificates for next of kin 12.3% 66.5% 21.2% 2,351,932
Cash plot allowance 7.8% 71.3% 21.0% 2,351,132
Cash burial allowance 10.1% 69.8% 20.1% 2,331,541
Military Funeral Honors 39.2% 45.0% 15.8% 2,334,192
Receiving a US Flag 51.6% 36.7% 11.8% 2,356,984 SOURCE: 2010 National Survey of Veterans – Veteran Survey

2010 National Survey of Veterans - Appendix D - Detailed Tables
Veterans Survey Page D-125
VE-K3(18). Heard of the following burial benefits before today: (K3) - for respondents who are Asian
Yes No Don't know
Estimated Population
Responding to Item
Burial at a VA National or State Veterans cemetery 32.7% 51.8% 15.5% 142,467
Headstone and burial markers provided by VA at private cemeteries 34.6% 51.6% 13.8% 140,748
Presidential Memorial Certificates for next of kin 7.6% 68.0% 24.4% 139,220
Cash plot allowance 8.2% 71.1% 20.7% 140,748
Cash burial allowance 12.5% 64.4% 23.1% 140,939
Military Funeral Honors 41.5% 42.8% 15.8% 142,467
Receiving a US Flag 48.0% 37.7% 14.3% 142,467 SOURCE: 2010 National Survey of Veterans – Veteran Survey
VE-K3(19). Heard of the following burial benefits before today: (K3) - for respondents who are Hawaiian/Pacific Islander
Yes No Don't know
Estimated Population
Responding to Item
Burial at a VA National or State Veterans cemetery 28.0% 51.0% 21.0% 206,068
Headstone and burial markers provided by VA at private cemeteries 13.4% 63.5% 23.1% 206,068
Presidential Memorial Certificates for next of kin 4.5% 67.1% 28.4% 206,068
Cash plot allowance 0.7% 72.4% 26.9% 206,068
Cash burial allowance 3.5% 69.6% 26.9% 206,068
Military Funeral Honors 21.5% 52.3% 26.2% 205,363
Receiving a US Flag 31.9% 50.3% 17.8% 203,747 SOURCE: 2010 National Survey of Veterans – Veteran Survey

2010 National Survey of Veterans - Appendix D - Detailed Tables
Veterans Survey Page D-126
VE-K3(20). Heard of the following burial benefits before today: (K3) - for respondents who are American Indian/Alaska Native
Yes No Don't know
Estimated Population
Responding to Item
Burial at a VA National or State Veterans cemetery * * * .
Headstone and burial markers provided by VA at private cemeteries * * * *
Presidential Memorial Certificates for next of kin * * * *
Cash plot allowance * * * *
Cash burial allowance * * * *
Military Funeral Honors * * * *
Receiving a US Flag * * * * SOURCE: 2010 National Survey of Veterans – Veteran Survey * Data were suppressed because fewer than 30 respondents answered this survey item.
VE-K3(21). Heard of the following burial benefits before today: (K3) - for respondents who are multiracial
Yes No Don't know
Estimated Population
Responding to Item
Burial at a VA National or State Veterans cemetery 40.1% 37.9% 22.0% 471,482
Headstone and burial markers provided by VA at private cemeteries 26.0% 51.9% 22.1% 473,356
Presidential Memorial Certificates for next of kin 10.8% 63.6% 25.5% 473,356
Cash plot allowance 10.2% 68.9% 20.8% 471,202
Cash burial allowance 15.2% 65.3% 19.6% 469,198
Military Funeral Honors 42.2% 39.1% 18.6% 471,352
Receiving a US Flag 48.7% 36.8% 14.5% 462,947 SOURCE: 2010 National Survey of Veterans – Veteran Survey

2010 National Survey of Veterans - Appendix D - Detailed Tables
Veterans Survey Page D-127
VE-B2(1). Veterans searching for information in the past 12 months (B2) - for those who served on active duty September 2001 or later
Yes No
Estimated Population
Responding to Item
Eligibility for VA health care 34.6% 65.4% 2,511,463
VA health care facility locations 35.0% 65.0% 2,519,831
VA life insurance 12.7% 87.3% 2,515,634
VA home loans 29.0% 71.0% 2,518,900
VA education and training 51.6% 48.4% 2,528,334
VA vocational rehabilitation 10.8% 89.2% 2,497,545
VA burial and memorial benefits 7.9% 92.1% 2,515,634
VA disability compensation and pension 31.6% 68.4% 2,503,088
VA benefits for dependents and survivors 14.4% 85.6% 2,509,294
VA transition assistance 10.2% 89.8% 2,521,694
VA prescription benefits 17.7% 82.3% 2,515,140 SOURCE: 2010 National Survey of Veterans – Veteran Survey

2010 National Survey of Veterans - Appendix D - Detailed Tables
Veterans Survey Page D-128
VE-B2(2). Veterans searching for information in the past 12 months (B2) - for those who served on active duty August 1990 to August 2001
Yes No
Estimated Population
Responding to Item
Eligibility for VA health care 23.1% 76.9% 4,050,752
VA health care facility locations 23.5% 76.5% 4,056,535
VA life insurance 9.0% 91.0% 4,058,164
VA home loans 20.3% 79.7% 4,061,706
VA education and training 23.9% 76.1% 4,061,074
VA vocational rehabilitation 6.7% 93.3% 4,052,731
VA burial and memorial benefits 6.3% 93.7% 4,053,689
VA disability compensation and pension 22.1% 77.9% 4,066,431
VA benefits for dependents and survivors 10.4% 89.6% 4,053,383
VA transition assistance 5.1% 94.9% 4,060,998
VA prescription benefits 15.1% 84.9% 4,050,648 SOURCE: 2010 National Survey of Veterans – Veteran Survey

2010 National Survey of Veterans - Appendix D - Detailed Tables
Veterans Survey Page D-129
VE-B2(3). Veterans searching for information in the past 12 months (B2) - for those who served on active duty May 1975 to July 1990
Yes No
Estimated Population
Responding to Item
Eligibility for VA health care 19.4% 80.6% 5,903,890
VA health care facility locations 17.0% 83.0% 5,886,679
VA life insurance 6.4% 93.6% 5,875,173
VA home loans 12.7% 87.3% 5,874,817
VA education and training 12.5% 87.5% 5,880,890
VA vocational rehabilitation 5.6% 94.4% 5,875,914
VA burial and memorial benefits 6.8% 93.2% 5,879,386
VA disability compensation and pension 14.5% 85.5% 5,897,430
VA benefits for dependents and survivors 8.7% 91.3% 5,877,864
VA transition assistance 3.3% 96.7% 5,871,960
VA prescription benefits 13.5% 86.5% 5,895,209 SOURCE: 2010 National Survey of Veterans – Veteran Survey

2010 National Survey of Veterans - Appendix D - Detailed Tables
Veterans Survey Page D-130
VE-B2(4). Veterans searching for information in the past 12 months (B2) - for those who served on active duty during the Vietnam era (August 1964 to April 1975)
Yes No
Estimated Population
Responding to Item
Eligibility for VA health care 21.7% 78.3% 7,205,253
VA health care facility locations 18.5% 81.5% 7,147,081
VA life insurance 3.3% 96.7% 7,145,495
VA home loans 5.1% 94.9% 7,135,547
VA education and training 2.8% 97.2% 7,120,370
VA vocational rehabilitation 2.0% 98.0% 7,119,685
VA burial and memorial benefits 6.8% 93.2% 7,147,903
VA disability compensation and pension 12.9% 87.1% 7,160,503
VA benefits for dependents and survivors 5.0% 95.0% 7,118,231
VA transition assistance 1.1% 98.9% 7,093,199
VA prescription benefits 17.0% 83.0% 7,165,020 SOURCE: 2010 National Survey of Veterans – Veteran Survey

2010 National Survey of Veterans - Appendix D - Detailed Tables
Veterans Survey Page D-131
VE-B2(5). Veterans searching for information in the past 12 months (B2) - for those who served on active duty February 1955 to July 1964
Yes No
Estimated Population
Responding to Item
Eligibility for VA health care 13.6% 86.4% 3,768,714
VA health care facility locations 11.9% 88.1% 3,750,853
VA life insurance 1.3% 98.7% 3,754,043
VA home loans 2.8% 97.2% 3,749,037
VA education and training 1.3% 98.7% 3,744,649
VA vocational rehabilitation 0.5% 99.5% 3,742,359
VA burial and memorial benefits 5.2% 94.8% 3,747,842
VA disability compensation and pension 5.0% 95.0% 3,746,388
VA benefits for dependents and survivors 2.6% 97.4% 3,742,048
VA transition assistance 0.7% 99.3% 3,728,235
VA prescription benefits 13.0% 87.0% 3,762,941 SOURCE: 2010 National Survey of Veterans – Veteran Survey

2010 National Survey of Veterans - Appendix D - Detailed Tables
Veterans Survey Page D-132
VE-B2(6). Veterans searching for information in the past 12 months (B2) - for those who served on active duty during the Korean War (July 1950 to January 1955)
Yes No
Estimated Population
Responding to Item
Eligibility for VA health care 16.0% 84.0% 2,332,465
VA health care facility locations 14.1% 85.9% 2,298,337
VA life insurance 3.5% 96.5% 2,297,800
VA home loans 2.1% 97.9% 2,302,890
VA education and training 1.2% 98.8% 2,294,585
VA vocational rehabilitation 0.5% 99.5% 2,284,723
VA burial and memorial benefits 5.9% 94.1% 2,304,905
VA disability compensation and pension 5.1% 94.9% 2,296,528
VA benefits for dependents and survivors 2.8% 97.2% 2,288,665
VA transition assistance 0.9% 99.1% 2,287,350
VA prescription benefits 15.3% 84.7% 2,309,345 SOURCE: 2010 National Survey of Veterans – Veteran Survey

2010 National Survey of Veterans - Appendix D - Detailed Tables
Veterans Survey Page D-133
VE-B2(7). Veterans searching for information in the past 12 months (B2) - for those who served on active duty January 1947 to June 1950
Yes No
Estimated Population
Responding to Item
Eligibility for VA health care 15.4% 84.6% 348,006
VA health care facility locations 10.0% 90.0% 323,579
VA life insurance 5.9% 94.1% 316,517
VA home loans 1.3% 98.7% 323,601
VA education and training 0.0% 100.0% 323,601
VA vocational rehabilitation 0.6% 99.4% 321,765
VA burial and memorial benefits 10.0% 90.0% 333,235
VA disability compensation and pension 8.6% 91.4% 327,573
VA benefits for dependents and survivors 4.1% 95.9% 321,765
VA transition assistance 1.1% 98.9% 322,063
VA prescription benefits 15.4% 84.6% 342,933 SOURCE: 2010 National Survey of Veterans – Veteran Survey

2010 National Survey of Veterans - Appendix D - Detailed Tables
Veterans Survey Page D-134
VE-B2(8). Veterans searching for information in the past 12 months (B2) - for those who served on active duty during World War II (December 1941 to December 1946)
Yes No
Estimated Population
Responding to Item
Eligibility for VA health care 17.1% 82.9% 1,778,196
VA health care facility locations 14.8% 85.2% 1,750,177
VA life insurance 4.9% 95.1% 1,725,431
VA home loans 1.9% 98.1% 1,720,822
VA education and training 1.8% 98.2% 1,721,060
VA vocational rehabilitation 0.6% 99.4% 1,701,943
VA burial and memorial benefits 10.8% 89.2% 1,741,479
VA disability compensation and pension 8.5% 91.5% 1,728,210
VA benefits for dependents and survivors 3.7% 96.3% 1,720,138
VA transition assistance 2.0% 98.0% 1,718,649
VA prescription benefits 18.5% 81.5% 1,777,909 SOURCE: 2010 National Survey of Veterans – Veteran Survey

2010 National Survey of Veterans - Appendix D - Detailed Tables
Veterans Survey Page D-135
VE-B2(9). Veterans searching for information in the past 12 months (B2) - for those who served on active duty November 1941 or earlier
Yes No
Estimated Population
Responding to Item
Eligibility for VA health care 16.3% 83.7% 81,033
VA health care facility locations 24.5% 75.5% 77,363
VA life insurance * * *
VA home loans 0.0% 100.0% 77,363
VA education and training 0.0% 100.0% 77,363
VA vocational rehabilitation * * *
VA burial and memorial benefits * * *
VA disability compensation and pension 16.4% 83.6% 77,363
VA benefits for dependents and survivors * * *
VA transition assistance * * *
VA prescription benefits * * * SOURCE: 2010 National Survey of Veterans – Veteran Survey * Data were suppressed because fewer than 30 respondents answered this survey item.
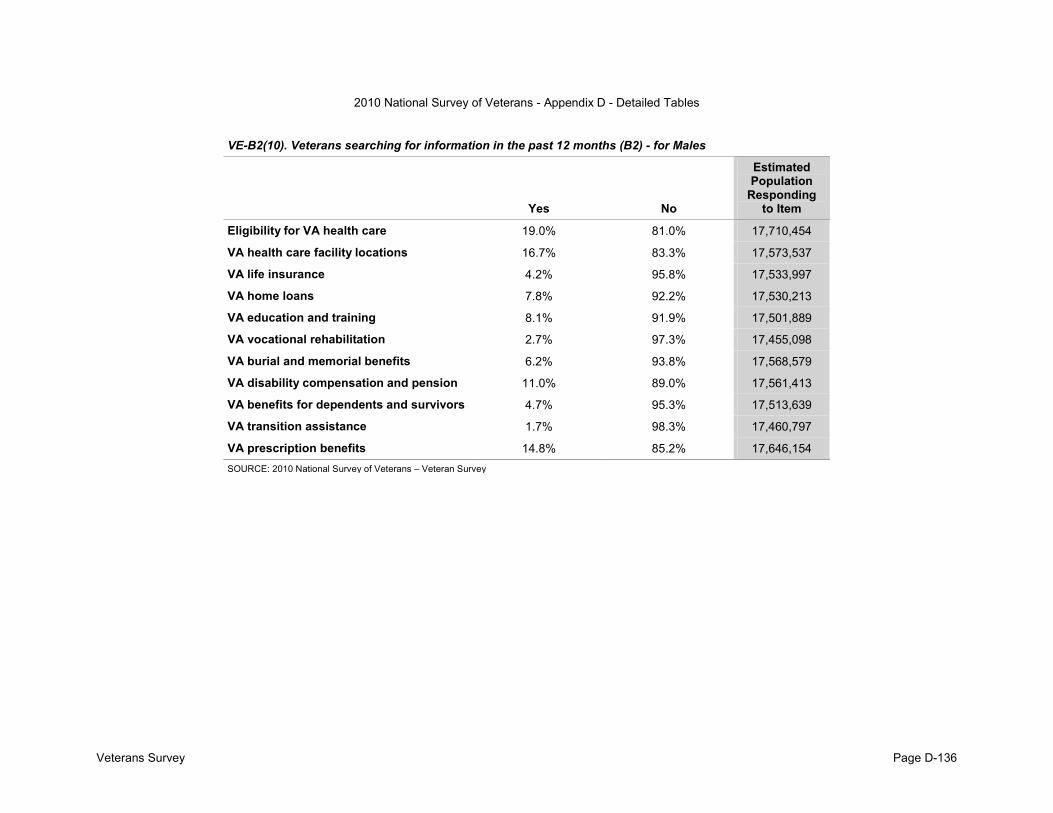
2010 National Survey of Veterans - Appendix D - Detailed Tables
Veterans Survey Page D-136
VE-B2(10). Veterans searching for information in the past 12 months (B2) - for Males
Yes No
Estimated Population
Responding to Item
Eligibility for VA health care 19.0% 81.0% 17,710,454
VA health care facility locations 16.7% 83.3% 17,573,537
VA life insurance 4.2% 95.8% 17,533,997
VA home loans 7.8% 92.2% 17,530,213
VA education and training 8.1% 91.9% 17,501,889
VA vocational rehabilitation 2.7% 97.3% 17,455,098
VA burial and memorial benefits 6.2% 93.8% 17,568,579
VA disability compensation and pension 11.0% 89.0% 17,561,413
VA benefits for dependents and survivors 4.7% 95.3% 17,513,639
VA transition assistance 1.7% 98.3% 17,460,797
VA prescription benefits 14.8% 85.2% 17,646,154 SOURCE: 2010 National Survey of Veterans – Veteran Survey

2010 National Survey of Veterans - Appendix D - Detailed Tables
Veterans Survey Page D-137
VE-B2(11). Veterans searching for information in the past 12 months (B2) - for Females
Yes No
Estimated Population
Responding to Item
Eligibility for VA health care 22.2% 77.8% 1,561,559
VA health care facility locations 20.0% 80.0% 1,549,557
VA life insurance 5.9% 94.1% 1,558,010
VA home loans 19.4% 80.6% 1,551,974
VA education and training 24.6% 75.4% 1,554,911
VA vocational rehabilitation 7.3% 92.7% 1,550,613
VA burial and memorial benefits 6.2% 93.8% 1,551,257
VA disability compensation and pension 16.4% 83.6% 1,555,009
VA benefits for dependents and survivors 7.9% 92.1% 1,554,484
VA transition assistance 3.8% 96.2% 1,550,613
VA prescription benefits 15.0% 85.0% 1,551,101 SOURCE: 2010 National Survey of Veterans – Veteran Survey

2010 National Survey of Veterans - Appendix D - Detailed Tables
Veterans Survey Page D-138
VE-B2(12). Veterans searching for information in the past 12 months (B2) - for responders under age 31
Yes No
Estimated Population
Responding to Item
Eligibility for VA health care 38.4% 61.6% 1,130,519
VA health care facility locations 40.7% 59.3% 1,142,132
VA life insurance 10.9% 89.1% 1,140,430
VA home loans 32.8% 67.2% 1,141,202
VA education and training 66.0% 34.0% 1,142,132
VA vocational rehabilitation 11.1% 88.9% 1,130,678
VA burial and memorial benefits 7.0% 93.0% 1,141,202
VA disability compensation and pension 27.4% 72.6% 1,132,715
VA benefits for dependents and survivors 12.1% 87.9% 1,140,708
VA transition assistance 6.7% 93.3% 1,141,639
VA prescription benefits 15.7% 84.3% 1,140,708 SOURCE: 2010 National Survey of Veterans – Veteran Survey

2010 National Survey of Veterans - Appendix D - Detailed Tables
Veterans Survey Page D-139
VE-B2(13). Veterans searching for information in the past 12 months (B2) - for responders age 31 and older
Yes No
Estimated Population
Responding to Item
Eligibility for VA health care 18.6% 81.4% 20,186,612
VA health care facility locations 16.2% 83.8% 20,019,763
VA life insurance 4.1% 95.9% 19,981,591
VA home loans 7.6% 92.4% 19,958,769
VA education and training 7.0% 93.0% 19,950,435
VA vocational rehabilitation 2.7% 97.3% 19,909,525
VA burial and memorial benefits 6.2% 93.8% 20,008,352
VA disability compensation and pension 11.1% 88.9% 20,017,641
VA benefits for dependents and survivors 4.9% 95.1% 19,949,459
VA transition assistance 2.0% 98.0% 19,897,084
VA prescription benefits 14.7% 85.3% 20,081,402 SOURCE: 2010 National Survey of Veterans – Veteran Survey

2010 National Survey of Veterans - Appendix D - Detailed Tables
Veterans Survey Page D-140
VE-B2(14). Veterans searching for information in the past 12 months (B2) - for non-Hispanics
Yes No
Estimated Population
Responding to Item
Eligibility for VA health care 19.3% 80.7% 19,093,912
VA health care facility locations 17.2% 82.8% 18,983,974
VA life insurance 4.2% 95.8% 18,955,323
VA home loans 8.4% 91.6% 18,921,544
VA education and training 10.0% 90.0% 18,926,509
VA vocational rehabilitation 3.1% 96.9% 18,893,105
VA burial and memorial benefits 6.0% 94.0% 18,953,586
VA disability compensation and pension 11.6% 88.4% 18,961,454
VA benefits for dependents and survivors 5.1% 94.9% 18,922,320
VA transition assistance 2.0% 98.0% 18,890,706
VA prescription benefits 14.2% 85.8% 19,012,603 SOURCE: 2010 National Survey of Veterans – Veteran Survey

2010 National Survey of Veterans - Appendix D - Detailed Tables
Veterans Survey Page D-141
VE-B2(15). Veterans searching for information in the past 12 months (B2) - for Hispanics
Yes No
Estimated Population
Responding to Item
Eligibility for VA health care 24.7% 75.3% 1,025,733
VA health care facility locations 24.4% 75.6% 1,016,085
VA life insurance 6.3% 93.7% 1,001,530
VA home loans 20.1% 79.9% 1,013,359
VA education and training 19.6% 80.4% 1,013,359
VA vocational rehabilitation 5.8% 94.2% 1,003,041
VA burial and memorial benefits 5.4% 94.6% 1,016,356
VA disability compensation and pension 15.9% 84.1% 1,013,359
VA benefits for dependents and survivors 7.8% 92.2% 1,011,639
VA transition assistance 4.3% 95.7% 1,011,190
VA prescription benefits 18.4% 81.6% 1,013,281 SOURCE: 2010 National Survey of Veterans – Veteran Survey

2010 National Survey of Veterans - Appendix D - Detailed Tables
Veterans Survey Page D-142
VE-B2(16). Veterans searching for information in the past 12 months (B2) - for respondents who are White
Yes No
Estimated Population
Responding to Item
Eligibility for VA health care 17.4% 82.6% 17,817,133
VA health care facility locations 15.4% 84.6% 17,684,656
VA life insurance 3.4% 96.6% 17,647,897
VA home loans 7.0% 93.0% 17,621,457
VA education and training 8.1% 91.9% 17,628,575
VA vocational rehabilitation 2.0% 98.0% 17,580,800
VA burial and memorial benefits 5.5% 94.5% 17,672,919
VA disability compensation and pension 9.7% 90.3% 17,673,912
VA benefits for dependents and survivors 4.1% 95.9% 17,625,508
VA transition assistance 1.7% 98.3% 17,583,786
VA prescription benefits 13.5% 86.5% 17,721,039 SOURCE: 2010 National Survey of Veterans – Veteran Survey

2010 National Survey of Veterans - Appendix D - Detailed Tables
Veterans Survey Page D-143
VE-B2(17). Veterans searching for information in the past 12 months (B2) - for respondents who are Black/African American
Yes No
Estimated Population
Responding to Item
Eligibility for VA health care 33.9% 66.1% 2,347,235
VA health care facility locations 29.8% 70.2% 2,334,685
VA life insurance 12.2% 87.8% 2,344,281
VA home loans 20.5% 79.5% 2,347,142
VA education and training 24.1% 75.9% 2,331,181
VA vocational rehabilitation 11.3% 88.7% 2,337,300
VA burial and memorial benefits 10.5% 89.5% 2,346,266
VA disability compensation and pension 27.0% 73.0% 2,345,785
VA benefits for dependents and survivors 11.1% 88.9% 2,335,784
VA transition assistance 6.5% 93.5% 2,330,010
VA prescription benefits 24.0% 76.0% 2,369,798 SOURCE: 2010 National Survey of Veterans – Veteran Survey

2010 National Survey of Veterans - Appendix D - Detailed Tables
Veterans Survey Page D-144
VE-B2(18). Veterans searching for information in the past 12 months (B2) - for respondents who are Asian
Yes No
Estimated Population
Responding to Item
Eligibility for VA health care 26.4% 73.6% 142,467
VA health care facility locations 29.1% 70.9% 142,467
VA life insurance 5.1% 94.9% 140,939
VA home loans 10.7% 89.3% 142,467
VA education and training 7.2% 92.8% 142,467
VA vocational rehabilitation 6.8% 93.2% 135,850
VA burial and memorial benefits 4.9% 95.1% 142,467
VA disability compensation and pension 21.9% 78.1% 133,354
VA benefits for dependents and survivors 12.6% 87.4% 139,971
VA transition assistance 0.0% 100.0% 139,971
VA prescription benefits 15.6% 84.4% 139,971 SOURCE: 2010 National Survey of Veterans – Veteran Survey
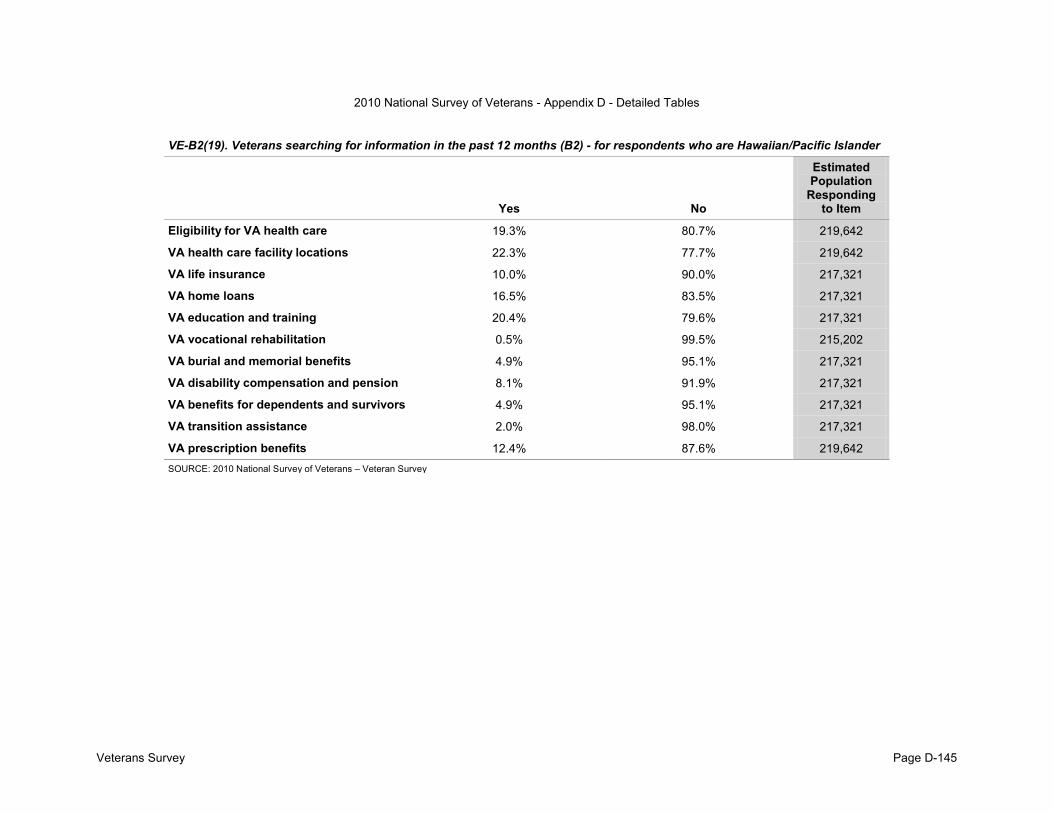
2010 National Survey of Veterans - Appendix D - Detailed Tables
Veterans Survey Page D-145
VE-B2(19). Veterans searching for information in the past 12 months (B2) - for respondents who are Hawaiian/Pacific Islander
Yes No
Estimated Population
Responding to Item
Eligibility for VA health care 19.3% 80.7% 219,642
VA health care facility locations 22.3% 77.7% 219,642
VA life insurance 10.0% 90.0% 217,321
VA home loans 16.5% 83.5% 217,321
VA education and training 20.4% 79.6% 217,321
VA vocational rehabilitation 0.5% 99.5% 215,202
VA burial and memorial benefits 4.9% 95.1% 217,321
VA disability compensation and pension 8.1% 91.9% 217,321
VA benefits for dependents and survivors 4.9% 95.1% 217,321
VA transition assistance 2.0% 98.0% 217,321
VA prescription benefits 12.4% 87.6% 219,642 SOURCE: 2010 National Survey of Veterans – Veteran Survey
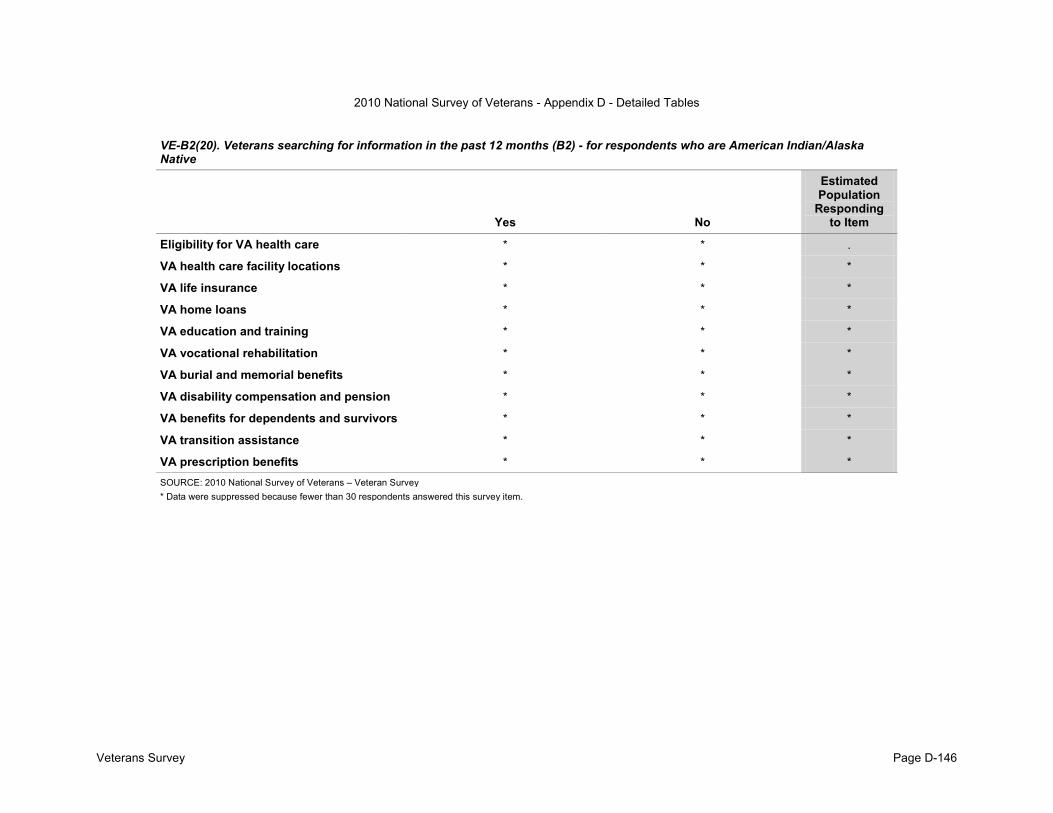
2010 National Survey of Veterans - Appendix D - Detailed Tables
Veterans Survey Page D-146
VE-B2(20). Veterans searching for information in the past 12 months (B2) - for respondents who are American Indian/Alaska Native
Yes No
Estimated Population
Responding to Item
Eligibility for VA health care * * .
VA health care facility locations * * *
VA life insurance * * *
VA home loans * * *
VA education and training * * *
VA vocational rehabilitation * * *
VA burial and memorial benefits * * *
VA disability compensation and pension * * *
VA benefits for dependents and survivors * * *
VA transition assistance * * *
VA prescription benefits * * * SOURCE: 2010 National Survey of Veterans – Veteran Survey * Data were suppressed because fewer than 30 respondents answered this survey item.

2010 National Survey of Veterans - Appendix D - Detailed Tables
Veterans Survey Page D-147
VE-B2(21). Veterans searching for information in the past 12 months (B2) - for respondents who are multiracial
Yes No
Estimated Population
Responding to Item
Eligibility for VA health care 29.3% 70.7% 475,529
VA health care facility locations 28.6% 71.4% 468,319
VA life insurance 4.4% 95.6% 462,564
VA home loans 20.1% 79.9% 462,564
VA education and training 15.6% 84.4% 463,495
VA vocational rehabilitation 7.3% 92.7% 462,564
VA burial and memorial benefits 10.6% 89.4% 462,564
VA disability compensation and pension 18.5% 81.5% 467,266
VA benefits for dependents and survivors 12.8% 87.2% 462,564
VA transition assistance 2.0% 98.0% 463,495
VA prescription benefits 18.4% 81.6% 467,266 SOURCE: 2010 National Survey of Veterans – Veteran Survey

2010 National Survey of Veterans - Appendix D - Detailed Tables
Veterans Survey Page D-148
VE-I1a(1). Best way for VA to communicate VGLI program changes (I1a) - for those who served on active duty September 2001 or later
Estimated Population Responding to Item 241,542
Email 39.5%
Direct mailings 52.5%
Veterans Affairs (VA) insurance web site (www.insurance.VA.gov) 7.0%
Other 1.0% SOURCE: 2010 National Survey of Veterans – Veteran Survey
VE-I1a(2). Best way for VA to communicate VGLI program changes (I1a) - for those who served on active duty August 1990 to August 2001
Estimated Population Responding to Item 401,661
Email 24.6%
Direct mailings 70.9%
Veterans Affairs (VA) insurance web site (www.insurance.VA.gov) 3.9%
Other 0.6% SOURCE: 2010 National Survey of Veterans – Veteran Survey
VE-I1a(3). Best way for VA to communicate VGLI program changes (I1a) - for those who served on active duty May 1975 to July 1990
Estimated Population Responding to Item 384,923
Email 23.5%
Direct mailings 72.4%
Veterans Affairs (VA) insurance web site (www.insurance.VA.gov) 2.2%
Other 1.9% SOURCE: 2010 National Survey of Veterans – Veteran Survey

2010 National Survey of Veterans - Appendix D - Detailed Tables
Veterans Survey Page D-149
VE-I1a(4). Best way for VA to communicate VGLI program changes (I1a) - for those who served on active duty during the Vietnam era (August 1964 to April 1975)
Estimated Population Responding to Item 203,188
Email 18.8%
Direct mailings 74.0%
Veterans Affairs (VA) insurance web site (www.insurance.VA.gov) 3.0%
Other 4.3% SOURCE: 2010 National Survey of Veterans – Veteran Survey
VE-I1a(5). Best way for VA to communicate VGLI program changes (I1a) - for those who served on active duty February 1955 to July 1964
Estimated Population Responding to Item 99,668
Email 11.1%
Direct mailings 88.9%
Veterans Affairs (VA) insurance web site (www.insurance.VA.gov) 0.0%
Other 0.0% SOURCE: 2010 National Survey of Veterans – Veteran Survey
VE-I1a(6). Best way for VA to communicate VGLI program changes (I1a) - for those who served on active duty during the Korean War (July 1950 to January 1955)
Estimated Population Responding to Item 314,144
Email 1.7%
Direct mailings 90.7%
Veterans Affairs (VA) insurance web site (www.insurance.VA.gov) 2.6%
Other 4.9% SOURCE: 2010 National Survey of Veterans – Veteran Survey

2010 National Survey of Veterans - Appendix D - Detailed Tables
Veterans Survey Page D-150
VE-I1a(7). Best way for VA to communicate VGLI program changes (I1a) - for those who served on active duty January 1947 to June 1950
Estimated Population Responding to Item 72,967
Email 4.0%
Direct mailings 89.7%
Veterans Affairs (VA) insurance web site (www.insurance.VA.gov) 1.2%
Other 5.1% SOURCE: 2010 National Survey of Veterans – Veteran Survey
VE-I1a(8). Best way for VA to communicate VGLI program changes (I1a) - for those who served on active duty during World War II (December 1941 to December 1946)
Estimated Population Responding to Item 321,789
Email 2.5%
Direct mailings 92.6%
Veterans Affairs (VA) insurance web site (www.insurance.VA.gov) 2.9%
Other 2.0% SOURCE: 2010 National Survey of Veterans – Veteran Survey
VE-I1a(9). Best way for VA to communicate VGLI program changes (I1a) - for those who served on active duty November 1941 or earlier
Estimated Population Responding to Item *
SOURCE: 2010 National Survey of Veterans – Veteran Survey * Data were suppressed because fewer than 30 respondents answered this survey item.

2010 National Survey of Veterans - Appendix D - Detailed Tables
Veterans Survey Page D-151
VE-I1a(10). Best way for VA to communicate VGLI program changes (I1a) - for Males
Estimated Population Responding to Item 1,095,301
Email 8.3%
Direct mailings 86.0%
Veterans Affairs (VA) insurance web site (www.insurance.VA.gov) 3.4%
Other 2.3% SOURCE: 2010 National Survey of Veterans – Veteran Survey
VE-I1a(11). Best way for VA to communicate VGLI program changes (I1a) - for Females
Estimated Population Responding to Item 87,076
Email 12.5%
Direct mailings 85.9%
Veterans Affairs (VA) insurance web site (www.insurance.VA.gov) 1.6%
Other 0.0% SOURCE: 2010 National Survey of Veterans – Veteran Survey
VE-I1a(12). Best way for VA to communicate VGLI program changes (I1a) - for responders under age 31
Estimated Population Responding to Item *
SOURCE: 2010 National Survey of Veterans – Veteran Survey * Data were suppressed because fewer than 30 respondents answered this survey item.

2010 National Survey of Veterans - Appendix D - Detailed Tables
Veterans Survey Page D-152
VE-I1a(13). Best way for VA to communicate VGLI program changes (I1a) - for responders age 31 and older
Estimated Population Responding to Item 1,270,149
Email 12.3%
Direct mailings 82.4%
Veterans Affairs (VA) insurance web site (www.insurance.VA.gov) 3.1%
Other 2.2% SOURCE: 2010 National Survey of Veterans – Veteran Survey
VE-I1a(14). Best way for VA to communicate VGLI program changes (I1a) - for non-Hispanics
Estimated Population Responding to Item 1,194,003
Email 13.9%
Direct mailings 82.2%
Veterans Affairs (VA) insurance web site (www.insurance.VA.gov) 2.4%
Other 1.5% SOURCE: 2010 National Survey of Veterans – Veteran Survey
VE-I1a(15). Best way for VA to communicate VGLI program changes (I1a) - for Hispanics
Estimated Population Responding to Item *
SOURCE: 2010 National Survey of Veterans – Veteran Survey * Data were suppressed because fewer than 30 respondents answered this survey item.

2010 National Survey of Veterans - Appendix D - Detailed Tables
Veterans Survey Page D-153
VE-I1a(16). Best way for VA to communicate VGLI program changes (I1a) - for respondents who are White
Estimated Population Responding to Item 1,105,416
Email 13.0%
Direct mailings 82.1%
Veterans Affairs (VA) insurance web site (www.insurance.VA.gov) 3.0%
Other 1.9% SOURCE: 2010 National Survey of Veterans – Veteran Survey
VE-I1a(17). Best way for VA to communicate VGLI program changes (I1a) - for respondents who are Black/African American
Estimated Population Responding to Item 142,827
Email 23.9%
Direct mailings 72.5%
Veterans Affairs (VA) insurance web site (www.insurance.VA.gov) 0.3%
Other 3.3% SOURCE: 2010 National Survey of Veterans – Veteran Survey
VE-I1a(18). Best way for VA to communicate VGLI program changes (I1a) - for respondents who are Asian
Estimated Population Responding to Item *
SOURCE: 2010 National Survey of Veterans – Veteran Survey * Data were suppressed because fewer than 30 respondents answered this survey item.

2010 National Survey of Veterans - Appendix D - Detailed Tables
Veterans Survey Page D-154
VE-I1a(19). Best way for VA to communicate VGLI program changes (I1a) - for respondents who are Hawaiian/Pacific Islander
Estimated Population Responding to Item *
SOURCE: 2010 National Survey of Veterans – Veteran Survey * Data were suppressed because fewer than 30 respondents answered this survey item.
VE-I1a(20). Best way for VA to communicate VGLI program changes (I1a) - for respondents who are American Indian/Alaska Native
Estimated Population Responding to Item *
SOURCE: 2010 National Survey of Veterans – Veteran Survey * Data were suppressed because fewer than 30 respondents answered this survey item.
VE-I1a(21). Best way for VA to communicate VGLI program changes (I1a) - for respondents who are multiracial
Estimated Population Responding to Item *
SOURCE: 2010 National Survey of Veterans – Veteran Survey * Data were suppressed because fewer than 30 respondents answered this survey item.

2010 National Survey of Veterans - Appendix D - Detailed Tables
Veterans Survey Page D-155
VE-M5(1). Willingness to use the Internet for the following activities: (M5) - for those who served on active duty September 2001 or later
Very
willing Somewhat
willing
Neither willing
nor unwilling
Somewhat unwilling
Very unwilling
Estimated Population
Responding to Item
Obtaining news and information 72.0% 21.4% 3.5% 1.8% 1.2% 2,497,057
Carrying out research on services 73.8% 19.4% 4.2% 1.5% 1.1% 2,486,573
Purchasing goods or services 55.8% 27.3% 8.1% 6.1% 2.7% 2,493,607
Responding to polls or surveys 41.1% 22.6% 17.5% 9.5% 9.2% 2,462,537
Obtain information about VA benefits 62.3% 27.2% 6.5% 2.7% 1.3% 2,492,913
Apply for VA benefits 61.8% 27.2% 6.5% 1.1% 3.4% 2,484,748 SOURCE: 2010 National Survey of Veterans – Veteran Survey
VE-M5(2). Willingness to use the Internet for the following activities: (M5) - for those who served on active duty August 1990 to August 2001
Very
willing Somewhat
willing
Neither willing
nor unwilling
Somewhat unwilling
Very unwilling
Estimated Population
Responding to Item
Obtaining news and information 72.9% 19.3% 3.5% 1.5% 2.8% 4,025,040
Carrying out research on services 73.5% 18.9% 4.4% 0.8% 2.3% 3,995,850
Purchasing goods or services 57.6% 24.1% 7.4% 5.9% 5.0% 3,988,989
Responding to polls or surveys 36.2% 24.4% 16.0% 11.0% 12.4% 3,991,548
Obtain information about VA benefits 60.3% 25.7% 8.4% 2.5% 3.2% 4,000,495
Apply for VA benefits 58.6% 25.4% 9.2% 2.7% 4.0% 4,000,584 SOURCE: 2010 National Survey of Veterans – Veteran Survey

2010 National Survey of Veterans - Appendix D - Detailed Tables
Veterans Survey Page D-156
VE-M5(3). Willingness to use the Internet for the following activities: (M5) - for those who served on active duty May 1975 to July 1990
Very
willing Somewhat
willing
Neither willing
nor unwilling
Somewhat unwilling
Very unwilling
Estimated Population
Responding to Item
Obtaining news and information 64.5% 22.4% 5.4% 2.9% 4.8% 5,814,258
Carrying out research on services 64.4% 21.9% 6.9% 2.2% 4.7% 5,809,369
Purchasing goods or services 45.8% 28.4% 10.8% 7.0% 8.1% 5,779,046
Responding to polls or surveys 29.6% 23.6% 19.0% 11.6% 16.3% 5,792,009
Obtain information about VA benefits 52.9% 28.1% 11.6% 2.1% 5.3% 5,805,488
Apply for VA benefits 51.7% 26.9% 12.3% 2.6% 6.5% 5,791,460 SOURCE: 2010 National Survey of Veterans – Veteran Survey
VE-M5(4). Willingness to use the Internet for the following activities: (M5) - for those who served on active duty during the Vietnam era (August 1964 to April 1975)
Very
willing Somewhat
willing
Neither willing
nor unwilling
Somewhat unwilling
Very unwilling
Estimated Population
Responding to Item
Obtaining news and information 50.2% 24.5% 10.6% 4.1% 10.6% 6,837,118
Carrying out research on services 50.7% 24.0% 10.5% 4.5% 10.4% 6,776,872
Purchasing goods or services 35.1% 27.6% 13.4% 8.0% 15.9% 6,759,515
Responding to polls or surveys 21.8% 22.6% 19.4% 12.0% 24.2% 6,735,859
Obtain information about VA benefits 40.5% 29.4% 14.9% 4.6% 10.6% 6,810,722
Apply for VA benefits 39.4% 26.8% 16.2% 5.2% 12.3% 6,763,248 SOURCE: 2010 National Survey of Veterans – Veteran Survey

2010 National Survey of Veterans - Appendix D - Detailed Tables
Veterans Survey Page D-157
VE-M5(5). Willingness to use the Internet for the following activities: (M5) - for those who served on active duty February 1955 to July 1964
Very
willing Somewhat
willing
Neither willing
nor unwilling
Somewhat unwilling
Very unwilling
Estimated Population
Responding to Item
Obtaining news and information 39.5% 25.2% 11.7% 4.7% 19.0% 3,432,693
Carrying out research on services 40.9% 23.7% 11.6% 5.1% 18.6% 3,376,213
Purchasing goods or services 27.6% 26.5% 12.0% 8.5% 25.4% 3,347,700
Responding to polls or surveys 14.6% 21.2% 18.3% 13.7% 32.2% 3,345,113
Obtain information about VA benefits 28.8% 29.1% 16.1% 6.4% 19.6% 3,389,307
Apply for VA benefits 26.5% 25.6% 19.1% 6.3% 22.5% 3,348,635 SOURCE: 2010 National Survey of Veterans – Veteran Survey
VE-M5(6). Willingness to use the Internet for the following activities: (M5) - for those who served on active duty during the Korean War (July 1950 to January 1955)
Very
willing Somewhat
willing
Neither willing
nor unwilling
Somewhat unwilling
Very unwilling
Estimated Population
Responding to Item
Obtaining news and information 30.3% 20.6% 14.4% 5.3% 29.4% 1,969,493
Carrying out research on services 26.8% 20.0% 17.1% 6.1% 30.0% 1,875,901
Purchasing goods or services 17.5% 22.2% 16.7% 7.9% 35.6% 1,907,939
Responding to polls or surveys 8.7% 15.3% 22.9% 10.2% 43.0% 1,876,866
Obtain information about VA benefits 22.2% 23.5% 18.5% 6.6% 29.3% 1,924,151
Apply for VA benefits 18.9% 21.1% 20.6% 7.4% 32.0% 1,903,521 SOURCE: 2010 National Survey of Veterans – Veteran Survey
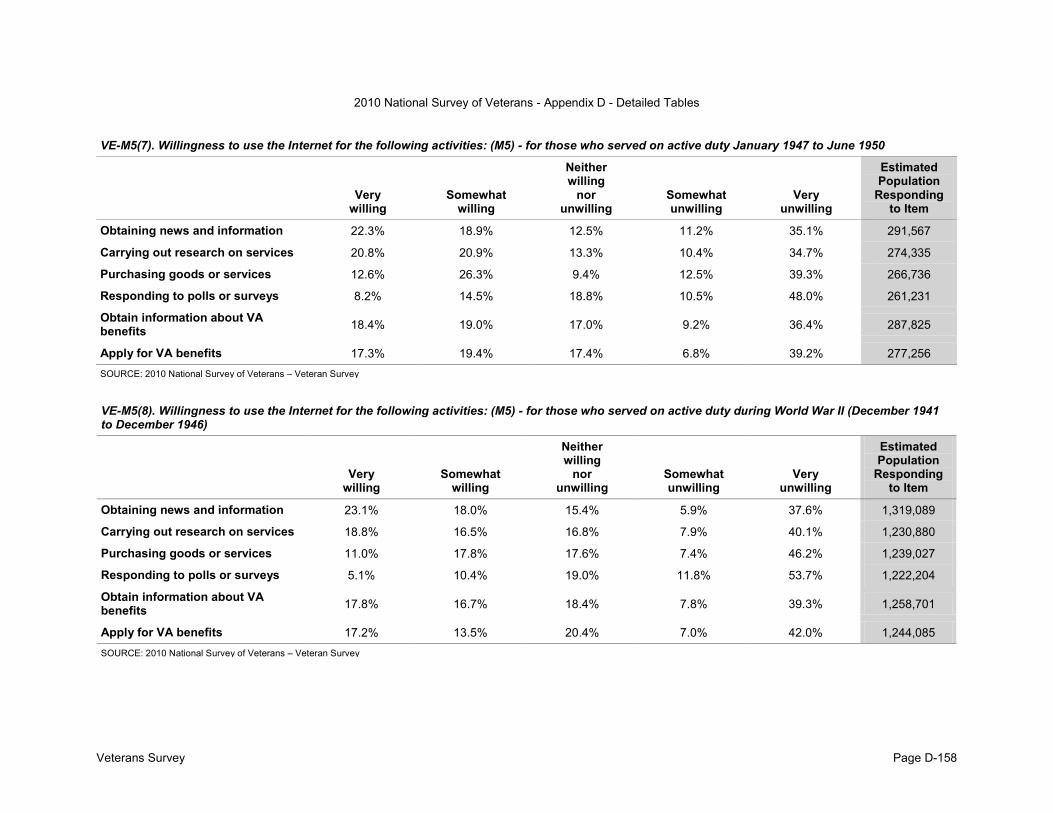
2010 National Survey of Veterans - Appendix D - Detailed Tables
Veterans Survey Page D-158
VE-M5(7). Willingness to use the Internet for the following activities: (M5) - for those who served on active duty January 1947 to June 1950
Very
willing Somewhat
willing
Neither willing
nor unwilling
Somewhat unwilling
Very unwilling
Estimated Population
Responding to Item
Obtaining news and information 22.3% 18.9% 12.5% 11.2% 35.1% 291,567
Carrying out research on services 20.8% 20.9% 13.3% 10.4% 34.7% 274,335
Purchasing goods or services 12.6% 26.3% 9.4% 12.5% 39.3% 266,736
Responding to polls or surveys 8.2% 14.5% 18.8% 10.5% 48.0% 261,231
Obtain information about VA benefits 18.4% 19.0% 17.0% 9.2% 36.4% 287,825
Apply for VA benefits 17.3% 19.4% 17.4% 6.8% 39.2% 277,256 SOURCE: 2010 National Survey of Veterans – Veteran Survey
VE-M5(8). Willingness to use the Internet for the following activities: (M5) - for those who served on active duty during World War II (December 1941 to December 1946)
Very
willing Somewhat
willing
Neither willing
nor unwilling
Somewhat unwilling
Very unwilling
Estimated Population
Responding to Item
Obtaining news and information 23.1% 18.0% 15.4% 5.9% 37.6% 1,319,089
Carrying out research on services 18.8% 16.5% 16.8% 7.9% 40.1% 1,230,880
Purchasing goods or services 11.0% 17.8% 17.6% 7.4% 46.2% 1,239,027
Responding to polls or surveys 5.1% 10.4% 19.0% 11.8% 53.7% 1,222,204
Obtain information about VA benefits 17.8% 16.7% 18.4% 7.8% 39.3% 1,258,701
Apply for VA benefits 17.2% 13.5% 20.4% 7.0% 42.0% 1,244,085 SOURCE: 2010 National Survey of Veterans – Veteran Survey

2010 National Survey of Veterans - Appendix D - Detailed Tables
Veterans Survey Page D-159
VE-M5(9). Willingness to use the Internet for the following activities: (M5) - burial benefits (K1) - for those who served on active duty during the Korean War (July 1950 to January 1955)
Very
willing Somewhat
willing
Neither willing
nor unwilling
Somewhat unwilling
Very unwilling
Estimated Population
Responding to Item
Obtaining news and information * * * * * .
Carrying out research on services * * * * * *
Purchasing goods or services * * * * * *
Responding to polls or surveys * * * * * *
Obtain information about VA benefits * * * * * *
Apply for VA benefits * * * * * * SOURCE: 2010 National Survey of Veterans – Veteran Survey * Data were suppressed because fewer than 30 respondents answered this survey item.
VE-M5(10). Willingness to use the Internet for the following activities: (M5) - for Males
Very
willing Somewhat
willing
Neither willing
nor unwilling
Somewhat unwilling
Very unwilling
Estimated Population
Responding to Item
Obtaining news and information 46.2% 23.8% 10.5% 4.3% 15.2% 16,326,465
Carrying out research on services 46.6% 23.0% 10.8% 4.7% 14.9% 16,064,506
Purchasing goods or services 31.9% 25.8% 13.4% 8.5% 20.3% 16,029,172
Responding to polls or surveys 18.5% 19.7% 20.0% 13.2% 28.7% 15,963,986
Obtain information about VA benefits 36.4% 28.0% 15.1% 5.1% 15.3% 16,149,496
Apply for VA benefits 35.3% 25.6% 16.5% 5.3% 17.4% 16,046,864 SOURCE: 2010 National Survey of Veterans – Veteran Survey

2010 National Survey of Veterans - Appendix D - Detailed Tables
Veterans Survey Page D-160
VE-M5(11). Willingness to use the Internet for the following activities: (M5) - for Females
Very
willing Somewhat
willing
Neither willing
nor unwilling
Somewhat unwilling
Very unwilling
Estimated Population
Responding to Item
Obtaining news and information 66.4% 20.9% 6.4% 2.4% 3.9% 1,495,962
Carrying out research on services 66.7% 18.2% 9.2% 1.5% 4.4% 1,468,966
Purchasing goods or services 47.0% 28.4% 9.3% 7.6% 7.7% 1,478,693
Responding to polls or surveys 31.0% 25.4% 19.2% 9.2% 15.2% 1,477,865
Obtain information about VA benefits 57.5% 24.0% 10.3% 3.2% 4.9% 1,490,917
Apply for VA benefits 54.7% 26.6% 9.4% 2.8% 6.5% 1,483,074 SOURCE: 2010 National Survey of Veterans – Veteran Survey
VE-M5(12). Willingness to use the Internet for the following activities: (M5) - for responders under age 31
Very
willing Somewhat
willing
Neither willing
nor unwilling
Somewhat unwilling
Very unwilling
Estimated Population
Responding to Item
Obtaining news and information 66.6% 26.2% 5.6% 1.4% 0.2% 1,133,049
Carrying out research on services 72.5% 21.1% 4.5% 1.8% 0.2% 1,131,698
Purchasing goods or services 51.9% 29.6% 9.4% 8.4% 0.7% 1,132,509
Responding to polls or surveys 39.3% 26.3% 18.9% 10.8% 4.8% 1,117,687
Obtain information about VA benefits 58.3% 30.6% 6.3% 4.6% 0.2% 1,133,049
Apply for VA benefits 60.1% 30.8% 5.2% 0.8% 3.1% 1,130,122 SOURCE: 2010 National Survey of Veterans – Veteran Survey

2010 National Survey of Veterans - Appendix D - Detailed Tables
Veterans Survey Page D-161
VE-M5(13). Willingness to use the Internet for the following activities: (M5) - for responders age 31 and older
Very
willing Somewhat
willing
Neither willing
nor unwilling
Somewhat unwilling
Very unwilling
Estimated Population
Responding to Item
Obtaining news and information 50.6% 22.4% 9.5% 3.9% 13.6% 18,769,661
Carrying out research on services 50.6% 21.8% 10.0% 4.2% 13.4% 18,479,800
Purchasing goods or services 36.1% 25.6% 12.3% 7.6% 18.4% 18,448,190
Responding to polls or surveys 22.5% 20.8% 18.7% 11.9% 26.2% 18,387,414
Obtain information about VA benefits 40.8% 26.9% 14.1% 4.5% 13.8% 18,590,576
Apply for VA benefits 39.6% 24.6% 15.5% 4.8% 15.5% 18,468,439 SOURCE: 2010 National Survey of Veterans – Veteran Survey
VE-M5(14). Willingness to use the Internet for the following activities: (M5) - for non-Hispanics
Very
willing Somewhat
willing
Neither willing
nor unwilling
Somewhat unwilling
Very unwilling
Estimated Population
Responding to Item
Obtaining news and information 51.9% 22.5% 9.2% 3.7% 12.6% 18,085,670
Carrying out research on services 52.5% 21.6% 9.7% 3.9% 12.4% 17,850,848
Purchasing goods or services 37.3% 25.8% 12.2% 7.5% 17.2% 17,837,400
Responding to polls or surveys 23.5% 20.9% 19.1% 11.7% 24.7% 17,767,716
Obtain information about VA benefits 42.0% 27.0% 14.0% 4.4% 12.7% 17,955,735
Apply for VA benefits 40.6% 25.3% 15.1% 4.5% 14.6% 17,849,366 SOURCE: 2010 National Survey of Veterans – Veteran Survey

2010 National Survey of Veterans - Appendix D - Detailed Tables
Veterans Survey Page D-162
VE-M5(15). Willingness to use the Internet for the following activities: (M5) - for Hispanics
Very
willing Somewhat
willing
Neither willing
nor unwilling
Somewhat unwilling
Very unwilling
Estimated Population
Responding to Item
Obtaining news and information 57.7% 21.5% 6.3% 3.3% 11.1% 966,188
Carrying out research on services 57.8% 20.5% 5.9% 3.4% 12.4% 955,626
Purchasing goods or services 40.6% 27.9% 8.5% 9.0% 14.0% 940,797
Responding to polls or surveys 31.4% 19.3% 13.7% 12.3% 23.3% 944,350
Obtain information about VA benefits 51.1% 23.3% 9.4% 4.2% 12.0% 945,027
Apply for VA benefits 51.3% 21.9% 11.0% 3.9% 11.9% 941,192 SOURCE: 2010 National Survey of Veterans – Veteran Survey
VE-M5(16). Willingness to use the Internet for the following activities: (M5) - for respondents who are White
Very
willing Somewhat
willing
Neither willing
nor unwilling
Somewhat unwilling
Very unwilling
Estimated Population
Responding to Item
Obtaining news and information 51.0% 21.9% 9.6% 3.7% 13.8% 16,557,512
Carrying out research on services 51.5% 20.9% 10.0% 3.9% 13.7% 16,318,018
Purchasing goods or services 37.5% 25.1% 12.0% 7.1% 18.3% 16,303,127
Responding to polls or surveys 22.6% 20.5% 18.4% 11.9% 26.6% 16,214,582
Obtain information about VA benefits 40.2% 26.9% 14.5% 4.5% 13.9% 16,409,083
Apply for VA benefits 38.7% 24.9% 16.0% 4.7% 15.7% 16,286,694 SOURCE: 2010 National Survey of Veterans – Veteran Survey

2010 National Survey of Veterans - Appendix D - Detailed Tables
Veterans Survey Page D-163
VE-M5(17). Willingness to use the Internet for the following activities: (M5) - for respondents who are Black/African American
Very
willing Somewhat
willing
Neither willing
nor unwilling
Somewhat unwilling
Very unwilling
Estimated Population
Responding to Item
Obtaining news and information 56.0% 26.9% 6.2% 4.0% 7.0% 2,243,237
Carrying out research on services 56.4% 26.2% 7.1% 4.3% 6.0% 2,196,863
Purchasing goods or services 34.4% 30.1% 11.7% 11.9% 11.9% 2,183,690
Responding to polls or surveys 28.0% 25.9% 20.3% 12.1% 13.7% 2,197,295
Obtain information about VA benefits 53.8% 26.3% 8.6% 4.1% 7.2% 2,224,678
Apply for VA benefits 54.2% 23.2% 9.3% 3.5% 9.8% 2,230,459 SOURCE: 2010 National Survey of Veterans – Veteran Survey
VE-M5(18). Willingness to use the Internet for the following activities: (M5) - for respondents who are Asian
Very
willing Somewhat
willing
Neither willing
nor unwilling
Somewhat unwilling
Very unwilling
Estimated Population
Responding to Item
Obtaining news and information 38.7% 21.8% 16.0% 5.8% 17.6% 125,565
Carrying out research on services 40.4% 17.9% 16.0% 7.6% 18.1% 125,565
Purchasing goods or services 28.8% 33.4% 10.1% 6.4% 21.3% 124,264
Responding to polls or surveys 25.1% 30.0% 11.3% 9.9% 23.6% 118,763
Obtain information about VA benefits 33.0% 30.6% 12.7% 5.3% 18.4% 124,264
Apply for VA benefits 36.2% 28.5% 10.6% 6.0% 18.7% 126,266 SOURCE: 2010 National Survey of Veterans – Veteran Survey

2010 National Survey of Veterans - Appendix D - Detailed Tables
Veterans Survey Page D-164
VE-M5(19). Willingness to use the Internet for the following activities: (M5) - for respondents who are Hawaiian/Pacific Islander
Very
willing Somewhat
willing
Neither willing
nor unwilling
Somewhat unwilling
Very unwilling
Estimated Population
Responding to Item
Obtaining news and information 50.8% 31.3% 9.4% 3.8% 4.6% 195,140
Carrying out research on services 47.3% 33.7% 9.1% 6.4% 3.5% 192,695
Purchasing goods or services 30.9% 32.8% 24.0% 5.1% 7.2% 195,140
Responding to polls or surveys 28.0% 26.6% 19.4% 13.9% 12.2% 197,269
Obtain information about VA benefits 40.9% 33.7% 15.5% 4.7% 5.2% 197,269
Apply for VA benefits 47.2% 31.4% 9.5% 6.7% 5.2% 195,140 SOURCE: 2010 National Survey of Veterans – Veteran Survey
VE-M5(20). Willingness to use the Internet for the following activities: (M5) - for respondents who are American Indian/Alaska Native
Very
willing Somewhat
willing
Neither willing
nor unwilling
Somewhat unwilling
Very unwilling
Estimated Population
Responding to Item
Obtaining news and information * * * * * .
Carrying out research on services * * * * * *
Purchasing goods or services * * * * * *
Responding to polls or surveys * * * * * *
Obtain information about VA benefits * * * * * *
Apply for VA benefits * * * * * * SOURCE: 2010 National Survey of Veterans – Veteran Survey * Data were suppressed because fewer than 30 respondents answered this survey item.

2010 National Survey of Veterans - Appendix D - Detailed Tables
Veterans Survey Page D-165
VE-M5(21). Willingness to use the Internet for the following activities: (M5) - for respondents who are multiracial
Very
willing Somewhat
willing
Neither willing
nor unwilling
Somewhat unwilling
Very unwilling
Estimated Population
Responding to Item
Obtaining news and information 51.5% 25.2% 9.7% 4.7% 8.9% 465,241
Carrying out research on services 52.9% 27.7% 8.0% 2.4% 9.1% 467,943
Purchasing goods or services 34.7% 27.2% 13.9% 8.4% 15.8% 467,943
Responding to polls or surveys 25.9% 17.2% 25.5% 12.0% 19.5% 464,570
Obtain information about VA benefits 44.9% 28.7% 13.1% 4.0% 9.3% 464,570
Apply for VA benefits 42.0% 28.4% 13.8% 5.2% 10.7% 459,605 SOURCE: 2010 National Survey of Veterans – Veteran Survey
VE-M6(1). Veterans indicating they have ever used the “MyHealtheVet” web site (M6) - for those who served on active duty September 2001 or later
Estimated Population Responding to Item 2,513,175
Yes 5.7%
No 94.3% SOURCE: 2010 National Survey of Veterans – Veteran Survey
VE-M6(2). Veterans indicating they have ever used the “MyHealtheVet” web site (M6) - for those who served on active duty August 1990 to August 2001
Estimated Population Responding to Item 4,040,842
Yes 5.8%
No 94.2% SOURCE: 2010 National Survey of Veterans – Veteran Survey

2010 National Survey of Veterans - Appendix D - Detailed Tables
Veterans Survey Page D-166
VE-M6(3). Veterans indicating they have ever used the “MyHealtheVet” web site (M6) - for those who served on active duty May 1975 to July 1990
Estimated Population Responding to Item 5,877,995
Yes 4.2%
No 95.8% SOURCE: 2010 National Survey of Veterans – Veteran Survey
VE-M6(4). Veterans indicating they have ever used the “MyHealtheVet” web site (M6) - for those who served on active duty during the Vietnam era (August 1964 to April 1975)
Estimated Population Responding to Item 7,117,861
Yes 3.8%
No 96.2% SOURCE: 2010 National Survey of Veterans – Veteran Survey
VE-M6(5). Veterans indicating they have ever used the “MyHealtheVet” web site (M6) - for those who served on active duty February 1955 to July 1964
Estimated Population Responding to Item 3,657,927
Yes 2.2%
No 97.8% SOURCE: 2010 National Survey of Veterans – Veteran Survey
VE-M6(6). Veterans indicating they have ever used the “MyHealtheVet” web site (M6) - for those who served on active duty during the Korean War (July 1950 to January 1955)
Estimated Population Responding to Item 2,230,186
Yes 1.3%
No 98.7% SOURCE: 2010 National Survey of Veterans – Veteran Survey

2010 National Survey of Veterans - Appendix D - Detailed Tables
Veterans Survey Page D-167
VE-M6(7). Veterans indicating they have ever used the “MyHealtheVet” web site (M6) - for those who served on active duty January 1947 to June 1950
Estimated Population Responding to Item 335,303
Yes 1.0%
No 99.0% SOURCE: 2010 National Survey of Veterans – Veteran Survey
VE-M6(8). Veterans indicating they have ever used the “MyHealtheVet” web site (M6) - for those who served on active duty during World War II (December 1941 to December 1946)
Estimated Population Responding to Item 1,680,914
Yes 0.8%
No 99.2% SOURCE: 2010 National Survey of Veterans – Veteran Survey
VE-M6(9). Veterans indicating they have ever used the “MyHealtheVet” web site (M6) - for those who served on active duty November 1941 or earlier
Estimated Population Responding to Item *
SOURCE: 2010 National Survey of Veterans – Veteran Survey * Data were suppressed because fewer than 30 respondents answered this survey item.
VE-M6(10). Veterans indicating they have ever used the “MyHealtheVet” web site (M6) - for Males
Estimated Population Responding to Item 17,444,097
Yes 2.6%
No 97.4% SOURCE: 2010 National Survey of Veterans – Veteran Survey
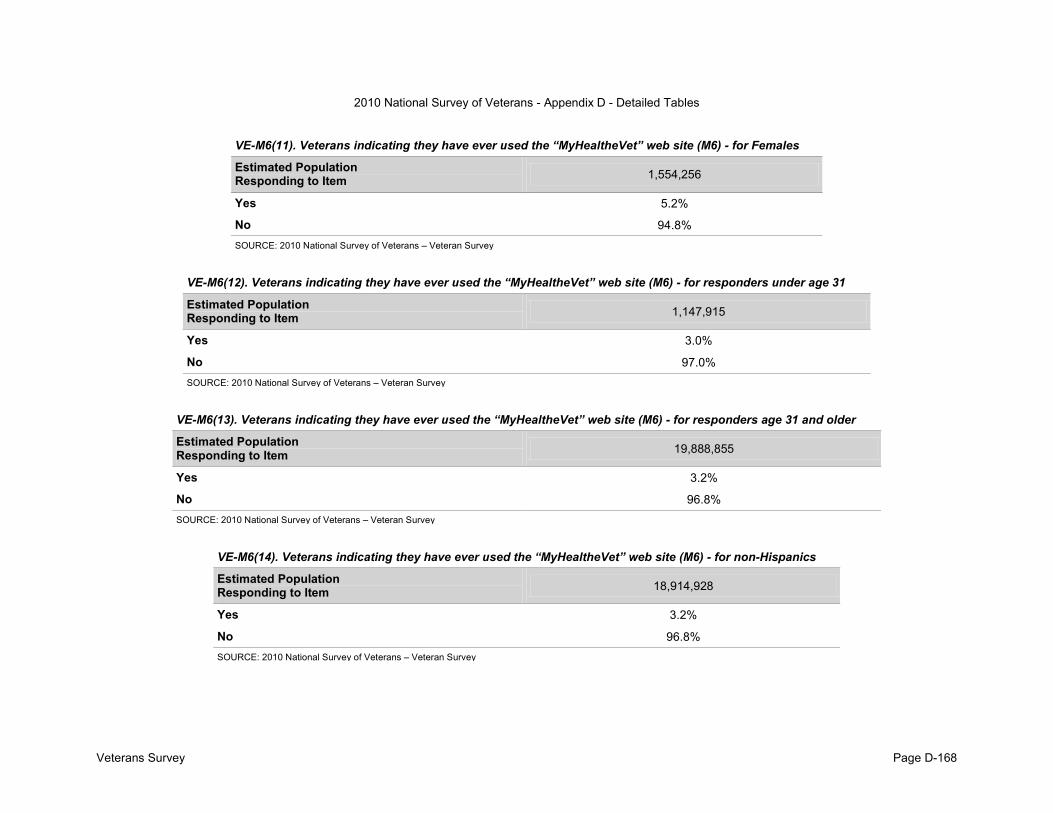
2010 National Survey of Veterans - Appendix D - Detailed Tables
Veterans Survey Page D-168
VE-M6(11). Veterans indicating they have ever used the “MyHealtheVet” web site (M6) - for Females
Estimated Population Responding to Item 1,554,256
Yes 5.2%
No 94.8% SOURCE: 2010 National Survey of Veterans – Veteran Survey
VE-M6(12). Veterans indicating they have ever used the “MyHealtheVet” web site (M6) - for responders under age 31
Estimated Population Responding to Item 1,147,915
Yes 3.0%
No 97.0% SOURCE: 2010 National Survey of Veterans – Veteran Survey
VE-M6(13). Veterans indicating they have ever used the “MyHealtheVet” web site (M6) - for responders age 31 and older
Estimated Population Responding to Item 19,888,855
Yes 3.2%
No 96.8% SOURCE: 2010 National Survey of Veterans – Veteran Survey
VE-M6(14). Veterans indicating they have ever used the “MyHealtheVet” web site (M6) - for non-Hispanics
Estimated Population Responding to Item 18,914,928
Yes 3.2%
No 96.8% SOURCE: 2010 National Survey of Veterans – Veteran Survey

2010 National Survey of Veterans - Appendix D - Detailed Tables
Veterans Survey Page D-169
VE-M6(15). Veterans indicating they have ever used the “MyHealtheVet” web site (M6) - for Hispanics
Estimated Population Responding to Item 1,024,825
Yes 4.6%
No 95.4% SOURCE: 2010 National Survey of Veterans – Veteran Survey
VE-M6(16). Veterans indicating they have ever used the “MyHealtheVet” web site (M6) - for respondents who are White
Estimated Population Responding to Item 17,536,281
Yes 2.9%
No 97.1% SOURCE: 2010 National Survey of Veterans – Veteran Survey
VE-M6(17). Veterans indicating they have ever used the “MyHealtheVet” web site (M6) - for respondents who are Black/African American
Estimated Population Responding to Item 2,351,094
Yes 4.7%
No 95.3% SOURCE: 2010 National Survey of Veterans – Veteran Survey
VE-M6(18). Veterans indicating they have ever used the “MyHealtheVet” web site (M6) - for respondents who are Asian
Estimated Population Responding to Item 138,302
Yes 3.3%
No 96.7% SOURCE: 2010 National Survey of Veterans – Veteran Survey

2010 National Survey of Veterans - Appendix D - Detailed Tables
Veterans Survey Page D-170
VE-M6(19). Veterans indicating they have ever used the “MyHealtheVet” web site (M6) - for respondents who are Hawaiian/Pacific Islander
Estimated Population Responding to Item 212,296
Yes 2.3%
No 97.7% SOURCE: 2010 National Survey of Veterans – Veteran Survey
VE-M6(20). Veterans indicating they have ever used the “MyHealtheVet” web site (M6) - for respondents who are American Indian/Alaska Native
Estimated Population Responding to Item *
SOURCE: 2010 National Survey of Veterans – Veteran Survey * Data were suppressed because fewer than 30 respondents answered this survey item.
VE-M6(21). Veterans indicating they have ever used the “MyHealtheVet” web site (M6) - for respondents who are multiracial
Estimated Population Responding to Item 472,008
Yes 6.9%
No 93.1% SOURCE: 2010 National Survey of Veterans – Veteran Survey

2010 National Survey of Veterans - Appendix D - Detailed Tables
Veterans Survey Page D-171
VE-M7(1). Veterans indicating they would like to receive VA information through the Internet (M7) - for those who served on active duty September 2001 or later
Estimated Population Responding to Item 2,498,061
Yes 79.0%
No 21.0% SOURCE: 2010 National Survey of Veterans – Veteran Survey
VE-M7(2). Veterans indicating they would like to receive VA information through the Internet (M7) - for those who served on active duty August 1990 to August 2001
Estimated Population Responding to Item 4,025,882
Yes 77.7%
No 22.3% SOURCE: 2010 National Survey of Veterans – Veteran Survey
VE-M7(3). Veterans indicating they would like to receive VA information through the Internet (M7) - for those who served on active duty May 1975 to July 1990
Estimated Population Responding to Item 5,821,864
Yes 73.1%
No 26.9% SOURCE: 2010 National Survey of Veterans – Veteran Survey

2010 National Survey of Veterans - Appendix D - Detailed Tables
Veterans Survey Page D-172
VE-M7(4). Veterans indicating they would like to receive VA information through the Internet (M7) - for those who served on active duty during the Vietnam era (August 1964 to April 1975)
Estimated Population Responding to Item 6,994,075
Yes 61.7%
No 38.3% SOURCE: 2010 National Survey of Veterans – Veteran Survey
VE-M7(5). Veterans indicating they would like to receive VA information through the Internet (M7) - for those who served on active duty February 1955 to July 1964
Estimated Population Responding to Item 3,572,172
Yes 49.0%
No 51.0% SOURCE: 2010 National Survey of Veterans – Veteran Survey
VE-M7(6). Veterans indicating they would like to receive VA information through the Internet (M7) - for those who served on active duty during the Korean War (July 1950 to January 1955)
Estimated Population Responding to Item 2,160,045
Yes 38.6%
No 61.4% SOURCE: 2010 National Survey of Veterans – Veteran Survey

2010 National Survey of Veterans - Appendix D - Detailed Tables
Veterans Survey Page D-173
VE-M7(7). Veterans indicating they would like to receive VA information through the Internet (M7) - for those who served on active duty January 1947 to June 1950
Estimated Population Responding to Item 320,619
Yes 31.4%
No 68.6% SOURCE: 2010 National Survey of Veterans – Veteran Survey
VE-M7(8). Veterans indicating they would like to receive VA information through the Internet (M7) - for those who served on active duty during World War II (December 1941 to December 1946)
Estimated Population Responding to Item 1,622,265
Yes 24.6%
No 75.4% SOURCE: 2010 National Survey of Veterans – Veteran Survey
VE-M7(9). Veterans indicating they would like to receive VA information through the Internet (M7) - for those who served on active duty November 1941 or earlier
Estimated Population Responding to Item *
SOURCE: 2010 National Survey of Veterans – Veteran Survey * Data were suppressed because fewer than 30 respondents answered this survey item.

2010 National Survey of Veterans - Appendix D - Detailed Tables
Veterans Survey Page D-174
VE-M7(10). Veterans indicating they would like to receive VA information through the Internet (M7) - for Males
Estimated Population Responding to Item 17,086,461
Yes 54.4%
No 45.6% SOURCE: 2010 National Survey of Veterans – Veteran Survey
VE-M7(11). Veterans indicating they would like to receive VA information through the Internet (M7) - for Females
Estimated Population Responding to Item 1,526,557
Yes 70.0%
No 30.0% SOURCE: 2010 National Survey of Veterans – Veteran Survey
VE-M7(12). Veterans indicating they would like to receive VA information through the Internet (M7) - for responders under age 31
Estimated Population Responding to Item 1,146,563
Yes 75.6%
No 24.4% SOURCE: 2010 National Survey of Veterans – Veteran Survey

2010 National Survey of Veterans - Appendix D - Detailed Tables
Veterans Survey Page D-175
VE-M7(13). Veterans indicating they would like to receive VA information through the Internet (M7) - for responders age 31 and older
Estimated Population Responding to Item 19,521,321
Yes 58.5%
No 41.5% SOURCE: 2010 National Survey of Veterans – Veteran Survey
VE-M7(14). Veterans indicating they would like to receive VA information through the Internet (M7) - for non-Hispanics
Estimated Population Responding to Item 18,624,068
Yes 60.2%
No 39.8% SOURCE: 2010 National Survey of Veterans – Veteran Survey
VE-M7(15). Veterans indicating they would like to receive VA information through the Internet (M7) - for Hispanics
Estimated Population Responding to Item 993,671
Yes 64.1%
No 35.9% SOURCE: 2010 National Survey of Veterans – Veteran Survey
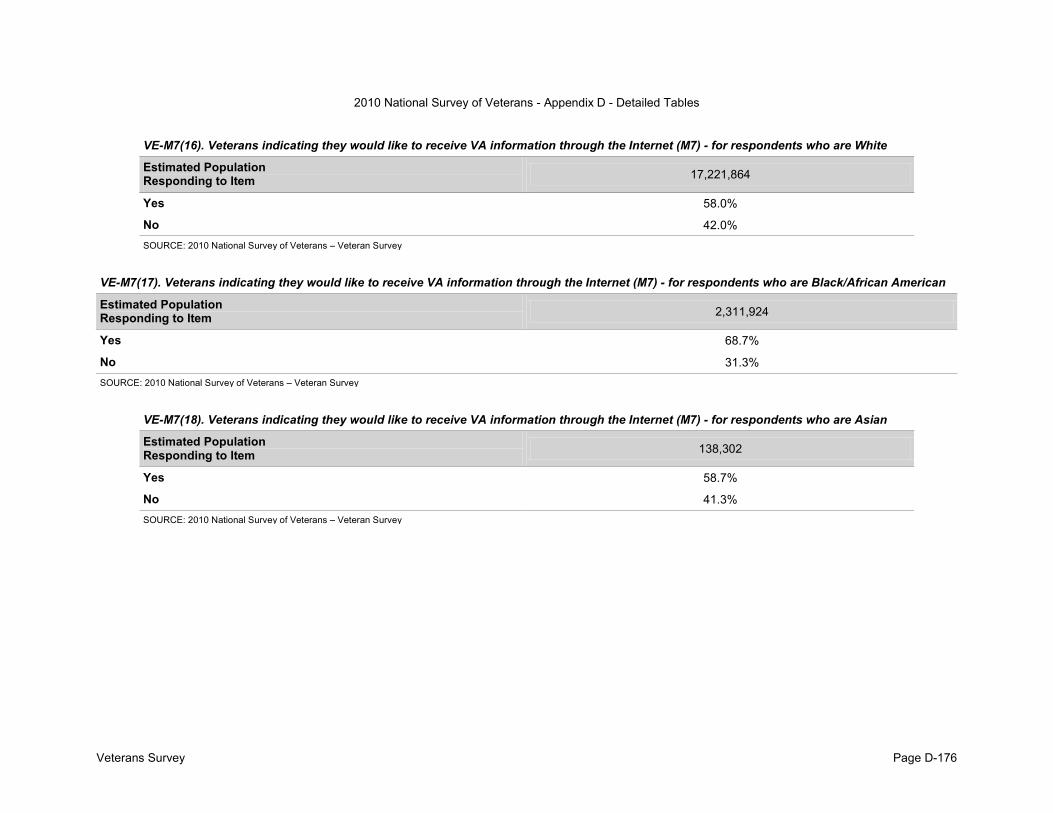
2010 National Survey of Veterans - Appendix D - Detailed Tables
Veterans Survey Page D-176
VE-M7(16). Veterans indicating they would like to receive VA information through the Internet (M7) - for respondents who are White
Estimated Population Responding to Item 17,221,864
Yes 58.0%
No 42.0% SOURCE: 2010 National Survey of Veterans – Veteran Survey
VE-M7(17). Veterans indicating they would like to receive VA information through the Internet (M7) - for respondents who are Black/African American
Estimated Population Responding to Item 2,311,924
Yes 68.7%
No 31.3% SOURCE: 2010 National Survey of Veterans – Veteran Survey
VE-M7(18). Veterans indicating they would like to receive VA information through the Internet (M7) - for respondents who are Asian
Estimated Population Responding to Item 138,302
Yes 58.7%
No 41.3% SOURCE: 2010 National Survey of Veterans – Veteran Survey
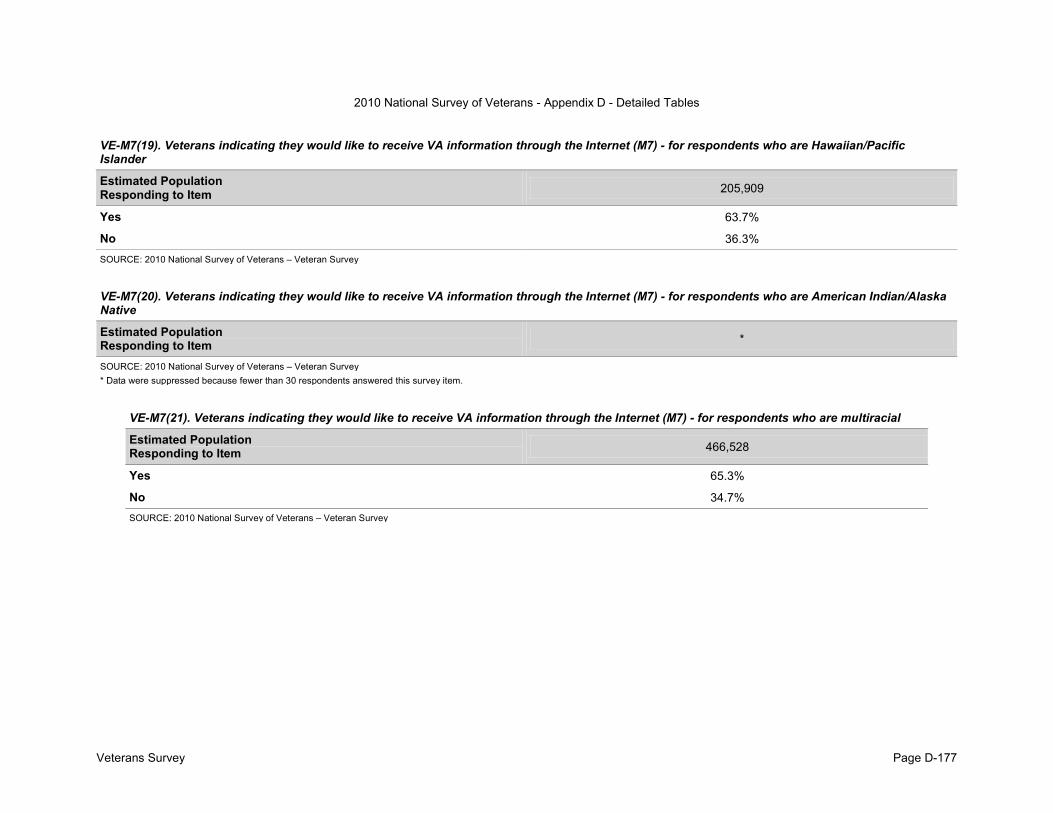
2010 National Survey of Veterans - Appendix D - Detailed Tables
Veterans Survey Page D-177
VE-M7(19). Veterans indicating they would like to receive VA information through the Internet (M7) - for respondents who are Hawaiian/Pacific Islander
Estimated Population Responding to Item 205,909
Yes 63.7%
No 36.3% SOURCE: 2010 National Survey of Veterans – Veteran Survey
VE-M7(20). Veterans indicating they would like to receive VA information through the Internet (M7) - for respondents who are American Indian/Alaska Native
Estimated Population Responding to Item *
SOURCE: 2010 National Survey of Veterans – Veteran Survey * Data were suppressed because fewer than 30 respondents answered this survey item.
VE-M7(21). Veterans indicating they would like to receive VA information through the Internet (M7) - for respondents who are multiracial
Estimated Population Responding to Item 466,528
Yes 65.3%
No 34.7% SOURCE: 2010 National Survey of Veterans – Veteran Survey

2010 National Survey of Veterans - Appendix D - Detailed Tables
Demobilized National Guard and Reserve Member Survey Page D-178
NG-A1b. Currently a member of the National Guard or Reserves? (A1b)
Estimated Population Responding to Item 314,275
Yes 87.6%
No 12.4% SOURCE: 2010 National Survey of Veterans – Demobilized National Guard/Reserve Survey
NG-A2. Branches served on during active duty (A2)
% Marked
Estimated Population
Responding to Item
Army 60.7% 316,342
Navy 8.6% 316,342
Air Force 25.2% 316,342
Marine Corps 8.9% 316,342
Coast Guard 2.2% 316,342
Other 0.0% 316,342 SOURCE: 2010 National Survey of Veterans – Demobilized National Guard/Reserve

2010 National Survey of Veterans - Appendix D - Detailed Tables
Page D-179
NG-A3. Periods of service (A3)
% Marked
Estimated Population
Responding to Item
September 2001 or later 93.8% 313,552
August 1990 to August 2001 (includes Persian Gulf War) 27.0% 313,552
May 1975 to July 1990 17.9% 313,552
Vietnam era (August 1964 to April 1975) 3.7% 313,552
February 1955 to July 1964 0.0% 313,552
Korean War (July 1950 to January 1955) 0.0% 313,552
January 1947 to June 1950 0.0% 313,552
World War II (December 1941 to December 1946) 0.0% 313,552
November 1941 or earlier 0.0% 313,552 SOURCE: 2010 National Survey of Veterans – Demobilized National Guard/Reserve Survey
NG-A4. Deployed in support of Operation Enduring Freedom (OEF) or Operation Iraqi Freedom (OIF) (A4)
Estimated Population Responding to Item 313,616
Yes 85.7%
No 14.3% SOURCE: 2010 National Survey of Veterans – Demobilized National Guard/Reserve Survey
Demobilized National Guard and Reserve Member Survey

2010 National Survey of Veterans - Appendix D - Detailed Tables
Page D-180
NG-A5. Year first entered active duty (A5)
Estimated Population Responding to Item 311,396
1946 or earlier 0.0%
1947 to 1949 0.0%
1965 to 1969 1.3%
1970 to 1974 2.2%
1975 to 1979 3.5%
1980 to 1984 7.8%
1985 to 1989 10.2%
1990 to 1994 6.4%
1995 to 1999 4.6%
2000 to 2004 36.0%
2005 to 2009 28.1% SOURCE: 2010 National Survey of Veterans – Demobilized National Guard/Reserve Survey
Demobilized National Guard and Reserve Member Survey

2010 National Survey of Veterans - Appendix D - Detailed Tables
Page D-181
NG-A6. Year last released from active duty (A6)
Estimated Population Responding to Item 304,350
1946 or earlier 0.0%
1947 to 1949 0.0%
1970 to 1974 0.2%
1975 to 1979 0.2%
1980 to 1984 1.0%
1985 to 1989 1.5%
1990 to 1994 4.6%
1995 to 1999 1.9%
2000 to 2004 15.6%
2005 to 2009 74.9% SOURCE: 2010 National Survey of Veterans – Demobilized National Guard/Reserve Survey
NG-A7. Times activated since becoming a member of the Reserves or National Guard (A7)
Estimated Population Responding to Item 310,714
1 time 55.9%
2 times 26.2%
3 or more times 17.9% SOURCE: 2010 National Survey of Veterans – Demobilized National Guard/Reserve Survey
Demobilized National Guard and Reserve Member Survey

2010 National Survey of Veterans - Appendix D - Detailed Tables
Page D-182
NG-A8. Ever served in combat or war zone (A8)
Estimated Population Responding to Item 316,342
Yes 76.7%
No 23.3% SOURCE: 2010 National Survey of Veterans – Demobilized National Guard/Reserve Survey
NG-A9. During military serv: exposure to dead/dying/wounded people (A9)
Estimated Population Responding to Item 314,503
Yes 54.1%
No 45.9% SOURCE: 2010 National Survey of Veterans – Demobilized National Guard/Reserve Survey
NG-A10. Ever prisoner of war (A10)
Estimated Population Responding to Item 316,416
Yes 0.0%
No 100.0% SOURCE: 2010 National Survey of Veterans – Demobilized National Guard/Reserve Survey
Demobilized National Guard and Reserve Member Survey

2010 National Survey of Veterans - Appendix D - Detailed Tables
Page D-183
NG-A11. During military serv: exposure to environmental hazards (A11)
Estimated Population Responding to Item 317,544
Definitely Yes 13.1%
Probably Yes 20.4%
Probably No 28.0%
Definitely No 22.7%
Don't know 15.8% SOURCE: 2010 National Survey of Veterans – Demobilized National Guard/Reserve Survey
NG-B1. How much understand VA benefits available (B1)
A lot Some A little Not at all
Estimated Population
Responding to Item
The Veterans benefits that are available to me 8.9% 52.5% 30.1% 8.4% 317,030
The Veterans health care benefits I’m entitled to 7.3% 41.8% 36.3% 14.6% 317,544
The Veterans burial benefits available to me 5.0% 33.2% 29.1% 32.7% 213,222
The Veterans education and training benefits I’m entitled to from VA 17.5% 35.8% 29.1% 17.7% 214,251
The Veterans life insurance benefits I’m entitled to 5.9% 28.2% 35.0% 30.9% 213,217
The Veterans Home Loan Guaranty benefits I’m entitled to 9.4% 33.3% 27.7% 29.6% 213,737 SOURCE: 2010 National Survey of Veterans – Demobilized National Guard/Reserve Survey
Demobilized National Guard and Reserve Member Survey

2010 National Survey of Veterans - Appendix D - Detailed Tables
Page D-184
NG-B2. In past 12 months looked for VA benefits information on the following: (B2)
Yes No
Estimated Population
Responding to Item
Eligibility for VA health care 29.4% 70.6% 312,376
Locating a VA health care facility 27.8% 72.2% 312,979
VA life insurance 6.9% 93.1% 312,622
VA home loans 21.7% 78.3% 313,823
VA education and training 40.3% 59.7% 314,789
VA vocational rehabilitation 7.5% 92.5% 312,538
VA burial and memorial benefits 3.3% 96.7% 311,420
VA disability compensation and pension 21.7% 78.3% 311,945
VA benefits for dependents and survivors 11.8% 88.2% 311,340
VA prescription benefits 15.9% 84.1% 312,622 SOURCE: 2010 National Survey of Veterans – Demobilized National Guard/Reserve Survey
NG-B3. Attended transition assistance workshops (TAP/DTAP) while on active duty (B3)
Estimated Population Responding to Item 315,268
Yes 17.3%
No 69.4%
Don't know 13.3% SOURCE: 2010 National Survey of Veterans – Demobilized National Guard/Reserve Survey
Demobilized National Guard and Reserve Member Survey

2010 National Survey of Veterans - Appendix D - Detailed Tables
Page D-185
NG-B3a. Usefulness of transition program in providing information about VA benefits/services (B3a)
Estimated Population Responding to Item 52,070
Very useful 14.0%
Useful 32.0%
Somewhat useful 48.7%
Not useful 5.4% SOURCE: 2010 National Survey of Veterans – Demobilized National Guard/Reserve Survey
NG-B3b. Agreement with statement: VA briefing gave me a thorough understanding of VA benefits (B3b)
Estimated Population Responding to Item 54,564
Completely agree 4.1%
Agree 35.5%
Neither agree nor disagree 42.3%
Disagree 11.9%
Completely disagree 6.1% SOURCE: 2010 National Survey of Veterans – Demobilized National Guard/Reserve Survey
NG-B3c. Extent that VA benefits portion of briefing was beneficial (B3c)
Estimated Population Responding to Item 54,564
Very beneficial 29.4%
Somewhat beneficial 65.4%
Not at all beneficial 5.2% SOURCE: 2010 National Survey of Veterans – Demobilized National Guard/Reserve Survey
Demobilized National Guard and Reserve Member Survey

2010 National Survey of Veterans - Appendix D - Detailed Tables
Page D-186
NG-B3d. VA benefits presenter was knowledgeable on subject (B3d)
Estimated Population Responding to Item 53,524
Very knowledgeable 54.9%
Somewhat knowledgeable 43.2%
Not at all knowledgeable 1.9% SOURCE: 2010 National Survey of Veterans – Demobilized National Guard/Reserve Survey
NG-B4. Transition program was useful in providing information on USERRA (B4)
Estimated Population Responding to Item 52,254
Yes 63.6%
No 36.4% SOURCE: 2010 National Survey of Veterans – Demobilized National Guard/Reserve Survey
NG-B5. Received a thorough understanding of what the USERRA provides (B5)
Estimated Population Responding to Item 52,254
Yes 47.3%
No 52.7% SOURCE: 2010 National Survey of Veterans – Demobilized National Guard/Reserve Survey
NG-C1. Ever applied for VA disability benefits (C1)
Estimated Population Responding to Item 307,236
Yes 26.1%
No 73.9% SOURCE: 2010 National Survey of Veterans – Demobilized National Guard/Reserve Survey
Demobilized National Guard and Reserve Member Survey

2010 National Survey of Veterans - Appendix D - Detailed Tables
Page D-187
NG-C1a. Reasons never applied for VA disability (C1A)
% Marked
Estimated Population
Responding to Item
Don’t have a service-connected disability 47.4% 197,810
Not aware of VA service-connected disability program 12.6% 197,810
Don’t think I’m entitled or eligible 30.7% 197,810
Getting military disability pay 0.0% 197,810
Getting disability income from another source 0.0% 197,810
Don’t think disability is severe enough 13.6% 197,810
Don’t know how to apply 15.3% 197,810
Don’t want any assistance 1.3% 197,810
Don’t need assistance 17.4% 197,810
Applying is too much trouble or red tape 10.5% 197,810
Never thought about it 19.7% 197,810
Other specify 8.7% 197,810
Don’t know 4.3% 197,810 SOURCE: 2010 National Survey of Veterans – Demobilized National Guard/Reserve Survey
NG-C2. Has a VA service-connected disability rating (C2)
Estimated Population Responding to Item 82,547
Yes 74.4%
No 25.6% SOURCE: 2010 National Survey of Veterans – Demobilized National Guard/Reserve Survey
Demobilized National Guard and Reserve Member Survey

2010 National Survey of Veterans - Appendix D - Detailed Tables
Page D-188
NG-C2a. Disability rating (C2a)
Estimated Population Responding to Item 60,877
0 percent 0.9%
10 or 20 percent 44.9%
30 to 40 percent 23.1%
50 to 60 percent 11.4%
70 percent or higher 12.3%
Don't know 7.5% SOURCE: 2010 National Survey of Veterans – Demobilized National Guard/Reserve Survey
NG-C2b. Service-connected disability ever prevented getting/holding a job (C2b)
Estimated Population Responding to Item 59,843
Yes 19.4%
No 80.6% SOURCE: 2010 National Survey of Veterans – Demobilized National Guard/Reserve Survey
NG-C2c. VA service-connected disability currently prevents getting/holding a job (C2c)
Estimated Population Responding to Item *
SOURCE: 2010 National Survey of Veterans – Demobilized National Guard/Reserve Survey * Data were suppressed because fewer than 30 respondents answered this survey item.
Demobilized National Guard and Reserve Member Survey

2010 National Survey of Veterans - Appendix D - Detailed Tables
Page D-189
NG-C3. Status of most recent claim application (C3)
Estimated Population Responding to Item 81,241
Approved 50.0%
Waiting for decision from VA regional office 14.5%
Waiting for decision from the Board of Appeals 7.3%
Denied 13.4%
Don't know 14.8% SOURCE: 2010 National Survey of Veterans – Demobilized National Guard/Reserve Survey
NG-C4. Currently receiving monthly disability payments from VA (C4)
Estimated Population Responding to Item 84,094
Yes 69.8%
No 30.2% SOURCE: 2010 National Survey of Veterans – Demobilized National Guard/Reserve Survey
NG-C5. Type of VA disability income received (C5)
% Marked
Estimated Population
Responding to Item
Service-connected disability compensation 100.0% 53,129
Non-service-connected disability pension 0.0% 53,129 SOURCE: 2010 National Survey of Veterans – Demobilized National Guard/Reserve Survey
Demobilized National Guard and Reserve Member Survey

2010 National Survey of Veterans - Appendix D - Detailed Tables
Page D-190
NG-C6. Importance of VA disability payment to help meet financial needs in past year (C6)
Estimated Population Responding to Item 55,405
Extremely important 52.6%
Very important 26.3%
Moderately important 11.2%
Slightly important 4.2%
Not at all important 5.8%
Don't know 0.0% SOURCE: 2010 National Survey of Veterans – Demobilized National Guard/Reserve Survey
NG-C7. Ever used vocational rehabilitation services from VA (C7)
Estimated Population Responding to Item 83,384
Yes 4.5%
No 95.5% SOURCE: 2010 National Survey of Veterans – Demobilized National Guard/Reserve Survey
Demobilized National Guard and Reserve Member Survey

2010 National Survey of Veterans - Appendix D - Detailed Tables
Page D-191
NG-C8. Reasons not used VA vocational rehabilitation services (C8)
% Marked
Estimated Population
Responding to Item
Don’t have a service-connected disability 8.7% 75,709
Didn’t think disability was severe enough 24.8% 75,709
Didn’t know how to apply for or get needed benefits 33.1% 75,709
Didn’t want financial assistance from VA 0.0% 75,709
Didn’t need financial assistance from VA 3.4% 75,709
Applying was too much trouble or red tape 12.2% 75,709
Never considered applying 44.6% 75,709
Got assistance from somewhere else 6.2% 75,709
Got better/didn’t need assistance any more 0.7% 75,709
Just had claim approved 3.7% 75,709
Other specify 14.6% 75,709 SOURCE: 2010 National Survey of Veterans – Demobilized National Guard/Reserve Survey
NG-C9. Importance of VA vocational rehabilitation services in getting job (C9)
Estimated Population Responding to Item *
SOURCE: 2010 National Survey of Veterans – Demobilized National Guard/Reserve Survey * Data were suppressed because fewer than 30 respondents answered this survey item.
Demobilized National Guard and Reserve Member Survey

2010 National Survey of Veterans - Appendix D - Detailed Tables
Page D-192
NG-C10. If employed - VA services that were helpful in finding job (C10)
% Marked
Estimated Population
Responding to Item
Educational services * *
Financial assistance * *
Job development training * *
Job placement services * *
Not employed * *
Other specify * * SOURCE: 2010 National Survey of Veterans – Demobilized National Guard/Reserve Survey * Data were suppressed because fewer than 30 respondents answered this survey item.
NG-C11. Reason used vocational rehabilitation when eligible for GI bill benefits (C11)
% Marked
Estimated Population
Responding to Item
Financial benefit * *
Payment of tuition and books * *
Length of training program * *
Support of VA vocational rehabilitation counselor * *
Assistance in finding employment * *
Referral for medical or dental benefits * *
Other specify * * SOURCE: 2010 National Survey of Veterans – Demobilized National Guard/Reserve Survey * Data were suppressed because fewer than 30 respondents answered this survey item.
Demobilized National Guard and Reserve Member Survey

2010 National Survey of Veterans - Appendix D - Detailed Tables
Page D-193
NG-C12. Reason for stopping participation in vocational rehabilitation program (C12)
Estimated Population Responding to Item *
SOURCE: 2010 National Survey of Veterans – Demobilized National Guard/Reserve Survey * Data were suppressed because fewer than 30 respondents answered this survey item.
NG-C13. Services that could have helped veteran complete program (C13)
% Marked
Estimated Population
Responding to Item
Financial support * *
Flexible training program * *
Job placement services * *
Independent living services * *
Other specify * * SOURCE: 2010 National Survey of Veterans – Demobilized National Guard/Reserve Survey * Data were suppressed because fewer than 30 respondents answered this survey item.
Demobilized National Guard and Reserve Member Survey

2010 National Survey of Veterans - Appendix D - Detailed Tables
Page D-194
NG-C14. Services that did help veteran complete program (C14)
% Marked
Estimated Population
Responding to Item
Testing and evaluation * *
Guidance and counseling * *
Training and education * *
Medical and dental referral * *
Financial support * *
Job placement * *
Employment follow-up * *
Other specify * * SOURCE: 2010 National Survey of Veterans – Demobilized National Guard/Reserve Survey * Data were suppressed because fewer than 30 respondents answered this survey item.
NG-D1. General health status (D1)
Estimated Population Responding to Item 315,628
Excellent 12.5%
Very good 39.9%
Good 34.6%
Fair 10.3%
Poor 2.7% SOURCE: 2010 National Survey of Veterans – Demobilized National Guard/Reserve Survey
Demobilized National Guard and Reserve Member Survey

2010 National Survey of Veterans - Appendix D - Detailed Tables
Page D-195
NG-D2. Health status of teeth and gums (D2)
Estimated Population Responding to Item 314,595
Excellent 11.9%
Very good 29.6%
Good 35.4%
Fair 18.4%
Poor 4.7% SOURCE: 2010 National Survey of Veterans – Demobilized National Guard/Reserve Survey
NG-D3. Amount of assistance needed last week doing the following activities: (D3)
I can do without any assistance
I can do with some assistance
I am completely dependent on
assistance I do not do this activity
Estimated Population
Responding to Item
Bathing 97.8% 0.4% 0.7% 1.2% 312,439
Eating 98.3% 0.0% 0.7% 1.1% 312,439
Transferring from bed or a chair 97.6% 0.0% 0.7% 1.8% 312,953
Using the toilet 97.6% 0.7% 0.7% 1.1% 312,953
Walking around your home 97.0% 1.3% 0.7% 1.1% 312,197
Dressing 97.3% 1.0% 0.7% 1.1% 312,953
Preparing meals 96.3% 1.7% 0.8% 1.2% 313,472
Managing your money 88.7% 9.2% 1.1% 1.1% 313,472
Doing household chores 93.5% 4.3% 0.8% 1.4% 313,472
Using the telephone 97.6% 0.7% 0.7% 1.1% 313,472
Taking medications properly 88.4% 3.3% 1.4% 6.8% 312,439 SOURCE: 2010 National Survey of Veterans – Demobilized National Guard/Reserve Survey
Demobilized National Guard and Reserve Member Survey

2010 National Survey of Veterans - Appendix D - Detailed Tables
Page D-196
NG-D4. Currently need aid and attendance of another person (D4)
Estimated Population Responding to Item 315,985
Yes 2.6%
No 97.4% SOURCE: 2010 National Survey of Veterans – Demobilized National Guard/Reserve Survey
NG-D5. Permanently housebound (D5)
Estimated Population Responding to Item 311,355
Yes 1.2%
No 98.8% SOURCE: 2010 National Survey of Veterans – Demobilized National Guard/Reserve Survey
NG-D6. Ever smoked at least 100 cigarettes (D6)
Estimated Population Responding to Item 315,787
Yes 37.5%
No 62.5% SOURCE: 2010 National Survey of Veterans – Demobilized National Guard/Reserve Survey
NG-D7. Current cigarette smoking (D7)
Estimated Population Responding to Item 317,544
Every day 9.9%
Some days 9.9%
Not at all 80.2% SOURCE: 2010 National Survey of Veterans – Demobilized National Guard/Reserve Survey
Demobilized National Guard and Reserve Member Survey

2010 National Survey of Veterans - Appendix D - Detailed Tables
Page D-197
NG-E1. Ever enrolled in VA health care (E1)
Estimated Population Responding to Item 317,544
Yes 31.5%
No 51.5%
Don't know 17.0% SOURCE: 2010 National Survey of Veterans – Demobilized National Guard/Reserve Survey
NG-E2. Ever used VA health care benefits (E2)
Estimated Population Responding to Item 316,505
Yes 34.7%
No 53.4%
Don't know 12.0% SOURCE: 2010 National Survey of Veterans – Demobilized National Guard/Reserve Survey
Demobilized National Guard and Reserve Member Survey

2010 National Survey of Veterans - Appendix D - Detailed Tables
Page D-198
NG-E2a. Reasons never used VA health care benefits (E2a)
% Marked
Estimated Population
Responding to Item
Did not need any care 39.1% 192,161
Not aware of VA health care benefits 32.8% 192,161
Not entitled to or eligible for health care benefits 7.5% 192,161
Do not know how to apply for health care benefits 25.8% 192,161
Did not need or want assistance from VA 5.5% 192,161
Too much trouble or red tape 12.4% 192,161
Never considered getting any health care from VA 23.0% 192,161
Don’t think VA health care would be as good as that available elsewhere 9.0% 192,161
I use other sources for health care 30.6% 192,161
VA care is difficult to access (parking, distance, appointment availability) 5.1% 192,161
Applied, but was told that I am not eligible 1.3% 192,161
Other specify 4.5% 192,161
Don’t know 7.6% 192,161 SOURCE: 2010 National Survey of Veterans – Demobilized National Guard/Reserve Survey
NG-E3. Used VA health care services or had VA pay for any health care in last 6 months (E3)
Estimated Population Responding to Item 109,152
Yes – I received services at VA, or they were paid for by VA 58.6%
No – I received services, but not from VA and were not paid for by VA 14.4%
No – I did not receive any health care services 26.0%
Don't know/Don't remember 1.0% SOURCE: 2010 National Survey of Veterans – Demobilized National Guard/Reserve Survey
Demobilized National Guard and Reserve Member Survey

2010 National Survey of Veterans - Appendix D - Detailed Tables
Page D-199
NG-E3a. Reasons did not use VA health care services in the last 6 months (E3a)
% Marked
Estimated Population
Responding to Item
Do not need any care 38.5% 44,577
Not aware of the VA health care benefits 10.1% 44,577
Do not believe self entitled to or eligible for health care benefits 25.4% 44,577
Bad prior experience 15.0% 44,577
Do not know how to apply for health care benefits 8.9% 44,577
Do not need or want assistance from VA 5.1% 44,577
Applying for health care benefits too much trouble or red tape 12.5% 44,577
Never considered getting any health care from VA 10.2% 44,577
Don’t think VA health care would be as good as that available elsewhere 17.6% 44,577
Uses other sources for health care 42.0% 44,577
VA care is difficult to access (parking and/or appointment availability) 11.0% 44,577
VA care is difficult to access due to distance 11.9% 44,577
I do not feel welcome at VA 4.7% 44,577
VA does not provide the services that I need 0.0% 44,577
Other specify 18.9% 44,577
Don’t know 0.0% 44,577 SOURCE: 2010 National Survey of Veterans – Demobilized National Guard/Reserve Survey
Demobilized National Guard and Reserve Member Survey

2010 National Survey of Veterans - Appendix D - Detailed Tables
Page D-200
NG-E4. Stay in hospital for medical/surgical care in last 6 months (E4)
Estimated Population Responding to Item 310,479
Yes 6.8%
No 93.2% SOURCE: 2010 National Survey of Veterans – Demobilized National Guard/Reserve Survey
NG-E4a. Sources of financial support for medical/surgical care in hospital (E4a)
% Marked
Estimated Population
Responding to Item
VA (Department of Veterans Affairs) * *
CHAMPUS, CHAMPVA, or TRICARE (military) * *
Medicare, including Medigap supplement * *
Medicaid/Medical Assistance * *
Some other federal/state/local government program * *
Private insurance purchased directly or by a family member, through a union, or from a current or former employer * *
Out of pocket by you or your family (copayment) * *
Some other source * * SOURCE: 2010 National Survey of Veterans – Demobilized National Guard/Reserve Survey * Data were suppressed because fewer than 30 respondents answered this survey item.
Demobilized National Guard and Reserve Member Survey

2010 National Survey of Veterans - Appendix D - Detailed Tables
Page D-201
NG-E5. Outpatient medical care in last 6 months (E5)
Estimated Population Responding to Item 310,082
Yes 63.0%
No 37.0% SOURCE: 2010 National Survey of Veterans – Demobilized National Guard/Reserve Survey
NG-E5a. Sources of financial support for outpatient medical care (E5a)
% Marked
Estimated Population
Responding to Item
VA (Department of Veterans Affairs) 20.3% 185,901
CHAMPUS, CHAMPVA, or TRICARE (military) 18.4% 185,901
Medicare, including Medigap supplement 0.0% 185,901
Medicaid/Medical Assistance 1.2% 185,901
Some other federal/state/local government program 6.2% 185,901
Private insurance purchased directly or by a family member, through a union, or from a current or former employer 61.6% 185,901
Out of pocket by you or your family (copayment) 39.5% 185,901
Some other source 2.0% 185,901 SOURCE: 2010 National Survey of Veterans – Demobilized National Guard/Reserve Survey
Demobilized National Guard and Reserve Member Survey

2010 National Survey of Veterans - Appendix D - Detailed Tables
Page D-202
NG-E6. Stay in hospital for mental health/substance abuse in last 6 months (E6)
Estimated Population Responding to Item 309,706
Yes 1.3%
No 98.7% SOURCE: 2010 National Survey of Veterans – Demobilized National Guard/Reserve Survey
NG-E6a. Sources of financial support for mental health/substance abuse care in hospital (E6a)
% Marked
Estimated Population
Responding to Item
VA (Department of Veterans Affairs) * *
CHAMPUS, CHAMPVA, or TRICARE (military) * *
Medicare, including Medigap supplement * *
Medicaid/Medical Assistance * *
Some other federal/state/local government program * *
Private insurance purchased directly or by a family member, through a union, or from a current or former employer * *
Out of pocket by you or your family (copayment) * *
Some other source * * SOURCE: 2010 National Survey of Veterans – Demobilized National Guard/Reserve Survey * Data were suppressed because fewer than 30 respondents answered this survey item.
NG-E7. Outpatient mental health/substance abuse counseling in last 6 months (E7)
Estimated Population Responding to Item 311,202
Yes 14.5%
No 85.5% SOURCE: 2010 National Survey of Veterans – Demobilized National Guard/Reserve Survey
Demobilized National Guard and Reserve Member Survey

2010 National Survey of Veterans - Appendix D - Detailed Tables
Page D-203
NG-E7a. Sources of financial support for outpatient mental health/substance abuse counseling (E7a)
% Marked
Estimated Population
Responding to Item
VA (Department of Veterans Affairs) 53.1% 45,028
CHAMPUS, CHAMPVA, or TRICARE (military) 14.5% 45,028
Medicare, including Medigap supplement 0.0% 45,028
Medicaid/Medical Assistance 0.0% 45,028
Some other federal/state/local government program 6.2% 45,028
Private insurance purchased directly or by a family member, through a union, or from a current or former employer 24.5% 45,028
Out of pocket by you or your family (copayment) 24.7% 45,028
Some other source 6.3% 45,028 SOURCE: 2010 National Survey of Veterans – Demobilized National Guard/Reserve Survey
NG-E8. Prescription medicine in last 6 months (E8)
Estimated Population Responding to Item 308,242
Yes 58.4%
No 41.6% SOURCE: 2010 National Survey of Veterans – Demobilized National Guard/Reserve Survey
Demobilized National Guard and Reserve Member Survey

2010 National Survey of Veterans - Appendix D - Detailed Tables
Page D-204
NG-E8a. Sources of financial support for prescription medications (E8a)
% Marked
Estimated Population
Responding to Item
VA (Department of Veterans Affairs) 25.9% 180,081
CHAMPUS, CHAMPVA, or TRICARE (military) 15.9% 180,081
Medicare, including Medigap supplement 0.0% 180,081
Medicaid/Medical Assistance 1.0% 180,081
Some other federal/state/local government program 2.6% 180,081
Private insurance purchased directly or by a family member, through a union, or from a current or former employer 57.1% 180,081
Out of pocket by you or your family (copayment) 40.9% 180,081
Some other source 3.2% 180,081 SOURCE: 2010 National Survey of Veterans – Demobilized National Guard/Reserve Survey
NG-E9. Over-the-counter medications in last 6 months (E9)
Estimated Population Responding to Item 312,953
Yes 67.7%
No 32.3% SOURCE: 2010 National Survey of Veterans – Demobilized National Guard/Reserve Survey
Demobilized National Guard and Reserve Member Survey

2010 National Survey of Veterans - Appendix D - Detailed Tables
Page D-205
NG-E9a. Sources of financial support for over-the-counter medications (E9a)
% Marked
Estimated Population
Responding to Item
VA (Department of Veterans Affairs) 2.4% 207,838
CHAMPUS, CHAMPVA, or TRICARE (military) 4.1% 207,838
Medicare, including Medigap supplement 0.0% 207,838
Medicaid/Medical Assistance 0.0% 207,838
Some other federal/state/local government program 1.0% 207,838
Private insurance purchased directly or by a family member, through a union, or from a current or former employer 19.5% 207,838
Out of pocket by you or your family (copayment) 82.3% 207,838
Some other source 4.3% 207,838 SOURCE: 2010 National Survey of Veterans – Demobilized National Guard/Reserve Survey
NG-E10. In-home health care in the last 6 months (E10)
Estimated Population Responding to Item 306,350
Yes 0.8%
No 99.2% SOURCE: 2010 National Survey of Veterans – Demobilized National Guard/Reserve Survey
Demobilized National Guard and Reserve Member Survey

2010 National Survey of Veterans - Appendix D - Detailed Tables
Page D-206
NG-E10a. Sources of financial support for in-home health care (E10a)
% Marked
Estimated Population
Responding to Item
VA (Department of Veterans Affairs) * *
CHAMPUS, CHAMPVA, or TRICARE (military) * *
Medicare, including Medigap supplement * *
Medicaid/Medical Assistance * *
Some other federal/state/local government program * *
Private insurance purchased directly or by a family member, through a union, or from a current or former employer * *
Out of pocket by you or your family (copayment) * *
Some other source * * SOURCE: 2010 National Survey of Veterans – Demobilized National Guard/Reserve Survey * Data were suppressed because fewer than 30 respondents answered this survey item.
NG-E11. Care for prosthetics/medical equipment in last 6 months (E11)
Estimated Population Responding to Item 314,512
Yes 2.7%
No 97.3% SOURCE: 2010 National Survey of Veterans – Demobilized National Guard/Reserve Survey
Demobilized National Guard and Reserve Member Survey

2010 National Survey of Veterans - Appendix D - Detailed Tables
Page D-207
NG-E11a. Sources of financial support for care of prosthetics/medical equipment (E11a)
% Marked
Estimated Population
Responding to Item
VA (Department of Veterans Affairs) * *
CHAMPUS, CHAMPVA, or TRICARE (military) * *
Medicare, including Medigap supplement * *
Medicaid/Medical Assistance * *
Some other federal/state/local government program * *
Private insurance purchased directly or by a family member, through a union, or from a current or former employer * *
Out of pocket by you or your family (copayment) * *
Some other source * * SOURCE: 2010 National Survey of Veterans – Demobilized National Guard/Reserve Survey * Data were suppressed because fewer than 30 respondents answered this survey item.
NG-E12. Care for hearing aids/eye glasses in last 6 months (E12)
Estimated Population Responding to Item 310,912
Yes 28.3%
No 71.7% SOURCE: 2010 National Survey of Veterans – Demobilized National Guard/Reserve Survey
Demobilized National Guard and Reserve Member Survey

2010 National Survey of Veterans - Appendix D - Detailed Tables
Page D-208
NG-E12a. Sources of financial support for care of hearing aids/eye glasses (E12a)
% Marked
Estimated Population
Responding to Item
VA (Department of Veterans Affairs) 11.2% 89,864
CHAMPUS, CHAMPVA, or TRICARE (military) 8.5% 89,864
Medicare, including Medigap supplement 0.0% 89,864
Medicaid/Medical Assistance 0.0% 89,864
Some other federal/state/local government program 4.4% 89,864
Private insurance purchased directly or by a family member, through a union, or from a current or former employer 49.8% 89,864
Out of pocket by you or your family (copayment) 57.9% 89,864
Some other source 3.1% 89,864 SOURCE: 2010 National Survey of Veterans – Demobilized National Guard/Reserve Survey
NG-E13. Stayed overnite in a rehabilitation hospital/nursing care in last 6 months (E13)
Estimated Population Responding to Item 314,512
Yes 0.0%
No 100.0% SOURCE: 2010 National Survey of Veterans – Demobilized National Guard/Reserve Survey
Demobilized National Guard and Reserve Member Survey

2010 National Survey of Veterans - Appendix D - Detailed Tables
Page D-209
NG-E13a. Sources of financial support for care in rehabilitation hospital/nursing care (E13a)
% Marked
Estimated Population
Responding to Item
VA (Department of Veterans Affairs) * *
CHAMPUS, CHAMPVA, or TRICARE (military) * *
Medicare, including Medigap supplement * *
Medicaid/Medical Assistance * *
Some other federal/state/local government program * *
Private insurance purchased directly or by a family member, through a union, or from a current or former employer * *
Out of pocket by you or your family (copayment) * *
Some other source * * SOURCE: 2010 National Survey of Veterans – Demobilized National Guard/Reserve Survey * Data were suppressed because fewer than 30 respondents answered this survey item.
NG-E14. Dental care in last 6 months (E14)
Estimated Population Responding to Item 311,583
Yes 63.9%
No 36.1% SOURCE: 2010 National Survey of Veterans – Demobilized National Guard/Reserve Survey
Demobilized National Guard and Reserve Member Survey

2010 National Survey of Veterans - Appendix D - Detailed Tables
Page D-210
NG-E14a. Sources of financial support for dental care (E14a)
% Marked
Estimated Population
Responding to Item
VA (Department of Veterans Affairs) 4.8% 200,303
CHAMPUS, CHAMPVA, or TRICARE (military) 15.9% 200,303
Medicare, including Medigap supplement 0.0% 200,303
Medicaid/Medical Assistance 0.0% 200,303
Some other federal/state/local government program 9.2% 200,303
Private insurance purchased directly or by a family member, through a union, or from a current or former employer 63.4% 200,303
Out of pocket by you or your family (copayment) 45.8% 200,303
Some other source 4.4% 200,303 SOURCE: 2010 National Survey of Veterans – Demobilized National Guard/Reserve Survey
NG-E15. Visited emergency room in last 6 months (E15)
Estimated Population Responding to Item 313,992
Yes 15.8%
No 84.2% SOURCE: 2010 National Survey of Veterans – Demobilized National Guard/Reserve Survey
Demobilized National Guard and Reserve Member Survey

2010 National Survey of Veterans - Appendix D - Detailed Tables
Page D-211
NG-E15a. Sources of financial support for emergency room visit (E15a)
% Marked
Estimated Population
Responding to Item
VA (Department of Veterans Affairs) 19.2% 50,100
CHAMPUS, CHAMPVA, or TRICARE (military) 20.7% 50,100
Medicare, including Medigap supplement 0.0% 50,100
Medicaid/Medical Assistance 0.0% 50,100
Some other federal/state/local government program 1.0% 50,100
Private insurance purchased directly or by a family member, through a union, or from a current or former employer 49.1% 50,100
Out of pocket by you or your family (copayment) 45.9% 50,100
Some other source 8.2% 50,100 SOURCE: 2010 National Survey of Veterans – Demobilized National Guard/Reserve Survey
NG-E16. Other medical treatment in last 6 months (E16)
Estimated Population Responding to Item 313,801
Yes 16.7%
No 83.3% SOURCE: 2010 National Survey of Veterans – Demobilized National Guard/Reserve Survey
Demobilized National Guard and Reserve Member Survey

2010 National Survey of Veterans - Appendix D - Detailed Tables
Page D-212
NG-E16b. Sources of financial support for other medical treatment (E16b)
% Marked
Estimated Population
Responding to Item
VA (Department of Veterans Affairs) 16.9% 51,264
CHAMPUS, CHAMPVA, or TRICARE (military) 20.6% 51,264
Medicare, including Medigap supplement 0.0% 51,264
Medicaid/Medical Assistance 3.4% 51,264
Some other federal/state/local government program 3.0% 51,264
Private insurance purchased directly or by a family member, through a union, or from a current or former employer 58.2% 51,264
Out of pocket by you or your family (copayment) 46.7% 51,264
Some other source 5.6% 51,264 SOURCE: 2010 National Survey of Veterans – Demobilized National Guard/Reserve Survey
Demobilized National Guard and Reserve Member Survey

2010 National Survey of Veterans - Appendix D - Detailed Tables
Page D-213
NG-E17. How much agree or disagree on following statements about VA health benefit use (E17)
Strongly
agree Agree
Neither agree nor disagree Disagree
Strongly disagree
Don't know
Estimated Population
Responding to Item
If the cost of health care to me increases, I will use VA more 22.9% 23.9% 27.6% 5.4% 2.6% 17.7% 312,755
I would only use VA if I did not have access to any other source of health care 20.0% 28.7% 21.5% 12.6% 6.5% 10.6% 312,146
I have a doctor outside VA who I really trust 17.8% 23.9% 28.7% 12.4% 12.5% 4.7% 311,121
Veterans who can afford to use other sources of health care should leave VA to those who really need it 12.9% 22.8% 26.1% 19.1% 12.1% 7.1% 311,546
Veterans like me who use VA are satisfied with the health care they receive 7.0% 22.1% 27.5% 5.6% 3.1% 34.7% 308,163
VA health care providers explain treatment/ diagnoses in a way that patients can understand 9.1% 19.8% 23.3% 3.3% 0.9% 43.5% 309,365
There is a VA provider in my area that offers all of the health care services that Veterans like me need 12.2% 23.1% 18.3% 6.7% 1.5% 38.1% 308,845
SOURCE: 2010 National Survey of Veterans – Demobilized National Guard/Reserve Survey
NG-E18. Veteran has one provider in charge of their care (E18)
Estimated Population Responding to Item 313,997
Yes 56.8%
No 43.2% SOURCE: 2010 National Survey of Veterans – Demobilized National Guard/Reserve Survey
Demobilized National Guard and Reserve Member Survey

2010 National Survey of Veterans - Appendix D - Detailed Tables
Page D-214
NG-E20. Accessed woman's health care (e.g. pap smear/prenatal care) last 12 months (E20)
Estimated Population Responding to Item 56,598
Yes 57.7%
No 42.3% SOURCE: 2010 National Survey of Veterans – Demobilized National Guard/Reserve Survey
NG-E21. Sources of woman's health care (E21)
Yes No
Estimated Population
Responding to Item
A primary care clinic at a VA facility * * .
A women’s health clinic or gynecology clinic at a VA facility 24.1% 75.9% 26,251
Any provider or facility outside VA, but paid for by VA * * *
Any provider or facility outside VA, not paid for by VA 62.9% 37.1% 30,099
Any women’s healthcare provider or gynecology clinic outside VA, not paid for by VA 74.6% 25.4% 30,554 SOURCE: 2010 National Survey of Veterans – Demobilized National Guard/Reserve Survey * Data were suppressed because fewer than 30 respondents answered this survey item.
NG-E22. Would veteran consider VA for long-term nursing home care (E22)
Estimated Population Responding to Item 314,234
Definitely go to VA 23.5%
Maybe go to VA 70.0%
Definitely go somewhere else 6.5% SOURCE: 2010 National Survey of Veterans – Demobilized National Guard/Reserve Survey
Demobilized National Guard and Reserve Member Survey

2010 National Survey of Veterans - Appendix D - Detailed Tables
Page D-215
NG-E23. Plans for using VA health care in future (E23)
Estimated Population Responding to Item 289,290
As your primary source of health care 21.6%
In addition to non-VA care for some services 19.0%
A "safety net" to use only if I lose other sources of health care 34.6%
For prescriptions 2.2%
For specialized care 0.8%
Some other way 3.4%
No plans to use VA for health care 18.3% SOURCE: 2010 National Survey of Veterans – Demobilized National Guard/Reserve Survey
Demobilized National Guard and Reserve Member Survey

2010 National Survey of Veterans - Appendix D - Detailed Tables
Page D-216
NG-F1. Current health insurance coverage (F1)
% Marked
Estimated Population
Responding to Item
No health insurance 14.9% 313,720
Insurance through a current or former employer or union (of yours or another family member) 62.5% 313,720
Insurance purchased directly from an insurance company (by you or another family member) 4.3% 313,720
Medicare, for people 65 and older, or people with certain disabilities 0.2% 313,720
Medicaid, Medical Assistance, or any kind of government-assistance plan for those with low incomes or a disability 0.9% 313,720
VA (including those who have ever used or enrolled for VA health care) 10.5% 313,720
TRICARE, TRICARE for Life or other military health care 23.8% 313,720
Indian Health Service 0.6% 313,720
Any other type of health insurance or health coverage plan Please specify below 2.4% 313,720 SOURCE: 2010 National Survey of Veterans – Demobilized National Guard/Reserve Survey
NG-F1a. Sources of coverage (F1a)
% Marked
Estimated Population
Responding to Item
No health insurance 14.0% 308,757
Current employer, including COBRA coverage 55.2% 308,757
Former employer 1.8% 308,757
Individually purchased coverage 10.0% 308,757
Federal, State, County, or local community health services program 11.5% 308,757
Family member, such as a spouse, parent, etc. 11.6% 308,757
From somewhere else 4.5% 308,757 SOURCE: 2010 National Survey of Veterans – Demobilized National Guard/Reserve Survey
Demobilized National Guard and Reserve Member Survey

2010 National Survey of Veterans - Appendix D - Detailed Tables
Page D-217
NG-F2. Receive Medicare coverage through a Medicare Advantage Plan (F2)
Estimated Population Responding to Item *
SOURCE: 2010 National Survey of Veterans – Demobilized National Guard/Reserve Survey * Data were suppressed because fewer than 30 respondents answered this survey item.
NG-F2a. Medicare coverage pays for: (F2a)
Yes No
Estimated Population
Responding to Item
Care if you are hospitalized? * * .
Doctor’s office visits? * * *
Prescription drug coverage, ‘Part D’? * * * SOURCE: 2010 National Survey of Veterans – Demobilized National Guard/Reserve Survey * Data were suppressed because fewer than 30 respondents answered this survey item.
NG-F3. Medicare Supplemental insurance (F3)
Estimated Population Responding to Item *
SOURCE: 2010 National Survey of Veterans – Demobilized National Guard/Reserve Survey * Data were suppressed because fewer than 30 respondents answered this survey item.
NG-F4. Insurance includes prescription drug coverage (F4)
Estimated Population Responding to Item 314,043
Yes 77.9%
No 22.1% SOURCE: 2010 National Survey of Veterans – Demobilized National Guard/Reserve Survey
Demobilized National Guard and Reserve Member Survey

2010 National Survey of Veterans - Appendix D - Detailed Tables
Page D-218
NG-F5. Currently have prescription drug coverage from VA (F5)
Estimated Population Responding to Item 220,687
Yes 16.0%
No 59.6%
Don't know 24.4% SOURCE: 2010 National Survey of Veterans – Demobilized National Guard/Reserve Survey
NG-F6. Agreement with the following statements: (F6)
Strongly
agree Agree Neither agree nor disagree Disagree
Strongly disagree
Estimated Population
Responding to Item
I feel I know what is available to me through my VA health coverage 2.8% 15.7% 22.2% 40.6% 18.9% 314,015
My family has a health insurance plan that adequately covers me and my family 17.4% 37.3% 20.7% 10.2% 14.3% 313,496
SOURCE: 2010 National Survey of Veterans – Demobilized National Guard/Reserve Survey
NG-G1. Excluding VA voc rehab, used other VA education/training benefits (G1)
Estimated Population Responding to Item 315,280
Yes 38.4%
No 61.6% SOURCE: 2010 National Survey of Veterans – Demobilized National Guard/Reserve Survey
Demobilized National Guard and Reserve Member Survey

2010 National Survey of Veterans - Appendix D - Detailed Tables
Page D-219
NG-G2. When used VA education/training benefit (G2)
% Marked
Estimated Population
Responding to Item
During active duty service 8.1% 112,487
After active duty service 70.4% 112,487
Both during and after active duty service 29.6% 112,487
Have never used education and training benefits 0.0% 112,487 SOURCE: 2010 National Survey of Veterans – Demobilized National Guard/Reserve Survey
NG-G2a. How used VA education benefit? (G2a)
% Marked
Estimated Population
Responding to Item
Took college or university coursework leading to a bachelor or graduate degree 87.3% 120,657
Attended business, technical or vocational school training leading to a certificate or diploma 9.9% 120,657
Participated in an apprenticeship or on-the-job training program 7.1% 120,657
Took correspondence courses 1.4% 120,657
Took flight training 0.9% 120,657
Received tutorial assistance, refresher courses, or deficiency training 2.1% 120,657
Attended a teacher certification program 1.7% 120,657
Did something else: Please specify below 5.6% 120,657 SOURCE: 2010 National Survey of Veterans – Demobilized National Guard/Reserve Survey
Demobilized National Guard and Reserve Member Survey
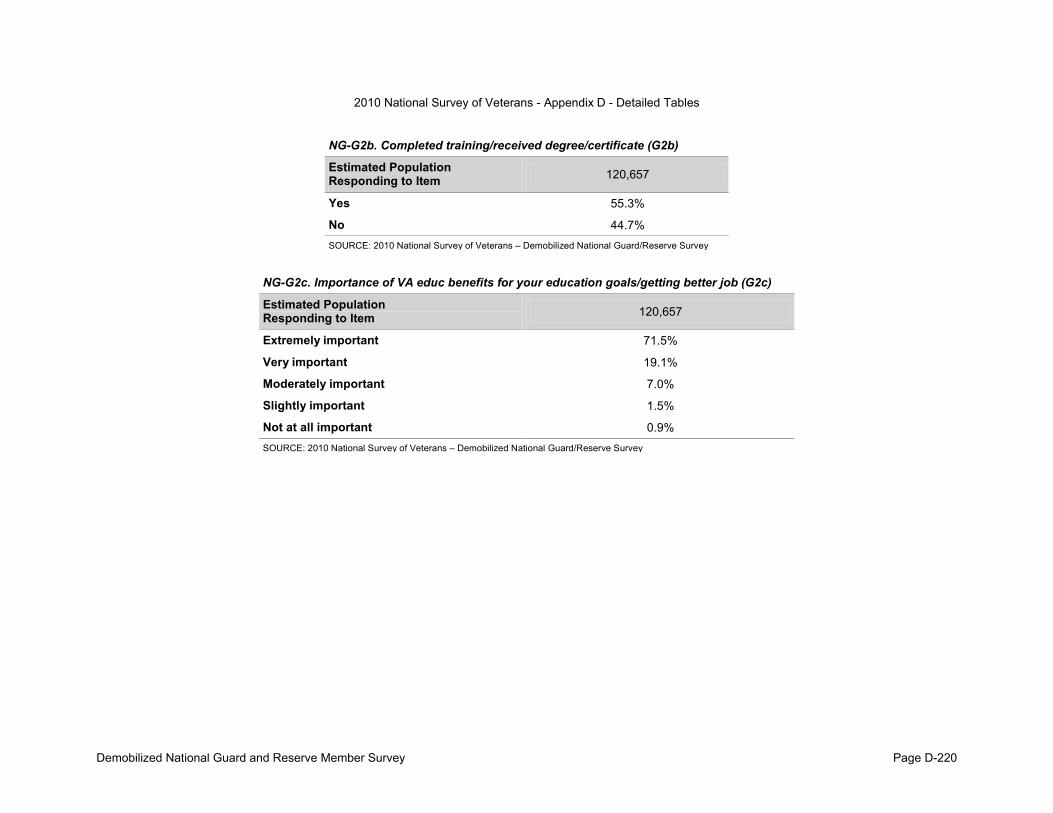
2010 National Survey of Veterans - Appendix D - Detailed Tables
Page D-220
NG-G2b. Completed training/received degree/certificate (G2b)
Estimated Population Responding to Item 120,657
Yes 55.3%
No 44.7% SOURCE: 2010 National Survey of Veterans – Demobilized National Guard/Reserve Survey
NG-G2c. Importance of VA educ benefits for your education goals/getting better job (G2c)
Estimated Population Responding to Item 120,657
Extremely important 71.5%
Very important 19.1%
Moderately important 7.0%
Slightly important 1.5%
Not at all important 0.9% SOURCE: 2010 National Survey of Veterans – Demobilized National Guard/Reserve Survey
Demobilized National Guard and Reserve Member Survey

2010 National Survey of Veterans - Appendix D - Detailed Tables
Page D-221
NG-G3. Reasons did not use VA educational assistance (G3)
% Marked
Estimated Population
Responding to Item
I used state education benefits from the National Guard instead 9.0% 186,925
Not aware of VA education or training benefits 40.0% 186,925
Don’t believe entitled to or eligible for education or training benefits 10.6% 186,925
My period of eligibility expired/ran out 6.1% 186,925
Don’t know how to apply for education or training benefits 32.8% 186,925
Don’t need any additional education or training 13.8% 186,925
Don’t need or want assistance from VA 2.3% 186,925
Too much trouble or red tape 12.9% 186,925
Never considered getting any education or training from VA 18.8% 186,925
Didn’t pay into training funds during active duty 7.4% 186,925
Other: Please specify type below 13.4% 186,925 SOURCE: 2010 National Survey of Veterans – Demobilized National Guard/Reserve Survey
NG-G4. Received other education/training assistance since discharge (G4)
Estimated Population Responding to Item 314,246
Yes 16.5%
No 83.5% SOURCE: 2010 National Survey of Veterans – Demobilized National Guard/Reserve Survey
Demobilized National Guard and Reserve Member Survey

2010 National Survey of Veterans - Appendix D - Detailed Tables
Page D-222
NG-G6. Used military's tuition assistance while on active duty (G6)
Estimated Population Responding to Item 310,692
Yes 22.0%
No 78.0% SOURCE: 2010 National Survey of Veterans – Demobilized National Guard/Reserve Survey
NG-H1. Work status during the last week (H1)
Estimated Population Responding to Item 314,766
Working, or on paid vacation or sick leave from work 78.3%
Not working, but looking for work 16.5%
Not working and not looking for work 5.2% SOURCE: 2010 National Survey of Veterans – Demobilized National Guard/Reserve Survey
NG-H1a. Main reason not looking for work (H1a)
Estimated Population Responding to Item *
SOURCE: 2010 National Survey of Veterans – Demobilized National Guard/Reserve Survey * Data were suppressed because fewer than 30 respondents answered this survey item.
Demobilized National Guard and Reserve Member Survey

2010 National Survey of Veterans - Appendix D - Detailed Tables
Page D-223
NG-H2. Recent civilian job matched occupation trained for while in military (H2)
Estimated Population Responding to Item 314,043
Yes 39.7%
No 56.5%
Have not had civilian jobs 3.9% SOURCE: 2010 National Survey of Veterans – Demobilized National Guard/Reserve Survey
NG-H3. Extent that military training/experience applied to recent civilian job (H3)
Estimated Population Responding to Item 285,458
A lot 33.6%
Some 27.1%
A little 19.1%
Not at all 20.2% SOURCE: 2010 National Survey of Veterans – Demobilized National Guard/Reserve Survey
NG-H4. Enrolled in a service-sponsored transition program upon returning from activation (H4)
Estimated Population Responding to Item 314,754
Yes 3.5%
No 96.5% SOURCE: 2010 National Survey of Veterans – Demobilized National Guard/Reserve Survey
Demobilized National Guard and Reserve Member Survey

2010 National Survey of Veterans - Appendix D - Detailed Tables
Page D-224
NG-H5. At the time of most recent activation, enrolled in a civilian school (H5)
Estimated Population Responding to Item 313,200
Yes 19.0%
No 81.0% SOURCE: 2010 National Survey of Veterans – Demobilized National Guard/Reserve Survey
NG-H6. Full time or Part Time Enrollment in civilian school (H6)
Estimated Population Responding to Item 56,229
Full-time 76.5%
Part-time 23.5% SOURCE: 2010 National Survey of Veterans – Demobilized National Guard/Reserve Survey
NG-H7. Employed at time of most recent activation (H7)
Estimated Population Responding to Item 309,682
Yes 81.7%
No 18.3% SOURCE: 2010 National Survey of Veterans – Demobilized National Guard/Reserve Survey
Demobilized National Guard and Reserve Member Survey

2010 National Survey of Veterans - Appendix D - Detailed Tables
Page D-225
NG-H7a. Hours usually worked per week (H7a)
Estimated Population Responding to Item 239,984
Less than 10 hours per week 0.4%
Between 10 and 19 hours per week 1.2%
Between 20 and 39 hours per week 12.2%
40 hours per week 56.3%
More than 40 hours per week 29.8% SOURCE: 2010 National Survey of Veterans – Demobilized National Guard/Reserve Survey
NG-H8 When returned from active duty, returned to a civilian job? (H8)
Estimated Population Responding to Item 307,164
Yes, previous job with same employer 61.4%
Yes, previous job with earlier employer (not employer I was working for when I was activated) 0.5%
Yes, different job with same employer 3.0%
Yes, different job with different employer 13.0%
No, did not have a civilian job at the time I was activated 14.5%
No, I did not try to return to civilian job after deactivation 7.6% SOURCE: 2010 National Survey of Veterans – Demobilized National Guard/Reserve Survey
NG-H8a. For those reporting a different job, comparison between job before and after activation (H8a)
Estimated Population Responding to Item 45,259
Job I went back to was similar 34.3%
Job I went back to was quite different 65.7% SOURCE: 2010 National Survey of Veterans – Demobilized National Guard/Reserve Survey
Demobilized National Guard and Reserve Member Survey
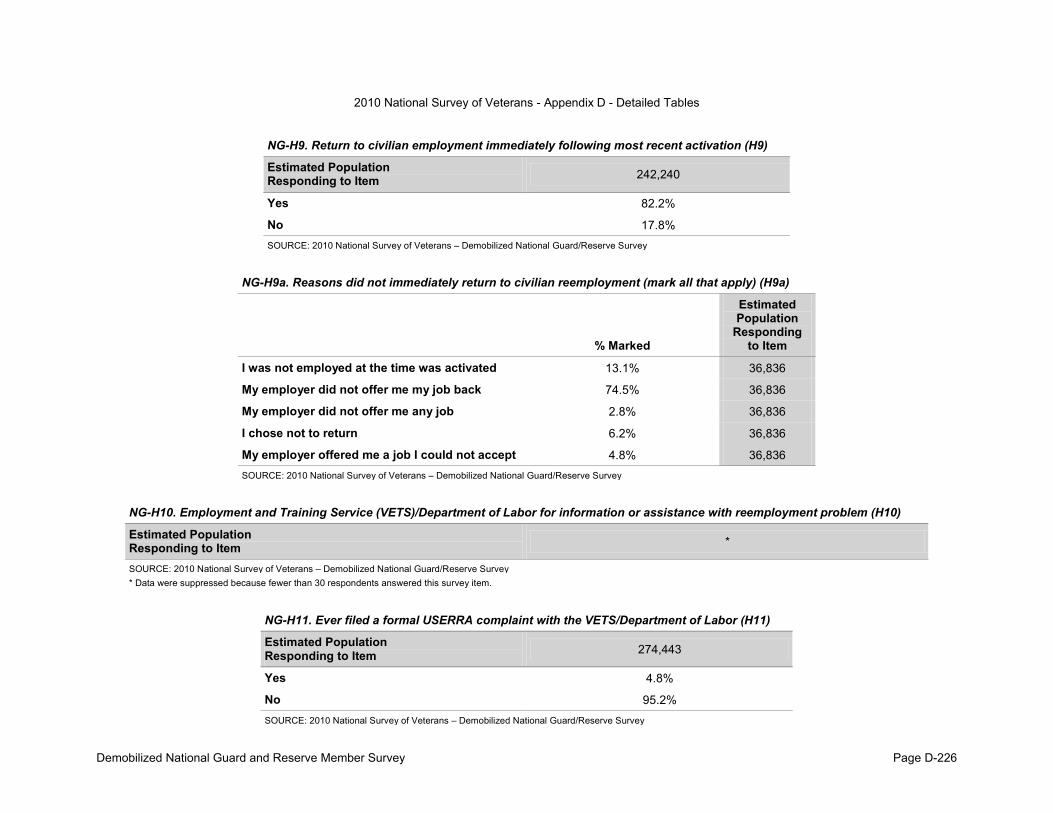
2010 National Survey of Veterans - Appendix D - Detailed Tables
Page D-226
NG-H9. Return to civilian employment immediately following most recent activation (H9)
Estimated Population Responding to Item 242,240
Yes 82.2%
No 17.8% SOURCE: 2010 National Survey of Veterans – Demobilized National Guard/Reserve Survey
NG-H9a. Reasons did not immediately return to civilian reemployment (mark all that apply) (H9a)
% Marked
Estimated Population
Responding to Item
I was not employed at the time was activated 13.1% 36,836
My employer did not offer me my job back 74.5% 36,836
My employer did not offer me any job 2.8% 36,836
I chose not to return 6.2% 36,836
My employer offered me a job I could not accept 4.8% 36,836 SOURCE: 2010 National Survey of Veterans – Demobilized National Guard/Reserve Survey
NG-H10. Employment and Training Service (VETS)/Department of Labor for information or assistance with reemployment problem (H10)
Estimated Population Responding to Item *
SOURCE: 2010 National Survey of Veterans – Demobilized National Guard/Reserve Survey * Data were suppressed because fewer than 30 respondents answered this survey item.
NG-H11. Ever filed a formal USERRA complaint with the VETS/Department of Labor (H11)
Estimated Population Responding to Item 274,443
Yes 4.8%
No 95.2% SOURCE: 2010 National Survey of Veterans – Demobilized National Guard/Reserve Survey
Demobilized National Guard and Reserve Member Survey

2010 National Survey of Veterans - Appendix D - Detailed Tables
Page D-227
NG-H12. Level of support from principal civilian employer of National Guard/Reserve obligations (H12)
Estimated Population Responding to Item 272,721
Very supportive 53.9%
Supportive 20.5%
Neither supportive nor unsupportive 9.7%
Unsupportive 2.9%
Very unsupportive 1.4%
Does not apply 11.6% SOURCE: 2010 National Survey of Veterans – Demobilized National Guard/Reserve Survey
NG-I1. Currently covered by VA life insurance VGLI/SGLI (I1)
Estimated Population Responding to Item 311,721
Yes, covered by VGLI 77.7%
Yes, covered by SDVI 22.3% SOURCE: 2010 National Survey of Veterans – Demobilized National Guard/Reserve Survey
NG-I2. Except SGLI policy, have life insurance from other source (I2)
Estimated Population Responding to Item 312,439
Yes 53.2%
No 46.8% SOURCE: 2010 National Survey of Veterans – Demobilized National Guard/Reserve Survey
Demobilized National Guard and Reserve Member Survey

2010 National Survey of Veterans - Appendix D - Detailed Tables
Page D-228
NG-I2a. If insurance from other source, coverage amount (I2a)
Estimated Population Responding to Item 151,960
Less than $10,000 4.2%
$10,000 to $49,999 22.6%
$50,000 to $99,999 16.2%
$100,000 to $199,999 26.2%
$200,000 to $399,999 11.6%
$400,000 to $599,999 12.4%
$600,000 to $999,999 3.9%
$1,000,000 or more 2.8% SOURCE: 2010 National Survey of Veterans – Demobilized National Guard/Reserve Survey
NG-I3. Aware of ability to convert SGLI to VGLI after separate from the National Guard/Reserves (I3)
Estimated Population Responding to Item 309,920
Yes 32.1%
No 67.7%
SGLI was not available to me 0.0%
SGLI was available, but I did not have it while on active duty 0.2% SOURCE: 2010 National Survey of Veterans – Demobilized National Guard/Reserve Survey
Demobilized National Guard and Reserve Member Survey

2010 National Survey of Veterans - Appendix D - Detailed Tables
Page D-229
NG-I4. Best way for VA to communicate VGLI program changes (I4)
Estimated Population Responding to Item 282,814
Email 36.7%
Direct mailings 57.6%
Veterans Affairs (VA) insurance web site (www.insurance.VA.gov) 4.8%
Other 1.0% SOURCE: 2010 National Survey of Veterans – Demobilized National Guard/Reserve Survey
NG-J1. Current living arrangement (J1)
Estimated Population Responding to Item 313,681
Rent my home 27.6%
Own my home—with an outstanding mortgage 53.3%
Own my home—no mortgage balance 4.4%
Occupy dwelling with no payment of cash rent 7.2%
Other 7.5% SOURCE: 2010 National Survey of Veterans – Demobilized National Guard/Reserve Survey
NG-J2. Aware of VA home loan guaranty program for eligible veterans (J2)
Estimated Population Responding to Item 314,715
Yes 69.9%
No 30.1% SOURCE: 2010 National Survey of Veterans – Demobilized National Guard/Reserve Survey
Demobilized National Guard and Reserve Member Survey

2010 National Survey of Veterans - Appendix D - Detailed Tables
Page D-230
NG-J3. Ever obtain home loan (J3)
Estimated Population Responding to Item 314,195
Yes 43.8%
No 56.2% SOURCE: 2010 National Survey of Veterans – Demobilized National Guard/Reserve Survey
NG-J3a. Lender discussed VA home loan guaranty as option (J3a)
Estimated Population Responding to Item 131,593
Yes 41.0%
No 34.7%
Don't remember 24.3% SOURCE: 2010 National Survey of Veterans – Demobilized National Guard/Reserve Survey
NG-J4. Ever used VA home loan guaranty program (J4)
Estimated Population Responding to Item 132,627
Yes, currently have VA home loan 30.9%
Yes, not currently, but have had VA home loan in the past 35.1%
No, never have had VA home loan 33.9% SOURCE: 2010 National Survey of Veterans – Demobilized National Guard/Reserve Survey
Demobilized National Guard and Reserve Member Survey

2010 National Survey of Veterans - Appendix D - Detailed Tables
Page D-231
NG-J4a. How long ago obtained most recent home loan (J4a)
Estimated Population Responding to Item 88,139
Within last 5 years 42.9%
6-10 years ago 24.1%
11-20 years ago 25.3%
More than 20 years ago 7.7% SOURCE: 2010 National Survey of Veterans – Demobilized National Guard/Reserve Survey
NG-J4b. When used VA home loan guaranty program (J4b)
Estimated Population Responding to Item 87,105
During active duty service 20.5%
After active duty service 68.7%
Both during and after active duty service 10.8% SOURCE: 2010 National Survey of Veterans – Demobilized National Guard/Reserve Survey
NG-J5. Most important reason used VA home loan (J5)
Estimated Population Responding to Item 72,464
VA loan program is offered only to U.S. Veterans 9.3%
No down payment required 61.3%
Convenience 5.3%
No mortgage insurance required 3.9%
Favorable interest rate 13.7%
Loan more likely to be approved 6.5%
VA's assistance to avoid foreclosure 0.0%
Previous experience with the VA loan program 0.0% SOURCE: 2010 National Survey of Veterans – Demobilized National Guard/Reserve Survey
Demobilized National Guard and Reserve Member Survey

2010 National Survey of Veterans - Appendix D - Detailed Tables
Page D-232
NG-J6. Main reason did not use VA home loan program (J6)
Estimated Population Responding to Item 40,942
A conventional FHA mortgage was easier or less expensive for me to obtain 36.1%
I applied for a VA home loan, but did not qualify 8.4%
I did not apply because I did not think that I would qualify 5.5%
I thought that the process for obtaining a VA loan would take too long 6.5%
My lender and/or realtor discouraged the use of the VA program 5.9%
The VA funding fee was too high 3.8%
I didn't know about the program 22.2%
Other 11.6% SOURCE: 2010 National Survey of Veterans – Demobilized National Guard/Reserve Survey
NG-K1. Satisfaction with ability to get accurate burial benefit information (K1)
Estimated Population Responding to Item 312,920
Very satisfied 2.1%
Satisfied 15.5%
Neither satisfied nor dissatisfied 28.4%
Dissatisfied 5.1%
Very dissatisfied 1.3%
I have not tried to get information 47.7% SOURCE: 2010 National Survey of Veterans – Demobilized National Guard/Reserve Survey
Demobilized National Guard and Reserve Member Survey

2010 National Survey of Veterans - Appendix D - Detailed Tables
Page D-233
NG-K2. Importance of various aspects if VA cemeteries: (K2)
Very
important Important Not very
important Not at all important
Don't know
Estimated Population
Responding to Item
Maintenance of the cemetery grounds 62.8% 26.0% 4.1% 0.5% 6.6% 312,039
Upkeep of headstones, markers, and wall covers for cremated remains 63.9% 25.6% 3.7% 0.5% 6.3% 313,073
Maintenance of other landscape features 56.3% 30.8% 5.4% 0.7% 6.8% 313,073
Appearance of committal shelters 56.2% 28.7% 4.8% 1.3% 9.0% 311,277
Appearance of individual gravesites 62.0% 27.5% 2.9% 0.9% 6.7% 309,154
Maintenance of cemetery buildings and roads 52.9% 35.2% 4.7% 0.9% 6.4% 313,073
Cemetery’s front gate and entrance area 54.1% 31.6% 6.8% 0.9% 6.6% 313,073
Availability of parking and/or restrooms 44.2% 37.1% 10.2% 1.2% 7.3% 312,553
Public ceremonies and events that honor Veterans 62.3% 24.0% 6.5% 0.7% 6.5% 310,283
Presentation of military funeral honors 71.1% 18.6% 3.4% 0.3% 6.5% 309,154
Other specify 21.1% 8.8% 6.7% 0.8% 62.6% 61,579 SOURCE: 2010 National Survey of Veterans – Demobilized National Guard/Reserve Survey
Demobilized National Guard and Reserve Member Survey

2010 National Survey of Veterans - Appendix D - Detailed Tables
Page D-234
NG-K3. Heard of the following burial benefits before today: (K3)
Yes No Don't know
Estimated Population
Responding to Item
Burial at a VA National or State Veterans cemetery 46.7% 41.3% 11.9% 314,195
Headstone and burial markers provided by VA at private cemeteries 26.7% 60.5% 12.8% 313,676
Presidential Memorial Certificates for next of kin 12.4% 73.8% 13.7% 313,676
Cash plot allowance 9.4% 76.4% 14.2% 314,195
Cash burial allowance 11.8% 74.6% 13.5% 311,469
Military Funeral Honors 60.7% 31.4% 7.9% 313,587
Receiving a US Flag 66.3% 27.8% 5.9% 313,681 SOURCE: 2010 National Survey of Veterans – Demobilized National Guard/Reserve Survey
NG-L1. Plan for type of burial (L1)
Estimated Population Responding to Item 312,128
In-ground, casket burial 49.8%
Cremation, in-ground burial 12.4%
Cremation, columbarium (a vault for cremated remains) 5.6%
Mausoleum (i.e., tomb within a monument or building) 1.1%
Something else 5.7%
Don’t know 25.3% SOURCE: 2010 National Survey of Veterans – Demobilized National Guard/Reserve Survey
Demobilized National Guard and Reserve Member Survey

2010 National Survey of Veterans - Appendix D - Detailed Tables
Page D-235
NG-L2. Plan to be buried in VA national or state cemetery (L2)
Estimated Population Responding to Item 314,195
Yes 21.2%
No 27.0%
Don't know 51.9% SOURCE: 2010 National Survey of Veterans – Demobilized National Guard/Reserve Survey
NG-L2a. Reasons planning burial in VA cemetery: (L2a)
% Marked
Estimated Population
Responding to Item
No cost 29.1% 201,571
Friends or family buried there 8.5% 201,571
Quality of services 19.0% 201,571
The honor of burial in a VA National shrine 44.2% 201,571
My connection to the military/past service to country 56.3% 201,571
Other specify 2.2% 201,571
Don’t know 30.9% 201,571 SOURCE: 2010 National Survey of Veterans – Demobilized National Guard/Reserve Survey
Demobilized National Guard and Reserve Member Survey

2010 National Survey of Veterans - Appendix D - Detailed Tables
Page D-236
NG-L3. Reasons not planning for burial in VA cemetery: (L3)
% Marked
Estimated Population
Responding to Item
Don’t know eligibility criteria 31.7% 82,410
Quality of services 0.0% 82,410
Don’t know how to make arrangements with VA 13.0% 82,410
Made other arrangements 21.4% 82,410
VA services don’t accommodate religious preferences 0.6% 82,410
Veterans cemetery too far away (distance) 19.9% 82,410
Travel time to Veterans cemetery too long 10.3% 82,410
Appearance of cemetery doesn’t meet my expectations 0.6% 82,410
Want location close to other family members 55.4% 82,410
Want services that are not available at Veterans cemetery 2.1% 82,410
Too difficult to make arrangements with VA 2.6% 82,410
Unable to make advance arrangements with VA 0.6% 82,410
Other specify 7.8% 82,410
Don’t know 6.1% 82,410 SOURCE: 2010 National Survey of Veterans – Demobilized National Guard/Reserve Survey
NG-L4. If burial in private cemetery, plan for headstone/marker from VA (L4)
Estimated Population Responding to Item 80,600
Yes 35.9%
No 15.4%
Don't know 48.7% SOURCE: 2010 National Survey of Veterans – Demobilized National Guard/Reserve Survey
Demobilized National Guard and Reserve Member Survey

2010 National Survey of Veterans - Appendix D - Detailed Tables
Page D-237
NG-L4a. Reasons not planning on headstone/marker from VE: (L4a)
% Marked
Estimated Population
Responding to Item
Don’t know about headstones and markers for Veterans * *
Made other arrangements * *
Wants headstone similar to other family members * *
Don’t like VA headstones and markers * *
Other specify * *
Don’t know * * SOURCE: 2010 National Survey of Veterans – Demobilized National Guard/Reserve Survey * Data were suppressed because fewer than 30 respondents answered this survey item.
NG-L5. Burial option preference (L5)
Estimated Population Responding to Item 307,731
Casket burial, in-ground 60.3%
Casket burial, in a mausoleum 4.0%
Cremation, ashes buried in-ground 7.7%
Cremation, ashes placed in a columbarium 4.4%
Cremation, ashes scattered 16.4%
Cremation, ashes kept by my family 4.5%
Something not listed 2.6% SOURCE: 2010 National Survey of Veterans – Demobilized National Guard/Reserve Survey
Demobilized National Guard and Reserve Member Survey

2010 National Survey of Veterans - Appendix D - Detailed Tables
Page D-238
NG-L5a. Which of the following burial options are acceptable: (L5a)
% Marked
Estimated Population
Responding to Item
Casket burial, in-ground 46.8% 308,927
Casket burial, in a mausoleum 35.9% 308,927
Cremation, ashes buried in-ground 30.3% 308,927
Cremation, ashes places in a columbarium 16.3% 308,927
Cremation, ashes scattered 26.6% 308,927
Cremation, ashes kept by my family 20.1% 308,927
Something not listed 3.3% 308,927 SOURCE: 2010 National Survey of Veterans – Demobilized National Guard/Reserve Survey
NG-M1. Use Internet, at least occasionally (M1)
Estimated Population Responding to Item 314,195
Yes 98.8%
No 1.2% SOURCE: 2010 National Survey of Veterans – Demobilized National Guard/Reserve Survey
NG-M2. How often access Internet/world wide web (M2)
Estimated Population Responding to Item 297,600
At least once a day 79.0%
At least once a week but not every day 17.2%
At least once a month but less than once a week 3.5%
At least once a year but less than once a month 0.3%
Less than once a year 0.0% SOURCE: 2010 National Survey of Veterans – Demobilized National Guard/Reserve Survey
Demobilized National Guard and Reserve Member Survey
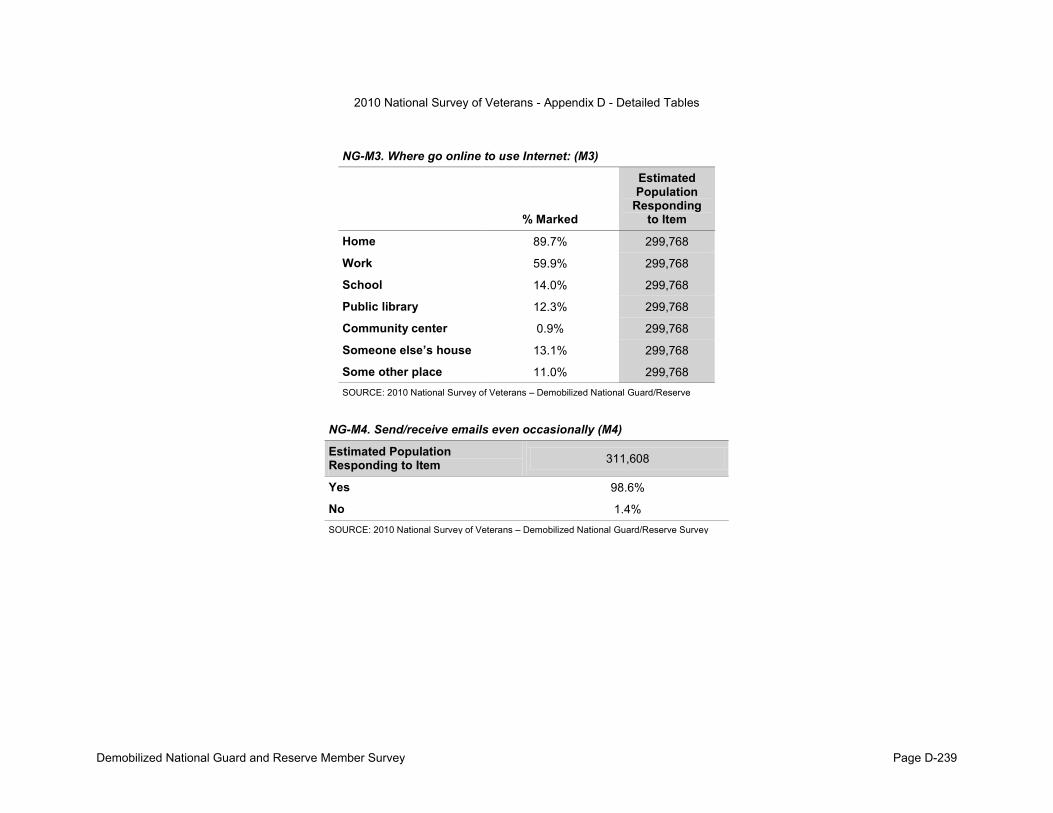
2010 National Survey of Veterans - Appendix D - Detailed Tables
Page D-239
NG-M3. Where go online to use Internet: (M3)
% Marked
Estimated Population
Responding to Item
Home 89.7% 299,768
Work 59.9% 299,768
School 14.0% 299,768
Public library 12.3% 299,768
Community center 0.9% 299,768
Someone else’s house 13.1% 299,768
Some other place 11.0% 299,768 SOURCE: 2010 National Survey of Veterans – Demobilized National Guard/Reserve
NG-M4. Send/receive emails even occasionally (M4)
Estimated Population Responding to Item 311,608
Yes 98.6%
No 1.4% SOURCE: 2010 National Survey of Veterans – Demobilized National Guard/Reserve Survey
Demobilized National Guard and Reserve Member Survey

2010 National Survey of Veterans - Appendix D - Detailed Tables
Page D-240
NG-M4a. Where go online to send/receive emails (M4a)
% Marked
Estimated Population
Responding to Item
Home 89.1% 293,122
Work 59.1% 293,122
School 13.1% 293,122
Public Library 10.8% 293,122
Community Center 1.7% 293,122
Someone else’s house 11.0% 293,122
Some other place 12.1% 293,122 SOURCE: 2010 National Survey of Veterans – Demobilized National Guard/Reserve
NG-M5. Willingness to use Internet for the following activities: (M5)
Very
willing Somewhat
willing
Neither willing
nor unwilling
Somewhat unwilling
Very unwilling
Estimated Population
Responding to Item
Obtaining news and information 64.4% 25.6% 6.2% 1.6% 2.2% 314,195
Carrying out research on services 65.5% 26.3% 6.5% 1.2% 0.5% 313,676
Purchasing goods or services 51.9% 30.1% 9.2% 6.1% 2.7% 313,676
Responding to polls or surveys 36.3% 26.4% 22.1% 8.9% 6.3% 313,067
Obtain information about VA benefits 56.3% 30.7% 10.2% 1.9% 0.8% 314,195
Apply for VA benefits 59.4% 29.0% 6.6% 2.8% 2.3% 314,195 SOURCE: 2010 National Survey of Veterans – Demobilized National Guard/Reserve Survey
Demobilized National Guard and Reserve Member Survey

2010 National Survey of Veterans - Appendix D - Detailed Tables
Page D-241
NG-M6. Ever used the MyHealtheVet website to obtain information regarding personal health care (M6)
Estimated Population Responding to Item 314,195
Yes 6.0%
No 94.0% SOURCE: 2010 National Survey of Veterans – Demobilized National Guard/Reserve Survey
NG-M7. Want to receive VA information via Internet or World Wide Web ((M7)
Estimated Population Responding to Item 313,676
Yes 80.2%
No 19.8% SOURCE: 2010 National Survey of Veterans – Demobilized National Guard/Reserve Survey
Demobilized National Guard and Reserve Member Survey

2010 National Survey of Veterans - Appendix D - Detailed Tables
Page D-242
NG-N1. Sources of family income in last 12 months (N1)
Yes No Don't know
Estimated Population
Responding to Item
Wages, salary, commissions, bonuses, or tips from all jobs 91.4% 7.2% 1.5% 310,564
Self-employment income from own nonfarm businesses or farm businesses, including proprietorships and partnerships 14.7% 83.1% 2.2% 282,989
Interest, dividends, net rental income, royalty income, or income from estates and trusts 30.1% 65.0% 5.0% 287,910
Social Security or Railroad Retirement 2.3% 95.3% 2.5% 278,540
Supplemental Security Income (SSI) 2.2% 94.7% 3.0% 278,459
Any public assistance or welfare payments from the state or local welfare office 3.6% 94.0% 2.4% 277,506
Retirement, survivor, or disability pensions 5.2% 92.2% 2.6% 281,381
Veterans’ (VA) service-connected disability compensation payments 20.9% 77.1% 2.0% 286,029
All other VA payments (eg, VA education payments) 14.5% 83.1% 2.4% 283,856
Any other sources of income received regularly such as unemployment compensation, child support or alimony 17.1% 81.3% 1.6% 280,049
SOURCE: 2010 National Survey of Veterans – Demobilized National Guard/Reserve Survey
Demobilized National Guard and Reserve Member Survey

2010 National Survey of Veterans - Appendix D - Detailed Tables
Page D-243
NG-N2. Total family income range past 12 months (N2)
Estimated Population Responding to Item 311,328
$5,000 to $7,499 1.3%
$7,500 to $9,999 1.5%
$10,000 to $12,499 1.2%
$12,500 to $14,999 3.6%
$15,000 to $19,999 3.6%
$20,000 to $24,999 3.4%
$25,000 to $29,999 5.2%
$30,000 to $34,999 4.7%
$35,000 to $39,999 8.1%
$40,000 to $49,999 6.1%
$50,000 to $59,999 9.2%
$60,000 to $74,999 14.3%
$75,000 to $99,999 17.7%
$100,000 to $149,999 15.3%
$150,000 or more 4.8% SOURCE: 2010 National Survey of Veterans – Demobilized National Guard/Reserve Survey
NG-O1. Gender (O1)
Estimated Population Responding to Item 312,642
Male 82.7%
Female 17.3% SOURCE: 2010 National Survey of Veterans – Demobilized National Guard/Reserve Survey
Demobilized National Guard and Reserve Member Survey

2010 National Survey of Veterans - Appendix D - Detailed Tables
Page D-244
NG-O2. Age (O2)
Estimated Population Responding to Item 310,175
Younger than 25 10.6%
25 to 29 28.0%
30 to 34 9.2%
35 to 39 9.5%
40 to 44 14.1%
45 to 49 15.0%
50 to 54 8.1%
55 to 59 4.3%
60 to 64 1.0%
65 to 69 0.2% SOURCE: 2010 National Survey of Veterans – Demobilized National Guard/Reserve Survey
NG-O3. Number minor children (O3)
Estimated Population Responding to Item 297,704
No minor children 48.6%
1 Minor child 19.7%
2 Minor children 19.9%
3 Minor children 9.1%
4 or more minor children 2.6% SOURCE: 2010 National Survey of Veterans – Demobilized National Guard/Reserve Survey
Demobilized National Guard and Reserve Member Survey

2010 National Survey of Veterans - Appendix D - Detailed Tables
Page D-245
NG-O3. Number dependent older children (O3)
Estimated Population Responding to Item 276,425
No dependent older children 80.6%
1 Dependent older child 13.4%
2 Dependent older children 4.6%
3 Dependent older children 1.0%
4 or more dependent older children 0.4% SOURCE: 2010 National Survey of Veterans – Demobilized National Guard/Reserve Survey
NG-O4. Highest degree/school level you completed (O4)
Estimated Population Responding to Item 313,162
High school diploma / GED 19.7%
Some college credit, but less than 1 year of college credit 11.7%
1 or more years of college credit, no degree 19.0%
Associate's degree (for example, AA, AS) 12.6%
Bachelor's degree (for example, BA, BS) 25.2%
Master's degree (for example, MA, MS, MEng, MEd, MSW, MBA) 9.1%
Professional degree beyond a bachelor's degree (for example, MD, DDS, DVM, LLB, JD) 2.3%
Doctorate degree (for example, PhD, EdD) 0.3% SOURCE: 2010 National Survey of Veterans – Demobilized National Guard/Reserve Survey
Demobilized National Guard and Reserve Member Survey

2010 National Survey of Veterans - Appendix D - Detailed Tables
Page D-246
NG-O5. Hispanic/Latino/Spanish origin (O5)
Estimated Population Responding to Item 307,815
No, not of Hispanic, Latino, or Spanish origin 89.4%
Yes, Cuban 0.2%
Yes, Mexican, Mexican American, Chicano 5.3%
Yes, Puerto Rican 2.0%
Yes, another Hispanic, Latino, or Spanish origin For example: Argentinean, Colombian, Dominican, Nicaraguan, Salvadoran, Spaniard, and so on. 3.2%
SOURCE: 2010 National Survey of Veterans – Demobilized National Guard/Reserve Survey
NG-O6. Race (O6)
% Marked
Estimated Population
Responding to Item
White 83.3% 301,907
Black or African American 9.8% 301,907
American Indian or Alaska Native 3.6% 301,907
Asian Indian 0.3% 301,907
Chinese 0.7% 301,907
Filipino 1.4% 301,907
Other Asian (for example, Hmong, Laotian, Thai, Pakistani, Cambodian, and so on) 2.8% 301,907
Native Hawaiian 0.3% 301,907
Guamanian or Chamorro 0.3% 301,907
Samoan 0.4% 301,907
Other Pacific Islander (for example, Fijian, Tongan, and so on) 1.6% 301,907 SOURCE: 2010 National Survey of Veterans – Demobilized National Guard/Reserve Survey
Demobilized National Guard and Reserve Member Survey

2010 National Survey of Veterans - Appendix D - Detailed Tables
Page D-247
NG-O7. Current marital status (O7)
Estimated Population Responding to Item 311,442
Now Married 61.3%
Widowed 0.6%
Divorced 10.6%
Separated 1.6%
Never Married 25.4%
Civil Commitment or Union 0.5% SOURCE: 2010 National Survey of Veterans – Demobilized National Guard/Reserve Survey
Demobilized National Guard and Reserve Member Survey

2010 National Survey of Veterans - Appendix D - Detailed Tables
Active Duty Service Member Survey Page D-248
AD-A1. Currently on active duty (A1)
Estimated Population Responding to Item 1,043,361
Yes 100.0%
No 0.0% SOURCE: 2010 National Survey of Veterans – Active Duty Service Member Survey
AD-A2. Year first entered active duty (A2)
Estimated Population Responding to Item 1,030,855
1965 to 1969 0.3%
1970 to 1974 0.7%
1975 to 1979 0.7%
1980 to 1984 2.1%
1985 to 1989 9.5%
1990 to 1994 10.9%
1995 to 1999 13.5%
2000 to 2004 29.4%
2005 to 2009 33.0% SOURCE: 2010 National Survey of Veterans – Active Duty Service Member Survey

2010 National Survey of Veterans - Appendix D - Detailed Tables
Active Duty Service Member Survey Page D-249
AD-A3. Branch of Uniformed Services currently serving (A3)
Estimated Population Responding to Item 1,040,215
Army 37.2%
Navy 20.7%
Air Force 22.6%
Marine Corps 13.5%
Coast Guard 6.0%
Other 0.0% SOURCE: 2010 National Survey of Veterans – Active Duty Service Member Survey
AD-A4. During military service: exposure to dead/dying/wounded people (A4)
Estimated Population Responding to Item 1,041,896
Yes 54.3%
No 45.7% SOURCE: 2010 National Survey of Veterans – Active Duty Service Member Survey
AD-A5. Ever prisoner of war (A5)
Estimated Population Responding to Item 1,041,896
Yes 0.4%
No 99.6% SOURCE: 2010 National Survey of Veterans – Active Duty Service Member Survey

2010 National Survey of Veterans - Appendix D - Detailed Tables
Active Duty Service Member Survey Page D-250
AD-A6. During military service: exposure to environmental hazards (A6)
Estimated Population Responding to Item 1,040,430
Definitely Yes 17.4%
Probably Yes 19.4%
Probably No 27.9%
Definitely No 24.4%
Don't know 11.0% SOURCE: 2010 National Survey of Veterans – Active Duty Service Member Survey
AD-B1. In past 12 months looked for VA benefits information on the following: (B1)
Yes No
Estimated Population
Responding to Item
Eligibility for VA health care 19.5% 80.5% 1,003,996
VA health care facility locations 18.7% 81.3% 993,798
VA life insurance 13.9% 86.1% 991,897
VA home loans 37.4% 62.6% 1,013,791
VA education and training 40.2% 59.8% 1,005,291
VA vocational rehabilitation 9.9% 90.1% 989,643
VA burial and memorial benefits 10.0% 90.0% 995,023
VA disability compensation and pension 21.2% 78.8% 1,001,647
VA benefits for dependents and survivors 18.5% 81.5% 996,009
VA prescription benefits 14.8% 85.2% 992,431 SOURCE: 2010 National Survey of Veterans – Active Duty Service Member Survey

2010 National Survey of Veterans - Appendix D - Detailed Tables
Active Duty Service Member Survey Page D-251
AD-B2. Level of awareness of the following VA benefits: (B2)
Very aware Aware Somewhat aware Barely aware Not aware at all
Estimated Population
Responding to Item
Eligibility for VA health care 8.3% 25.7% 32.4% 21.7% 11.9% 1,038,795
VA life insurance 7.6% 20.5% 24.5% 29.9% 17.5% 1,032,872
VA home loans 22.3% 31.3% 22.7% 13.3% 10.4% 1,034,002
VA education and training 15.3% 25.7% 24.4% 19.0% 15.5% 1,037,330
VA vocational rehabilitation 4.2% 15.2% 25.1% 27.7% 27.8% 1,037,330
VA burial and memorial benefits 7.5% 19.9% 21.5% 29.2% 21.9% 1,037,330
VA disability compensation and pension 7.4% 21.4% 27.2% 24.9% 19.0% 1,030,925
VA benefits for dependents and survivors 4.7% 19.4% 25.5% 26.7% 23.7% 1,032,872
VA prescription benefits 4.0% 17.2% 26.3% 27.1% 25.4% 1,037,330 SOURCE: 2010 National Survey of Veterans – Active Duty Service Member Survey
AD-B3. Consider transferring education benefits (B3)
Yes No Don't know
Estimated Population
Responding to Item
Would you consider transferring your entitlement to education benefits to your spouse? 49.7% 24.1% 26.2% 1,031,926
Would you consider transferring your entitlement to education benefits to your dependent child? 65.0% 7.1% 27.9% 1,034,356
SOURCE: 2010 National Survey of Veterans – Active Duty Service Member Survey

2010 National Survey of Veterans - Appendix D - Detailed Tables
Active Duty Service Member Survey Page D-252
AD-B4. Satisfaction with VA benefits/services information (B4)
Estimated Population Responding to Item 1,035,843
Very satisfied 5.8%
Satisfied 37.1%
Neither satisfied nor dissatisfied 44.1%
Dissatisfied 11.1%
Very dissatisfied 1.9% SOURCE: 2010 National Survey of Veterans – Active Duty Service Member Survey
AD-B5. Past year, source used for VA info: (B5)
% Marked
Estimated Population
Responding to Item
VA web site 49.6% 1,011,236
Veteran service organization 7.4% 1,011,236
My local VA office 10.0% 1,011,236
VA health care facility 6.0% 1,011,236
VA Toll-Free Help Line 5.6% 1,011,236
VA Veterans Benefits Handbook 12.5% 1,011,236
A Veteran 16.4% 1,011,236
Other 3.7% 1,011,236 SOURCE: 2010 National Survey of Veterans – Active Duty Service Member Survey

2010 National Survey of Veterans - Appendix D - Detailed Tables
Active Duty Service Member Survey Page D-253
AD-B5a. Information source most difficult to use (B5a)
Estimated Population Responding to Item 455,174
VA web site 39.8%
Veteran service organization 1.9%
My local VA office 10.1%
VA health care facility 3.7%
VA Toll-Free Help Line 14.0%
VA Veterans Benefits Handbook 5.6%
A Veteran 10.7%
Other 14.3% SOURCE: 2010 National Survey of Veterans – Active Duty Service Member Survey
AD-B5b. Information source easiest to use (B5b)
Estimated Population Responding to Item 529,525
VA web site 58.2%
Veteran service organization 3.4%
My local VA office 10.3%
VA health care facility 2.7%
VA Toll-Free Help Line 1.9%
VA Veterans Benefits Handbook 2.9%
A Veteran 15.4%
Other 5.1% SOURCE: 2010 National Survey of Veterans – Active Duty Service Member Survey

2010 National Survey of Veterans - Appendix D - Detailed Tables
Active Duty Service Member Survey Page D-254
AD-B6. Most preferred way to get answers to VA questions (B6)
Estimated Population Responding to Item 950,505
Mail 11.9%
Telephone 8.2%
Email 21.8%
Face to face 31.2%
Internet site 26.8% SOURCE: 2010 National Survey of Veterans – Active Duty Service Member Survey
AD-B7. Least preferred way to get answers to VA questions (B7)
Estimated Population Responding to Item 960,799
Mail 35.0%
Telephone 44.6%
Email 8.4%
Face to face 4.3%
Internet site 7.7% SOURCE: 2010 National Survey of Veterans – Active Duty Service Member Survey

2010 National Survey of Veterans - Appendix D - Detailed Tables
Active Duty Service Member Survey Page D-255
AD-C1. General health status (C1)
Estimated Population Responding to Item 1,034,004
Excellent 25.8%
Very good 39.5%
Good 27.7%
Fair 5.8%
Poor 1.1% SOURCE: 2010 National Survey of Veterans – Active Duty Service Member Survey
AD-C2. Plan to use VA health services after active duty (C2)
Estimated Population Responding to Item 1,037,308
Yes 60.6%
No 4.7%
Not sure 34.7% SOURCE: 2010 National Survey of Veterans – Active Duty Service Member Survey

2010 National Survey of Veterans - Appendix D - Detailed Tables
Active Duty Service Member Survey Page D-256
AD-C3. Primary way to use VA health care in future (C3)
Estimated Population Responding to Item 600,945
As your primary source of health care 48.7%
In addition to non-VA care for some services 23.3%
A "safety net" to use only if I lose other sources of health care 17.6%
For prescriptions 2.4%
For specialized care 3.0%
Some other way 3.2%
No plans to use VA for health care 1.8% SOURCE: 2010 National Survey of Veterans – Active Duty Service Member Survey
AD-D1. Ever use military Tuition Assistance program (D1)
Estimated Population Responding to Item 1,032,378
Yes 52.4%
No 47.6% SOURCE: 2010 National Survey of Veterans – Active Duty Service Member Survey
AD-D2. Excluding VA voc rehab, ever use VA education/training benefits (D2)
Estimated Population Responding to Item 1,030,207
Yes 19.3%
No 80.7% SOURCE: 2010 National Survey of Veterans – Active Duty Service Member Survey

2010 National Survey of Veterans - Appendix D - Detailed Tables
Active Duty Service Member Survey Page D-257
AD-D2a. Used VA education benefit how: (D2a)
% Marked
Estimated Population
Responding to Item
Took college or university coursework leading to a bachelor or graduate degree 68.4% 200,554
Attended business, technical or vocational school training leading to a certificate or diploma 13.1% 200,554
Participated in an apprenticeship or on-job training program 6.2% 200,554
Took correspondence courses 12.4% 200,554
Took flight training 0.7% 200,554
Received tutorial assistance, refresher courses, or deficiency training 4.4% 200,554
Attended a teacher certification program 0.0% 200,554
Did something else 15.2% 200,554 SOURCE: 2010 National Survey of Veterans – Active Duty Service Member Survey
AD-D2b. Completed training/received degree/certificate enrolled for and receiving VA education (D2b)
Estimated Population Responding to Item 198,988
Yes 38.5%
No 18.4%
Still in training 43.0% SOURCE: 2010 National Survey of Veterans – Active Duty Service Member Survey

2010 National Survey of Veterans - Appendix D - Detailed Tables
Active Duty Service Member Survey Page D-258
AD-D2c. Importance of your VA educ benefits for educational goals or better life (D2c)
Estimated Population Responding to Item 209,042
Extremely important 64.8%
Very important 21.0%
Moderately important 10.6%
Slightly important 1.5%
Not at all important 2.1% SOURCE: 2010 National Survey of Veterans – Active Duty Service Member Survey
AD-D3. Reasons not use VA education assistance (D3)
% Marked
Estimated Population
Responding to Item
Not aware of VA education or training benefits 26.9% 808,962
Don’t believe I’m entitled to or eligible for education or training benefits 5.4% 808,962
Plan on using after I leave active duty service 34.4% 808,962
Using Tuition Assistance (TA) instead 25.6% 808,962
Too busy to use the benefit 27.5% 808,962
Chose not to contribute to the Montgomery GI Bill 4.5% 808,962
Don’t need any additional education or training 4.7% 808,962
Other 8.3% 808,962 SOURCE: 2010 National Survey of Veterans – Active Duty Service Member Survey

2010 National Survey of Veterans - Appendix D - Detailed Tables
Active Duty Service Member Survey Page D-259
AD-E1. Have Servicemembers Group Life Insurance (E1)
Estimated Population Responding to Item 1,036,321
Yes 94.4%
No 5.6% SOURCE: 2010 National Survey of Veterans – Active Duty Service Member Survey
AD-E2. Aware possible to convert SGLI to VGLI after discharge (E2)
Estimated Population Responding to Item 1,035,828
Yes 41.8%
No 58.2% SOURCE: 2010 National Survey of Veterans – Active Duty Service Member Survey
AD-E3. Have life insurance through organization other than SGLI (E3)
Estimated Population Responding to Item 1,040,260
Yes 29.4%
No 70.6% SOURCE: 2010 National Survey of Veterans – Active Duty Service Member Survey

2010 National Survey of Veterans - Appendix D - Detailed Tables
Active Duty Service Member Survey Page D-260
AD-F1. Your current living arrangement (F1)
Estimated Population Responding to Item 1,034,377
Live in military housing 24.1%
Rent my home 36.8%
Own my home - with outstanding mortgage 34.1%
Own my home - no mortgage balance 1.2%
Occupy dwelling with no payment of cash rent 1.5%
Other 2.3% SOURCE: 2010 National Survey of Veterans – Active Duty Service Member Survey
AD-F2. Ever obtain home loan to purchase/refinance/make home improvement (F2)
Estimated Population Responding to Item 1,037,308
Yes 45.5%
No 54.5% SOURCE: 2010 National Survey of Veterans – Active Duty Service Member Survey
AD-F2a. Obtaining home loan, lender discuss VA home loan guaranty as option (F2a)
Estimated Population Responding to Item 460,815
Yes 50.8%
No 20.2%
Don't remember 28.9% SOURCE: 2010 National Survey of Veterans – Active Duty Service Member Survey

2010 National Survey of Veterans - Appendix D - Detailed Tables
Active Duty Service Member Survey Page D-261
AD-F3. Aware VA home loan guaranty program for servicemembers (F3)
Estimated Population Responding to Item 464,888
Yes 75.3%
No 24.7% SOURCE: 2010 National Survey of Veterans – Active Duty Service Member Survey
AD-F4. Ever use VA home loan guaranty program (F4)
Estimated Population Responding to Item 467,819
Yes, current 49.9%
Yes, past 31.7%
No 18.4% SOURCE: 2010 National Survey of Veterans – Active Duty Service Member Survey
AD-F5. How long ago obtain most recent home loan (F5)
Estimated Population Responding to Item 380,227
Within last 5 years 71.7%
6-10 years ago 16.9%
11-20 years ago 10.7%
More than 20 years ago 0.7% SOURCE: 2010 National Survey of Veterans – Active Duty Service Member Survey

2010 National Survey of Veterans - Appendix D - Detailed Tables
Active Duty Service Member Survey Page D-262
AD-F6. Most important reason to get VA home loan (F6)
Estimated Population Responding to Item 341,673
VA loan program is offered only to U.S. Veterans 10.2%
No down payment required 60.5%
Convenience 4.1%
No mortgage insurance required 7.2%
Favorable interest rate 11.7%
Loan more likely to be approved 4.7%
VA's assistance to avoid foreclosure 0.0%
Previous experience with the VA loan program 1.6% SOURCE: 2010 National Survey of Veterans – Active Duty Service Member Survey
AD-F7. Main reason not use VA home loan program (F7)
Estimated Population Responding to Item 85,155
A conventional FHA mortgage was easier or less expensive for me to obtain 34.9%
I applied for a VA home loan, but did not qualify 8.9%
I did not apply because I did not think that I would qualify 8.7%
I thought that the process for obtaining a VA loan would take too long 4.1%
My lender and/or realtor discouraged the use of the VA program 4.2%
The VA funding fee was too high 10.1%
I didn't know about the program 8.4%
Other 20.6% SOURCE: 2010 National Survey of Veterans – Active Duty Service Member Survey
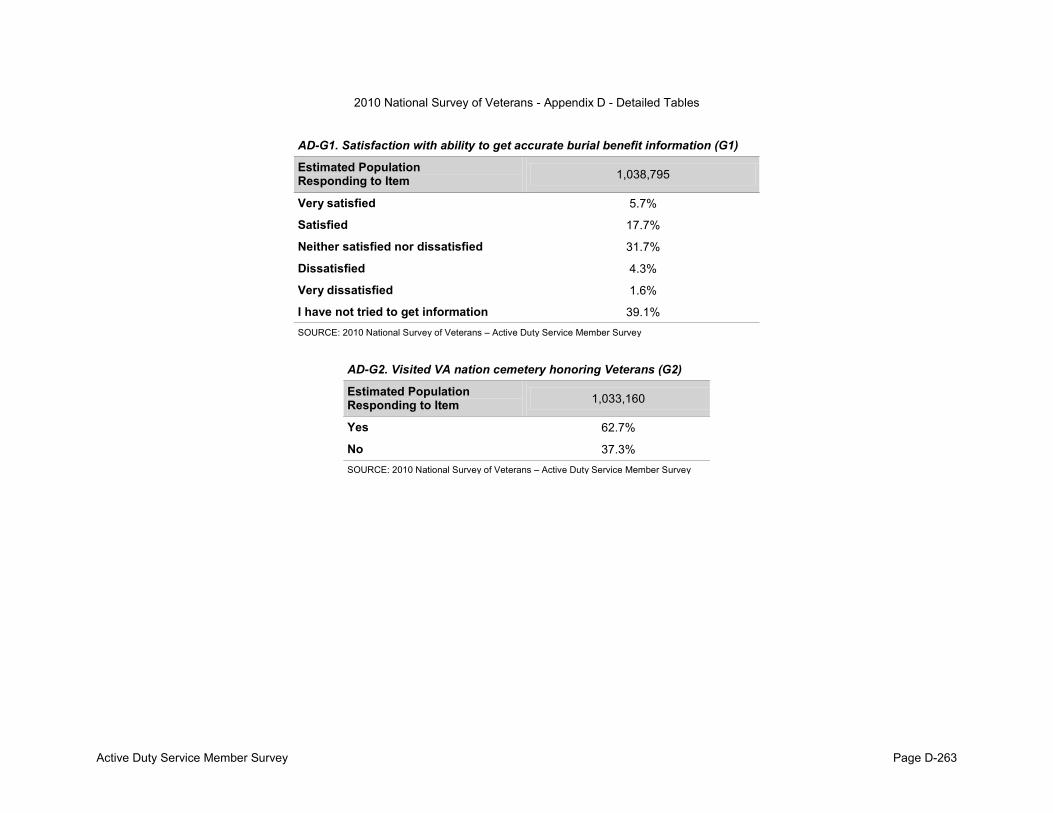
2010 National Survey of Veterans - Appendix D - Detailed Tables
Active Duty Service Member Survey Page D-263
AD-G1. Satisfaction with ability to get accurate burial benefit information (G1)
Estimated Population Responding to Item 1,038,795
Very satisfied 5.7%
Satisfied 17.7%
Neither satisfied nor dissatisfied 31.7%
Dissatisfied 4.3%
Very dissatisfied 1.6%
I have not tried to get information 39.1% SOURCE: 2010 National Survey of Veterans – Active Duty Service Member Survey
AD-G2. Visited VA nation cemetery honoring Veterans (G2)
Estimated Population Responding to Item 1,033,160
Yes 62.7%
No 37.3% SOURCE: 2010 National Survey of Veterans – Active Duty Service Member Survey

2010 National Survey of Veterans - Appendix D - Detailed Tables
Active Duty Service Member Survey Page D-264
AD-G3. Importance of VA cemeteries as shrines (G3)
Very
important Important Not very
important Not at all important
Don't know
Estimated Population
Responding to Item
Maintenance of the cemetery grounds 65.6% 25.2% 0.7% 1.1% 7.4% 1,005,927
Upkeep of headstones, markers, and wall covers for cremated remains 66.0% 24.1% 1.0% 1.1% 7.8% 1,011,850
Maintenance of other landscape features 50.0% 37.5% 3.2% 1.4% 8.0% 1,002,889
Appearance of committal shelters 49.5% 30.0% 4.8% 1.1% 14.5% 1,011,850
Appearance of individual gravesites 58.6% 31.1% 1.8% 1.1% 7.5% 1,011,850
Maintenance of cemetery buildings and roads 49.4% 38.2% 4.0% 1.1% 7.3% 1,008,883
Cemetery’s front gate and entrance area 52.1% 35.1% 3.5% 1.5% 7.8% 1,011,850
Availability of parking and/or restrooms 44.9% 32.2% 12.2% 2.5% 8.1% 1,002,611
Public ceremonies and events that honor Veterans 60.6% 25.7% 4.9% 1.5% 7.3% 1,010,385
Presentation of military funeral honors 70.0% 20.9% 1.1% 1.1% 6.9% 1,011,850
Other specify 30.8% 21.6% 1.7% 1.4% 44.5% 260,163 SOURCE: 2010 National Survey of Veterans – Active Duty Service Member Survey

2010 National Survey of Veterans - Appendix D - Detailed Tables
Active Duty Service Member Survey Page D-265
AD-G4. Heard of benefit before today: (G4)
Yes No Don't know
Estimated Population
Responding to Item
Burial at a VA National or State Veterans cemetery 55.3% 33.1% 11.7% 1,016,598
Headstone and burial markers provided by VA at private cemeteries 34.6% 53.0% 12.4% 1,016,598
Presidential Memorial Certificates for next of kin 23.8% 62.4% 13.8% 1,015,132
Cash plot allowance 17.2% 68.5% 14.3% 1,007,411
Cash burial allowance 20.9% 66.3% 12.8% 1,012,165
Military Funeral Honors 65.3% 26.0% 8.7% 1,014,160
Receiving a US Flag 70.6% 20.5% 9.0% 1,015,757 SOURCE: 2010 National Survey of Veterans – Active Duty Service Member Survey
AD-H1. Type of burial you’ll have (H1)
Estimated Population Responding to Item 1,000,480
Casket burial, in-ground 44.9%
Cremation, in-ground 6.0%
Cremation, columbarium 3.7%
Mausoleum 2.1%
Something else 11.1%
Don’t know 32.2% SOURCE: 2010 National Survey of Veterans – Active Duty Service Member Survey

2010 National Survey of Veterans - Appendix D - Detailed Tables
Active Duty Service Member Survey Page D-266
AD-H2. Plan to be buried in VA national or state cemetery (H2)
Estimated Population Responding to Item 1,016,456
Yes 19.3%
No 29.9%
Don't know 50.8% SOURCE: 2010 National Survey of Veterans – Active Duty Service Member Survey
AD-H2a. Reason want burial in VA national/state cemetery (H2a)
% Marked
Estimated Population
Responding to Item
No cost 29.3% 668,676
Friends or family buried there 6.3% 668,676
Quality of services 18.3% 668,676
The honor of burial in a VA National shrine 43.4% 668,676
My connection to the military/past service to country 49.4% 668,676
Other specify 2.5% 668,676
Don’t know 30.6% 668,676 SOURCE: 2010 National Survey of Veterans – Active Duty Service Member Survey
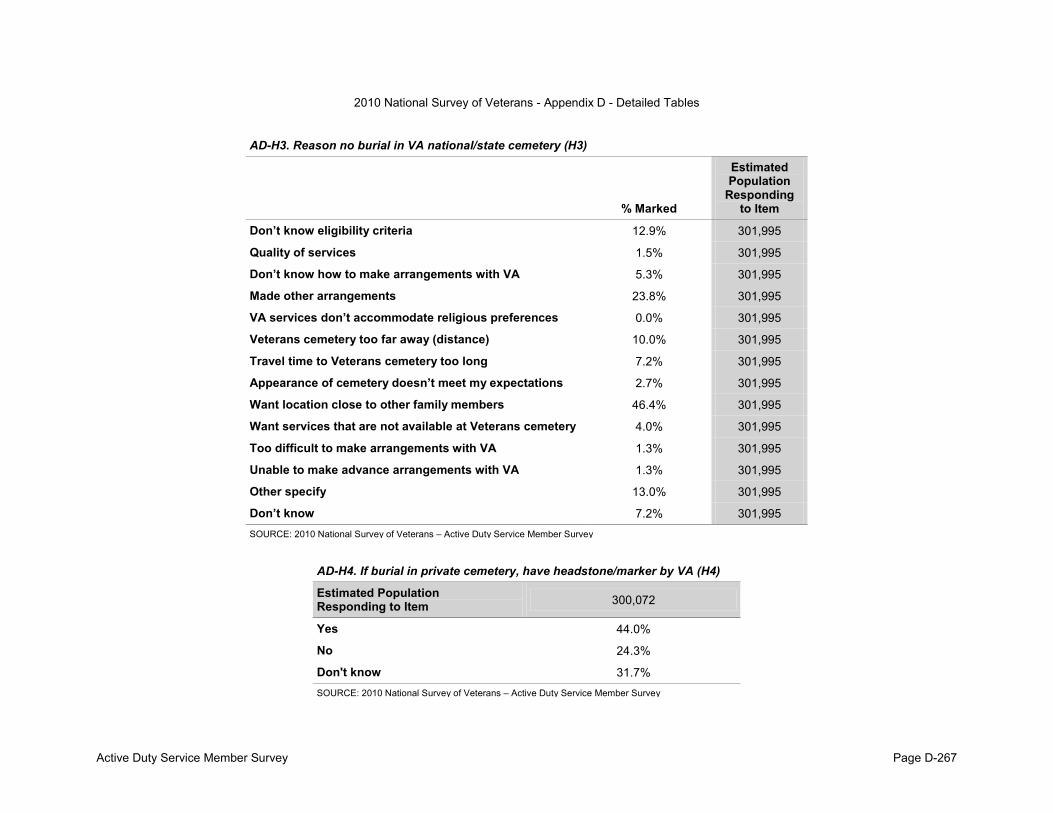
2010 National Survey of Veterans - Appendix D - Detailed Tables
Active Duty Service Member Survey Page D-267
AD-H3. Reason no burial in VA national/state cemetery (H3)
% Marked
Estimated Population
Responding to Item
Don’t know eligibility criteria 12.9% 301,995
Quality of services 1.5% 301,995
Don’t know how to make arrangements with VA 5.3% 301,995
Made other arrangements 23.8% 301,995
VA services don’t accommodate religious preferences 0.0% 301,995
Veterans cemetery too far away (distance) 10.0% 301,995
Travel time to Veterans cemetery too long 7.2% 301,995
Appearance of cemetery doesn’t meet my expectations 2.7% 301,995
Want location close to other family members 46.4% 301,995
Want services that are not available at Veterans cemetery 4.0% 301,995
Too difficult to make arrangements with VA 1.3% 301,995
Unable to make advance arrangements with VA 1.3% 301,995
Other specify 13.0% 301,995
Don’t know 7.2% 301,995 SOURCE: 2010 National Survey of Veterans – Active Duty Service Member Survey
AD-H4. If burial in private cemetery, have headstone/marker by VA (H4)
Estimated Population Responding to Item 300,072
Yes 44.0%
No 24.3%
Don't know 31.7% SOURCE: 2010 National Survey of Veterans – Active Duty Service Member Survey

2010 National Survey of Veterans - Appendix D - Detailed Tables
Active Duty Service Member Survey Page D-268
AD-H4a. Reason not use headstone/marker from VA: (H4a)
% Marked
Estimated Population
Responding to Item
Don’t know about headstones and markers for Veterans 7.9% 76,036
Made other arrangements 36.9% 76,036
Wants headstone similar to other family members 11.7% 76,036
Don’t like VA headstones and markers 10.7% 76,036
Other specify 38.7% 76,036
Don’t know 0.0% 76,036 SOURCE: 2010 National Survey of Veterans – Active Duty Service Member Survey
AD-H5. Burial option preference (H5)
Estimated Population Responding to Item 969,290
Casket burial, in-ground 55.2%
Casket burial, in a mausoleum 5.6%
Cremation, ashes buried in-ground 6.7%
Cremation, ashes placed in a columbarium 2.2%
Cremation, ashes scattered 18.6%
Cremation, ashes kept by my family 6.3%
Something not listed 5.4% SOURCE: 2010 National Survey of Veterans – Active Duty Service Member Survey

2010 National Survey of Veterans - Appendix D - Detailed Tables
Active Duty Service Member Survey Page D-269
AD-H6. Burial option acceptable: (H6)
% Marked
Estimated Population
Responding to Item
Casket burial, in-ground 45.2% 980,207
Casket burial, in a mausoleum 35.5% 980,207
Cremation, ashes buried in-ground 27.8% 980,207
Cremation, ashes places in a columbarium 15.8% 980,207
Cremation, ashes scattered 28.9% 980,207
Cremation, ashes kept by my family 30.3% 980,207
Something not listed 8.5% 980,207 SOURCE: 2010 National Survey of Veterans – Active Duty Service Member Survey
AD-I1. Use Internet at least occasionally (I1)
Estimated Population Responding to Item 1,019,152
Yes 99.1%
No 0.9% SOURCE: 2010 National Survey of Veterans – Active Duty Service Member Survey
AD-I2. How often access Internet/World Wide Web (I2)
Estimated Population Responding to Item 987,636
At least once a day 92.2%
At least once a week but not every day 7.5%
At least once a month but less than once a week 0.3%
At least once a year but less than once a month 0.0%
Less than once a year 0.0% SOURCE: 2010 National Survey of Veterans – Active Duty Service Member Survey

2010 National Survey of Veterans - Appendix D - Detailed Tables
Active Duty Service Member Survey Page D-270
AD-I3. Where go online to use Internet: (I3)
% Marked
Estimated Population
Responding to Item
Home 94.6% 990,242
Work 84.7% 990,242
School 8.6% 990,242
Public library 13.5% 990,242
Community center 4.7% 990,242
Someone else’s house 15.4% 990,242
Some other place 7.4% 990,242 SOURCE: 2010 National Survey of Veterans – Active Duty Service Member Survey
AD-I4. Send/receive emails even occasionally (I4)
Estimated Population Responding to Item 1,006,496
Yes 99.0%
No 1.0% SOURCE: 2010 National Survey of Veterans – Active Duty Service Member Survey

2010 National Survey of Veterans - Appendix D - Detailed Tables
Active Duty Service Member Survey Page D-271
AD-I5. Where go online to send/receive emails: (I5)
% Marked
Estimated Population
Responding to Item
Home 94.8% 978,570
Work 84.8% 978,570
School 7.5% 978,570
Public library 8.2% 978,570
Community center 4.2% 978,570
Someone else’s house 10.5% 978,570
Some other place 7.1% 978,570 SOURCE: 2010 National Survey of Veterans – Active Duty Service Member Survey
AD-I6. Use of Internet for activities: (I6)
Very
willing Somewhat
willing
Neither willing
nor unwilling
Somewhat unwilling
Very unwilling
Estimated Population
Responding to Item
Obtaining news and information 72.7% 18.1% 5.6% 1.8% 1.8% 1,016,056
Carrying out research on services 73.7% 18.9% 4.6% 1.3% 1.5% 1,019,360
Purchasing goods or services 60.7% 28.6% 5.5% 2.2% 3.0% 1,014,902
Responding to polls or surveys 40.3% 25.8% 14.1% 12.2% 7.7% 1,013,617
Obtain information about VA benefits 57.3% 29.4% 9.0% 2.4% 1.8% 1,016,259
Apply for VA benefits 61.6% 25.5% 6.6% 3.8% 2.5% 1,017,895 SOURCE: 2010 National Survey of Veterans – Active Duty Service Member Survey

2010 National Survey of Veterans - Appendix D - Detailed Tables
Active Duty Service Member Survey Page D-272
AD-I7. Want to receive VA information via Internet or World Wide Web (I7)
Estimated Population Responding to Item 1,013,772
Yes 81.6%
No 18.4% SOURCE: 2010 National Survey of Veterans – Active Duty Service Member Survey
AD-I8. Accessed website for transitioning servicemembers assistance (I8)
Estimated Population Responding to Item 1,014,902
Yes 45.6%
No 54.4% SOURCE: 2010 National Survey of Veterans – Active Duty Service Member Survey
AD-J1. Gender (J1)
Estimated Population Responding to Item 1,011,602
Male 86.0%
Female 14.0% SOURCE: 2010 National Survey of Veterans – Active Duty Service Member Survey

2010 National Survey of Veterans - Appendix D - Detailed Tables
Active Duty Service Member Survey Page D-273
AD-J2. Age (J2)
Estimated Population Responding to Item 1,043,361
24 years or younger 20.0%
25 to 34 50.4%
35 to 44 21.8%
45 to 54 6.8%
55 or older 1.0% SOURCE: 2010 National Survey of Veterans – Active Duty Service Member Survey
AD-J3. Number minor children (J3)
Estimated Population Responding to Item 988,803
No minor children 41.5%
1 Minor child 21.1%
2 Minor children 24.9%
3 Minor children 8.6%
4 or more minor children 4.0% SOURCE: 2010 National Survey of Veterans – Active Duty Service Member Survey
AD-J3. Number dependent older children (J3)
Estimated Population Responding to Item 878,922
No dependent older children 89.8%
1 Dependent older child 7.3%
2 Dependent older children 2.5%
3 Dependent older children 0.3%
4 or more dependent older children 0.1% SOURCE: 2010 National Survey of Veterans – Active Duty Service Member Survey

2010 National Survey of Veterans - Appendix D - Detailed Tables
Active Duty Service Member Survey Page D-274
AD-J4. Highest degree/school level you completed (J4)
Estimated Population Responding to Item 1,015,611
Less than high school 0.0%
High school diploma / GED 13.6%
Some college credit, but less than 1 year of college credit 19.8%
1 or more years of college credit, no degree 20.1%
Associate's degree (for example, AA, AS) 9.9%
Bachelor's degree (for example, BA, BS) 23.3%
Master's degree (for example, MA, MS, MEng, MEd, MSW, MBA) 9.2%
Professional degree beyond a bachelor's degree (for example, MD, DDS, DVM, LLB, JD) 3.3%
Doctorate degree (for example, PhD, EdD) 0.8% SOURCE: 2010 National Survey of Veterans – Active Duty Service Member Survey
AD-J5. Hispanic/Latino/Spanish origin (J5)
Estimated Population Responding to Item 981,022
No, not of Hispanic, Latino, or Spanish origin 82.9%
Yes, Cuban 0.2%
Yes, Mexican, Mexican American, Chicano 7.4%
Yes, Puerto Rican 5.3%
Yes, another Hispanic, Latino, or Spanish origin For example: Argentinean, Colombian, Dominican, Nicaraguan, Salvadoran, Spaniard, and so on. 4.1%
SOURCE: 2010 National Survey of Veterans – Active Duty Service Member Survey

2010 National Survey of Veterans - Appendix D - Detailed Tables
Active Duty Service Member Survey Page D-275
AD-J6. Your race (J6)
% Marked
Estimated Population
Responding to Item
White 79.0% 948,689
Black or African American 16.7% 948,689
American Indian or Alaska Native 5.1% 948,689
Asian Indian 0.0% 948,689
Chinese 0.5% 948,689
Filipino 1.8% 948,689
Other Asian (for example, Hmong, Laotian, Thai, Pakistani, Cambodian, and so on) 1.1% 948,689
Native Hawaiian 0.0% 948,689
Guamanian or Chamorro 0.1% 948,689
Samoan 0.0% 948,689
Other Pacific Islander (for example, Fijian, Tongan, and so on) 0.8% 948,689 SOURCE: 2010 National Survey of Veterans – Active Duty Service Member Survey
AD-J7. Current marital status (J7)
Estimated Population Responding to Item 1,011,157
Now Married 68.2%
Widowed 0.3%
Divorced 6.3%
Separated 2.2%
Never Married 23.1%
Civil Commitment or Union 0.0% SOURCE: 2010 National Survey of Veterans – Active Duty Service Member Survey

2010 National Survey of Veterans - Appendix D - Detailed Tables
Veteran Spouse Survey Page D-276
VS-A1. In the past year, have you received any information regarding Veterans Affairs (VA) benefits/services for you or your spouse? (A1)
Estimated Population Responding to Item 14,815,709
Yes 16.7%
No 78.0%
Don't know 5.3% SOURCE: 2010 National Survey of Veterans – Veteran Spouse Survey
VS-A2. Through what means did you receive information regarding VA benefits/services? Mark all that apply. (A2)
% Marked
Estimated Population
Responding to Item
Through mail 86.0% 2,385,910
Through email 17.1% 2,385,910
Through a newsletter 3.6% 2,385,910
Through VA newsletter 8.0% 2,385,910
Through TV/media 5.9% 2,385,910
Other 7.4% 2,385,910 SOURCE: 2010 National Survey of Veterans – Veteran Spouse Survey

2010 National Survey of Veterans - Appendix D - Detailed Tables
Veteran Spouse Survey Page D-277
VS-A3. Past 12 months looked for information: (A3)
Yes No
Estimated Population
Responding to Item
Eligibility for VA health care 9.7% 90.3% 14,238,849
A VA health care facility 6.8% 93.2% 13,793,246
VA life insurance 4.9% 95.1% 13,696,743
VA home loans 7.0% 93.0% 13,850,998
VA education and training 5.6% 94.4% 13,776,756
VA vocational rehabilitation 1.4% 98.6% 13,770,673
VA burial and memorial benefits 5.3% 94.7% 13,987,177
VA disability compensation and pension 5.5% 94.5% 13,937,543
VA benefits for dependents and survivors 5.9% 94.1% 13,947,728
VA transition assistance 1.9% 98.1% 13,663,148
VA prescription benefits 7.7% 92.3% 14,023,649 SOURCE: 2010 National Survey of Veterans – Veteran Spouse Survey

2010 National Survey of Veterans - Appendix D - Detailed Tables
Veteran Spouse Survey Page D-278
VS-A4. Awareness of VA benefits/services: (A4)
Very aware Aware Somewhat aware Barely aware Not aware at all
Estimated Population
Responding to Item
Eligibility for VA health care 7.1% 7.5% 18.2% 18.4% 48.8% 14,522,360
Locating a VA health care facility 15.9% 17.0% 16.8% 13.5% 36.8% 14,470,618
VA life insurance 5.1% 5.4% 10.2% 16.2% 63.1% 14,474,348
VA home loans 12.2% 13.3% 16.9% 14.1% 43.5% 14,321,399
VA education and training 6.5% 7.9% 15.3% 14.8% 55.5% 14,451,356
VA vocational rehabilitation 4.7% 4.8% 11.2% 15.5% 63.8% 14,421,380
VA burial and memorial benefits 5.5% 9.5% 15.9% 19.4% 49.8% 14,507,739
VA disability compensation and pension 5.7% 6.8% 12.4% 17.9% 57.2% 14,410,017
VA benefits for dependents and survivors 3.0% 5.8% 11.1% 18.6% 61.6% 14,573,651
VA transition assistance 3.4% 1.9% 8.2% 15.7% 70.8% 14,396,820
VA prescription benefits 8.2% 5.0% 11.3% 13.8% 61.7% 14,510,703 SOURCE: 2010 National Survey of Veterans – Veteran Spouse Survey
VS-B1. Work status during the last week (B1)
Estimated Population Responding to Item 14,131,443
Working, or on paid vacation or sick leave from work 46.0%
Not working, but looking for work 4.9%
Not working and not looking for work 49.0% SOURCE: 2010 National Survey of Veterans – Veteran Spouse Survey

2010 National Survey of Veterans - Appendix D - Detailed Tables
Veteran Spouse Survey Page D-279
VS-B2. Average hours per week working (B2)
Estimated Population Responding to Item 5,958,182
Less than 10 hours per week 4.2%
Between 10 and 19 hours per week 2.9%
Between 20 and 39 hours per week 27.6%
40 hours per week 48.7%
More than 40 hours per week 16.7% SOURCE: 2010 National Survey of Veterans – Veteran Spouse Survey
VS-B3. Reasons working less than 35 hours/week (B3)
% Marked
Estimated Population
Responding to Item
Do not want to work 35 hours or more 41.1% 2,040,439
Need flexibility due to spouse’s employment 4.7% 2,040,439
Could only find part-time work 12.9% 2,040,439
Seasonal work 3.1% 2,040,439
Child care responsibilities 10.5% 2,040,439
Responsible for caring for my spouse’s health/medical limitations 2.9% 2,040,439
My personal health/medical limitations 9.9% 2,040,439
Other family/personal obligations 8.1% 2,040,439
Need schooling/training/certification 1.9% 2,040,439
In school 0.4% 2,040,439
Other 32.7% 2,040,439 SOURCE: 2010 National Survey of Veterans – Veteran Spouse Survey

2010 National Survey of Veterans - Appendix D - Detailed Tables
Veteran Spouse Survey Page D-280
VS-B4. Worked at current job: (B4)
Estimated Population Responding to Item 6,034,619
Less than 1 year 11.6%
1 year 6.5%
2-4 years 14.6%
5-9 years 20.9%
10 or more years 46.7% SOURCE: 2010 National Survey of Veterans – Veteran Spouse Survey
VS-B5. Satisfaction with employment/career opportunities (B5)
Estimated Population Responding to Item 13,696,097
Does not apply, I am not interested in employment 44.5%
Very satisfied 17.4%
Satisfied 25.6%
Dissatisfied 8.4%
Very dissatisfied 4.1% SOURCE: 2010 National Survey of Veterans – Veteran Spouse Survey

2010 National Survey of Veterans - Appendix D - Detailed Tables
Veteran Spouse Survey Page D-281
VS-C1. When spouse left military (C1)
Estimated Population Responding to Item 15,002,965
1920 to 1945 2.8%
1946 to 1950 15.7%
1951 to 1955 6.3%
1956 to 1960 8.8%
1961 to 1965 8.9%
1966 to 1970 10.6%
1971 to 1975 15.3%
1976 to 1980 6.2%
1981 to 1985 4.5%
1986 to 1990 6.5%
1991 to 1995 4.9%
1996 to 2000 3.8%
2001 to 2005 3.6%
2006 to 2010 2.1% SOURCE: 2010 National Survey of Veterans – Veteran Spouse Survey
VS-C2. Number of years spouse served in military (C2)
Estimated Population Responding to Item 12,856,574
1-2 years 26.6%
3-4 years 36.8%
5-19 years 24.7%
20 years 4.1%
More than 20 years 7.7% SOURCE: 2010 National Survey of Veterans – Veteran Spouse Survey

2010 National Survey of Veterans - Appendix D - Detailed Tables
Veteran Spouse Survey Page D-282
VS-C3. Veteran spouse discharged for disability (C3)
Estimated Population Responding to Item 14,055,252
Yes 4.8%
No 93.1%
Don't know 2.1% SOURCE: 2010 National Survey of Veterans – Veteran Spouse Survey
VS-D1. Spouse have service-connected disability rating (D1)
Estimated Population Responding to Item 13,811,001
Yes 12.6%
No 87.4% SOURCE: 2010 National Survey of Veterans – Veteran Spouse Survey
VS-D1a. Service-connected disability prevented spouse from getting/holding job (D1a)
Estimated Population Responding to Item 1,412,162
Yes 30.1%
No 69.9% SOURCE: 2010 National Survey of Veterans – Veteran Spouse Survey

2010 National Survey of Veterans - Appendix D - Detailed Tables
Veteran Spouse Survey Page D-283
VS-D1b. Spouses current VA service-connected disability rating (D1b)
Estimated Population Responding to Item 1,785,757
0 percent 3.8%
10 to 20 percent 41.8%
30 to 40 percent 15.9%
50 to 60 percent 13.3%
70 percent or higher 13.9%
Don't know 11.3% SOURCE: 2010 National Survey of Veterans – Veteran Spouse Survey
VS-D2. Spouse a prisoner of war (D2)
Estimated Population Responding to Item 1,867,683
Yes 0.0%
No 100.0% SOURCE: 2010 National Survey of Veterans – Veteran Spouse Survey
VS-E1. Your general health status (E1)
Estimated Population Responding to Item 14,312,830
Excellent 11.8%
Very good 36.8%
Good 35.7%
Fair 13.0%
Poor 2.7% SOURCE: 2010 National Survey of Veterans – Veteran Spouse Survey

2010 National Survey of Veterans - Appendix D - Detailed Tables
Veteran Spouse Survey Page D-284
VS-E2. Currently need aid and assistance of another person (E2)
Estimated Population Responding to Item 14,298,818
Yes 5.1%
No 94.9% SOURCE: 2010 National Survey of Veterans – Veteran Spouse Survey
VS-E3. You are permanently housebound (E3)
Estimated Population Responding to Item 14,409,397
Yes 1.2%
No 98.8% SOURCE: 2010 National Survey of Veterans – Veteran Spouse Survey
VS-F1. Current health coverage: (F1)
% Marked
Estimated Population
Responding to Item
No health insurance 5.2% 14,463,842
Insurance through a current or former employer or union 58.9% 14,463,842
Insurance purchased directly from an insurance company 13.7% 14,463,842
Medicare 35.4% 14,463,842
Medicaid, Medical Assistance, or other government-assistance plan 2.1% 14,463,842
TRICARE, TRICARE for Life or other military health care 10.8% 14,463,842
CHAMPVA 0.4% 14,463,842
Indian Health Service 0.5% 14,463,842
Other type of health insurance or health coverage plan 3.4% 14,463,842 SOURCE: 2010 National Survey of Veterans – Veteran Spouse Survey

2010 National Survey of Veterans - Appendix D - Detailed Tables
Veteran Spouse Survey Page D-285
VS-F2. Familiarity of CHAMPVA benefits/eligibility (F2)
Estimated Population Responding to Item 14,428,754
Extremely familiar 0.6%
Moderately familiar 1.4%
Somewhat familiar 3.3%
Slightly familiar 4.7%
Not at all familiar 90.1% SOURCE: 2010 National Survey of Veterans – Veteran Spouse Survey
VS-G1. Used any VA education assistance (G1)
Estimated Population Responding to Item 14,371,065
Yes 4.9%
No 95.1% SOURCE: 2010 National Survey of Veterans – Veteran Spouse Survey

2010 National Survey of Veterans - Appendix D - Detailed Tables
Veteran Spouse Survey Page D-286
VS-G2. How used VA education benefits: (G2)
% Marked
Estimated Population
Responding to Item
College or university coursework leading to a degree 53.3% 578,259
Business, technical or vocational school leading to certificate or diploma 30.1% 578,259
Participated in an apprenticeship or on-job training program 2.8% 578,259
Took correspondence courses 5.5% 578,259
Took flight training 1.2% 578,259
Received tutorial assistance, refresher courses, or deficiency training 0.0% 578,259
Attended a teacher certification program 2.5% 578,259
Did something else 10.6% 578,259 SOURCE: 2010 National Survey of Veterans – Veteran Spouse Survey
VS-G2a. Completed training/received degree or certificate you were enrolled for/receiving VA education (G2a)
Estimated Population Responding to Item 636,481
Yes 57.7%
No 42.3% SOURCE: 2010 National Survey of Veterans – Veteran Spouse Survey

2010 National Survey of Veterans - Appendix D - Detailed Tables
Veteran Spouse Survey Page D-287
VS-G2b. Importance of VA education benefits for your educational goals or better life (G2b)
Estimated Population Responding to Item 703,236
Extremely important 30.5%
Very important 25.6%
Moderately important 15.3%
Slightly important 15.1%
Not at all important 13.4% SOURCE: 2010 National Survey of Veterans – Veteran Spouse Survey
VS-G3. Reasons not use VA educ assist: (G3)
% Marked
Estimated Population
Responding to Item
Not aware of VA education or training benefits 47.9% 13,446,231
Don’t believe entitled to or eligible for education or training benefits 40.7% 13,446,231
My period of eligibility expired/ran out 3.0% 13,446,231
Don’t know how to apply for education or training benefits 13.2% 13,446,231
Don’t need any additional education or training 17.3% 13,446,231
Don’t need or want assistance from VA 8.5% 13,446,231
Too much trouble or red tape 3.7% 13,446,231
Never considered getting any education or training from VA 34.2% 13,446,231
Other 3.2% 13,446,231 SOURCE: 2010 National Survey of Veterans – Veteran Spouse Survey

2010 National Survey of Veterans - Appendix D - Detailed Tables
Veteran Spouse Survey Page D-288
VS-H1. Your current living arrangement (H1)
Estimated Population Responding to Item 14,391,946
Rent my home 6.5%
Own my home—with an outstanding mortgage 52.0%
Own my home—no mortgage balance 38.5%
Occupy dwelling with no payment of cash rent 1.1%
Other 1.9% SOURCE: 2010 National Survey of Veterans – Veteran Spouse Survey
VS-H2. Ever obtain home loan for purchase/refinance/make home improvements (H2)
Estimated Population Responding to Item 14,436,006
Yes 58.0%
No 42.0% SOURCE: 2010 National Survey of Veterans – Veteran Spouse Survey
VS-H2a. Obtaining loan, lender discuss VA home loan guaranty as option (H2a)
Estimated Population Responding to Item 7,814,906
Yes 22.9%
No 36.1%
Don't remember 41.0% SOURCE: 2010 National Survey of Veterans – Veteran Spouse Survey

2010 National Survey of Veterans - Appendix D - Detailed Tables
Veteran Spouse Survey Page D-289
VS-H3. Ever use VA home loan guaranty program (H3)
Estimated Population Responding to Item 7,763,205
Yes, current 11.4%
Yes, past 45.3%
No 43.3% SOURCE: 2010 National Survey of Veterans – Veteran Spouse Survey
VS-H3a. How long ago obtain most recent home loan (H3a)
Estimated Population Responding to Item 4,193,914
Within last 5 years 13.4%
6-10 years ago 23.9%
11-20 years ago 20.1%
More than 20 years ago 42.5% SOURCE: 2010 National Survey of Veterans – Veteran Spouse Survey
VS-H3b. When use VA home loan guaranty program (H3b)
Estimated Population Responding to Item 4,303,112
During active duty service 18.7%
After active duty service 75.3%
Both during and after active duty service 6.0% SOURCE: 2010 National Survey of Veterans – Veteran Spouse Survey

2010 National Survey of Veterans - Appendix D - Detailed Tables
Veteran Spouse Survey Page D-290
VS-H4. Most important reason to use VA home loan (H4)
Estimated Population Responding to Item 3,614,787
No down payment required 49.8%
Convenience 8.6%
No mortgage insurance required 2.5%
Favorable interest rate 28.1%
Loan more likely to be approved 8.9%
VA's assistance to avoid foreclosure 0.0%
Previous experience with the VA loan program 2.1% SOURCE: 2010 National Survey of Veterans – Veteran Spouse Survey
VS-H5. Main reason not use VA home loan program (H5)
Estimated Population Responding to Item 2,770,661
A conventional FHA mortgage was easier or less expensive for me to obtain 27.3%
I applied for a VA home loan, but did not qualify 0.0%
I did not apply because I did not think that I would qualify 14.4%
I thought that the process for obtaining a VA loan would take too long 0.5%
My lender and/or realtor discouraged the use of the VA program 6.9%
The VA funding fee was too high 0.0%
I didn't know about the program 40.5%
Other 10.4% SOURCE: 2010 National Survey of Veterans – Veteran Spouse Survey

2010 National Survey of Veterans - Appendix D - Detailed Tables
Veteran Spouse Survey Page D-291
VS-H6. Aware VA home loan guaranty prog for eligible spouses (H6)
Estimated Population Responding to Item 3,303,636
Yes 6.4%
No 93.6% SOURCE: 2010 National Survey of Veterans – Veteran Spouse Survey
VS-I1. Satisfaction with ability to get accurate burial benefit info (I1)
Estimated Population Responding to Item 14,525,394
Very satisfied 3.2%
Satisfied 6.0%
Neither satisfied nor dissatisfied 15.1%
Dissatisfied 1.6%
Very dissatisfied 1.1%
I have not tried to get information 73.0% SOURCE: 2010 National Survey of Veterans – Veteran Spouse Survey

2010 National Survey of Veterans - Appendix D - Detailed Tables
Veteran Spouse Survey Page D-292
VS-I2. Importance of VA cemeteries as shrines: (I2)
Very
important Important Not very
important Not at all important
Don't know
Estimated Population
Responding to Item
Maintenance of cemetery grounds 51.7% 33.5% 0.8% 1.4% 12.7% 13,802,720
Upkeep of headstones, markers, and wall covers for cremated remains 51.9% 32.9% 1.4% 1.3% 12.5% 13,996,014
Maintenance of other landscape features 44.7% 38.1% 2.7% 1.8% 12.7% 13,957,965
Appearance of committal shelters 43.3% 34.3% 3.7% 2.2% 16.5% 13,829,327
Appearance of individual gravesites 50.2% 33.7% 2.4% 1.3% 12.4% 13,815,600
Maintenance of cemetery buildings and roads 46.4% 37.4% 2.1% 1.4% 12.7% 13,866,624
Cemetery’s front gate and entrance area 45.5% 36.0% 4.8% 1.4% 12.3% 13,849,423
Availability of parking and/or restrooms 41.3% 35.0% 8.4% 2.1% 13.3% 13,845,646
Public ceremonies and events that honor Veterans 49.1% 34.0% 2.8% 1.4% 12.7% 13,899,656
Presentation of military funeral honors 52.7% 30.3% 2.4% 1.1% 13.5% 13,911,556
Other 24.2% 15.9% 2.4% 2.4% 55.1% 2,222,977 SOURCE: 2010 National Survey of Veterans – Veteran Spouse Survey

2010 National Survey of Veterans - Appendix D - Detailed Tables
Veteran Spouse Survey Page D-293
VS-I3. Heard of benefit before today: (I3)
Yes No Don't know
Estimated Population
Responding to Item
Burial at a VA National or State Veterans cemetery 39.1% 41.4% 19.5% 14,062,558
Headstone and burial markers provided by VA at private cemeteries 23.3% 58.7% 18.0% 14,038,988
Presidential Memorial Certificates for next of kin 5.3% 70.0% 24.8% 13,790,591
Cash plot allowance 4.0% 69.7% 26.3% 13,859,047
Cash burial allowance 8.3% 66.1% 25.6% 13,905,826
Military Funeral Honors 33.7% 45.9% 20.3% 13,808,274
Receiving a U.S. Flag 44.2% 38.7% 17.1% 13,940,397 SOURCE: 2010 National Survey of Veterans – Veteran Spouse Survey
VS-J1. Type of burial you’ll have (J1)
Estimated Population Responding to Item 14,057,007
Casket burial, in-ground 44.3%
Cremation, in-ground 17.1%
Cremation, columbarium 9.3%
Mausoleum 3.1%
Something else 11.1%
Don’t know 15.1% SOURCE: 2010 National Survey of Veterans – Veteran Spouse Survey

2010 National Survey of Veterans - Appendix D - Detailed Tables
Veteran Spouse Survey Page D-294
VS-J2. Plan to be buried in VA National or State cemetery (J2)
Estimated Population Responding to Item 14,218,852
Yes 11.6%
No 64.8%
Don't know 23.6% SOURCE: 2010 National Survey of Veterans – Veteran Spouse Survey
VS-J2a. Reasons want burial in VA National/State cemetery: (J2a)
% Marked
Estimated Population
Responding to Item
No cost 34.1% 4,097,289
Spouse planning to be buried there 37.1% 4,097,289
Friends or family buried there 7.4% 4,097,289
Quality of services 16.3% 4,097,289
The honor of burial in a VA National shrine 22.4% 4,097,289
My spouse’s connection to the military/past service to the country 38.6% 4,097,289
Other 4.5% 4,097,289
Don’t Know 38.8% 4,097,289 SOURCE: 2010 National Survey of Veterans – Veteran Spouse Survey

2010 National Survey of Veterans - Appendix D - Detailed Tables
Veteran Spouse Survey Page D-295
VS-J3. Reason no burial in VA National/State cemetery: (J3)
% Marked
Estimated Population
Responding to Item
Don’t know eligibility criteria 38.4% 8,954,998
Spouse not (planning to be) buried there 48.4% 8,954,998
Quality of services 0.0% 8,954,998
Don’t know how to make arrangements with VA 12.2% 8,954,998
Made other arrangements 34.1% 8,954,998
VA services don’t accommodate religious preferences 1.7% 8,954,998
Veterans cemetery too far away (distance) 13.3% 8,954,998
Travel time to Veterans cemetery too long 9.9% 8,954,998
Appearance of cemetery doesn’t meet my expectations 0.0% 8,954,998
Want location close to other family members 30.2% 8,954,998
Want services that are not available at Veterans cemetery 1.1% 8,954,998
Too difficult to make arrangements with VA 1.4% 8,954,998
Unable to make advance arrangements with VA 1.4% 8,954,998
Other 2.8% 8,954,998
Don’t know 6.4% 8,954,998 SOURCE: 2010 National Survey of Veterans – Veteran Spouse Survey

2010 National Survey of Veterans - Appendix D - Detailed Tables
Veteran Spouse Survey Page D-296
VS-J4. Burial option preference (J4)
Estimated Population Responding to Item 13,633,673
Casket burial, in-ground 45.3%
Casket burial, in a mausoleum 4.7%
Cremation, ashes buried in-ground 13.2%
Cremation, ashes placed in a columbarium 5.5%
Cremation, ashes scattered 21.4%
Cremation, ashes kept by my family 8.2%
Something not listed 1.7% SOURCE: 2010 National Survey of Veterans – Veteran Spouse Survey
VS-J5. Burial option acceptable: (J5)
% Marked
Estimated Population
Responding to Item
Casket burial, inground 43.0% 13,836,724
Casket burial, in a mausoleum 25.9% 13,836,724
Cremation, ashes buried inground 31.3% 13,836,724
Cremation, ashes placed in a columbarium 15.7% 13,836,724
Cremation, ashes scattered 29.9% 13,836,724
Cremation, ashes kept by my family 23.2% 13,836,724
Something not listed 3.2% 13,836,724 SOURCE: 2010 National Survey of Veterans – Veteran Spouse Survey

2010 National Survey of Veterans - Appendix D - Detailed Tables
Veteran Spouse Survey Page D-297
VS-K1. Use Internet at least occasionally (K1)
Estimated Population Responding to Item 14,384,966
Yes 78.0%
No 22.0% SOURCE: 2010 National Survey of Veterans – Veteran Spouse Survey
VS-K2. How often access Internet/World Wide Web (K2)
Estimated Population Responding to Item 9,951,505
At least once a day 67.9%
At least once a week but not every day 23.1%
At least once a month but less than once a week 7.1%
At least once a year but less than once a month 1.3%
Less than once a year 0.5% SOURCE: 2010 National Survey of Veterans – Veteran Spouse Survey

2010 National Survey of Veterans - Appendix D - Detailed Tables
Veteran Spouse Survey Page D-298
VS-K3. Where go online to use Internet: (K3)
% Marked
Estimated Population
Responding to Item
Home 94.8% 10,890,861
Work 31.7% 10,890,861
School 1.4% 10,890,861
Public Library 5.1% 10,890,861
Community Center 0.2% 10,890,861
Someone else’s house 4.8% 10,890,861
Some other place 1.9% 10,890,861 SOURCE: 2010 National Survey of Veterans – Veteran Spouse Survey
VS-K4. Send/receive emails even occasionally (K4)
Estimated Population Responding to Item 14,018,342
Yes 77.7%
No 22.3% SOURCE: 2010 National Survey of Veterans – Veteran Spouse Survey

2010 National Survey of Veterans - Appendix D - Detailed Tables
Veteran Spouse Survey Page D-299
VS-K4a. Where go online to send/receive emails: (K4a)
% Marked
Estimated Population
Responding to Item
Home 97.3% 9,736,346
Work 33.0% 9,736,346
School 1.3% 9,736,346
Public Library 2.4% 9,736,346
Community Center 0.3% 9,736,346
Someone else’s house 3.7% 9,736,346
Some other place 1.5% 9,736,346 SOURCE: 2010 National Survey of Veterans – Veteran Spouse Survey
VS-K5. Use of Internet for activities: (K5)
Very
willing Somewhat
willing
Neither willing
nor unwilling
Somewhat unwilling
Very unwilling
Estimated Population
Responding to Item
Obtaining news and information 48.9% 25.7% 6.0% 6.0% 13.4% 13,294,907
Carrying out research on services 50.1% 25.0% 5.4% 6.0% 13.6% 12,891,641
Purchasing goods or services 36.2% 26.4% 11.2% 7.8% 18.5% 13,045,826
Responding to polls or surveys 19.8% 22.2% 15.4% 13.2% 29.4% 12,853,615
Obtain information about VA benefits 34.7% 29.0% 14.2% 7.8% 14.3% 13,080,398
Apply for VA benefits 31.9% 27.5% 17.5% 6.9% 16.1% 12,919,605 SOURCE: 2010 National Survey of Veterans – Veteran Spouse Survey

2010 National Survey of Veterans - Appendix D - Detailed Tables
Veteran Spouse Survey Page D-300
VS-K6. Want to receive VA information via Internet or World Wide Web (K6)
Estimated Population Responding to Item 13,654,565
Yes 52.7%
No 47.3% SOURCE: 2010 National Survey of Veterans – Veteran Spouse Survey
VS-L1. Family received income in last 12 months from: (L1)
Yes No Don't know
Estimated Population
Responding to Item
Wages, salary, etc. 71.9% 27.1% 1.0% 12,854,789
Self-employment income 17.0% 82.4% 0.6% 11,711,002
Interest, dividends, etc. 55.5% 42.5% 2.0% 12,438,797
Social Security or Railroad Retirement 48.6% 50.7% 0.7% 12,677,255
Supplemental Security Income (SSI) 5.3% 92.3% 2.4% 11,038,938
Public assistance or welfare payments, state or local 1.8% 97.0% 1.2% 11,253,208
Retirement, survivor, or disability pensions 38.9% 60.2% 0.9% 12,341,187
Veterans’ (VA) service-connected disability compensation payments 12.3% 85.0% 2.6% 11,305,448
VA Dependency and Indemnity 1.7% 97.0% 1.2% 11,091,969
Compensation (DIC) 9.8% 89.4% 0.8% 11,188,048 SOURCE: 2010 National Survey of Veterans – Veteran Spouse Survey

2010 National Survey of Veterans - Appendix D - Detailed Tables
Veteran Spouse Survey Page D-301
VS-L2. Total family income range in past 12 months (L2)
Estimated Population Responding to Item 13,190,382
Less than $5,000 0.4%
$5,000 to $7,499 0.8%
$7,500 to $9,999 0.7%
$10,000 to $12,499 0.6%
$12,500 to $14,999 2.5%
$15,000 to $19,999 3.0%
$20,000 to $24,999 4.2%
$25,000 to $29,999 5.3%
$30,000 to $34,999 7.6%
$35,000 to $39,999 4.2%
$40,000 to $49,999 9.7%
$50,000 to $59,999 11.6%
$60,000 to $74,999 14.6%
$75,000 to $99,999 14.6%
$100,000 to $149,999 11.8%
$150,000 or more 8.3% SOURCE: 2010 National Survey of Veterans – Veteran Spouse Survey
VS-M1. Gender (M1)
Estimated Population Responding to Item 14,316,978
Male 5.0%
Female 95.0% SOURCE: 2010 National Survey of Veterans – Veteran Spouse Survey

2010 National Survey of Veterans - Appendix D - Detailed Tables
Veteran Spouse Survey Page D-302
VS-M2. Age (M2)
Estimated Population Responding to Item 14,286,216
34 years or younger 3.8%
35 to 44 9.8%
45 or 54 22.6%
55 or 64 29.1%
65 or 74 20.4%
75 or older 14.4% SOURCE: 2010 National Survey of Veterans – Veteran Spouse Survey
VS-M3. Number minor children (M3)
Estimated Population Responding to Item 11,677,718
No minor children 78.1%
1 Minor child 9.0%
2 Minor children 9.1%
3 Minor children 1.6%
4 or more minor children 2.2% SOURCE: 2010 National Survey of Veterans – Veteran Spouse Survey
VS-M3. Number dependent older children (M3)
Estimated Population Responding to Item 11,741,365
No dependent older children 84.1%
1 Dependent older child 11.4%
2 Dependent older children 4.5% SOURCE: 2010 National Survey of Veterans – Veteran Spouse Survey

2010 National Survey of Veterans - Appendix D - Detailed Tables
Veteran Spouse Survey Page D-303
VS-M4. Highest degree/school level you completed (M4)
Estimated Population Responding to Item 14,317,125
Less than high school 3.8%
High school diploma / GED 32.0%
Some college credit, but less than 1 year of college credit 9.5%
1 or more years of college credit, no degree 16.1%
Associate's degree (for example, AA, AS) 8.1%
Bachelor's degree (for example, BA, BS) 20.9%
Master's degree (for example, MA, MS, MEng, MEd, MSW, MBA) 7.9%
Professional degree beyond a bachelor's degree (for example, MD, DDS, DVM, LLB, JD) 1.2%
Doctorate degree (for example, PhD, EdD) 0.5% SOURCE: 2010 National Survey of Veterans – Veteran Spouse Survey
VS-M5. Hispanic/Latino/Spanish origin (M5)
Estimated Population Responding to Item 13,869,212
No, not of Hispanic, Latino, or Spanish origin 94.8%
Yes, Cuban 0.8%
Yes, Mexican, Mexican American, Chicano 2.9%
Yes, Puerto Rican 0.0%
Yes, another Hispanic, Latino, or Spanish origin For example: Argentinean, Colombian, Dominican, Nicaraguan, Salvadoran, Spaniard, and so on. 1.5%
SOURCE: 2010 National Survey of Veterans – Veteran Spouse Survey

2010 National Survey of Veterans - Appendix D - Detailed Tables
Veteran Spouse Survey Page D-304
VS-M6. Your race: (M6)
% Marked
Estimated Population
Responding to Item
White 89.4% 14,264,223
Black or African American 6.6% 14,264,223
American Indian or Alaska Native 2.8% 14,264,223
Asian Indian 0.0% 14,264,223
Chinese 0.2% 14,264,223
Filipino 1.6% 14,264,223
Other Asian 1.0% 14,264,223
Native Hawaiian 0.1% 14,264,223
Guamanian or Chamorro 0.0% 14,264,223
Samoan 0.0% 14,264,223
Other Pacific Islander 0.0% 14,264,223 SOURCE: 2010 National Survey of Veterans – Veteran Spouse Survey
VS-M7. Current marital status (M7)
Estimated Population Responding to Item 14,261,438
Now Married 96.7%
Widowed 2.7%
Divorced 0.3%
Separated 0.4%
Never Married 0.0%
Civil Commitment or Union 0.0% SOURCE: 2010 National Survey of Veterans – Veteran Spouse Survey

2010 National Survey of Veterans - Appendix D - Detailed Tables
Active Duty Spouse Survey Page D-305
AS-A1. Ever received VA benefits/services information (A1)
Estimated Population Responding to Item 259,155
Yes 28.4%
No 63.0%
Don't know 8.6% SOURCE: 2010 National Survey of Veterans – Active Duty Spouse Survey
AS-A2. Received VA information: (A2)
% Marked
Estimated Population
Responding to Item
Through mail * *
Through email * *
Through a newsletter * *
Through VA newsletter * *
Through TV/media * *
Other * * SOURCE: 2010 National Survey of Veterans – Active Duty Spouse Survey
* Data were suppressed because fewer than 30 respondents answered this survey item.

2010 National Survey of Veterans - Appendix D - Detailed Tables
Active Duty Spouse Survey Page D-306
AS-A3. Looked for information: (A3)
Yes No
Estimated Population
Responding to Item
Eligibility for VA health care 9.4% 90.6% 237,118
A VA health care facility 9.1% 90.9% 240,464
VA life insurance 3.3% 96.7% 229,586
VA home loans 19.2% 80.8% 251,622
VA education and training 24.1% 75.9% 248,137
VA vocational rehabilitation 3.2% 96.8% 225,819
VA burial and memorial benefits 4.9% 95.1% 229,726
VA disability compensation and pension 8.0% 92.0% 229,586
VA benefits for dependents and survivors 14.3% 85.7% 233,212
VA transition assistance 4.9% 95.1% 225,960
VA prescription benefits 11.4% 88.6% 225,960 SOURCE: 2010 National Survey of Veterans – Active Duty Spouse Survey

2010 National Survey of Veterans - Appendix D - Detailed Tables
Active Duty Spouse Survey Page D-307
AS-A4. Awareness of VA benefits/services: (A4)
Very aware Aware Somewhat aware Barely aware Not aware at all
Estimated Population
Responding to Item
Eligibility for VA health care 5.7% 15.8% 36.2% 13.0% 29.2% 255,529
Locating a VA health care facility 15.8% 23.1% 20.4% 14.5% 26.2% 255,389
VA life insurance 2.8% 15.9% 18.9% 18.7% 43.6% 255,529
VA home loans 20.0% 25.7% 18.7% 15.7% 20.0% 259,155
VA education and training 10.2% 15.8% 19.0% 14.4% 40.7% 255,529
VA vocational rehabilitation 5.7% 10.0% 10.2% 17.4% 56.7% 255,529
VA burial and memorial benefits 3.0% 11.7% 11.8% 25.0% 48.6% 251,903
VA disability compensation and pension 5.7% 10.0% 12.9% 22.7% 48.7% 259,155
VA benefits for dependents and survivors 5.7% 11.4% 10.0% 31.3% 41.6% 259,155
VA transition assistance 7.3% 4.3% 15.9% 21.6% 50.9% 255,529
VA prescription benefits 2.8% 13.0% 18.9% 24.5% 40.8% 255,529 SOURCE: 2010 National Survey of Veterans – Active Duty Spouse Survey
AS-B1. Work status during the last week (B1)
Estimated Population Responding to Item 259,155
Working, or on paid vacation or sick leave from work 48.5%
Not working, but looking for work 17.2%
Not working and not looking for work 34.3% SOURCE: 2010 National Survey of Veterans – Active Duty Spouse Survey

2010 National Survey of Veterans - Appendix D - Detailed Tables
Active Duty Spouse Survey Page D-308
AS-B2. Average hours per week working (B2)
Estimated Population Responding to Item 125,671
Less than 10 hours per week 3.0%
Between 10 and 19 hours per week 6.0%
Between 20 and 39 hours per week 29.4%
40 hours per week 55.7%
More than 40 hours per week 5.9% SOURCE: 2010 National Survey of Veterans – Active Duty Spouse Survey
AS-B3. Reason working less than 35 hours/week: (B3)
% Marked
Estimated Population
Responding to Item
Do not want to work 35 hours or more * *
Need flexibility due to spouse’s employment * *
Could only find part-time work * *
Seasonal work * *
Child care responsibilities * *
Other family/personal obligations * *
My personal health/medical limitations * *
Need schooling/training/certification * *
In school * *
Other * * SOURCE: 2010 National Survey of Veterans – Active Duty Spouse Survey * Data were suppressed because fewer than 30 respondents answered this survey item.

2010 National Survey of Veterans - Appendix D - Detailed Tables
Active Duty Spouse Survey Page D-309
AS-B4. Worked at current job: (B4)
Estimated Population Responding to Item *
SOURCE: 2010 National Survey of Veterans – Active Duty Spouse Survey * Data were suppressed because fewer than 30 respondents answered this survey item.
AS-B5. Satisfaction with employment/career opportunities (B5)
Estimated Population Responding to Item 251,903
Does not apply, I am not interested in employment 25.0%
Very satisfied 17.8%
Satisfied 30.7%
Dissatisfied 14.7%
Very dissatisfied 11.8% SOURCE: 2010 National Survey of Veterans – Active Duty Spouse Survey
AS-C1. Your general health status (C1)
Estimated Population Responding to Item 259,155
Excellent 14.3%
Very good 34.4%
Good 42.7%
Fair 7.2%
Poor 1.4% SOURCE: 2010 National Survey of Veterans – Active Duty Spouse Survey
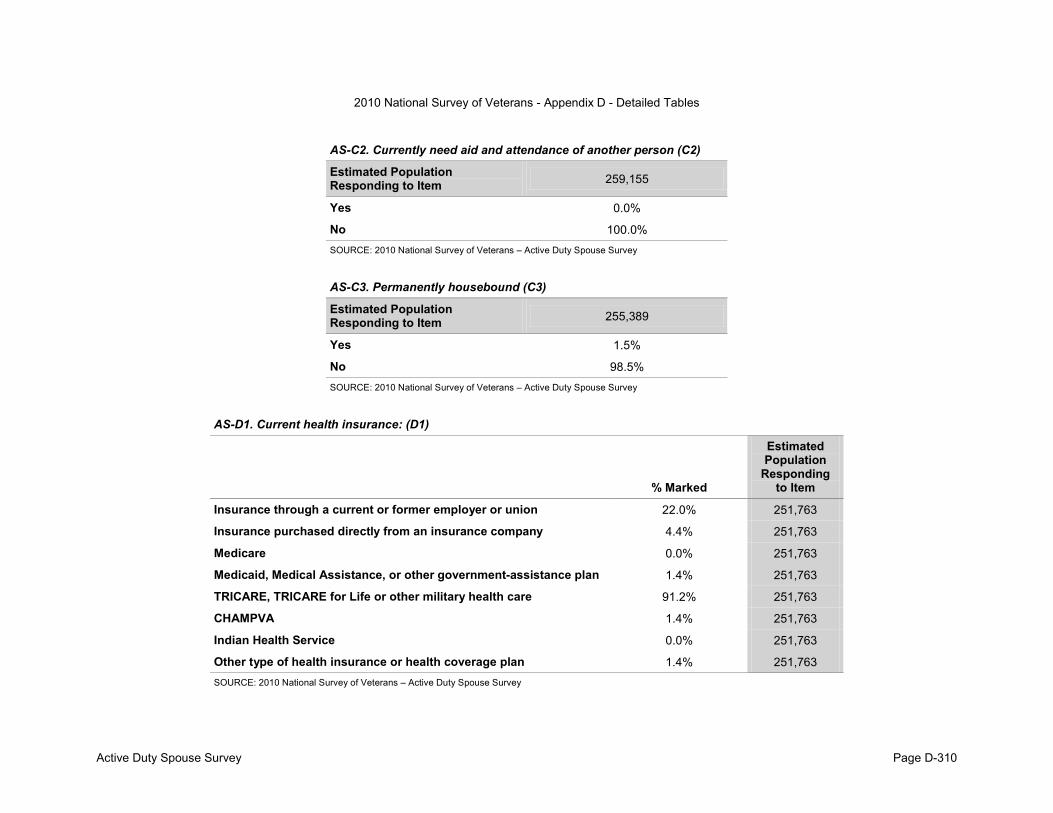
2010 National Survey of Veterans - Appendix D - Detailed Tables
Active Duty Spouse Survey Page D-310
AS-C2. Currently need aid and attendance of another person (C2)
Estimated Population Responding to Item 259,155
Yes 0.0%
No 100.0% SOURCE: 2010 National Survey of Veterans – Active Duty Spouse Survey
AS-C3. Permanently housebound (C3)
Estimated Population Responding to Item 255,389
Yes 1.5%
No 98.5% SOURCE: 2010 National Survey of Veterans – Active Duty Spouse Survey
AS-D1. Current health insurance: (D1)
% Marked
Estimated Population
Responding to Item
Insurance through a current or former employer or union 22.0% 251,763
Insurance purchased directly from an insurance company 4.4% 251,763
Medicare 0.0% 251,763
Medicaid, Medical Assistance, or other government-assistance plan 1.4% 251,763
TRICARE, TRICARE for Life or other military health care 91.2% 251,763
CHAMPVA 1.4% 251,763
Indian Health Service 0.0% 251,763
Other type of health insurance or health coverage plan 1.4% 251,763 SOURCE: 2010 National Survey of Veterans – Active Duty Spouse Survey

2010 National Survey of Veterans - Appendix D - Detailed Tables
Active Duty Spouse Survey Page D-311
AS-E1. Current living arrangement (E1)
Estimated Population Responding to Item 251,763
Live in military housing 14.7%
Rent my home 17.7%
Own my home - with outstanding mortgage 63.2%
Own my home - no mortgage balance 1.5%
Occupy dwelling with no payment of cash rent 1.4%
Other 1.5% SOURCE: 2010 National Survey of Veterans – Active Duty Spouse Survey
AS-E2. Ever obtain home loan to purchase/refinance/make home improvement (E2)
Estimated Population Responding to Item 255,529
Yes 59.4%
No 40.6% SOURCE: 2010 National Survey of Veterans – Active Duty Spouse Survey
AS-E2a. Obtaining loan, lender discuss VA home loan guaranty program (E2a)
Estimated Population Responding to Item 144,643
Yes 30.7%
No 17.9%
Don't remember 51.4% SOURCE: 2010 National Survey of Veterans – Active Duty Spouse Survey

2010 National Survey of Veterans - Appendix D - Detailed Tables
Active Duty Spouse Survey Page D-312
AS-E3. Ever use VA home loan guaranty program (E3)
Estimated Population Responding to Item 141,017
Yes, currently have a VA home loan 42.0%
Yes, not currently, but have had a VA home loan in the past 36.9%
No, Never have had a VA home loan 21.1% SOURCE: 2010 National Survey of Veterans – Active Duty Spouse Survey
AS-E3a. How long ago obtain most recent home loan (E3a)
Estimated Population Responding to Item *
SOURCE: 2010 National Survey of Veterans – Active Duty Spouse Survey * Data were suppressed because fewer than 30 respondents answered this survey item.
AS-E4. Most important reason to get VA home loan (E4)
Estimated Population Responding to Item *
SOURCE: 2010 National Survey of Veterans – Active Duty Spouse Survey * Data were suppressed because fewer than 30 respondents answered this survey item.
AS-E5. Main reason not use VA home loan program (E5)
Estimated Population Responding to Item *
SOURCE: 2010 National Survey of Veterans – Active Duty Spouse Survey * Data were suppressed because fewer than 30 respondents answered this survey item.
AS-E6. Aware VA home loan guaranty program for eligible spouses (E6)
Estimated Population Responding to Item *
SOURCE: 2010 National Survey of Veterans – Active Duty Spouse Survey * Data were suppressed because fewer than 30 respondents answered this survey item.

2010 National Survey of Veterans - Appendix D - Detailed Tables
Active Duty Spouse Survey Page D-313
AS-F1. Satisfaction with ability to get accurate burial benefit information (F1)
Estimated Population Responding to Item 255,529
Very satisfied 2.8%
Satisfied 13.1%
Neither satisfied nor dissatisfied 8.7%
Dissatisfied 1.5%
Very dissatisfied 0.0%
I have not tried to get information 73.9% SOURCE: 2010 National Survey of Veterans – Active Duty Spouse Survey
AS-F2. Importance of VA cemeteries as shrines: (F2)
Very
important Important Not very
important Not at all important
Don't know
Estimated Population
Responding to Item
Maintenance of cemetery grounds 65.2% 26.3% 0.0% 0.0% 8.6% 255,529
Upkeep of headstones, markers, and wall covers for cremated remains 70.1% 22.5% 0.0% 0.0% 7.4% 248,277
Maintenance of other landscape features 55.9% 32.4% 3.0% 0.0% 8.7% 251,903
Appearance of committal shelters 55.2% 23.9% 4.5% 0.0% 16.4% 248,137
Appearance of individual gravesites 61.2% 30.0% 1.5% 0.0% 7.4% 248,137
Maintenance of cemetery buildings and roads 59.6% 30.1% 3.0% 0.0% 7.4% 248,137
Cemetery’s front gate and entrance area 60.6% 28.9% 3.1% 0.0% 7.5% 244,511
Availability of parking and/or restrooms 53.7% 32.9% 6.0% 0.0% 7.4% 248,137
Public ceremonies and events that honor Veterans 62.6% 28.5% 1.5% 0.0% 7.4% 248,137
Presentation of military funeral honors 70.2% 22.5% 0.0% 0.0% 7.4% 248,137
Other * * * * * * SOURCE: 2010 National Survey of Veterans – Active Duty Spouse Survey * Data were suppressed because fewer than 30 respondents answered this survey item.

2010 National Survey of Veterans - Appendix D - Detailed Tables
Active Duty Spouse Survey Page D-314
AS-F3. Heard of benefit before today: (F3)
Yes No Don't know
Estimated Population
Responding to Item
Burial at a VA National or State Veterans cemetery 48.5% 33.8% 17.7% 251,763
Headstone and burial markers provided by VA at private cemeteries 20.2% 56.6% 23.2% 255,529
Presidential Memorial Certificates for next of kin 11.5% 66.7% 21.8% 255,529
Cash plot allowance 14.3% 66.8% 18.9% 255,529
Cash burial allowance 18.7% 63.9% 17.4% 255,529
Military Funeral Honors 55.0% 27.6% 17.4% 255,529
Receiving a U.S. Flag 65.2% 21.7% 13.0% 255,529 SOURCE: 2010 National Survey of Veterans – Active Duty Spouse Survey
AS-G1. Type of burial you'll have (G1)
Estimated Population Responding to Item 247,996
Casket burial, in-ground 46.2%
Cremation, in-ground 15.0%
Cremation, columbarium 10.4%
Mausoleum 3.0%
Something else 6.0%
Don’t know 19.3% SOURCE: 2010 National Survey of Veterans – Active Duty Spouse Survey

2010 National Survey of Veterans - Appendix D - Detailed Tables
Active Duty Spouse Survey Page D-315
AS-G2. Plan to be buried in VA Nation/State cemetery (G2)
Estimated Population Responding to Item 255,529
Yes 13.0%
No 40.6%
Don't know 46.4% SOURCE: 2010 National Survey of Veterans – Active Duty Spouse Survey
AS-G2a. Reason want burial in VA National/State cemetery: (G2a)
% Marked
Estimated Population
Responding to Item
No cost 26.8% 137,110
Spouse planning to be buried there/Spouse buried there 54.1% 137,110
Friends or family buried there 10.9% 137,110
Quality of services 10.8% 137,110
The honor of burial in a VA National shrine 21.5% 137,110
My spouse’s connection to the military/past service to the country 37.8% 137,110
Other 2.6% 137,110
Don’t know 24.4% 137,110 SOURCE: 2010 National Survey of Veterans – Active Duty Spouse Survey

2010 National Survey of Veterans - Appendix D - Detailed Tables
Active Duty Spouse Survey Page D-316
AS-G3. Reason no burial in VA National/State cemetery: (G3)
% Marked
Estimated Population
Responding to Item
Don’t know eligibility criteria * *
Spouse not (planning to be) buried there * *
Quality of services * *
Don’t know how to make arrangements with VA * *
Made other arrangements * *
VA services don’t accommodate religious preferences * *
Veterans cemetery too far away (distance) * *
Travel time to Veterans cemetery too long * *
Appearance of cemetery doesn’t meet my expectations * *
Want location close to other family members * *
Want services that are not available at Veterans cemetery * *
Too difficult to make arrangements with VA * *
Unable to make advance arrangements with VA * *
Other * *
Don’t know * * SOURCE: 2010 National Survey of Veterans – Active Duty Spouse Survey * Data were suppressed because fewer than 30 respondents answered this survey item.

2010 National Survey of Veterans - Appendix D - Detailed Tables
Active Duty Spouse Survey Page D-317
AS-G4. Burial option preference (G4)
Estimated Population Responding to Item 237,118
Casket burial, in-ground 54.6%
Casket burial, in a mausoleum 3.1%
Cremation, ashes buried in-ground 7.8%
Cremation, ashes placed in a columbarium 7.9%
Cremation, ashes scattered 17.2%
Cremation, ashes kept by my family 7.8%
Something not listed 1.5% SOURCE: 2010 National Survey of Veterans – Active Duty Spouse Survey
AS-G5. Burial option acceptable: (G5)
% Marked
Estimated Population
Responding to Item
Casket burial, inground 46.2% 248,137
Casket burial, in a mausoleum 32.8% 248,137
Cremation, ashes buried inground 32.9% 248,137
Cremation, ashes placed in a columbarium 19.4% 248,137
Cremation, ashes scattered 19.4% 248,137
Cremation, ashes kept by my family 22.5% 248,137
Something not listed 3.0% 248,137 SOURCE: 2010 National Survey of Veterans – Active Duty Spouse Survey

2010 National Survey of Veterans - Appendix D - Detailed Tables
Active Duty Spouse Survey Page D-318
AS-H1. Use Internet at least occasionally (H1)
Estimated Population Responding to Item 255,529
Yes 100.0%
No 0.0% SOURCE: 2010 National Survey of Veterans – Active Duty Spouse Survey
AS-H2. How often access Internet/World Wide Web (H2)
Estimated Population Responding to Item 236,697
At least once a day 87.4%
At least once a week but not every day 9.4%
At least once a month but less than once a week 3.1%
At least once a year but less than once a month 0.0%
Less than once a year 0.0% SOURCE: 2010 National Survey of Veterans – Active Duty Spouse Survey

2010 National Survey of Veterans - Appendix D - Detailed Tables
Active Duty Spouse Survey Page D-319
AS-H3. Where go online to access Internet (H3)
% Marked
Estimated Population
Responding to Item
Home 98.6% 255,529
Work 29.0% 255,529
School 7.2% 255,529
Public Library 1.4% 255,529
Community Center 0.0% 255,529
Someone else’s house 5.7% 255,529
Some other place 2.9% 255,529 SOURCE: 2010 National Survey of Veterans – Active Duty Spouse Survey
AS-H4. Send/receive emails even occasionally (H4)
Estimated Population Responding to Item 255,529
Yes 100.0%
No 0.0% SOURCE: 2010 National Survey of Veterans – Active Duty Spouse Survey

2010 National Survey of Veterans - Appendix D - Detailed Tables
Active Duty Spouse Survey Page D-320
AS-H4a. Where go online to send/receive emails (H4a)
% Marked
Estimated Population
Responding to Item
Home 98.5% 244,370
Work 27.3% 244,370
School 4.5% 244,370
Public Library 0.0% 244,370
Community Center 0.0% 244,370
Someone else’s house 7.4% 244,370
Some other place 3.0% 244,370 SOURCE: 2010 National Survey of Veterans – Active Duty Spouse Survey
AS-H5. Use of Internet for activities: (H5)
Very
willing Somewhat
willing
Neither willing
nor unwilling
Somewhat unwilling
Very unwilling
Estimated Population
Responding to Item
Obtaining news and information 72.5% 17.4% 5.7% 2.9% 1.5% 255,529
Carrying out research on services 71.1% 23.2% 2.8% 1.4% 1.5% 255,529
Purchasing goods or services 55.9% 27.9% 7.4% 5.9% 3.0% 251,763
Responding to polls or surveys 33.9% 36.6% 17.6% 7.4% 4.5% 251,763
Obtain information about VA benefits 63.2% 25.0% 5.8% 1.5% 4.4% 251,763
Apply for VA benefits 65.7% 25.5% 4.4% 1.5% 3.0% 248,137 SOURCE: 2010 National Survey of Veterans – Active Duty Spouse Survey

2010 National Survey of Veterans - Appendix D - Detailed Tables
Active Duty Spouse Survey Page D-321
AS-H6. Want to receive VA information via Internet/World Wide Web (H6)
Estimated Population Responding to Item 255,529
Yes 92.7%
No 7.3% SOURCE: 2010 National Survey of Veterans – Active Duty Spouse Survey
AS-I1. Gender (I1)
Estimated Population Responding to Item 255,529
Male 7.1%
Female 92.9% SOURCE: 2010 National Survey of Veterans – Active Duty Spouse Survey
AS-I2. Age (I2)
Estimated Population Responding to Item 251,903
34 years or younger 20.5%
35 to 44 44.2%
45 to 54 33.9%
55 to 64 1.4% SOURCE: 2010 National Survey of Veterans – Active Duty Spouse Survey

2010 National Survey of Veterans - Appendix D - Detailed Tables
Active Duty Spouse Survey Page D-322
AS-I3. Number minor children: (I3)
Estimated Population Responding to Item 237,118
No minor children 23.4%
1 Minor child 26.6%
2 Minor children 39.0%
3 Minor children 7.9%
4 or more minor children 3.2% SOURCE: 2010 National Survey of Veterans – Active Duty Spouse Survey
AS-I3. Number dependent older children: (I3)
Estimated Population Responding to Item 192,624
No dependent older children 67.4%
1 Dependent older child 26.7%
2 Dependent older children 5.9% SOURCE: 2010 National Survey of Veterans – Active Duty Spouse Survey

2010 National Survey of Veterans - Appendix D - Detailed Tables
Active Duty Spouse Survey Page D-323
AS-I4. Highest degree/school level completed (I4)
Estimated Population Responding to Item 255,529
Less than high school 2.9%
High school diploma / GED 17.3%
Some college credit, but less than 1 year of college credit 8.7%
1 or more years of college credit, no degree 21.6%
Associate's degree (for example, AA, AS) 15.9%
Bachelor's degree (for example, BA, BS) 19.0%
Master's degree (for example, MA, MS, MEng, MEd, MSW, MBA) 11.7%
Professional degree beyond a bachelor's degree (for example, MD, DDS, DVM, LLB, JD) 2.9%
Doctorate degree (for example, PhD, EdD) 0.0% SOURCE: 2010 National Survey of Veterans – Active Duty Spouse Survey
AS-I5. Hispanic/Latino/Spanish origin (I5)
Estimated Population Responding to Item 244,370
Non-Hispanic 75.7%
Hispanic 24.3% SOURCE: 2010 National Survey of Veterans – Active Duty Spouse Survey

2010 National Survey of Veterans - Appendix D - Detailed Tables
Active Duty Spouse Survey Page D-324
AS-I6. Your race: (I6)
Estimated Population Responding to Item 233,071
White 81.2%
African American / Black 11.0%
Hawaiian / Pacific Islander * 3.2%
American Indian / Alaska Native 1.6%
Multi-Racial 3.1% SOURCE: 2010 National Survey of Veterans – Active Duty Spouse Survey
AS-I7. Current marital status (I7)
Estimated Population Responding to Item 255,529
Now Married 100.0%
Widowed 0.0%
Divorced 0.0%
Separated 0.0%
Never Married 0.0%
Civil Commitment or Union 0.0% SOURCE: 2010 National Survey of Veterans – Active Duty Spouse Survey

2010 National Survey of Veterans - Appendix D - Detailed Tables
Surviving Spouse Survey Page D-325
VW-A1. Received VA benefits/services information in past year (A1)
Estimated Population Responding to Item 5,412,036
Yes 17.7%
No 78.1%
Don't know 4.2% SOURCE: 2010 National Survey of Veterans – Surviving Spouse Survey
VW-A2. How received VA information: (A2)
% Marked
Estimated Population
Responding to Item
Through mail 82.0% 1,007,676
Through email 4.9% 1,007,676
Through a newsletter 4.0% 1,007,676
Through VA newsletter 4.5% 1,007,676
Through TV/media 3.3% 1,007,676
Other 12.3% 1,007,676 SOURCE: 2010 National Survey of Veterans – Surviving Spouse Survey

2010 National Survey of Veterans - Appendix D - Detailed Tables
Surviving Spouse Survey Page D-326
VW-A3. Looked for information in past 12 months: (A3)
Yes No
Estimated Population
Responding to Item
Eligibility for VA health care 4.3% 95.7% 5,141,780
A VA health care facility 2.5% 97.5% 4,975,803
VA life insurance 3.3% 96.7% 4,968,100
VA home loans 1.5% 98.5% 4,928,460
VA education and training 1.3% 98.7% 4,907,252
VA burial and memorial benefits 8.0% 92.0% 5,017,689
VA disability compensation and pension 3.6% 96.4% 4,970,664
VA benefits for dependents and survivors 12.2% 87.8% 5,196,712
VA transition assistance 0.2% 99.8% 4,856,660
VA prescription benefits 4.2% 95.8% 5,020,847
‘No Fee’ Passports 0.5% 99.5% 4,917,545 SOURCE: 2010 National Survey of Veterans – Surviving Spouse Survey

2010 National Survey of Veterans - Appendix D - Detailed Tables
Surviving Spouse Survey Page D-327
VW-A4. Level of awareness with the following VA benefits and services: (A4)
Very aware Aware Somewhat aware Barely aware Not aware at all
Estimated Population
Responding to Item
Eligibility for VA health care 3.3% 6.8% 9.0% 9.7% 71.3% 5,199,797
Locating a VA health care facility 11.8% 16.1% 9.5% 9.5% 53.1% 5,115,342
VA life insurance 3.3% 5.6% 5.4% 9.4% 76.2% 5,112,572
VA home loans 3.8% 10.3% 9.2% 9.7% 67.0% 5,091,692
VA education and training 2.3% 8.1% 8.5% 8.9% 72.3% 5,052,234
VA burial and memorial benefits 9.3% 17.0% 10.4% 10.6% 52.7% 5,157,298
VA disability compensation and pension 4.5% 9.2% 9.1% 9.2% 68.0% 5,123,084
VA benefits for dependents and survivors 5.6% 7.8% 8.3% 10.3% 68.0% 5,273,747
VA transition assistance 1.5% 2.2% 4.1% 8.1% 84.1% 5,046,372
VA prescription benefits 3.8% 6.9% 5.2% 8.0% 76.1% 5,184,974
‘No Fee’ Passports 1.1% 2.0% 2.1% 5.3% 89.4% 5,138,291 SOURCE: 2010 National Survey of Veterans – Surviving Spouse Survey
VW-B1. Work status during the last week (B1)
Estimated Population Responding to Item 4,984,603
Working, or on paid vacation or sick leave from work 14.1%
Not working, but looking for work 1.9%
Not working and not looking for work 84.1% SOURCE: 2010 National Survey of Veterans – Surviving Spouse Survey

2010 National Survey of Veterans - Appendix D - Detailed Tables
Surviving Spouse Survey Page D-328
VW-B2. Average hours per week working (B2)
Estimated Population Responding to Item 5,803,374
Less than 10 hours per week 89.2%
Between 10 and 19 hours per week 2.6%
Between 20 and 39 hours per week 3.8%
40 hours per week 3.9%
More than 40 hours per week 0.5% SOURCE: 2010 National Survey of Veterans – Surviving Spouse Survey
VW-B3. Reasons working less than 35 hours per week: (B3)
% Marked
Estimated Population
Responding to Item
Do not want to work 35 hours or more 31.4% 472,749
Need flexibility 8.9% 472,749
Could only find part-time work 16.9% 472,749
Seasonal work 5.7% 472,749
Child care responsibilities 2.6% 472,749
My personal health/medical limitations 18.3% 472,749
Need schooling/training/certification 0.0% 472,749
In school 1.0% 472,749
Other 37.6% 472,749 SOURCE: 2010 National Survey of Veterans – Surviving Spouse Survey

2010 National Survey of Veterans - Appendix D - Detailed Tables
Surviving Spouse Survey Page D-329
VW-B4. Worked at current job: (B4)
Estimated Population Responding to Item 716,970
Less than 1 year 11.5%
1 year 6.0%
2-4 years 19.9%
5-9 years 12.7%
10 or more years 49.9% SOURCE: 2010 National Survey of Veterans – Surviving Spouse Survey
VW-B5. Satisfaction with employment/career opportunities (B5)
Estimated Population Responding to Item 4,693,268
Does not apply, I am not interested in employment 77.6%
Very satisfied 4.9%
Satisfied 10.1%
Dissatisfied 5.5%
Very dissatisfied 1.8% SOURCE: 2010 National Survey of Veterans – Surviving Spouse Survey

2010 National Survey of Veterans - Appendix D - Detailed Tables
Surviving Spouse Survey Page D-330
VW-C1. Veteran spouse discharged for service disability (C1)
Estimated Population Responding to Item 5,171,207
Spouse discharged from military service for a service-connected disability 6.9%
Spouse retired from military 14.7%
Spouse died on active duty 2.4%
Spouse separated at end of service obligation 71.1%
Other 4.9% SOURCE: 2010 National Survey of Veterans – Surviving Spouse Survey
VW-C2. When spouse left military (C2)
Estimated Population Responding to Item 5,786,432
1920 to 1945 18.5%
1946 to 1950 38.7%
1951 to 1955 12.3%
1956 to 1960 6.1%
1961 to 1965 5.4%
1966 to 1970 6.6%
1971 to 1975 5.7%
1976 to 1980 1.9%
1981 to 1985 1.7%
1986 to 1990 0.8%
1991 to 1995 1.8%
1996 to 2000 0.3%
2001 to 2005 0.3% SOURCE: 2010 National Survey of Veterans – Surviving Spouse Survey

2010 National Survey of Veterans - Appendix D - Detailed Tables
Surviving Spouse Survey Page D-331
VW-C3. Number of years spouse served in military (C3)
Estimated Population Responding to Item 4,344,713
1-2 years 27.0%
3-4 years 42.9%
5-19 years 14.6%
20 years 4.4%
More than 20 years 11.1% SOURCE: 2010 National Survey of Veterans – Surviving Spouse Survey
VW-C4. Year of veteran spouse's death (C4)
Estimated Population Responding to Item 5,803,374
1920 to 1945 7.3%
1946 to 1950 0.2%
1956 to 1960 0.6%
1961 to 1965 0.7%
1966 to 1970 1.6%
1971 to 1975 2.3%
1976 to 1980 3.5%
1981 to 1985 5.2%
1986 to 1990 7.5%
1991 to 1995 13.2%
1996 to 2000 15.0%
2001 to 2005 20.4%
2006 to 2010 22.5% SOURCE: 2010 National Survey of Veterans – Surviving Spouse Survey

2010 National Survey of Veterans - Appendix D - Detailed Tables
Surviving Spouse Survey Page D-332
VW-C5. Death resulted from: (C5)
Yes No
Estimated Population
Responding to Item
A disease or injury incurred or aggravated in the line of duty while on active duty or active duty for training 5.6% 94.4% 4,943,765
An injury incurred or aggravated in the line of duty while on inactive duty training 0.5% 99.5% 4,791,025
A service-connected disability 7.4% 92.6% 4,974,225
A condition directly related to a service-connected disability 6.2% 93.8% 4,859,672
An in the line of duty event that happened on active duty that was not due to misconduct 3.5% 96.5% 4,833,874 SOURCE: 2010 National Survey of Veterans – Surviving Spouse Survey
VW-C6. At time of death, your Veteran spouse's disability rating: (C6)
Yes No Don't know
Estimated Population
Responding to Item
Continuously rated totally disabled for a period of 10 years immediately preceding death 10.8% 78.8% 10.4% 5,076,449
Continuously rated totally disabled from the date of military discharge and for at least 5 years immediately preceding death 3.7% 88.4% 8.0% 4,823,052
A former POW who died after September 30, 1999, and who was continuously rated totally disabled for a period of at least one year preceding death 0.5% 92.3% 7.2% 4,719,932
SOURCE: 2010 National Survey of Veterans – Surviving Spouse Survey
VW-C7. Spouse had service-connected disability rating (C7)
Estimated Population Responding to Item 5,252,612
Yes 19.0%
No 81.0% SOURCE: 2010 National Survey of Veterans – Surviving Spouse Survey

2010 National Survey of Veterans - Appendix D - Detailed Tables
Surviving Spouse Survey Page D-333
VW-C7a. Service-connected disability prevented spouse from getting/holding job (C7a)
Estimated Population Responding to Item 943,184
Yes 30.8%
No 69.2% SOURCE: 2010 National Survey of Veterans – Surviving Spouse Survey
VW-C8. Spouse ever prisoner of war (C8)
Estimated Population Responding to Item 5,385,119
Yes 1.0%
No 99.0% SOURCE: 2010 National Survey of Veterans – Surviving Spouse Survey
VW-D1. Your general health status (D1)
Estimated Population Responding to Item 5,685,426
Excellent 5.3%
Very good 23.9%
Good 34.1%
Fair 23.2%
Poor 13.4% SOURCE: 2010 National Survey of Veterans – Surviving Spouse Survey

2010 National Survey of Veterans - Appendix D - Detailed Tables
Surviving Spouse Survey Page D-334
VW-D2. Currently need aid and attendance of another person (D2)
Estimated Population Responding to Item 5,628,516
Yes 16.3%
No 83.7% SOURCE: 2010 National Survey of Veterans – Surviving Spouse Survey
VW-D3. Permanently housebound (D3)
Estimated Population Responding to Item 5,617,018
Yes 6.6%
No 93.4% SOURCE: 2010 National Survey of Veterans – Surviving Spouse Survey
VW-E1. Current health insurance (E1)
% Marked
Estimated Population
Responding to Item
No health insurance 3.8% 5,648,160
Insurance through a current or former employer or union 30.1% 5,648,160
Insurance purchased directly from an insurance company 26.2% 5,648,160
Medicare 79.6% 5,648,160
Medicaid, Medical Assistance, or other government-assistance plan 7.5% 5,648,160
TRICARE, TRICARE for Life or other military health care 11.3% 5,648,160
CHAMPVA 2.0% 5,648,160
Indian Health Service 0.4% 5,648,160
Other type of health insurance or health coverage plan 8.0% 5,648,160 SOURCE: 2010 National Survey of Veterans – Surviving Spouse Survey

2010 National Survey of Veterans - Appendix D - Detailed Tables
Surviving Spouse Survey Page D-335
VW-E2. Familiarity of CHAMPVA benefits/eligibility (E2)
Estimated Population Responding to Item 5,536,847
Extremely familiar 0.6%
Moderately familiar 1.5%
Somewhat familiar 3.2%
Slightly familiar 4.3%
Not at all familiar 90.3% SOURCE: 2010 National Survey of Veterans – Surviving Spouse Survey
VW-F1. Ever used any VA educational assistance (F1)
Estimated Population Responding to Item 5,466,127
Yes 1.6%
No 98.4% SOURCE: 2010 National Survey of Veterans – Surviving Spouse Survey

2010 National Survey of Veterans - Appendix D - Detailed Tables
Surviving Spouse Survey Page D-336
VW-F2. How used VA education benefit: (F2)
% Marked
Estimated Population
Responding to Item
College or university coursework leading to a degree * *
Business, technical or vocational school leading to certificate or diploma * *
Participated in an apprenticeship or on-job training program * *
Took correspondence courses * *
Took flight training * *
Received tutorial assistance, refresher courses, or deficiency training * *
Attended a teacher certification program * *
Did something else * * SOURCE: 2010 National Survey of Veterans – Surviving Spouse Survey * Data were suppressed because fewer than 30 respondents answered this survey item.
VW-F2a. Completed training/received degree or certificate you were enrolled for/receiving VA education (F2a)
Estimated Population Responding to Item *
SOURCE: 2010 National Survey of Veterans – Surviving Spouse Survey * Data were suppressed because fewer than 30 respondents answered this survey item.

2010 National Survey of Veterans - Appendix D - Detailed Tables
Surviving Spouse Survey Page D-337
VW-F2b. Importance of VA education benefits for your educational goals or better life (F2b)
Estimated Population Responding to Item *
SOURCE: 2010 National Survey of Veterans – Surviving Spouse Survey * Data were suppressed because fewer than 30 respondents answered this survey item.
VW-F3. Reasons not use VA educational assistance: (F3)
% Marked
Estimated Population
Responding to Item
Not aware of VA education or training benefits 40.9% 5,027,653
Don’t believe entitled to or eligible for education or training benefits 27.0% 5,027,653
My period of eligibility expired/ran out 2.8% 5,027,653
Don’t know how to apply for education or training benefits 10.0% 5,027,653
Don’t need any additional education or training 31.8% 5,027,653
Don’t need or want assistance from VA 11.9% 5,027,653
Too much trouble or red tape 3.3% 5,027,653
Never considered getting any education or training from VA 39.5% 5,027,653
Other 4.7% 5,027,653 SOURCE: 2010 National Survey of Veterans – Surviving Spouse Survey

2010 National Survey of Veterans - Appendix D - Detailed Tables
Surviving Spouse Survey Page D-338
VW-G1. Your current living arrangement: (G1)
Estimated Population Responding to Item 5,490,625
Rent my home 15.2%
Own my home—with an outstanding mortgage 19.0%
Own my home—no mortgage balance 52.0%
Occupy dwelling with no payment of cash rent 2.7%
Other 11.2% SOURCE: 2010 National Survey of Veterans – Surviving Spouse Survey
VW-G2. Ever obtain home loan for purchase/refinance/make home improvement (G2)
Estimated Population Responding to Item 5,264,097
Yes 38.7%
No 61.3% SOURCE: 2010 National Survey of Veterans – Surviving Spouse Survey
VW-G2a. Obtaining loan, lender discuss VA home loan guaranty as option (G2a)
Estimated Population Responding to Item 1,896,750
Yes 11.6%
No 28.7%
Don't remember 59.6% SOURCE: 2010 National Survey of Veterans – Surviving Spouse Survey

2010 National Survey of Veterans - Appendix D - Detailed Tables
Surviving Spouse Survey Page D-339
VW-G3. Ever use VA home loan guaranty program (G3)
Estimated Population Responding to Item 1,830,078
Yes, currently have VA home loan 4.0%
Yes, not currently, but have had VA home loan in the past 47.3%
No, never have had VA home loan 48.7% SOURCE: 2010 National Survey of Veterans – Surviving Spouse Survey
VW-G3a. How long ago obtain most recent home loan (G3a)
Estimated Population Responding to Item 1,092,380
Within last 5 years 9.5%
6-10 years ago 8.4%
11-20 years ago 14.9%
More than 20 years ago 67.2% SOURCE: 2010 National Survey of Veterans – Surviving Spouse Survey
VW-G3b. When use VA home loan guaranty program (G3b)
Estimated Population Responding to Item 995,476
During active duty service 6.5%
After active duty service 86.3%
Both during and after active duty service 7.1% SOURCE: 2010 National Survey of Veterans – Surviving Spouse Survey

2010 National Survey of Veterans - Appendix D - Detailed Tables
Surviving Spouse Survey Page D-340
VW-G4. Most important reason to get VA home loan (G4)
Estimated Population Responding to Item 766,783
No down payment required 36.5%
Convenience 17.1%
No mortgage insurance required 0.9%
Favorable interest rate 35.3%
Loan more likely to be approved 8.9%
VA's assistance to avoid foreclosure 0.0%
Previous experience with the VA loan program 1.2% SOURCE: 2010 National Survey of Veterans – Surviving Spouse Survey
VW-G5. Main reason not use VA home loan program (G5)
Estimated Population Responding to Item 746,400
A conventional FHA mortgage was easier or less expensive for me to obtain 21.5%
I applied for a VA home loan, but did not qualify 1.5%
I did not apply because I did not think that I would qualify 7.6%
I thought that the process for obtaining a VA loan would take too long 3.2%
My lender and/or realtor discouraged the use of the VA program 0.0%
The VA funding fee was too high 0.0%
I didn't know about the program 46.3%
Other 19.8% SOURCE: 2010 National Survey of Veterans – Surviving Spouse Survey

2010 National Survey of Veterans - Appendix D - Detailed Tables
Surviving Spouse Survey Page D-341
VW-G6. Aware VA home loan guaranty program for surviving spouses (G6)
Estimated Population Responding to Item 841,619
Yes 3.1%
No 96.9% SOURCE: 2010 National Survey of Veterans – Surviving Spouse Survey
VW-H1. Satisfaction with ability to get accurate burial benefit information (H1)
Estimated Population Responding to Item 5,436,858
Very satisfied 8.4%
Satisfied 18.6%
Neither satisfied nor dissatisfied 11.0%
Dissatisfied 2.3%
Very dissatisfied 1.7%
I have not tried to get information 58.0% SOURCE: 2010 National Survey of Veterans – Surviving Spouse Survey

2010 National Survey of Veterans - Appendix D - Detailed Tables
Surviving Spouse Survey Page D-342
VW-H2. Importance of VA cemeteries as shrines: (H2)
Very
important Important Not very
important Not at all important
Don't know
Estimated Population
Responding to Item
Maintenance of cemetery grounds 52.5% 29.1% 2.7% 1.9% 13.8% 4,924,931
Upkeep of headstones, markers, and wall covers for cremated remains 50.7% 30.4% 2.7% 2.0% 14.2% 4,808,486
Maintenance of other landscape features 44.1% 35.3% 4.4% 2.6% 13.6% 4,722,344
Appearance of committal shelters 41.6% 33.0% 5.1% 2.3% 18.0% 4,658,148
Appearance of individual gravesites 48.0% 33.0% 3.2% 1.9% 13.9% 4,751,103
Maintenance of cemetery buildings and roads 44.4% 35.0% 4.6% 2.1% 13.9% 4,722,739
Cemetery’s front gate and entrance area 43.7% 34.4% 5.1% 2.3% 14.5% 4,737,112
Availability of parking and/or restrooms 42.6% 35.2% 4.4% 3.0% 14.8% 4,746,199
Public ceremonies and events that honor Veterans 49.0% 30.0% 5.0% 2.9% 13.1% 4,797,300
Presentation of military funeral honors 51.9% 28.0% 4.6% 2.5% 13.0% 4,778,853
Other 27.2% 21.3% 4.8% 4.6% 42.2% 792,757 SOURCE: 2010 National Survey of Veterans – Surviving Spouse Survey

2010 National Survey of Veterans - Appendix D - Detailed Tables
Surviving Spouse Survey Page D-343
VW-H3 Heard of benefits before today: (H3)
Yes No Don't know
Estimated Population
Responding to Item
Burial at a VA National or State Veterans cemetery 51.6% 34.4% 14.0% 4,905,612
Headstone and burial markers provided by VA at private cemeteries 50.7% 34.7% 14.6% 5,086,541
Presidential Memorial Certificates for next of kin 21.4% 54.9% 23.6% 4,794,956
Cash plot allowance 11.1% 62.8% 26.1% 4,763,115
Cash burial allowance 24.1% 53.1% 22.8% 4,874,007
Military Funeral Honors 51.5% 30.7% 17.8% 4,867,951
Receiving a U.S. Flag 75.2% 16.5% 8.3% 5,130,291 SOURCE: 2010 National Survey of Veterans – Surviving Spouse Survey
VW-H4. Spouse buried in a VA National/State cemetery (H4)
Estimated Population Responding to Item 5,523,463
Yes 15.7%
No 84.3% SOURCE: 2010 National Survey of Veterans – Surviving Spouse Survey

2010 National Survey of Veterans - Appendix D - Detailed Tables
Surviving Spouse Survey Page D-344
VW-H5. Aware spouse could be buried in VA National/State cemetery (H5)
Estimated Population Responding to Item 4,125,243
Yes 46.6%
No 53.4% SOURCE: 2010 National Survey of Veterans – Surviving Spouse Survey
VW-I1. Type of burial you'll have (I1)
Estimated Population Responding to Item 5,389,143
Casket burial, in-ground 54.5%
Cremation, in-ground 20.7%
Cremation, columbarium 8.2%
Mausoleum 2.5%
Something else 6.1%
Don’t know 8.0% SOURCE: 2010 National Survey of Veterans – Surviving Spouse Survey
VW-I2. Plan to be buried in VA National or State cemetery (I2)
Estimated Population Responding to Item 5,498,579
Yes 12.5%
No 81.7%
Don't know 5.8% SOURCE: 2010 National Survey of Veterans – Surviving Spouse Survey

2010 National Survey of Veterans - Appendix D - Detailed Tables
Surviving Spouse Survey Page D-345
VW-I2a. Reasons want burial in VA National/State cemetery: (I2a)
% Marked
Estimated Population
Responding to Item
No cost 23.6% 909,003
Spouse planning to be buried there/Spouse buried there 77.4% 909,003
Friends or family buried there 15.4% 909,003
Quality of services 18.9% 909,003
The honor of burial in a VA National shrine 19.6% 909,003
My spouse’s connection to the military/past service to the country 38.7% 909,003
Other 2.3% 909,003
Don’t know 9.0% 909,003 SOURCE: 2010 National Survey of Veterans – Surviving Spouse Survey

2010 National Survey of Veterans - Appendix D - Detailed Tables
Surviving Spouse Survey Page D-346
VW-I3. Reasons no burial in VA National/State cemetery: (I3)
% Marked
Estimated Population
Responding to Item
Don’t know eligibility criteria 12.1% 4,307,360
Spouse not (planning to be) buried there 78.5% 4,307,360
Quality of services 0.0% 4,307,360
Don’t know how to make arrangements with VA 3.6% 4,307,360
Made other arrangements 41.5% 4,307,360
VA services don’t accommodate religious preferences 1.1% 4,307,360
Veterans cemetery too far away (distance) 8.9% 4,307,360
Travel time to Veterans cemetery too long 5.0% 4,307,360
Appearance of cemetery doesn’t meet my expectations 0.5% 4,307,360
Want location close to other family members 33.8% 4,307,360
Want services that are not available at Veterans cemetery 1.2% 4,307,360
Too difficult to make arrangements with VA 1.0% 4,307,360
Other 3.4% 4,307,360
Don’t know 4.8% 4,307,360 SOURCE: 2010 National Survey of Veterans – Surviving Spouse Survey
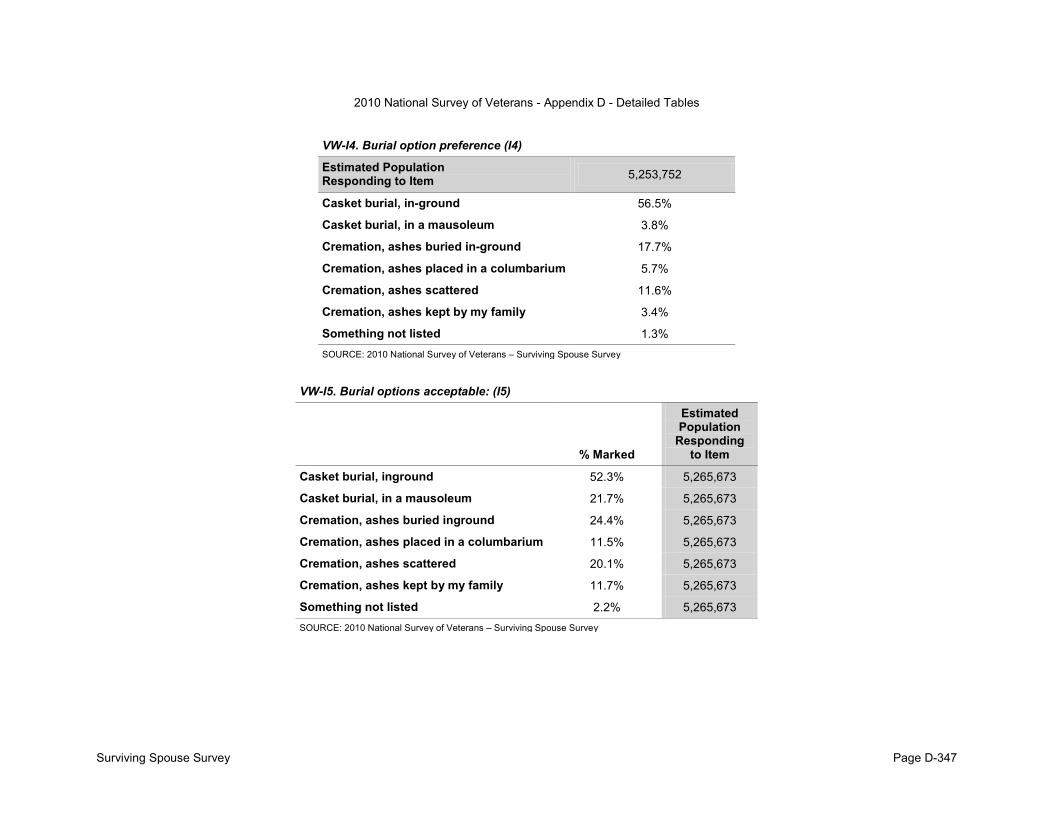
2010 National Survey of Veterans - Appendix D - Detailed Tables
Surviving Spouse Survey Page D-347
VW-I4. Burial option preference (I4)
Estimated Population Responding to Item 5,253,752
Casket burial, in-ground 56.5%
Casket burial, in a mausoleum 3.8%
Cremation, ashes buried in-ground 17.7%
Cremation, ashes placed in a columbarium 5.7%
Cremation, ashes scattered 11.6%
Cremation, ashes kept by my family 3.4%
Something not listed 1.3% SOURCE: 2010 National Survey of Veterans – Surviving Spouse Survey
VW-I5. Burial options acceptable: (I5)
% Marked
Estimated Population
Responding to Item
Casket burial, inground 52.3% 5,265,673
Casket burial, in a mausoleum 21.7% 5,265,673
Cremation, ashes buried inground 24.4% 5,265,673
Cremation, ashes placed in a columbarium 11.5% 5,265,673
Cremation, ashes scattered 20.1% 5,265,673
Cremation, ashes kept by my family 11.7% 5,265,673
Something not listed 2.2% 5,265,673 SOURCE: 2010 National Survey of Veterans – Surviving Spouse Survey

2010 National Survey of Veterans - Appendix D - Detailed Tables
Surviving Spouse Survey Page D-348
VW-J1. Use Internet at least occasionally (J1)
Estimated Population Responding to Item 5,473,269
Yes 40.3%
No 59.7% SOURCE: 2010 National Survey of Veterans – Surviving Spouse Survey
VW-J2. How often access Internet/World Wide Web (J2)
Estimated Population Responding to Item 2,096,214
At least once a day 51.5%
At least once a week but not every day 29.4%
At least once a month but less than once a week 11.0%
At least once a year but less than once a month 5.7%
Less than once a year 2.4% SOURCE: 2010 National Survey of Veterans – Surviving Spouse Survey

2010 National Survey of Veterans - Appendix D - Detailed Tables
Surviving Spouse Survey Page D-349
VW-J3. Where go online to use Internet/World Wide Web: (J3)
% Marked
Estimated Population
Responding to Item
Home 94.1% 2,107,546
Work 11.0% 2,107,546
School 0.5% 2,107,546
Public Library 4.3% 2,107,546
Community Center 0.9% 2,107,546
Someone else’s house 6.1% 2,107,546
Some other place 1.0% 2,107,546 SOURCE: 2010 National Survey of Veterans – Surviving Spouse Survey
VW-J4. Send/receive emails even occasionally (J4)
Estimated Population Responding to Item 4,975,656
Yes 41.9%
No 58.1% SOURCE: 2010 National Survey of Veterans – Surviving Spouse Survey

2010 National Survey of Veterans - Appendix D - Detailed Tables
Surviving Spouse Survey Page D-350
VW-J4a. Where go online to send/receive emails: (J4a)
% Marked
Estimated Population
Responding to Item
Home 91.1% 2,185,941
Work 10.7% 2,185,941
School 0.8% 2,185,941
Public Library 1.8% 2,185,941
Community Center 0.0% 2,185,941
Someone else’s house 9.0% 2,185,941
Some other place 2.3% 2,185,941 SOURCE: 2010 National Survey of Veterans – Surviving Spouse Survey
VW-J5. Use of Internet for activities: (J5)
Very
willing Somewhat
willing
Neither willing
nor unwilling
Somewhat unwilling
Very unwilling
Estimated Population
Responding to Item
Obtaining news and information 28.0% 15.7% 11.4% 7.2% 37.7% 4,337,654
Carrying out research on services 24.5% 17.9% 12.5% 6.3% 38.7% 4,092,108
Purchasing goods or services 16.9% 16.2% 11.3% 12.4% 43.2% 4,117,363
Responding to polls or surveys 10.2% 12.8% 14.5% 12.2% 50.3% 4,060,029
Obtain information about VA benefits 21.4% 15.9% 16.0% 7.0% 39.6% 4,203,364
Apply for VA benefits 20.6% 11.7% 17.3% 6.4% 44.0% 4,130,584 SOURCE: 2010 National Survey of Veterans – Surviving Spouse Survey

2010 National Survey of Veterans - Appendix D - Detailed Tables
Surviving Spouse Survey Page D-351
VW-J6. Want to receive VA information via Internet or World Wide Web (J6)
Estimated Population Responding to Item 5,037,616
Yes 23.0%
No 77.0% SOURCE: 2010 National Survey of Veterans – Surviving Spouse Survey
VW-K1. Family received income in past year from: (K1)
Yes No Don't know
Estimated Population
Responding to Item
Wages, salary, etc. 27.5% 69.6% 2.9% 4,354,340
Self-employment income 7.3% 90.4% 2.4% 4,116,056
Interest, dividends, etc. 48.3% 47.1% 4.6% 4,341,987
Social Security or Railroad Retirement 79.3% 17.7% 3.0% 5,056,453
Supplemental Security Income (SSI) 9.8% 86.6% 3.6% 4,036,741
Public assistance or welfare payments, state or local 4.6% 93.0% 2.4% 4,165,282
Retirement, survivor, or disability pensions 52.2% 45.3% 2.5% 4,579,137
VA Dependency and Indemnity Compensation (DIC) 6.4% 88.4% 5.2% 4,157,978
All other VA payments 1.0% 95.4% 3.6% 4,096,572
Any other sources of income received regularly 3.2% 94.0% 2.8% 4,135,476 SOURCE: 2010 National Survey of Veterans – Surviving Spouse Survey

2010 National Survey of Veterans - Appendix D - Detailed Tables
Surviving Spouse Survey Page D-352
VW-K2. Total family income range past 12 months (K2)
Estimated Population Responding to Item 4,986,200
Less than $5,000 3.2%
$5,000 to $7,499 2.0%
$7,500 to $9,999 4.7%
$10,000 to $12,499 9.7%
$12,500 to $14,999 10.4%
$15,000 to $19,999 13.9%
$20,000 to $24,999 14.3%
$25,000 to $29,999 8.2%
$30,000 to $34,999 9.1%
$35,000 to $39,999 6.7%
$40,000 to $49,999 6.3%
$50,000 to $59,999 3.9%
$60,000 to $74,999 2.6%
$75,000 to $99,999 2.6%
$100,000 to $149,999 1.6%
$150,000 or more 0.9% SOURCE: 2010 National Survey of Veterans – Surviving Spouse Survey
VW-L1. Gender (L1)
Estimated Population Responding to Item 5,682,389
Male 0.8%
Female 99.2% SOURCE: 2010 National Survey of Veterans – Surviving Spouse Survey

2010 National Survey of Veterans - Appendix D - Detailed Tables
Surviving Spouse Survey Page D-353
VW-L2. Age (L2)
Estimated Population Responding to Item 5,602,710
Younger than 45 1.5%
45 to 54 5.0%
55 to 64 11.7%
65 or 74 23.6%
75 or older 58.2% SOURCE: 2010 National Survey of Veterans – Surviving Spouse Survey
VW-L3. Number minor children (L3)
Estimated Population Responding to Item 4,077,121
No minor children 96.2%
1 Minor child 2.3%
2 Minor children 1.0%
3 Minor children 0.2%
4 or more minor children 0.3% SOURCE: 2010 National Survey of Veterans – Surviving Spouse Survey
VW-L3. Number dependent older children (L3)
Estimated Population Responding to Item 4,106,521
No dependent older children 94.8%
1 Dependent older child 3.4%
2 Dependent older children 0.9%
3 Dependent older children 0.4%
4 or more dependent older children 0.4% SOURCE: 2010 National Survey of Veterans – Surviving Spouse Survey

2010 National Survey of Veterans - Appendix D - Detailed Tables
Page D-247
NG-O7. Current marital status (O7)
Estimated Population Responding to Item 311,442
Now Married 61.3%
Widowed 0.6%
Divorced 10.6%
Separated 1.6%
Never Married 25.4%
Civil Commitment or Union 0.5% SOURCE: 2010 National Survey of Veterans – Demobilized National Guard/Reserve Survey
Demobilized National Guard and Reserve Member Survey

2010 National Survey of Veterans - Appendix D - Detailed Tables
Surviving Spouse Survey Page D-355
VW-L6. Your race (L6)
% Marked
Estimated Population
Responding to Item
White 91.6% 5,434,269
Black or African American 6.3% 5,434,269
American Indian or Alaska Native 1.7% 5,434,269
Asian Indian 0.2% 5,434,269
Chinese 0.6% 5,434,269
Filipino 0.6% 5,434,269
Other Asian 0.5% 5,434,269
Native Hawaiian 0.0% 5,434,269
Guamanian or Chamorro 0.0% 5,434,269
Samoan 0.0% 5,434,269
Other Pacific Islander 0.1% 5,434,269 SOURCE: 2010 National Survey of Veterans – Surviving Spouse Survey
VW-L7. Current marital status (L7)
Estimated Population Responding to Item 5,469,005
Now Married 4.6%
Widowed 92.8%
Divorced 2.5%
Separated 0.0%
Never Married 0.0%
Civil Commitment or Union 0.0% SOURCE: 2010 National Survey of Veterans – Surviving Spouse Survey