Embed Size (px)
Citation preview
Wetland Expert Panel, Appendix D 1
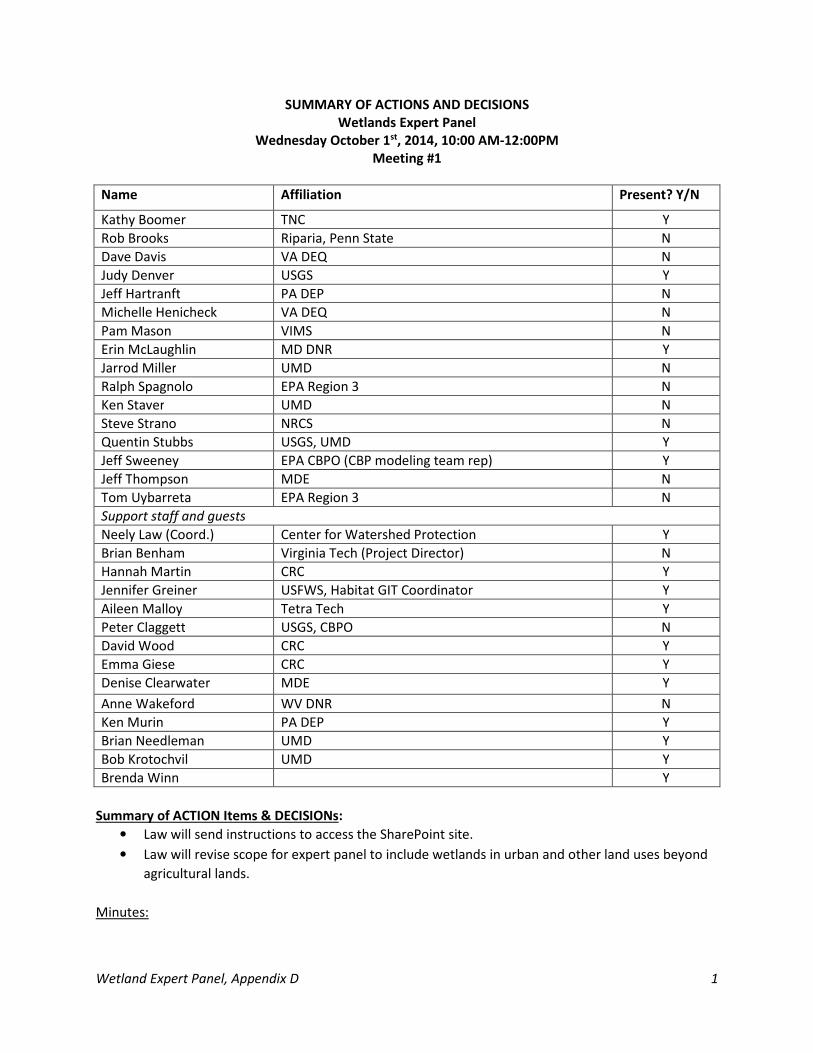
SUMMARY OF ACTIONS AND DECISIONS
Wetlands Expert Panel
Wednesday October 1st, 2014, 10:00 AM-12:00PM
Meeting #1
Name Affiliation Present? Y/N
Kathy Boomer TNC Y
Rob Brooks Riparia, Penn State N
Dave Davis VA DEQ N
Judy Denver USGS Y
Jeff Hartranft PA DEP N
Michelle Henicheck VA DEQ N
Pam Mason VIMS N
Erin McLaughlin MD DNR Y
Jarrod Miller UMD N
Ralph Spagnolo EPA Region 3 N
Ken Staver UMD N
Steve Strano NRCS N
Quentin Stubbs USGS, UMD Y
Jeff Sweeney EPA CBPO (CBP modeling team rep) Y
Jeff Thompson MDE N
Tom Uybarreta EPA Region 3 N
Support staff and guests
Neely Law (Coord.) Center for Watershed Protection Y
Brian Benham Virginia Tech (Project Director) N
Hannah Martin CRC Y
Jennifer Greiner USFWS, Habitat GIT Coordinator Y
Aileen Malloy Tetra Tech Y
Peter Claggett USGS, CBPO N
David Wood CRC Y
Emma Giese CRC Y
Denise Clearwater MDE Y
Anne Wakeford WV DNR N
Ken Murin PA DEP Y
Brian Needleman UMD Y
Bob Krotochvil UMD Y
Brenda Winn Y
Summary of ACTION Items & DECISIONs:
• Law will send instructions to access the SharePoint site.
• Law will revise scope for expert panel to include wetlands in urban and other land uses beyond
agricultural lands.
Minutes:
Wetland Expert Panel, Appendix D 2
Action: Law will send instructions to access SharePoint site. SharePoint will be used to share resources
and post meeting minutes and literature.
Water Quality GIT BMP Review Protocol and Panel Charge and Timeline (Neely Law)
The process for convening expert panels was recently updated with more explicit than last guidance.
Copies provided to panel membership. Law provided an overview of the process, highlights below.
• Recommendations from the WEP will go to the Wetland Workgroup for comments/approval.
Once workgroup approval is given, the recommendations move to the Watershed Technical
Work Group, Habitat GIT and Water Quality GIT. Invited review by other workgroups such as
Agriculture and Urban Workgroups may also occur.
The WEP Scope of work was crafted in March 2014. The Wetland Workgroup approved the scope of
work for the Ag wetlands expert panel at their meeting on September 11, 2014. Previous workshops
have explored urban wetlands, however they are largely engineered practices for storm water
management. The purpose of WEP is to look at wetlands on agricultural land that are more naturally
functioning practices.
Discussion:
• It was discussed at the Sept 11 Wetland workgroup meeting that there are in fact more natural
wetlands in urban areas that provide habitat functions. The workgroup recommended that WEP
shouldn’t exclude this type of restoration opportunity so the group could potentially revise
scope and purpose to include crediting/tracking “natural” wetlands in urban areas similar to
those credited/tracked on ag lands.
o McLaughlin: At the workgroup meeting, several individuals supported that natural
wetlands are being restored in urban settings. These practices do treat storm water but
that is not the main intent (habitat purpose with water quality benefits).
o Greiner: The wetlands outcome in the Watershed Agreement is to create/reestablish
85,000 acres and enhance 150,000 acres in both ag and urban. Focus of the habitat
team is on ag side but wetland workgroup talked about the other type of project that
deserves some credit in the model.
o Muir: there are opportunities to restore wetlands in urban landscapes and similar
impairments across land use types (urban and ag).
o Boomer: agree with idea of considering urban wetlands
o McLaughlin: The reason this came up in the workgroup meeting is because urban
wetlands are credited for drainage area treated by the practice while ag wetlands are
credited by the actual footprint acreage of the practice.
o Law: Also, there is different verification guidance depending on BMP on ag vs urban so
credit might be similar but reporting and verification might be different.
• Action: Revise scope for expert panel to include wetlands in urban and other land uses beyond
ag
Chesapeake Bay Watershed Model (Jeff Sweeney, CBPO)
Presentation on the Chesapeake Bay Watershed Model and how wetlands are currently defined, their
loading rate and pollutant load reductions calculated.
Wetland Expert Panel, Appendix D 3
The current Watershed model is in Phase 5.3.2. The model will be updated with Phase 6 by 2017 and
will give a clean slate to add new BMPs and land uses. Currently, Wetland Enhancement is not credited
but it is part of the wetland outcome in the Watershed Agreement.
Credit for wetland restoration is based off Tom Jordan’s previous work/group (incl STAC workshop) that
investigated water quality benefits of these practices. The credit is based on the area of the wetland
itself and the watershed that drains to it, however since 2007, little if any reported of the watershed is
reported which is needed. Therefore, a default was created and now when a drainage area is not
provided, a landuse conversion from crop to forest and reduction efficiencies are assigned by
hydrogeomorphic area based on regional conditions (see presentation for values).
• Sources of this data are reserve program, CREP, CEP, FWS. Wetland data are inputted by state
data contacts into the National Environmental Information Exchange Network (NEIEN) and the
Chesapeake Bay Program’s Watershed Model receives the data from NEIEN in order to track
progress and issue credits.
• The task of the WEP is it develop recommendations pre and post BMP of wetlands. Consider the
available data in order to credit the mechanism. The Bay Program has EPA funding for states and
can put in requirements about what needs to be collected/reported in order to receive the
credits the WEP recommends.
• Things to consider
o Reporting mechanism is NEIEN.
o There aren’t many required fields currently but it has capability to add more information
for the projects being done. More we know about these projects the more likely it is
meeting design standards. Good way to track projects that are more likely to be
maintained.
o Best professional judgment in comparison to other BMPs
o Wetland enhancement: need to account for degraded condition before benefits can be
applied to enhancement.
• Model Support for the WEP: Call Jeff Sweeney with specific questions about the model. Quentin
Stubbs is working with Peter Claggett and the land use workgroup and will also provide technical
support.
• Discussion:
o Greiner: The real issue is how to get states to include certain information like
enhancement data. Previously not reported. Lack of incentive to report enhancement
for credit
� Give states notice in the implementation plans and make it clear that if that field
isn’t filled in then they won’t get credit. The need for verification is a
justification for keeping that language in the WIPs.
o McLaughlin: if groups are designing the projects, they have to know the drainage area
so that’s an opportunity with Chesapeake Bay Trust Fund that apply for grant funding to
tell them what they need to provide. That will work in MD but needs to spread to other
states.
Action: A copy of the presentation is uploaded to the Sharepoint site
Wetland Expert Panel, Appendix D 4
Proposal to Define Wetlands as a Land Use for the Phase 6 Chesapeake Bay Watershed Model (Erin
McLaughlin)
Currently, wetlands are lumped together with forests as a land use in the Watershed Model. Loading
rate for wetlands are similar to forests so in the model they are represented as forest. Want to
represent wetland area in the model and determine loads for P, N, and Sediment. Wetland restoration
field practitioners would like to pull out wetlands and wetland types as their own separate land use. In
order to add wetlands as a new land use, the WEP would be tasked to define loads from land use types.
• Why do practitioners want to have wetlands as a new land use? Wetlands process differently
than forest and habitat values are different than forest and being able to track wetlands
separately would be important to meeting targets of Watershed agreement. They may not have
significantly different loading rates than forests but there is concern that this has not been fully
explored and agreed upon.
• Olivia Deveraux (Chesapeake Bay Program) will present at Nov meeting on the land use targets
that are being developed for Phase 6 of the model and tell us what they are looking for in order
to have wetlands as a new land use.
• NWI is the primary data across watershed because it is standardized. There are discrepancies in
states that have LiDAR maps however not all counties have LiDAR maps.
Discussion:
• Sweeney: you want to differentiate between the landuses. 1. Diff loading rates 2. Own goals you
need to measure though images like NWI 3. Climate change
• Jeff, DEP: clarify streams as a landuse?
o Currently streams represented in model are 100 cfs or greater. In the next model hoping
to get more specific and detailed than that. Not modeling every creek but that is acres
of streams that are greater than 100 cfs.
• Ideally would need working numbers by December and then finalized by February ideally.
o 1. Smaller working groups to propose definitions and loading rates to the larger groups
in order to vet
o 2. Move together and focus on landuse for 4 months and then look at efficiencies.
• What wetland classifications are missing?
o Freshwater tidal
o Coastal
o Tidal forested
o Cowardin Wetland System: http://www.fws.gov/wetlands/Documents/Wetlands-and-
Deepwater-Habitats-Classification-chart.pdf
o NOAA CCAP:
http://coast.noaa.gov/digitalcoast/_/pdf/ccap_class_scheme.pdf?redirect=301ocm
o Boomer is interested in participating in smaller landuse group discussion.
o New version of Sparrow coming out and has a delivery factor that accounts for factors
that understand ground water recharge and runoff. Vegetative index. Two factors for
groundwater (recharge potential in an area, AWC average water contact) carbonate
areas in piedmont (factor for delivery N).
Wetland Expert Panel, Appendix D 5
Next meetings: moving forward.
• First Wednesday of the month at 10
• Reconvene with Boomer and develop strategy to set starting point to start literature review.
• December: research workshop where we lay out articles and people are assigned and can
provide summaries.
• RAE Summit first week of November, so move to second week. Look for doodle poll.
MEETING ADJOURNED: 12:10pm
Wetland Expert Panel, Appendix D 6
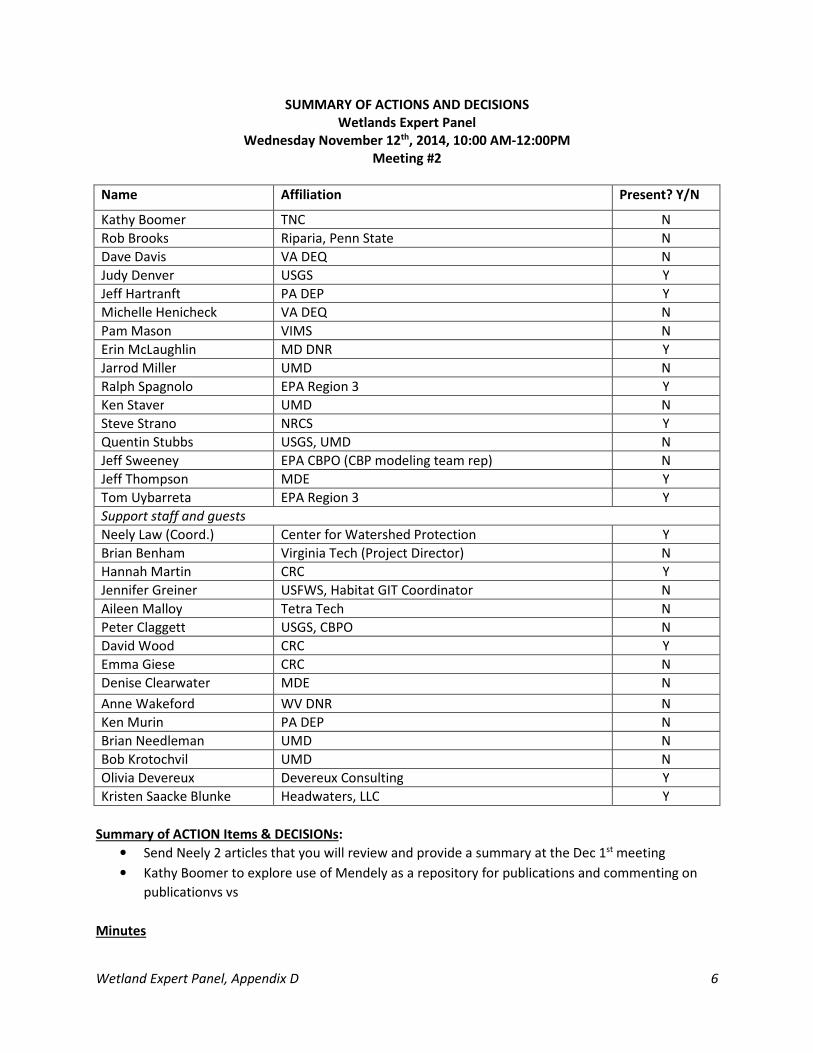
SUMMARY OF ACTIONS AND DECISIONS
Wetlands Expert Panel
Wednesday November 12th, 2014, 10:00 AM-12:00PM
Meeting #2
Name Affiliation Present? Y/N
Kathy Boomer TNC N
Rob Brooks Riparia, Penn State N
Dave Davis VA DEQ N
Judy Denver USGS Y
Jeff Hartranft PA DEP Y
Michelle Henicheck VA DEQ N
Pam Mason VIMS N
Erin McLaughlin MD DNR Y
Jarrod Miller UMD N
Ralph Spagnolo EPA Region 3 Y
Ken Staver UMD N
Steve Strano NRCS Y
Quentin Stubbs USGS, UMD N
Jeff Sweeney EPA CBPO (CBP modeling team rep) N
Jeff Thompson MDE Y
Tom Uybarreta EPA Region 3 Y
Support staff and guests
Neely Law (Coord.) Center for Watershed Protection Y
Brian Benham Virginia Tech (Project Director) N
Hannah Martin CRC Y
Jennifer Greiner USFWS, Habitat GIT Coordinator N
Aileen Malloy Tetra Tech N
Peter Claggett USGS, CBPO N
David Wood CRC Y
Emma Giese CRC N
Denise Clearwater MDE N
Anne Wakeford WV DNR N
Ken Murin PA DEP N
Brian Needleman UMD N
Bob Krotochvil UMD N
Olivia Devereux Devereux Consulting Y
Kristen Saacke Blunke Headwaters, LLC Y
Summary of ACTION Items & DECISIONs:
• Send Neely 2 articles that you will review and provide a summary at the Dec 1st meeting
• Kathy Boomer to explore use of Mendely as a repository for publications and commenting on
publicationvs vs
Minutes
Wetland Expert Panel, Appendix D 7
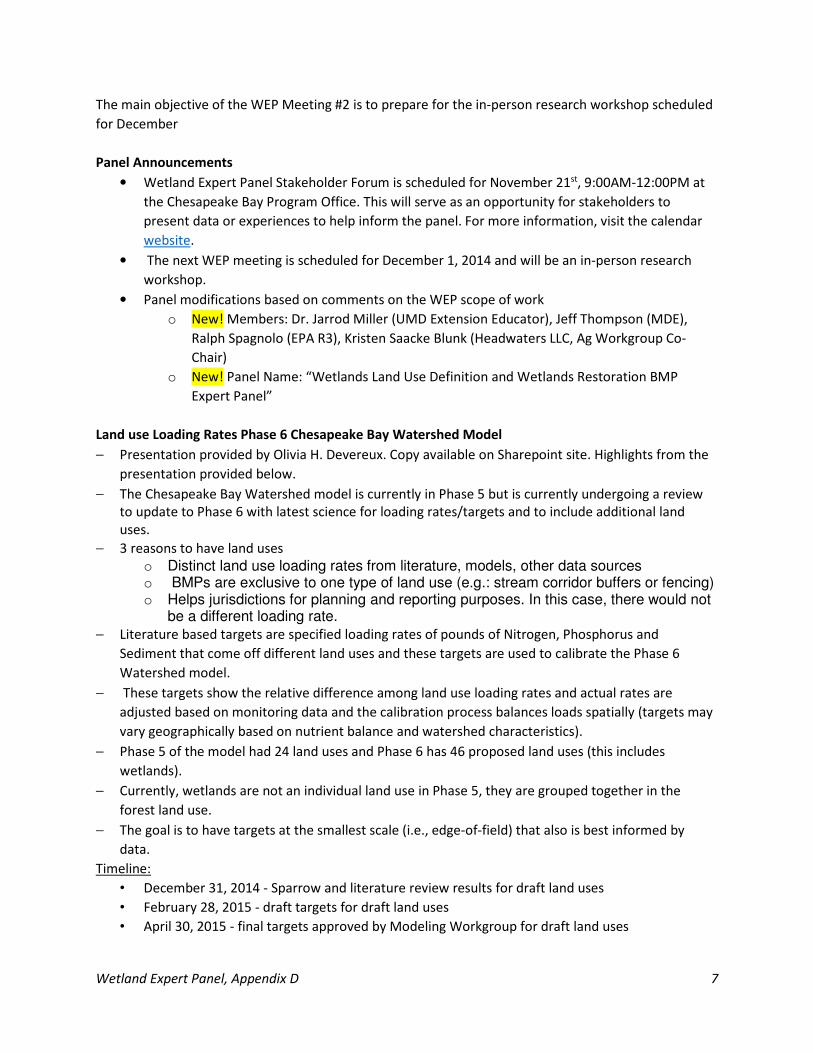
The main objective of the WEP Meeting #2 is to prepare for the in-person research workshop scheduled
for December
Panel Announcements
• Wetland Expert Panel Stakeholder Forum is scheduled for November 21st, 9:00AM-12:00PM at
the Chesapeake Bay Program Office. This will serve as an opportunity for stakeholders to
present data or experiences to help inform the panel. For more information, visit the calendar
website.
• The next WEP meeting is scheduled for December 1, 2014 and will be an in-person research
workshop.
• Panel modifications based on comments on the WEP scope of work
o New! Members: Dr. Jarrod Miller (UMD Extension Educator), Jeff Thompson (MDE),
Ralph Spagnolo (EPA R3), Kristen Saacke Blunk (Headwaters LLC, Ag Workgroup Co-
Chair)
o New! Panel Name: “Wetlands Land Use Definition and Wetlands Restoration BMP
Expert Panel”
Land use Loading Rates Phase 6 Chesapeake Bay Watershed Model
− Presentation provided by Olivia H. Devereux. Copy available on Sharepoint site. Highlights from the
presentation provided below.
− The Chesapeake Bay Watershed model is currently in Phase 5 but is currently undergoing a review
to update to Phase 6 with latest science for loading rates/targets and to include additional land
uses.
− 3 reasons to have land uses
o Distinct land use loading rates from literature, models, other data sources o BMPs are exclusive to one type of land use (e.g.: stream corridor buffers or fencing) o Helps jurisdictions for planning and reporting purposes. In this case, there would not
be a different loading rate.
− Literature based targets are specified loading rates of pounds of Nitrogen, Phosphorus and
Sediment that come off different land uses and these targets are used to calibrate the Phase 6
Watershed model.
− These targets show the relative difference among land use loading rates and actual rates are
adjusted based on monitoring data and the calibration process balances loads spatially (targets may
vary geographically based on nutrient balance and watershed characteristics).
− Phase 5 of the model had 24 land uses and Phase 6 has 46 proposed land uses (this includes
wetlands).
− Currently, wetlands are not an individual land use in Phase 5, they are grouped together in the
forest land use.
− The goal is to have targets at the smallest scale (i.e., edge-of-field) that also is best informed by
data.
Timeline:
• December 31, 2014 - Sparrow and literature review results for draft land uses
• February 28, 2015 - draft targets for draft land uses
• April 30, 2015 - final targets approved by Modeling Workgroup for draft land uses
Wetland Expert Panel, Appendix D 8
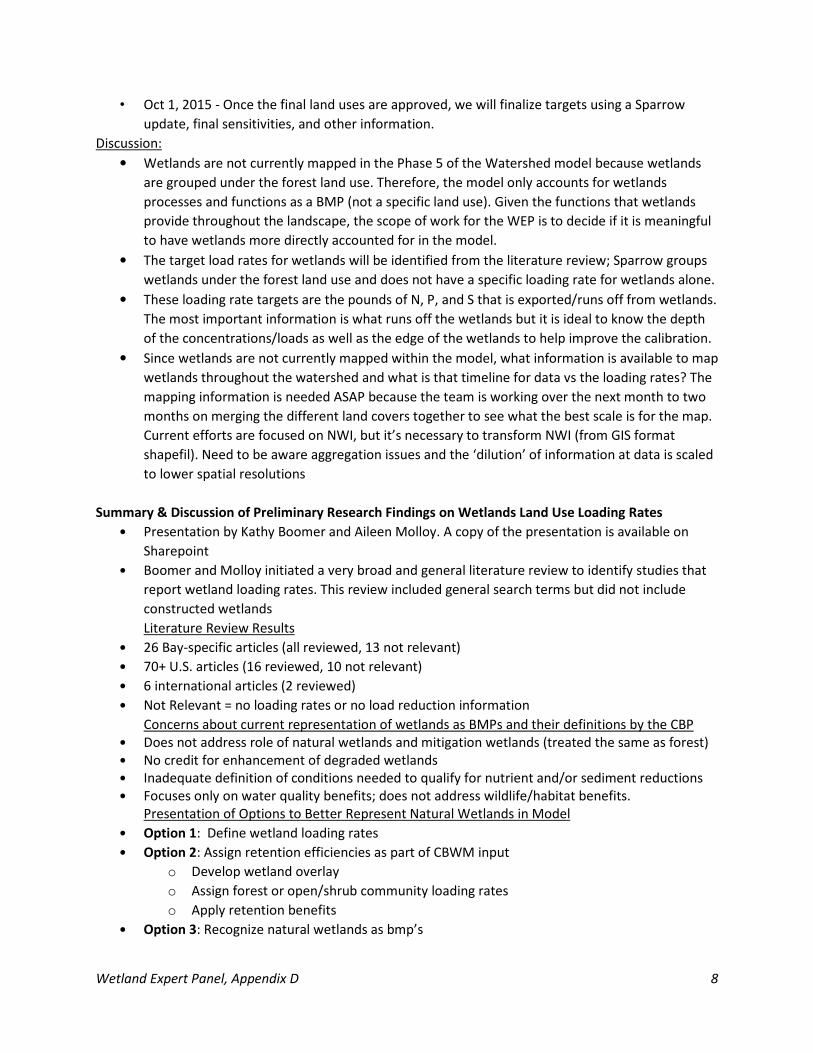
• Oct 1, 2015 - Once the final land uses are approved, we will finalize targets using a Sparrow
update, final sensitivities, and other information.
Discussion:
• Wetlands are not currently mapped in the Phase 5 of the Watershed model because wetlands
are grouped under the forest land use. Therefore, the model only accounts for wetlands
processes and functions as a BMP (not a specific land use). Given the functions that wetlands
provide throughout the landscape, the scope of work for the WEP is to decide if it is meaningful
to have wetlands more directly accounted for in the model.
• The target load rates for wetlands will be identified from the literature review; Sparrow groups
wetlands under the forest land use and does not have a specific loading rate for wetlands alone.
• These loading rate targets are the pounds of N, P, and S that is exported/runs off from wetlands.
The most important information is what runs off the wetlands but it is ideal to know the depth
of the concentrations/loads as well as the edge of the wetlands to help improve the calibration.
• Since wetlands are not currently mapped within the model, what information is available to map
wetlands throughout the watershed and what is that timeline for data vs the loading rates? The
mapping information is needed ASAP because the team is working over the next month to two
months on merging the different land covers together to see what the best scale is for the map.
Current efforts are focused on NWI, but it’s necessary to transform NWI (from GIS format
shapefil). Need to be aware aggregation issues and the ‘dilution’ of information at data is scaled
to lower spatial resolutions
Summary & Discussion of Preliminary Research Findings on Wetlands Land Use Loading Rates
• Presentation by Kathy Boomer and Aileen Molloy. A copy of the presentation is available on
Sharepoint
• Boomer and Molloy initiated a very broad and general literature review to identify studies that
report wetland loading rates. This review included general search terms but did not include
constructed wetlands
Literature Review Results
• 26 Bay-specific articles (all reviewed, 13 not relevant)
• 70+ U.S. articles (16 reviewed, 10 not relevant)
• 6 international articles (2 reviewed)
• Not Relevant = no loading rates or no load reduction information
Concerns about current representation of wetlands as BMPs and their definitions by the CBP
• Does not address role of natural wetlands and mitigation wetlands (treated the same as forest)
• No credit for enhancement of degraded wetlands
• Inadequate definition of conditions needed to qualify for nutrient and/or sediment reductions
• Focuses only on water quality benefits; does not address wildlife/habitat benefits.
Presentation of Options to Better Represent Natural Wetlands in Model
• Option 1: Define wetland loading rates
• Option 2: Assign retention efficiencies as part of CBWM input
o Develop wetland overlay
o Assign forest or open/shrub community loading rates
o Apply retention benefits
• Option 3: Recognize natural wetlands as bmp’s
Wetland Expert Panel, Appendix D 9
o Develop wetland overlay and assign efficiencies
o Incorporate as filter/bmp application model component
� Incorporate effects of up-slope contributions
� Compare predicted benefits with bmp’s more directly.
� Provides easier framework for updating information and integrating with
County WIP plans
Discussion
• The explicit assignment of land use loading rates similar to other land use loading rates may not
be supported in the current literature. The best option moving forward may be to get input on
where the three options fit with WEP members’ knowledge as practitioners/regulators.
• S. Strano states wetlands are a unique land use; need to consider how wetlands land use
updated in future years
• Wetlands are unique in that they could be a land use but also function as a BMP. Ability to
assign loading rates to different types of wetlands limited (J. Thompson).
• A commonality across the studies is that vegetation is a short term sink for uptake of the
nutrients which had lead researchers to think of wetlands as permanent sinks.
• Option 2 and 3 may be the best options for WEP to address.
• Q. Stubbs request for wetland mapping data from States. Important to consider scale of data,
define a baseline year and how acreage will change in future years
R. Spagnolo stated EPA Watershed Resources Registry as a potential source of data for mapping
wetlands
Wetland Expert Panel, Appendix D 10
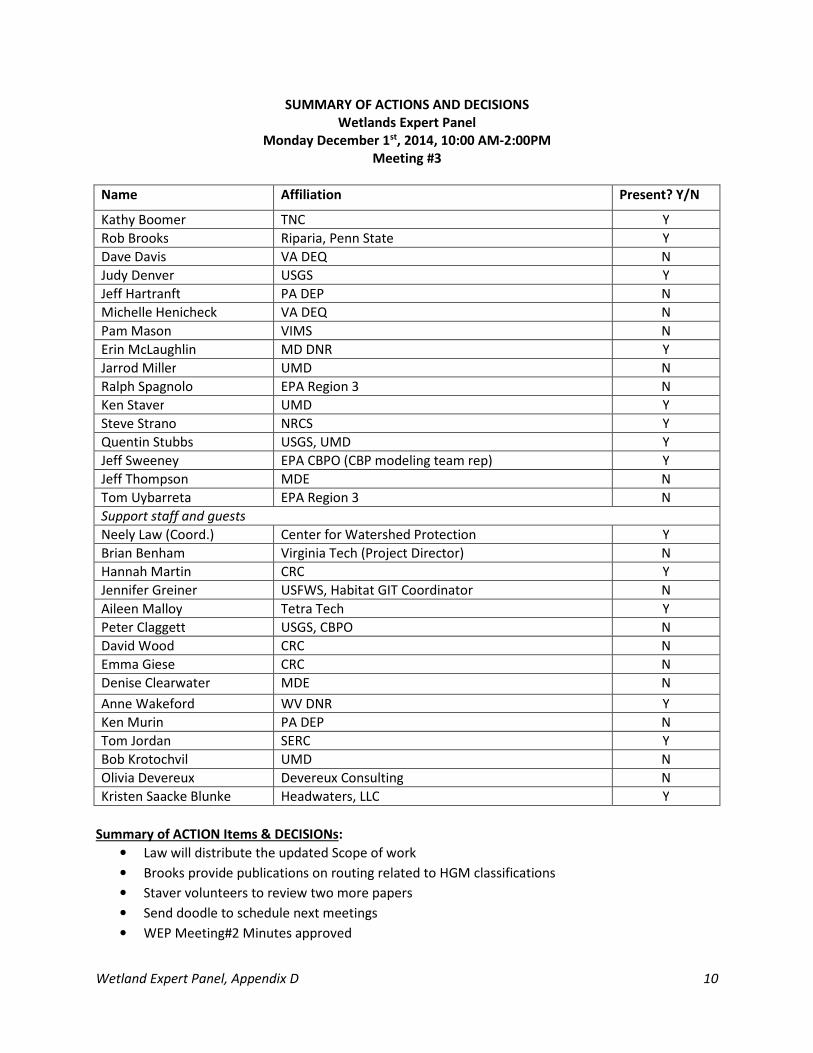
SUMMARY OF ACTIONS AND DECISIONS
Wetlands Expert Panel
Monday December 1st, 2014, 10:00 AM-2:00PM
Meeting #3
Name Affiliation Present? Y/N
Kathy Boomer TNC Y
Rob Brooks Riparia, Penn State Y
Dave Davis VA DEQ N
Judy Denver USGS Y
Jeff Hartranft PA DEP N
Michelle Henicheck VA DEQ N
Pam Mason VIMS N
Erin McLaughlin MD DNR Y
Jarrod Miller UMD N
Ralph Spagnolo EPA Region 3 N
Ken Staver UMD Y
Steve Strano NRCS Y
Quentin Stubbs USGS, UMD Y
Jeff Sweeney EPA CBPO (CBP modeling team rep) Y
Jeff Thompson MDE N
Tom Uybarreta EPA Region 3 N
Support staff and guests
Neely Law (Coord.) Center for Watershed Protection Y
Brian Benham Virginia Tech (Project Director) N
Hannah Martin CRC Y
Jennifer Greiner USFWS, Habitat GIT Coordinator N
Aileen Malloy Tetra Tech Y
Peter Claggett USGS, CBPO N
David Wood CRC N
Emma Giese CRC N
Denise Clearwater MDE N
Anne Wakeford WV DNR Y
Ken Murin PA DEP N
Tom Jordan SERC Y
Bob Krotochvil UMD N
Olivia Devereux Devereux Consulting N
Kristen Saacke Blunke Headwaters, LLC Y
Summary of ACTION Items & DECISIONs:
• Law will distribute the updated Scope of work
• Brooks provide publications on routing related to HGM classifications
• Staver volunteers to review two more papers
• Send doodle to schedule next meetings
• WEP Meeting#2 Minutes approved
Wetland Expert Panel, Appendix D 11
Minutes
Updates
The WEP scope of work has been updated based on comments received from the wetland workgroup.
Action: Law will distribute the updated SOW
The WEP membership has been updated. Denise Clearwater is the new MDE alternate for Jeff
Thompson and Anne Wakeford is the new WV representative (both are wetland workgroup members).
Presentation: Modeling Wetlands in the Watershed (Tom Jordan, SERC)
Tom Jordan presented on modeling wetlands in the watershed, comparing N and P removal among
wetlands receiving unregulated inflows, and predicting removal efficiency from the proportion of
wetlands in watersheds. Noted importance of wetland flowpaths on wetland function and effect on
water quality benefits. Jordan concludes that efficiency cannot be assigned a single value because it is a
function of wetland size relative to inflow and it is important to quantify uncertainties when dealing with
BMP selection. Determining the uncertainty is important because just using the best-guess efficiency
biases selection toward inexpensive, poorly-understood (risky) BMPs.
- Baker et al 2006 propose functional riparian metrics to account for spatial distribution of forest areas
based on flow pathways. NLCD (30m) not sufficient resolution to measure buffer widths; subsequent
publication by Weller and Baker applied analysis to CB Watershed
Discussion:
• Law: This presentation supports the importance of landscape positon and representation of
wetlands in the model
• Saacke Blunk: Is there anyone on the WEP that can explore the question of uncertainties with
the efficiency?
o Jordan: Expert Panelss should report their estimated efficiency along with the
uncertainty of the estimate so that both can be taken into consideration when
designing/driving BMP selection. Report uncertainty along with metric on pollutant
removal
o Strano: Every BMP has so many uncertainties/variability associated, if you get too
precise on that aspect you will never be able to get that certainty of the efficiencies
related to other BMPs in the real world.
o Staver: Bottom line is to capture the average value and you do the best you can but you
have to be careful about chasing the uncertainty values. The local governments are
thinking about the TMDL because they are required to meet those targets.
o Strano: It’s hard to compare urban BMPs vs ag style BMPs. Ag BMPs tend to have other
benefits (wildlife, habitat benefits) and it’s important to include in the presentations and
document habitat benefits and how to incorporate into this report.
Presentation: Mapping Wetlands (Quentin Stubbs, USGS/CBP)
Wetlands are not currently explicitly represented in the Chesapeake Bay Watershed Model. Quentin
overviewed the data requirements and land use classes. Wetlands are proposed to be a land use under
the natural land uses with tidal emergent, fresh emergent, and non-tidal woody as the subclasses of
wetlands. Quentin laid out specific key questions that the expert panel members must consider while
discussing mapping wetlands.
Wetland Expert Panel, Appendix D 12
1. What is the best spatial scale to use?
2. How will we decipher between “perceived” versus “known” wetlands?
3. What will serve as the base year of wetland coverage
4. Is it feasible to differentiate the HGM conditions and subsequent loading rates for each land use
class at each level?
5. How will we justify having wetland types with different loading rates?
6. What type of credit will we give BMPs?
a. How would we translate the credit into loading rates for wetlands?
Discussion:
• Law: Recommendations on wetland land use part of panel scope; may consider this initial
mapping as a starting point.
• Brooks: Must think about landscape position and definitely need to go to 10m level and
combine National Land Cover Dataset (NLCD) with high resolution. Is it possible to incorporate
HDM into NWI and possibly create a hybrid classification? I like the idea of using other sources
such as National Hydrography Dataset (NHD) and digital elevation models (DEMs) and soil/crop
data to get closer to what areas are most likely wetlands but groundtruthing exercises will be
needed to determine accuracy. Base Year; 2009 (BMPs, TMDL began), 2012 (last ag census for
crop data) but PA wetlands data are from the 80’s and they don’t plan on updating.
• Sweeney: Base year is key and inventory, but more important is being able to do the same
inventory 5-10 years in the future.
• Stubbs: USGS requested data from local jurisdictions. Quality and type of data provided highly
variable
• Brooks: Nutrient removal efficiencies are different for different vegetative types for wetlands
• Law: Is there in interest for tidal/non-tidal emergent/non-emergent as 4 key groupings as a
starting point?
o McLaughlin: There is also tidal woody wetalnds
• Sweeney: what are the proposed breaks? 10 m as minimum with hybrid between level 2 and 3
to account with emergent and forested but data are needed to justify.
• Brooks: Is it possible to build in HGM with modifiers because isolated wetlands versus those
associated with streams/rivers will have a different function?
• Denver: Hydrogeology based on geographic region
• Action: Brooks will send publications on flow routing/ HGM report
Literature Reviews (All)
Boomer and Malloy laid out three options at the last meeting for the WEP members to consider.
Option 1: Define wetland loading rates
Option 2: Assign retention efficiencies as part of CBWM input (apply efficiencies as part of the input data
set that drives the model)
� Develop wetland overlay
� Assign forest or open/shrub community loading rates
� Apply retention benefits
Option 3: Recognize wetlands as natural bmp’s in the landscape (efficiencies are applied in the
application step to use as part of the scenario assessment process)
� Develop wetland overlay to existing land uses and assign efficiencies
Wetland Expert Panel, Appendix D 13
� Incorporate as filter/bmp application model component
� Incorporate effects of up-slope contributions
� Compare predicted benefits with bmp’s more directly.
� Provides easier framework for updating information and integrating
with County WIP plans
Overview Discussion:
� Law: Need to define natural wetland for the wetlands land use and then you can apply wetland
BMPs to it to enhance.
� Boomer: We could propose to expand to capture benefits of wetland enhancement for existing
wetlands. Count explicitly/include benefits of natural wetlands which could be incentive for
protection.
Literature Review Report Outs
1. Rob Brooks
a. Kroger, R, RE Lizotte, Jr., FD Shields, Jr., E Usborne. 2012. Inundation influences on
bioavailability of phosphorus in managed wetland sediments in agricultural landscapes.
Journal of Environmental Quality 41:604-614.
i. This would be a good paper for other EP members to review and refer to it. The
tables are dense but have a lot of information and the reporting range are quite
wide but overall it is a good review. The tables do not give you an idea of the
specific wetland type, rather it’s more flux type (amount moving through the
system through various pathways). The illustrations are useful too.
ii. Law: Might be noteworthy to see if the data reported in Fisher and Acerman is
similar.
b. Parn, J, G Pinay, U Mander. 2012. Indicators of nutrients transport from agricultural
catchments under temperate climate: a review. Ecological Indicators 22:4-15.
2. Anne Wakeford
a. Noe, Gregory B., et. al (2013) Hydrogeomorphology Influences Soil Nitrogen and
Phosphorus Mineralization in Floodplain Wetlands Ecosystems 16:75-94
i. Boomer: Important to map wetlands but need to determine if they have distinct
loading rate that is different from forest land use.
3. Judy Denver
a. Seldomridge and Prestegaard, 2014. Geochemical, Temperature, and Hydrologic
Transport Limitations on Nitrate Retention in Tidal Freshwater Wetlands, Patuxent
River, Maryland. Wetlands (2014) 34:641-651
b. Kellogg, et al. 2008. Riparian Ground-Water Flow Patterns using Flownet Analysis:
Evapotranspiration-Induced Upwelling and Implications for N Removal. JAWRA Vol. 44,
No. 4:1024-1034.
4. Kristen Saacke Blunk
a. Duriancik, L. F. et al 2008 The First Five Years of the Conservation Effects Assessment
Project – CEAP Wetlands Component (NOT RELEVANT)
b. Richardson, C.J. et al 2011 Integrated stream and wetland restoration: A watershed
approach to improved water quality on the landscape
5. Steve Strano
Wetland Expert Panel, Appendix D 14
a. Mitsch, WJ, JW Day, L Zhang, and RR Lane. Nitrate-nitrogen retention in wetlands in the
Mississippi River Basin. Ecological Engineering 24-267-278, 2005
b. Huang, J, WJ Mitsch and DL Johnson. Estimating biogeochemical and biotic interactions
between a stream channel and created riparian wetland: A medium-scale physical
model. Ecological Engineering 37-1035-1049, 2011
c. Discussion:
i. Both papers are more about BMP efficiencies but would apply to passive
diversion
6. Ken Staver
a. Wilson and Morris. 2012. Biogeochemistry. The influence of tidal forcing on
groundwater flow and nutrient exchange in a salt marsh-dominated estuary.
b. Rogers et al. 2009. JAWRA. Hydrologic and water quality functions of a disturbed
wetland in an agricultural setting.
c. Action: Staver volunteers to review two more papers
7. Erin McLaughlin
a. Dianna M. Hogan and Mark R. Walbridge. Urbanization and Nutrient Retention in
Freshwater Riparian Wetlands. 2007. Ecological Applications 17(4): 1142–1155.
b. Allison R. Aldous, Christopher B. Craft, Carla J. Stevens, Matthew J. Berry, and Leslie B.
Bach. Soil Phosphorus Release from a Restoration Wetland, Upper Klamath Lake,
Oregon. 2007. Wetlands 27(4): 1025-1035.
c. John M. Marton, M. Siobhan Fennessy, and Christopher B. Craft. USDA Conservation
Practices Increase Carbon Storage and Water Quality Improvement Functions: An
Example from Ohio. 2013. Restoration Ecology.
i. USDA BMPs-Ohio; depends on vegetation and location of practices but it is
useful to support options 2 and 3.
These literature reviews/papers will be posted on sharepoint.
There will be continued literature review to build familiarity with data out there and see if we can begin
to see if one of these three options would be best supported. This discussion will continue over email
exchanges before the next WEP meeting.
Continued Discussion:
1. Representing wetlands (mapping) in CBW.
• Minimum would be 10 M dataset and fine tune with other finer scale data analysis to capture
tidal/nontidal, emergent/woody
• Need to make sure that the data used will be there in the future in order to continue to calibrate
the model
2. Check-in with expert panel on Options 1, 2, 3
• Stubbs: Pass
• Staver: 2&3
• Wakeford: Pass
• Strano: 2&3 based on availability of data
• Denver: 3
• Boomer: 3

Wetland Expert Panel, Appendix D 15
• McLaughlin: 3
Action: Send doodle to schedule next meetings.
ADJOURN
Wetland Expert Panel, Appendix D 16
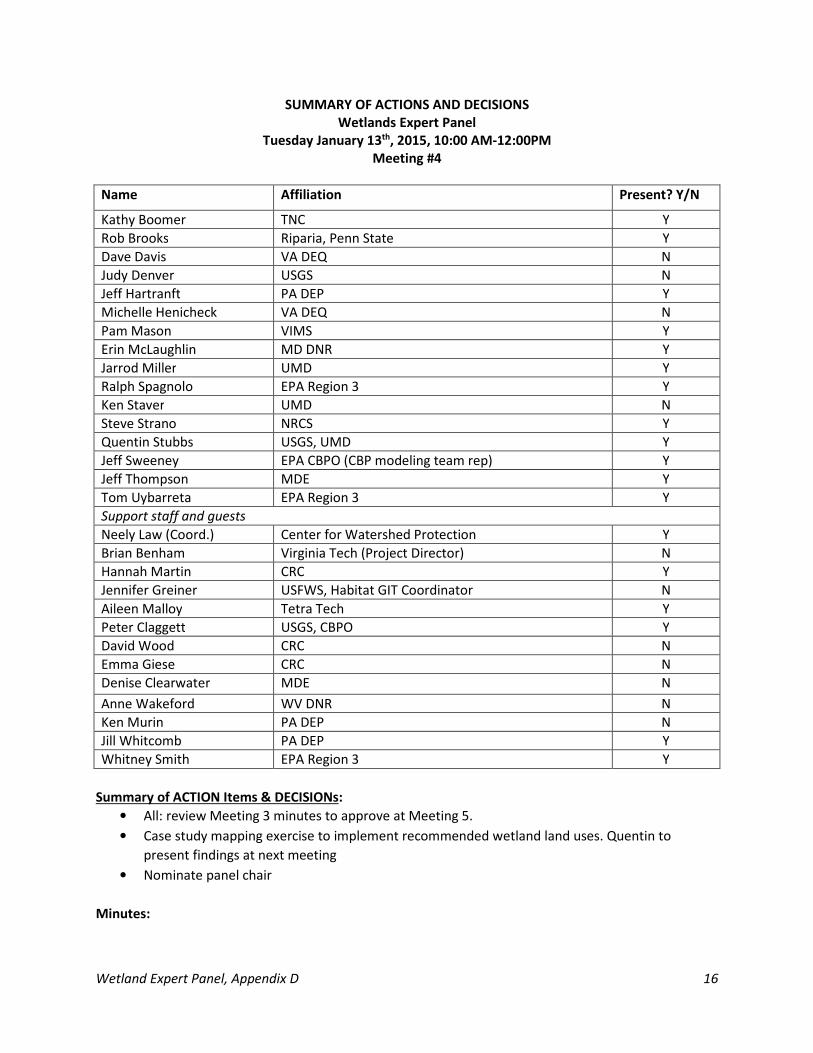
SUMMARY OF ACTIONS AND DECISIONS
Wetlands Expert Panel
Tuesday January 13th, 2015, 10:00 AM-12:00PM
Meeting #4
Name Affiliation Present? Y/N
Kathy Boomer TNC Y
Rob Brooks Riparia, Penn State Y
Dave Davis VA DEQ N
Judy Denver USGS N
Jeff Hartranft PA DEP Y
Michelle Henicheck VA DEQ N
Pam Mason VIMS Y
Erin McLaughlin MD DNR Y
Jarrod Miller UMD Y
Ralph Spagnolo EPA Region 3 Y
Ken Staver UMD N
Steve Strano NRCS Y
Quentin Stubbs USGS, UMD Y
Jeff Sweeney EPA CBPO (CBP modeling team rep) Y
Jeff Thompson MDE Y
Tom Uybarreta EPA Region 3 Y
Support staff and guests
Neely Law (Coord.) Center for Watershed Protection Y
Brian Benham Virginia Tech (Project Director) N
Hannah Martin CRC Y
Jennifer Greiner USFWS, Habitat GIT Coordinator N
Aileen Malloy Tetra Tech Y
Peter Claggett USGS, CBPO Y
David Wood CRC N
Emma Giese CRC N
Denise Clearwater MDE N
Anne Wakeford WV DNR N
Ken Murin PA DEP N
Jill Whitcomb PA DEP Y
Whitney Smith EPA Region 3 Y
Summary of ACTION Items & DECISIONs:
• All: review Meeting 3 minutes to approve at Meeting 5.
• Case study mapping exercise to implement recommended wetland land uses. Quentin to
present findings at next meeting
• Nominate panel chair
Minutes:
Wetland Expert Panel, Appendix D 17
Wetland Expert Panel Meeting 4 Purpose—Presentation on a recommended approach and data to
generate a map of wetland land uses across the Chesapeake Bay Watershed. The Land use workgroup
and modeling team will be working together in 2015 to implement information to map wetlands and
other land uses.
Presentation: Phase 6 Wetland Land Use Classification, Quentin Stubbs
a. Recommendations to use NWI coupled with other supplemental data at state and local
level . A comparison of wetland mapping data options suggests NWI provides the ‘best
available’ data as a starting point for bay-wide mapping purposes. The 3 proposed
wetland land uses based on the water quality benefit functions provided by wetlands to
include: estuarine, floodplain, depressional
b. Discussion:
i. Claggett provided further clarification on input requested from expert panel.
Proposing to use NWI and state wetland maps to determine where wetlands are
located. Then look at how those wetlands function with respect to their water
quality function for nutrient and sediment reduction. Review attributes in NWI
database to assist with land use type, in addition to landscape context to
determine how these wetlands (ancillary data will come in to inform the breaks
between estuarine, floodplain, and depressional wetlands).
ii. Timeline: Mid March-draft land use data set and methods needed to be given to
Water Quality GIT. Refine mapping between March and October
iii. Spagnolo: Are we going to use the NWI classifications?
iv. Law: This will be placeholder and starting point to determine if it is or is it not a
wetland and is this data sufficient to capture wetlands bay-wide
v. Spagnolo: Why do we need the categories?
vi. Claggett: Need to know classes/categories we are going to be mapped and
define a unique loading rate with each of them. Proposing simplistic, minimum
of three classes by March. March-October. This is for land use, not BMP.
vii. Brooks: States will have different quality data, is it necessary to have consistent
data across the whole watershed or can you use better data where it’s available.
Unlikely you will get seamless one layer of wetlands for the whole basin.
Important to document decisions in metadata.
viii. Boomer: Agree with Brooks, especially because quality of NWI varies state by
state. Could someone come forward and restore a wetland that occurs but isn’t
mapped? Specify how you use data for practitioners and county for meeting the
WIPs. Note to Panel: we need to address this as part of reporting and tracking
ix. Mason: Need to resolve mapping of regulatory wetlands; NWI may not include
these wetlands. Need to clarify
x. Mason: Recommends creation of a tidal wetland class to include both
freshwater and saline. From a modeling perspective, tidal wetlands modeled in
the Estuarine model and not the Chesapeake Bay Watershed
xi. Thompson: How did Quentin come up with the three classifications?
xii. Claggett: Landscape position and how these wetlands would perform.
Wetland Expert Panel, Appendix D 18
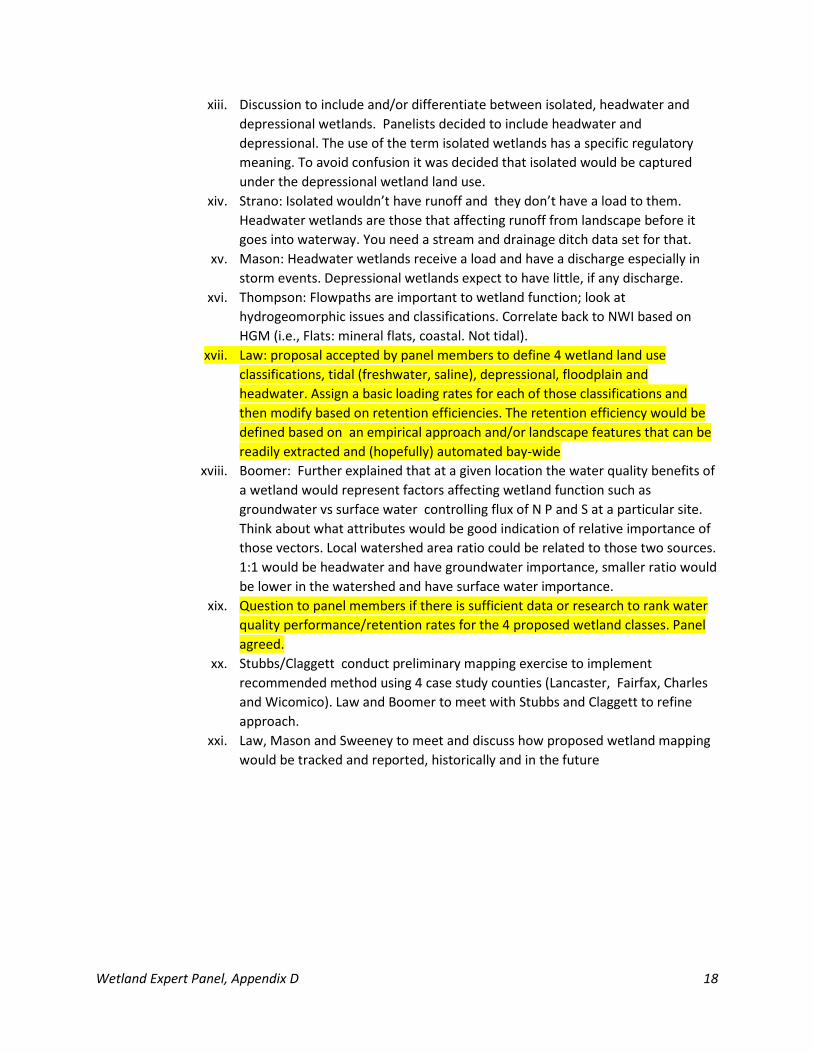
xiii. Discussion to include and/or differentiate between isolated, headwater and
depressional wetlands. Panelists decided to include headwater and
depressional. The use of the term isolated wetlands has a specific regulatory
meaning. To avoid confusion it was decided that isolated would be captured
under the depressional wetland land use.
xiv. Strano: Isolated wouldn’t have runoff and they don’t have a load to them.
Headwater wetlands are those that affecting runoff from landscape before it
goes into waterway. You need a stream and drainage ditch data set for that.
xv. Mason: Headwater wetlands receive a load and have a discharge especially in
storm events. Depressional wetlands expect to have little, if any discharge.
xvi. Thompson: Flowpaths are important to wetland function; look at
hydrogeomorphic issues and classifications. Correlate back to NWI based on
HGM (i.e., Flats: mineral flats, coastal. Not tidal).
xvii. Law: proposal accepted by panel members to define 4 wetland land use
classifications, tidal (freshwater, saline), depressional, floodplain and
headwater. Assign a basic loading rates for each of those classifications and
then modify based on retention efficiencies. The retention efficiency would be
defined based on an empirical approach and/or landscape features that can be
readily extracted and (hopefully) automated bay-wide
xviii. Boomer: Further explained that at a given location the water quality benefits of
a wetland would represent factors affecting wetland function such as
groundwater vs surface water controlling flux of N P and S at a particular site.
Think about what attributes would be good indication of relative importance of
those vectors. Local watershed area ratio could be related to those two sources.
1:1 would be headwater and have groundwater importance, smaller ratio would
be lower in the watershed and have surface water importance.
xix. Question to panel members if there is sufficient data or research to rank water
quality performance/retention rates for the 4 proposed wetland classes. Panel
agreed.
xx. Stubbs/Claggett conduct preliminary mapping exercise to implement
recommended method using 4 case study counties (Lancaster, Fairfax, Charles
and Wicomico). Law and Boomer to meet with Stubbs and Claggett to refine
approach.
xxi. Law, Mason and Sweeney to meet and discuss how proposed wetland mapping
would be tracked and reported, historically and in the future
Wetland Expert Panel, Appendix D 19
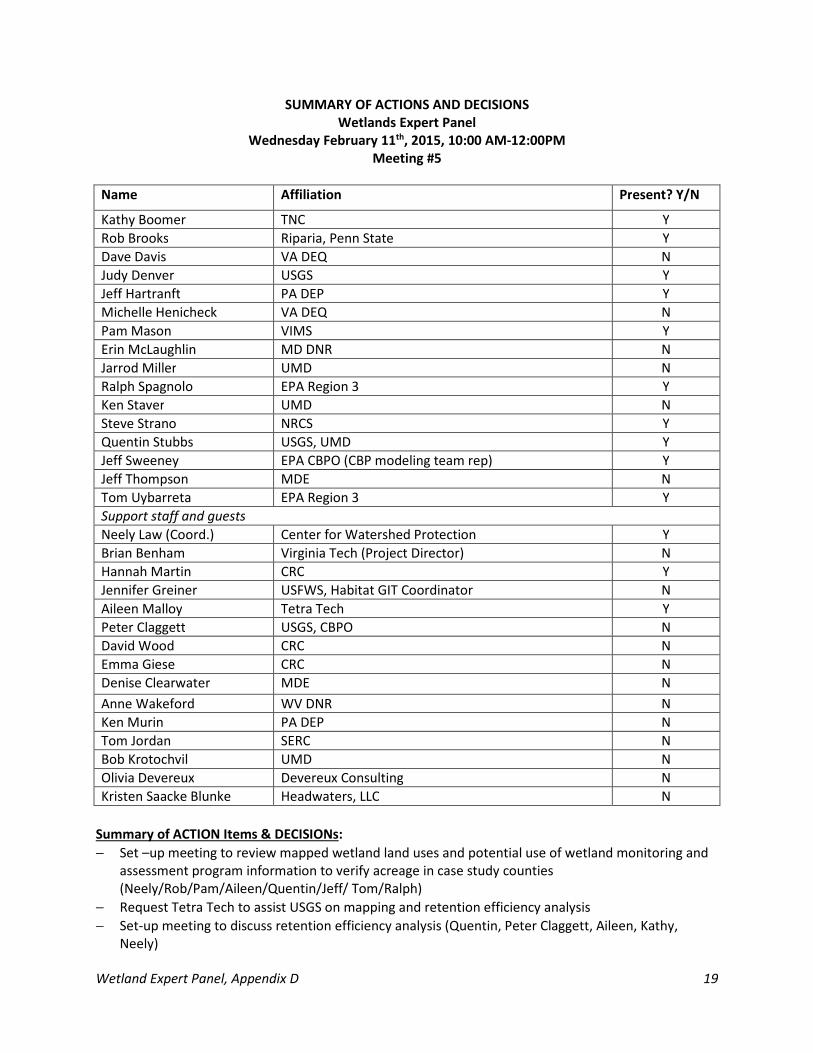
SUMMARY OF ACTIONS AND DECISIONS
Wetlands Expert Panel
Wednesday February 11th, 2015, 10:00 AM-12:00PM
Meeting #5
Name Affiliation Present? Y/N
Kathy Boomer TNC Y
Rob Brooks Riparia, Penn State Y
Dave Davis VA DEQ N
Judy Denver USGS Y
Jeff Hartranft PA DEP Y
Michelle Henicheck VA DEQ N
Pam Mason VIMS Y
Erin McLaughlin MD DNR N
Jarrod Miller UMD N
Ralph Spagnolo EPA Region 3 Y
Ken Staver UMD N
Steve Strano NRCS Y
Quentin Stubbs USGS, UMD Y
Jeff Sweeney EPA CBPO (CBP modeling team rep) Y
Jeff Thompson MDE N
Tom Uybarreta EPA Region 3 Y
Support staff and guests
Neely Law (Coord.) Center for Watershed Protection Y
Brian Benham Virginia Tech (Project Director) N
Hannah Martin CRC Y
Jennifer Greiner USFWS, Habitat GIT Coordinator N
Aileen Malloy Tetra Tech Y
Peter Claggett USGS, CBPO N
David Wood CRC N
Emma Giese CRC N
Denise Clearwater MDE N
Anne Wakeford WV DNR N
Ken Murin PA DEP N
Tom Jordan SERC N
Bob Krotochvil UMD N
Olivia Devereux Devereux Consulting N
Kristen Saacke Blunke Headwaters, LLC N
Summary of ACTION Items & DECISIONs:
− Set –up meeting to review mapped wetland land uses and potential use of wetland monitoring and
assessment program information to verify acreage in case study counties
(Neely/Rob/Pam/Aileen/Quentin/Jeff/ Tom/Ralph)
− Request Tetra Tech to assist USGS on mapping and retention efficiency analysis
− Set-up meeting to discuss retention efficiency analysis (Quentin, Peter Claggett, Aileen, Kathy,
Neely)
Wetland Expert Panel, Appendix D 20
− Ralph Spagnolo forward EPA study on wetland nutrient and sediments
− Tom U offered to contact states for updates on wetland mapping – check with Peter and Quentin re
information received from states on land use land cover as part of Phase 6
− Meeting minutes #3 and #4 approved.
Mapping Wetland Land use & Discussion (Quentin Stubbs, USGS )
− Quentin presented methods and results of preliminary mapping of wetlands land uses using 4 County
case studies and multiple data sources.
− The Panel asked to provide feedback on the wetland mapping and recommendations to accept and, or
modify the methods.
1) Does the preliminary distribution of wetlands appear reasonable?
2) What additional information may be used to further identify and map depressional wetlands?
− 4 wetland classes extracted from NWI database and supplement data to define wetland type to include:
tidal (fresh and saline, floodplain, headwater and depressional
− 4 Counties used to implement proposed method to identify and map wetland land uses: Charles County,
MD, Wicomico County, MD, Lancaster County PA and Fairfax County, VA
− Methods and results are summarized in the presentation (attachment provided).
− A hierarchical method used to label wetland land use classes
( tidal >floodplain>headwater>depressional)
− Findings
− Experimented with data sources to differentiate amongst wetland classes (spatial resolution of data
sources such as geology vs SSURGO, 10 m DEM vs NHD)
− Tidal and floodplain wetlands generally readily identified
− Results of mapping identified challenge to identify depressional wetlands, data to identify floodplain
wetlands may under-represent this class; spatial resolution of data and connectivity of stream
channels affects identification of headwater vs depressional (NHD, 10m). Other mapping efforts by
Bay Program support use of 10m DEM; NHD layer won’t pick up a lot of the streams, specifically the
Eastern Shore
− Coastal area missing mineral flats
− Found wetland distribution in Lancaster County “spotty”. This may not be a result of the data
sources, rather a result of geology and limestone sinkholes resulting in a lack of surficial hydrologic
connectivity
− J. Hartranft noted that in PA the impact of legacy sediment disconnects wetlands from streams
− K. Boomer notes geomorphology identifiers in SSURGO dataset along with NWI floodplain provide a
reasonable approximation for wetlands in these areas (K. Boomer)
− Model representation. What time period does this wetland land use represent?
CBWM Land Use Data
− Land use change in time 1985 – 2025 for other land uses
− Some NWI data represents a 2nd point of wetland coverage but NWI layer completed in mid 1980s so
would be represented as a baseline condition
− Additional data source from MDE can provide an inventory of restored wetlands
Wetland Expert Panel, Appendix D 21
o Need to think about accuracy with level of effort given what is lost and gained given
relative percentage of land use. E.g. wetland resotraiton small percentage of total land
area in County
o Voluntary restoration no location data
o Look into Status and Trends reports
− Tom U contact states for updates
− State wetland mapping efforts, PA DEP e-fact mine for permitting actions, state data not updated
recently e.g .MD 1990s
Wetland Verification
− What is the ability to ground truth wetlands mapped vs existing (Jeff) Quentin replied there is
limited capacity to do so – could ask localities
− Pam suggested verification of wetland acreage mapped by model could be cross-referenced with
monitoring and assessment programs, PA DEP Jeff focus on streams, very small number of wetlands
− Rob Brooks: 50% of wetlands not detected (clarify was assessment was updated)
− Rob/Pam/Aileen/Quentin/Jeff – Tom/Raph: follow-up call for verifying wetlands (review
verification guidance)
− Rob classification MidAtlantic HGM classification: headwater complex. Kathy and Steve agree
− Steve wetlands not truly isolated act or function as headwater
− *Quentin thesis: Delmarva peninsula on net gain 1%, correlation with permitting agencies
Retention Efficiencies
− Jeff S. reminded expert panel that efficiencies would be relative rates to forest land use loading
− Kathy B stated that we are more concerned with variation in retention
− Judy and Pam stated this would make best use of available data reported on welands
− *EPA study N, P and Sediment, Ralph will forward
Wetland Expert Panel, Appendix D 22
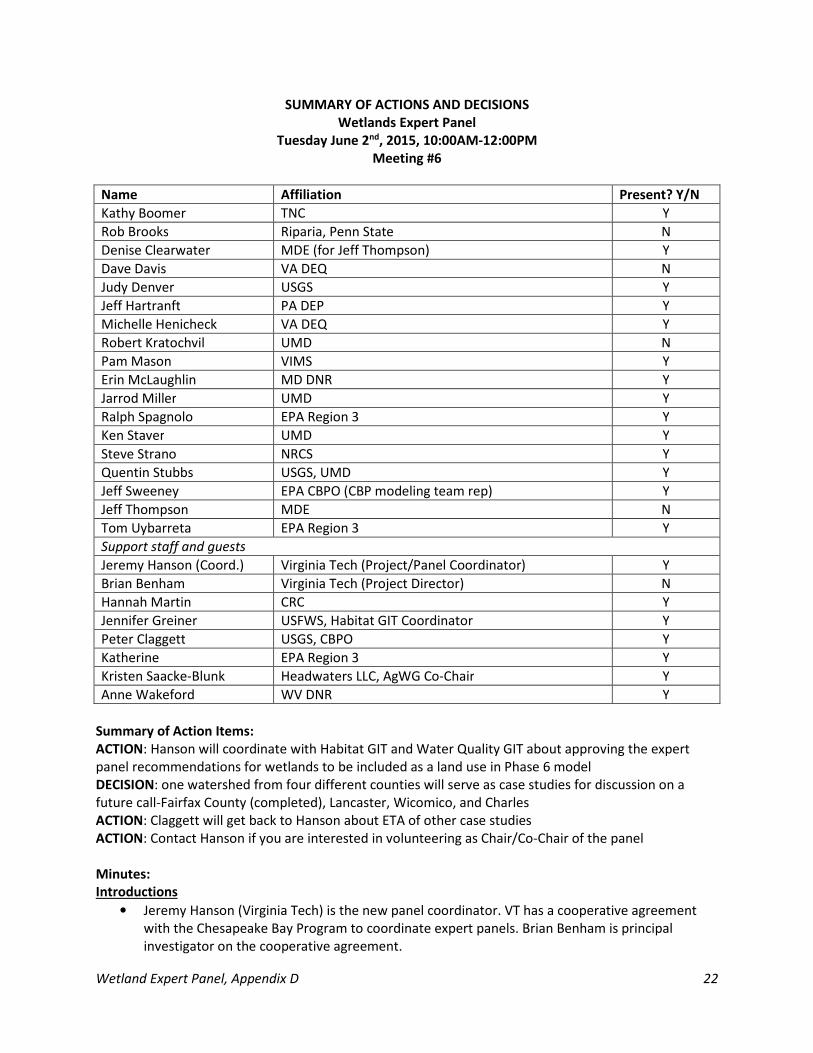
SUMMARY OF ACTIONS AND DECISIONS
Wetlands Expert Panel
Tuesday June 2nd, 2015, 10:00AM-12:00PM
Meeting #6
Name Affiliation Present? Y/N
Kathy Boomer TNC Y
Rob Brooks Riparia, Penn State N
Denise Clearwater MDE (for Jeff Thompson) Y
Dave Davis VA DEQ N
Judy Denver USGS Y
Jeff Hartranft PA DEP Y
Michelle Henicheck VA DEQ Y
Robert Kratochvil UMD N
Pam Mason VIMS Y
Erin McLaughlin MD DNR Y
Jarrod Miller UMD Y
Ralph Spagnolo EPA Region 3 Y
Ken Staver UMD Y
Steve Strano NRCS Y
Quentin Stubbs USGS, UMD Y
Jeff Sweeney EPA CBPO (CBP modeling team rep) Y
Jeff Thompson MDE N
Tom Uybarreta EPA Region 3 Y
Support staff and guests
Jeremy Hanson (Coord.) Virginia Tech (Project/Panel Coordinator) Y
Brian Benham Virginia Tech (Project Director) N
Hannah Martin CRC Y
Jennifer Greiner USFWS, Habitat GIT Coordinator Y
Peter Claggett USGS, CBPO Y
Katherine EPA Region 3 Y
Kristen Saacke-Blunk Headwaters LLC, AgWG Co-Chair Y
Anne Wakeford WV DNR Y
Summary of Action Items:
ACTION: Hanson will coordinate with Habitat GIT and Water Quality GIT about approving the expert
panel recommendations for wetlands to be included as a land use in Phase 6 model
DECISION: one watershed from four different counties will serve as case studies for discussion on a
future call-Fairfax County (completed), Lancaster, Wicomico, and Charles
ACTION: Claggett will get back to Hanson about ETA of other case studies
ACTION: Contact Hanson if you are interested in volunteering as Chair/Co-Chair of the panel
Minutes:
Introductions
• Jeremy Hanson (Virginia Tech) is the new panel coordinator. VT has a cooperative agreement
with the Chesapeake Bay Program to coordinate expert panels. Brian Benham is principal
investigator on the cooperative agreement.
Wetland Expert Panel, Appendix D 23
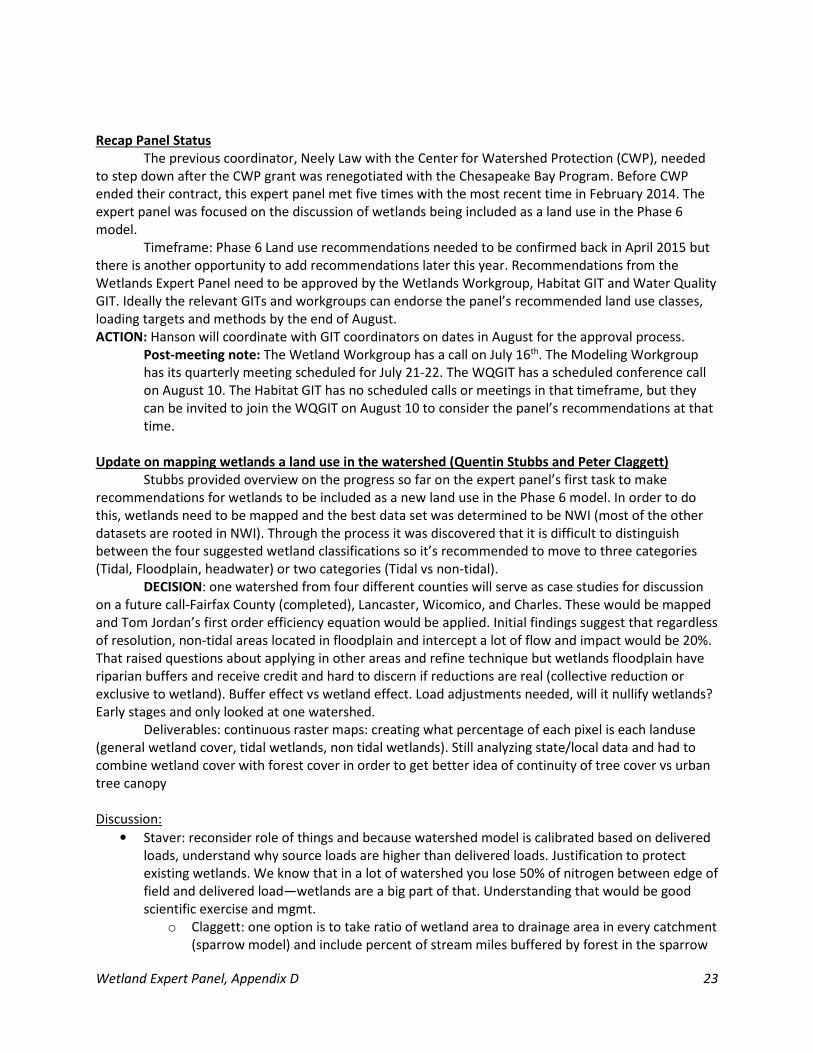
Recap Panel Status
The previous coordinator, Neely Law with the Center for Watershed Protection (CWP), needed
to step down after the CWP grant was renegotiated with the Chesapeake Bay Program. Before CWP
ended their contract, this expert panel met five times with the most recent time in February 2014. The
expert panel was focused on the discussion of wetlands being included as a land use in the Phase 6
model.
Timeframe: Phase 6 Land use recommendations needed to be confirmed back in April 2015 but
there is another opportunity to add recommendations later this year. Recommendations from the
Wetlands Expert Panel need to be approved by the Wetlands Workgroup, Habitat GIT and Water Quality
GIT. Ideally the relevant GITs and workgroups can endorse the panel’s recommended land use classes,
loading targets and methods by the end of August.
ACTION: Hanson will coordinate with GIT coordinators on dates in August for the approval process.
Post-meeting note: The Wetland Workgroup has a call on July 16th. The Modeling Workgroup
has its quarterly meeting scheduled for July 21-22. The WQGIT has a scheduled conference call
on August 10. The Habitat GIT has no scheduled calls or meetings in that timeframe, but they
can be invited to join the WQGIT on August 10 to consider the panel’s recommendations at that
time.
Update on mapping wetlands a land use in the watershed (Quentin Stubbs and Peter Claggett)
Stubbs provided overview on the progress so far on the expert panel’s first task to make
recommendations for wetlands to be included as a new land use in the Phase 6 model. In order to do
this, wetlands need to be mapped and the best data set was determined to be NWI (most of the other
datasets are rooted in NWI). Through the process it was discovered that it is difficult to distinguish
between the four suggested wetland classifications so it’s recommended to move to three categories
(Tidal, Floodplain, headwater) or two categories (Tidal vs non-tidal).
DECISION: one watershed from four different counties will serve as case studies for discussion
on a future call-Fairfax County (completed), Lancaster, Wicomico, and Charles. These would be mapped
and Tom Jordan’s first order efficiency equation would be applied. Initial findings suggest that regardless
of resolution, non-tidal areas located in floodplain and intercept a lot of flow and impact would be 20%.
That raised questions about applying in other areas and refine technique but wetlands floodplain have
riparian buffers and receive credit and hard to discern if reductions are real (collective reduction or
exclusive to wetland). Buffer effect vs wetland effect. Load adjustments needed, will it nullify wetlands?
Early stages and only looked at one watershed.
Deliverables: continuous raster maps: creating what percentage of each pixel is each landuse
(general wetland cover, tidal wetlands, non tidal wetlands). Still analyzing state/local data and had to
combine wetland cover with forest cover in order to get better idea of continuity of tree cover vs urban
tree canopy
Discussion:
• Staver: reconsider role of things and because watershed model is calibrated based on delivered
loads, understand why source loads are higher than delivered loads. Justification to protect
existing wetlands. We know that in a lot of watershed you lose 50% of nitrogen between edge of
field and delivered load—wetlands are a big part of that. Understanding that would be good
scientific exercise and mgmt.
o Claggett: one option is to take ratio of wetland area to drainage area in every catchment
(sparrow model) and include percent of stream miles buffered by forest in the sparrow
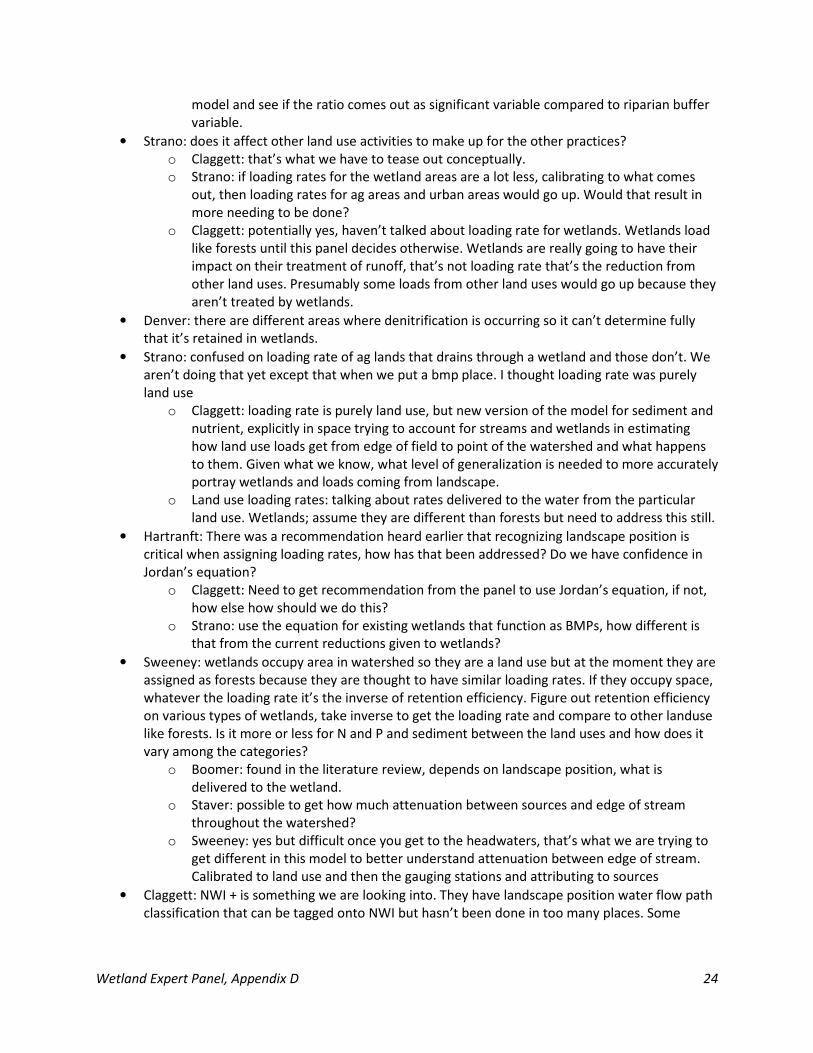
Wetland Expert Panel, Appendix D 24
model and see if the ratio comes out as significant variable compared to riparian buffer
variable.
• Strano: does it affect other land use activities to make up for the other practices?
o Claggett: that’s what we have to tease out conceptually.
o Strano: if loading rates for the wetland areas are a lot less, calibrating to what comes
out, then loading rates for ag areas and urban areas would go up. Would that result in
more needing to be done?
o Claggett: potentially yes, haven’t talked about loading rate for wetlands. Wetlands load
like forests until this panel decides otherwise. Wetlands are really going to have their
impact on their treatment of runoff, that’s not loading rate that’s the reduction from
other land uses. Presumably some loads from other land uses would go up because they
aren’t treated by wetlands.
• Denver: there are different areas where denitrification is occurring so it can’t determine fully
that it’s retained in wetlands.
• Strano: confused on loading rate of ag lands that drains through a wetland and those don’t. We
aren’t doing that yet except that when we put a bmp place. I thought loading rate was purely
land use
o Claggett: loading rate is purely land use, but new version of the model for sediment and
nutrient, explicitly in space trying to account for streams and wetlands in estimating
how land use loads get from edge of field to point of the watershed and what happens
to them. Given what we know, what level of generalization is needed to more accurately
portray wetlands and loads coming from landscape.
o Land use loading rates: talking about rates delivered to the water from the particular
land use. Wetlands; assume they are different than forests but need to address this still.
• Hartranft: There was a recommendation heard earlier that recognizing landscape position is
critical when assigning loading rates, how has that been addressed? Do we have confidence in
Jordan’s equation?
o Claggett: Need to get recommendation from the panel to use Jordan’s equation, if not,
how else how should we do this?
o Strano: use the equation for existing wetlands that function as BMPs, how different is
that from the current reductions given to wetlands?
• Sweeney: wetlands occupy area in watershed so they are a land use but at the moment they are
assigned as forests because they are thought to have similar loading rates. If they occupy space,
whatever the loading rate it’s the inverse of retention efficiency. Figure out retention efficiency
on various types of wetlands, take inverse to get the loading rate and compare to other landuse
like forests. Is it more or less for N and P and sediment between the land uses and how does it
vary among the categories?
o Boomer: found in the literature review, depends on landscape position, what is
delivered to the wetland.
o Staver: possible to get how much attenuation between sources and edge of stream
throughout the watershed?
o Sweeney: yes but difficult once you get to the headwaters, that’s what we are trying to
get different in this model to better understand attenuation between edge of stream.
Calibrated to land use and then the gauging stations and attributing to sources
• Claggett: NWI + is something we are looking into. They have landscape position water flow path
classification that can be tagged onto NWI but hasn’t been done in too many places. Some
Wetland Expert Panel, Appendix D 25
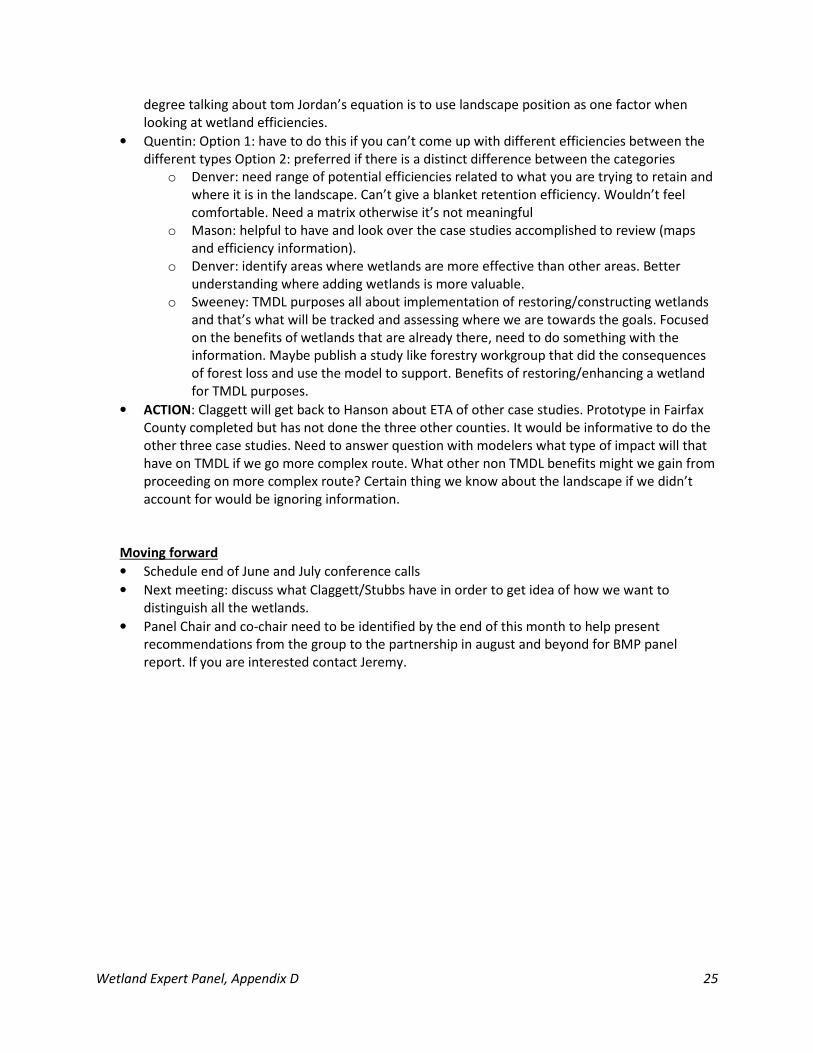
degree talking about tom Jordan’s equation is to use landscape position as one factor when
looking at wetland efficiencies.
• Quentin: Option 1: have to do this if you can’t come up with different efficiencies between the
different types Option 2: preferred if there is a distinct difference between the categories
o Denver: need range of potential efficiencies related to what you are trying to retain and
where it is in the landscape. Can’t give a blanket retention efficiency. Wouldn’t feel
comfortable. Need a matrix otherwise it’s not meaningful
o Mason: helpful to have and look over the case studies accomplished to review (maps
and efficiency information).
o Denver: identify areas where wetlands are more effective than other areas. Better
understanding where adding wetlands is more valuable.
o Sweeney: TMDL purposes all about implementation of restoring/constructing wetlands
and that’s what will be tracked and assessing where we are towards the goals. Focused
on the benefits of wetlands that are already there, need to do something with the
information. Maybe publish a study like forestry workgroup that did the consequences
of forest loss and use the model to support. Benefits of restoring/enhancing a wetland
for TMDL purposes.
• ACTION: Claggett will get back to Hanson about ETA of other case studies. Prototype in Fairfax
County completed but has not done the three other counties. It would be informative to do the
other three case studies. Need to answer question with modelers what type of impact will that
have on TMDL if we go more complex route. What other non TMDL benefits might we gain from
proceeding on more complex route? Certain thing we know about the landscape if we didn’t
account for would be ignoring information.
Moving forward
• Schedule end of June and July conference calls
• Next meeting: discuss what Claggett/Stubbs have in order to get idea of how we want to
distinguish all the wetlands.
• Panel Chair and co-chair need to be identified by the end of this month to help present
recommendations from the group to the partnership in august and beyond for BMP panel
report. If you are interested contact Jeremy.
Wetland Expert Panel, Appendix D 26
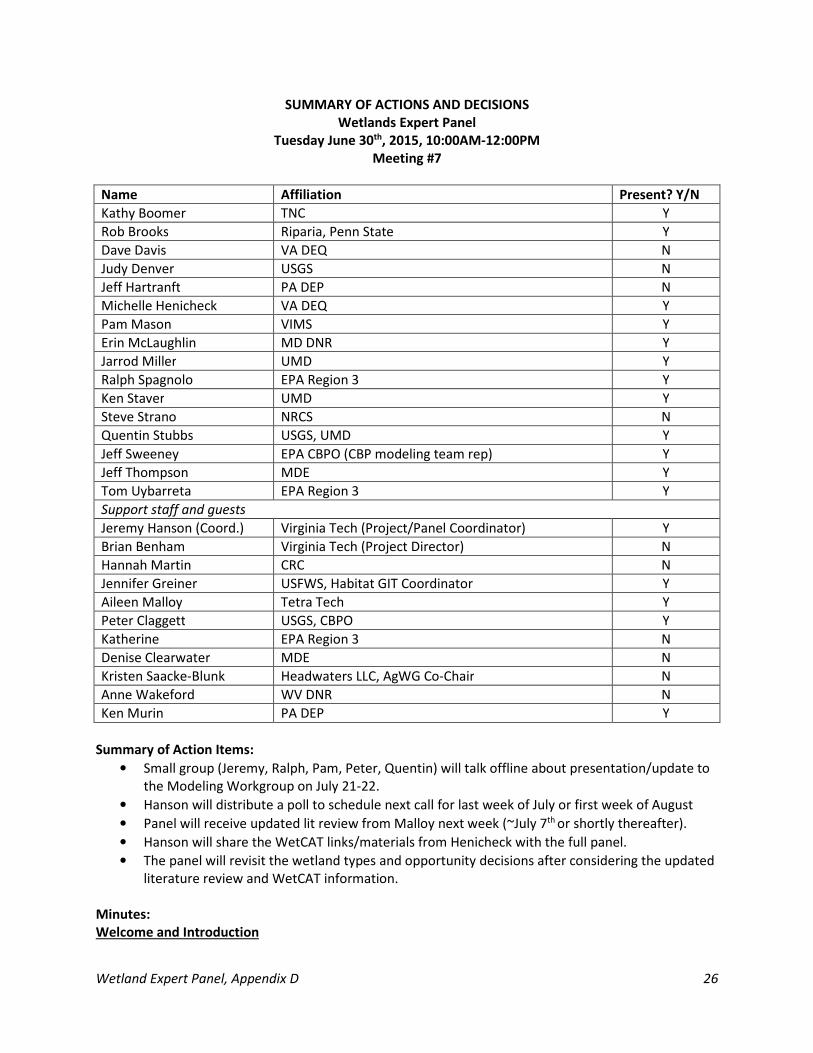
SUMMARY OF ACTIONS AND DECISIONS
Wetlands Expert Panel
Tuesday June 30th, 2015, 10:00AM-12:00PM
Meeting #7
Name Affiliation Present? Y/N
Kathy Boomer TNC Y
Rob Brooks Riparia, Penn State Y
Dave Davis VA DEQ N
Judy Denver USGS N
Jeff Hartranft PA DEP N
Michelle Henicheck VA DEQ Y
Pam Mason VIMS Y
Erin McLaughlin MD DNR Y
Jarrod Miller UMD Y
Ralph Spagnolo EPA Region 3 Y
Ken Staver UMD Y
Steve Strano NRCS N
Quentin Stubbs USGS, UMD Y
Jeff Sweeney EPA CBPO (CBP modeling team rep) Y
Jeff Thompson MDE Y
Tom Uybarreta EPA Region 3 Y
Support staff and guests
Jeremy Hanson (Coord.) Virginia Tech (Project/Panel Coordinator) Y
Brian Benham Virginia Tech (Project Director) N
Hannah Martin CRC N
Jennifer Greiner USFWS, Habitat GIT Coordinator Y
Aileen Malloy Tetra Tech Y
Peter Claggett USGS, CBPO Y
Katherine EPA Region 3 N
Denise Clearwater MDE N
Kristen Saacke-Blunk Headwaters LLC, AgWG Co-Chair N
Anne Wakeford WV DNR N
Ken Murin PA DEP Y
Summary of Action Items:
• Small group (Jeremy, Ralph, Pam, Peter, Quentin) will talk offline about presentation/update to
the Modeling Workgroup on July 21-22.
• Hanson will distribute a poll to schedule next call for last week of July or first week of August
• Panel will receive updated lit review from Malloy next week (~July 7th or shortly thereafter).
• Hanson will share the WetCAT links/materials from Henicheck with the full panel.
• The panel will revisit the wetland types and opportunity decisions after considering the updated
literature review and WetCAT information.
Minutes:
Welcome and Introduction
Wetland Expert Panel, Appendix D 27
• Jeremy asked for any final corrections or edits to the June 2nd minutes. None were raised; the
minutes were approved.
• DECISION: The June 2nd call minutes were accepted as written.
Review and discussion of retention case study results
Stubbs reviewed the objectives, methods and results of the pilot study. Charles, Wicomico, Lancaster,
plus they included two additional areas Steuben (NY) and Cumberland (PA). He asked the group to
consider if there are any variables missing, if the reductions are too high, or any other comments.
Brooks asked for clarification about the relationship between the summary table and the graphs.
Proportionally, the coastal plain areas have higher percentage of wetlands, so that appears to be main
reason for the higher reductions compared to the Piedmont or Appalachian areas. Later this summer the
GIS and modeling team has plans to use work from Weller and others to more explicitly incorporate
forest buffers into the modeling tools. A lot of the wetlands are floodplain wetlands, and those NWI
polygons include the open water of the stream. We essentially nulled those out. It was noted that
Wicomico may also be tidal and would likely need to include the open water treatment for tidal-fresh
and tidal-saline. Peter pointed out that Jordan’s equation doesn’t include direct interaction with the
water column. Judy was unable to join the call, but Quentin explained some of her concerns with the
methods regarding relationships to groundwater and surrounding land covers. For the land uses we
want to know if the removal efficiencies are dramatically different across the types. Then determine
how to adjust the rates based on the known differences using NWI, etc.
• Brooks pointed out that the range of removal efficiencies for wetlands is extremely large in the
literature, ranging from significant sinks to sources. Looking at the literature most wetlands do
act as sinks but we can see cases where they act as sources. We can probably learn more about
what factors make a wetland a source vs. a sink.
• Sweeney noted there are options for how the panel can address large flow events, but all panels
should account for it somehow. The easiest way to account for it, is to assume that at least one
or two large events will occur over a certain number of years (e.g., 10) and adjust the reduction
accordingly.
• Mason mentioned that the group may need to crosswalk with some of the tidal wetland
considerations from the shoreline management panel’s recommendations. She recapped that
the first question to resolve is whether the group wants to revisit changing the number of
types? We had four, were down to three, and now five were under discussion. She noted Stubbs
and Claggett need that answered first before they can update their analysis. Then there is the
issue of opportunity for the wetlands to treat the surrounding areas or land uses. Looking at
percentage of total acres treated, how much weight do we apply to factors like that? Will need
to answer that eventually.
• Claggett: we have land cover data for the entire watershed. Based on the ratios, Jordan’s
equation and the land covers we can make the necessary adjustments. The type question is
more difficult.
o It was suggested to wait until after the literature review is updated to define or
distinguish the types.
o Henicheck mentioned WetCAT, which scores wetlands based on habitat or other
stressor factors. WetCAT is GIS analytical tool from VIMS and VA DEQ that was
developed for permit programs, but also for monitoring and assessment. Fairly
comprehensive tool that incorporates water quality, habitat, land use and other
variables. So it is another tool that could potentially be used to help guide our approach
Wetland Expert Panel, Appendix D 28
to classifying wetlands or extrapolating their retention or effectiveness. Henicheck will
send link and documents to Hanson.
o Claggett: Eastern Shore will likely be most challenging area, so perhaps they could test
out applying the kinetic equation to the entire Shore and get a better sense of how to
adjust or apply the equation/methods.
o There was general agreement from the group that over the next few weeks everyone
can look at WetCAT and the literature review to help modify how, and justify why, we
distinguish the 3-4 classes/types.
Literature review update and status
Malloy cautioned that while the spreadsheet has quite a few entries, there is a smaller subset of studies
that have relevant loading data broken down by wetland type or other factors of interest. The group
agreed that she continue to not exclude data or information if it is only nitrate. The model and panel can
still use nitrate as a part of TN. The same goes for other species of N (or P, where available), such as
dissolved, ammonia, etc. Malloy noted she has added a few sources and need to rerun some of the
numbers. Will try to more fully explain and include a discussion of factors that affect nutrient removal,
such as retention time, etc. in the narrative. May not be able to do quantitative analysis due to limited
results, but can at least describe them qualitatively. She mentioned that she will continue to come
across studies looking at constructed wetlands for stormwater and she asked how the group felt she
should handle those studies. It was agreed that while they are not an explicit part of this group’s charge,
they can still be included overall, but separated from the natural wetland studies. They may provide
some insight when compared to the natural wetland studies, though the group will need to be wary of
the methods and how to properly compare and contrast their results.
Confirmation of Panel Co-Chairs
DECISION: Pam Mason and Ralph Spagnolo were confirmed as Co-Chairs for the panel.
Moving forward
Hanson outlined some next steps for the group. See summary of action items above.
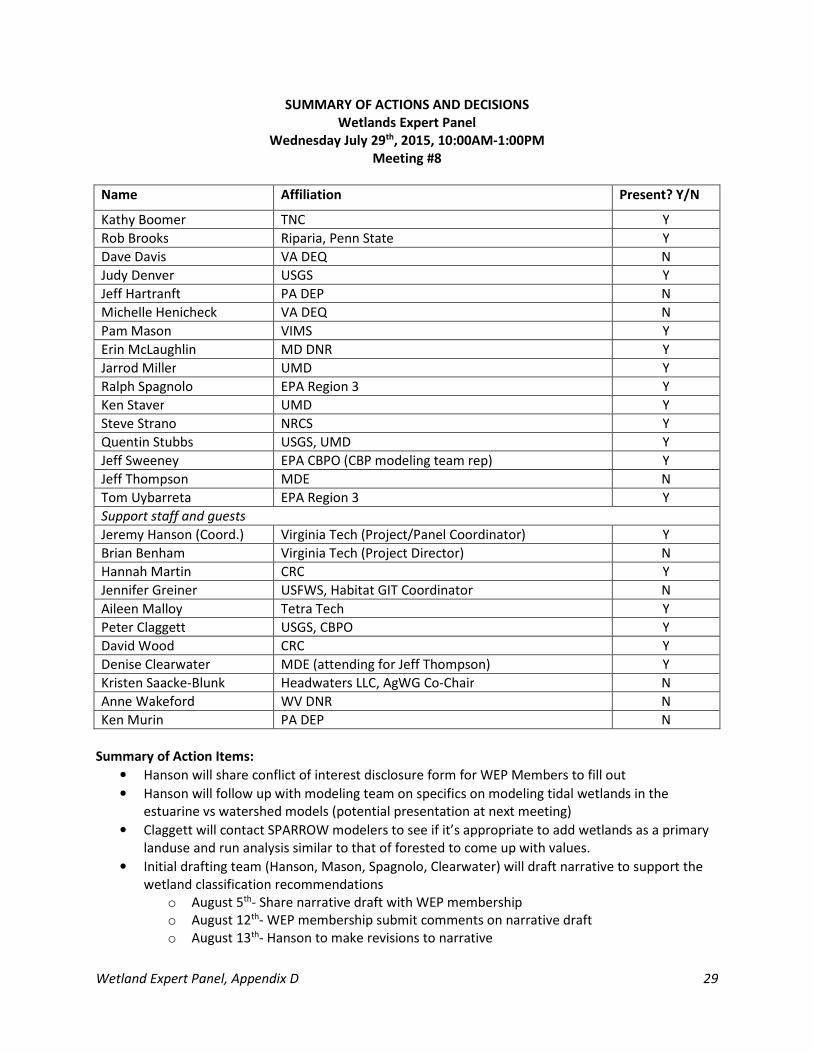
Wetland Expert Panel, Appendix D 29
SUMMARY OF ACTIONS AND DECISIONS
Wetlands Expert Panel
Wednesday July 29th, 2015, 10:00AM-1:00PM
Meeting #8
Name Affiliation Present? Y/N
Kathy Boomer TNC Y
Rob Brooks Riparia, Penn State Y
Dave Davis VA DEQ N
Judy Denver USGS Y
Jeff Hartranft PA DEP N
Michelle Henicheck VA DEQ N
Pam Mason VIMS Y
Erin McLaughlin MD DNR Y
Jarrod Miller UMD Y
Ralph Spagnolo EPA Region 3 Y
Ken Staver UMD Y
Steve Strano NRCS Y
Quentin Stubbs USGS, UMD Y
Jeff Sweeney EPA CBPO (CBP modeling team rep) Y
Jeff Thompson MDE N
Tom Uybarreta EPA Region 3 Y
Support staff and guests
Jeremy Hanson (Coord.) Virginia Tech (Project/Panel Coordinator) Y
Brian Benham Virginia Tech (Project Director) N
Hannah Martin CRC Y
Jennifer Greiner USFWS, Habitat GIT Coordinator N
Aileen Malloy Tetra Tech Y
Peter Claggett USGS, CBPO Y
David Wood CRC Y
Denise Clearwater MDE (attending for Jeff Thompson) Y
Kristen Saacke-Blunk Headwaters LLC, AgWG Co-Chair N
Anne Wakeford WV DNR N
Ken Murin PA DEP N
Summary of Action Items:
• Hanson will share conflict of interest disclosure form for WEP Members to fill out
• Hanson will follow up with modeling team on specifics on modeling tidal wetlands in the
estuarine vs watershed models (potential presentation at next meeting)
• Claggett will contact SPARROW modelers to see if it’s appropriate to add wetlands as a primary
landuse and run analysis similar to that of forested to come up with values.
• Initial drafting team (Hanson, Mason, Spagnolo, Clearwater) will draft narrative to support the
wetland classification recommendations
o August 5th- Share narrative draft with WEP membership
o August 12th- WEP membership submit comments on narrative draft
o August 13th- Hanson to make revisions to narrative
Wetland Expert Panel, Appendix D 30
o August 14th- Submit wetland classification recommendations and narrative to Water
Quality GIT for review
o August 24th-Water Quality GIT meeting to discuss/approve panel recommendations.
• Hanson will send doodle for a next WEP call in late August
Minutes:
Welcome and Introduction
• Hanson asked for any final corrections or edits to the June 30th minutes. None were raised; the
minutes were approved.
o DECISION: The June 30th call minutes were accepted as written.
• Updates made to the BMP Expert Panel Protocol—changes affect the process for writing the
final report and comment review period.
• Panel members must now fill out the conflict of interest disclosure form. ACTION: Hanson will
share the form with panel members
• Mason presented to the modeling workgroup; slides were provided to WEP members
Discussion of wetland loading rate(s)
NONTIDAL-Use SPARROW to confirm Jordan equation. The WEP decided to take all nontidal wetlands in
watershed and apply the Jordan 1st order kinetic equation to the entire watershed and then take
efficiencies and average within NHD+ catchments. USGS SPARROW model—takes multiple variables (like
forest riparian buffers) and overlays wetland efficiencies and SPARROW will determine at regional scale
if the efficiencies calculated with Jordan equation explain N, P and sediment efficiencies are
comparable. If coefficient is 1 then it works, if it’s 2 then the efficiencies should be twice as much as the
equation. If 0 then wetlands don’t have an effect that can be explained with the Jordan equation. Ideal
would be coefficient of 1 which gives us confirmation/confidence that Jordan’s equation is ideal
method.
• Denver: important to understand; I like running kinetic equation but would prefer it to be done
for the entire area that will give us information about where that equation represents. Riparian
wetlands are the last place water goes before it enters stream. Need to determine where the
equation comes close to 1 and then look at those areas and how it’s related to hydrogeology to
determine if wetlands are a contributing factor to that area. Also, get results of that analysis and
compare directly to places that we know what’s going on in order to learn a lot about what’s
important for attenuation. Don’t screen so we can look at areas that don’t work and determine
why. Explain importance of attenuation and factors in certain areas.
TIDAL—both fresh and saline then it would be taken out of watershed model and no longer be a landuse
because accounting for their loads and functions would be moved to the water quality model (Estuarine
Model). Issue is that the estuarine model does not handle crediting BMPs—unclear how tidal wetland
restoration/enhancement would be credited.
ACTION: Hanson will follow up with modeling team to get more information on the best approach to
modeling tidal wetlands. Is it possible to build a module similar to the SAV in estuarine model with load
reductions? How can we best realistically account for tidal wetlands as a natural resource as well as tidal
wetlands that are a restored/created resource—do these belong in the same model?
Initial call with Modeling team will include Hanson, Claggett, Spagnolo, Mason, and Boomer.
Potential presentation for August WEP meeting.
Wetland Expert Panel, Appendix D 31
Since Tidal wetlands are unclear and may be moved to the Estuarine model, this WEP meeting will focus
on deciding the recommendations for the non-tidal wetland classification categories and loading rates.
The panel members provided professional opinions that the loading rates are probably different than
those of forests, however the current literature review and science cannot support these opinions. For
example, nontidal wetlands should have higher rate for sediment than forest due to typical vegetated
patterns. Some members expressed dissatisfaction with the results of the literature review, and that
there are relevant studies which were not included. Some members offered to re-examine the
literature for more studies, which could be used to produce a defensible loading rate in the future.
Mason: The isolated depressional wetlands are chronically going to trap sediment, unless there’s a
discharge event like a major storm. How that varies from forest, that’s probably still a net trap of
sediment. From landscape position, they don’t have a load into the waterway which makes them a
perfect sink. Statistically knowing how much it represents on landscape, they aren’t the majority of the
wetlands. Least information about those systems (least amount of literature) because they are assumed
to be sinks. More groundwater relationship
Denver: tend to be sources of groundwater, add to groundwater. Not intercepting much. Sending clean
water to the streams, don’t add sediment or P.
Clearwater: The scrutiny given to wetlands as landuse should be no different than other land use. For
example, if one study was used to set loadings or efficiencies for forests, one study should also be
sufficient for wetlands. . Also curious if any of the forested studies were done on hydric soils and could
be pulled out for this purpose.
• The next SPARROW run will add all Phase 6 landuses with unique loading rates and therefore
SPARROW sets the primary loading rates. Can wetlands be added as a primary rate to get a
difference between wetlands and forests?
• ACTION: Claggett will contact SPARROW modelers to see if it’s appropriate to add wetlands as a
primary landuse and run analysis similar to that of forested to come up with values.
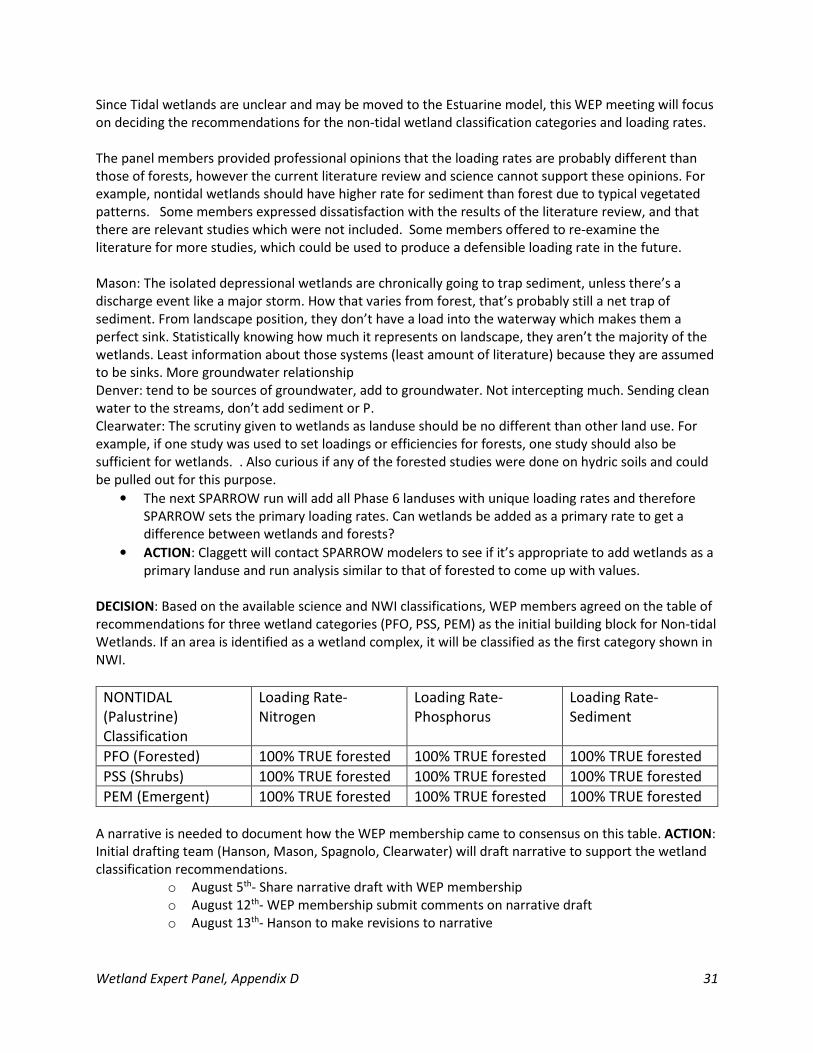
DECISION: Based on the available science and NWI classifications, WEP members agreed on the table of
recommendations for three wetland categories (PFO, PSS, PEM) as the initial building block for Non-tidal
Wetlands. If an area is identified as a wetland complex, it will be classified as the first category shown in
NWI.
NONTIDAL
(Palustrine)
Classification
Loading Rate-
Nitrogen
Loading Rate-
Phosphorus
Loading Rate-
Sediment
PFO (Forested) 100% TRUE forested 100% TRUE forested 100% TRUE forested
PSS (Shrubs) 100% TRUE forested 100% TRUE forested 100% TRUE forested
PEM (Emergent) 100% TRUE forested 100% TRUE forested 100% TRUE forested
A narrative is needed to document how the WEP membership came to consensus on this table. ACTION:
Initial drafting team (Hanson, Mason, Spagnolo, Clearwater) will draft narrative to support the wetland
classification recommendations.
o August 5th- Share narrative draft with WEP membership
o August 12th- WEP membership submit comments on narrative draft
o August 13th- Hanson to make revisions to narrative
Wetland Expert Panel, Appendix D 32
o August 14th- Submit wetland classification recommendations and narrative to Water
Quality GIT for review
o August 24th-Water Quality GIT meeting to discuss/approve panel recommendations.
Wrap-up and next steps
ACTION: Hanson will send doodle poll for Aug meeting.
Next Meeting: Someone from modeling team to clarify tidal wetlands in the next model.
Start moving into BMP questions.
Wetland Expert Panel, Appendix D 33
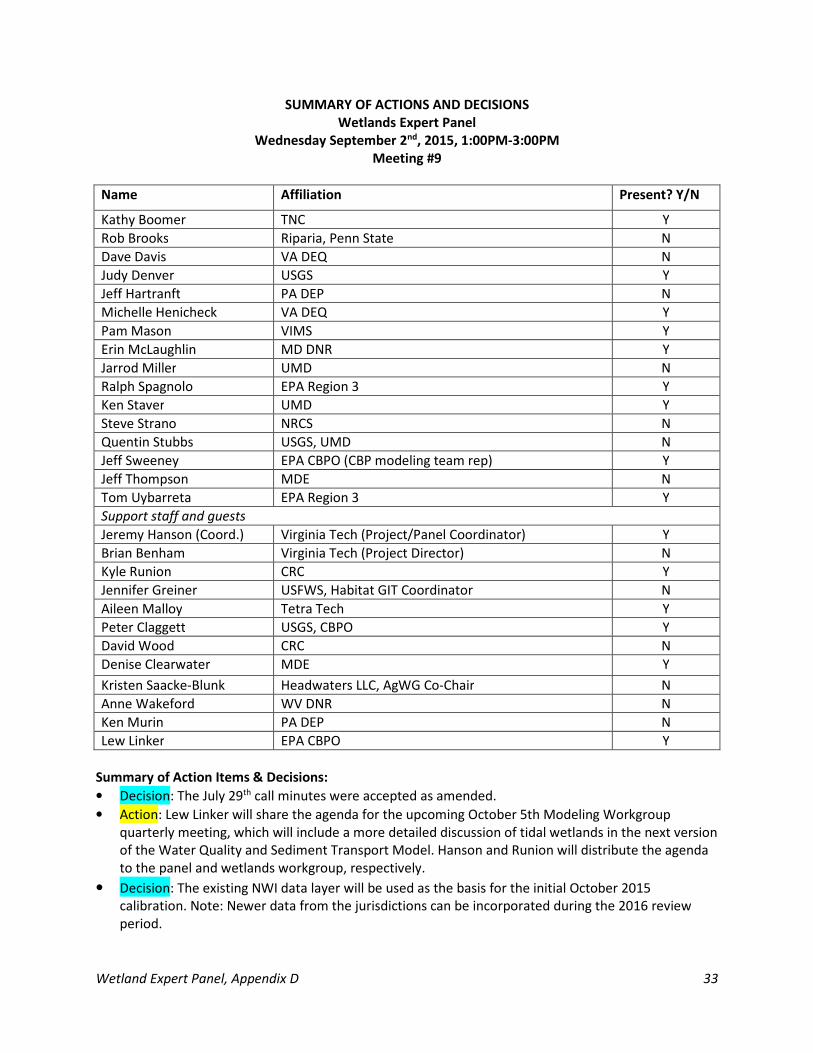
SUMMARY OF ACTIONS AND DECISIONS
Wetlands Expert Panel
Wednesday September 2nd, 2015, 1:00PM-3:00PM
Meeting #9
Name Affiliation Present? Y/N
Kathy Boomer TNC Y
Rob Brooks Riparia, Penn State N
Dave Davis VA DEQ N
Judy Denver USGS Y
Jeff Hartranft PA DEP N
Michelle Henicheck VA DEQ Y
Pam Mason VIMS Y
Erin McLaughlin MD DNR Y
Jarrod Miller UMD N
Ralph Spagnolo EPA Region 3 Y
Ken Staver UMD Y
Steve Strano NRCS N
Quentin Stubbs USGS, UMD N
Jeff Sweeney EPA CBPO (CBP modeling team rep) Y
Jeff Thompson MDE N
Tom Uybarreta EPA Region 3 Y
Support staff and guests
Jeremy Hanson (Coord.) Virginia Tech (Project/Panel Coordinator) Y
Brian Benham Virginia Tech (Project Director) N
Kyle Runion CRC Y
Jennifer Greiner USFWS, Habitat GIT Coordinator N
Aileen Malloy Tetra Tech Y
Peter Claggett USGS, CBPO Y
David Wood CRC N
Denise Clearwater MDE Y
Kristen Saacke-Blunk Headwaters LLC, AgWG Co-Chair N
Anne Wakeford WV DNR N
Ken Murin PA DEP N
Lew Linker EPA CBPO Y
Summary of Action Items & Decisions:
• Decision: The July 29th call minutes were accepted as amended.
• Action: Lew Linker will share the agenda for the upcoming October 5th Modeling Workgroup
quarterly meeting, which will include a more detailed discussion of tidal wetlands in the next version
of the Water Quality and Sediment Transport Model. Hanson and Runion will distribute the agenda
to the panel and wetlands workgroup, respectively.
• Decision: The existing NWI data layer will be used as the basis for the initial October 2015
calibration. Note: Newer data from the jurisdictions can be incorporated during the 2016 review
period.
Wetland Expert Panel, Appendix D 34
• Action: Claggett can be on the WQ GIT meeting to reassure group that changes can be made within
the model to include new data as it becomes available.
• Decision: NWI data for riverine, palustrine, and lacustrine wetlands will be used as the basis for the
wetland land uses in the initial Phase 6 model calibration (upon Water Quality GIT approval).
Riverine (vegetated) and lacustrine (vegetated) will be changed from open water to wetland when
there is overlap with acres of the existing open water land use. Acres of all three (palustrine, riverine
and lacustrine) will then be split into the Floodplain and Other classifications using a combination of
FEMA and SSURGO maps, as Peter and Quentin have already been doing. Note: If adjustments need
to be made to the rules to change how the acres are split between the two "buckets," they can be
made following the October 2015 calibration.
• Action: WEP members should reach out to WQ representatives colleagues and inform them of
these land use changes to gain support for the 9/14 WQ GIT vote.
• Action: Edits or comments on the recommendations memo should be provided (in track changes
format) to Jeremy ([email protected]) by COB Thursday 9/3 (tomorrow).
• Action: Hanson will send doodle poll for next meeting in October.
Minutes:
Welcome and Introduction
• Hanson asked for any final corrections or edits to the July 29th minutes. None were raised; the
minutes were approved.
o Decision: The July 29th call minutes were accepted as amended.
• Review/summary of Wetland WG call from 8/28
o Non-tidal wetland land-use categories for Phase 6 model moves from three vegetation-
based classes to two landscape classes: floodplain and other.
o Process has been collapsed in a short timeframe that has caused frustration and
confusion. The preferred deadline to determine number of categories was months ago
and the timeline of the group conflicts with this. Now we are limited to three or fewer
classes with the first calibration on October 1st. The two proposed classes have support
from the workgroup, though, and two land uses for nontidal wetlands would be a major
achievement.
o Hanson: Overall, we will have wetlands added to the Phase 6 (with WQ GIT approval
9/14). Today we will review the recommendation memo and land use labels.
Discussion of tidal wetlands loading rate(s)
Lew Linker:
• Motivation behind including a tidal wetland:
1. Assessment of effect of climate change/sea level rise on the TMDL and other standards on
the Bay with a loss of tidal wetlands.
2. There has now been documentation of attenuation of N and P in tidal wetlands – TN/TP
attenuated 46/74% from tidal wetlands (Anderson, Iris et. al.)
3. Model needs update in attenuation.
4. Alignment with other expert panels.
• Calibration of tidal wetland attenuation will be initiated this month.
• Will be able to credit tidal wetland creation.
• Attempting to provide an assessment to guide management.
• Timeline – Both should be fully operation by the end of 2015 and review by CBP by 2016.
Wetland Expert Panel, Appendix D 35
• Action: Lew Linker will share the agenda for the upcoming October 5th Modeling Workgroup
quarterly meeting, which will include a more detailed discussion of tidal wetlands in the next version
of the Water Quality and Sediment Transport Model. Hanson and Runion will distribute the agenda
to the panel and wetlands workgroup, respectively.
Discussion of updated Phase 6 land use recommendations
• Review of most recent recommendations document – altered to reflect the Wetland Expert Panel’s
recommendation as supported by Wetland WG. PA dissent from WG recommendation has been
documented as against adding wetlands as a land use due to the age and inaccuracy of NWI in their
state, although they expressed support of the land uses to allow for reporting BMPs such as wetland
enhancement.
• Hanson: The current need for the model is to include wetlands in this first calibration in order to add
new, more accurate data next year wherever better data may exist.
• Staver: Critical part of differentiating wetlands and forests in the model is attenuation, not loading
rate.
• Claggett: We’re in agreement that attenuation of wetlands comes from surrounding lands. WQ GIT
is resistant to adding wetlands as a land use because loading rates are different from efficiencies.
Including efficiencies adds transparency to the model.
• Staver: Need to include wetlands to have a “mechanistic narrative” in order for the model to be
understandable.
• Hanson: Second criteria for new land use described as “contribution” in the memo rather than
loading rate or efficiency in order to be more comprehensive.
• Mason: Incorporating this data gives additional opportunities within the model such as habitat uses.
• Updating the wetland mapping model
o Decision: The existing NWI data layer will be used as the basis for the initial October 2015
calibration. Note: Newer data from the jurisdictions can be incorporated during the 2016
review period.
o Starting 1/1/16 there is a full review period of the calibrated model. There would be
opportunity to change or make improvements (NWI+) whenever available. This adds
incentive to develop NWI+ and put resources towards new data
o Action: Peter Claggett can be on the WQ GIT meeting to reassure group of this.
• Decision: NWI data for riverine, palustrine, and lacustrine wetlands will be used as the basis for the
wetland land uses in the initial Phase 6 model calibration (upon Water Quality GIT approval).
Riverine (vegetated) and lacustrine (vegetated) will be changed from open water to wetland when
there is overlap with acres of the existing open water land use. Acres of all three (palustrine, riverine
and lacustrine) will then be split into the Floodplain and Other classifications using a combination of
FEMA and SSURGO maps, as Peter and Quentin have already been doing. Note: If adjustments need
to be made to the rules to change how the acres are split between the two "buckets," they can be
made following the October 2015 calibration.
• Sweeney: Creating a land use in the model is difficult and the modelers are prepared to enter zero
for these land uses; the WEP must be able to answer various questions from different groups. Ex.
Why do we have multiple wetland classes if the loading rate/efficiencies are the same?
• Action: WEP members should reach out to WQ representatives colleagues and inform them of
these land use changes to gain support for the 9/14 WQ GIT vote.
• Action: Edits or comments on the recommendations memo should be provided (in track changes
format) to Jeremy ([email protected]) by COB Thursday 9/3 (tomorrow).

Wetland Expert Panel, Appendix D 36
Wrap-up and next steps
Action: Hanson will send doodle poll for next call in October.
Wetland Expert Panel, Appendix D 37
SUMMARY OF ACTIONS AND DECISIONS
Wetlands Expert Panel
Thursday November 5th, 10:00 AM-12:00PM
Meeting #10
Name Affiliation Present? Y/N
Kathy Boomer TNC N
Rob Brooks Riparia, Penn State Y
Dave Davis VA DEQ N
Judy Denver USGS Y
Jeff Hartranft PA DEP N
Michelle Henicheck VA DEQ Y
Pam Mason VIMS Y
Erin McLaughlin MD DNR Y
Jarrod Miller UMD Y
Ralph Spagnolo EPA Region 3 Y
Ken Staver UMD Y
Steve Strano NRCS N
Quentin Stubbs USGS, UMD Y
Jeff Sweeney EPA CBPO (CBP modeling team rep) N
Jeff Thompson MDE Y
Tom Uybarreta EPA Region 3 N
Support staff and guests
Jeremy Hanson (Coord.) Virginia Tech (Project/Panel Coordinator) Y
Brian Benham Virginia Tech (Project Director) N
Kyle Runion CRC Y
Jennifer Greiner USFWS, Habitat GIT Coordinator N
Aileen Malloy Tetra Tech Y
Peter Claggett USGS, CBPO N
David Wood CRC N
Denise Clearwater MDE N
Kristen Saacke-Blunk Headwaters LLC, AgWG Co-Chair N
Anne Wakeford WV DNR N
Ken Murin PA DEP Y
Lew Linker EPA CBPO N
Summary of ACTION Items & DECISIONs:
• DECISION: The September 2nd call minutes were accepted.
• ACTION: Members will send any additional literature to be reviewed by Tetra Tech to Hanson.
Any that emerge after 11/6 will need to be reviewed and summarized by a panel member.
• ACTION: Rob/Erin will provide list of common wetland practices that the panel will then work to
categorize under reestablishment, rehabilitation, or enhancement.
• ACTION: Ralph, Pam and Erin will discuss the tidal wetland conversion issue offline.
Wetland Expert Panel, Appendix D 38
• ACTION: Erin will share the wetland workgroup's NEIEN wetland BMP data flowcharts with the
panel. She will work with Virginia (Pam & Michelle) to get their flowchart similar to the other
jurisdictions.
• ACTION: Conflict of interest forms for the panel should be in to Hanson by Tuesday, 11/10/15.
Minutes:
Welcome and Introduction
• Hanson asked for any final corrections or edits to the September 2nd minutes. None were raised;
the minutes were approved.
o DECISION: The September 2nd call minutes were accepted.
Updates and Timeline
• Our tasks at a glance…
o Recommendations for the Phase 6 wetlands land uses were made as two classes:
“floodplain” and “other.”
o Recommendation of loading rates for Phase 6 Land Uses is ongoing
o Evaluation and recommendations of wetland BMPs is ongoing
• Timeline outlook
o November 2015: finalize additional literature for inclusion by Tetra Tech.
� ACTION: Members will send any additional literature to be reviewed by Tetra
Tech to Hanson. Any that emerge after 11/6 will need to be reviewed and
summarized by a panel member.
� Literature to be separated between constructed/restored and natural wetlands.
o December (week of the 7th): Panel call to refine BMP definitions Peter and Quentin to
begin SPARROW analysis. Build report outline.
o January 2016: Updated nutrient/sediment literature review from Tetra Tech &
SPARROW analysis to be discussed. Continue report outline.
o March: Work to complete first full draft of report. Face-to-face meeting.
� Murin: Should try to deliver the draft report to the panel as soon as possible to
ensure all can review and comment in time.
o April: Begin comment/review/approval process. Present recommendations to Wetlands
WG, Habitat GIT, Watershed Technical WG, WQ GIT.
� Spagnolo: Ideally will have comments from these groups in time for them to
come back to the Panel for review before final approval.
• Hanson: Any substantive changes will come to the Panel, but minor
changes in language etc. will be dealt with by the Chairs/Coordinator.
o September: All model inputs must be final.
o October 2, 2016: Final Phase 6 CMWM is calibrated.
o Members should give Hanson, Spagnolo, and Mason notice if they are taking time off or
have issues with any content.
BMP Definitions
• For Phase 6, we want to
o Have more clarity in the BMP definitions used by CBP for annual progress reporting
� Mason: Definitions that exist were created to be used for agricultural settings.
Moving forward, we want to consider all BMPs.
Wetland Expert Panel, Appendix D 39
� McLaughlin: We’re also building new categories of restoration to include
practices where there is an ecological uplift, but no gain in acres.
o Distinguish restoration, creation, and enhancement
o Recommend distinct effectiveness values for each of the BMPs
• Will be helpful to create a list to identify specific implementation practices that could be
classified under these BMPs for CBP reporting (as well as a list of practices that should not be
classified).
o Example: Legacy sediment removal is currently a CBP approved Stream Restoration BMP
but should be changed to a Wetland BMP.
o Spagnolo: Cannot have people start converting land just for the sake of BMP credits.
Even if there is a rise in water quality with a change, it may not be justified when
weighed down by the tradeoffs.
� Will set qualifying conditions for these practices to ensure tradeoffs aren’t net
negative
o ACTION: Rob/Erin will provide list of common wetland practices that the panel will then
work to categorize under reestablishment, rehabilitation, or enhancement.
• Murin: There is an existing regulatory definition from the EPA and USACE based on their
mitigation role from 2008. We could utilize this consistent definition for the various wetland
types. The NRCS Conservation Practice Standards definition could be used as an example for the
type of activity that qualifies for the wetland BMP.
o Brooks: Should not have to be exclusive in which we use. NRCS definitions are more
consistent with practitioners as opposed to the regulatory definition.
• Reestablishment, Rehabilitation, and Enhancement as categories under Restoration
o McLaughlin: Enhancement involves tweaking/improving one function while
Rehabilitation consists of multiple functions.
o Mason: We should keep these categories separate for now, but if we cannot determine
loading figures later on they can be consolidated into fewer categories.
� Staver: List the practices and have them define the categories.
o McLaughlin: There won’t be a land-use change for rehabilitation, but there will be an
acreage of improved function. Value change, not an area change.
o Mitigation is not counted/credited by the Bay Program.
� Constructed wetlands that are created for a purpose such as waste/pollution
treatment. Similar to mitigation but often done voluntarily
• Hanson: There are other BMPs and panels that deal with engineered
stormwater wetlands. Will list and refer to the appropriate panel in the
BMP list.
• Creation
o Creation is straightforward once the qualifying conditions are set.
• Tidal Wetlands
o Mason: What do we call vegetated wetland creation on near-shore shallow waters? NWI
already classifies this area as wetlands, so how can this be called creation? Ex. Living
shorelines that give an ecological lift and are given BMP credits but replace existing
aquatic resources.
� McLaughlin: Conversion/enhancement of one wetland habitat to another with
improved function.
o Could be included in other panels, such as living shorelines, and we should defer to that
panels’ recommendations.
Wetland Expert Panel, Appendix D 40
o ACTION: Ralph, Pam and Erin will discuss the tidal wetland conversion issue offline.
• Restoration to be split into four categories: Reestablishment, Rehabilitation, Enhancement, and
Creation.
o Spagnolo: Creation vs. other restoration can be separated by the presence of hydric
soils.
Wrap-up and next steps
• The Wetland Workgroup will meet on 11/19, 1-3 pm. All panel members are welcome to join.
o The Upper Susquehanna Coalition will be giving a presentation on a potential method to
update NWI data for PA.
• Wetland WG has put together a flow chart for each state of who is reporting to the NEIEN
contact. Mainly NRCS practices but expanding, so these contacts are helpful.
o ACTION: Erin will share the wetland workgroup's NEIEN wetland BMP data flowcharts
with the panel. She will work with Virginia (Pam & Michelle) to get their flowchart
similar to the other jurisdictions.
• Specific questions/topics for subgroups
o What practices should be on the lists of approved and non-approved wetland BMPs?
(also to be reviewed by Wetland Workgroup)
o Review of issues where other panels also exist (ex. Tidal wetland creation � living
shorelines)
o Identify format of BMP loading coefficients (ex. fixed percentage or sliding scale) and
order of effectiveness of restoration activities.
• ACTION: Conflict of interest forms for the panel should be in to Hanson by Tuesday, 11/10/15.
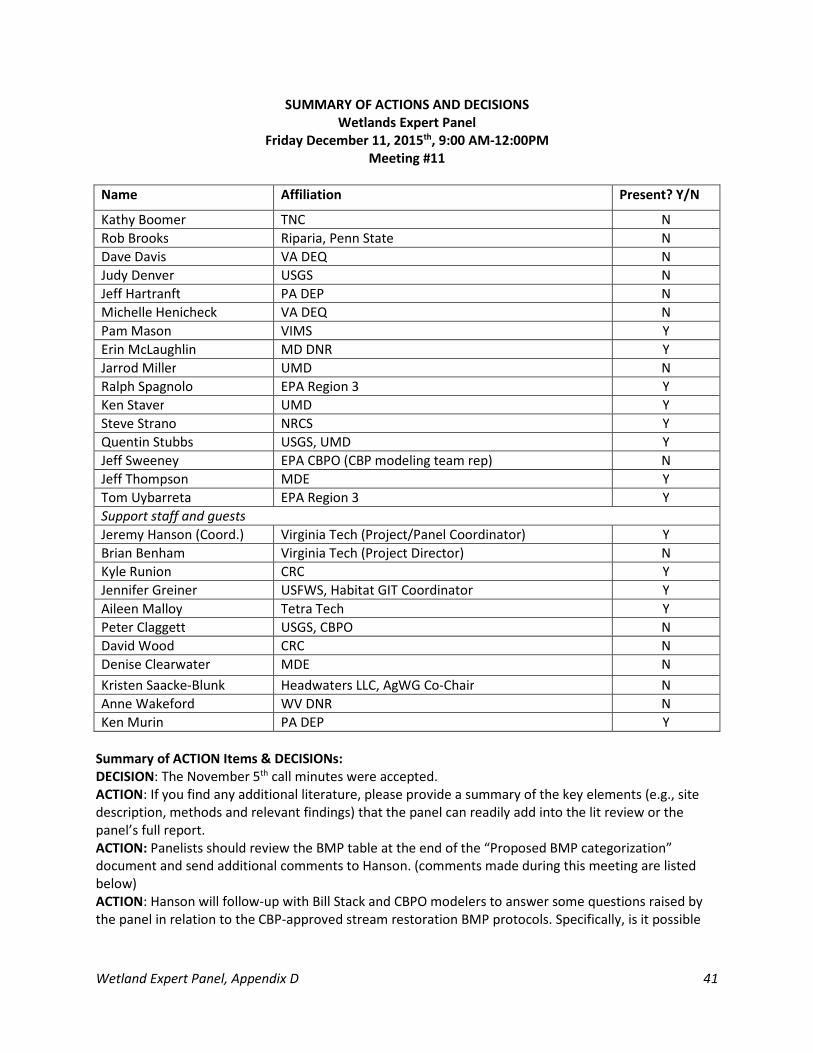
Wetland Expert Panel, Appendix D 41
SUMMARY OF ACTIONS AND DECISIONS
Wetlands Expert Panel
Friday December 11, 2015th, 9:00 AM-12:00PM
Meeting #11
Name Affiliation Present? Y/N
Kathy Boomer TNC N
Rob Brooks Riparia, Penn State N
Dave Davis VA DEQ N
Judy Denver USGS N
Jeff Hartranft PA DEP N
Michelle Henicheck VA DEQ N
Pam Mason VIMS Y
Erin McLaughlin MD DNR Y
Jarrod Miller UMD N
Ralph Spagnolo EPA Region 3 Y
Ken Staver UMD Y
Steve Strano NRCS Y
Quentin Stubbs USGS, UMD Y
Jeff Sweeney EPA CBPO (CBP modeling team rep) N
Jeff Thompson MDE Y
Tom Uybarreta EPA Region 3 Y
Support staff and guests
Jeremy Hanson (Coord.) Virginia Tech (Project/Panel Coordinator) Y
Brian Benham Virginia Tech (Project Director) N
Kyle Runion CRC Y
Jennifer Greiner USFWS, Habitat GIT Coordinator Y
Aileen Malloy Tetra Tech Y
Peter Claggett USGS, CBPO N
David Wood CRC N
Denise Clearwater MDE N
Kristen Saacke-Blunk Headwaters LLC, AgWG Co-Chair N
Anne Wakeford WV DNR N
Ken Murin PA DEP Y
Summary of ACTION Items & DECISIONs:
DECISION: The November 5th call minutes were accepted.
ACTION: If you find any additional literature, please provide a summary of the key elements (e.g., site
description, methods and relevant findings) that the panel can readily add into the lit review or the
panel’s full report.
ACTION: Panelists should review the BMP table at the end of the “Proposed BMP categorization”
document and send additional comments to Hanson. (comments made during this meeting are listed
below)
ACTION: Hanson will follow-up with Bill Stack and CBPO modelers to answer some questions raised by
the panel in relation to the CBP-approved stream restoration BMP protocols. Specifically, is it possible
Wetland Expert Panel, Appendix D 42
for the acres reported under the stream restoration BMP (Protocol 3 for floodplain reconnection) to be
used for tracking purposes under the Watershed Agreement’s outcome for wetland restoration?
ACTION: Hanson will update the table based on the discussion during the call or offline and share it with
the panel.
Minutes:
Welcome and Introduction
• Hanson asked for any final corrections or edits to the November 5nd minutes. None were raised;
the minutes were approved.
o DECISION: The November 5th call minutes were accepted.
Updates and Timeline
• About 50 pieces of literature were sent to Aileen Malloy at Tetra Tech for review. So far 15 have
been reviewed, with 7 having relevant data (1 from Chesapeake watershed). Most had a
removal efficiency or a way to determine it. Findings from the literature review should be
delivered to the Wetland Expert Panel in mid-January. ACTION: If you find any additional
literature for Tetra Tech from now on, please provide a summary as Aileen’s hours are limited.
SPARROW Analysis
• Mason: Questions arose last summer when the group became aware of the SPARROW model
process which was used to set the forest values for the Chesapeake Bay Watershed model. This
validated model could also be used to determine a loading rate for wetlands within the model.
• Stubbs: Timeline update (best case timeline for modelers, not WEP):
o Mid-December: In contact with USGS liaison to determine a timeline for the SPARROW
model to run. We are creating a spreadsheet vector dataset of the area of the wetlands
by NHD catchment to evaluate the wetlands in SPARROW. We will forward the
spreadsheet next week to run the SPARROW model.
o Late December/early January: Results of the SPARROW model in so we have time to run
through the results and ensure there are no glaring errors.
o Mid-January: Go back to the algorithm from Tom Jordan to calculate the wetland
efficiency rate.
o Late-January: The results will be forwarded to the WEP for review.
o Early February: Sent to Wetland Workgroup for review.
� Hanson: Reminder of calibration timelines: January 1st, 2016, first
calibration/beta version. April, second beta version. June/July, third beta
version. All inputs final in September. When can we deliver the efficiencies? In
time for a beta?
• Pros and cons of this group having more time vs modelers having more time…
o Hanson: The later the modelers receive a WQGIT-approved recommendation, the less
likely it is to be included. A simple loading rate is easy/quick, while a more complex
approach (curve, etc.) would be more difficult and require more time to build into the
modeling tools.
� Murin: WEP is supposed to deliver best science decision. Need to be aware of
timelines with modeling, but that can’t be the driver of our decision. Can’t rush
and deliver a poor product.
Wetland Expert Panel, Appendix D 43
• Mason: The current timeline seems to allow for the recommendations
to possibly be incorporated into that third beta version. The timeline
would give both the panel and modelers time to prepare and adjust.
o Greiner: Would involve delivering to the Wetland WG and
Habitat GIT in May/June
• Hanson: The recommendation requires a comprehensive memo, so it
would not be efficient to split the loading rate into N/P/… in order to
deliver some product sooner.
o Hanson: call mid-late January to examine Tetra Tech review and
SPARROW analysis review. Early March – face to face meeting,
Baltimore, Annapolis. Comments in first 30 days after…
� Stubbs: Potential for new wetland area numbers as we
find methods to update maps. New numbers could
require another SPARROW analysis. Hopefully that can
be automated, so not time consuming.
• Hanson: Ideally would have SPARROW and
literature give us a uniform loading rate for
each of the two wetland land uses. Then it
might not be necessary to redo the SPARROW
runs.
• Murin: We hope to have PA wetland mapping
(USC & UVM proposal) set to work by January 1
and completed by the end of July.
BMP
Provided to the group was a BMP categorization as well as an old “WetlandTrackingDefs” slide that
provided a base for our categorization of wetland BMP practices. Jeremy explained that he used that old
2005 table as a template for a way to categorize the panel’s recommendations for Phase 6 wetland
BMPs. The panel discussed how various practices may be included or excluded under the Phase 6
wetland BMPs.
• Wetland vs. stream restoration, credits for BMPs
o Legacy sediment removal, often done as floodplain reconnection outside of the stream
channel, could be counted towards wetland BMP and acre gain rather than stream in
many cases.
� McLaughlin: Huge potential for wetland acreage towards the Watershed
Agreement; do not mean to take away from streams but need to credit wetlands as
they are reconnected.
• Spagnolo: Clear way to do it (not how it is being done right now) is that in
channel areas go towards stream restoration and floodplain areas go to
wetland credits.
� Spagnolo: This sediment itself can become a source of pollution if not
transported/used properly. We need to be careful when categorizing this as legacy
sediment is done in different ways by different people/states.
• Questions for Jeff Sweeney and Bill Stack: Are states reporting floodplain
reconnection as wetland or stream credits? Varies state to state. Should
coordinate with Stream Health Workgroup (CWP contractual support ends
12/31/15, so any questions for them should be asked quickly).
Wetland Expert Panel, Appendix D 44
o Mason: What do we do with non-georeferenced projects along
waterways with regards to area of wetland creation and nutrient
reduction?
o Do the nutrient reduction efficiencies for these stream restoration
projects include floodplain sediment trapping?
• Modelers can avoid double count IF they receive the geo-reference from the
state every time (not always the case).
o Staver: Are stream restoration benefits counted with wetlands
benefits? Don’t need to capture the nutrient reduction, but want to
use the acres for wetlands towards the goal
• “Other Wetland Restoration project types” credited under stream but have potential for wetland
o Regenerative stormwater conveyance
� McLaughlin noted that when done outside of a stream channel, RSC is called Coastal
Plain Outfall. (same technique)
o Hanson: some not ambiguous, creditable elsewhere (living shoreline, constructed wetlands,
and riparian tree plantings)
� Living shorelines - gap in crediting
� Invasive species - not credited elsewhere,
� Wetland meadow planting – restoration.
• Strano: planting herbaceous vegetation on cropland with hydric soils.
Restoration in that they are installing vegetation where it used to be, but
whether or not they work with hydrology is another question. Land is not
under protection – can be converted back to cropland.
o Mason: This results in a wetland acreage gain.
� Strano: This practice is done under NRCS code 327
(conservation cover). Associated with wetland restoration.
Should assign 657 over the whole area and 327 over just the
meadow planting. Should avoid double counting: can’t
count 327 as enhancement and entire 657 area as
restoration.
• ACTION: Panelists should review the BMP table at the end of the “Proposed BMP categorization”
document and send comments to Hanson.
o Greiner: Background on initial table: this table is about a decade old, based on how
practitioners were reporting in 2005. Definitions taken from White House wetland working
group in the 90s. Seeking to make this table more reflective of current work and
terminology.
o McLaughlin: Create new category for rehabilitation (functional gain) rather than having it
within enhancement. Invasive species removal should be moved to enhancement.
Floodplain reconnection would fall under rehabilitation. Legacy sediment removal would fall
under restoration.
o Mason: Similar thoughts… comes down to explaining our decisions to who it effects
o Spagnolo: Note that “Practice and Project Examples” is not comprehensive
� Should clarify “regulate flow…” under enhancement
• Greiner: Group was trying to distinguish between habitat and water quality
within enhancement.
• Murin: NRCS, PA berms, with control structure to expand wetland area into
wetlands
Wetland Expert Panel, Appendix D 45
o Strano: Restoration/creation if it is upland
� Need to be clear that rehabilitate is repairing to natural/historic functions, while
enhancement is functional gain of some kind.
o Staver: Agree
o Strano: Include “reestablishing native vegetation on cropland with wetland hydrology” in
restoration.
� Many pastures require the hydrology be restored to be considered wetlands again.
• Will need to clarify if pasture will be included in land uses.
o Thompson: Enhancement, waterfowl – this does not consider moist soil management
� Ditch plugging would be rehabilitation if done in the woods, restoration if done in
agricultural lands
o Will need qualifying conditions and disclaimers to ensure the BMP credits aren’t being taken
advantage of with regards to actual benefit to wetlands.
� McLaughlin: Counties putting in BMP practices in order to gain credits…
implementing practices that gain more credit rather than the practice that is best
for the site. Mostly in developed areas, suburban, not ag
Follow up
The WEP will have another call in mid to late January to examine the literature review from Tetra Tech.
We plan to have a face to face meeting in late February or early March in the Baltimore/Annapolis area.
Depending on progress and workload, we may have another short call in early February (Delaware
wetland conference in early February is a scheduling conflict). Be on the lookout for Doodle polls soon
for these 2-3 dates.
We hope to have our report released in April to go through groups at the CBP and have loading rates
approved for the summer beta version of the Phase 6 Watershed model.
Wetland Expert Panel, Appendix D 46
SUMMARY OF ACTIONS AND DECISIONS
Wetlands Expert Panel
Wednesday January 27th, 2016, 9:00 AM-12:00PM
Meeting #12
Name Affiliation Present? Y/N
Kathy Boomer TNC Y
Rob Brooks Riparia, Penn State N
Dave Davis VA DEQ N
Judy Denver USGS Y
Jeff Hartranft PA DEP Y
Michelle Henicheck VA DEQ N
Pam Mason VIMS Y
Erin McLaughlin MD DNR Y
Jarrod Miller UMD N
Ralph Spagnolo EPA Region 3 Y
Ken Staver UMD Y
Steve Strano NRCS Y
Quentin Stubbs USGS, UMD Y
Jeff Sweeney EPA CBPO (CBP modeling team rep) Y
Jeff Thompson MDE Y
Tom Uybarreta EPA Region 3 Y
Support staff and guests
Jeremy Hanson (Coord.) Virginia Tech (Project/Panel Coordinator) Y
Brian Benham Virginia Tech (Project Director) N
Kyle Runion CRC Y
Jennifer Greiner USFWS, Habitat GIT Coordinator N
Aileen Malloy Tetra Tech Y
Peter Claggett USGS, CBPO N
David Wood CRC N
Denise Clearwater MDE Y
Kristen Saacke-Blunk Headwaters LLC, AgWG Co-Chair N
Anne Wakeford WV DNR N
Ken Murin PA DEP N
Summary of ACTION Items & DECISIONs:
DECISION: The December 11th call minutes were accepted.
ACTION: If you find any additional literature for Tetra Tech from now on, please provide a summary as
Aileen’s hours are limited. We are now focused on the literature review for unintended consequences
and ancillary benefits of wetland BMPs.
ACTION: Hanson and Runion will send a table listing chapter assignments. Please email Hanson if you’d
like to help with any other section.
ACTION: Draft sections due March 9th. March 16th as back-up deadline. Must be done before March 23rd
meeting for members to review.
ACTION: The Chapter 5 outline will be updated to reflect the categorization proposed today and shared
with the group by Hanson
Wetland Expert Panel, Appendix D 47
Minutes:
Welcome and Introduction
• Hanson asked for any final corrections or edits to the December 11th minutes. None were raised;
the minutes were approved.
o DECISION: The December 11th call minutes were accepted.
Updates
• The revised BMP categorization table was distributed; we will continue to revisit and revise the
document as needed.
• Hanson spoke to Bill Stack and modelers at CBP about stream restoration BMPs. No news to
report, but will be an evolving conversation.
• We hope to see SPARROW results in mid-February; hopefully in time to discuss during out 2/18
call.
Literature Review, Aileen Malloy
• About 50 pieces of literature were sent to Aileen Malloy at Tetra Tech for review. Of articles
addressing wetlands in the Chesapeake Bay watershed, 13 were identified as having potentially
useful data.
o 18 studies had TN load reduction efficiencies
o 20 studies had TP load reduction efficiencies
o 9 studies had TSS reduction efficiencies
o Studies varied geographically
� 8-10 data points within the Bay watershed
o Wetland types were very different
o Results are broken down by nutrient and sediment reduction efficiencies by wetland
and vegetation type in table 2 of the literature review (distributed)
� Mean % reduction given in this table was calculated using only data points given
in studies, not data ranges. The ranges are also described above the table.
• The spreadsheet distributed along with the literature review document gives all studies
provided and provides a reason for rejection for those studies that were not used (columns J
and K).
• Boomer: Would like to thank Aileen. The literature review is a great head start into the report.
The processes affecting the fate and transport of nutrients could be addressed better in the final
report.
• The literature review of unintended consequences and ancillary benefits of wetland BMPs has
not yet been started. Some current literature could be used, but additional relevant literature
would be appreciated.
o Hanson: The focus is on restoration/BMPs of wetland habitats, not just wetlands in
general. Will be more of a qualitative rather than quantitative review. Any
benefits/consequences besides nutrients/sediment (habitat, toxic contaminant, etc.)
� Staver: Benefits could even include downstream effects on hydrology related to
stream channel erosion. There is a large scale thinking of benefits.
• Strano: These studies look at a single type of wetland. In large storm
events, headwater wetlands become overrun and floodplain wetlands
become even more important.
Wetland Expert Panel, Appendix D 48
• Boomer: Wetland importance can also be shown with water storage
and hydrograph effects.
• ACTION: If you find any additional literature for Tetra Tech from now on, please provide a
summary as Aileen’s hours are limited.
SPARROW Analysis, Quentin Stubbs
• We are in the process of reformatting two datasets for SPARROW. We have to create an
updated wetland layer to include MD wetlands, and a layer that accounts for land cover that is
between agriculture and stream bank. Want to see if they can actually detect if there is forest or
wetlands between the agriculture and stream. Trying to identify how many nutrients these
wetlands are absorbing. After we have those two layers, we will resubmit to the modelers to
run. A long line of other groups wanting to run SPARROW things.
o Hanson: Output from analysis?
� The basic efficiency rate from the analysis will be entered into the Jordon
equation, which is what is of interest to us.
o Hanson: Hope to have this before 2/18 call.
Report Outline
• We have to release our report in April in order to have it approved by September. Priorities are
land use loading rates and wetland restoration BMPs in the calibration history.
• Will need input and effort from everyone in writing the report. Look at the outline
• Chapter 1: Charge and membership of the expert panel
• Chapter 2: Definitions of terms used in the report
• Chapter 3: Background on wetlands and wetland BMPs in the Chesapeake Bay Watershed
o Chapters 1-3 are background and can be done by staff here at CBP
• Chapter 4: Review of available science
o Literature review is a good start here, but some sections can be expanded on (processes
affecting the fate and transport of nutrients)
o Boomer, Denver
• Chapter 5: Recommendations for Wetlands as land-use and BMPs in Phase 6 Watershed Model
o A, Wetlands as a landuse
� Staver, Strano
o B, Wetlands as landscape efficiencies and BMPs
� Break out by restoration/creation/enhancement/rehabilitation or tidal, non-
tidal floodplain/non-tidal other?
• Looking through BMP categorization and determining what projects can
take place in floodplain/other can help clarify this.
� Floodplains: Strano, Boomer, Greg Noe, Denver
� Non tidal/headwater depressional: Staver, Denver
� Tidal: ?
o Hanson: Note the distinct difference in wetland loading rate and wetland as a landscape
efficiency.
� Staver: 5b and the recommended loading rates may be the most important
section; everything is built to defend the numbers in 5b.
• Sweeny: 5a is just as important, as when wetlands are reported, the
land is moved from whatever it is classified as into wetlands, creating a
Wetland Expert Panel, Appendix D 49
benefit as it will no longer be moving to forests. TMDL will receive credit
just for that move.
o Staver: Loads from wetlands as a landuse are going to be
uniformly smaller than loads coming from upland, aka the
landscape efficiency
� Staver: Experimental issues such as waterfowl, cover crops, etc. External sources
of nutrients that may overall remove/replace nutrients beneficially but can
credit/blame these nutrients on wetlands.
• Chapter 6: Accounting mechanisms
o McLaughlin and Clearwater
• Chapter 7: Unintended consequences and ancillary benefits of wetland BMPs
o Forthcoming literature review from Tetra Tech, Malloy will provide a base here
o Spagnolo, Uybarreta, Mason
• Chapter 8: Future research and management needs
o Likely to populate as a group
o Mason, Spagnolo, Uybarreta
o
• Chapter 9: References
• ACTION: Hanson and Runion will send a table listing chapter assignments. Please email Hanson
if you’d like to help with any other section.
• These reports can be updated as needed but only by a new panel, so it may take 3-5 years.
• ACTION: Draft sections due March 9th. March 16th as back-up deadline. Must be done before
March 23rd meeting for members to review.
Next Steps
• Habitat/other consequences (other than nutrient/sediment effects) literature should be sent to
Aileen. Focus should be on BMPs.
• Next call: February 18th. We don’t expect to have first draft of report yet, but hope for it to be
started. Chapter 4 is a priority and having a draft of that for 2/18 or shortly after would be ideal.
• ACTION: The Chapter 5 outline will be updated to reflect the categorization proposed today and
shared with the group by Hanson
• March face to face meeting: Wednesday March, 23rd 10am-4pm. Location is TBD.

Wetland Expert Panel, Appendix D 50
SUMMARY OF ACTIONS AND DECISIONS
Wetlands Expert Panel
Thursday February 18th, 2016, 10:00 AM-12:00PM
Meeting #13
Name Affiliation Present? Y/N
Kathy Boomer TNC Y
Rob Brooks Riparia, Penn State N
Dave Davis VA DEQ N
Judy Denver USGS Y
Jeff Hartranft PA DEP Y
Michelle Henicheck VA DEQ Y
Pam Mason VIMS Y
Erin McLaughlin MD DNR Y
Jarrod Miller UMD Y
Ralph Spagnolo EPA Region 3 Y
Ken Staver UMD N
Steve Strano NRCS Y
Quentin Stubbs USGS, UMD Y
Jeff Sweeney EPA CBPO (CBP modeling team rep) N
Jeff Thompson MDE Y
Tom Uybarreta EPA Region 3 Y
Support staff and guests
Jeremy Hanson (Coord.) Virginia Tech (Project/Panel Coordinator) Y
Brian Benham Virginia Tech (Project Director) N
Kyle Runion CRC Y
Jennifer Greiner USFWS, Habitat GIT Coordinator Y
Aileen Malloy Tetra Tech Y
Peter Claggett USGS, CBPO N
David Wood CRC N
Denise Clearwater MDE Y
Kristen Saacke-Blunk Headwaters LLC, AgWG Co-Chair N
Anne Wakeford WV DNR N
Ken Murin PA DEP N
Bill Stack CWP Y
Summary of ACTION Items & DECISIONs:
• March meeting: Wednesday, March 23rd. 10am – 4pm.
o NRCS office, 339 Buschs Frontage Rd #205, Annapolis, MD 21409
o There is a WaWa nearby for lunch. We will also look into delivery options.
• ACTION: Draft report deadline: March 9th. March 16th as backup deadline.
Minutes:
Welcome and Introduction
• Hanson asked for any final corrections or edits to the January 27th minutes. Some panelists have
not reviewed minutes; approval pending further review.
Wetland Expert Panel, Appendix D 51
Literature Review, Aileen Malloy
• Tetra Tech has moved on to their second literature review based on unintended consequences.
• Malloy: We have gotten through all the articles that were sent in (over 100). Roughly half were
found to be relevant (others continued to focus on nutrient and sediment reductions, which
were addressed in the initial literature review).
o Many articles addressed benefit to habitat. Other positive impacts included flow
reduction, water storage, storm abatement, aquifer recharge, and water quality
improvements.
o Negative impacts found included nuisance vegetation, toxics concentration, unintended
flooding, and methane emissions.
o Other topics mentioned by panelists: carbon storage and sequestration, denitrification
and how it changes with varying water tables and soils.
• Hanson: Some studies came out in this search that involved nutrients. These should be double
checked to ensure they were included or are added in the previous literature review.
SPARROW Analysis, Jeremy Hanson
• SPARROW analysis is not going to be completed within our necessary timeframe. This analysis
still could be useful to various GITs and workgroups, but it will not be complete until after our
report is out for review/completed.
o Mason: Large portion of time required for SPARROW is USGS’s round of QA/QC, which
was not accounted for in our timeline.
o Clearwater: Our report should note that the recommended efficiency could change
based on the results of this model.
� Greiner: Could place an addendum based on newly available information in
these reports.
o Hanson: There will be CBP modelers trained in SPARROW in early March, who would be
able to conduct this analysis with an expected completion date of this summer.
o Hartranft: Does the literature support moving forward with these efficiency
recommendations? The original charge stated that if it did not, we would make
recommendations on what new science is required.
� Hanson: No recommendation yet but there does seem to be sufficient
information to determine rates. We just need to review and agree on numbers.
• Hartranft: Could also consider scaling up and lumping categories
together to determine a loading rate rather than splitting down to each
specific practice.
o Mason: Splitting further is unlikely. We would need to have
many studies for each categorization. Terms are not explicitly
defined (as we have done) in literature.
o Greiner: CBP adopted the federal tracking definitions in 2005.
Recommending anything other than those to change those
would require significant effort for approval.
o Denver: SPARROW is particularly important as it can take geographical conditions into
consideration.
o Post-meeting note: On Feb. 24th, Hanson was informed that USGS is no longer able to
provide SPARROW training for CBP modelers until June or July at the earliest, if at all.
This new information makes it extremely unlikely that the desired SPARROW work and
Wetland Expert Panel, Appendix D 52
subsequent analysis could be done in time to inform the final Phase 6 model calibration.
Hanson will keep the panel informed if any new ideas surface or anything changes.
CBP BMPs, Bill Stack
• Hanson: There are two panels (stream restoration and shoreline management) that have
released reports that relate to our floodplain and tidal wetlands sections. There is some content
here we could possibly use and build on. Those panels’ recommendations have already been
reviewed and approved by the partnership, so we should utilize information that we can and
make sure the protocols are consistent or do not lead to double-counting.
• Two panels have dealt with this nutrient and sediment removal efficiency related to wetland
processes.
• Sujay Kaushal, UMD, and Paul Mayer, EPA, did research on nitrogen reduction with
reconnection of a stream to its floodplain. They developed recommendations for quantifying
denitrification in the hyporheic zone (applies to baseflow, stormflow has other protocol).
o Hartranft: In Kaushal’s study, are the floodplain access areas actually wetlands? Actual
wetlands rather than floodplain areas could have even higher nutrient removal.
� Stack: They installed monitoring wells in the stream up to the floodplain
wetlands. Connectivity of the water table was the key in these areas meeting
our qualifying conditions of this study. Qualifying conditions to determine
wetland status were not developed by the expert panel.
• Clearwater: “Reconnection” is misleading in this process as it assumes
the floodplain is being used with any stormwater while the cutoff in
natural channel design for disconnection is flooding at over the 2 year
storm event. To treat it like it is disconnected can be misleading.
o Stack: This protocol pertains to baseflow, the stormflow
protocol addresses that issue.
• Credit for floodplain reconnection volumes during storm flow
o Floodplain connection volume of stormflow increases when floodplain is more easily
accessible.
o We then took efficiencies from the Tom Jordan curves and multiplied by the volume of
annual runoff.
o A certain ratio of wetland area to watershed area proved to be optimal for nutrient removal.
o Floodplain reconnection has to reconnect to a wetland as defined… same assumptions as
Tom Jordan.
� Spagnolo: Were these wetlands categorized? Was hydrology measured?
• Strano: The wetlands used in this study were restored wetlands, not floodplain
wetlands used in the study.
o Hartranft: The criteria for categorization of restoration sites in the Jordan study
was different than what we are working under. The ratio of wetland size to
watershed size was not statistically significant, but rather a general trend that
he established. This relationship may work well at large scales (watershed) in
theory but it may not at floodplain wetland scales and even up to several order
tributary scales.
� Stack: Two parts of this protocol. First part estimates the volume of annual
flow that enters the wetland area. This affects the efficiency more that the
Jordan curve. Second, the expert panel used that ratio of watershed area to
wetland area to try to address the uncertainty associated with the method;
Wetland Expert Panel, Appendix D 53
this tries to be conservative. The 1% ratio chosen helped account for
sufficient hydrologic retention time.
� Wetland vs floodplain size drives denitrification, though there are other
factors such as landuse and inputs.
• Hanson: The phase 5 rates are largely based on Jordan equations.
Nitrogen: 16.75%, Phosphorus: 32.18%, Sediment: 9.82%.
o Hartranft: Is the panel considering a removal rate attributed to
floodplain wetlands in addition to or in lieu of an acre
efficiency?
� Hanson: Load reduction – pound figure, efficiency –
calculated based on upland loads or the loads of that
landuse.
� Clearwater: The floodplain reconnection protocol is
considered part of the stream restoration BMP whether or
not there are existing wetlands there or ones are created
or restored.
� Stack: This credit applies to the volume of upland
runoff treated by the wetland.
� Hartranft: Recommendations for stream restoration
apply to all types of floodplain reconnection, whether
it be wetland restoration or stream work. For example,
legacy sediment removal was named in the urban
stream restoration expert report, but lumped with
other types of BMPs (no specific removal rate).
� Spagnolo: Stream restoration getting credit for
wetlands created after restoration.
� Clearwater: What’s measured is the difference
between pre- and post-construction volume.
� Stack: There are three different protocols for stream
restoration projects based on different processes. Though
they don’t directly define an efficiency based on legacy
sediment, we allowed flexibility on the efficiency based on
monitoring data.
� Do not want to double count, but do want to accurately
track and report between streams and wetlands.
� Spagnolo: Credit is on an area basis. Will have to
discuss minimum project size at March meeting.
� Mason: The modeling workgroup (or whoever may be
appropriate) will have to deal with double counting.
We can say in our report that there might be
complications in tracking the data.
• Tidal shoreline management protocol
o Protocols 2, 3 and 4 apply to living shorelines/fringe wetlands. A literature review led to
median values applied to area of wetland. Credits applied as annual reductions.
Verification recommendations ensure that wetlands are still functioning. Credits are
adjusted accordingly.
� Denitrification rate (TN)
� Accretion that occurs due to fluctuation tides (TP, TSS)
Wetland Expert Panel, Appendix D 54
� Marsh Redfield Ratio: biomass stored in wetland. One-time annualized credit
over 20 year period based on standing crop (TN, TP)
o Mason: Protocol 1: sediment prevention/retention remains largely unknown, so TSS
rates are project specific.
o Hanson: Could these same protocols apply to tidal wetlands? We could save ourselves a
lot of work, but do not want to do so just for convenience sake, the panel would need to
agree that the shoreline management protocols are valid estimates of reductions for
tidal wetland BMPs.
� Mason: The panel would need to consider if there have there been any
significant studies on this science since these recommendations were made.
VIMS researchers are looking at N & P uptake of living shorelines, but otherwise
doesn’t seem to be much more new information to modify the protocols.
o Clearwater: Unfortunately, habitat is not yet being counted. Until a habitat multiplier is
developed, it may as well be counted as a shoreline BMP.
� Hanson: Even if living shorelines and tidal wetlands are credited the same,
having them reported separately can be useful towards our tracking efforts.
� Mason: Differentiating between tidal wetlands and living shorelines categories
in the crediting can help show other ecosystem services such as habitat.
• Greiner: In terms of the direction of this partnership, there is a value
added by differentiating and keeping habitat in mind. Should include
enough in report to begin to develop this distinction.
Next Steps
• Tidal discussion to continue at our March meeting.
• March meeting: Wednesday, March 23rd. 10am – 4pm.
o NRCS office, 339 Buschs Frontage Rd #205, Annapolis, MD 21409
o There is a WaWa nearby for lunch. We will also look into delivery options.
• Draft report deadline: March 9th. March 16th as backup deadline.
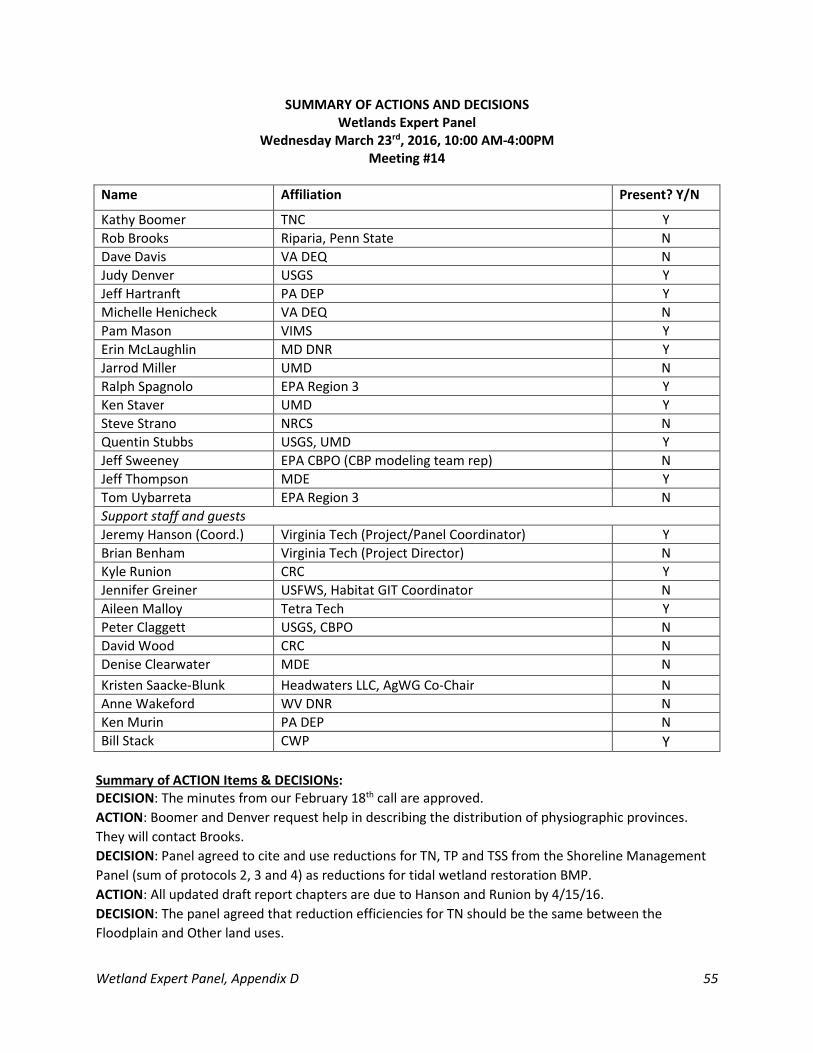
Wetland Expert Panel, Appendix D 55
SUMMARY OF ACTIONS AND DECISIONS
Wetlands Expert Panel
Wednesday March 23rd, 2016, 10:00 AM-4:00PM
Meeting #14
Name Affiliation Present? Y/N
Kathy Boomer TNC Y
Rob Brooks Riparia, Penn State N
Dave Davis VA DEQ N
Judy Denver USGS Y
Jeff Hartranft PA DEP Y
Michelle Henicheck VA DEQ N
Pam Mason VIMS Y
Erin McLaughlin MD DNR Y
Jarrod Miller UMD N
Ralph Spagnolo EPA Region 3 Y
Ken Staver UMD Y
Steve Strano NRCS N
Quentin Stubbs USGS, UMD Y
Jeff Sweeney EPA CBPO (CBP modeling team rep) N
Jeff Thompson MDE Y
Tom Uybarreta EPA Region 3 N
Support staff and guests
Jeremy Hanson (Coord.) Virginia Tech (Project/Panel Coordinator) Y
Brian Benham Virginia Tech (Project Director) N
Kyle Runion CRC Y
Jennifer Greiner USFWS, Habitat GIT Coordinator N
Aileen Malloy Tetra Tech Y
Peter Claggett USGS, CBPO N
David Wood CRC N
Denise Clearwater MDE N
Kristen Saacke-Blunk Headwaters LLC, AgWG Co-Chair N
Anne Wakeford WV DNR N
Ken Murin PA DEP N
Bill Stack CWP Y
Summary of ACTION Items & DECISIONs:
DECISION: The minutes from our February 18th call are approved.
ACTION: Boomer and Denver request help in describing the distribution of physiographic provinces.
They will contact Brooks.
DECISION: Panel agreed to cite and use reductions for TN, TP and TSS from the Shoreline Management
Panel (sum of protocols 2, 3 and 4) as reductions for tidal wetland restoration BMP.
ACTION: All updated draft report chapters are due to Hanson and Runion by 4/15/16.
DECISION: The panel agreed that reduction efficiencies for TN should be the same between the
Floodplain and Other land uses.
Wetland Expert Panel, Appendix D 56
DECISION: The panel agreed that reduction efficiencies for existing wetlands will be the same between
Floodplain and Other.
ACTION: Molloy will attempt to tease out physiographic regions and wetland:watershed ratios from the
literature review to see if we are able to tease out regarding those attributes.
DECISION: There was consideration for using reduction efficiencies from the Riparian Forest Buffer
report (2014), but the panel agrees that our own literature review is likely more accurate and will
continue to discuss this. Hanson will distribute the RFB Report.
ACTION: Staver will chase down the CBWM 5.3.2 reduction efficiencies for current land uses.
ACTION: Stubbs will separate out wetlands using the beta watershed model calibration for Maryland
and one other state (DE or PA) by 4/1/16.
Next Steps: We will schedule a two hour call during the week of 4/11/16 and another face to face
meeting will be scheduled during the following weeks. Please complete the NeedToMeet polls by
Thursday 3/31: April two hour conference call; April face to face meeting
Minutes:
Welcome and Introduction
• Hanson asked for any final corrections or edits to the February 18th minutes. None were raised.
DECISION: The minutes from our February 18th call are approved.
• The focus of today is to make decisions about how to structure BMPs of the land uses; whether
or not we want to have different rates for floodplain/other, physiographic regions, and
restoration/creation/rehabilitation. The next step is to decide values or at least ranges of
reduction efficiencies for these BMPs.
• Our overall deadline is the Phase 6 calibration in September. We hope to have the report
released by the end of April/early May in order to be able to get through the review process in a
timely fashion.
Review of Draft Chapters
Please send any comments to the chapter authors and Hanson
Chapter 1. Charge and membership of the expert panel, Hanson
• Mason: Some of the description should be more definitive in how some of these things evolved.
“In addition to review….” Be clear that the group is in support of rather than determine if there
is sufficient evidence for including wetlands in the Chesapeake Bay Watershed Model (CBWM)
Chapter 2. Definitions, Hanson
• Will be added for next version
Chapter 3. Background on wetlands and wetland BMPs in the Chesapeake Bay Watershed, Hanson
• Mason: It is important for our partners to check the nontidal/tidal wetlands percentages as they
may be dated. If anyone has a specific reference, please share with Hanson & Runion.
o Boomer: Would also be worthwhile to ensure our geospatial datasets are matching up
with these numbers. We’d also ultimately want our NWI tables to be separated by
county and physiographic region.
� Hanson: This will be worked out with the modelers. Our maps and numbers will
likely change once we receive the updated Pennsylvania mapping from the
Chesapeake Conservancy/University of Vermont/Upper Susquehanna Coalition
Wetland Expert Panel, Appendix D 57
project. Stubbs will also have literature on how the GIS layer was created to
include in an appendix.
� Denver: Suggest we split the Eastern and Western shore with in the Coastal
Plain for our physiographic provinces. Wetland functions are very different
between the two.
• Denver: It would be nice to have some graphics to show tidal/nontidal and floodplain/other on
maps or pie charts to give an understanding of where and how we are targeting these wetland
BMPs.
• Mason: Flow diagram from the wetland verification guidance may need updating. We also need
to clearly state that this data does not include wetlands created primarily to capture stormwater
runoff.
o McLaughlin: The Wetland Workgroup is looking into tackling this issue of urban wetland
restoration projects.
Chapter 4. Review of available science, Boomer and Denver
• Boomer: Chapter 4 has three basic sections
o Conceptual model overview based on combination of hydrogeomorphic, hydrogologic,
and stream classification framework
� There is still some literature to review. The framework is well built, but we need
to pull additional references and discuss what we know in hydrogeomorhpic and
watershed position.
� Mason: Considering the baseflow contributions from groundwater and the
capacity of wetlands, is the relative contribution of wetlands something to think
about?
• Boomer: Thinking of wetlands as a source of nutrients, and that the
amount retained will really depend on the amount in the contributing
area.
o Staver: Will the model show that delivered loads much lower
than source loads where there are wetlands?
� Denver: The SPARROW model does this now. Higher
water content is associated with wetlands, and we’d
likely see a correlation between source and load with
wetlands.
o Boomer reviewed the N and P Dynamics they’ll cover in the chapter: available in the
slides distributed along with these minutes.
o Predicting importance of biogeochemical processes based on location in relation to
landscape model
� We’ll need to marry what we know about these processes with the distribution
of wetlands across the landscape in different physiographic provinces.
• Denver: A map or pie chart with the distribution of wetlands within
physiographic provinces would be helpful here as well. Recognize that
Eastern and Western shores are separated within the outer coastal
plain.
o Boomer reviewed their remaining to-do list for Chapter 4:
� Incorporate key landscape model papers
Wetland Expert Panel, Appendix D 58
� Description of general hydrogeology by physiographic province, including
overview of HGM type distributions
� Outline dominant N and P transport processes based on landscape framework
� Discuss human impacts on wetland nutrient & sediment processes
� Action: Boomer and Denver request help in describing the distribution of
physiographic provinces. They will contact Brooks.
� Mason: The text of the chapter could be integrating instead of bullets to make it
flow like a report.
Chapter 6. Accountability mechanisms, McLaughlin
• Initial verification that the proposed practice was installed correctly, and is hydrologically,
vegetatively, and physically stable should be done by the installing agency. That agency should
deal with record keeping and report to state NEIEN. Note that the database must be modified as
we start to collect enhancement and rehabilitation.
o Clearwater had put what is currently stated in the BMP verification guidance: as long as
you can verify you have the three parameters and are keeping an eye on invasives you
should be good; remote observations can serve as a proxy.
o Spagnolo: Accountability is visual/on site. Is there a procedure CBP uses a site will be
registered as a wetland after 5 years monitoring? As land use changes, how do we
update it? Having a form that practitioners can register to put the landuse change on a
map would be helpful (if we could register is as a polygon & tabular data)
� Hanson: The model updates land uses year to year but changes are typically to
agriculture and urban areas as that’s where the data is. Presumably the wetland
land uses would be held constant and only change based on BMP
implementation or when changes to other land uses force changes to the
wetland acres. Other groups in the partnership beside this panel will work out
those specific details as needed.
• Stubbs: Also depends on the resolution of the imagery. If the size of the
project is less than minimum mapping unit then it doesn’t get counted
through the imagery.
• Mason: Is there no GIS post processing that goes along with data
submissions to convert landuse data layer from agricultural to wetland
when wetlands are created?
o Stubbs: No, but in Phase 6 there could be the landuse change
BMP
� McLaughlin: This may be helpful in capturing
restoration area. We have current landuse vs restored
landuse but we do not have landscape position.
Chapter 7. Unintended consequences and qualifying conditions of wetland BMPs, Spagnolo
• We do not want to have projects where ecosystems of high quality are altered or degraded,
functionally, just to receive wetland BMPs. “Wetter isn’t necessarily better.”
o Could be worth defining “high quality wetlands,” or it could be left up to the jurisdiction.
� Hartranft: Suggests using “natural” rather than “high quality” as in PA there are
instances where it would be beneficial to restore a degraded “high quality”
ecosystem (think degraded forested wetland). “Highly functional”?
Wetland Expert Panel, Appendix D 59
• Mason: Would be worth cross-walking BMP description in this chapter with our BMP
categorization table (which largely follow the existing NRCS definitions). Would also be worth
including that BMP table and examples in Chapter 2 rather than laying out the BMPs here.
• Ralph thought it may help to define “pre-application meeting.” Input from other states as to if
this is necessary would be appreciated.
Chapter 8. Future research and management needs, Mason
• Though literature is scarce on wetlands as a source, there is plenty of literature on removal
efficiencies largely focused on wetlands explicitly served for nutrients.
• Helpful future research would investigate wetlands as both sources and sinks, efficiencies of
inputs from other landuses, and determine load reductions for various practices and attributes
(landscape position, hydrology, vegetation, etc.).
o SPARROW would have been helpful to get numbers (we still may, in order to compare,
but not in time to add to the report).
ACTION: All updated draft report chapters are due to Hanson by 4/15/16.
Discussion of how to frame, determine, and finalize wetlands reductions for TN, TP, and TSS
Tidal
• As discussed in a past call with Bill Stack, the Shoreline panel has already developed reductions
using literature on the nutrient and sediment processes of tidal marsh areas. Note: we are only
concerned with Protocols 2, 3, and 4. Protocol 1 is not applicable for our purposes.
• Decision: Panel agreed to cite and use reductions for TN, TP and TSS from the Shoreline
Management Panel (sum of protocols 2, 3 and 4) as reductions for tidal wetland restoration
BMP.
Nontidal
• Floodplain and Other
o Stubbs: These categories were originally floodplain vs headwater/depression, but are
now lumped into Floodplain and Other following the partnership’s decision in the Fall.
Floodplain is mapped with FEMA plus SSURGO and overlaid by water layer. A wetland
can make the first cut with NWI but is disregarded if it is overlaid by open water.
� Denver: If only third order or high count in Floodplain, does Other include
floodplains that are 1st or 2nd order?
• Stubbs: FEMA and SSURGO are primary sources. Third order mainly
used to check what could be open water; trying to preserve third order
floodplains.
• Denver noted the distinction between floodplain and other may be
more important for TP and TSS than it is for TN.
o Spagnolo agreed, as denitrification is generally lower in
floodplains associated with flashy hydrology.
� Mason: The reduction efficiency should be the same for
TN between Floodplain and Other. Objections? None
raised.
� Decision: The panel agreed that reduction efficiencies
for TN should be the same between the Floodplain and
Other land uses.
Wetland Expert Panel, Appendix D 60
• Creation vs Restoration
o How to credit existing wetlands
� Hanson: With Phase 6 being a new model, the effect of existing could change in
the model.
• Staver: Realistically, loads to the Bay will not change with our
efficiencies. Existing should be the same between Floodplain and Other
as there will be no change in function and therefore no change in
effect/benefit to the Bay.
� Decision: The panel agreed that reduction efficiencies for existing wetlands will
be the same between Floodplain and Other.
o Discussion of using percent reduction or removal rate by area
� Mason: We can’t give a percentage reduction without knowing the drainage
area. If we give a lbs/acre measurement, the model would then calculate that
percent.
� Hanson explained that it doesn’t exactly work that way in the modeling tools. A
percent reduction (i.e. efficiency) is much easier to use in the model for a
number of reasons and will not require translation from the results of our
literature review. Absolute reductions (in pounds) can get much more
complicated from a modeling perspective. The panel is strongly encouraged to
consider what the relative impact of a wetland or wetland BMP is compared to a
no-wetland or no-BMP baseline. We should be able to do that with the
literature available.
� Staver: Have to consider the wetland:watershed ratio in securing accuracy of
this method.
� Staver suggested the panel could consider using the same efficiencies from the
Riparian Forest Buffer report from 2014.
� Denver: Agree. Converting the RFB numbers into a range would be more
comfortable. These numbers also include physiographic regions (though not
exactly the ones we laid out), which is helpful.
� Hartranft felt the RFB panel’s numbers should be our minimum as wetlands
assuredly have higher removal efficiencies than RFBs.
� Mason noted there is some suspicion that the RFB numbers are too high in their
own right. We shouldn’t copy any potential mistakes. The mean removal rates
from our literature review is the best option we have and they are notably
lower than any of the RFB values. In the report we can acknowledge that further
investigation is needed and give opportunities to modify.
� Hanson pointed out that the panel would want to very carefully consider the
RFB panel’s underlying assumptions before deciding to adopt their numbers
wholesale or not. Especially if they are still largely based on the original RFB
work from the 1990s, which was not updated in the Simpson and Weammert
(2009) review, and again not updated by the latest (2012) RFB panel. Would
need to fully understand what assumptions they are making regarding the
performance and longevity of buffers in the real world vs. optimal or perfect
conditions, among other things.

Wetland Expert Panel, Appendix D 61
� Action: Molloy will attempt to tease out physiographic regions and
wetland:watershed ratios from the literature review to see if we are able to
tease out regarding those attributes.
� Decision: There was consideration for using reduction efficiencies from the
Riparian Forest Buffer report (2014), but the panel agrees that our own
literature review is likely more accurate and will continue to discuss this.
Hanson will distribute the RFB Report.
• Rehabilitation vs. Enhancement
o Staver: These cannot be as high as existing, as we are interested in the change/increase
of function. It cannot receive full credit for function if it already has a fraction of that
function.
� Boomer: if we’ve got some suboptimal efficiency, there can be a burden placed
on counties in determining which are high quality and thus cannot be restored.
o Discussion on this topic will continue at the next call & meeting.
• Action: Staver will chase down the CBWM 5.3.2 reduction efficiencies for current land uses.
• Stubbs: Within the model, there is an option of looking at state, county, or portion of province in
a county or state.
o Action: Stubbs will separate out wetlands using the beta watershed model calibration
for Maryland and one other state (DE or PA) by 4/1/16.
Next Steps: We will schedule a two hour call during the week of 4/11/16 and another face to face
meeting will be scheduled during the following weeks. Please complete the NeedToMeet polls by
Thursday 3/31: April two hour conference call; April face to face meeting
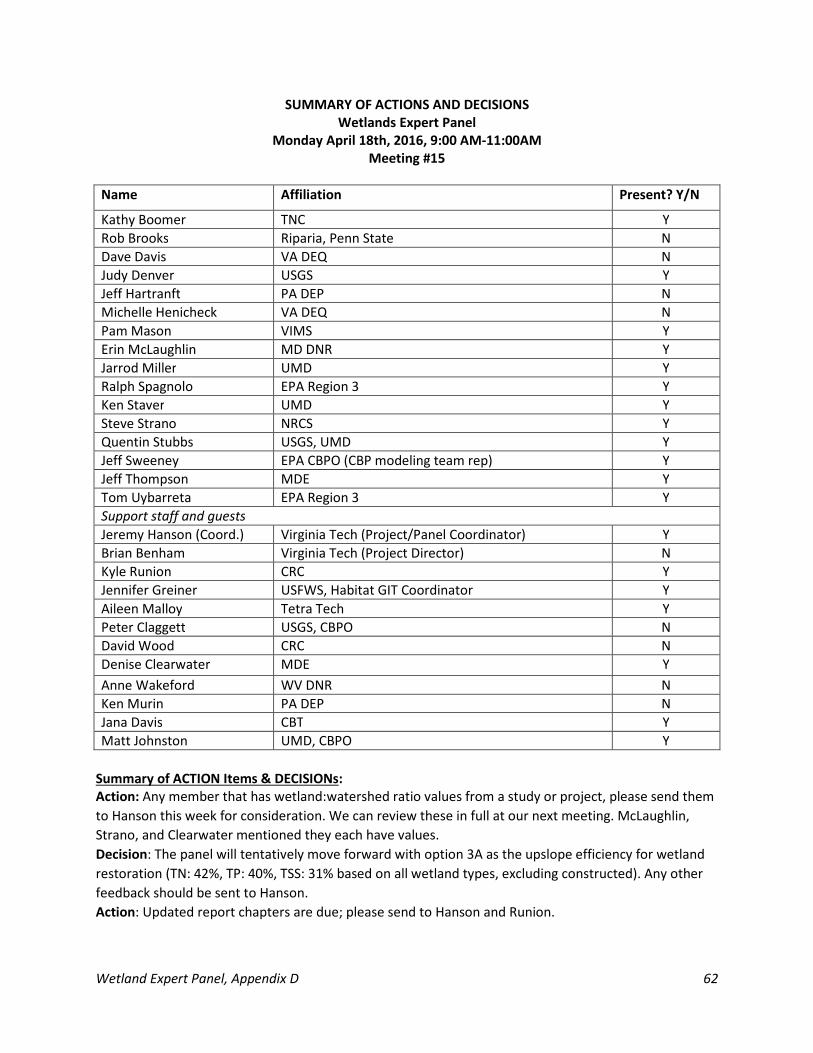
Wetland Expert Panel, Appendix D 62
SUMMARY OF ACTIONS AND DECISIONS
Wetlands Expert Panel
Monday April 18th, 2016, 9:00 AM-11:00AM
Meeting #15
Name Affiliation Present? Y/N
Kathy Boomer TNC Y
Rob Brooks Riparia, Penn State N
Dave Davis VA DEQ N
Judy Denver USGS Y
Jeff Hartranft PA DEP N
Michelle Henicheck VA DEQ N
Pam Mason VIMS Y
Erin McLaughlin MD DNR Y
Jarrod Miller UMD Y
Ralph Spagnolo EPA Region 3 Y
Ken Staver UMD Y
Steve Strano NRCS Y
Quentin Stubbs USGS, UMD Y
Jeff Sweeney EPA CBPO (CBP modeling team rep) Y
Jeff Thompson MDE Y
Tom Uybarreta EPA Region 3 Y
Support staff and guests
Jeremy Hanson (Coord.) Virginia Tech (Project/Panel Coordinator) Y
Brian Benham Virginia Tech (Project Director) N
Kyle Runion CRC Y
Jennifer Greiner USFWS, Habitat GIT Coordinator Y
Aileen Malloy Tetra Tech Y
Peter Claggett USGS, CBPO N
David Wood CRC N
Denise Clearwater MDE Y
Anne Wakeford WV DNR N
Ken Murin PA DEP N
Jana Davis CBT Y
Matt Johnston UMD, CBPO Y
Summary of ACTION Items & DECISIONs:
Action: Any member that has wetland:watershed ratio values from a study or project, please send them
to Hanson this week for consideration. We can review these in full at our next meeting. McLaughlin,
Strano, and Clearwater mentioned they each have values.
Decision: The panel will tentatively move forward with option 3A as the upslope efficiency for wetland
restoration (TN: 42%, TP: 40%, TSS: 31% based on all wetland types, excluding constructed). Any other
feedback should be sent to Hanson.
Action: Updated report chapters are due; please send to Hanson and Runion.
Wetland Expert Panel, Appendix D 63
Welcome and Introduction
• Mason: We are so close to finishing up and while it has taken a lot of time, we have
accomplished a lot and are close to delivering a finished product.
• Davis: Big appreciation to the WEP, as expert panels can be strenuous work. It seems the panel
is very close, and we are at a very opportune moment within the Watershed Model’s timeline
where we can benefit by adding wetlands as a land use. We will have opportunities to refine the
BMP numbers in the future, so we just need our best possible recommendations now to
incorporate into the model before the upcoming calibration.
• Greiner: Would also like to thank the panel members for their hard work. Many expert panels
are behind and the WEP even had an extra bump in the road with the land use classification
process, but the finish line is in sight and we hope to finish strong.
How Wetlands Differ Spatially Across the Watershed, Matt Johnston, UMD
• Johnston reviewed and clarified some common land use & BMP terms. Refer to powerpoint,
distributed to the panel.
• Landscape effects: Factors come from SPARROW analysis.
o Land-to-Water. Ex. Nitrogen is more likely to move from edge of field to small order
streams in the Susquehanna system, while phosphorus transport is very efficient in the
coastal plain.
o USGS is working on improving SPARROW and trying to determine how much drainage
area there is per wetland. This may be done in time for the next calibration, but would
be addressed outside of this panel by the Modeling Workgroup, which would coordinate
with the Wetlands Workgroup or other workgroups as needed.
• Mason: The efficiency aspect is largely accounted for. Our focus should be on the BMP side of
things.
o Staver: Important to characterize existing wetlands as a sink of nutrients to show their
value. This idea should be captured in the report and identified as a task for the next
panel.
• Johnston: There is currently no difference between wetlands and forest in the model but by
separating wetlands, you are giving USGS ability to differentiate within these factors.
o Mason: The panel feels that this is a high priority.
� Johnston: Recommends that the panel includes this in a list of requests.
Discussion of wetland restoration BMP effectiveness estimates
• Hanson: Focusing exclusively on BMPs and removal efficiency values.
o Numbers used currently in the Phase 5.3.2 model are shown in Figure 1, with a
description of how they were developed below.
� Denver: Just as this section states that the kinetic equation does not account for
wetlands as a source, we should recognize the shortcomings in our report as
well. The kinetic equation also does not account for groundwater inputs, only
surface flows.
o Six different options are proposed based on the summarized results of values in the
literature. Options are fully described and listed in the “Wetland reduction option”
Wetland Expert Panel, Appendix D 64
document. Both mean and median are listed as options. Some options differentiate
values for Floodplain and Other, while some do not.
� Constructed refers to wetland stormwater facility.
� Staver: What/where are these number applied? We need to further discuss the
potential to develop a watershed:wetland ratio for these efficiencies. A 1:1 ratio
will lead to the efficiencies being very conservative. A qualifier should be
included that this only applies to newly created and restored wetlands.
• Mason: We do not have the capacity to do this right now, but part of
this effect is captured in the landscape effects for existing wetlands. By
acknowledging there is an issue with the ratio applied to the BMP, we
can incorporate the appropriate efficiency values and allow this issue to
be resolved in a later model run.
o Action: Any member that has ratio values from a study or
project, please send them to Hanson this week for
consideration. We can review these in full at our next meeting.
McLaughlin, Strano, and Clearwater mentioned they each have
values.
• Clearwater: We have always been trying to get the size of the
watershed when a project is reported, but many did not report and 1:1
was used as a default. Leaning towards option 3.
• Strano: Agrees that the effect will likely be severely underestimated on
a 1:1 watershed scale.
• Staver: Riparian Forest Buffers (RFBs) have a 4:1 and 2:1 ratio for N and
P, respectively. Reasonable that wetlands should have at least this area
treated, but the modeling folks don’t agree. The scrutiny level will
increase as our proposed ratio gets higher.
o Strano, Clearwater, and McLaughlin agree that the RFB ratios
can serve as a minimum value for our ratios.
o Hanson: Wary of comparing efficiencies with the RFBs as we are
unsure of their accuracy as applied to wetlands in the next
version of the model. Their ratios are conservative as well, but
we would need a basis to accept them. We will revisit this
discussion at our next meeting. Then we can look at some of the
available information about wetland:watershed ratios.
Important to consider that we don’t select a ratio that would be
too high as there will be projects that are closer to a 1:1 ratio.
o Sweeney: Right now there’s no basis for using the RFB upslope
ratios of 4:1 and 2:1 for wetlands. The panel could justify using
those ratios but they need to explain why those ratios are
useable for wetlands.
� Vote on option 3A (values from the literature review for all wetlands, excluding
constructed wetlands. Floodplain and Other are combined).
• In favor: Mason, Spagnolo, Thompson, McLaughlin, Clearwater, Denver,
Staver, Miller, Strano.

Wetland Expert Panel, Appendix D 65
• Boomer asked for some time to review and send her thoughts via email
vote, but tentatively agreed.
• Decision: The panel will tentatively move forward with option 3A (TN:
42%, TP: 40%, TSS: 31% for all wetland types, excluding constructed).
Any other feedback should be sent to Hanson.
• Mason: The efficiencies from Table 1 that are separated out into geomorphic provinces are
based on any landscape ratios of 1, 2 and 4% - having a background on these values would be
helpful.
o Sweeney: Will find out and share with the panel.
Wrap-Up
Action: Updated report chapters are due; please send to Hanson and Runion.
Our next meeting is Thursday, April 28th from 10am-4pm at the NRCS office in Annapolis. If you cannot
attend, please provide any input or comments to Hanson before the meeting.
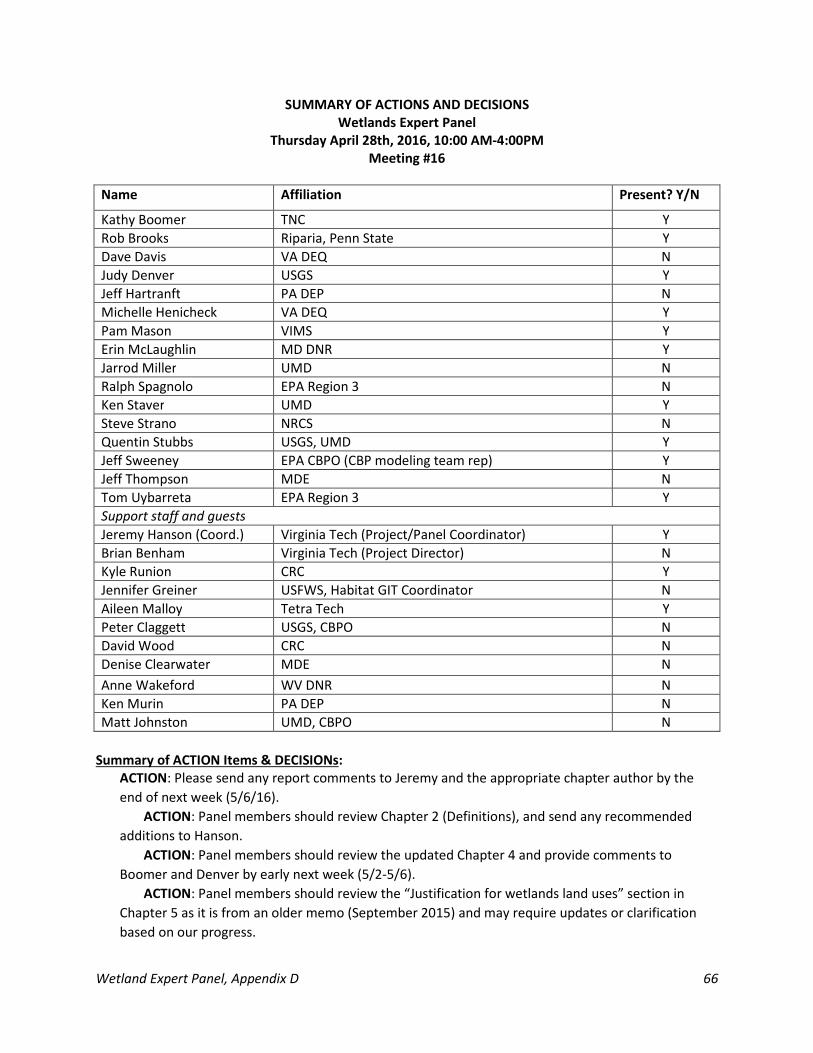
Wetland Expert Panel, Appendix D 66
SUMMARY OF ACTIONS AND DECISIONS
Wetlands Expert Panel
Thursday April 28th, 2016, 10:00 AM-4:00PM
Meeting #16
Name Affiliation Present? Y/N
Kathy Boomer TNC Y
Rob Brooks Riparia, Penn State Y
Dave Davis VA DEQ N
Judy Denver USGS Y
Jeff Hartranft PA DEP N
Michelle Henicheck VA DEQ Y
Pam Mason VIMS Y
Erin McLaughlin MD DNR Y
Jarrod Miller UMD N
Ralph Spagnolo EPA Region 3 N
Ken Staver UMD Y
Steve Strano NRCS N
Quentin Stubbs USGS, UMD Y
Jeff Sweeney EPA CBPO (CBP modeling team rep) Y
Jeff Thompson MDE N
Tom Uybarreta EPA Region 3 Y
Support staff and guests
Jeremy Hanson (Coord.) Virginia Tech (Project/Panel Coordinator) Y
Brian Benham Virginia Tech (Project Director) N
Kyle Runion CRC Y
Jennifer Greiner USFWS, Habitat GIT Coordinator N
Aileen Malloy Tetra Tech Y
Peter Claggett USGS, CBPO N
David Wood CRC N
Denise Clearwater MDE N
Anne Wakeford WV DNR N
Ken Murin PA DEP N
Matt Johnston UMD, CBPO N
Summary of ACTION Items & DECISIONs:
ACTION: Please send any report comments to Jeremy and the appropriate chapter author by the
end of next week (5/6/16).
ACTION: Panel members should review Chapter 2 (Definitions), and send any recommended
additions to Hanson.
ACTION: Panel members should review the updated Chapter 4 and provide comments to
Boomer and Denver by early next week (5/2-5/6).
ACTION: Panel members should review the “Justification for wetlands land uses” section in
Chapter 5 as it is from an older memo (September 2015) and may require updates or clarification
based on our progress.
Wetland Expert Panel, Appendix D 67
ACTION: Panel members will need to help explain the reasoning for why the reduction
efficiencies we are proposing are an improvement to the current Phase 5.3.2 method.
ACTION: If anyone has photos appropriate for the report, please provide them to Hanson.
DECISION: Minutes from the 4/18/16 conference call were approved.
ACTION: Wetland verification guidance figure (contact Clearwater if any edits are necessary) moved
from Chapter 3 to Chapter 6 (Accountability Mechanisms). Table 3.X updated with 2015 annual
progress run.
ACTION: Changed “Freshwater” to “Non-Tidal” in title of Chapter 4.
ACTION: Stubbs will cut the wetland area in Chapter 4, Table 1 to only the watershed.
ACTION: Reformatted Table X of reductions to move the “All except constructed” Wetland type to
the bottom of the table and include those numbers in the below text.
DECISION: Based on geologic features, the panel tentatively agreed on the following Physiographic
Subregions: Coastal Plain Western Shore incised, Coastal Plain Eastern Shore well-drained, Coastal
Plain Eastern poorly-drained, Coastal Plain lowland, Piedmont, and Plateau/Ridge & Valley.
ACTION: Boomer will consult with Greg Noe for review and help with classifying categories for
retention efficiencies.
ACTION: Please complete the NeedToMeet poll for mid-May call.
Welcome and Introduction
DECISION: Minutes from the 4/18/16 conference call were approved.
Overview of current points of agreement and remaining decisions
• During our last call (4/18/16), we tentatively agreed on using wetland reduction values from our
Tetra Tech literature review, excluding constructed wetlands, with no difference between
floodplain and other wetlands. The mean values were chosen: TN 42%, TP 40%, TSS 31%.
o One of the remaining decisions is what area to apply this reduction efficiency to
(watershed:wetland ratio). The current, default value is 1:1, but the panel agreed that
this was generally too low. We have some data from panel members which allowed for
example ratios, which we can review for our Phase 6 recommendations.
• Mason: The work by this panel to create land uses for wetlands for the Phase 6 model and start
to attribute load reduction values will open opportunities for future panels.
o McLaughlin: The high resolution imagery completed for parts of VA and DE is using
forested and emergent classifications for wetlands, which is a cause for concern. They
likely used NWI as a basis, but Stubbs was worried as they were not separating tidal and
non-tidal. He will be asking for comment from the panel, and we should be working with
the workgroups in this modeling work.
Discussion of panel report, remaining tasks, and writing assignments
• Chapter 1: No changes
• Chapter 2: Terms chosen to define are those that may be left to interpretation, or those which
have a specific definition for the panel. Our audience must include the public, so scientific and
technical terms (especially those in Chapter 4) may be later defined in a glossary.
o ACTION: Panel members should review Chapter 2 (Definitions), and send any
recommended additions to Hanson.
Wetland Expert Panel, Appendix D 68
o Glossary definitions should be consistent – USGS may have existing glossaries to use as
starting point.
o The table of wetland creation/restoration/enhancement/rehabilitation definitions will
also be included in Chapter 2.
• Chapter 3: ACTION: Wetland verification guidance figure (contact Clearwater if any edits are
necessary) to be moved to Chapter 6 (Accountability Mechanisms). Table 3.X will be updated
with 2015 annual progress run.
• Chapter 4: Recently updated by Boomer and Denver. The basis of the chapter has not changed,
but some edits and additions were made.
o ACTION: Change “Freshwater” to “Non-Tidal” in title of Chapter 4.
o A summary of the types of wetlands that occur in different physiographic provinces was
added (5th paragraph).
� The classifications made in this paragraph could be merged with table 1 below.
• The wetland acres in this table includes some out of the watershed
areas. Adding a wetland percentage of total area in each physiographic
province would be helpful. ACTION: Stubbs will cut the wetland area in
Chapter 4, Table 1 to only the watershed.
� Brooks: Slope can be a major factor differentiating these provinces. The
unidirectional flow which is mainly a groundwater contribution breaks down in
the coastal plain without geologic contact zones.
• Boomer: A shallower gradient in the coastal plain will lead to slower
flow
o Boomer: In this paragraph we started to lay out biogeochemical processes, but haven’t
quite connected them back to wetland types. This could be expanded on.
o ACTION: Panel members should review the updated Chapter 4 and provide comments
to Boomer and Denver by early next week (5/2-5/6).
• Chapter 5: Still incomplete and awaiting some of the panel’s decisions.
o We are unsure of the current status of the Pennsylvania wetland mapping project. The
final report is due in August, anticipated in time for the new calibration. This can be
represented in Chapter 5.
o ACTION: Panel members should review the “Justification for wetlands land uses” section
in Chapter 5 as it is from an older memo (September 2015) and may require updates or
clarification based on our progress.
o Hartranft had comments on the “Wetland BMPs” section, which were incorporated into
the most recent draft summarizing the basis for the Phase 5.3.2 BMP.
o Important to note that wetlands used for Simpson and Weammert study (Phase 5.3.2
model) were mainly constructed.
o ACTION: Panel members will need to help explain the reasoning for why the reduction
efficiencies we are proposing are more accurate than the current method.
o Boomer: Breaking down our table by wetland type and physiographic province will show
the importance of landscape setting. How we can populate this table will provide
evidence of our research limitations.
o ACTION: Reformat Table X of reductions to move the “All except constructed” Wetland
type to the bottom of the table and include those numbers in the below text.
Wetland Expert Panel, Appendix D 69
o Boomer: Supports Denver’s idea of developing a table with an array of wetland type by
region and assigning high/medium/low retention capacity with specified retention
percentage ranges. A basis for assigning that range will be provided from the literature.
� Staver: Another idea is to provide a default credit and then offer higher levels of
credit with data provided to increase efficiency. This will help steer
management toward collecting that data.
• Hanson will review entire document to make formatting and layout more consistent; he will
hand off to Aileen for Tetra Tech to do more thorough editing for consistency through the whole
report.
Discussion of default upslope acres for Phase 6 wetland restoration BMP
• ACTION: If anyone has photos appropriate for the report, please provide them to Hanson.
• The goal of the afternoon portion of the meeting is to work towards defining a recommended
wetland:watershed ratio for which projects receive credit if they do not report the drainage
area.
o Panelists sent in a total of 69 usable sites for Hanson to review watershed:wetland
ratios.
� Data was analyzed both including and excluding the ratio while including the
wetland area in the watershed (drainage) area. There was a minor change, and
including this conflicts with past calculations (Jordan).
� The implied upslope acres per acre of wetland restored (watershed:wetland
ratio) came out to for the be 2 for the Coastal Plain, 4 for the Piedmont, and 8
for the Appalachian Plateau and Ridge & Valley.
o The physiographic regions should be divided into subregions in order to accurately
define retention efficiencies and acres treated.
� Denver: The Coastal Plain is extremely non-uniform, so this is especially
important to separate.
� Sweeney: This is mappable by county reported. We can classify down to
coordinates, so any additional information given, such as HUC-10 is helpful, but
the minimum data we receive is the county in which the project took place.
• Boomer: Could be classified by land-river segments.
� DECISION: Based on geologic features, the panel tentatively agreed on the
following Physiographic Subregions: Coastal Plain Western Shore incised,
Coastal Plain Eastern Shore well-drained, Coastal Plain Eastern poorly-drained,
Coastal Plain lowland, Piedmont, and Plateau/Ridge & Valley.
• Denver: Depressional wetlands should only receive the wetland acreage
for nitrogen as most of the nitrogen is focused in groundwater, and the
water table is not sufficiently interacting with the wetland to remove
nitrates. The only substantial nitrogen effect is where the reduction of
fertilizer application takes place.
o Nitrogen moves by groundwater (subsurface process) and,
overall in the Piedmont and Coastal Plain, the removal will be
variable. This is where a Low/Medium/High rate of removal will
Wetland Expert Panel, Appendix D 70
help. Phosphorus and sediment are simpler as they are surface
processes.
o McLaughlin: A 1:1 ratio for nitrogen fits here. Phosphorus
should have a 2:1 ratio based on surface features.
• Denver: Lowland needs to be separated as they tend to be finer
textured, with very little groundwater interaction. Poorly drained
uplands are on the drainage divide for the Chesapeake with a sandy
subsurface. Well drained also occur on the eastern shore in stream
valleys.
• Denver/Boomer: Nitrogen efficiencies for the Coastal Plain western
shore will be high as stream incisions cut through the aquifers. Nitrogen
efficiencies for Coastal Plain eastern shore well drained will be lower for
nitrogen removal as there is a better opportunity for transport due to
slope (low retention time). Nitrogen efficiencies for Coastal Plain
eastern shore poorly drained will be medium because much of the
organic matter that traps nitrogen is removed in this region. Nitrogen
efficiencies for Piedmont is medium because of often erosion/incision in
the stream in this region. Nitrogen efficiencies for the Coastal Plain
lowland will be medium/high because of the low flow volume and high
efficiency of nutrient reduction.
• Floodplain TN is set at medium and TP/TSS at high as a default.
o Piedmont: a combination of high stream incision (lower
interaction) and the angle of flow interaction led to the nitrogen
efficiency being medium.
• Phosphorus and sediment can generally be tracked together, unless
otherwise stated. General topography led to TP and TSS removal being
medium in other wetlands and high in floodplain wetlands.
o Acres treated are taken from Hanson’s project review.
� Coastal Plain eastern shore poorly drained and lowland should have a
watershed:wetland ratio (acres treated) of 1 because of the low slope.
� Coastal Plain western shore incised and eastern shore well drained (besides
west TN) will follow the ratios found in Hanson’s review.
• TN for Coastal Plain western shore incised is treated similar to the
Piedmont because of a higher slope.
� Floodplain acres tested are double of other as a placeholder.
• These wetlands are receiving the baseflow delivery as well as a storm
pulse – justification for doubling these numbers.
o Staver: Could back this up using per acre trapping rates for
floodplain wetlands (discussed in a previous call).
• Panel should remember that “Floodplain” wetlands also include those
wetlands within a certain distance of the stream, not just those directly
adjacent.
• McLaughlin: This will provide more justification for projects to be sited
in floodplain locations, which would be a negative consequence of
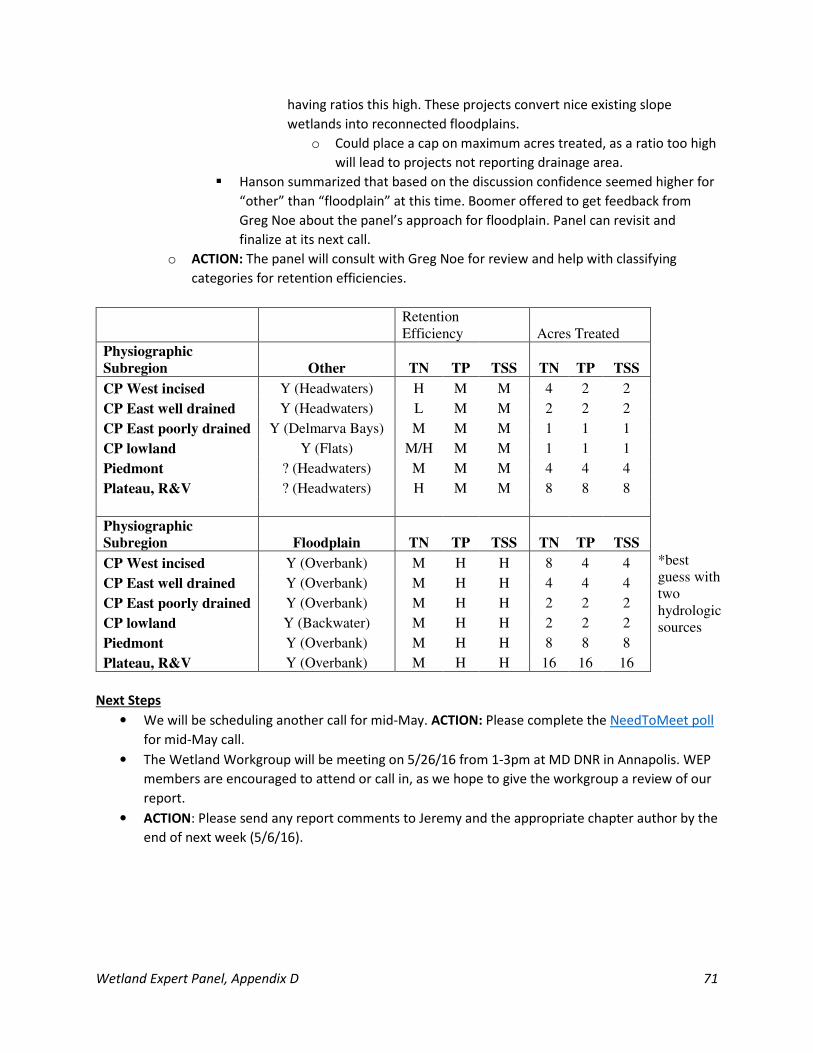
Wetland Expert Panel, Appendix D 71
having ratios this high. These projects convert nice existing slope
wetlands into reconnected floodplains.
o Could place a cap on maximum acres treated, as a ratio too high
will lead to projects not reporting drainage area.
� Hanson summarized that based on the discussion confidence seemed higher for
“other” than “floodplain” at this time. Boomer offered to get feedback from
Greg Noe about the panel’s approach for floodplain. Panel can revisit and
finalize at its next call.
o ACTION: The panel will consult with Greg Noe for review and help with classifying
categories for retention efficiencies.
Retention
Efficiency Acres Treated
Physiographic
Subregion Other TN TP TSS TN TP TSS
CP West incised Y (Headwaters) H M M 4 2 2
CP East well drained Y (Headwaters) L M M 2 2 2
CP East poorly drained Y (Delmarva Bays) M M M 1 1 1
CP lowland Y (Flats) M/H M M 1 1 1
Piedmont ? (Headwaters) M M M 4 4 4
Plateau, R&V ? (Headwaters) H M M 8 8 8
Physiographic
Subregion Floodplain TN TP TSS TN TP TSS
CP West incised Y (Overbank) M H H 8 4 4 *best
guess with
two
hydrologic
sources
CP East well drained Y (Overbank) M H H 4 4 4
CP East poorly drained Y (Overbank) M H H 2 2 2
CP lowland Y (Backwater) M H H 2 2 2
Piedmont Y (Overbank) M H H 8 8 8
Plateau, R&V Y (Overbank) M H H 16 16 16
Next Steps
• We will be scheduling another call for mid-May. ACTION: Please complete the NeedToMeet poll
for mid-May call.
• The Wetland Workgroup will be meeting on 5/26/16 from 1-3pm at MD DNR in Annapolis. WEP
members are encouraged to attend or call in, as we hope to give the workgroup a review of our
report.
• ACTION: Please send any report comments to Jeremy and the appropriate chapter author by the
end of next week (5/6/16).
Wetland Expert Panel, Appendix D 72
SUMMARY OF ACTIONS AND DECISIONS
Wetlands Expert Panel
Monday May 16th, 2016, 10:00 AM-4:00PM
Meeting #17
Name Affiliation Present? Y/N
Kathy Boomer TNC N
Rob Brooks Riparia, Penn State N
Dave Davis VA DEQ N
Judy Denver USGS N
Jeff Hartranft PA DEP Y
Michelle Henicheck VA DEQ N
Pam Mason VIMS Y
Erin McLaughlin MD DNR Y
Jarrod Miller UMD Y
Ralph Spagnolo EPA Region 3 Y
Ken Staver UMD Y
Steve Strano NRCS Y
Quentin Stubbs USGS, UMD N
Jeff Sweeney EPA CBPO (CBP modeling team rep) Y
Jeff Thompson MDE N
Tom Uybarreta EPA Region 3 Y
Support staff and guests
Jeremy Hanson (Coord.) Virginia Tech (Project/Panel Coordinator) Y
Brian Benham Virginia Tech (Project Director) N
Kyle Runion CRC Y
Jennifer Greiner USFWS, Habitat GIT Coordinator N
Aileen Malloy Tetra Tech Y
Peter Claggett USGS, CBPO N
David Wood CRC N
Denise Clearwater MDE Y
Anne Wakeford WV DNR N
Ken Murin PA DEP N
Summary of ACTION Items & DECISIONs:
• ACTION: Boomer and Denver will clearly define the physiographic subregions and provide logic
for the proposed efficiencies in Chapters 2 and 5, respectively.
• ACTION: Hanson will touch base with Denver and Stubbs regarding a map of the subregions.
• ACTION: Hanson will check with Boomer and Denver regarding feedback from Greg Noe on
retention efficiency and acres treated in the developed table.
• ACTION: Panelists should provide comments and edits to the report by 5/20. Please use the
SharePoint link, distributed by Hanson, if possible. Otherwise, use the version distributed by
Hanson on 5/13 to make edits using track changes.
Wetland Expert Panel, Appendix D 73
• ACTION: Panelists should make every effort to attend or call in to the Wetland Workgroup’s
meeting on 5/26 as the workgroup will be reviewing and asking questions about the report.
Hanson will give key highlights and major points of the report, but other panelists must be
available to answer questions. Another meeting may be held in June for approval of the report.
o ACTION: McLaughlin will follow up with Greiner regarding the role of those who are on
both the expert panel and the workgroup.
Welcome and Introduction
• Minutes from the 4/28 meeting were distributed on 4/29. Any comments or edits should be
sent to Runion and Hanson by 5/20.
Minutes
• The main product of our last meeting was the “Wetland Retention and Acres by Physiographic
Subregion” where six physiographic subregions were developed, retention efficiencies were
assigned as high, medium, or low, and an acres treated ratio was developed for each.
o Some titles are unclear in a wetland sense, such as incised and well-drained.
� ACTION: Boomer and Denver will clearly define the physiographic subregions
and provide logic for the proposed efficiencies in Chapters 2 and 5, respectively.
� ACTION: Hanson will touch base with Denver and Stubbs regarding a map of the
subregions.
o ACTION: Hanson will check with Boomer and Denver regarding feedback from Greg Noe
on retention efficiency and acres treated in the developed table.
� Currently the Floodplain category is doubled in the acres treated section to
account for both hydrologic sources: groundwater and surface flow.
• Clearwater: Explanation for why certain studies were considered but excluded from the
literature review should be provided.
• In “Option for combining mean nutrient and TSS removals with panel BMP framework”
document, Hanson laid out a summary of means from the Tetra Tech literature review to
provide preliminary options for the high, medium, and low retention efficiencies. This Table 1
needs to be refined into Table 2, ideally with input from another expert such as Noe.
• Staver: Substantiating our findings with past work may help during the review process.
o Mason: The 1:1 ratio used with the Jordan equations were a placeholder based on the
best available science. The data we have mined of watershed ratios gives us better
available science and has more merit in being included in the Watershed Model. This fits
the adaptive management approach that the Chesapeake Bay Program is following.
• Hanson: For most BMPs that are entered in the scenario builder, there is one element to
calculate reduction. For example, in the Phase 5 BMP, the reported wetland area determines
the area of land use change and treated acreage using the 1:1 default ratio. The issue is if we ask
them to report drainage and wetland area, there are then two elements necessary to calculate
the reduction in Scenario Builder, meaning that the drainage area determines the upland area
treated by the BMP efficiency while the wetland area determines the area for the land use
change. This can be done, but modelers will need notice in order to code this into the tools; only
other BMP that uses more than one element is stormwater performance standards. Our options
Wetland Expert Panel, Appendix D 74
are to either just have it as a land use change, or have a default ratio for upland acres regardless
of whether or not the drainage area is reported.
o Sweeney: No reporting agency has ever asked us to accommodate the need to report
the area of the wetland and the treated area (in 5-7 years). The model can
accommodate this, but having never had to do so, it may be unlikely that we will in the
future.
� McLaughlin: The information is available, as they have the numbers when
designing projects but it is never reported.
• Mason: The Bay Program has an opportunity to include this information
going forward so we can continue to improve how wetland BMPs are
managed with regards to water quality.
• ACTION: Panelists should provide comments and edits to the report by 5/20. Please use the
SharePoint link, distributed by Hanson, if possible. Otherwise, use the version distributed by
Hanson on 5/13 to make edits using track changes.
o Hanson would like the draft report finished and distributed to the partnership by COB
6/14. The report will be changing throughout the review period, but it must be at a
near-final stage by this date. The following appendices are still needed for addition to
the report: glossary, minutes, Tetra Tech literature reviews (2), scenario builder
technical appendix, and a BMP protocol checklist.
o The verification guidance flowchart could be updated. Clearwater or Greiner may have
the original (currently an image in report).
• ACTION: Panelists should make every effort to attend or call in to the Wetland Workgroup’s
meeting on 5/26 as the workgroup will be reviewing and asking questions about the report.
Hanson will give key highlights and major points of the report, but other panelists must be
available to answer questions. Another meeting may be held in June for approval of the report.
o ACTION: McLaughlin will follow up with Greiner regarding the role of those who are on
both the expert panel and the workgroup.
• Hanson: As this panel is running short on time, wetland creation can be a land use change and
credit will be assigned at a 1:1 area treatment.
o McLaughlin: With the long time to establish function, creation should not be given the
same efficiencies.
Adjourned
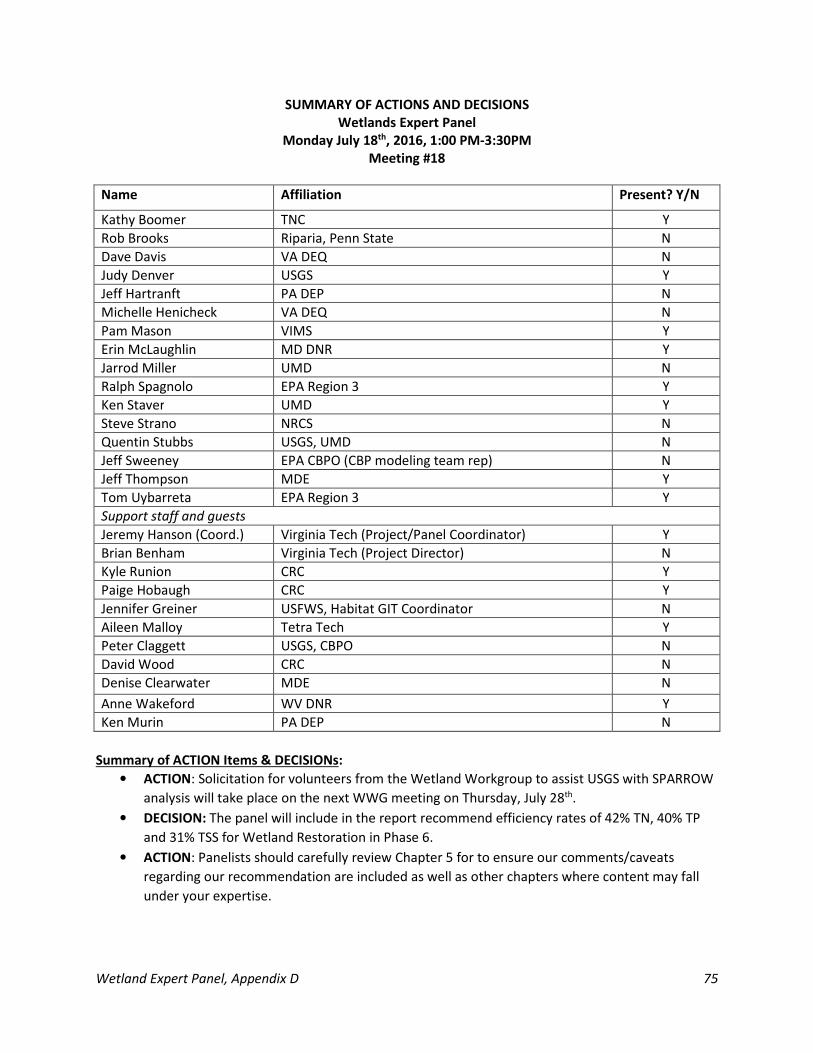
Wetland Expert Panel, Appendix D 75
SUMMARY OF ACTIONS AND DECISIONS
Wetlands Expert Panel
Monday July 18th, 2016, 1:00 PM-3:30PM
Meeting #18
Name Affiliation Present? Y/N
Kathy Boomer TNC Y
Rob Brooks Riparia, Penn State N
Dave Davis VA DEQ N
Judy Denver USGS Y
Jeff Hartranft PA DEP N
Michelle Henicheck VA DEQ N
Pam Mason VIMS Y
Erin McLaughlin MD DNR Y
Jarrod Miller UMD N
Ralph Spagnolo EPA Region 3 Y
Ken Staver UMD Y
Steve Strano NRCS N
Quentin Stubbs USGS, UMD N
Jeff Sweeney EPA CBPO (CBP modeling team rep) N
Jeff Thompson MDE Y
Tom Uybarreta EPA Region 3 Y
Support staff and guests
Jeremy Hanson (Coord.) Virginia Tech (Project/Panel Coordinator) Y
Brian Benham Virginia Tech (Project Director) N
Kyle Runion CRC Y
Paige Hobaugh CRC Y
Jennifer Greiner USFWS, Habitat GIT Coordinator N
Aileen Malloy Tetra Tech Y
Peter Claggett USGS, CBPO N
David Wood CRC N
Denise Clearwater MDE N
Anne Wakeford WV DNR Y
Ken Murin PA DEP N
Summary of ACTION Items & DECISIONs:
• ACTION: Solicitation for volunteers from the Wetland Workgroup to assist USGS with SPARROW
analysis will take place on the next WWG meeting on Thursday, July 28th.
• DECISION: The panel will include in the report recommend efficiency rates of 42% TN, 40% TP
and 31% TSS for Wetland Restoration in Phase 6.
• ACTION: Panelists should carefully review Chapter 5 for to ensure our comments/caveats
regarding our recommendation are included as well as other chapters where content may fall
under your expertise.
Wetland Expert Panel, Appendix D 76
• ACTION: Boomer and Denver will provide strawman of table 2 adjusted for 7/22, 9-10:30 am call
for discussion and vote. The updated Chapter 4 and the slides from this meeting will be
distributed.
Welcome and Introduction
• Since our last call, we have updated Chapters 4 and 5. Kathy, Judy, and Pam have worked to
complete the recommendations, which we will vote on today. Chapters 1-3 and 6-8 remain
largely the same. Remaining appendices are to be completed by Jeremy with help from other
CBPO staff as needed.
Minutes
• The USGS SPARROW timeframe will be too late for this panel. The Wetland Workgroup may be
able to work with USGS on setting up the SPARROW analysis and coming back to the partnership
with an analysis, which may or may not have implications for the Phase 6 Watershed model.
ACTION: Solicitation for volunteers from the WWG will take place on the next WWG meeting on
Thursday, July 28th.
• Kathy explained the framework that she and Judy had worked on since the last call. Wetland
water quality effect is largely based on the strength of the source, size of contributing area, and
likelihood of bypass could be linked to acres treated. Wetland types were characterized by
geological occurrence within each physiographic province (Blue Ridge and Karst terrain added).
o Ratings (high/medium/low) were given for each wetland type that occurred in each
physiographic province for likelihood of both elevated contaminant supply rate and
hydrologic contact. Analysis attempts to include watershed position within
physiographic provinces for each type of wetland. These ratings are available in the
“Efficiency recommendations” powerpoint (distributed, email [email protected] for
access).
• Staver: Worry that reported acres may include the buffer area, inflating the number of acres.
o McLaughlin: MD DNR is careful about separating the buffer since that acreage could be
reported as a separate BMP, but not sure this is the case everywhere. The projects used
for our upland acre assessment were reported appropriately regarding buffers.
• Boomer: In support of breaking out removal rates into categories of floodplain and other with
physiographic regions. The acres treated data is lacking. Examining the distribution of wetlands
within a physiographic province and key drivers behind that distribution can give a relative size
of contributing area that you can expect those wetlands to treat. This may give a more accurate
and appropriate measure than the limited dataset we have used.
o Mason: There is also a lack of data here to tease this out. We previously asked the Bay
Program for modeling to get some numbers here but it didn’t happen.
� Boomer: Recommend that Table 2 be made consistent with Chapter 4 and to
have two columns for floodplain and other wetlands. Floodplain numbers would
be different as those wetlands receive water from both groundwater and
surface flow water. We had “floodplain” acres at double the “other” acres at a
previous meeting, but the panel is not confident in this arbitrary measure. Based
on the high/medium/low assignments, we could assign the current acres
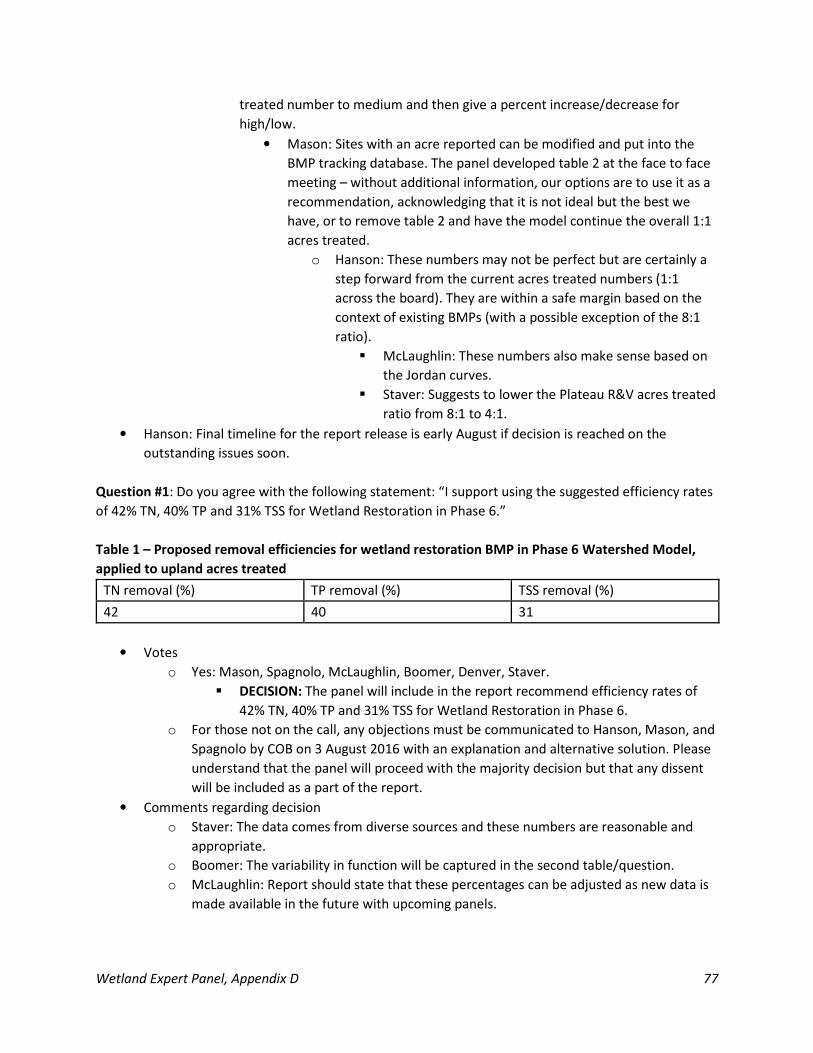
Wetland Expert Panel, Appendix D 77
treated number to medium and then give a percent increase/decrease for
high/low.
• Mason: Sites with an acre reported can be modified and put into the
BMP tracking database. The panel developed table 2 at the face to face
meeting – without additional information, our options are to use it as a
recommendation, acknowledging that it is not ideal but the best we
have, or to remove table 2 and have the model continue the overall 1:1
acres treated.
o Hanson: These numbers may not be perfect but are certainly a
step forward from the current acres treated numbers (1:1
across the board). They are within a safe margin based on the
context of existing BMPs (with a possible exception of the 8:1
ratio).
� McLaughlin: These numbers also make sense based on
the Jordan curves.
� Staver: Suggests to lower the Plateau R&V acres treated
ratio from 8:1 to 4:1.
• Hanson: Final timeline for the report release is early August if decision is reached on the
outstanding issues soon.
Question #1: Do you agree with the following statement: “I support using the suggested efficiency rates
of 42% TN, 40% TP and 31% TSS for Wetland Restoration in Phase 6.”
Table 1 – Proposed removal efficiencies for wetland restoration BMP in Phase 6 Watershed Model,
applied to upland acres treated
TN removal (%) TP removal (%) TSS removal (%)
42 40 31
• Votes
o Yes: Mason, Spagnolo, McLaughlin, Boomer, Denver, Staver.
� DECISION: The panel will include in the report recommend efficiency rates of
42% TN, 40% TP and 31% TSS for Wetland Restoration in Phase 6.
o For those not on the call, any objections must be communicated to Hanson, Mason, and
Spagnolo by COB on 3 August 2016 with an explanation and alternative solution. Please
understand that the panel will proceed with the majority decision but that any dissent
will be included as a part of the report.
• Comments regarding decision
o Staver: The data comes from diverse sources and these numbers are reasonable and
appropriate.
o Boomer: The variability in function will be captured in the second table/question.
o McLaughlin: Report should state that these percentages can be adjusted as new data is
made available in the future with upcoming panels.
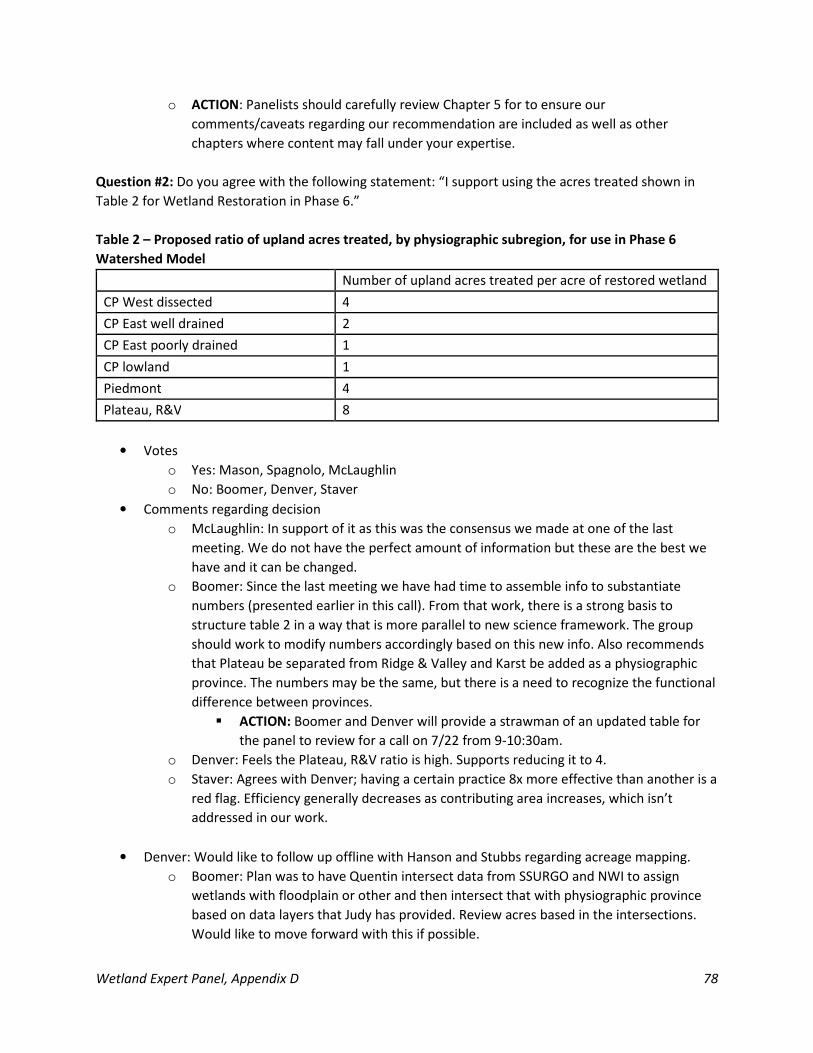
Wetland Expert Panel, Appendix D 78
o ACTION: Panelists should carefully review Chapter 5 for to ensure our
comments/caveats regarding our recommendation are included as well as other
chapters where content may fall under your expertise.
Question #2: Do you agree with the following statement: “I support using the acres treated shown in
Table 2 for Wetland Restoration in Phase 6.”
Table 2 – Proposed ratio of upland acres treated, by physiographic subregion, for use in Phase 6
Watershed Model
Number of upland acres treated per acre of restored wetland
CP West dissected 4
CP East well drained 2
CP East poorly drained 1
CP lowland 1
Piedmont 4
Plateau, R&V 8
• Votes
o Yes: Mason, Spagnolo, McLaughlin
o No: Boomer, Denver, Staver
• Comments regarding decision
o McLaughlin: In support of it as this was the consensus we made at one of the last
meeting. We do not have the perfect amount of information but these are the best we
have and it can be changed.
o Boomer: Since the last meeting we have had time to assemble info to substantiate
numbers (presented earlier in this call). From that work, there is a strong basis to
structure table 2 in a way that is more parallel to new science framework. The group
should work to modify numbers accordingly based on this new info. Also recommends
that Plateau be separated from Ridge & Valley and Karst be added as a physiographic
province. The numbers may be the same, but there is a need to recognize the functional
difference between provinces.
� ACTION: Boomer and Denver will provide a strawman of an updated table for
the panel to review for a call on 7/22 from 9-10:30am.
o Denver: Feels the Plateau, R&V ratio is high. Supports reducing it to 4.
o Staver: Agrees with Denver; having a certain practice 8x more effective than another is a
red flag. Efficiency generally decreases as contributing area increases, which isn’t
addressed in our work.
• Denver: Would like to follow up offline with Hanson and Stubbs regarding acreage mapping.
o Boomer: Plan was to have Quentin intersect data from SSURGO and NWI to assign
wetlands with floodplain or other and then intersect that with physiographic province
based on data layers that Judy has provided. Review acres based in the intersections.
Would like to move forward with this if possible.

Wetland Expert Panel, Appendix D 79
Wrap-Up
• ACTION: Boomer and Denver will provide strawman of table 2 adjusted for 7/22, 9-10:30 am call
for discussion and vote. The updated Chapter 4 and the slides from this meeting will be
distributed.
Adjourned
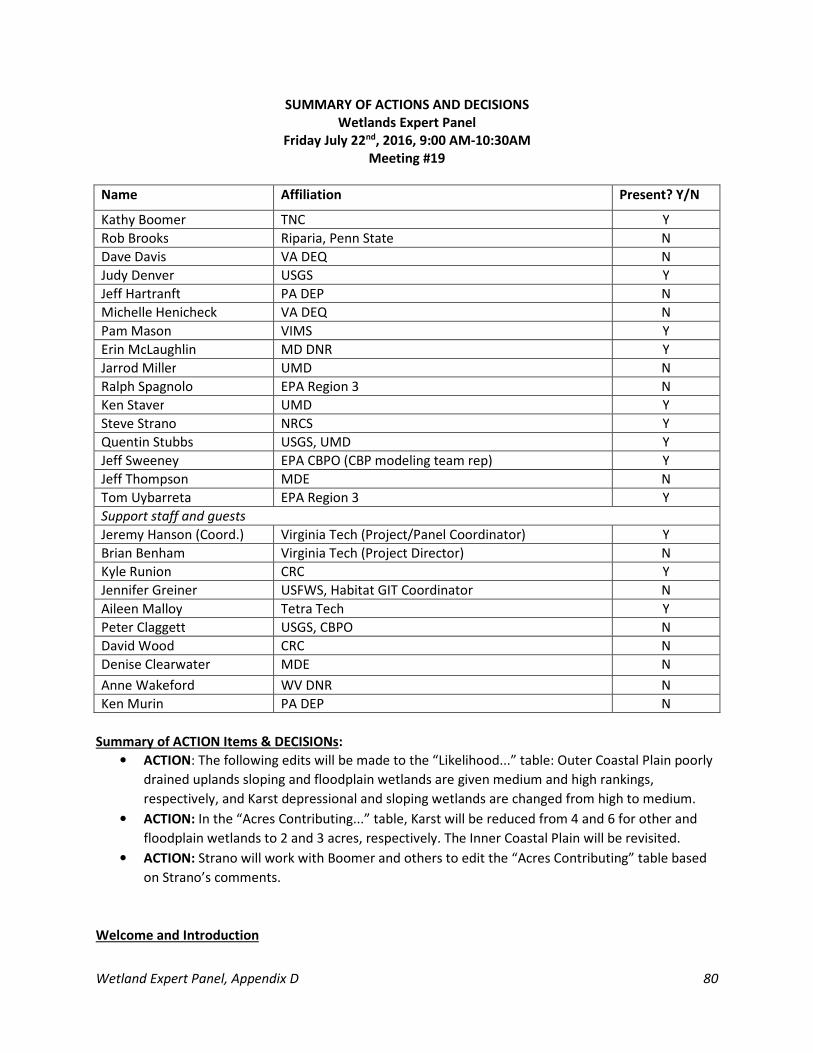
Wetland Expert Panel, Appendix D 80
SUMMARY OF ACTIONS AND DECISIONS
Wetlands Expert Panel
Friday July 22nd, 2016, 9:00 AM-10:30AM
Meeting #19
Name Affiliation Present? Y/N
Kathy Boomer TNC Y
Rob Brooks Riparia, Penn State N
Dave Davis VA DEQ N
Judy Denver USGS Y
Jeff Hartranft PA DEP N
Michelle Henicheck VA DEQ N
Pam Mason VIMS Y
Erin McLaughlin MD DNR Y
Jarrod Miller UMD N
Ralph Spagnolo EPA Region 3 N
Ken Staver UMD Y
Steve Strano NRCS Y
Quentin Stubbs USGS, UMD Y
Jeff Sweeney EPA CBPO (CBP modeling team rep) Y
Jeff Thompson MDE N
Tom Uybarreta EPA Region 3 Y
Support staff and guests
Jeremy Hanson (Coord.) Virginia Tech (Project/Panel Coordinator) Y
Brian Benham Virginia Tech (Project Director) N
Kyle Runion CRC Y
Jennifer Greiner USFWS, Habitat GIT Coordinator N
Aileen Malloy Tetra Tech Y
Peter Claggett USGS, CBPO N
David Wood CRC N
Denise Clearwater MDE N
Anne Wakeford WV DNR N
Ken Murin PA DEP N
Summary of ACTION Items & DECISIONs:
• ACTION: The following edits will be made to the “Likelihood...” table: Outer Coastal Plain poorly
drained uplands sloping and floodplain wetlands are given medium and high rankings,
respectively, and Karst depressional and sloping wetlands are changed from high to medium.
• ACTION: In the “Acres Contributing...” table, Karst will be reduced from 4 and 6 for other and
floodplain wetlands to 2 and 3 acres, respectively. The Inner Coastal Plain will be revisited.
• ACTION: Strano will work with Boomer and others to edit the “Acres Contributing” table based
on Strano’s comments.
Welcome and Introduction
Wetland Expert Panel, Appendix D 81
• On Monday, we voted on questions 1 and 2 (removal efficiencies and upland acres treated
ratios). Question 1 was approved at 42% TN, 40% TP, and 31% TSS. Question 2 was not
approved. Boomer and Denver have worked to provide a revised question 2, which will be
presented today.
Minutes
• Boomer and Denver worked together to develop a new table of upland acres treated ratios
including columns for both floodplain and other wetlands. The framework for this involved
describing wetland distributions by physiographic province and wetland type and then assigning
a quantitative value for likelihood of hydrologic contact with non-point source contaminated
waters. These quantitative values were then translated into an acreage ratio. All descriptions are
available in the “Efficiency recommendations 22June16” file, distributed by Kathy on the
morning of Friday, 7/22.
o “Karst” was added as a physiographic province. Karst areas have a medium/high
potential for contamination and nutrient removal where it occurs within other
provinces.
o “Likelihood of Hydrologic Contact...” table takes into consideration not only size of
contributing area but information of likelihood of impact due to human land
management and potential of through-flow vs bypass. This table provides the reasoning
for the acres treated numbers. A low likelihood will correspond to a lower acres treated
ratio.
� Denver: Outer Coastal Plain – Poorly drained uplands, sloping wetlands should
be given a medium ranking due to the often low contact due to ditches yet high
organic matter. Floodplain in the same province should be listed as high with
large potential for contact. Karst also may have lower contact and should have a
medium ranking in both depressional and sloping wetlands.
� Strano: Suggest to include category of converted wetlands, specifically within
the outer coastal plain poorly drained to address the issue of site selected
restoration projects vs natural placement (which is the basis of this table). Ex.
many restoration projects are placed directly where uptake will occur, so the
low ranking doesn’t accurately describe this.
� ACTION: The following edits will be made to the “Likelihood...” table: Outer
Coastal Plain poorly drained uplands sloping and floodplain wetlands are given
medium and high rankings, respectively, and Karst depressional and sloping
wetlands are changed from high to medium.
o The “Acres Contributing...” table was developed using the previous “Likelihood” table.
Other wetlands with low rankings were assigned 1 acre, high rankings were assigned 4
acres, and medium rankings were assigned 2 acres. Floodplain wetlands were assigned
150% of the other wetland figure within the same physiographic province.
� ACTION: In the “Acres Contributing...” table, Karst will be reduced from 4 and 6
for other and floodplain wetlands to 2 and 3 acres, respectively. The Inner
Coastal Plain will be revisited.
Wetland Expert Panel, Appendix D 82
o Staver: Suggest including a paragraph stating this is a foundation for how wetlands work
in our landscape, this generalizes their position relative to land use to transition into the
discussion of restored hydrology.
• Hanson confirmed with participants that they agreed with the overall framework and approach
described and presented by Boomer. He asked if anyone else had significant concerns or
comments outside of the specific rows or issues raised so far, e.g. by Staver and Strano. Hanson
noted the time and that some of the specifics in the tables still need some additional work in
light of the discussion before a decision can be made, but there is agreement on the general
approach as well as most of the categories. So the panel is making progress and is one step
closer to a decision.
• ACTION: Strano will work with Boomer and others to edit the “Acres Contributing” table based
on Strano’s comments.
Wrap-Up
• After panelists have some time to talk offline and make edits to tables, either a call will be
planned to discuss and vote on approval, or a poll will be distributed to seek approval.
Adjourned
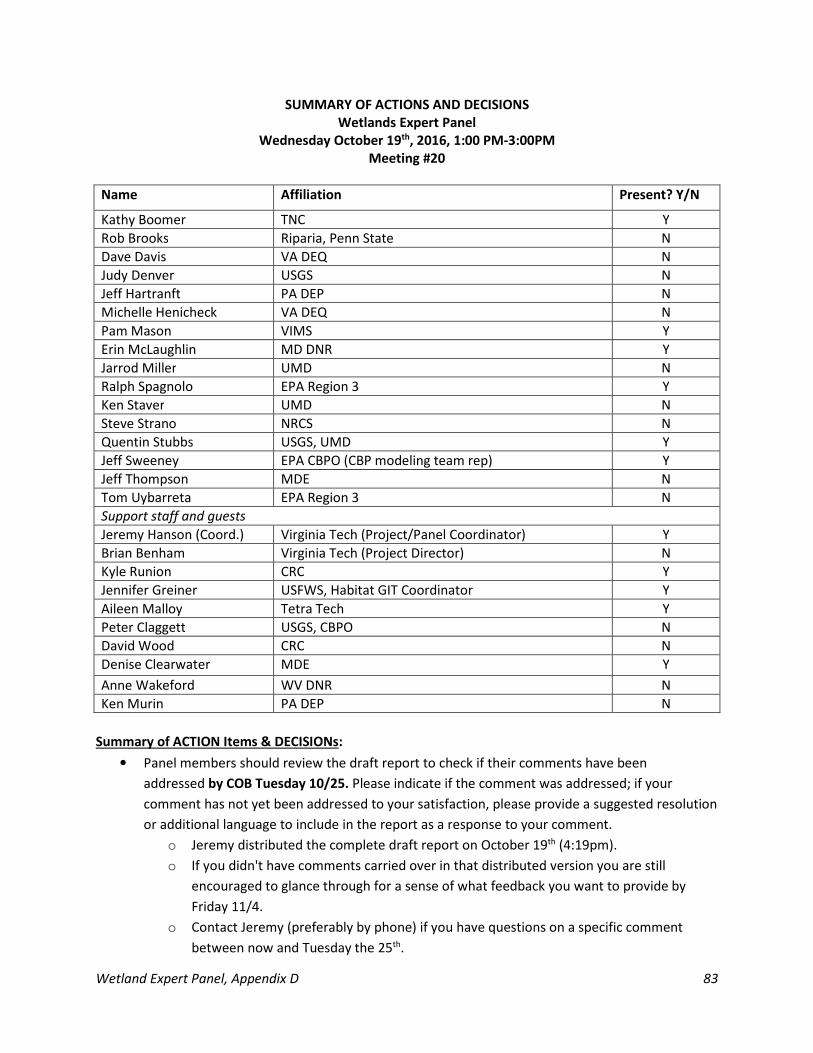
Wetland Expert Panel, Appendix D 83
SUMMARY OF ACTIONS AND DECISIONS
Wetlands Expert Panel
Wednesday October 19th, 2016, 1:00 PM-3:00PM
Meeting #20
Name Affiliation Present? Y/N
Kathy Boomer TNC Y
Rob Brooks Riparia, Penn State N
Dave Davis VA DEQ N
Judy Denver USGS N
Jeff Hartranft PA DEP N
Michelle Henicheck VA DEQ N
Pam Mason VIMS Y
Erin McLaughlin MD DNR Y
Jarrod Miller UMD N
Ralph Spagnolo EPA Region 3 Y
Ken Staver UMD N
Steve Strano NRCS N
Quentin Stubbs USGS, UMD Y
Jeff Sweeney EPA CBPO (CBP modeling team rep) Y
Jeff Thompson MDE N
Tom Uybarreta EPA Region 3 N
Support staff and guests
Jeremy Hanson (Coord.) Virginia Tech (Project/Panel Coordinator) Y
Brian Benham Virginia Tech (Project Director) N
Kyle Runion CRC Y
Jennifer Greiner USFWS, Habitat GIT Coordinator Y
Aileen Malloy Tetra Tech Y
Peter Claggett USGS, CBPO N
David Wood CRC N
Denise Clearwater MDE Y
Anne Wakeford WV DNR N
Ken Murin PA DEP N
Summary of ACTION Items & DECISIONs:
• Panel members should review the draft report to check if their comments have been
addressed by COB Tuesday 10/25. Please indicate if the comment was addressed; if your
comment has not yet been addressed to your satisfaction, please provide a suggested resolution
or additional language to include in the report as a response to your comment.
o Jeremy distributed the complete draft report on October 19th (4:19pm).
o If you didn't have comments carried over in that distributed version you are still
encouraged to glance through for a sense of what feedback you want to provide by
Friday 11/4.
o Contact Jeremy (preferably by phone) if you have questions on a specific comment
between now and Tuesday the 25th.
Wetland Expert Panel, Appendix D 84
• Next Wednesday, Jeremy will remove comments that have been addressed and distribute a
cleaner version of the report on SharePoint and by email for final feedback/comments/edits by
COB Friday November 4th.
o If you're able to access and make edits via Sharepoint, please do so as that will be more
efficient for the group; if not you can email your feedback on the report using track
changes to me and Kyle.
o Ralph asks that members (particularly regulatory folks) read over the unintended
consequences chapter once more for any final feedback by the November 4 deadline.
o Kathy requests members review Chapter 4 to see if there's anything to add.
o Panel members are encouraged to contact each other directly between now and
November 4th regarding technical questions or items as they work on providing
feedback; contact Jeremy with overall or process-related questions.
• Please follow this link to indicate your availability for a call on Wednesday November 9th to
discuss final comments and edits before report becomes final. Please provide your
availability by COB Tuesday, 10/25.
• Following the call on November 9, Jeremy will coordinate with others as needed to resolve any
final revisions before the report undergoes final formatting/editing prior to release to the
partnership. The report will be ready for release no later than Tuesday, November 22.
• At this stage any disagreements from panel members on panel recommendations described in
the report must be provided in writing and then may be included in the report as a dissenting
opinion.
Welcome and Introduction
• The goal for the panel is to have the final report released by Thanksgiving. Specific edits and
language is required from panel members. We have developed a timeline today to complete this
task.
Minutes
• The Water Quality GIT is meeting October 24-25 and will make a decision regarding deadlines
for full approval of BMP panels, including ours.
• On September 15th, the Wetland Workgroup approved our preliminary results, allowing for the
framework to be included in the most recent beta version of the Watershed Model. Minutes
and other materials from that meeting are available online.
• Denise: MDE’s caveat was to not include the enhancement and rehabilitation BMPs until we are
certain that the data system has distinct categories for them and they won’t be included with
acreage gains.
o Jeff Sweeney: In the Phase 6 model, you will be able to designate practices with land use
change (restoration and creation) with those that do not (other categories)
• Panel members should review the draft report to check if their comments have been
addressed by COB Tuesday 10/25. Please indicate if the comment was addressed; if your
Wetland Expert Panel, Appendix D 85
comment has not yet been addressed to your satisfaction, please provide a suggested resolution
or additional language to include in the report as a response to your comment.
o Jeremy distributed the complete draft report on October 19th (4:19pm).
o If you didn't have comments carried over in that distributed version you are still
encouraged to glance through for a sense of what feedback you want to provide by
Friday 11/4.
o Contact Jeremy (preferably by phone) if you have questions on a specific comment
between now and Tuesday the 25th.
• Thanks to Quentin we now have a map of the physiographic regions and acreage numbers.
Updated numbers may come in a few weeks as the GIS team is currently running datasets for
each county with the new high resolution land cover data.
• Kathy: It may be helpful to include the spreadsheet of Tetra Tech’s literature reviews in the
appendix for those who want to see the data behind our recommendations.
o Jeremy: The summary tables will certainly be included in the report and the actual
spreadsheets could either be included or be posted somewhere online and referred to
in the report.
• The USGS SPARROW report is yet to come but we are hoping for it in early 2017.
o MD still has a desire to have the report completed.
• Next Wednesday, Jeremy will remove comments that have been addressed and distribute a
cleaner version of the report on SharePoint and by email for final feedback/comments/edits by
COB Friday November 4th.
o If you're able to access and make edits via Sharepoint, please do so as that will be more
efficient for the group; if not you can email your feedback on the report using track
changes to Jeremy and Kyle.
� Ralph asks that members (particularly regulatory folks) read over the
unintended consequences chapter once more for any final feedback by the
November 4 deadline.
� Kathy requests members review Chapter 4 to see if there's anything to add.
� The Chapter 5 BMP section following the discussion of the Phase 5 Model
version requires a review from panel members to ensure it is accurate and
conveys the thoughts of the panel.
o Panel members are encouraged to contact each other directly between now and
November 4th regarding technical questions or items as they work on providing
feedback; contact Jeremy with overall or process-related questions.
• Table 11 will be removed by Jeremy.
• It had been said in a previous call that the Chapter 6 graphic based on wetland BMP reporting
matrix could be updated; if anyone has a more recent graphic, please provide it.
• Table 2 will see some edits based on comments from September Wetland WG meeting.
• The two literature reviews provided by Tetra Tech are Appendices A & B. Appendix C is the
technical appendix for the scenario builder. Appendix D is the meeting minutes. Appendix E is a
Wetland Expert Panel, Appendix D 86
glossary which may need some updates. Appendix F is a BMP checklist which Jeremy will
complete.
• If there are maps that we need to include in the report, the map must be already existing to fit
into our timeline. If it already exists, we may source and cite the map in the report.
• Documents such as the land use memo to the WQ GIT and the preliminary report to the
Wetland WG will not be included – all of this information is already included within the report.
• Please follow this link to indicate your availability for a call on Wednesday November 9th to
discuss final comments and edits before report becomes final. Please provide your
availability by COB Tuesday, 10/25.
• Following the call on November 9, Jeremy will coordinate with others as needed to resolve any
final revisions before the report undergoes final formatting/editing prior to release to the
partnership. The report will be ready for release no later than Tuesday, November 22.
• At this stage any disagreements from panel members on panel recommendations described in
the report must be provided in writing and then may be included in the report as a dissenting
opinion.
Wrap-Up
• Check and provide resolutions to your comments by October 25th
• Complete this NeedToMeet poll by October 25th.
• Jeremy will provide a clean version of the report by November 4th
• November 9th: placeholder for 90 minute call if necessary.
• The report will be released no later than November 22nd.
Adjourned
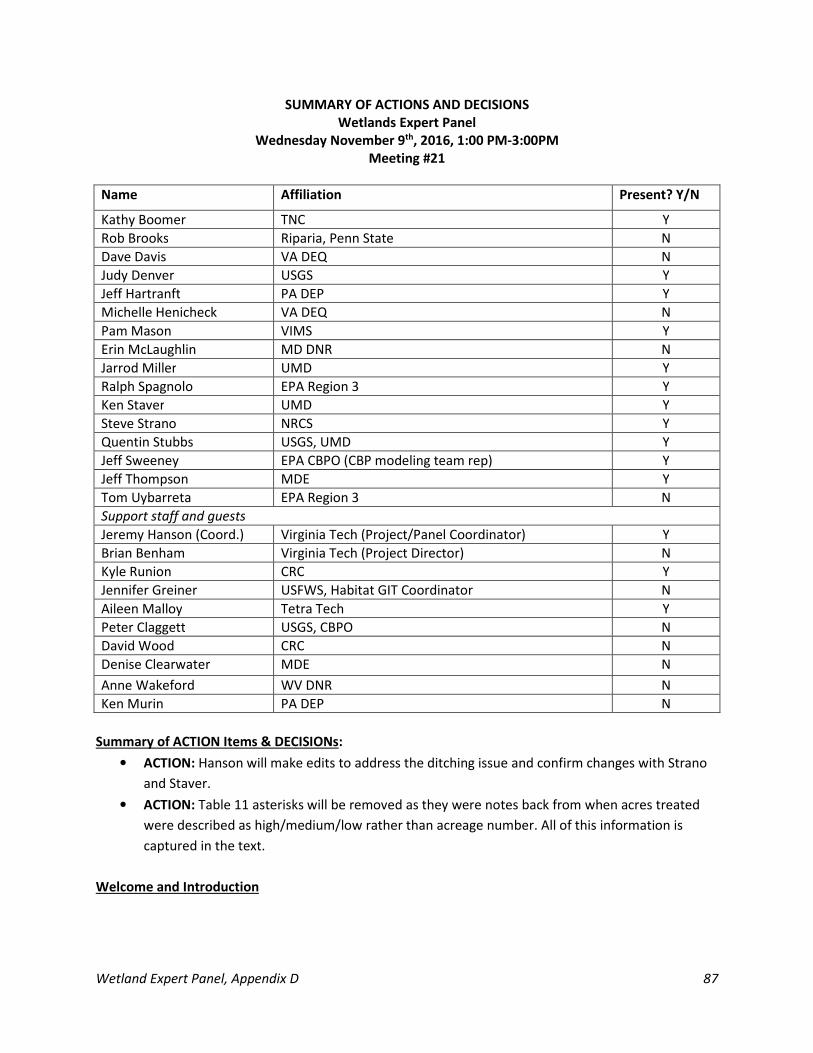
Wetland Expert Panel, Appendix D 87
SUMMARY OF ACTIONS AND DECISIONS
Wetlands Expert Panel
Wednesday November 9th, 2016, 1:00 PM-3:00PM
Meeting #21
Name Affiliation Present? Y/N
Kathy Boomer TNC Y
Rob Brooks Riparia, Penn State N
Dave Davis VA DEQ N
Judy Denver USGS Y
Jeff Hartranft PA DEP Y
Michelle Henicheck VA DEQ N
Pam Mason VIMS Y
Erin McLaughlin MD DNR N
Jarrod Miller UMD Y
Ralph Spagnolo EPA Region 3 Y
Ken Staver UMD Y
Steve Strano NRCS Y
Quentin Stubbs USGS, UMD Y
Jeff Sweeney EPA CBPO (CBP modeling team rep) Y
Jeff Thompson MDE Y
Tom Uybarreta EPA Region 3 N
Support staff and guests
Jeremy Hanson (Coord.) Virginia Tech (Project/Panel Coordinator) Y
Brian Benham Virginia Tech (Project Director) N
Kyle Runion CRC Y
Jennifer Greiner USFWS, Habitat GIT Coordinator N
Aileen Malloy Tetra Tech Y
Peter Claggett USGS, CBPO N
David Wood CRC N
Denise Clearwater MDE N
Anne Wakeford WV DNR N
Ken Murin PA DEP N
Summary of ACTION Items & DECISIONs:
• ACTION: Hanson will make edits to address the ditching issue and confirm changes with Strano
and Staver.
• ACTION: Table 11 asterisks will be removed as they were notes back from when acres treated
were described as high/medium/low rather than acreage number. All of this information is
captured in the text.
Welcome and Introduction
Wetland Expert Panel, Appendix D 88
• The report will be distributed to the partnership on November 23rd. Today’s call will ensure
everyone is up to date on changes and all final comments are addressed. The majority of
comments and edits requiring discussion are in Chapters 4 & 5.
Minutes
• Chapter 4:
o Boomer: Chapter 4 edits did not contain any major changes to the direction of the text.
Figures were more directly tied to the content of the text.
o Box 1 had edits from multiple authors to bridge the gap between Chapter 4’s
physiographic province descriptions and Chapter 5’s land uses/mapping.
� National Elevation Dataset requires citation (Stubbs).
o Staver: Is there a restored wetland inventory to date anywhere? This can help show the
future potential of restored wetlands.
� Boomer: This would be helpful: a table showing current wetlands and which of
those are restored.
� Hanson: We have summarized what was reported in the Phase 5 Watershed
Model under that definition of the “wetland restoration” BMP, and we have the
baseline data from NWI for existing wetlands. The report does include some
language along those lines, which is tied to Strano’s earlier comments about
prior converted wetlands.
• Boomer: This is a good response to make regarding PA DEP’s concern on
how we’re tracking wetland restoration.
� Boomer: Next on our to-do list: capture PA DEP’s concerns and involve this
restored wetland inventory in the section on uncertainties/future direction.
There is some related discussion in Chapter 4. This could either be pulled to the
end of Chapter 4 or put into Chapter 7.
o Strano: In the “Advanced understanding of human impacts...” section, the sentence
starting with “where ditching has lowered the watertable...” should be edited to convey
the conversion of groundwater flow to surface flow paths being the cause of bypass.
� Revision offered: “Ditching lowered the water table, allowing former wetlands
to be farmed and developed. However, the ditching also short-circuited the
natural groundwater and surface flowpaths, resulting in less contact time with,
or even complete bypass of natural wetlands and marshes where processing of
nutrients and trapping of sediments occurs.”
o Staver: The big issue with ditching was that it allows for a bypass of nutrient processing
and creates a potential for a nutrient source in farming. Mentioning this double
whammy issue would strengthen the “Advanced understanding...” section.
� Boomer: The “Across the Bay watershed” sentence could be expanded to
include ditches with channelization and mention that ditching reduces the
interaction between contaminated waters with wetlands.
� Staver: Could also add that are source loads for nutrient inputs” to the “As a
result, many flats...” sentence earlier in this section.
Wetland Expert Panel, Appendix D 89
� ACTION: Hanson will make edits to address the ditching issue and confirm
changes with Strano and Staver.
o Hanson asked if there were any other issues to discuss on Chapter 4; none were raised.
• Chapter 5:
o Boomer: Most of the changes made to Chapter 5 are structural and help make the
chapter parallel the presentation given to the Wetland Workgroup in September,
outlining how we came to the ultimate set of recommendations to estimate wetland
retention function. The chapter begins with an overview of the recommendations and a
summary of key factors considered and follows with land uses, loading rates, and logic
behind our recommendation for wetland restoration loading rates and acres treated
ratios.
� Staver: The mean values used for retention efficiencies are appropriate and
match what expert panels generally report. Fine scale estimation isn’t possible
without fine scale reporting, which hasn’t been provided by the states.
� Mason: The framework created here will be extremely helpful for future panels.
• Staver: During the review period, a major argument may be that the reduction efficiency for all
of the regions is the same. While this is articulated in the report, we should be prepared to
answer questions such as this. The acres treated is biggest difference between Phase 5 and our
recommendations, so this may also be under scrutiny.
• ACTION: Table 11 asterisks will be removed as they were notes back from when acres treated
were described as high/medium/low rather than acreage number. All of this information is
captured in the text.
• Hartranft: The Chapter 6 tracking component, field 8 lists acreage gains for establishment and
reestablishment while these terms have been abandoned by the panel and replaced with
restoration and creation.
o Hanson: Table 2 earlier in the report clarifies these are essentially interchangeable
terms for CBP purposes (i.e. restoration and re-establishment; creation and
establishment). We can add a citation back towards this table to avoid confusion. [viii.
(refer to table 2 for term definitions)]
• Hanson asked if there were any other issues to discuss for Chapter 5 or other parts of the
report; none were raised. He noted that panel members can contact him directly if anything else
comes up following the call. Given the extensive discussions in meetings and offline it seems the
panel has consensus on the major points and logic of the recommendations, with standard
caveats that there is room for improvement in the future.
Wrap-Up
• Hanson noted this is the panel’s final conference call. He thanked everyone for all their time and
effort over the past 2+ years and commended them for the excellent work.
• The Water Quality GIT is holding BMP panels to the end of 2016 deadline for completion. The
review period will be condensed, described below.
Review Period
Wetland Expert Panel, Appendix D 90
• November 23rd: Final Panel Report released for Partnership review
• December 1st-2nd: Webinar to discuss Final Report with the Partnership.
o Wil require assistance from certain panel members to lead the technical aspects of the
report. If you are interested in presenting, please let Hanson know.
• December 7th: All comments due to Hanson, Mason, and Spagnolo
• December 13th: Wetland Workgroup meeting to seek approval of the report (1-3pm)
• December 19th: Water Quality GIT conference call with Habitat GIT to seek final approval of the
report.
Adjourned