Embed Size (px)
Citation preview
38
Appendix C—Fire Behavior and Weather
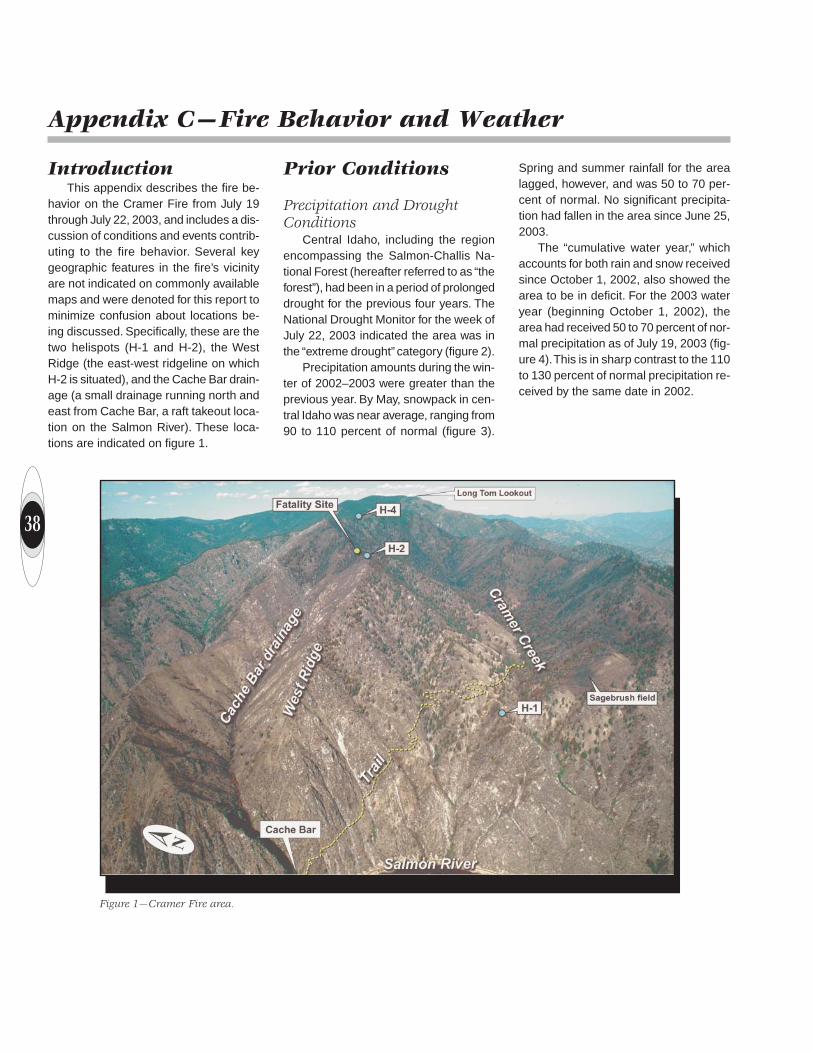
Figure 1—Cramer Fire area.
IntroductionThis appendix describes the fire be-
havior on the Cramer Fire from July 19through July 22, 2003, and includes a dis-cussion of conditions and events contrib-uting to the fire behavior. Several keygeographic features in the fire’s vicinityare not indicated on commonly availablemaps and were denoted for this report tominimize confusion about locations be-ing discussed. Specifically, these are thetwo helispots (H-1 and H-2), the WestRidge (the east-west ridgeline on whichH-2 is situated), and the Cache Bar drain-age (a small drainage running north andeast from Cache Bar, a raft takeout loca-tion on the Salmon River). These loca-tions are indicated on figure 1.
Prior Conditions
Precipitation and DroughtConditions
Central Idaho, including the regionencompassing the Salmon-Challis Na-tional Forest (hereafter referred to as “theforest”), had been in a period of prolongeddrought for the previous four years. TheNational Drought Monitor for the week ofJuly 22, 2003 indicated the area was inthe “extreme drought” category (figure 2).
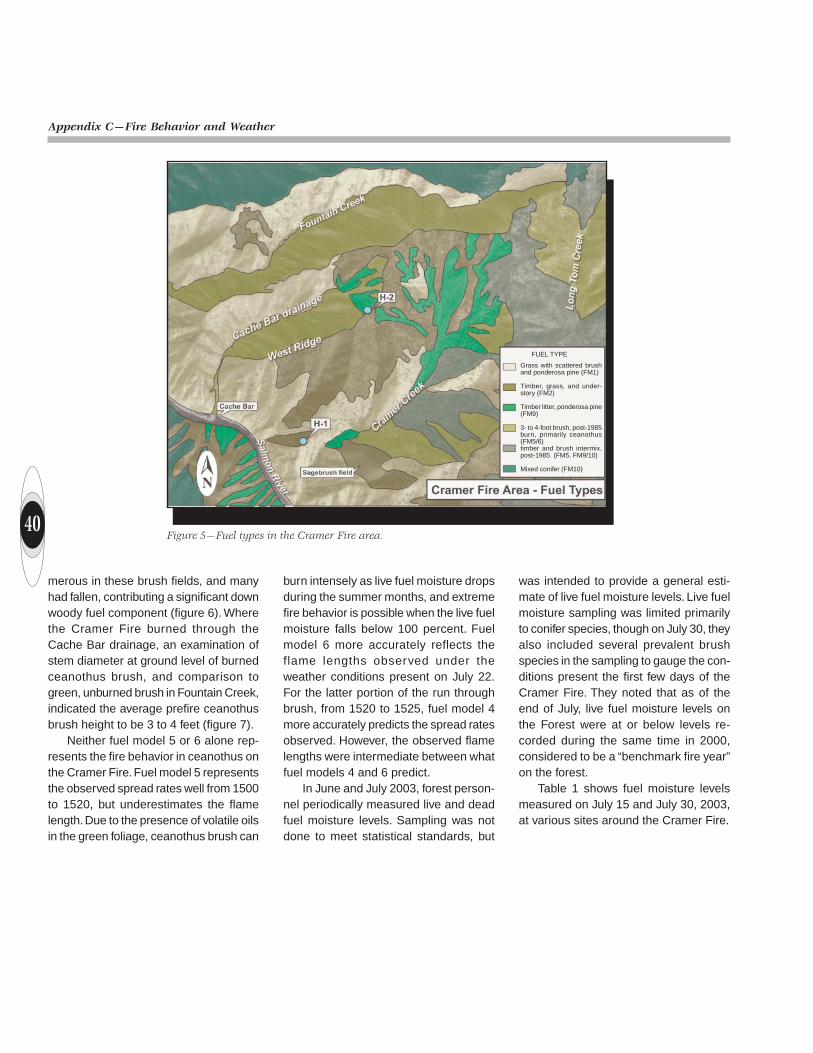
Precipitation amounts during the win-ter of 2002–2003 were greater than theprevious year. By May, snowpack in cen-tral Idaho was near average, ranging from90 to 110 percent of normal (figure 3).
Spring and summer rainfall for the arealagged, however, and was 50 to 70 per-cent of normal. No significant precipita-tion had fallen in the area since June 25,2003.
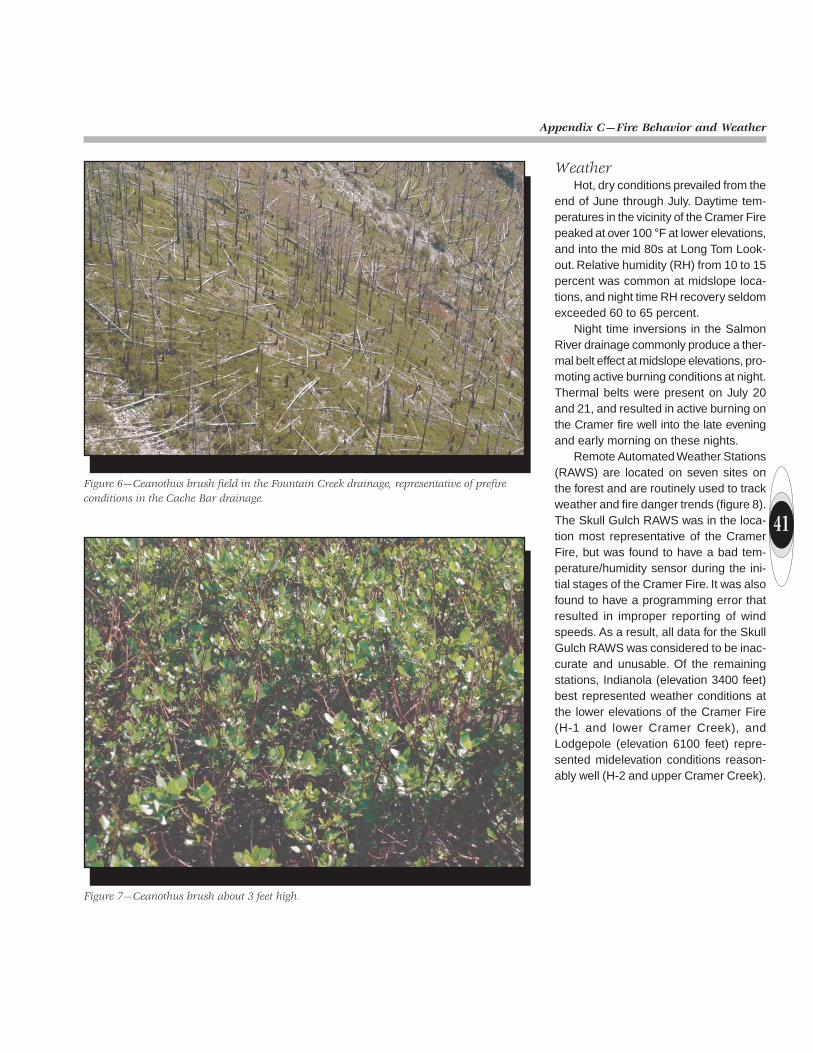
The “cumulative water year,” whichaccounts for both rain and snow receivedsince October 1, 2002, also showed thearea to be in deficit. For the 2003 wateryear (beginning October 1, 2002), thearea had received 50 to 70 percent of nor-mal precipitation as of July 19, 2003 (fig-ure 4). This is in sharp contrast to the 110to 130 percent of normal precipitation re-ceived by the same date in 2002.
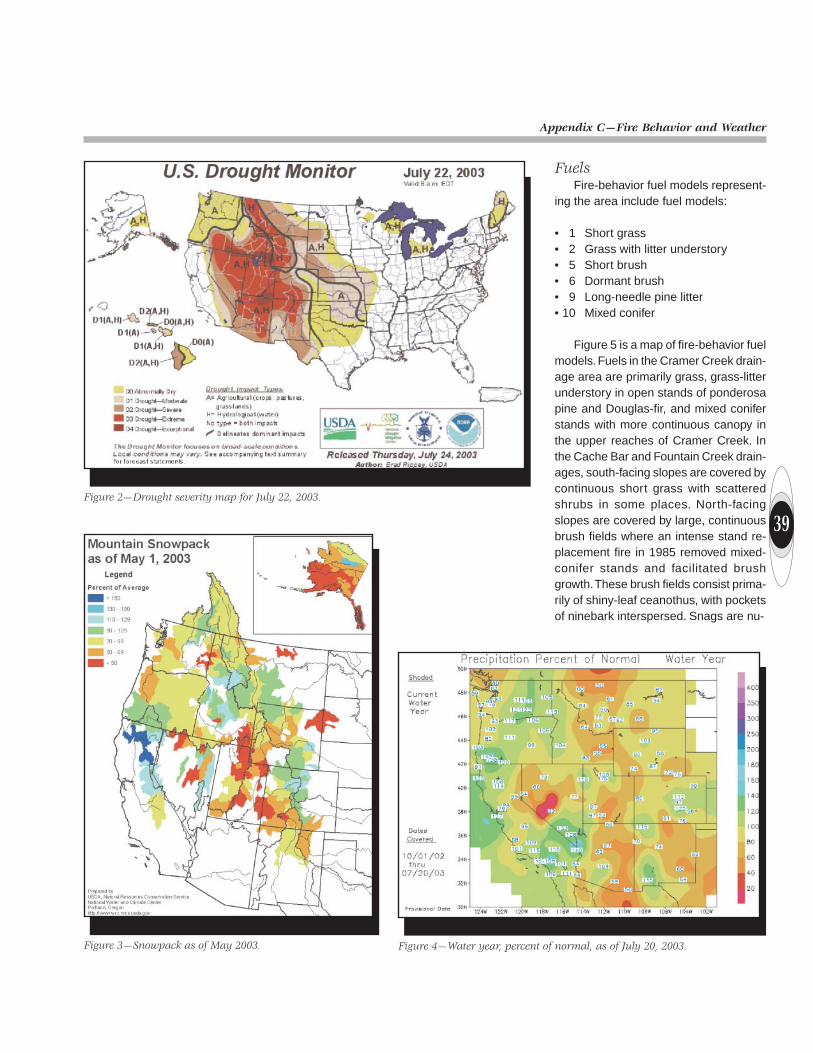
39Figure 2—Drought severity map for July 22, 2003.
Figure 3—Snowpack as of May 2003. Figure 4—Water year, percent of normal, as of July 20, 2003.
FuelsFire-behavior fuel models represent-
ing the area include fuel models:
• 1 Short grass• 2 Grass with litter understory• 5 Short brush• 6 Dormant brush• 9 Long-needle pine litter• 10 Mixed conifer
Figure 5 is a map of fire-behavior fuelmodels. Fuels in the Cramer Creek drain-age area are primarily grass, grass-litterunderstory in open stands of ponderosapine and Douglas-fir, and mixed coniferstands with more continuous canopy inthe upper reaches of Cramer Creek. Inthe Cache Bar and Fountain Creek drain-ages, south-facing slopes are covered bycontinuous short grass with scatteredshrubs in some places. North-facingslopes are covered by large, continuousbrush fields where an intense stand re-placement fire in 1985 removed mixed-conifer stands and facilitated brushgrowth. These brush fields consist prima-rily of shiny-leaf ceanothus, with pocketsof ninebark interspersed. Snags are nu-
Appendix C—Fire Behavior and Weather
40
Appendix C—Fire Behavior and Weather
merous in these brush fields, and manyhad fallen, contributing a significant downwoody fuel component (figure 6). Wherethe Cramer Fire burned through theCache Bar drainage, an examination ofstem diameter at ground level of burnedceanothus brush, and comparison togreen, unburned brush in Fountain Creek,indicated the average prefire ceanothusbrush height to be 3 to 4 feet (figure 7).
Neither fuel model 5 or 6 alone rep-resents the fire behavior in ceanothus onthe Cramer Fire. Fuel model 5 representsthe observed spread rates well from 1500to 1520, but underestimates the flamelength. Due to the presence of volatile oilsin the green foliage, ceanothus brush can
burn intensely as live fuel moisture dropsduring the summer months, and extremefire behavior is possible when the live fuelmoisture falls below 100 percent. Fuelmodel 6 more accurately reflects theflame lengths observed under theweather conditions present on July 22.For the latter portion of the run throughbrush, from 1520 to 1525, fuel model 4more accurately predicts the spread ratesobserved. However, the observed flamelengths were intermediate between whatfuel models 4 and 6 predict.
In June and July 2003, forest person-nel periodically measured live and deadfuel moisture levels. Sampling was notdone to meet statistical standards, but
was intended to provide a general esti-mate of live fuel moisture levels. Live fuelmoisture sampling was limited primarilyto conifer species, though on July 30, theyalso included several prevalent brushspecies in the sampling to gauge the con-ditions present the first few days of theCramer Fire. They noted that as of theend of July, live fuel moisture levels onthe Forest were at or below levels re-corded during the same time in 2000,considered to be a “benchmark fire year”on the forest.
Table 1 shows fuel moisture levelsmeasured on July 15 and July 30, 2003,at various sites around the Cramer Fire.
Figure 5—Fuel types in the Cramer Fire area.
FUEL TYPE
Grass with scattered brushand ponderosa pine (FM1)
Timber, grass, and under-story (FM2)
Timber litter, ponderosa pine(FM9)
3- to 4-foot brush, post-1985burn, primarily ceanothus(FM5/6)timber and brush intermix,post-1985 (FM5, FM9/10)
Mixed conifer (FM10)
41
Appendix C—Fire Behavior and Weather
Figure 6—Ceanothus brush field in the Fountain Creek drainage, representative of prefireconditions in the Cache Bar drainage.
Figure 7—Ceanothus brush about 3 feet high.
WeatherHot, dry conditions prevailed from the
end of June through July. Daytime tem-peratures in the vicinity of the Cramer Firepeaked at over 100 °F at lower elevations,and into the mid 80s at Long Tom Look-out. Relative humidity (RH) from 10 to 15percent was common at midslope loca-tions, and night time RH recovery seldomexceeded 60 to 65 percent.
Night time inversions in the SalmonRiver drainage commonly produce a ther-mal belt effect at midslope elevations, pro-moting active burning conditions at night.Thermal belts were present on July 20and 21, and resulted in active burning onthe Cramer fire well into the late eveningand early morning on these nights.
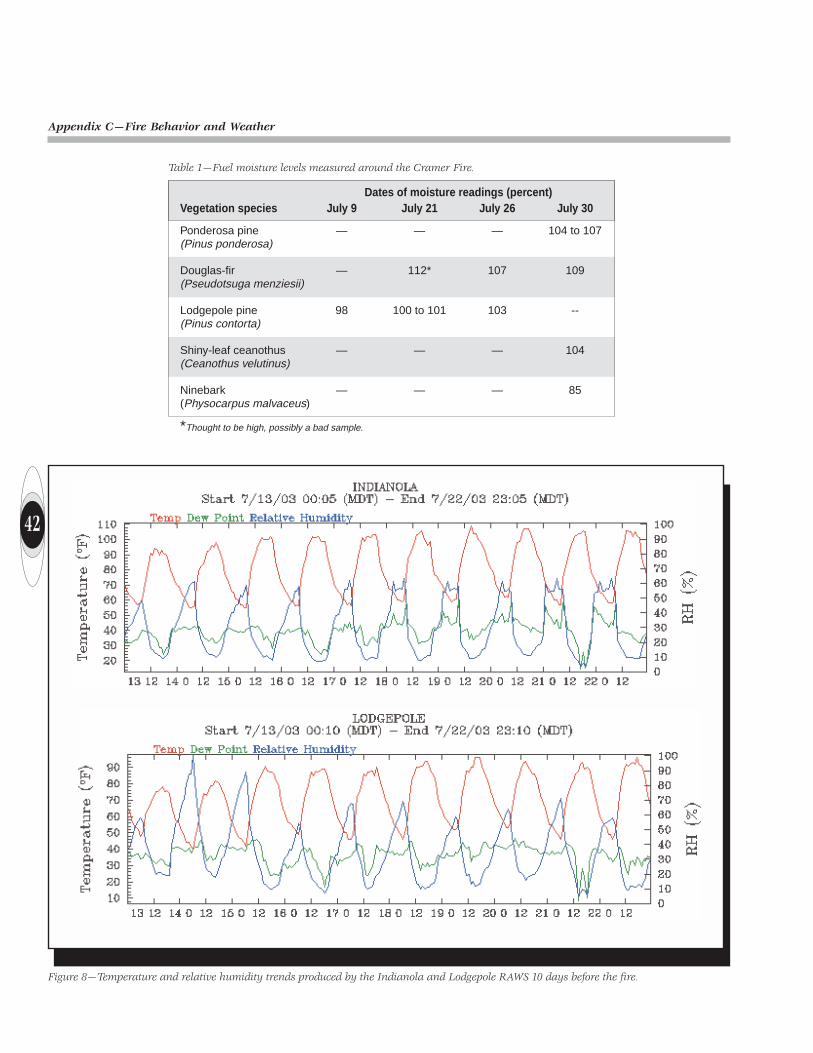
Remote Automated Weather Stations(RAWS) are located on seven sites onthe forest and are routinely used to trackweather and fire danger trends (figure 8).The Skull Gulch RAWS was in the loca-tion most representative of the CramerFire, but was found to have a bad tem-perature/humidity sensor during the ini-tial stages of the Cramer Fire. It was alsofound to have a programming error thatresulted in improper reporting of windspeeds. As a result, all data for the SkullGulch RAWS was considered to be inac-curate and unusable. Of the remainingstations, Indianola (elevation 3400 feet)best represented weather conditions atthe lower elevations of the Cramer Fire(H-1 and lower Cramer Creek), andLodgepole (elevation 6100 feet) repre-sented midelevation conditions reason-ably well (H-2 and upper Cramer Creek).
42
Appendix C—Fire Behavior and Weather
Dates of moisture readings (percent)Vegetation species July 9 July 21 July 26 July 30
Ponderosa pine — — — 104 to 107(Pinus ponderosa)
Douglas-fir — 112* 107 109(Pseudotsuga menziesii)
Lodgepole pine 98 100 to 101 103 --(Pinus contorta)
Shiny-leaf ceanothus — — — 104(Ceanothus velutinus)
Ninebark — — — 85(Physocarpus malvaceus)
*Thought to be high, possibly a bad sample.
Table 1—Fuel moisture levels measured around the Cramer Fire.
Figure 8—Temperature and relative humidity trends produced by the Indianola and Lodgepole RAWS 10 days before the fire.
43
Appendix C—Fire Behavior and Weather
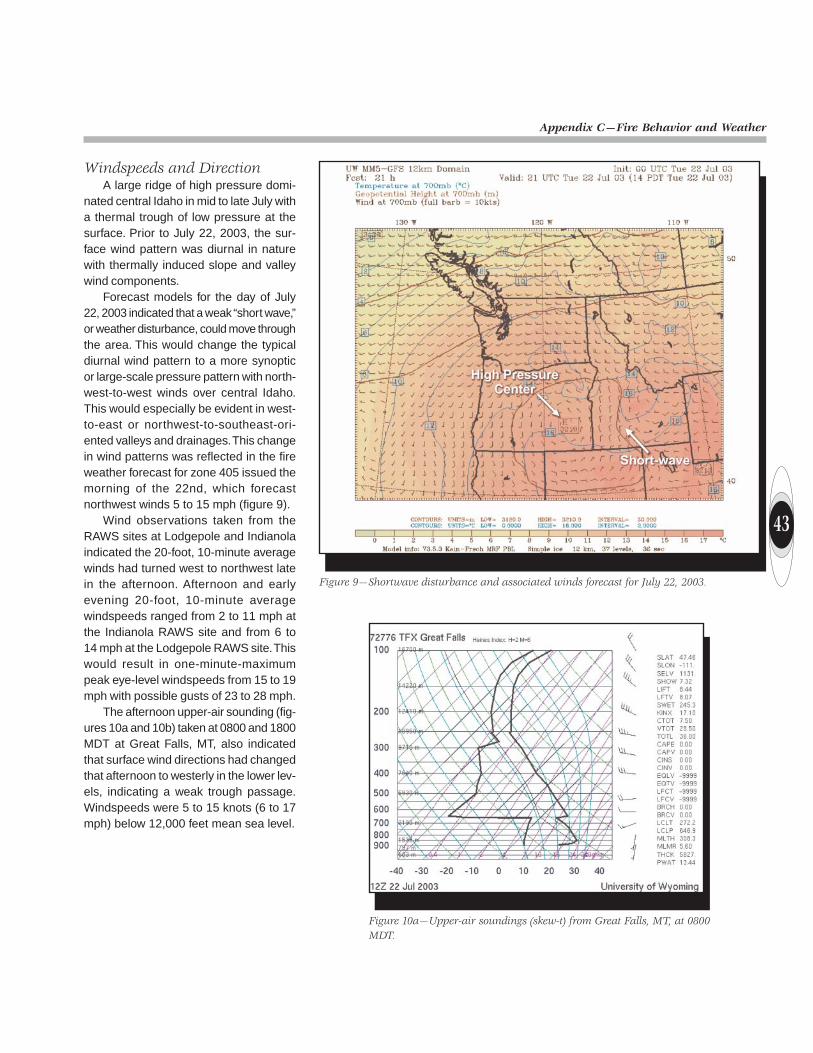
Figure 9—Shortwave disturbance and associated winds forecast for July 22, 2003.
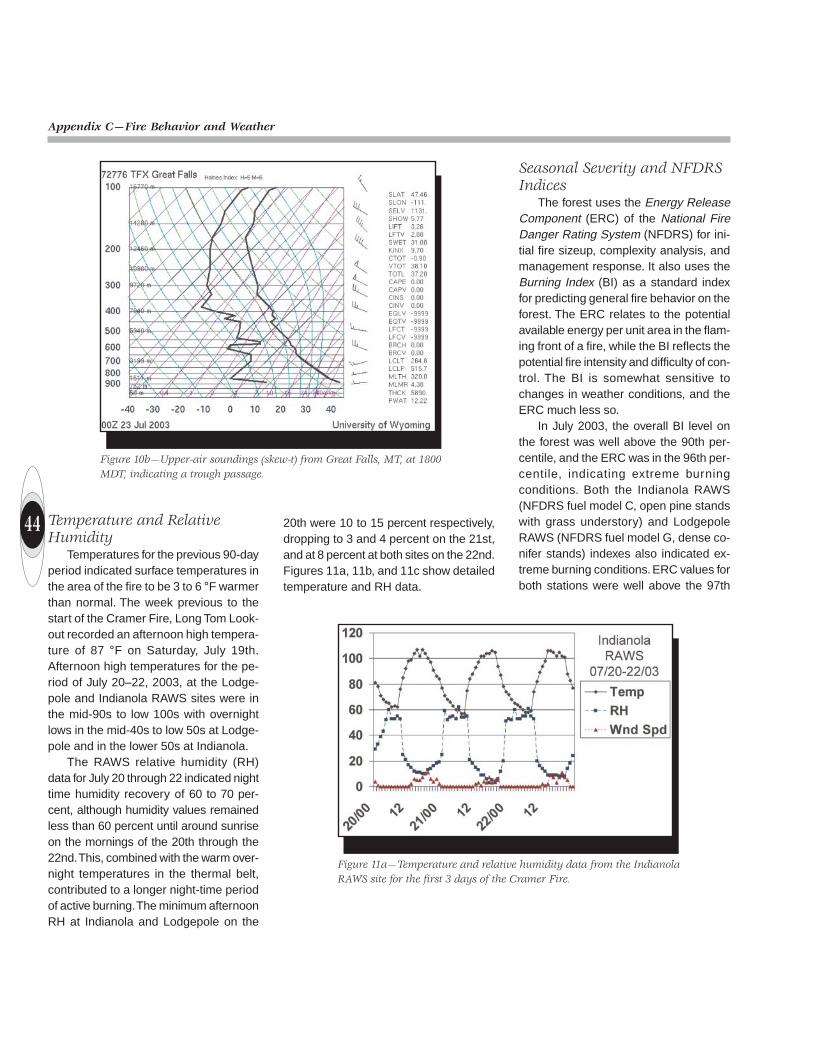
Figure 10a—Upper-air soundings (skew-t) from Great Falls, MT, at 0800MDT.
Windspeeds and DirectionA large ridge of high pressure domi-
nated central Idaho in mid to late July witha thermal trough of low pressure at thesurface. Prior to July 22, 2003, the sur-face wind pattern was diurnal in naturewith thermally induced slope and valleywind components.
Forecast models for the day of July22, 2003 indicated that a weak “short wave,”or weather disturbance, could move throughthe area. This would change the typicaldiurnal wind pattern to a more synopticor large-scale pressure pattern with north-west-to-west winds over central Idaho.This would especially be evident in west-to-east or northwest-to-southeast-ori-ented valleys and drainages. This changein wind patterns was reflected in the fireweather forecast for zone 405 issued themorning of the 22nd, which forecastnorthwest winds 5 to 15 mph (figure 9).
Wind observations taken from theRAWS sites at Lodgepole and Indianolaindicated the 20-foot, 10-minute averagewinds had turned west to northwest latein the afternoon. Afternoon and earlyevening 20-foot, 10-minute averagewindspeeds ranged from 2 to 11 mph atthe Indianola RAWS site and from 6 to14 mph at the Lodgepole RAWS site. Thiswould result in one-minute-maximumpeak eye-level windspeeds from 15 to 19mph with possible gusts of 23 to 28 mph.
The afternoon upper-air sounding (fig-ures 10a and 10b) taken at 0800 and 1800MDT at Great Falls, MT, also indicatedthat surface wind directions had changedthat afternoon to westerly in the lower lev-els, indicating a weak trough passage.Windspeeds were 5 to 15 knots (6 to 17mph) below 12,000 feet mean sea level.
44
Appendix C—Fire Behavior and Weather
Figure 10b—Upper-air soundings (skew-t) from Great Falls, MT, at 1800MDT, indicating a trough passage.
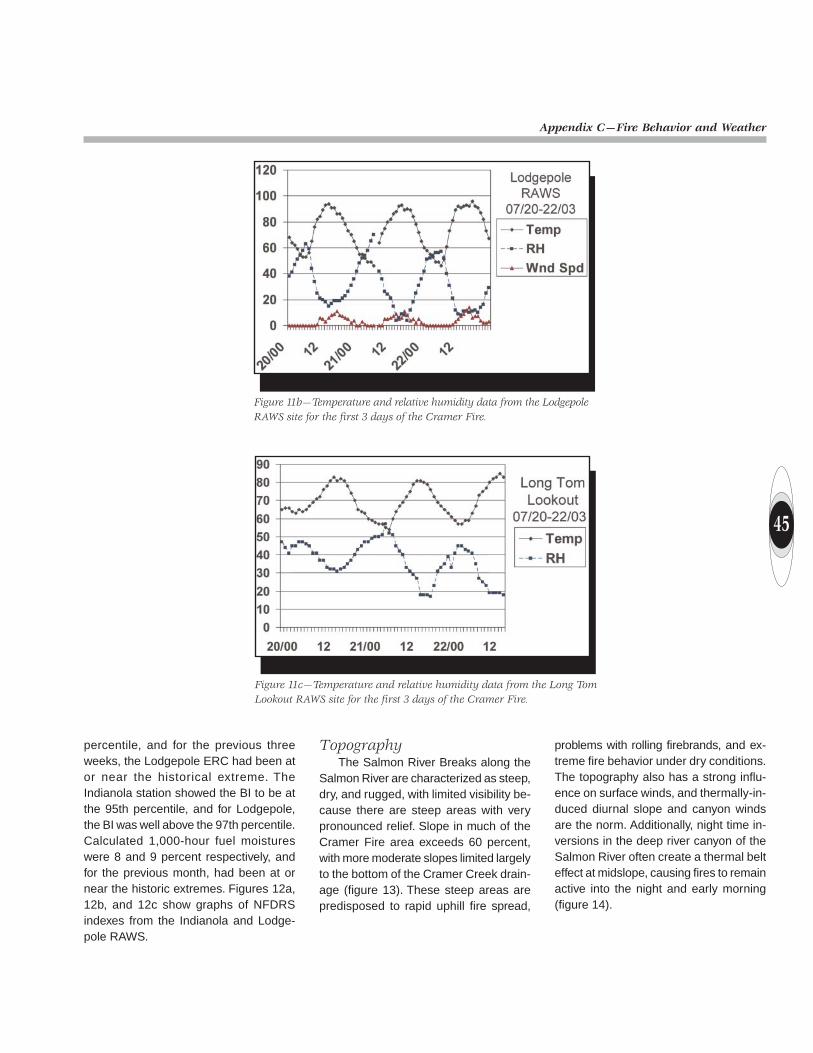
Figure 11a—Temperature and relative humidity data from the IndianolaRAWS site for the first 3 days of the Cramer Fire.
Temperature and RelativeHumidity
Temperatures for the previous 90-dayperiod indicated surface temperatures inthe area of the fire to be 3 to 6 °F warmerthan normal. The week previous to thestart of the Cramer Fire, Long Tom Look-out recorded an afternoon high tempera-ture of 87 °F on Saturday, July 19th.Afternoon high temperatures for the pe-riod of July 20–22, 2003, at the Lodge-pole and Indianola RAWS sites were inthe mid-90s to low 100s with overnightlows in the mid-40s to low 50s at Lodge-pole and in the lower 50s at Indianola.
The RAWS relative humidity (RH)data for July 20 through 22 indicated nighttime humidity recovery of 60 to 70 per-cent, although humidity values remainedless than 60 percent until around sunriseon the mornings of the 20th through the22nd. This, combined with the warm over-night temperatures in the thermal belt,contributed to a longer night-time periodof active burning. The minimum afternoonRH at Indianola and Lodgepole on the
20th were 10 to 15 percent respectively,dropping to 3 and 4 percent on the 21st,and at 8 percent at both sites on the 22nd.Figures 11a, 11b, and 11c show detailedtemperature and RH data.
Seasonal Severity and NFDRSIndices
The forest uses the Energy ReleaseComponent (ERC) of the National FireDanger Rating System (NFDRS) for ini-tial fire sizeup, complexity analysis, andmanagement response. It also uses theBurning Index (BI) as a standard indexfor predicting general fire behavior on theforest. The ERC relates to the potentialavailable energy per unit area in the flam-ing front of a fire, while the BI reflects thepotential fire intensity and difficulty of con-trol. The BI is somewhat sensitive tochanges in weather conditions, and theERC much less so.
In July 2003, the overall BI level onthe forest was well above the 90th per-centile, and the ERC was in the 96th per-centile, indicating extreme burningconditions. Both the Indianola RAWS(NFDRS fuel model C, open pine standswith grass understory) and LodgepoleRAWS (NFDRS fuel model G, dense co-nifer stands) indexes also indicated ex-treme burning conditions. ERC values forboth stations were well above the 97th
45
Appendix C—Fire Behavior and Weather
Figure 11b—Temperature and relative humidity data from the LodgepoleRAWS site for the first 3 days of the Cramer Fire.
Figure 11c—Temperature and relative humidity data from the Long TomLookout RAWS site for the first 3 days of the Cramer Fire.
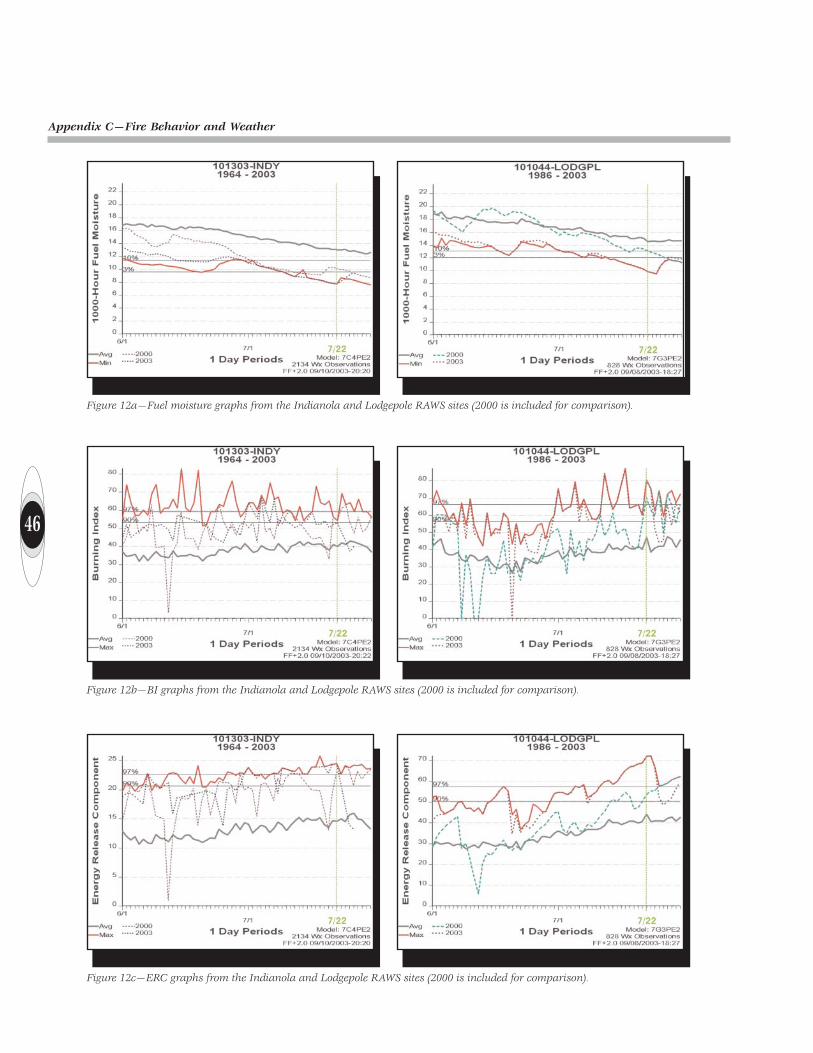
percentile, and for the previous threeweeks, the Lodgepole ERC had been ator near the historical extreme. TheIndianola station showed the BI to be atthe 95th percentile, and for Lodgepole,the BI was well above the 97th percentile.Calculated 1,000-hour fuel moistureswere 8 and 9 percent respectively, andfor the previous month, had been at ornear the historic extremes. Figures 12a,12b, and 12c show graphs of NFDRSindexes from the Indianola and Lodge-pole RAWS.
TopographyThe Salmon River Breaks along the
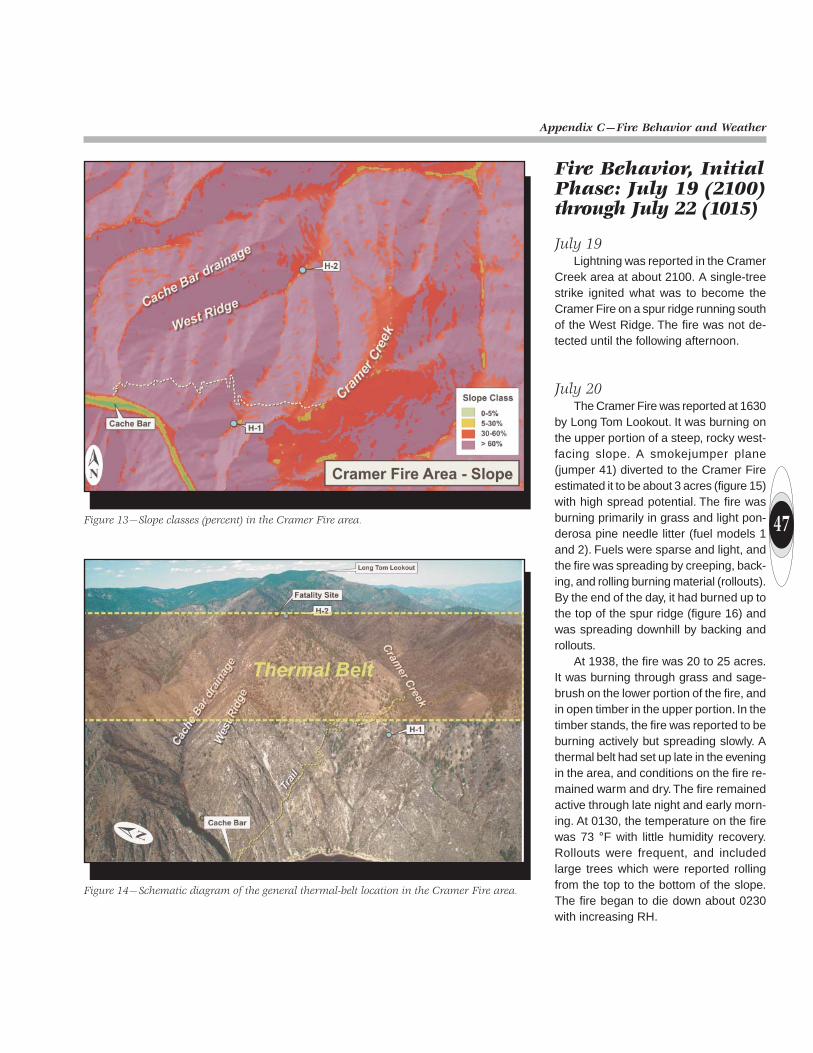
Salmon River are characterized as steep,dry, and rugged, with limited visibility be-cause there are steep areas with verypronounced relief. Slope in much of theCramer Fire area exceeds 60 percent,with more moderate slopes limited largelyto the bottom of the Cramer Creek drain-age (figure 13). These steep areas arepredisposed to rapid uphill fire spread,
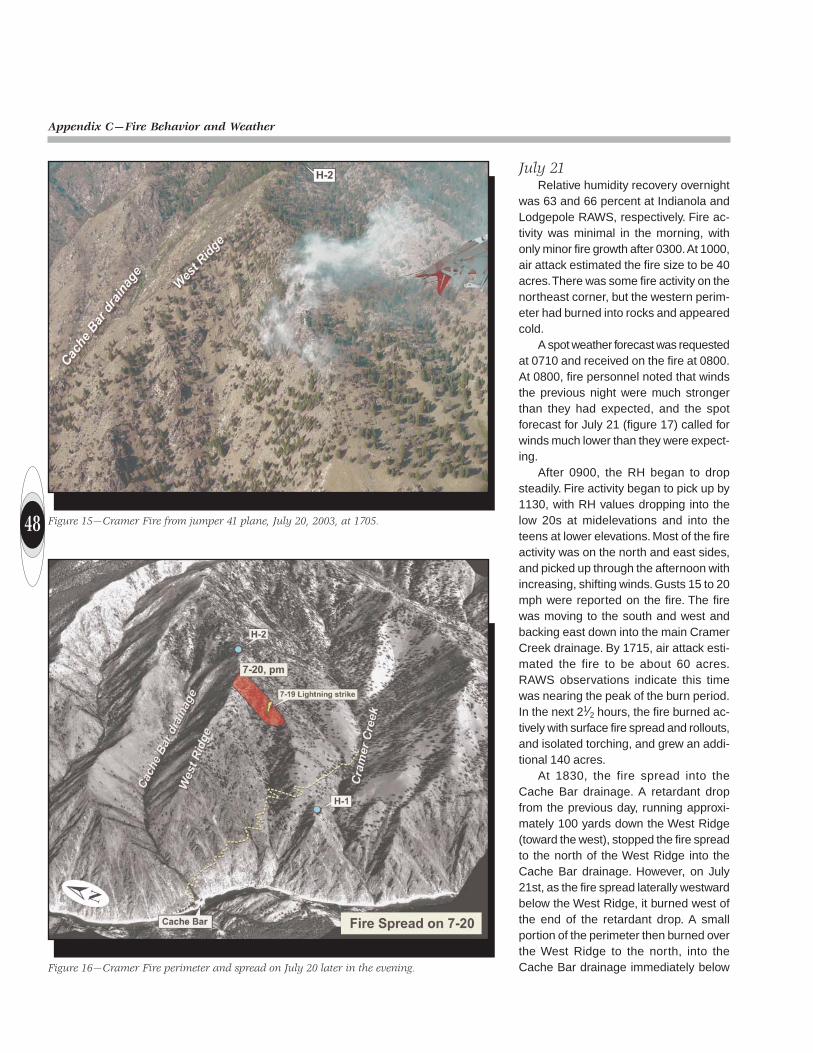
problems with rolling firebrands, and ex-treme fire behavior under dry conditions.The topography also has a strong influ-ence on surface winds, and thermally-in-duced diurnal slope and canyon windsare the norm. Additionally, night time in-versions in the deep river canyon of theSalmon River often create a thermal belteffect at midslope, causing fires to remainactive into the night and early morning(figure 14).
46
Appendix C—Fire Behavior and Weather
Figure 12b—BI graphs from the Indianola and Lodgepole RAWS sites (2000 is included for comparison).
Figure 12a—Fuel moisture graphs from the Indianola and Lodgepole RAWS sites (2000 is included for comparison).
Figure 12c—ERC graphs from the Indianola and Lodgepole RAWS sites (2000 is included for comparison).
47
Appendix C—Fire Behavior and Weather
Figure 13—Slope classes (percent) in the Cramer Fire area.
Figure 14—Schematic diagram of the general thermal-belt location in the Cramer Fire area.
Fire Behavior, InitialPhase: July 19 (2100)through July 22 (1015)
July 19Lightning was reported in the Cramer
Creek area at about 2100. A single-treestrike ignited what was to become theCramer Fire on a spur ridge running southof the West Ridge. The fire was not de-tected until the following afternoon.
July 20The Cramer Fire was reported at 1630
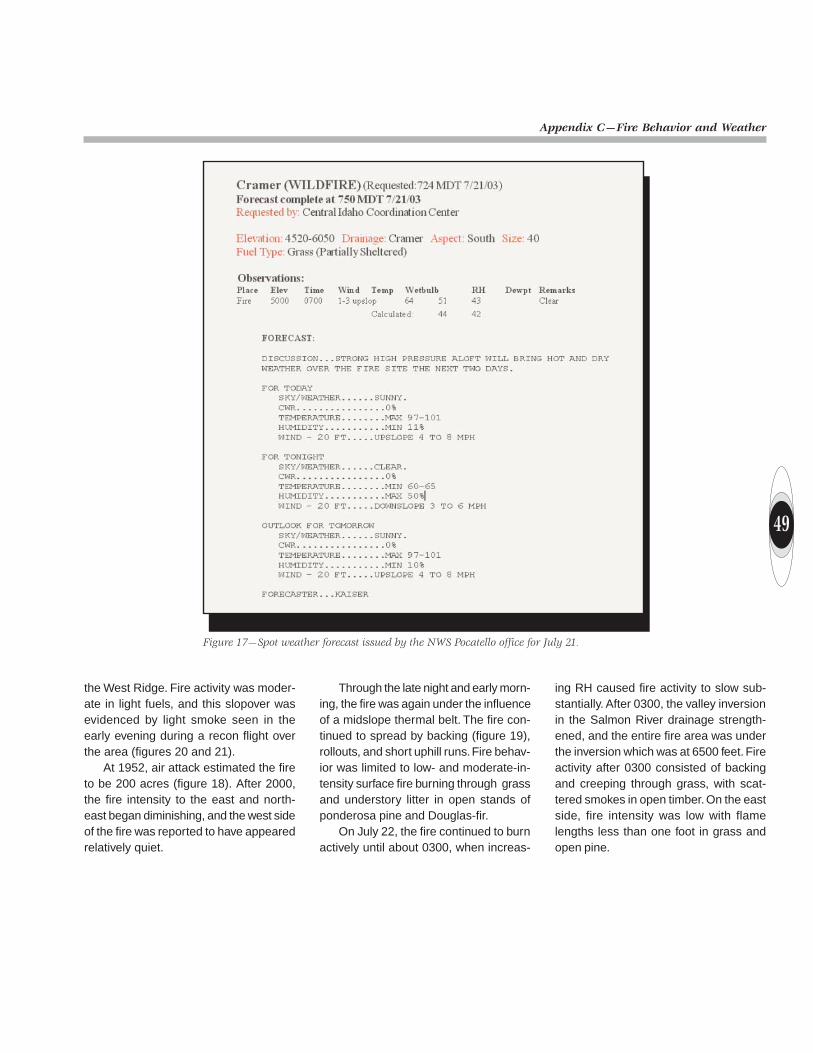
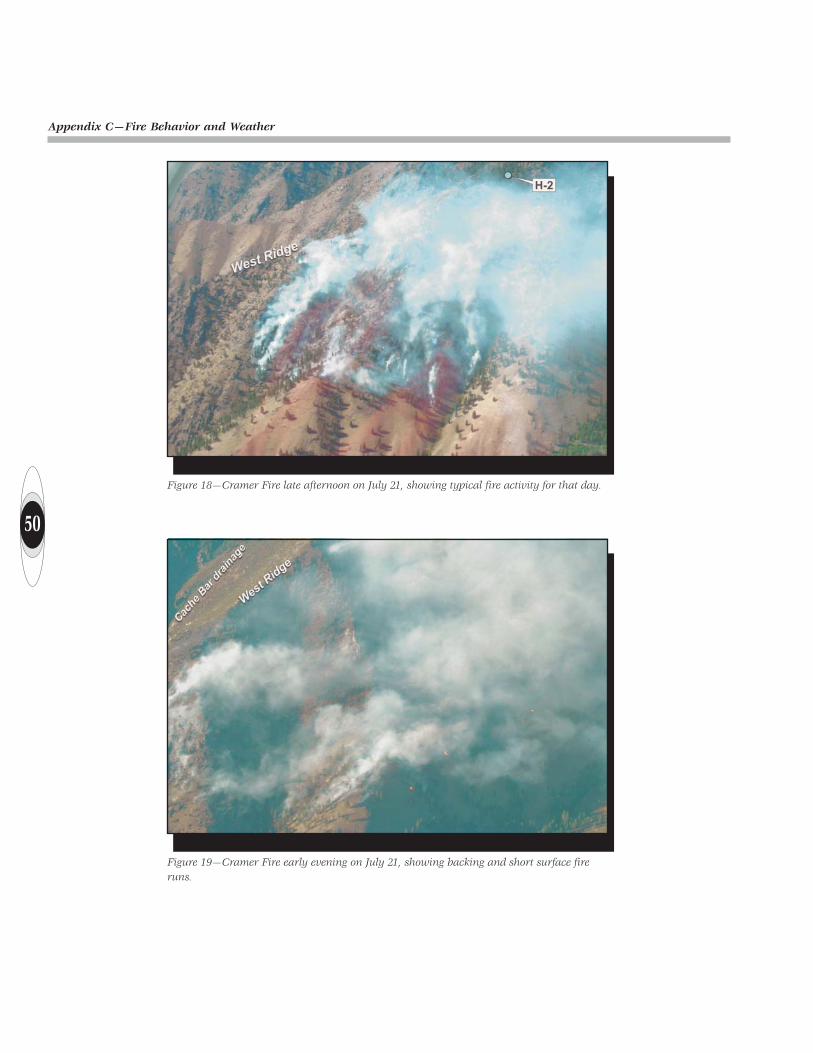
by Long Tom Lookout. It was burning onthe upper portion of a steep, rocky west-facing slope. A smokejumper plane(jumper 41) diverted to the Cramer Fireestimated it to be about 3 acres (figure 15)with high spread potential. The fire wasburning primarily in grass and light pon-derosa pine needle litter (fuel models 1and 2). Fuels were sparse and light, andthe fire was spreading by creeping, back-ing, and rolling burning material (rollouts).By the end of the day, it had burned up tothe top of the spur ridge (figure 16) andwas spreading downhill by backing androllouts.
At 1938, the fire was 20 to 25 acres.It was burning through grass and sage-brush on the lower portion of the fire, andin open timber in the upper portion. In thetimber stands, the fire was reported to beburning actively but spreading slowly. Athermal belt had set up late in the eveningin the area, and conditions on the fire re-mained warm and dry. The fire remainedactive through late night and early morn-ing. At 0130, the temperature on the firewas 73 °F with little humidity recovery.Rollouts were frequent, and includedlarge trees which were reported rollingfrom the top to the bottom of the slope.The fire began to die down about 0230with increasing RH.
48
Appendix C—Fire Behavior and Weather
Figure 15—Cramer Fire from jumper 41 plane, July 20, 2003, at 1705.
Figure 16—Cramer Fire perimeter and spread on July 20 later in the evening.
July 21Relative humidity recovery overnight
was 63 and 66 percent at Indianola andLodgepole RAWS, respectively. Fire ac-tivity was minimal in the morning, withonly minor fire growth after 0300. At 1000,air attack estimated the fire size to be 40acres. There was some fire activity on thenortheast corner, but the western perim-eter had burned into rocks and appearedcold.
A spot weather forecast was requestedat 0710 and received on the fire at 0800.At 0800, fire personnel noted that windsthe previous night were much strongerthan they had expected, and the spotforecast for July 21 (figure 17) called forwinds much lower than they were expect-ing.
After 0900, the RH began to dropsteadily. Fire activity began to pick up by1130, with RH values dropping into thelow 20s at midelevations and into theteens at lower elevations. Most of the fireactivity was on the north and east sides,and picked up through the afternoon withincreasing, shifting winds. Gusts 15 to 20mph were reported on the fire. The firewas moving to the south and west andbacking east down into the main CramerCreek drainage. By 1715, air attack esti-mated the fire to be about 60 acres.RAWS observations indicate this timewas nearing the peak of the burn period.In the next 21⁄2 hours, the fire burned ac-tively with surface fire spread and rollouts,and isolated torching, and grew an addi-tional 140 acres.
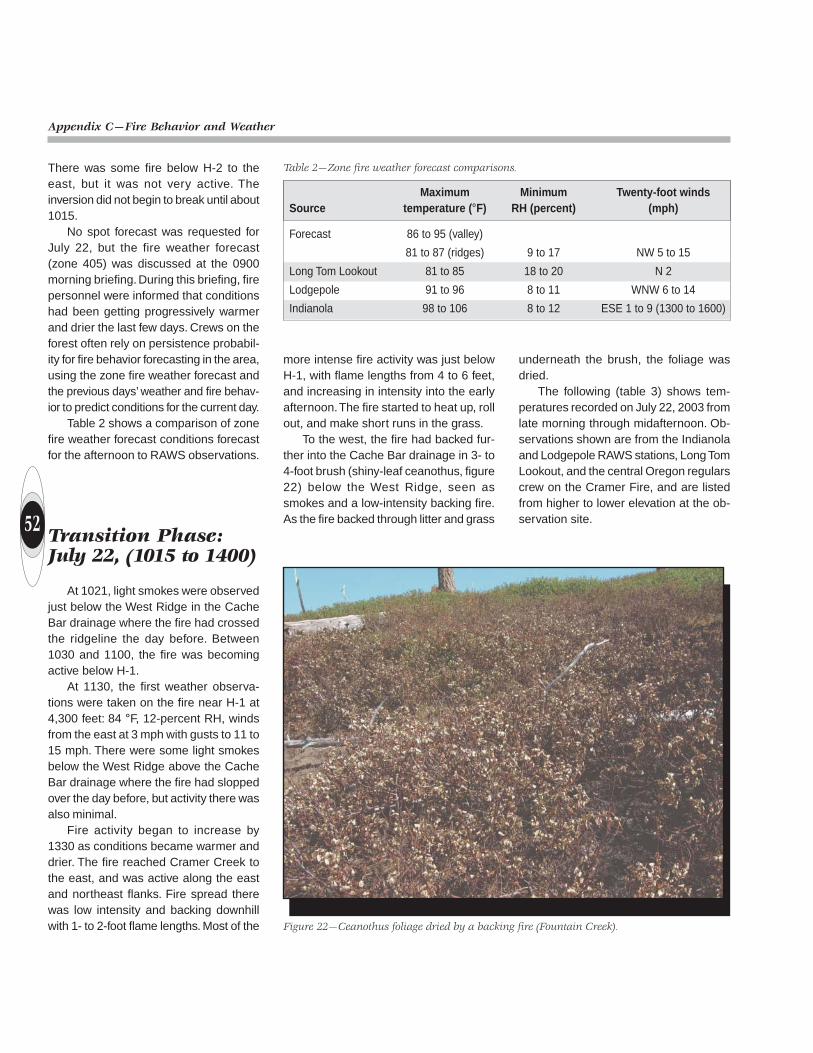
At 1830, the fire spread into theCache Bar drainage. A retardant dropfrom the previous day, running approxi-mately 100 yards down the West Ridge(toward the west), stopped the fire spreadto the north of the West Ridge into theCache Bar drainage. However, on July21st, as the fire spread laterally westwardbelow the West Ridge, it burned west ofthe end of the retardant drop. A smallportion of the perimeter then burned overthe West Ridge to the north, into theCache Bar drainage immediately below
49
Appendix C—Fire Behavior and Weather
Figure 17—Spot weather forecast issued by the NWS Pocatello office for July 21.
the West Ridge. Fire activity was moder-ate in light fuels, and this slopover wasevidenced by light smoke seen in theearly evening during a recon flight overthe area (figures 20 and 21).
At 1952, air attack estimated the fireto be 200 acres (figure 18). After 2000,the fire intensity to the east and north-east began diminishing, and the west sideof the fire was reported to have appearedrelatively quiet.
Through the late night and early morn-ing, the fire was again under the influenceof a midslope thermal belt. The fire con-tinued to spread by backing (figure 19),rollouts, and short uphill runs. Fire behav-ior was limited to low- and moderate-in-tensity surface fire burning through grassand understory litter in open stands ofponderosa pine and Douglas-fir.
On July 22, the fire continued to burnactively until about 0300, when increas-
ing RH caused fire activity to slow sub-stantially. After 0300, the valley inversionin the Salmon River drainage strength-ened, and the entire fire area was underthe inversion which was at 6500 feet. Fireactivity after 0300 consisted of backingand creeping through grass, with scat-tered smokes in open timber. On the eastside, fire intensity was low with flamelengths less than one foot in grass andopen pine.
50
Appendix C—Fire Behavior and Weather
Figure 18—Cramer Fire late afternoon on July 21, showing typical fire activity for that day.
Figure 19—Cramer Fire early evening on July 21, showing backing and short surface fireruns.
51
Appendix C—Fire Behavior and Weather
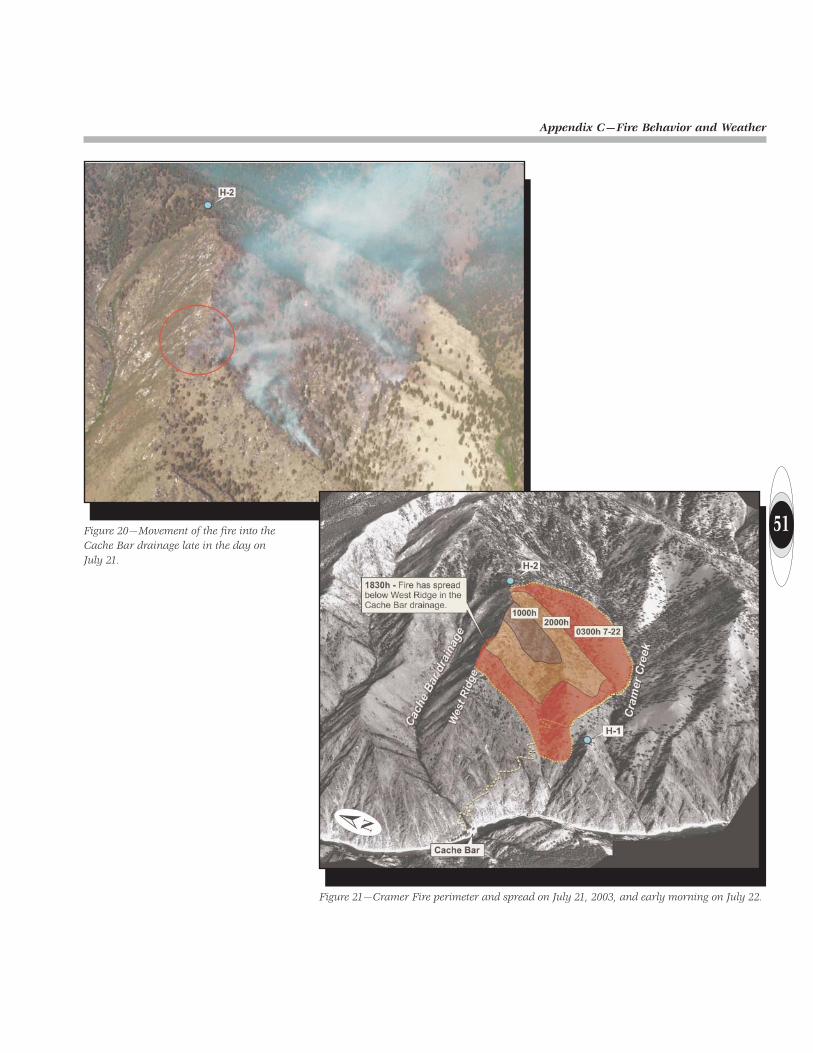
Figure 20—Movement of the fire into theCache Bar drainage late in the day onJuly 21.
Figure 21—Cramer Fire perimeter and spread on July 21, 2003, and early morning on July 22.
52
Appendix C—Fire Behavior and Weather
There was some fire below H-2 to theeast, but it was not very active. Theinversion did not begin to break until about1015.
No spot forecast was requested forJuly 22, but the fire weather forecast(zone 405) was discussed at the 0900morning briefing. During this briefing, firepersonnel were informed that conditionshad been getting progressively warmerand drier the last few days. Crews on theforest often rely on persistence probabil-ity for fire behavior forecasting in the area,using the zone fire weather forecast andthe previous days’ weather and fire behav-ior to predict conditions for the current day.
Table 2 shows a comparison of zonefire weather forecast conditions forecastfor the afternoon to RAWS observations.
Transition Phase:July 22, (1015 to 1400)
At 1021, light smokes were observedjust below the West Ridge in the CacheBar drainage where the fire had crossedthe ridgeline the day before. Between1030 and 1100, the fire was becomingactive below H-1.
At 1130, the first weather observa-tions were taken on the fire near H-1 at4,300 feet: 84 °F, 12-percent RH, windsfrom the east at 3 mph with gusts to 11 to15 mph. There were some light smokesbelow the West Ridge above the CacheBar drainage where the fire had sloppedover the day before, but activity there wasalso minimal.
Fire activity began to increase by1330 as conditions became warmer anddrier. The fire reached Cramer Creek tothe east, and was active along the eastand northeast flanks. Fire spread therewas low intensity and backing downhillwith 1- to 2-foot flame lengths. Most of the
more intense fire activity was just belowH-1, with flame lengths from 4 to 6 feet,and increasing in intensity into the earlyafternoon. The fire started to heat up, rollout, and make short runs in the grass.
To the west, the fire had backed fur-ther into the Cache Bar drainage in 3- to4-foot brush (shiny-leaf ceanothus, figure22) below the West Ridge, seen assmokes and a low-intensity backing fire.As the fire backed through litter and grass
underneath the brush, the foliage wasdried.
The following (table 3) shows tem-peratures recorded on July 22, 2003 fromlate morning through midafternoon. Ob-servations shown are from the Indianolaand Lodgepole RAWS stations, Long TomLookout, and the central Oregon regularscrew on the Cramer Fire, and are listedfrom higher to lower elevation at the ob-servation site.
Figure 22—Ceanothus foliage dried by a backing fire (Fountain Creek).
Maximum Minimum Twenty-foot windsSource temperature (°F) RH (percent) (mph)
Forecast 86 to 95 (valley)
81 to 87 (ridges) 9 to 17 NW 5 to 15
Long Tom Lookout 81 to 85 18 to 20 N 2
Lodgepole 91 to 96 8 to 11 WNW 6 to 14
Indianola 98 to 106 8 to 12 ESE 1 to 9 (1300 to 1600)
Table 2—Zone fire weather forecast comparisons.

53
Appendix C—Fire Behavior and Weather
Station/ Temp. RHTime source Elev. (°F) (%) Winds (mph) Notes
1130 Long Tom 8,168 78 24
Lodgepole 6,100 90 12 3 to 5 E Midpoint between 1100 and 1200 obs.
Central OR 4,300 84 21 3 to 4 updrainage, S-SW
Indianola 3,400 92 16 0 to 2 SE to SW Midpoint between 1100 and 1200 obs.
1230 Long Tom 8,168 80 19
Lodgepole 6,100 92 9 5 to 7 Midpoint between 1200 and 1300 obs.
Central OR 4,300 98 18 2 to 3 updrainage, S-SE
Indianola 3,400 96 14 1 to 2 SE to SW Midpoint between 1200 and 1300 obs.
1330 Long Tom 8,168 83 19
Lodgepole 6,100 91 10 7 to 9 W Midpoint between 1300 and 1400 obs.
Central OR 4,300 95 15 4 updrainage, S-SW
Indianola 3,400 102 12 1 to 2 S-SE Midpoint between 1300 and 1400 obs
1500 Long Tom 8168 84 19
Lodgepole 6100 93 12 12 W
Central OR 4300 — — Gusts to 20–25 reported near H-1
Indianola 3400 105 10 2 to 5 ENE Missing 1500 obs; used midpoint between 1400 and 1500 obs.
Table 3—Fire weather forecast comparisons at different elevations.
Acceleration Phase,July 22 (1400 to 1500)
Between 1330 and 1400, the fire wasmaking small runs in the grass withupcanyon winds and backing downslopeinto the main Cramer Creek drainage withlow flame lengths. H-1 was being pressedby fire.
By 1400, the shortwave disturbancehad started to move into central Idaho.This brought increased windspeeds anda strong flow from the northwest that be-gan to overpower local diurnal winds. Fireactivity began to increase dramatically
over the entire fire, as well as on otherfires in the area. Winds were reported as“whipping back and forth,” and a largebrown smoke column formed west of H-1. The fire burned with increasing inten-sity, moving east and downslope withstronger winds, overrunning H-1. To thewest, fire continued to back down belowthe West Ridge into the Cache Bar drain-age.
With hot conditions, increasing winds,and dried, preheated foliage from thebacking fire, the smokes began to transi-tion to an active fire front between 1430and 1440. The general winds were over-
coming local diurnal winds in the canyon.Although the ridgeline between FountainCreek and the Cache Bar drainage shel-tered the bottom of the drainage from thenorthwesterly winds initially, the shift to amore westerly flow aligned with the east-west orientation of the Cache Bar drain-age, and overall updrainage windspeedsbegan to increase. The fire in the CacheBar drainage was building simultaneouslyto the fire buildup in Cramer Creek. Seefigure 23 for estimated perimeter growthand figure 24 for estimated backing spreadinto the Cache Bar drainage.
54
Appendix C—Fire Behavior and Weather
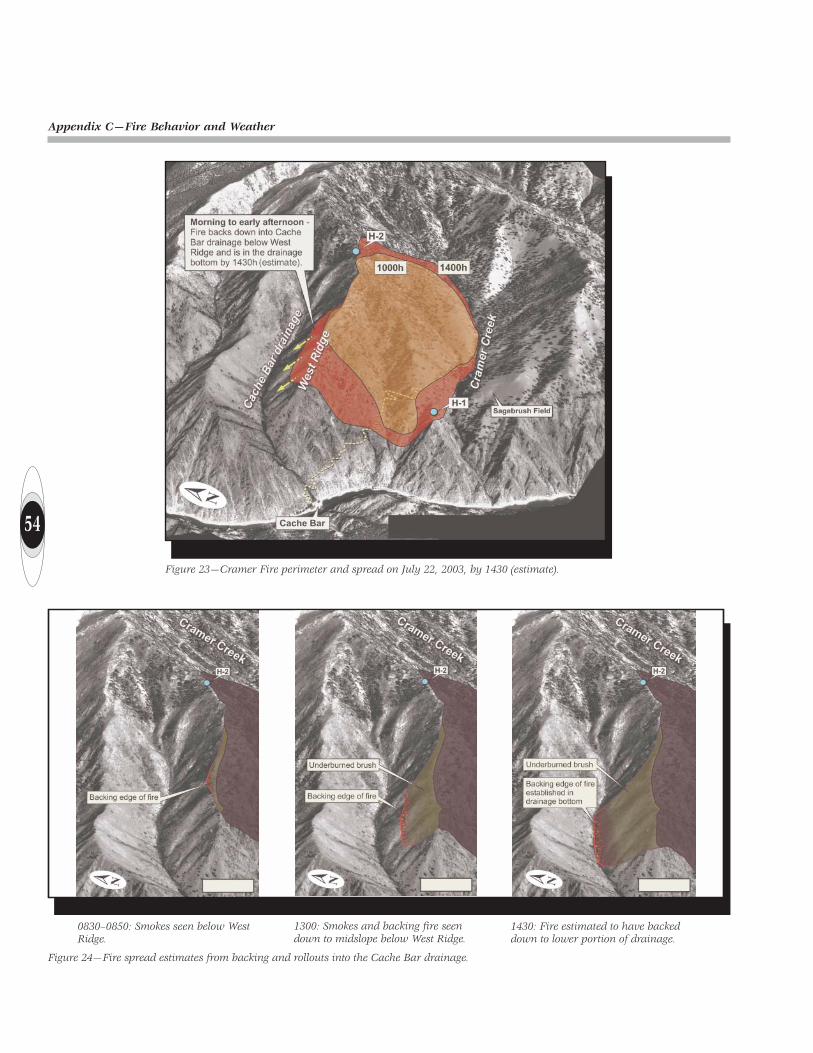
Figure 23—Cramer Fire perimeter and spread on July 22, 2003, by 1430 (estimate).
Figure 24—Fire spread estimates from backing and rollouts into the Cache Bar drainage.
0830–0850: Smokes seen below WestRidge.
1300: Smokes and backing fire seendown to midslope below West Ridge.
1430: Fire estimated to have backeddown to lower portion of drainage.
55
Appendix C—Fire Behavior and Weather
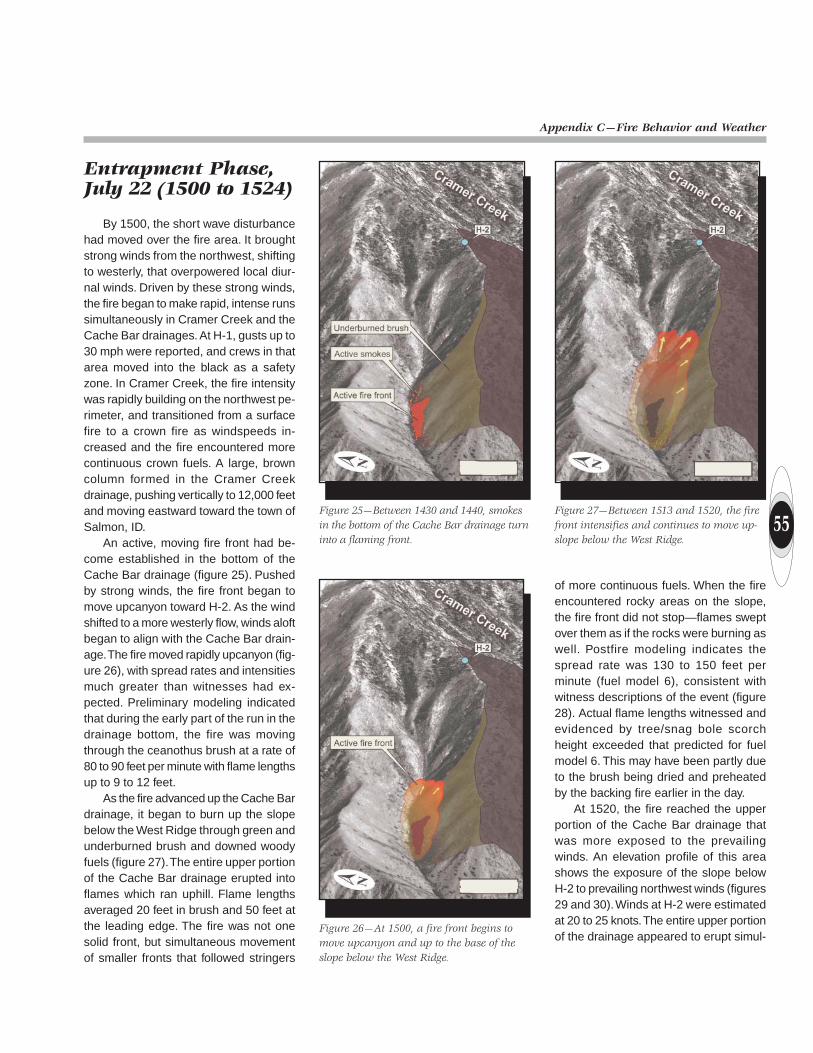
Figure 25—Between 1430 and 1440, smokesin the bottom of the Cache Bar drainage turninto a flaming front.
Figure 26—At 1500, a fire front begins tomove upcanyon and up to the base of theslope below the West Ridge.
Figure 27—Between 1513 and 1520, the firefront intensifies and continues to move up-slope below the West Ridge.
Entrapment Phase,July 22 (1500 to 1524)
By 1500, the short wave disturbancehad moved over the fire area. It broughtstrong winds from the northwest, shiftingto westerly, that overpowered local diur-nal winds. Driven by these strong winds,the fire began to make rapid, intense runssimultaneously in Cramer Creek and theCache Bar drainages. At H-1, gusts up to30 mph were reported, and crews in thatarea moved into the black as a safetyzone. In Cramer Creek, the fire intensitywas rapidly building on the northwest pe-rimeter, and transitioned from a surfacefire to a crown fire as windspeeds in-creased and the fire encountered morecontinuous crown fuels. A large, browncolumn formed in the Cramer Creekdrainage, pushing vertically to 12,000 feetand moving eastward toward the town ofSalmon, ID.
An active, moving fire front had be-come established in the bottom of theCache Bar drainage (figure 25). Pushedby strong winds, the fire front began tomove upcanyon toward H-2. As the windshifted to a more westerly flow, winds aloftbegan to align with the Cache Bar drain-age. The fire moved rapidly upcanyon (fig-ure 26), with spread rates and intensitiesmuch greater than witnesses had ex-pected. Preliminary modeling indicatedthat during the early part of the run in thedrainage bottom, the fire was movingthrough the ceanothus brush at a rate of80 to 90 feet per minute with flame lengthsup to 9 to 12 feet.
As the fire advanced up the Cache Bardrainage, it began to burn up the slopebelow the West Ridge through green andunderburned brush and downed woodyfuels (figure 27). The entire upper portionof the Cache Bar drainage erupted intoflames which ran uphill. Flame lengthsaveraged 20 feet in brush and 50 feet atthe leading edge. The fire was not onesolid front, but simultaneous movementof smaller fronts that followed stringers
of more continuous fuels. When the fireencountered rocky areas on the slope,the fire front did not stop—flames sweptover them as if the rocks were burning aswell. Postfire modeling indicates thespread rate was 130 to 150 feet perminute (fuel model 6), consistent withwitness descriptions of the event (figure28). Actual flame lengths witnessed andevidenced by tree/snag bole scorchheight exceeded that predicted for fuelmodel 6. This may have been partly dueto the brush being dried and preheatedby the backing fire earlier in the day.
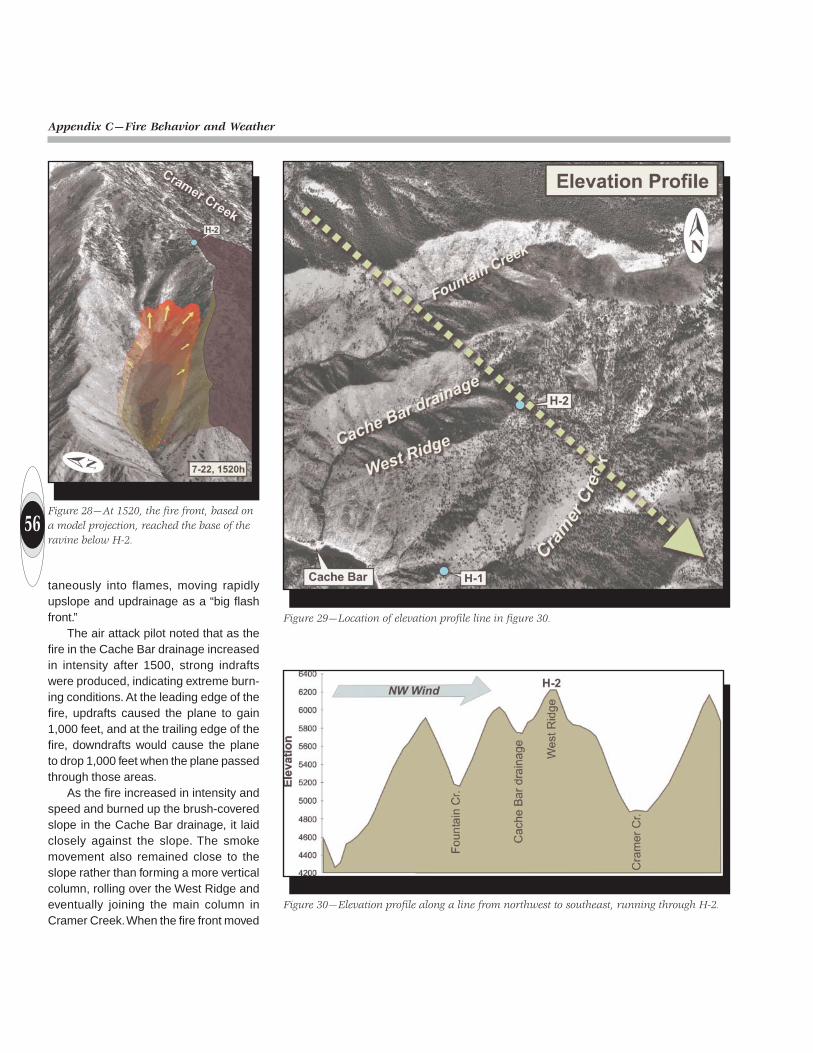
At 1520, the fire reached the upperportion of the Cache Bar drainage thatwas more exposed to the prevailingwinds. An elevation profile of this areashows the exposure of the slope belowH-2 to prevailing northwest winds (figures29 and 30). Winds at H-2 were estimatedat 20 to 25 knots. The entire upper portionof the drainage appeared to erupt simul-
56
Appendix C—Fire Behavior and Weather
Figure 28—At 1520, the fire front, based ona model projection, reached the base of theravine below H-2.
Figure 29—Location of elevation profile line in figure 30.
Figure 30—Elevation profile along a line from northwest to southeast, running through H-2.
taneously into flames, moving rapidlyupslope and updrainage as a “big flashfront.”
The air attack pilot noted that as thefire in the Cache Bar drainage increasedin intensity after 1500, strong indraftswere produced, indicating extreme burn-ing conditions. At the leading edge of thefire, updrafts caused the plane to gain1,000 feet, and at the trailing edge of thefire, downdrafts would cause the planeto drop 1,000 feet when the plane passedthrough those areas.
As the fire increased in intensity andspeed and burned up the brush-coveredslope in the Cache Bar drainage, it laidclosely against the slope. The smokemovement also remained close to theslope rather than forming a more verticalcolumn, rolling over the West Ridge andeventually joining the main column inCramer Creek. When the fire front moved
57
Appendix C—Fire Behavior and Weather
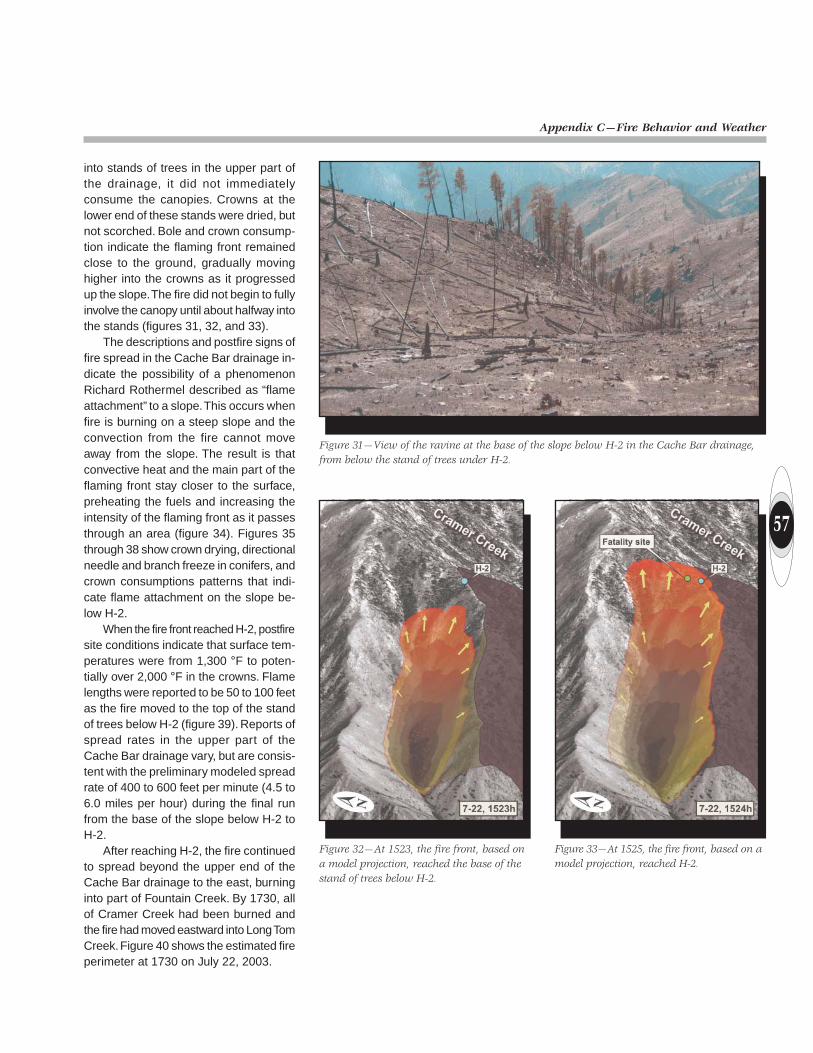
into stands of trees in the upper part ofthe drainage, it did not immediatelyconsume the canopies. Crowns at thelower end of these stands were dried, butnot scorched. Bole and crown consump-tion indicate the flaming front remainedclose to the ground, gradually movinghigher into the crowns as it progressedup the slope. The fire did not begin to fullyinvolve the canopy until about halfway intothe stands (figures 31, 32, and 33).
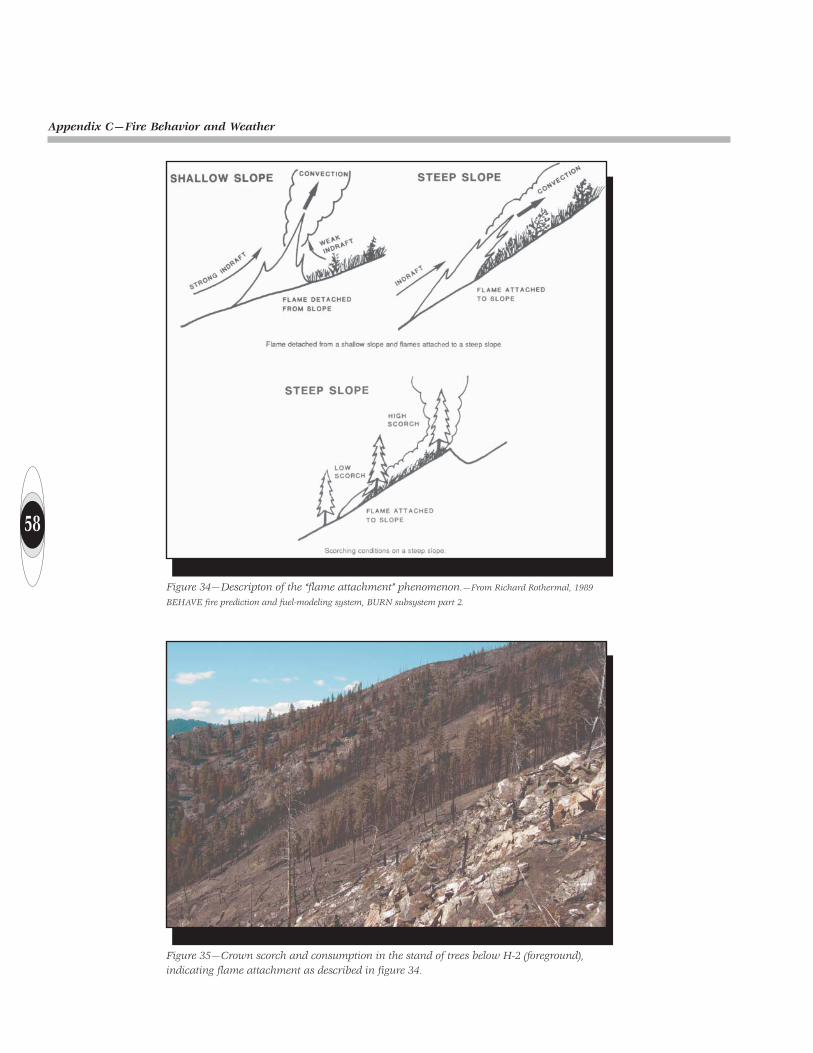
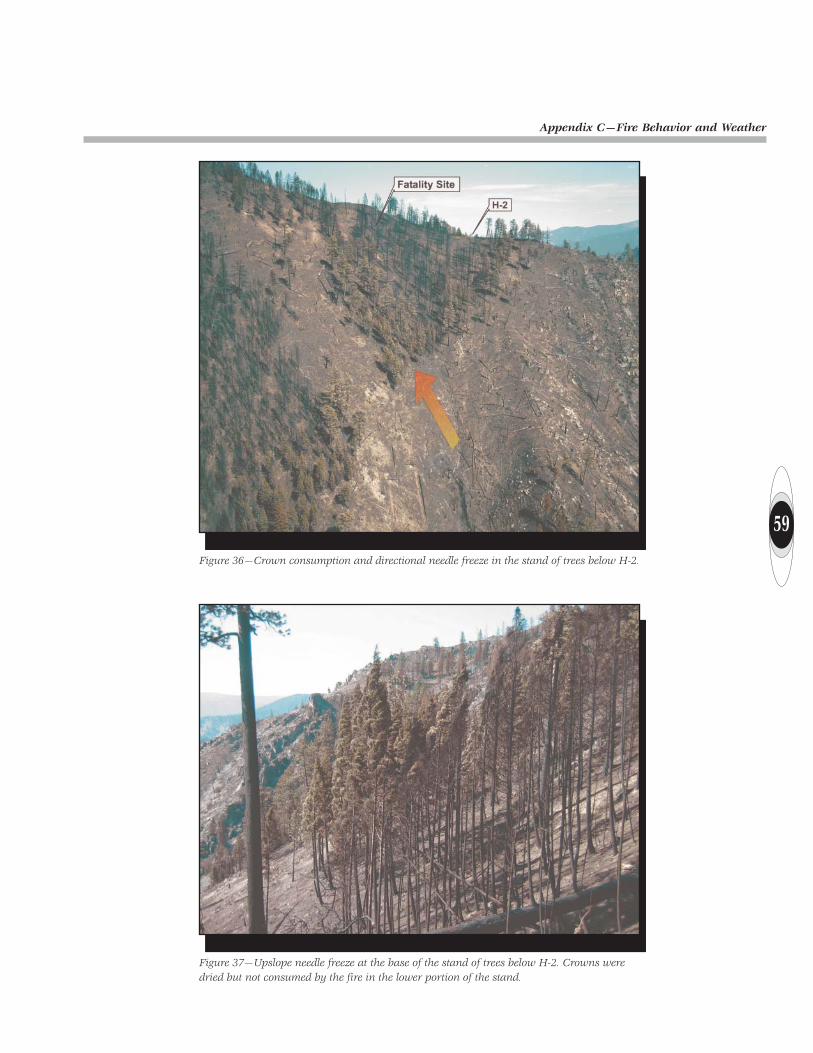
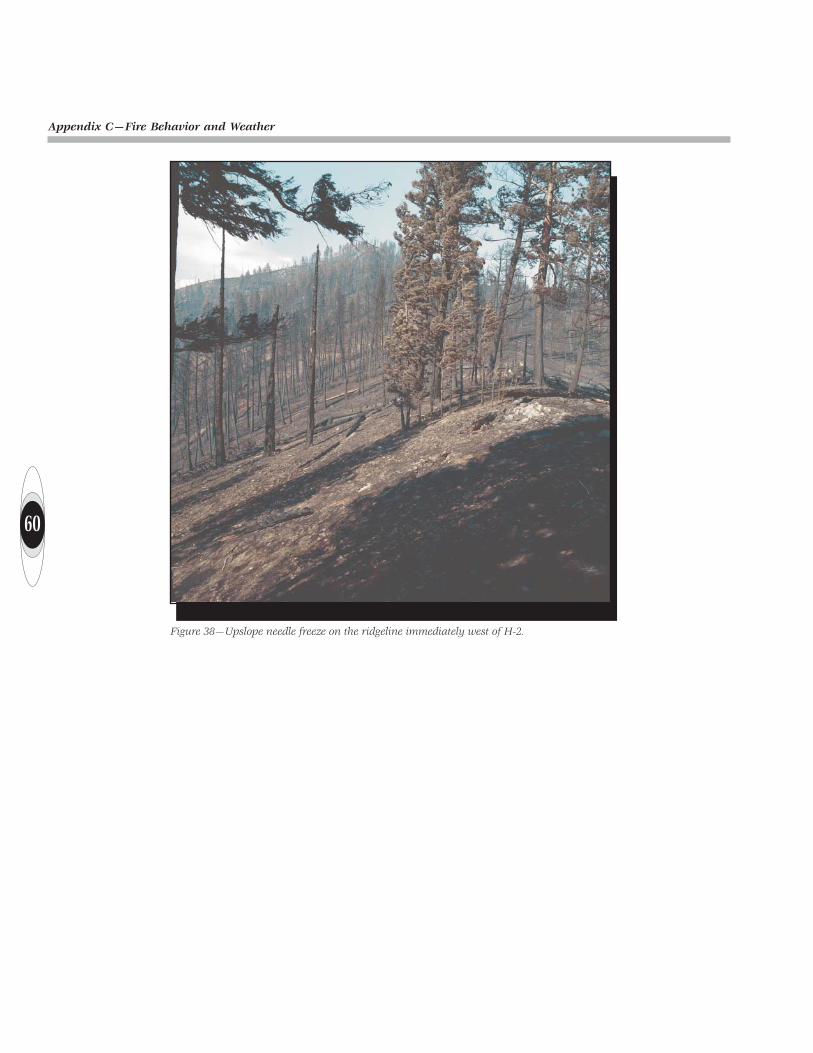
The descriptions and postfire signs offire spread in the Cache Bar drainage in-dicate the possibility of a phenomenonRichard Rothermel described as “flameattachment” to a slope. This occurs whenfire is burning on a steep slope and theconvection from the fire cannot moveaway from the slope. The result is thatconvective heat and the main part of theflaming front stay closer to the surface,preheating the fuels and increasing theintensity of the flaming front as it passesthrough an area (figure 34). Figures 35through 38 show crown drying, directionalneedle and branch freeze in conifers, andcrown consumptions patterns that indi-cate flame attachment on the slope be-low H-2.
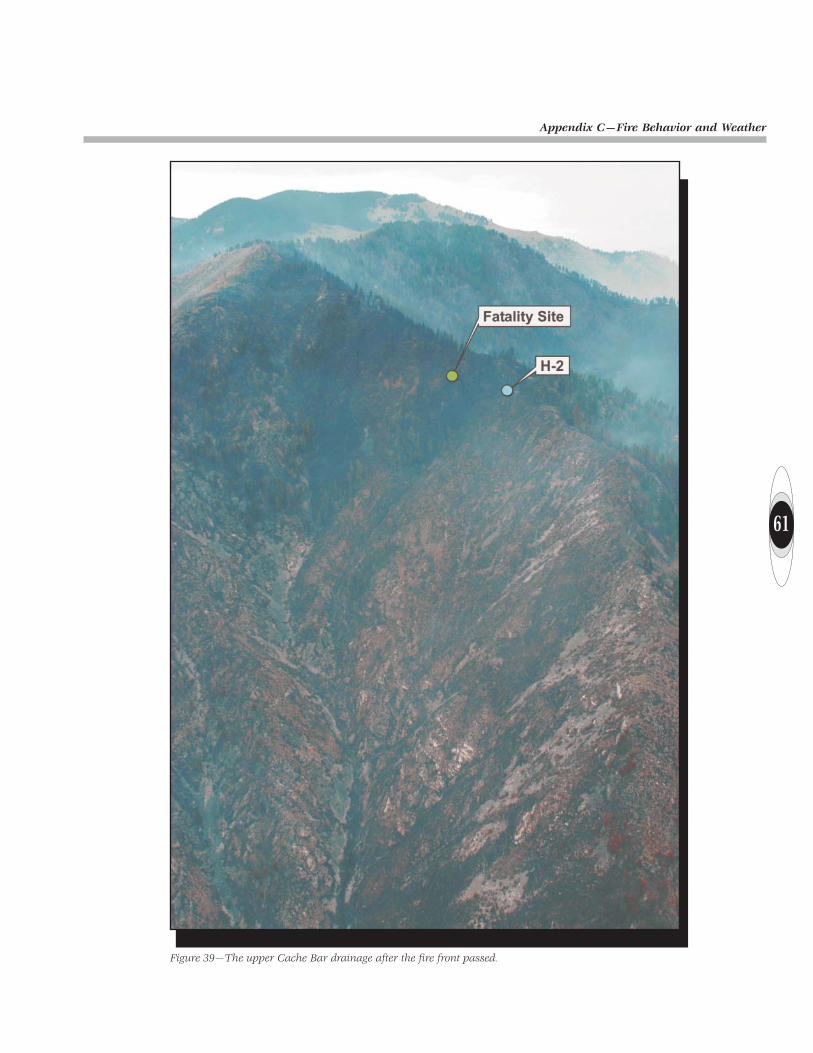
When the fire front reached H-2, postfiresite conditions indicate that surface tem-peratures were from 1,300 °F to poten-tially over 2,000 °F in the crowns. Flamelengths were reported to be 50 to 100 feetas the fire moved to the top of the standof trees below H-2 (figure 39). Reports ofspread rates in the upper part of theCache Bar drainage vary, but are consis-tent with the preliminary modeled spreadrate of 400 to 600 feet per minute (4.5 to6.0 miles per hour) during the final runfrom the base of the slope below H-2 toH-2.
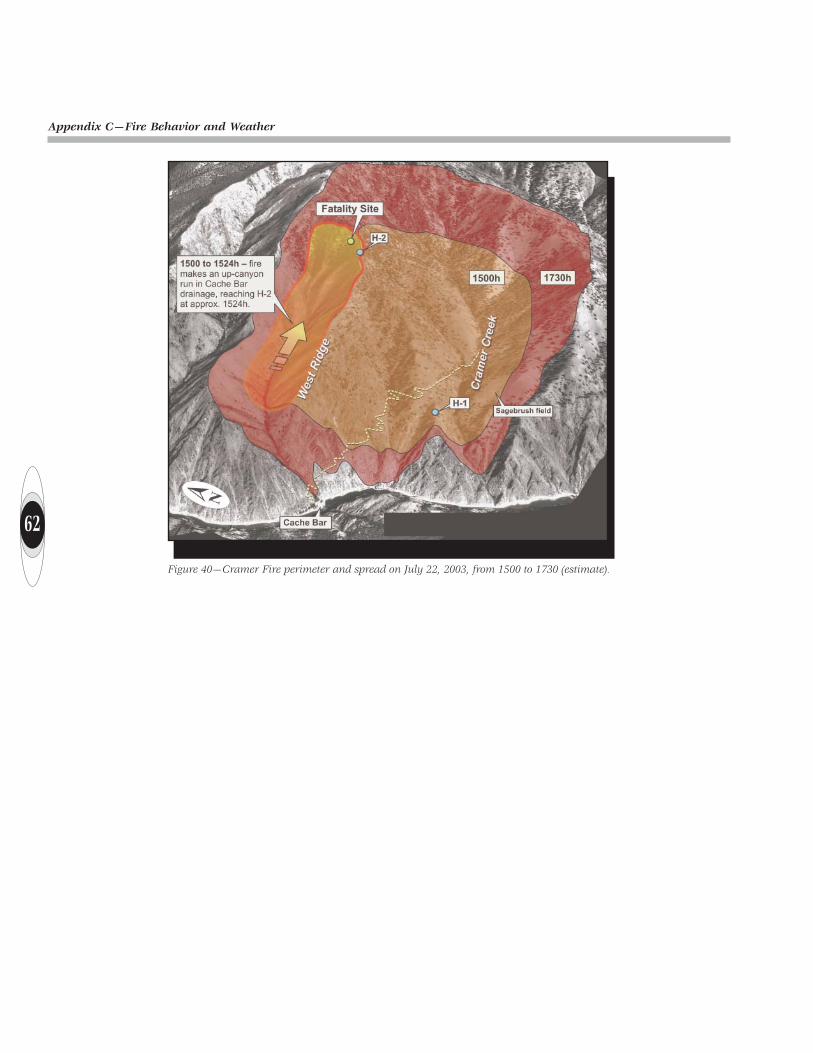
After reaching H-2, the fire continuedto spread beyond the upper end of theCache Bar drainage to the east, burninginto part of Fountain Creek. By 1730, allof Cramer Creek had been burned andthe fire had moved eastward into Long TomCreek. Figure 40 shows the estimated fireperimeter at 1730 on July 22, 2003.
Figure 31—View of the ravine at the base of the slope below H-2 in the Cache Bar drainage,from below the stand of trees under H-2.
Figure 32—At 1523, the fire front, based ona model projection, reached the base of thestand of trees below H-2.
Figure 33—At 1525, the fire front, based on amodel projection, reached H-2.
58
Appendix C—Fire Behavior and Weather
Figure 35—Crown scorch and consumption in the stand of trees below H-2 (foreground),indicating flame attachment as described in figure 34.
Figure 34—Descripton of the “flame attachment” phenomenon.—From Richard Rothermal, 1989
BEHAVE fire prediction and fuel-modeling system, BURN subsystem part 2.
59
Appendix C—Fire Behavior and Weather
Figure 36—Crown consumption and directional needle freeze in the stand of trees below H-2.
Figure 37—Upslope needle freeze at the base of the stand of trees below H-2. Crowns weredried but not consumed by the fire in the lower portion of the stand.
60
Appendix C—Fire Behavior and Weather
Figure 38—Upslope needle freeze on the ridgeline immediately west of H-2.
61
Appendix C—Fire Behavior and Weather
Figure 39—The upper Cache Bar drainage after the fire front passed.
62
Appendix C—Fire Behavior and Weather
Figure 40—Cramer Fire perimeter and spread on July 22, 2003, from 1500 to 1730 (estimate).