Embed Size (px)
Citation preview

Skunk Hill Road Solar (0231258.05) Woodard & Curran, Inc. Master Plan Report January 2021
APPENDIX C: WETLAND & FOREST ASSESSMENT REPORTS


Natural Resource Services, Inc.
P.O. Box 311 Harrisville, RI 02830 401-568-7390 FAX 401-568-7490
Report of Findings for
Freshwater Wetland Delineation ________________________________
Arcadia Road
A.P. 18, Lots 8 & 13
Hopkinton, Rhode Island
Prepared for:
Stephen Theran, Director of Operations
Energy Development Partners, LLC
260 West Exchange Street
Providence, RI 02903
Report (NRS File No. 18-216) Prepared by:
___________________________
Scott P. Rabideau, PWS
Principal
August 13, 2018

Page | 2
Introduction
Natural Resource Services, Inc. (NRS) has completed the freshwater wetland delineation
within the above-referenced parcels. This field work was performed in accordance with the de-
lineation standards outlined in Appendix 2 of the Rules and Regulations Governing the Admin-
istration and Enforcement of the Freshwater Wetlands Act (effective July 16, 2014; hereafter ‘the
regulations’). Rule 8.03(D) of the wetland regulations states that all delineations performed by
wetland consultants, including NRS, are not considered valid for regulatory purposes until the
work is reviewed and approved by the RI Department of Environmental Management, Office of
Water Resources (DEM, OWR).
This field work was performed by NRS staff biologist Edward J. Avizinis, CPSS, PWS
on July 31, August 8 and August 9, 2018. The regulatory section of this report details the classi-
fication of each wetland and the jurisdictional limits applied to these features under the regula-
tions.
Geographic Information System (GIS) graphics are included as appendices to this report.
Wetland features were GPS located using a Trimble GeoXT 6000 handheld unit. GPS data has
been overlain onto an accompanying GIS graphic for reference. Although this is not to be con-
sidered a survey, it does provide a reasonable approximation of the resource areas which can be
utilized for preliminary planning purposes.
This report has been prepared in fulfillment of your authorization to proceed. Do not
hesitate to contact NRS if you have any questions or if you require additional copies of this re-
port. Copies of this report and the accompanying graphic are being forwarded to your engineer,
Denise Cameron, PE of Woodard and Curran for her use.
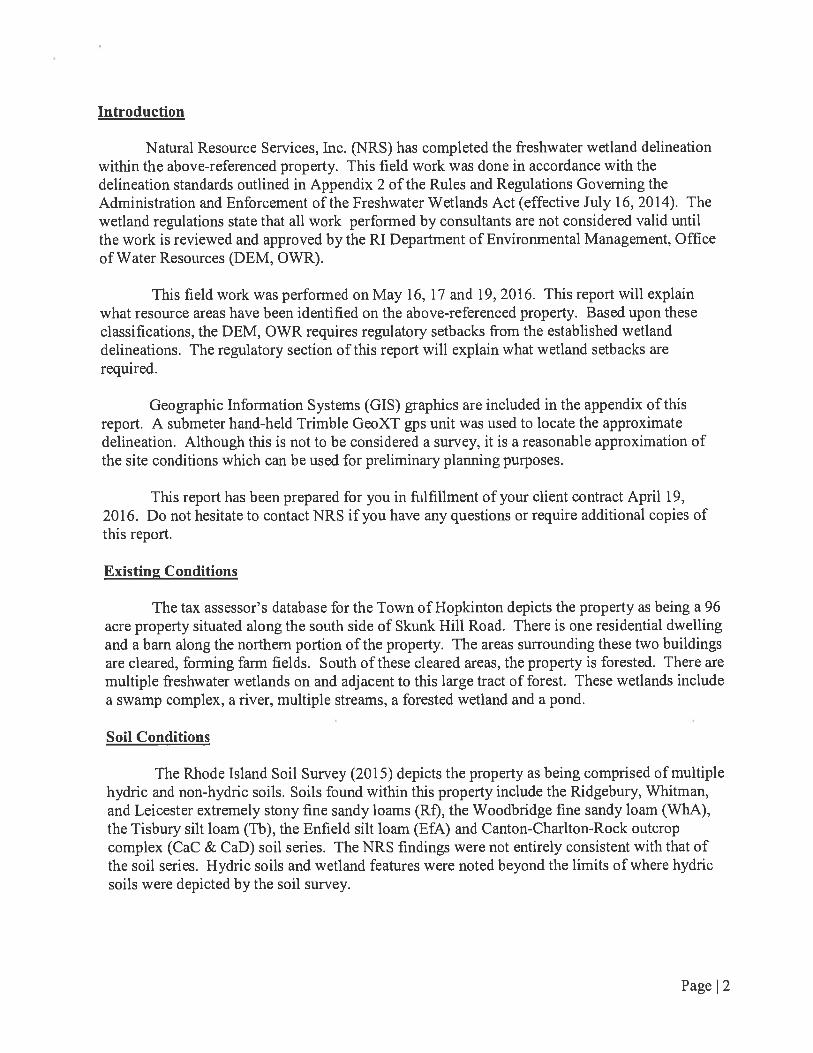
Existing Conditions
The tax assessor’s database for the Town of Hopkinton lists the subject parcels as an ap-
proximate area of 75.52 acres in size. These lots are located to the west of Arcadia Road and are
comprised of a number of land-use types, including agricultural fields, mixed forests and fresh-
water wetlands. The forested upland areas are comprised of red maple (Acer rubrum), white
pine (Pinus strobus), red oak (Quercus rubra), white oak (Quercus alba), sweet pepperbush
(Clethra alnifolia), partridge berry (Mitchella repens), witch hazel (Hamamelis virginiana),
mountain laurel (Kalmia latifolia) and Canada mayflower (Maianthemum canadense), among
other species.
Freshwater swamps occupy portions of the subject lots. These swamps are vegetated with
red maple (Acer rubrum), yellow birch (Betula alleghaniensis), winterberry (Ilex verticillata),
greenbrier (Smilax rotundifolia), cinnamon fern (Osmundastrum cinnamomeum), royal fern
(Osmunda spectabilis), swamp dewberry (Rubus hispidus) and mountain laurel (Kalmia latifo-
lia), among other species.

Page | 3
A river and intermittent streams also flow throughout the delineated parcels. Of these
watercourses, the river (RI0008040R-16C) is considered to be tributary to Wood River and is
also recognized by the DEM’s Environmental Resource Map as a cold water fishery.
Soil Conditions
The Rhode Island Soil Survey (2017) depicts multiple soil series comprising the subject
lots. Soil units approximated within these parcels include the Hinckley gravelly loam, the Scar-
boro mucky sandy loam, the Ridgebury, Whitman and Leicester extremely stony fine sandy
loam, the Pits, gravel, the Canton-Charlton-Rock outcrop complex, the Walpole sandy loam, the
Enfield silt loam and the Merrimac sandy loam soil series. Of these map units, the Ridgebury,
Whitman and Leicester, the Walpole and the Scarboro soil series are recognized as hydric soils
which are generally indicative of wetland features. The NRS findings were not entirely con-
sistent with the approximations of the soil survey as hydric soils were identified beyond the areas
estimated by the survey.
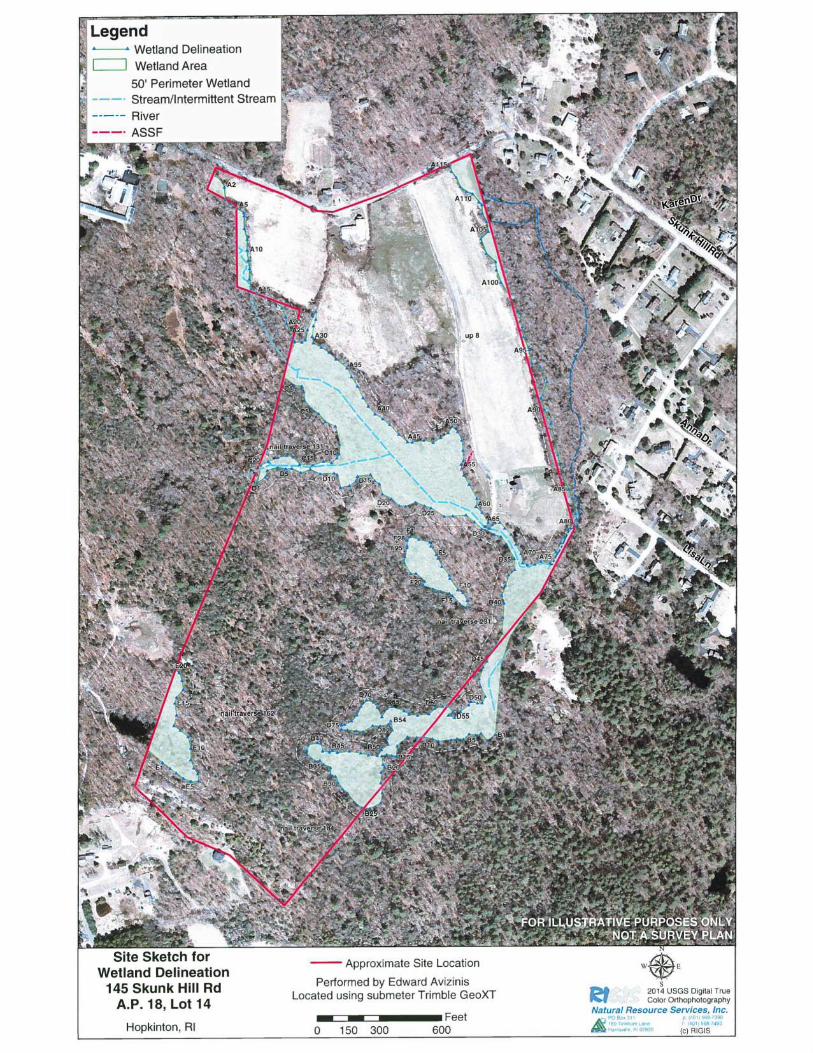
Wetland Delineations
NRS has established and GPS located four (4) delineation flag series within the subject
property. Rule 7.04(B) of the regulations does not require the delineation of stream and river
banks. These watercourses will need to be survey located and accurately plotted on all site plans.
NRS has approximated the centerline of the river and intermittent streams for preliminary plan-
ning purposes.
Flagging labeled G1 – G115, H1 – H114, I1 – I18 and J1 – J102 depicts the boundary of
the on-site swamps. These features receive additional jurisdictional limits in the form of 50-foot
perimeter wetland.
Jurisdictional Limits
The following table has been prepared to depict each NRS flag series in relation to its
classification under the DEM, OWR wetland regulations as well as any additional jurisdictional
limits which may be required.
NRS Flag Series Wetland Delineations Jurisdictional Limits
G1 – G115 Swamp 50 ft. Perimeter Wetland
H1 – H114 Swamp 50 ft. Perimeter Wetland
I1 – I18 Swamp 50 ft. Perimeter Wetland
J1 – J102 Swamp 50 ft. Perimeter Wetland
Not Flagged River 200 ft. Riverbank Wetland
Not Flagged Intermittent Stream(s) 100 ft. Riverbank Wetland
The G-, H-, I- and J-series swamps are afforded 50-foot perimeter wetlands. Appendix
2(D) of the regulations applies riverbank wetlands to streams and rivers based on the mean width
of the subject watercourse. As the river is ten (10) feet or greater in its average width, it is af-

Page | 4
forded a 200-foot riverbank wetland. The intermittent streams are less than ten (10) feet in aver-
age width and therefore subject to 100-foot riverbank wetland.
Perimeter and riverbank wetlands are considered to be regulated resource areas and not
simple buffer zones. As such, any work which is contemplated within the wetlands or their asso-
ciated jurisdictional limits shall require approval in the form of a permit from the DEM, OWR.
Summation
This report has been prepared to describe the field work performed by NRS. Freshwater
wetlands in the form of swamps occupy portions of the subject lots. Additionally, a river and
multiple intermittent streams flow within the parcel. These features are subject to additional ju-
risdictional limits as tabulated in the preceding section of this report. Any land-use activities
considered within the wetlands or their jurisdictional limits shall require a permit from the DEM,
OWR.
It is also important to note that a new state freshwater wetlands law was enacted in July
of 2015. This law made changes to the jurisdictional limits currently utilized in the regulations.
The DEM, OWR is writing new regulations which will require buffer zones for all freshwater
wetlands. While a comprehensive timeline has not been established for the enactment of these
rules, it is anticipated that they will be in effect at some point in 2018. If you submit an applica-
tion prior to the promulgation of these rules, your project would then be grandfathered under the
current setback standards.
Please do not hesitate to contact NRS if you have any questions or if you require elabora-
tion on the findings of this report.

Page | 5
Appendix

Ø
H80
H1G105
#*Ø
#*#*#* #*#*
#*#*#*#* #*
#*#*#*
#*#*#*#*
#*#*
#*#*#*#*#*
#*#*#*#*#* #*#*
#*#*
#*#*#*
#*#*#*
#*#*#*
#*#*#*#*
#*#*#*#*
#*
#*#*#*
#*#*#*#*
#*#*#*
#*#*#*#*#*
#*#*#*
#*#*
#*#*
#*#*#*
#*#*#*#*
#*#*#*#*#*
#*#*#*
#*#*
#*#*#*#*
#*#*#*#*#*#*
#*#*#*#*#*
#*#*
#*#*
#*#*#*#*
#*#*#*
#*#*#*
#*#*#*#*#*
#*#*
#*#*
#*#*#*#*#*
#*#*#*#*
#*
#*
#*#*#*
#*#* #*#*
#*#*#*#*#*
#*#*#*
#*
#*#*
#*#*#*#*#*
#*#*
#*#*#*#*#*
#*#*#*
#*#*
#* #*#* #*#*#*#*
#*#*#*#*#*#*#*
#*
#*#*#*
f
Ø
#*#*
#*#*
#*#*
#*#*#*
#* #*#*#*
#*#*#*#*
#*#*#*#*#*
#*#*
#*#*#*
#*#*#*#*#*#*
#*
#*#*
#*#*
#*#*#*
#*#*#*#*#*
#*#*#*
#*#*#*#*
#*#*#*#*#*#*#*#*#*#*#*#*#*#*
#*#*#*#*#*#*#*#*#*#*#*#*
#*#*#*#*#*
#*#*#*#*#*#*#*
#*#*#*#*#*
#*#*#*#*#*#*#*#*
#*#*#*#*#*#* #*#*#*#*
#*#*#*#*#*#*#*#*#*
#*#*#*#*
#*
#*#*#*#*#*
#*#*#*#*
#*#*#*#*
#*#*#*#*#*
#*
#*#*
#*#*#*#*
#*#*
#*
Arca
diaRd
BankSt
Skunk HillRd
Keith
Dr
BridgeSt
FairviewAve
KarenDrAldrichSt
SunsetDr
Kreyss
ProspectSq
H5
G5
G1
J5
J1
I5
I1
up
H75H70
H65
H60H55
H50
H45
H40
H35H30
H20
H15
H10
G95
G85
G80
G75
G70 G65G60 G55
G50
G45
G40
G35
G30
G25G20G15
G10
J95J90
J85
J80
J75
J70
J65J60
J55J50
J45 J40 J35 J30 J25J20
J15J10
I18I15
I10
H95
H90
H85
up57
G110
G100
J102J100
H114
H110H105
H100
G32a&b
up58-6
Old B7
Old B27
G115 end
G90
URI EDC, RIGIS
Site Sketch for ApproximateWetland Delineation
Arcadia RdA.P. 18, Lots 8 &13
Hopkinton, RI
FOR ILLUSTRATIVE PURPOSES ONLYNOT A SURVEY PLAN
µPerformed byEdward Avizinis, PWS, CPSS 7/31 & 8/8&9/18
Located using hand-held Trimble GeoXT(c) RIGIS
Natural Resource Services, Inc.PO Box 311 p: (401) 568-7390180 Tinkham Lane f: (401) 568-7490Harrisville, RI 02830
2014 USGS Digital TrueColor Orthophotography
LegendApproximate Site Location (Town GIS)
Approximate Wetland Delineation
Approximate Intermittent Streams (<10' wide)
Approximate River (>10' wide)
Previous Wetland Delineation (2016)
50' Perimeter Wetland
100' Riverbank Wetland
200' Riverbank Wetland
Approximate Wetland Area
Approximate Cart Path Location#*#*
0 500 1,000250Feet
HkCRfCaC
SuB
HkC
Sb
Sb
Sb
CaCWa Pg
MmAHkA
EfB
URI EDC, RIGIS
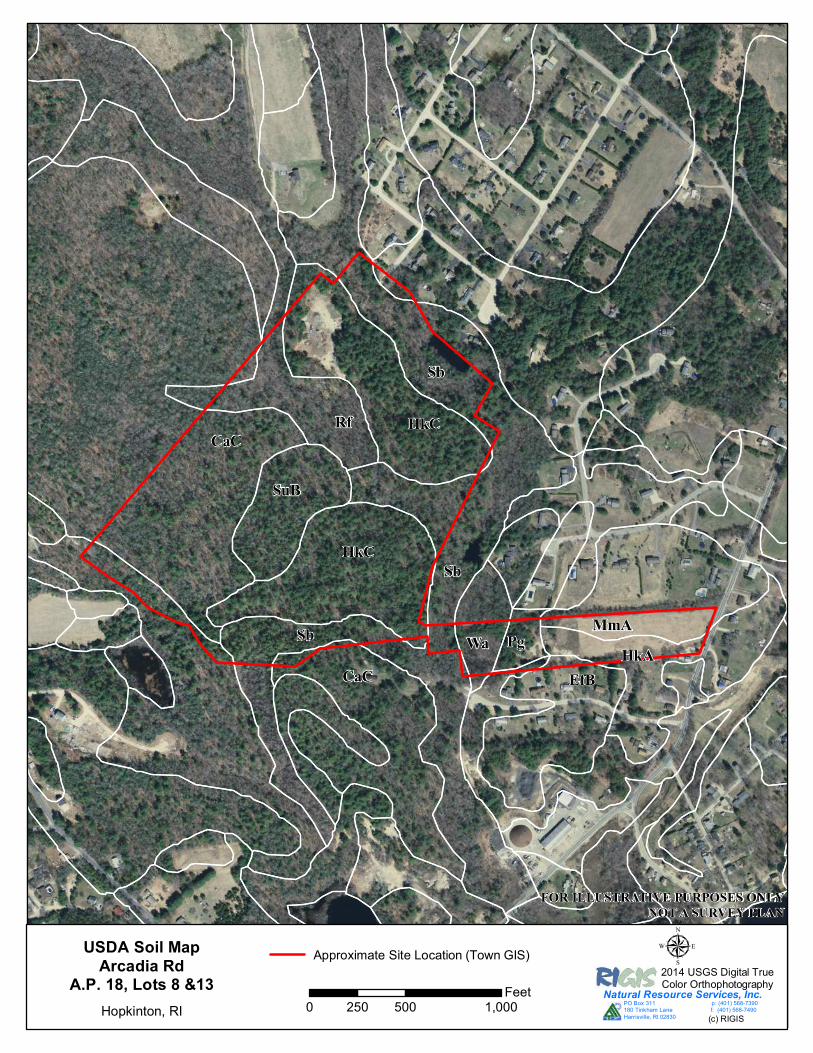
USDA Soil MapArcadia Rd
A.P. 18, Lots 8 &13Hopkinton, RI
FOR ILLUSTRATIVE PURPOSES ONLYNOT A SURVEY PLAN
µ(c) RIGIS
Natural Resource Services, Inc.PO Box 311 p: (401) 568-7390180 Tinkham Lane f: (401) 568-7490Harrisville, RI 02830
2014 USGS Digital TrueColor Orthophotography
Approximate Site Location (Town GIS)
0 500 1,000250Feet

URI EDC, RIGIS
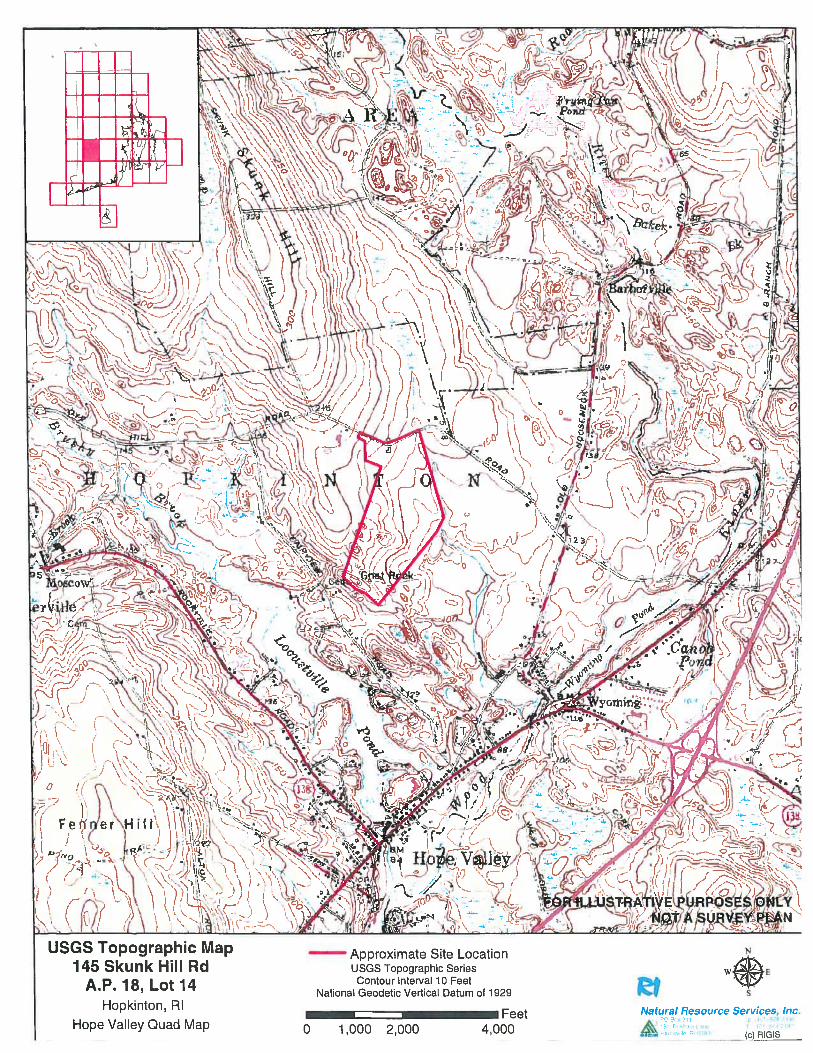
USGS Topographic MapArcadia Rd
A.P. 18, Lots 8 &13Hopkinton, RI
FOR ILLUSTRATIVE PURPOSES ONLYNOT A SURVEY PLAN
µApproximate Site Location
0 2,000 4,0001,000Feet
(c) RIGIS
Natural Resource Services, Inc.PO Box 311 p: (401) 568-7390180 Tinkham Lane f: (401) 568-7490Harrisville, RI 02830
USGS Topographic SeriesContour Interval 10 Feet
National Geodetic Vertical Datum of 1929
Hope Valley Quad Map

Wetland Edge Delineation Data Form (Wetland)
Applicant: Wetland No.: 1
Project: Arcadia Road Flag No. Sequence: H1 – H114
City/Town: Hopkinton, RI Date: July 31, 2018, August 8 & 9, 2018
Vegetation: List the three dominant species in each vegetative strata along with their
NWI status.
Indicator Indicator
Tree Status Herbs Status
1. Betula alleghaniensis FAC 1. Osmundastrum cinnamomeum FACW
2. Acer rubrum FAC 2. Osmunda spectabilis OBL
3. 3. Dendrolycopodium obscurum FACU
Saplings/Shrubs Woody Vines
1. Clethra alnifolia FAC 1. Smilax rotundifolia FAC
2. Ilex verticillata FACW 2. Vitis labrusca FACU
3. Rubus hispidus FACW 3.
List other vegetative species noted which may have affected determination of the wetland
edge: Maianthemum canadense (FACU) & Kalmia latifolia (FACU)________
Soil: SCS Soil Survey Mapping Unit: Sb
On Hydric Soils List (Y / N) Y
Soil Profile: (Note wetland flag no. nearest soil test pit): H100
Horizon Depth Matrix Color Mottling
Description
Depth to
Saturation
Depth to
Free Water
Oe
0-3” - - - -
Ap
3-8” 10YR 3/1 - - -
Bw
8-18” 10YR 5/3 c: 10YR 5/6
d: 10YR 6/1
- -
Other indicators of wetland hydrology (eg. water marks, drainage patterns, root
Rhizospheres, etc: Buttressed roots, staining
Landscape Position: Toeslope
Altered / atypical situation? (describe)
Comments:

Wetland Edge Delineation Data Form (Upland)
Applicant: Wetland No.: 1
Project: Arcadia Road Flag No. Sequence: H1 – H114
City/Town: Hopkinton, RI Date: July 31, 2018, August 8 & 9, 2018
Vegetation: List the three dominant species in each vegetative strata along with their
NWI status.
Indicator Indicator
Tree Status Herbs Status
1. Acer rubrum FAC 1. Maianthemum canadense FACU
2. Quercus alba FACU 2.
3. Quercus rubra FACU 3.
Saplings/Shrubs Woody Vines
1. Mitchella repens FACU 1.
2. Hamamelis virginiana FACU 2.
3. Kalmia latifolia FACU 3.
List other vegetative species noted which may have affected determination of the wetland
Edge: Pinus strobus (FACU)
Soil: SCS Soil Survey Mapping Unit: HkC
On Hydric Soils List (Y / N) N
Soil Profile: (Note wetland flag no. nearest soil test pit): H100
Horizon Depth Matrix Color Mottling
Description
Depth to
Saturation
Depth to
Free Water
-
- - - - -
-
- - - - -
-
- - - - -
- - - - - -
Other indicators of wetland hydrology (eg. water marks, drainage patterns, root
Rhizospheres, etc.):
Landscape Position: Footslope _____
Altered / atypical situation? (describe) ________________________________________
Comments:______________________________________________________________

Wetland Edge Delineation Data Form (Wetland)
Applicant: Wetland No.: 2
Project: Arcadia Road Flag No. Sequence: I1 – I18/J1-J102
City/Town: Hopkinton, RI Date: July 31, 2018, August 8 & 9, 2018
Vegetation: List the three dominant species in each vegetative strata along with their
NWI status.
Indicator Indicator
Tree Status Herbs Status
1. Acer rubrum FAC 1. Maianthemum canadense FACU
2. Pinus strobus FACU 2. Osmunda spectabilis OBL
3. 3.
Saplings/Shrubs Woody Vines
1. 1. Vitis labrusca FACU
2. 2.
3. 3.
List other vegetative species noted which may have affected determination of the wetland
Edge:
Soil: SCS Soil Survey Mapping Unit: Wa
On Hydric Soils List (Y / N) Y
Soil Profile: (Note wetland flag no. nearest soil test pit): I9
Horizon Depth Matrix Color Mottling
Description
Depth to
Saturation
Depth to
Free Water
Ap
0-8” 10YR 3/1 - - -
Bw
8-15” 10YR 4/1 - - -
-
- - - - -
Other indicators of wetland hydrology (eg. water marks, drainage patterns, root
Rhizospheres, etc: Buttressed roots, saturated at 8”
Landscape Position: Toeslope
Altered / atypical situation? (describe)
Comments:

Wetland Edge Delineation Data Form (Upland)
Applicant: Wetland No.: 2
Project: Arcadia Road Flag No. Sequence: I1 – I18/J1-J102
City/Town: Hopkinton, RI Date: July 31, 2018, August 8 & 9, 2018
Vegetation: List the three dominant species in each vegetative strata along with their
NWI status.
Indicator Indicator
Tree Status Herbs Status
1. Pinus strobus FACU 1. Maianthemum canadense FACU
2. 2.
3. 3.
Saplings/Shrubs Woody Vines
1. 1. Vitis labrusca FACU
2. 2.
3. 3.
List other vegetative species noted which may have affected determination of the wetland
Edge:
Soil: SCS Soil Survey Mapping Unit: HkC
On Hydric Soils List (Y / N) N
Soil Profile: (Note wetland flag no. nearest soil test pit): I9
Horizon Depth Matrix Color Mottling
Description
Depth to
Saturation
Depth to
Free Water
Ap
0-8” 10YR 3/2 - - -
Bw
8-14” 10YR 5/4 - - -
-
- - - - -
- - - - - -
Other indicators of wetland hydrology (eg. water marks, drainage patterns, root
Rhizospheres, etc.):
Landscape Position: Footslope _____
Altered / atypical situation? (describe) ________________________________________
Comments:______________________________________________________________

1
LAND MANAGEMENT SERVICES 303 Courthouse Lane, Pascoag, RI 02859 401-568-3410 [email protected]
January 2, 2019 (amended 3/26/19)
Forest Assessment Proposed Skunk Hill I & II Solar Projects Skunk Hill I: 145 Skunk Hill Road (AP 18, Lot 14) Skunk Hill II: 0 Arcadia Road and 0 Lisa Lane (AP 18, Lots 8 & 13) Hopkinton, RI
Purpose:
This forest assessment is provided to document the forest resources on the total of 173.5 acres in three (3) lots that will be subject to the development of a solar array. The above-referenced project currently involves approximately 47 +/- acres that would be cleared of trees for the solar arrays, although this estimate is subject to change as the project proposal is refined.
General Site Description:
The subject properties are located southerly of Skunk Hill Road and westerly of Arcadia Road, with additional access from Lisa Lane, northwest of the Hope Valley village area in the northeast portion of the town of Hopkinton, RI. The property is situated on the southern tip of Skunk Hill, which is a long ridge flanked by the Wood River to the east and Brushy Brook (Locustville Pond) to the west. The terrain consists of a southeast-facing slope with a couple of rocky, upland knolls and interior intermittent stream valleys. These streams flow to the southeast to the Wood River just below Wyoming Pond.
According to the USDA Soil Survey, the existing soil conditions underlying the wooded upland areas of the property that will be subjected to the clearing for this project include well-drained Canton-Charlton-Rock Outcrop complex of fine sandy loams, very rocky, with 3 to 15 percent slopes, which are typically found on side slopes and crests of upland hills and ridges; excessively well-drained Hinckley gravelly sandy loam, rolling, which are typically found on terraces and glacial features such as outwash plains, kames, and eskers; and moderately well-drained Sutton very stony fine sandy loam, 0 to 8 percent slopes, which are typically found on the lower side slopes of the uplands. There are rock outcroppings present within these soil types, particularly in the southwestern area of the property. Stones and boulders can cover from 10 to 35 percent of the surface in the upland sites underlain with the Canton/Charlton soil type, with other areas that have from 0 to 10 percent of the surface covered by stones and boulders.
The available water capacity of these soils is from low in the gravelly areas, to moderate in most other areas of the property, and runoff rate is slow to medium. They are typically too stony for agricultural uses, with only the Hinckley gravelly soils suitable for pasture or hayfields. They are suited to trees and community development. These soils have a woodland productivity rating

2
of 4o to 5s, which is low to moderate in productivity, with site limitations for equipment operation due to the stoniness, and low fertility due to sandiness. They have a Site Index value that ranges from 52 for Red oak in the upland areas and 62 in the mid- to lower-slope sites, and 58 for White pine in the upland sites to 62 in the lower-slope sites. The gravelly, sandy loam of the Hinckley site is most suited to growing White pine, where it regenerates readily, but due to low fertility the Site Index for White pine is relatively low at 60. This Site Index value is an indication of how well trees will grow in that soil type, and those values range from poor in the upland areas to fair in the mid- to lower slope sites, in relation to other Rhode Island soils. The USDA Soil Survey includes information on depth to bedrock, soil texture, seasonal water table influences, and suitability for certain tree species. A copy of the USDA Soil Survey report for the subject property is attached to this assessment. There is a woods trail that enters the wooded areas of the property from the northern hayfields, and runs parallel to the western boundary down to the ledges known as Goat Rock. There is a second trail that comes in from the road frontage in the southeastern portion of the property and runs along the ledges overlooking the southern stream to the Goat Rock ledges, with several other ATV trails that run through these areas. Some of these roads are visible in the Aerial Imagery. Forest Cover Descriptions: The forest cover on the subject sites is predominately upland oaks (Scarlet oak, Black oak, and White oak), with some presence of Northern red oak in the upper slope areas of the western portions of the property, with a heavy understory of Mountain laurel shrubs, and in the southeast portions of the property White pine is the dominant tree species, with mature stands of pine mixed with some upland oaks, along with Black birch, Red maple, Sassafras, and a few small copses of American beech. Red maple and other hardwoods are present in a small area just south of the northwest field, where seasonally high water tables have an influence on the species found there. There is no evidence of any recent timber harvesting activity, other than some firewood harvesting in the northern areas of the woodlot, close to the property’s house site and fields. There are no signs of any harvesting of mature timber in many years. The woods roads and a couple of branch trails are still open with evidence of some vegetation maintenance for recreational access. More recently, defoliations by Gypsy moth caterpillars has resulted in a minor amount of oak mortality. The 2016 Aerial imagery illustrates the amount of defoliation that occurred (light-colored patches that should be green with foliage), with defoliation in the upland areas of the southwestern portions of the property. The preparation of this Forest Assessment has included a forest resource inventory, the results of which are included in each of the Stand Descriptions that will follow. Forest stands are

3
determined through a combination of forest cover and geographic features, with soil types, slope, and aspect each having a major influence on the delineation of these stands.
This forest inventory was conducted by the randomized distribution of variable radius sampling plots, with the use of a 10-factor prism and measuring the diameters of all “in” trees. Extrapolation of the recorded data provides average diameter and stocking data (e.g. numbers of trees) across the stand. Data recorded includes species, determination of acceptable or un-acceptable growing stock (AGS vs. UGS), understory vegetation, and any additional site factors that influences the health and viability of the stand.
Stand Descriptions: The woodland has been delineated into three (3) upland stands, as shown on the attached Forest Stand Map, with descriptions that follow. The acreage for each of these stands includes only the acreages within the proposed limit of disturbance as provided by Woodard & Curran Engineering’s Site Plan. This is the area to be cleared within the proposed fence line of the arrays and associated stormwater management facilities. There are additional areas comprised of wetlands not subject to clearing for the solar arrays.
. . . . . . . . . . . . . . . . . . . . . . . . . . . . . . . . . . . . . . . . . . . . . . . . . . . . . . . . . . . . . . . . . . . . . . . . . . . . .
Stand 1 – Mixed Hardwoods Acres: 3
# TREES/A: 88 AVG. DBH: 14” AGE: 100+ years
(DBH = Diameter Breast Height = @4.5’ above ground)
SOIL TYPE: Woodbridge fine sandy loam, 0 – 3 percent slopes
SITE INDEX: Red oak = 72 White pine = 65
Located at the southern end of the northwest open fields, with a seasonally high water table and moderately well-drained soil conditions, the overstory of this small patch is comprised of Red maple and other associated hardwoods.
Red maple is the most prevalent species, representing about 70% of the total stocking, and found in all size classes, with some large diameter culls present. These culls, along with some scattered large White and Scarlet oaks are likely remnant pasture trees, with an intermediate stocking of smaller diameter Red maple, White oaks, Hickory, and Black birch. American elms of various sizes were also noted.
Recent cutting of firewood in this stand has produced a fairly open understory with a growth response of Blackberry canes, clumps of Green briers, and thickets of non-native, invasive plants

4
such as Multi-flora rose shrubs, Japanese barberry shrubs, and Honeysuckle vines. Grasses and annual weeds are present, along with ferns and Sweet pepperbush.
The current health condition of the dominant trees is moderate, with storm-damaged crowns and broken stems of large Red maple culls, and some mortality of the oaks scattered throughout the stand due to recent defoliations. The defoliation would not have been extensive due to the diversity of hardwoods present in the stand, and the moist, fertile soil conditions that enhance the health and productivity of the trees.
. . . . . . . . . . . . . . . . . . . . . . . . . . . . . . . . . . . . . . . . . . . . . . . . . . . . . . . . . . . . . . . . . . . . . . . . . . . . .
Stand 2 – Upland Oaks Acres: 24
# TREES/A: 135 AVG. DBH: 9.8” AGE: 80 - 90 years
SOIL TYPE: Canton/Charlton/Rock Outcrop Complex, 3 to 15 percent slopes
SITE INDEX: Red oak = 52 - 58 White pine = 58 - 65
Located in the central and southwest portions of the property, comprising the acreage of Skunk Hill Solar I, and situated on the mid-slopes of the hillside, with rocky knoll inclusions, and with a southeastern aspect, the overstory of this stand is dominated by mixed oaks in the 12 to 22 inch dbh size classes. Most of the oak stocking is comprised of the upland Black and Scarlet oaks.
Due to the higher soil moisture content of the soils underlying the northern and eastern edges of the stand, there is a component of better quality Northern red oaks present, along with several Red maples in those transition areas. Here there are some oaks and a few White pines that are found in the 20 to 26 inch dbh size classes.
Altogether, the oaks comprise about 80% of the dominant overstory trees, and about 55% of the total growing stock.
Other hardwoods present in the stand include some co-dominant White oaks and Black birch, and an intermediate and suppressed stocking of small to medium diameter Black birch, Hickory, mixed oaks, Sassafras, Black gum, and Red maple. There are some scattered White and Pitch pines present, along with some smaller diameter pine saplings, which are now being released by the recent mortality of oaks.
The current stocking level is 62%, which is a fully-stocked condition on the Upland Central Hardwood stocking chart.
The current health condition of these oaks is poor to moderate, with some crown dieback in most of the dominant and co-dominant stems, and some mortality scattered throughout the stand due to recent drought and defoliations. The upper slopes have significant amounts of oak mortality, comprising about 40% of the overstory in some areas.
5
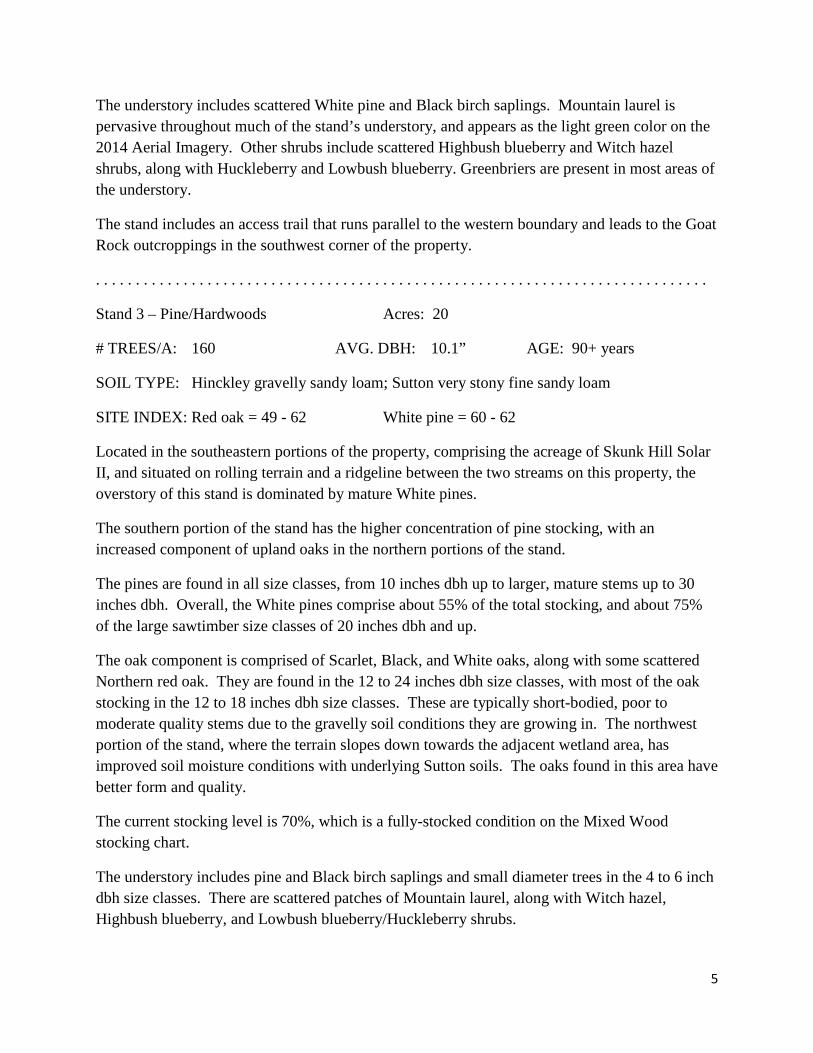
The understory includes scattered White pine and Black birch saplings. Mountain laurel is pervasive throughout much of the stand’s understory, and appears as the light green color on the 2014 Aerial Imagery. Other shrubs include scattered Highbush blueberry and Witch hazel shrubs, along with Huckleberry and Lowbush blueberry. Greenbriers are present in most areas of the understory.
The stand includes an access trail that runs parallel to the western boundary and leads to the Goat Rock outcroppings in the southwest corner of the property.
. . . . . . . . . . . . . . . . . . . . . . . . . . . . . . . . . . . . . . . . . . . . . . . . . . . . . . . . . . . . . . . . . . . . . . . . . . . . .
Stand 3 – Pine/Hardwoods Acres: 20
# TREES/A: 160 AVG. DBH: 10.1” AGE: 90+ years
SOIL TYPE: Hinckley gravelly sandy loam; Sutton very stony fine sandy loam
SITE INDEX: Red oak = 49 - 62 White pine = 60 - 62
Located in the southeastern portions of the property, comprising the acreage of Skunk Hill Solar II, and situated on rolling terrain and a ridgeline between the two streams on this property, the overstory of this stand is dominated by mature White pines.
The southern portion of the stand has the higher concentration of pine stocking, with an increased component of upland oaks in the northern portions of the stand.
The pines are found in all size classes, from 10 inches dbh up to larger, mature stems up to 30 inches dbh. Overall, the White pines comprise about 55% of the total stocking, and about 75% of the large sawtimber size classes of 20 inches dbh and up.
The oak component is comprised of Scarlet, Black, and White oaks, along with some scattered Northern red oak. They are found in the 12 to 24 inches dbh size classes, with most of the oak stocking in the 12 to 18 inches dbh size classes. These are typically short-bodied, poor to moderate quality stems due to the gravelly soil conditions they are growing in. The northwest portion of the stand, where the terrain slopes down towards the adjacent wetland area, has improved soil moisture conditions with underlying Sutton soils. The oaks found in this area have better form and quality.
The current stocking level is 70%, which is a fully-stocked condition on the Mixed Wood stocking chart.
The understory includes pine and Black birch saplings and small diameter trees in the 4 to 6 inch dbh size classes. There are scattered patches of Mountain laurel, along with Witch hazel, Highbush blueberry, and Lowbush blueberry/Huckleberry shrubs.

6
The stand includes a woodland path that runs along the southern edge, on the rim of the valley overlooking the southern stream valley. Visible in the 1939 Aerial Imagery, this was once a cart path that led to Goat Rock, and also branches off to run northeast through the stand. Kept open by ATV’s and hikers, the pine overstory along that southern valley provides a mature canopy over that trail system.
. . . . . . . . . . . . . . . . . . . . . . . . . . . . . . . . . . . . . . . . . . . . . . . . . . . . . . . . . . . . . . . . . . . . . . . . . . . . .
Wetland Areas Acres: 50+/-
SOIL TYPE: Ridgebury extremely stony fine sandy loams
Located in the stream valleys that cut through the central and southern portions of the property, the overstory of this stand, which is not subject to the clearing for the proposed solar project, is comprised of a mix of hardwoods, including mixed oaks, Red maple, Hickory, Black birch, White ash, Tulip poplar, Black gum, and some scattered mature White pines. Some oak mortality was noted in the transitional, lower slope areas of the valleys, where the oak overstory is more dominant and was subjected to the defoliations by Gypsy moths. The understory is typical of forested wetlands, with Highbush blueberry and Clethra (Sweet pepperbush) heavily present in the more saturated sites of the stand. Heavy thickets of Mountain laurel are present within some areas of these wetlands, where soil conditions are not saturated, but are stony and include the stream channels. Summary of Observations: The overall condition of this forested tract is one of diverse species composition, with varying stand density (stocking) conditions. Most of the acreage is dominated by mixed oaks, with White pine comprising a significant component of the southeast area of the property. A significant percentage of the trees are in sizes of 20 inches dbh or larger (approximately 9% on average across the areas to be cleared for the solar arrays). Much of the forest soil and slope conditions are only moderately productive for oak due to the droughty conditions and stoniness on the upland knoll and ridges that limits the ability of the trees to attain any significant height or growth rates. There is an area of mid- to lower slope sites in the central portions of the property, with transition zones where soil moisture conditions improve to provide a more productive site capability, and there are some good quality, maturing oaks in this area. The health conditions of the woodlands include significant impacts to the oak overstory in the upper slope sites due to recent defoliations by Gypsy moth and/or Forest tent caterpillars, and by several years of moderate drought conditions. Along with significant mortality in those sites, there is some observable dieback in the crowns of the surviving upland oaks, and additional

7
mortality may yet occur due to the widespread presence of the two-lined Chestnut borer that attacks weakened and stressed oaks. Projections for more frequent drought events, warmer temperatures, and more severe precipitation events will continue to have a negative impact on the forest health of upland oak stands in Rhode Island. Oaks are susceptible to Gypsy moth and Forest tent caterpillar defoliations, and to the follow-up attacks on stressed trees by the Two-lined Chestnut borer, which may occur with increased frequency as spring droughts become more common.
The pine-dominated forest of the southeast portion of the property, with its underlying gravelly sandy loams, does not appear to have any significant health concerns, although some Gypsy moth defoliation of the upland oaks in the northern portion of that area has impacted the understory pines. High stocking levels of this un-managed stand of pine has led to natural mortality of small diameter pines due to competition.
The weighted average of trees per acre for the 47 acres of woodlands to be cleared for this project equals 142, for a total of 6,704 trees to be removed for this project.
Prepared By: Marc J. Tremblay, CF
MA Forester Lic #239, CT Certified Forester #F-517, RI Lic. Arborist #104
Certification: I hereby attest that the above Forest Assessment Report prepared for the referenced property has been prepared according to the appropriate standards and information available, and the information provided is as accurate as current forestry practices allow.
Marc J. Tremblay, CF Attachments:
• 2014 Imagery with Forest Stands • 2016 Imagery showing GM Defoliation Impacts • Topographical Map • USDA Web Soil Survey Map & Report (Forestland Productivity) (12pp)


United StatesDepartment ofAgriculture
A product of the NationalCooperative Soil Survey,a joint effort of the UnitedStates Department ofAgriculture and otherFederal agencies, Stateagencies including theAgricultural ExperimentStations, and localparticipants
Custom Soil Resource Report forState of Rhode Island: Bristol, Kent, Newport, Providence, and Washington CountiesSkunk Hill I & II Solar, Hopkinton, RI
NaturalResourcesConservationService
December 27, 2018

6
Custom Soil Resource ReportSoil Map
4599
700
4599
900
4600
100
4600
300
4600
500
4600
700
4600
900
4601
100
4601
300
4601
500
4599
700
4599
900
4600
100
4600
300
4600
500
4600
700
4600
900
4601
100
4601
300
4601
500
273200 273400 273600 273800 274000 274200 274400
273000 273200 273400 273600 273800 274000 274200 274400
41° 32' 2'' N71
° 4
3' 1
3'' W
41° 32' 2'' N
71° 4
2' 9
'' W
41° 30' 59'' N
71° 4
3' 1
3'' W
41° 30' 59'' N
71° 4
2' 9
'' W
N
Map projection: Web Mercator Corner coordinates: WGS84 Edge tics: UTM Zone 19N WGS840 450 900 1800 2700
Feet0 100 200 400 600
MetersMap Scale: 1:9,570 if printed on A portrait (8.5" x 11") sheet.

MA
P LE
GEN
DM
AP
INFO
RM
ATIO
N
Are
a of
Inte
rest
(AO
I)A
rea
of In
tere
st (A
OI)
Soils
Soi
l Map
Uni
t Pol
ygon
s
Soi
l Map
Uni
t Lin
es
Soi
l Map
Uni
t Poi
nts
Spec
ial P
oint
Fea
ture
sB
low
out
Bor
row
Pit
Cla
y S
pot
Clo
sed
Dep
ress
ion
Gra
vel P
it
Gra
velly
Spo
t
Land
fill
Lava
Flo
w
Mar
sh o
r sw
amp
Min
e or
Qua
rry
Mis
cella
neou
s W
ater
Per
enni
al W
ater
Roc
k O
utcr
op
Sal
ine
Spo
t
San
dy S
pot
Sev
erel
y E
rode
d S
pot
Sin
khol
e
Slid
e or
Slip
Sod
ic S
pot
Spo
il A
rea
Sto
ny S
pot
Very
Sto
ny S
pot
Wet
Spo
t
Oth
er
Spe
cial
Lin
e Fe
atur
es
Wat
er F
eatu
res
Stre
ams
and
Can
als
Tran
spor
tatio
nR
ails
Inte
rsta
te H
ighw
ays
US
Rou
tes
Maj
or R
oads
Loca
l Roa
ds
Bac
kgro
und A
eria
l Pho
togr
aphy
The
soil
surv
eys
that
com
pris
e yo
ur A
OI w
ere
map
ped
at
1:12
,000
.
Ple
ase
rely
on
the
bar s
cale
on
each
map
she
et fo
r map
m
easu
rem
ents
.
Sou
rce
of M
ap:
Nat
ural
Res
ourc
es C
onse
rvat
ion
Ser
vice
Web
Soi
l Sur
vey
UR
L:
Coo
rdin
ate
Sys
tem
: W
eb M
erca
tor (
EP
SG
:385
7)
Map
s fro
m th
e W
eb S
oil S
urve
y ar
e ba
sed
on th
e W
eb M
erca
tor
proj
ectio
n, w
hich
pre
serv
es d
irect
ion
and
shap
e bu
t dis
torts
di
stan
ce a
nd a
rea.
A p
roje
ctio
n th
at p
rese
rves
are
a, s
uch
as th
e A
lber
s eq
ual-a
rea
coni
c pr
ojec
tion,
sho
uld
be u
sed
if m
ore
accu
rate
cal
cula
tions
of d
ista
nce
or a
rea
are
requ
ired.
This
pro
duct
is g
ener
ated
from
the
US
DA
-NR
CS
cer
tifie
d da
ta a
s of
the
vers
ion
date
(s) l
iste
d be
low
.
Soi
l Sur
vey
Are
a:
Sta
te o
f Rho
de Is
land
: Bris
tol,
Ken
t, N
ewpo
rt,
Pro
vide
nce,
and
Was
hing
ton
Cou
ntie
sS
urve
y A
rea
Dat
a:
Vers
ion
18, D
ec 6
, 201
8
Soi
l map
uni
ts a
re la
bele
d (a
s sp
ace
allo
ws)
for m
ap s
cale
s 1:
50,0
00 o
r lar
ger.
Dat
e(s)
aer
ial i
mag
es w
ere
phot
ogra
phed
: M
ay 1
4, 2
010—
Apr
1,
201
7
The
orth
opho
to o
r oth
er b
ase
map
on
whi
ch th
e so
il lin
es w
ere
com
pile
d an
d di
gitiz
ed p
roba
bly
diffe
rs fr
om th
e ba
ckgr
ound
im
ager
y di
spla
yed
on th
ese
map
s. A
s a
resu
lt, s
ome
min
or
shift
ing
of m
ap u
nit b
ound
arie
s m
ay b
e ev
iden
t.
Cus
tom
Soi
l Res
ourc
e R
epor
t
7

Map Unit Legend
Map Unit Symbol Map Unit Name Acres in AOI Percent of AOI
CaC Canton-Charlton-Rock outcrop complex, 3 to 15 percent slopes
55.3 32.8%
CaD Canton-Charlton-Rock outcrop complex, 15 to 35 percent slopes, very stony
4.8 2.8%
CeC Canton and Charlton fine sandy loams, 3 to 15 percent slopes, very rocky
0.0 0.0%
EfA Enfield silt loam, 0 to 3 percent slopes
5.7 3.4%
EfB Enfield silt loam, 3 to 8 percent slopes
4.7 2.8%
HkA Hinckley loamy sand, 0 to 3 percent slopes
1.5 0.9%
HkC Hinckley loamy sand, 8 to 15 percent slopes
23.5 14.0%
HkD Hinckley loamy sand, 15 to 25 percent slopes
0.0 0.0%
MmA Merrimac fine sandy loam, 0 to 3 percent slopes
3.2 1.9%
PaB Paxton fine sandy loam, 3 to 8 percent slopes
0.6 0.4%
Pg Pits, gravel 1.3 0.7%
Rf Ridgebury, Leicester, and Whitman soils, 0 to 8 percent slopes, extremely stony
20.3 12.0%
Rp Rock outcrop-Canton complex, 0 to 35 percent slopes, very stony
1.3 0.8%
Sb Scarboro mucky fine sandy loam, 0 to 3 percent slopes
15.2 9.0%
Ss Sudbury sandy loam 0.1 0.0%
SuB Sutton fine sandy loam, 0 to 8 percent slopes, very stony
5.8 3.4%
Tb Tisbury silt loam 2.4 1.4%
Wa Walpole sandy loam, 0 to 3 percent slopes
1.7 1.0%
WhA Woodbridge fine sandy loam, 0 to 3 percent slopes
13.5 8.0%
WoB Woodbridge fine sandy loam, 0 to 8 percent slopes, very stony
7.4 4.4%
Custom Soil Resource Report
8

Map Unit Symbol Map Unit Name Acres in AOI Percent of AOI
WrB Woodbridge fine sandy loam, 0 to 8 percent slopes, extremely stony
0.3 0.2%
Totals for Area of Interest 168.5 100.0%
Custom Soil Resource Report
9

Soil Information for All Uses
Soil ReportsThe Soil Reports section includes various formatted tabular and narrative reports (tables) containing data for each selected soil map unit and each component of each unit. No aggregation of data has occurred as is done in reports in the Soil Properties and Qualities and Suitabilities and Limitations sections.
The reports contain soil interpretive information as well as basic soil properties and qualities. A description of each report (table) is included.
Vegetative Productivity
This folder contains a collection of tabular reports that present vegetative productivity data. The reports (tables) include all selected map units and components for each map unit. Vegetative productivity includes estimates of potential vegetative production for a variety of land uses, including cropland, forestland, hayland, pastureland, horticulture and rangeland. In the underlying database, some states maintain crop yield data by individual map unit component. Other states maintain the data at the map unit level. Attributes are included for both, although only one or the other is likely to contain data for any given geographic area. For other land uses, productivity data is shown only at the map unit component level. Examples include potential crop yields under irrigated and nonirrigated conditions, forest productivity, forest site index, and total rangeland production under of normal, favorable and unfavorable conditions.
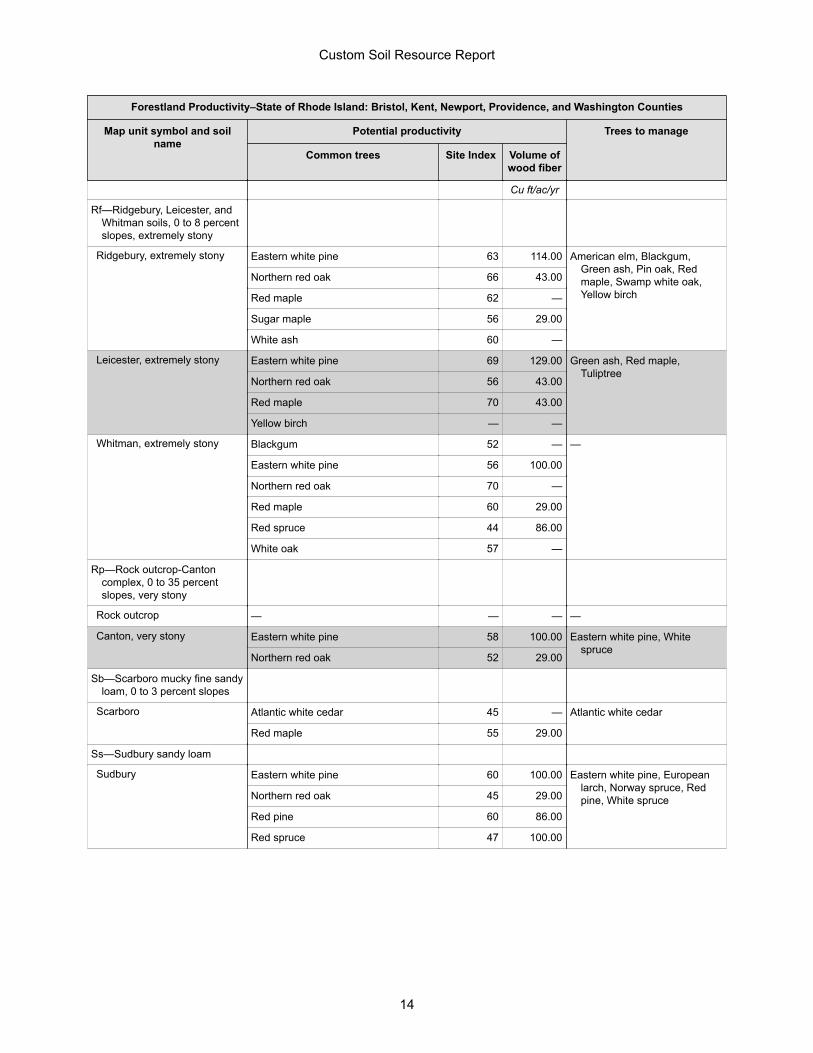
Forestland Productivity
This table can help forestland owners or managers plan the use of soils for wood crops. It shows the potential productivity of the soils for wood crops.
Potential productivity of merchantable or common trees on a soil is expressed as a site index and as a volume number. The site index is the average height, in feet, that dominant and codominant trees of a given species attain in a specified number of years. The site index applies to fully stocked, even-aged, unmanaged stands. Commonly grown trees are those that forestland managers generally favor in intermediate or improvement cuttings. They are selected on the basis of growth rate, quality, value, and marketability. More detailed information regarding site index is available in the "National Forestry Manual," which is available in local offices of the Natural Resources Conservation Service or on the Internet.
10
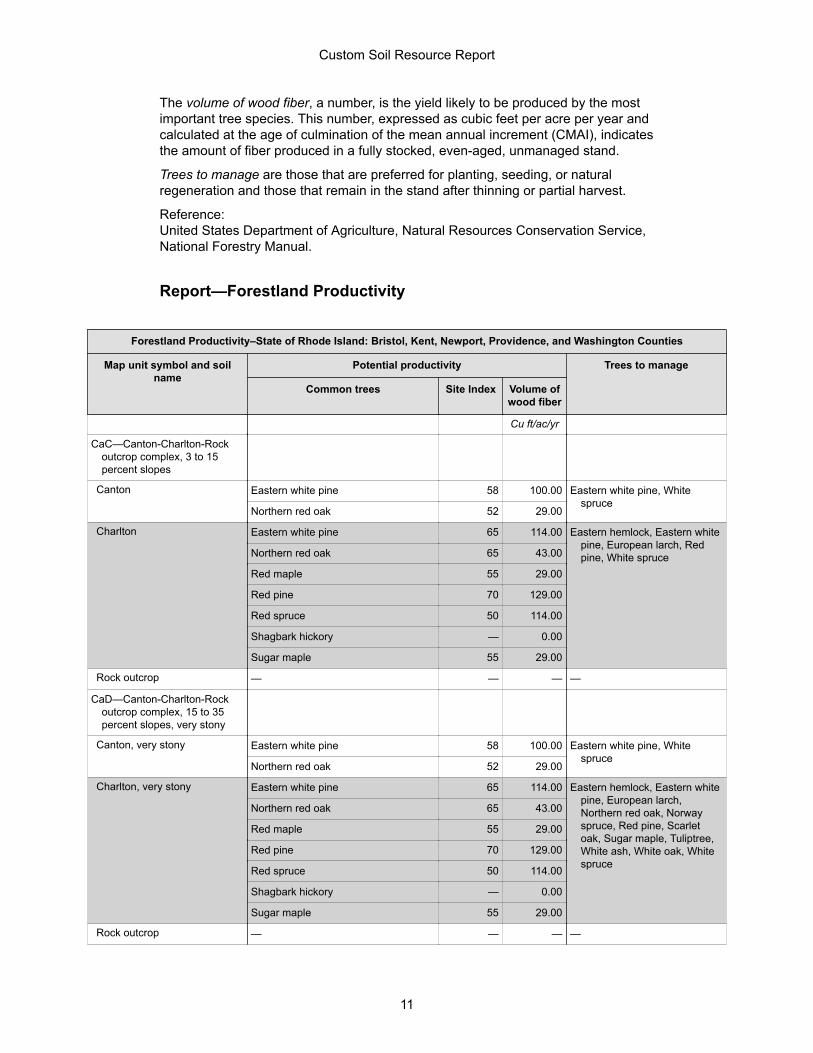
The volume of wood fiber, a number, is the yield likely to be produced by the most important tree species. This number, expressed as cubic feet per acre per year and calculated at the age of culmination of the mean annual increment (CMAI), indicates the amount of fiber produced in a fully stocked, even-aged, unmanaged stand.
Trees to manage are those that are preferred for planting, seeding, or natural regeneration and those that remain in the stand after thinning or partial harvest.
Reference:United States Department of Agriculture, Natural Resources Conservation Service, National Forestry Manual.
Report—Forestland Productivity
Forestland Productivity–State of Rhode Island: Bristol, Kent, Newport, Providence, and Washington Counties
Map unit symbol and soil name
Potential productivity Trees to manage
Common trees Site Index Volume of wood fiber
Cu ft/ac/yr
CaC—Canton-Charlton-Rock outcrop complex, 3 to 15 percent slopes
Canton Eastern white pine 58 100.00 Eastern white pine, White spruce
Northern red oak 52 29.00
Charlton Eastern white pine 65 114.00 Eastern hemlock, Eastern white pine, European larch, Red pine, White spruceNorthern red oak 65 43.00
Red maple 55 29.00
Red pine 70 129.00
Red spruce 50 114.00
Shagbark hickory — 0.00
Sugar maple 55 29.00
Rock outcrop — — — —
CaD—Canton-Charlton-Rock outcrop complex, 15 to 35 percent slopes, very stony
Canton, very stony Eastern white pine 58 100.00 Eastern white pine, White spruce
Northern red oak 52 29.00
Charlton, very stony Eastern white pine 65 114.00 Eastern hemlock, Eastern white pine, European larch, Northern red oak, Norway spruce, Red pine, Scarlet oak, Sugar maple, Tuliptree, White ash, White oak, White spruce
Northern red oak 65 43.00
Red maple 55 29.00
Red pine 70 129.00
Red spruce 50 114.00
Shagbark hickory — 0.00
Sugar maple 55 29.00
Rock outcrop — — — —
Custom Soil Resource Report
11

Forestland Productivity–State of Rhode Island: Bristol, Kent, Newport, Providence, and Washington Counties
Map unit symbol and soil name
Potential productivity Trees to manage
Common trees Site Index Volume of wood fiber
Cu ft/ac/yr
CeC—Canton and Charlton fine sandy loams, 3 to 15 percent slopes, very rocky
Canton, very stony Eastern hemlock — — Beech, Bitternut hickory, Black oak, Eastern hemlock, Eastern white pine, Gray birch, Mockernut hickory, Northern red oak, Pignut hickory, Red maple, Shagbark hickory, Sugar maple, White ash, White oak, Yellow birch
Eastern white pine 58 100.00
Northern red oak 52 29.00
Red maple 55 29.00
Shagbark hickory — 0.00
Sugar maple 55 29.00
White oak — —
Charlton, very stony Eastern white pine 65 114.00 Eastern white pine, European larch, Northern red oak, Norway spruce, Red pine, Scarlet oak, Sugar maple, Tuliptree, White ash, White oak
Northern red oak 65 43.00
Red maple 55 29.00
Red pine 70 129.00
Red spruce 50 114.00
Shagbark hickory — 0.00
Sugar maple 55 29.00
EfA—Enfield silt loam, 0 to 3 percent slopes
Enfield Eastern white pine 74 129.00 Eastern white pine, European larch
Northern red oak 65 43.00
Shagbark hickory — 0.00
EfB—Enfield silt loam, 3 to 8 percent slopes
Enfield Eastern white pine 74 129.00 Eastern white pine, European larch
Northern red oak 65 43.00
Shagbark hickory — 0.00
HkA—Hinckley loamy sand, 0 to 3 percent slopes
Hinckley Eastern white pine 61 100.00 Black oak, Eastern white pine, Pitch pine
Northern red oak 49 29.00
Paper birch 60 54.00
Pitch pine 60 —
Red pine 54 92.00
Red spruce 39 86.00
Sugar maple 59 30.00
White spruce 52 114.00
Custom Soil Resource Report
12

Forestland Productivity–State of Rhode Island: Bristol, Kent, Newport, Providence, and Washington Counties
Map unit symbol and soil name
Potential productivity Trees to manage
Common trees Site Index Volume of wood fiber
Cu ft/ac/yr
HkC—Hinckley loamy sand, 8 to 15 percent slopes
Hinckley Eastern white pine 61 100.00 Black oak, Eastern white pine, Pitch pine
Northern red oak 49 29.00
Paper birch 60 54.00
Pitch pine 60 —
Red pine 54 92.00
Red spruce 39 86.00
Sugar maple 59 30.00
White spruce 52 114.00
HkD—Hinckley loamy sand, 15 to 25 percent slopes
Hinckley Eastern white pine 61 100.00 Black oak, Eastern white pine, Pitch pine
Northern red oak 49 29.00
Paper birch 60 54.00
Pitch pine 60 —
Red pine 54 92.00
Red spruce 39 86.00
Sugar maple 59 30.00
White spruce 52 114.00
MmA—Merrimac fine sandy loam, 0 to 3 percent slopes
Merrimac — — — —
PaB—Paxton fine sandy loam, 3 to 8 percent slopes
Paxton Black oak 67 — Eastern white pine, European larch, Northern red oak, Norway spruce, Red pine, Scarlet oak, Sugar maple, Tuliptree, White ash, White oak
Eastern white pine 72 114.00
European larch 80 —
Northern red oak 68 43.00
Red pine 70 —
Scarlet oak 67 —
Sugar maple 75 43.00
White ash 89 —
White oak 60 —
Pg—Pits, gravel
Pits — — — —
Custom Soil Resource Report
13
Forestland Productivity–State of Rhode Island: Bristol, Kent, Newport, Providence, and Washington Counties
Map unit symbol and soil name
Potential productivity Trees to manage
Common trees Site Index Volume of wood fiber
Cu ft/ac/yr
Rf—Ridgebury, Leicester, and Whitman soils, 0 to 8 percent slopes, extremely stony
Ridgebury, extremely stony Eastern white pine 63 114.00 American elm, Blackgum, Green ash, Pin oak, Red maple, Swamp white oak, Yellow birch
Northern red oak 66 43.00
Red maple 62 —
Sugar maple 56 29.00
White ash 60 —
Leicester, extremely stony Eastern white pine 69 129.00 Green ash, Red maple, Tuliptree
Northern red oak 56 43.00
Red maple 70 43.00
Yellow birch — —
Whitman, extremely stony Blackgum 52 — —
Eastern white pine 56 100.00
Northern red oak 70 —
Red maple 60 29.00
Red spruce 44 86.00
White oak 57 —
Rp—Rock outcrop-Canton complex, 0 to 35 percent slopes, very stony
Rock outcrop — — — —
Canton, very stony Eastern white pine 58 100.00 Eastern white pine, White spruce
Northern red oak 52 29.00
Sb—Scarboro mucky fine sandy loam, 0 to 3 percent slopes
Scarboro Atlantic white cedar 45 — Atlantic white cedar
Red maple 55 29.00
Ss—Sudbury sandy loam
Sudbury Eastern white pine 60 100.00 Eastern white pine, European larch, Norway spruce, Red pine, White spruceNorthern red oak 45 29.00
Red pine 60 86.00
Red spruce 47 100.00
Custom Soil Resource Report
14
Forestland Productivity–State of Rhode Island: Bristol, Kent, Newport, Providence, and Washington Counties
Map unit symbol and soil name
Potential productivity Trees to manage
Common trees Site Index Volume of wood fiber
Cu ft/ac/yr
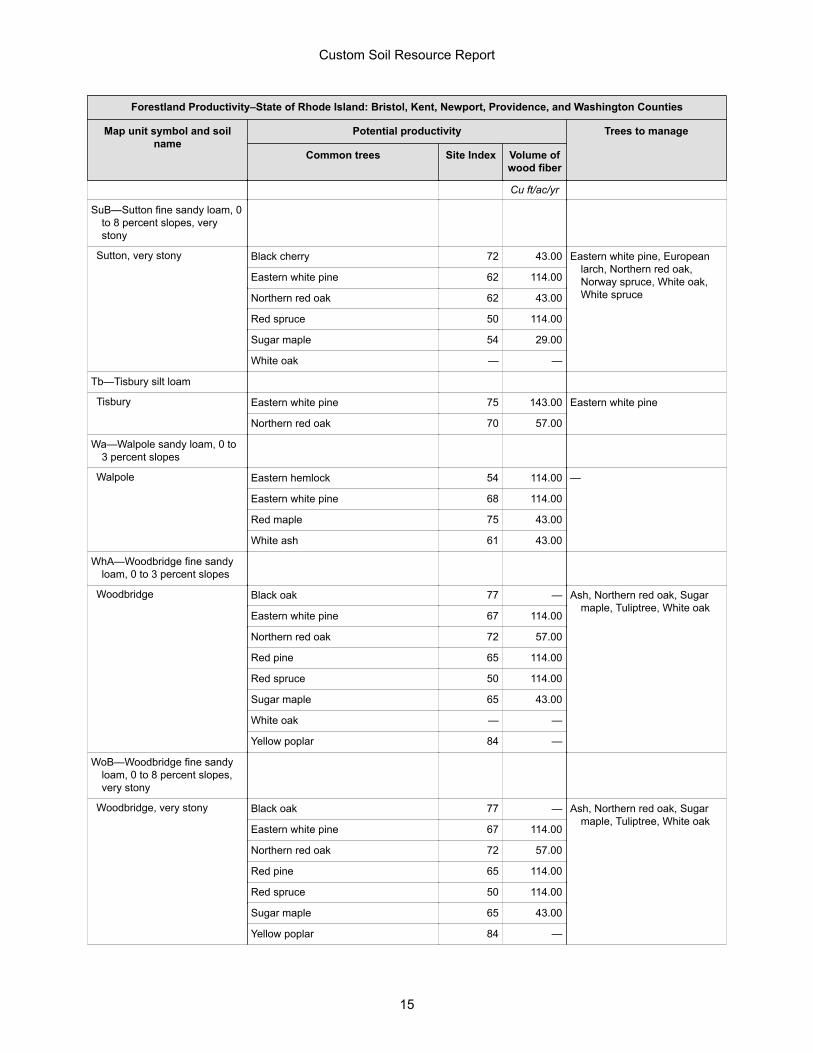
SuB—Sutton fine sandy loam, 0 to 8 percent slopes, very stony
Sutton, very stony Black cherry 72 43.00 Eastern white pine, European larch, Northern red oak, Norway spruce, White oak, White spruce
Eastern white pine 62 114.00
Northern red oak 62 43.00
Red spruce 50 114.00
Sugar maple 54 29.00
White oak — —
Tb—Tisbury silt loam
Tisbury Eastern white pine 75 143.00 Eastern white pine
Northern red oak 70 57.00
Wa—Walpole sandy loam, 0 to 3 percent slopes
Walpole Eastern hemlock 54 114.00 —
Eastern white pine 68 114.00
Red maple 75 43.00
White ash 61 43.00
WhA—Woodbridge fine sandy loam, 0 to 3 percent slopes
Woodbridge Black oak 77 — Ash, Northern red oak, Sugar maple, Tuliptree, White oak
Eastern white pine 67 114.00
Northern red oak 72 57.00
Red pine 65 114.00
Red spruce 50 114.00
Sugar maple 65 43.00
White oak — —
Yellow poplar 84 —
WoB—Woodbridge fine sandy loam, 0 to 8 percent slopes, very stony
Woodbridge, very stony Black oak 77 — Ash, Northern red oak, Sugar maple, Tuliptree, White oak
Eastern white pine 67 114.00
Northern red oak 72 57.00
Red pine 65 114.00
Red spruce 50 114.00
Sugar maple 65 43.00
Yellow poplar 84 —
Custom Soil Resource Report
15

Forestland Productivity–State of Rhode Island: Bristol, Kent, Newport, Providence, and Washington Counties
Map unit symbol and soil name
Potential productivity Trees to manage
Common trees Site Index Volume of wood fiber
Cu ft/ac/yr
WrB—Woodbridge fine sandy loam, 0 to 8 percent slopes, extremely stony
Woodbridge, extremely stony Black oak 77 — Ash, Northern red oak, Sugar maple, Tuliptree, White oak
Eastern white pine 67 114.00
Northern red oak 72 57.00
Red pine 65 114.00
Red spruce 50 114.00
Sugar maple 65 43.00
Yellow poplar 84 —
Custom Soil Resource Report
16