Embed Size (px)
Citation preview
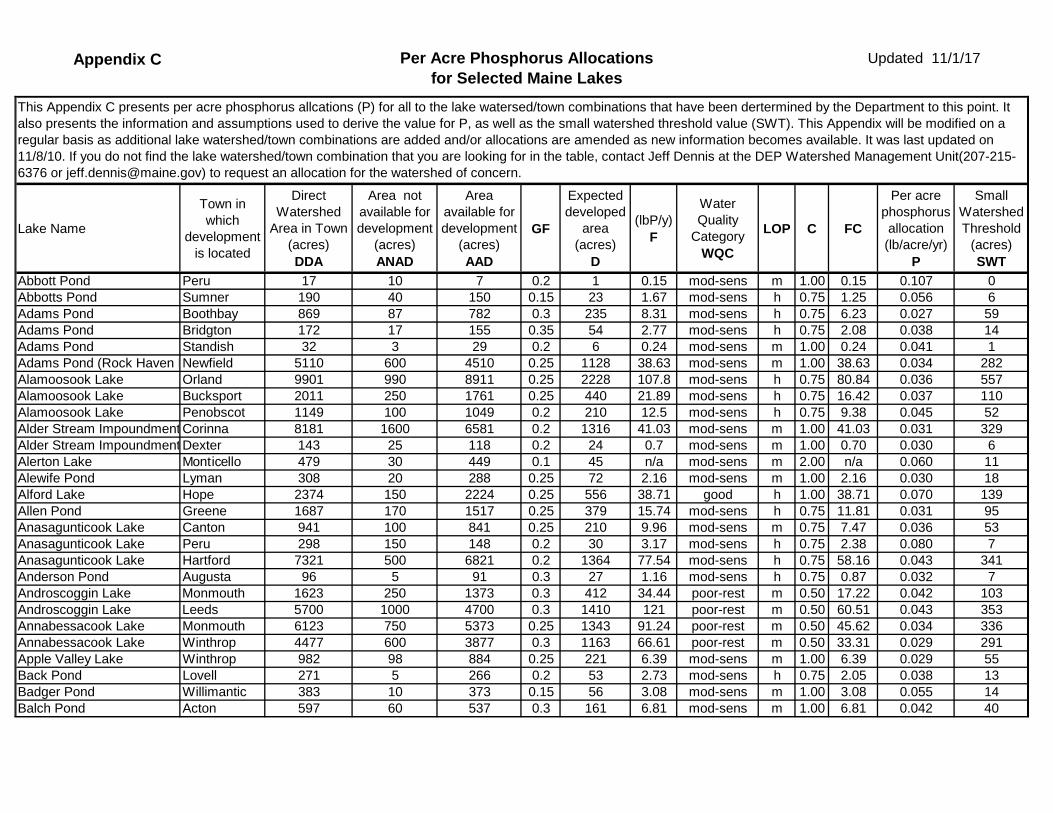
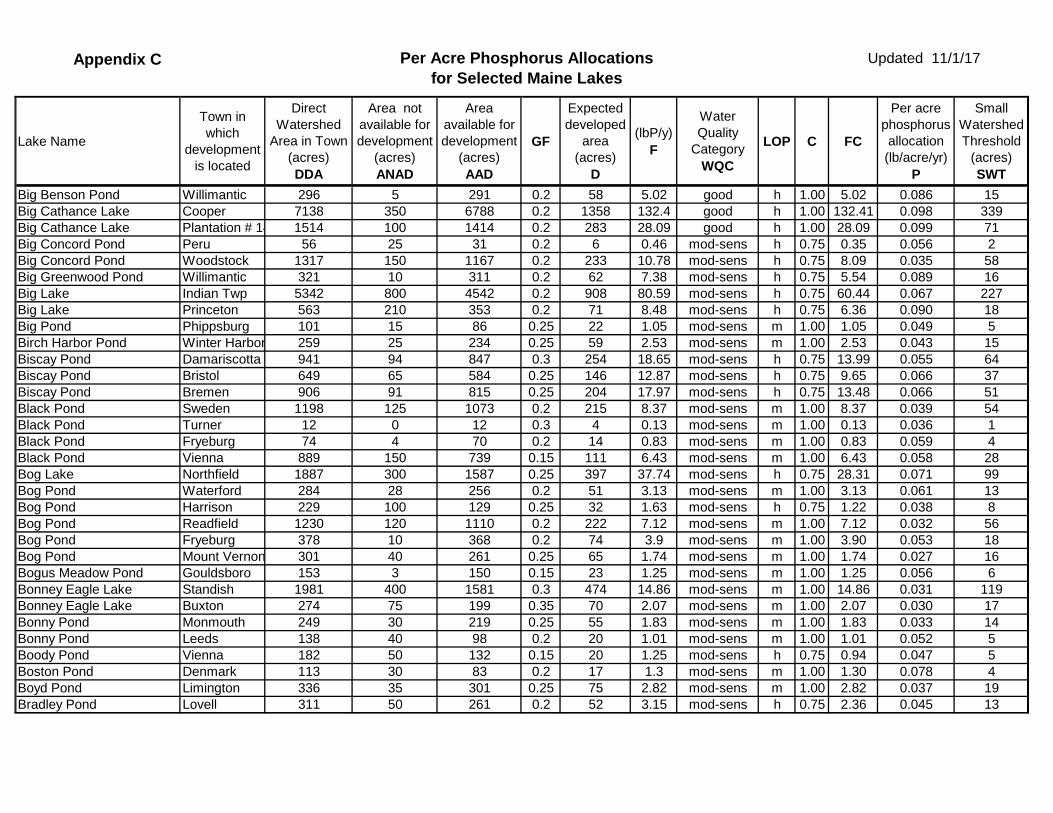
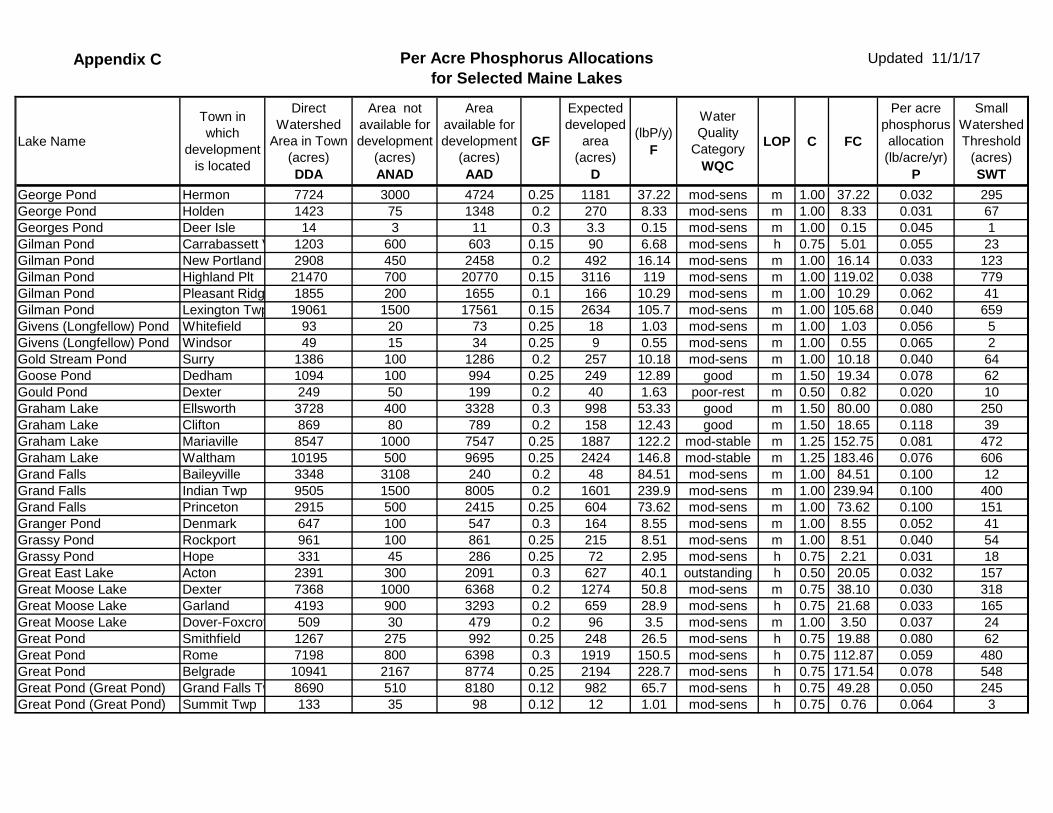
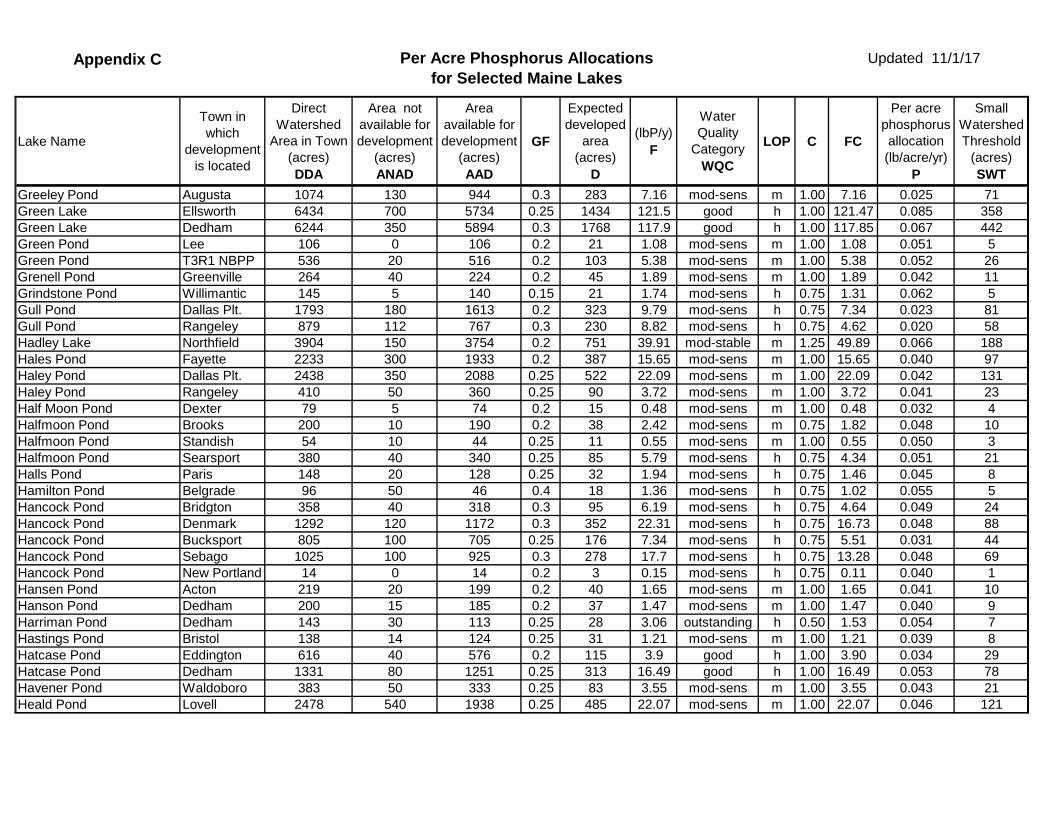
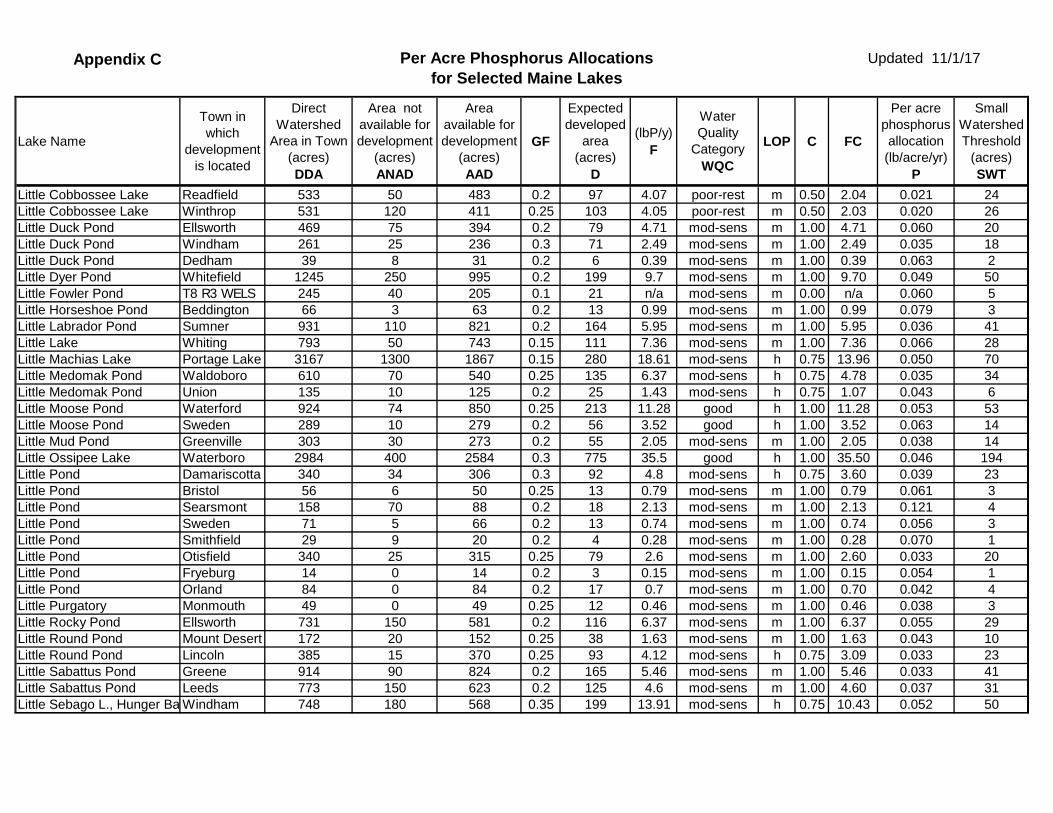
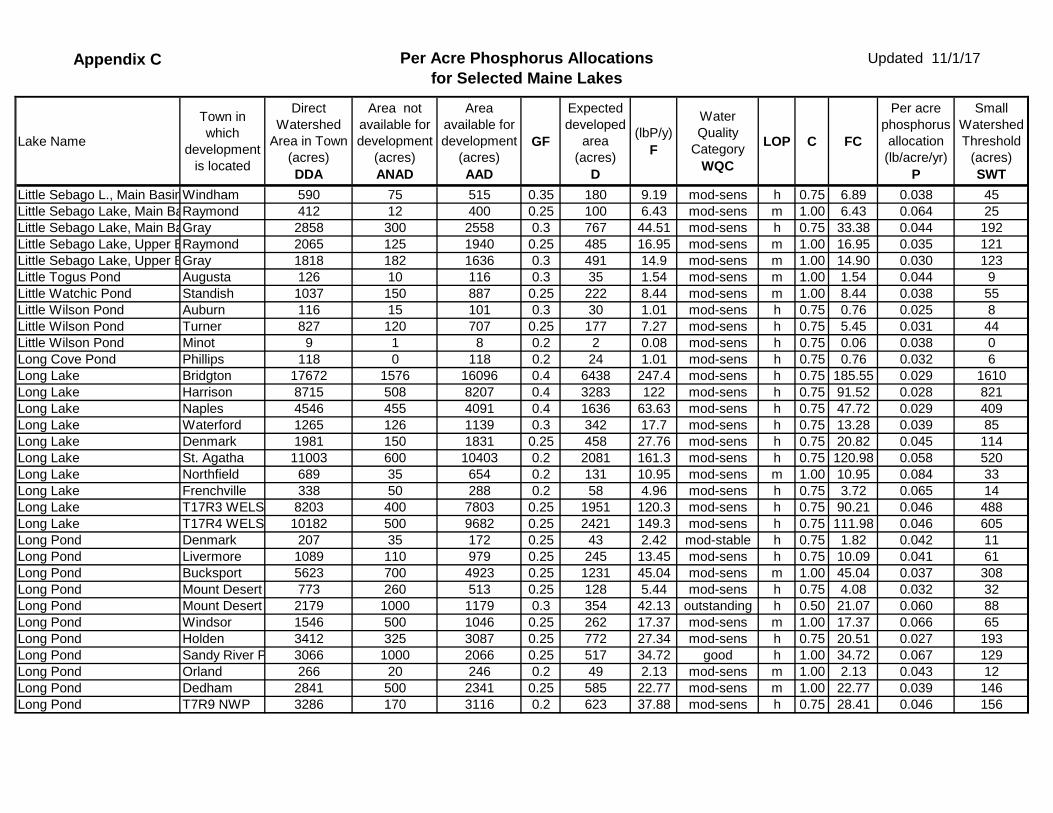
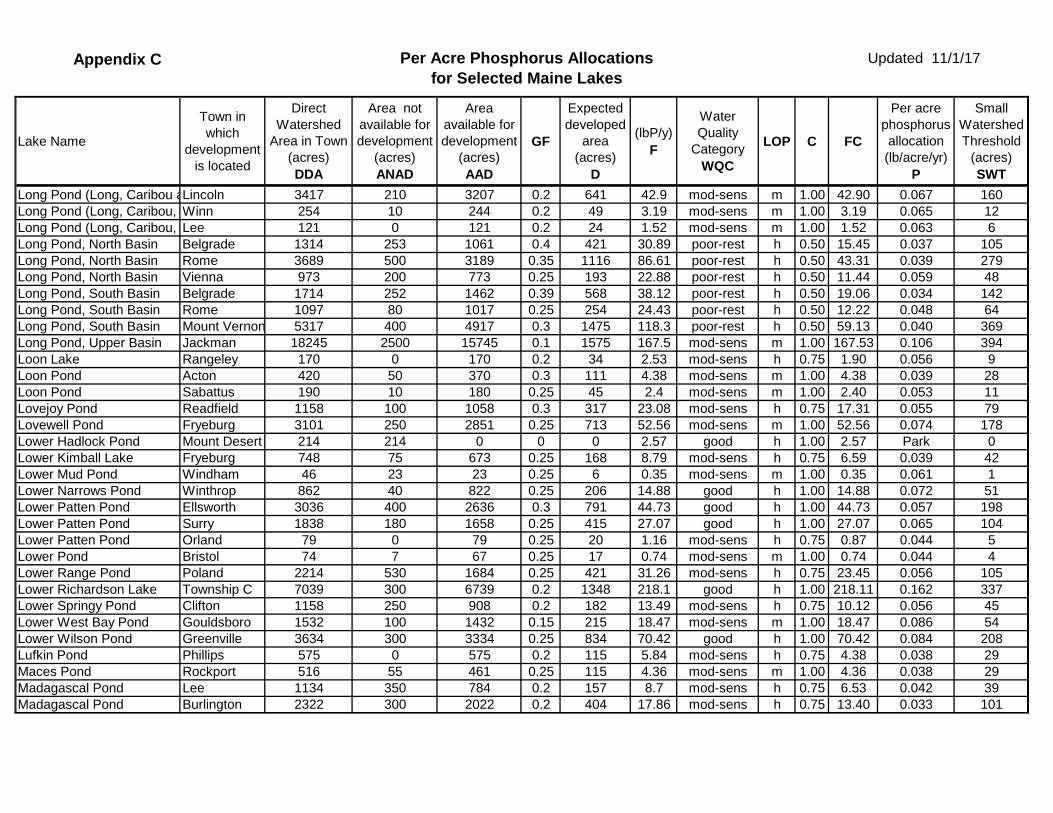
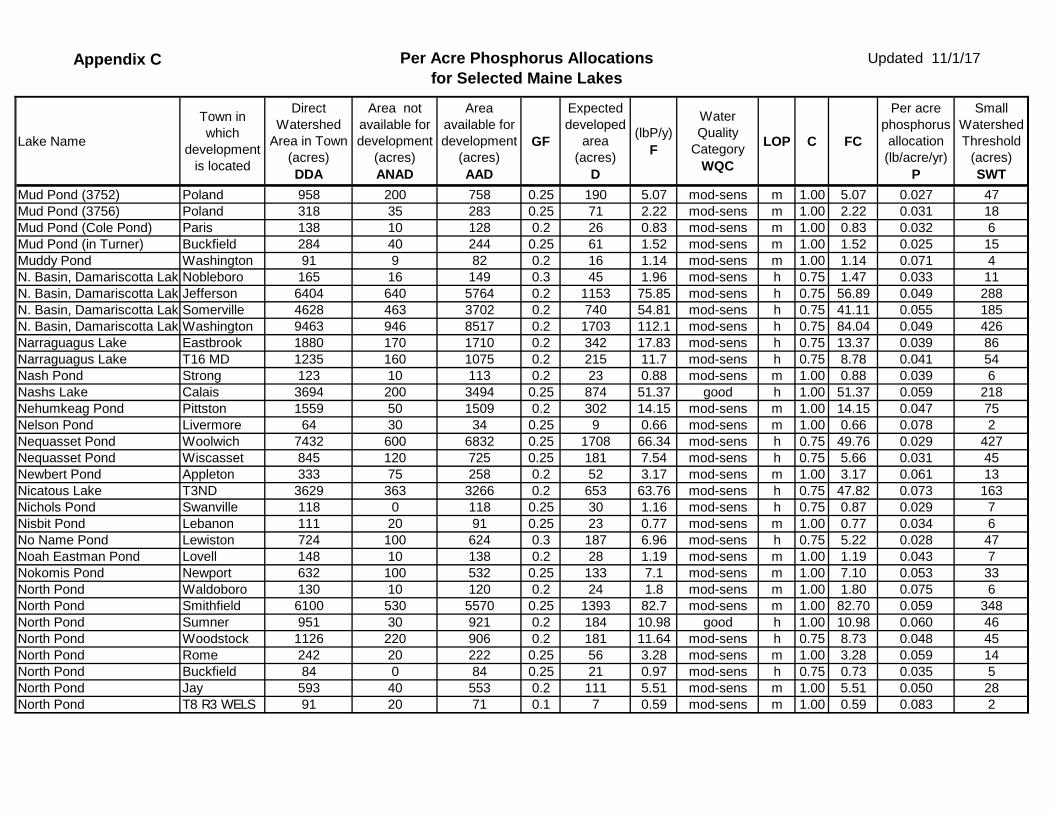
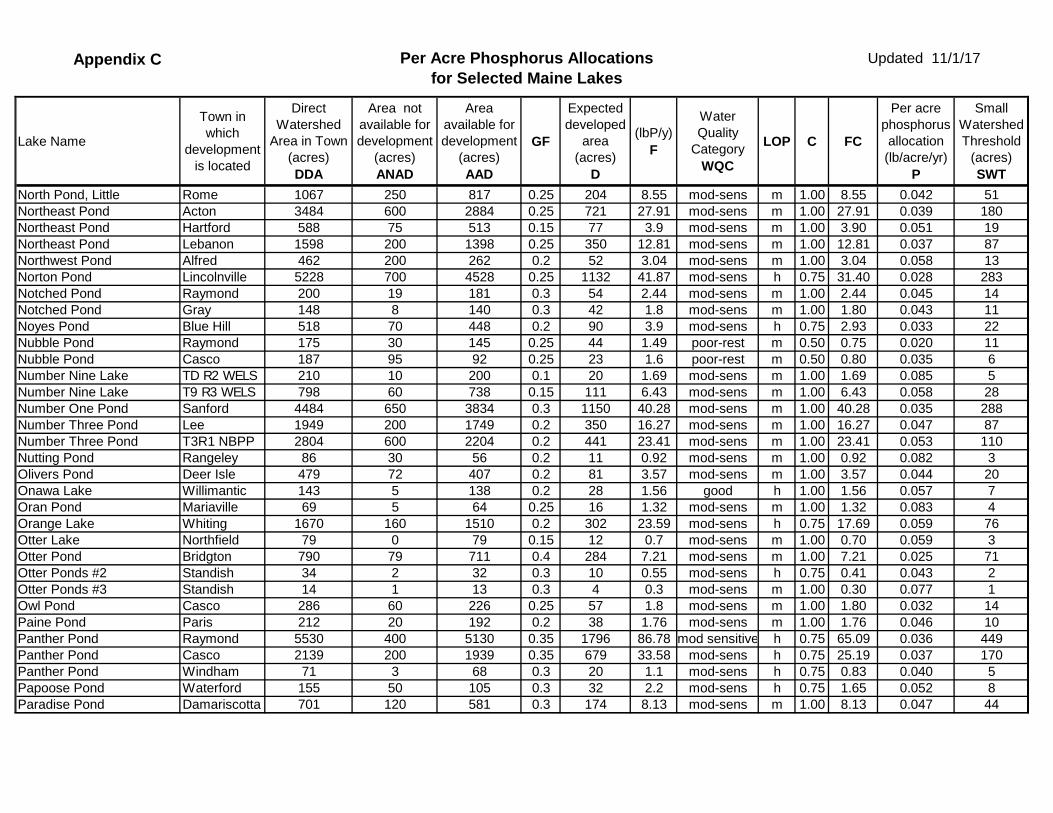
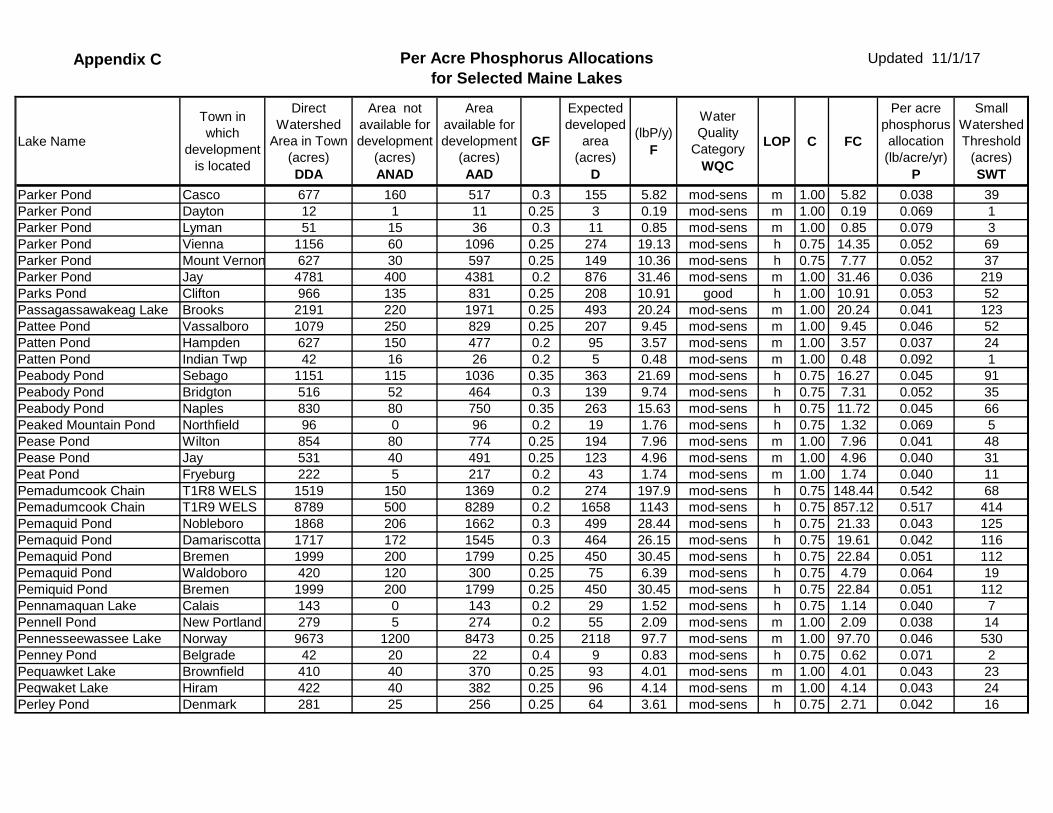
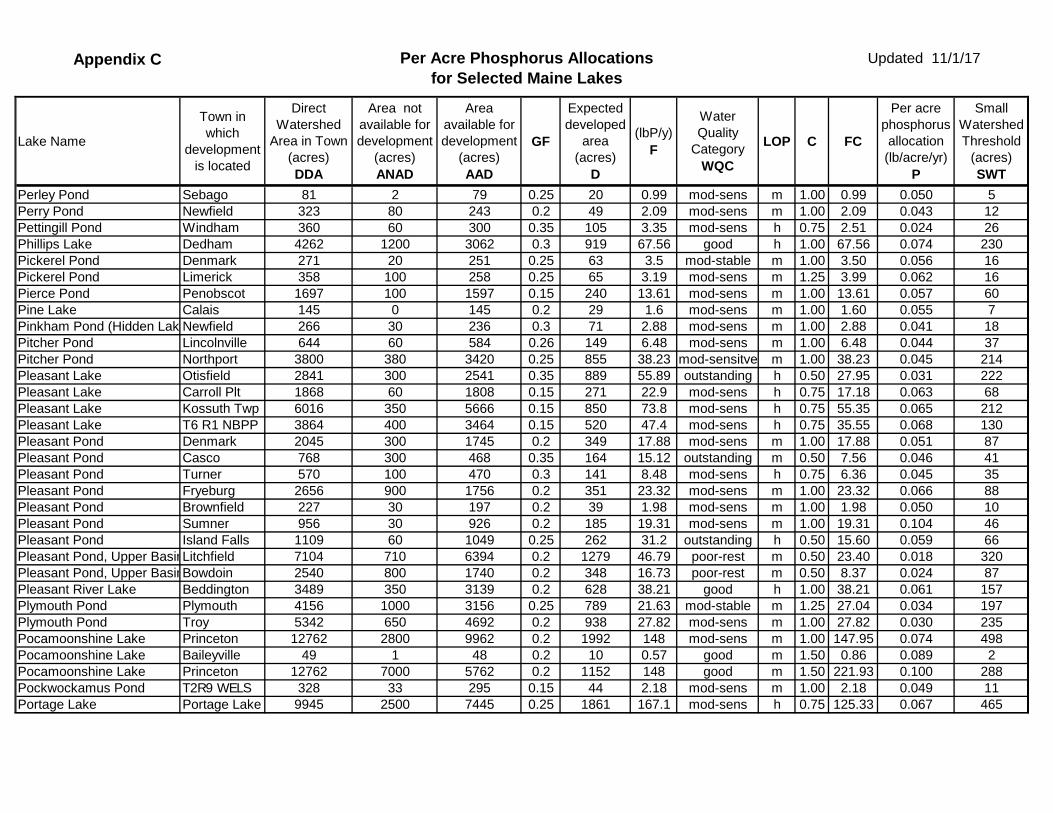
Appendix C Per Acre Phosphorus Allocationsfor Selected Maine Lakes
Updated 11/1/17
Lake Name
Town in which
development is located
Direct Watershed
Area in Town (acres) DDA
Area not available for development
(acres) ANAD
Area available for development
(acres) AAD
GF
Expected developed
area (acres)
D
(lbP/y) F
Water Quality
Category WQC
LOP C FC
Per acre phosphorus allocation (lb/acre/yr)
P
Small Watershed Threshold
(acres) SWT
Abbott Pond Peru 17 10 7 0.2 1 0.15 mod-sens m 1.00 0.15 0.107 0Abbotts Pond Sumner 190 40 150 0.15 23 1.67 mod-sens h 0.75 1.25 0.056 6Adams Pond Boothbay 869 87 782 0.3 235 8.31 mod-sens h 0.75 6.23 0.027 59Adams Pond Bridgton 172 17 155 0.35 54 2.77 mod-sens h 0.75 2.08 0.038 14Adams Pond Standish 32 3 29 0.2 6 0.24 mod-sens m 1.00 0.24 0.041 1Adams Pond (Rock Haven LNewfield 5110 600 4510 0.25 1128 38.63 mod-sens m 1.00 38.63 0.034 282Alamoosook Lake Orland 9901 990 8911 0.25 2228 107.8 mod-sens h 0.75 80.84 0.036 557Alamoosook Lake Bucksport 2011 250 1761 0.25 440 21.89 mod-sens h 0.75 16.42 0.037 110Alamoosook Lake Penobscot 1149 100 1049 0.2 210 12.5 mod-sens h 0.75 9.38 0.045 52Alder Stream Impoundment Corinna 8181 1600 6581 0.2 1316 41.03 mod-sens m 1.00 41.03 0.031 329Alder Stream Impoundment Dexter 143 25 118 0.2 24 0.7 mod-sens m 1.00 0.70 0.030 6Alerton Lake Monticello 479 30 449 0.1 45 n/a mod-sens m 2.00 n/a 0.060 11Alewife Pond Lyman 308 20 288 0.25 72 2.16 mod-sens m 1.00 2.16 0.030 18Alford Lake Hope 2374 150 2224 0.25 556 38.71 good h 1.00 38.71 0.070 139Allen Pond Greene 1687 170 1517 0.25 379 15.74 mod-sens h 0.75 11.81 0.031 95Anasagunticook Lake Canton 941 100 841 0.25 210 9.96 mod-sens m 0.75 7.47 0.036 53Anasagunticook Lake Peru 298 150 148 0.2 30 3.17 mod-sens h 0.75 2.38 0.080 7Anasagunticook Lake Hartford 7321 500 6821 0.2 1364 77.54 mod-sens h 0.75 58.16 0.043 341Anderson Pond Augusta 96 5 91 0.3 27 1.16 mod-sens h 0.75 0.87 0.032 7Androscoggin Lake Monmouth 1623 250 1373 0.3 412 34.44 poor-rest m 0.50 17.22 0.042 103Androscoggin Lake Leeds 5700 1000 4700 0.3 1410 121 poor-rest m 0.50 60.51 0.043 353Annabessacook Lake Monmouth 6123 750 5373 0.25 1343 91.24 poor-rest m 0.50 45.62 0.034 336Annabessacook Lake Winthrop 4477 600 3877 0.3 1163 66.61 poor-rest m 0.50 33.31 0.029 291Apple Valley Lake Winthrop 982 98 884 0.25 221 6.39 mod-sens m 1.00 6.39 0.029 55Back Pond Lovell 271 5 266 0.2 53 2.73 mod-sens h 0.75 2.05 0.038 13Badger Pond Willimantic 383 10 373 0.15 56 3.08 mod-sens m 1.00 3.08 0.055 14Balch Pond Acton 597 60 537 0.3 161 6.81 mod-sens m 1.00 6.81 0.042 40
This Appendix C presents per acre phosphorus allcations (P) for all to the lake watersed/town combinations that have been dertermined by the Department to this point. It also presents the information and assumptions used to derive the value for P, as well as the small watershed threshold value (SWT). This Appendix will be modified on a regular basis as additional lake watershed/town combinations are added and/or allocations are amended as new information becomes available. It was last updated on 11/8/10. If you do not find the lake watershed/town combination that you are looking for in the table, contact Jeff Dennis at the DEP Watershed Management Unit(207-215-6376 or [email protected]) to request an allocation for the watershed of concern.

Appendix C Per Acre Phosphorus Allocationsfor Selected Maine Lakes
Updated 11/1/17
Lake Name
Town in which
development is located
Direct Watershed
Area in Town (acres) DDA
Area not available for development
(acres) ANAD
Area available for development
(acres) AAD
GF
Expected developed
area (acres)
D
(lbP/y) F
Water Quality
Category WQC
LOP C FC
Per acre phosphorus allocation (lb/acre/yr)
P
Small Watershed Threshold
(acres) SWT
Balch Pond & Stump Pond Newfield 2194 500 1694 0.3 508 24.96 mod-sens m 1.00 24.96 0.049 127Barker Pond Denmark 911 50 861 0.2 172 12.85 mod-sens h 0.75 9.64 0.056 43Barker Pond Sebago 1062 100 962 0.25 241 15.01 mod-sens h 0.75 11.26 0.047 60Barker Pond Hiram 1569 230 1339 0.25 335 22.18 mod-sens h 0.75 16.64 0.050 84Bartlett Pond Waterboro 2234 284 1950 0.25 488 13.2 mod-sens m 1.00 13.20 0.027 122Bartlett Pond Livermore 331 30 301 0.25 75 2.77 mod-sens h 0.75 2.08 0.028 19Baskahegan Lake Brookton Twp 6182 1600 4582 0.15 687 61.76 mod-sens m 1.00 61.76 0.090 172Baskahegan Lake Carroll Plt 9439 1400 8039 0.15 1206 94.3 mod-sens m 1.00 94.30 0.078 301Baskahegan Lake Codyville Plt 66 5 61 0.15 9 0.66 mod-sens m 1.00 0.66 0.072 2Baskahegan Lake Danforth 333 5 328 0.15 49 3.32 mod-sens m 1.00 3.32 0.067 12Baskahegan Lake Forest Twp 66 5 61 0.15 9 0.66 mod-sens m 1.00 0.66 0.072 2Baskahegan Lake Kossuth Twp 23931 7100 16831 0.15 2525 239.1 mod-sens m 1.00 239.08 0.095 631Baskahegan Lake Prentiss Plt 3921 500 3421 0.15 513 39.18 mod-sens m 1.00 39.18 0.076 128Baskahegan Lake T8 R3 NBPP 12762 1300 11462 0.15 1719 127.5 mod-sens m 1.00 127.51 0.074 430Baskahegan Lake Topsfield 9772 1800 7972 0.15 1196 97.63 mod-sens m 1.00 97.63 0.082 299Bauds Pond New Vineyard 2209 350 1859 0.25 465 21.63 mod-sens m 1.00 21.63 0.047 116Bauneg Beg Sanford 5446 750 4696 0.35 1644 34.42 mod-sens m 1.00 34.42 0.021 411Bear Pond Waterford 5275 744 4531 0.3 1359 62.22 mod-sens h 0.75 46.67 0.034 340Bear Pond Turner 222 25 197 0.25 49 2.31 mod-sens m 1.00 2.31 0.047 12Bear Pond Hartford 788 150 638 0.25 160 8.26 mod-sens m 1.00 8.26 0.052 40Beaver Lake Calais 511 25 486 0.2 97 6.06 mod-sens m 1.00 6.06 0.062 24Beaver Pond Bridgton 1653 300 1353 0.4 541 13.05 mod-sens m 1.00 13.05 0.024 135Beaver Pond Denmark 1284 65 1219 0.2 244 10.05 mod-sens m 1.00 10.05 0.041 61Beddington Lake Beddington 3365 600 2765 0.15 415 25.4 mod-sens h 0.75 19.05 0.046 104Belfast Reservoir #1 Northport 1326 70 1256 0.25 314 9.08 mod-sens m 1.00 9.08 0.029 79Belfast Reservoir #1 Belfast 669 150 519 0.25 130 4.6 mod-sens m 1.00 4.60 0.035 32Belfast Reservoir #2 Northport 1084 55 1029 0.25 257 6.83 mod-sens m 1.00 6.83 0.027 64Belfast Reservoir #2 Belfast 6921 1000 5921 0.25 1480 43.54 mod-sens m 1.00 43.54 0.029 370Ben Annis Pond Hermon 202 70 132 0.25 33 1.23 mod-sens m 1.00 1.23 0.037 8Ben Annis Pond Hampden 575 170 405 0.25 101 3.52 mod-sens m 1.00 3.52 0.035 25Berry Pond Readfield 1307 100 1207 0.25 302 8.73 mod-sens m 1.00 8.73 0.029 75Berry Pond Winthrop 2080 150 1930 0.25 483 13.91 mod-sens m 1.00 13.91 0.029 121
Appendix C Per Acre Phosphorus Allocationsfor Selected Maine Lakes
Updated 11/1/17
Lake Name
Town in which
development is located
Direct Watershed
Area in Town (acres) DDA
Area not available for development
(acres) ANAD
Area available for development
(acres) AAD
GF
Expected developed
area (acres)
D
(lbP/y) F
Water Quality
Category WQC
LOP C FC
Per acre phosphorus allocation (lb/acre/yr)
P
Small Watershed Threshold
(acres) SWT
Big Benson Pond Willimantic 296 5 291 0.2 58 5.02 good h 1.00 5.02 0.086 15Big Cathance Lake Cooper 7138 350 6788 0.2 1358 132.4 good h 1.00 132.41 0.098 339Big Cathance Lake Plantation # 14 1514 100 1414 0.2 283 28.09 good h 1.00 28.09 0.099 71Big Concord Pond Peru 56 25 31 0.2 6 0.46 mod-sens h 0.75 0.35 0.056 2Big Concord Pond Woodstock 1317 150 1167 0.2 233 10.78 mod-sens h 0.75 8.09 0.035 58Big Greenwood Pond Willimantic 321 10 311 0.2 62 7.38 mod-sens h 0.75 5.54 0.089 16Big Lake Indian Twp 5342 800 4542 0.2 908 80.59 mod-sens h 0.75 60.44 0.067 227Big Lake Princeton 563 210 353 0.2 71 8.48 mod-sens h 0.75 6.36 0.090 18Big Pond Phippsburg 101 15 86 0.25 22 1.05 mod-sens m 1.00 1.05 0.049 5Birch Harbor Pond Winter Harbor 259 25 234 0.25 59 2.53 mod-sens m 1.00 2.53 0.043 15Biscay Pond Damariscotta 941 94 847 0.3 254 18.65 mod-sens h 0.75 13.99 0.055 64Biscay Pond Bristol 649 65 584 0.25 146 12.87 mod-sens h 0.75 9.65 0.066 37Biscay Pond Bremen 906 91 815 0.25 204 17.97 mod-sens h 0.75 13.48 0.066 51Black Pond Sweden 1198 125 1073 0.2 215 8.37 mod-sens m 1.00 8.37 0.039 54Black Pond Turner 12 0 12 0.3 4 0.13 mod-sens m 1.00 0.13 0.036 1Black Pond Fryeburg 74 4 70 0.2 14 0.83 mod-sens m 1.00 0.83 0.059 4Black Pond Vienna 889 150 739 0.15 111 6.43 mod-sens m 1.00 6.43 0.058 28Bog Lake Northfield 1887 300 1587 0.25 397 37.74 mod-sens h 0.75 28.31 0.071 99Bog Pond Waterford 284 28 256 0.2 51 3.13 mod-sens m 1.00 3.13 0.061 13Bog Pond Harrison 229 100 129 0.25 32 1.63 mod-sens h 0.75 1.22 0.038 8Bog Pond Readfield 1230 120 1110 0.2 222 7.12 mod-sens m 1.00 7.12 0.032 56Bog Pond Fryeburg 378 10 368 0.2 74 3.9 mod-sens m 1.00 3.90 0.053 18Bog Pond Mount Vernon 301 40 261 0.25 65 1.74 mod-sens m 1.00 1.74 0.027 16Bogus Meadow Pond Gouldsboro 153 3 150 0.15 23 1.25 mod-sens m 1.00 1.25 0.056 6Bonney Eagle Lake Standish 1981 400 1581 0.3 474 14.86 mod-sens m 1.00 14.86 0.031 119Bonney Eagle Lake Buxton 274 75 199 0.35 70 2.07 mod-sens m 1.00 2.07 0.030 17Bonny Pond Monmouth 249 30 219 0.25 55 1.83 mod-sens m 1.00 1.83 0.033 14Bonny Pond Leeds 138 40 98 0.2 20 1.01 mod-sens m 1.00 1.01 0.052 5Boody Pond Vienna 182 50 132 0.15 20 1.25 mod-sens h 0.75 0.94 0.047 5Boston Pond Denmark 113 30 83 0.2 17 1.3 mod-sens m 1.00 1.30 0.078 4Boyd Pond Limington 336 35 301 0.25 75 2.82 mod-sens m 1.00 2.82 0.037 19Bradley Pond Lovell 311 50 261 0.2 52 3.15 mod-sens h 0.75 2.36 0.045 13
Appendix C Per Acre Phosphorus Allocationsfor Selected Maine Lakes
Updated 11/1/17
Lake Name
Town in which
development is located
Direct Watershed
Area in Town (acres) DDA
Area not available for development
(acres) ANAD
Area available for development
(acres) AAD
GF
Expected developed
area (acres)
D
(lbP/y) F
Water Quality
Category WQC
LOP C FC
Per acre phosphorus allocation (lb/acre/yr)
P
Small Watershed Threshold
(acres) SWT
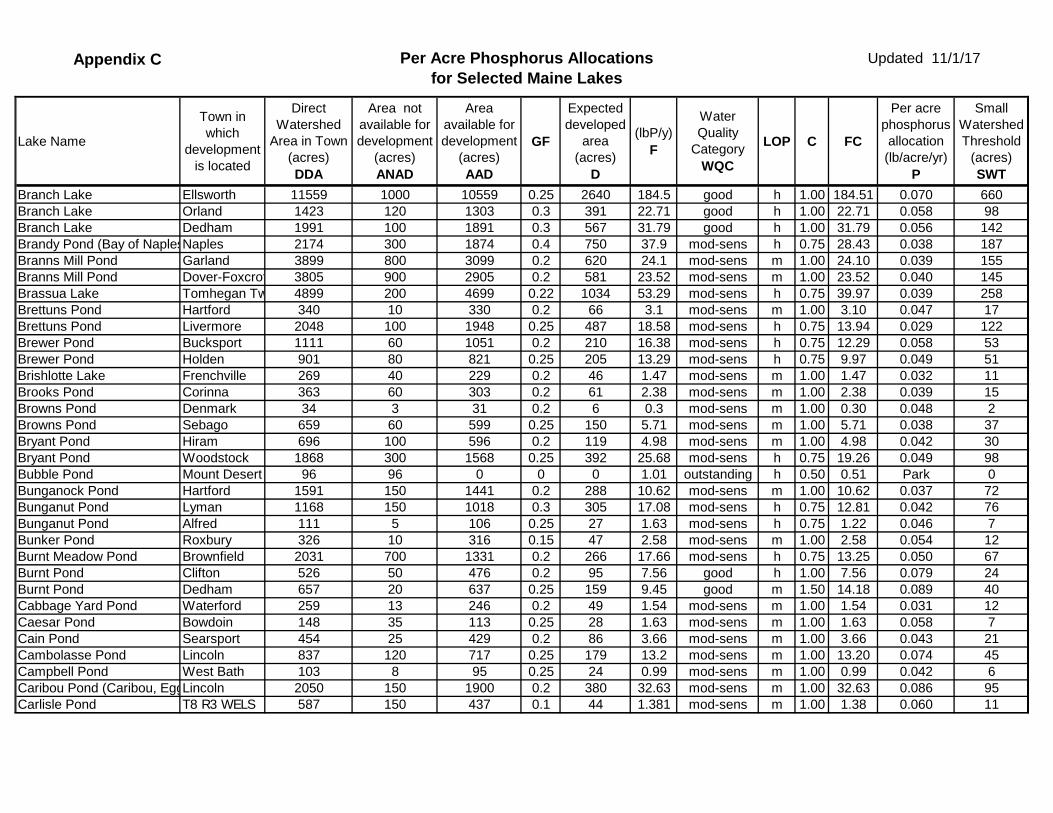
Branch Lake Ellsworth 11559 1000 10559 0.25 2640 184.5 good h 1.00 184.51 0.070 660Branch Lake Orland 1423 120 1303 0.3 391 22.71 good h 1.00 22.71 0.058 98Branch Lake Dedham 1991 100 1891 0.3 567 31.79 good h 1.00 31.79 0.056 142Brandy Pond (Bay of NaplesNaples 2174 300 1874 0.4 750 37.9 mod-sens h 0.75 28.43 0.038 187Branns Mill Pond Garland 3899 800 3099 0.2 620 24.1 mod-sens m 1.00 24.10 0.039 155Branns Mill Pond Dover-Foxcrof 3805 900 2905 0.2 581 23.52 mod-sens m 1.00 23.52 0.040 145Brassua Lake Tomhegan Tw 4899 200 4699 0.22 1034 53.29 mod-sens h 0.75 39.97 0.039 258Brettuns Pond Hartford 340 10 330 0.2 66 3.1 mod-sens m 1.00 3.10 0.047 17Brettuns Pond Livermore 2048 100 1948 0.25 487 18.58 mod-sens h 0.75 13.94 0.029 122Brewer Pond Bucksport 1111 60 1051 0.2 210 16.38 mod-sens h 0.75 12.29 0.058 53Brewer Pond Holden 901 80 821 0.25 205 13.29 mod-sens h 0.75 9.97 0.049 51Brishlotte Lake Frenchville 269 40 229 0.2 46 1.47 mod-sens m 1.00 1.47 0.032 11Brooks Pond Corinna 363 60 303 0.2 61 2.38 mod-sens m 1.00 2.38 0.039 15Browns Pond Denmark 34 3 31 0.2 6 0.3 mod-sens m 1.00 0.30 0.048 2Browns Pond Sebago 659 60 599 0.25 150 5.71 mod-sens m 1.00 5.71 0.038 37Bryant Pond Hiram 696 100 596 0.2 119 4.98 mod-sens m 1.00 4.98 0.042 30Bryant Pond Woodstock 1868 300 1568 0.25 392 25.68 mod-sens h 0.75 19.26 0.049 98Bubble Pond Mount Desert 96 96 0 0 0 1.01 outstanding h 0.50 0.51 Park 0Bunganock Pond Hartford 1591 150 1441 0.2 288 10.62 mod-sens m 1.00 10.62 0.037 72Bunganut Pond Lyman 1168 150 1018 0.3 305 17.08 mod-sens h 0.75 12.81 0.042 76Bunganut Pond Alfred 111 5 106 0.25 27 1.63 mod-sens h 0.75 1.22 0.046 7Bunker Pond Roxbury 326 10 316 0.15 47 2.58 mod-sens m 1.00 2.58 0.054 12Burnt Meadow Pond Brownfield 2031 700 1331 0.2 266 17.66 mod-sens h 0.75 13.25 0.050 67Burnt Pond Clifton 526 50 476 0.2 95 7.56 good h 1.00 7.56 0.079 24Burnt Pond Dedham 657 20 637 0.25 159 9.45 good m 1.50 14.18 0.089 40Cabbage Yard Pond Waterford 259 13 246 0.2 49 1.54 mod-sens m 1.00 1.54 0.031 12Caesar Pond Bowdoin 148 35 113 0.25 28 1.63 mod-sens m 1.00 1.63 0.058 7Cain Pond Searsport 454 25 429 0.2 86 3.66 mod-sens m 1.00 3.66 0.043 21Cambolasse Pond Lincoln 837 120 717 0.25 179 13.2 mod-sens m 1.00 13.20 0.074 45Campbell Pond West Bath 103 8 95 0.25 24 0.99 mod-sens m 1.00 0.99 0.042 6Caribou Pond (Caribou, EggLincoln 2050 150 1900 0.2 380 32.63 mod-sens m 1.00 32.63 0.086 95Carlisle Pond T8 R3 WELS 587 150 437 0.1 44 1.381 mod-sens m 1.00 1.38 0.060 11

Appendix C Per Acre Phosphorus Allocationsfor Selected Maine Lakes
Updated 11/1/17
Lake Name
Town in which
development is located
Direct Watershed
Area in Town (acres) DDA
Area not available for development
(acres) ANAD
Area available for development
(acres) AAD
GF
Expected developed
area (acres)
D
(lbP/y) F
Water Quality
Category WQC
LOP C FC
Per acre phosphorus allocation (lb/acre/yr)
P
Small Watershed Threshold
(acres) SWT
Carlton Pond Readfield 1383 400 983 0.25 246 16.93 mod-sens h 0.75 12.70 0.052 61Carlton Pond Detroit 3049 1000 2049 0.2 410 17.48 mod-stable m 1.25 21.85 0.053 102Carlton Pond Troy 7445 750 6695 0.2 1339 42.68 mod-sens m 1.00 42.68 0.032 335Carlton Pond Winthrop 108 0 108 0.25 27 1.32 mod-sens h 0.75 0.99 0.037 7Cat Lake Fryeburg 442 5 437 0.2 87 6.85 mod-sens m 1.00 6.85 0.078 22Cathance Lake Plantation # 14 1514 100 1414 0.2 283 28.09 mod-sens h 1.00 28.09 0.099 71Cedar Swamp Pond Clifton 847 80 767 0.15 115 5.6 mod-sens m 1.00 5.60 0.049 29Center Pond Phippsburg 966 90 876 0.25 219 7.27 mod-sens m 1.00 7.27 0.033 55Center Pond Lincoln 1262 120 1142 0.2 228 11.26 mod-sens m 1.00 11.26 0.049 57Chaffin Pond Windham 79 10 69 0.35 24 0.94 mod-sens m 1.00 0.94 0.039 6Chain of Ponds - Long Chain of Pond 9513 240 9273 0.15 1391 114.4 mod-sens h 0.75 85.82 0.062 348Chain of Ponds - Natanis Chain of Pond 2357 60 2297 0.15 345 28.24 mod-sens h 0.75 21.18 0.061 86Chalk Pond Beddington 338 0 338 0.15 51 2.35 mod-sens m 1.00 2.35 0.046 13Chamberlain Pond Belgrade 96 40 56 0.4 22 0.72 mod-sens h 0.75 0.54 0.024 6Chemo Pond Eddington 3439 350 3089 0.25 772 34.24 mod-sens m 1.00 34.24 0.044 193Chemo Pond Clifton 6810 1500 5310 0.25 1328 67.8 mod-sens h 0.75 50.85 0.038 332Chesuncook, Caribou Lake T3R13 6822 200 6622 0.15 993 111.9 mod-sens h 0.75 83.89 0.084 248Chickawaukie Lake Rockland 333 66 267 0.35 93 5.02 mod-sens h 0.75 3.77 0.040 23Chickawaukie Pond Rockport 1321 132 1189 0.3 357 20.2 mod-sens h 0.75 15.15 0.042 89China Lake East Basin China 11957 3587.1 8369.9 0.25 2092 142.7 poor-rest 0.50 71.36 0.034 523China Lake West Basin China 2804 672.96 2131.04 0.25 533 61.03 poor-rest 0.50 30.52 0.057 133China Lake, West Basin Vassalboro 1430 125 1305 0.25 326 31.15 poor-rest h 0.40 12.46 0.038 82Clary Lake Whitefield 2340 250 2090 0.25 523 25.07 mod-sens m 1.00 25.07 0.048 131Clays Pond Fryeburg 323 25 298 0.25 75 4.43 mod-sens h 0.75 3.32 0.045 19Clemons Pond Hiram 766 150 616 0.2 123 8.75 mod-sens h 0.75 6.56 0.053 31Cloutman Pond Rangeley 150 10 140 0.2 28 1.56 mod-sens m 1.00 1.56 0.056 7Cobbossee Lake Wales 5735 600 5135 0.25 1284 108.7 poor-rest m 0.50 54.36 0.042 321Cobbossee Lake Monmouth 7304 900 6404 0.25 1601 138.5 poor-rest h 0.50 69.23 0.043 400Cobbossee Lake Winthrop 2248 250 1998 0.3 599 42.62 poor-rest h 0.50 21.31 0.036 150Cobbossee Lake Manchester 3405 320 3085 0.3 926 64.51 poor-rest h 0.50 32.26 0.035 231Cochnewagon Monmouth 1769 200 1569 0.25 392 23.65 mod-sens h 0.75 17.74 0.045 98Coffee Pond Casco 452 135 317 0.35 111 7.91 mod-sens h 0.75 5.93 0.053 28
Appendix C Per Acre Phosphorus Allocationsfor Selected Maine Lakes
Updated 11/1/17
Lake Name
Town in which
development is located
Direct Watershed
Area in Town (acres) DDA
Area not available for development
(acres) ANAD
Area available for development
(acres) AAD
GF
Expected developed
area (acres)
D
(lbP/y) F
Water Quality
Category WQC
LOP C FC
Per acre phosphorus allocation (lb/acre/yr)
P
Small Watershed Threshold
(acres) SWT
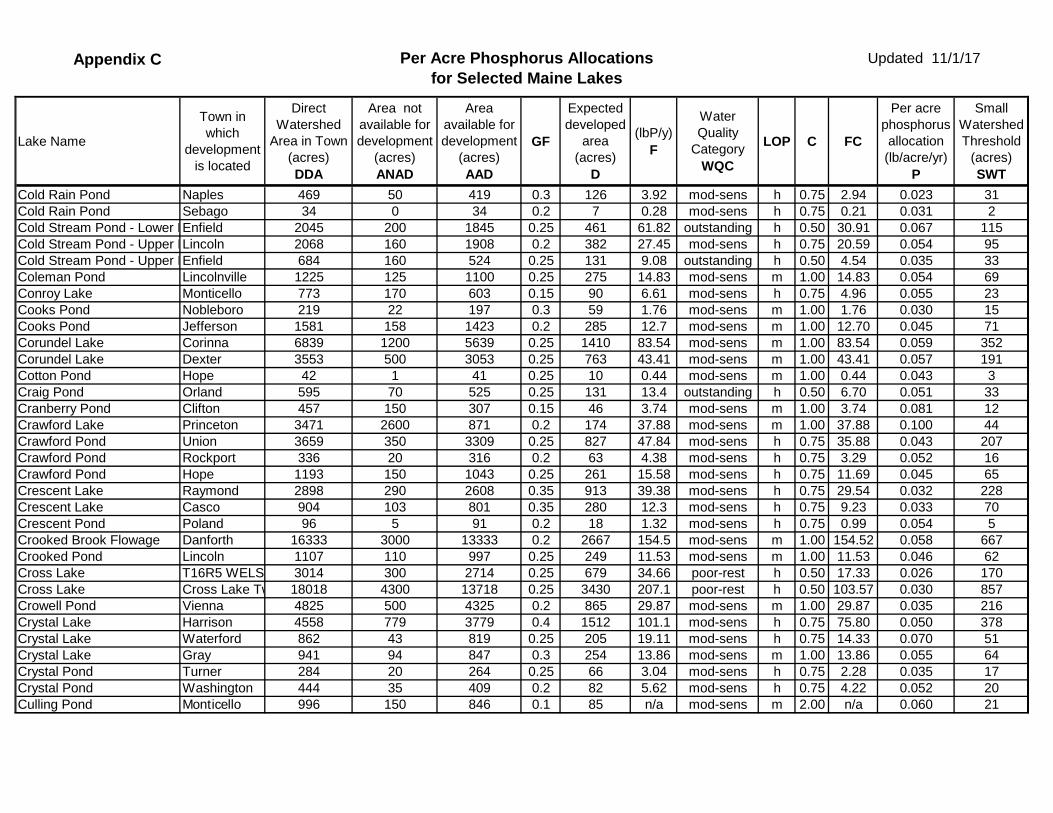
Cold Rain Pond Naples 469 50 419 0.3 126 3.92 mod-sens h 0.75 2.94 0.023 31Cold Rain Pond Sebago 34 0 34 0.2 7 0.28 mod-sens h 0.75 0.21 0.031 2Cold Stream Pond - Lower BEnfield 2045 200 1845 0.25 461 61.82 outstanding h 0.50 30.91 0.067 115Cold Stream Pond - Upper BLincoln 2068 160 1908 0.2 382 27.45 mod-sens h 0.75 20.59 0.054 95Cold Stream Pond - Upper BEnfield 684 160 524 0.25 131 9.08 outstanding h 0.50 4.54 0.035 33Coleman Pond Lincolnville 1225 125 1100 0.25 275 14.83 mod-sens m 1.00 14.83 0.054 69Conroy Lake Monticello 773 170 603 0.15 90 6.61 mod-sens h 0.75 4.96 0.055 23Cooks Pond Nobleboro 219 22 197 0.3 59 1.76 mod-sens m 1.00 1.76 0.030 15Cooks Pond Jefferson 1581 158 1423 0.2 285 12.7 mod-sens m 1.00 12.70 0.045 71Corundel Lake Corinna 6839 1200 5639 0.25 1410 83.54 mod-sens m 1.00 83.54 0.059 352Corundel Lake Dexter 3553 500 3053 0.25 763 43.41 mod-sens m 1.00 43.41 0.057 191Cotton Pond Hope 42 1 41 0.25 10 0.44 mod-sens m 1.00 0.44 0.043 3Craig Pond Orland 595 70 525 0.25 131 13.4 outstanding h 0.50 6.70 0.051 33Cranberry Pond Clifton 457 150 307 0.15 46 3.74 mod-sens m 1.00 3.74 0.081 12Crawford Lake Princeton 3471 2600 871 0.2 174 37.88 mod-sens m 1.00 37.88 0.100 44Crawford Pond Union 3659 350 3309 0.25 827 47.84 mod-sens h 0.75 35.88 0.043 207Crawford Pond Rockport 336 20 316 0.2 63 4.38 mod-sens h 0.75 3.29 0.052 16Crawford Pond Hope 1193 150 1043 0.25 261 15.58 mod-sens h 0.75 11.69 0.045 65Crescent Lake Raymond 2898 290 2608 0.35 913 39.38 mod-sens h 0.75 29.54 0.032 228Crescent Lake Casco 904 103 801 0.35 280 12.3 mod-sens h 0.75 9.23 0.033 70Crescent Pond Poland 96 5 91 0.2 18 1.32 mod-sens h 0.75 0.99 0.054 5Crooked Brook Flowage Danforth 16333 3000 13333 0.2 2667 154.5 mod-sens m 1.00 154.52 0.058 667Crooked Pond Lincoln 1107 110 997 0.25 249 11.53 mod-sens m 1.00 11.53 0.046 62Cross Lake T16R5 WELS 3014 300 2714 0.25 679 34.66 poor-rest h 0.50 17.33 0.026 170Cross Lake Cross Lake Tw 18018 4300 13718 0.25 3430 207.1 poor-rest h 0.50 103.57 0.030 857Crowell Pond Vienna 4825 500 4325 0.2 865 29.87 mod-sens m 1.00 29.87 0.035 216Crystal Lake Harrison 4558 779 3779 0.4 1512 101.1 mod-sens h 0.75 75.80 0.050 378Crystal Lake Waterford 862 43 819 0.25 205 19.11 mod-sens h 0.75 14.33 0.070 51Crystal Lake Gray 941 94 847 0.3 254 13.86 mod-sens m 1.00 13.86 0.055 64Crystal Pond Turner 284 20 264 0.25 66 3.04 mod-sens h 0.75 2.28 0.035 17Crystal Pond Washington 444 35 409 0.2 82 5.62 mod-sens h 0.75 4.22 0.052 20Culling Pond Monticello 996 150 846 0.1 85 n/a mod-sens m 2.00 n/a 0.060 21

Appendix C Per Acre Phosphorus Allocationsfor Selected Maine Lakes
Updated 11/1/17
Lake Name
Town in which
development is located
Direct Watershed
Area in Town (acres) DDA
Area not available for development
(acres) ANAD
Area available for development
(acres) AAD
GF
Expected developed
area (acres)
D
(lbP/y) F
Water Quality
Category WQC
LOP C FC
Per acre phosphorus allocation (lb/acre/yr)
P
Small Watershed Threshold
(acres) SWT
Curtis Bog Sabattus 1045 450 595 0.25 149 9.72 mod-sens m 1.00 9.72 0.065 37Cushman Pond Sumner 86 20 66 0.15 10 0.85 mod-sens h 0.75 0.64 0.064 2Cushman Pond Lovell 180 15 165 0.2 33 2.44 mod-sens h 0.75 1.83 0.055 8Dam Pond Augusta 766 115 651 0.3 195 9.81 mod-sens m 1.00 9.81 0.050 49Dan Charles Pond Lovell 318 10 308 0.2 62 2.64 mod-sens m 1.00 2.64 0.043 15Davis Pond Eddington 3041 300 2741 0.25 685 27.65 mod-sens m 1.00 27.65 0.040 171Davis Pond Vienna 150 50 100 0.2 20 1.25 mod-sens m 1.00 1.25 0.063 5Davis Pond Holden 946 90 856 0.25 214 8.59 mod-sens m 1.00 8.59 0.040 54Dead Lake Fryeburg 452 125 327 0.2 65 4.76 mod-sens m 1.00 4.76 0.073 16Debec Pond Clifton 244 150 94 0.2 19 2.13 mod-sens h 0.75 1.60 0.085 5Deer Pond Hollis 64 20 44 0.35 15 1.6 mod-sens h 0.75 1.20 0.078 4Desert Pond Mount Vernon 484 30 454 0.2 91 3.79 mod-sens h 0.75 2.84 0.031 23Dexter Pond Winthrop 390 90 300 0.25 75 3.32 mod-sens m 1.00 3.32 0.044 19Dipper Pond Carroll Plt 66 10 56 0.15 8 0.44 mod-sens m 1.00 0.44 0.052 2Dodge Pond Rangeley 1482 100 1382 0.25 346 14.9 mod-sens h 0.75 11.18 0.032 86Doles Pond Limington 724 100 624 0.2 125 4.43 mod-sens m 1.00 4.43 0.035 31Doliff Pond Searsmont 143 10 133 0.2 27 0.92 mod-sens m 1.00 0.92 0.035 7Dresden Bog Wiscasset 294 0 294 0.2 59 3.1 mod-sens m 1.00 3.10 0.053 15Drew Pond Newfield 27 5 22 0.5 11 0.3 mod-sens m 1.00 0.30 0.027 3Duck Pond Waterford 308 15 293 0.2 59 2.97 mod-sens m 1.00 2.97 0.051 15Duck Pond Standish 93 5 88 0.25 22 0.9 mod-sens m 1.00 0.90 0.041 6Duckpuddle Pond Nobleboro 1373 137 1236 0.3 371 12.32 mod-sens m 1.00 12.32 0.033 93Duckpuddle Pond Bremen 29 0 29 0.15 4 0.26 mod-sens m 1.00 0.26 0.060 1Duckpuddle Pond Waldoboro 3575 400 3175 0.25 794 32.08 mod-sens m 1.00 32.08 0.040 198Dumpling Pond Casco 375 56 319 0.25 80 4.32 mod-sens m 1.00 4.32 0.054 20Dunham Pond Dover-Foxcrof 126 0 126 0.2 25 1.14 mod-sens m 1.00 1.14 0.045 6Dutton Pond Brooks 160 10 150 0.2 30 1.14 mod-sens m 1.00 1.14 0.038 8Dyer Pond Brownfield 360 30 330 0.2 66 2.49 mod-sens m 1.00 2.49 0.038 17Eagle Lake Mount Desert 86 86 0 0 0 1.98 outstanding h 0.50 0.99 Park 0East Pond Smithfield 1492 130 1362 0.25 341 29.96 poor-rest m 0.50 14.98 0.044 85East Pond Oakland 1270 130 1140 0.3 342 26.51 poor-rest m 0.50 13.26 0.039 86Eastern Lake Whiting 192 20 172 0.15 26 1.85 mod-sens m 1.00 1.85 0.072 6

Appendix C Per Acre Phosphorus Allocationsfor Selected Maine Lakes
Updated 11/1/17
Lake Name
Town in which
development is located
Direct Watershed
Area in Town (acres) DDA
Area not available for development
(acres) ANAD
Area available for development
(acres) AAD
GF
Expected developed
area (acres)
D
(lbP/y) F
Water Quality
Category WQC
LOP C FC
Per acre phosphorus allocation (lb/acre/yr)
P
Small Watershed Threshold
(acres) SWT
Echo Lake Mount Desert 716 290 426 0.3 128 10.89 good h 1.00 10.89 0.085 32Echo Lake Readfield 311 30 281 0.3 84 6.41 good h 1.00 6.41 0.076 21Echo Lake Mount Vernon 3229 300 2929 0.35 1025 66.56 good h 1.00 66.56 0.065 256Echo Lake Fayette 1833 330 1503 0.35 526 37.77 good h 1.00 37.77 0.072 132Echo Lake (Little) Mount Desert 311 30 281 0.3 84 4.49 mod-sens m 0.75 3.37 0.040 21Egg Pond Lee 630 100 530 0.2 106 4.18 mod-sens m 1.00 4.18 0.039 27Egg Pond (Egg, Long, & CaLincoln 420 30 390 0.2 78 4.71 mod-sens m 1.00 4.71 0.060 20Egypt Pond Vienna 284 35 249 0.2 50 2.71 mod-sens h 0.75 2.03 0.041 12Ell (L) Pond Sanford 407 130 277 0.35 97 3.66 mod-sens h 0.75 2.75 0.028 24Ellis Pond Brooks 434 25 409 0.2 82 4.49 mod-sens m 1.00 4.49 0.055 20Ellis Pond Roxbury 3496 230 3266 0.2 653 26.68 mod-sens m 1.00 26.68 0.041 163Embden Pond Embden 4731 350 4381 0.2 876 83.7 outstanding h 0.50 41.85 0.048 219Escutasis (Little) Lake Burlington 449 50 399 0.2 80 5.55 mod-sens m 1.00 5.55 0.070 20Eskutassis Pond Burlington 3820 800 3020 0.2 604 35.54 mod-sens m 1.00 35.54 0.059 151Eskutassis Pond Lowell 1660 300 1360 0.2 272 15.45 mod-sens m 1.00 15.45 0.057 68Estes Lake Alfred 11149 1115 10034 0.3 3010 72.73 mod-sens m 1.00 72.73 0.024 753Estes Lake Sanford 5127 775 4352 0.35 1523 41.58 mod-sens m 1.00 41.58 0.027 381Estes Lake, Upper Basin Sanford 3165 700 2465 0.35 863 20.5 mod-sens m 1.00 20.50 0.024 216Etna Pond Etna 882 90 792 0.25 198 6.06 mod-sens 1.00 6.06 0.031 50Etna Pond Carmel 417 80 337 0.2 67 2.86 mod-sens m 1.00 2.86 0.042 17Farrington Pond Lovell 340 30 310 0.25 78 3.88 mod-sens m 1.00 3.88 0.050 19Farwell Bog Raymond 1045 209 836 0.25 209 6.35 mod-stable m 1.25 7.94 0.038 52Faulkner Lake Weston 516 40 476 0.15 71 4.6 mod-sens m 1.00 4.60 0.064 18Fields Pond Holden 696 80 616 0.25 154 8.55 mod-sens m 1.00 8.55 0.056 39First Pond Blue Hill 2241 200 2041 0.2 408 23.17 mod-sens h 0.75 17.38 0.043 102Fish Pond Hope 617 30 587 0.25 147 7.96 mod-sens m 1.00 7.96 0.054 37Fitts Pond Eddington 316 25 291 0.2 58 3.41 good h 1.00 3.41 0.059 15Fitts Pond Clifton 395 60 335 0.2 67 4.25 good h 1.00 4.25 0.063 17Flagstaff Lake Eustis 23795 1500 22295 0.15 3344 214.3 mod-sens h 0.75 160.76 0.048 836Flagstaff Lake Redington Tw 17731 0 17731 0.15 2660 159.7 mod-sens h 0.75 119.78 0.045 665Flagstaff Lake Carrying Place 6997 450 6547 0.15 982 63.04 mod-sens h 0.75 47.28 0.048 246Flagstaff Lake Kibby Twp 4198 15 4183 0.15 627 37.83 mod-sens h 0.75 28.37 0.045 157
Appendix C Per Acre Phosphorus Allocationsfor Selected Maine Lakes
Updated 11/1/17
Lake Name
Town in which
development is located
Direct Watershed
Area in Town (acres) DDA
Area not available for development
(acres) ANAD
Area available for development
(acres) AAD
GF
Expected developed
area (acres)
D
(lbP/y) F
Water Quality
Category WQC
LOP C FC
Per acre phosphorus allocation (lb/acre/yr)
P
Small Watershed Threshold
(acres) SWT
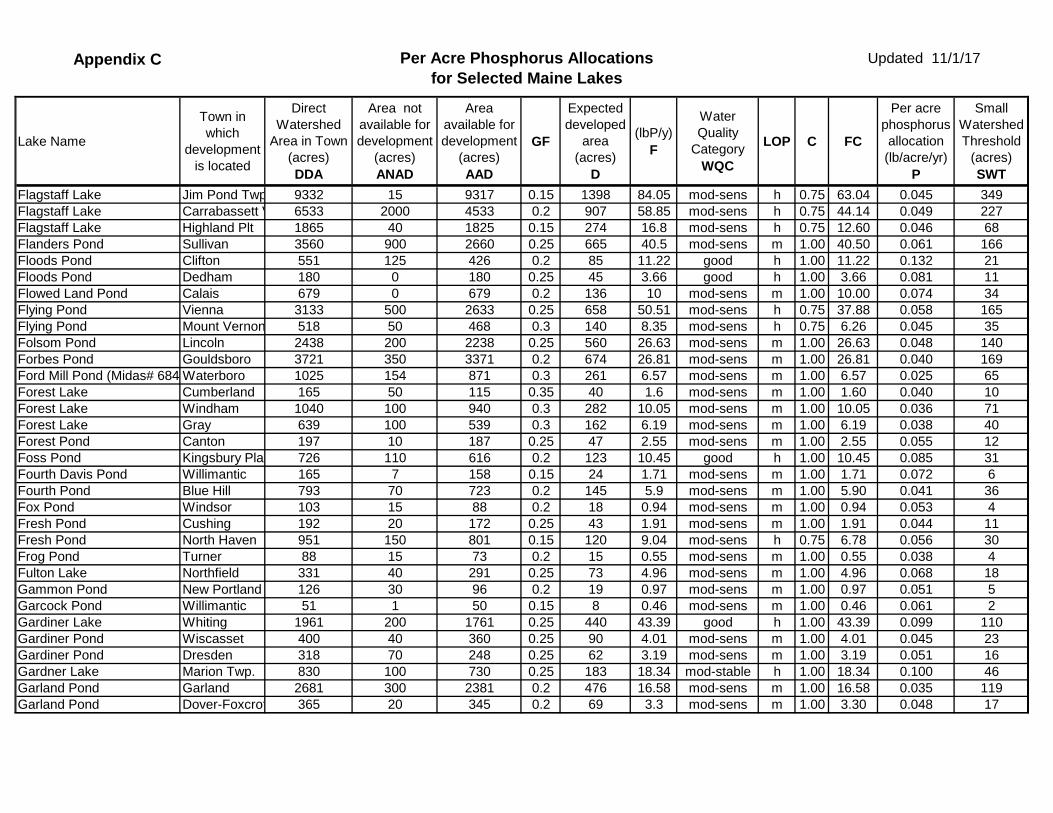
Flagstaff Lake Jim Pond Twp 9332 15 9317 0.15 1398 84.05 mod-sens h 0.75 63.04 0.045 349Flagstaff Lake Carrabassett V 6533 2000 4533 0.2 907 58.85 mod-sens h 0.75 44.14 0.049 227Flagstaff Lake Highland Plt 1865 40 1825 0.15 274 16.8 mod-sens h 0.75 12.60 0.046 68Flanders Pond Sullivan 3560 900 2660 0.25 665 40.5 mod-sens m 1.00 40.50 0.061 166Floods Pond Clifton 551 125 426 0.2 85 11.22 good h 1.00 11.22 0.132 21Floods Pond Dedham 180 0 180 0.25 45 3.66 good h 1.00 3.66 0.081 11Flowed Land Pond Calais 679 0 679 0.2 136 10 mod-sens m 1.00 10.00 0.074 34Flying Pond Vienna 3133 500 2633 0.25 658 50.51 mod-sens h 0.75 37.88 0.058 165Flying Pond Mount Vernon 518 50 468 0.3 140 8.35 mod-sens h 0.75 6.26 0.045 35Folsom Pond Lincoln 2438 200 2238 0.25 560 26.63 mod-sens m 1.00 26.63 0.048 140Forbes Pond Gouldsboro 3721 350 3371 0.2 674 26.81 mod-sens m 1.00 26.81 0.040 169Ford Mill Pond (Midas# 684 Waterboro 1025 154 871 0.3 261 6.57 mod-sens m 1.00 6.57 0.025 65Forest Lake Cumberland 165 50 115 0.35 40 1.6 mod-sens m 1.00 1.60 0.040 10Forest Lake Windham 1040 100 940 0.3 282 10.05 mod-sens m 1.00 10.05 0.036 71Forest Lake Gray 639 100 539 0.3 162 6.19 mod-sens m 1.00 6.19 0.038 40Forest Pond Canton 197 10 187 0.25 47 2.55 mod-sens m 1.00 2.55 0.055 12Foss Pond Kingsbury Pla 726 110 616 0.2 123 10.45 good h 1.00 10.45 0.085 31Fourth Davis Pond Willimantic 165 7 158 0.15 24 1.71 mod-sens m 1.00 1.71 0.072 6Fourth Pond Blue Hill 793 70 723 0.2 145 5.9 mod-sens m 1.00 5.90 0.041 36Fox Pond Windsor 103 15 88 0.2 18 0.94 mod-sens m 1.00 0.94 0.053 4Fresh Pond Cushing 192 20 172 0.25 43 1.91 mod-sens m 1.00 1.91 0.044 11Fresh Pond North Haven 951 150 801 0.15 120 9.04 mod-sens h 0.75 6.78 0.056 30Frog Pond Turner 88 15 73 0.2 15 0.55 mod-sens m 1.00 0.55 0.038 4Fulton Lake Northfield 331 40 291 0.25 73 4.96 mod-sens m 1.00 4.96 0.068 18Gammon Pond New Portland 126 30 96 0.2 19 0.97 mod-sens m 1.00 0.97 0.051 5Garcock Pond Willimantic 51 1 50 0.15 8 0.46 mod-sens m 1.00 0.46 0.061 2Gardiner Lake Whiting 1961 200 1761 0.25 440 43.39 good h 1.00 43.39 0.099 110Gardiner Pond Wiscasset 400 40 360 0.25 90 4.01 mod-sens m 1.00 4.01 0.045 23Gardiner Pond Dresden 318 70 248 0.25 62 3.19 mod-sens m 1.00 3.19 0.051 16Gardner Lake Marion Twp. 830 100 730 0.25 183 18.34 mod-stable h 1.00 18.34 0.100 46Garland Pond Garland 2681 300 2381 0.2 476 16.58 mod-sens m 1.00 16.58 0.035 119Garland Pond Dover-Foxcrof 365 20 345 0.2 69 3.3 mod-sens m 1.00 3.30 0.048 17
Appendix C Per Acre Phosphorus Allocationsfor Selected Maine Lakes
Updated 11/1/17
Lake Name
Town in which
development is located
Direct Watershed
Area in Town (acres) DDA
Area not available for development
(acres) ANAD
Area available for development
(acres) AAD
GF
Expected developed
area (acres)
D
(lbP/y) F
Water Quality
Category WQC
LOP C FC
Per acre phosphorus allocation (lb/acre/yr)
P
Small Watershed Threshold
(acres) SWT
George Pond Hermon 7724 3000 4724 0.25 1181 37.22 mod-sens m 1.00 37.22 0.032 295George Pond Holden 1423 75 1348 0.2 270 8.33 mod-sens m 1.00 8.33 0.031 67Georges Pond Deer Isle 14 3 11 0.3 3.3 0.15 mod-sens m 1.00 0.15 0.045 1Gilman Pond Carrabassett V 1203 600 603 0.15 90 6.68 mod-sens h 0.75 5.01 0.055 23Gilman Pond New Portland 2908 450 2458 0.2 492 16.14 mod-sens m 1.00 16.14 0.033 123Gilman Pond Highland Plt 21470 700 20770 0.15 3116 119 mod-sens m 1.00 119.02 0.038 779Gilman Pond Pleasant Ridg 1855 200 1655 0.1 166 10.29 mod-sens m 1.00 10.29 0.062 41Gilman Pond Lexington Twp 19061 1500 17561 0.15 2634 105.7 mod-sens m 1.00 105.68 0.040 659Givens (Longfellow) Pond Whitefield 93 20 73 0.25 18 1.03 mod-sens m 1.00 1.03 0.056 5Givens (Longfellow) Pond Windsor 49 15 34 0.25 9 0.55 mod-sens m 1.00 0.55 0.065 2Gold Stream Pond Surry 1386 100 1286 0.2 257 10.18 mod-sens m 1.00 10.18 0.040 64Goose Pond Dedham 1094 100 994 0.25 249 12.89 good m 1.50 19.34 0.078 62Gould Pond Dexter 249 50 199 0.2 40 1.63 poor-rest m 0.50 0.82 0.020 10Graham Lake Ellsworth 3728 400 3328 0.3 998 53.33 good m 1.50 80.00 0.080 250Graham Lake Clifton 869 80 789 0.2 158 12.43 good m 1.50 18.65 0.118 39Graham Lake Mariaville 8547 1000 7547 0.25 1887 122.2 mod-stable m 1.25 152.75 0.081 472Graham Lake Waltham 10195 500 9695 0.25 2424 146.8 mod-stable m 1.25 183.46 0.076 606Grand Falls Baileyville 3348 3108 240 0.2 48 84.51 mod-sens m 1.00 84.51 0.100 12Grand Falls Indian Twp 9505 1500 8005 0.2 1601 239.9 mod-sens m 1.00 239.94 0.100 400Grand Falls Princeton 2915 500 2415 0.25 604 73.62 mod-sens m 1.00 73.62 0.100 151Granger Pond Denmark 647 100 547 0.3 164 8.55 mod-sens m 1.00 8.55 0.052 41Grassy Pond Rockport 961 100 861 0.25 215 8.51 mod-sens m 1.00 8.51 0.040 54Grassy Pond Hope 331 45 286 0.25 72 2.95 mod-sens h 0.75 2.21 0.031 18Great East Lake Acton 2391 300 2091 0.3 627 40.1 outstanding h 0.50 20.05 0.032 157Great Moose Lake Dexter 7368 1000 6368 0.2 1274 50.8 mod-sens m 0.75 38.10 0.030 318Great Moose Lake Garland 4193 900 3293 0.2 659 28.9 mod-sens h 0.75 21.68 0.033 165Great Moose Lake Dover-Foxcrof 509 30 479 0.2 96 3.5 mod-sens m 1.00 3.50 0.037 24Great Pond Smithfield 1267 275 992 0.25 248 26.5 mod-sens h 0.75 19.88 0.080 62Great Pond Rome 7198 800 6398 0.3 1919 150.5 mod-sens h 0.75 112.87 0.059 480Great Pond Belgrade 10941 2167 8774 0.25 2194 228.7 mod-sens h 0.75 171.54 0.078 548Great Pond (Great Pond) Grand Falls Tw 8690 510 8180 0.12 982 65.7 mod-sens h 0.75 49.28 0.050 245Great Pond (Great Pond) Summit Twp 133 35 98 0.12 12 1.01 mod-sens h 0.75 0.76 0.064 3
Appendix C Per Acre Phosphorus Allocationsfor Selected Maine Lakes
Updated 11/1/17
Lake Name
Town in which
development is located
Direct Watershed
Area in Town (acres) DDA
Area not available for development
(acres) ANAD
Area available for development
(acres) AAD
GF
Expected developed
area (acres)
D
(lbP/y) F
Water Quality
Category WQC
LOP C FC
Per acre phosphorus allocation (lb/acre/yr)
P
Small Watershed Threshold
(acres) SWT
Greeley Pond Augusta 1074 130 944 0.3 283 7.16 mod-sens m 1.00 7.16 0.025 71Green Lake Ellsworth 6434 700 5734 0.25 1434 121.5 good h 1.00 121.47 0.085 358Green Lake Dedham 6244 350 5894 0.3 1768 117.9 good h 1.00 117.85 0.067 442Green Pond Lee 106 0 106 0.2 21 1.08 mod-sens m 1.00 1.08 0.051 5Green Pond T3R1 NBPP 536 20 516 0.2 103 5.38 mod-sens m 1.00 5.38 0.052 26Grenell Pond Greenville 264 40 224 0.2 45 1.89 mod-sens m 1.00 1.89 0.042 11Grindstone Pond Willimantic 145 5 140 0.15 21 1.74 mod-sens h 0.75 1.31 0.062 5Gull Pond Dallas Plt. 1793 180 1613 0.2 323 9.79 mod-sens h 0.75 7.34 0.023 81Gull Pond Rangeley 879 112 767 0.3 230 8.82 mod-sens h 0.75 4.62 0.020 58Hadley Lake Northfield 3904 150 3754 0.2 751 39.91 mod-stable m 1.25 49.89 0.066 188Hales Pond Fayette 2233 300 1933 0.2 387 15.65 mod-sens m 1.00 15.65 0.040 97Haley Pond Dallas Plt. 2438 350 2088 0.25 522 22.09 mod-sens m 1.00 22.09 0.042 131Haley Pond Rangeley 410 50 360 0.25 90 3.72 mod-sens m 1.00 3.72 0.041 23Half Moon Pond Dexter 79 5 74 0.2 15 0.48 mod-sens m 1.00 0.48 0.032 4Halfmoon Pond Brooks 200 10 190 0.2 38 2.42 mod-sens m 0.75 1.82 0.048 10Halfmoon Pond Standish 54 10 44 0.25 11 0.55 mod-sens m 1.00 0.55 0.050 3Halfmoon Pond Searsport 380 40 340 0.25 85 5.79 mod-sens h 0.75 4.34 0.051 21Halls Pond Paris 148 20 128 0.25 32 1.94 mod-sens h 0.75 1.46 0.045 8Hamilton Pond Belgrade 96 50 46 0.4 18 1.36 mod-sens h 0.75 1.02 0.055 5Hancock Pond Bridgton 358 40 318 0.3 95 6.19 mod-sens h 0.75 4.64 0.049 24Hancock Pond Denmark 1292 120 1172 0.3 352 22.31 mod-sens h 0.75 16.73 0.048 88Hancock Pond Bucksport 805 100 705 0.25 176 7.34 mod-sens h 0.75 5.51 0.031 44Hancock Pond Sebago 1025 100 925 0.3 278 17.7 mod-sens h 0.75 13.28 0.048 69Hancock Pond New Portland 14 0 14 0.2 3 0.15 mod-sens h 0.75 0.11 0.040 1Hansen Pond Acton 219 20 199 0.2 40 1.65 mod-sens m 1.00 1.65 0.041 10Hanson Pond Dedham 200 15 185 0.2 37 1.47 mod-sens m 1.00 1.47 0.040 9Harriman Pond Dedham 143 30 113 0.25 28 3.06 outstanding h 0.50 1.53 0.054 7Hastings Pond Bristol 138 14 124 0.25 31 1.21 mod-sens m 1.00 1.21 0.039 8Hatcase Pond Eddington 616 40 576 0.2 115 3.9 good h 1.00 3.90 0.034 29Hatcase Pond Dedham 1331 80 1251 0.25 313 16.49 good h 1.00 16.49 0.053 78Havener Pond Waldoboro 383 50 333 0.25 83 3.55 mod-sens m 1.00 3.55 0.043 21Heald Pond Lovell 2478 540 1938 0.25 485 22.07 mod-sens m 1.00 22.07 0.046 121

Appendix C Per Acre Phosphorus Allocationsfor Selected Maine Lakes
Updated 11/1/17
Lake Name
Town in which
development is located
Direct Watershed
Area in Town (acres) DDA
Area not available for development
(acres) ANAD
Area available for development
(acres) AAD
GF
Expected developed
area (acres)
D
(lbP/y) F
Water Quality
Category WQC
LOP C FC
Per acre phosphorus allocation (lb/acre/yr)
P
Small Watershed Threshold
(acres) SWT
Heart Pond Orland 546 60 486 0.3 146 6.9 mod-sens h 0.75 5.18 0.035 36Hermon Pond Hermon 4329 600 3729 0.3 1119 24.91 poor-natural m 2.00 49.82 0.045 280Hermon Pond Hampden 59 6 53 0.3 16 0.35 poor-natural m 2.00 0.70 0.044 4Highland Lake Bridgton 3600 360 3240 0.4 1296 56.64 mod-sens h 0.75 42.48 0.033 324Highland Lake Waterford 42 0 42 0.25 11 0.63 mod-sens h 0.75 0.47 0.045 3Highland Lake Westbrook 385 90 295 0.35 103 4.71 mod-sens h 0.75 3.53 0.034 26Highland Lake Sweden 1457 90 1367 0.3 410 22.95 mod-sens h 0.75 17.21 0.042 103Highland Lake Windham 2194 1100 1094 0.6 656 26.87 poor-rest h 0.50 13.44 0.020 164Highland Lake Falmouth 2058 800 1258 0.5 629 25.22 poor-rest h 0.50 12.61 0.020 157Hilton Pond 1 Kingsbury Pla 439 25 414 0.2 83 3.46 mod-sens m 1.00 3.46 0.042 21Hilton Pond 2 Kingsbury Pla 135 10 125 0.2 25 1.23 mod-sens m 1.00 1.23 0.049 6Hobbs Pond Camden 51 5 46 0.25 12 0.61 mod-stable m 1.25 0.76 0.066 3Hobbs Pond Hope 1655 180 1475 0.25 369 19.95 poor-rest m 0.50 9.98 0.027 92Hodgdon Pond Tremont 227 25 202 0.25 51 2 mod-sens m 1.00 2.00 0.040 13Hodgdon Pond Mount Desert 553 0 553 0 0 4.89 good h 1.00 4.89 Park 0Hog Meadow Pond Casco 135 25 110 0.25 28 1.41 mod-sens m 1.00 1.41 0.051 7Hogan Pond Mechanic Fall 941 90 851 0.3 255 9.56 mod-sens m 1.00 9.56 0.037 64Hogan Pond Poland 155 15 140 0.3 42 1.56 mod-sens m 1.00 1.56 0.037 11Hogan Pond Oxford 1361 130 1231 0.3 369 13.82 mod-sens m 1.00 13.82 0.037 92Holbrook Pond Eddington 805 90 715 0.25 179 8.04 mod-sens m 1.00 8.04 0.045 45Holbrook Pond Holden 2309 200 2109 0.25 527 23.72 mod-sens m 1.00 23.72 0.045 132Holbrook Pond Dedham 499 40 459 0.25 115 5 mod-sens m 1.00 5.00 0.044 29Holland Pond (Sokokis L.) Limerick 2327 500 1827 0.25 457 16.94 mod-sens m 1.00 16.94 0.037 114Holmes Pond Whiting 2060 200 1860 0.15 279 14.42 mod-sens m 1.00 14.42 0.052 70Holt Pond Deer Isle 172 26 146 0.2 29 1.47 mod-sens m 1.00 1.47 0.050 7Holt Pond Bridgton 1877 400 1477 0.35 517 14.77 mod-sens m 1.00 14.77 0.029 129Holt Pond Naples 224 15 209 0.35 73 1.76 mod-sens m 1.00 1.76 0.024 18Hopkins Pond Clifton 1025 100 925 0.2 185 17.75 good h 1.00 17.75 0.096 46Hopkins Pond Mariaville 518 45 473 0.25 118 8.97 good h 1.00 8.97 0.076 30Horn Pond Acton 373 60 313 0.3 94 7.05 mod-sens h 0.75 5.29 0.056 23Horne Pond Limington 1821 400 1421 0.25 355 17.97 mod-sens h 0.75 13.48 0.038 89Horseshoe Lake Northfield 93 3 90 0.2 18 1.34 mod-sens m 1.00 1.34 0.074 5

Appendix C Per Acre Phosphorus Allocationsfor Selected Maine Lakes
Updated 11/1/17
Lake Name
Town in which
development is located
Direct Watershed
Area in Town (acres) DDA
Area not available for development
(acres) ANAD
Area available for development
(acres) AAD
GF
Expected developed
area (acres)
D
(lbP/y) F
Water Quality
Category WQC
LOP C FC
Per acre phosphorus allocation (lb/acre/yr)
P
Small Watershed Threshold
(acres) SWT
Horseshoe Pond Denmark 32 5 27 0.2 5 0.92 mod-sens m 1.00 0.92 0.170 1Horseshoe Pond Fryeburg 24 5 19 0.2 4 0.5 mod-sens m 1.00 0.50 0.132 1Horseshoe Pond Beddington 674 100 574 0.15 86 6.21 mod-sens m 1.00 6.21 0.072 22Horseshoe Pond Willimantic 420 10 410 0.15 62 4.6 mod-sens m 1.00 4.60 0.075 15Horseshoe Pond Lovell 407 340 67 0.25 17 5.13 mod-sens h 0.75 3.85 0.100 4Horseshoe Pond 1 Fryeburg 138 4 134 0.2 27 1.41 mod-sens m 1.00 1.41 0.053 7Hosmer Pond Camden 1168 300 868 0.3 260 9.37 mod-sens m 1.00 9.37 0.036 65Hosmer Pond Rockport 303 100 203 0.2 41 2.42 mod-sens m 1.00 2.42 0.060 10Hothole Pond Bucksport 439 20 419 0.2 84 2.69 mod-sens m 1.00 2.69 0.032 21Hothole Pond Orland 5512 800 4712 0.2 942 33.69 mod-sens h 0.75 25.27 0.027 236Houghton Pond West Bath 84 5 79 0.25 20 0.79 mod-sens m 1.00 0.79 0.040 5House Pond Lee 93 5 88 0.15 13 0.57 mod-sens h 0.75 0.43 0.032 3Howard Lake Calais 647 35 612 0.25 153 8.18 mod-sens h 0.75 6.14 0.040 38Howard Pond Hanover 546 40 506 0.2 101 6.04 good h 1.00 6.04 0.060 25Hunt Pond Fryeburg 123 5 118 0.2 24 1.32 mod-sens m 1.00 1.32 0.056 6Hurd Pond Dedham 929 110 819 0.25 205 7.62 mod-sens h 0.75 5.72 0.028 51Hurds Pond Belfast 541 100 441 0.25 110 3.28 mod-sens m 1.00 3.28 0.030 28Hutchinson Pond Farmingdale 788 70 718 0.25 180 7.18 mod-sens m 1.00 7.18 0.040 45Indian Lake Whiting 593 60 533 0.25 133 8 mod-sens h 0.75 6.00 0.045 33Indian Pond Sapling Twp. 16207 2000 14207 0.15 2131 334.4 good h 1.00 334.43 0.157 533Ingalls Pond Bridgton 1030 100 930 0.35 326 12.14 good h 1.00 12.14 0.037 81Ingalls Pond Hiram 128 25 103 0.2 21 0.81 mod-sens h 0.75 0.61 0.029 5Ingham Pond Mount Vernon 4279 450 3829 0.2 766 24.67 mod-sens m 1.00 24.67 0.032 191Iron Pond Washington 158 0 158 0.2 32 1.58 mod-sens h 0.75 1.19 0.038 8Isinglass Pond Limington 126 15 111 0.25 28 1.23 mod-sens h 0.75 0.92 0.033 7Island Pond Waterford 679 130 549 0.25 137 6.3 mod-sens h 0.75 4.73 0.034 34Island Pond Harrison 467 50 417 0.25 104 4.34 mod-sens h 0.75 3.26 0.031 26Island Pond Leeds 81 10 71 0.2 14 0.81 mod-sens m 1.00 0.81 0.057 4Jacob Buck Pond Bucksport 1275 128 1147 0.25 287 13.03 mod-sens h 0.75 9.77 0.034 72Jaybird Pond Hiram 202 100 102 0.25 26 1.52 mod-sens h 0.75 1.14 0.045 6Jerry Pond Millinocket 140 125 15 0.25 4 1.58 mod-sens m 1.00 1.58 0.421 1Jesse Bog Ellsworth 101 30 71 0.3 21 0.72 mod-sens m 1.00 0.72 0.034 5

Appendix C Per Acre Phosphorus Allocationsfor Selected Maine Lakes
Updated 11/1/17
Lake Name
Town in which
development is located
Direct Watershed
Area in Town (acres) DDA
Area not available for development
(acres) ANAD
Area available for development
(acres) AAD
GF
Expected developed
area (acres)
D
(lbP/y) F
Water Quality
Category WQC
LOP C FC
Per acre phosphorus allocation (lb/acre/yr)
P
Small Watershed Threshold
(acres) SWT
Jesse Bog Orland 254 10 244 0.2 49 1.8 mod-sens m 1.00 1.80 0.037 12Jewett Pond Waterford 395 30 365 0.25 91 3.41 mod-sens m 1.00 3.41 0.037 23Jimmie Pond Hallowell 390 150 240 0.25 60 3.5 good h 1.00 3.50 0.058 15Jimmie Pond Farmingdale 533 45 488 0.25 122 4.8 good h 1.00 4.80 0.039 31Jimmy Pond Bowdoin 595 80 515 0.25 129 3.46 mod-sens m 1.00 3.46 0.027 32Jimmy Pond Litchfield 3197 800 2397 0.2 479 18.54 mod-sens m 1.00 18.54 0.039 120Jimmy Pond Sabattus 798 40 758 0.15 114 4.63 mod-sens m 1.00 4.63 0.041 28Joe Pond Belgrade 19 3 16 0.4 6 0.28 mod-sens h 0.75 0.21 0.033 2Johnson Pond Appleton 69 5 64 0.25 16 0.74 mod-sens m 1.00 0.74 0.046 4Joice Pond Whitefield 200 25 175 0.25 44 2.29 mod-sens m 1.00 2.29 0.052 11Joice Pond Pittston 128 30 98 0.2 20 1.47 mod-sens m 1.00 1.47 0.075 5Jones Pond Gouldsboro 2006 220 1786 0.25 447 29.94 mod-sens h 0.75 22.46 0.050 112Jordan Pond Mount Desert 948 0 948 0 0 21.14 outstanding h 0.50 10.57 Park 0Josh Pond Whiting 1564 100 1464 0.2 293 13.64 mod-sens m 1.00 13.64 0.047 73Kalers Pond Waldoboro 365 165 200 0.25 50 4.36 mod-sens h 0.75 3.27 0.065 13Keenes Lake Calais 780 20 760 0.25 190 8.93 mod-sens h 0.75 6.70 0.035 48Keewaydin Lake Stoneham 2463 1600 863 0.3 259 26.12 good h 0.75 19.59 0.076 65Kennebunk Pond Lyman 476 100 376 0.35 132 9.61 mod-sens h 0.75 7.21 0.055 33Keoka Lake Waterford 3644 772 2872 0.3 862 42.88 mod-sens h 0.75 32.16 0.037 215Ketcham Lake TD R2 WELS 187 60 127 0.1 13 0.468 mod-sens m 1.00 0.47 0.060 3Keys Pond Sweden 1235 130 1105 0.35 387 15.23 good h 1.00 15.23 0.039 97Kezar Lake Lovell 3780 250 3530 0.25 883 54.13 mod-sens h 0.75 40.60 0.046 221Kezar Lake (97-1 - north ba Lovell 9095 1200 7895 0.3 2369 133.5 mod-sens h 0.75 100.13 0.042 592Kezar Pond Fryeburg 3390 450 2940 0.25 735 44.84 mod-sens m 1.00 44.84 0.061 184Kezar Pond Bridgton 2651 250 2401 0.3 720 35.08 mod-sens m 1.00 35.08 0.049 180Kezar Pond Denmark 2651 1000 1651 0.25 413 35.08 mod-sens m 1.00 35.08 0.085 103Kezar Pond Sweden 2174 200 1974 0.25 494 28.75 mod-sens m 1.00 28.75 0.058 123Kezar Pond Winthrop 205 70 135 0.3 41 1.85 mod-sens m 1.00 1.85 0.046 10Kidder Pond Vienna 249 50 199 0.2 40 1.87 mod-sens m 1.00 1.87 0.047 10Killick Pond Waterboro 1957 300 1657 0.25 414 11.92 mod-stable h 1.00 11.92 0.029 104Killick Pond Limington 103 10 93 0.2 19 0.63 mod-sens m 1.00 0.63 0.034 5Killick Pond Hollis 2646 500 2146 0.25 537 16.11 mod-sens m 1.00 16.11 0.030 134

Appendix C Per Acre Phosphorus Allocationsfor Selected Maine Lakes
Updated 11/1/17
Lake Name
Town in which
development is located
Direct Watershed
Area in Town (acres) DDA
Area not available for development
(acres) ANAD
Area available for development
(acres) AAD
GF
Expected developed
area (acres)
D
(lbP/y) F
Water Quality
Category WQC
LOP C FC
Per acre phosphorus allocation (lb/acre/yr)
P
Small Watershed Threshold
(acres) SWT
Kimball Pond Vienna 106 20 86 0.25 22 1.43 good h 1.00 1.43 0.067 5Kingsbury Pond Kingsbury Pla 541 90 451 0.25 113 6.46 mod-sens h 0.75 4.85 0.043 28Kingsbury Pond Mayfield Twp 2419 100 2319 0.2 464 28.86 mod-sens h 0.75 21.65 0.047 116Knickerboocker Pond Boothbay 726 73 653 0.3 196 8.31 mod-sens h 0.75 6.23 0.032 49Knight Pond Lincolnville 49 3 46 0.2 9 0.48 mod-sens m 1.00 0.48 0.052 2Knight Pond Northport 795 150 645 0.25 161 7.6 mod-sens m 1.00 7.60 0.047 40Labrador Pond Sumner 2159 250 1909 0.2 382 15.76 mod-sens m 1.00 15.76 0.041 95Lake Auburn Turner 160 8 152 0.3 46 3.74 good h 1.00 3.74 0.082 11Lake Auburn Auburn 4704 350 4354 0.35 1524 109.9 good h 1.00 109.87 0.072 381Lake George Canaan 1455 400 1055 0.2 211 13.84 mod-sens h 0.75 10.38 0.049 53Lard Pond Turner 106 42 64 0.3 19 0.85 mod-sens m 1.00 0.85 0.044 5Lawry Pond Searsmont 2263 200 2063 0.2 413 16.71 mod-sens m 1.00 16.71 0.040 103Lermond Pond Union 148 30 118 0.35 41 2.93 good h 1.00 2.93 0.071 10Lermond Pond Hope 464 50 414 0.35 145 9.17 good h 1.00 9.17 0.063 36Levenseller Pond Searsmont 219 40 179 0.25 45 2.09 mod-stable m 1.25 2.61 0.058 11Levenseller Pond Lincolnville 32 5 27 0.25 7 0.3 mod-sens m 1.00 0.30 0.044 2Lilly Pond Rockport 150 25 125 0.3 38 1.74 poor-rest m 0.50 0.87 0.023 9Lilly Pond Camden 24 2 22 0.3 7 0.3 mod-sens m 1.00 0.30 0.045 2Lily Pond Edgecomb 625 62 563 0.25 141 5.75 mod-sens m 1.00 5.75 0.041 35Lily Pond Deer Isle 237 45 192 0.25 48 2.6 mod-sens h 0.75 1.95 0.041 12Lily Pond Denmark 345 35 310 0.25 78 2.22 mod-sens m 1.00 2.22 0.029 19Lily Pond West Bath 575 50 525 0.25 131 2.73 mod-sens m 1.25 3.41 0.026 33Lily Pond Turner 252 40 212 0.2 42 2.16 mod-sens m 1.00 2.16 0.051 11Lily Pond Dexter 66 2 64 0.2 13 0.7 mod-sens m 1.00 0.70 0.055 3Lily Pond Gouldsboro 234 20 214 0.2 43 2.31 mod-sens m 1.00 2.31 0.054 11Lily Pond New Gloucest 615 120 495 0.3 149 4.43 mod-sens m 1.00 4.43 0.030 37Lily Pond Hollis 239 45 194 0.25 49 1.67 mod-sens m 1.00 1.67 0.034 12Lily Pond New Vineyard 506 50 456 0.25 114 7.76 mod-sens m 1.00 7.76 0.068 29Lily Pond Hope 197 15 182 0.25 46 2.27 mod-sens m 1.00 2.27 0.050 11Little Bear Pond Hartford 3385 600 2785 0.2 557 22.51 mod-sens m 1.00 22.51 0.040 139Little Burnt Pond Clifton 286 40 246 0.2 49 2.27 mod-sens m 1.00 2.27 0.046 12Little Clemons Pond Hiram 227 45 182 0.25 46 1.96 mod-sens m 1.00 1.96 0.043 11
Appendix C Per Acre Phosphorus Allocationsfor Selected Maine Lakes
Updated 11/1/17
Lake Name
Town in which
development is located
Direct Watershed
Area in Town (acres) DDA
Area not available for development
(acres) ANAD
Area available for development
(acres) AAD
GF
Expected developed
area (acres)
D
(lbP/y) F
Water Quality
Category WQC
LOP C FC
Per acre phosphorus allocation (lb/acre/yr)
P
Small Watershed Threshold
(acres) SWT
Little Cobbossee Lake Readfield 533 50 483 0.2 97 4.07 poor-rest m 0.50 2.04 0.021 24Little Cobbossee Lake Winthrop 531 120 411 0.25 103 4.05 poor-rest m 0.50 2.03 0.020 26Little Duck Pond Ellsworth 469 75 394 0.2 79 4.71 mod-sens m 1.00 4.71 0.060 20Little Duck Pond Windham 261 25 236 0.3 71 2.49 mod-sens m 1.00 2.49 0.035 18Little Duck Pond Dedham 39 8 31 0.2 6 0.39 mod-sens m 1.00 0.39 0.063 2Little Dyer Pond Whitefield 1245 250 995 0.2 199 9.7 mod-sens m 1.00 9.70 0.049 50Little Fowler Pond T8 R3 WELS 245 40 205 0.1 21 n/a mod-sens m 0.00 n/a 0.060 5Little Horseshoe Pond Beddington 66 3 63 0.2 13 0.99 mod-sens m 1.00 0.99 0.079 3Little Labrador Pond Sumner 931 110 821 0.2 164 5.95 mod-sens m 1.00 5.95 0.036 41Little Lake Whiting 793 50 743 0.15 111 7.36 mod-sens m 1.00 7.36 0.066 28Little Machias Lake Portage Lake 3167 1300 1867 0.15 280 18.61 mod-sens h 0.75 13.96 0.050 70Little Medomak Pond Waldoboro 610 70 540 0.25 135 6.37 mod-sens h 0.75 4.78 0.035 34Little Medomak Pond Union 135 10 125 0.2 25 1.43 mod-sens h 0.75 1.07 0.043 6Little Moose Pond Waterford 924 74 850 0.25 213 11.28 good h 1.00 11.28 0.053 53Little Moose Pond Sweden 289 10 279 0.2 56 3.52 good h 1.00 3.52 0.063 14Little Mud Pond Greenville 303 30 273 0.2 55 2.05 mod-sens m 1.00 2.05 0.038 14Little Ossipee Lake Waterboro 2984 400 2584 0.3 775 35.5 good h 1.00 35.50 0.046 194Little Pond Damariscotta 340 34 306 0.3 92 4.8 mod-sens h 0.75 3.60 0.039 23Little Pond Bristol 56 6 50 0.25 13 0.79 mod-sens m 1.00 0.79 0.061 3Little Pond Searsmont 158 70 88 0.2 18 2.13 mod-sens m 1.00 2.13 0.121 4Little Pond Sweden 71 5 66 0.2 13 0.74 mod-sens m 1.00 0.74 0.056 3Little Pond Smithfield 29 9 20 0.2 4 0.28 mod-sens m 1.00 0.28 0.070 1Little Pond Otisfield 340 25 315 0.25 79 2.6 mod-sens m 1.00 2.60 0.033 20Little Pond Fryeburg 14 0 14 0.2 3 0.15 mod-sens m 1.00 0.15 0.054 1Little Pond Orland 84 0 84 0.2 17 0.7 mod-sens m 1.00 0.70 0.042 4Little Purgatory Monmouth 49 0 49 0.25 12 0.46 mod-sens m 1.00 0.46 0.038 3Little Rocky Pond Ellsworth 731 150 581 0.2 116 6.37 mod-sens m 1.00 6.37 0.055 29Little Round Pond Mount Desert 172 20 152 0.25 38 1.63 mod-sens m 1.00 1.63 0.043 10Little Round Pond Lincoln 385 15 370 0.25 93 4.12 mod-sens h 0.75 3.09 0.033 23Little Sabattus Pond Greene 914 90 824 0.2 165 5.46 mod-sens m 1.00 5.46 0.033 41Little Sabattus Pond Leeds 773 150 623 0.2 125 4.6 mod-sens m 1.00 4.60 0.037 31Little Sebago L., Hunger Ba Windham 748 180 568 0.35 199 13.91 mod-sens h 0.75 10.43 0.052 50
Appendix C Per Acre Phosphorus Allocationsfor Selected Maine Lakes
Updated 11/1/17
Lake Name
Town in which
development is located
Direct Watershed
Area in Town (acres) DDA
Area not available for development
(acres) ANAD
Area available for development
(acres) AAD
GF
Expected developed
area (acres)
D
(lbP/y) F
Water Quality
Category WQC
LOP C FC
Per acre phosphorus allocation (lb/acre/yr)
P
Small Watershed Threshold
(acres) SWT
Little Sebago L., Main BasinWindham 590 75 515 0.35 180 9.19 mod-sens h 0.75 6.89 0.038 45Little Sebago Lake, Main BaRaymond 412 12 400 0.25 100 6.43 mod-sens m 1.00 6.43 0.064 25Little Sebago Lake, Main BaGray 2858 300 2558 0.3 767 44.51 mod-sens h 0.75 33.38 0.044 192Little Sebago Lake, Upper BRaymond 2065 125 1940 0.25 485 16.95 mod-sens m 1.00 16.95 0.035 121Little Sebago Lake, Upper BGray 1818 182 1636 0.3 491 14.9 mod-sens m 1.00 14.90 0.030 123Little Togus Pond Augusta 126 10 116 0.3 35 1.54 mod-sens m 1.00 1.54 0.044 9Little Watchic Pond Standish 1037 150 887 0.25 222 8.44 mod-sens m 1.00 8.44 0.038 55Little Wilson Pond Auburn 116 15 101 0.3 30 1.01 mod-sens h 0.75 0.76 0.025 8Little Wilson Pond Turner 827 120 707 0.25 177 7.27 mod-sens h 0.75 5.45 0.031 44Little Wilson Pond Minot 9 1 8 0.2 2 0.08 mod-sens h 0.75 0.06 0.038 0Long Cove Pond Phillips 118 0 118 0.2 24 1.01 mod-sens h 0.75 0.76 0.032 6Long Lake Bridgton 17672 1576 16096 0.4 6438 247.4 mod-sens h 0.75 185.55 0.029 1610Long Lake Harrison 8715 508 8207 0.4 3283 122 mod-sens h 0.75 91.52 0.028 821Long Lake Naples 4546 455 4091 0.4 1636 63.63 mod-sens h 0.75 47.72 0.029 409Long Lake Waterford 1265 126 1139 0.3 342 17.7 mod-sens h 0.75 13.28 0.039 85Long Lake Denmark 1981 150 1831 0.25 458 27.76 mod-sens h 0.75 20.82 0.045 114Long Lake St. Agatha 11003 600 10403 0.2 2081 161.3 mod-sens h 0.75 120.98 0.058 520Long Lake Northfield 689 35 654 0.2 131 10.95 mod-sens m 1.00 10.95 0.084 33Long Lake Frenchville 338 50 288 0.2 58 4.96 mod-sens h 0.75 3.72 0.065 14Long Lake T17R3 WELS 8203 400 7803 0.25 1951 120.3 mod-sens h 0.75 90.21 0.046 488Long Lake T17R4 WELS 10182 500 9682 0.25 2421 149.3 mod-sens h 0.75 111.98 0.046 605Long Pond Denmark 207 35 172 0.25 43 2.42 mod-stable h 0.75 1.82 0.042 11Long Pond Livermore 1089 110 979 0.25 245 13.45 mod-sens h 0.75 10.09 0.041 61Long Pond Bucksport 5623 700 4923 0.25 1231 45.04 mod-sens m 1.00 45.04 0.037 308Long Pond Mount Desert 773 260 513 0.25 128 5.44 mod-sens h 0.75 4.08 0.032 32Long Pond Mount Desert 2179 1000 1179 0.3 354 42.13 outstanding h 0.50 21.07 0.060 88Long Pond Windsor 1546 500 1046 0.25 262 17.37 mod-sens m 1.00 17.37 0.066 65Long Pond Holden 3412 325 3087 0.25 772 27.34 mod-sens h 0.75 20.51 0.027 193Long Pond Sandy River P 3066 1000 2066 0.25 517 34.72 good h 1.00 34.72 0.067 129Long Pond Orland 266 20 246 0.2 49 2.13 mod-sens m 1.00 2.13 0.043 12Long Pond Dedham 2841 500 2341 0.25 585 22.77 mod-sens m 1.00 22.77 0.039 146Long Pond T7R9 NWP 3286 170 3116 0.2 623 37.88 mod-sens h 0.75 28.41 0.046 156
Appendix C Per Acre Phosphorus Allocationsfor Selected Maine Lakes
Updated 11/1/17
Lake Name
Town in which
development is located
Direct Watershed
Area in Town (acres) DDA
Area not available for development
(acres) ANAD
Area available for development
(acres) AAD
GF
Expected developed
area (acres)
D
(lbP/y) F
Water Quality
Category WQC
LOP C FC
Per acre phosphorus allocation (lb/acre/yr)
P
Small Watershed Threshold
(acres) SWT
Long Pond (Long, Caribou aLincoln 3417 210 3207 0.2 641 42.9 mod-sens m 1.00 42.90 0.067 160Long Pond (Long, Caribou, Winn 254 10 244 0.2 49 3.19 mod-sens m 1.00 3.19 0.065 12Long Pond (Long, Caribou, Lee 121 0 121 0.2 24 1.52 mod-sens m 1.00 1.52 0.063 6Long Pond, North Basin Belgrade 1314 253 1061 0.4 421 30.89 poor-rest h 0.50 15.45 0.037 105Long Pond, North Basin Rome 3689 500 3189 0.35 1116 86.61 poor-rest h 0.50 43.31 0.039 279Long Pond, North Basin Vienna 973 200 773 0.25 193 22.88 poor-rest h 0.50 11.44 0.059 48Long Pond, South Basin Belgrade 1714 252 1462 0.39 568 38.12 poor-rest h 0.50 19.06 0.034 142Long Pond, South Basin Rome 1097 80 1017 0.25 254 24.43 poor-rest h 0.50 12.22 0.048 64Long Pond, South Basin Mount Vernon 5317 400 4917 0.3 1475 118.3 poor-rest h 0.50 59.13 0.040 369Long Pond, Upper Basin Jackman 18245 2500 15745 0.1 1575 167.5 mod-sens m 1.00 167.53 0.106 394Loon Lake Rangeley 170 0 170 0.2 34 2.53 mod-sens h 0.75 1.90 0.056 9Loon Pond Acton 420 50 370 0.3 111 4.38 mod-sens m 1.00 4.38 0.039 28Loon Pond Sabattus 190 10 180 0.25 45 2.4 mod-sens m 1.00 2.40 0.053 11Lovejoy Pond Readfield 1158 100 1058 0.3 317 23.08 mod-sens h 0.75 17.31 0.055 79Lovewell Pond Fryeburg 3101 250 2851 0.25 713 52.56 mod-sens m 1.00 52.56 0.074 178Lower Hadlock Pond Mount Desert 214 214 0 0 0 2.57 good h 1.00 2.57 Park 0Lower Kimball Lake Fryeburg 748 75 673 0.25 168 8.79 mod-sens h 0.75 6.59 0.039 42Lower Mud Pond Windham 46 23 23 0.25 6 0.35 mod-sens m 1.00 0.35 0.061 1Lower Narrows Pond Winthrop 862 40 822 0.25 206 14.88 good h 1.00 14.88 0.072 51Lower Patten Pond Ellsworth 3036 400 2636 0.3 791 44.73 good h 1.00 44.73 0.057 198Lower Patten Pond Surry 1838 180 1658 0.25 415 27.07 good h 1.00 27.07 0.065 104Lower Patten Pond Orland 79 0 79 0.25 20 1.16 mod-sens h 0.75 0.87 0.044 5Lower Pond Bristol 74 7 67 0.25 17 0.74 mod-sens m 1.00 0.74 0.044 4Lower Range Pond Poland 2214 530 1684 0.25 421 31.26 mod-sens h 0.75 23.45 0.056 105Lower Richardson Lake Township C 7039 300 6739 0.2 1348 218.1 good h 1.00 218.11 0.162 337Lower Springy Pond Clifton 1158 250 908 0.2 182 13.49 mod-sens h 0.75 10.12 0.056 45Lower West Bay Pond Gouldsboro 1532 100 1432 0.15 215 18.47 mod-sens m 1.00 18.47 0.086 54Lower Wilson Pond Greenville 3634 300 3334 0.25 834 70.42 good h 1.00 70.42 0.084 208Lufkin Pond Phillips 575 0 575 0.2 115 5.84 mod-sens h 0.75 4.38 0.038 29Maces Pond Rockport 516 55 461 0.25 115 4.36 mod-sens m 1.00 4.36 0.038 29Madagascal Pond Lee 1134 350 784 0.2 157 8.7 mod-sens h 0.75 6.53 0.042 39Madagascal Pond Burlington 2322 300 2022 0.2 404 17.86 mod-sens h 0.75 13.40 0.033 101
Appendix C Per Acre Phosphorus Allocationsfor Selected Maine Lakes
Updated 11/1/17
Lake Name
Town in which
development is located
Direct Watershed
Area in Town (acres) DDA
Area not available for development
(acres) ANAD
Area available for development
(acres) AAD
GF
Expected developed
area (acres)
D
(lbP/y) F
Water Quality
Category WQC
LOP C FC
Per acre phosphorus allocation (lb/acre/yr)
P
Small Watershed Threshold
(acres) SWT
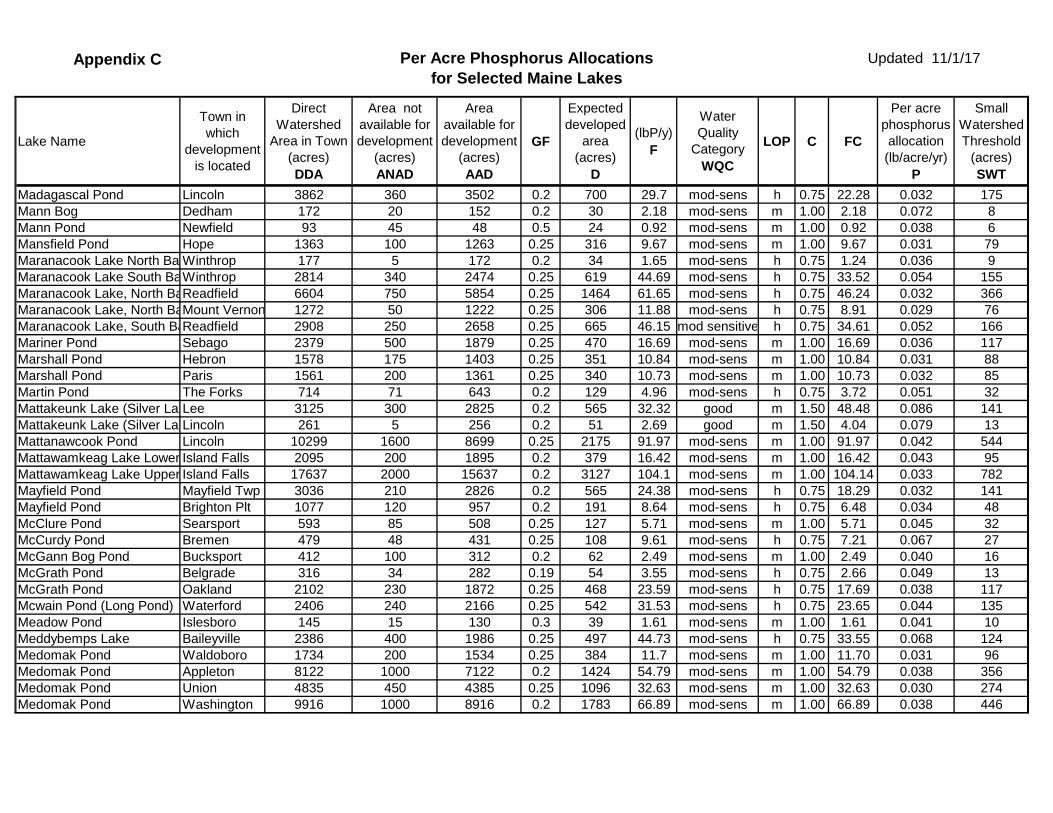
Madagascal Pond Lincoln 3862 360 3502 0.2 700 29.7 mod-sens h 0.75 22.28 0.032 175Mann Bog Dedham 172 20 152 0.2 30 2.18 mod-sens m 1.00 2.18 0.072 8Mann Pond Newfield 93 45 48 0.5 24 0.92 mod-sens m 1.00 0.92 0.038 6Mansfield Pond Hope 1363 100 1263 0.25 316 9.67 mod-sens m 1.00 9.67 0.031 79Maranacook Lake North Ba Winthrop 177 5 172 0.2 34 1.65 mod-sens h 0.75 1.24 0.036 9Maranacook Lake South BaWinthrop 2814 340 2474 0.25 619 44.69 mod-sens h 0.75 33.52 0.054 155Maranacook Lake, North BaReadfield 6604 750 5854 0.25 1464 61.65 mod-sens h 0.75 46.24 0.032 366Maranacook Lake, North BaMount Vernon 1272 50 1222 0.25 306 11.88 mod-sens h 0.75 8.91 0.029 76Maranacook Lake, South BaReadfield 2908 250 2658 0.25 665 46.15 mod sensitive h 0.75 34.61 0.052 166Mariner Pond Sebago 2379 500 1879 0.25 470 16.69 mod-sens m 1.00 16.69 0.036 117Marshall Pond Hebron 1578 175 1403 0.25 351 10.84 mod-sens m 1.00 10.84 0.031 88Marshall Pond Paris 1561 200 1361 0.25 340 10.73 mod-sens m 1.00 10.73 0.032 85Martin Pond The Forks 714 71 643 0.2 129 4.96 mod-sens h 0.75 3.72 0.051 32Mattakeunk Lake (Silver La Lee 3125 300 2825 0.2 565 32.32 good m 1.50 48.48 0.086 141Mattakeunk Lake (Silver La Lincoln 261 5 256 0.2 51 2.69 good m 1.50 4.04 0.079 13Mattanawcook Pond Lincoln 10299 1600 8699 0.25 2175 91.97 mod-sens m 1.00 91.97 0.042 544Mattawamkeag Lake Lower Island Falls 2095 200 1895 0.2 379 16.42 mod-sens m 1.00 16.42 0.043 95Mattawamkeag Lake Upper Island Falls 17637 2000 15637 0.2 3127 104.1 mod-sens m 1.00 104.14 0.033 782Mayfield Pond Mayfield Twp 3036 210 2826 0.2 565 24.38 mod-sens h 0.75 18.29 0.032 141Mayfield Pond Brighton Plt 1077 120 957 0.2 191 8.64 mod-sens h 0.75 6.48 0.034 48McClure Pond Searsport 593 85 508 0.25 127 5.71 mod-sens m 1.00 5.71 0.045 32McCurdy Pond Bremen 479 48 431 0.25 108 9.61 mod-sens h 0.75 7.21 0.067 27McGann Bog Pond Bucksport 412 100 312 0.2 62 2.49 mod-sens m 1.00 2.49 0.040 16McGrath Pond Belgrade 316 34 282 0.19 54 3.55 mod-sens h 0.75 2.66 0.049 13McGrath Pond Oakland 2102 230 1872 0.25 468 23.59 mod-sens h 0.75 17.69 0.038 117Mcwain Pond (Long Pond) Waterford 2406 240 2166 0.25 542 31.53 mod-sens h 0.75 23.65 0.044 135Meadow Pond Islesboro 145 15 130 0.3 39 1.61 mod-sens m 1.00 1.61 0.041 10Meddybemps Lake Baileyville 2386 400 1986 0.25 497 44.73 mod-sens h 0.75 33.55 0.068 124Medomak Pond Waldoboro 1734 200 1534 0.25 384 11.7 mod-sens m 1.00 11.70 0.031 96Medomak Pond Appleton 8122 1000 7122 0.2 1424 54.79 mod-sens m 1.00 54.79 0.038 356Medomak Pond Union 4835 450 4385 0.25 1096 32.63 mod-sens m 1.00 32.63 0.030 274Medomak Pond Washington 9916 1000 8916 0.2 1783 66.89 mod-sens m 1.00 66.89 0.038 446

Appendix C Per Acre Phosphorus Allocationsfor Selected Maine Lakes
Updated 11/1/17
Lake Name
Town in which
development is located
Direct Watershed
Area in Town (acres) DDA
Area not available for development
(acres) ANAD
Area available for development
(acres) AAD
GF
Expected developed
area (acres)
D
(lbP/y) F
Water Quality
Category WQC
LOP C FC
Per acre phosphorus allocation (lb/acre/yr)
P
Small Watershed Threshold
(acres) SWT
Meduxnekeag Lake Oakfield 6958 500 6458 0.15 969 70.05 mod-sens h 0.75 52.54 0.054 242Meetinghouse Pond Phippsburg 69 15 54 0.25 14 0.66 mod-sens m 1.00 0.66 0.049 3Megunticook Lake Basin 1 Lincolnville 1176 240 936 0.25 234 17.61 mod-sens h 0.75 13.21 0.056 59Megunticook Lake Basin 2 Lincolnville 2513 250 2263 0.25 566 28.86 mod-sens h 0.75 21.65 0.038 141Megunticook Lake North BaHope 874 100 774 0.25 194 10.03 mod-sens h 0.75 7.52 0.039 48Megunticook Lake South BaCamden 2807 560 2247 0.3 674 42.07 mod-sens h 0.75 31.55 0.047 169Megunticook Lake South BaHope 1363 150 1213 0.25 303 20.44 mod-sens h 0.75 15.33 0.051 76Merril Pond Lee 1465 500 965 0.25 241 14.57 mod-sens m 1.00 14.57 0.060 60Messalonskee Lake Belgrade 11312 1286 10026 0.23 2274 205.7 mod-sens h 0.75 154.31 0.068 568Messalonskee Lake Readfield 2915 150 2765 0.25 691 53.05 mod-sens h 0.75 39.79 0.058 173Messalonskee Lake Mount Vernon 3830 300 3530 0.25 883 69.65 mod-sens h 0.75 52.24 0.059 221Messalonskee Lake Sidney 6333 1500 4833 0.3 1450 115.2 mod-sens h 0.75 86.39 0.060 362Mid Basin, Damariscotta La Nobleboro 4047 405 3642 0.3 1093 75.27 mod-sens h 0.75 56.45 0.051 273Mid Basin, Damariscotta La Jefferson 405 40 365 0.2 73 7.49 mod-sens h 0.75 5.62 0.077 18Middle Branch Pond Alfred 207 90 117 0.2 23 1.65 mod-sens m 1.00 1.65 0.071 6Middle Pond Waterford 39 20 19 0.25 5 0.39 mod-sens h 0.75 0.29 0.062 1Middle Pond Lovell 79 5 74 0.2 15 0.81 mod-sens h 0.75 0.61 0.041 4Middle Range Pond Poland 3170 300 2870 0.25 718 43.52 mod-sens h 0.75 32.64 0.045 179Middle Springy Pond Clifton 69 35 34 0.2 7 0.79 mod-sens m 1.00 0.79 0.116 2Mill Pond Deer Isle 429 64 365 0.25 91 4.63 mod-sens m 1.00 4.63 0.051 23Mill Pond Washington 1008 40 968 0.2 194 7.18 mod-sens m 1.00 7.18 0.037 48Mill Pond Lee 1596 175 1421 0.25 355 11.86 mod-sens m 1.00 11.86 0.033 89Mill Pond New Vineyard 751 75 676 0.25 169 9.67 mod-sens m 1.00 9.67 0.057 42Mill Privilege Lake Carroll Plt 2614 300 2314 0.15 347 17.08 mod-sens m 1.00 17.08 0.049 87Mill Privilege Lake Lakeville 513 40 473 0.15 71 3.35 mod-sens m 1.00 3.35 0.047 18Mill Privilege Lake Pukakon Twp 343 20 323 0.15 48 2.24 mod-sens m 1.00 2.24 0.046 12Millinocket Lake T1R8 WELS 4190 200 3990 0.25 998 53.31 good h 1.00 53.31 0.053 249Millinocket Lake T1R9 WELS 3165 500 2665 0.25 666 40.28 good h 1.00 40.28 0.060 167Milton Pond Lebanon 931 110 821 0.25 205 9.06 mod-sens m 1.00 9.06 0.044 51Minnehonk Lake Mount Vernon 1116 200 916 0.35 321 20.13 good h 1.00 20.13 0.063 80Mirror Lake Camden 182 30 152 0.25 38 2.29 good h 1.00 2.29 0.060 10Mirror Lake Rockport 753 175 578 0.2 116 9.48 mod-sens h 0.75 7.11 0.062 29
Appendix C Per Acre Phosphorus Allocationsfor Selected Maine Lakes
Updated 11/1/17
Lake Name
Town in which
development is located
Direct Watershed
Area in Town (acres) DDA
Area not available for development
(acres) ANAD
Area available for development
(acres) AAD
GF
Expected developed
area (acres)
D
(lbP/y) F
Water Quality
Category WQC
LOP C FC
Per acre phosphorus allocation (lb/acre/yr)
P
Small Watershed Threshold
(acres) SWT
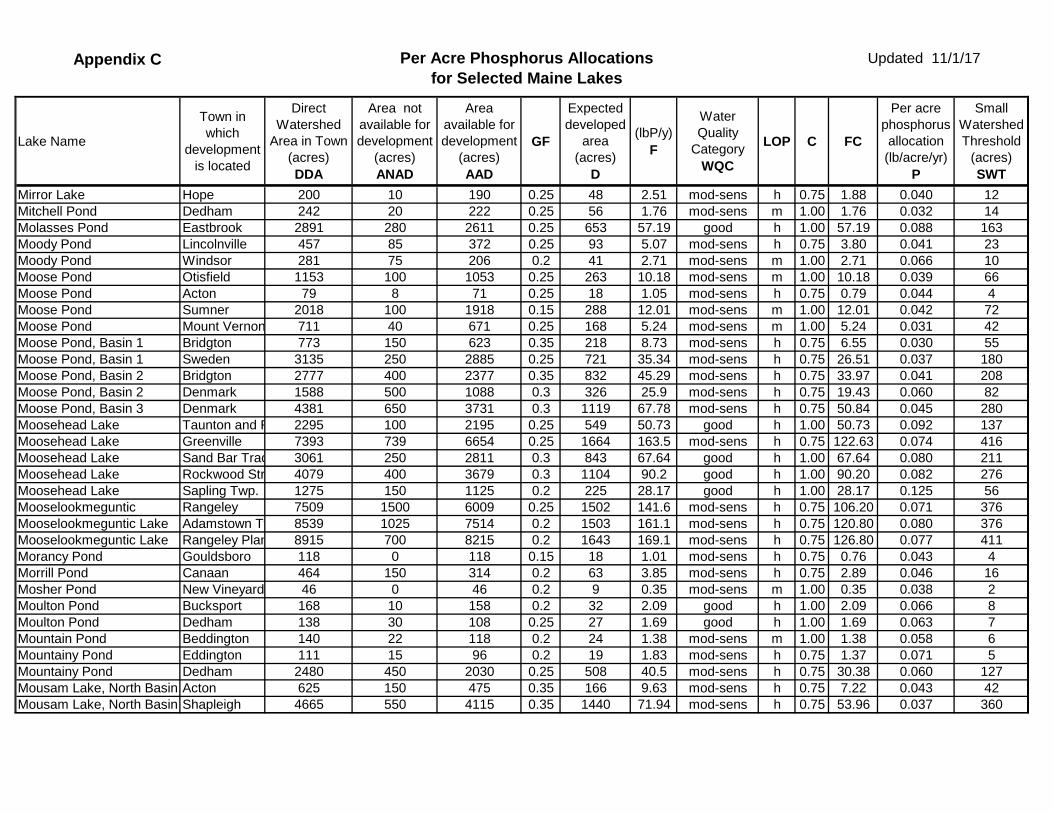
Mirror Lake Hope 200 10 190 0.25 48 2.51 mod-sens h 0.75 1.88 0.040 12Mitchell Pond Dedham 242 20 222 0.25 56 1.76 mod-sens m 1.00 1.76 0.032 14Molasses Pond Eastbrook 2891 280 2611 0.25 653 57.19 good h 1.00 57.19 0.088 163Moody Pond Lincolnville 457 85 372 0.25 93 5.07 mod-sens h 0.75 3.80 0.041 23Moody Pond Windsor 281 75 206 0.2 41 2.71 mod-sens m 1.00 2.71 0.066 10Moose Pond Otisfield 1153 100 1053 0.25 263 10.18 mod-sens m 1.00 10.18 0.039 66Moose Pond Acton 79 8 71 0.25 18 1.05 mod-sens h 0.75 0.79 0.044 4Moose Pond Sumner 2018 100 1918 0.15 288 12.01 mod-sens m 1.00 12.01 0.042 72Moose Pond Mount Vernon 711 40 671 0.25 168 5.24 mod-sens m 1.00 5.24 0.031 42Moose Pond, Basin 1 Bridgton 773 150 623 0.35 218 8.73 mod-sens h 0.75 6.55 0.030 55Moose Pond, Basin 1 Sweden 3135 250 2885 0.25 721 35.34 mod-sens h 0.75 26.51 0.037 180Moose Pond, Basin 2 Bridgton 2777 400 2377 0.35 832 45.29 mod-sens h 0.75 33.97 0.041 208Moose Pond, Basin 2 Denmark 1588 500 1088 0.3 326 25.9 mod-sens h 0.75 19.43 0.060 82Moose Pond, Basin 3 Denmark 4381 650 3731 0.3 1119 67.78 mod-sens h 0.75 50.84 0.045 280Moosehead Lake Taunton and R 2295 100 2195 0.25 549 50.73 good h 1.00 50.73 0.092 137Moosehead Lake Greenville 7393 739 6654 0.25 1664 163.5 mod-sens h 0.75 122.63 0.074 416Moosehead Lake Sand Bar Trac 3061 250 2811 0.3 843 67.64 good h 1.00 67.64 0.080 211Moosehead Lake Rockwood Str 4079 400 3679 0.3 1104 90.2 good h 1.00 90.20 0.082 276Moosehead Lake Sapling Twp. 1275 150 1125 0.2 225 28.17 good h 1.00 28.17 0.125 56Mooselookmeguntic Rangeley 7509 1500 6009 0.25 1502 141.6 mod-sens h 0.75 106.20 0.071 376Mooselookmeguntic Lake Adamstown Tw 8539 1025 7514 0.2 1503 161.1 mod-sens h 0.75 120.80 0.080 376Mooselookmeguntic Lake Rangeley Plan 8915 700 8215 0.2 1643 169.1 mod-sens h 0.75 126.80 0.077 411Morancy Pond Gouldsboro 118 0 118 0.15 18 1.01 mod-sens h 0.75 0.76 0.043 4Morrill Pond Canaan 464 150 314 0.2 63 3.85 mod-sens h 0.75 2.89 0.046 16Mosher Pond New Vineyard 46 0 46 0.2 9 0.35 mod-sens m 1.00 0.35 0.038 2Moulton Pond Bucksport 168 10 158 0.2 32 2.09 good h 1.00 2.09 0.066 8Moulton Pond Dedham 138 30 108 0.25 27 1.69 good h 1.00 1.69 0.063 7Mountain Pond Beddington 140 22 118 0.2 24 1.38 mod-sens m 1.00 1.38 0.058 6Mountainy Pond Eddington 111 15 96 0.2 19 1.83 mod-sens h 0.75 1.37 0.071 5Mountainy Pond Dedham 2480 450 2030 0.25 508 40.5 mod-sens h 0.75 30.38 0.060 127Mousam Lake, North Basin Acton 625 150 475 0.35 166 9.63 mod-sens h 0.75 7.22 0.043 42Mousam Lake, North Basin Shapleigh 4665 550 4115 0.35 1440 71.94 mod-sens h 0.75 53.96 0.037 360
Appendix C Per Acre Phosphorus Allocationsfor Selected Maine Lakes
Updated 11/1/17
Lake Name
Town in which
development is located
Direct Watershed
Area in Town (acres) DDA
Area not available for development
(acres) ANAD
Area available for development
(acres) AAD
GF
Expected developed
area (acres)
D
(lbP/y) F
Water Quality
Category WQC
LOP C FC
Per acre phosphorus allocation (lb/acre/yr)
P
Small Watershed Threshold
(acres) SWT
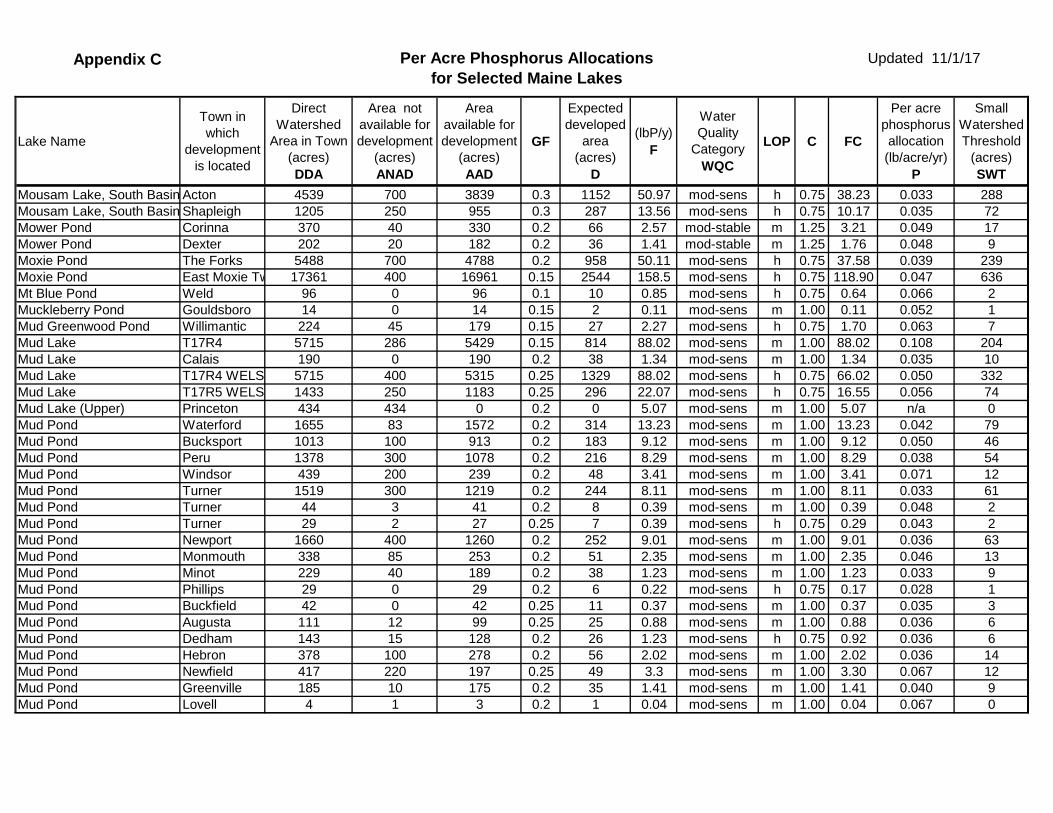
Mousam Lake, South Basin Acton 4539 700 3839 0.3 1152 50.97 mod-sens h 0.75 38.23 0.033 288Mousam Lake, South Basin Shapleigh 1205 250 955 0.3 287 13.56 mod-sens h 0.75 10.17 0.035 72Mower Pond Corinna 370 40 330 0.2 66 2.57 mod-stable m 1.25 3.21 0.049 17Mower Pond Dexter 202 20 182 0.2 36 1.41 mod-stable m 1.25 1.76 0.048 9Moxie Pond The Forks 5488 700 4788 0.2 958 50.11 mod-sens h 0.75 37.58 0.039 239Moxie Pond East Moxie Tw 17361 400 16961 0.15 2544 158.5 mod-sens h 0.75 118.90 0.047 636Mt Blue Pond Weld 96 0 96 0.1 10 0.85 mod-sens h 0.75 0.64 0.066 2Muckleberry Pond Gouldsboro 14 0 14 0.15 2 0.11 mod-sens m 1.00 0.11 0.052 1Mud Greenwood Pond Willimantic 224 45 179 0.15 27 2.27 mod-sens h 0.75 1.70 0.063 7Mud Lake T17R4 5715 286 5429 0.15 814 88.02 mod-sens m 1.00 88.02 0.108 204Mud Lake Calais 190 0 190 0.2 38 1.34 mod-sens m 1.00 1.34 0.035 10Mud Lake T17R4 WELS 5715 400 5315 0.25 1329 88.02 mod-sens h 0.75 66.02 0.050 332Mud Lake T17R5 WELS 1433 250 1183 0.25 296 22.07 mod-sens h 0.75 16.55 0.056 74Mud Lake (Upper) Princeton 434 434 0 0.2 0 5.07 mod-sens m 1.00 5.07 n/a 0Mud Pond Waterford 1655 83 1572 0.2 314 13.23 mod-sens m 1.00 13.23 0.042 79Mud Pond Bucksport 1013 100 913 0.2 183 9.12 mod-sens m 1.00 9.12 0.050 46Mud Pond Peru 1378 300 1078 0.2 216 8.29 mod-sens m 1.00 8.29 0.038 54Mud Pond Windsor 439 200 239 0.2 48 3.41 mod-sens m 1.00 3.41 0.071 12Mud Pond Turner 1519 300 1219 0.2 244 8.11 mod-sens m 1.00 8.11 0.033 61Mud Pond Turner 44 3 41 0.2 8 0.39 mod-sens m 1.00 0.39 0.048 2Mud Pond Turner 29 2 27 0.25 7 0.39 mod-sens h 0.75 0.29 0.043 2Mud Pond Newport 1660 400 1260 0.2 252 9.01 mod-sens m 1.00 9.01 0.036 63Mud Pond Monmouth 338 85 253 0.2 51 2.35 mod-sens m 1.00 2.35 0.046 13Mud Pond Minot 229 40 189 0.2 38 1.23 mod-sens m 1.00 1.23 0.033 9Mud Pond Phillips 29 0 29 0.2 6 0.22 mod-sens h 0.75 0.17 0.028 1Mud Pond Buckfield 42 0 42 0.25 11 0.37 mod-sens m 1.00 0.37 0.035 3Mud Pond Augusta 111 12 99 0.25 25 0.88 mod-sens m 1.00 0.88 0.036 6Mud Pond Dedham 143 15 128 0.2 26 1.23 mod-sens h 0.75 0.92 0.036 6Mud Pond Hebron 378 100 278 0.2 56 2.02 mod-sens m 1.00 2.02 0.036 14Mud Pond Newfield 417 220 197 0.25 49 3.3 mod-sens m 1.00 3.30 0.067 12Mud Pond Greenville 185 10 175 0.2 35 1.41 mod-sens m 1.00 1.41 0.040 9Mud Pond Lovell 4 1 3 0.2 1 0.04 mod-sens m 1.00 0.04 0.067 0
Appendix C Per Acre Phosphorus Allocationsfor Selected Maine Lakes
Updated 11/1/17
Lake Name
Town in which
development is located
Direct Watershed
Area in Town (acres) DDA
Area not available for development
(acres) ANAD
Area available for development
(acres) AAD
GF
Expected developed
area (acres)
D
(lbP/y) F
Water Quality
Category WQC
LOP C FC
Per acre phosphorus allocation (lb/acre/yr)
P
Small Watershed Threshold
(acres) SWT
Mud Pond (3752) Poland 958 200 758 0.25 190 5.07 mod-sens m 1.00 5.07 0.027 47Mud Pond (3756) Poland 318 35 283 0.25 71 2.22 mod-sens m 1.00 2.22 0.031 18Mud Pond (Cole Pond) Paris 138 10 128 0.2 26 0.83 mod-sens m 1.00 0.83 0.032 6Mud Pond (in Turner) Buckfield 284 40 244 0.25 61 1.52 mod-sens m 1.00 1.52 0.025 15Muddy Pond Washington 91 9 82 0.2 16 1.14 mod-sens m 1.00 1.14 0.071 4N. Basin, Damariscotta LakeNobleboro 165 16 149 0.3 45 1.96 mod-sens h 0.75 1.47 0.033 11N. Basin, Damariscotta LakeJefferson 6404 640 5764 0.2 1153 75.85 mod-sens h 0.75 56.89 0.049 288N. Basin, Damariscotta LakeSomerville 4628 463 3702 0.2 740 54.81 mod-sens h 0.75 41.11 0.055 185N. Basin, Damariscotta LakeWashington 9463 946 8517 0.2 1703 112.1 mod-sens h 0.75 84.04 0.049 426Narraguagus Lake Eastbrook 1880 170 1710 0.2 342 17.83 mod-sens h 0.75 13.37 0.039 86Narraguagus Lake T16 MD 1235 160 1075 0.2 215 11.7 mod-sens h 0.75 8.78 0.041 54Nash Pond Strong 123 10 113 0.2 23 0.88 mod-sens m 1.00 0.88 0.039 6Nashs Lake Calais 3694 200 3494 0.25 874 51.37 good h 1.00 51.37 0.059 218Nehumkeag Pond Pittston 1559 50 1509 0.2 302 14.15 mod-sens m 1.00 14.15 0.047 75Nelson Pond Livermore 64 30 34 0.25 9 0.66 mod-sens m 1.00 0.66 0.078 2Nequasset Pond Woolwich 7432 600 6832 0.25 1708 66.34 mod-sens h 0.75 49.76 0.029 427Nequasset Pond Wiscasset 845 120 725 0.25 181 7.54 mod-sens h 0.75 5.66 0.031 45Newbert Pond Appleton 333 75 258 0.2 52 3.17 mod-sens m 1.00 3.17 0.061 13Nicatous Lake T3ND 3629 363 3266 0.2 653 63.76 mod-sens h 0.75 47.82 0.073 163Nichols Pond Swanville 118 0 118 0.25 30 1.16 mod-sens h 0.75 0.87 0.029 7Nisbit Pond Lebanon 111 20 91 0.25 23 0.77 mod-sens m 1.00 0.77 0.034 6No Name Pond Lewiston 724 100 624 0.3 187 6.96 mod-sens h 0.75 5.22 0.028 47Noah Eastman Pond Lovell 148 10 138 0.2 28 1.19 mod-sens m 1.00 1.19 0.043 7Nokomis Pond Newport 632 100 532 0.25 133 7.1 mod-sens m 1.00 7.10 0.053 33North Pond Waldoboro 130 10 120 0.2 24 1.8 mod-sens m 1.00 1.80 0.075 6North Pond Smithfield 6100 530 5570 0.25 1393 82.7 mod-sens m 1.00 82.70 0.059 348North Pond Sumner 951 30 921 0.2 184 10.98 good h 1.00 10.98 0.060 46North Pond Woodstock 1126 220 906 0.2 181 11.64 mod-sens h 0.75 8.73 0.048 45North Pond Rome 242 20 222 0.25 56 3.28 mod-sens m 1.00 3.28 0.059 14North Pond Buckfield 84 0 84 0.25 21 0.97 mod-sens h 0.75 0.73 0.035 5North Pond Jay 593 40 553 0.2 111 5.51 mod-sens m 1.00 5.51 0.050 28North Pond T8 R3 WELS 91 20 71 0.1 7 0.59 mod-sens m 1.00 0.59 0.083 2
Appendix C Per Acre Phosphorus Allocationsfor Selected Maine Lakes
Updated 11/1/17
Lake Name
Town in which
development is located
Direct Watershed
Area in Town (acres) DDA
Area not available for development
(acres) ANAD
Area available for development
(acres) AAD
GF
Expected developed
area (acres)
D
(lbP/y) F
Water Quality
Category WQC
LOP C FC
Per acre phosphorus allocation (lb/acre/yr)
P
Small Watershed Threshold
(acres) SWT
North Pond, Little Rome 1067 250 817 0.25 204 8.55 mod-sens m 1.00 8.55 0.042 51Northeast Pond Acton 3484 600 2884 0.25 721 27.91 mod-sens m 1.00 27.91 0.039 180Northeast Pond Hartford 588 75 513 0.15 77 3.9 mod-sens m 1.00 3.90 0.051 19Northeast Pond Lebanon 1598 200 1398 0.25 350 12.81 mod-sens m 1.00 12.81 0.037 87Northwest Pond Alfred 462 200 262 0.2 52 3.04 mod-sens m 1.00 3.04 0.058 13Norton Pond Lincolnville 5228 700 4528 0.25 1132 41.87 mod-sens h 0.75 31.40 0.028 283Notched Pond Raymond 200 19 181 0.3 54 2.44 mod-sens m 1.00 2.44 0.045 14Notched Pond Gray 148 8 140 0.3 42 1.8 mod-sens m 1.00 1.80 0.043 11Noyes Pond Blue Hill 518 70 448 0.2 90 3.9 mod-sens h 0.75 2.93 0.033 22Nubble Pond Raymond 175 30 145 0.25 44 1.49 poor-rest m 0.50 0.75 0.020 11Nubble Pond Casco 187 95 92 0.25 23 1.6 poor-rest m 0.50 0.80 0.035 6Number Nine Lake TD R2 WELS 210 10 200 0.1 20 1.69 mod-sens m 1.00 1.69 0.085 5Number Nine Lake T9 R3 WELS 798 60 738 0.15 111 6.43 mod-sens m 1.00 6.43 0.058 28Number One Pond Sanford 4484 650 3834 0.3 1150 40.28 mod-sens m 1.00 40.28 0.035 288Number Three Pond Lee 1949 200 1749 0.2 350 16.27 mod-sens m 1.00 16.27 0.047 87Number Three Pond T3R1 NBPP 2804 600 2204 0.2 441 23.41 mod-sens m 1.00 23.41 0.053 110Nutting Pond Rangeley 86 30 56 0.2 11 0.92 mod-sens m 1.00 0.92 0.082 3Olivers Pond Deer Isle 479 72 407 0.2 81 3.57 mod-sens m 1.00 3.57 0.044 20Onawa Lake Willimantic 143 5 138 0.2 28 1.56 good h 1.00 1.56 0.057 7Oran Pond Mariaville 69 5 64 0.25 16 1.32 mod-sens m 1.00 1.32 0.083 4Orange Lake Whiting 1670 160 1510 0.2 302 23.59 mod-sens h 0.75 17.69 0.059 76Otter Lake Northfield 79 0 79 0.15 12 0.7 mod-sens m 1.00 0.70 0.059 3Otter Pond Bridgton 790 79 711 0.4 284 7.21 mod-sens m 1.00 7.21 0.025 71Otter Ponds #2 Standish 34 2 32 0.3 10 0.55 mod-sens h 0.75 0.41 0.043 2Otter Ponds #3 Standish 14 1 13 0.3 4 0.3 mod-sens m 1.00 0.30 0.077 1Owl Pond Casco 286 60 226 0.25 57 1.8 mod-sens m 1.00 1.80 0.032 14Paine Pond Paris 212 20 192 0.2 38 1.76 mod-sens m 1.00 1.76 0.046 10Panther Pond Raymond 5530 400 5130 0.35 1796 86.78 mod sensitive h 0.75 65.09 0.036 449Panther Pond Casco 2139 200 1939 0.35 679 33.58 mod-sens h 0.75 25.19 0.037 170Panther Pond Windham 71 3 68 0.3 20 1.1 mod-sens h 0.75 0.83 0.040 5Papoose Pond Waterford 155 50 105 0.3 32 2.2 mod-sens h 0.75 1.65 0.052 8Paradise Pond Damariscotta 701 120 581 0.3 174 8.13 mod-sens m 1.00 8.13 0.047 44
Appendix C Per Acre Phosphorus Allocationsfor Selected Maine Lakes
Updated 11/1/17
Lake Name
Town in which
development is located
Direct Watershed
Area in Town (acres) DDA
Area not available for development
(acres) ANAD
Area available for development
(acres) AAD
GF
Expected developed
area (acres)
D
(lbP/y) F
Water Quality
Category WQC
LOP C FC
Per acre phosphorus allocation (lb/acre/yr)
P
Small Watershed Threshold
(acres) SWT
Parker Pond Casco 677 160 517 0.3 155 5.82 mod-sens m 1.00 5.82 0.038 39Parker Pond Dayton 12 1 11 0.25 3 0.19 mod-sens m 1.00 0.19 0.069 1Parker Pond Lyman 51 15 36 0.3 11 0.85 mod-sens m 1.00 0.85 0.079 3Parker Pond Vienna 1156 60 1096 0.25 274 19.13 mod-sens h 0.75 14.35 0.052 69Parker Pond Mount Vernon 627 30 597 0.25 149 10.36 mod-sens h 0.75 7.77 0.052 37Parker Pond Jay 4781 400 4381 0.2 876 31.46 mod-sens m 1.00 31.46 0.036 219Parks Pond Clifton 966 135 831 0.25 208 10.91 good h 1.00 10.91 0.053 52Passagassawakeag Lake Brooks 2191 220 1971 0.25 493 20.24 mod-sens m 1.00 20.24 0.041 123Pattee Pond Vassalboro 1079 250 829 0.25 207 9.45 mod-sens m 1.00 9.45 0.046 52Patten Pond Hampden 627 150 477 0.2 95 3.57 mod-sens m 1.00 3.57 0.037 24Patten Pond Indian Twp 42 16 26 0.2 5 0.48 mod-sens m 1.00 0.48 0.092 1Peabody Pond Sebago 1151 115 1036 0.35 363 21.69 mod-sens h 0.75 16.27 0.045 91Peabody Pond Bridgton 516 52 464 0.3 139 9.74 mod-sens h 0.75 7.31 0.052 35Peabody Pond Naples 830 80 750 0.35 263 15.63 mod-sens h 0.75 11.72 0.045 66Peaked Mountain Pond Northfield 96 0 96 0.2 19 1.76 mod-sens h 0.75 1.32 0.069 5Pease Pond Wilton 854 80 774 0.25 194 7.96 mod-sens m 1.00 7.96 0.041 48Pease Pond Jay 531 40 491 0.25 123 4.96 mod-sens m 1.00 4.96 0.040 31Peat Pond Fryeburg 222 5 217 0.2 43 1.74 mod-sens m 1.00 1.74 0.040 11Pemadumcook Chain T1R8 WELS 1519 150 1369 0.2 274 197.9 mod-sens h 0.75 148.44 0.542 68Pemadumcook Chain T1R9 WELS 8789 500 8289 0.2 1658 1143 mod-sens h 0.75 857.12 0.517 414Pemaquid Pond Nobleboro 1868 206 1662 0.3 499 28.44 mod-sens h 0.75 21.33 0.043 125Pemaquid Pond Damariscotta 1717 172 1545 0.3 464 26.15 mod-sens h 0.75 19.61 0.042 116Pemaquid Pond Bremen 1999 200 1799 0.25 450 30.45 mod-sens h 0.75 22.84 0.051 112Pemaquid Pond Waldoboro 420 120 300 0.25 75 6.39 mod-sens h 0.75 4.79 0.064 19Pemiquid Pond Bremen 1999 200 1799 0.25 450 30.45 mod-sens h 0.75 22.84 0.051 112Pennamaquan Lake Calais 143 0 143 0.2 29 1.52 mod-sens h 0.75 1.14 0.040 7Pennell Pond New Portland 279 5 274 0.2 55 2.09 mod-sens m 1.00 2.09 0.038 14Pennesseewassee Lake Norway 9673 1200 8473 0.25 2118 97.7 mod-sens m 1.00 97.70 0.046 530Penney Pond Belgrade 42 20 22 0.4 9 0.83 mod-sens h 0.75 0.62 0.071 2Pequawket Lake Brownfield 410 40 370 0.25 93 4.01 mod-sens m 1.00 4.01 0.043 23Peqwaket Lake Hiram 422 40 382 0.25 96 4.14 mod-sens m 1.00 4.14 0.043 24Perley Pond Denmark 281 25 256 0.25 64 3.61 mod-sens h 0.75 2.71 0.042 16
Appendix C Per Acre Phosphorus Allocationsfor Selected Maine Lakes
Updated 11/1/17
Lake Name
Town in which
development is located
Direct Watershed
Area in Town (acres) DDA
Area not available for development
(acres) ANAD
Area available for development
(acres) AAD
GF
Expected developed
area (acres)
D
(lbP/y) F
Water Quality
Category WQC
LOP C FC
Per acre phosphorus allocation (lb/acre/yr)
P
Small Watershed Threshold
(acres) SWT
Perley Pond Sebago 81 2 79 0.25 20 0.99 mod-sens m 1.00 0.99 0.050 5Perry Pond Newfield 323 80 243 0.2 49 2.09 mod-sens m 1.00 2.09 0.043 12Pettingill Pond Windham 360 60 300 0.35 105 3.35 mod-sens h 0.75 2.51 0.024 26Phillips Lake Dedham 4262 1200 3062 0.3 919 67.56 good h 1.00 67.56 0.074 230Pickerel Pond Denmark 271 20 251 0.25 63 3.5 mod-stable m 1.00 3.50 0.056 16Pickerel Pond Limerick 358 100 258 0.25 65 3.19 mod-sens m 1.25 3.99 0.062 16Pierce Pond Penobscot 1697 100 1597 0.15 240 13.61 mod-sens m 1.00 13.61 0.057 60Pine Lake Calais 145 0 145 0.2 29 1.6 mod-sens m 1.00 1.60 0.055 7Pinkham Pond (Hidden Lak Newfield 266 30 236 0.3 71 2.88 mod-sens m 1.00 2.88 0.041 18Pitcher Pond Lincolnville 644 60 584 0.26 149 6.48 mod-sens m 1.00 6.48 0.044 37Pitcher Pond Northport 3800 380 3420 0.25 855 38.23 mod-sensitve m 1.00 38.23 0.045 214Pleasant Lake Otisfield 2841 300 2541 0.35 889 55.89 outstanding h 0.50 27.95 0.031 222Pleasant Lake Carroll Plt 1868 60 1808 0.15 271 22.9 mod-sens h 0.75 17.18 0.063 68Pleasant Lake Kossuth Twp 6016 350 5666 0.15 850 73.8 mod-sens h 0.75 55.35 0.065 212Pleasant Lake T6 R1 NBPP 3864 400 3464 0.15 520 47.4 mod-sens h 0.75 35.55 0.068 130Pleasant Pond Denmark 2045 300 1745 0.2 349 17.88 mod-sens m 1.00 17.88 0.051 87Pleasant Pond Casco 768 300 468 0.35 164 15.12 outstanding m 0.50 7.56 0.046 41Pleasant Pond Turner 570 100 470 0.3 141 8.48 mod-sens h 0.75 6.36 0.045 35Pleasant Pond Fryeburg 2656 900 1756 0.2 351 23.32 mod-sens m 1.00 23.32 0.066 88Pleasant Pond Brownfield 227 30 197 0.2 39 1.98 mod-sens m 1.00 1.98 0.050 10Pleasant Pond Sumner 956 30 926 0.2 185 19.31 mod-sens m 1.00 19.31 0.104 46Pleasant Pond Island Falls 1109 60 1049 0.25 262 31.2 outstanding h 0.50 15.60 0.059 66Pleasant Pond, Upper BasinLitchfield 7104 710 6394 0.2 1279 46.79 poor-rest m 0.50 23.40 0.018 320Pleasant Pond, Upper BasinBowdoin 2540 800 1740 0.2 348 16.73 poor-rest m 0.50 8.37 0.024 87Pleasant River Lake Beddington 3489 350 3139 0.2 628 38.21 good h 1.00 38.21 0.061 157Plymouth Pond Plymouth 4156 1000 3156 0.25 789 21.63 mod-stable m 1.25 27.04 0.034 197Plymouth Pond Troy 5342 650 4692 0.2 938 27.82 mod-sens m 1.00 27.82 0.030 235Pocamoonshine Lake Princeton 12762 2800 9962 0.2 1992 148 mod-sens m 1.00 147.95 0.074 498Pocamoonshine Lake Baileyville 49 1 48 0.2 10 0.57 good m 1.50 0.86 0.089 2Pocamoonshine Lake Princeton 12762 7000 5762 0.2 1152 148 good m 1.50 221.93 0.100 288Pockwockamus Pond T2R9 WELS 328 33 295 0.15 44 2.18 mod-sens m 1.00 2.18 0.049 11Portage Lake Portage Lake 9945 2500 7445 0.25 1861 167.1 mod-sens h 0.75 125.33 0.067 465

Appendix C Per Acre Phosphorus Allocationsfor Selected Maine Lakes
Updated 11/1/17
Lake Name
Town in which
development is located
Direct Watershed
Area in Town (acres) DDA
Area not available for development
(acres) ANAD
Area available for development
(acres) AAD
GF
Expected developed
area (acres)
D
(lbP/y) F
Water Quality
Category WQC
LOP C FC
Per acre phosphorus allocation (lb/acre/yr)
P
Small Watershed Threshold
(acres) SWT
Porter Lake New Vineyard 1882 150 1732 0.25 433 23.65 good h 1.00 23.65 0.055 108Porter Lake Strong 1114 150 964 0.25 241 14.02 good h 1.00 14.02 0.058 60Poverty Pond Willimantic 338 10 328 0.15 49 3.41 mod-sens m 1.00 3.41 0.069 12Poverty Pond (Silver Lake) Newfield 607 210 397 0.3 119 6.28 mod-sens m 1.00 6.28 0.053 30Presque Isle Lake T9 R3 WELS 791 50 741 0.1 74 2.063 mod-sens m 1.00 2.06 0.060 19Prong Pond Beaver Cove T 1756 400 1356 0.25 339 15.34 mod-sens h 0.75 11.51 0.034 85Prong Pond Greenville 2256 580 1676 0.25 419 19.69 mod-sens h 0.75 14.77 0.035 105Puffers Pond Dexter 1013 125 888 0.25 222 8.93 mod-sens h 0.75 6.70 0.030 56Pug Pond Hermon 56 28 28 0.25 7 0.37 mod-sens m 1.00 0.37 0.053 2Pushaw Lake Glenburn 5152 700 4452 0.25 1113 44.62 mod-sens m 1.00 44.62 0.040 278Pushaw Lake Orono 1396 870 526 0.45 237 12.1 mod-sens m 1.00 12.10 0.051 59Quantabacook Lake Searsmont 6807 700 6107 0.25 1527 61.62 mod-sens m 1.00 61.62 0.040 382Quimby Pond Rangeley 256 100 156 0.3 47 4.14 poor-rest h 0.50 2.07 0.044 12Rangeley Lake Rangeley Plt 12330 1000 11330 0.25 2833 226.5 good h 1.00 226.50 0.080 708Rangeley Lake Rangeley 7702 770 6932 0.3 2080 141.5 good h 1.00 141.51 0.068 520Rangeley Lake Dallas Plt. 1551 150 1401 0.2 280 28.51 good h 1.00 28.51 0.102 70Rangeley Lake Sandy River P 6629 1100 5529 0.25 1382 121.2 good h 1.00 121.23 0.088 346Raymond Pond Raymond 2772 120 2652 0.3 796 28.7 mod-sens h 0.75 21.53 0.027 199Reddington Pond Carrabassett V 622 210 412 0.25 103 5.79 mod-sens h 0.75 4.34 0.042 26Redington Pond Redington Tw 4519 0 4519 0.15 678 35.1 mod-sens h 0.75 26.33 0.039 169Rich Mill Pond Standish 1981 500 1481 0.25 370 12.3 mod-sens m 1.00 12.30 0.033 93Rideout Lake Monticello 340 70 270 0.1 27 0.862 mod-sens m 1.00 0.86 0.060 7Roaring Lake Whiting 1598 100 1498 0.15 225 12.23 mod-sens m 1.00 12.23 0.054 56Roberts Pond Lyman 1522 200 1322 0.25 331 10.27 mod-sens m 1.00 10.27 0.031 83Robinson Pond Jay 7 0.25 6.75 0.2 1 0.06 mod-sens m 1.00 0.06 0.044 0Rocky Pond Rockport 153 10 143 0.25 36 1.45 mod-sens m 1.00 1.45 0.041 9Rocky Pond Orland 1109 120 989 0.25 247 11.2 mod-sens m 1.00 11.20 0.045 62Rocky Pond Dedham 400 80 320 0.2 64 6.15 mod-sens m 1.00 6.15 0.096 16Rocky Pond (Little) Dedham 108 10 98 0.25 25 0.94 mod-sens m 1.00 0.94 0.038 6Ross Pond Bristol 108 11 97 0.25 24 1.25 mod-sens h 0.75 0.94 0.039 6Ross Pond Rangeley 674 40 634 0.15 95 3.57 mod-sens m 1.00 3.57 0.038 24Round Pond Waldoboro 175 20 155 0.2 31 1.76 mod-sens m 1.00 1.76 0.057 8
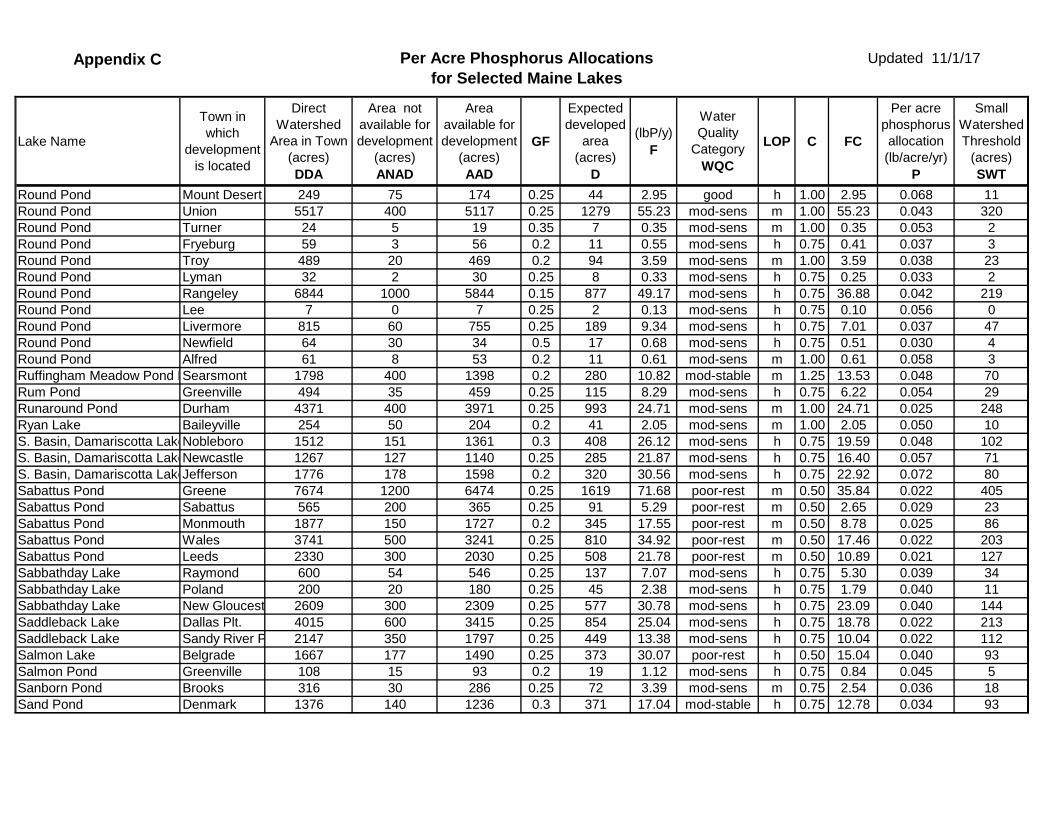
Appendix C Per Acre Phosphorus Allocationsfor Selected Maine Lakes
Updated 11/1/17
Lake Name
Town in which
development is located
Direct Watershed
Area in Town (acres) DDA
Area not available for development
(acres) ANAD
Area available for development
(acres) AAD
GF
Expected developed
area (acres)
D
(lbP/y) F
Water Quality
Category WQC
LOP C FC
Per acre phosphorus allocation (lb/acre/yr)
P
Small Watershed Threshold
(acres) SWT
Round Pond Mount Desert 249 75 174 0.25 44 2.95 good h 1.00 2.95 0.068 11Round Pond Union 5517 400 5117 0.25 1279 55.23 mod-sens m 1.00 55.23 0.043 320Round Pond Turner 24 5 19 0.35 7 0.35 mod-sens m 1.00 0.35 0.053 2Round Pond Fryeburg 59 3 56 0.2 11 0.55 mod-sens h 0.75 0.41 0.037 3Round Pond Troy 489 20 469 0.2 94 3.59 mod-sens m 1.00 3.59 0.038 23Round Pond Lyman 32 2 30 0.25 8 0.33 mod-sens h 0.75 0.25 0.033 2Round Pond Rangeley 6844 1000 5844 0.15 877 49.17 mod-sens h 0.75 36.88 0.042 219Round Pond Lee 7 0 7 0.25 2 0.13 mod-sens h 0.75 0.10 0.056 0Round Pond Livermore 815 60 755 0.25 189 9.34 mod-sens h 0.75 7.01 0.037 47Round Pond Newfield 64 30 34 0.5 17 0.68 mod-sens h 0.75 0.51 0.030 4Round Pond Alfred 61 8 53 0.2 11 0.61 mod-sens m 1.00 0.61 0.058 3Ruffingham Meadow Pond PSearsmont 1798 400 1398 0.2 280 10.82 mod-stable m 1.25 13.53 0.048 70Rum Pond Greenville 494 35 459 0.25 115 8.29 mod-sens h 0.75 6.22 0.054 29Runaround Pond Durham 4371 400 3971 0.25 993 24.71 mod-sens m 1.00 24.71 0.025 248Ryan Lake Baileyville 254 50 204 0.2 41 2.05 mod-sens m 1.00 2.05 0.050 10S. Basin, Damariscotta LakeNobleboro 1512 151 1361 0.3 408 26.12 mod-sens h 0.75 19.59 0.048 102S. Basin, Damariscotta LakeNewcastle 1267 127 1140 0.25 285 21.87 mod-sens h 0.75 16.40 0.057 71S. Basin, Damariscotta LakeJefferson 1776 178 1598 0.2 320 30.56 mod-sens h 0.75 22.92 0.072 80Sabattus Pond Greene 7674 1200 6474 0.25 1619 71.68 poor-rest m 0.50 35.84 0.022 405Sabattus Pond Sabattus 565 200 365 0.25 91 5.29 poor-rest m 0.50 2.65 0.029 23Sabattus Pond Monmouth 1877 150 1727 0.2 345 17.55 poor-rest m 0.50 8.78 0.025 86Sabattus Pond Wales 3741 500 3241 0.25 810 34.92 poor-rest m 0.50 17.46 0.022 203Sabattus Pond Leeds 2330 300 2030 0.25 508 21.78 poor-rest m 0.50 10.89 0.021 127Sabbathday Lake Raymond 600 54 546 0.25 137 7.07 mod-sens h 0.75 5.30 0.039 34Sabbathday Lake Poland 200 20 180 0.25 45 2.38 mod-sens h 0.75 1.79 0.040 11Sabbathday Lake New Gloucest 2609 300 2309 0.25 577 30.78 mod-sens h 0.75 23.09 0.040 144Saddleback Lake Dallas Plt. 4015 600 3415 0.25 854 25.04 mod-sens h 0.75 18.78 0.022 213Saddleback Lake Sandy River P 2147 350 1797 0.25 449 13.38 mod-sens h 0.75 10.04 0.022 112Salmon Lake Belgrade 1667 177 1490 0.25 373 30.07 poor-rest h 0.50 15.04 0.040 93Salmon Pond Greenville 108 15 93 0.2 19 1.12 mod-sens h 0.75 0.84 0.045 5Sanborn Pond Brooks 316 30 286 0.25 72 3.39 mod-sens m 0.75 2.54 0.036 18Sand Pond Denmark 1376 140 1236 0.3 371 17.04 mod-stable h 0.75 12.78 0.034 93
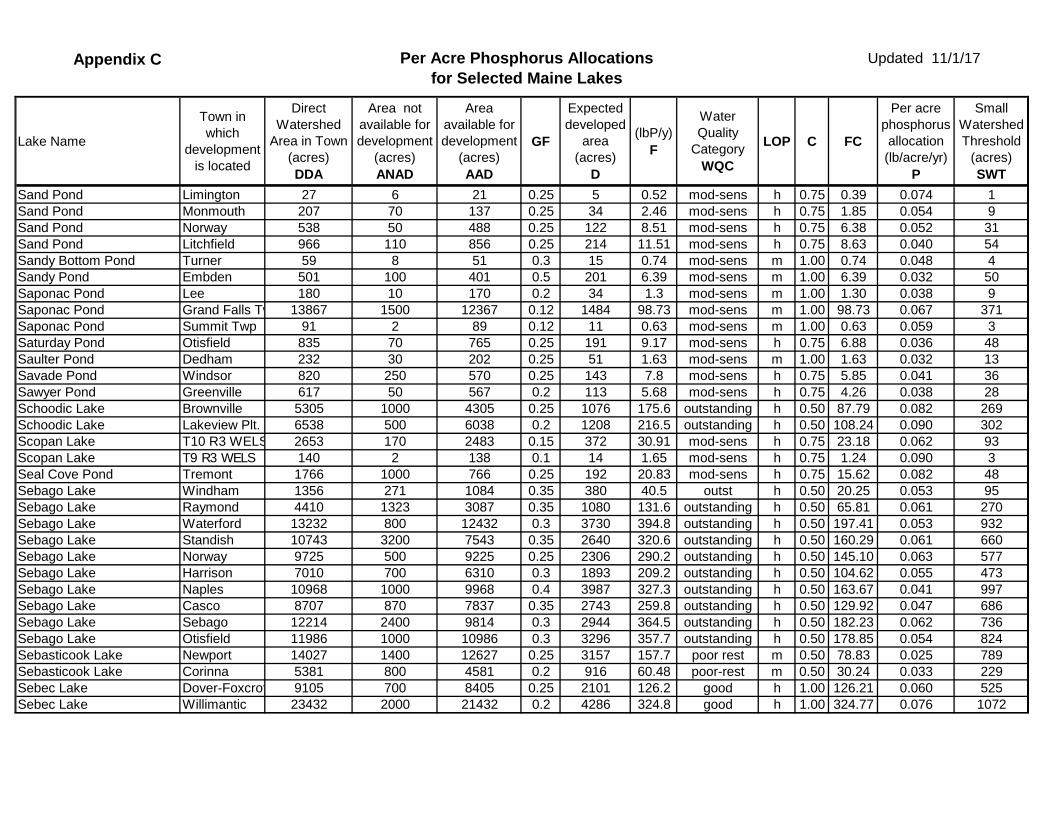
Appendix C Per Acre Phosphorus Allocationsfor Selected Maine Lakes
Updated 11/1/17
Lake Name
Town in which
development is located
Direct Watershed
Area in Town (acres) DDA
Area not available for development
(acres) ANAD
Area available for development
(acres) AAD
GF
Expected developed
area (acres)
D
(lbP/y) F
Water Quality
Category WQC
LOP C FC
Per acre phosphorus allocation (lb/acre/yr)
P
Small Watershed Threshold
(acres) SWT
Sand Pond Limington 27 6 21 0.25 5 0.52 mod-sens h 0.75 0.39 0.074 1Sand Pond Monmouth 207 70 137 0.25 34 2.46 mod-sens h 0.75 1.85 0.054 9Sand Pond Norway 538 50 488 0.25 122 8.51 mod-sens h 0.75 6.38 0.052 31Sand Pond Litchfield 966 110 856 0.25 214 11.51 mod-sens h 0.75 8.63 0.040 54Sandy Bottom Pond Turner 59 8 51 0.3 15 0.74 mod-sens m 1.00 0.74 0.048 4Sandy Pond Embden 501 100 401 0.5 201 6.39 mod-sens m 1.00 6.39 0.032 50Saponac Pond Lee 180 10 170 0.2 34 1.3 mod-sens m 1.00 1.30 0.038 9Saponac Pond Grand Falls Tw 13867 1500 12367 0.12 1484 98.73 mod-sens m 1.00 98.73 0.067 371Saponac Pond Summit Twp 91 2 89 0.12 11 0.63 mod-sens m 1.00 0.63 0.059 3Saturday Pond Otisfield 835 70 765 0.25 191 9.17 mod-sens h 0.75 6.88 0.036 48Saulter Pond Dedham 232 30 202 0.25 51 1.63 mod-sens m 1.00 1.63 0.032 13Savade Pond Windsor 820 250 570 0.25 143 7.8 mod-sens h 0.75 5.85 0.041 36Sawyer Pond Greenville 617 50 567 0.2 113 5.68 mod-sens h 0.75 4.26 0.038 28Schoodic Lake Brownville 5305 1000 4305 0.25 1076 175.6 outstanding h 0.50 87.79 0.082 269Schoodic Lake Lakeview Plt. 6538 500 6038 0.2 1208 216.5 outstanding h 0.50 108.24 0.090 302Scopan Lake T10 R3 WELS 2653 170 2483 0.15 372 30.91 mod-sens h 0.75 23.18 0.062 93Scopan Lake T9 R3 WELS 140 2 138 0.1 14 1.65 mod-sens h 0.75 1.24 0.090 3Seal Cove Pond Tremont 1766 1000 766 0.25 192 20.83 mod-sens h 0.75 15.62 0.082 48Sebago Lake Windham 1356 271 1084 0.35 380 40.5 outst h 0.50 20.25 0.053 95Sebago Lake Raymond 4410 1323 3087 0.35 1080 131.6 outstanding h 0.50 65.81 0.061 270Sebago Lake Waterford 13232 800 12432 0.3 3730 394.8 outstanding h 0.50 197.41 0.053 932Sebago Lake Standish 10743 3200 7543 0.35 2640 320.6 outstanding h 0.50 160.29 0.061 660Sebago Lake Norway 9725 500 9225 0.25 2306 290.2 outstanding h 0.50 145.10 0.063 577Sebago Lake Harrison 7010 700 6310 0.3 1893 209.2 outstanding h 0.50 104.62 0.055 473Sebago Lake Naples 10968 1000 9968 0.4 3987 327.3 outstanding h 0.50 163.67 0.041 997Sebago Lake Casco 8707 870 7837 0.35 2743 259.8 outstanding h 0.50 129.92 0.047 686Sebago Lake Sebago 12214 2400 9814 0.3 2944 364.5 outstanding h 0.50 182.23 0.062 736Sebago Lake Otisfield 11986 1000 10986 0.3 3296 357.7 outstanding h 0.50 178.85 0.054 824Sebasticook Lake Newport 14027 1400 12627 0.25 3157 157.7 poor rest m 0.50 78.83 0.025 789Sebasticook Lake Corinna 5381 800 4581 0.2 916 60.48 poor-rest m 0.50 30.24 0.033 229Sebec Lake Dover-Foxcrof 9105 700 8405 0.25 2101 126.2 good h 1.00 126.21 0.060 525Sebec Lake Willimantic 23432 2000 21432 0.2 4286 324.8 good h 1.00 324.77 0.076 1072

Appendix C Per Acre Phosphorus Allocationsfor Selected Maine Lakes
Updated 11/1/17
Lake Name
Town in which
development is located
Direct Watershed
Area in Town (acres) DDA
Area not available for development
(acres) ANAD
Area available for development
(acres) AAD
GF
Expected developed
area (acres)
D
(lbP/y) F
Water Quality
Category WQC
LOP C FC
Per acre phosphorus allocation (lb/acre/yr)
P
Small Watershed Threshold
(acres) SWT
Sebec Lake Bowerbank 11356 1200 10156 0.2 2031 157.4 good h 1.00 157.41 0.077 508Sebec Lake Greenville 10845 1100 9745 0.25 2436 150.3 good h 1.00 150.33 0.062 609Second Davis Pond Willimantic 266 15 251 0.2 50 2.09 mod-sens m 1.00 2.09 0.042 13Second Lake Marion Twp. 12226 1000 11226 0.15 1684 124.1 mod-sens h 0.75 93.05 0.055 421Second Lake Whiting 311 20 291 0.15 44 3.17 mod-sens h 0.75 2.38 0.054 11Second Pond Blue Hill 775 70 705 0.25 176 9.32 mod-sens h 0.75 6.99 0.040 44Second Pond Dedham 489 45 444 0.25 111 5.4 mod-sens h 0.75 4.05 0.036 28Second Roach Pond Shawtown Tw 2090 260 1830 0.15 275 30.6 mod-sens h 0.75 22.95 0.084 69Second Roach Pond T1 R12 WELS 3133 350 2783 0.15 417 45.84 mod-sens h 0.75 34.38 0.082 104Secret Pond Greenville 118 10 108 0.2 22 1.19 mod-sens h 0.75 0.89 0.041 5Sennebec Pond Searsmont 14161 1500 12661 0.2 2532 126.6 mod-sens h 0.75 94.96 0.038 633Sennebec Pond Lincolnville 303 30 273 0.2 55 2.71 mod-sens h 0.75 2.03 0.037 14Sennebec Pond Appleton 11336 1500 9836 0.25 2459 101.3 mod-sens h 0.75 76.01 0.031 615Sennebec Pond Union 1702 170 1532 0.25 383 15.21 mod-sens h 0.75 11.41 0.030 96Sennebec Pond Hope 1793 30 1763 0.2 353 16.03 mod-sens h 0.75 12.02 0.034 88Seven Tree Pond Union 2748 300 2448 0.3 734 35.52 mod-sens h 0.75 26.64 0.036 184Seven Tree Pond Hope 168 5 163 0.2 33 2.13 mod-sens h 0.75 1.60 0.049 8Shagg Pond Sumner 74 15 59 0.15 9 0.68 mod-sens h 0.75 0.51 0.058 2Shagg Pond Woodstock 743 50 693 0.2 139 6.83 mod-sens h 0.75 5.12 0.037 35Shaker Bog Poland 378 40 338 0.25 85 4.6 mod-sens m 1.00 4.60 0.054 21Shaker Pond Waterboro 9421 1200 8221 0.3 2466 66.12 mod-sens m 1.00 66.12 0.027 617Shaker Pond Lyman 756 50 706 0.2 141 5.29 mod-sens m 1.00 5.29 0.037 35Shaker Pond Alfred 1811 400 1411 0.25 353 12.7 mod-sens m 1.00 12.70 0.036 88Shaking Bog Denmark 106 11 95 0.25 24 0.79 mod-sens m 1.00 0.79 0.033 6Shattuck Lake Calais 42 2 40 0.25 10 0.66 mod-sens h 0.75 0.50 0.050 3Shaw Lake Carroll Plt 2471 200 2271 0.15 341 18.87 mod-sens m 1.00 18.87 0.055 85Shaw Lake Pukakon Twp 197 30 167 0.15 25 1.49 mod-sens m 1.00 1.49 0.059 6Shaw Lake T6 R1 NBPP 360 50 310 0.15 47 2.75 mod-sens m 1.00 2.75 0.059 12Shed Pond Readfield 316 30 286 0.25 72 2.2 mod-sens m 1.00 2.20 0.031 18Sheepscot Lake Washington 929 30 899 0.2 180 10.34 good h 1.00 10.34 0.058 45Sherman Lake Edgecomb 2364 236 2128 0.25 532 16.31 mod-sens m 1.00 16.31 0.031 133Sherman Lake Newcastle 1942 194 1748 0.25 437 13.4 mod-sens m 1.00 13.40 0.031 109
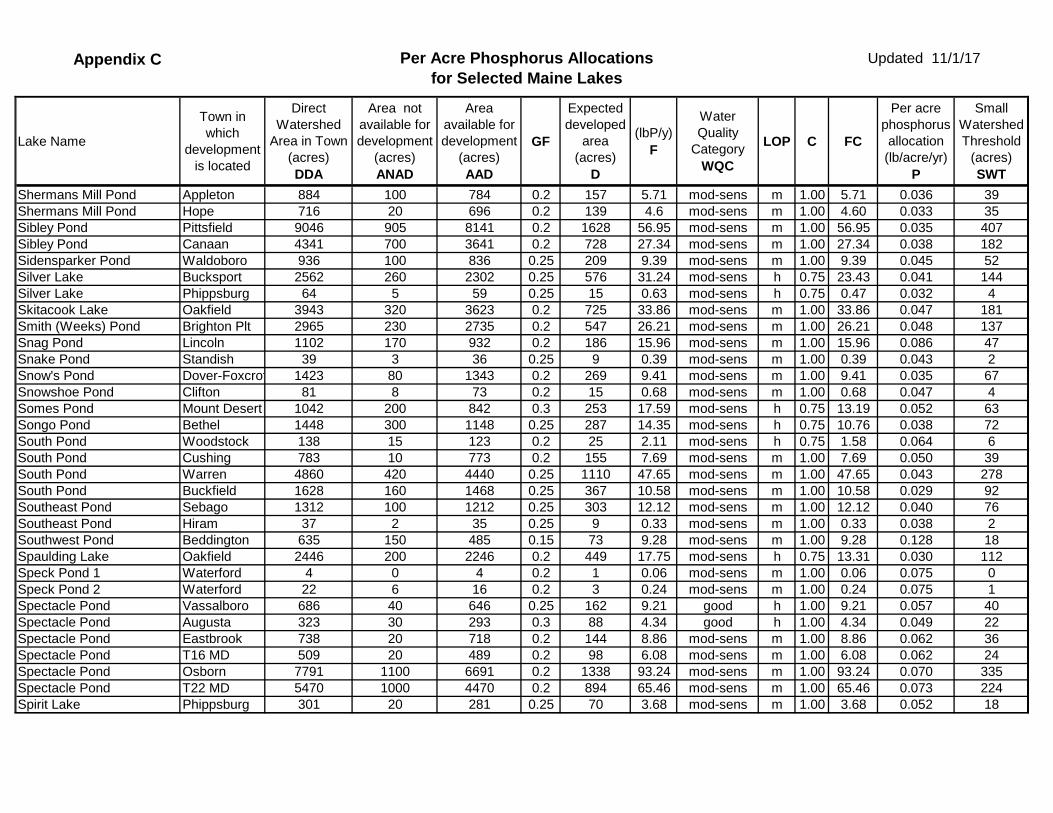
Appendix C Per Acre Phosphorus Allocationsfor Selected Maine Lakes
Updated 11/1/17
Lake Name
Town in which
development is located
Direct Watershed
Area in Town (acres) DDA
Area not available for development
(acres) ANAD
Area available for development
(acres) AAD
GF
Expected developed
area (acres)
D
(lbP/y) F
Water Quality
Category WQC
LOP C FC
Per acre phosphorus allocation (lb/acre/yr)
P
Small Watershed Threshold
(acres) SWT
Shermans Mill Pond Appleton 884 100 784 0.2 157 5.71 mod-sens m 1.00 5.71 0.036 39Shermans Mill Pond Hope 716 20 696 0.2 139 4.6 mod-sens m 1.00 4.60 0.033 35Sibley Pond Pittsfield 9046 905 8141 0.2 1628 56.95 mod-sens m 1.00 56.95 0.035 407Sibley Pond Canaan 4341 700 3641 0.2 728 27.34 mod-sens m 1.00 27.34 0.038 182Sidensparker Pond Waldoboro 936 100 836 0.25 209 9.39 mod-sens m 1.00 9.39 0.045 52Silver Lake Bucksport 2562 260 2302 0.25 576 31.24 mod-sens h 0.75 23.43 0.041 144Silver Lake Phippsburg 64 5 59 0.25 15 0.63 mod-sens h 0.75 0.47 0.032 4Skitacook Lake Oakfield 3943 320 3623 0.2 725 33.86 mod-sens m 1.00 33.86 0.047 181Smith (Weeks) Pond Brighton Plt 2965 230 2735 0.2 547 26.21 mod-sens m 1.00 26.21 0.048 137Snag Pond Lincoln 1102 170 932 0.2 186 15.96 mod-sens m 1.00 15.96 0.086 47Snake Pond Standish 39 3 36 0.25 9 0.39 mod-sens m 1.00 0.39 0.043 2Snow's Pond Dover-Foxcrof 1423 80 1343 0.2 269 9.41 mod-sens m 1.00 9.41 0.035 67Snowshoe Pond Clifton 81 8 73 0.2 15 0.68 mod-sens m 1.00 0.68 0.047 4Somes Pond Mount Desert 1042 200 842 0.3 253 17.59 mod-sens h 0.75 13.19 0.052 63Songo Pond Bethel 1448 300 1148 0.25 287 14.35 mod-sens h 0.75 10.76 0.038 72South Pond Woodstock 138 15 123 0.2 25 2.11 mod-sens h 0.75 1.58 0.064 6South Pond Cushing 783 10 773 0.2 155 7.69 mod-sens m 1.00 7.69 0.050 39South Pond Warren 4860 420 4440 0.25 1110 47.65 mod-sens m 1.00 47.65 0.043 278South Pond Buckfield 1628 160 1468 0.25 367 10.58 mod-sens m 1.00 10.58 0.029 92Southeast Pond Sebago 1312 100 1212 0.25 303 12.12 mod-sens m 1.00 12.12 0.040 76Southeast Pond Hiram 37 2 35 0.25 9 0.33 mod-sens m 1.00 0.33 0.038 2Southwest Pond Beddington 635 150 485 0.15 73 9.28 mod-sens m 1.00 9.28 0.128 18Spaulding Lake Oakfield 2446 200 2246 0.2 449 17.75 mod-sens h 0.75 13.31 0.030 112Speck Pond 1 Waterford 4 0 4 0.2 1 0.06 mod-sens m 1.00 0.06 0.075 0Speck Pond 2 Waterford 22 6 16 0.2 3 0.24 mod-sens m 1.00 0.24 0.075 1Spectacle Pond Vassalboro 686 40 646 0.25 162 9.21 good h 1.00 9.21 0.057 40Spectacle Pond Augusta 323 30 293 0.3 88 4.34 good h 1.00 4.34 0.049 22Spectacle Pond Eastbrook 738 20 718 0.2 144 8.86 mod-sens m 1.00 8.86 0.062 36Spectacle Pond T16 MD 509 20 489 0.2 98 6.08 mod-sens m 1.00 6.08 0.062 24Spectacle Pond Osborn 7791 1100 6691 0.2 1338 93.24 mod-sens m 1.00 93.24 0.070 335Spectacle Pond T22 MD 5470 1000 4470 0.2 894 65.46 mod-sens m 1.00 65.46 0.073 224Spirit Lake Phippsburg 301 20 281 0.25 70 3.68 mod-sens m 1.00 3.68 0.052 18
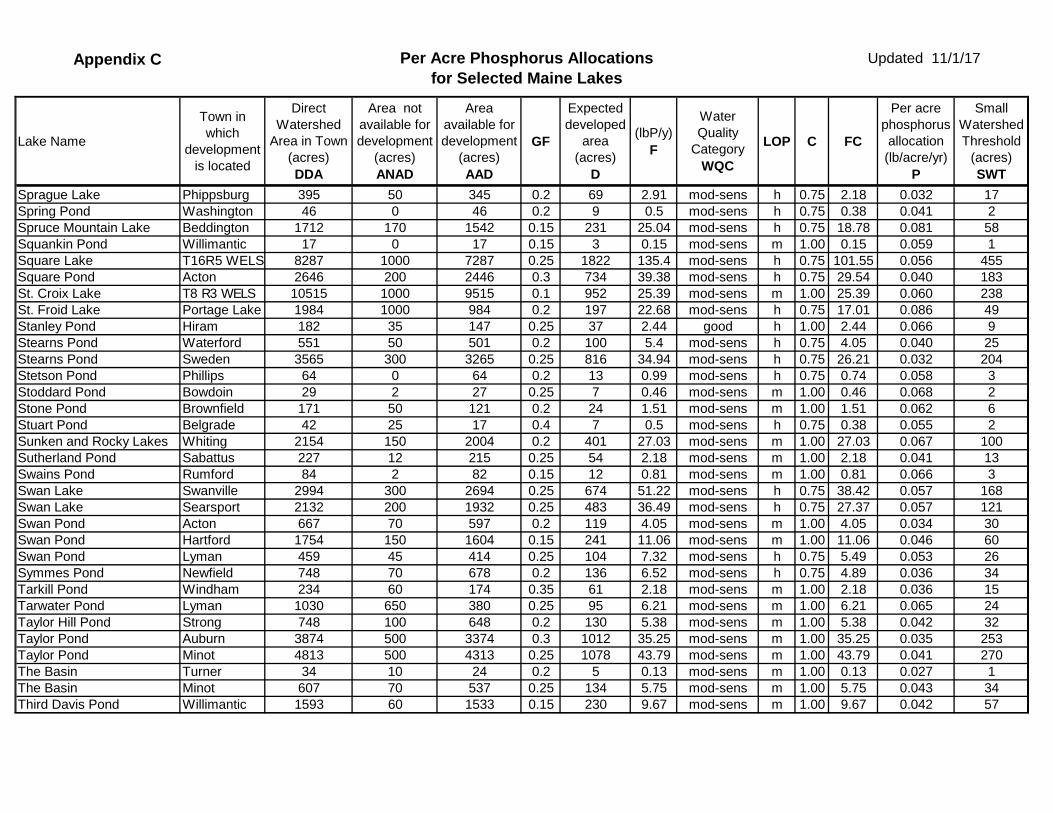
Appendix C Per Acre Phosphorus Allocationsfor Selected Maine Lakes
Updated 11/1/17
Lake Name
Town in which
development is located
Direct Watershed
Area in Town (acres) DDA
Area not available for development
(acres) ANAD
Area available for development
(acres) AAD
GF
Expected developed
area (acres)
D
(lbP/y) F
Water Quality
Category WQC
LOP C FC
Per acre phosphorus allocation (lb/acre/yr)
P
Small Watershed Threshold
(acres) SWT
Sprague Lake Phippsburg 395 50 345 0.2 69 2.91 mod-sens h 0.75 2.18 0.032 17Spring Pond Washington 46 0 46 0.2 9 0.5 mod-sens h 0.75 0.38 0.041 2Spruce Mountain Lake Beddington 1712 170 1542 0.15 231 25.04 mod-sens h 0.75 18.78 0.081 58Squankin Pond Willimantic 17 0 17 0.15 3 0.15 mod-sens m 1.00 0.15 0.059 1Square Lake T16R5 WELS 8287 1000 7287 0.25 1822 135.4 mod-sens h 0.75 101.55 0.056 455Square Pond Acton 2646 200 2446 0.3 734 39.38 mod-sens h 0.75 29.54 0.040 183St. Croix Lake T8 R3 WELS 10515 1000 9515 0.1 952 25.39 mod-sens m 1.00 25.39 0.060 238St. Froid Lake Portage Lake 1984 1000 984 0.2 197 22.68 mod-sens h 0.75 17.01 0.086 49Stanley Pond Hiram 182 35 147 0.25 37 2.44 good h 1.00 2.44 0.066 9Stearns Pond Waterford 551 50 501 0.2 100 5.4 mod-sens h 0.75 4.05 0.040 25Stearns Pond Sweden 3565 300 3265 0.25 816 34.94 mod-sens h 0.75 26.21 0.032 204Stetson Pond Phillips 64 0 64 0.2 13 0.99 mod-sens h 0.75 0.74 0.058 3Stoddard Pond Bowdoin 29 2 27 0.25 7 0.46 mod-sens m 1.00 0.46 0.068 2Stone Pond Brownfield 171 50 121 0.2 24 1.51 mod-sens m 1.00 1.51 0.062 6Stuart Pond Belgrade 42 25 17 0.4 7 0.5 mod-sens h 0.75 0.38 0.055 2Sunken and Rocky Lakes Whiting 2154 150 2004 0.2 401 27.03 mod-sens m 1.00 27.03 0.067 100Sutherland Pond Sabattus 227 12 215 0.25 54 2.18 mod-sens m 1.00 2.18 0.041 13Swains Pond Rumford 84 2 82 0.15 12 0.81 mod-sens m 1.00 0.81 0.066 3Swan Lake Swanville 2994 300 2694 0.25 674 51.22 mod-sens h 0.75 38.42 0.057 168Swan Lake Searsport 2132 200 1932 0.25 483 36.49 mod-sens h 0.75 27.37 0.057 121Swan Pond Acton 667 70 597 0.2 119 4.05 mod-sens m 1.00 4.05 0.034 30Swan Pond Hartford 1754 150 1604 0.15 241 11.06 mod-sens m 1.00 11.06 0.046 60Swan Pond Lyman 459 45 414 0.25 104 7.32 mod-sens h 0.75 5.49 0.053 26Symmes Pond Newfield 748 70 678 0.2 136 6.52 mod-sens h 0.75 4.89 0.036 34Tarkill Pond Windham 234 60 174 0.35 61 2.18 mod-sens m 1.00 2.18 0.036 15Tarwater Pond Lyman 1030 650 380 0.25 95 6.21 mod-sens m 1.00 6.21 0.065 24Taylor Hill Pond Strong 748 100 648 0.2 130 5.38 mod-sens m 1.00 5.38 0.042 32Taylor Pond Auburn 3874 500 3374 0.3 1012 35.25 mod-sens m 1.00 35.25 0.035 253Taylor Pond Minot 4813 500 4313 0.25 1078 43.79 mod-sens m 1.00 43.79 0.041 270The Basin Turner 34 10 24 0.2 5 0.13 mod-sens m 1.00 0.13 0.027 1The Basin Minot 607 70 537 0.25 134 5.75 mod-sens m 1.00 5.75 0.043 34Third Davis Pond Willimantic 1593 60 1533 0.15 230 9.67 mod-sens m 1.00 9.67 0.042 57
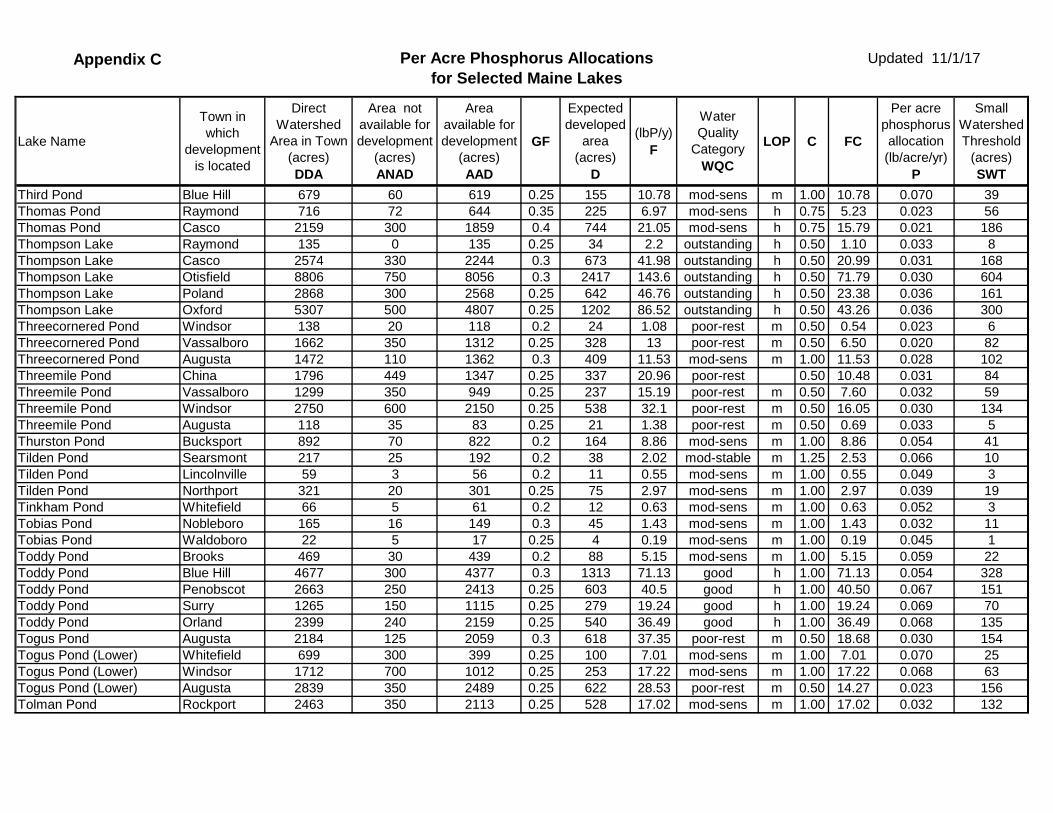
Appendix C Per Acre Phosphorus Allocationsfor Selected Maine Lakes
Updated 11/1/17
Lake Name
Town in which
development is located
Direct Watershed
Area in Town (acres) DDA
Area not available for development
(acres) ANAD
Area available for development
(acres) AAD
GF
Expected developed
area (acres)
D
(lbP/y) F
Water Quality
Category WQC
LOP C FC
Per acre phosphorus allocation (lb/acre/yr)
P
Small Watershed Threshold
(acres) SWT
Third Pond Blue Hill 679 60 619 0.25 155 10.78 mod-sens m 1.00 10.78 0.070 39Thomas Pond Raymond 716 72 644 0.35 225 6.97 mod-sens h 0.75 5.23 0.023 56Thomas Pond Casco 2159 300 1859 0.4 744 21.05 mod-sens h 0.75 15.79 0.021 186Thompson Lake Raymond 135 0 135 0.25 34 2.2 outstanding h 0.50 1.10 0.033 8Thompson Lake Casco 2574 330 2244 0.3 673 41.98 outstanding h 0.50 20.99 0.031 168Thompson Lake Otisfield 8806 750 8056 0.3 2417 143.6 outstanding h 0.50 71.79 0.030 604Thompson Lake Poland 2868 300 2568 0.25 642 46.76 outstanding h 0.50 23.38 0.036 161Thompson Lake Oxford 5307 500 4807 0.25 1202 86.52 outstanding h 0.50 43.26 0.036 300Threecornered Pond Windsor 138 20 118 0.2 24 1.08 poor-rest m 0.50 0.54 0.023 6Threecornered Pond Vassalboro 1662 350 1312 0.25 328 13 poor-rest m 0.50 6.50 0.020 82Threecornered Pond Augusta 1472 110 1362 0.3 409 11.53 mod-sens m 1.00 11.53 0.028 102Threemile Pond China 1796 449 1347 0.25 337 20.96 poor-rest 0.50 10.48 0.031 84Threemile Pond Vassalboro 1299 350 949 0.25 237 15.19 poor-rest m 0.50 7.60 0.032 59Threemile Pond Windsor 2750 600 2150 0.25 538 32.1 poor-rest m 0.50 16.05 0.030 134Threemile Pond Augusta 118 35 83 0.25 21 1.38 poor-rest m 0.50 0.69 0.033 5Thurston Pond Bucksport 892 70 822 0.2 164 8.86 mod-sens m 1.00 8.86 0.054 41Tilden Pond Searsmont 217 25 192 0.2 38 2.02 mod-stable m 1.25 2.53 0.066 10Tilden Pond Lincolnville 59 3 56 0.2 11 0.55 mod-sens m 1.00 0.55 0.049 3Tilden Pond Northport 321 20 301 0.25 75 2.97 mod-sens m 1.00 2.97 0.039 19Tinkham Pond Whitefield 66 5 61 0.2 12 0.63 mod-sens m 1.00 0.63 0.052 3Tobias Pond Nobleboro 165 16 149 0.3 45 1.43 mod-sens m 1.00 1.43 0.032 11Tobias Pond Waldoboro 22 5 17 0.25 4 0.19 mod-sens m 1.00 0.19 0.045 1Toddy Pond Brooks 469 30 439 0.2 88 5.15 mod-sens m 1.00 5.15 0.059 22Toddy Pond Blue Hill 4677 300 4377 0.3 1313 71.13 good h 1.00 71.13 0.054 328Toddy Pond Penobscot 2663 250 2413 0.25 603 40.5 good h 1.00 40.50 0.067 151Toddy Pond Surry 1265 150 1115 0.25 279 19.24 good h 1.00 19.24 0.069 70Toddy Pond Orland 2399 240 2159 0.25 540 36.49 good h 1.00 36.49 0.068 135Togus Pond Augusta 2184 125 2059 0.3 618 37.35 poor-rest m 0.50 18.68 0.030 154Togus Pond (Lower) Whitefield 699 300 399 0.25 100 7.01 mod-sens m 1.00 7.01 0.070 25Togus Pond (Lower) Windsor 1712 700 1012 0.25 253 17.22 mod-sens m 1.00 17.22 0.068 63Togus Pond (Lower) Augusta 2839 350 2489 0.25 622 28.53 poor-rest m 0.50 14.27 0.023 156Tolman Pond Rockport 2463 350 2113 0.25 528 17.02 mod-sens m 1.00 17.02 0.032 132
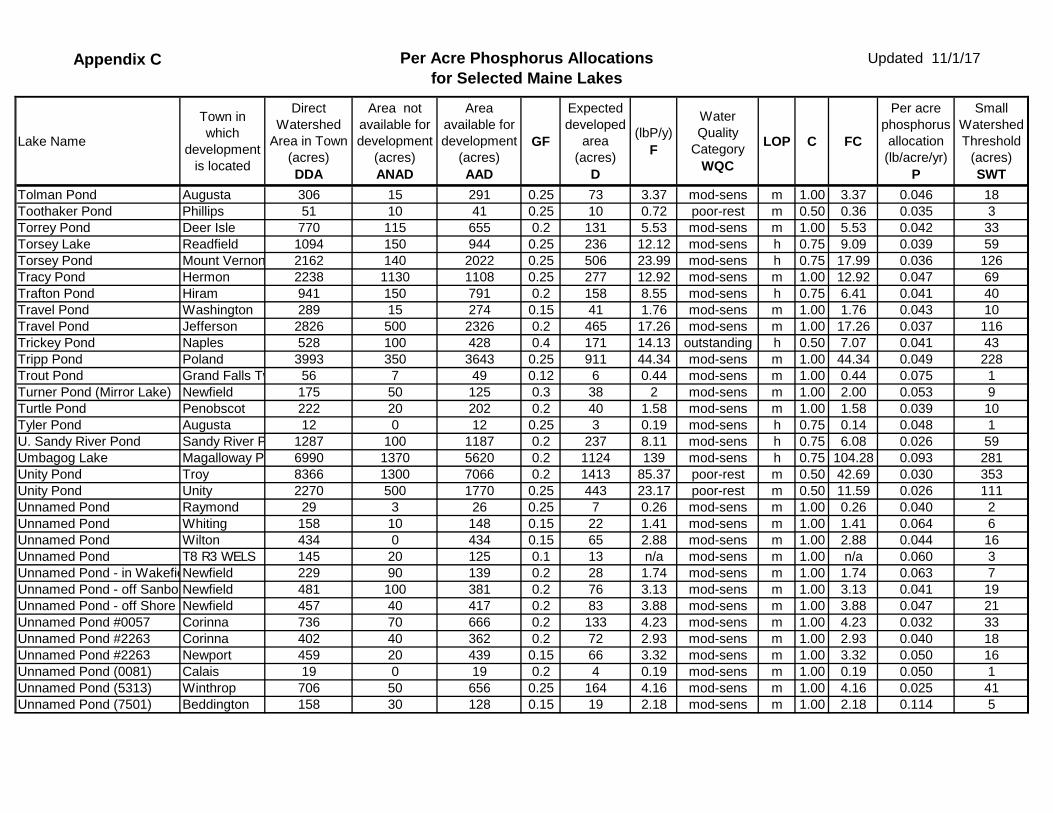
Appendix C Per Acre Phosphorus Allocationsfor Selected Maine Lakes
Updated 11/1/17
Lake Name
Town in which
development is located
Direct Watershed
Area in Town (acres) DDA
Area not available for development
(acres) ANAD
Area available for development
(acres) AAD
GF
Expected developed
area (acres)
D
(lbP/y) F
Water Quality
Category WQC
LOP C FC
Per acre phosphorus allocation (lb/acre/yr)
P
Small Watershed Threshold
(acres) SWT
Tolman Pond Augusta 306 15 291 0.25 73 3.37 mod-sens m 1.00 3.37 0.046 18Toothaker Pond Phillips 51 10 41 0.25 10 0.72 poor-rest m 0.50 0.36 0.035 3Torrey Pond Deer Isle 770 115 655 0.2 131 5.53 mod-sens m 1.00 5.53 0.042 33Torsey Lake Readfield 1094 150 944 0.25 236 12.12 mod-sens h 0.75 9.09 0.039 59Torsey Pond Mount Vernon 2162 140 2022 0.25 506 23.99 mod-sens h 0.75 17.99 0.036 126Tracy Pond Hermon 2238 1130 1108 0.25 277 12.92 mod-sens m 1.00 12.92 0.047 69Trafton Pond Hiram 941 150 791 0.2 158 8.55 mod-sens h 0.75 6.41 0.041 40Travel Pond Washington 289 15 274 0.15 41 1.76 mod-sens m 1.00 1.76 0.043 10Travel Pond Jefferson 2826 500 2326 0.2 465 17.26 mod-sens m 1.00 17.26 0.037 116Trickey Pond Naples 528 100 428 0.4 171 14.13 outstanding h 0.50 7.07 0.041 43Tripp Pond Poland 3993 350 3643 0.25 911 44.34 mod-sens m 1.00 44.34 0.049 228Trout Pond Grand Falls Tw 56 7 49 0.12 6 0.44 mod-sens m 1.00 0.44 0.075 1Turner Pond (Mirror Lake) Newfield 175 50 125 0.3 38 2 mod-sens m 1.00 2.00 0.053 9Turtle Pond Penobscot 222 20 202 0.2 40 1.58 mod-sens m 1.00 1.58 0.039 10Tyler Pond Augusta 12 0 12 0.25 3 0.19 mod-sens h 0.75 0.14 0.048 1U. Sandy River Pond Sandy River P 1287 100 1187 0.2 237 8.11 mod-sens h 0.75 6.08 0.026 59Umbagog Lake Magalloway P 6990 1370 5620 0.2 1124 139 mod-sens h 0.75 104.28 0.093 281Unity Pond Troy 8366 1300 7066 0.2 1413 85.37 poor-rest m 0.50 42.69 0.030 353Unity Pond Unity 2270 500 1770 0.25 443 23.17 poor-rest m 0.50 11.59 0.026 111Unnamed Pond Raymond 29 3 26 0.25 7 0.26 mod-sens m 1.00 0.26 0.040 2Unnamed Pond Whiting 158 10 148 0.15 22 1.41 mod-sens m 1.00 1.41 0.064 6Unnamed Pond Wilton 434 0 434 0.15 65 2.88 mod-sens m 1.00 2.88 0.044 16Unnamed Pond T8 R3 WELS 145 20 125 0.1 13 n/a mod-sens m 1.00 n/a 0.060 3Unnamed Pond - in WakefieNewfield 229 90 139 0.2 28 1.74 mod-sens m 1.00 1.74 0.063 7Unnamed Pond - off Sanbo Newfield 481 100 381 0.2 76 3.13 mod-sens m 1.00 3.13 0.041 19Unnamed Pond - off Shore Newfield 457 40 417 0.2 83 3.88 mod-sens m 1.00 3.88 0.047 21Unnamed Pond #0057 Corinna 736 70 666 0.2 133 4.23 mod-sens m 1.00 4.23 0.032 33Unnamed Pond #2263 Corinna 402 40 362 0.2 72 2.93 mod-sens m 1.00 2.93 0.040 18Unnamed Pond #2263 Newport 459 20 439 0.15 66 3.32 mod-sens m 1.00 3.32 0.050 16Unnamed Pond (0081) Calais 19 0 19 0.2 4 0.19 mod-sens m 1.00 0.19 0.050 1Unnamed Pond (5313) Winthrop 706 50 656 0.25 164 4.16 mod-sens m 1.00 4.16 0.025 41Unnamed Pond (7501) Beddington 158 30 128 0.15 19 2.18 mod-sens m 1.00 2.18 0.114 5

Appendix C Per Acre Phosphorus Allocationsfor Selected Maine Lakes
Updated 11/1/17
Lake Name
Town in which
development is located
Direct Watershed
Area in Town (acres) DDA
Area not available for development
(acres) ANAD
Area available for development
(acres) AAD
GF
Expected developed
area (acres)
D
(lbP/y) F
Water Quality
Category WQC
LOP C FC
Per acre phosphorus allocation (lb/acre/yr)
P
Small Watershed Threshold
(acres) SWT
Unnamed Pond (8127) Mount Vernon 64 0 64 0.25 16 0.59 mod-sens m 1.00 0.59 0.037 4Unnamed Pond (8129) Mount Vernon 259 10 249 0.2 50 2.11 mod-sens m 1.00 2.11 0.042 12Unnamed Pond (8137) Monmouth 474 45 429 0.2 86 3.46 mod-sens m 1.00 3.46 0.040 21Unnamed Pond (8223) Augusta 37 4 33 0.2 7 0.35 mod-sens m 1.00 0.35 0.053 2Unnamed Pond (8533) Dedham 160 5 155 0.2 31 1.05 mod-sens m 1.00 1.05 0.034 8Unnamed Pond (8535) Dedham 358 10 348 0.2 70 2 mod-sens m 1.00 2.00 0.029 17Unnamed Pond (8797) Jay 170 10 160 0.15 24 1.12 mod-sens m 1.00 1.12 0.047 6Unnamed Pond (8801) Jay 538 40 498 0.15 75 3.26 mod-sens m 1.00 3.26 0.044 19Unnamed Pond (Hibberts GWashington 51 30 21 0.2 4 0.33 mod-sens m 1.00 0.33 0.079 1Unnamed Pond (in DresdenPittston 471 25 446 0.2 89 3.21 mod-sens m 1.00 3.21 0.036 22Unnamed Pond (in TwelvemCanaan 370 37 333 0.2 67 1.98 mod-sens m 1.00 1.98 0.030 17Unnamed Pond (Spencer B Limerick 691 70 621 0.2 124 3.79 mod-sens m 1.00 3.79 0.031 31Unnamed Pond 6735 Hartford 434 40 394 0.15 59 2.86 mod-sens m 1.00 2.86 0.048 15Unnamed Pond 8895 Casco 422 100 322 0.3 97 3.72 mod-sens m 1.00 3.72 0.039 24Unnamed Pond 8897 Casco 143 15 128 0.3 38 1.38 mod-sens m 1.00 1.38 0.036 10Unnamed Pond 9520 Clifton 343 40 303 0.15 45 2.22 mod-sens m 1.00 2.22 0.049 11Unnamed Pond 9558 Clifton 108 8 100 0.15 15 0.97 mod-sens m 1.00 0.97 0.065 4Unnamed Pond, Beaver BroDenmark 1761 300 1461 0.25 365 13.23 mod-sens m 1.00 13.23 0.036 91Unnamed Pond, drains to QSearsmont 128 12 116 0.2 23 1.12 mod-sens m 1.00 1.12 0.048 6Unnamed Pond,drains to Si Waldoboro 496 40 456 0.2 91 3.96 mod-sens m 1.00 3.96 0.043 23Upper Cold Stream Pond (eLincoln 558 90 468 0.25 117 7.78 good h 1.00 7.78 0.066 29Upper Cold Stream Pond (wLincoln 736 160 576 0.25 144 14.2 outstanding h 0.50 7.10 0.049 36Upper Hadlock Pond Mount Desert 808 808 0 0 0 7.14 mod-sens h 0.75 5.36 Park 0Upper Mud Pond Windham 61 5 56 0.25 14 0.39 mod-sens m 1.00 0.39 0.028 4Upper Narrows Pond Winthrop 2545 220 2325 0.25 581 29.39 mod-sens h 0.75 22.04 0.038 145Upper Patten Pond Ellsworth 405 50 355 0.25 89 3.9 mod-sens h 1.00 3.90 0.044 22Upper Patten Pond Surry 1233 125 1108 0.2 222 11.88 mod-sens h 0.75 8.91 0.040 55Upper Patten Pond Orland 2260 200 2060 0.3 618 21.8 mod-sens h 0.75 16.35 0.026 155Upper Pond Bristol 101 10 91 0.25 23 0.99 mod-sens h 0.75 0.74 0.032 6Upper Pond Lincoln 1924 130 1794 0.25 449 19.55 mod-sens m 1.00 19.55 0.044 112Upper Pond Burlington 2060 230 1830 0.2 366 20.92 mod-sens m 1.00 20.92 0.057 92Upper Range Pond Raymond 375 25 350 0.25 88 4.25 mod-sens h 0.75 3.19 0.036 22
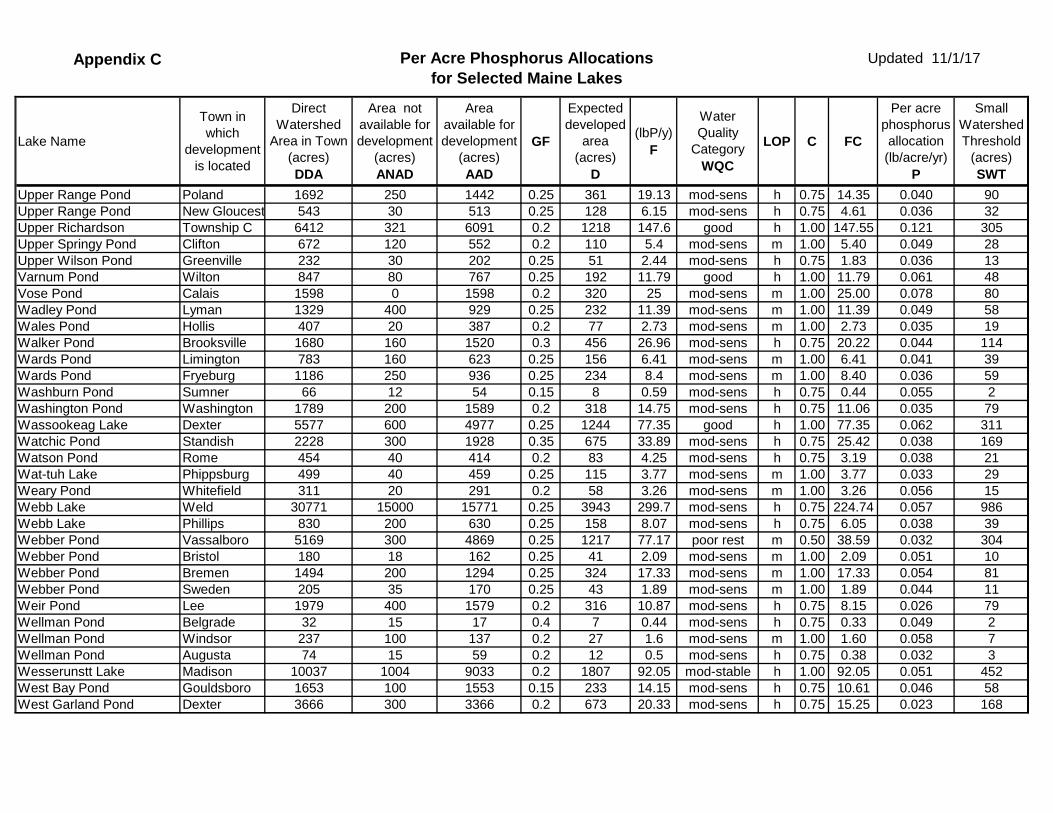
Appendix C Per Acre Phosphorus Allocationsfor Selected Maine Lakes
Updated 11/1/17
Lake Name
Town in which
development is located
Direct Watershed
Area in Town (acres) DDA
Area not available for development
(acres) ANAD
Area available for development
(acres) AAD
GF
Expected developed
area (acres)
D
(lbP/y) F
Water Quality
Category WQC
LOP C FC
Per acre phosphorus allocation (lb/acre/yr)
P
Small Watershed Threshold
(acres) SWT
Upper Range Pond Poland 1692 250 1442 0.25 361 19.13 mod-sens h 0.75 14.35 0.040 90Upper Range Pond New Gloucest 543 30 513 0.25 128 6.15 mod-sens h 0.75 4.61 0.036 32Upper Richardson Township C 6412 321 6091 0.2 1218 147.6 good h 1.00 147.55 0.121 305Upper Springy Pond Clifton 672 120 552 0.2 110 5.4 mod-sens m 1.00 5.40 0.049 28Upper Wilson Pond Greenville 232 30 202 0.25 51 2.44 mod-sens h 0.75 1.83 0.036 13Varnum Pond Wilton 847 80 767 0.25 192 11.79 good h 1.00 11.79 0.061 48Vose Pond Calais 1598 0 1598 0.2 320 25 mod-sens m 1.00 25.00 0.078 80Wadley Pond Lyman 1329 400 929 0.25 232 11.39 mod-sens m 1.00 11.39 0.049 58Wales Pond Hollis 407 20 387 0.2 77 2.73 mod-sens m 1.00 2.73 0.035 19Walker Pond Brooksville 1680 160 1520 0.3 456 26.96 mod-sens h 0.75 20.22 0.044 114Wards Pond Limington 783 160 623 0.25 156 6.41 mod-sens m 1.00 6.41 0.041 39Wards Pond Fryeburg 1186 250 936 0.25 234 8.4 mod-sens m 1.00 8.40 0.036 59Washburn Pond Sumner 66 12 54 0.15 8 0.59 mod-sens h 0.75 0.44 0.055 2Washington Pond Washington 1789 200 1589 0.2 318 14.75 mod-sens h 0.75 11.06 0.035 79Wassookeag Lake Dexter 5577 600 4977 0.25 1244 77.35 good h 1.00 77.35 0.062 311Watchic Pond Standish 2228 300 1928 0.35 675 33.89 mod-sens h 0.75 25.42 0.038 169Watson Pond Rome 454 40 414 0.2 83 4.25 mod-sens h 0.75 3.19 0.038 21Wat-tuh Lake Phippsburg 499 40 459 0.25 115 3.77 mod-sens m 1.00 3.77 0.033 29Weary Pond Whitefield 311 20 291 0.2 58 3.26 mod-sens m 1.00 3.26 0.056 15Webb Lake Weld 30771 15000 15771 0.25 3943 299.7 mod-sens h 0.75 224.74 0.057 986Webb Lake Phillips 830 200 630 0.25 158 8.07 mod-sens h 0.75 6.05 0.038 39Webber Pond Vassalboro 5169 300 4869 0.25 1217 77.17 poor rest m 0.50 38.59 0.032 304Webber Pond Bristol 180 18 162 0.25 41 2.09 mod-sens m 1.00 2.09 0.051 10Webber Pond Bremen 1494 200 1294 0.25 324 17.33 mod-sens m 1.00 17.33 0.054 81Webber Pond Sweden 205 35 170 0.25 43 1.89 mod-sens m 1.00 1.89 0.044 11Weir Pond Lee 1979 400 1579 0.2 316 10.87 mod-sens h 0.75 8.15 0.026 79Wellman Pond Belgrade 32 15 17 0.4 7 0.44 mod-sens h 0.75 0.33 0.049 2Wellman Pond Windsor 237 100 137 0.2 27 1.6 mod-sens m 1.00 1.60 0.058 7Wellman Pond Augusta 74 15 59 0.2 12 0.5 mod-sens h 0.75 0.38 0.032 3Wesserunstt Lake Madison 10037 1004 9033 0.2 1807 92.05 mod-stable h 1.00 92.05 0.051 452West Bay Pond Gouldsboro 1653 100 1553 0.15 233 14.15 mod-sens h 0.75 10.61 0.046 58West Garland Pond Dexter 3666 300 3366 0.2 673 20.33 mod-sens h 0.75 15.25 0.023 168

Appendix C Per Acre Phosphorus Allocationsfor Selected Maine Lakes
Updated 11/1/17
Lake Name
Town in which
development is located
Direct Watershed
Area in Town (acres) DDA
Area not available for development
(acres) ANAD
Area available for development
(acres) AAD
GF
Expected developed
area (acres)
D
(lbP/y) F
Water Quality
Category WQC
LOP C FC
Per acre phosphorus allocation (lb/acre/yr)
P
Small Watershed Threshold
(acres) SWT
West Garland Pond Garland 1294 300 994 0.2 199 7.18 mod-sens h 1.00 7.18 0.036 50West Harbor Pond Boothbay 175 18 157 0.3 47 2.18 mod-sens m 1.00 2.18 0.046 12West Pond T3ND 2110 105 2005 0.2 401 42.71 good h 1.00 42.71 0.106 100West Pond T40MD 1326 66 1260 0.2 252 26.85 good h 1.00 26.85 0.106 63West Richardson Pond Adamstown Tw 7912 2500 5412 0.1 541 85.26 mod-sens h 0.75 63.95 0.118 135West Richardson Pond Lincoln Plt 578 15 563 0.1 56 6.21 mod-sens h 0.75 4.66 0.083 14Western Lake Whiting 180 10 170 0.15 26 1.76 mod-sens m 1.00 1.76 0.069 6Weymouth Pond Corinna 363 30 333 0.2 67 3.28 mod-sens m 1.00 3.28 0.049 17Whetstone Pond Kingsbury Pla 291 10 281 0.2 56 5.84 mod-sens h 0.75 4.38 0.078 14Whitney Pond Waterford 39 0 39 0.2 8 0.28 mod-sens m 1.00 0.28 0.036 2Whitney Pond Oxford 706 80 626 0.3 188 8.26 mod-sens m 1.00 8.26 0.044 47Whittier Pond Rome 2115 200 1915 0.2 383 12.74 mod-sens h 0.75 9.56 0.025 96Whittier Pond Vienna 252 15 237 0.2 47 2.29 mod-sens m 1.00 2.29 0.048 12Wight Pond Penobscot 5831 300 5531 0.2 1106 45.33 mod-sens m 1.00 45.33 0.041 277Wiley Pond Boothbay 71 7 64 0.3 19 0.85 mod-sens h 0.75 0.64 0.034 5Williams Pond Bucksport 768 100 668 0.2 134 7.25 mod-sens h 0.75 5.44 0.041 33Wilson Lake Acton 2241 300 1941 0.3 582 26.17 mod-sens h 0.75 19.63 0.034 146Wilson Pond Monmouth 1828 150 1678 0.3 503 20.77 mod-sens m 1.00 20.77 0.041 126Wilson Pond Winthrop 808 50 758 0.25 190 9.19 mod-sens h 0.75 6.89 0.036 47Wilson Pond Wilton 8048 970 7078 0.25 1770 72.1 mod-sens h 0.75 54.08 0.031 442Wilson Pond Jay 32 4 28 0.2 6 0.28 mod-sens h 0.75 0.21 0.038 1Withee Pond Mayfield Twp 144 40 104 0.2 21 1.21 mod-sens m 1.00 1.21 0.058 5Woodbury Pond Monmouth 187 10 177 0.25 44 3.04 mod-sens h 1.00 3.04 0.069 11Woodbury Pond Litchfield 1423 150 1273 0.3 382 22.88 mod-sens h 0.75 17.16 0.045 95Woods Millpond Sebago 266 15 251 0.2 50 1.54 mod-sens m 1.00 1.54 0.031 13Woods Pond Bridgton 3266 327 2939 0.35 1029 37.04 mod-sens m 1.00 37.04 0.036 257Wormwood Pond Ellsworth 605 50 555 0.2 111 3.83 mod-sens m 1.00 3.83 0.035 28Worthley Pond Poland 936 94 842 0.25 211 7.43 mod-sens h 0.75 5.57 0.026 53Worthley Pond Peru 3518 800 2718 0.25 680 39.97 mod-sens h 0.75 29.98 0.044 170Wytopitlock Lake Glenwood Plt 2555 230 2325 0.2 465 28.81 mod-sens m 1.00 28.81 0.062 116
Appendix C Per Acre Phosphorus Allocationsfor Selected Maine Lakes
Updated 11/1/17

Appendix C Per Acre Phosphorus Allocationsfor Selected Maine Lakes
Updated 11/1/17

Appendix C Per Acre Phosphorus Allocationsfor Selected Maine Lakes
Updated 11/1/17

Appendix C Per Acre Phosphorus Allocationsfor Selected Maine Lakes
Updated 11/1/17

Appendix C Per Acre Phosphorus Allocationsfor Selected Maine Lakes
Updated 11/1/17

Appendix C Per Acre Phosphorus Allocationsfor Selected Maine Lakes
Updated 11/1/17

Appendix C Per Acre Phosphorus Allocationsfor Selected Maine Lakes
Updated 11/1/17
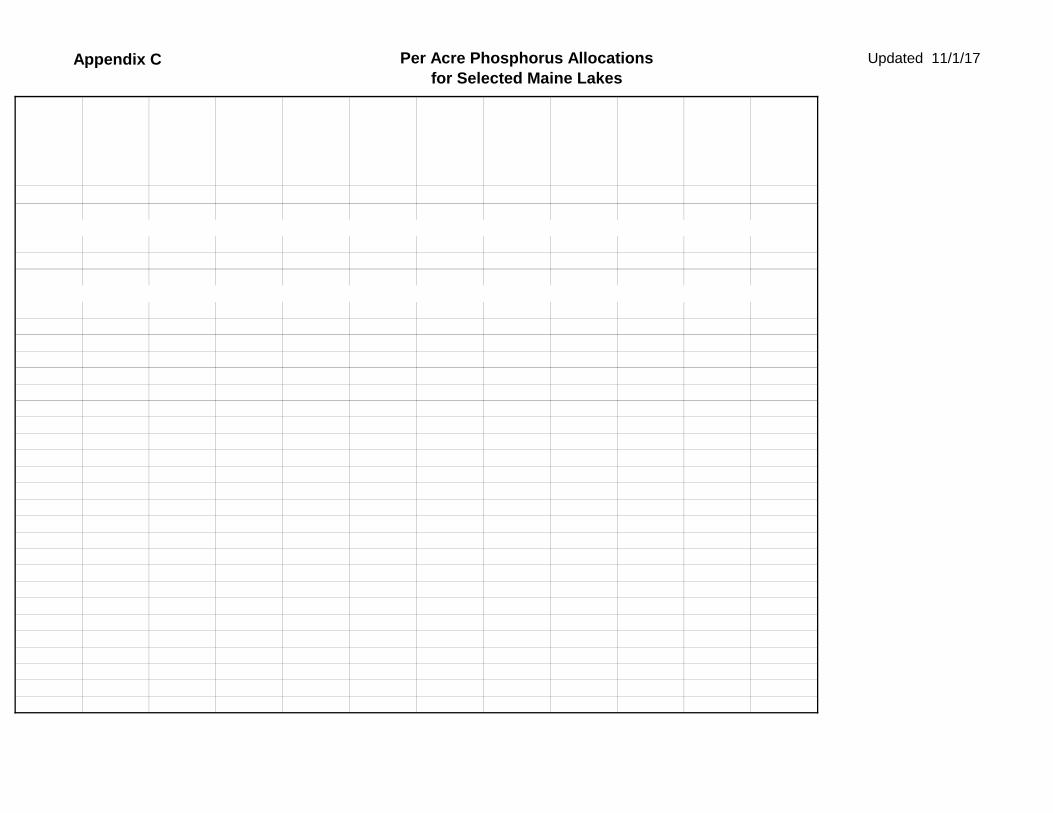
Appendix C Per Acre Phosphorus Allocationsfor Selected Maine Lakes
Updated 11/1/17

Appendix C Per Acre Phosphorus Allocationsfor Selected Maine Lakes
Updated 11/1/17

Appendix C Per Acre Phosphorus Allocationsfor Selected Maine Lakes
Updated 11/1/17

Appendix C Per Acre Phosphorus Allocationsfor Selected Maine Lakes
Updated 11/1/17

Appendix C Per Acre Phosphorus Allocationsfor Selected Maine Lakes
Updated 11/1/17
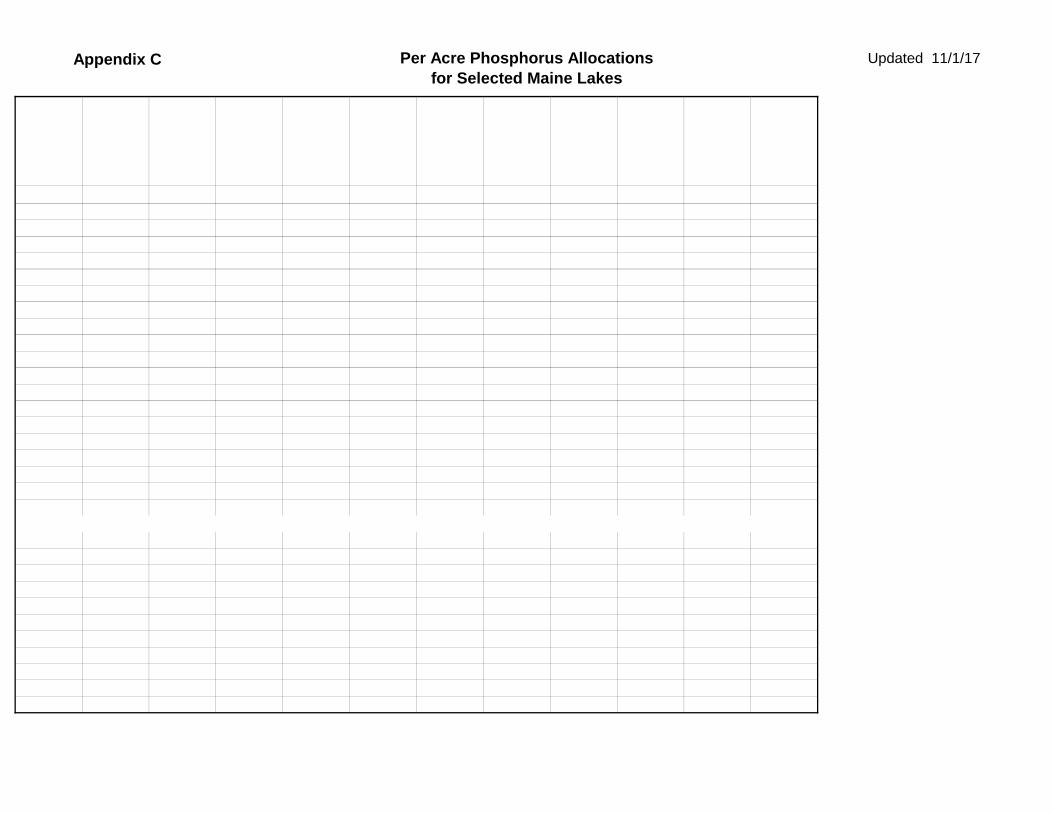
Appendix C Per Acre Phosphorus Allocationsfor Selected Maine Lakes
Updated 11/1/17
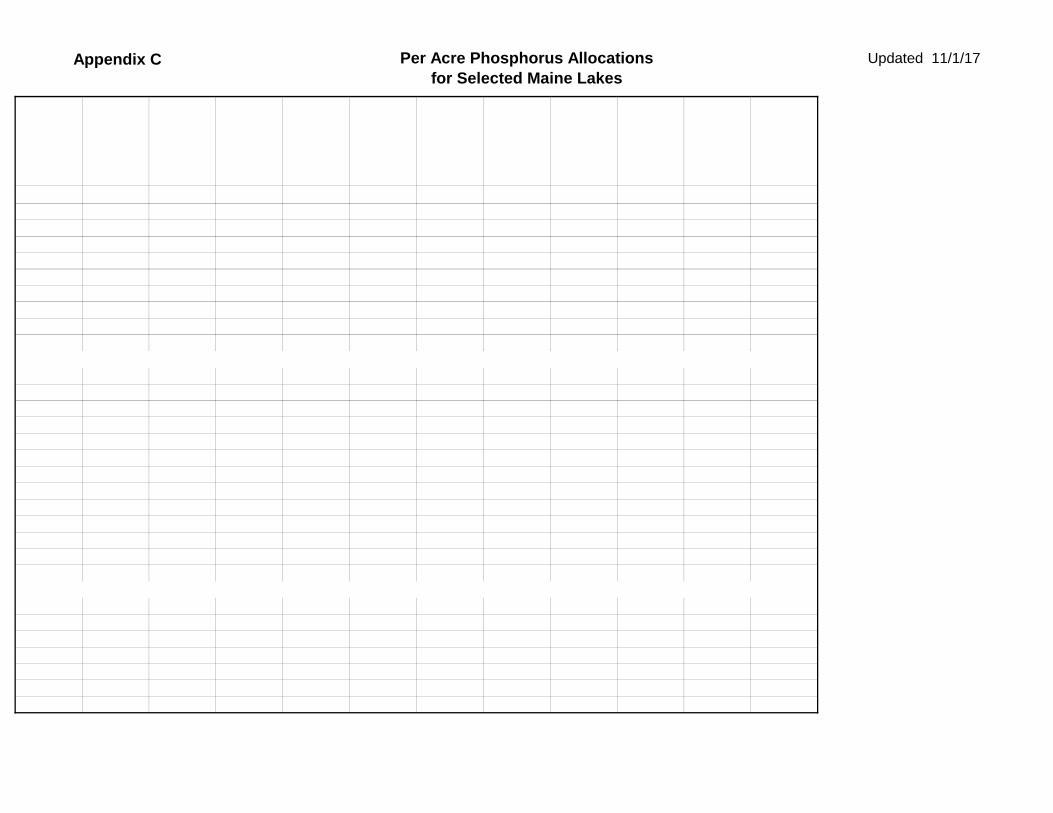
Appendix C Per Acre Phosphorus Allocationsfor Selected Maine Lakes
Updated 11/1/17

Appendix C Per Acre Phosphorus Allocationsfor Selected Maine Lakes
Updated 11/1/17

Appendix C Per Acre Phosphorus Allocationsfor Selected Maine Lakes
Updated 11/1/17

Appendix C Per Acre Phosphorus Allocationsfor Selected Maine Lakes
Updated 11/1/17
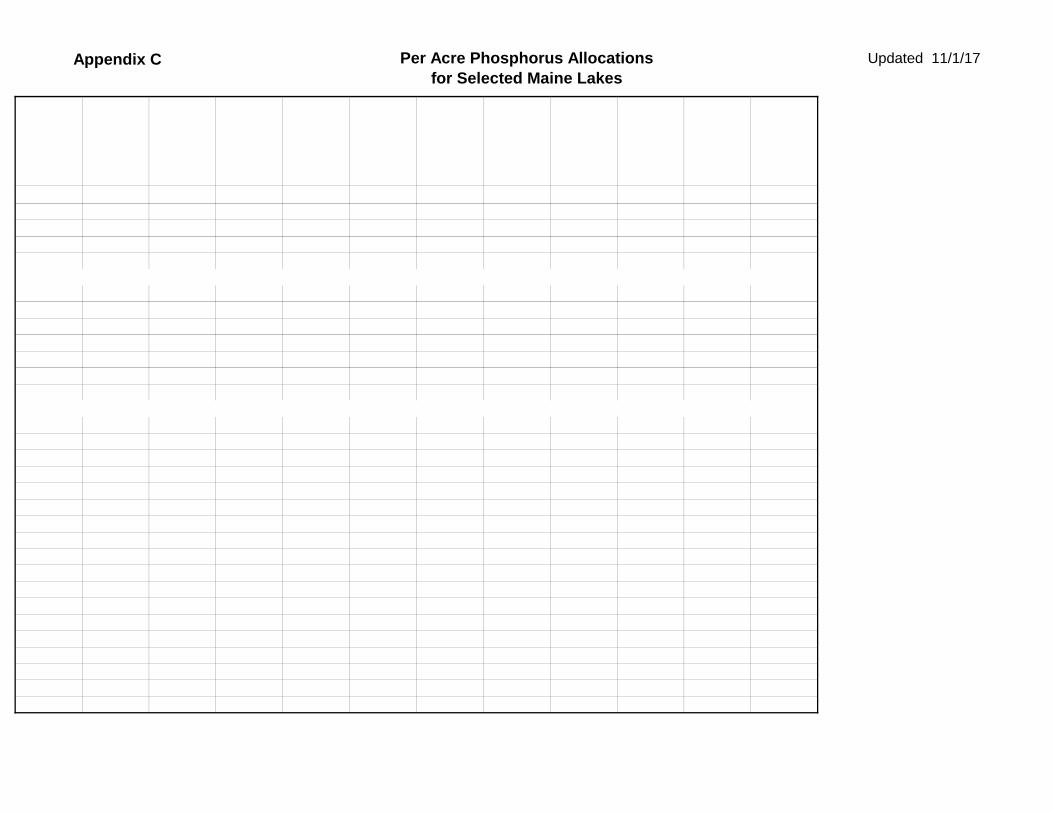
Appendix C Per Acre Phosphorus Allocationsfor Selected Maine Lakes
Updated 11/1/17

Appendix C Per Acre Phosphorus Allocationsfor Selected Maine Lakes
Updated 11/1/17

Appendix C Per Acre Phosphorus Allocationsfor Selected Maine Lakes
Updated 11/1/17

Appendix C Per Acre Phosphorus Allocationsfor Selected Maine Lakes
Updated 11/1/17
Appendix C Per Acre Phosphorus Allocationsfor Selected Maine Lakes
Updated 11/1/17

Appendix C Per Acre Phosphorus Allocationsfor Selected Maine Lakes
Updated 11/1/17

Appendix C Per Acre Phosphorus Allocationsfor Selected Maine Lakes
Updated 11/1/17

Appendix C Per Acre Phosphorus Allocationsfor Selected Maine Lakes
Updated 11/1/17

Appendix C Per Acre Phosphorus Allocationsfor Selected Maine Lakes
Updated 11/1/17

Appendix C Per Acre Phosphorus Allocationsfor Selected Maine Lakes
Updated 11/1/17

Appendix C Per Acre Phosphorus Allocationsfor Selected Maine Lakes
Updated 11/1/17

Appendix C Per Acre Phosphorus Allocationsfor Selected Maine Lakes
Updated 11/1/17

Appendix C Per Acre Phosphorus Allocationsfor Selected Maine Lakes
Updated 11/1/17

Appendix C Per Acre Phosphorus Allocationsfor Selected Maine Lakes
Updated 11/1/17

Appendix C Per Acre Phosphorus Allocationsfor Selected Maine Lakes
Updated 11/1/17

Appendix C Per Acre Phosphorus Allocationsfor Selected Maine Lakes
Updated 11/1/17

Appendix C Per Acre Phosphorus Allocationsfor Selected Maine Lakes
Updated 11/1/17

Appendix C Per Acre Phosphorus Allocationsfor Selected Maine Lakes
Updated 11/1/17

Appendix C Per Acre Phosphorus Allocationsfor Selected Maine Lakes
Updated 11/1/17
Appendix C Per Acre Phosphorus Allocationsfor Selected Maine Lakes
Updated 11/1/17