Embed Size (px)
Citation preview

Norfolk County Council & Great Yarmouth Borough Council
Great Yarmouth Surface Water Management Plan
Final Draft September 2013
C-1
1. Introduction
As part of the Great Yarmouth Surface Water Management Plan (SWMP) Capita Symonds URS
constructed three hydraulic models to simulate surface water flooding using InfoWorks ICM (Integrated
Catchment Modelling) software for the urban areas of Great Yarmouth, Gorleston, Bradwell and
Southtown. These models represent surface water flooding from direct rainfall and sewer flooding. Three
models of the area were needed to optimise overall model run times and data processing.
The baseline models were constructed to inform the Risk Assessment (Phase 2) of the SWMP, including
the delineation of Critical Drainage Areas (CDAs), assessment of level of risk facing properties and
communities in Great Yarmouth, Bradwell, Gorleston and Southtown, and identification of options. The
models were adapted to model the potential impacts of the proposed options for each of the CDAs to
inform the Options Assessment (Phase 3).
2. Model Data
Topographic Data
The 2D surface of the model was created in most areas using Light Detecting and Ranging Data (LiDAR).
LiDAR is a method of optical remote sensing which uses light reflections to determine vertical heights.
LiDAR data is provided in two formats; Digital Surface Model (DSM) that includes vegetation and buildings
and a Digital Terrain Model (DTM), which is filtered to remove the majority of buildings and vegetation.
For the purpose of this study, the filtered LiDAR was used to create a DTM to represent the ’bare earth‘
elevation with buildings, structures and vegetation removed. Buildings have been taken into account during
the model build process and the process for undertaking this is described in the Model Build (Section 3).
The LiDAR data supplied by the Environment Agency’s Geomatics Group was flown in July 2011 and
covers the majority of the model extents. The heights are recorded at a 1m resolution. The vertical
accuracy is not specified.
Interferometric Synthetic Aperture Radar (IFSAR) data, obtained from Bluesky, was used to supplement
the LiDAR data for an area of approximately 1.2km2 to the south of Gorleston. As with the LiDAR data the
‘bare earth’ elevations were used. The heights are recorded at a 5m resolution. The vertical accuracy is not
specified.
Model Hydrology
Direct Rainfall
Rainfall profiles were created using the Flood Estimation Handbook (FEH) rain generator in Infoworks ICM
based on the catchment descriptors for the study area exported from the FEH CD-ROM version 3. So that
an areal reduction factor was not applied the values were adjusted to match those for a 1km grid point
rather than using the default catchment values. For all other values, including the urban catchment
wetness index (UCWI), the default value was used.
Critical duration is a complex issue when modelling large areas for surface water flood risk. The critical
duration can change rapidly even within a small area, due to the topography, land use, size of the
upstream catchment and nature of the drainage systems. The ideal approach would be to model a wide
range of durations. However, this is not always practical or economic when modelling large areas using 2D
models which have long simulation times – such as within this study.
Norfolk County Council & Great Yarmouth Borough Council
Great Yarmouth Surface Water Management Plan
Final Draft September 2013
C-2
Two methods were used to calculate an estimate of the critical storm duration for the rainfall profiles used
in the model. A summary of these methods is given below:
• The Bransby-Williams formula was used to derive the time of concentration, defined as the time
taken for water to travel from the furthest point in the catchment to the catchment outfall, at which
point the entire site is considered to be contributing runoff; and
• The FEH equation for critical storm duration - the standard average annual rainfall (SAAR) value
for each a catchment has been extracted from the FEH CD-ROM v3 and the Revitalised Flood
Hydrograph method (ReFH) model has been used to derive the time to peak (Tp) from catchment
descriptors.
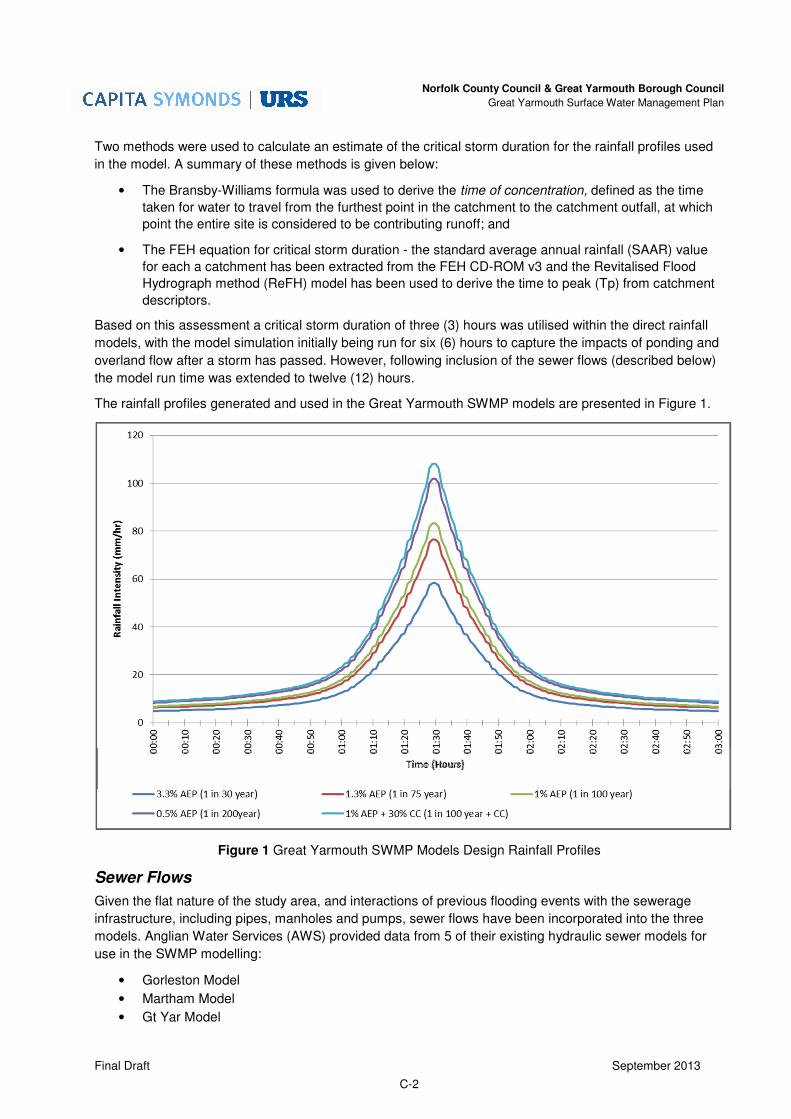
Based on this assessment a critical storm duration of three (3) hours was utilised within the direct rainfall
models, with the model simulation initially being run for six (6) hours to capture the impacts of ponding and
overland flow after a storm has passed. However, following inclusion of the sewer flows (described below)
the model run time was extended to twelve (12) hours.
The rainfall profiles generated and used in the Great Yarmouth SWMP models are presented in Figure 1.
Figure 1 Great Yarmouth SWMP Models Design Rainfall Profiles
Sewer Flows
Given the flat nature of the study area, and interactions of previous flooding events with the sewerage
infrastructure, including pipes, manholes and pumps, sewer flows have been incorporated into the three
models. Anglian Water Services (AWS) provided data from 5 of their existing hydraulic sewer models for
use in the SWMP modelling:
• Gorleston Model
• Martham Model
• Gt Yar Model

Norfolk County Council & Great Yarmouth Borough Council
Great Yarmouth Surface Water Management Plan
Final Draft September 2013
C-3
• Northgate Existing Model
• Northgate Scheme Model
AWS ran their existing hydraulic sewer models using the 1 in 30 year, 1 in 75 year, 1 in 100 year, 1 in 100
year including climate change (+30%) and 1 in 200 year rainfall profiles generated for the direct rainfall
models (Figure 1). Two csv files were exported for each return period from each of the models;
• “_floodvolume” - a time series of data that contains the flood volume at each manhole location at
each of the timesteps.
• “_flvol” - a time series of data that contains the cumulative volume lost from each of the manholes
at each timestep, i.e., the total volume lost to the sewer system (surcharging) through flooding.
Data Summary
Table 1 provides a summary of the main data sources used in undertaking the Great Yarmouth SWMP
modelling. These are discussed in further detail throughout this Appendix.
Table 1 Summary of Data Used in Great Yarmouth SWMP Modelling
Data Source Utilisation
LiDAR Environment Agency (Geomatics Group)
Base topography in model (1m resolution)
SAR Bluesky Base topography in an area of BRG2 model (where LiDAR data is missing) (5m resolution)
OS Mastermap Norfolk County Council Delineating runoff coefficients, roughness values and land types
AWS Manholes Anglian Water Services (AWS) Location of manholes within the model act as 2D point sources of flooding
AWS Subcatchments AWS Subcatchment areas for AWS manholes
IDB Culverts Waveney, Lower Yare & Lothingland IDB
Dimensions of 5 culverts in the BRG1 model network, taken from WLY&L IDB Burgh Castle District Water Level Management Plan 2007.
Design Rainfall Profiles
Generated using Flood Estimation Handbook (FEH) v3.0.
To simulate direct rainfall onto the models and to supply to AWS for us in their sewer models.

Norfolk County Council & Great Yarmouth Borough Council
Great Yarmouth Surface Water Management Plan
Final Draft September 2013
C-4
3. Model Build
Software Selection
All models have been run using InfoWorks ICM (Integrated Catchment Modelling) v3.0.0.6008 software
(http://www.innovyze.com/products/infoworks_icm/). InfoWorks ICM is an industry standard hydraulic
modelling package for integrated modelling of both urban and river catchments.
Model Extents
The data outlined in the previous section was used to construct three models:
• ‘GRY1’ – Great Yarmouth Model
• ‘BRG1’ – Bradwell and Gorleston Model 1; and,
• ‘BRG2’ – Bradwell and Gorleston Model 2.
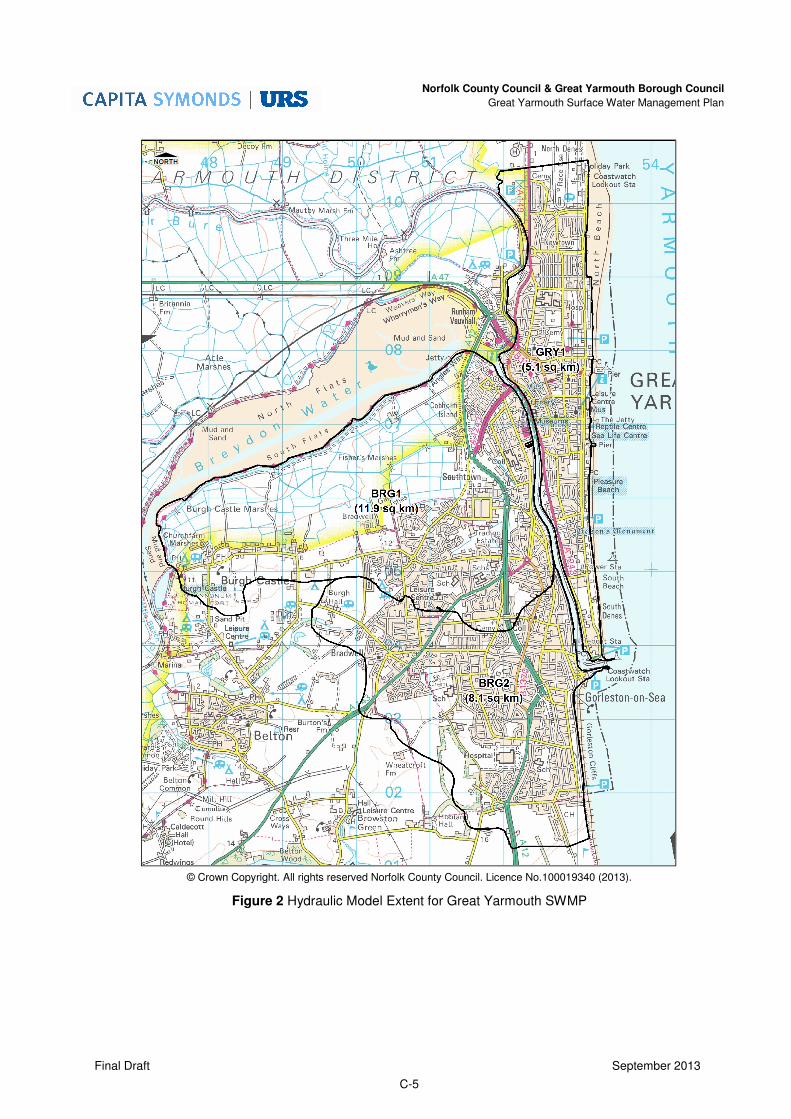
The extents of the three models have been based on catchment boundaries delineated using LiDAR data
to limit the amount of cross-boundary interaction between the models. Figure 2 illustrates the extent of the
study area and the hydraulic models.
Model Naming Convention
Naming the model networks and run files within InfoWorks ICM consistently, logically and in a predictable
way will distinguish similar model files from one another at a glance, and by doing so will facilitate their
storage and retrieval, which will enable users to browse file names more effectively and efficiently. Naming
files according to agreed conventions will enable users to quickly interpret model filenames.
Networks have been named ‘ID_M’ and run files have been named ‘ID_V_M_RP_D’, where:
• ID = Unique network identify found in the properties of the network.
• M = Model name (or abbreviated name).
• V = Network version number found in the properties of the network.
• RP = Return Period.
• D = Storm duration.
Table 2 provides examples from each of the models in the 1% annual probability event (1 in 100 year
return period). For BRG 2, LL_SCHEME at the end of the model name has been used to recognise that the
model includes the Lords Lane drainage system (see Incorporation of Sewer Flooding – BRG2 for further
information).
Table 2 Model Naming Convention
Model Name Naming Convention
(100 year flood event example)
GRY1 ID1v39_GRY1_100yr_180min
BRG1 ID5_BRG1v35_100yr_180min
BRG2 ID4_BRG2v8_100yr_180min_LL_Scheme
Norfolk County Council & Great Yarmouth Borough Council
Great Yarmouth Surface Water Management Plan
Final Draft September 2013
C-5
© Crown Copyright. All rights reserved Norfolk County Council. Licence No.100019340 (2013).
Figure 2 Hydraulic Model Extent for Great Yarmouth SWMP

Norfolk County Council & Great Yarmouth Borough Council
Great Yarmouth Surface Water Management Plan
Final Draft September 2013
C-6
Common Assumptions
All of the models have the following common assumptions:
• Initial Loss – None.
• Infiltration Loss – None.
• No aerial reduction factor applied.
• A ‘Summer’ rainfall profile was used.
• Mannings ‘N’ does not vary with depth of water.
Mesh Generation
A 2-dimensional (2D) model was created in InfoWorks ICM using a flexible mesh. InfoWorks ICM allows
the creation of a flexible mesh through the generation of triangular elements that cover the 2D model. A
flexible mesh enables the triangular elements to be drawn aligned to important surface features such as
buildings, bunds or roads which creates a more precise representation of flow paths. The elevation of each
of the triangular elements is based on an average of the three points it comprises, shown in the example in
Figure 3.
Figure 3 Example of the Elevation of a Triangular Element
The model run time is influenced by the resolution of the 2D mesh. A finer mesh results in a longer model
run time. A balance between a mesh resolution that sufficiently represents the site as well as allowing
efficient run times was sought.
The element size in the mesh was varied throughout the model domain depending upon the complexity of
floodplain and any topographic features identified as important to flood propagation. In Infoworks ICM
version 3 ‘terrain sensitive meshing’ automatically increases the mesh resolution where the changes in
topography is greater and vice versa. The maximum triangular area was set to 30m² and minimum element
area was set to 5m².
Roughness Coefficients
OS Mastermap data has been used to determine Manning’s roughness values applied across the models
for the roads as these are generally the land features that act as the most significant flow paths. A global
Mannings value of 0.05 has been applied across the model and specific features have been assigned the
following Manning’s values, where lower values represent a smoother surface:
• Road and paths – 0.020
• Buildings – 0.500
• Water – 0.030
Average
element level
= 50mAOD

Norfolk County Council & Great Yarmouth Borough Council
Great Yarmouth Surface Water Management Plan
Final Draft September 2013
C-7
• Railways – 0.200
• Grass and gardens – 0.040
Runoff Coefficients
OS Mastermap data was used to determine the runoff coefficients that are applied to the rainfall profiles
(Table 3). These simulate an appropriate level of infiltration for each land use type. For example, the runoff
coefficients simulate greater runoff from roads (85%) than from grass (35%).
Table 3 Runoff Coefficients and Losses
Feature Code Descriptive Group Comment Runoff coefficient (as %)
10021 Building 90%
10053 General surface Residential yards 50%
10054 General surface Step 80%
10056 General surface Grass, parkland 35%
10062 Building Glasshouse 95%
10076 Land; Heritage and Antiquities 85%
10089 Water Inland 100%
10111 Natural Environment (coniferous / non coniferous trees)
Heavy woodland and forest
20%
10119 Roads Tracks and Paths Manmade 85%
10123 Roads Tracks and Paths Tarmac or dirt tracks
75%
10167 Rail 35%
10172 Roads Tracks and Paths Tarmac 85%
10183 Roads Tracks and Paths (roadside) Pavement 85%
10185 Structures Roadside structure 90%
10187 Structures Generally on top of buildings
90%
10203 Water Foreshore 100%
10210 Water Tidal 100%
10217 Land (unclassified) Industrial yards, car parks
85%
Formal and Informal Defences
A GIS layer containing defences from the Environment Agency’s National Flood and Coastal Defence
Database (NFCDD) dataset was provided. These defences have been represented in the model as a non-
porous wall. The crest height of the defences has not been explicitly modelled as the defences are not
overtopped in any of the scenarios (see Downstream Boundaries section).
1D structures
The following 1D structures were included in the models to represent the following:
• Underpasses - one culvert was added to the GRY1 model to represent an underpass. The
dimensions of the underpass have been estimated from site photographs.

Norfolk County Council & Great Yarmouth Borough Council
Great Yarmouth Surface Water Management Plan
Final Draft September 2013
C-8
• Culverts – these were added to the BRG1 model to represent culverts on watercourses managed
by the Waveney, Lower Yare and Lothingland Internal Drainage Board (IDB). The dimensions of
the culverts were extracted from the Burgh Castle District Water Level Management Plan 2007
(Waveney, Lower Yare and Lothingland IDB, 2007).
Modelling parameters used for each of the 1D structures in the GRY1 and BRG1 models are detailed in
Table 4. No 1D structures were explicitly modelled within BRG2.
Table 4 Modelled 1D Structures
Model Structure Name in Model
Structure Type
Representation in Model
Dimensions Approx. Location
X Y
GRY1 Underpass Underpass under the A149
Mesh zone
Invert level = 0mAOD
Length = 13m
Height = 3m
652210 308126
BRG1 MH_IDB_B1 (us node)
MH_IDB_B2 (ds node)
C_IDB_B (conduit)
Culvert under A12 near Ladbrooke Road
1D conduit
Diameter = 1.4m
Length = 46m
US invert level = -1mAOD
DS invert level = - 1.1mAOD
651467 307340
BRG1 MH_IDB_C1 (us node)
MH_IDB_C2 (ds node)
C_IDB_C (conduit)
Culvert under A12 near Black Gate Farm
1D conduit
Diameter = 1.2m
Length = 64m
US invert level = -1.3mAOD
DS invert level = -1.4mAOD
651532 306688
BRG1 MH_IDB_D1 (us node)
MH_IDB_D2 (ds node)
C_IDB_D (conduit)
Culvert under A12 near Gapton Hall retail park
1D conduit
Diameter = 1.2m
Length = 52m
US invert level = -1.2mAOD
DS invert level = -1.3mAOD
651520 306275
BRG1 MH_IDB_E1 (us node)
MH_IDB_E2 (ds node)
C_IDB_E1 (conduit)
Culvert alongside Thamesfield Way
1D conduit
Diameter = 1.2m
Length = 287m
US invert level = -0.5mAOD
DS invert level = -0.6mAOD
651827 306556
BRG1 MH_IDB_E2 (us node)
MH_IDB_E3 (ds node)
C_IDB_E2 (conduit)
Culvert under Thamesfield Way
1D conduit
Diameter = 1.2m
Length = 41m
US invert level = -0.6mAOD
DS invert level = -0.7mAOD
651707 306731
BRG1 MH_IDB_E3 (us node)
MH_IDB_E4 (ds node)
C_IDB_E3 (conduit)
Culvert beside A1243
1D conduit
Diameter = 1.2m
Length = 30m
US invert level = -0.7mAOD
DS invert level = -1 mAOD
651694 306694
BRG1 MH_IDB_E4 (us node)
MH_IDB_E5 (ds node)
C_IDB_E4 (conduit)
Culvert under A1243
1D conduit
Diameter = 1.2m
Length = 54m
US invert level = -1mAOD
DS invert level = -1.1mAOD
651662 306683
Building Representation
The OS Mastermap has been queried to for buildings with an area >25m². These buildings have been
included in the model to have a threshold level that is 0.1m greater than the average adjacent ground level.
It is appreciated that in the site walkover threshold levels higher and lower than this were observed, so this
level is deemed to be an approximate average.

Norfolk County Council & Great Yarmouth Borough Council
Great Yarmouth Surface Water Management Plan
Final Draft September 2013
C-9
In order to determine the influence raised building pads will have within the model, the following approach
has been used for the representation of buildings in the models.
• A GIS layer containing the locations of all ‘buildings’ was created based on the buildings polygons
in the OS Mastermap dataset.
• The DTM was then interrogated to obtain an average ‘bare earth’ ground level for each building
polygon.
• This average ground level was applied to the building polygons to give them their base elevation in
the models.
• The building polygons were then raised 100mm above their average ‘bare earth’ ground level to
create ‘stubby’ building pads (reflecting an average building threshold level). This ensures that the
buildings form an obstruction to flood water and that shallow flows must pass round the buildings
(and not flow through them).
It was identified during the site walkover and a subsequent review of the aerial photography and LiDAR
data that some properties with the GRY1 model have basements. The topography of these buildings has
been lowered in the mesh to represent the basement level in the vicinity of Camperdown, Albert Square
and Nelson Road South. The perimeter of the buildings has been delineated using the OS Mastermap
dataset.
Incorporation of sewer flooding
GRY1 Model
The manholes from the AWS ‘Gt Yar’ and ‘Northgate with Scheme’ models were incorporated into the
model as 2D point sources. The flow hydrographs, extracted from the ‘flvol’ and ‘floodvolume’ csv files
provided by AWS, were associated with the corresponding manhole in the model.
The AWS’ ‘Northgate with Scheme’ Model includes the AWS Northgate Scheme, installed following the
flooding in the Northgate Street vicinity in September 2006, and designed to a 1 in 96 year standard.
These outputs have been included in the GRY1 to represent the current-day (2013) sewer flooding
predictions.
To avoid double counting of rainfall the sewer subcatchment boundaries were used to delineate where
rainfall should be applied to the 2D mesh. The original intention was to use the subcatchments provided by
AWS to form the subcatchment boundary, however the subcatchments are delineated as circles rather
than defining the boundary of the catchment. Therefore, a dummy ‘subcatchment’ was generated and
agreed with AWS for use in the GRY1 model (Figure 4). Table 5 outlines the approach (direct rainfall vs.
sewer flooding) used for each of the different areas within the GRY1 model.
Table 5 GRY1 Modelling Summary
GRY1 AWS Model Direct Rainfall Applied (%)
AWS Sewer Flows?
Assumptions
Area within subcatchment
Gt Yar 0% Yes • All rainfall that falls within the subcatchment
drains to an AWS sewer and has been applied in the AWS model
Area within subcatchment
Northgate with Scheme
0% Yes
• All rainfall that falls within the subcatchment drains to an AWS sewer and has been applied in the AWS model
• Northgate scheme model includes new AWS infrastructure implemented by AWS since Sept. 2007 flooding

Norfolk County Council & Great Yarmouth Borough Council
Great Yarmouth Surface Water Management Plan
Final Draft September 2013
C-10
GRY1 AWS Model Direct Rainfall Applied (%)
AWS Sewer Flows?
Assumptions
Area outside subcatchment
None 100% No • Areas are not drained / included within AWS
models
© Crown Copyright. All rights reserved Norfolk County Council. Licence No.100019340 (2013).
Figure 4 GRY1 Modelled Subcatchment Boundary
BRG1 Model
The manholes from the AWS ‘Gorleston’ model were incorporated as 2D point sources within InfoWorks
ICM and an inflow extracted from the ‘flvol’ and ‘floodvolume’ csv files provided was applied. To avoid
double counting of rainfall the subcatchments provided by AWS has been used to act as a boundary within
which direct rainfall is not applied to the mesh. The subcatchment boundary for the BRG1 model is shown
in Figure 5.

Norfolk County Council & Great Yarmouth Borough Council
Great Yarmouth Surface Water Management Plan
Final Draft September 2013
C-11
© Crown Copyright. All rights reserved Norfolk County Council. Licence No.100019340 (2013).
Figure 5 BRG1 Modelled Subcatchment Boundary
To avoid double counting of rainfall the sewer subcatchment boundaries were used to delineate where
rainfall should be applied to the 2D mesh. Following model verification of the BRG1, it was determined that
predicted flooding depths in the Southtown and Cobholm area were under predicted compared to local and
historical knowledge. Further model runs were undertaken, applying a percentage of direct rainfall to the
Southtown and Cobholm subcatchment in addition to the AWS sewer outputs, to determine a predicted
level of flooding that was considered to be in conformity with local and historical knowledge. The outputs
were discussed with the SWMP Steering Group and it was agreed that 30% direct rainfall should be
applied to the Southtown and Cobholm subcatchment in addition to the inclusion of the AWS sewer flows.
Table 6 outlines the approach (direct rainfall vs. sewer flooding) used for each of the different areas within
the BRG1 model.
Table 6 BRG1 Modelling Summary
BRG1 AWS Model
Direct Rainfall Applied (%)
AWS Sewer Flows?
Assumptions
Area within subcatchment
Gorleston 0% Yes
• All rainfall that falls within the subcatchment drains to an AWS sewer and has been applied in the AWS model
Area outside subcatchment
None 100% No • Areas are not drained / included
within AWS models
Southtown / Cobholm Gorleston 30% Yes • Direct rainfall percentage defined
Norfolk County Council & Great Yarmouth Borough Council
Great Yarmouth Surface Water Management Plan
Final Draft September 2013
C-12
BRG1 AWS Model
Direct Rainfall Applied (%)
AWS Sewer Flows?
Assumptions
area within Subcatchment
through verification exercise and sensitivity testing of outputs to meet local and historical knowledge of modelling in the catchment.
• Not all rainfall is reaching the sewer network in this area. Site visits observed that there are areas where water is unlikely to reach the gullies and sewer system.
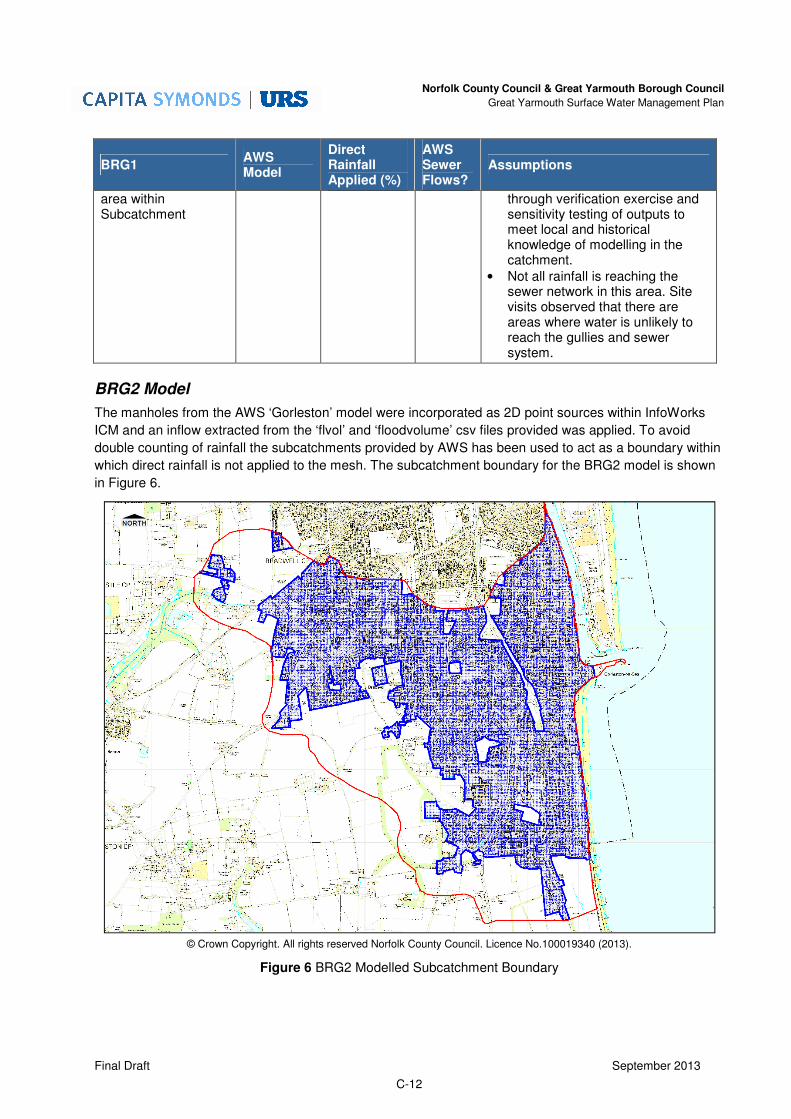
BRG2 Model
The manholes from the AWS ‘Gorleston’ model were incorporated as 2D point sources within InfoWorks
ICM and an inflow extracted from the ‘flvol’ and ‘floodvolume’ csv files provided was applied. To avoid
double counting of rainfall the subcatchments provided by AWS has been used to act as a boundary within
which direct rainfall is not applied to the mesh. The subcatchment boundary for the BRG2 model is shown
in Figure 6.
© Crown Copyright. All rights reserved Norfolk County Council. Licence No.100019340 (2013).
Figure 6 BRG2 Modelled Subcatchment Boundary

Norfolk County Council & Great Yarmouth Borough Council
Great Yarmouth Surface Water Management Plan
Final Draft September 2013
C-13
To avoid double counting of rainfall the sewer subcatchment boundaries were used to delineate where
rainfall should be applied to the 2D mesh.
Historically, flooding has occurred in the Lords Lane area of Bradwell. To address this, Norfolk County
Council has constructed a scheme that is designed to convey the 1 in 10 year flood event in the sewer
system. This scheme is not included in the current AWS ‘Gorleston’ model. To try to represent the
potential alleviation provided by the scheme within the BRG2 model, AWS agreed to undertake a further
run of their ‘Gorleston’ sewer model for a 1 in 10 year rainfall event with a 3 hour storm duration. The
sewer model outputs for the 1 in 10 year rainfall event were subtracted from each of the agreed model
rainfall events, and these amended sewer flows included within the BRG2 model as 2D point sources to
represent the Lords lane drainage scheme.
Table 7 outlines the approach (direct rainfall vs. sewer flooding) used for each of the different areas within
the BRG1 model.
Table 7 BRG2 Modelling Summary
BRG2 AWS Model
Direct Rainfall Applied (%)
AWS Sewer Flows?
Assumptions
Area within subcatchment
Gorleston 0% Yes
• All rainfall that falls within the subcatchment drains to an AWS sewer and has been applied in the AWS model
Lords Lane catchment within subcatchment
Gorleston 0% Yes
• Hydrographs reduced by 1 in 10 year return period to represent effect of Lords Lane drainage scheme in catchment
Area outside subcatchment
Gorleston 100% No • Areas are not drained / included
within AWS models
Downstream boundaries
Within InfoWorks ICM the flow permitted out of the model (i.e. across the perimeter of the mesh) was
defined as a 2D boundary. Two types of boundaries were applied to the model:
• Along the coastline and tidal River Yare where there are defences – an initial review of the
defences found that they are all greater than 1m above the ground level. It was therefore assumed
that no surface water will be able to overtop this and these boundaries were represented as an
infinite wall. Following the model runs the depth of water behind the defences was reviewed but no
significant depths occurred that would ordinarily overtop the defences.
• All other boundaries - The perimeter of the mesh was set with a ‘normal depth’ 2D boundary that is
defined in InfoWorks ICM as ‘it is assumed that slope balances friction forces (normal flow). Depth
and velocity are kept constant when water reaches the boundary, so water can flow out without
energy losses’.
Run parameters
The InfoWorks ICM default values were used for the majority of run parameters. The main model run
parameters are presented in Table 8.

Norfolk County Council & Great Yarmouth Borough Council
Great Yarmouth Surface Water Management Plan
Final Draft September 2013
C-14
Table 8 Main Run Parameters
Parameter Value
Time step 2 seconds
Results Timestep Multiplier 150 seconds
Duration 12 hours
Cell Wet/Dry Depth 0.001m
Maximum Velocity Cut-off Depth 0m/s
4. Model calibration and verification
Calibration
Calibration is the process of adjusting the model parameters to make a model fit with measured conditions,
usually flows. This process should be followed by verification using a different data set than that used to
calibrate the model, normally with events of different magnitude and duration. No detailed calibration data
was available for this study and therefore verification was used to review the model performance and
outputs and make any model parameter adjustments, as required.
Verification
A number of data sources have been used to check the validity of the model outputs, including the
following:
Ground-truth Model
This stage of verification involved reviewing the hydraulic model outputs against the initial site
inspections/assessment to ensure that the predictions were realistic and considered local topography and
identified drainage patterns. Where previous site inspection data did not provide sufficient information on a
specific area within the study, the model outputs were assessed against photography from third party
sources (e.g. Google and Bing maps) to assist in the model verification.
EA National Surface Water Mapping
The Environment Agency has produced two national surface water datasets using a coarse scale national
methodology:
• Areas Susceptible to Surface Water Flooding (AStSWF); and
• Flood Map for Surface Water (FMfSW).
As a method of validation, the outputs from these datasets have been compared to the SWMP modelling
outputs to ensure similar flood depths and extents have been predicted. There are slight variations, due to
the more accurate methodology used in the SWMP risk assessment, but generally the outputs with relation
to ponding locations and flow paths are very similar.
Flood History and Local Knowledge
Recorded flood history has also been used to verify areas which are identified as being at risk of flooding
with previous known flood events. Information on historical flood events were collected from a number of
sources, and in particular, information relating to the September 2006 flooding, a 1 in 96 year rainfall event,
has been used to verify the modelling outputs for the 1 in 100 year rainfall event. In addition to this,

Norfolk County Council & Great Yarmouth Borough Council
Great Yarmouth Surface Water Management Plan
Final Draft September 2013
C-15
members of the SWMP Steering Group, have an extensive knowledge of the study area and the drainage
and flooding history through living locally.
The use of a Steering Group workshop and public ‘drop in’ sessions were also used to validate the model
outputs. The attendees of the events examined the modelling outputs and were able to provide anecdotal
information on past flooding which confirmed several of the predicted areas of ponding.
Verification Summary
Within the study area there are a number of local flood resilience forums that, amongst other tasks, collect
reports on historical flooding. During the site walkover and in subsequent meetings with the SWMP
Steering Group and stakeholders locations of known flooding hotspots have been provided as descriptions
and in some cases photographs. All of the historical flooding points are identified in the main SWMP report.
Following the initial model runs the results were reviewed against this verification data and a comparison of
the key locations presented Table 9.

Norfolk County Council & Great Yarmouth Borough Council
Great Yarmouth Surface Water Management Plan
Final Draft September 2013
C-16
Table 9 Model Verification at Key Locations
Anecdotal evidence Modelled results
GRY1
Underpass under A149
The underpass under
A149 is known to flood.
© Crown Copyright. All rights reserved Norfolk County Council. Licence No.100019340
(2013).
The modelled results show that the underpass floods to an approximate
maximum depth of 1.8m in the 1% annual probability including the effects
of climate change.
South end of Northgate Street
Flooding is known to
occur at the south end
of Northgate Street
© Crown Copyright. All rights reserved Norfolk County Council. Licence No.100019340
(2013).
This area is entirely covered by the Anglian Water models and therefore
any potential flooding in this area will derive from the manholes shown
above. An inspection of the AWS data for these manholes shows that
limited flooding is modelled to occur from these manholes in the 1%
annual probability event.

Norfolk County Council & Great Yarmouth Borough Council
Great Yarmouth Surface Water Management Plan
Final Draft September 2013
C-17
Anecdotal evidence Modelled results
Northgate Street
Northgate Street
experienced significant
floods in 2006 (prior to
the Northgate Scheme)
© Crown Copyright. All rights reserved Norfolk County Council. Licence No.100019340
(2013).
The model shows the maximum flood depth on Northgate Street in the 1%
annual probability including the effects of climate change to be
approximately 0.6m.
Junction at the north end of Northgate Street
It is known that flooding
occurs on Lawn
Avenue (outside the
doctors surgery)
© Crown Copyright. All rights reserved Norfolk County Council. Licence No.100019340
(2013).
The model shows the maximum flood depth on Lawn Avenue in the 1%
annual probability including the effects of climate change to be
approximately 0.3m.

Norfolk County Council & Great Yarmouth Borough Council
Great Yarmouth Surface Water Management Plan
Final Draft September 2013
C-18
Anecdotal evidence Modelled results
BRG1
Burgh Road
Flooding is known to
occur to the north of
Burgh Road
© Crown Copyright. All rights reserved Norfolk County Council. Licence No.100019340
(2013).
The model shows the maximum flood depth to the north of Burgh Road in
the 1% annual probability including the effects of climate change to be
approximately 1.1m.
Southtown
Streets in Southtown
that have been
identified as known
flooding points are:
Coronation Road and
Granville Road. These
were reported to flood
to kerb height (approx.
150mm).
© Crown Copyright. All rights reserved Norfolk County Council. Licence No.100019340
(2013).
The model shows the maximum flood depth in the vicinity of Coronation
Road and Granville Road in the 1% annual probability including the effects
of climate change to be approximately 0.2m.

Norfolk County Council & Great Yarmouth Borough Council
Great Yarmouth Surface Water Management Plan
Final Draft September 2013
C-19
Anecdotal evidence Modelled results
BRG2
Lords Lane
Lords Lane and Yew
Tree Close have been
known to flood.
© Crown Copyright. All rights reserved Norfolk County Council. Licence No.100019340
(2013).
The model shows the maximum flood depth on Lords Lane in the 1%
annual probability including the effects of climate change to be
approximately 0.4m. The maximum flood depth for Yew Tree Close, for the
same event is approximately 0.6m.
Dock Tavern Lane
Dock Tavern Lane has
been known to flood in
the past.
© Crown Copyright. All rights reserved Norfolk County Council. Licence No.100019340
(2013).
The model shows the maximum flood depth on Dock Tavern Lane in the
1% annual probability including the effects of climate change to be
approximately 0.6m.

Norfolk County Council & Great Yarmouth Borough Council
Great Yarmouth Surface Water Management Plan
Final Draft September 2013
C-20
Anecdotal evidence Modelled results
Pavilion Road
Flooding from Beach
Road to Pavilion Road
has been known to
occur and cause a
landslide
© Crown Copyright. All rights reserved Norfolk County Council. Licence No.100019340
(2013).
The model shows the maximum flood depth on Lords Lane in the 1%
annual probability including the effects of climate change to be
approximately 0.6m.
5. Sensitivity Testing
Sensitivity testing is the process of quantifying the change in model results, typically in terms of changes in
water levels and/or flood extents, in response to a variation of a model parameter (e.g. a fixed percentage
increase/decrease in roughness coefficients or structure representation).
The results of sensitivity analyses provide an indication as to the reliance of the model outputs on specific
assumptions, which have been made by the modelling team, and the potential variation in the results if a
different assumption is applied. This section details the sensitivity testing undertaken on the hydraulic
model to derive an associated statement of confidence in modelled results.
Model Sensitivity Parameters
Sensitivity testing was undertaken on the BRG1 model for the 1% annual probability event. Testing
comprised of adjusting the following parameters:
• Mannings N roughness coefficients increased by 25%;
• Mannings N roughness coefficients decreased by 25%
• Runoff coefficients increased to 100%;
• Runoff coefficients decreased by 25%;
• Time step reduced to 1 second;
• 2 hour storm duration; and,
• 4 hour storm duration.

Norfolk County Council & Great Yarmouth Borough Council
Great Yarmouth Surface Water Management Plan
Final Draft September 2013
C-21
Model Sensitivity Results
Flood depths have been extracted from 5 flooded locations in the BRG1 model for all of the sensitivity runs
(Figure 7). The results from the sensitivity runs are presented in Table 10 and Table 11.
© Crown Copyright. All rights reserved Norfolk County Council. Licence No.100019340 (2013).
Figure 7 BRG1 Sensitivity Points

Norfolk County Council & Great Yarmouth Borough Council
Great Yarmouth Surface Water Management Plan
Final Draft September 2013
C-22
Table 10 Sensitivity testing results for BRG1 in the 1% annual probability event (1 in 100 year return period)
Point
Depth (m)
Base
100% runoff coefficient
Difference (m)
Minus 25% runoff coefficient
Difference (m)
N increased by 25%
Difference (m)
N decreased by 25%
Difference (m)
1 0.22 0.24 0.02 0.22 0 0.22 0 0.22 0
2 0.62 0.76 0.14 0.56 -0.06 0.62 0 0.62 0
3 0.19 0.33 0.14 0.14 -0.05 0.19 0 0.19 0
4 0.2 0.26 0.06 0.16 -0.04 0.2 0 0.2 0
5 0.14 0.2 0.06 0.12 -0.02 0.14 0 0.14 0
Table 11 Sensitivity testing results for BRG1 in the 1% annual probability event (1 in 100 year return period) continued
Point
Depth (m)
Base 1 sec timestep
Difference (m) 2 hour storm duration
Difference (m)
4 hour storm duration
Difference (m)
1 0.22 0.22 0.00 0.23 0.01 0.23 0.01
2 0.62 0.62 0.00 0.63 0.01 0.66 0.04
3 0.19 0.19 0.00 0.21 0.02 0.22 0.03
4 0.2 0.20 0.00 0.21 0.01 0.21 0.01
5 0.14 0.14 0.00 0.15 0.01 0.15 0.01

Norfolk County Council & Great Yarmouth Borough Council
Great Yarmouth Surface Water Management Plan
Final Draft September 2013
C-23
In summary, the sensitivity testing demonstrates that:
• When the roughness coefficients varied by 25% the differences at the extraction points was
negligible (less than 5mm).
• When the timestep is reduced to 1 second the differences at the extraction points was negligible
(less than 5mm).
• When the storm duration is reduced to 2 hours or increased to 4 hours the flood depths at the
extraction points varied up to 40mm.
• When the runoff coefficient was set to 100%, this led to an overall increase in flood depths at the
extraction points to a maximum of 140mm. When the runoff coefficients were reduced by 25%
there was a reduction in flood depths at the extraction points of up to 60mm.
• The model uncertainty is approximately +/- 140mm.
6. Options Modelling
Introduction
The baseline models were updated to include the proposed options for each of the CDAs to inform Phase
3: Options Assessment of the Great Yarmouth Surface Water Management plan.
Methodology Overview
Strategic options were selected for the CDAs during workshops held by Capita Symonds URS in June
2013. To inform a high-level cost-benefit analysis these options have been represented in the three
baseline models. The options comprise:
• Flood wall and embankments.
• Formalised overland flow routes.
• Property level protection.
• Increased conveyance.
• Sustainable Drainage Systems (SuDS).
A summary of the options selected is presented in Table 12. For further details on individual options and
the location of these please refer to the SWMP main report.
Table 12 Summary of the Proposed Options Modelled
Model Number of each Option Proposed
Flood Wall or Embankment
Formalised Overland Flow Route
Property Level Protection (Area)
Increased Conveyance
SuDS
GRY1 0 0 2 2 16
BRG1 4 0 0 0 2
BRG2 1 5 9 6 6
The options were assessed and modelled in combination, i.e. no model runs were undertaken for each of
the individual option scenarios. Each model was run for the 5 return period storm events: 1 in 30 year; 1 in
75 year; 1 in 100 year; 100 year including the effects of climate change; and, 1 in 200 year to allow a
comparison against the baseline model results.

Norfolk County Council & Great Yarmouth Borough Council
Great Yarmouth Surface Water Management Plan
Final Draft September 2013
C-24
It should be acknowledged that the model outputs are not to be used for the design of specific options but
to inform strategic decisions. More detailed modelling of the options would need to be carried out to inform
outline or detailed design.
Flood Walls and / or Embankments
Polylines were imported from GIS as Base linear structures (2D) in InfoWorks ICM. These have been set
to have a 0% porosity value so that flood waters cannot pass through and to have an infinite height so no
flood waters will overtop the flood walls.
Formalised Overland Flow Route
Overland flowpaths have been represented in the model using mesh zones that have lowered the area by
150mm below the existing ground levels. The roughness coefficient local to the overland flow route has
also been reduced by 25%.
Property Level Protection
The Property Level Protection (PLP) has been represented by increasing the level of the buildings included
within the polygons indicated (represented as mesh zone) by 600mm. Where PLP has been applied to
basement properties, the level of the buildings have been raised to the surrounding ground level plus
600mm.
Increased Conveyance
To represent increased conveyance of the surface water drainage network 1D conduits and manholes
were incorporated into the model. The manholes within the 2D zone were set to be 2D manholes, so they
are able to receive flows from the 2D mesh. Downstream manholes that are outside the model extent were
modelled as 2D outlets (if within the 2D domain) or simply a free outfall (if outside the 2D domain). Where
applicable, it is assumed that the invert levels provided will allow a free fall into the River Yare in one
direction and that no tide-locking will occur.
SuDs
The potential impact of SuDS techniques are to both attenuate flood waters and allow more infiltration.
Given the strategic nature of the baseline modelling undertaken and the uncertainty over the specific SuDS
techniques to be implemented at specific locations it was agreed that SuDS would be represented in the
Options models by applying infiltration losses within the areas where the use of SuDS has been identified
as an option.
The baseline models apply infiltration losses through using runoff coefficients so these values have been
varied to represent more infiltration into the surface and less runoff. However, this approach could only be
applied to those areas that are modelled to receive direct rainfall, the infiltration rates applied to the areas
within the subcatchments will have been applied by AWS during their sewer model simulations.
The selected option areas partly fall within areas where direct rainfall has been applied and partly where it
has not (i.e. they are within subcatchments). So, to represent the use of SuDS option, three approaches
were adopted:
• Use of SuDS representation in urban areas that receive direct rainfall - the underlying runoff
coefficient polygon was amended to represent a ‘general surface’ so that a greater volume of
infiltration occurs.
• Use of SuDS in rural areas that receive direct rainfall - the runoff coefficient polygon has been
amended to have 100% infiltration within the SuDS area.
Norfolk County Council & Great Yarmouth Borough Council
Great Yarmouth Surface Water Management Plan
Final Draft September 2013
C-25
• Use of SuDS representation in urban areas that do not receive direct rainfall - the 2D point sources
that simulate flooding from a manhole (supplied by AWS) were amended so that the volume of
water surcharging from each manhole was reduced by 30mm per hour.
7. Conclusions and Recommendations
The hydraulic models constructed for Phase 2 of the Great Yarmouth Surface Water Management Plan
represents an ‘intermediate’ approach to identify areas at risk of surface water flooding. It represents a
significant refinement on the previously available information on surface water flooding in the study area. It
is envisaged that these models (or parts of) could be used as base models for designing options. However,
it is recommended that for future improvements to the models include (but are not limited) to the following:
• Reduction in overall model extent so that the model can be more detailed near to the option
proposed.
• Inclusion of threshold surveys.
• Inclusion of river flows and channel capacity (where applicable).
• If applicable to the proposed option, incorporate the IDB watercourses as 1D river channels so the
interaction between the surface water network and the IDB watercourses can be modelled more
accurately.
• Further investigation on the runoff coefficients local to the options being modelled, followed by a
suite of sensitivity runs to determine the most appropriate runoff coefficient.