Embed Size (px)
Citation preview

Appendix C Electrical Effects
KLONDIKE III/BIGLOW CANYON WIND INTEGRATION PROJECT
APPENDIX C
ELECTRICAL EFFECTS
MARCH 2006
Prepared by
T. Dan Bracken, Inc.
for
Bonneville Power Administration

KlondikeIII/Biglow Canyon Wind Integration Project Appendix C: Electrical Effects
i
Table of Contents
1.0 Introduction..................................................................................................................................... 1
2.0 Physical Description........................................................................................................................ 2
2.1 Proposed Line ................................................................................................................................... 2 2.2 Existing Lines ................................................................................................................................... 3
3.0 Electric Field.................................................................................................................................... 4
3.1 Basic Concepts.................................................................................................................................. 4 3.2 Transmission-line Electric Fields...................................................................................................... 4 3.3 Calculated Values of Electric Fields ................................................................................................. 5 3.4 Environmental Electric Fields........................................................................................................... 6
4.0 Magnetic Field................................................................................................................................. 7
4.1 Basic Concepts................................................................................................................................. 7 4.2 Transmission-line Magnetic Fields ................................................................................................... 8 4.3 Calculated Values for Magnetic Fields ............................................................................................. 9 4.4 Environmental Magnetic Fields ........................................................................................................ 9
5.0 Electric and Magnetic Field (EMF) Effects ................................................................................ 12
5.1 Electric Fields: Short-term Effects................................................................................................. 12 5.2 Magnetic Field: Short-term Effects................................................................................................ 15
6.0 Regulations .................................................................................................................................... 16
7.0 Audible Noise................................................................................................................................. 18
7.1 Basic Concepts................................................................................................................................ 18 7.2 Transmission-line Audible Noise.................................................................................................... 19 7.3 Predicted Audible Noise Levels...................................................................................................... 20 7.4 Discussion ....................................................................................................................................... 20 7.5 Conclusion ...................................................................................................................................... 21
8.0 Electromagnetic Interference....................................................................................................... 21
8.1 Basic Concepts................................................................................................................................ 21 8.2 Radio Interference (RI) ................................................................................................................... 22 8.3 Predicted RI Levels......................................................................................................................... 22 8.4 Television Interference (TVI) ......................................................................................................... 22 8.5 Predicted TVI Levels ...................................................................................................................... 22 8.6 Interference with Other Devices ..................................................................................................... 23 8.7 Conclusion ...................................................................................................................................... 23
9.0 Other Corona Effects.................................................................................................................... 23
10.0 Summary........................................................................................................................................ 23
List of References Cited............................................................................................................................ 25
List of Preparers ....................................................................................................................................... 29
Klondike III/Biglow Canyon Wind Integration Project Appendix C: Electrical Effects
ii
List of Tables Table 1 Possible routes for Klondike - John Day 230-kV transmission-line corridor ........... 31
Table 2 Physical and electrical characteristics of the proposed Klondike - John Day 230-kV transmission-line ......................................................................................... 31
Table 3 Calculated peak and edge-of-right-of-way electric fields for the proposed Klondike - John Day 230-kV line operated at maximum voltage............................. 32
Table 4 Calculated peak and edge-of-right-of-way magnetic fields for the proposed Klondike - John Day 230-kV line operated at maximum current ............................. 32
Table 5 States with transmission-line field limits .................................................................. 33
Table 6 Common noise levels ................................................................................................ 34
Table 7 Predicted foul-weather audible noise (AN) levels at edge of right-of-way (ROW) for the proposed Klondike - John Day 230-kV line.................................................. 34
List of Figures
Figure 1 Line configuration for the proposed Klondike - John Day 230-kV transmission line ....................................................................................................... 35
Figure 2 Electric-field profiles for the proposed Klondike - John Day 230-kV transmission line under maximum voltage conditions ................................................................... 36
Figure 3 Magnetic-field profiles for the proposed Klondike - John Day 230-kV transmission line under maximum current conditions .............................................. 37
Figure 4 Predicted foul-weather L50 audible noise levels for the proposed Klondike - John Day 230-kV transmission line........................................................ 38
KlondikeIII/Biglow Canyon Wind Integration Project Appendix C: Electrical Effects
Appendix C/1
ELECTRICAL EFFECTS FROM BPA’S PORTION OF THE KLONDIKE III/BIGLOW CANYON WIND
INTEGRATION PROJECT
1.0 Introduction
The Bonneville Power Administration (BPA) is proposing to build an approximately 12-mile (mi.) (19.3-kilometer [km]) 230-kilovolt (kV) double-circuit transmission line from the existing Klondike Schoolhouse Substation east of Wasco, Oregon, to a proposed BPA John Day 230-kV Substation adjacent to BPA’s existing John Day 500-kV Substation near Rufus, Oregon. The proposed line is designated the Klondike - John Day 230-kV transmission line. The proposed line would be built on new right-of-way entirely within the state of Oregon. Two alternative routes are being considered for the proposed line – the North Alternative and the Middle Alternative (Table 1). There are no existing high-voltage transmission lines that parallel the proposed line routes.
The purpose of this report is to describe and quantify the electrical effects of the proposed Klondike - John Day 230-kV transmission line and the proposed substations. These effects include the following:
• the levels of 60-hertz (Hz; cycles per second) electric and magnetic fields (EMF) at 3.28 feet (ft.) or 1 meter (m) above the ground,
• the effects associated with those fields,
• the levels of audible noise produced by the line, and
• electromagnetic interference associated with the line.
Electrical effects occur near all transmission lines, including existing 230-kV lines in Oregon and the 500-kV lines that connect into the existing BPA John Day 500-kV Substation. Therefore, the levels of these quantities for the proposed line are computed and compared with those from the existing lines in Oregon.
The voltage on the conductors of transmission lines generates an electric field in the space between the conductors and the ground. The electric field is calculated or measured in units of volts-per-meter (V/m) or kilovolts-per-meter (kV/m) at a height of 3.28 ft. (1 m) above the ground. The current flowing in the conductors of the transmission line generates a magnetic field in the air and earth near the transmission line; current is expressed in units of amperes (A). The magnetic field is expressed in milligauss (mG), and is also usually measured or calculated at a height of 3.28 ft. (1 m) above the ground. The electric field at the surface of the conductors causes the phenomenon of corona. Corona is the electrical breakdown or ionization of air in very strong electric fields, and is the source of audible noise, electromagnetic radiation, and visible light.
To quantify EMF levels along the route, the electric and magnetic fields from the proposed transmission line were calculated using the BPA Corona and Field Effects Program (USDOE, undated). In this program, the calculation of 60-Hz fields uses standard superposition techniques for vector fields from several line sources: in this case, the line sources are transmission-line conductors. (Vector fields have both magnitude and direction: these must be taken into account when combining fields from different sources.) Important input parameters to the computer program are voltage, current, and geometric configuration of the line. The transmission-line conductors are assumed to be straight, parallel to each other, and located above and parallel to an infinite flat ground plane. Although such conditions do not
Klondike III/Biglow Canyon Wind Integration Project Appendix C: Electrical Effects
Appendix C/2
occur under real lines because of conductor sag and variable terrain, the validity and limitations of calculations using these assumptions have been well verified by comparisons with measurements. This approach was used to estimate fields for the proposed Klondike – John Day line, where minimum clearances were assumed to provide worst-case (highest) estimates for the fields.
Electric fields are calculated using an imaging method. Fields from the conductors and their images in the ground plane are superimposed with the proper magnitude and phase to produce the total field at a selected location.
The total magnetic field is calculated from the vector summation of the fields from currents in all the transmission-line conductors. Balanced (equal) currents are assumed for each three-phase circuit; the contribution of induced image currents in the conductive earth is not included.
Electric and magnetic fields for the proposed line were calculated at the standard height (3.28 ft. or 1 m) above the ground (IEEE, 1994). Calculations were performed out to 300 ft. (91 m) from the centerline of the existing corridor. The validity and limitations of such calculations have been well verified by measurements. Because maximum voltage, maximum current, and minimum conductor height above-ground are used, the calculated values given here represent worst-case conditions: i.e., the calculated fields are higher than they would be in practice. Such worst-case conditions would seldom occur.
The corona performance of the proposed line was also predicted using the BPA Corona and Field Effects Program (USDOE, undated). Corona performance is calculated using empirical equations that have been developed over several years from the results of measurements on numerous high-voltage lines (Chartier and Stearns, 1981; Chartier, 1983). The validity of this approach for corona-generated audible noise has been demonstrated through comparisons with measurements on other lines all over the United States (IEEE Committee Report, 1982). The accuracy of this method for predicting corona-generated radio and television interference from transmission lines has also been established (Olsen et al., 1992). Important input parameters to the computer program are voltage, current, conductor size, and geometric configuration of the line.
Corona is a highly variable phenomenon that depends on conditions along a length of line. Predictions of the levels of corona effects are reported in statistical terms to account for this variability. Calculations of audible noise and electromagnetic interference levels were made under conditions of an estimated average operating voltage of 237 kV and with the average line height along a span of 38.5 ft. (11.7 m). Levels of audible noise, radio interference, and television interference are predicted for both fair and foul weather; however, corona is basically a foul-weather phenomenon. Wet conductors can occur during periods of rain, fog, snow, or icing. In the Rufus-Wasco area of the proposed route, such conditions are expected to occur about 6% of the time during a year based on hourly precipitation records from Moro, Oregon (near Wasco) during 2000 – 2004 (NOAA, 2005). Corona activity also increases with altitude. For purposes of evaluating corona effects from the proposed line, an altitude of 1500 ft. (460 m) was assumed.
2.0 Physical Description
2.1 Proposed Line
The proposed 230-kV transmission line would be a three-phase, double-circuit line placed on mostly tubular steel structures. (Some towers would be lattice steel construction, for example where the line changed direction. The double-circuit towers would have two sets of three phases arranged vertically on either side of the structure. Each set of phase wires comprises a circuit. Voltage and current waves are
KlondikeIII/Biglow Canyon Wind Integration Project Appendix C: Electrical Effects
Appendix C/3
displaced by 120° in time (one-third of a cycle) on each electrical phase. The maximum phase-to-phase voltage would be 242 kV; the average voltage would be 237 kV.
The line would be operated with the load from the Biglow Canyon project on one of the circuits and the load from the Klondike III project on the other. Initially the projected peak loads for the two circuits of the proposed line are: 400 megawatts (MW) for the Biglow Canyon circuit and 300 MW for the Klondike circuit. When the Orion project is completed the peak load on the Biglow Canyon circuit would increase to 600 MW. These loads correspond to an initial maximum current per phase of 974 A on the Biglow Canyon circuit, increasing to 1462 A with the addition of the Orion load, and 731 A on the Klondike circuit. The Orion project load could be added in the future and is only considered as a cumulative impact with the proposed project.
The load factor for wind power is 0.30 (average load = peak load x load factor). Thus, the average currents on each circuit would be 30 percent of the maximum values. BPA provided the physical and operating characteristics of the proposed line.
The electrical characteristics and physical dimensions for the proposed line configuration are shown in Figure 1, and summarized in Table 2. Each phase of the proposed 230-kV line would have one 1.6-inch (in.) (4.06-centimeter [cm]) diameter conductors (AAC: all aluminum conductors).
The horizontal phase spacing between the lower and upper conductor positions would be 19.0 ft. (5.79 m). Between the middle conductors, the horizontal spacing would be 31.0 ft. (9.45 m). The vertical spacing between the conductor positions would be 18.0 ft. (5.49 m). The spacing between conductor locations would vary slightly where special towers are used, such as at angle points along the line. Short sections of the proposed line where conductor locations would change, such as upon entry to a substation, were not analyzed.
Minimum conductor-to-ground clearance would be 26.5 ft. (8.08 m) at a conductor temperature of 212°F (100°C); clearances above ground would be greater under normal operating temperatures. The average clearance above ground along a span would be approximately 38.5 ft. (11.7 m); this value was used for corona calculations. At road crossings, the ground clearance would be at least 37.5 ft. (11.4 m). The final design of the proposed line could entail larger clearances. The right-of-way width for the proposed line would be 125 ft. (38.11 m).
The electrical phasing of the proposed line would be selected to ensure that BPA criteria for electric-field and audible-noise levels are met and to minimize magnetic field to the extent practical. The results reported here for fields and corona effects assume that the electrical phasing of the two circuits would be such as to place different electrical phases on the lower conductors of each circuit and on the upper conductors of each circuit. This phasing configuration tends to minimize the fields at ground level. During the design process, BPA will verify that any changes from the phasing described here continue to meet design criteria.
2.2 Existing Lines
There are no existing transmission lines parallel to the proposed routes.
Klondike III/Biglow Canyon Wind Integration Project Appendix C: Electrical Effects
Appendix C/4
3.0 Electric Field
3.1 Basic Concepts
An electric field is said to exist in a region of space if an electrical charge, at rest in that space, experiences a force of electrical origin (i.e., electric fields cause free charges to move). Electric field is a vector quantity: that is, it has both magnitude and direction. The direction corresponds to the direction that a positive charge would move in the field. Sources of electric fields are unbalanced electrical charges (positive or negative) and time-varying magnetic fields. Transmission lines, distribution lines, house wiring, and appliances generate electric fields in their vicinity because of unbalanced electrical charge on energized conductors. The unbalanced charge is associated with the voltage on the energized system. On the power system in North America, the voltage and charge on the energized conductors are cyclic (plus to minus to plus) at a rate of 60 times per second. This changing voltage results in electric fields near sources that are also time-varying at a frequency of 60 hertz (Hz; a frequency unit equivalent to cycles per second).
As noted earlier, electric fields are expressed in units of volts per meter (V/m) or kilovolts (thousands of volts) per meter (kV/m). Electric- and magnetic-field magnitudes in this report are expressed in root-mean-square (rms) units. For sinusoidal waves, the rms amplitude is given as the peak amplitude divided by the square root of two.
The spatial uniformity of an electric field depends on the source of the field and the distance from that source. On the ground, under a transmission line, the electric field is nearly constant in magnitude and direction over distances of several feet (1 meter). However, close to transmission- or distribution-line conductors, the field decreases rapidly with distance from the conductors. Similarly, near small sources such as appliances, the field is not uniform and falls off even more rapidly with distance from the device. If an energized conductor (source) is inside a grounded conducting enclosure, then the electric field outside the enclosure is zero, and the source is said to be shielded.
Electric fields interact with the charges in all matter, including living systems. When a conducting object, such as a vehicle or person, is located in a time-varying electric field near a transmission line, the external electric field exerts forces on the charges in the object, and electric fields and currents are induced in the object. If the object is grounded, then the total current induced in the body (the "short-circuit current") flows to earth. The distribution of the currents within, say, the human body, depends on the electrical conductivities of various parts of the body: for example, muscle and blood have higher conductivity than bone and would therefore experience higher currents.
At the boundary surface between air and the conducting object, the field both in the air and perpendicular to the conductor surface is much, much larger than the field in the conductor itself. For example, the average surface field on a human standing in a 10 kV/m field is 27 kV/m; the internal fields in the body are much smaller: approximately 0.008 V/m in the torso and 0.45 V/m in the ankles.
3.2 Transmission-line Electric Fields
The electric field created by a high-voltage transmission line extends from the energized conductors to other conducting objects such as the ground, towers, vegetation, buildings, vehicles, and people. The calculated strength of the electric field at a height of 3.28 ft. (1 m) above an unvegetated, flat earth is frequently used to describe the electric field under straight, parallel transmission lines. The most important transmission-line parameters that determine the electric field at a 1-m height are conductor height above ground and line voltage.
KlondikeIII/Biglow Canyon Wind Integration Project Appendix C: Electrical Effects
Appendix C/5
Calculations of electric fields from transmission lines are performed with computer programs based on well-known physical principles (cf., Deno and Zaffanella, 1982). The calculated values under these conditions represent an ideal situation. When practical conditions approach this ideal model, measurements and calculations agree. Often, however, conditions are far from ideal because of variable terrain and vegetation. In these cases, fields are calculated for ideal conditions, with the lowest conductor clearances to provide upper bounds on the electric field under the transmission lines. With the use of more complex models or empirical results, it is also possible to account accurately for variations in conductor height, topography, and changes in line direction. Because the fields from different sources add vectorially, it is possible to compute the fields from several different lines if the electrical and geometrical properties of the lines are known. However, in general, electric fields near transmission lines with vegetation below are highly complex and cannot be calculated. Measured fields in such situations are highly variable.
For evaluation of EMF from transmission lines, the fields must be calculated for a specific line condition. The NESC states the condition for evaluating electric-field-induced short-circuit current for lines with voltage above 98 kV, line-to-ground, as follows: conductors are at a minimum clearance from ground corresponding to a conductor temperature of 122°F (50°C), and at a maximum voltage (IEEE, 2002). BPA has supplied the information for calculating electric and magnetic fields from the proposed transmission line: the maximum operating voltage, the estimated peak currents, and the minimum conductor clearances. The minimum clearances (100°C) provided by BPA are lower than those specified in the NESC (50°C). If the fields under the lower BPA conductor clearances meet the NESC criterion, they will also meet the criterion at the NESC specified clearance.
There are standard techniques for measuring transmission-line electric fields (IEEE, 1994). Provided that the conditions at a measurement site closely approximate those of the ideal situation assumed for calculations, measurements of electric fields agree well with the calculated values. If the ideal conditions are not approximated, the measured field can differ substantially from calculated values. Usually the actual electric field at ground level is reduced from the calculated values by various common objects that act as shields.
Maximum or peak field values occur over a small area at midspan, where conductors are closest to the ground. As the location of an electric-field profile approaches a tower, the conductor clearance increases, and the peak field decreases. A grounded tower will reduce the electric field considerably, by shielding. Thus the assumption of minimum clearance results in peak (worst-case) fields that may be larger than what occur in practice.
For traditional transmission lines, such as the proposed line, where the right-of-way extends laterally well beyond the conductors, electric fields at the edge of the right-of-way are not as sensitive as the peak field to conductor height. Computed values at the edge of the right-of-way for any line height are fairly representative of what can be expected all along the transmission-line corridor. However, the presence of vegetation on and at the edge of the right-of-way will reduce actual electric-field levels below calculated values.
3.3 Calculated Values of Electric Fields
Table 3 shows the calculated values of electric field at 3.28 ft. (1 m) above ground for the proposed Klondike - John Day 230-kV transmission-line operated at maximum voltage. The peak value on the right-of-way and the value at the edge of the right-of-way are given for the proposed line at minimum conductor clearance and at the estimated average clearance over a span. Figure 2 shows lateral profiles for the electric field from the proposed line at the minimum and average line heights.
Klondike III/Biglow Canyon Wind Integration Project Appendix C: Electrical Effects
Appendix C/6
The calculated peak electric field expected on the right-of-way of the proposed line is 2.4 kV/m. For average clearance, the peak field would be 1.1 kV/m or less. As shown in Figure 2, the peak values would be present only at locations directly under the 230-kV line, near mid-span, where the conductors are at the minimum clearance. The conditions of minimum conductor clearance at maximum current and maximum voltage occur very infrequently. The calculated peak levels are rarely reached under real-life conditions, because the actual line height is generally above the minimum value used in the computer model, because the actual voltage is below the maximum value used in the model, and because vegetation within and near the edge of the right-of-way tends to shield the field at ground level. Maximum electric fields on existing 230-kV corridors are typically 2.5 to 3 kV/m. On 500-kV transmission line corridors, the maximum electric fields range from 7 to 9 kV/m.
The largest value expected at the edge of the right-of-way of the proposed line is 0.3 kV/m decreasing to about 0.2 kV/m opposite conductors at average clearance.
3.4 Environmental Electric Fields
The electric fields associated with the Klondike - John Day 230-kV line can be compared with those found in other environments. Sources of 60-Hz electric (and magnetic) fields exist everywhere electricity is used; levels of these fields in the modern environment vary over a wide range. Electric-field levels associated with the use of electrical energy are orders of magnitude greater than naturally occurring 60-Hz fields of about 0.0001 V/m, which stem from atmospheric and extraterrestrial sources.
Electric fields in outdoor, publicly accessible places range from less than 1 V/m to 12 kV/m; the large fields exist close to high-voltage transmission lines of 230 kV or higher. In remote areas without electrical service, 60-Hz field levels can be much lower than 1 V/m. Electric fields in home and work environments generally are not spatially uniform like those of transmission lines; therefore, care must be taken when making comparisons between fields from different sources such as appliances and electric lines. In addition, fields from all sources can be strongly modified by the presence of conducting objects. However, it is helpful to know the levels of electric fields generated in domestic and office environments in order to compare commonly experienced field levels with those near transmission lines.
Numerous measurements of residential electric fields have been reported for various parts of the United States, Canada, and Europe. Although there have been no large studies of residential electric fields, sufficient data are available to indicate field levels and characteristics. Measurements of domestic 60-Hz electric fields indicate that levels are highly variable and source-dependent. Electric-field levels are not easily predicted because walls and other objects act as shields, because conducting objects perturb the field, and because homes contain numerous localized sources. Internal sources (wiring, fixtures, and appliances) seem to predominate in producing electric fields inside houses. Average measured electric fields in residences are generally in the range of 5 to 20 V/m. In a large occupational exposure monitoring project that included electric-field measurements at homes, average exposures for all groups away from work were generally less than 10 V/m (Bracken, 1990).
Electric fields from household appliances are localized and decrease rapidly with distance from the source. Local electric fields measured at 1 ft. (0.3 m) from small household appliances are typically in the range of 30 to 60 V/m. Stopps and Janischewskyj (1979) reported electric-field measurements near 20 different appliances; at a 1-ft. (0.3-m) distance, fields ranged from 1 to 150 V/m, with a mean of 33 V/m. In another survey, reported by Deno and Zaffanella (1982), field measurements at a 1-ft. (0.3-m) distance from common domestic and workshop sources were found to range from 3 to 70 V/m. The localized fields from appliances are not uniform, and care should be taken in comparing them with transmission-line fields.
KlondikeIII/Biglow Canyon Wind Integration Project Appendix C: Electrical Effects
Appendix C/7
Electric blankets can generate higher localized electric fields. Sheppard and Eisenbud (1977) reported fields of 250 V/m at a distance of approximately 1 ft. (0.3 m). Florig et al. (1987) carried out extensive empirical and theoretical analysis of electric-field exposure from electric blankets and presented results in terms of uniform equivalent fields such as those near transmission lines. Depending on what parameter was chosen to represent intensity of exposure and the grounding status of the subject, the equivalent vertical 60-Hz electric-field exposure ranged from 20 to over 3500 V/m. The largest equivalent field corresponds to the measured field on the chest with the blanket-user grounded. The average field on the chest of an ungrounded blanket-user yields an equivalent vertical field of 960 V/m. As manufacturers have become aware of the controversy surrounding EMF exposures, electric blankets have been redesigned to reduce magnetic fields. However, electric fields from these “low field” blankets are still comparable with those from older designs (Bassen et al., 1991).
Generally, people in occupations not directly related to high-voltage equipment are exposed to electric fields comparable with those of residential exposures. For example, the average electric field measured in 14 commercial and retail locations in rural Wisconsin and Michigan was 4.8 V/m (ITT Research Institute, 1984). Median electric field was about 3.4 V/m. These values are about one-third the values in residences reported in the same study. Power-frequency electric fields near video display terminals (VTDs) are about 10 V/m, similar to those of other appliances (Harvey, 1983). Electric-field levels in public buildings such as shops, offices, and malls appear to be comparable with levels in residences.
In a survey of 1,882 volunteers from utilities, electric-field exposures were measured for 2,082 work days and 657 non-work days (Bracken, 1990). Electric-field exposures for occupations other than those directly related to high-voltage equipment were equivalent to those for non-work exposure.
Thus, except for the relatively few occupations where high-voltage sources are prevalent, electric fields encountered in the workplace are probably similar to those of residential exposures. Even in electric-utility occupations where high field sources are present, exposures to high fields are limited on average to minutes per day.
Electric fields found in publicly accessible areas near high-voltage transmission lines can typically range up to 3 kV/m for 230-kV lines, to 10 kV/m for 500-kV lines, and to 12 kV/m for 765-kV lines. Although these peak levels are considerably higher than the levels found in other public areas, they are present only in limited areas on rights-of-way.
The calculated electric fields for the proposed Klondike - John Day 230-kV transmission line are consistent with the levels reported for other 230-kV transmission lines in Oregon, Washington, and elsewhere. The electric fields on the right-of-way of the proposed transmission line, as calculated, would be much higher than levels normally encountered in residences and offices.
4.0 Magnetic Field
4.1 Basic Concepts
Magnetic fields can be characterized by the force they exert on a moving charge or on an electrical current. As with the electric field, the magnetic field is a vector quantity characterized by both magnitude and direction. Electrical currents generate magnetic fields. In the case of transmission lines, distribution lines, house wiring, and appliances, the 60-Hz electric current flowing in the conductors generates a time-varying, 60-Hz magnetic field in the vicinity of these sources. The strength of a magnetic field is measured in terms of magnetic lines of force per unit area, or magnetic flux density. The term “magnetic

Klondike III/Biglow Canyon Wind Integration Project Appendix C: Electrical Effects
Appendix C/8
field,” as used here, is synonymous with magnetic flux density and is expressed in units of Gauss (G) or milligauss (mG).
The uniformity of a magnetic field depends on the nature and proximity of the source, just as the uniformity of an electric field does. Transmission-line-generated magnetic fields are quite uniform over horizontal and vertical distances of several feet near the ground. However, for small sources such as appliances, the magnetic field decreases rapidly over distances comparable with the size of the device.
The interaction of a time-varying magnetic field with conducting objects results in induced electric field and currents in the object. A changing magnetic field through an area generates a voltage around any conducting loop enclosing the area (Faraday's law). This is the physical basis for the operation of an electrical transformer. For a time-varying sinusoidal magnetic field, the magnitude of the induced voltage around the loop is proportional to the area of the loop, the frequency of the field, and the magnitude of the field. The induced voltage around the loop results in an induced electric field and current flow in the loop material. The induced current that flows in the loop depends on the conductivity of the loop.
4.2 Transmission-line Magnetic Fields
The magnetic field generated by currents on transmission-line conductors extends from the conductors through the air and into the ground. The magnitude of the field at a height of 3.28 ft. (1 m) is frequently used to describe the magnetic field under transmission lines. Because the magnetic field is not affected by non-ferrous materials, the field is not influenced by normal objects on the ground under the line. The direction of the maximum field varies with location. (The electric field, by contrast, is essentially vertical near the ground.) The most important transmission-line parameters that determine the magnetic field at 3.28 ft. (1 m) height are conductor height above ground and magnitude of the currents flowing in the conductors. As distance from the transmission-line conductors increases, the magnetic field decreases.
Calculations of magnetic fields from transmission lines are performed using well-known physical principles (cf., Deno and Zaffanella, 1982). The calculated values usually represent the ideal straight parallel-conductor configuration. For simplicity, a flat earth is usually assumed. Balanced currents (currents of the same magnitude for each phase) are also assumed. This is usually valid for transmission lines, where loads on all three phases are maintained in balance during operation. Induced image currents in the earth are usually ignored for calculations of magnetic field under or near the right-of-way. The resulting error is negligible. Only at distances greater than 300 ft. (91 m) from a line do such contributions become significant (Deno and Zaffanella, 1982). The clearance for magnetic-field calculations for the proposed line was the same as that used for electric-field evaluations.
Standard techniques for measuring magnetic fields near transmission lines are described in ANSI IEEE Standard No. 644-1994 (IEEE, 1994). Measured magnetic fields agree well with calculated values, provided the currents and line heights that go into the calculation correspond to the actual values for the line. To realize such agreement, it is necessary to get accurate current readings during field measurements (because currents on transmission lines can vary considerably over short periods of time) and also to account for all field sources in the vicinity of the measurements.
As with electric fields, the maximum or peak magnetic fields occur in areas near the centerline and at midspan where the conductors are the lowest. The magnetic field at the edge of the right-of-way is not very dependent on line height. For a double-circuit line or if more than one line is present, the peak field will depend on the relative electrical phasing of the conductors and the direction of power flow.
KlondikeIII/Biglow Canyon Wind Integration Project Appendix C: Electrical Effects
Appendix C/9
4.3 Calculated Values for Magnetic Fields
Table 4 gives the calculated values of the magnetic field at 3.28 ft. (1 m) height for the proposed Klondike – John Day 230-kV double-circuit transmission line. Field values on the right-of-way and at the edge of the right-of-way are given for projected maximum currents, for minimum and average conductor clearances. The maximum currents for the Biglow Canyon circuit and Klondike circuit are given in Table 2. The maximum current on the Biglow Canyon circuit is 974 A initially and 1462 A after the Orion load is added. The maximum current on the Klondike circuit is 731 A. Power on both circuits is assumed to flow from Klondike to John Day and the phasing of the conductors is selected to be different on the lower phases to produce minimum electric and magnetic fields.
The actual magnetic-field levels would vary, as currents on the lines change daily and seasonally and as ambient temperature changes. Average currents over the year would be about 30% of the maximum values. The levels shown in the figures represent the highest magnetic fields expected for the proposed Klondike - John Day 230-kV line. Average fields over a year would be considerably reduced from the peak values, as a result of reduced average currents and increased clearances above the minimum value due to conductor temperatures less than the design value of 100 C°.
Figure 3 shows lateral profiles of the magnetic field under maximum current and minimum clearance conditions for the proposed 230-kV transmission line. A field profile for average height under maximum current conditions is also included in Figure 3.
For the proposed 230-kV line, the maximum calculated 60-Hz magnetic field expected at 3.28 ft. (1 m) above ground is 128 mG for a minimum conductor height of 26.5 ft. (8.1 m). This field is calculated for maximum currents of 974 and 731 A on the Biglow Canyon and Klondike circuits, respectively. The maximum field would decrease for increased conductor clearance. For the average conductor height over a span of 38.5 ft. (11.7 m), the maximum field would be 57 mG.
For maximum currents in both circuits and minimum clearance conditions, the calculated magnetic fields at the edges of the 125-foot (38.1-m) right-of-way are 24 mG on the edge adjacent to the Biglow Canyon circuit and 12 mG adjacent to the Klondike circuit. For average conductor height the fields at the edge of the right-of-way are 19 and 10 mG for the Biglow Canyon and Klondike sides of the line, respectively.
With the Klondike circuit out of service (0 A), the fields from the two circuits would no longer cancel. In this case the maximum field due to the Biglow Canyon circuit alone would be 150 mG at the peak location on the right-of-way and 44 mG at the edge of the right-of-way.
All of these magnetic field levels averaged over a year would be about 30-percent of the above values. Thus, averaged over the year the maximum levels at the respective edges of the right-of-way would be about 7 and 4 mG.
4.4 Environmental Magnetic Fields
Transmission lines are not the only source of magnetic fields; as with 60-Hz electric fields, 60-Hz magnetic fields are present throughout the environment of a society that relies on electricity as a principal energy source. The magnetic fields associated with the proposed Klondike - John Day 230-kV line can be compared with fields from other sources. The range of 60-Hz magnetic-field exposures in publicly accessible locations such as open spaces, transmission-line rights-of-way, streets, pedestrian walkways, parks, shopping malls, parking lots, shops, hotels, public transportation, and so on range from less than 0.1 mG to about 1 G, with the highest values occurring near small appliances with electric motors. In occupational settings in electric utilities, where high currents are present, magnetic-field exposures for
Klondike III/Biglow Canyon Wind Integration Project Appendix C: Electrical Effects
Appendix C/10
workers can be above 1 G. At 60 Hz, the magnitude of the natural magnetic field is approximately 0.0005 mG.
Several investigations of residential fields have been conducted. In a large study to identify and quantify significant sources of 60-Hz magnetic fields in residences, measurements were made in 996 houses, randomly selected throughout the country (Zaffanella, 1993). The most common sources of residential fields were power lines, the grounding system of residences, and appliances. Field levels were characterized by both point-in-time (spot) measurements and 24-hour measurements. Spot measurements averaged over all rooms in a house exceeded 0.6 mG in 50% of the houses and 2.9 mG in 5% of houses. Power lines generally produced the largest average fields in a house over a 24-hour period. On the other hand, grounding system currents proved to be a more significant source of the highest fields in a house. Appliances were found to produce the highest local fields; however, fields fell off rapidly with increased distance. For example, the median field near microwave ovens was 36.9 mG at a distance of 10.5 in. (0.27 m) and 2.1 mG at 46 in. (1.17 m). Across the entire sample of 996 houses, higher magnetic fields were found in, among others, urban areas (vs. rural); multi-unit dwellings (vs. single-family); old houses (vs. new); and houses with grounding to a municipal water system.
In an extensive measurement project to characterize the magnetic-field exposure of the general population, over 1000 randomly selected persons in the United States wore a personal exposure meter for 24 hours and recorded their location in a simple diary (Zaffanella and Kalton, 1998). Based on the measurements of 853 persons, the estimated 24-hour average exposure for the general population is 1.24 mG and the estimated median exposure is 0.88 mG. The average field “at home, not in bed” is 1.27 mG and “at home, in bed” is 1.11 mG. Average personal exposures were found to be highest “at work” (mean of 1.79 mG and median of 1.01 mG) and lowest “at home, in bed” (mean of 1.11 mG and median of 0.49 mG). Average fields in school were also low (mean of 0.88 mG and median of 0.69 mG). Factors associated with higher exposures at home were smaller residences, duplexes and apartments, metallic rather than plastic water pipes, and nearby overhead distribution lines.
As noted above, magnetic fields from appliances are localized and decrease rapidly with distance from the source. Localized 60-Hz magnetic fields have been measured near about 100 household appliances such as ranges, refrigerators, electric drills, food mixers, and shavers (Gauger, 1985). At a distance of 1 ft. (0.3 m), the maximum magnetic field ranged from 0.3 to 270 mG, with 95% of the measurements below 100 mG. Ninety-five percent of the levels at a distance of 4.9 ft. (1.5 m) were less than 1 mG. Devices that use light-weight, high-torque motors with little magnetic shielding exhibited the largest fields. These included vacuum cleaners and small hand-held appliances and tools. Microwave ovens with large power transformers also exhibited relatively large fields. Electric blankets have been a much-studied source of magnetic-field exposure because of the length of time they are used and because of the close proximity to the body. Florig and Hoburg (1988) estimated that the average magnetic field in a person using an electric blanket was 15 mG, and that the maximum field could be 100 mG. New "low-field" blankets have magnetic fields at least 10 times lower than those from conventional blankets (Bassen et al., 1991).
In a domestic magnetic-field survey, Silva et al. (1989) measured fields near different appliances at locations typifying normal use (e.g., sitting at an electric typewriter or standing at a stove). Specific appliances with relatively large fields included can openers (n = 9), with typical fields ranging from 30 to 225 mG and a maximum value up to 2.7 G; shavers (n = 4), with typical fields from 50 to 300 mG and maximum fields up to 6.9 G; and electric drills (n = 2), with typical fields from 56 to 190 mG and maximum fields up to 1.5 G. The fields from such appliances fall off very rapidly with distance and are only present for short periods. Thus, although instantaneous magnetic-field levels close to small hand-held appliances can be quite large, they do not contribute to average area levels in residences.
KlondikeIII/Biglow Canyon Wind Integration Project Appendix C: Electrical Effects
Appendix C/11
In a study with 162 subjects, Mezei et al. (2001) employed magnetic-field exposure measurements, simultaneous record-keeping of appliance proximity, and an appliance-use questionnaire to investigate the contributions of appliances to overall exposure. They found that individual appliance use did not contribute significantly to time-weighted-average exposure, unless the use was prolonged during the day of measurements. For example, approximately 16% of exposure accumulated during periods when a subject was using a computer. For all subjects exposure during computer use accounted for on-average 9% of total exposure. Cell phones were identified as another source of relatively low fields and long use times that could contribute to overall exposure. Use of other small appliances did not contribute significantly to accumulated exposure but did contribute to the relatively short periods when high-field exposures were observed.
Although studies of residential magnetic fields have not all considered the same independent parameters, the following consistent characterization of residential magnetic fields emerges from the data:
(1) External sources play a large role in determining residential magnetic-field levels. Transmission lines, when nearby, are an important external source. Unbalanced ground currents on neutral conductors and other conductors, such as water pipes in and near a house, can represent a significant source of magnetic field. Distribution lines per se, unless they are quite close to a residence, do not appear to be a traditional distance-dependent source.
(2) Homes with overhead electrical service appear to have higher average fields than those with underground service.
(3) Appliances represent a localized source of magnetic fields that can be much higher than average or area fields. However, fields from appliances approach area levels at distances greater than 3.28 ft. (1 m) from the device.
Although important variables in determining residential magnetic fields have been identified, quantification and modeling of their influence on fields at specific locations is not yet possible. However, a general characterization of residential magnetic-field level is possible: average levels in the United States are in the range of 0.5 to 1.0 mG, with the average field in a small number of homes exceeding this range by as much as a factor of 10 or more. Average personal exposure levels are slightly higher, possibly due to use of appliances and varying distances to other sources. Maximum fields can be much higher.
Magnetic fields in commercial and retail locations are comparable with those in residences. As with appliances, certain equipment or machines can be a local source of higher magnetic fields. Utility workers who work close to transformers, generators, cables, transmission lines, and distribution systems clearly experience high-level fields. Other sources of fields in the workplace include motors, welding machines, computers, and video display terminals (VDTs). In publicly accessible indoor areas, such as offices and stores, field levels are generally comparable with residential levels, unless a high-current source is nearby.
Because high-current sources of magnetic field are more prevalent than high-voltage sources, occupational environments with relatively high magnetic fields encompass a more diverse set of occupations than do those with high electric fields. For example, in occupational magnetic-field measurements reported by Bowman et al. (1988), the geometric mean field from 105 measurements of magnetic field in "electrical worker" job locations was 5.0 mG. "Electrical worker" environments showed the following elevated magnetic-field levels (geometric mean greater than 20 mG): industrial power supplies, alternating current (ac) welding machines, and sputtering systems for electronic assembly. For secretaries in the same study, the geometric mean field was 3.1 mG for those using VDTs (n = 6) and 1.1 mG for those not using VDTs (n = 3).
Klondike III/Biglow Canyon Wind Integration Project Appendix C: Electrical Effects
Appendix C/12
Measurements of personal exposure to magnetic fields were made for 1,882 volunteer utility workers for a total of 4,411 workdays (Bracken, 1990). Median workday mean exposures ranged from 0.5 mG for clerical workers without computers to 7.2 mG for substation operators. Occupations not specifically associated with transmission and distribution facilities had median workday exposures less than 1.5 mG, while those associated with such facilities had median exposures above 2.3 mG. Magnetic-field exposures measured in homes during this study were comparable with those recorded in offices.
Magnetic fields in publicly accessible outdoor areas seem to be, as expected, directly related to proximity to electric-power transmission and distribution facilities. Near such facilities, magnetic fields are generally higher than indoors (residential). Higher-voltage facilities tend to have higher fields. Typical maximum magnetic fields in publicly accessible areas near transmission facilities can range from less than a few milligauss up to 300 mG or more, near heavily loaded lines operated at 230 to 765 kV. The levels depend on the line load, conductor height, and location on the right-of-way. Because magnetic fields near high-voltage transmission lines depend on the current in the line, they can vary daily and seasonally. To characterize fields from the distribution system, Heroux (1987) measured 60-Hz magnetic fields with a mobile platform along 140 mi. (223 km) of roads in Montreal. The median field level averaged over nine different routes was 1.6 mG, with 90% of the measurements less than about 5.1 mG. Spot measurements indicated that typical fields directly above underground distribution systems were 5 to 19 mG. Beneath overhead distribution lines, typical fields were 1.5 to 5 mG on the primary side of the transformer, and 4 to 10 mG on the secondary side. Near ground-based transformers used in residential areas, fields were 80 to 1000 mG at the surface and 10 to 100 mG at a distance of 1 ft. (0.3 m).
The magnetic fields from the proposed line would be comparable to or less than those from existing 230-kV lines in Oregon, Washington, and elsewhere. On and near the right-of-way of the proposed line, magnetic fields would be above average residential levels. However, the fields from the line would decrease rapidly and approach common ambient levels (1 mG) at a distance of about 200 feet from the edge of the right-of-way under maximum current conditions and at about 100 feet from the edge under average current conditions. Furthermore, the fields at the edge of the right-of-way would not be above those encountered during normal activities near common sources such as hand-held appliances.
5.0 Electric and Magnetic Field (EMF) Effects
Possible effects associated with the interaction of EMF from transmission lines with people on and near a right-of-way fall into two categories: short-term effects that can be perceived and may represent a nuisance, and possible long-term health effects. Only short-term effects are discussed here. The issue of whether there are long-term health effects associated with transmission-line fields is controversial. In recent years, considerable research on possible biological effects of EMF has been conducted. A review of these studies and their implications for health-related effects is provided in a separate technical report for the environmental assessment for the proposed Klondike - John Day 230-kV transmission line.
5.1 Electric Fields: Short-term Effects
Short-term effects from transmission-line electric fields are associated with perception of induced currents and voltages or perception of the field. Induced current or spark discharge shocks can be experienced under certain conditions when a person contacts objects in an electric field. Such effects occur in the fields associated with transmission lines that have voltages of 230-kV or higher. These effects could occur infrequently under the proposed Klondike - John Day 230-kV line.
Steady-state currents are those that flow continuously after a person contacts an object and provides a path to ground for the induced current. The amplitude of the steady-state current depends on the induced
KlondikeIII/Biglow Canyon Wind Integration Project Appendix C: Electrical Effects
Appendix C/13
current to the object in question and on the grounding path. The magnitude of the induced current to vehicles and objects under the proposed line will depend on the electric-field strength and the size and shape of the object. When an object is electrically grounded, the voltage on the object is reduced to zero, and it is not a source of current or voltage shocks. If the object is poorly grounded or not grounded at all, then it acquires some voltage relative to earth and is a possible source of current or voltage shocks.
The responses of persons to steady-state current shocks have been extensively studied, and levels of response documented (Keesey and Letcher, 1969; IEEE, 1978). Primary shocks are those that can result in direct physiological harm. Such shocks will not be possible from induced currents under the existing or proposed lines, because clearances above ground required by the NESC preclude such shocks from large vehicles and grounding practices eliminate large stationary objects as sources of such shocks.
Secondary shocks are defined as those that could cause an involuntary and potentially harmful movement, but no direct physiological harm. Secondary shocks could occur under the proposed 230-kV line when making contact with ungrounded conducting objects such as large vehicles or equipment. However, such occurrences are anticipated to be very infrequent. Shocks, when they occur under the 230-kV line, are most likely to be below the nuisance level. Induced currents would not be perceived off the right-of-way.
Induced currents are always present in electric fields under transmission lines and will be present near the proposed line. However, during initial construction, it is BPA policy to ground metal objects, such as fences, that are located on the right-of-way. The grounding eliminates these objects as sources of induced current and voltage shocks. Multiple grounding points are used to provide redundant paths for induced current flow. After construction, BPA would respond to any complaints and install or repair grounding to mitigate nuisance shocks.
Unlike fences or buildings, mobile objects such as vehicles and farm machinery cannot be grounded permanently. Limiting the possibility of induced currents from such objects to persons is accomplished in several ways. First, required clearances for above-ground conductors tend to limit field strengths to levels that do not represent a hazard or nuisance. The NESC (IEEE, 2002) requires that, for lines with voltage exceeding 98 kV line-to-ground (170 kV line-to-line), sufficient conductor clearance be maintained to limit the induced short-circuit current in the largest anticipated vehicle under the line to 5 milliamperes (mA) or less. This can be accomplished by limiting access or by increasing conductor clearances in areas where large vehicles could be present. BPA and other utilities design and operate lines to be in compliance with the NESC.
For the proposed line, conductor clearances (100°C) would be increased to at least 37.5 ft. (11.4 m) over major road crossings along the route, resulting in a maximum field of 1.2 kV/m or less at the 3.28 ft. (1 m) height. The largest truck allowed on roads in Oregon without a special permit is 14 ft. high by 8.5 ft. wide by 75 ft. long (4.3 x 2.6 x 22.9 m). The induced currents to such a vehicle oriented perpendicular to the line in a maximum field of 1.2 kV/m (at 3.28-ft. height) would be less than 1.2 mA (Reilly, 1979). For smaller trucks, the maximum induced currents for perpendicular orientation to the proposed line would be less than this value. (Larger special-permitted trucks, such as triple trailers, can be up to 105 feet in length. However, because they average the field over such a long distance, the maximum induced current to a 105-ft. vehicle oriented perpendicular to the 230-kV line at a road crossing would be less than that for the 75-foot truck.) These large vehicles are not anticipated to be off highways on the right-of-way or oriented parallel and directly under the proposed line. Thus, the NESC 5-mA criterion would be met for road crossings of the proposed line. In accordance with the NESC, line clearances would also be increased over other areas, such as over railroads, orchards and water areas suitable for sailboating.
The computed induced currents at road crossings are for worst-case conditions that occur rarely. Several factors tend to reduce the levels of induced current shocks from vehicles at road crossings and elsewhere:
Klondike III/Biglow Canyon Wind Integration Project Appendix C: Electrical Effects
Appendix C/14
(1) Activities are distributed over the whole right-of-way, and only a small percentage of time is spent in areas where the field is at or close to the maximum value.
(2) At road crossings, vehicles are aligned perpendicular to the conductors, resulting in a substantial reduction in induced current.
(3) The conductor clearance at road crossings may not be at minimum values because of lower conductor temperatures and/or location of the road crossing away from midspan.
(4) The largest vehicles are permitted only on certain highways.
(5) Off-road vehicles are in contact with soil or vegetation, which reduces shock currents substantially.
Induced voltages occur on objects, such as vehicles, in an electric field where there is an inadequate electrical ground. If the voltage is sufficiently high, then a spark discharge shock can occur as contact is made with the object. Such shocks are similar to "carpet" shocks that occur, for example, when a person touches a doorknob after walking across a carpet on a dry day. The number and severity of spark discharge shocks depend on electric-field strength and generally of concern under lines with voltages of 345-kV or higher. Nuisance shocks, which are primarily spark discharges, are not anticipated to be a problem under the proposed line.
In electric fields higher than those that would occur under the proposed line, it is theoretically possible for a spark discharge from the induced voltage on a large vehicle to ignite gasoline vapor during refueling. The probability for exactly the right conditions for ignition to occur is extremely remote. The additional clearance of conductors provided at road crossings reduces the electric field in areas where vehicles are prevalent and reduces the chances for such events. Even so, BPA recommends that vehicles should not be refueled under the proposed line unless specific precautions are taken to ground the vehicle and the fueling source (USDOE, 1995).
Under certain conditions, the electric field can be perceived through hair movement on an upraised hand or arm of a person standing on the ground under high-voltage transmission lines. The median field for perception in this manner was 7 kV/m for 136 persons; only about 12% could perceive fields of 2 kV/m or less (Deno and Zaffanella, 1982). In limited areas under the conductors at midspan, the fields at ground level would exceed the levels where field perception can occur. However it is unlikely that field perception would be common under the proposed 230-kV line because fields would generally be below the perception level. Where vegetation provides shielding, the field would not be perceived.
Conductive shielding reduces both the electric field and induced effects such as shocks. Persons inside a vehicle cab or canopy are shielded from the electric field. Similarly, a row of trees or a lower-voltage distribution line reduces the field on the ground in the vicinity. Metal pipes, wiring, and other conductors in a residence or building shield the interior from the transmission-line electric field.
The electric fields from the proposed 230-kV line would be comparable to or less than those from existing 230-kV lines in the project area and elsewhere. Potential impacts of electric fields can be mitigated through grounding policies and adherence to the NESC. Worst-case levels are used for safety analyses but, in practice, induced currents and voltages are reduced considerably by unintentional grounding. Shielding by conducting objects, such as vehicles and vegetation, also reduces the potential for electric-field effects.
KlondikeIII/Biglow Canyon Wind Integration Project Appendix C: Electrical Effects
Appendix C/15
5.2 Magnetic Field: Short-term Effects
Magnetic fields associated with transmission and distribution systems can induce voltage and current in long conducting objects that are parallel to the transmission line. As with electric-field induction, these induced voltages and currents are a potential source of shocks. A fence, irrigation pipe, pipeline, electrical distribution line, or telephone line forms a conducting loop when it is grounded at both ends. The earth forms the other portion of the loop. The magnetic field from a transmission line can induce a current to flow in such a loop if it is oriented parallel to the line. If only one end of the fence is grounded, then an induced voltage appears across the open end of the loop. The possibility for a shock exists if a person closes the loop at the open end by contacting both the ground and the conductor. The magnitude of this potential shock depends on the following factors: the magnitude of the field; the length of the object (the longer the object, the larger the induced voltage); the orientation of the object with respect to the transmission line (parallel as opposed to perpendicular, where no induction would occur); and the amount of electrical resistance in the loop (high resistance limits the current flow).
Magnetically induced currents from power lines have been investigated for many years; calculation methods and mitigating measures are available. A comprehensive study of gas pipelines near transmission lines developed prediction methods and mitigation techniques specifically for induced voltages on pipelines (Dabkowski and Taflove, 1979; Taflove and Dabkowski, 1979). Similar techniques and procedures are available for irrigation pipes and fences. Grounding policies employed by utilities for long fences reduce the potential magnitude of induced voltage.
The magnitude of the coupling with both pipes and fences is very dependent on the electrical unbalance (unequal currents) among the three phases of the line. Thus, a distribution line where a phase outage may go unnoticed for long periods of time can represent a larger source of induced currents than a transmission line where the loads are well-balanced (Jaffa and Stewart, 1981).
Knowledge of the phenomenon, grounding practices, and the availability of mitigation measures mean that magnetic-induction effects from the proposed 230-kV transmission line would be minimal.
Magnetic fields from transmission and distribution facilities can interfere with certain electronic equipment. Magnetic fields can cause distortion of the image on older style VDTs and computer monitors (cathode-ray tubes). The threshold field for interference depends on the type and size of monitor and the frequency of the field. Interference has been observed for certain monitors at fields at or below 10 mG (Baishiki et al., 1990; Banfai et al., 2000). The problem typically arises when computer monitors are in use near electrical distribution or transmission facilities or near the distribution system in large office buildings. Under peak current conditions fields from the proposed line would fall below this level from the edge of the right of way to about 30 ft. (9 m) beyond the right of way depending on line height. For average current conditions the field at the edge of the right-of-way and beyond would be below the 10 mG level where interference can occur.
Interference from magnetic fields does not occur for flat-screen monitors, such as used in laptop computers. If interference does occur for an older monitor, it can be eliminated by shielding the affected monitor or moving it to an area with lower fields. Similar mitigation methods could be applied to other sensitive electronics, if necessary. Interference from 60-Hz fields with computers and control circuits in vehicles and other equipment is not anticipated at the field levels found under and near the proposed 230-kV transmission line.
Klondike III/Biglow Canyon Wind Integration Project Appendix C: Electrical Effects
Appendix C/16
6.0 Regulations
Regulations that apply to transmission-line electric and magnetic fields fall into two categories. Safety standards or codes are intended to limit or eliminate electric shocks that could seriously injure or kill persons. Field limits or guidelines are intended to limit electric- and magnetic-field exposures that can cause nuisance shocks or that might cause health effects. In no case has a limit or standard been established because of a known or demonstrated health effect.
The proposed line would be designed to meet the NESC (IEEE, 2002a), which specifies how far transmission-line conductors must be from the ground and other objects. The clearances specified in the code provide safe distances that prevent harmful shocks to workers and the public. In addition, people who live and work near transmission lines must be aware of safety precautions to avoid electrical (which is not necessarily physical) contact with the conductors. For example, farmers should not up-end irrigation pipes under a transmission or other electrical line or direct the water stream from an irrigation system into or near the conductors. In addition, as a matter of safety, the NESC specifies that electric-field-induced currents from transmission lines must be below the 5 mA (“let go”) threshold deemed a lower limit for primary shock. BPA publishes and distributes a brochure that describes safe practices to protect against shock hazards around power lines (USDOE, 1995).
Field limits or guidelines have been adopted in several states and countries and by national and international organizations. Electric-field limits have generally been based on minimizing nuisance shocks or field perception. In some cases, such as the state limits in Table 5, the intent of magnetic-field limits has been to limit exposures to existing levels, given the uncertainty of their potential for health effects. In the case of international standard or guideline setting organizations, magnetic field limits have been based on thresholds for possible effects from induced internal currents or electric fields (ICNIRP, 1998; IEEE, 2002b).
There are currently no national standards in the United States for 60-Hz electric and magnetic fields. Oregon's formal rule in its transmission-line-siting procedures specifically addresses field limits. The Oregon limit of 9 kV/m for electric fields is applied to areas accessible to the public (Oregon, State of, 1980). The Oregon rule also addresses grounding practices, audible noise, and radio interference. Oregon does not have a limit for magnetic fields from transmission lines.
Besides Oregon, several states have been active in establishing mandatory or suggested limits on 60-Hz electric and (in two cases) magnetic fields. Five other states have specific electric-field limits that apply to transmission lines: Florida, Minnesota, Montana, New Jersey, and New York. Florida and New York have established regulations for magnetic fields. These regulations are summarized in Table 5, adapted from TDHS Report (1989).
Government agencies and utilities operating transmission systems have established design criteria that include EMF levels. BPA has maximum allowable electric fields of 9 and 5 kV/m on and at the edge of the right-of-way, respectively (USDOE, 1996). BPA also has maximum-allowable electric-field strengths of 5 kV/m, 3.5 kV/m, and 2.5 kV/m for road crossings, shopping center parking lots, and commercial/ industrial parking lots, respectively. These levels are based on limiting the maximum short-circuit currents from anticipated vehicles to less than 1 mA in shopping center lots and to less than 2 mA in commercial parking lots.
Electric-field limits for overhead power lines have also been established in other countries (Maddock, 1992). Limits for magnetic fields from overhead power lines have not been explicitly established anywhere except in Florida and New York (see Table 5). However, general guidelines and limits on EMF
KlondikeIII/Biglow Canyon Wind Integration Project Appendix C: Electrical Effects
Appendix C/17
have been established for occupational and public exposure in several countries and by national and international organizations.
The American Conference of Governmental Industrial Hygienists (ACGIH) sets guidelines (Threshold Limit Values® or TLV®) for occupational exposures to environmental agents (ACGIH, 2000). In general, a TLV represents the level below which it is believed that nearly all workers may be exposed repeatedly without adverse health effects. For EMF, the TLVs represent ceiling levels. For 60-Hz electric fields, occupational exposures should not exceed the TLV of 25 kV/m. However, the ACGIH also recognizes the potential for startle reactions from spark discharges and short-circuit currents in fields greater than 5-7 kV/m, and recommends implementing grounding practices. They recommend the use of conductive clothing for work in fields exceeding 15 kV/m. The TLV for occupational exposure to 60-Hz magnetic fields is a ceiling level of 10 G (10,000 mG) (ACGIH, 2000).
Electric and magnetic fields from various sources (including automobile ignitions, appliances and, possibly, transmission lines) can interfere with implanted cardiac pacemakers. In light of this potential problem, manufacturers design devices to be immune from such interference. However, research has shown that these efforts have not been completely successful and that a few older models of pacemakers could be affected by 60-Hz fields from transmission lines. There were also numerous models of pacemakers that were not affected by fields even larger than those found under transmission lines. Because of the known potential for interference with pacemakers by 60-Hz fields, field limits for pacemaker wearers have been established by the ACGIH. They recommend that wearers of pacemakers and similar medical-assist devices limit their exposure to electric fields of 1 kV/m or less and to magnetic fields to 1 G (1,000 mG) or less (ACGIH, 2000).
The International Committee on Non-ionizing Radiation Protection (ICNIRP), working in cooperation with the World Health Organization (WHO), has developed guidelines for occupational and public exposures to EMF (ICNIRP, 1998). For occupational exposures at 60 Hz, the recommended limits to exposure are 8.3 kV/m for electric fields and 4.2 G (4,200 mG) for magnetic fields. The electric-field level can be exceeded, provided precautions are taken to prevent spark discharge and induced current shocks. For the general public, the ICNIRP guidelines recommend exposure limits of 4.2 kV/m for electric fields and 0.83 G (830 mG) for magnetic fields (ICNIRP, 1998).
ICNIRP has also established guidelines for contact currents, which could occur when a grounded person contacts an ungrounded object in an electric field. The guideline levels are 1.0 mA for occupational exposure and 0.5 mA for public exposure.
The Institute of Electrical and Electronic Engineers (IEEE, 2002b) has also set limits for occupational and public exposure to electric and magnetic fields and to contact currents. The magnetic-field limits are based on an extensive assessment of possible neurological responses to magnetic field exposures. The limit for public exposure to 60-Hz magnetic fields are 9,040 mG.
The IEEE electric-field limits are based on thresholds for possible reactions to perceivable spark discharges that occur in electric fields. The limits for public exposure to electric fields are 5 kV/m except on power line rights-of-way, where the limit is 10 kV/m. The current limit for the general public is 0.5 mA for a touch contact.
The electric fields from the proposed 230-kV transmission line would meet the ACGIH, ICNIRP, and IEEE standards, provided wearers of pacemakers and similar medical-assist devices are discouraged from unshielded right-of-way use. (A passenger in an automobile under the line would be shielded from the electric field.) The magnetic fields from the proposed line would be below the ACGIH occupational limits, and well as below those of ICNIRP and IEEE for occupational and public exposures. The electric

Klondike III/Biglow Canyon Wind Integration Project Appendix C: Electrical Effects
Appendix C/18
fields present on the right-of-way could induce currents in ungrounded vehicles that exceeded the ICNIRP and IEEE levels of 0.5 mA.
The estimated peak electric fields on the right-of-way of the proposed transmission line would meet the limits of all states. (see Table 5). The BPA electric field criteria would be met by the proposed line. for all configurations of the proposed line. The edge-of-right-of-way electric fields from the proposed line would be below the edge-of-right-of-way limits set by all states. The magnetic field at the edge of the right-of-way from the proposed line would be below the regulatory levels of states where such regulations exist.
7.0 Audible Noise
7.1 Basic Concepts
Audible noise (AN), as defined here, represents an unwanted sound, as from a transmission line, transformer, airport, or vehicle traffic. Sound is a pressure wave caused by a sound source vibrating or displacing air. The ear converts the pressure fluctuations into auditory sensations. AN from a source is superimposed on the background or ambient noise that is present before the source is introduced.
The amplitude of a sound wave is the incremental pressure resulting from sound above atmospheric pressure. The sound-pressure level is the fundamental measure of AN; it is generally measured on a logarithmic scale with respect to a reference pressure. The sound-pressure level (SPL) in decibels (dB) is given by:
SPL = 20 log (P/Po)dB
where P is the effective rms (root-mean-square) sound pressure, Po is the reference pressure, and the logarithm (log) is to the base 10. The reference pressure for measurements concerned with hearing is usually taken as 20 micropascals (Pa), which is the approximate threshold of hearing for the human ear. A logarithmic scale is used to encompass the wide range of sound levels present in the environment. The range of human hearing is from 0 dB up to about 140 dB, a ratio of 10 million in pressure (EPA, 1978).
Logarithmic scales, such as the decibel scale, are not directly additive: to combine decibel levels, the dB values must be converted back to their respective equivalent pressure values, the total rms pressure level found, and the dB value of the total recalculated. For example, adding two sounds of equal level on the dB scale results in a 3 dB increase in sound level. Such an increase in sound pressure level of 3 dB, which corresponds to a doubling of the energy in the sound wave, is barely discernible by the human ear. It requires an increase of about 10 dB in SPL to produce a subjective doubling of sound level for humans. The upper range of hearing for humans (140 dB) corresponds to a sharply painful response (EPA, 1978).
Humans respond to sounds in the frequency range of 16 to 20,000 Hz. The human response depends on frequency, with the most sensitive range roughly between 2000 and 4000 Hz. The frequency-dependent sensitivity is reflected in various weighting scales for measuring audible noise. The A-weighted scale weights the various frequency components of a noise in approximately the same way that the human ear responds. This scale is generally used to measure and describe levels of environmental sounds such as those from vehicles or occupational sources. The A-weighted scale is also used to characterize transmission-line noise. Sound levels measured on the A-scale are expressed in units of dB(A) or dBA.
AN levels and, in particular, corona-generated audible noise (see below) vary in time. In order to account for fluctuating sound levels, statistical descriptors have been developed for environmental noise. Exceedence levels (L levels) refer to the A-weighted sound level that is exceeded for a specified
KlondikeIII/Biglow Canyon Wind Integration Project Appendix C: Electrical Effects
Appendix C/19
percentage of the time. Thus, the L5 level refers to the noise level that is exceeded only 5% of the time. L50 refers to the sound level exceeded 50% of the time. Sound-level measurements and predictions for transmission lines are often expressed in terms of exceedence levels, with the L5 level representing the maximum level and the L50 level representing a median level.
Table 6 shows AN levels from various common sources. Clearly, there is wide variation. Noise exposure depends on how much time an individual spends in different locations. Outdoor noise generally does not contribute to indoor levels (EPA, 1974). Activities in a building or residence generally dominate interior AN levels.
The BPA transmission-line design criterion for corona-generated audible noise (L50, foul weather) is 50 dBA at the edge of the ROW (USDOE, 2006). This criterion applies to new line construction and is under typical conditions of foul weather, altitude, and system voltage.
Audible noise from substations is generated predominantly by equipment such as transformers, reactors and other wire-wound equipment. It is characterized by a 120 Hz hum that is associated with magnetic-field caused vibrations in the equipment. Noise from such equipment varies by voltage and other operating conditions. The BPA design level for substation noise is 50 dBA at the substation property line for new construction (USDOE, 2006). The design level is met by obtaining equipment that meets specified noise limits and, for new substations, by securing a no-built buffer beyond the substation perimeter fence.
In industrial, business, commercial, or mixed use zones the AN level from substations may exceed 50 dBA but must still meet any state or local AN requirements. The design criteria also allows the 50 dBA design level to be exceeded in remote areas where development of noise sensitive properties is highly unlikely.
The EPA has established a guideline of 55 dBA for the annual average day-night level (Ldn) in outdoor areas (EPA, 1978). In computing this value, a 10 dB correction (penalty) is added to night-time noise between the hours of 10 p.m. and 7 a.m.
7.2 Transmission-line Audible Noise
Corona is the partial electrical breakdown of the insulating properties of air around the conductors of a transmission line. In a small volume near the surface of the conductors, energy and heat are dissipated. Part of this energy is in the form of small local pressure changes that result in audible noise. Corona-generated audible noise can be characterized as a hissing, crackling sound that, under certain conditions, is accompanied by a 120-Hz hum. Corona-generated audible noise is of concern primarily for con- temporary lines operating at voltages of 345 kV and higher during foul weather. However, the proposed 230-kV line will produce some noise under foul weather conditions.
The conductors of high-voltage transmission lines are designed to be corona-free under ideal conditions. However, protrusions on the conductor surface—particularly water droplets on or dripping off the conductors—cause electric fields near the conductor surface to exceed corona onset levels, and corona occurs. Therefore, audible noise from transmission lines is generally a foul-weather (wet-conductor) phenomenon. Wet conductors can occur during periods of rain, fog, snow, or icing. Based on meteorologic records near the route of the proposed transmission line, such conditions are expected to occur about 6% of the time during the year in the Wasco area.
For a few months after line construction, residual grease or oil on the conductors can cause water to bead up on the surface. This results in more corona sources and slightly higher levels of audible noise and

Klondike III/Biglow Canyon Wind Integration Project Appendix C: Electrical Effects
Appendix C/20
electromagnetic interference if the line is energized. However, the new conductors "age" in a few months, and the level of corona activity decreases to the predicted equilibrium value. During fair weather, insects and dust on the conductor can also serve as sources of corona.
7.3 Predicted Audible Noise Levels
Corona-generated audible-noise levels are calculated for average voltage and average conductor heights for fair- and foul-weather conditions. The predicted levels of audible noise for the proposed line operated at a voltage of 237 kV are given in Table 7 and plotted in Figure 4.
The calculated median level (L50) during foul weather at the edge of the proposed Klondike - John Day 230-kV line right-of-way (62.5 ft. from centerline) is 42 dBA; the calculated maximum level (L5) during foul weather at the edge of the right-of-way is 46 dBA. During fair-weather conditions, which occur about 94% of the time in the Wasco area, audible noise levels at the edge of the right-of-way would be about 20 dBA (if corona were present). These lower levels could be masked by ambient noise on and off the right-of-way.
7.4 Discussion
The calculated foul-weather corona noise levels for the proposed line would be comparable to, or less than, those from existing 230-kV lines in Oregon. During fair weather, noise from the conductors might be perceivable on the right-of-way; however, beyond the right-of-way it would very likely be masked or so low as not to be perceived. During foul weather, when ambient noise is higher, it is also likely that corona-generated noise off the right-of-way would be masked to some extent.
On and off the right-of-way, the levels of audible noise from the proposed line during foul weather would be well below the 55-dBA level that can produce interference with speech outdoors. The distance to the nearest residence to the proposed line is about 0.25 miles (0.4 km). At this distance the AN from the line would be about 30 dBA during foul weather and probably not be perceived above background noise. During such periods ambient noise levels can be increased due to wind and rain hitting foliage or buildings.
The computed annual Ldn level for transmission lines operating in areas with about 6% foul weather is about Ldn = L50 - 3 dBA (Bracken, 1987). Therefore, assuming such conditions in the area of the proposed Klondike - John Day 230-kV line, the estimated Ldn at the edge of the right-of-way would be approximately 39 dBA, which is well below the EPA Ldn guideline of 55 dBA.
The transformers and other equipment installed at the new Klondike substation will be specified so that the BPA noise level criterion of 50 dBA for new substations will be met at the edge of the property (USDOE, 2006). This will ensure that all applicable federal, state, and local regulations are met.
For the expansion to the John Day Substation, the new equipment would be required to meet the same specifications as for new substations (USDOE, 2006). However, the new equipment would be placed in an environment with noise from existing transmission lines and existing equipment in the John Day Substation. The combined noise level from the existing and new facilities could exceed the 50 dBA design level at points on the perimeter of the expanded substation. However, the levels would be controlled to meet all applicable regulations at the edge of the property.
KlondikeIII/Biglow Canyon Wind Integration Project Appendix C: Electrical Effects
Appendix C/21
7.5 Conclusion
Along the proposed line route there could be increases in the perceived noise above ambient levels during foul weather at the edges of the proposed 230-kV right-of-way. The corona-generated noise during foul weather would be masked to some extent by naturally occurring sounds such as wind and rain on foliage. During fair weather, the noise off the right-of-way from the proposed line would probably not be detectable above ambient levels. The noise levels from the proposed line would be below levels identified as causing interference with speech or sleep. The audible noise from the transmission line would be below EPA guideline levels and would meet the BPA design criterion that complies with state noise regulations. Similarly the new substations would be designed and constructed to meet BPA design criteria that all federal, state and local regulations be met.
8.0 Electromagnetic Interference
8.1 Basic Concepts
Corona on transmission-line conductors can also generate electromagnetic noise in the frequency bands used for radio and television signals. The noise can cause radio and television interference (RI and TVI). In certain circumstances, corona-generated electromagnetic interference (EMI) can also affect communications systems and other sensitive receivers. Interference with electromagnetic signals by corona-generated noise is generally associated with lines operating at voltages of 345 kV or higher. This is especially true of interference with television signals. The single 1.6-in diameter conductor used in the design of the proposed 230-kV line would mitigate corona generation and keep radio and television interference levels at acceptable levels below those of many existing 230-kV lines with smaller conductors.
Spark gaps on distribution lines and on low-voltage wood-pole transmission lines are a more common source of RI/TVI than is corona from high-voltage electrical systems. This gap-type interference is primarily a fair-weather phenomenon caused by loose hardware and wires. The proposed transmission line would be constructed with modern hardware that eliminates such problems and therefore minimizes gap noise. Consequently, this source of EMI is not anticipated for the proposed line.
No state has limits for either RI or TVI. In the United States, electromagnetic interference from power transmission systems is governed by the Federal Communications Commission (FCC) Rules and Regulations presently in existence (FCC, 1988). A power transmission system falls into the FCC category of "incidental radiation device," which is defined as "a device that radiates radio frequency energy during the course of its operation although the device is not intentionally designed to generate radio frequency energy." Such a device "shall be operated so that the radio frequency energy that is emitted does not cause harmful interference. In the event that harmful interference is caused, the operator of the device shall promptly take steps to eliminate the harmful interference." For purposes of these regulations, harmful interference is defined as: "any emission, radiation or induction which endangers the functioning of a radio navigation service or of other safety services or seriously degrades, obstructs or repeatedly interrupts a radio communication service operating in accordance with this chapter" (FCC, 1988: Vol II, part 15. 47CFR, Ch. 1).
Electric power companies have been able to work quite well under the present FCC rule because harmful interference can generally be eliminated. It has been estimated that more than 95% of power-line sources that cause interference are due to gap-type discharges. These can be found and completely eliminated, when required to prevent interference (USDOE, 1980). Complaints related to corona-generated

Klondike III/Biglow Canyon Wind Integration Project Appendix C: Electrical Effects
Appendix C/22
interference occur infrequently. This is especially true with the advent of cable television and satellite television, which are not subject to corona-generated interference. Mitigation of corona-generated interference with conventional radio and television receivers can be accomplished in several ways, such as use of a directional antenna or relocation of an existing antenna (USDOE, 1977; USDOE, 1980; Loftness et al., 1981).
8.2 Radio Interference (RI)
Radio reception in the AM broadcast band (535 to 1605 kilohertz (kHz)) is most often affected by corona-generated EMI. FM radio reception is rarely affected. Generally, only residences very near to transmission lines can be affected by RI. The IEEE Radio Noise Design Guide identifies an acceptable limit of fair-weather RI as expressed in decibels above 1 microvolt per meter (dBμV/m) of about 40 dBμV/m at 100 ft. (30 m) from the outside conductor (IEEE Committee Report, 1971). As a general rule, average levels during foul weather (when the conductors are wet) are 16 to 22 dBμV/m higher than average fair-weather levels.
8.3 Predicted RI Levels
The predicted median (L50) fair- and foul-weather RI levels at 100 ft. (30 m) from the outside conductor for the proposed line operating at 237 kV are 28 and 45 dBμV/m, respectively. This level will meet the IEEE 40 dBμV/m criterion for fair weather levels at distances greater than about 100 ft. (30 m) from the outside conductor. Predicted fair-weather L50 levels are comparable to, or lower than, those for existing 230-kV lines in Oregon..
8.4 Television Interference (TVI)
Corona-caused TVI occurs during foul weather and is generally of concern for transmission lines with voltages of 345 kV or above, and only for conventional receivers within about 600 ft. (183 m) of such a line. As is the case for RI, gap sources on distribution and low-voltage transmission lines are the principal observed sources of TVI. The use of modern hardware and construction practices for the proposed line would minimize such sources. TVI levels are expressed in dBμV/m at 75 MHz.
8.5 Predicted TVI Levels
The foul weather TVI level predicted at 100 ft. (30 m) from the outside conductor of the proposed line is 13 dBμV/m with the line operating at 237 kV. This is considerably below foul-weather TVI levels from existing 500-kV lines (24-27 dBμV/m), where TVI can be a problem.
Other forms of TVI from transmission lines are signal reflection (ghosting) and signal blocking caused by the relative locations of the transmission structure and the receiving antenna with respect to the incoming television signal. The steel pole towers proposed for use in the design of the proposed line are less effective in causing this type of interference than are lattice steel towers. Television systems that operate at higher frequencies, such as satellite receivers, are not affected by corona-generated TVI. Cable television systems are similarly unaffected. The distance between the proposed line route and nearby residences makes this type of interference very unlikely for the proposed line.
Since residences are 0.25 miles or more distant, corona-generated TVI, signal reflection or signal blocking are not anticipated to occur due to the proposed 230-kV line. In the unlikely event that RI or TVI is caused by the proposed line, BPA has a program to identify, investigate, and mitigate legitimate RI and TVI complaints.
KlondikeIII/Biglow Canyon Wind Integration Project Appendix C: Electrical Effects
Appendix C/23
8.6 Interference with Other Devices
Corona-generated interference can conceivably cause disruption on other communications bands such as the citizen’s (CB) and mobile bands. However, mobile-radio communications are not susceptible to transmission-line interference because they are generally frequency modulated (FM). Similarly, cellular telephones operate at a frequency of 900 MHz or higher, which is above the frequency where corona-generated interference is prevalent. In the unlikely event that interference occurs with these or other communications, mitigation can be achieved with the same techniques used for television and AM radio interference. As digital signal processing has been integrated into communications the potential impact of corona-generated EMI has decreased substantially.
8.7 Conclusion
Predicted EMI levels for the proposed 230-kV transmission line are comparable to, or lower, than those that already exist near 230-kV lines and no impacts of corona-generated interference on radio, television, or other receptors are anticipated. Furthermore, if interference should occur, there are various methods for correcting it: BPA has a program to respond to legitimate complaints.
9.0 Other Corona Effects
Corona is sometimes visible as a bluish glow or as bluish plumes on higher voltage lines. On the proposed 230-kV line, corona levels would be very low, so it is very unlikely that it could be observed. Any corona on the conductors would be observable only under the darkest conditions and only with the aid of binoculars, if at all. Without a period of adaptation for the eyes and without intentional looking for the corona, it would probably not be noticeable.
When corona is present, the air surrounding the conductors is ionized and many chemical reactions take place, producing small amounts of ozone and other oxidants. Ozone is approximately 90% of the oxidants, while the remaining 10% is composed principally of nitrogen oxides. The corona level predicted for the proposed line is much lower than that from 500-kV lines. The levels from 500-kV lines are significantly below natural levels and fluctuations in natural levels. Consequently, any production of ozone from the proposed line would be essentially undetectable at ground level.
10.0 Summary
Electric and magnetic fields from the proposed transmission line have been characterized using well-known techniques accepted within the scientific and engineering community. The expected electric-field levels from the proposed line at minimum design clearance would be comparable to those from existing 230-kV lines in Oregon, and elsewhere. The expected magnetic-field levels from the proposed line would be comparable to those from other 230-kV lines in Oregon, and elsewhere.
The peak electric field expected under the proposed line would be 2.4 kV/m; the maximum value at the edge of the right-of-way would be about 0.3 kV/m. Clearances at road crossings would be increased to reduce the peak electric-field value to 1.2 kV/m or less.
Under maximum current conditions on both circuits, the maximum magnetic fields under the proposed line would be 128 mG; at the edge of the right-of-way of the proposed line the maximum magnetic field would be 24 mG. With only the Biglow Canyon circuit loaded to maximum current the magnetic fields
Klondike III/Biglow Canyon Wind Integration Project Appendix C: Electrical Effects
Appendix C/24
would increase to a maximum of 150 mG on the right-of-way and 44 mG at the edge. Over a year, the magnetic field levels would average to be about 30% of the above levels.
The electric fields from the proposed line would meet regulatory limits for public exposure in Oregon and all other states that have limits and would meet the regulatory limits or guidelines for peak fields established by national and international guideline setting organizations. The magnetic fields from the proposed line would be within the regulatory limits of the two states that have established them and within guidelines for public exposure established by ICNIRP and IEEE. The state of Oregon does not have limits for magnetic fields from transmission lines.
Short-term effects from transmission-line fields are well understood and can be mitigated. Nuisance shocks arising from electric-field induced currents and voltages could be perceivable on the right-of-way of the proposed line. It is common practice to ground permanent conducting objects during and after construction to mitigate against such occurrences.
Corona-generated audible noise from the proposed line could be perceivable during foul weather at the edge of the right-of-way. The levels would be comparable with, or less than, those near existing 230-kV transmission lines in Oregon, and would be in compliance with noise regulations in Oregon, and would be below levels specified in EPA guidelines.
Corona-generated electromagnetic interference from the proposed line would be comparable to or less than that from existing 230-kV lines in Oregon. Radio interference levels would be below limits identified as acceptable. Television interference, a foul-weather phenomenon usually associated with higher voltage lines, is not anticipated to occur from the proposed 230-kV line. If legitimate TVI complaints arise, BPA has a mitigation program.
KlondikeIII/Biglow Canyon Wind Integration Project Appendix C: Electrical Effects
Appendix C/25
List of References Cited
ACGIH (American Conference of Governmental Industrial Hygienists). 2000. 2000 TLVs and BEIs: Threshold Limit Values for Chemical Substances and Physical Agents and Biological Exposure Indices. American Conference of Governmental Industrial Hygienists, Cincinnati. 192 pages.
Baishiki, R.S.; Johnson, G.B.; Zaffanella, L.E.; Bracken, T.D.; Sussman, S.S.; Rauch, G.B.; and Silva, J.M. 1990. Studies of Power System Magnetic Fields: Characterization of Sources in Residential Environments, Measurement of Exposure, Influence On Computer Screens. (36-104) CIGRE, Paris, France. 10 pages.
Banfai, B.; Karady, G.G.; Kim, C.J.; and Maracas, K.B. 2000. Magnetic field effects on CRT computer monitors. IEEE Trans. on Power Delivery 15, 307-312.
Bassen, H.; Casamento, J.; and Crowl, B. 1991. Reduction of electric and magnetic field emissions from electric blankets (Meeting abstract). In: Bioelectromagnetics Society, 13th Annual Meeting, 23-27 June, Salt Lake City. Bioelectromagnetics Society, New York, 20.
Bowman, J.D.; Garabrant, D.H.; Sobel, E.; and Peters, J.M. June 1988. Exposures to Extremely Low Frequency (ELF) Electromagnetic Fields in Occupations with Elevated Leukemia Rates. Applied Industrial Hygienics, 3(6, June):189-194.
Bracken, T.D. 1987. Audible Noise from High Voltage Transmission Facilities. A Briefing Paper Prepared for State of Florida Department of Environmental Regulation. (DER Contract No. SP122) State of Florida Department of Environmental Regulation.
Bracken, T.D. 1990. The EMDEX Project: Technology Transfer and Occupational Measurements, Volumes 1-3 Interim Report. EPRI Report EN-7048. (EPRI EN-7048) Electric Power Research Institute, Palo Alto, CA.
Chartier, V.L. April 1983. Empirical Expressions for Calculating High Voltage Transmission Corona Phenomena, First Annual Seminar Technical Career Program for Professional Engineers. Bonneville Power Administration, Portland, Oregon. April 1983, 75-82.
Chartier, V.L.; and Stearns, R.D. January 1981. Formulas for Predicting Audible Noise from Overhead High Voltage AC and DC Lines. IEEE Transactions on Power Apparatus and Systems, PAS-100(No. 1, January 1981):121-129.
Dabkowski, J.; and Taflove, A. May/June 1979. Prediction Method for Buried Pipeline Voltages Due to 60 Hz AC Inductive Coupling. Part II: Field Test Verification. IEEE Transactions on Power Apparatus and Systems, PAS-98(3, May/June):788-794.
Deno, D.W.; and Zaffanella, L. 1982. Field effects of overhead transmission lines and stations. Chap. 8. In: Transmission Line Reference Book: 345 KV and Above. Second ed. (Ed: LaForest, J.J.). Electric Power Research Institute, Palo Alto, CA, 329-419.
EPA (Environmental Protection Agency). July 1973. Public Health and Welfare Criteria for Noise. (No. 500/9-73-002, July 27, 1973.) U.S. Environmental Protection Agency, Washington, D.C.
EPA. 1974. Information On Levels of Environmental Noise Requisite to Protect Public Health and Welfare With an Adequate Margin of Safety. (No. PB-239 429.) U.S. Environmental Protection Agency, Washington, D.C.
EPA. 1978. Protective Noise Levels. Condensed Version of EPA Levels Document. (No. PB82-138827) U.S Environmental Protection Agency, Washington, DC.
FCC (Federal Communications Commission). 1988. Federal Communications Commission Rules and Regulations. 10-1-88 ed. Vol. II part 15, 47 CFR, Ch. 1.
Klondike III/Biglow Canyon Wind Integration Project Appendix C: Electrical Effects
Appendix C/26
Florig, H.K.; and Hoburg, J.F. 1988. Electric and Magnetic Field Exposure Associated With Electric Blankets. Project Resume. Contractor's Review. U.S. Department of Energy/Electric Power Research Institute.
Florig, H.K.; Hoburg, J.F.; and Morgan, M.G. April 1987. Electric Field Exposure from Electric Blankets. IEEE Transactions on Power Delivery, PWRD-2(2, April):527-536.
Gauger, J. September 1985. Household Appliance Magnetic Field Survey. IEEE Transactions on Power Apparatus and Systems, 104(9, September):2436-2445.
Harvey, S.M. 1983. Analysis of operator exposure to electric fields from video display units. Chap. 2. In: Video Display Units⎯Characterization of Electric and Magnetic Fields. (Ontario Hydro Research Division Report # 83-503-K) (Ed: Walsh, M.L.). Ontario Hydro, Toronto, 31-56.
Heroux, P. 1987. 60-Hz Electric and Magnetic Fields Generated By a Distribution Network. Bioelectromagnetics, 8(2):135-148.
ICNIRP (International Committee on Non-ionizing Radiation Protection). April 1998. Guidelines for Limiting Exposure to Time-Varying Electric, Magnetic, and Electromagnetic Fields (Up to 300 GHz). Health Physics, 74(4, April):1-32.
IEEE (Institute of Electrical and Electronics Engineers, Inc.). 1978. Electric and Magnetic Field Coupling from High Voltage AC Power Transmission Lines⎯Classification of Short-Term Effects On People. IEEE Transactions on Power Apparatus and Systems, PAS-97:2243-2252.
IEEE. 1994. IEEE Standard Procedures for Measurement of Power Frequency Electric and Magnetic Fields from AC Power Lines. ANSI/IEEE Std. 644-1994, New York, NY.
IEEE. 2002a. National Electrical Safety Code. 2002 ed. Institute of Electrical and Electronics Engineers, Inc., New York, NY. 287 pages.
IEEE (Institute of Electrical and Electronics Engineers, Inc.). 2002b. IEEE PC95.6-2002 Standard for Safety Levels With Respect to Human Exposure to Electromagnetic Fields, 0 to 3 kHz. Piscataway, NJ: prepared by Subcommittee 3 of Standards Coordinating Committee 28, IEEE Standards Department, 2002.
IEEE Committee Report. March/April 1971. Radio Noise Design Guide for High Voltage Transmission Lines. IEEE Transactions on Power Apparatus and Systems, PAS-90(No. 2, March/April):833-842.
IEEE Committee Report. October 1982. A Comparison of Methods for Calculating Audible Noise of High Voltage Transmission Lines. IEEE Transactions on Power Apparatus and Systems, 101(10, October):4090-4099.
ITT Research Institute. 1984. Representative Electromagnetic Field Intensities Near the Clam Lake (WI) and Republic (MI) ELF Facilities. Report Prepared for Naval Electronics Systems Command, PME 110 E Washington, D.C. 20360. (Under contract N00039-84-C0070.) ITT Research Institute, Chicago, IL. 60 pages.
Jaffa, K.C.; and Stewart, J.B. March 1981. Magnetic Field Induction from Overhead Transmission and Distribution Power Lines On Buried Irrigation Pipelines. IEEE Transactions on Power Apparatus and Systems, PAS-100(3, March):990-1000.
Keesey, J.C.; and Letcher, F.S. 1969. Minimum Thresholds for Physiological Responses to Flow of Alternating Electric Current Through the Human Body At Power-Transmission Frequencies. (Report No. 1) Naval Medical Research Institute, Project MR 005.08-0030B, Bethesda, MD. 25 pages.
KlondikeIII/Biglow Canyon Wind Integration Project Appendix C: Electrical Effects
Appendix C/27
Loftness, M.O.; Chartier, V.L.; and Reiner, G.L. 1981. EMI Correction Techniques for Transmission Line Corona. (August 18-20, 1981, pp. 351-361.) Proceedings of the 1981 IEEE International Symposium on Electromagnetic Compatibility, Boulder, CO.
Maddock, B.J. September 1992. Guidelines and Standards for Exposure to Electric and Magnetic Fields At Power Frequencies. (Panel 2-05, CIGRE meeting August 30-September 5, 1992) CIGRE, Paris.
Mezei, G.; Kheifets, L.I.; Nelson, L.M.; Mills, K.M. ; Iriye, R. ;and Kelsey, J.L. 2001. Household Appliance Use and Residential Exposure to 60-Hz Magnetic Fields. Journal of Exposure Analysis and Environmental Epidemiology, Vol. 11, No. 1: 41-49.
NOAA, National Oceanic & Atmospheric Administration. 2005. National Environmental Satellite, Data, and Information Service (NESDIS), National Climatic Data Center (NCDC). http://www.ncdc.noaa.gov/oa/ncdc.html
Olsen, R.G.; Schennum, S.D.; and Chartier, V.L. April 1992. Comparison of Several Methods for Calculating Power Line Electromagnetic Interference Levels and Calibration With Long Term Data. IEEE Transactions on Power Delivery, 7 (April, 1992):903-913.
Oregon, State of. 1980. Oregon Administrative Rules Chapter 345, Division 80. Energy Facility Siting Council standards relating to public health and safety, 934-80-055.
Reilly, J.P. 1979. Electric Field Induction on Long Objects⎯A Methodology for Transmission Line Impact Studies. IEEE Transactions on Power Apparatus and Systems, PAS-98(6, Nov/Dec):1841-1852.
Sheppard, A.R.; and Eisenbud, M. 1977. Biological Effects of Electric and Magnetic Fields of Extremely Low Frequency. New York University Press, New York.
Silva, M.; Hummon, N.; Rutter, D.; and Hooper, C. 1989. Power Frequency Magnetic Fields in the Home. IEEE Transactions on Power Delivery, 4:465-478.
Stopps, G.J.; and Janischewskyj, W. 1979. Epidemiological Study of Workers Maintaining HV Equipment and Transmission Lines in Ontario. (Canadian Electrical Association Research Report) Canadian Electrical Association, Montreal. 82 pages.
Taflove, A. and Dabkowski, J. May/June 1979. Prediction Method for Buried Pipeline Voltages Due to 60 Hz AC Inductive Coupling. Part I: Analysis. IEEE Transactions on Power Apparatus and Systems, PAS-98(3, May/June):780-787.
TDHS Report. March 1989. EMF Rule Becomes Law; Hillsborough County Commission Challenges. Transmission/Distribution Health & Safety Report, 7(9, 31 March):1-3.
TDHS Report. August 1990. Updates: New York. Transmission/Distribution Health & Safety Report, 8(7, 31 August):4.
USDOE (U.S. Department of Energy), Bonneville Power Administration. March 1977. A Practical Handbook for the Location, Prevention and Correction of Television Interference from Overhead Power Lines. Portland, OR.
USDOE, Bonneville Power Administration. May 1980. A Practical Handbook for the Correction of Radio Interference from Overhead Powerlines and Facilities. Portland, OR.
USDOE, Bonneville Power Administration. 1995. Living and Working Around High-Voltage Power Lines. (DOE/BP-799). Portland, OR. 9 pages.
USDOE, Bonneville Power Administration. 1996. Electrical and Biological Effects of Transmission Lines: A Review. (DOE/BP 2938 December 1996 1M) Portland, OR.
Klondike III/Biglow Canyon Wind Integration Project Appendix C: Electrical Effects
Appendix C/28
USDOE, Bonneville Power Administration. undated. "Corona and Field Effects" Computer Program (Public Domain Software). Bonneville Power Administration, P.O. Box 491-ELE, Vancouver, WA 98666.
USDOE, Bonneville Power Administration. 2006. Audible Noise Policy. TBL Policy T2006-1. Bonneville Power Administration, Portland, OR.
Zaffanella, L.E. 1993. Survey of Residential Magnetic Field Sources. Vol. 1: Goals, results, and conclusions. (EPRI TR-102759-V1, Project 3335-02) Electric Power Research Institute, Palo Alto, CA.
Zaffanella, L.E.; and Kalton, G.W. 1998. Survey of personal magnetic field exposure, Phase II: 1000-person survey. Interim Report. EMF RAPID Program Engineering Project #6. Enertech Consultants, Lee, MA.
KlondikeIII/Biglow Canyon Wind Integration Project Appendix C: Electrical Effects
Appendix C/29
List of Preparers
T. Dan Bracken was the principal author of this report. He received a B.S. degree in physics from Dartmouth College and M.S. and Ph.D. degrees in physics from Stanford University. Dr. Bracken has been involved with research on and characterization of electric- and magnetic-field effects from transmission lines for over 30 years, first as a physicist with the Bonneville Power Administration (BPA) (1973 - 1980) and since then as a consultant. His firm, T. Dan Bracken, Inc., offers technical expertise in areas of electric- and magnetic-field measurements, instrumentation, environmental effects of transmission lines, exposure assessment and project management. Joseph Dudman of T. Dan Bracken, Inc., provided data entry, graphics, and clerical support in the preparation of the report.
Klondike III/Biglow Canyon Wind Integration Project Appendix C: Electrical Effects
Appendix C/30
This page intentionally left blank.
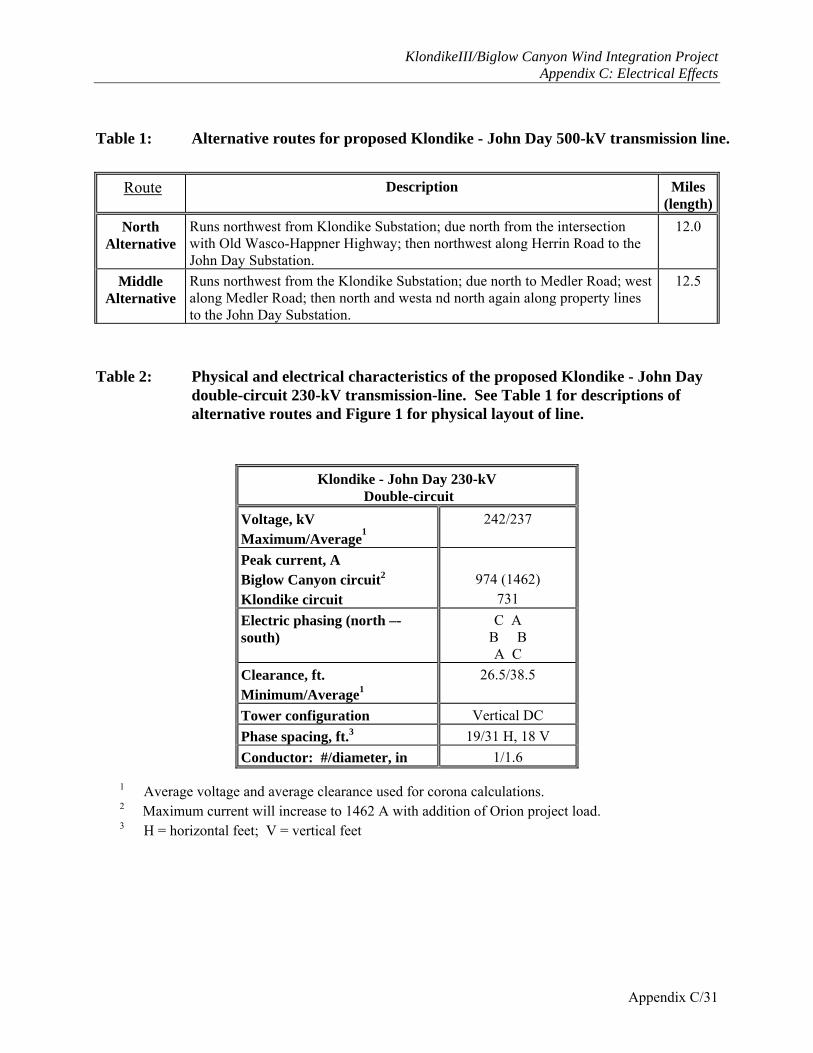
KlondikeIII/Biglow Canyon Wind Integration Project Appendix C: Electrical Effects
Appendix C/31
Table 1: Alternative routes for proposed Klondike - John Day 500-kV transmission line.
Route Description Miles(length)
North Alternative
Runs northwest from Klondike Substation; due north from the intersection with Old Wasco-Happner Highway; then northwest along Herrin Road to the John Day Substation.
12.0
Middle Alternative
Runs northwest from the Klondike Substation; due north to Medler Road; west along Medler Road; then north and westa nd north again along property lines to the John Day Substation.
12.5
Table 2: Physical and electrical characteristics of the proposed Klondike - John Day double-circuit 230-kV transmission-line. See Table 1 for descriptions of alternative routes and Figure 1 for physical layout of line.
Klondike - John Day 230-kV Double-circuit
Voltage, kV Maximum/Average1
242/237
Peak current, A Biglow Canyon circuit2 Klondike circuit
974 (1462)
731 Electric phasing (north –- south)
C A B B A C
Clearance, ft. Minimum/Average1
26.5/38.5
Tower configuration Vertical DC Phase spacing, ft.3 19/31 H, 18 V Conductor: #/diameter, in 1/1.6
1 Average voltage and average clearance used for corona calculations. 2 Maximum current will increase to 1462 A with addition of Orion project load. 3 H = horizontal feet; V = vertical feet

Klondike III/Biglow Canyon Wind Integration Project Appendix C: Electrical Effects
Appendix C/32
Table 3: Calculated peak and edge-of-right-of-way electric fields for the proposed
Klondike - John Day 230-kV line operated at maximum voltage.
Location Electric Field, kV/m
Line Clearance Minimum Average
Peak 2.4 1.1
Edge-of-ROW 0.3 0.2
Table 4: Calculated peak and edge-of-right-of-way magnetic fields for the proposed Klondike - John Day 230-kV line operated at maximum current. Average fields would be 30% of table values.
Location Magnetic Field, mG
Line Clearance Minimum Average
Peak 128 57
Edge-of-ROW1 24/12 19/10
1 Higher value is at edge of right-of-way adjacent to circuit with Biglow Canyon load.
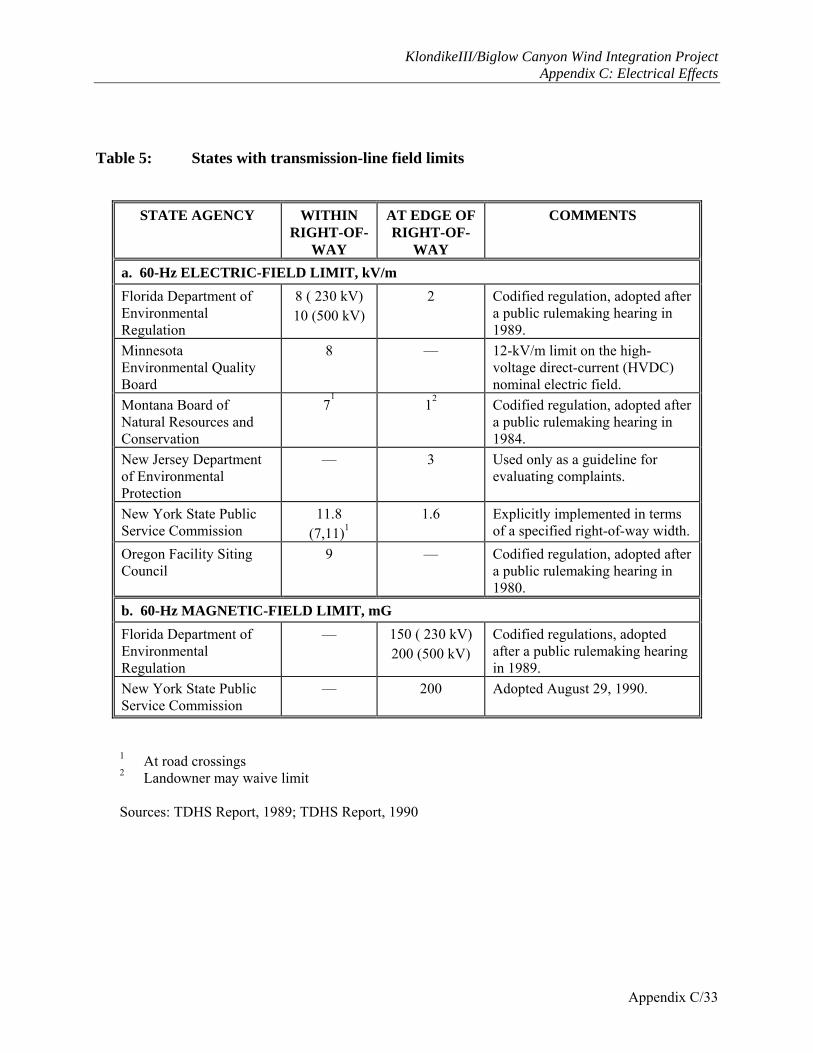
KlondikeIII/Biglow Canyon Wind Integration Project Appendix C: Electrical Effects
Appendix C/33
Table 5: States with transmission-line field limits
STATE AGENCY WITHIN RIGHT-OF-
WAY
AT EDGE OF RIGHT-OF-
WAY
COMMENTS
a. 60-Hz ELECTRIC-FIELD LIMIT, kV/m Florida Department of Environmental Regulation
8 ( 230 kV) 10 (500 kV)
2 Codified regulation, adopted after a public rulemaking hearing in 1989.
Minnesota Environmental Quality Board
8 — 12-kV/m limit on the high-voltage direct-current (HVDC) nominal electric field.
Montana Board of Natural Resources and Conservation
71 12 Codified regulation, adopted after
a public rulemaking hearing in 1984.
New Jersey Department of Environmental Protection
— 3 Used only as a guideline for evaluating complaints.
New York State Public Service Commission
11.8 (7,11)1
1.6 Explicitly implemented in terms of a specified right-of-way width.
Oregon Facility Siting Council
9 — Codified regulation, adopted after a public rulemaking hearing in 1980.
b. 60-Hz MAGNETIC-FIELD LIMIT, mG Florida Department of Environmental Regulation
— 150 ( 230 kV) 200 (500 kV)
Codified regulations, adopted after a public rulemaking hearing in 1989.
New York State Public Service Commission
— 200 Adopted August 29, 1990.
1 At road crossings 2 Landowner may waive limit Sources: TDHS Report, 1989; TDHS Report, 1990
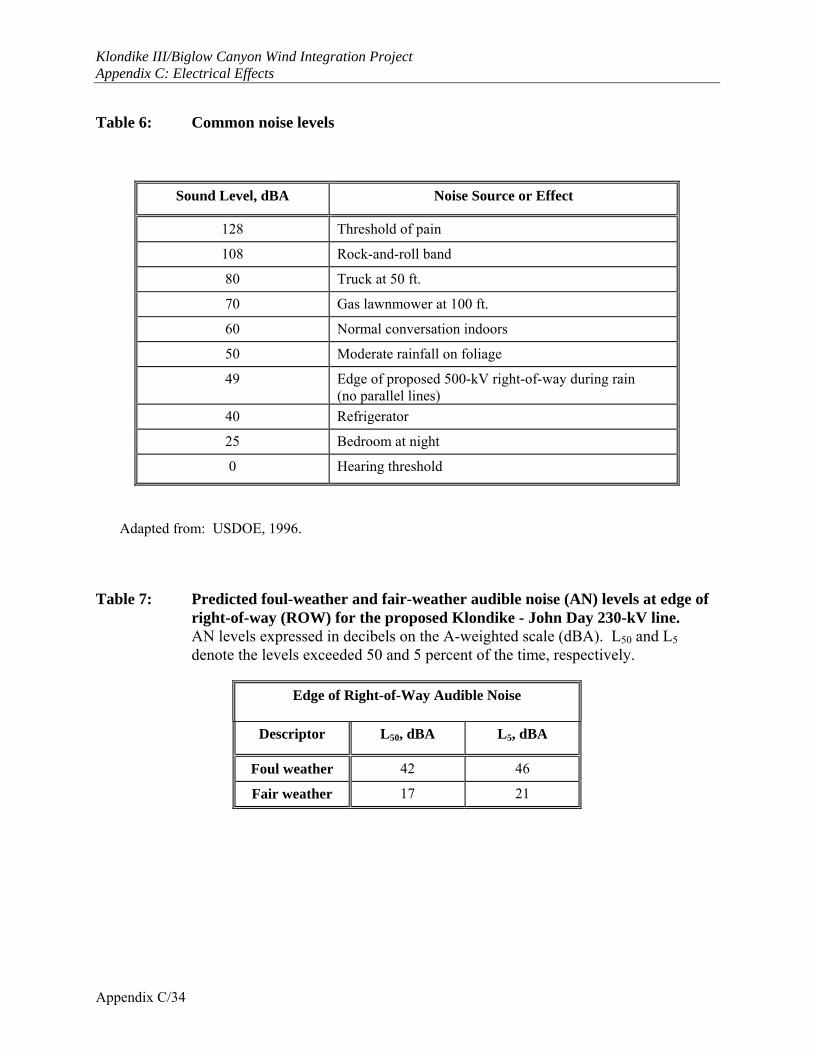
Klondike III/Biglow Canyon Wind Integration Project Appendix C: Electrical Effects
Appendix C/34
Table 6: Common noise levels
Sound Level, dBA Noise Source or Effect
128 Threshold of pain
108 Rock-and-roll band
80 Truck at 50 ft.
70 Gas lawnmower at 100 ft.
60 Normal conversation indoors
50 Moderate rainfall on foliage
49 Edge of proposed 500-kV right-of-way during rain (no parallel lines)
40 Refrigerator
25 Bedroom at night
0 Hearing threshold
Adapted from: USDOE, 1996. Table 7: Predicted foul-weather and fair-weather audible noise (AN) levels at edge of
right-of-way (ROW) for the proposed Klondike - John Day 230-kV line. AN levels expressed in decibels on the A-weighted scale (dBA). L50 and L5 denote the levels exceeded 50 and 5 percent of the time, respectively.
Edge of Right-of-Way Audible Noise
Descriptor L50, dBA L5, dBA
Foul weather 42 46
Fair weather 17 21
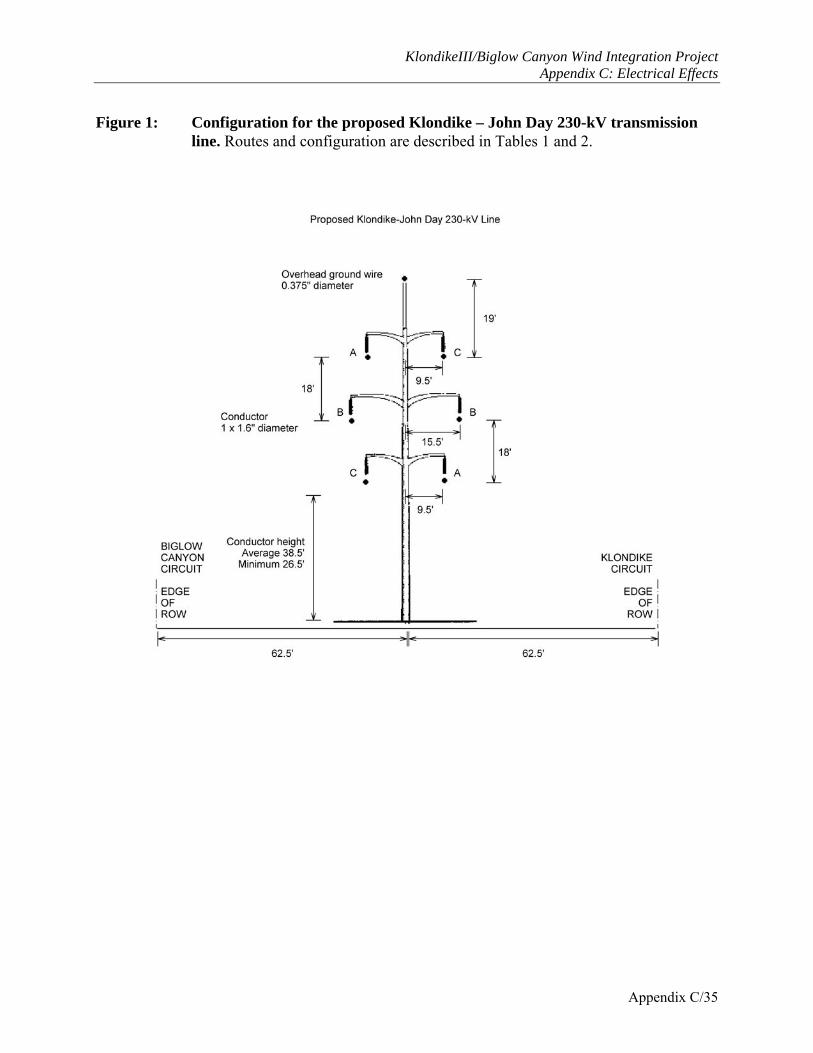
KlondikeIII/Biglow Canyon Wind Integration Project Appendix C: Electrical Effects
Appendix C/35
Figure 1: Configuration for the proposed Klondike – John Day 230-kV transmission
line. Routes and configuration are described in Tables 1 and 2.
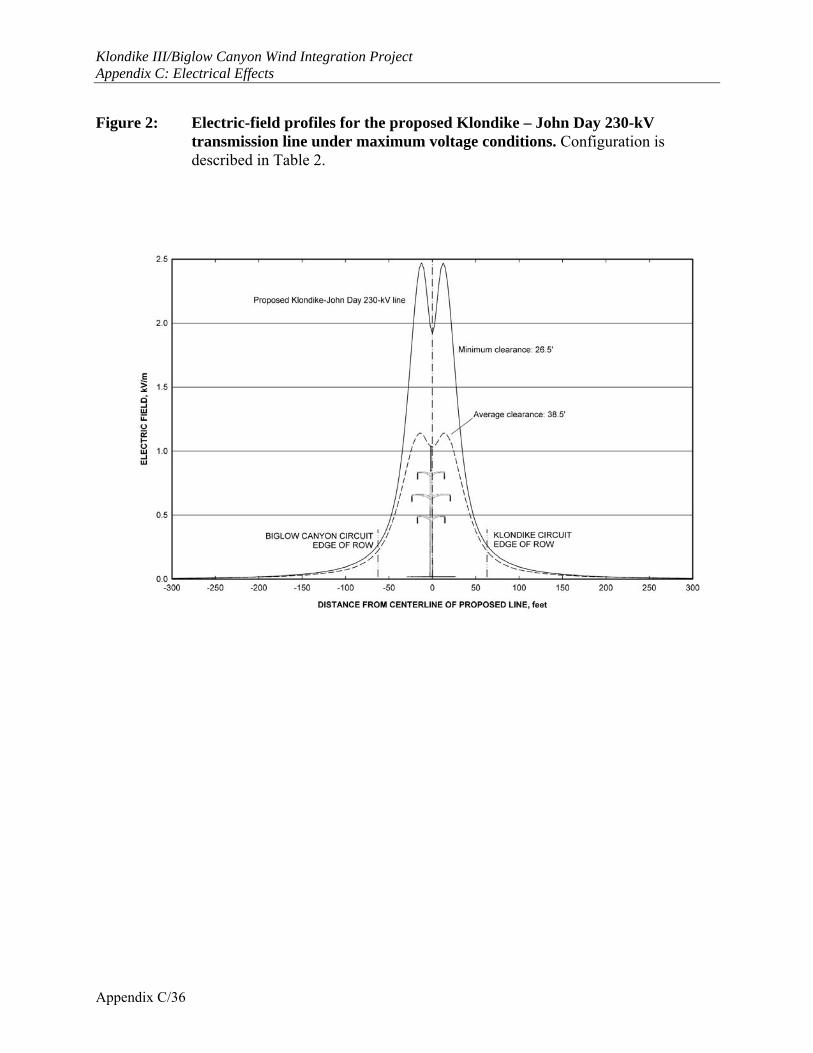
Klondike III/Biglow Canyon Wind Integration Project Appendix C: Electrical Effects
Appendix C/36
Figure 2: Electric-field profiles for the proposed Klondike – John Day 230-kV
transmission line under maximum voltage conditions. Configuration is described in Table 2.
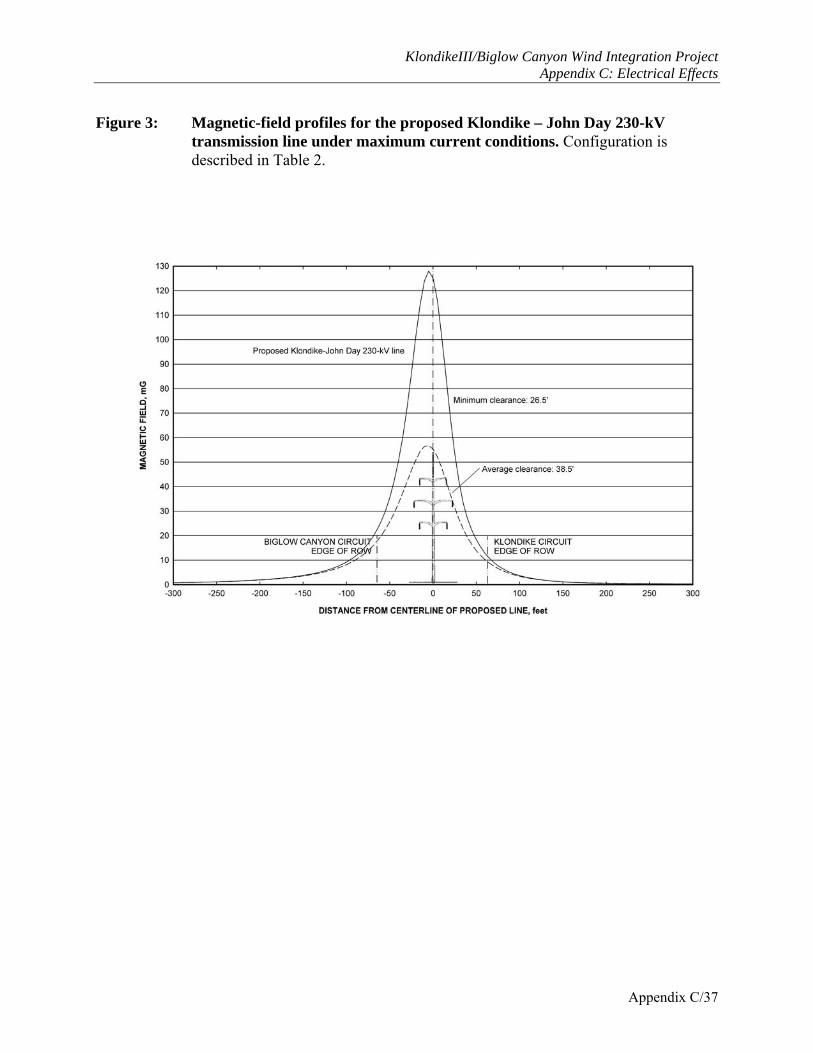
KlondikeIII/Biglow Canyon Wind Integration Project Appendix C: Electrical Effects
Appendix C/37
Figure 3: Magnetic-field profiles for the proposed Klondike – John Day 230-kV
transmission line under maximum current conditions. Configuration is described in Table 2.
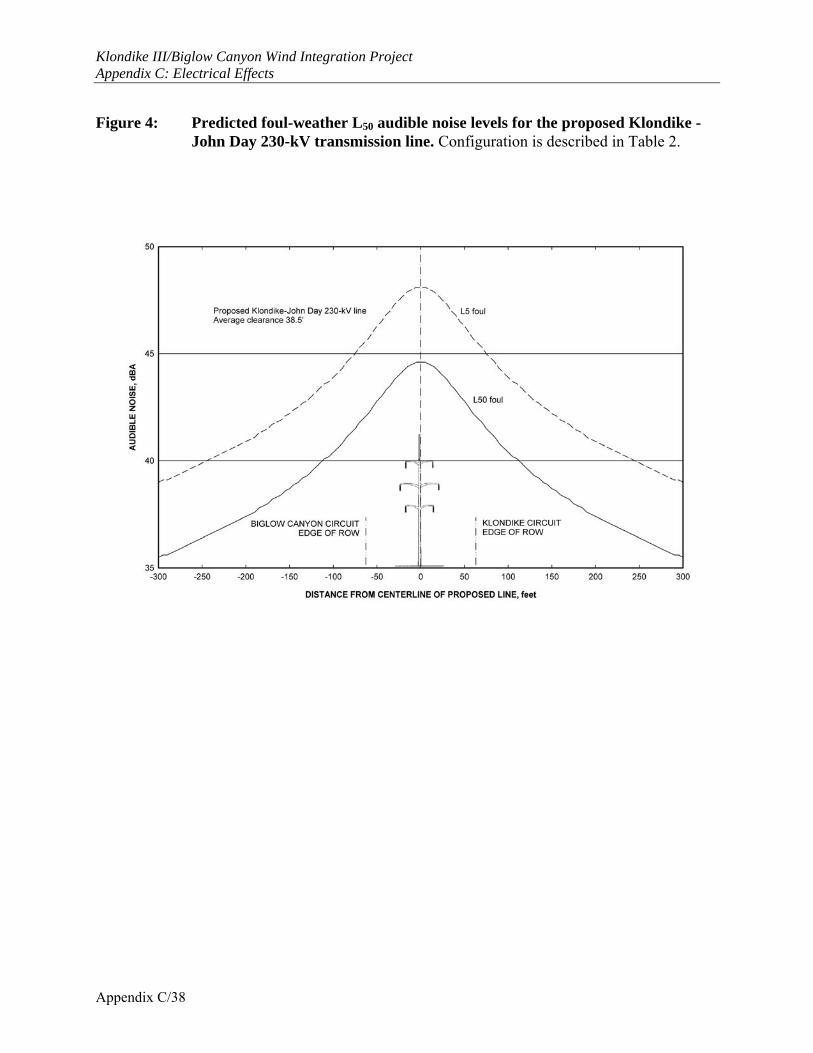
Klondike III/Biglow Canyon Wind Integration Project Appendix C: Electrical Effects
Appendix C/38
Figure 4: Predicted foul-weather L50 audible noise levels for the proposed Klondike -
John Day 230-kV transmission line. Configuration is described in Table 2.