Embed Size (px)
Citation preview
APPENDIX C
ANALYSIS OF HISTORIC FLOODS AND MODEL TUNING


Combined Catchments of Whartons, Collins and Farrahars Creeks, Bellambi Gully and Bellambi Lake Flood Study Appendix C - Analysis of Historic Floods and Model Tuning
Combined FS Appendix C.doc Ci Lyall & Associates 30 March 2011 Rev. 3.0 Consulting Water Engineers
TABLE OF CONTENTS
Page No.
C1. SYNOPSIS ...................................................................................................................... C1
C2. HISTORIC FLOODING IN THE STUDY CATCHMENTS................................................. C3
C2.1 October 1987 Flood ............................................................................................ C3 C2.2 April 1988 Flood .................................................................................................. C3 C2.3 August 1998 Flood .............................................................................................. C3
C3. HYDROLOGY ................................................................................................................. C5
C3.1 Review of RAFTS Modelling Approach ............................................................... C5 C3.2 RAFTS Model Layouts ........................................................................................ C7 C3.3 RAFTS Model Calibration ................................................................................... C7 C3.4 RAFTS Model Parameters .................................................................................. C7 C3.5 Application of Historic Rainfall to the RAFTS Model ........................................... C8 C3.6 RAFTS Model Results ......................................................................................... C8
C4. HYDRAULICS ............................................................................................................... C13
C4.1 The TUFLOW Modelling Approach ................................................................... C13 C4.2 TUFLOW Model Layouts ................................................................................... C13 C4.3 Adjustments to TUFLOW Model to Take Account of Development ................... C14
C5. DISCUSSION ON RESULTS OF MODEL TUNING PROCESS .................................... C17
C5.1 Presentation of Results ..................................................................................... C17 C5.2 Comparison with Observed Flood Behaviour .................................................... C17 C5.3 Comparison with Recorded Flood Levels .......................................................... C19 C5.4 Comparison of Discharge Hydrographs at Ocean Outlets ................................. C23
C6. REFERENCES .............................................................................................................. C25

Combined Catchments of Whartons, Collins and Farrahars Creeks, Bellambi Gully and Bellambi Lake Flood Study Appendix C - Analysis of Historic Floods and Model Tuning
Combined FS Appendix C.doc Cii Lyall & Associates 30 March 2011 Rev. 3.0 Consulting Water Engineers
FIGURES BOUND IN VOLUME 2 C2.1 48 Hour Rainfall Isohyets October 1987 Storm C2.2 Cumulative Rainfall October 1987 Storm C2.3 48 Hour Rainfall Isohyets April 1988 Storm C2.4 Cumulative Rainfall April 1988 Storm C2.5 24 Hour Rainfall Isohyets August 1998 Storm C2.6 Cumulative Rainfall August 1998 Storm C3.1 RAFTS Model Layout Whartons Creek and Collins Creek Catchments C3.2 RAFTS Model Layout Farrahars Creek and Bellambi Gully Catchments C3.3 RAFTS Model Layout Bellambi Lake Catchment C4.1 Whartons Creek TUFLOW Model Layout C4.2 Collins Creek, Farrahars Creek, Bellambi Gully and Bellambi Lake TUFLOW Model Layout
(Sheet 1 of 3) C4.3 Collins Creek, Farrahars Creek, Bellambi Gully and Bellambi Lake TUFLOW Model Layout (Sheet 2 of 3) C4.4 Collins Creek, Farrahars Creek, Bellambi Gully and Bellambi Lake TUFLOW Model Layout (Sheet 3 of 3) C4.5 Characteristics of Flooding Key Map August 1998 Storm C4.6 Characteristics of Flooding Whartons Creek Catchment August 1998 Storm C4.7 Characteristics of Flooding Whartons Creek Catchment August 1998 Storm C4.8 Characteristics of Flooding Collins Creek Catchment August 1998 Storm C4.9 Characteristics of Flooding Collins Creek Catchment August 1998 Storm C4.10 Characteristics of Flooding Farrahars Creek and Bellambi Gully Catchments August 1998
Storm C4.11 Characteristics of Flooding Bellambi Gully and Bellambi Lake Catchments August 1998
Storm C4.12 Characteristics of Flooding Bellambi Gully Catchment August 1998 Storm C4.13 Characteristics of Flooding Bellambi Gully Catchment August 1998 Storm C4.14 Characteristics of Flooding Bellambi Lake Catchment August 1998 Storm C4.15 Characteristics of Flooding Bellambi Lake Catchment August 1998 Storm C4.16 Water Surface Profile Main Arm of Whartons Creek Drainage System August 1998 Storm C4.17 Water Surface Profile Main Arm of Collins Creek Drainage System August 1998 Storm C4.18 Water Surface Profile Main Arm of Bellambi Gully Drainage System August 1998 Storm C4.19a Water Surface Profile Main Arm of Bellambi Lake Drainage System August 1998 Storm C4.19b Water Surface Profile Main Arm of Bellambi Lake Drainage System August 1998 Storm C4.20 Discharge Hydrographs at Whartons Creek Ocean Outlet August 1998 Storm C4.21 Discharge Hydrographs at Collins Creek Ocean Outlets August 1998 Storm C4.22 Discharge Hydrographs at Bellambi Gully Ocean Outlet August 1998 Storm C4.23 Discharge Hydrographs at Bellambi Lake Ocean Outlet August 1998 Storm

Combined Catchments of Whartons, Collins and Farrahars Creeks, Bellambi Gully and Bellambi Lake Flood Study Appendix C - Analysis of Historic Floods and Model Tuning
Combined FS Appendix C.doc Page C1 Lyall & Associates 30 March 2011 Rev. 3.0 Consulting Water Engineers
C1. SYNOPSIS This Appendix deals with the selection of historic floods for the tuning of the RAFTS hydrologic and TUFLOW hydrodynamic computer based models of the study catchments, the analysis of rainfall data for those events and the tuning process. Historic flood data is available for storms which occurred on 20 October 1987, 30 April 1988 and 17 August 1998. The historic flood data comprises rainfall depths which were recorded at a number of pluviographic stations located both within and immediately adjacent to the study area, in addition to a number of flood marks which are contained in a database held by WCC. An initial appraisal was carried out of the rainfall which was recorded by the pluviographic stations during the three historic storms. Further inspection of the data showed that the majority of available flood marks associated with the two storms which occurred in the 1980’s are located in areas where major development has since occurred. As a result, the large storm that occurred on 17 August 1998 and caused major flooding in the study area was considered to be the only historic storm which could be used to tune both the hydrologic and hydraulic models. For hydrologic modelling in the flood study, the practical choice was between the models known as RAFTS, RORB and WBNM, and any of these would have been suitable. Each of these models converts storm rainfall to discharge hydrographs using a procedure known as runoff-routing. There was little to choose technically between these models, however, the use of the RAFTS modelling approach in the preparation of a flood study for the adjacent catchment of Towradgi Creek (BC, 2003) was the determining factor in its selection for use in this present study. In the middle and lower reaches of the drainage system, where flooding is of main concern to WCC, the pattern of flow required the implementation of a two dimensional model capable of analysing the time varying affects of flows from the local catchments, the routing effects of the floodplain storage and the impact of varying tailwater conditions which result from inshore ocean conditions. The model also needed to be capable of defining the pattern of flow which is heavily influenced by features on the floodplain such as buildings or other obstructions and where flow paths cannot readily be identified from site inspection. Furthermore, several breakouts of flow have been observed to occur as a result of blockage of culverts and bridges. The model therefore needed to be capable of defining the location where these breakouts will occur and the direction floodwaters will take once it leaves the creek system of origin. The TUFLOW modelling software is one of only a few commercially available hydraulic models which contain all the features described above, and was therefore adopted for use in this present study. The model is "fully dynamic" and once tuned will provide an accurate representation of existing flood behaviour in terms of depth, velocity and distribution of flow. The geometric models of the study creeks were based principally on WCC’s ALS data, supplemented by field survey of the inbank area of the various watercourses and their drainage structures. Work-As-Executed drawings provided by WCC of several drainage structures (eg the major flood retarding basin) were also used to supplement the field data. RAFTS model parameters adopted as part of the flood study on the adjacent catchment of Towradgi Creek (BC, 2003) were found to generate discharge hydrographs, which when applied to the tuned TUFLOW hydraulic model, gave a reasonable fit to historic flood data.

Combined Catchments of Whartons, Collins and Farrahars Creeks, Bellambi Gully and Bellambi Lake Flood Study Appendix C - Analysis of Historic Floods and Model Tuning
Combined FS Appendix C.doc Page C2 Lyall & Associates 30 March 2011 Rev. 3.0 Consulting Water Engineers
There were a few locations where modelled flood levels were found to lie outside a ±300 mm range when compared to the recorded flood data. Further investigation was carried out in these areas whereby adjustments were made to the TUFLOW model in an endeavour to reduce the difference in recorded versus modelled flood levels. Adjustments were also made to the Whartons Creek TUFLOW model after the exhibition of the draft report, in an attempt to replicate observed flood behaviour in properties located immediately west of Trinity Row. A brief discussion on the findings of the investigations and the conclusions which were reached are contained in this Appendix.

Combined Catchments of Whartons, Collins and Farrahars Creeks, Bellambi Gully and Bellambi Lake Flood Study Appendix C - Analysis of Historic Floods and Model Tuning
Combined FS Appendix C.doc Page C3 Lyall & Associates 30 March 2011 Rev. 3.0 Consulting Water Engineers
C2. HISTORIC FLOODING IN THE STUDY CATCHMENTS C2.1 October 1987 Flood Rainfall records for the storm which commenced at around 0300 hours on 19 October 1987 and ended at around 1730 hours on 20 October 1987 show that rainfall fell steadily over a 38.5 hour period, but was not very intense. The total depth of rain which fell in the 48 hour period commencing at midnight on 18 October 1987 ranged from 192 mm [Bulli Pass] to 218 mm [Beth Salem]. Figure C2.1 shows the 48 hour rainfall isohyets and Figure C2.2 shows the cumulative rainfall depths for this period. Based on the rainfall records for Bulli Pass, Russell Vale and Corrimal (Collins Street), bursts of rainfall embedded in the 38.5 hour long storm were equivalent to a 1 in 2 year event for periods of between 1 and 3 hours. For periods of less than 1 hour, rainfall was equivalent to only a 1 in 1 year event. C2.2 April 1988 Flood Rainfall records show that rain commenced to fall in the study area at around 0300 hours on 28 April 1988 and continued largely unabated for a period of approximately 65 hours to around 2000 hours on 1 April 1988. Approximately 100 mm of rain fell over the first 21 hours of the storm to midnight on 28 April 1988. After that, total rainfall depths ranged between 277 mm [Corrimal] and 309 mm [Rixons Pass and Bulli Pass] for the 48 hour period commencing at midnight of 28 April 1988. Figure C2.3 shows the 48 hour rainfall isohyets for this latter period, whilst Figure C2.4 shows the cumulative rainfall depths over the full duration of the storm. Based on the rainfall records for Rixons Pass, Russell Vale and Corrimal (Collins Street) (568153), bursts of rainfall embedded in the 65 hour long storm were equivalent to between a 3 and 5 year event for periods of up to 3 hours. Just to the north of the study catchments, the Bulli Pass pluviograph recorded a 3 hour burst of rainfall which was equivalent to a 1 in 9 year event. Flood data collected by WCC suggests that the depth of flooding in the residential area adjacent to the Princes Highway in the Whartons Creek catchment was approximately 600 mm during this storm event. C2.3 August 1998 Flood Rainfall records show that up to 100 mm of rain fell on the study catchments over a 15 hour period on the rain day of 15 August 1998. The records show that heavy rainfall abated at about 1100 hours on 16 August 1998 before recommencing at around 0300 hours on 17 August 1998. It then continued unabated for a period of approximately 30 hours to around 0900 hours on 18 August 1998. The most intense rain was recorded between 1800 and 2100 hours on 17 August 1998.

Combined Catchments of Whartons, Collins and Farrahars Creeks, Bellambi Gully and Bellambi Lake Flood Study Appendix C - Analysis of Historic Floods and Model Tuning
Combined FS Appendix C.doc Page C4 Lyall & Associates 30 March 2011 Rev. 3.0 Consulting Water Engineers
The total rainfall recorded on the rain day of 17 August 1998 ranged from 313 mm [Corrimal] to 441 mm [Rixons Pass]. Figure C2.5 shows the 24 hour rainfall isohyets for the rain day of 18 August 1998, whilst Figure C2.6 shows the cumulative rainfall depths for the five day rain day period commencing the 15 August 1998. The recorded rainfall depths exceeded a 1 in 100 year event at the Bulli and Rixons Pass gauge for periods of between 1 and 3 hours. Rainfall intensities recorded at gauges located east of the Bulli and Rixons Pass gauges were less. For example, the Russell Vale gauge recorded rainfall intensities equivalent to a 1 in 50 year event for periods of up to 3 hours and the Corrimal (Collins Street) gauge recorded rainfall intensities equivalent to a 1 in 40 year event for periods of up to 1 hour and only a 1 in 20 year event for periods of between 1 and 3 hours.

Combined Catchments of Whartons, Collins and Farrahars Creeks, Bellambi Gully and Bellambi Lake Flood Study Appendix C - Analysis of Historic Floods and Model Tuning
Combined FS Appendix C.doc Page C5 Lyall & Associates 30 March 2011 Rev. 3.0 Consulting Water Engineers
C3. HYDROLOGY C3.1 Review of RAFTS Modelling Approach
The RAFTS software converts storm rainfall to discharge hydrographs using a procedure known as runoff-routing and envisages the catchment to be comprised of a series of concentrated storages which represent sub-catchments defined on watershed lines, plus concentrated special storages which could simulate flood storage areas.
Each sub-catchment model is represented by a series of ten non-linear concentrated cascading storages. Within RAFTS each of the subareas in a sub-catchment is treated as a concentrated storage with a storage-discharge relation:
S = k(Q)Q (C3.1)
k(Q) = BQn (C3.2) The parameters n and B represent the catchment non-linearity and sub-catchment storage delay coefficient respectively and roughly equate to the parameters m and k in RORB. The storage delay coefficient B is either directly input for each sub-catchment or estimated from equation C3.3 which was derived by Aitken (1975).
Bav = 0.285 A0.52 (1+U)-1.97Sc-0.50 (C3.3)
Where: Bav = mean value of coefficient B for each sub-catchment; A = sub-catchment area (km2); U = fraction of catchment that is urbanised (where U = 1.0, the catchment is fully
urbanised and when U = 0.0, the catchment is completely rural); and Sc = main drainage slope of the sub-catchment (%).
Reduced values of B tend to indicate steeply rising flood hydrographs where times of concentration are relatively short. Table C3.1 summarises the effects of urbanisation and catchment slope on the storage delay parameter B for a catchment with an area of 1 km2. Note that slopes of between 2 and 5 per cent are characteristic of urbanised areas which lie close to the coastline, whilst slopes of between 10 and 20 per cent are characteristic of urbanised areas which lie in the middle reaches of the study creeks. Slopes of between 20 and 30 per cent are characteristic of the heavily wooded slopes of the Illawarra Escarpment.
By comparison of the values given in Table C3.1, it can be seen that the relatively steep undeveloped slopes of the Illawarra Escarpment would have an unadjusted storage delay coefficient similar to a fully urbanised catchment located close to the coastline, indicating that response times of runoff from the escarpment area are comparatively short. Whilst this result is expected, the original regression equation (refer equation C3.3) does not differentiate between catchments with the same degree of urbanisation but different roughness (i.e. it does not take account of the retardation effects of runoff flowing off say a heavily wooded catchment versus one that has been cleared as a result of urbanisation).

Combined Catchments of Whartons, Collins and Farrahars Creeks, Bellambi Gully and Bellambi Lake Flood Study Appendix C - Analysis of Historic Floods and Model Tuning
Combined FS Appendix C.doc Page C6 Lyall & Associates 30 March 2011 Rev. 3.0 Consulting Water Engineers
TABLEC3.1 VALUES OF STORAGE DELAY COEFFICIENT B(1)
AS A FUNCTION OF URBANISATION AND MAIN DRAINAGE SLOPE
Degree of Urbanisation
Main Drainage Slope (%)
2 5 10 20 30
0 0.202 0.127 0.090 0.064 0.052
0.25 0.130 0.082 0.058 0.041 0.034
0.5 0.091 0.057 0.041 0.029 0.023
0.75 0.067 0.042 0.030 0.021 0.017
1 0.051 0.033 0.023 0.016 0.013
1. Refer equation C3.3 for derivation of the storage delay coefficient values An additional empirical parameter was therefore added to the RAFTS code by the software developers to take pervious sub-catchment roughness into account. The parameter PERN is inputted as a Mannings ‘n’ representation of the average sub-catchment roughness. The storage delay coefficient is then modified in accordance with the following:
PERN or Mannings ‘n’ value Multiplication Factor
0.010 0.4
0.015 0.5
0.025 1.0
0.1 3.0
From the above values of PERN, it can be seen that the adoption of a value equal to 0.025 will give a multiplication factor of 1.0 for B. This value of PERN is commonly adopted by practitioners when describing the “roughness” of urbanised catchments. The higher value of PERN given above (i.e. the value of 0.1) may be considered representative of the heavily wooded slopes of the escarpment area and as such will result in a multiplier of 3.0 being applied to the computed value of B. For the purpose of this present investigation, a PERN value of 0.1 was applied to those sub-catchments which describe the steep heavily wooded regions of the Illawarra Escarpment, whilst a PERN value of 0.025 was applied to those sub-catchments which describe the urbanised areas in the middle and lower reaches of the study creeks. This set of parameters is considered to best represent the runoff-routing characteristics of the study catchments and their drainage lines. It is also consistent with the set of parameters which were found to give a good fit to historic flood data recorded in the adjacent catchment of Towradgi Creek (BC, 2003).

Combined Catchments of Whartons, Collins and Farrahars Creeks, Bellambi Gully and Bellambi Lake Flood Study Appendix C - Analysis of Historic Floods and Model Tuning
Combined FS Appendix C.doc Page C7 Lyall & Associates 30 March 2011 Rev. 3.0 Consulting Water Engineers
C3.2 RAFTS Model Layouts
The layout of the RAFTS models which were set up to represent the study catchments is shown on Figures C3.1 to C3.3. Note that the lumped storages associated with the five large flood retarding basins which are located in the study area (refer Appendix A for details) were not modelled in RAFTS. Rather, details of the basins were incorporated into the TUFLOW hydraulic model and their impact on flood behaviour assessed using this modelling approach (refer Section C4 for further details). C3.3 RAFTS Model Calibration As there were no historic data on storm flows discharging to the South Pacific Ocean for each of the study catchments, the procedure adopted for the calibration of the RAFTS models involved an iterative process sometimes referred to as “tuning”. This process involved the generation of discharge hydrographs for the historic storm which occurred in August 1998 using a selected set of RAFTS model parameters. The discharge hydrographs were then input to the TUFLOW hydraulic model, which was then run with an initial set of hydraulic roughness parameters and the resulting flood levels compared with recorded flood marks. Several iterations of this process are usually required, whereby changes need to be made to the RAFTS model parameters after which the resulting adjusted discharge hydrographs are input to the hydraulic model in a continued attempt to achieve a good fit with recorded data. However, the starting point for the tuning of the RAFTS model for this present study was the adoption of the parameters which were found to give a reasonable fit to historic flood data recorded in the adjacent catchment of Towradgi Creek (BC, 2003). It was found that this common set of RAFTS model parameters generated discharge hydrographs, which when applied to the tuned TUFLOW hydraulic model, gave a reasonable fit to historic flood data in the study area. C3.4 RAFTS Model Parameters
The Towradgi Creek catchment comprises similar features which influence the rainfall-runoff process (e.g. topography and degree of urbanisation). The RAFTS model parameters adopted for modelling the August 1998 storm in the Towradgi Creek study (BC, 2003) were as follows:
an initial loss of 0 mm and a continuing loss of 2.5 mm/h for pervious areas, and 0 mm and 0 mm/h respectively for impervious areas;
a Bx factor of -0.285, reflecting a non-linear approach to modelling the flood wave down the catchments; and
a “PERN” value of 0.025 for urbanised areas and a value of 0.1 for the heavily wooded escarpment areas.
Given the close proximity of the Towradgi Creek catchment to the study area, the set of parameters adopted for the 2003 study were used as the starting point for modelling historic flood behaviour in the study area.

Combined Catchments of Whartons, Collins and Farrahars Creeks, Bellambi Gully and Bellambi Lake Flood Study Appendix C - Analysis of Historic Floods and Model Tuning
Combined FS Appendix C.doc Page C8 Lyall & Associates 30 March 2011 Rev. 3.0 Consulting Water Engineers
C3.5 Application of Historic Rainfall to the RAFTS Model The isohyetal map for the August 1998 storm (Figure C2.5) was digitised and converted into a three-dimensional surface plot using the 12D, Vertical Mapper and MAPINFO software packages. The total depth of rainfall at the centroid of each sub-catchment was extracted from the three-dimensional surface plot and then used to factor the rainfall which was recorded at the various pluviographic rainfall gauging stations. Temporal variability was built into the models by assigning gauge data to the various sub-catchments based on the thiesson polygon approach. Further discussion on the flows generated by the RAFTS model at the outlet of the various drainage systems is contained in Section C5. C3.6 RAFTS Model Results Peak flows at key locations along the study reaches for the August 1998 storm are given in Tables C3.2 to C3.5.
TABLE C3.2 PEAK DISCHARGES(1)
WHARTONS CREEK CATCHMENT 17 AUGUST 1998 STORM
Watercourse Location RAFTS Node No.
Peak Discharge
(m3/s)
Main Arm
Inflow to TUFLOW Model 23.01 22.8
Inlet of twin 1500 RCP’s at Gordon Hutton Park Detention Basin
23.02 29.3
Hospital Road 23.05 31.9
Princes Highway 23.08 40.6
Illawarra Railway Line 23.09 45.0
Ocean Outlet 23.14 57.5
Tributary 1 Inflow to TUFLOW Model 24.00 0.9
Tributary 2 Inflow to TUFLOW Model 25.00 0.9
At rear of houses along Organs Road 25.01 4.2
1. Flood retarding basin in Gordon Hutton Park not modelled in RAFTS. Values given on the main arm of Whartons Creek downstream of RAFTS Model Node 23.02 therefore represent un-attenuated flow conditions.
Combined Catchments of Whartons, Collins and Farrahars Creeks, Bellambi Gully and Bellambi Lake Flood Study Appendix C - Analysis of Historic Floods and Model Tuning
Combined FS Appendix C.doc Page C9 Lyall & Associates 30 March 2011 Rev. 3.0 Consulting Water Engineers
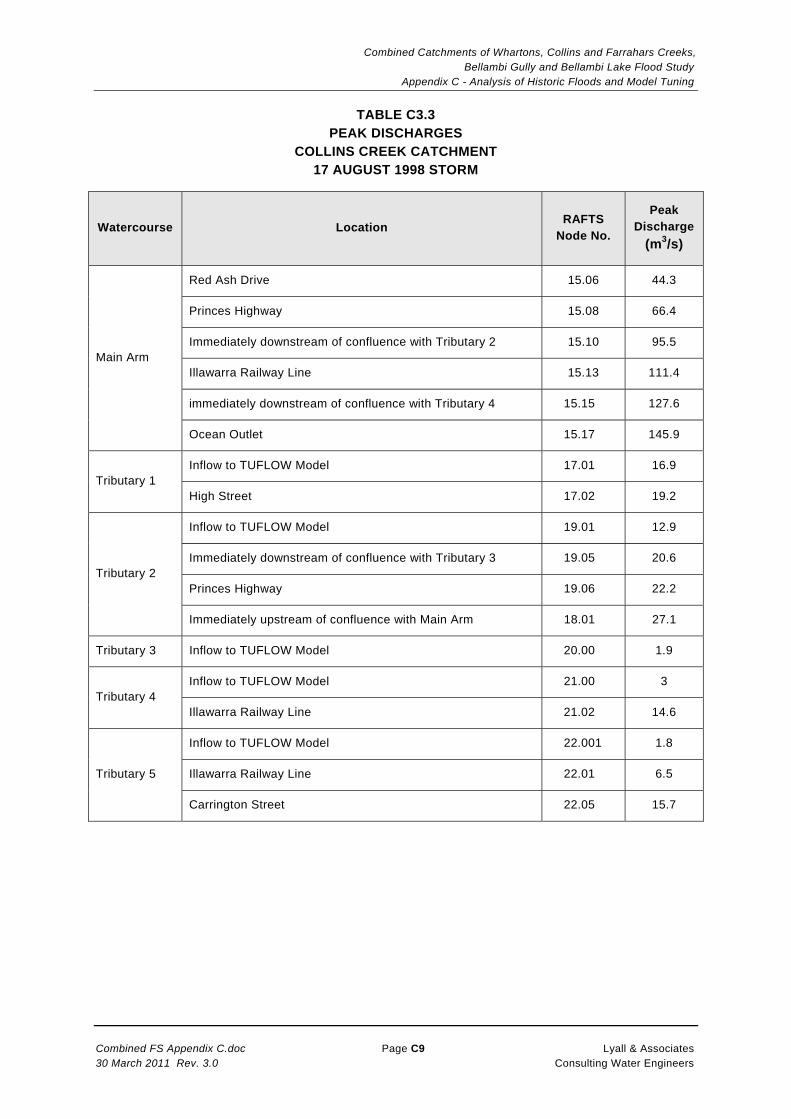
TABLE C3.3 PEAK DISCHARGES
COLLINS CREEK CATCHMENT 17 AUGUST 1998 STORM
Watercourse Location RAFTS Node No.
Peak Discharge
(m3/s)
Main Arm
Red Ash Drive 15.06 44.3
Princes Highway 15.08 66.4
Immediately downstream of confluence with Tributary 2 15.10 95.5
Illawarra Railway Line 15.13 111.4
immediately downstream of confluence with Tributary 4 15.15 127.6
Ocean Outlet 15.17 145.9
Tributary 1 Inflow to TUFLOW Model 17.01 16.9
High Street 17.02 19.2
Tributary 2
Inflow to TUFLOW Model 19.01 12.9
Immediately downstream of confluence with Tributary 3 19.05 20.6
Princes Highway 19.06 22.2
Immediately upstream of confluence with Main Arm 18.01 27.1
Tributary 3 Inflow to TUFLOW Model 20.00 1.9
Tributary 4 Inflow to TUFLOW Model 21.00 3
Illawarra Railway Line 21.02 14.6
Tributary 5
Inflow to TUFLOW Model 22.001 1.8
Illawarra Railway Line 22.01 6.5
Carrington Street 22.05 15.7

Combined Catchments of Whartons, Collins and Farrahars Creeks, Bellambi Gully and Bellambi Lake Flood Study Appendix C - Analysis of Historic Floods and Model Tuning
Combined FS Appendix C.doc Page C10 Lyall & Associates 30 March 2011 Rev. 3.0 Consulting Water Engineers
TABLE C3.4 PEAK DISCHARGES(1)
BELLAMBI GULLY/FARRAHARS CREEK CATCHMENT 17 AUGUST 1998 STORM
Watercourse Location RAFTS Node No.
Peak Discharge
(m3/s)
Main Arm
Inflow to TUFLOW Model 12.01 20.1
Princes Highway 12.022 25.6
Northern Distributor Extension 12.04 32.6
Illawarra Railway Line 12.06 37.6
Extension of Bellambi Road 12.09 49.2
Immediately downstream of confluence with Tributary 1 5.16 177.7
Ocean outlet 5.18 188.6
Tributary 1
Inflow to TUFLOW Model 7.00 3
Princes Highway 7.01 4.9
Northern Distributor Extension 7.06 15.9
Tributary 2
Inflow to TUFLOW Model (inflow to basin in mine) 5.01 26.3
Princes Highway 5.05 29.4
Northern Distributor Extension 5.12 54.9
Farrahars Creek
Inflow to TUFLOW Model 6.00 10.1
Princes Highway 6.011 15.6
Immediately upstream of Collaery Road 6.03 19.7
Immediately upstream of confluence with Tributary 2 6.04 20.9
Tributary 3(1)
Inflow to TUFLOW Model 8.01 16
Princes Highway 8.05 28.2
Northern Distributor Extension 8.07 35.9
Illawarra Railway Line 8.09 55.6
Immediately upstream of confluence with Farrahar’s Creek 8.10 56.7
Tributary 4 Inflow to TUFLOW Model (Princes Highway) 9.00 2.3
1. Flood storage present in retarding basin located south of the Edgewood Estate (i.e. Basin No. 1) on Tributary 3 not modelled in RAFTS. Values given downstream of the basin therefore represent un-attenuated flow conditions.
Combined Catchments of Whartons, Collins and Farrahars Creeks, Bellambi Gully and Bellambi Lake Flood Study Appendix C - Analysis of Historic Floods and Model Tuning
Combined FS Appendix C.doc Page C11 Lyall & Associates 30 March 2011 Rev. 3.0 Consulting Water Engineers
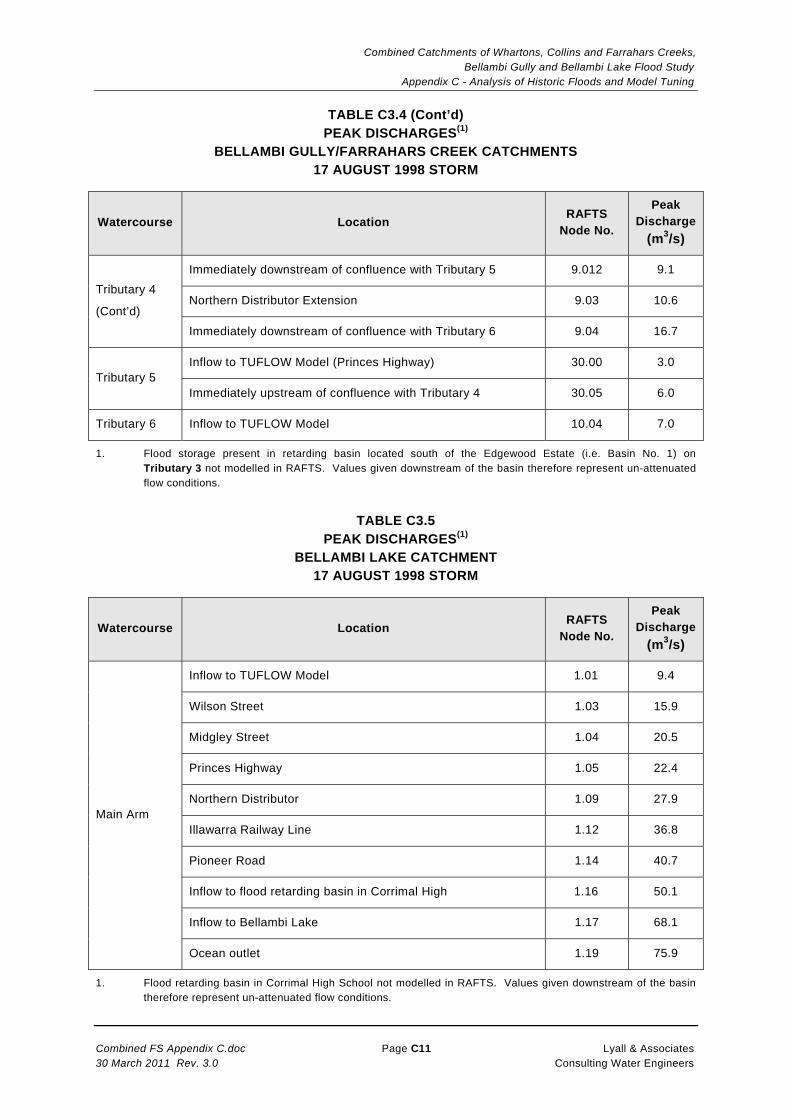
TABLE C3.4 (Cont’d) PEAK DISCHARGES(1)
BELLAMBI GULLY/FARRAHARS CREEK CATCHMENTS 17 AUGUST 1998 STORM
Watercourse Location RAFTS Node No.
Peak Discharge
(m3/s)
Tributary 4
(Cont’d)
Immediately downstream of confluence with Tributary 5 9.012 9.1
Northern Distributor Extension 9.03 10.6
Immediately downstream of confluence with Tributary 6 9.04 16.7
Tributary 5 Inflow to TUFLOW Model (Princes Highway) 30.00 3.0
Immediately upstream of confluence with Tributary 4 30.05 6.0
Tributary 6 Inflow to TUFLOW Model 10.04 7.0
1. Flood storage present in retarding basin located south of the Edgewood Estate (i.e. Basin No. 1) on Tributary 3 not modelled in RAFTS. Values given downstream of the basin therefore represent un-attenuated flow conditions.
TABLE C3.5
PEAK DISCHARGES(1) BELLAMBI LAKE CATCHMENT
17 AUGUST 1998 STORM
Watercourse Location RAFTS Node No.
Peak Discharge
(m3/s)
Main Arm
Inflow to TUFLOW Model 1.01 9.4
Wilson Street 1.03 15.9
Midgley Street 1.04 20.5
Princes Highway 1.05 22.4
Northern Distributor 1.09 27.9
Illawarra Railway Line 1.12 36.8
Pioneer Road 1.14 40.7
Inflow to flood retarding basin in Corrimal High 1.16 50.1
Inflow to Bellambi Lake 1.17 68.1
Ocean outlet 1.19 75.9
1. Flood retarding basin in Corrimal High School not modelled in RAFTS. Values given downstream of the basin therefore represent un-attenuated flow conditions.

Combined Catchments of Whartons, Collins and Farrahars Creeks, Bellambi Gully and Bellambi Lake Flood Study Appendix C - Analysis of Historic Floods and Model Tuning
Combined FS Appendix C.doc Page C12 Lyall & Associates 30 March 2011 Rev. 3.0 Consulting Water Engineers
[Page Intentionally Left Blank]

Combined Catchments of Whartons, Collins and Farrahars Creeks, Bellambi Gully and Bellambi Lake Flood Study Appendix C - Analysis of Historic Floods and Model Tuning
Combined FS Appendix C.doc Page C13 Lyall & Associates 30 March 2011 Rev. 3.0 Consulting Water Engineers
C4. HYDRAULICS C4.1 The TUFLOW Modelling Approach TUFLOW is a true two-dimensional hydraulic model which does not rely on a prior knowledge of the pattern of flood flows in order to set up the various fluvial and weir type linkages which describe the passage of a flood wave through the system. The basic equations of TUFLOW involve all of the terms of the St Venant equations of unsteady flow. Consequently the model is "fully dynamic" and once tuned will provide an accurate representation of existing flood behaviour in terms of depth, velocity and distribution of flow. TUFLOW solves the equations of flow at each point of a rectangular grid system which represent overland flow on the floodplain and along streets. The choice of grid point spacing depends on the need to accurately represent features on the floodplain which influence hydraulic behaviour and flow patterns (e.g. buildings, streets, changes in channel and floodplain dimensions, hydraulic structures which influence flow patterns, etc). Pipe drainage and channel systems can be modelled as one-dimensional elements embedded in the larger two-dimensional domain which typically represents the wider floodplain. Flows are able to move between the one and two-dimensional elements of the model depending on the capacity characteristics of the drainage system being modelled. The TUFLOW software allows for the assessment of potential flood management measures, such as detention storage, increased channel and floodway dimensions, augmentation of culverts and bridge crossing dimensions, diversion banks and levee systems. C4.2 TUFLOW Model Layouts Two TUFLOW models were set up to represent the various fluvial and weir type linkages which comprise the drainage systems of the study area. The first model covers the Whartons Creek catchment (Figure C4.1), whilst the second covers the catchments of Collins Creek, Farrahars Creek, Bellambi Gully and Bellambi Lake (Figures C4.2 to C4.4). The larger of the two model was set up to assess the impact the transfer of flood flows between each of the catchments will have on flood behaviour. A 5 m grid spacing was found to provide the appropriate balance between the need to define features on the floodplain versus model run times. Grid elevations were based on WCC’s DTM of the catchment, with ridge and gully lines added to the model where the grid spacing was considered too course to accurately represent important topographic features. Four hundred and forty eight cross sections derived from field survey were used to define the inbank waterway area of the drainage systems. Field survey data were used to define the waterway areas of 75 bridges, 105 pipe and 116 culvert transverse drainage structures. The footprints of a large number of individual buildings located in the two-dimensional model domain were digitised and assigned an artificially high hydraulic roughness value which accounted for their blocking effect on flow whilst maintaining storage in the model.

Combined Catchments of Whartons, Collins and Farrahars Creeks, Bellambi Gully and Bellambi Lake Flood Study Appendix C - Analysis of Historic Floods and Model Tuning
Combined FS Appendix C.doc Page C14 Lyall & Associates 30 March 2011 Rev. 3.0 Consulting Water Engineers
Fenced properties where also digitised and assigned an artificially high hydraulic roughness value (although not as high as for individual buildings) to account for the reduction in conveyance capacity which will result from the fences and other obstructions stored on these properties. During the preparation of the flood study, the scope of the investigation was increased to include the pipe drainage system which controls runoff converging on a sag in the Princes Highway east of the Edgewood Estate (refer Tributary 5 in the Bellambi Gully system). Initial runs of the TUFLOW model showed that flow surcharging the pipe drainage system on Tributary 5 transfers into the catchment which contributes flow to an existing 900 mm diameter pipe, the outlet of which is located to the east of Alice Street (i.e. into the catchment which contributes flow along Tributary 6 in the Bellambi Gully system). To better represent local flood behaviour along Tributary 6, a pipe drainage system was incorporated into the TUFLOW model extending upstream to a location east of Chenhalls Street. The adopted pipes ranged in diameter between 375 and 900 mm. The location of the inlet pits associated with the pipe drainage system was based on a review of the ALS data and aerial photography. During the next stage of the study, WCC will need to obtain survey of this pipe drainage system in order to more accurately model flood behaviour in this area. C4.3 Adjustments to TUFLOW Model to Take Account of Development Several large residential developments have been constructed in the past two decades. The adjustments which were made to the TUFLOW model structure to reflect the changes which are associated with these developments are briefly described below. Magnolia Green Development The Magnolia Green development in the Whartons Creek catchment was constructed in the mid-1990’s and was impacted upon by floodwaters which surcharged the flood retarding basin in Gordon Hutton Park during the large storm which occurred in August 1998. The final landform in the development is reflected in WCC’s DTM and could be easily incorporated into the TUFLOW model. Details of the basin and its spillways were taken from the design plans provided by Council, in combination with an inspection of the DTM. Lang Street and Ball Street, Woonona Developments The subdivision of several relatively large parcels of land which lie to the west of the Princes Highway along Lang Street and Ball Street in the Collins Creek catchment occurred in the 1990’s. Results generated by the TUFLOW model for the August 1998 storm were found not to fit the recorded flood levels which are located to the east (downstream) of the subdivided land in the vicinity of the Princes Highway. It was subsequently found that WCC’s DTM included a property to the west of Ball Street which had been developed post the August 1998 storm. The TUFLOW model results were found to give a reasonable fit with the recorded flood level data in this area after the development was removed.
Combined Catchments of Whartons, Collins and Farrahars Creeks, Bellambi Gully and Bellambi Lake Flood Study Appendix C - Analysis of Historic Floods and Model Tuning
Combined FS Appendix C.doc Page C15 Lyall & Associates 30 March 2011 Rev. 3.0 Consulting Water Engineers
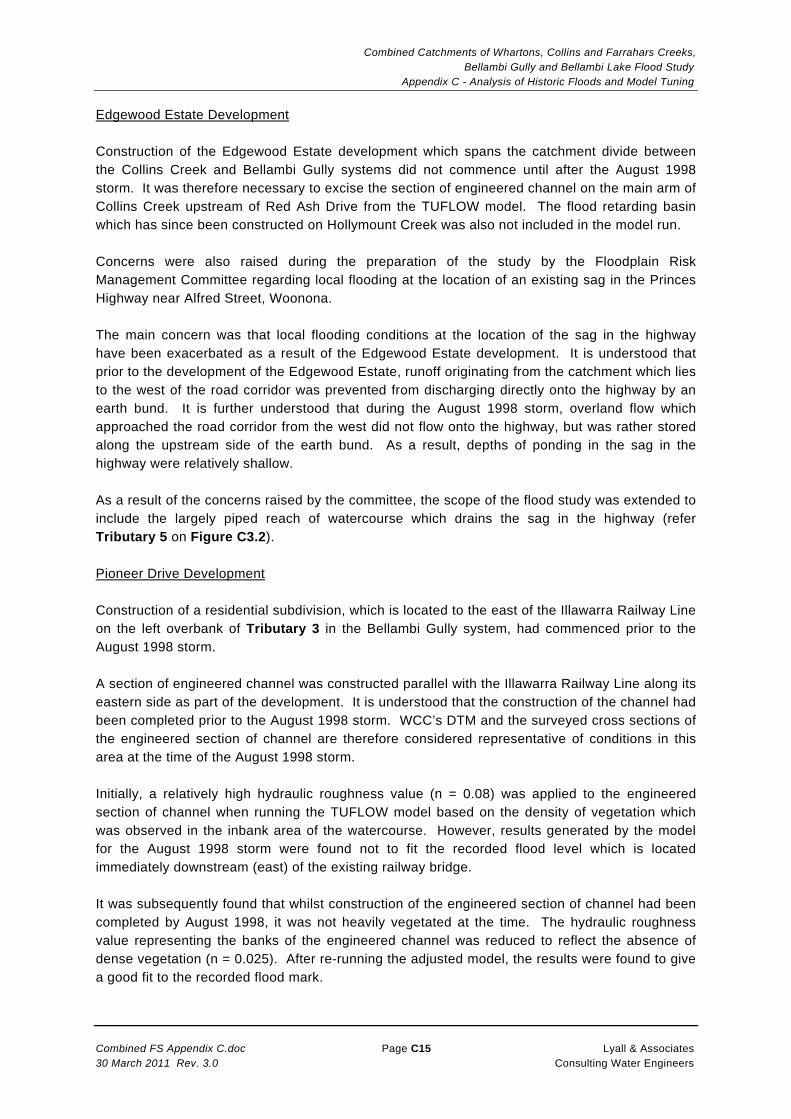
Edgewood Estate Development Construction of the Edgewood Estate development which spans the catchment divide between the Collins Creek and Bellambi Gully systems did not commence until after the August 1998 storm. It was therefore necessary to excise the section of engineered channel on the main arm of Collins Creek upstream of Red Ash Drive from the TUFLOW model. The flood retarding basin which has since been constructed on Hollymount Creek was also not included in the model run. Concerns were also raised during the preparation of the study by the Floodplain Risk Management Committee regarding local flooding at the location of an existing sag in the Princes Highway near Alfred Street, Woonona. The main concern was that local flooding conditions at the location of the sag in the highway have been exacerbated as a result of the Edgewood Estate development. It is understood that prior to the development of the Edgewood Estate, runoff originating from the catchment which lies to the west of the road corridor was prevented from discharging directly onto the highway by an earth bund. It is further understood that during the August 1998 storm, overland flow which approached the road corridor from the west did not flow onto the highway, but was rather stored along the upstream side of the earth bund. As a result, depths of ponding in the sag in the highway were relatively shallow. As a result of the concerns raised by the committee, the scope of the flood study was extended to include the largely piped reach of watercourse which drains the sag in the highway (refer Tributary 5 on Figure C3.2). Pioneer Drive Development Construction of a residential subdivision, which is located to the east of the Illawarra Railway Line on the left overbank of Tributary 3 in the Bellambi Gully system, had commenced prior to the August 1998 storm. A section of engineered channel was constructed parallel with the Illawarra Railway Line along its eastern side as part of the development. It is understood that the construction of the channel had been completed prior to the August 1998 storm. WCC’s DTM and the surveyed cross sections of the engineered section of channel are therefore considered representative of conditions in this area at the time of the August 1998 storm. Initially, a relatively high hydraulic roughness value (n = 0.08) was applied to the engineered section of channel when running the TUFLOW model based on the density of vegetation which was observed in the inbank area of the watercourse. However, results generated by the model for the August 1998 storm were found not to fit the recorded flood level which is located immediately downstream (east) of the existing railway bridge. It was subsequently found that whilst construction of the engineered section of channel had been completed by August 1998, it was not heavily vegetated at the time. The hydraulic roughness value representing the banks of the engineered channel was reduced to reflect the absence of dense vegetation (n = 0.025). After re-running the adjusted model, the results were found to give a good fit to the recorded flood mark.

Combined Catchments of Whartons, Collins and Farrahars Creeks, Bellambi Gully and Bellambi Lake Flood Study Appendix C - Analysis of Historic Floods and Model Tuning
Combined FS Appendix C.doc Page C16 Lyall & Associates 30 March 2011 Rev. 3.0 Consulting Water Engineers
[Page Intentionally Left Blank]

Combined Catchments of Whartons, Collins and Farrahars Creeks, Bellambi Gully and Bellambi Lake Flood Study Appendix C - Analysis of Historic Floods and Model Tuning
Combined FS Appendix C.doc Page C17 Lyall & Associates 30 March 2011 Rev. 3.0 Consulting Water Engineers
C5. DISCUSSION ON RESULTS OF MODEL TUNING PROCESS C5.1 Presentation of Results Figure C4.5 is a key map showing the layout of ten plans (Figures C4.6 to C4.15) on which the results of modelling the 17 August 1998 flood are presented. The locations of several flood marks which were recorded in the study area either during or immediately after the August 1998 storm are also shown on the plans. Tables showing the elevation of the recorded flood levels and the corresponding modelled flood level (both in m AHD) and the difference between each (in metres) have been incorporated onto the plans. Longitudinal sections showing the peak water surface profile for the 17 August 1998 flood along the main arm of each drainage system are presented on Figures C4.16 to C4.19b. Also shown on the longitudinal sections are the location and elevation of those flood marks which were recorded along the main arm of each drainage line. Discharge hydrographs at the four ocean outlets are presented in Figures C4.20 to C4.23. Hydrographs generated by both the RAFTS and TUFLOW models have been shown for comparative purposes. C5.2 Comparison with Observed Flood Behaviour During the preparation of the flood study, the following flood behaviour was observed by several residents:
i) the confined nature of floodwaters along the main arm of Wharton Creek north of Corrie Road. One resident reported that floodwaters did not surcharge the right bank of the creek in this area;
ii) the flow of water through a residential unit block which is located to the south of the sag in Farrell Road in the Whartons Creek catchment;
iii) the breakout of floodwaters from the left bank of Whartons Creek immediately upstream of the Franklin Avenue culverts;
iv) the absence of floodwater in properties located along Godolphin Street and Jardine Street in the Whartons Creek catchment;
v) the ponding of floodwaters on the upstream (western) side of the Illawarra Railway Line on the main arm of the Bellambi Gully system;
vi) the breakout of floodwaters which occurred on the main arm of the Bellambi Gully system upstream (west) of Gladstone Street;
vii) the flow of water through several residential properties which are located along West Street in the upper reaches of Tributary 2 in the Bellambi Gully drainage system;
viii) the ponding of floodwaters west (upstream) of York Road on Tributary 3 of the Bellambi Gully system; and
ix) the absence of floodwater in properties which back on to Hollymount Park along Stanhope Street.

Combined Catchments of Whartons, Collins and Farrahars Creeks, Bellambi Gully and Bellambi Lake Flood Study Appendix C - Analysis of Historic Floods and Model Tuning
Combined FS Appendix C.doc Page C18 Lyall & Associates 30 March 2011 Rev. 3.0 Consulting Water Engineers
The tuned TUFLOW models were found to reproduce the above observed flood behaviour when run for the 17 August 1998 flood, with the exception of the observed flood behaviour noted under points iv) and ix). Following the completion of the public exhibition phase of the draft Flood Study report, both these areas were inspected to ascertain reasons for why the hydraulic model was not reproducing observed flood behaviour. In respect to the comment regarding the absence of flooding in properties located along Godolphin Street and Jardine Street, the following refinements were made to the Whartons Creek TUFLOW model in an attempt to replicate reported flood behaviour:
The inclusion of a 1-dimensional element representing a shallow grassed and concrete lined drain which was observed running along the western side of the Godolphin Street properties in the Bulli High School grounds. This drain acts to intercept overland flow which discharges in an easterly direction through the school grounds.
The addition of several gully lines to represent several shallow depressions which were observed in the grounds of both Waniora Primary and Bulli High Schools. These shallow depressions act to divert overland flow towards either the main arm of Whartons Creek or Ursula Road.
Modelling of the slab on ground buildings located in both Waniora Primary and Bulli High Schools as blockouts. These buildings will influence local flooding patterns during storms which result in overland flow discharging through the school grounds.
The addition of a minor pipe drainage system which was observed in Ursula Road near the common boundary of Waniora Primary and Bulli High Schools. The pipe drainage system will intercept minor gutter flows which traverse Ursula Road in an easterly direction. Flows captured by the minor pipe drainage system discharge to the section of channel which runs along the northern side of the road reserve.
The addition of several ridge lines to represent the raised sections of footpath and the minor crest which is located in Ursula Road immediately east of Benelong Street. The changes are aimed at maximising the conveyance capacity of the roadways.
The removal of the blockage factor initially adopted at the Franklin Avenue culverts. It is noted that one of the respondents to the original community questionnaire indicated that these culverts did experience a partial blockage during the 17 August 1998 flood.
Re-running of the adjusted Whartons Creek TUFLOW model resulted in a significant reduction in the magnitude and depth of flow discharging through the properties which are located along Godolphin Street and Jardine Street. However, the inundation of these properties could not be removed completely. The difference in observed and modelled flood behaviour is believed to be a function of the shallow nature of overland flow which discharges through Waniora Primary School and Bulli High School grounds and the difficulties associated with modelling features which heavily influence this type of flow in a grid based model (eg kerb and gutter and cross fall in roads). Given the above refinements and model limitations, the adjusted TUFLOW model is considered to provide a reasonable representation of flooding patterns in the lower reaches of the Whartons Creek catchment. That said, predicted flood behaviour in this area will need to be carefully considered during the preparation of the Floodplain Risk Management Plan.

Combined Catchments of Whartons, Collins and Farrahars Creeks, Bellambi Gully and Bellambi Lake Flood Study Appendix C - Analysis of Historic Floods and Model Tuning
Combined FS Appendix C.doc Page C19 Lyall & Associates 30 March 2011 Rev. 3.0 Consulting Water Engineers
With respect to the observed absence of floodwater in the rear of properties located along Stanhope Street, a check was made to confirm that the TUFLOW model was correctly computing the capacity of the 1500 mm diameter pipe which crosses the Princes Highway and runs beneath Hollymount Park. Given that the 1500 mm diameter pipe has a capacity of about 10 m3/s and the peak flow predicted by the RAFTS and TUFLOW models at the highway for the 17 August 1998 flood is about 28 m3/s, it is difficult to rationalise how property along the northern side of Hollymount Park did not experience flooding during this event. It is noted that since the 17 August 1998 flood, three relatively large flood retarding basins have been constructed immediately upstream of the Princes Highway on Tributary 3 (refer Figure A3.1 for basin locations). Modelling of design storm events shows that the hydrologic standard of the 1500 mm diameter pipe crossing the Princes Highway on Tributary 3 has now been increased to about 50 year ARI (refer Appendix E for further details). Given the significant changes that have occurred upstream of the Princes Highway since the August 1998 storm event, it was concluded that there is no benefit in making further adjustments to the hydraulic model in an attempt to replicate reported flood behaviour in this area. C5.3 Comparison with Recorded Flood Levels The tuned TUFLOW models were found to give a reasonable fit with the majority of recorded flood marks in the study area. However, there were a few locations where modelled flood levels were found to lie outside a ±300 mm range when compared to the recorded flood data. Further investigation was carried out in these areas whereby adjustments were made to the TUFLOW model in an endeavour to reduce the difference in recorded versus modelled flood levels. A brief discussion on the findings of those investigations follows. Franklin Avenue Culverts on the Main Arm of Whartons Creek Close correlation between the recorded and modelled flood levels at Franklin Avenue (refer ID No. 2019 on Figure C4.7) was achieved by partially blocking the culverts under the road. However, the blockage of these culverts resulted in a significant portion of the flow, which is conveyed beneath the Illawarra Railway Line, surcharging the left bank of Whartons Creek, where it was found to contribute to flooding in property located immediately to the west of Trinity Row. As explained in the previous section, floodwater was reported not to have reached Trinity Row near Godolphin Street and Jardine Street during the 17 August 1998 flood. The 330 mm difference in recorded and modelled flood levels at Franklin Avenue resulted when culvert blockage was removed at the Franklin Avenue culverts in an attempt to reduce the severity of flooding shown in the Godolphin Street and Jardine Street properties. Conclusion: It was not possible to reproduce both the recorded flood level and observed flood behaviour in the lower reaches of Whartons Creek. The difference in observed versus predicted flood behaviour is believed to be linked to the problems associated with modelling shallow overland flow using a grid based model.

Combined Catchments of Whartons, Collins and Farrahars Creeks, Bellambi Gully and Bellambi Lake Flood Study Appendix C - Analysis of Historic Floods and Model Tuning
Combined FS Appendix C.doc Page C20 Lyall & Associates 30 March 2011 Rev. 3.0 Consulting Water Engineers
Princess Highway Culverts on the Main Arm of Collins Creek
The recorded flood mark of 22.0 m AHD on the upstream side of the Princes Highway culverts (refer ID No. 2009 on Figure C4.8) is 1.3 m below the modelled flood level and indicates that the highway was not flooded during the August 1998 storm (i.e. because the recorded flood level is approximately 600 mm below the level of the road). Whereas, the modelled flood level of 23.3 m AHD indicates the highway was inundated to a depth of approximately 600 mm.
A review of survey plans prepared as part of the Edgewood Estate development showed that there were no major storage areas located upstream of the highway culverts on either the main arm of Collins Creek or Hollymount Creek which might have attenuated flood flows. Furthermore, there appears to have been no opportunity for floodwaters to have broken out of the creek system and bypass the highway culverts.
Based on an inlet control calculation, the flow through the existing twin cell 1800 x 2400 box culvert system were flood levels to have reached only 22.0 m AHD on the upstream side of the road is estimated to have been approximately 42 m3/s. This compares to a peak flow in the TUFLOW model on the upstream side of the Princes Highway culverts of 66 m3/s.
Sensitivity studies were carried out in an attempt to lower tailwater levels at the culvert crossing. This involved reducing the hydraulic roughness values along the now densely vegetated downstream reach of channel within a realistic range. Results of the sensitivity studies showed that peak flood levels on the upstream side of the highway corridor could not be lowered to the level of the recorded flood mark (i.e. 22.0 m AHD).
It is noted that the level of 22.0 m AHD was based on a clump of debris which was found deposited along the top of the left creek bank immediately upstream of the pedestrian fence (Source: photograph taken by WCC’s surveyors) following the flood. It is possible that this clump of debris was caught upstream of the culverts by the pedestrian fence during the flood and that it settled onto the creek bank as the floodwaters receded. Conclusion: It was not possible to reproduce the recorded flood level upstream of the Princes Highway culverts, even after hydraulic roughness values in the downstream reach of channel were reduced to relatively low values. Three possible reasons for the difference between the recorded and modelled flood levels are:
i) the rainfall which was recorded at the nearby pluviographic stations was not representative of that which fell on the Collins Creek catchment upstream of the highway;
ii) that the cross sectional area of the downstream reach of channel has changed since the August 1998 storm; or
iii) the recorded flood mark is unreliable. In the absence of any visual reports confirming that the highway was not overtopped during the storm event, there is currently insufficient evidence to justify altering the parameters of the RAFTS model in order to reduce peak flows at this location (since good correspondence with historic flood marks was achieved downstream of the highway culverts). There is also no merit in altering the geometry of the downstream reach of channel just to match the recorded flood mark, as recent survey information will be used to model the design flood events.
Combined Catchments of Whartons, Collins and Farrahars Creeks, Bellambi Gully and Bellambi Lake Flood Study Appendix C - Analysis of Historic Floods and Model Tuning
Combined FS Appendix C.doc Page C21 Lyall & Associates 30 March 2011 Rev. 3.0 Consulting Water Engineers
Conclusion (Cont’d): A thorough review of the structure of the TUFLOW model was carried out at this location and it is believed that the model will give a reasonable representation of flood behaviour in this area for the design flood events. Tributary 2 of Collins Creek west of the Princes Highway The TUFLOW model underestimated the depth of flooding west of the highway on Tributary 2 of Collins Creek at several locations. There are a number of buildings and fences in this area and it is possible that floodwaters were forced to pond along the upstream side of these structures where the flood marks appear to have been taken (eg ID No. 2040 on Figure C4.8). Conclusion: It is not feasible to schematise every structure which influences flood behaviour in the TUFLOW model. A relatively high roughness value was therefore applied to the two-dimensional model domain for properties which are bounded by fences, thus reflecting the reduction in conveyance which will result from the blocking effects of these structures. Buildings were modelled with a hydraulic roughness value an order of magnitude higher than that adopted for fenced properties (i.e. a value of 10 for buildings versus 1 for fenced properties). The differences in modelled versus recorded flood levels are therefore considered to be a function of localised effects, the impact of which cannot be accounted for in the TUFLOW model. Consideration will need to be given to these localised effects during the next stage of the study, when an appropriate flood planning level will need to be selected for this area. Upstream of Illawarra Railway Line on the Main Arm of Collins Creek TUFLOW computed a flood level 390 mm higher than the recorded flood mark at a location 100 m upstream of the Illawarra Railway Line crossing (refer ID No. 2060 on Figure C4.9). Sensitivity studies were carried out whereby the hydraulic roughness of the channel was reduced within a realistic range. However, the impact of these changes was to increase flood levels in an area where a good fit with other flood marks was achieved (refer ID Nos. 2062 and 2063 on Figure C4.8). Conclusion: This flood mark was considered unreliable given the good fit of the TUFLOW model results to recorded flood data both upstream and downstream of this location. Princes Highway crossing of Tributary 2 in Bellambi Gully System The level of the historic flood mark located at the intersection of the Princes Highway and Hicks Street (refer ID No. 1800 on Figure C4.10) of 24.1 m AHD is 600 mm below natural surface levels at its recorded location.

Combined Catchments of Whartons, Collins and Farrahars Creeks, Bellambi Gully and Bellambi Lake Flood Study Appendix C - Analysis of Historic Floods and Model Tuning
Combined FS Appendix C.doc Page C22 Lyall & Associates 30 March 2011 Rev. 3.0 Consulting Water Engineers
Conclusion: The flood mark was considered to be unreliable and was discarded given that the recorded flood level is 600 mm below natural surface levels at this location. Princes Highway crossing of Tributary 1 in Bellambi Gully System The TUFLOW model underestimated the peak flood level recorded on the eastern (downstream) side of the highway by 320 mm (refer ID No. 1802 on Figure C4.11). A low red brick wall of approximately 300 mm height was observed along the road reserve boundary immediately adjacent to the flood mark. It may have been that floodwaters flowing across the road corridor either ponded, or alternatively, overtopped this low brick wall, hence giving rise to the flood mark. Conclusion: Modelling of such a localised effect was not considered warranted during the tuning phase of the TUFLOW model. Main Arm of Bellambi Gully east of the Illawarra Railway Line Flood behaviour in property which is located between the Illawarra Railway Line and Gladstone Street (refer Figure C4.13) was influenced by a large amount of coal wash which was reported to have been deposited in the channel during the flood. One resident also reported that a taxi was washed off the road at this location where it lodged in the creek. Whilst the waterway area of the channel and road culverts was reduced to reflect the loss in conveyance which resulted from the deposition of this material, it is believed that complex flooding patterns arose in this area during the August 1998 flood which made tuning of the TUFLOW model to the recorded flood data difficult. Sensitivity studies were carried out whereby the hydraulic roughness of the floodplain was increased within a realistic range and ridgelines added to reflect the possible partial blockage of fences. However, no combination of hydraulic roughness parameters or blockage factors could be found which raised flood levels to those recorded. Conclusion: Localised features on the floodplain such as blocked fences and other structures, in combination with the large quantities of coal wash which was reported to have deposited in the channel, resulted in complex flooding patterns arising which made tuning of the TUFLOW model at this location difficult. Consideration will need to be given during the next stage of the study to the possibility of such complex flooding patterns arising during another major flood in the catchment. For example, structural measures may need to be implemented to reduce the risk of blockage and to improve the waterway area beneath the road crossings. The adoption of an appropriate flood planning level which reflects the flood risk in this area will also need to be given careful consideration.

Combined Catchments of Whartons, Collins and Farrahars Creeks, Bellambi Gully and Bellambi Lake Flood Study Appendix C - Analysis of Historic Floods and Model Tuning
Combined FS Appendix C.doc Page C23 Lyall & Associates 30 March 2011 Rev. 3.0 Consulting Water Engineers
Main Arm of Bellambi Lake west of the Princes Highway The computed flood level of 31.28 m AHD is 800 mm below the recorded flood level of 32.08 m AHD (refer ID No. 1814 on Figure C4.14). Conclusion: A high brick wall was observed along the road reserve boundary and it is believed the flood mark reflects floodwaters which ponded along the western (upstream) side of this wall. Modelling of such a localised effect was not considered warranted during the tuning phase of the study given computed flood levels in the area gave a good fit with nearby historic flood marks. Flood Retarding Basin in Corrimal High School on Main Arm in Bellambi Lake System Flood marks recorded around the perimeter of the flood retarding basin are inconsistent with each other, in that there is a 700 mm discrepancy between those recorded adjacent to the spillway (refer ID Nos 1236 and 2647 on Figure C4.14) and another recorded along its northern embankment (refer ID No. 1235 on Figure C4.14). Conclusion: No explanation for the large discrepancy in recorded flood marks could be found. However, the TUFLOW model predicted a peak flood level in the basin which lies midway between the two sets of conflicting level data.
C5.4 Comparison of Discharge Hydrographs at Ocean Outlets
The difference in peak flows which can be observed in the discharge hydrographs is attributed primarily to the attenuating affects of the lumped storages which are present in each of the catchments (i.e. the existing flood retarding basins, details of which are given in Table 2.3 in the Main Report).
The difference between the TUFLOW and RAFTS model results can also be attributed (although to a lesser degree) to the attenuating effects of storage which is present on the floodplain of the study creeks and which was incorporated into the two-dimensional model domain.
The total volume of flow in the TUFLOW models was found to be about 6% less than that computed by the RAFTS models. The difference in volume between the two models is attributed to flow becoming “locked up” in depressions which are present on the overbank areas of the creek system and which have been modelled in the two-dimensional model domain of TUFLOW.
The results of a sensitivity study carried out on the Whartons Creek catchment (refer Section E4.6 in Appendix E for further details) showed that peak flood levels were generally increased by up to 50 mm west (upstream) of the Illawarra Railway Line and 10 mm east (downstream) of the Illawarra Railway Line after the floodplain storage which is present in the TUFLOW was filled prior to routing the design 100 year ARI discharge hydrograph through the model.

Combined Catchments of Whartons, Collins and Farrahars Creeks, Bellambi Gully and Bellambi Lake Flood Study Appendix C - Analysis of Historic Floods and Model Tuning
Combined FS Appendix C.doc Page C24 Lyall & Associates 30 March 2011 Rev. 3.0 Consulting Water Engineers
[Page Intentionally Left Blank]
Combined Catchments of Whartons, Collins and Farrahars Creeks, Bellambi Gully and Bellambi Lake Flood Study Appendix C - Analysis of Historic Floods and Model Tuning
Combined FS Appendix C.doc Page C25 Lyall & Associates 30 March 2011 Rev. 3.0 Consulting Water Engineers
C6. REFERENCES Arcement and Schneider (1984), “Guide for Selecting Manning’s Roughness Coefficients of Natural Channels and Floodplains”. US Department Transportation. FHA. Bewsher Consulting (2003). “Addendum to Towradgi Creek Flood Study Following August 1998 Flood”. NSW Department of Land and Water Conservation (2002). “17 August 1998 Storm in Wollongong Flood Data Report” The Institution of Engineers (Reprinted Edition 1998). “Australian Rainfall and Runoff: a guide to flood estimation” Walsh, M.A, Pilgrim, D.H, Cordery, I (1991). “Initial Losses for Design Flood Estimation in New South Wales” Intn’l Hydrology & Water Resources Symposium, Perth. Weeks, B (1992). “Flooding in the Illawarra An Historical Perspective”

Combined Catchments of Whartons, Collins and Farrahars Creeks, Bellambi Gully and Bellambi Lake Flood Study Appendix C - Analysis of Historic Floods and Model Tuning
Combined FS Appendix C.doc Page C26 Lyall & Associates 30 March 2011 Rev. 3.0 Consulting Water Engineers
[Page Intentionally Left Blank]