Embed Size (px)
Citation preview

c;D-..•...... - ..- .. - .
Solid Waste Management Plan ReviewDraft Solid Waste Management Plan
May 2007
APPENDIX C
- 2006 TNRD SOLID WASTE COMPOSITION STUDY RESULTS
- 2006 CITY OF KAMLOOPS SOLID WASTE COMPOSITIONSTUDY RESULTS

SOLID WASTECOMPOSITION STUDY
forCity of Kamloops7 Victoria StreetKamloops, B.C.
V2C tA2Attention: Manager of Environmental Services
Technology Resource Inc.102 - 980 West First Street
North Vancouver, B.C.V7P 3N4
December 7, 2006
P:\City ofKamloops\K20;2Ql - Waste Study\WP Data\Report - Composition Study .doc

City ofKamloops
EXECUTIVE SUMMARY
SolidWasteCompositionStudyK20.201
The City ofKamloops (the City) is responsible for managing solid waste within its boundaries and relieson solid waste composition studies to provide information about the various waste streamS and to assistwith the development of waste reduction strategies. Direct analysis of solid waste provides importantinformation about the composition of waste produced by residential, commercial, industrial andinstitutional sources. The information is a useful tool for waste management planning purposes. A SolidWaste Composition Study was undertal<:enofbelWf oftbe City tu determine tbe current composition ofthe solid waste stream and to identifY areas wbere alternative waste management options may exist.
The study was completed at the Recycling and Disposal Facility (RDF) in Mission Flats Landfills, in tbeCity between August 14, 2006 and August 30, 2006. A total of sixty (60) waste samples were collectedand analyzed. Once the SOUTceof each sample was identified, the sample was weigbed and sorted intotwelve (12) primary categories and twenty-six (26) secondary categories. Waste for a thirteenth primarycategory, "Other", was received used during this study. The mass of each category was subsequentlyrecorded and used to calculate the sample composition. The primary data was subjected to statisticalanalysis to determine the means and standard deviation each primary and secondary waste category (bywaste source). The Kolmogorov-Smirnov Goodness-of-Fit Test (the K-S Test) was also applied toselected waste sort data sets to determine whether the compositions were normally distributed.
The primary category with the higbest mean composition was Organic Matter (food and other waste),exhibiting a mean composition of25.3% of the total waste stream. Efforts to divert organic materialsfrom tbe waste stream, sucb as backyard composting or commercial composting at tbe landfill, couldserve to decrease the amount of organic matter entering the waste stream. A commercial compostingfacility may also offer a source of revenue generation.
Paper & Paperboard, Wood & Wood Products, and Plastics are categories that make up 20.6%, 13.0%and 11.1%, respectively, of the total waste. The general trend in mean composition for the remainder ofthe primary waste categories consists of, in descending order, Construction and Demolition Materials,Textiles, Composite Products, Glass, Ferrous Metals, Hazardous By-products, Non-Ferrous Metals andRubber. The highly variable standard deviation in the waste sort data sets can be attributed to the lack ofan adequate number of samples and/or a limited sampling period. Based on the K-S Test, waste in themajor primary categories was normally distributed but waste from the categories contributing less to thewaste stream did not fall into a normal distribution. Generally, data sets that follow a normal distributionare more likely to be representative than data sets that do not.
The results of this study indicate that Organics, Paper and Paper Products, and Plastics represent morethan 57% of the waste that is landfilled at tbe City landfill in Mission Flats. Wood & Wood Products andConstruction and Demolition Materials represent an additional 21%. Opportunities to divert a portion ofsome of these wastes appear possible based on the data. In keeping with the current programs andobjectives, we suggest that additional efforts be made to increase awareness and to educate the public(both residential and corporate) about the importance of recycling where possible, in particular fo.rpaper
... -- ..

city of Kamloops Solid W~te Composition StudyK20.201
and plastic products. Additionally, technologies such as compo sting could ""mOVe a large source of thewaste stream from the landfill and would produce a saleable product (composted soil amendment).Further investigation will be required to determine if any of these technologies are feasible for the City.Finally, much of the waste classified as Wood & Wood Products and COhstruction and DemolitionMaterials can be diverted for reuse or as an alternative fuel source .
.._-.,;.'ii
City ofKamloops
TABLE OF CONTENTS
Solid Waste Composition StudyK20.201
Page
EXECUTIVE SUMMARY •.......•....•.....•...•...•••..•••..•...•.••...••..............•.....•......•............•.....••.•••................•..i
1 INTRODUCTION ..•..................••...•..•.•...•..•.........................................•...•••.........••.......................1
2 METHODOLOGY ..•••......................•...••..........••...•.•...•...........••....••.••......•••..•••.............................3
2.1 DESIGN OFTHE SAMPLINGPROGRAM .....••....•.......•.......•.••...................••............................ 32.2 LOAD SOURCEAND SAMPLEACQUISITION..•.........•............................••..•.......................... 32.3 SORT METHOD ............................................................................•.••.............................•...... 4
2.3.1 Safety Precautions 52.4 DATA ANALYSIS ........••...••....••........................................................•................................... 62.5 QUALITYASSURANCEAND QUALITYCONTROLPROCEDURES 6
3 RESULTS AND DISCUSSION ...•....•........•....••..•••.••.••...••.••......••......•......................•.•...........••...•7
3.1 SAMPLE SOURCEAND DISTRIBUTION..............................•...................••........................••... 73.2 WASTE COMPOSITIONBYCATEGORy ..•..........•...•......................................••...................... 7
3.2.1 Impacts of Recycling. 83.3 WASTE COMPOSITIONBY SOURCE ............••.•..................................................................... 9
3.3.1 Qualitative Observations 123.4 QUALITATIVECOMPARISONWITHUSEPA WASTE COMPOSITIONSTUDIES 183.5 STATISTICALANALYSIS..................................•...............••••.............................................. 193.6 LIMITATIONS:SOURCESOF ERROR DURINGTHE SORTS .......................••......••••............... 20
4 CONCLUSIONS •...........•..........•...............••.•.......•.........•...••....•......................................•............21
5 RECOMMENDATIONS ...•..........................................•........•..••.•...........•.••...........••............••.....23
5.1 SUGGESTIONSFORFuTURE WASTE COMPOSITIONSTUDIES 23
6 CLOSURE AND PROFESSIONAL STATEMENT ..••.....•••...••.....•....•...•...........................••.••24
Hi

City .ofKamJoops
LIST OF TABLES
Salid WasteCampositianStudyK20.201
Page
Table I
Table 2
Table 3
Table 4
Table 5
Number .ofSampleS and Tatal Mass Sarted .................•..................................................... 7
Mean Campositian .ofPrimary Categaries 8
Campasitian .ofPrimaryCategaries ...................•.............................................................. II
Summary .ofProduct Waste and Otber Waste 18
Primary Waste Category Campositions Showing a Normal Distribution 20
Tablesfoundfollowing the main body of the report
Table 6
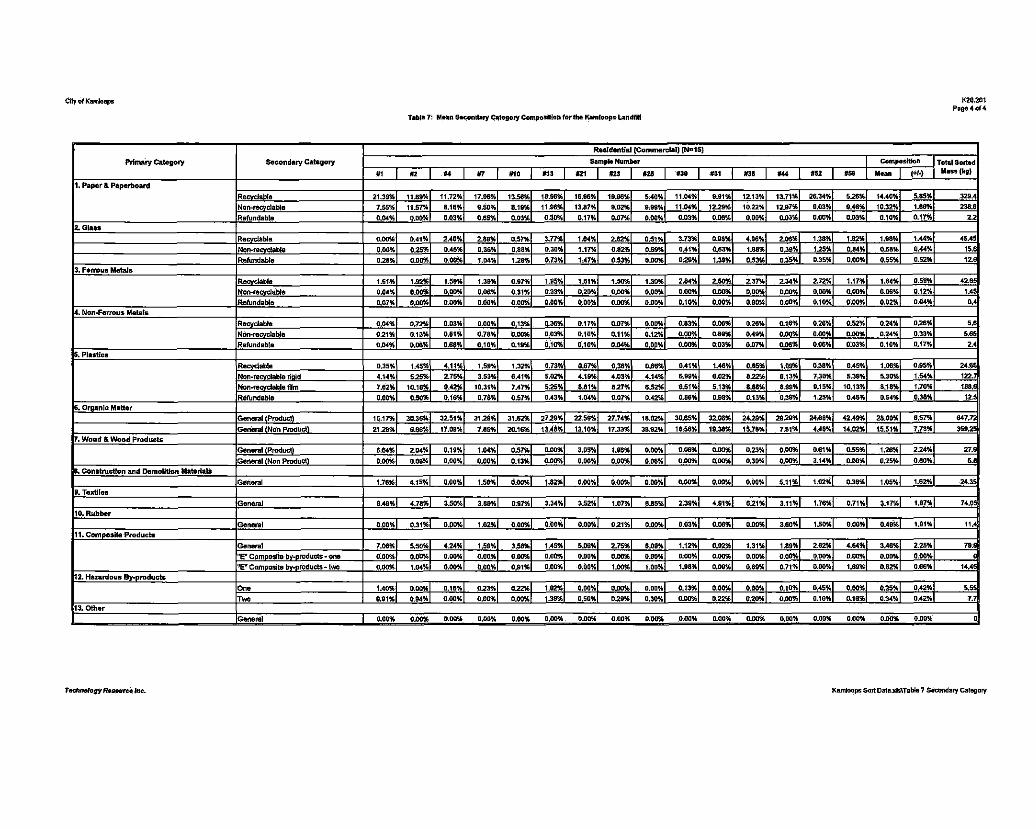
Table 7
Figure 1
Figure 2
Figure 3
Figure 4
Figure 5
Mean Primary Categary Campasitians far the Missian Flats Landfill
Mean Secandary Categary Compasitians far the Missian Flats Landfill
LIST OF FIGURES
Mean Primary Category Compasitions for the Kamloops Landfill (N=60) 13
Mean Secandary Categary Campositians for Residential Commercial SaUTces(N= 15). 14
Mean Secandary Categary Compositians for Residential Self-haul Saurces (N=15) IS
Mean Secandary Categary Compasitians far ICI Cammercial Sources (N=15) 16
Mean Secandary Category Campositians far ICI Self-haul Saurces (N=IS) 17
LIST OF APPENDICES
Appendix I Waste Campasitian Categories
Appendix II Raw Sart Data
Appendix III Site Photographs
J __ •iv

City of Kamloops
1 INTRODUCTION
Solid Waste Composition StudyK20.201
In 1989, the Waste Management Act Was liDlended to require regional district governments to prepare awaste management plan that would reduce the per capita quantity of solid waste placed in landfills byfifty percent (50%). The City ofKamloops (the City) is responsible for managing solid Waste within itsboundaries and remains proactive in achieving its reduction goals.
Features of a Solid Waste Management Plan (SWMP) and the associated programs includeencouragement of ecological sustainability and reduction of the waste streams in accordance with the'3Rs' principle. The strategies often implemented in SWMPs to achieve these goals often include:
}> reduction of the per capita weight of waste placed in landfills;}> encouragement of minimization of undesirable Waste handling and disposal practices, including
littering and illegal dumping;}> promotion of waste reduction and recycling programs;
> diversion of target waste streams (including the diversion of metal and wood for salvage and thegrinding of wood waste);
> maximiZing the life of existing landfills; and}> introduction of disposal fees.
The City is responsible for managing solid waste within its boundaries, and in part, relies on solid Wastecomposition studies to provide information about the waste streams generated by residents, businesses,institutions and industry. The studies are useful for managing waste flows, and can help with thedevelopment and implementation of Waste reduction strategies. To determine the effectiveness of wastediversion and reduction strategies, Technology Resource Inc. (TRI) was engaged by the City to undertakea Solid Waste Composition Study (the Study). The Study was completed in August 2006. The scope ofwork was to:
> Collect the data necessary for further waste management planning and to determine whatadditional efforts or programs could provide the greatest reduction in Waste disposal;
}> Employ a standard methodology"';
> Provide accurate information on origin and load weights for each waste sample; and> Interview facility staff, waste haulers, managers, drivers, and City staff to assist in organizing the
survey and to identify areas of concern.> The assessment of the overall composition of waste generated within the City was undertaken
with samples obtained exclusively at the Mission Flats Recycling and Disposal Facility (RDF).
The purpose of the Study is to generate data describing the current composition of the City's solid wastestream and to identify areas where alternative Waste management options may exist. The Study involved
I BC Ministry of Water, Land and Air Protection (MWLAP) (1991). Procedural Manual/or Municipal Solid WasteComposition Analysis .
•• _._M':;,;,"

City of Kamloops Solid Waste Composition StudyK20.20]
the selection of representative waste samples from Residential, Industrial, Commercial, and Institutionalsources. Information obtained from this Study will be extrapolated to determine the overall wastecomposition for each landfilL
During the waste composition analysis, the wet mass of the waste samples and compositions wererecorded. In this report, "hauler" refers to the vehicle delivering the waste, "load" refers to the totalamount of waste contained in a hauler, "sample" refers to the portion of the load that was sorted andweighed, and "load source" refers to the origin of a specific sample (see categorizations in Section 2.2).
"••111'"---""2

City of Kamloops
2 METHODOLOGY
2.1 Design of the Sampling Program
SolidWasteCompositionStudyK20.201
The sampling program was based on industry accepted techniques2, previous experience gained by TRI,
and with modifications made according to the requirements of the present Study. All samples were sortedat the Mission Flats landfill.
2.2 Load Source and Sample Acquisition
Waste samples were classified as originating from one of two sources: Residential and Industrial,Commercial and Institutional (ICI) samples. Residential samples were divided into two groupings:
I. Commercial haulers delivering waste from a municipality; and,
2. Residential self-haul.
ICI samples Werealso divided into two categories.
1. Commercial haulers delivering industrial and commercial waste from the City; and
2. Industrial and commercial self-haul.
A list identifYingthe waste stream sampling requirements was obtained during the preparation of theproposal2
• Every effort was made to randomly select loads for sampling while achieving theserequirements. However, at times when there were only small numbers of vehicles arriving at the landfill,any load available Was selected for sampling.
Mission Flats Landfill (August 14, 2006 through August 30, 2006)
Both self-haul and commercial vehicles deliver waste to this landfill. In general, commercial loads aresent directly to the landfill face, while.self-haul loads are delivered either to the landfill face or to a seriesoffifty (50) cubic yard bins near the scale to sort and deposit their waste.
To obtain a sample from a self-haul load, the Sort supervisor consulted with the landfill equipmentoperators. It was decided that self-hauls would come from a combination of self-hauls directed to thelandfill face and from the residential 50 cubic yard collection bin next to the landfill scale. In both casesthe self-haul materials would drop their load atthe landfill face and then an equipment operator wouldremove a portion of the waste with a front-end loader and bring it to the sorting site. The load mass was
2 TRl, Proposal to Provide Waste Composition Analysis Services, June 2, 2006 .
...---3
City of Kamloops Solid Waste Composition StudyK20.201
recorded at the scale house, and this information was obtained by the sort supervisor at the end of eachday.
To obtain a sample from a commercial load, a front-end loader would collect a portion of a load that wasplaced at the landfill face and bring it to the sort area. The sort supervisor randomly selected a sampleftom the bucket contents. The sort supervisor confirmed the truck number and the sourCe of a given loadwith the frcmt-end loader operator. The truck number was recorded and a load mass was obtained fromthe landfill vehicle log at the end of the day.
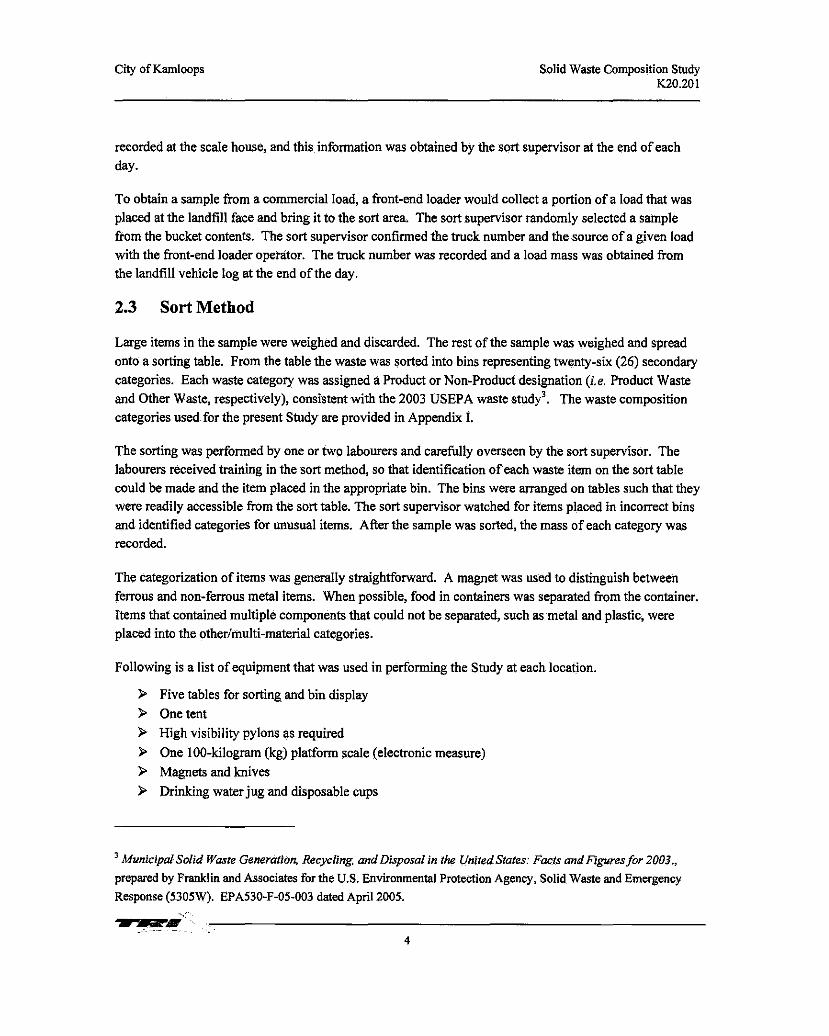
2.3 SortMethod
Large items in the sample were weighed and discarded. The rest of the sample was weighed and spreadonto a sorting table. From the table the waste was sorted into bins representing twenty-six (26) secondarycategories. Each waste category was assigned a Product or Non-Product designation (i.e. Product Wasteand Other Waste, respectively), consistent with the 2003 USEP A waste study'. The waste compositioncategories used for the present Study are provided in Appendix 1.
The sorting was performed by one or two labourers and carefully overseen by the sort supervisor. Thelabourers received training in the sort method, so that identification of each waste item on the sort tablecould be made and the item placed in the appropriate bin. The bins were arranged on tables such that theywere readily accessible from the sort table. The sort supervisor watched for items placed in incorrect binsand identified categories for unusual items. After the sample was sorted, the mass of each category wasrecorded.
The categorization of items was generally straightforward. A magnet was used to distinguish betweenferrous and non-ferrous metal items. When possible, food in containers was separated from the container.Items that contained multiple components that could not be separated, such as metal and plastic, Wereplaced into the other/multi-material categories.
Following is a list of equipment that was used in performing the Study at each location.
~ Five tables for sorting and bin display~ One tent~ High visibility pylons as required~ One 100-kilogram (kg) platform scale (electronic measure)~ Magnets and knives
~ Drinking water jug and disposable cups
, Municipal Solid Waste Generation, Recycling, and Disposal in the l)nited States: Facts and Figures for 2003.,prepared by Franklin and Associates for the U.S. Environmental Protection Agency, Solid Waste and EmergencyResponse (5305W). EPA530-F-05-003 dated April 2005 .
..,'.---' 4

CityofKamloops
» One shovel» One rake» One clipboard» One calculator» Permanent markers» One carttera and film» Duct tape» Ten large-size household garbage cans» 40 smaller, office-size garbage bins» Plastic garbage bags
2.3.1 Safety Precautions
SolidWasteCompositionStudyK20.201
The sort supervisor and all labourers received health and safety training to manage the hazards associatedwith sorting waste as well as site-specific hazards. All workers also had up-to"date te!an\ls shots. Sharpobjects (i.e. straight razors, syringes and broken glass) in the waste presented a significant hazard. Tongswere used to sort through waste when medical waste or signs of sharps were identified in tbe wastestream. Syringes and other sharp items were immediately placed in a medical waste container upondiscovery.
The most important safety issue at tbe landfill was awareness of the constant truck traffic. Visual contactwith drivers was established when directing the dumping of =ples. Safety pylons and delineators wereused at the landfills to identify the sort area.
5

City of Kamloops Solid Waste Composition Study1<20.201
Workers at each site used the following personal protective equipment (PPE).
~ High visibility vests~ Disposable nitrile gloves~ Thick protective gloves~ Protective eyewear as required~ Dust masks as required~ Cotton or lyvek overalls as required~ PYC aprons as required~ Steel toe and shank work boots~ Ear plugs as required
~ One first aid kit~ Disinfectant soap and paper towels~ Antiseptic towelettes
2.4 Data Analysis
Once all of the data had been entered into spreadsheet format, the mean compositions for all categories,primary and secondary, were calculated for waste trom all sources. Standard deviations about the meanswere also determined.
For waste composition studies that have large data sets the Kolmogorov-Smirnov Goodness-of-Fit Test(the K-S Test) can be used to determine whether the primary category compositions were normallydistributed. TRI has used the K-S Test to assess the distribution of all of the data collected at the landfill.Otherwise, TRI has employed basic statistical methods to derive quantitative information trom the Study.
2.5 Quality Assurance and Quality Control Procedures
In addition to the methods described above, a quality control program was undertaken concurrently withthe Study to ensure accurate results. The raw waste composition data was reviewed on a daily basisfollowing the sorts. This allowed the sort supervisor to determine if items had been omitted trom the datasheets. Also, office staff reviewed the accuracy of 10% of the data that was transcribed into spreadsheetformat. The accuracy of all data was reviewed by calculating the difference between the sum of thesorted category masses and the unsorted sample mass. Data entry corrections were made as necessary forthe samples exhibiting discrepancies greater than 5% of the unsorted sample mass.
6

City of Karnloops
3 RESULTSANDDISCUSSION
3.1 Sample Source and Distribution
SolidWasteCompositionStudyK20.201
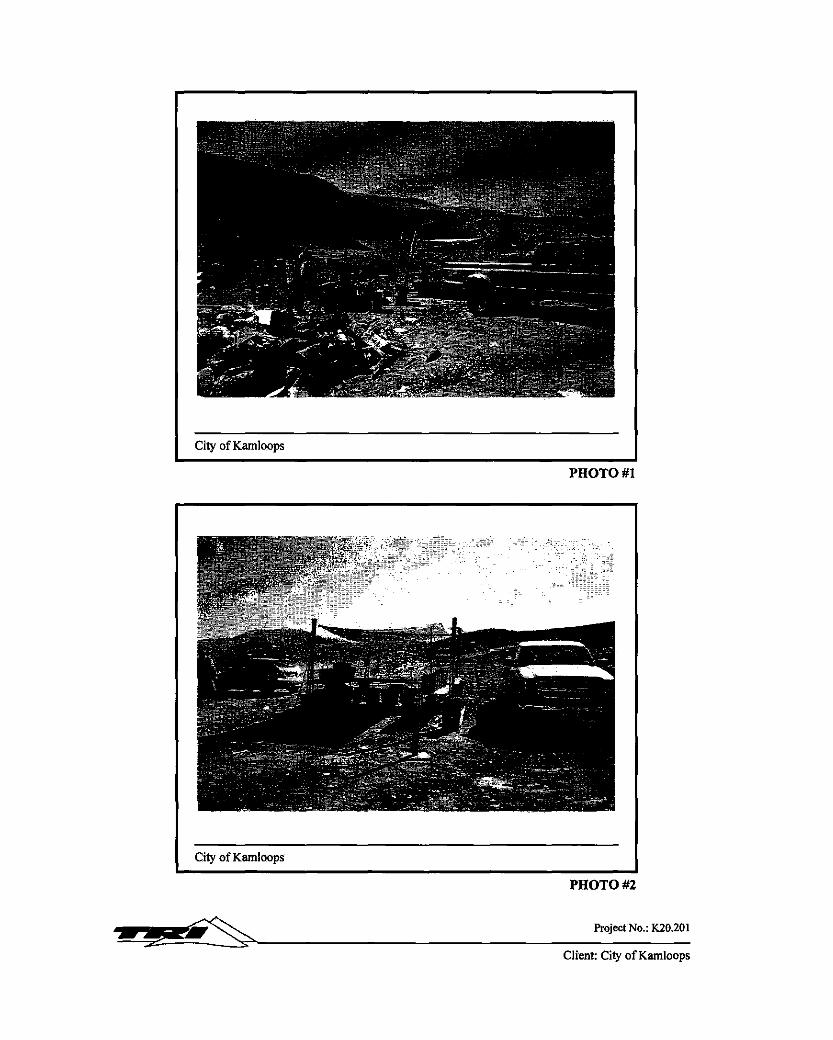
A total of sixty (60) waste samples were sorted during the Study. All of the sampling was completed atthe Mission Flats RDF between August ]4,2006 and August 30, 2006. The mean sample size in thisStudy was approximately 154 kg. The mean sample mass is consistent with the recommended samplesize requirement'. Photographs taken during the waste sorting operations are provided in Appendix ]V.A summary of the number of samples and sources of waste sorted during the Study is provided inTable 1.
Table 1: Number of Samples and Total Mass Sorted
Waste Source Numberof Total MassSamples Sorted Sorted (kg)
Residential tCommercial) 15 2308.50
Residential (Self-haul) 15 2385.85
ICI tCommercial) 15 2261.45
ICI(Self-haul) 15 2265.50
h"otal 60 9221.30
As Table I identifies, the number of samples sorted correlates exactly to the Waste Stream SamplingRequirements stipulated in the proposal'. The entire waste sort was completed at the Mission FlatsLandfill. A second landfill operated by the City, the Bamhartvale Landfill, was not included in thisStlidy. The Mission Flats Landfill is the only RDF that handles recycling for the City.
Visual observations of self-haul residential loads being delivered to the sort facilities indicated that theseloads consiSted of mainly household waste.
3.2 Waste Compositionby Category
The Study employed twelve (12) primary categories and twenty-six (26) secondary categories.l Theprimary categories included paper, glass, metals, plastics construction I demolition and organic matter.The secondary categories subdivided the primary categories, generally into recyclable I non-recyclable Irefundable or product I non-product groups. A thirteenth primary category, titled 'Other' was availablefor the Study; however, all materials encountered during the Study were placed into one of the twelveprimary categories. The "Other" category was therefore not used during the Study.
Two primary categories included were Composite Products and Hazardous By-products. CompositeProducts included such items as furniture, rubber tires and tire rims, and diapers. Hazardous By-productsincluded oil filters, compressed air spray cans and fluorescent tubes .
..-.-.•~.,.-'''------ .
7

City ofKamIoops Solid Waste Composition StudyK20.201
The primary and secondary category compositions for all waste sorts are presented in raw form inAppendix II. A review ofthe mean primary category compositions (summarized in Table 2) for theMission Flats RDF indicates several significant findings. The primary category contributing the mostwaste at the Mission Flats RDF is the Organic category, exhibiting a mean composition of25.3%.
The second most abundant waste category was Paper and Paperboard (20.6%). The third and fourth mQstabundant categories were Wood & Wood Products (13.0%) and Plastics (11.1 %), respectively. Theremainder of the Primary categories each make up less than 10% of the waste stream. The general trendin mean composition ftQm the remainder ofthe primary waste categories consists (in descending order) ofConstruction and Demolition Materials, Textiles, CQmposite Products, Glass, Ferrous Metals, HazardousBy-productS, NQn-Ferrous Metals, and Rubber. The data is summarized in Table 2 and presentedgraphically in Figure I.
Table 2: Mean Composition of Primary Categories
Primary Category Summary (N=60)Composition Total Sorted
Mean (+/-) Mass (kg)
1. Paper & Paperboard 20.63% 2.87% 1898.15
2. Glass 2.66% 1.14% 246.15
3. Ferrous Metals 2.37% 1.75% 222.65
q. Non-Ferrous Metals 0.60% 0.76% 55.80
5. Plastics 11.14% 3.50% 1027.25
6. Oraanic Matter 25.32% 5.03% 2320.97
7. Wood & Wood Products 12.97% 5.97% 1203.35
8. Construction and Demolition Materials 7.95% 7.95% 726.50
9. Textiles 7.80% 4.20% 732.20
10. Rubber 0.37% 0.57% 34.00
11. ComPQsite PrQducts 7.34% 4.10% 676.55
12. HazardQus By-products 0.84% 0.56% 77.75
13. Other 0% 0% 0.00
TOTAL 100.00% - 9221.32
3.2.1 Impacts of Rtlcycling
Recycle bins are available at five locations within the City, as well as at the Mission Flats landfill.According to the City website, the City Recycle bins accept "metal cans, glass, plastic milk jugs,newspapers and corrugated cardboard, and mixed waste paper". The Mission Flats landfill accepts "glass,paper, cardbQard, plastics and other scrap materials". These materials made up approximately 37% ofthetotal composition of waste sorted at the Mission Flats RDF.
8

City ofKamloops
3.3 Waste Compositionby Source
Solid Waste Composition StudyK20.201
Two sources of waste were examined in this study: residential and ICI. These SOurces were furtherdivided into commercial and self-haul. The commercial residential source provided curbside collection inresidential neighbourhoods. The commercial ICI source collected garbage bins located at industrial,commercial and institutional facilities. A third category, self-haul, was comprised of residential andcommercial businesses delivering small loads (usually no larger than a pick-up truck) to the landfills. Asummary of the composition of waste by source is presented in Table 3. Note that "N" represents thenumber of samples in a given data set, and that +1- represents standard deviation.
In general, the mean composition of the categories varied greatly between each waste source and littlecorrelation can be made. However, some observations can be made. The residential commercial andresidential self-haul sources contributed the greatest amount of waste to the Organic Matter category.These sources contributed 43.5% and 21.8% of waste to the total waste stream, respectively. Theresidential commercial sources contributed the second largest amount of waste to the Paper & Paperboardcategory (24.8%), and the third largest amount to the Plastics category. Together these categoriesrepresented 83.4% ofthe contributions made to the total waste stream, whereas the remaining categoriesrepresented less than 10% of the total amount of Waste received by the facility. Comparatively, theresidential self-haul sources contributed, in descending order, 17.5% to the Textiles category, I4.3%tothe Paper and Paperboard category, and 13.1% to the Wood & Wood Products category. Combined, thesecategories represented 66.7% of the contributions made to the total waste stream, whereas the remainingcategories represented less than 10% of the total amount of waste received by the facility. Graphicalrepresentation, in the form of pie charts, ofthe waste composition by for residential commercial andresidential self-haul sources is provided in Figure 2 and Figure 3.
The ICI commercial and ICI self-haul sources contributed varying amounts of waste to each categoryresulting with little similarities in the composition of the Waste received at the landfill. Of the total wastestream, the ICI commercial source generated 70.3% ITom three categories: 30.0% ITom Paper &Paperboard, 28.0% ITom Organic Matter and 12.3% ITom Plastics. The remaining categories eachcontributed less than 10% of the entire waste stream. Conversely, the ICI self-haul generated 72.3% ofthe total waste stream ITom four categories: 30.0% ITom Wood & Wood Products, 17.1% ITomConstruction & Demolition Materials, 13.4% ITom Paper & Paperboard and 11.8% ITom CompositeProducts. The remaining categories each contributed less than 10% of the entire waste stream. Graphicalrepresentation, in the form of pie charts, of the waste composition by for residential commercial andresidential self-haul sources is provided in Figure 4 and Figure 5.
Although the amounts vary, the three largest contributors to the waste stream were the same forresidential commercial and ICI commercial sources: Organic Matter, Paper & Paperboard and Plastics.With the exception ofICI Self-haul sources, Organic Matter category was among the largest contributorto the total waste stream. Similarly, the Paper & Paperboard category consistently placed among the topthree largest contributors to the total Waste stream for all of the sources. Categories containing a mix ofrecyclable, non-recyclable, and refundable products, including Glass, Ferrous and Non-ferrous Metals,
•• __ Jlf/'
9

city of Kamloops Solid Waste Composition StudyK20.201
each contributoo only a small of the total waste stream. However, in combination these categoriescontributed between 3.5% and 8.8% of the total waste stream. The low representation of these categoriesmay be at least partially attributed to the success of the recycling programs operating at the City stations.Conversely, the high representation of Paper & Paperboard and Plastic products may indicate therecycling programs are not effectively diverting this type of waste.
10

City of Kamloops
Table 3: Composition of Primary Categories
Solid Waste Composition StudyK20~201
Residential (Commercial) (N=16) ResldenUal (Self-haul) (N=15) ICI (Commercial) (N=15) ICI (Self-haul) (N=15)
Primary CategoryMean (+t-)
Total Sorted Mean (+/-)Total Sorted Mean (+/-)
Total Sorted Mean (+/-)Total Sorted
Ma•• (kg) Mass (kg) Ma•• (kgl Mass (kg)
1. Paner & Paperboard 24.82% 5.89% 570.20 14.29% 7.37% 337.20 29.98% 12.31% 684.40 13.44% 10.19% 306.35
2. Glass 3.20% 1.76% 73.65 4,05% 3.87% 96.10 2;00% 1.52% 45.50 1.3SOIo 1.49% 30~90
3. Ferrous Metals 1.93% 0.58% 44.50 4.32% 4.51% 104.60 1.59% 1.20% 36.50 1.65% 1.54% 37.0
4. Non-Ferrous Metals 0.59% 0.39% 13.65 0.43% 0.50% 10.20 0.90% 2.05% 21.05 0.48% 0.94% 10.9
5. Plastics 15.07% 2.27% 348.45 8.39% 3.68% 197.70 12.27% 5.08% 279.45 8.84% 10.29% 201.6
6. Oraanic Matter 43.51% 8.12% 1006.97 21.77% 15.94% 506.05 26,04% 16.62% 626.90 7.95% 7.11% 181.0
7. Wood & Wood Products 1.51% 2.30% 33.70 13.09% 12.21% 319.75 7,33% 7.50% 170.40 29.95% 16.12% 679.5
8. Construction and Demolition Materials 1.05% 1.52% 24.35 4.97% 6.25% 125.20 8.67% 19.40% 189.30 17.12% 14.19% 397.65
9. Textiles 3.17% 1.97% 74.05 17.50% 11;66% 422.45 4.27% 3.94% 95.60 6.26% 4.98% 140,10
10. Rubber 0.49% 1.01% 11.40 0.10% 0.22% 2.35 0.67% 1.55% 14.85 0.24% 0.62% 5.40
11. Comoosite Products 4.07% 2~35% 94.35 9.95% 7.54% 236.95 3.57% 3.56% 81.10 11.77% 11.40% 264.15
12. Hazardous Bv-nroducts 0.59% 0.76% 13.25 1.15% 1.88% 27.30 0.71% 0.89% 16.40 0.93% 1.69% 20.80
13.01l1er 0.00% 0.00% 0.00 0.00% 0.00% 0.00 0.00% 0.00% 0.00 0.00% 0.00% 0.00Total 100.00% - 2308.52 100.00% - 2385.85 100.00% - 2261.45 100.00% - 2265.50
Technology R8$ource Inc. 11

City ofKamloops
3.3.1 Qualitative Observatio(lS
Solid Waste Composition StudyK20.201
Qualitative observations made by the sort supervisor indicate that self-haul loads delivered to the MissionFlats RDF include quantities of items (e.g. mostly textiles and small quantities of electronic goods) thatappear to stilI be in good working condition. Mission Flats RDF had drop-off areas for reusable goodsthat appeared to be operating satisfactorily; however, it was observed that tonsiderable quantities ofreusable goods were not captured.
"j_r_II,IIi__iiI~--••
12

City ofKamloops SolidWasteCompositionStudyK20.201
Figure 1: Mean Primary Category Compositions for the Kamloops Landfill (N ~ 60)
Kamloops Primary Category Composition
8.0%
13.0%
"'u""
6111!',-=-,'«-
25.3%
13
2.7%
2.4%
0.6%
J!l1. Paper & Paperboard
1112.Glass
133. Ferrous Metals
134. Non-Ferrous Metals
illS. Plastics
1116.Organic Matter
1117.Wood & Wood Products
lEI8. Construction andDemolition Materials
1119.Textiles
11110.Rubber
1311. Composite Products
1312. Hazardous By-products

City of Kamloops Solid Waste Composition StudyK.20.201
Figure 2: Mean Primary Category Compositions for Residential Commercial Sources (N = IS)
Kamloops Residential Commercial
1!!11.Paper & Paperboard
.2. Glass
03. Ferrous Metals
04. Non-Ferrous Metals
.5. Plastics
l1li6. Organic Matter
.7. Wood & WoodProducts
08. Construction andDemolition Materials
.9. Textiles
.10. Rubber
011. Composite Products
012. Hazardous By-products
14

City ofKamloops Solid Waste Composition StudyK20.201
Figure 3: Mean Primary Category Compositions for Residential Self-haul Sources (N = 15)
Kamloops Residential Self-haul
1%
15
l1li1.Paper & Paperboard
.2. Glass
03. Ferrous Metals
04. Non-Ferrous Metals
.5. Plastics
0% 1ii16.Organic Matter
.7. Wood & WoodProducts
[] 8. Construction andDemolition Materials
.9. Textiles
1ii110.Rubber
o 11. Composite Products
012. Hazardous By-products

City of Karnloops Solid WIlSIe Composilioo StudyK20.20]
Figure 4: Mean Primary Category Compositions for ICI Commercial Sources (N = 15)
Kamloops ICI Commercial
7%
4% 1%
III 1. Paper & Paperboard
.2. Glass
03. Ferrous Metals
04. Non-Ferrous Metals
.5. Plastics
.6. Organic Matter
.7. Wood & Wood Products
E:J8. Construction andDemolition Materials
2% .9. Textiles
.10. Rubber
o 11. Composite Products
o 12. Hazardous By-products
]6

City of Kamloops SolidWasteCompositionStudyK20.201
Figure 5: Mean Primary Category Compositions for ICI Self-haul Sources (N ~ 15)
Kamloops ICI Self-haul
31%
]7
111. Paper & Paperboard
.2. Glass
13 3. Ferrous Melals
134. Non-Ferrous Metals
.5. Plastics
iii6. Organic Matter
.7.Wood & WoodProducts
13 8. Construction andDemolition Materials
.9. Textiles
• 10. Rubber
13 11. Composite Products
1312. Hazardous By-products

City of Kamloops Solid Waste Composition S!1ldyK20.201
3.4 Qualitative Comparison with USEPA Waste Composition Studies
The findings of the Study were also compared with two recent studies undertaken by the United StatesEnvironmental Protection Agency (USEP A) that focussed on observed trends in the generation, recyclingand disposal of municipal solid waste (MSW) in the United States. Specifically, the 2003 USEPA study'prepared by Franklin and Associates' and the 2005 USEP A study' were used for the qualitativecomparison. Two general waste categories were used for the comparative analysis: Product Waste andthe Other Waste. As per the USEP A studies, Product Waste has been defined as the sum of three sub-product categories, identified as containers and packaging, nondurable goods and durable goods. OtherWaste has been assumed to mean non-product waste including miscellaneous wastes and organic wastes(i.e. food scraps and yard trimmings). The Product Waste categories for this Study include the following:paper and paperboard, glass, ferrous metals, non-ferrous metals, plastics, construction and demolitionmaterials, textiles, rubber and composite products. Other Wastes include organic matter, wood and woodproducts (non-products) and other non-product wastes.
A summary of the materials generated in the aforementioned USEPA studies and in this Study issummarized in the Table 4.
Table 4: Summary of Product Waste and Other Waste
Source of information Location Product Waste (% of total Other Waste (% oftotalwaste generation) waste generation)
2003 USEPA study' US 74.7 25.3
2005 USEP A study' US 71.7 28.3
Present study Kamloops, BC 60.9 39.1
As indicated, the percentage of Product Waste is significantly less at the Mission Flats Landfill than theProduct Waste reported in either 2003 or 2005 USEPA studies. Consequently, the percentage of OtherWaste is greater at Mission Flats when compared to both USEPA studies.
4 Municipal Solid Waste in the Uniled Siales: 2005 Facts and Figures. I'repared by the U.S. EnvironmentalProtection Agency, Municipal and Industrial Solid Waste Division, Office of Solid Waste (S306P). EPAS30-S-06-DOl,dated October 18, 2006.
18

City of Kamloops Solid Waste Composition StudyK20.201
The lack of statistical rigour in the abpve comparison precludes a detailed analysis of the reported values.The following general observations however, can be made. The lower percentage of Product Waste at theMission Flats landfill can be attributed, at least in part, to increased recycling efforts on the part ofcitizens serVed by the landfill. It would appear that the City has been suceessful in encouraging citizensto recycle potential Product Wastes, thereby diverting this waste stream ITom the landfill. Notably,Canadian waste composition studies providing national trends are not available for comparison.
3.5 StatisticalAnalysis
Whenever a mean value of a data set was calculated, the standard deviation was also generated. Thestandard deviation is a representation of the variability in the source data about the mean. An elevatedstandard deviation indicates a greater variability. Standard deviations are presented with thecorresponding means in the Study data tables. Elevated standard deviations were often encol!ntered forsmall data sets, or when a mean was calculated fpr ml!ltiple-wasteosource composition data, as was donefor this Study.
For this Study, the Kolmogorov-Smimov Goodness-of-Fit Test (the K-S Test) was used to determinewhether the primary category compositions were normally distributed. The K-S Test examines the valuesin a standardized form and compares them with an expected normal distribution model. The K-S Testprovides the maximum difference between the sample data and the normal distribution. This value iscompared with a tabulated critical value at the desired confidence interval. For the purposes of this Studya confidence interval of95% was used. A maximum difference that is less than the tabulated criticalvalue indicates that the sample data is normally distributed. The results of the K-S Test are presented inTable 5 for the Mission Flats landfill.
The primary category compositions of Paper & Paperboard, Glass, Plastics and Organic Matter show anormal distribution. While the K-S Test to a normal distribution does not imply that a given data set is oris not accurate, data that fits the distribution is more likely to be representative than a data set that doeshot. The K-S Test is dependent on a confidence interval, as the number of samples in a given data setincreases, the confidence interval decreases. Thus, for categories that represent only a small ITaction ofthe waste stream,. there is a greater likelihood that the maximum difference will exceed the confidenceinterval.
19

City ofKamloops Solid Waste Composition Study1<20.20 I
Table 5: Primary Waste Category Compositions Showing a Normal Distribution
Data Set Follows a Nonnal DistributionPrimary Category
Mean Standard MaxK..s Comparison NannalDeviation Difference Critical Value Dlsb1butlon
1. PaDer & PaDerboard 20.63% 11.47 0.0629 < Yes
· Glass 2.66% 2.53 0.161 < Yes3. Ferrous Metals 2.37% 2.66 0.2335 > No
· Non-Ferrous Metals 0.60% 1.13 0.2986 > No5. Plastics 11.14% 6.57 0.1053 < Yes
· Oroanic Matter 25.32% 17.87 0.1114 < Yes· Wood & Wood Products 12.97% 15.05 0.1944 > ND
8. Construction and Demolition Materials 7.95% 13.52 0.2782 > No· Textiles 7.80% 8.71 0.1884 > No
10. Rubber 0.38% 0.98 0.3516 > No11. ComDosl1eProducts 7.34% 7.86 0.192 > No12. Hazardous BV-Droducts 0.84% 1.37 0.2692 > No13. Other 0.00% 0.00 - - -
3.6 Limitations: Sources of Error During the Sorts
At the conclusion of a given sort, there was usually a small discrepancy between the total sample massand the sum of the sorted category masses. Sample material being blown by the wind or accidentallyfalling to the floor would result in a sorted category mass less than the total sample mass. Also, duringthe initial measurement of sample weight, there were times when some bags did not fully rest on the scaleand as a result only a portion of the weight was recorded. Efforts were made to minimize such sources oferror. Errors in the recording of field data are the most likely reasons for the sum of the category massesbeing greater than the total sample mass. Such errors were usually minor.
20

City of Kamloops
4 CONCLUSIONS
SoJidWasteCompositionStudyK20.201
Between August 14, 2006 and August 30, 2006, TRI conducted a direct waste analysis study at theMission Flats Recycling and Disposal Facility (RDF) located in the City ofKamloops. A total of sixty(60) waste samples Wereconected and analyzed during the Study and were classified as Commercialdelivery uom Residential sources, Commercial delivery fi'om Industrial, Commercial and Institutional(ICI) sources, or Self-haul delivery fi'om Residential or ICI sources. Each Waste sample was weighedand sorted into thirteen (13) primary categories and twenty-six (26) secondary categories. The mass ofeach category was recorded and used to calculate the sample composition.
The primary category of organic Matter contributed the greatest mass to the waste stream, representing25.3% of the total waste sorted. The primary categories of Paper & Paperboard and Wood & WoodProducts contribute the next highest masses to the waste stream, making up 20.6% and 13.0%,respectively of the waste stream. The Plastics category contributes the fourth greatest mass (11.1%), andis also the last category contributing greater than 10% to the total waste stream. Together, thesecategories represent 70.1% of the entire waste stream.
The amount of waste attributed to Paper & Paperboard was 20.6%. The Paper & Paperboard categoryconsistently represented between the first and third greatest masses to the waste stream in alt of the wastesources. Visual observations made by the sort supervisor indicate that significant quantities of newspaperand computer paper were not being successfuny diverted into the recycling program, and therefore wereentering the landfin. The recycling program currently in operation at the City ofKamloops Recycle Binsand the Mission Flats Landfilt accept newspaper, waste paper and corrugated cardboard. Additional focuson public information, including both residential and corporate waste generators, may result in increasedrecycling activities for this category.
The Plastic reported in this Study represents the most bulky (Jeast dense) of alt waste categories. Themass of Plastic encountered during this Study was 1027 kg, representing 11.1% of the entire wastestream. In general, greater amounts of Plastics were encountered in samples obtained uom residentialcommercial and ICI commercial sources. It Wasnot unusual to require more than one bin to conect thesecondary plastic category (Non-recyclable Film). Oftentimes, even when compressed as much aspossible, this category would filt twice as many bins as was used for the Organic Matter primarycategory. Plastic milk jugs are accepted at the City of Kantloops Recycle Bins, additionally, plasticproducts are accepted at the Mission Flats Landfilt. Additional focus on public information related torecycling of plastics may reduce the quantity of plastic film in the waste stream. Initiatives with localmerchants to use alternative packaging may be another way to reduce the volume of plastic film presentlylandfilted.
The remaining waste categories in this Study are all relatively small contributors (less than 10%).Composite Products make up approximately 8% of the City's waste, At 7.8%, Textiles contribute slightlyless.
21

City ofKamloops Solid W,.s1eComposition StudyK20.201
Opportunities for waste reduction in the Org<!nic Matter, Paper & Paperboard and Plastics categories mayprovide the greatest reduction of waste deposited in landfills in the City. Additionally, the wasterepresented by the Wood & Wood Products and Construction and Demolition Materials should bereviewed. Opportunities for reuse or recycling may be available. Waste reduction opportunities arediscussed below.
22

City of Kamloops
5 RECO~NDATIONS
Solid Waste Composition StudyK20.201
buring the implementation of the Study, several waste reduction opportunities became apparent, asdescribed in the following recommendations:
I. Reduction of0r2anic Waste
The organic materials received at the City's Mission Flats Landfill represented 25.3% of the overallcontribution to the waste stream. Of this, 10.4% of waste was suitable for composting at source (e.g. yardand garden clippings) and 14.9% was food-type waste (e.g. general household food waste). Commercialfacilities far composting of the latter waste are presently available. We suggest that the City examine thefeasibility of installing a composting facility at the landfill. The benefits include a reduction in thequantity of waste landfilled and a saleable product (compost soil amendment) is a beneficial by-productof the process.
2. Reduce the Ouantity of Plastics
A large percentage of the plastics encountered during the Study consisted of non-recyclable plastic filmand rigid plastic containers made of recyclable plastic. We understand that there is only a limitedprogram in the City to recover rigid plastic containers. We suggest that the City explore and evaluateprograms or incentives to encourage local businesses using plastic film or rigid plastic containers toconsider alternative materials. For example, a program to charge the consumer for packaging materialsand to encourage use of reusable containers such as fabric bags or to encourage the use of alternativecontainers where rigid plastic materials are used at present.
3. Reduce the Ouantity of Recvclable Paver Products
Paper and Paperboard Products made up 20.6% of the waste stream at the Mission Flats landfill. A largerpercentage of paper originated in the residential commercial and ICI commercial waste sources. Much ofthis paper is recyclable. While the City has programs for homeowners and businesses to deliver paperand related products for recycling, further encouragement and a greater awareness of the importance ofthis program may result with a more efficient capture of recyclable paper. We further suggest that theCity consider and implement programs to encourage businesses to recycle paper and paper products. Inaddition, separate bins to collect recyclable paper and plastics could be placed on city streets or otherareas where the public tends to gather, further encouraging the public to recycle these products.
5.1 Suggestions for Future Waste Composition Studies
The waste analysis method adopted for this Study Was very effective. The samples were sorted in a safeand efficient marmer, yielding useful data. Acquisition of samples was generally easily accomplishedwith the assistance of the landfill employees. The management and staff were able to answer questionsand provide assistance when necessary.
23

City of Kamloops
6 CLOSURE AND PROFESSIONAL STATEMENT
Solid Waste Composition StudyK20.201
Technology Resource Inc. prepared the foregoing report for the exclusive use and infonnation of the Cityof Kamloops. The infonnation and data were collected and compiled in accordance with the general levelof care and skill nonnally exercised by environmental science and engineering professionals practicingunder similar circumstances. During the preparation of this report, TRI has relied on reports, data,studies, specifications, documents and other infonnation provided by others. TRI has taken care to verifYthe infonnation provided where possible, but makes no warranty as to the accuracy of the reports, data,studies, specifications, documents and other infotmatIon prepared by others and accepts no responsibilityfor infonnation contained in them.
Any use by a third party of the foregoing report, or any reliance upon or decisions made by a third partybased upon them, are the sole responsibility of such third parties. Technology Resource Inc. accepts noresponsibility for damages, if any, suffered by any third party as a result of decisions made or actionstaken based on the foregoing report.
Technology Resource IDe.
Marcus HeinrichsSort Supervisor
Janet Humphrey, B.Tech., AScTProject Manager
24
Allister Brown, PhD, QEPProject Director
City of KamJoops
APPENDICES
Solid Waste Composition StudyK20.20J

City of KamIoops
~.----'
Solid Waste Composition StudyK20.201
ApPENDIX I
WASTE COMPOSITION CATEGORIES
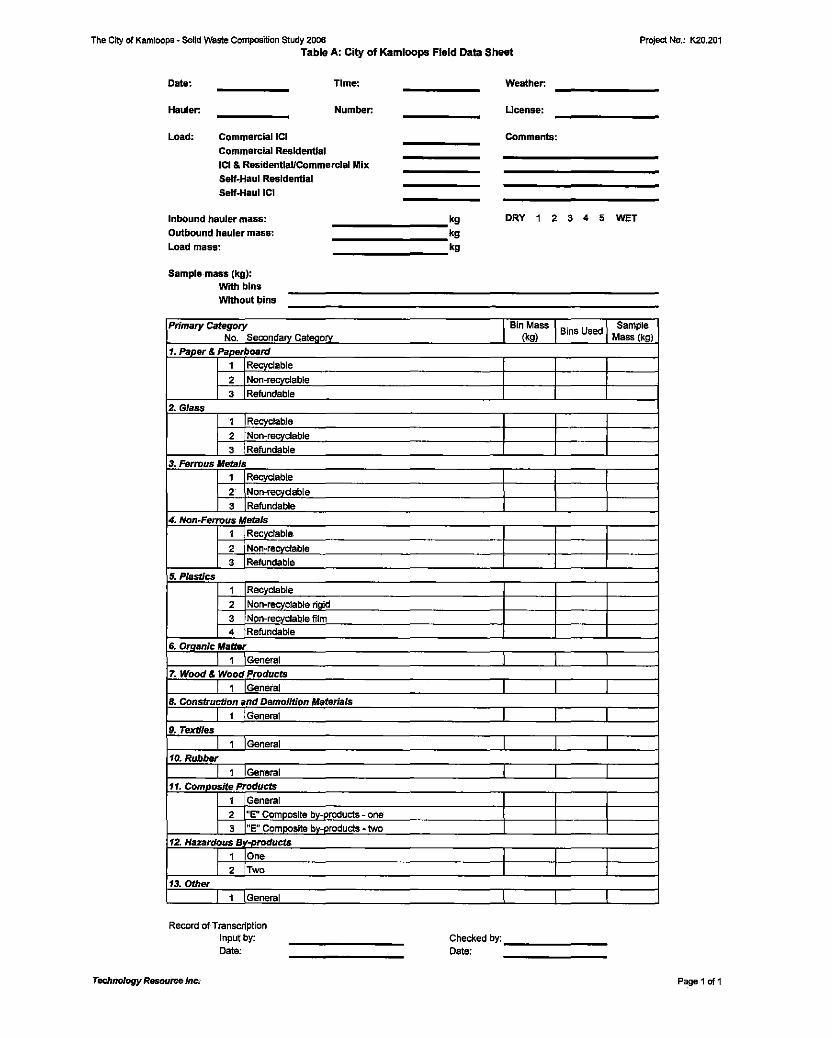
The City of Kamloops. Solid Waste CompOsition Study 2006Table A: City of Kamloops Field Data Sheet
Pi'oject No.: K20.201
Date: Time:-Hauler: Number:-Load: CommerciallCI
Commercial ResidentialICI & Residential/Commercial MixSelf..JiaulResidentialSelf..HaullCI
Weather.
Wcense:
Comments:
Inbound hauler mass:Outbound hauler mass:Load maS$~
Sample mass (kg):Wrthbli1sWfthout bins
_kgkg-_kg
DRY12345WET
Primary Category Bin MassBins Used
SampleNo. Secondarv Cateaorv (kg) Mass (kg)
1. Paner & Panerboard1 Reoydabl.2 Non-recvcJable
3 Refundable
2. Glass1 Recyclable
2 Non-recvclable
3 Refundable
3. Ferrous Metals1 Recyclable
2 Non-reovdabl.3 Refundable
4~Non~Ferrous Metals1 RecYClable
2 Non-recvclable
3 Refundable
5. Plastics1 Recyclable
2 Non-recvclable ri6id
3 Npn·recvclable film
4 Refundable
6. Oroanic Matter1 IGeneral I I I
7. Wood & Wood ProductsI 1 IGeneral I I I
8. Construction and Demolition MaterialsI 1 General I I I
9. TextilesI 1 ]Genera1 I I I
10. Rubber , 1 IGeneral I I I11. Comnosite Products
1 General
2 "E"Comooslte bv-oroducts - one
3 tiE" ComDOsite bv-oroducts - tINe
12. Hazardous Bv-products, 1 lOne I I I1 2 ITwo I I I
13. Other1 General I I I
Record of TranscriptionInput by:
Date:
Technology Resource 1m:;,
Checked by:-Date:
Page 1 of1

City ofKamloops
APPENDIX II
RAw SORT DATA
Solid Waste Composition StudyK20.201

h 2 g ·• • .~ i~~~• •Ii :; 0; ~ ~~i~
~g 3 ~g ~~~~'" g g ~: , ~~~~~, • " ,.1- .• •
II '" ~'" '" 3 '" u!H~'"• 2 ~~ m •· " ..• ,..: • •~ " .
'" § '" '" ~g !~'" '" '" '"~ s § m • ~. !~88• • .• • • • dd
i~'" ~'" ~~~~~~
~~• ~! ~,; 3 .~. ~~ .~ ~
'" '" S ~~~~~.~'" '" B" S ~;~ , 8 ~• g ~• N • do
'" !'" ~~'" '" '" '" ~'" 5 !~ ~~ ~~• 5 ~~• • " "
!~~~~~'" ~~'" ~511!1 !• ~• ~.• • • •
" ~'" § ~'" '" ~'" ~~~~~" ;!i :•• • ~" ;; ~ • ;: • •~~i '" g ~~'" ~'" ~g ~'" ~~5 ~ ~ "• ~~;; ,.; ~: ~;; • ~Ii
.i n!g • • • g ~~~. ~~~• ;; 5 ~~~N ·• •J• • • ~• ~~'" ~~• g~~• ~~~ ~i • ;~, , '" • •
~~§ g ~~
• • • •~'" g
~• • • ~·d • ~N '" " • ~·~'" ~'" ~~'" '" '" '" ~. '" '"~• ~ ~• • !i ! ! •• N .• • " ~ Ii •
'" '" g g '" g ~~~~51 ~~~~• " • • • ~~ ~·~ - ·" ·• • " '"·'" !~~g g .~ '" 51 ~~~~• .~;;i ;; :~• § ,~~• •
'" '" mrU '" g ~'" '" '" ~• ! ~~~~~5·" "51 !3 ~~g !~'" • '" !•
i ;; ! • ~ !i• • • • •
0 If ,;
•~0 g ~ 1~ i~ ~ 1 •• ~~ Ii f • lI
~•~
~ • • m• ~•, 0 ~•f ~~ ~ ~•~
3 ·• i • ~0
15 i ~• H! ~ 0 ii •f 6 f • 0 ~8 ~~8z ~ " ~~·" " ••
IiI:·:iIc,•~•,~

;;-
!:i,!E§.
if•

Ud d
.~ t•J ~
i•~ n ~ •~ ~'i! •~ ~'i! ~ i~ l t II ~
i ~~ i ~ :: Q.I~j l f ! CI 0 : •
f~~ ~3: i •~ ! ~B ~~-! BIJ ~ •• i~.I ~H~h5 l If z C
"' •• " • cD ~;:!~:!

~••••••i!~•sI•~I
z •i·!
••!j ~•,.~
i • I i•• • .! f •• ~ • e J• • £ 1 •• • ~~ !1 ~ •• · •
i ~ • n ~•f
~! • •~ •~
• • ~Ht • • •, p !1i ~• H~5 • •• • j lj ~ ~•
l ~ 0 u• 0 " ~~~.. •• • •• •• " " ~

,"d
,.~.
,~•
~.0••
I'.&• •
Udd
'U
~u• " 0
•;;
U~~•.. "!0"'00o
'"ma"dcici
H~•••
lU0·0",
~"fiP~~..' .."" .dd~
,'.f!i~~0 ••
~.~!';...cicid
.~~•••":00
'~'. ~" -coci
" ,~~~...
~,._ .,..o .• d
=
•;
i~·jE~•t••~
Ii:••uf!•···•
1••II• 0
.io
•&•~.;

, ,,"GIro •.•., %OD"O %00'0 %00'0 %00'1) %OO"/) ••.., %00'0 %00'0 %00"0 %00'0 •.•., %00'0 %00"0 %00'0 \IoetrD IEtJBU89
JIKUO '£:~., I"~O %~t·o ""., %.OIra 1%00'0 %OD~O )%00'0 •••., %8Z"O I"!MI"O I%sn %00-0 [%On I%~'~ 1%00'0 1%00'0 ."., OM.L%~'O ·%(,,",0 %f;O'O ""ZOO %8Z'Q •.•., %SZ"o •••., %00'0 %9t'~ %in %Q(rO "IotEIi'O, %00'0 ,%(10'0 ., %~l"L ouo
*"po.I esnop.ll!zIl!H"?:~YO, 'IIiS9'~ %£1.'0 %~n %00'0 %IWD %60'0 ",!;t'Z ""., %00'0 •••., %IH"O %,00'0 %00'0 ..•., %01)'0 "",tin ""., ~-spnp "" 00"3,,t"9~ 1'IIS,l'Z '¥iLl'O %00'0 1%00"0 1%00'0 1%00'0 1%00"0 %00"0 1%00'0 J%Oo'O [%00'0 ""., 1"00-0 1%99"OL %0(1'0 %OD'D %00"0 8UO-spnp 8)1$0 0:),,3.." %101: %zn: %lO'9 'YoWL %LrO %00'0 %en: %Otl"o- %99'" '!I,6n: %S'8"Z 'IIiOLt: %00'0 %a"O %SO'S %ertz %LO'O I~O
-.onpD.ld ~!'O Woo'tSg'tL %55," %in %t8"S %!!'I'O %","0 %£0'0 •.•., %00'0 '4011"0 "!In %01'0 %00'0 ""QL"I W)O'O %00'0 %WO %00'0 pMlt/e9
.-qq"H'OL,." %tS't %it'? ""., %"0 %to-v •••., "''' %6G1I %t!iS %!we %99,',L "' .. 'YOWS %l6't %LO'L %6l'"tl %to'O 1"'••••silllpt.J."
~6111 %01'81 %-LgR 'M)cro %O't %En'"'" ""DaD 'MotnL "'.. '!':Iro %0110 %00'0 ".1IS'lJ ."., r~~ %~n~ %si1u IBJaUat)
_llIpal*W uOlmowao pus UOJI;INISUO:)',,.• %»'0 %Oro %00'0 %1)0'0 1%00'0 ••.., %00'0 •••• %En %00'0 %00"0 %\P~'O ••..., %lO't 1"00'0 %00'0 1%00'0 oonpoJdUONJIBJ&1I&$,.••, 'iUt'l %tt'l .." %W't ••••• %!OYl~ %111'0 "" •. %9g't'l W'~ '!Io\lt'II~ %Og'~ %t1ro). •..., ,,!On %On "C:~'O~ OJd IBJ&U89!Q:IlIPCUd pooM 'If pooM'
Sn9Z: "Lrtt %"'U %$'nc: %IIn •• %89'\P %00'0 %66'l~ %00'0 '!':llfe %.l.t"o\P ."., %\>t'U %Z6'\I 'lioii9'0 %.l."H %60"9 %Zt'0~ pnpOJd uON IBJaUe9
Sl"t9£ I%U'S' %H'9~ %iQ'U f%lto'tl 1%II't'Ll 'ALZ'U %att '11;00'0 J"'.lr"l l%lWl~ I"'K'OI J%90'lJ. 1%96'" I%IO'OE 1%t9'6~ %!O~"ZZ f%tt·u ();)npo.ld)IQluat)
J;tDSW:ijUB 0·'I'''~ ""., %Uro "'I>n %00'0 "ES'O %t·n .." ""., %ZS"J. %~rO %tl:O •..., %6t'l %9~'O %et'O %00'0 •••• 81qePUnp;I-~
!OL'tit %tt'£' %to'L -, %60'£ %L6'S "LI'S 'un %EO'S %C:Yl ""., %Ot'C:1 %es'9~ -. %1,,'9 "''' %'S't %Oil's WIJ9lqBJO ·aMJONLose %Si!'Z %"r" %SL't %L\P'Z %99'1' %l61; %'WH •••• •••• •••• o/et9't %"'" %99't %.nt~ ••••• '!loIn ""O'E P]IJ}.I$fqIlFl ~ON
st'lt %U'O %05'0 'ill,,'o. %I>ro %l6'O %S.9·0 %lo't %00'0 %"'0 %05'0 ~o %H'O %01>'0 'Mro %8"1>'0 %/>11'0 %69'0 9]qe •"pftJd·
Sl'tH %l.O't %99'0 %O\P'O %9£'0 %D'O ."., %to'o %00'0 mt"O "'~O '!\9rG %t(J"O ""., ""., %trO %00'0 %LO'O 1i!!qllptJnJ9H,.. l%tt'O 1'!':U-0 %011'0 1%00'0 ]'!':9rO 1%£0'0 ""., "'DO'O "". W·gt'o "'<:t·0 %00'0 1%00'0 •••., %sro ","ro %£0'0 -- ON"., "'" "'tU'O %Lt'O %\pro %00'"0 %to'O %OD'D ""., %GO'O %llro. %,to'O %00'0 %to~o ••.., "'" ., .". ",. ,.~raI8W sn<we:t-uoN '
sr, %Z(I'O %1.0'0 %OD'D %00'0 ,,00'0 •.•., %00'0 %Olro %00,0 %.0'0 .'" %00'0 %00'0 %00'0 ""., %00'0 %,00'"0 8JqBPUnj8~
l'l %10&'0 1%60'0 %110'0 %00'0 • ., •••., %Sn %00'0 %00'0 •.•., %00'0 %00'0 %00'0 %00'0 '1'000'0 "&00'0 "'" 8!q1llt:J ai-uoN
SO·" %IJO'I ..., 'Mi.n -= • ., 'IoSn '!UC:'l %00'0 "an ••••• "01'0 "I~'O ""., %fin %Si'E %!i8"L VL'I .- •~W$l\o.ue:J·
~n~ %lirO %~S'O %tn %00·0 %l.1n MJ.lI %tt~O %0(1'0 %90'0 ""., %9£'0 t%LS'O •..., %Ln 1%0&'0 %00'0 %00'0 8[qepurvaH
56'S\ %Zn ',u1.'O ""., %!jt'0 %tL'O %9S'O %.1>11'1 ""., %00'0 .•.., ""., "''' •••., ",.£n %00'0 %00'0 %In VJqv OON." "U'O %9.£'0 %00'0 %~n %.t£'O %&a:l %6tr'O %00'0 %lO't iK.ll'O ••.., "noo ..., %1'g'O ""., %O(:'t %t6'~ ",qllp~
111'19'i'O •.•., %to'O "'EO'O %&0'0 l'YoU'O ""., %l~'O 'JIoOlrO %00'0 %00'0 %&0'0 l%tD'O %90'0 %00'0 1%90'0 %00'0 1%00'0 8Iqepul1J&~
."" %in %LZ'U %~6'l %59't %1.9'l~ %Eir6~ %c:9"St %In %9rtl "' .. %6t'9~ 't,:n~ "' .. %SO'9~ %ttt'S 'Miln "lll'. &1<I1It:i~OONS6'9c:. 1%~9'II %IS'IH ••• ·OZ %S9't~ 1%96'6~ ••••• %IJ't'St 9US~9 •••• %0"'9 %/>11'1<: 1%6[)'g~ o/.S6'.£l l%tt'O~ 1%&t'1l" 'I'otll'6~ 1%OZ'Il ~q1lp.\:l9~
PAI!Oq.ladSd'lfJBd"d-
161\)S1lll111 1 (-/+I I U'AW 6'" 1 .n. I ~t# 1 ttt IR'# 1 ml m I"" o!,1 .'" In. I Ut' J •• •• I ••)19).1081·1.1 uomS"edwo::) ",qQl'lN'IdIues: Alo8al~.tItrPU(N)1IS Alohlr.) AAswIJd
1s1~"M(I••OJeUJW~) 1::11

#g
"
~•o
#g
"~H000
U~000
~h00
~.dd
Ue... ~000
*~~000"'<::toddd
H~000
U~o " 0
m•
i>iH8~·iu~
.•I~
•i"•~~c•Z
.~
"sc~o"
~c•cB
Ics"
CllyotKamloaps
RuldantiallCommarclaJ) (Noo1S)
Primary CategorY ~cond.ry Category Sample Number 1 Compostllon To\'8,ISorted
" 1 " 1 •• 1 If1 .10 .1> 1 121 1 'II" '" '" 1 '" 1 138 1 M4 .521 ••• 1 Mean 1 (i-/.) Mau(kgl
1. Papar&P.aperboanl
• •• 21.39% 11.69% 11.72% 17.96% 13.56% 18c96'11. 16.96% ".- SAIl'll. 11.04% 9,91% 12.13% 13.71% 26.34% '''''' 14.40% •••• '"Non- ••••• 7.55% 11.51% 8.16% e.so% 8.19% 11.96% 13.37% U2% e,e9% 11.04%1 12.29% 10.22% 12.97% 9.03%1 £1.48%1 10.32%1 ..'" "'-,RefundablB 0.04%. 0.00% 0.03% o.EIS% 0.03% 0.300/0 0.11% 0.07% 0.00% 0.03% ,."" 0.00% 0.03% ,."" 0:03% 0.10% 0.17'%
GO••ReG'idable 0.00%1 Ut% 2.40% "'" 0.51% ",. ,•.. 2.82% 0.51% 3.73% 0.98" U6% 2.06% 1.38% ,..,. 1.98% 1.44% 45.45
Non-re· dable ,."" 0.2,5% 0.45% ...•" 0.8S% 0.30% 1.11% 0.82% 0,69% 0.41% 6.63% 1.68% ,...• ,.." 0.84% •••• OA4%I 15.
Rlafundable ,.••.. 0.00% 0.00% 1.04%1 1.26% 0.73% 1.47% 0.53 .•." 1t2e'll. 1.3'" 0.53% 0.3S% 0.35% 0.00% •••• 0,52% 12.8
3. FalTJ)us Metals
IR8C\/eklbJe 1.51'%1 1.92%1 1.59%1 1.39%1 o.e7% 1.95% 1.61%1 ,.••• 1.30% 2.84% ."" 2.37">101 2.34• 2.12% 1.17% U4% 0.5$% •••••N""" able O.D4% 0.00.% ,.- ,."" 0.31% ,."" 0.20% ,.- 0.00% ,... ,.- 0.00% •••• 0,00% 0.00% .."" 0.12% 1.45
R6fuitdable 0.07%1 0.00%1 0,00%1 0.00%1 "-00% 0,00%1 0,00%1 ,.- ,.'" 0.10% ,.- 0.00%.1 0.00% 0,10%. 0;00% 0.02% 0.04" ,.•Non.farrousMatals
• "'0 0.04% 0.~1 0.03%1 0.00%1 0.13% 0.36%1 0.11'1101 0.07" 0.00%1 0;113%1 0.06%1 0.26%1 0.16% 0.26%. 0.52%1 0.2"4%1 0.26% ,..NOn-a '" 0.21% 0;13% 0.61% 0.78% 0.00'lIo 0.03% 0.10% 0.11% 0.12% .- 0.89% 'A'" ".. 0.00% 0.00'110 0.24% 0.33% ,.Refundable 0.04% 0.00%1 0•• %1 0.10% 0,18% 0.10%1 0,10%1 0.04% 0.00%1 0.00$1 0;03%1 0m%1 ,..•• 0.06%1 0;03%1 0.10%1 0.17% ,.
5.Plas1lcs
R. ••••• 0.35% 1.45% 4.11% 1.59'1'0 1.32% 0.73'111 O.G7% 0.38' ,..•" 0:41'16 1.46% D.85'11i I.••• 0.38% 0.45% 1.06% US%- 24.
Nan-re c1ablerfld 4.14%. 525'11. 2.75% 3,53% 6.41% '.02% 4.19% 4.D3% 4.14% ..,,, ..,. '.22' 8.13% 7.30%. 5.38% 5.30.% 1.54% 122.7
Non-re dablefll(n 7.62% !O.18% 8.42% to.31% 7.47% 5.25% 8.81% 8.27% 6.52% ..,. 5.13% ,...• ..,. 11.15% 10.13% 8;18% 1.70% 188.6
Refundable OAIn\o ,.so" 0.16% 0.78% ..,. 0.43%. 1.0-4% 0.07% 0.42% •••• 0.98% 0.13% 0,39% 125% 0.45% 0.54% 0.38% '.50 nlcMatter
G_'" ..•"" 1G,1'1% 30.38% . 3251% 31.28% 31.62% 27.29% 22._ 27.74% 18.02% 30.65.% 32.08% '''''' 292'" 24;68% 42.48% ZO.'" ..,. 647.
G.~ralNonPtoduci 2128% 6.88% 11.09% 7.8511- 20.16-% 13.48% 1.3.10% 17.3.3% 35.92% 18,58%1 18.38% 15.78% 7.51% -4;48%1 14.02%115.51.% 7.13% "''"1. Woad & Wood Products
GenuralPrad 8.64% 2.04% 0.19% ,.••" 0.57% •••• 3.••• 1.9:6-'111 ,.- 0."" 0;00% Q.23% ,.- o.6t%1 0.55% 1•• 22411- 27.8
General CNon Prod\Id 0;00%1 0.011% 0.00% ,.- 0.13% .- ,.- 0.00% 0.06.% 0.00% O;OO'*' 0~0% ,.- 3.14% 0.00% 0.25% 0.80% ,.8. ConstructIon .,,4 DemoUtion Materials
General 1.78%1 4.15% 0.00% 1.56% 0,00% 1.82% 0.00% 0.00% 0.00% 0.00% 0.00% 0.00% 6.11% 1.<12% 0.36% 1.05% 1.62% 24.9. Teldll_
Go_ 0.49%1 4.78%1 3.50%1 3.811%1 0;91% 3.34% 3.52% 1.01% U5% ••••• 4.91% 8;21%1 3.11% 1.16% 0.71% 3.17% U7% 74.010. Rubber
General 0.00%1 0~1%1 0.110%1 1.62%1 0.00% 0.00%1 0.00%1 021% 0.00% 0.03%1 0.06%1 0.00%1 3060% ,.... 0.00%1 0.49%1 t.01% ".11.Com IteProductB
Gel1ll/'lll 7.08% 6.50%1 4.24%1 1.58%1 3:58% 1.45%1 ,_I 2.75'111 8.09% 1.12%-1 0.92%1 1.31%1 ,...• 2.62% 4.64",1 3.46%1 2.2$% 18;9
"E"Com os[tab roducls-one O~OO% 0.00% ,.- 0.00% ,.- 0.000/0 0.00% 0.00% ,.- 0;00% ,.- 0.00% 0.00% ,.- 11.00% ,.- 0.00% ,"E"Ccimoslle rQdilds-1Wo 0.00% 1.04%:1 0.00%1 0.00.% O.9t% 0.00%1 0.00'%1 ,.- 1.00'1'0 1.98%1 0.09%1 ••",I 0.71% 0.00%1 t.69.%1 0.62%1 0.86% 14.45
12. Hau.nfou& raclucls
Ona 1.40% ,.- 0.16% 0.23% ''''" 1.02%1 0.00% 0.00% 0.00% 0;13%1 0.00%1 0.00%1 0.10% 0.45%1 0.00%1 0.25%1 0.42% 5.55T_ 0.91% 0.94% 0.00% 0.00% ,... ."" 0.50% ,"'. ,."" ,.••• ,."" '.20% 0.00% 0.10% D.18'110 0.34% 0.42% 7.
13.otber
Genenll ".. ,.- O.DO% 0;00% 0.00% ,... 0.00% 0.00% OJIO% .0.00% 0.00% ,.••• O.DO% 0.00% 0.00% 0.00% O.DO.% ,
Ka:mtoops Sort DOItuls\Tabie 7 S&condary category
city of Kamloops
APPENDIX III
SITE PHOTOGRAPHS
Solid Waste Composition StudyK20.201
City of Kam]oops
PHOTO #1
City ofKamloops
PHOTO #2
Project No.: 1<20.201
Client: City of Kamloops