Embed Size (px)
Citation preview
Suffolk County - Comprehensive Plan 2035
Appendix B-1
Appendix B
Appendix B - REFERENCE MAPS
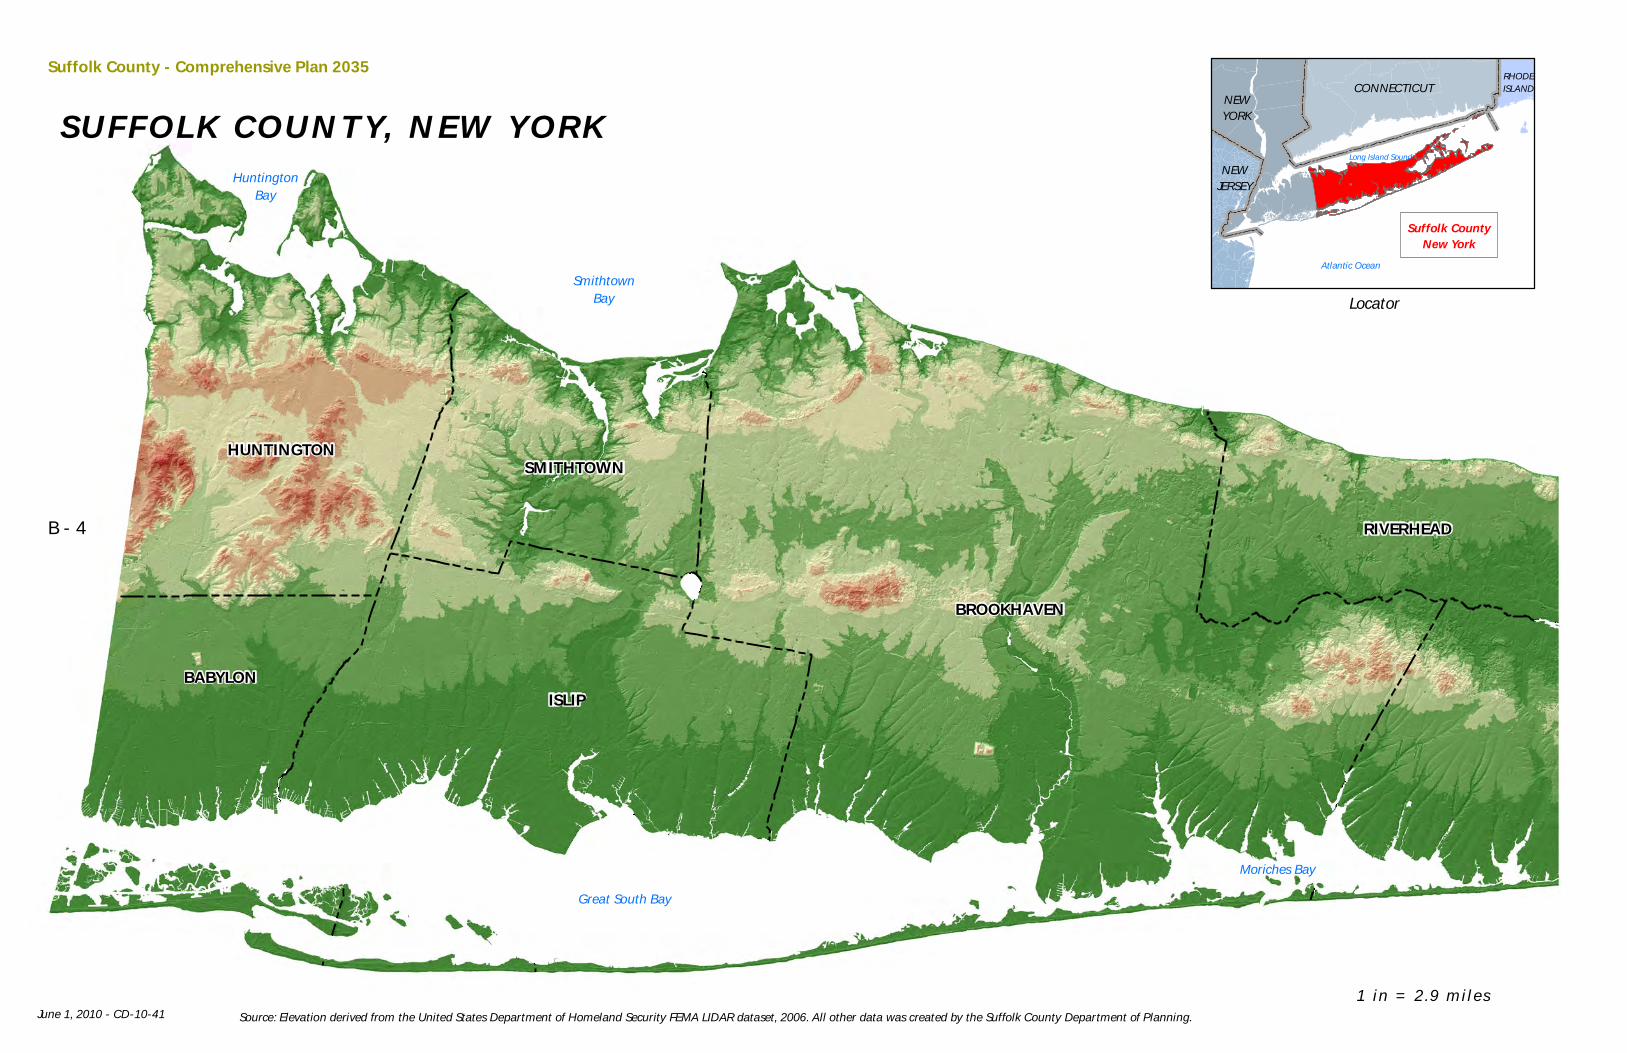
Map 1- Elevation with Shaded Relief- Elevation refers to the height
of land in relation to sea level. While Long Island is perceived as
relatively flat, there is significant variation in elevations across the
county. The characteristics of the county’s landform speak to our
geologic history including morainal ridges with elevations in excess
of 300 feet extending longitudinally along the spine of the island to
gently sloping outwash plains extending to the south shore bays. The
morainal ridges are apparent on the map in the orange and reddish
colors. The outwash plains are to the south in darkening shades of
green representing lower elevations.
The map also makes clear the numerous rivers and streams that
drain the upland areas. A clear example is the Nissequogue River in
the Town of Smithtown where a significant portion of the town is
within the watershed of the river. The river drains into Long Island
Sound to the north, a federally designated estuary. Similarly, streams
and rivers drain other parts of the county to adjacent estuaries
including the South Shore Estuary and the Peconic Estuary.
The map makes clear the physical structure of the county and serves
as a useful base of understanding for other information that will be
presented in the plan.
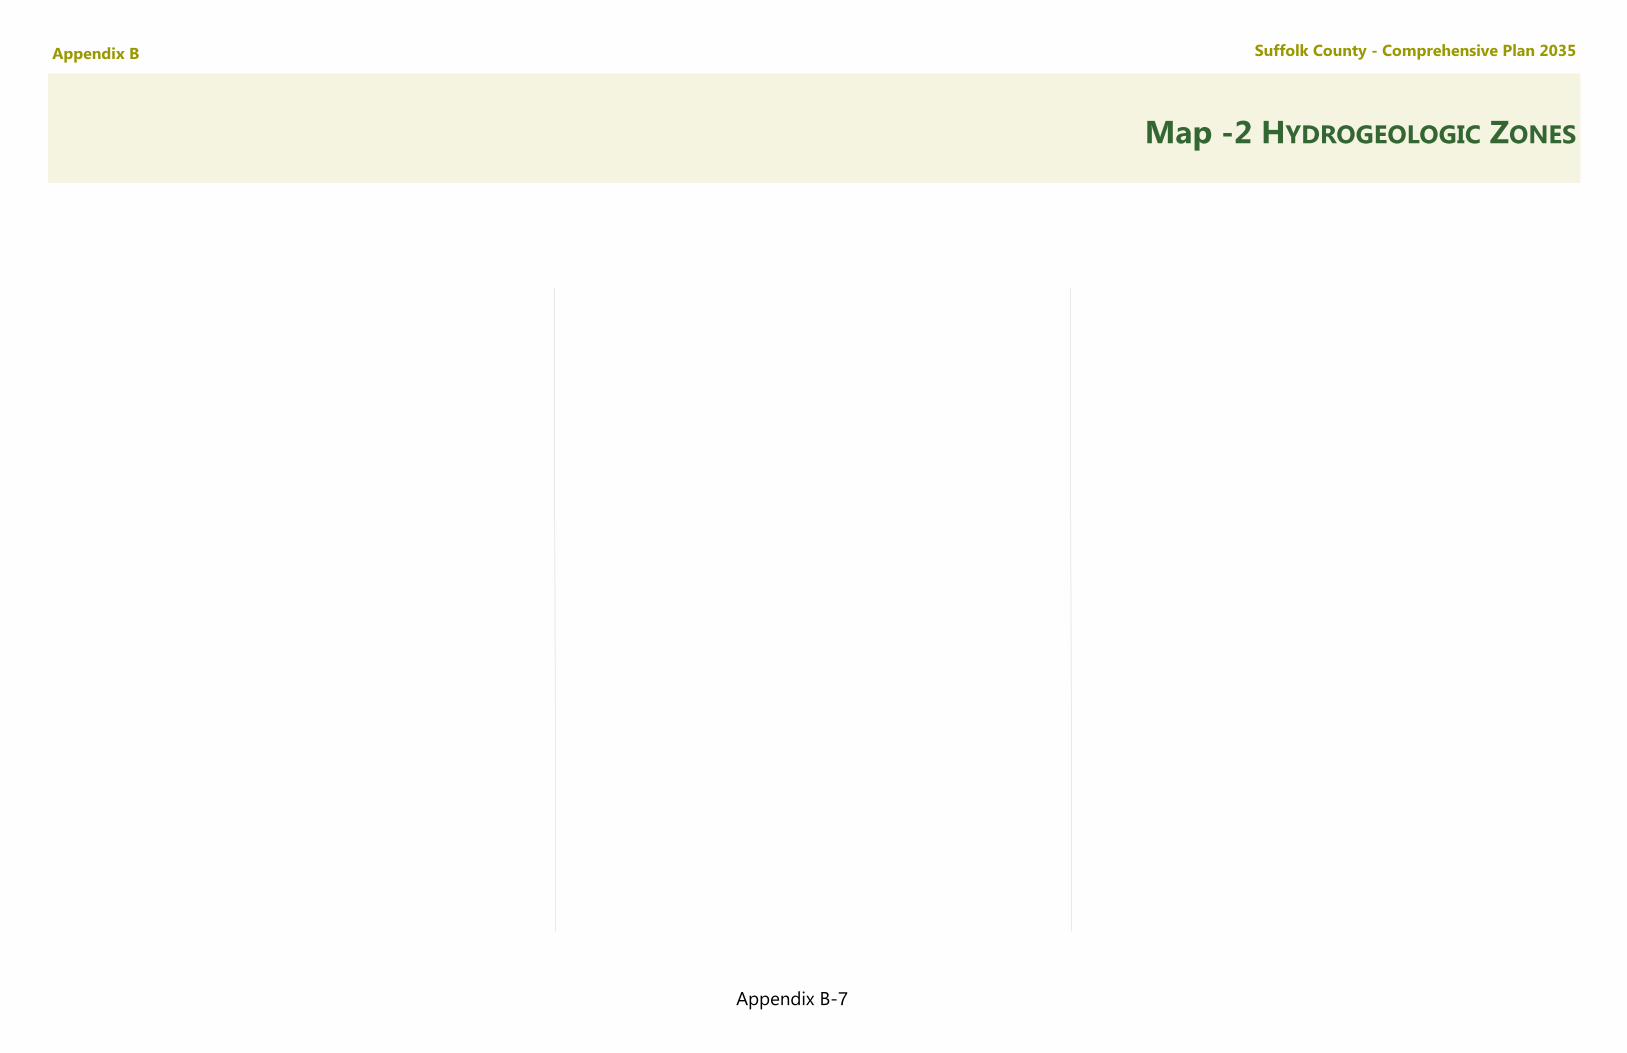
Map 2- Hydrogeologic Zones- The Long Island Comprehensive
Waste Treatment Management Plan (Koppelman, 1978), also known
as the “208” study based on the funding source reference, identified
eight distinct groundwater management zones in the county. The
zones are areas where rainwater drains into the ground forming
underground reservoirs that are located at differing depths. These
include the Upper Glacial, Magothy and Lloyd aquifers (in order of
depth). According to the 208 study, the major patterns of
groundwater flow are such that the region’s deep groundwater
reservoirs are mainly replenished of a broad area in the central part
of the bi-county region. Recharge water entering this central area
affects the quality of the middle and lower supply.
Groundwater flow can be generally described as either vertical or
horizontal. Deep flow zones are primarily vertical recharge areas that
transport water to the deeper Magothy and Lloyd aquifers.
Horizontal flow generally moves towards coastal areas and other
surface water bodies such as rivers and streams. Accordingly,
groundwater affects both drinking water and surface water quality.
Zones I, II, III encompass the deep flow zones in the county. The
zones are depicted on the map and are described as follows:
Zone I – Covers areas characterized by a deep flow system
which generally contribute water to the middle and lower
portions of the Magothy aquifer. This zone is a primary source
of drinking water.
Zone II – This zone only affects a small part of the county at
the border with Nassau County. It is a deep flow zone.
Zone III – The zone encompasses the central part of the
county and is a significant deep flow recharge water supply
source. The zone encompasses much of the Central Pine
Barrens.
Zone IV – This zone comprises the North Fork and the eastern
part of the South Fork. It is an area with a history of
groundwater problems due to intensive agricultural activities
and limited aquifer size.
Zone V – This zone comproses the southwestern portion of
the South Fork not included in Zone IV. It differs from Zone IV
only in the smaller amount of agricultural activities.
Zone VI – Is that portion of the groundwater system that
discharges to Moriches Bay and the eastern portion of Great
South Bay.
Zone VII – The zone includes large portions of Babylon and
Islip towns. It contributes water only to the shallow
groundwater flow system which discharges to streams and
bays and has more of a direct impact on these surface waters.
Zone VIII – Encompassing the North Shore area of the towns
of Huntington, Smithtown and Brookhaven, this is also a
shallow groundwater flow system.
Map 3- Municipalities: Towns and Villages- Local municipal
government in Suffolk County is divided into ten towns and 33
villages. The map depicts each of these entities and their geographic
boundaries. Suffolk County contains no cities.
In New York State, towns and villages have authority to plan and
regulate land use. Many of the towns and villages have local plans
and all have some level of land use regulation including zoning,
subdivision and building permit authority. One function of the
Suffolk County Planning Commission is to consider the
intermunicipal aspects of development applications, an important
task considering the high number of municipalities at the local level.
The largest town (geographic and population) is Brookhaven with
about 491,000. The smallest is Deering Harbor with 15 year round
Suffolk County - Comprehensive Plan 2035
Appendix B-2
Appendix B
residents. The Town of Riverhead is the only town without a village
within its boundaries.
Map 4- Census Designated Places, 2000- Many residents of Suffolk
County identify with their immediate community for their
identification of place. Suffolk County contains over 150 distinct
communities as identified by the United States Census Bureau. These
range from the villages of Amityville and Lloyd Harbor to the west
and Montauk hamlet and Fishers Island to the east.
Map 5- Schools and School Districts- Suffolk County has 69
separate school districts. These are depicted by name and
geographic boundary. Brookhaven town contains all or part of 17
districts while almost all of the Town of Riverhead is encompassed in
one district with small portions of two other districts touching the
town. Also depicted on the map are the locations of individual
schools (shown with small flags).
Map 6- Population Density- 2000- While Suffolk County has an
average population density of 1600 persons per square mile, the
actual density varies considerably throughout the county. The map
indicates higher densities with darker tones and lighter densities with
lighter tones. It is clear to see that higher densities are located in the
western portions of the county while lighter densities generally
extend from the center to the East End.
Map 7- Population Change 1990- 2000 – This map depicts the
changes in population that occurred from 1990 to 2000. The largest
changes (expressed as a percentage) are in the dark brown tones and
extend from 15.1% to 108.6%. The green tones are census designated
places where the population declined. Although some western towns
had census designated places with population increases (some very
significant), most of the increases occurred in the central and eastern
portions of the county.
Map 8- Transportation- Mobility in Suffolk County is accomplished
by a transportation system that includes roads and highways,
commuter and freight rail, interstate and intrastate ferries, and
aviation facilities. Much of the land-based network is oriented in an
east west direction representing the Island’s geography and
connection to New York City and the continental U.S. The only federal
highway is the Long Island Expressway (Interstate 495). There are
many State highways including the Northern and Southern State
Parkways, Sunrise Highway, Nesconset Highway, parts of Montauk
Highway and routes 110- 114 that provide north- south connections.
County Roads are numerous and include Nichols Road, William Floyd
Parkway, Motor Parkway, C.R. 39 to the South Fork, C.R. 48 to the
North Fork, among others. Aviation facilities are primarily for general
aviation purposes. Scheduled commercial services are available at
Long Island MacArthur Airport while most other national and all
international services are accommodated by facilities in the New York
Metropolitan area.
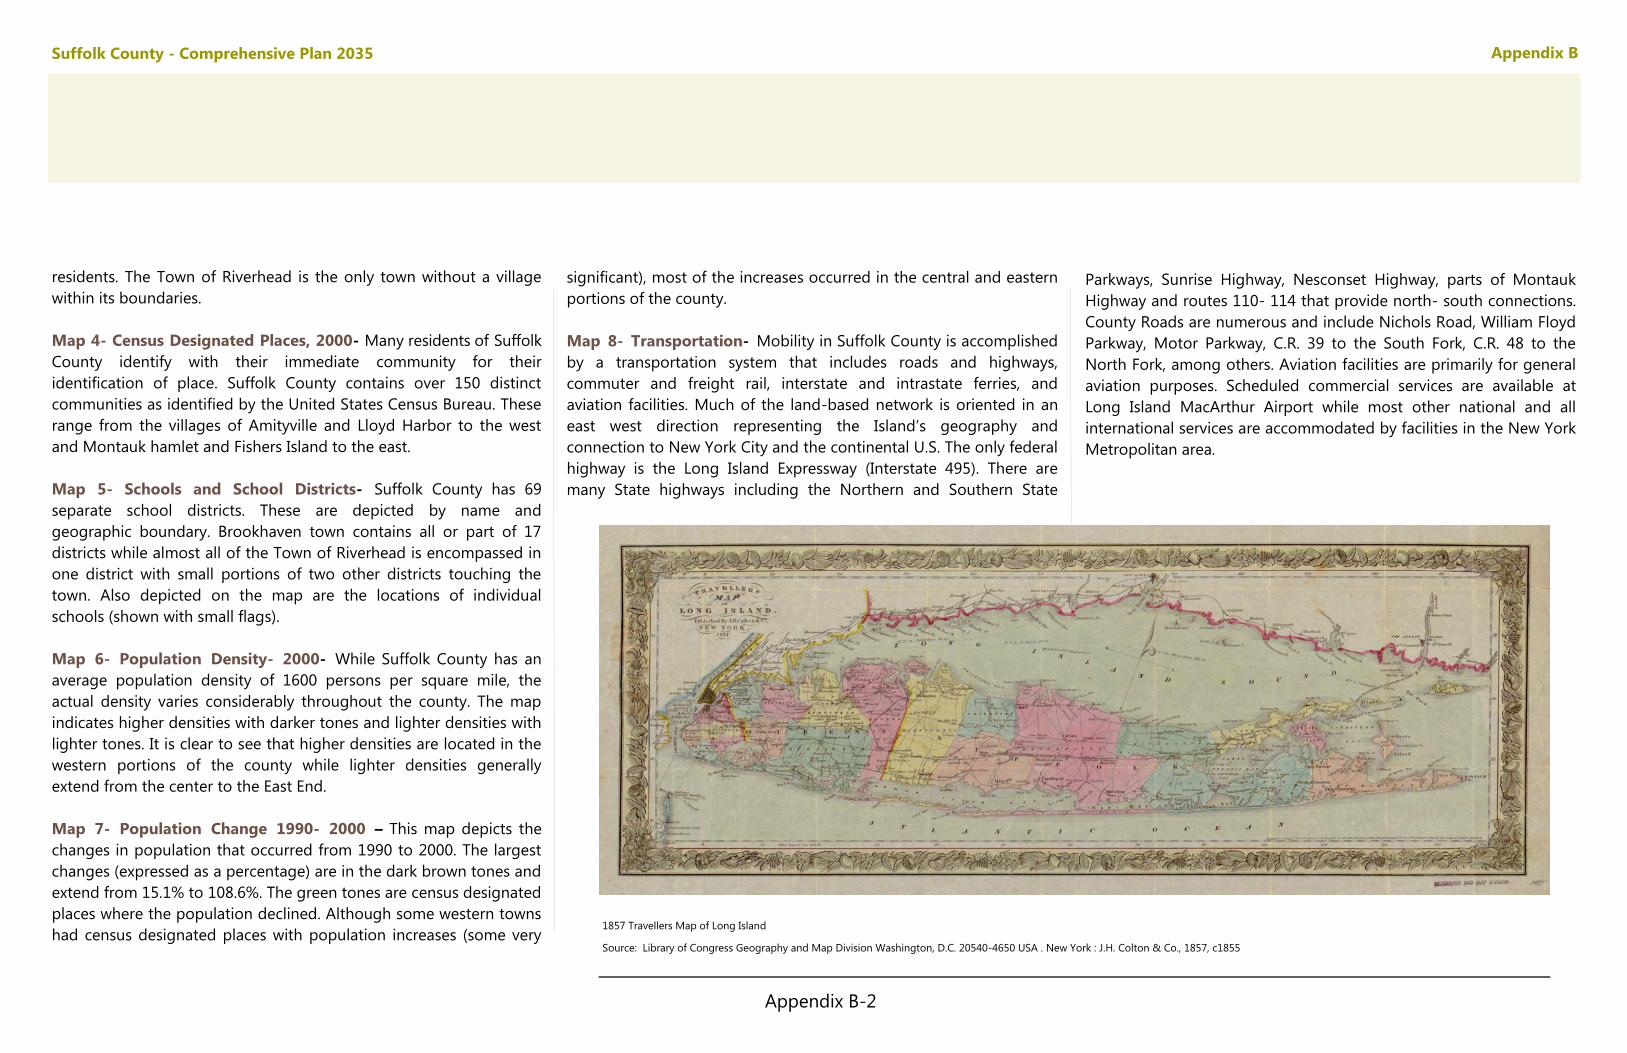
1857 Travellers Map of Long Island
Source: Library of Congress Geography and Map Division Washington, D.C. 20540-4650 USA . New York : J.H. Colton & Co., 1857, c1855
Suffolk County - Comprehensive Plan 2035
Appendix B-3
Appendix B
Map -1 ELEVATION WITH SHADED RELIEF
HUNTINGTON
BABYLONISLIP
SMITHTOWN
BROOKHAVEN
RIVERHEAD
SUFFOLK COUNTY, NE W YORK
Great South Bay
SmithtownBay
Moriches Bay
HuntingtonBay
Locator
1 in = 2.9 miles
CONNECTICUTNEWYORK
NEWJERSEY
RHODEISLAND
Suffolk CountyNew York
Atlantic Ocean
Long Island Sound
June 1, 2010 - CD-10-41
Suffolk County - Comprehensive Plan 2035
B - 4
Source: Elevation derived from the United States Department of Homeland Security FEMA LIDAR dataset, 2006. All other data was created by the Suffolk County Department of Planning.
SOUTHOLD
SOUTHAMPTON
EAST HAMPTON
SHELTERISLAND
ATLANTIC OCEAN
Long Island Sound
Block IslandSound
GardinersBay
Great PeconicBay
Shinnecock Bay
ELEVATION WITH SHADED RELIEF
N
0 2 4 6 8 10Miles
Suffolk County - Comprehensive Plan 2035
B-5
Legend
under 5050.1 - 100
100.1 - 150150.1 - 200200.1 - 250
250.1 - 300300.1 - 350350.1 - 398
Elevation, feet

Suffolk County - Comprehensive Plan 2035
Appendix B-6
Appendix B
Suffolk County - Comprehensive Plan 2035
Appendix B-7
Appendix B
Map -2 HYDROGEOLOGIC ZONES