Embed Size (px)
Citation preview

Appendix B Purpose and Need Technical Memorandum
I‐70 First Tier Draft EIS
October 2008 PURPOSE AND NEED
TECHNICAL MEMORANDUM
What is a Purpose and Need Statement? A Purpose and Need Statement identifies the reasons a proposed project is needed. Potential alternative solutions or strategies are then evaluated based on their ability to meet these project needs as well as their environmental impacts.
This document discusses the basic information underlying the I‐70 First Tier Environmental Impact Statement (FTEIS) including what the project is about, where it is located, and why improvements are needed to I‐70 on the Missouri side of the Kansas City Metropolitan Area (KC Metro). What is the I‐70 First Tier Environmental Impact Statement? The Missouri Department of Transportation (MoDOT) and the Federal Highway Administration propose improving the existing I‐70 corridor extending approximately 18 miles from the end of the last ramp termini east of the Missouri and Kansas state line to east of the I‐470 interchange, including the Kansas City, Missouri Downtown Freeway Loop to meet the current and future traffic, safety, and access needs within the corridor. The I‐70 FTEIS will:
• Provide an overview and description of the Study Area.
What is meant by improvement strategies? Improvement strategies are general, high level transportation improvement opportunities to address the transportation issues along I-70. Improvement strategies may include a series of specific transportation improvements such as adding lanes, fixing existing pavement and bridges, improving interchange ramps, and/or transit projects.
• Identify the current and future needs. • Determine potential improvement strategies to address
those needs. • Evaluate the human and natural environmental effects
of the strategies developed. • Identify a preferred strategy.
The proposed action for the I‐70 FTEIS is to seek the most effective approach to improve the corridor to meet the current and future transportation needs while minimizing impacts to the human and natural environment. The I‐70 FTEIS will evaluate strategies that address travel demand and the overall performance of the corridor for safely moving people and goods. This will enable program decisions to address corridor‐wide transportation system issues while leaving location specific decisions for the subsequent second tier environmental documents.
I‐70 First Tier Purpose and Need 1 of 30
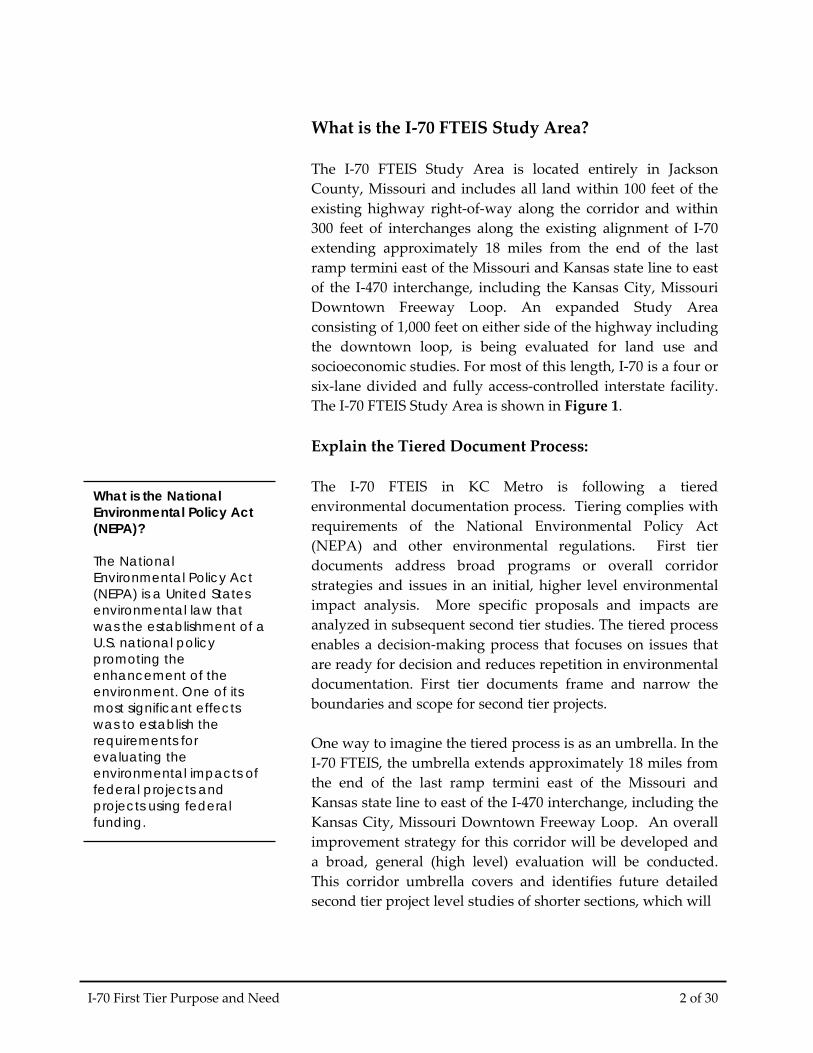
What is the I‐70 FTEIS Study Area? The I‐70 FTEIS Study Area is located entirely in Jackson County, Missouri and includes all land within 100 feet of the existing highway right‐of‐way along the corridor and within 300 feet of interchanges along the existing alignment of I‐70 extending approximately 18 miles from the end of the last ramp termini east of the Missouri and Kansas state line to east of the I‐470 interchange, including the Kansas City, Missouri Downtown Freeway Loop. An expanded Study Area consisting of 1,000 feet on either side of the highway including the downtown loop, is being evaluated for land use and socioeconomic studies. For most of this length, I‐70 is a four or six‐lane divided and fully access‐controlled interstate facility. The I‐70 FTEIS Study Area is shown in Figure 1. Explain the Tiered Document Process: The I‐70 FTEIS in KC Metro is following a tiered environmental documentation process. Tiering complies with requirements of the National Environmental Policy Act (NEPA) and other environmental regulations. First tier documents address broad programs or overall corridor strategies and issues in an initial, higher level environmental impact analysis. More specific proposals and impacts are analyzed in subsequent second tier studies. The tiered process enables a decision‐making process that focuses on issues that are ready for decision and reduces repetition in environmental documentation. First tier documents frame and narrow the boundaries and scope for second tier projects.
What is the National Environmental Policy Act (NEPA)? The National Environmental Policy Act (NEPA) is a United States environmental law that was the establishment of aU.S. national policy promoting the enhancement of the environment. One of its most significant effects was to establish the requirements for evaluating the environmental impacts of federal projects and projects using federal funding.
One way to imagine the tiered process is as an umbrella. In the I‐70 FTEIS, the umbrella extends approximately 18 miles from the end of the last ramp termini east of the Missouri and Kansas state line to east of the I‐470 interchange, including the Kansas City, Missouri Downtown Freeway Loop. An overall improvement strategy for this corridor will be developed and a broad, general (high level) evaluation will be conducted. This corridor umbrella covers and identifies future detailed second tier project level studies of shorter sections, which will
I‐70 First Tier Purpose and Need 2 of 30
Figure 1: Study Area Map
I‐70 First Tier Purpose and Need 3 of 30
Kansas
Blue Rive
r
Brush Creek
Roc
k C
reek
Little Blue River
Spring Branch
Mill
Cre
ek
Kansas R
iver
May Brook
Sugar Creek
Missouri River
Jersey Creek
Turkey Creek
Mil
l Cre
ek
Lake Jacomo
Lakewood LakesLakewood Lakes
0 0.75 1.50.375
Miles
1 inch equals 5,000 feet
I-70 First Tier EISLand Use & Socioeconomic Study Area Boundary
Field Study Area Boundary
Hydrology
State Boundary
have their own future environmental evaluation documents. The second tier studies will analyze shorter portions of I‐70 but in greater detail. During the first tier process, the Study Team will seek the following outcomes: What is a SIU?
• Approval of a preferred strategy for improving I‐70 in KC Metro including a plan for prioritizing the improvements.
A Section of Independent Utility (SIU) is a section of a larger project that can function on its own, without further construction of an adjoining road section required.
• Identification of portions of I‐70 in KC Metro that can be considered “sections of independent utility” for analysis in future second tier studies.
• Environmental documentation that can be referenced by second tier studies and reduce the amount of duplication between studies.
• Public and agency consensus and understanding around the overall improvement plan.
Why is I‐70 in KC Metro Important? The 18 mile I‐70 corridor and the entire downtown loop that is the subject of this FTEIS, is vital to serving the greater Kansas City, Missouri, regional transportation demands including commuters, transit, and local and national freight movements. In addition to serving local needs, I‐70 in KC Metro is also the main artery for traffic traveling to and from other cities and places across the state and nationally. Some of the interstate traffic heading east and west through Kansas City is bound for major population centers in Missouri and other adjacent states of Kansas, Nebraska, Iowa, and Illinois. What Studies Were Completed for the Corridor before the FTEIS? In 2000, MoDOT, the Mid‐America Regional Council (MARC), and the Kansas City Area Transportation Authority (KCATA) began the I‐70 Major Investment Study (MIS) to evaluate the challenges and opportunities associated with I‐70 in Jackson County. The I‐70 MIS established a planning horizon from 2003 to 2025, and involved a planning process to evaluate long‐term transportation needs in the I‐70 corridor. The purpose of the MIS was to identify the challenges, needs,
I‐70 First Tier Purpose and Need 4 of 30
goals, and objectives for the corridor as well as develop and analyze potential major transportation system improvement strategies. The I‐70 MIS was completed in November 2004. The I‐70 FTEIS in KC Metro will build on the efforts of the I‐70 MIS as well as other system planning studies that have been or are being completed in the Study Area. The I‐70 FTEIS will consider the strategies developed as part of the I‐70 MIS as well as developing and evaluating new ideas within the context of the most current data and according to the requirements of NEPA. The result will be a refinement of the transportation improvement strategies and an environmental evaluation of these strategies. The I‐70 Transit Alternatives Analysis prepared by MARC in June 2005, supplemented the I‐70 MIS by providing additional detail on transit alternatives options. The purpose of the I‐70 Transit Alternatives Analysis was to provide necessary documentation to enable a decision for the locally preferred transit strategy within the corridor. The results of this study along with any updates made in 2008 will also be part of the strategies for the FTEIS. How does this study differ from the I‐70 statewide studies? The I‐70 FTEIS in KC Metro is a separate and distinct study from the I‐70 study being conducted statewide in Missouri. The I‐70 statewide study essentially covers I‐70 between St. Louis and Kansas City (I‐470). The focus of the I‐70 statewide study is to evaluate the viability of using truck only lanes as part of future I‐70 improvements across the state. The I‐70 FTEIS in KC Metro is focused on broad improvement strategies for a specific 18 mile corridor and the downtown loop within the urbanized Kansas City area. The needs of I‐70 in the Kansas City area are different from the needs statewide and the I‐70 FTEIS is not focused on truck only lanes. The I‐70 FTEIS will be coordinated with the statewide study; however, they are separate projects.
I‐70 First Tier Purpose and Need 5 of 30
Why are improvements needed along I‐70 in KC Metro? The overall purpose of the I‐70 FTEIS is to determine an improvement strategy for the corridor, including future capacity and mode choices, which addresses the following items.
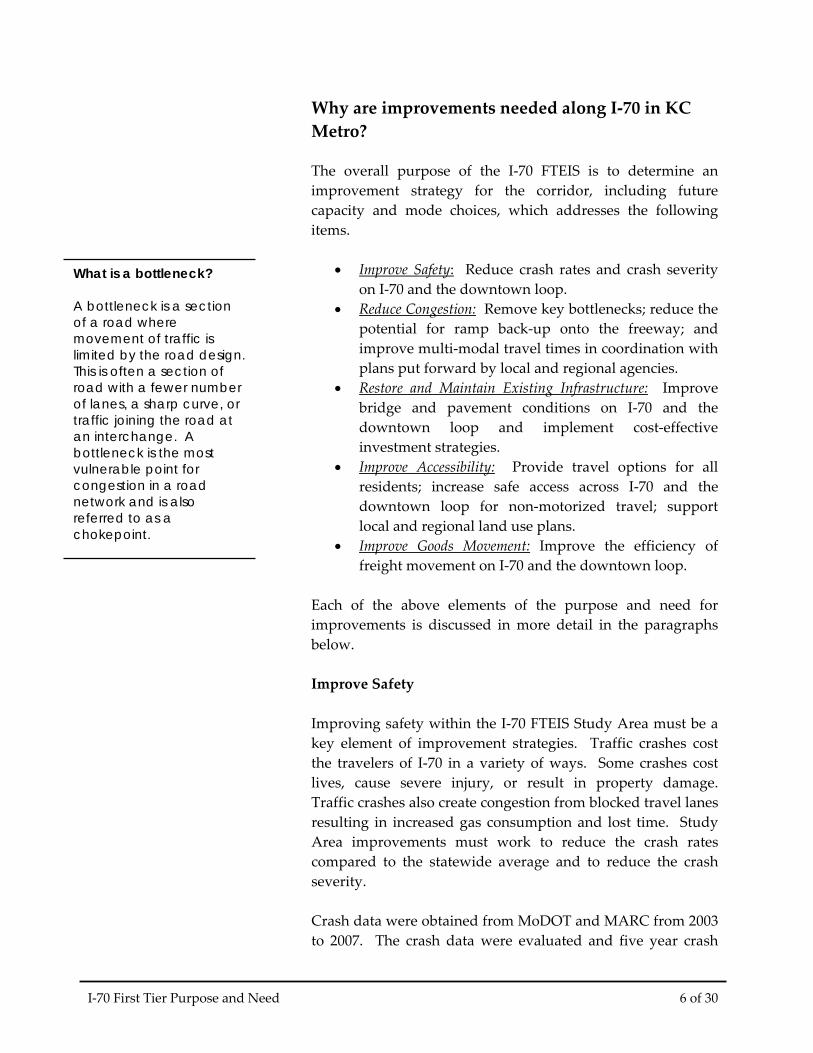
What is a bottleneck? A bottleneck is a section of a road where movement of traffic is limited by the road dThis is often a section o
esign. f ber
at
most
road with a fewer numof lanes, a sharp curve, or traffic joining the road an interchange. A bottleneck is thevulnerable point for congestion in a roadnetwork and is also referred to as a chokepoint.
• Improve Safety: Reduce crash rates and crash severity on I‐70 and the downtown loop.
• Reduce Congestion: Remove key bottlenecks; reduce the potential for ramp back‐up onto the freeway; and improve multi‐modal travel times in coordination with plans put forward by local and regional agencies.
• Restore and Maintain Existing Infrastructure: Improve bridge and pavement conditions on I‐70 and the downtown loop and implement cost‐effective investment strategies.
• Improve Accessibility: Provide travel options for all residents; increase safe access across I‐70 and the downtown loop for non‐motorized travel; support local and regional land use plans.
• Improve Goods Movement: Improve the efficiency of freight movement on I‐70 and the downtown loop.
Each of the above elements of the purpose and need for improvements is discussed in more detail in the paragraphs below. Improve Safety Improving safety within the I‐70 FTEIS Study Area must be a key element of improvement strategies. Traffic crashes cost the travelers of I‐70 in a variety of ways. Some crashes cost lives, cause severe injury, or result in property damage. Traffic crashes also create congestion from blocked travel lanes resulting in increased gas consumption and lost time. Study Area improvements must work to reduce the crash rates compared to the statewide average and to reduce the crash severity. Crash data were obtained from MoDOT and MARC from 2003 to 2007. The crash data were evaluated and five year crash
I‐70 First Tier Purpose and Need 6 of 30
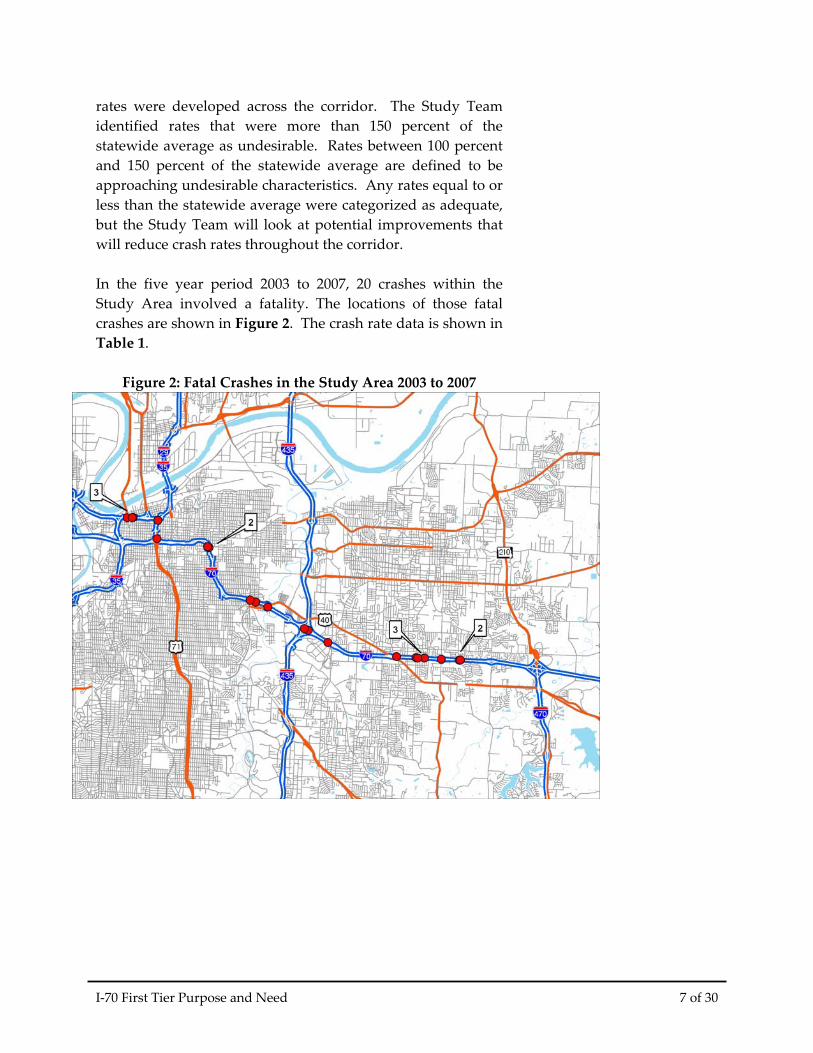
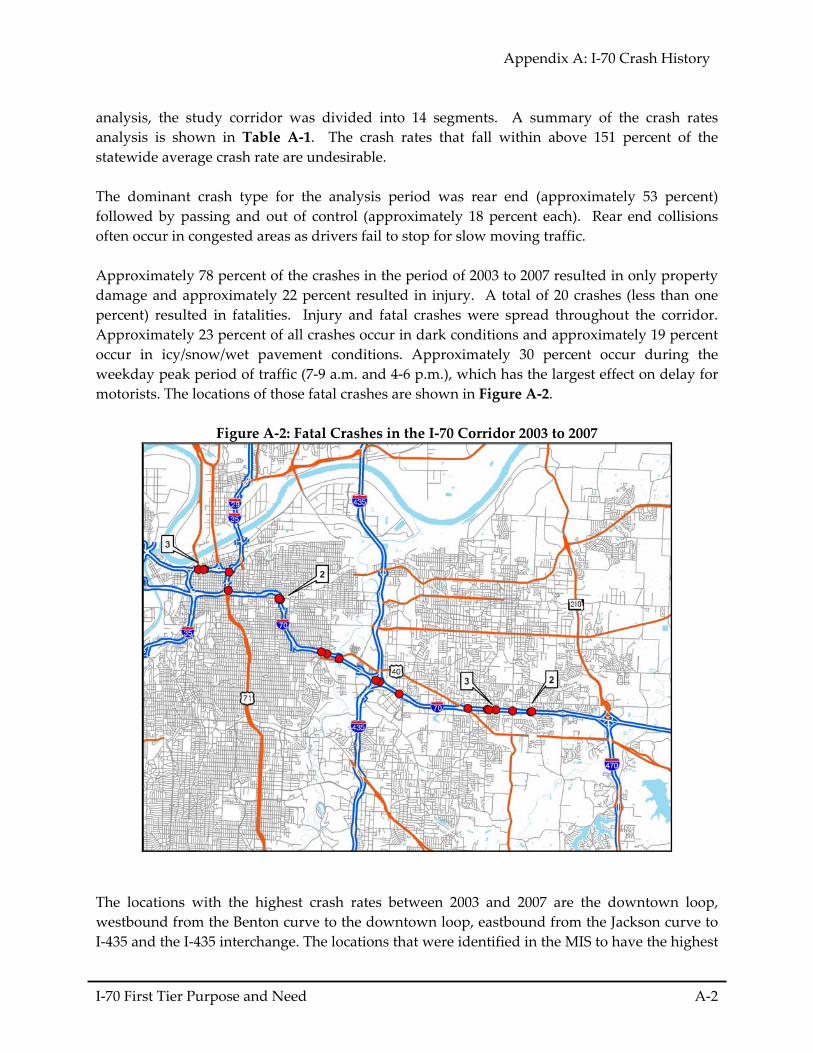
rates were developed across the corridor. The Study Team identified rates that were more than 150 percent of the statewide average as undesirable. Rates between 100 percent and 150 percent of the statewide average are defined to be approaching undesirable characteristics. Any rates equal to or less than the statewide average were categorized as adequate, but the Study Team will look at potential improvements that will reduce crash rates throughout the corridor. In the five year period 2003 to 2007, 20 crashes within the Study Area involved a fatality. The locations of those fatal crashes are shown in Figure 2. The crash rate data is shown in Table 1.
Figure 2: Fatal Crashes in the Study Area 2003 to 2007
Figure X: Fatal Crashes in the I‐70 Corridor 2003 to 2007
I‐70 First Tier Purpose and Need 7 of 30
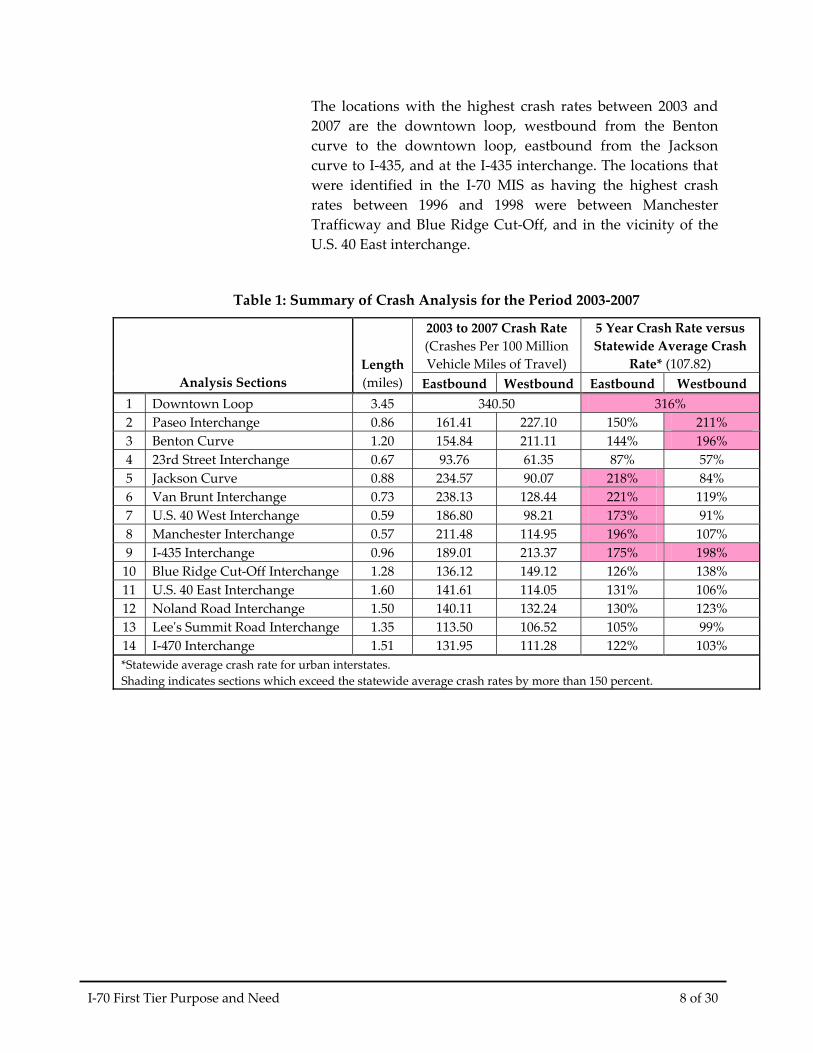
The locations with the highest crash rates between 2003 and 2007 are the downtown loop, westbound from the Benton curve to the downtown loop, eastbound from the Jackson curve to I‐435, and at the I‐435 interchange. The locations that were identified in the I‐70 MIS as having the highest crash rates between 1996 and 1998 were between Manchester Trafficway and Blue Ridge Cut‐Off, and in the vicinity of the U.S. 40 East interchange.
Table 1: Summary of Crash Analysis for the Period 2003‐2007
2003 to 2007 Crash Rate (Crashes Per 100 Million Vehicle Miles of Travel)
5 Year Crash Rate versus Statewide Average Crash
Rate* (107.82) Analysis Sections
Length (miles) Eastbound Westbound Eastbound Westbound
1 Downtown Loop 3.45 340.50 316% 2 Paseo Interchange 0.86 161.41 227.10 150% 211% 3 Benton Curve 1.20 154.84 211.11 144% 196% 4 23rd Street Interchange 0.67 93.76 61.35 87% 57% 5 Jackson Curve 0.88 234.57 90.07 218% 84% 6 Van Brunt Interchange 0.73 238.13 128.44 221% 119% 7 U.S. 40 West Interchange 0.59 186.80 98.21 173% 91% 8 Manchester Interchange 0.57 211.48 114.95 196% 107% 9 I‐435 Interchange 0.96 189.01 213.37 175% 198% 10 Blue Ridge Cut‐Off Interchange 1.28 136.12 149.12 126% 138% 11 U.S. 40 East Interchange 1.60 141.61 114.05 131% 106% 12 Noland Road Interchange 1.50 140.11 132.24 130% 123% 13 Leeʹs Summit Road Interchange 1.35 113.50 106.52 105% 99% 14 I‐470 Interchange 1.51 131.95 111.28 122% 103% *Statewide average crash rate for urban interstates. Shading indicates sections which exceed the statewide average crash rates by more than 150 percent.
I‐70 First Tier Purpose and Need 8 of 30
The downtown loop, the I‐435 interchange, and an additional four sections eastbound and two sections westbound are defined as undesirable because the crash rate exceeds 150 percent of the statewide average rate of 107.82 crashes per 100 million vehicle miles of travel. The downtown loop and the locations around the Benton‐Jackson curves have noticeably high crash rates. The part of I‐70 where crash rates increased most significantly during the period from 2003 to 2007 compared to the period from 1996 to 1998 is the Benton‐Jackson curves (approximately 25% higher). The crash rates between the Blue Ridge Boulevard and U.S. 40 East interchanges showed the largest reductions. The majority of the crashes are rear end (53%) followed by passing and out of control (approximately 18% each). Rear end collisions often occur in congested areas as drivers fail to stop for slow moving traffic. Approximately 78 percent of the total crashes cause property damage only and approximately 22 percent cause injury. Approximately 23 percent of all crashes occur in dark conditions and approximately 19 percent occur in icy/snow/wet pavement conditions. Approximately 30 percent occur during the weekday peak period of traffic (7‐9 a.m. and 4‐6 p.m.), which has the largest effect on delay for motorists. Further data on crash history of the Study Area is located in Appendix A. Reduce Congestion I‐70 has outlasted its original design life of 20 years and has carried traffic volumes of both cars and heavy trucks that have far exceeded original expectations. Traffic growth on I‐70 and the downtown loop is the result of population and economic growth in the Kansas City Metropolitan Area and growth in trips through the region by cars and trucks. The Kansas City Metropolitan Area has experienced population growth of 28 percent between 1970 and 2000 with expectations of an additional 21 percent growth in population by 2030 based on forecasts by the Census Bureau and the Mid‐America Regional Council. Jackson County population growth is expected to be near nine percent between 2000 and 2030. Within the Study Area, population growth is focused around Independence and further east in Blue Springs. Additional population growth data is contained in Appendix B.
I-70 Eastbound at Lister
I‐70 First Tier Purpose and Need 9 of 30
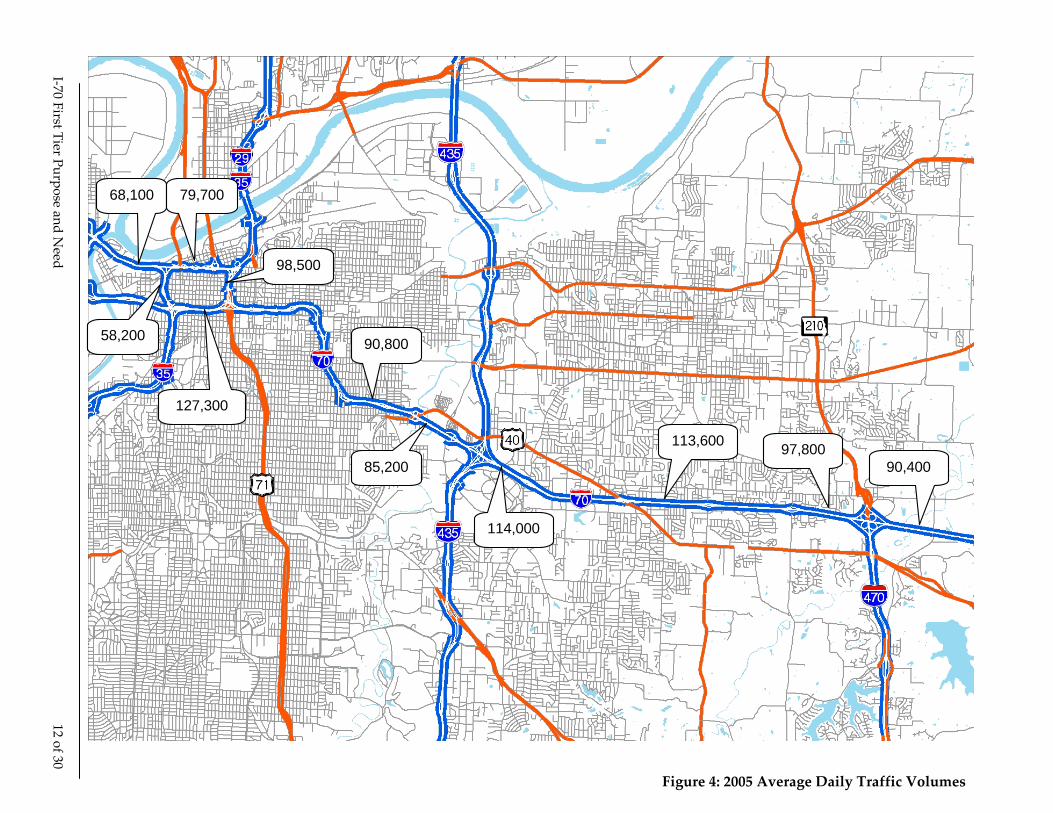
The I‐70 MIS developed an extensive inventory of locations that generate and attract trips along I‐70 in the Study Area. An understanding of these locations can help to more fully understand travel needs along the corridor, as well as assist locating freeway interchanges and transit stops. The I‐70 MIS reported that the key residential centers affecting I‐70 traffic are generally in the middle to outer portions of the Study Area along with those outside the Study Area in locations such as Blue Springs, Lee’s Summit, and the Country Club Plaza area. The MIS also reported that the major employment centers affecting I‐70 traffic are generally located between downtown Kansas City and the Country Club Plaza, along Ward Parkway, and along Bannister Road. The major shopping areas are the Country Club Plaza, Blue Ridge Crossing, Independence Center and other developments near the I‐70 and I‐470 interchange, and in Lee’s Summit. Other major trip attractors are located between the Country Club Plaza and I‐435. Figure 3 illustrates some of the key regional traffic attractions and truck generators that affect this portion of I‐70. Additional detail on trip generators and attractions are in Appendix C. As a result of population growth, the general locations of jobs in relation to locations where people live, and the shopping and entertainment areas, the I‐70 traffic volumes have been steadily increasing over the past 30 years. The completion of regional highway improvement (Bruce R. Watkins and Three Trails Crossing) projects in the early 2000s resulted in some traffic diversion away from I‐70. Some representative 2005 volumes are shown in Figure 4. Commuter traffic in the study corridor is highly directional with the majority of traffic destined towards the Kansas City Central Business District (CBD) during the morning and away from the CBD during the afternoon peak periods.
I‐70 First Tier Purpose and Need 10 of 30
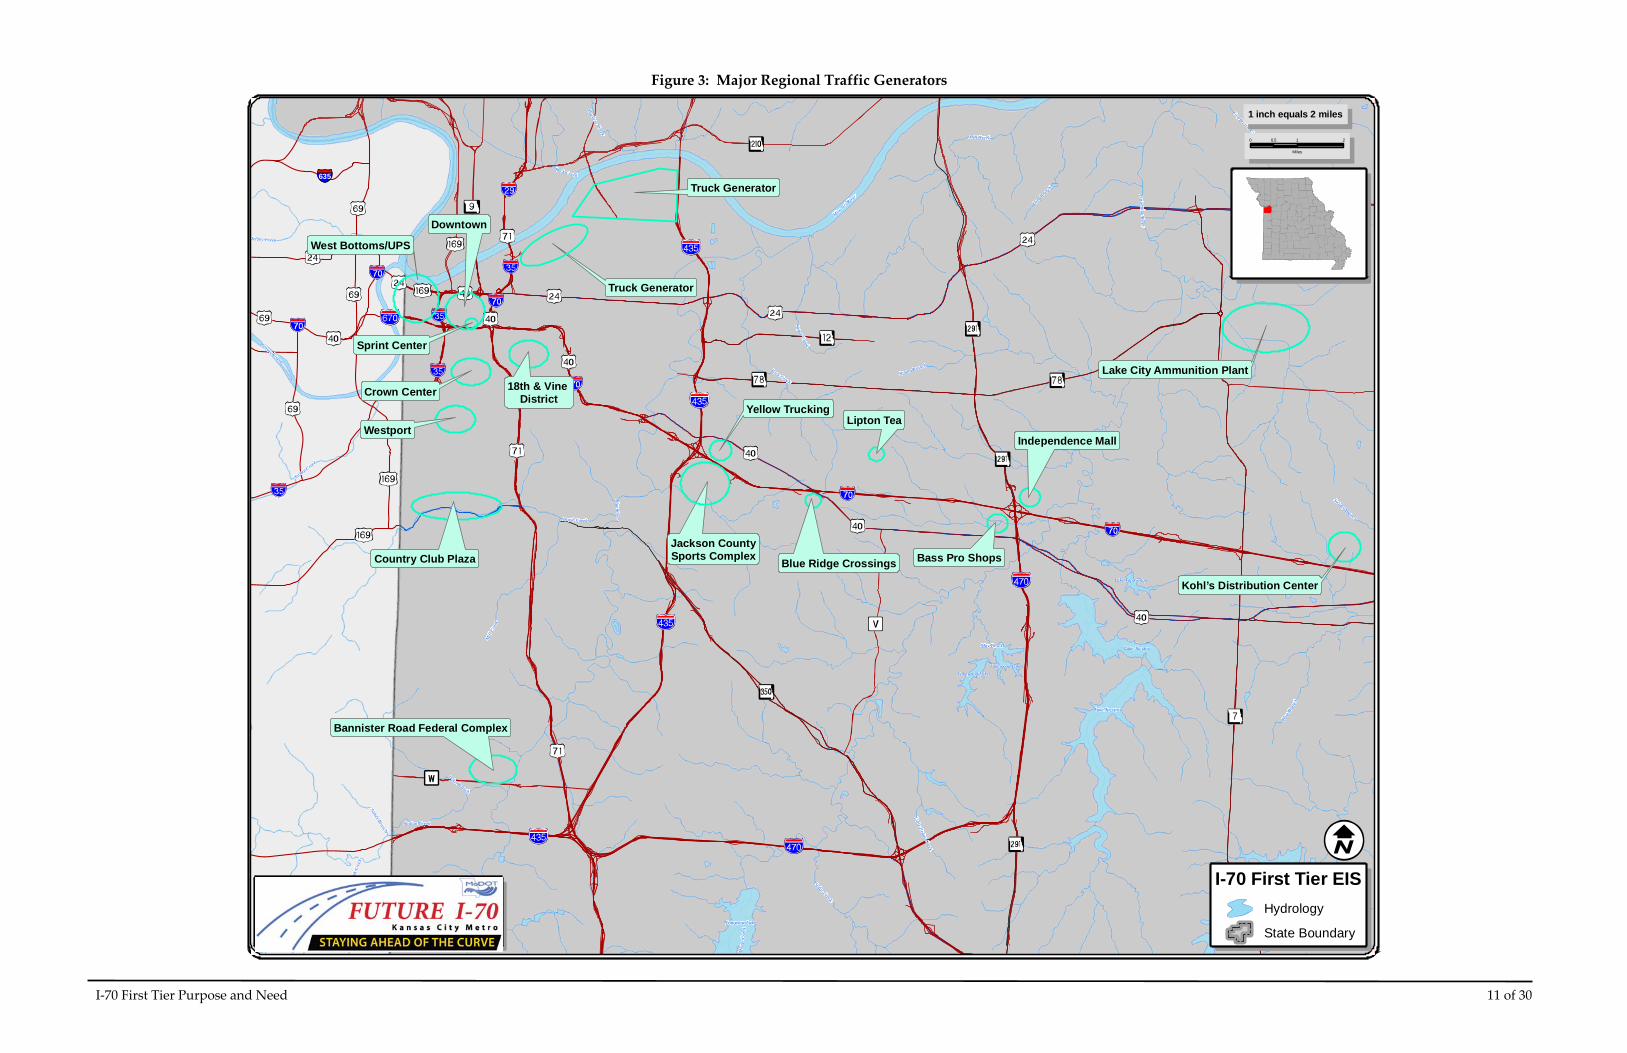
Figure 3: Major Regional Traffic Generators
I‐70 First Tier Purpose and Need 11 of 30
635
West Bottoms/UPS
Downtown
Sprint Center
Crown Center
Westport
18th & Vine District
Country Club Plaza
Truck Generator
Truck Generator
Jackson CountySports Complex
Yellow Trucking
Blue Ridge Crossings
Lipton Tea
Bass Pro Shops
Independence Mall
Lake City Ammunition Plant
Kohl’s Distribution Center
Bannister Road Federal Complex
Blue R
iver
Little Blue R
iver
Miss
ouri Rive
r
Brush Creek
Indian Creek
Rock Creek
May Brook
Spring Branch
Blue
Bra
nch
Mill
Cre
ek
Turk
ey C
reek
Kansas River
Jersey Creek
Dyke Branch
Lazy B
ranch
Cedar Creek
Fire Prairie Creek
Little Cedar C
reek
Sugar Creek
Tom
ahaw
k C
reek
James Branch
Buckeye Creek
Swiney Branch
Mou
se C
reek
Rock Creek
Mill Creek
Lake Jacomo
Lake Jacomo
Longview Lake
Lakewood Lakes
Lakewood Lakes
Lake Tapawingo
0 1 20.5
Miles
1 inch equals 2 miles
I-70 First Tier EISHydrology
State Boundary
I‐70 First Tier Purpose and Need 12 of 30
Figure 4: 2005 Average Daily Traffic Volumes
68,050 79,666
98,516
90,818
85,172
114,046
113,574
90,40097,828
127,30 0
58,160
68,100 79,700
98,500
90,800
85,200
114,000
113,600
90,40097,800
127,300
58,200
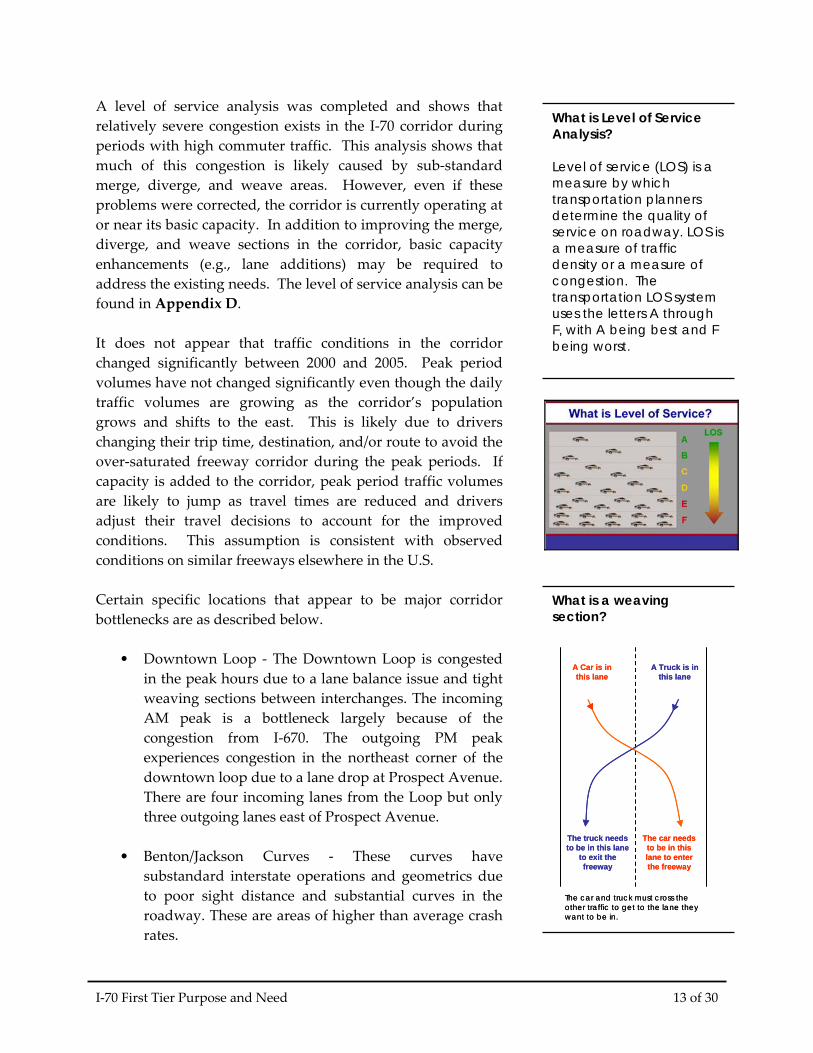
A level of service analysis was completed and shows that relatively severe congestion exists in the I‐70 corridor during periods with high commuter traffic. This analysis shows that much of this congestion is likely caused by sub‐standard merge, diverge, and weave areas. However, even if these problems were corrected, the corridor is currently operating at or near its basic capacity. In addition to improving the merge, diverge, and weave sections in the corridor, basic capacity enhancements (e.g., lane additions) may be required to address the existing needs. The level of service analysis can be found in Appendix D.
What is Level of Service Analysis? Level of service (LOS) is a measure by which transportation planners determine the quality of service on roadway. LOS is a measure of traffic density or a measure of congestion. The transportation LOS system uses the letters A through F, with A being best and F being worst.
It does not appear that traffic conditions in the corridor changed significantly between 2000 and 2005. Peak period volumes have not changed significantly even though the daily traffic volumes are growing as the corridor’s population grows and shifts to the east. This is likely due to drivers changing their trip time, destination, and/or route to avoid the over‐saturated freeway corridor during the peak periods. If capacity is added to the corridor, peak period traffic volumes are likely to jump as travel times are reduced and drivers adjust their travel decisions to account for the improved conditions. This assumption is consistent with observed conditions on similar freeways elsewhere in the U.S.
Certain specific locations that appear to be major corridor bottlenecks are as described below.
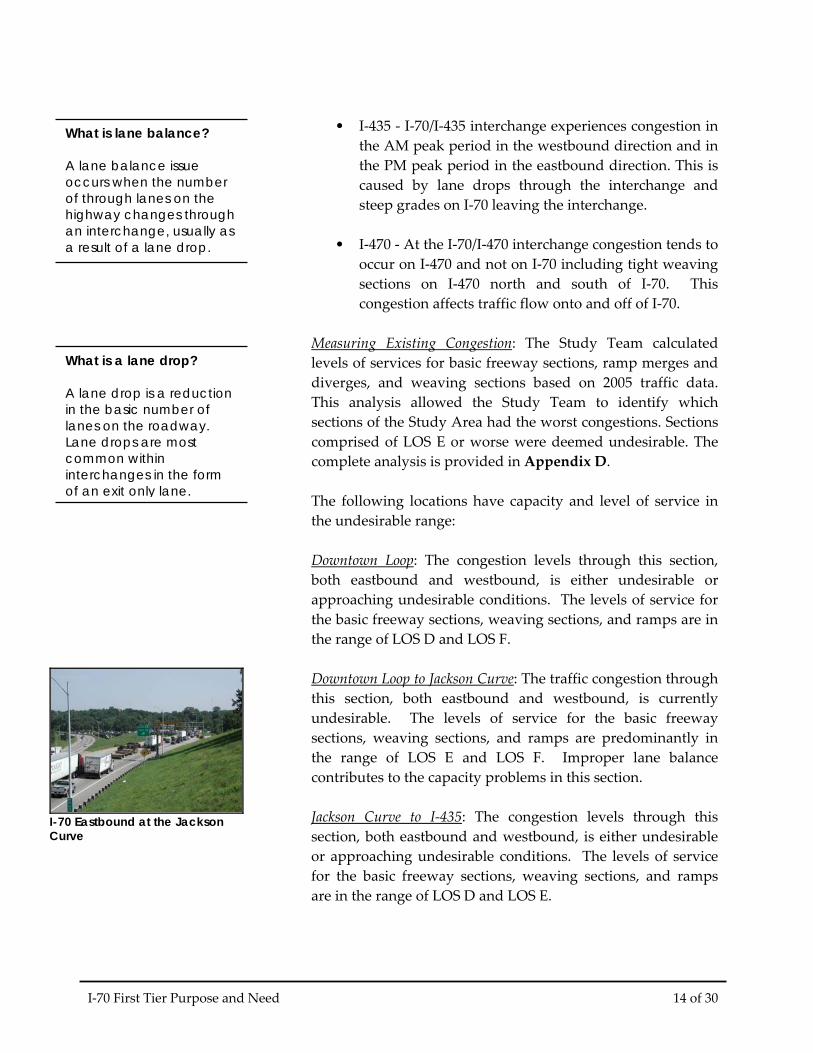
What is a weaving section?
A Car is in this lane
The car needs to be in this lane to enter the freeway
A Truck is in this lane
The truck needs to be in this lane
to exit the freeway
The car and truck must cross the other traffic to get to the lane they want to be in.
A Car is in this lane
The car needs to be in this lane to enter the freeway
A Truck is in this lane
The truck needs to be in this lane
to exit the freeway
The car and truck must cross the other traffic to get to the lane they want to be in.
• Downtown Loop ‐ The Downtown Loop is congested in the peak hours due to a lane balance issue and tight weaving sections between interchanges. The incoming AM peak is a bottleneck largely because of the congestion from I‐670. The outgoing PM peak experiences congestion in the northeast corner of the downtown loop due to a lane drop at Prospect Avenue. There are four incoming lanes from the Loop but only three outgoing lanes east of Prospect Avenue.
• Benton/Jackson Curves ‐ These curves have
substandard interstate operations and geometrics due to poor sight distance and substantial curves in the roadway. These are areas of higher than average crash rates.
I‐70 First Tier Purpose and Need 13 of 30
• I‐435 ‐ I‐70/I‐435 interchange experiences congestion in
the AM peak period in the westbound direction and in the PM peak period in the eastbound direction. This is caused by lane drops through the interchange and steep grades on I‐70 leaving the interchange.
What is lane balance? A lane balance issue occurs when the number of through lanes on the highway changes through an interchange, usually as a result of a lane drop.
• I‐470 ‐ At the I‐70/I‐470 interchange congestion tends to
occur on I‐470 and not on I‐70 including tight weaving sections on I‐470 north and south of I‐70. This congestion affects traffic flow onto and off of I‐70.
Measuring Existing Congestion: The Study Team calculated levels of services for basic freeway sections, ramp merges and diverges, and weaving sections based on 2005 traffic data. This analysis allowed the Study Team to identify which sections of the Study Area had the worst congestions. Sections comprised of LOS E or worse were deemed undesirable. The complete analysis is provided in Appendix D.
What is a lane drop? A lane drop is a reduction in the basic number of lanes on the roadway. Lane drops are most common within interchanges in the form of an exit only lane.
The following locations have capacity and level of service in the undesirable range: Downtown Loop: The congestion levels through this section, both eastbound and westbound, is either undesirable or approaching undesirable conditions. The levels of service for the basic freeway sections, weaving sections, and ramps are in the range of LOS D and LOS F. Downtown Loop to Jackson Curve: The traffic congestion through this section, both eastbound and westbound, is currently undesirable. The levels of service for the basic freeway sections, weaving sections, and ramps are predominantly in the range of LOS E and LOS F. Improper lane balance contributes to the capacity problems in this section.
I-70 Eastbound at the Jackson Curve
Jackson Curve to I‐435: The congestion levels through this section, both eastbound and westbound, is either undesirable or approaching undesirable conditions. The levels of service for the basic freeway sections, weaving sections, and ramps are in the range of LOS D and LOS E.
I‐70 First Tier Purpose and Need 14 of 30
I‐435: The congestion levels in both directions through the I‐435 interchange are undesirable, with levels of service predominantly in the range of LOS E and LOS F. Undesirable lane balance through this section is the main constraint to existing capacity. I‐435 to East Project Terminus: The congestion levels through this remaining section of the project corridor are either undesirable or approaching undesirable conditions. The levels of service for the basic freeway sections, weaving sections, and ramps are in the range of LOS C and LOS E. Congestion and Transit Service: Traffic growth and congestion in the I‐70 corridor affect bus services that operate on I‐70. Currently, travel options along the I‐70 corridor include primarily motor vehicles along with limited transit opportunities. There are currently three fixed bus transit routes that use I‐70 between downtown Kansas City and other communities. With the limited options, the majority of travel is done by passenger vehicles. Enhanced modal options in the corridor could have the potential to shift some traffic away from passenger vehicles and thus reduce congestion and environmental impacts such as air quality. Vehicle occupancy has leveled out based on MARC’s 2002 Vehicle Occupancy Study. However, recent increases in fuel costs since that study will impact the current vehicle occupancy use in terms of increased transit ridership and carpooling. SmartMoves is metropolitan Kansas City’s vision for expanded and enhanced public transportation services. It is a regional plan identifying future transit service in seven of the metropolitan area counties. SmartMoves builds on extensive prior transit plans and studies, reflects residents and businesses desires in a public transit system, and incorporates models and best practices from across the country for modern, effective, and efficient public transportation services. The benefits include increased mobility options for residents through new routes and technologies, a strengthened economy as a result of connecting major Kansas City employment and activity centers. The improvements developed for the I‐70 FTEIS need to coordinate with the 2008
I‐70 First Tier Purpose and Need 15 of 30
SmartMoves update and other plans put forward by local and regional agencies. Regional Congestion Reduction Measures: As the I‐70 FTEIS proceeds, coordination with Kansas City Scout and Operation Green Light will be required. These initiatives were implemented to maximize travel efficiency and reduce congestion along I‐70 and parallel routes. The Kansas City Scout, an Intelligent Transportation System (ITS), whose role is to provide traffic and roadway information to motorists in the Kansas City Metropolitan Area. This helps keep the interstate traffic moving smoothly. It functions by using sensors, cameras and large easy to read, changeable message boards to inform motorists about traffic problems, delays, collisions, and other real‐time information. Kansas City Scout has the potential to work with all aspects of the region’s transportation system. In 1998, MARC, along with several other agencies in Kansas and Missouri, initiated Operation Green Light, a study of the potential congestion mitigation and air quality impacts of enhanced arterial traffic signal systems to improve coordination of traffic signals on regional traffic corridors. This effort may also establish a link between the operation of regional freeway management systems and the operations of regional signalized arterial roadways. For I‐70, this could mean reduced congestion on ramps between the freeway and local arterial roads and greater flow of traffic on parallel roadways. This could reduce congestion at interchanges and reduce the number of local trips on I‐70 as local roads move traffic more efficiently. Restore and Maintain Existing Infrastructure
Other than short reconstructed portions, most sections of the Study Area are approximately 40 to 50 years old. With proper maintenance, the Jackson County I‐70 facility has outlasted its original design life of 20 years. Since the original construction, some interstate design standards have been revised and now leave I‐70 with undesirable design features. Improvements proposed as part of the I‐70 FTEIS need to modernize the freeway.
I‐70 First Tier Purpose and Need 16 of 30
A variety of data was gathered for the existing corridor’s physical characteristics. Four categories were established for the organization and evaluation of this data:
• Cross section elements (lane widths, shoulder widths, medians)
• Alignment (horizontal and vertical)
• Physical condition (pavement and bridge conditions)
• System configuration The subsequent discussion briefly describes the thresholds established for these categories. Cross Section: Lane width, shoulder width, and median width were the three primary cross section elements evaluated. Lane Width: Based on MoDOT standards, the Study Team defined lane widths of less than 12 feet as undesirable. For a freeway such as I‐70, 12‐foot lanes are important to maximize safety and capacity of the facility. Shoulder Width: The Study Team defined any shoulder widths of less than ten feet as undesirable. Ten foot shoulders are necessary on both sides of the traveled way to provide room for emergency pull offs, including trucks, given the high truck percentage in the project corridor. Insufficient room for emergency pull offs is detrimental to both the safety and capacity of a roadway, particularly of a freeway as minor crashes or incidents can cause unnecessary lane blockages and substantial congestion. Median Width: The Study Team defined median widths of less than 26 feet as undesirable. Since ten foot shoulders are required on the inside of the traveled way, and since a median barrier two feet in width is required to separate the opposing directions of traffic, 26 feet is the minimum width of desirable median. Nearly the entire project length has undesirable shoulder and median widths. The majority of shoulders are less than the standard ten feet in width; the majority of median sections are less than the standard 26 feet in width. Lane widths along I‐70 are sufficient. To the extent feasible, Study Area improvements
I‐70 First Tier Purpose and Need 17 of 30
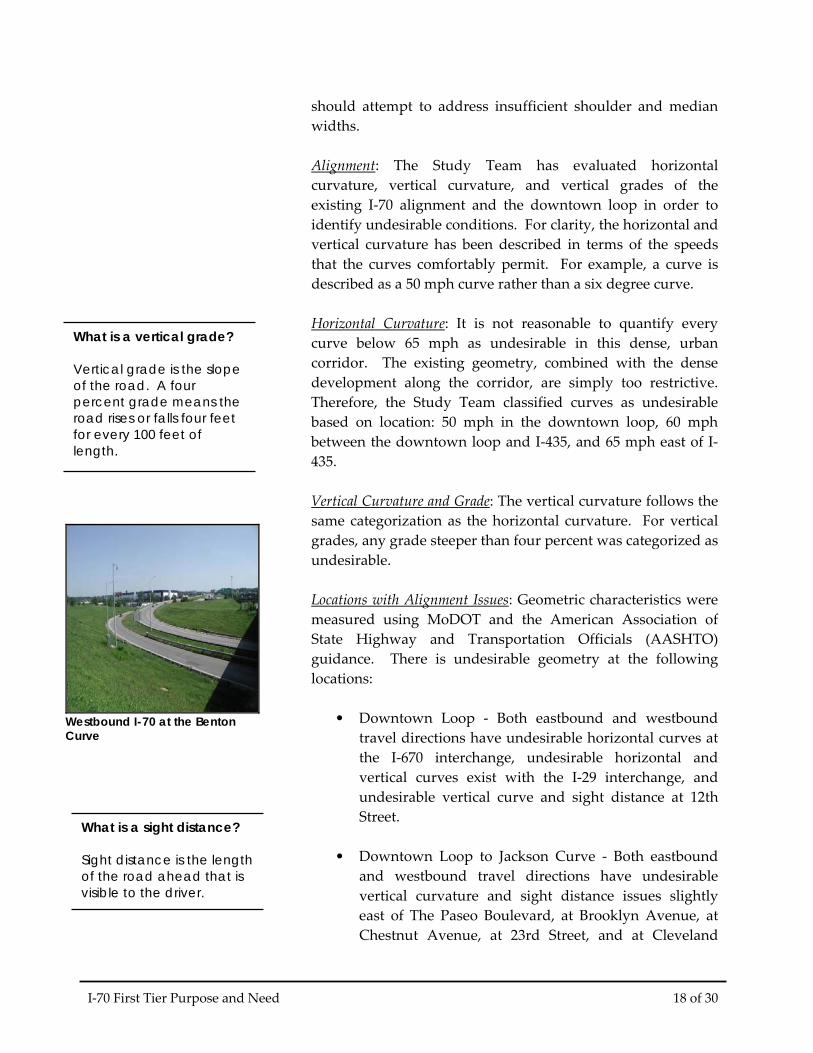
should attempt to address insufficient shoulder and median widths. Alignment: The Study Team has evaluated horizontal curvature, vertical curvature, and vertical grades of the existing I‐70 alignment and the downtown loop in order to identify undesirable conditions. For clarity, the horizontal and vertical curvature has been described in terms of the speeds that the curves comfortably permit. For example, a curve is described as a 50 mph curve rather than a six degree curve. Horizontal Curvature: It is not reasonable to quantify every curve below 65 mph as undesirable in this dense, urban corridor. The existing geometry, combined with the dense development along the corridor, are simply too restrictive. Therefore, the Study Team classified curves as undesirable based on location: 50 mph in the downtown loop, 60 mph between the downtown loop and I‐435, and 65 mph east of I‐435.
What is a vertical grade? Vertical grade is the slope of the road. A four percent grade means the road rises or falls four feet for every 100 feet of length.
What is a sight distance?
Westbound I-70 at the Benton Curve
Sight distance is the leof the road ahead that is visible to the driver.
ngth
Vertical Curvature and Grade: The vertical curvature follows the same categorization as the horizontal curvature. For vertical grades, any grade steeper than four percent was categorized as undesirable. Locations with Alignment Issues: Geometric characteristics were measured using MoDOT and the American Association of State Highway and Transportation Officials (AASHTO) guidance. There is undesirable geometry at the following locations:
• Downtown Loop ‐ Both eastbound and westbound travel directions have undesirable horizontal curves at the I‐670 interchange, undesirable horizontal and vertical curves exist with the I‐29 interchange, and undesirable vertical curve and sight distance at 12th Street.
• Downtown Loop to Jackson Curve ‐ Both eastbound
and westbound travel directions have undesirable vertical curvature and sight distance issues slightly east of The Paseo Boulevard, at Brooklyn Avenue, at Chestnut Avenue, at 23rd Street, and at Cleveland
I‐70 First Tier Purpose and Need 18 of 30
Avenue. There is an undesirable horizontal curve at Benton Boulevard.
• Jackson Curve to I‐435 ‐ Both eastbound and
westbound travel directions have undesirable vertical curvature and sight distance issues through the I‐435 interchange and undesirable horizontal curvature at Jackson Avenue. Only the eastbound direction has vertical curvature and sight distance issues at Truman Road and 18th Street.
• I‐435 to East Project Terminus does not have vertical
curvature, horizontal curvature, or sight distance issues.
Physical Condition: The Study Team recognizes I‐70 is an aging facility which requires annual maintenance to the pavement and bridges. The on‐going maintenance needs of the pavement and bridges are not a determining factor in evaluating strategy packages. The specific pavement and bridges that are currently in poor condition will require replacement or maintenance work regardless of the strategy package selected by the FTEIS process. The I‐70 FTEIS needs to seek solutions that modernize the freeway and reduce the need for the frequent regular maintenance that is needed today. System Configuration: The Study Team conducted a system configuration evaluation based on AASHTO Principles of Good Urban Freeway Planning and Design. The following are key system configuration principles that Study Area improvements need to address where feasible:
• Maintain route continuity and maintain basic number of lanes.
• Provide lane balance and continuity. • Maintain appropriate ramp spacing and design ramps
consistent with freeway speeds. • Eliminate weaving within interchanges along the
mainline.
I‐70 First Tier Purpose and Need 19 of 30
The Study Area locations that do not fully meet these AASHTO principles are listed below. Interchange Access Issues: A number of interchanges in the project corridor do not provide full access to all directions of traffic.
• MO‐9 interchange prohibits northbound traffic from going east or west on I‐70.
• I‐670 interchange prohibits westbound traffic on I‐70 from going southbound. What is partial access?
Partial access is when one or more movements at an intersection or interchange are not allowed or unavailable. For example, the U.S. 40 W interchange prohibits southbound U. S. 40 W traffic to access eastbound I-70.
• Brooklyn Avenue, Prospect Avenue, Chestnut Avenue, Benton Boulevard, Truman Road, and 18th Street all provide only partial access; the configurations can be confusing and counter intuitive to driver expectations.
• Access at 27th Street and Jackson Avenue is partial and asymmetrical.
• U.S. 40 interchange (between Manchester Trafficway and I‐435) prohibits southbound to eastbound and northbound to westbound access.
• There is only an eastbound exit ramp at Sterling Avenue.
• There is only an eastbound entrance ramp at Blue Ridge Boulevard.
Improper Lane Balance: Improper lane balance contributes to the congestion problems in the corridor. The following areas represent bottleneck situations, creating significant congestion due to improper lane balance.
• Westbound I‐70 at Broadway Boulevard.
• Westbound I‐70 through the I‐670 interchange.
• Eastbound I‐70 approaching The Paseo Boulevard.
I‐70 First Tier Purpose and Need 20 of 30
• Eastbound I‐70 at Prospect Avenue.
• Eastbound and westbound I‐70 through the I‐435 interchange.
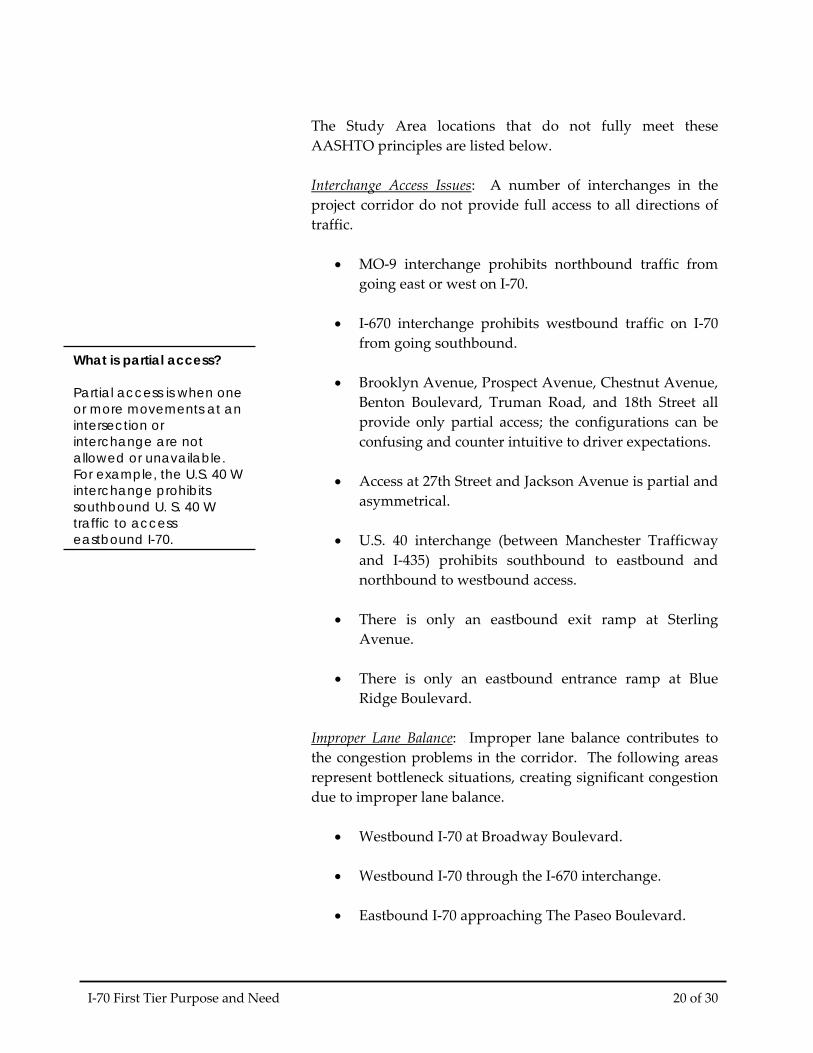
Downtown Loop: This section of the corridor is characterized by short weaving sections, and short on and off ramp lengths.
• Eastbound I‐70 has a number of undesirable weave lengths within the downtown loop. The weave length issues are between Broadway Boulevard and Main Street, on frontage road beneath Main Street, between Main Street and MO‐9, between Admiral Boulevard and 11th Street, and between 10th Street and I‐670 interchange. Shorter than desirable eastbound ramps include to and from the frontage road along north leg of loop (6th Street) and the eastbound entrance ramp from 10th Street. Finally, the east leg of the loop has a left lane exit to eastbound I‐70 in the I‐670 interchange.
North side of downtown loop looking east
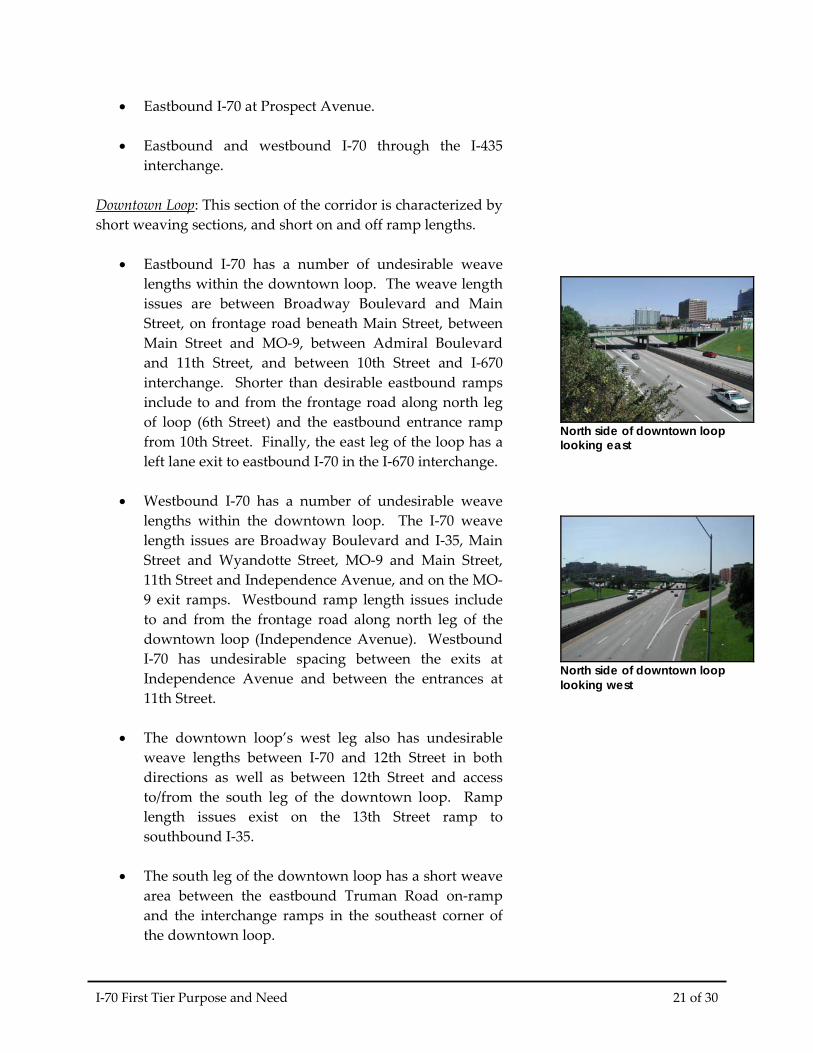
• Westbound I‐70 has a number of undesirable weave lengths within the downtown loop. The I‐70 weave length issues are Broadway Boulevard and I‐35, Main Street and Wyandotte Street, MO‐9 and Main Street, 11th Street and Independence Avenue, and on the MO‐9 exit ramps. Westbound ramp length issues include to and from the frontage road along north leg of the downtown loop (Independence Avenue). Westbound I‐70 has undesirable spacing between the exits at Independence Avenue and between the entrances at 11th Street.
North side of downtown loop looking west
• The downtown loop’s west leg also has undesirable
weave lengths between I‐70 and 12th Street in both directions as well as between 12th Street and access to/from the south leg of the downtown loop. Ramp length issues exist on the 13th Street ramp to southbound I‐35.
• The south leg of the downtown loop has a short weave
area between the eastbound Truman Road on‐ramp and the interchange ramps in the southeast corner of the downtown loop.
I‐70 First Tier Purpose and Need 21 of 30
Downtown Loop to Jackson Curve: This section is characterized by short weaving sections, short ramp lengths, and undesirable lane balance. There are undesirable weaving sections between The Paseo Boulevard and Brooklyn Avenue, as well as between 18th Street and 23rd Street in both directions. Undesirable eastbound exit ramp lengths and westbound entrance ramp lengths occur at The Paseo Boulevard, Brooklyn Avenue, Indiana Avenue, and 27th Street. Eastbound 23rd Street has undesirable entrance and exit ramp lengths. Jackson Curve to I‐435: This section has short weaving sections, short ramp lengths, and undesirable lane balance. Both the eastbound and the westbound directions have undesirable weaving sections between Manchester Trafficway and I‐435. The eastbound entrance ramp and the westbound exit ramp lengths at Van Brunt Boulevard are both undesirable. I‐435 to East Project Terminus: This section has short weaving sections, short ramp lengths, and undesirable lane balance. I‐70 has undesirable eastbound exit ramp length and westbound entrance ramp length at Blue Ridge Cut‐Off. Both directions of I‐70 have undesirable entrance ramp lengths at Blue Ridge Boulevard. An undesirable weaving area exists at the westbound I‐70 exit ramp at U.S. 40. Lee’s Summit Road has all four ramps with undesirable lengths. The weaving areas within the I‐470 interchange are undesirable in both directions.
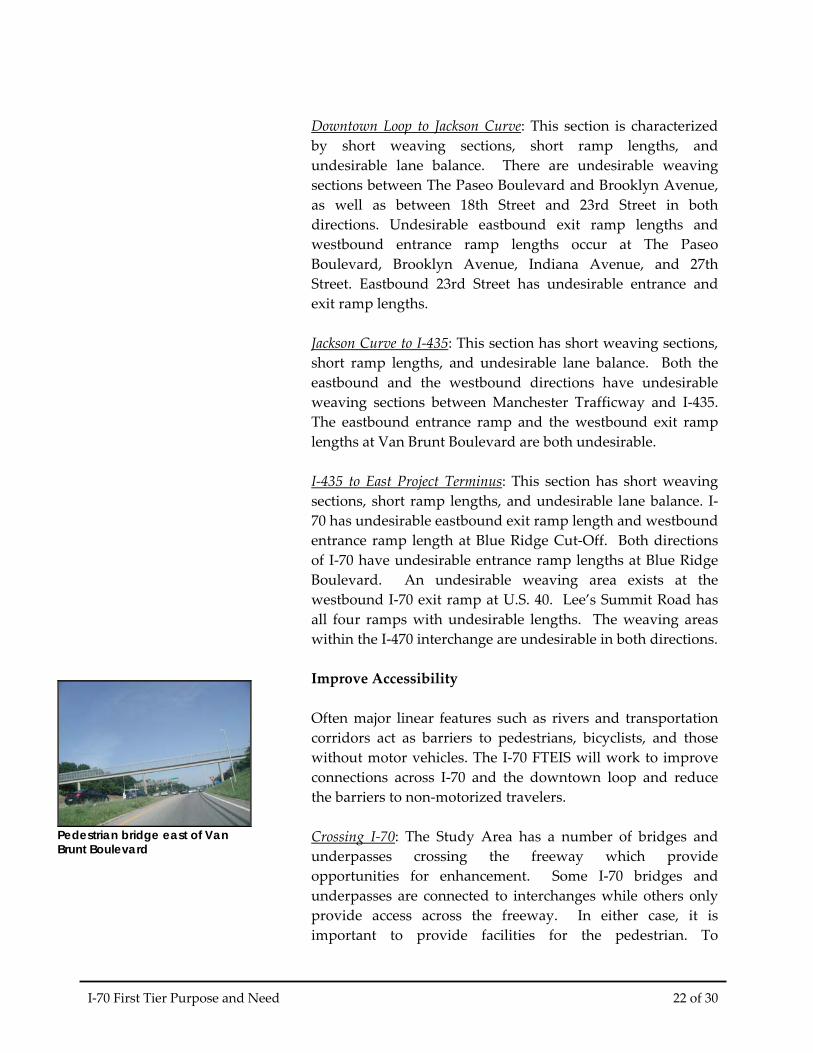
Pedestrian bridge east of Van Brunt Boulevard
Improve Accessibility Often major linear features such as rivers and transportation corridors act as barriers to pedestrians, bicyclists, and those without motor vehicles. The I‐70 FTEIS will work to improve connections across I‐70 and the downtown loop and reduce the barriers to non‐motorized travelers. Crossing I‐70: The Study Area has a number of bridges and underpasses crossing the freeway which provide opportunities for enhancement. Some I‐70 bridges and underpasses are connected to interchanges while others only provide access across the freeway. In either case, it is important to provide facilities for the pedestrian. To
I‐70 First Tier Purpose and Need 22 of 30
supplement the numerous roadway crossings of I‐70, there are two pedestrian bridges – one east of the Van Brunt Boulevard interchange connecting at Oakley Avenue and the second east of the Jackson Avenue interchange connecting at Cypress Avenue. The Cypress Avenue pedestrian bridge connects Cypress Park on the south side of I‐70 to the residential neighborhood to the north of I‐70. The majority of the bridges and underpasses have sidewalk accommodations on at least one side of the street. However, there are six locations without sidewalks available. These cross streets are Blue Ridge Boulevard, U.S. 40 East, Sterling Avenue, Stadium Drive, Manchester Trafficway, and U.S. 40 West. Pittman Road has a sidewalk on the bridge over I‐70, however there are no connecting sidewalks on either side of the bridge. Inside the downtown loop, there are two additional I‐70 crossings without sidewalk facilities located at 6th Street and Oak Street. Bicycle Facilities: The Kansas City Area does not yet have a regional network of fully interconnected bicycle facilities. There are various bike lanes and paths available throughout the Study Area, but non‐motorized transportation system improvements, along the I‐70 corridor or paralleling the corridor, are still needed. Individual projects have been constructed to various standards, some of which offer potential for future inclusion as part of a comprehensive regional bikeway system. Since most of the existing projects were planned and designed as recreational trails, they primarily meet recreation needs and may need to be upgraded or extended to become effective transportation routes. Transit Routes: KCATA fixed routes that parallel or cross I‐70 use the arterial road network. More than 55 KCATA transit routes cross I‐70 or the downtown interstate loop as they provide radial service from the transit center in downtown Kansas City. In addition, 8.35 percent of the households in adjacent census block groups to I‐70 have no vehicles available. Ten of the 61 census blocks groups adjacent to I‐70 have 20 percent or more of their households with no vehicle. This indicates that transit needs are an important aspect of the I‐70 corridor.
I‐70 First Tier Purpose and Need 23 of 30
Improvement of accessibility across I‐70 and for pedestrians, bicyclists, and those without motor vehicles, is needed to serve and support the wide variety of land uses adjacent to the freeway. The land uses within the Study Area vary drastically from Kansas City’s Central Business District to residential neighborhoods to major regional retail areas. Even within individual land use categories the Study Area varies greatly. For example, residential land uses include suburban neighborhoods, urban neighborhoods, and downtown neighborhoods. Together with a diverse land use, the Study Area contains several schools, churches, parks, and recreational areas such as Parade Park, West Terrace Park, and Little Blue Trace Nature Preserve. Several noteworthy buildings or structures adjacent to the corridor include Kauffman and Arrowhead Stadiums, Independence Center Shopping Mall, Kansas City Star Building, H&R Block World Headquarters, Whittaker Federal Courthouse, Bartle Hall Convention Center, Sprint Center, and a Federal Bureau of Investigation Building. It is important that improvements are sensitive to the needs of the local neighborhoods and businesses to access these key destinations located on either side of the freeway.
Improve Goods Movement Kansas City’s mid‐continent location makes the region a key location for the movement of goods. National cargo passes through the region by truck, rail, water, and air. I‐70, I‐35, I‐29, and U.S. 71 are the primary truck routes in the region. Shipments of local goods often use the interstate system to distribute goods from the manufacturer to the warehouse or from the warehouse to the store. The I‐70 FTEIS improvements need to support goods movement by providing less congested, more reliable travel. This will lead to improved freight travel times and reduced operating costs for moving goods. Trucks are an important component of the traffic stream in the I‐70 corridor. Approximately 11 percent of the vehicles in the corridor are trucks. Truck percentages during the peak periods (7:00 a.m. ‐ 9:00 a.m. and 4:00 p.m. ‐ 6:00 p.m.) are higher
I‐70 First Tier Purpose and Need 24 of 30
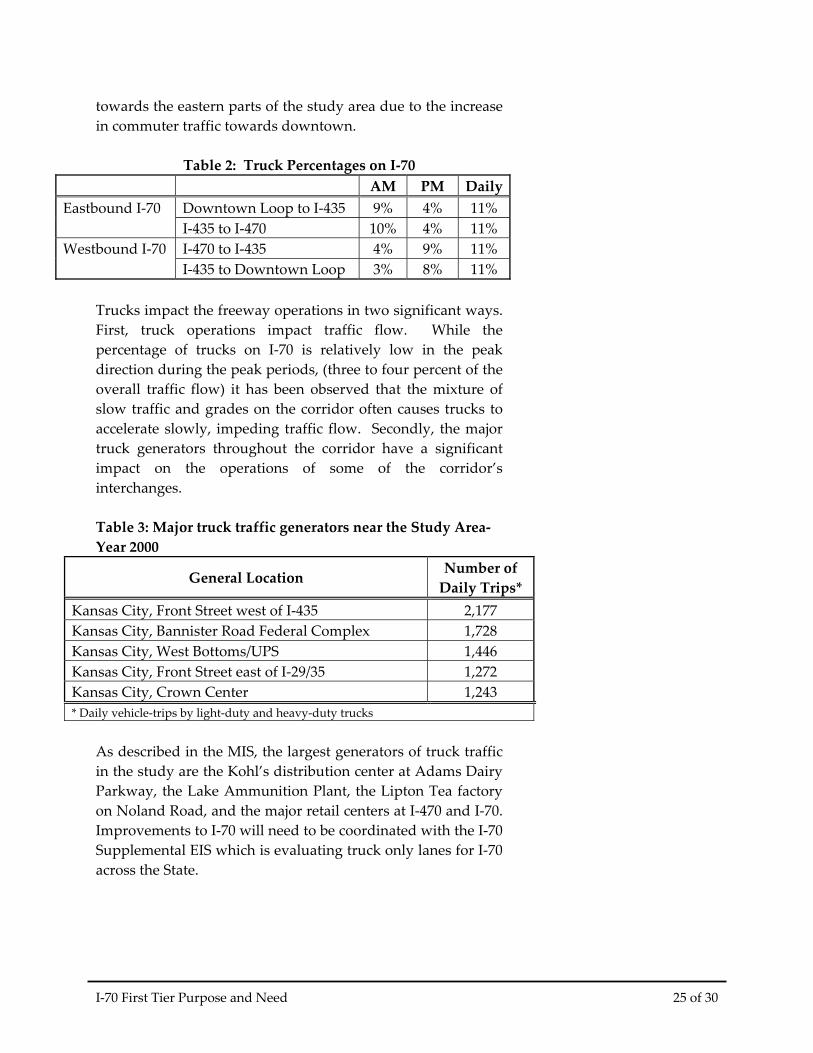
towards the eastern parts of the study area due to the increase in commuter traffic towards downtown.
Table 2: Truck Percentages on I‐70 AM PM Daily
Downtown Loop to I‐435 9% 4% 11% Eastbound I‐70 I‐435 to I‐470 10% 4% 11% I‐470 to I‐435 4% 9% 11% Westbound I‐70 I‐435 to Downtown Loop 3% 8% 11%
Trucks impact the freeway operations in two significant ways. First, truck operations impact traffic flow. While the percentage of trucks on I‐70 is relatively low in the peak direction during the peak periods, (three to four percent of the overall traffic flow) it has been observed that the mixture of slow traffic and grades on the corridor often causes trucks to accelerate slowly, impeding traffic flow. Secondly, the major truck generators throughout the corridor have a significant impact on the operations of some of the corridor’s interchanges. Table 3: Major truck traffic generators near the Study Area‐Year 2000
General Location Number of Daily Trips*
Kansas City, Front Street west of I‐435 2,177 Kansas City, Bannister Road Federal Complex 1,728 Kansas City, West Bottoms/UPS 1,446 Kansas City, Front Street east of I‐29/35 1,272 Kansas City, Crown Center 1,243 * Daily vehicle‐trips by light‐duty and heavy‐duty trucks
As described in the MIS, the largest generators of truck traffic in the study are the Kohl’s distribution center at Adams Dairy Parkway, the Lake Ammunition Plant, the Lipton Tea factory on Noland Road, and the major retail centers at I‐470 and I‐70. Improvements to I‐70 will need to be coordinated with the I‐70 Supplemental EIS which is evaluating truck only lanes for I‐70 across the State.
I‐70 First Tier Purpose and Need 25 of 30
What is the Relationship of the I‐70 FTEIS to Other Regional Transportation Studies? The FTEIS will also incorporate the results of other transportation‐related studies prepared under MoDOT and MARC guidance. This provides coordination at the regional level so that the I‐70 FTEIS in KC Metro is completed with awareness of other regional initiatives. Relevant regional studies are discussed below. Statewide I‐70 First Tier Environmental Impact Statement
What is a Record of Decision? Record of Decision (ROD) is a public document formalizing the final course of action to be taken by the Lead Agency at the end of an Environmental Impact Statement Study. The ROD discusses all environmental alternatives or strategies considered in the EIS process, provides the rationale for the alternative or strategies selected, and explains why the other alternatives or strategies were not chosen.
In January 2000, MoDOT initiated the I‐70 First Tier EIS to determine the best transportation improvement strategy for the I‐70 Study Corridor between the I‐470 interchange in the Kansas City Metropolitan Area and the Lake St. Louis interchange in the St. Louis Metropolitan Area. The Final First Tier EIS was approved in November 2001 and the Record of Decision was executed in December 2001. Through a coordinated public and agency involvement process, the Widen Existing I‐70 Strategy was identified as the preferred strategy. In general, this strategy entails a reinvestment in existing I‐70. This strategy will reconstruct the existing I‐70 pavement, bridges, and interchanges across the state with an improved and widened six‐lane roadway section. Between I‐470 and Oak Grove, this strategy will consist of a widened six lanes be provided in the rural areas and a minimum of eight lanes through the metropolitan area of Kansas City. I‐70 SIU #1 Environmental Assessment (EA)
The Second Tier I‐70 SIU #1 EA builds from the work completed in the I‐70 First Tier EIS. The minimum eight‐lane section on the east side of metropolitan Kansas City would extend from I‐470 in Independence to Adams Dairy Parkway in Blue Springs. Considerations would need to be given to connection with and continuation of these lanes through the I‐470 interchange to the west as part of the I‐70 FTEIS. Environmental clearance was achieved for the portion of I‐70 east of I‐470. The SIU #1 EA resulted in a Finding of No
I‐70 First Tier Purpose and Need 26 of 30
Significant Impacts (FONSI) which was signed on September 2006. Supplemental Statewide I‐70 First Tier Environmental Impact Statement The Statewide I‐70 EIS was re‐opened to examine truck only lanes (TOL) potential on I‐70 across the state. The concept is that trucks would have separate exclusive use lanes providing increased capacity for freight movements while reducing conflicts between cars and trucks. This effort was initiated in late 2007. Close coordination between the Supplemental I‐70 FTEIS and the I‐70 FTEIS in KC Metro will be important as both studies proceed. I‐435/I‐70 Alternative Study I‐435/I‐70 Alternative Study evaluated interchange options to improve traffic flow through the I‐435 and I‐70 interchange. The I‐70 FTEIS must consider the recommended interchange concept and incorporate it to the extent that the interchange concept is compatible with other I‐70 improvements indentified through the FTEIS. Northland/Downtown Major Investment Study (MIS) The Northland/Downtown Major Investment Study was completed in 2002 to address and improve the transportation and economic linkages across the Missouri River between downtown Kansas City, MO, the Northland, and the Kansas City International (KCI) Airport. Sponsored jointly by the KCATA, MoDOT, MARC, and the city of Kansas City, MO, this study considered a number of alternative improvement strategies to address bridge capacity issues into and out of downtown. The I‐29 corridor serves trips that are destined to or are just passing through downtown and connects with the downtown loop. Improvements to the downtown loop will benefit all highway corridors that connect with it. Full build‐out of the recommended long‐term improvements proposed in the Northland/Downtown MIS would entail completion of fixed‐guideway transit service between downtown and Kansas City International Airport. The I‐29
I‐70 First Tier Purpose and Need 27 of 30
corridor would be generally upgraded and widened to an eight‐lane section from U.S. 169 into downtown, including the construction of a new Paseo Bridge over the Missouri River. Construction of this new bridge has begun as part of the kcICON project. Complementary improvements and upgrades of the various access points along I‐29, including improved direct access into the northeast corner of downtown, would be provided.
Paseo Bridge
I‐29/I‐35 EIS and Location Study
The I‐29/I‐35 EIS and Location Study completed in 2007 was a result of the Northland/Downtown MIS findings and recommendations for bridge improvements to the I‐29 corridor. The study resulted in the kcICON signature bridge (Christopher S. Bond Bridge) to replace the Paseo Bridge. Construction began in May 2008. The key element, as it relates to the I‐70 FTEIS, is the environmental clearance of improvements to the northeast portion of the downtown loop that should be integrated with the I‐70 FTEIS. Downtown Loop Master Plan
The Downtown Loop Master Plan was developed as part of the I‐29/I‐35 EIS in early 2005. The goal was to lay out a long‐term conceptual improvement plan for the freeway and ramp system that comprise the downtown loop. The concept includes improvements that are warranted to improve the overall safety and efficiency of the loopʹs operation, while supporting downtown Kansas Cityʹs land use and development goals. With this approach, improvements to the corridors that feed into the downtown loop can be implemented in a manner consistent with the overall master plan. The development of the Downtown Loop Master Plan balanced the travel desires of both commuters who access downtown and the regional travelers passing through. The development and assessment of the Downtown Loop Master Plan considered travel markets passing through, traffic demand on approach corridors, freeway lane continuity and balance, and the need for access points to downtown. The result of the study effort was a conceptual plan for freeway
I‐70 First Tier Purpose and Need 28 of 30
through lanes, ingress and egress ramps, associated auxiliary lanes, and local roadway modifications. I‐470 Purpose and Need Study MoDOT is conducting the I‐470 Purpose and Need Study as one of the first steps to gather detailed information on improvement needs along I‐470. The area being examined is the stretch of I‐470 from Blue Ridge Boulevard on the western end to 39th Street on the eastern end in Jackson County. This study will not propose solutions rather result in an analysis on the information gathered to create a Purpose and Need Statement. The Purpose and Need Statement will identify transportation issues in terms of underlying root causes that may need to be addressed, such as safety, mobility and access to recreation, employment opportunities and commerce. These issues will be prioritized into short‐term and long‐term needs for future transportation studies and improvements. I‐70 Corridor Transit Alternatives Analysis The I‐70 Corridor Transit Alternatives Analysis was completed in 2007 as a supplement to the I‐70 Major Investment Study to provide additional detail for transit alternatives in the I‐70 corridor. This study includes analysis of a Transportation Systems Management (TSM) Alternative, an Express Bus Alternative, and a Commuter Rail Alternative. The final recommendations are an enhanced express bus service should be viewed as a near‐term transit strategy while commuter rail along existing rail lines should be viewed as a longer term proposition. Summary The purpose of the I‐70 FTEIS is to determine an improvement strategy for the corridor, including future capacity and mode choices, that addresses the key needs outlined in this document. These five key purpose and need goals are:
• Improve Safety • Reduce Congestion
I‐70 First Tier Purpose and Need 29 of 30
I‐70 First Tier Purpose and Need 30 of 30
• Restore and Maintain Existing Infrastructure • Improve Accessibility • Improve Goods Movement
The Study Team will develop, refine, and evaluate potential I‐70 corridor strategies based on the needs outlined in this document while seeking to minimize impacts to the human and natural environment.

APPENDIX A
Crash History
Appendix A: I‐70 Crash History
I‐70 First Tier Purpose and Need A‐1
I‐70 Crash History Major Investment Study (MIS) Crash Summary A crash analysis was performed as part of the I‐70 Major Investment Study (MIS) for the period 1996‐1998 in which the average annual number of crashes and the average crash rate for each segment of I‐70 between interchanges was computed. Eight segments were identified to have a crash rate that exceeded the statewide crash rate of 122.77 crashes per hundred million vehicle miles of travel. Approximately 574 crashes were reported in the Study Area during that time period. Approximately 24 percent of the crashes involved personal injury and approximately one percent involved fatalities. The frequency of crashes was more than twice that of the statewide average at I‐70 between Manchester Road and I‐435 and at I‐70 between U.S. 40 and Blue Ridge Boulevard. Figure A‐1 shows the high crash locations explored in the MIS in relation to the statewide average crash rate.
Figure A‐1: 1996‐1998 Crash rates as a percentage of statewide averages1
2003‐2007 Crash Analysis A total of 5,857 crashes were reported within the Study Area I‐70 corridor between 2003 and 2007. The locations of the fatal crashes are shown in Figure A‐2. For the purposes of our 1 I‐70 MIS Jackson County, Technical Memorandum 1, “Problem Definition and Initial Statement of Purpose and Need”, Section 5, Page 46, Figure 5.6 (m)
Appendix A: I‐70 Crash History
I‐70 First Tier Purpose and Need A‐2
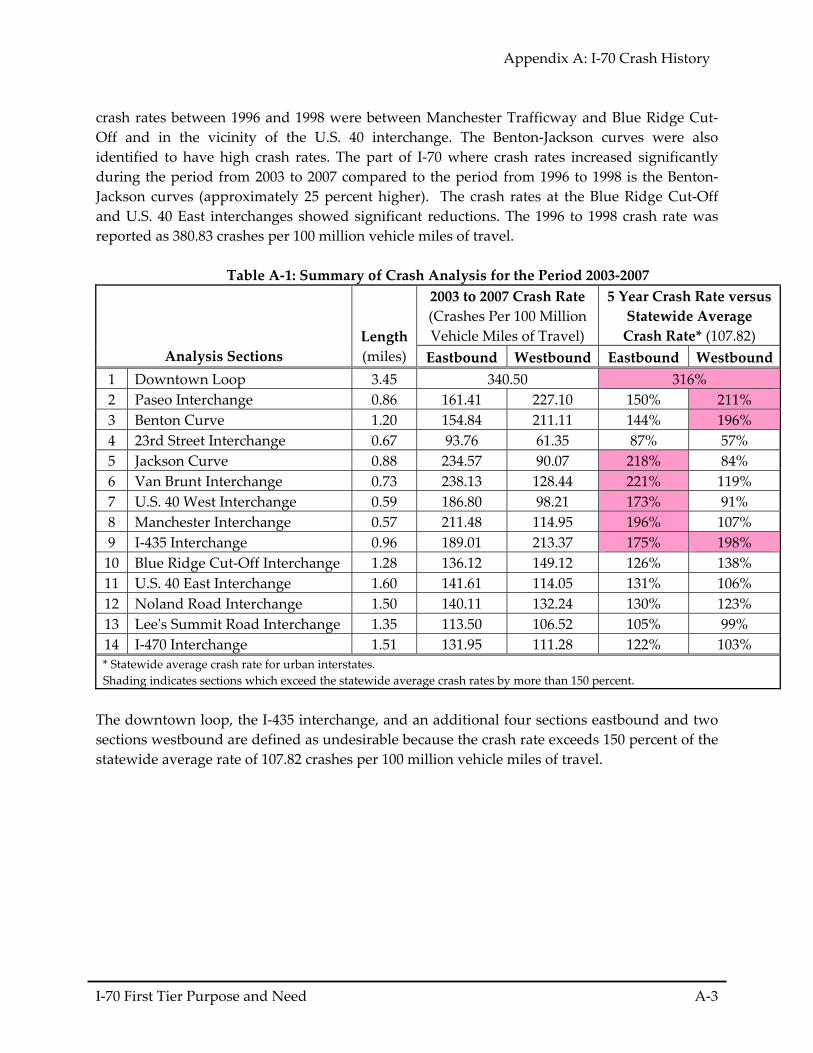
analysis, the study corridor was divided into 14 segments. A summary of the crash rates analysis is shown in Table A‐1. The crash rates that fall within above 151 percent of the statewide average crash rate are undesirable. The dominant crash type for the analysis period was rear end (approximately 53 percent) followed by passing and out of control (approximately 18 percent each). Rear end collisions often occur in congested areas as drivers fail to stop for slow moving traffic. Approximately 78 percent of the crashes in the period of 2003 to 2007 resulted in only property damage and approximately 22 percent resulted in injury. A total of 20 crashes (less than one percent) resulted in fatalities. Injury and fatal crashes were spread throughout the corridor. Approximately 23 percent of all crashes occur in dark conditions and approximately 19 percent occur in icy/snow/wet pavement conditions. Approximately 30 percent occur during the weekday peak period of traffic (7‐9 a.m. and 4‐6 p.m.), which has the largest effect on delay for motorists. The locations of those fatal crashes are shown in Figure A‐2.
Figure A‐2: Fatal Crashes in the I‐70 Corridor 2003 to 2007
The locations with the highest crash rates between 2003 and 2007 are the downtown loop, westbound from the Benton curve to the downtown loop, eastbound from the Jackson curve to I‐435 and the I‐435 interchange. The locations that were identified in the MIS to have the highest
Appendix A: I‐70 Crash History
I‐70 First Tier Purpose and Need A‐3
crash rates between 1996 and 1998 were between Manchester Trafficway and Blue Ridge Cut‐Off and in the vicinity of the U.S. 40 interchange. The Benton‐Jackson curves were also identified to have high crash rates. The part of I‐70 where crash rates increased significantly during the period from 2003 to 2007 compared to the period from 1996 to 1998 is the Benton‐Jackson curves (approximately 25 percent higher). The crash rates at the Blue Ridge Cut‐Off and U.S. 40 East interchanges showed significant reductions. The 1996 to 1998 crash rate was reported as 380.83 crashes per 100 million vehicle miles of travel.
Table A‐1: Summary of Crash Analysis for the Period 2003‐2007 2003 to 2007 Crash Rate (Crashes Per 100 Million Vehicle Miles of Travel)
5 Year Crash Rate versus Statewide Average Crash Rate* (107.82)
Analysis Sections Length (miles) Eastbound Westbound Eastbound Westbound
1 Downtown Loop 3.45 340.50 316% 2 Paseo Interchange 0.86 161.41 227.10 150% 211% 3 Benton Curve 1.20 154.84 211.11 144% 196% 4 23rd Street Interchange 0.67 93.76 61.35 87% 57% 5 Jackson Curve 0.88 234.57 90.07 218% 84% 6 Van Brunt Interchange 0.73 238.13 128.44 221% 119% 7 U.S. 40 West Interchange 0.59 186.80 98.21 173% 91% 8 Manchester Interchange 0.57 211.48 114.95 196% 107% 9 I‐435 Interchange 0.96 189.01 213.37 175% 198% 10 Blue Ridge Cut‐Off Interchange 1.28 136.12 149.12 126% 138% 11 U.S. 40 East Interchange 1.60 141.61 114.05 131% 106% 12 Noland Road Interchange 1.50 140.11 132.24 130% 123% 13 Leeʹs Summit Road Interchange 1.35 113.50 106.52 105% 99% 14 I‐470 Interchange 1.51 131.95 111.28 122% 103% * Statewide average crash rate for urban interstates. Shading indicates sections which exceed the statewide average crash rates by more than 150 percent.
The downtown loop, the I‐435 interchange, and an additional four sections eastbound and two sections westbound are defined as undesirable because the crash rate exceeds 150 percent of the statewide average rate of 107.82 crashes per 100 million vehicle miles of travel.

APPENDIX B
Demographic Trends
Appendix B: Demographic Trends
I‐70 First Tier Purpose and Need B ‐ 1
Demographic Trends Transportation is generally a derived demand. That is – transportation is usually a means to some other end rather than being an end into itself. That being the case, transportation demand is largely derived from the demographic characteristics of the local and regional environments. It is critically important to understand these characteristics in the study of transportation systems to ensure that the systems are built to best address the local needs. This study used several existing sources of data to put together a composite demographic profile of the Study Area. The sources of data used are shown below: Demographic Data Sources • I‐70 Major Investment Study
Historical (1990‐2000) population growth in Study Area Projected (2000‐2020) population growth in Study Area Major trip generators/attractors
• Mid‐America Regional Council 2030 Long Range Transportation Plan
Historical population and employment for region and by county Future population and employment for region and by county Historical and future population and employment growth by census tract Travel times Future capacity deficiencies Transit, bike, pedestrian, railroad, truck
• Mid‐America Regional Council Emme2 Models
Existing and future land use by traffic analysis zone (TAZ) Future link daily and peak hour volumes, level of service, travel times Origin‐Destination information
• 2000 Census Transportation Planning Package Data
2000 household and employment data by census tract and TAZ 2000 Home‐Work flow information (Origin‐Destination, travel time)
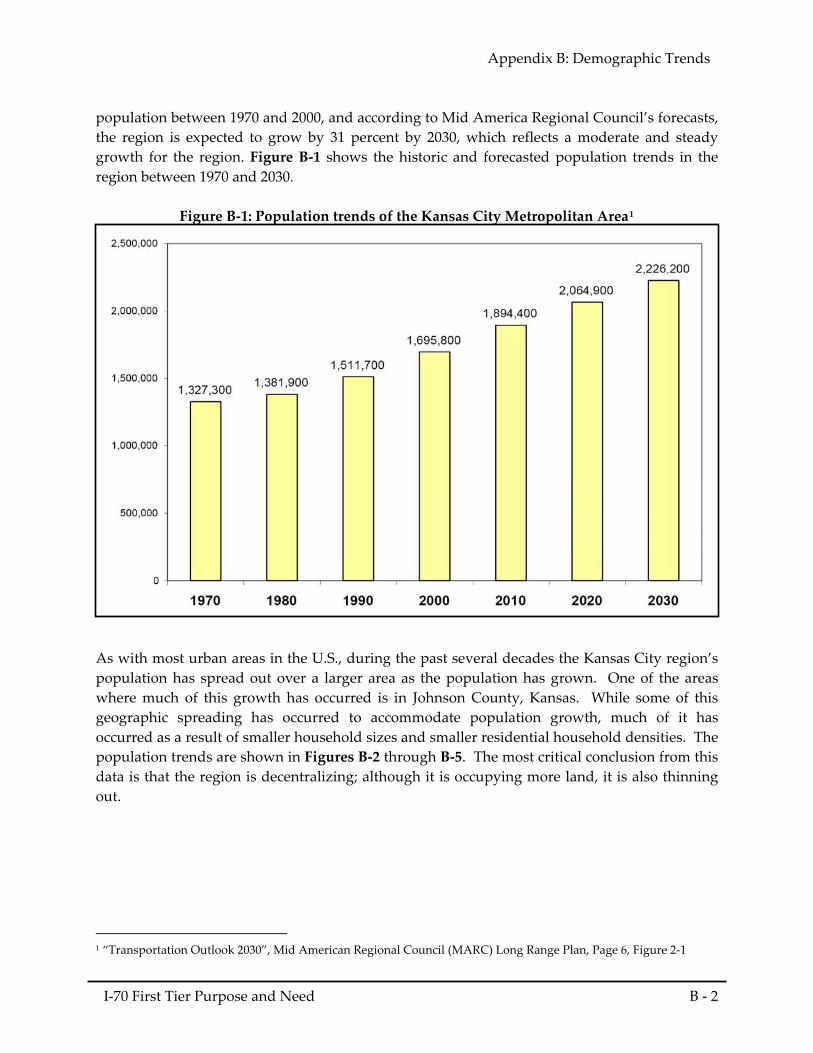
Regional Population Trends Population growth is one of the clearest indicators of economic activity in a corridor or region. Understanding the dynamics of population shifts within regions can help to set priorities for transportation improvements. Kansas City region has experienced a 28 percent growth in
Appendix B: Demographic Trends
I‐70 First Tier Purpose and Need B ‐ 2
population between 1970 and 2000, and according to Mid America Regional Council’s forecasts, the region is expected to grow by 31 percent by 2030, which reflects a moderate and steady growth for the region. Figure B‐1 shows the historic and forecasted population trends in the region between 1970 and 2030.
Figure B‐1: Population trends of the Kansas City Metropolitan Area1
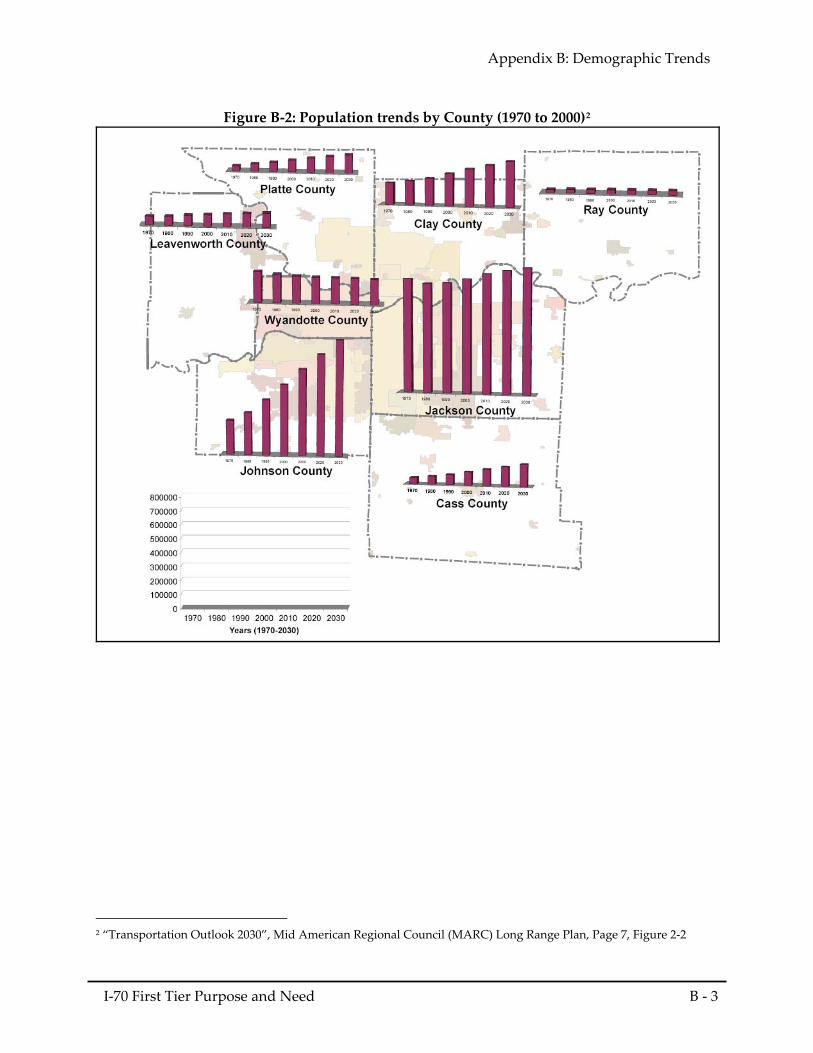
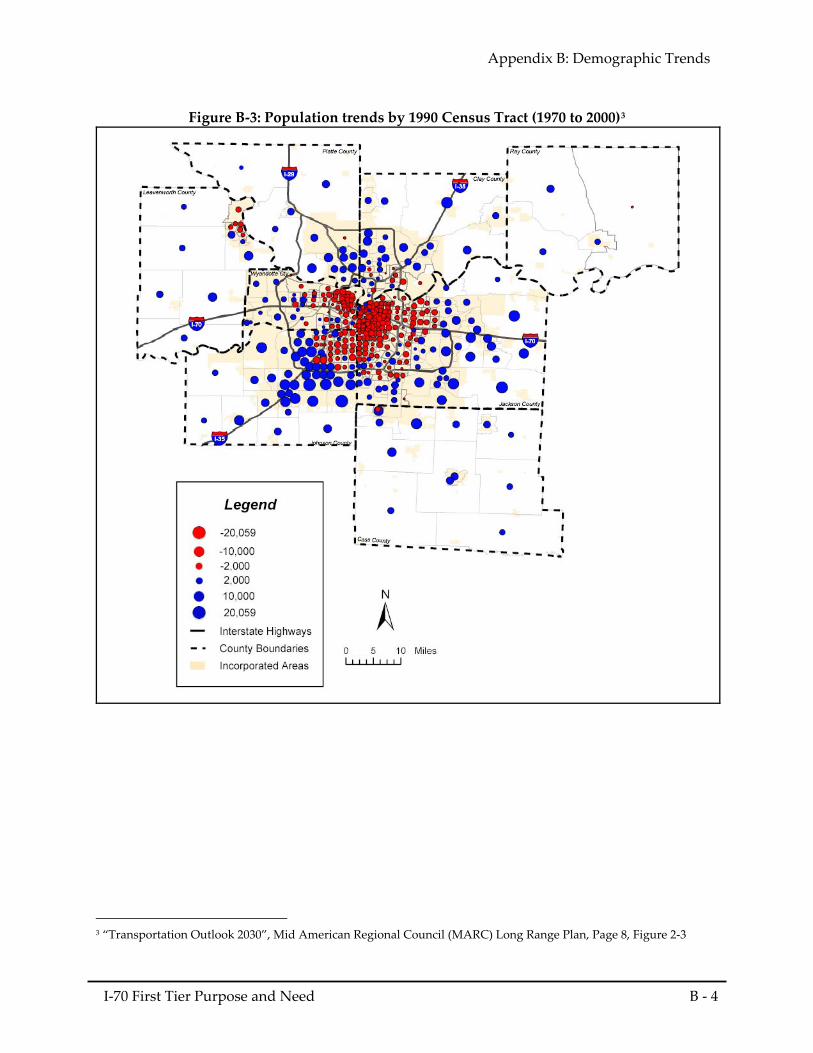
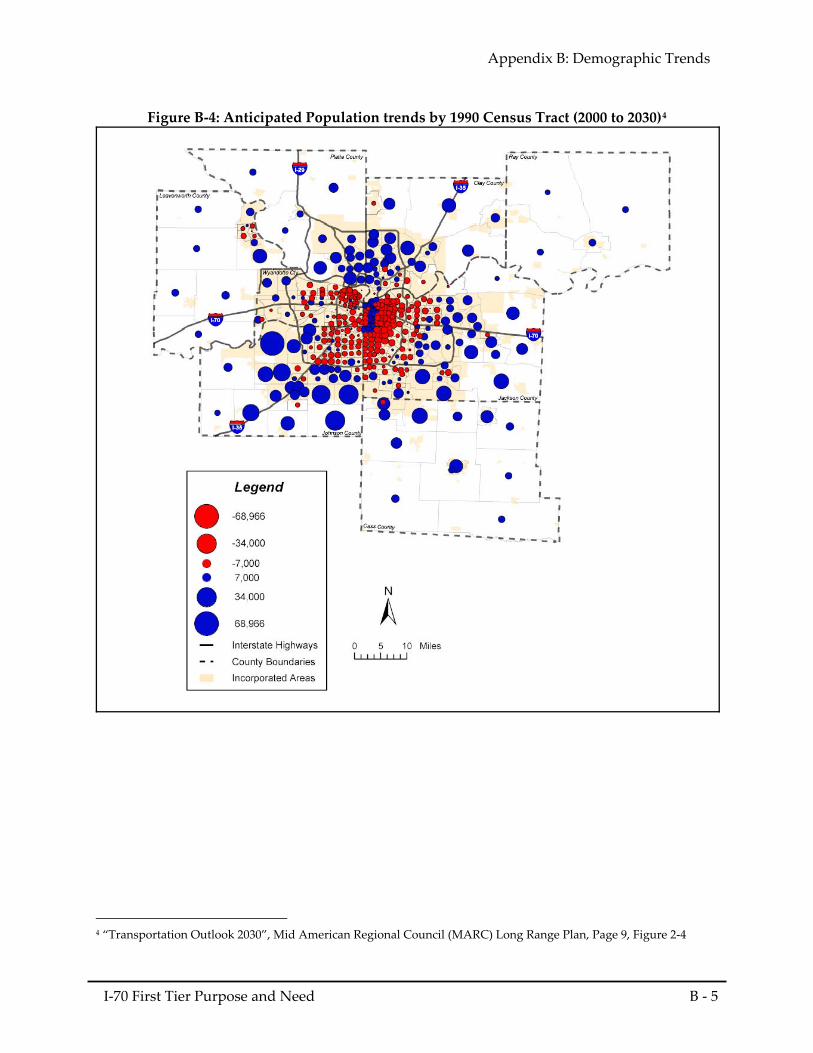
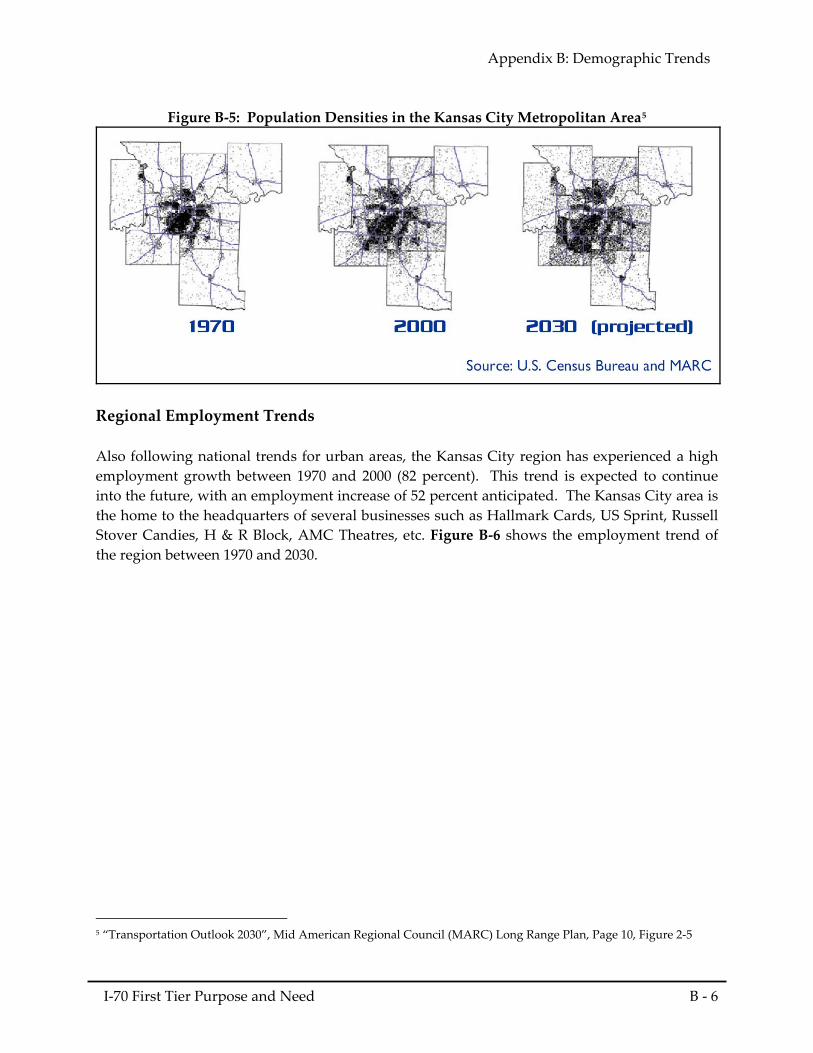
As with most urban areas in the U.S., during the past several decades the Kansas City region’s population has spread out over a larger area as the population has grown. One of the areas where much of this growth has occurred is in Johnson County, Kansas. While some of this geographic spreading has occurred to accommodate population growth, much of it has occurred as a result of smaller household sizes and smaller residential household densities. The population trends are shown in Figures B‐2 through B‐5. The most critical conclusion from this data is that the region is decentralizing; although it is occupying more land, it is also thinning out.
1 “Transportation Outlook 2030”, Mid American Regional Council (MARC) Long Range Plan, Page 6, Figure 2‐1
Appendix B: Demographic Trends
I‐70 First Tier Purpose and Need B ‐ 3
Figure B‐2: Population trends by County (1970 to 2000)2
2 “Transportation Outlook 2030”, Mid American Regional Council (MARC) Long Range Plan, Page 7, Figure 2‐2
Appendix B: Demographic Trends
I‐70 First Tier Purpose and Need B ‐ 4
Figure B‐3: Population trends by 1990 Census Tract (1970 to 2000)3
3 “Transportation Outlook 2030”, Mid American Regional Council (MARC) Long Range Plan, Page 8, Figure 2‐3
Appendix B: Demographic Trends
I‐70 First Tier Purpose and Need B ‐ 5
Figure B‐4: Anticipated Population trends by 1990 Census Tract (2000 to 2030)4
4 “Transportation Outlook 2030”, Mid American Regional Council (MARC) Long Range Plan, Page 9, Figure 2‐4
Appendix B: Demographic Trends
I‐70 First Tier Purpose and Need B ‐ 6
Figure B‐5: Population Densities in the Kansas City Metropolitan Area5
Regional Employment Trends Also following national trends for urban areas, the Kansas City region has experienced a high employment growth between 1970 and 2000 (82 percent). This trend is expected to continue into the future, with an employment increase of 52 percent anticipated. The Kansas City area is the home to the headquarters of several businesses such as Hallmark Cards, US Sprint, Russell Stover Candies, H & R Block, AMC Theatres, etc. Figure B‐6 shows the employment trend of the region between 1970 and 2030.
5 “Transportation Outlook 2030”, Mid American Regional Council (MARC) Long Range Plan, Page 10, Figure 2‐5
Appendix B: Demographic Trends
I‐70 First Tier Purpose and Need B ‐ 7
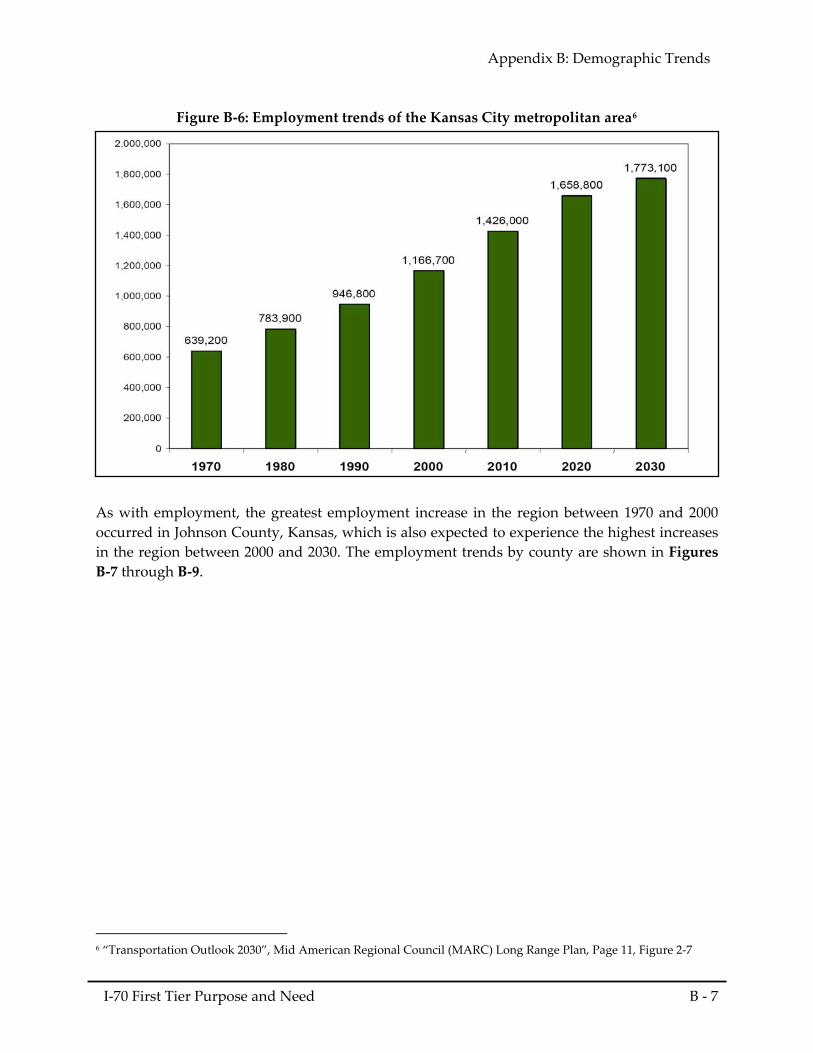
Figure B‐6: Employment trends of the Kansas City metropolitan area6
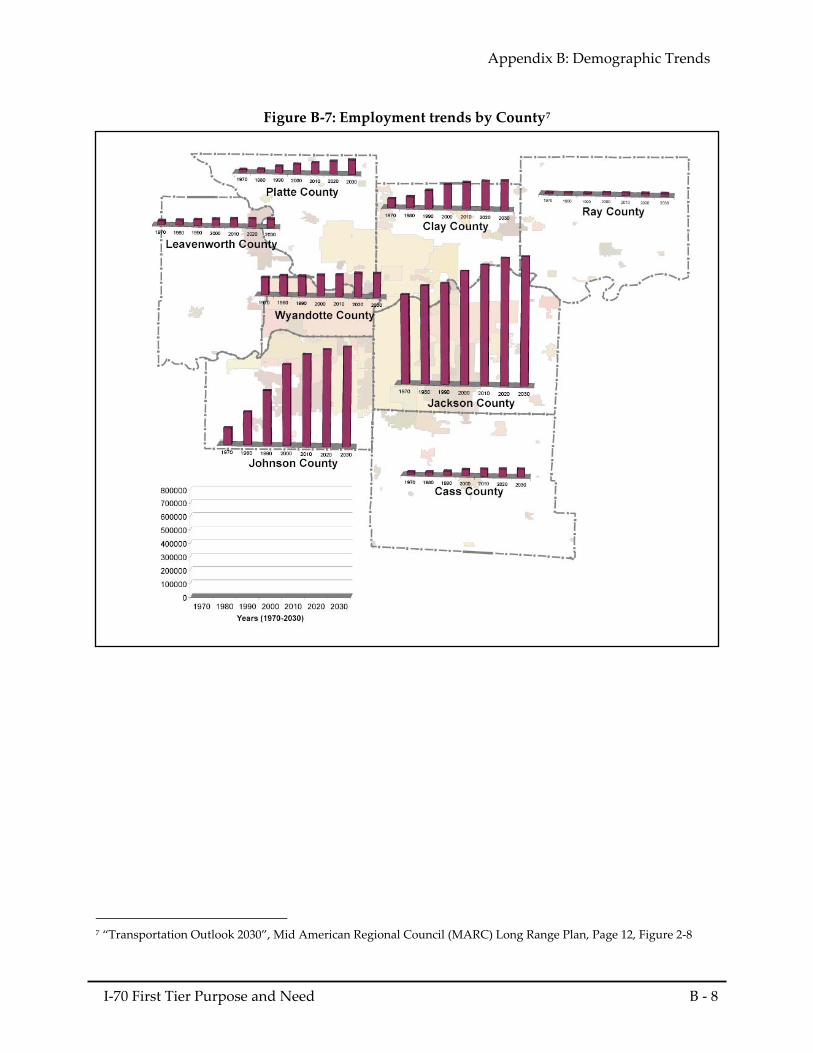
As with employment, the greatest employment increase in the region between 1970 and 2000 occurred in Johnson County, Kansas, which is also expected to experience the highest increases in the region between 2000 and 2030. The employment trends by county are shown in Figures B‐7 through B‐9.
6 “Transportation Outlook 2030”, Mid American Regional Council (MARC) Long Range Plan, Page 11, Figure 2‐7
Appendix B: Demographic Trends
I‐70 First Tier Purpose and Need B ‐ 8
Figure B‐7: Employment trends by County7
7 “Transportation Outlook 2030”, Mid American Regional Council (MARC) Long Range Plan, Page 12, Figure 2‐8
Appendix B: Demographic Trends
I‐70 First Tier Purpose and Need B ‐ 9
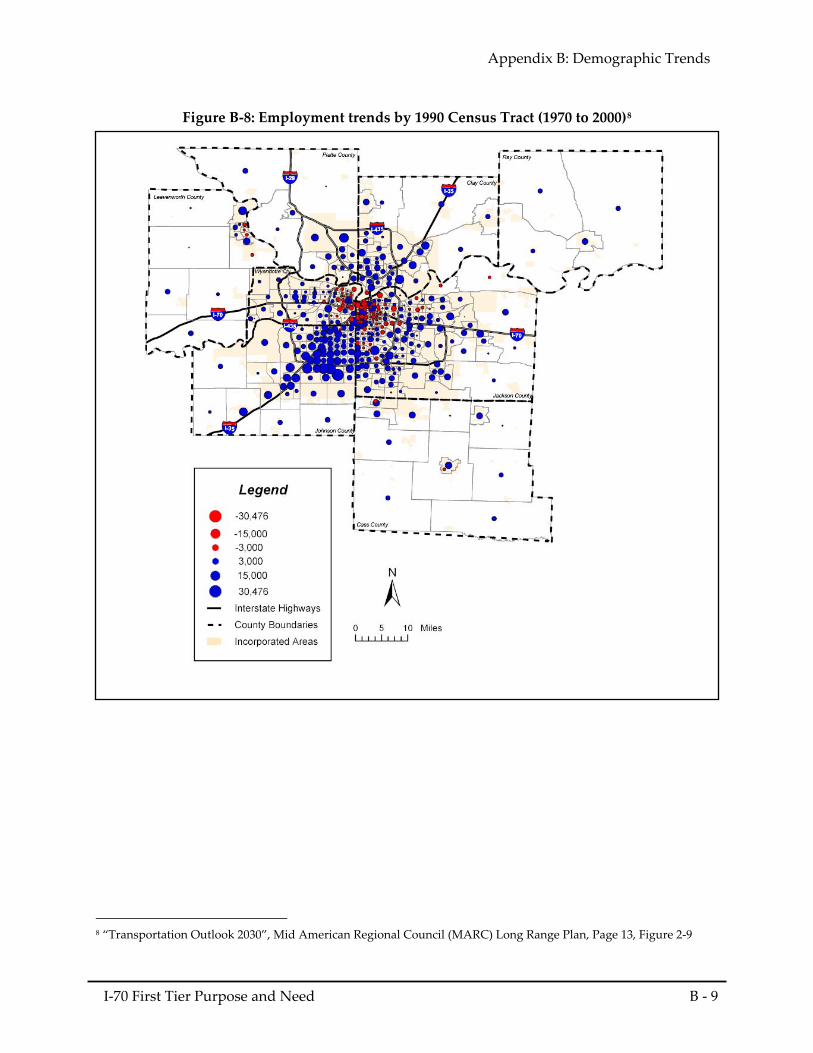
Figure B‐8: Employment trends by 1990 Census Tract (1970 to 2000)8
8 “Transportation Outlook 2030”, Mid American Regional Council (MARC) Long Range Plan, Page 13, Figure 2‐9
Appendix B: Demographic Trends
I‐70 First Tier Purpose and Need B ‐ 10
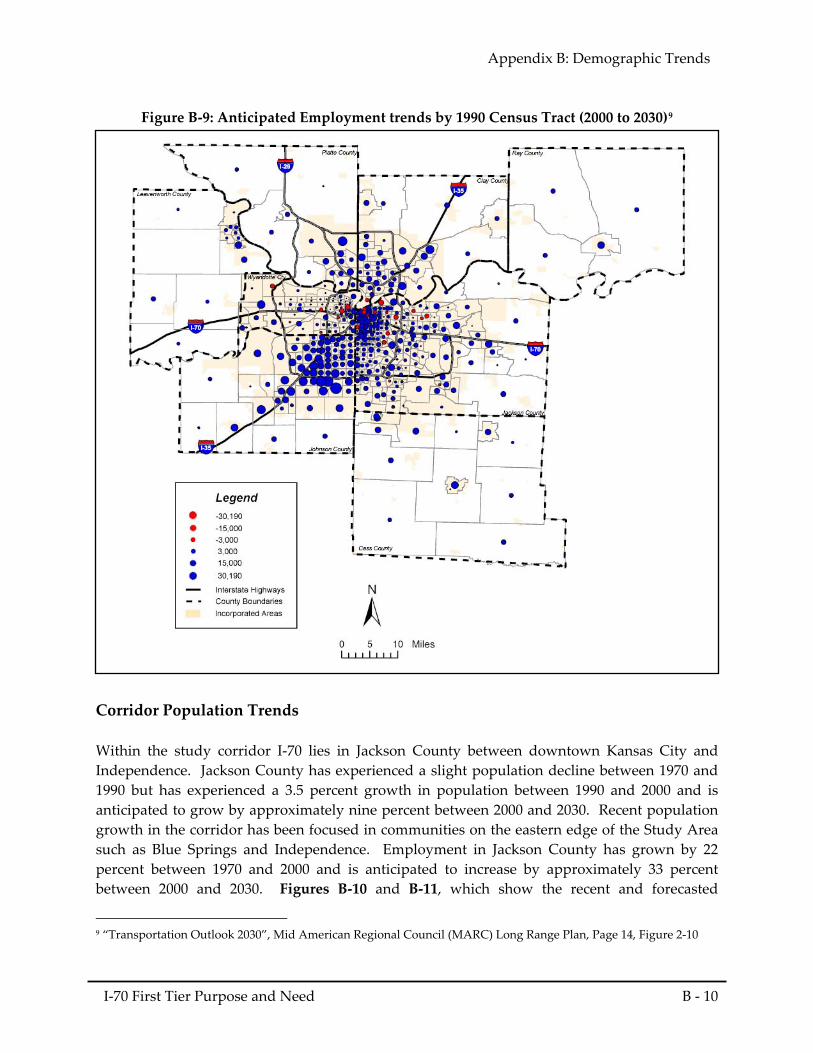
Figure B‐9: Anticipated Employment trends by 1990 Census Tract (2000 to 2030)9
Corridor Population Trends Within the study corridor I‐70 lies in Jackson County between downtown Kansas City and Independence. Jackson County has experienced a slight population decline between 1970 and 1990 but has experienced a 3.5 percent growth in population between 1990 and 2000 and is anticipated to grow by approximately nine percent between 2000 and 2030. Recent population growth in the corridor has been focused in communities on the eastern edge of the Study Area such as Blue Springs and Independence. Employment in Jackson County has grown by 22 percent between 1970 and 2000 and is anticipated to increase by approximately 33 percent between 2000 and 2030. Figures B‐10 and B‐11, which show the recent and forecasted
9 “Transportation Outlook 2030”, Mid American Regional Council (MARC) Long Range Plan, Page 14, Figure 2‐10
Appendix B: Demographic Trends
I‐70 First Tier Purpose and Need B ‐ 11
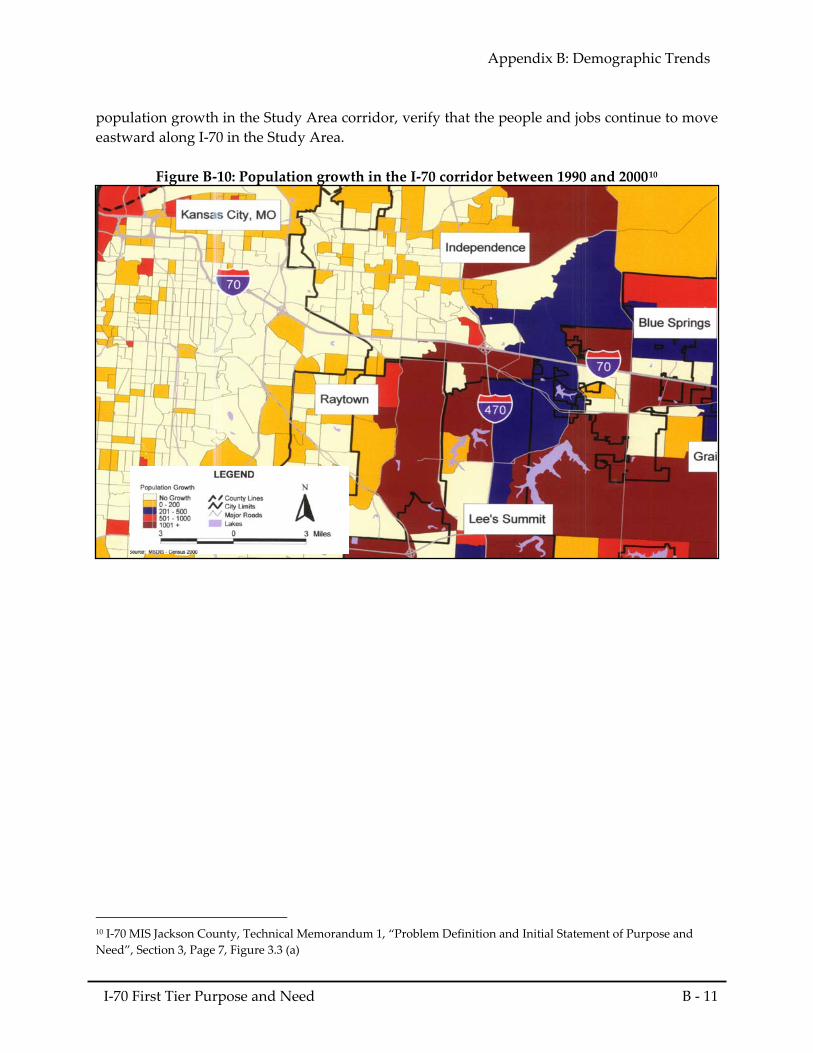
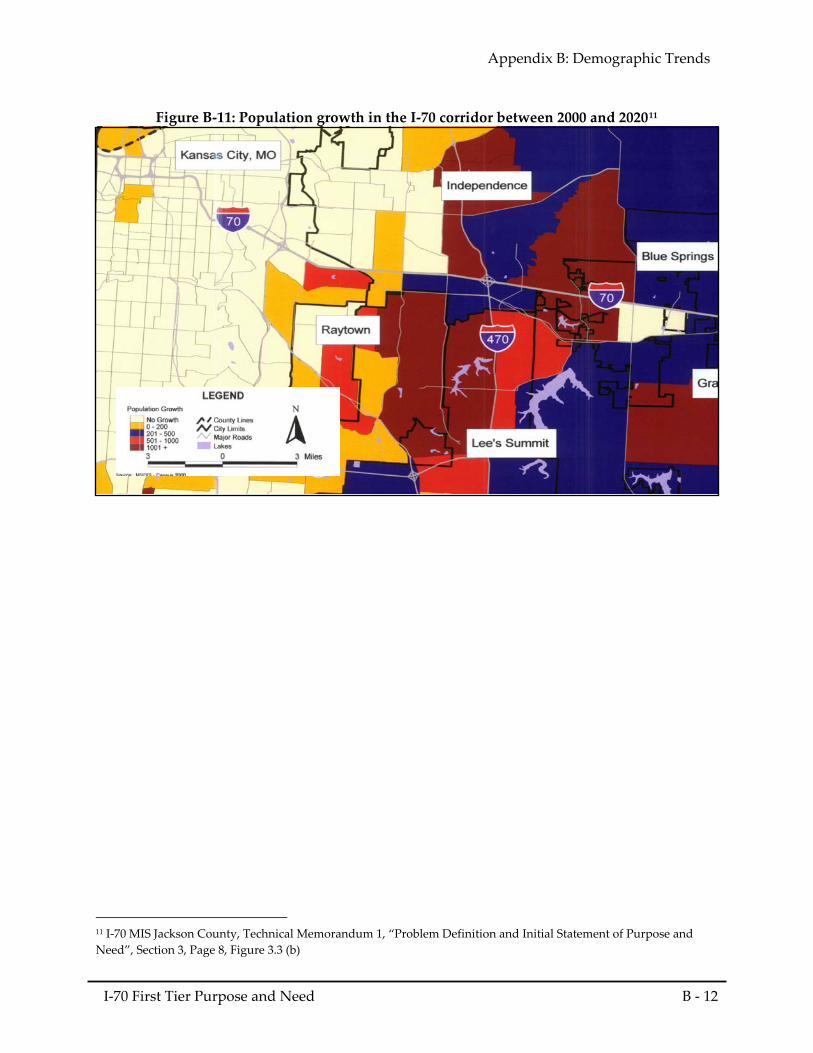
population growth in the Study Area corridor, verify that the people and jobs continue to move eastward along I‐70 in the Study Area.
Figure B‐10: Population growth in the I‐70 corridor between 1990 and 200010
10 I‐70 MIS Jackson County, Technical Memorandum 1, “Problem Definition and Initial Statement of Purpose and Need”, Section 3, Page 7, Figure 3.3 (a)
Appendix B: Demographic Trends
I‐70 First Tier Purpose and Need B ‐ 12
Figure B‐11: Population growth in the I‐70 corridor between 2000 and 202011
11 I‐70 MIS Jackson County, Technical Memorandum 1, “Problem Definition and Initial Statement of Purpose and Need”, Section 3, Page 8, Figure 3.3 (b)

APPENDIX C
Trip Generators and Attractions
Appendix C: Trip Generators and Attractions
I‐70 First Tier Purpose and Need C‐1
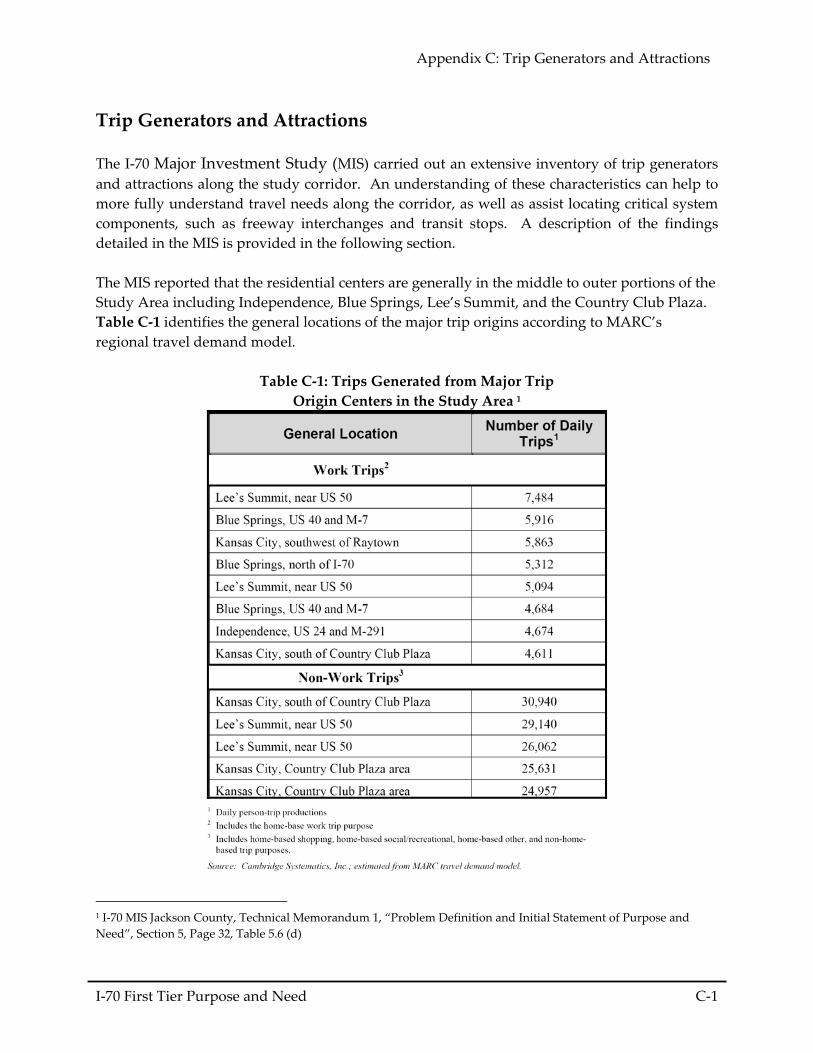
Trip Generators and Attractions The I‐70 Major Investment Study (MIS) carried out an extensive inventory of trip generators and attractions along the study corridor. An understanding of these characteristics can help to more fully understand travel needs along the corridor, as well as assist locating critical system components, such as freeway interchanges and transit stops. A description of the findings detailed in the MIS is provided in the following section. The MIS reported that the residential centers are generally in the middle to outer portions of the Study Area including Independence, Blue Springs, Lee’s Summit, and the Country Club Plaza. Table C‐1 identifies the general locations of the major trip origins according to MARC’s regional travel demand model.
Table C‐1: Trips Generated from Major Trip Origin Centers in the Study Area 1
1 I‐70 MIS Jackson County, Technical Memorandum 1, “Problem Definition and Initial Statement of Purpose and Need”, Section 5, Page 32, Table 5.6 (d)
Appendix C: Trip Generators and Attractions
I‐70 First Tier Purpose and Need C‐2
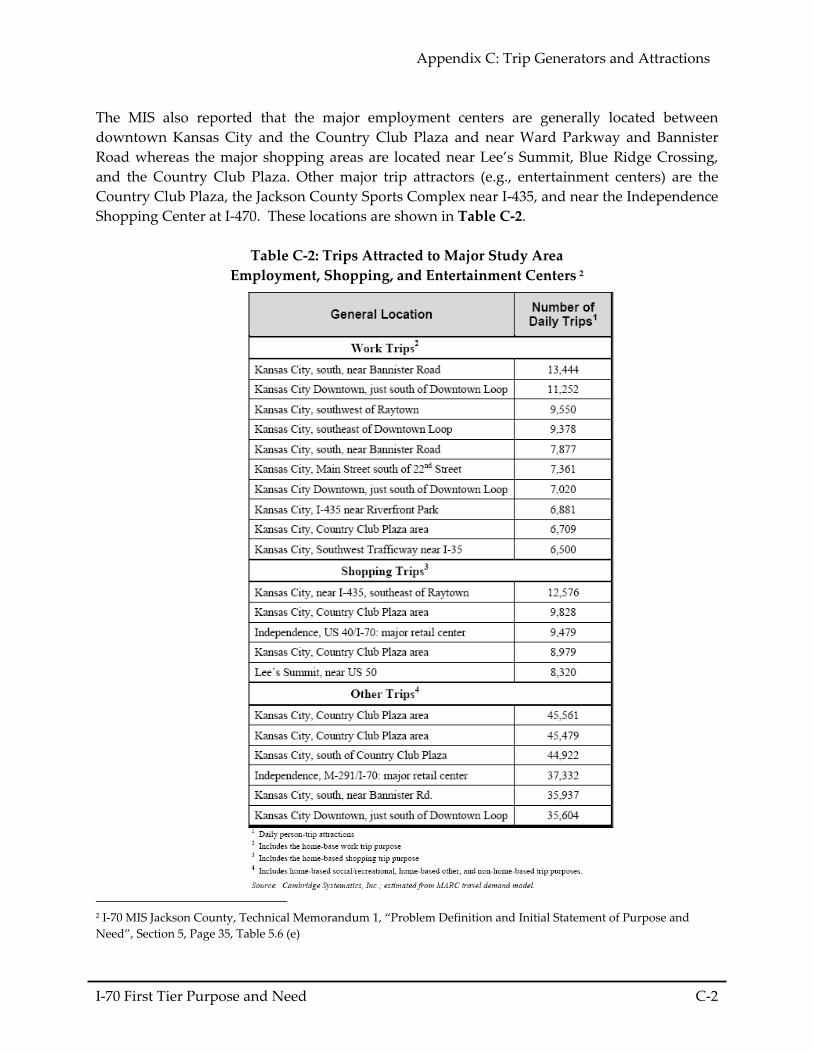
The MIS also reported that the major employment centers are generally located between downtown Kansas City and the Country Club Plaza and near Ward Parkway and Bannister Road whereas the major shopping areas are located near Lee’s Summit, Blue Ridge Crossing, and the Country Club Plaza. Other major trip attractors (e.g., entertainment centers) are the Country Club Plaza, the Jackson County Sports Complex near I‐435, and near the Independence Shopping Center at I‐470. These locations are shown in Table C‐2.
Table C‐2: Trips Attracted to Major Study Area Employment, Shopping, and Entertainment Centers 2
2 I‐70 MIS Jackson County, Technical Memorandum 1, “Problem Definition and Initial Statement of Purpose and Need”, Section 5, Page 35, Table 5.6 (e)
Appendix C: Trip Generators and Attractions
I‐70 First Tier Purpose and Need C‐3
It should be noted that the data provided above and in the MIS was based on 2000 census data, as is MARC’s current validated existing conditions regional travel demand model. However, the study corridor has obviously changed since the 2000 census. The I‐470 and I‐70 interchange has experienced an increase in regional retail opportunities with the Eastland Business Park and the Bass Pro Shop. The Blue Ridge Mall redevelopment has Blue Ridge Crossing which includes Walmart Super Center, Lowe’s, and additional pad site retail. The Bannister Mall has since closed. The Sprint Center has also opened since 2000. Furthermore, it needs to be mentioned that the Jackson County Sports Complex is in the Study Area (in the southeast quadrant of the I‐70/I‐435 interchange) and is a major trip attractor during special events. The Sports Complex includes Arrowhead Stadium (Kansas City Chiefs) and Kauffman Stadium (Kansas City Royals). The roadways that serve these stadiums must take the stadiums into account while improvement strategies are being developed.
APPENDIX D
Traffic Data and Level of Service Analysis
Appendix D: Traffic Data and Level of Service Analysis
I‐70 First Tier Purpose and Need D‐1
I‐70 Traffic Data and Level of Service Analysis Traffic volumes are the manifestation of a corridor’s demographic and transportation system characteristics. As such, this data is a critical component in understanding how a transportation system reacts to the travel demands placed onto it. Moreover, traffic volumes are one of the most critical factors in determining a system’s operations, that is how safely and efficiently they function. Therefore, a comprehensive collection of traffic volume data is vital to the description of corridor operations and the development and evaluation of corridor strategies. Fortunately for this study, a wealth of traffic volume data is available along I‐70 as is discussed below. Traffic Volume Data Sources • MoDOT Counts (2005)
2005 AM (6‐8 a.m.) and PM (4‐6 p.m.) peak period ramp volumes for interchanges of I‐70 with Manchester Trafficway, Blue‐Ridge Cut‐Off, and Noland Road
2005 hourly and daily volumes from January to June for several I‐70 corridor locations • MoDOT Historical Counts
1973‐2002 Average Annual Daily Traffic (AADT) on I‐70 East of Paseo, west of Van Brunt, west of Manchester and east of U.S. 40, east of I‐435, west of Noland Road, east of Selsa Road, west of MO‐7,
and east of MO‐7 (data for some years were not available for some locations) Maximum hourly volumes for 1997‐2003 for I‐70 west of Noland Road Daily volumes for 2003 for I‐70 west of Noland Road
• Crawford, Bunte, Brammeier (CBB) Counts (2005)
AM (6‐10 a.m.) and PM (3‐7 p.m.) peak period ramp volumes at the interchanges of I‐70 with I‐435 and I‐470
• Major Investment Study Data (2000)
2000 I‐70 mainline and ramp daily and AM/PM peak hour volumes Truck percentage on mainline I‐70 for daily and AM/PM peak periods
Historical AADT Growth MoDOT District 4 provided historic automatic machine counts (AADT) for several locations along I‐70 in the Study Area for the years 1973 to 2002. Volumes that were unavailable at some locations for certain years were estimated through interpolation. These historic volumes are
Appendix D: Traffic Data and Level of Service Analysis
I‐70 First Tier Purpose and Need D‐2
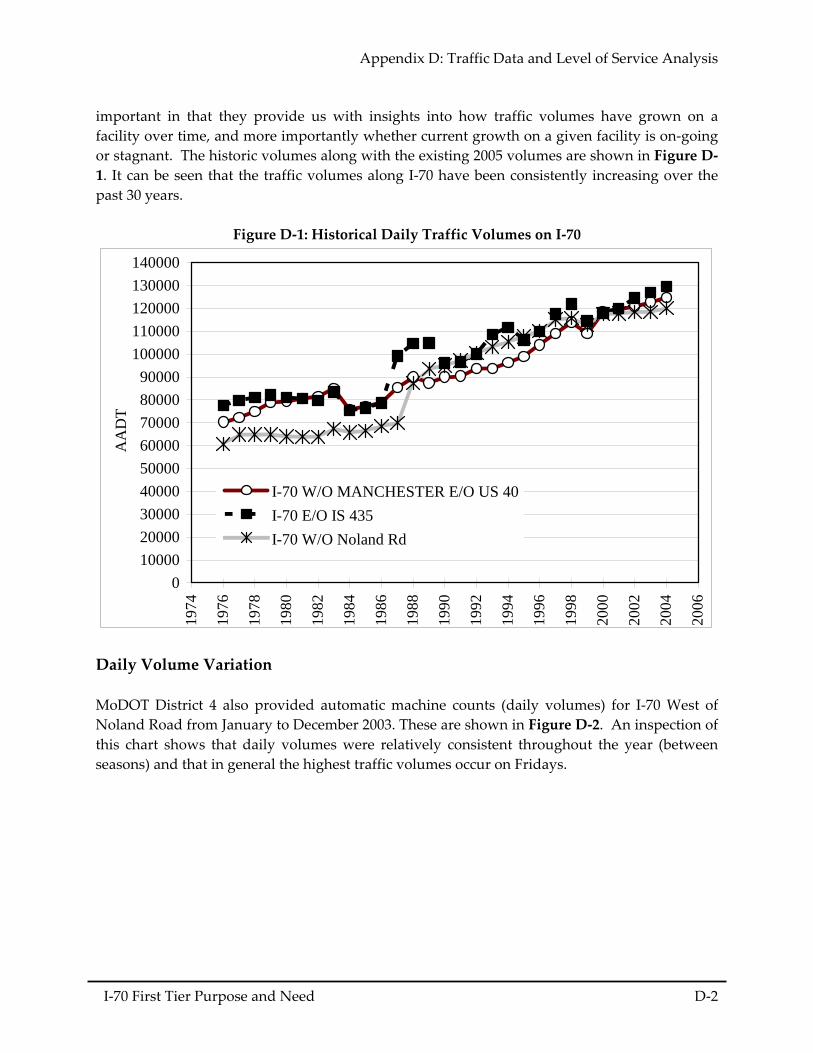
important in that they provide us with insights into how traffic volumes have grown on a facility over time, and more importantly whether current growth on a given facility is on‐going or stagnant. The historic volumes along with the existing 2005 volumes are shown in Figure D‐1. It can be seen that the traffic volumes along I‐70 have been consistently increasing over the past 30 years.
Figure D‐1: Historical Daily Traffic Volumes on I‐70
0100002000030000400005000060000700008000090000
100000110000120000130000140000
1974
1976
1978
1980
1982
1984
1986
1988
1990
1992
1994
1996
1998
2000
2002
2004
2006
AA
DT
I-70 W/O MANCHESTER E/O US 40I-70 E/O IS 435I-70 W/O Noland Rd
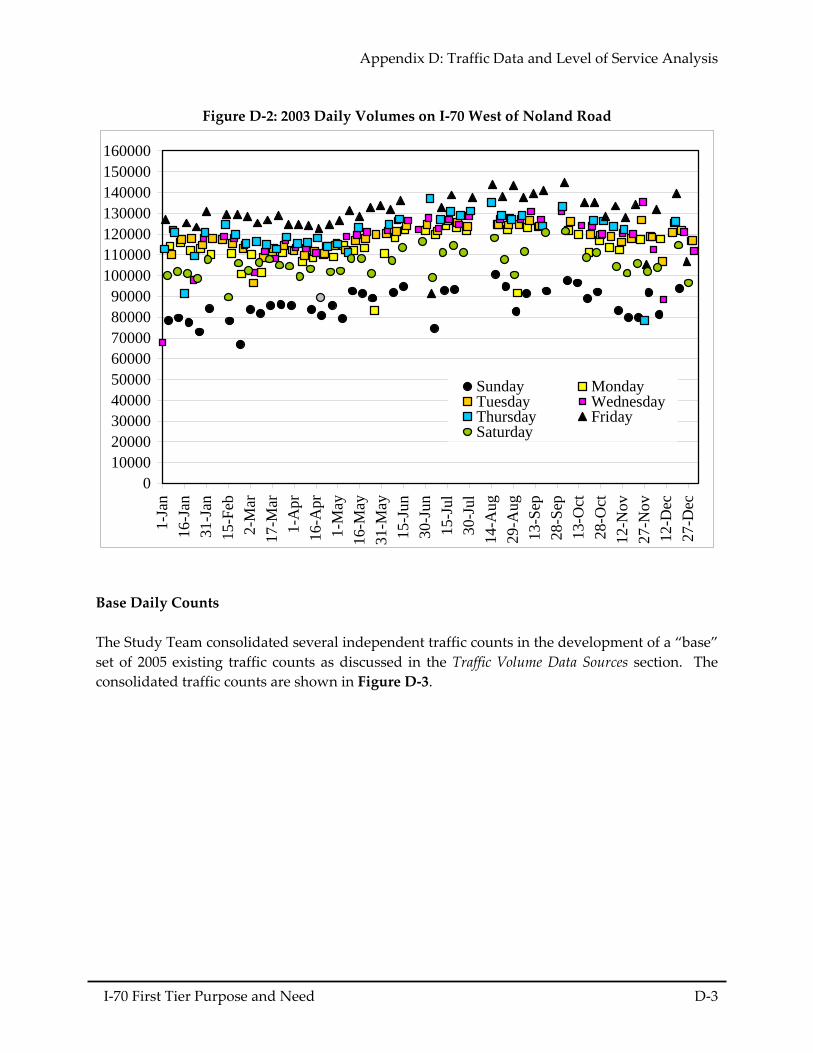
Daily Volume Variation MoDOT District 4 also provided automatic machine counts (daily volumes) for I‐70 West of Noland Road from January to December 2003. These are shown in Figure D‐2. An inspection of this chart shows that daily volumes were relatively consistent throughout the year (between seasons) and that in general the highest traffic volumes occur on Fridays.
Appendix D: Traffic Data and Level of Service Analysis
I‐70 First Tier Purpose and Need D‐3
Figure D‐2: 2003 Daily Volumes on I‐70 West of Noland Road
0100002000030000400005000060000700008000090000
100000110000120000130000140000150000160000
1-Ja
n16
-Jan
31-J
an15
-Feb
2-M
ar17
-Mar
1-A
pr16
-Apr
1-M
ay16
-May
31-M
ay15
-Jun
30-J
un15
-Jul
30-J
ul14
-Aug
29-A
ug13
-Sep
28-S
ep13
-Oct
28-O
ct12
-Nov
27-N
ov12
-Dec
27-D
ec
Sunday MondayTuesday WednesdayThursday FridaySaturday
Base Daily Counts
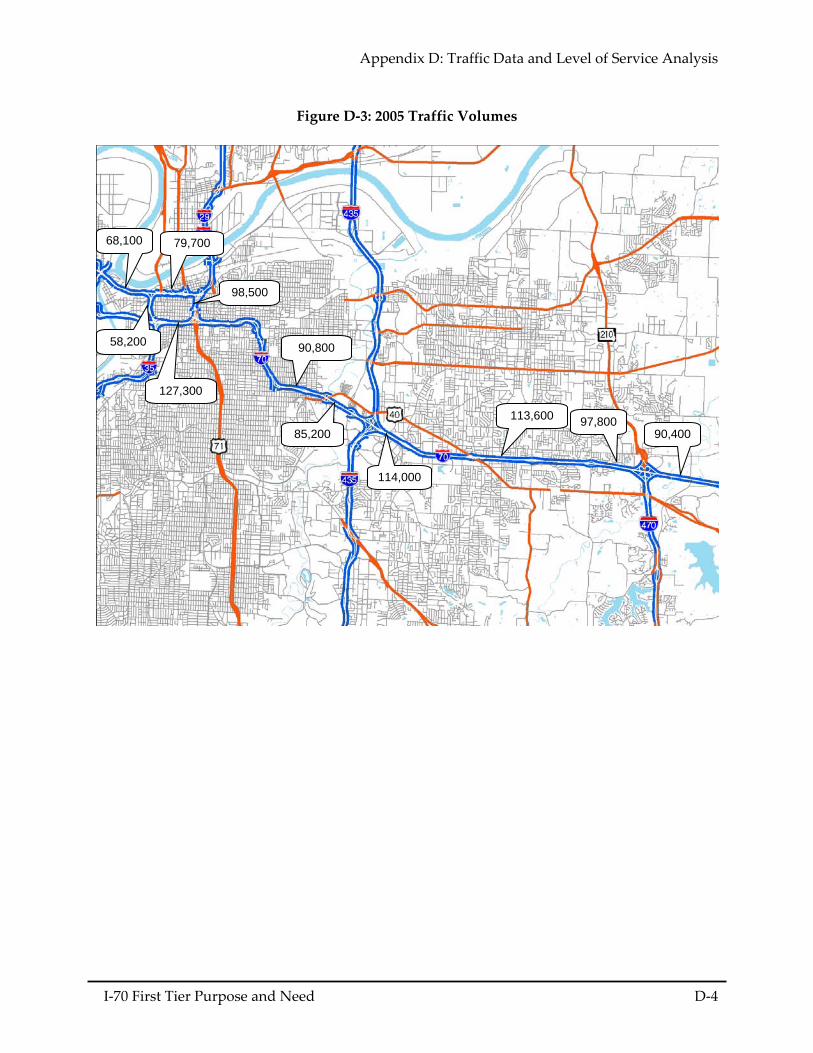
The Study Team consolidated several independent traffic counts in the development of a “base” set of 2005 existing traffic counts as discussed in the Traffic Volume Data Sources section. The consolidated traffic counts are shown in Figure D‐3.
Appendix D: Traffic Data and Level of Service Analysis
I‐70 First Tier Purpose and Need D‐4
Figure D‐3: 2005 Traffic Volumes
68,05 79,66
98,51
90,81
85,17
114,04
113,5790,400
97,828
127,3
58,16
68,100 79,700
98,500
90,800
85,200
114,000
113,600 90,400
97,800
127,300
58,200
Appendix D: Traffic Data and Level of Service Analysis
I‐70 First Tier Purpose and Need D‐5
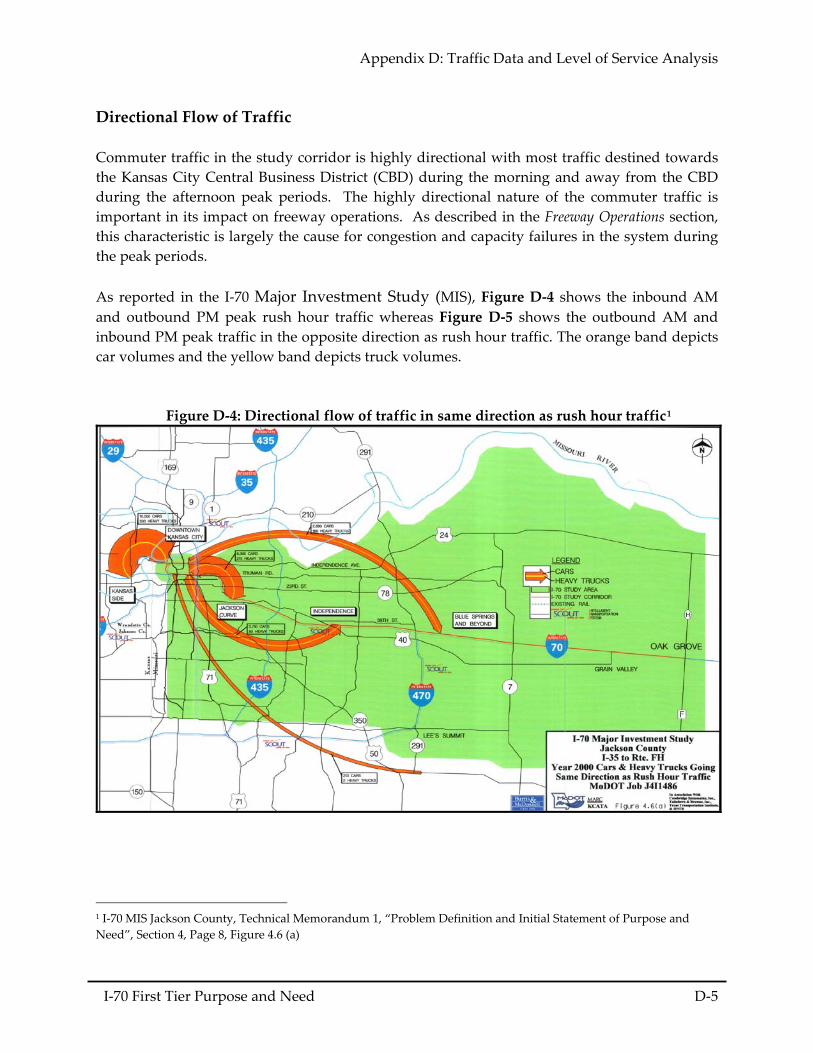
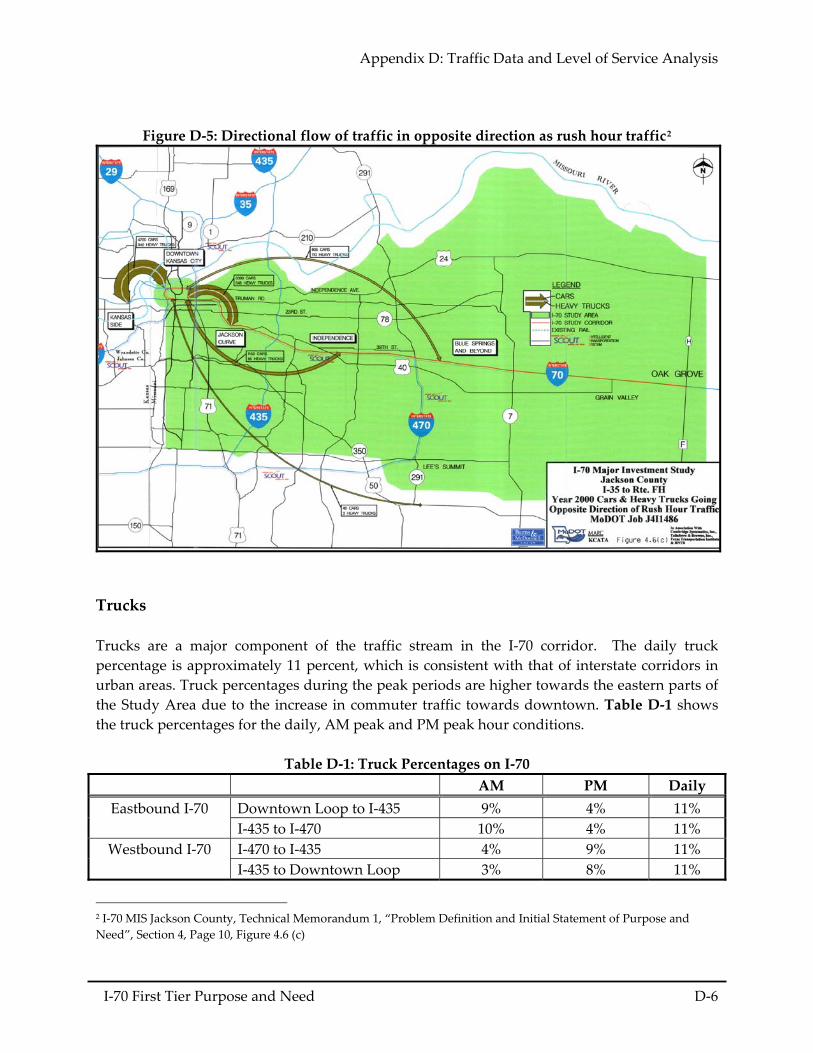
Directional Flow of Traffic Commuter traffic in the study corridor is highly directional with most traffic destined towards the Kansas City Central Business District (CBD) during the morning and away from the CBD during the afternoon peak periods. The highly directional nature of the commuter traffic is important in its impact on freeway operations. As described in the Freeway Operations section, this characteristic is largely the cause for congestion and capacity failures in the system during the peak periods. As reported in the I‐70 Major Investment Study (MIS), Figure D‐4 shows the inbound AM and outbound PM peak rush hour traffic whereas Figure D‐5 shows the outbound AM and inbound PM peak traffic in the opposite direction as rush hour traffic. The orange band depicts car volumes and the yellow band depicts truck volumes.
Figure D‐4: Directional flow of traffic in same direction as rush hour traffic1
1 I‐70 MIS Jackson County, Technical Memorandum 1, “Problem Definition and Initial Statement of Purpose and Need”, Section 4, Page 8, Figure 4.6 (a)
Appendix D: Traffic Data and Level of Service Analysis
I‐70 First Tier Purpose and Need D‐6
Figure D‐5: Directional flow of traffic in opposite direction as rush hour traffic2
Trucks Trucks are a major component of the traffic stream in the I‐70 corridor. The daily truck percentage is approximately 11 percent, which is consistent with that of interstate corridors in urban areas. Truck percentages during the peak periods are higher towards the eastern parts of the Study Area due to the increase in commuter traffic towards downtown. Table D‐1 shows the truck percentages for the daily, AM peak and PM peak hour conditions.
Table D‐1: Truck Percentages on I‐70
AM PM Daily Downtown Loop to I‐435 9% 4% 11% Eastbound I‐70 I‐435 to I‐470 10% 4% 11% I‐470 to I‐435 4% 9% 11% Westbound I‐70 I‐435 to Downtown Loop 3% 8% 11%
2 I‐70 MIS Jackson County, Technical Memorandum 1, “Problem Definition and Initial Statement of Purpose and Need”, Section 4, Page 10, Figure 4.6 (c)
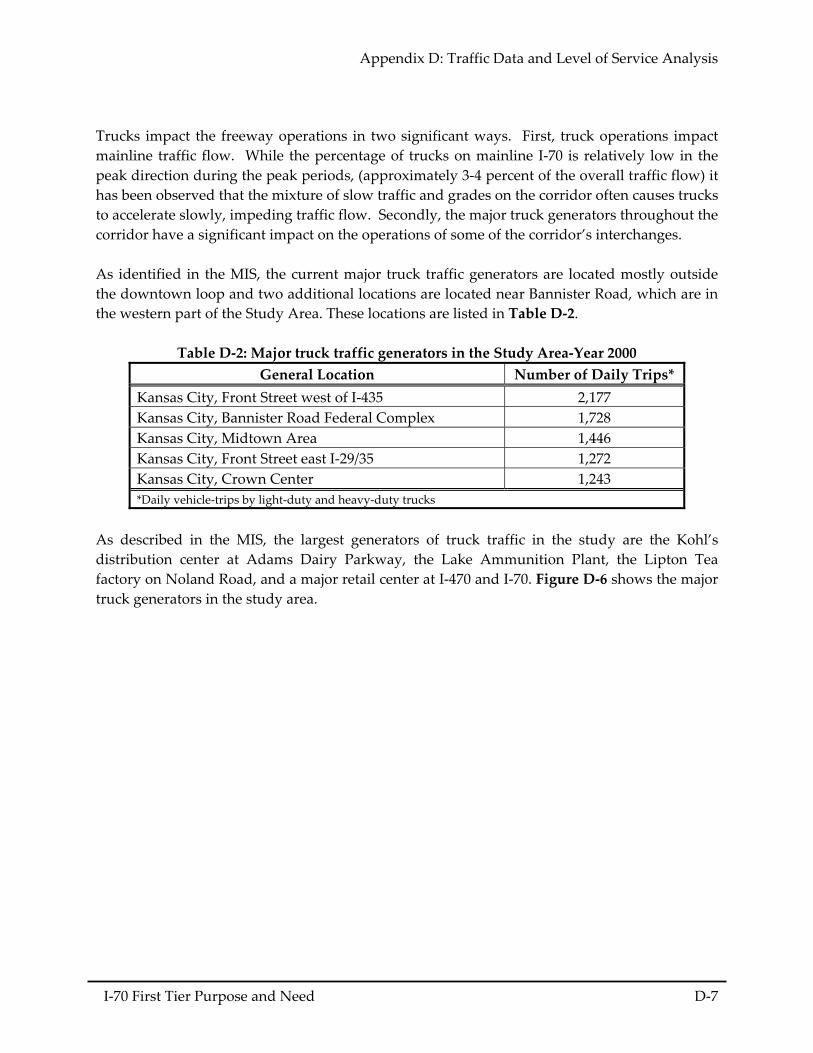
Appendix D: Traffic Data and Level of Service Analysis
I‐70 First Tier Purpose and Need D‐7
Trucks impact the freeway operations in two significant ways. First, truck operations impact mainline traffic flow. While the percentage of trucks on mainline I‐70 is relatively low in the peak direction during the peak periods, (approximately 3‐4 percent of the overall traffic flow) it has been observed that the mixture of slow traffic and grades on the corridor often causes trucks to accelerate slowly, impeding traffic flow. Secondly, the major truck generators throughout the corridor have a significant impact on the operations of some of the corridor’s interchanges. As identified in the MIS, the current major truck traffic generators are located mostly outside the downtown loop and two additional locations are located near Bannister Road, which are in the western part of the Study Area. These locations are listed in Table D‐2.
Table D‐2: Major truck traffic generators in the Study Area‐Year 2000
General Location Number of Daily Trips* Kansas City, Front Street west of I‐435 2,177 Kansas City, Bannister Road Federal Complex 1,728 Kansas City, Midtown Area 1,446 Kansas City, Front Street east I‐29/35 1,272 Kansas City, Crown Center 1,243 *Daily vehicle‐trips by light‐duty and heavy‐duty trucks
As described in the MIS, the largest generators of truck traffic in the study are the Kohl’s distribution center at Adams Dairy Parkway, the Lake Ammunition Plant, the Lipton Tea factory on Noland Road, and a major retail center at I‐470 and I‐70. Figure D‐6 shows the major truck generators in the study area.
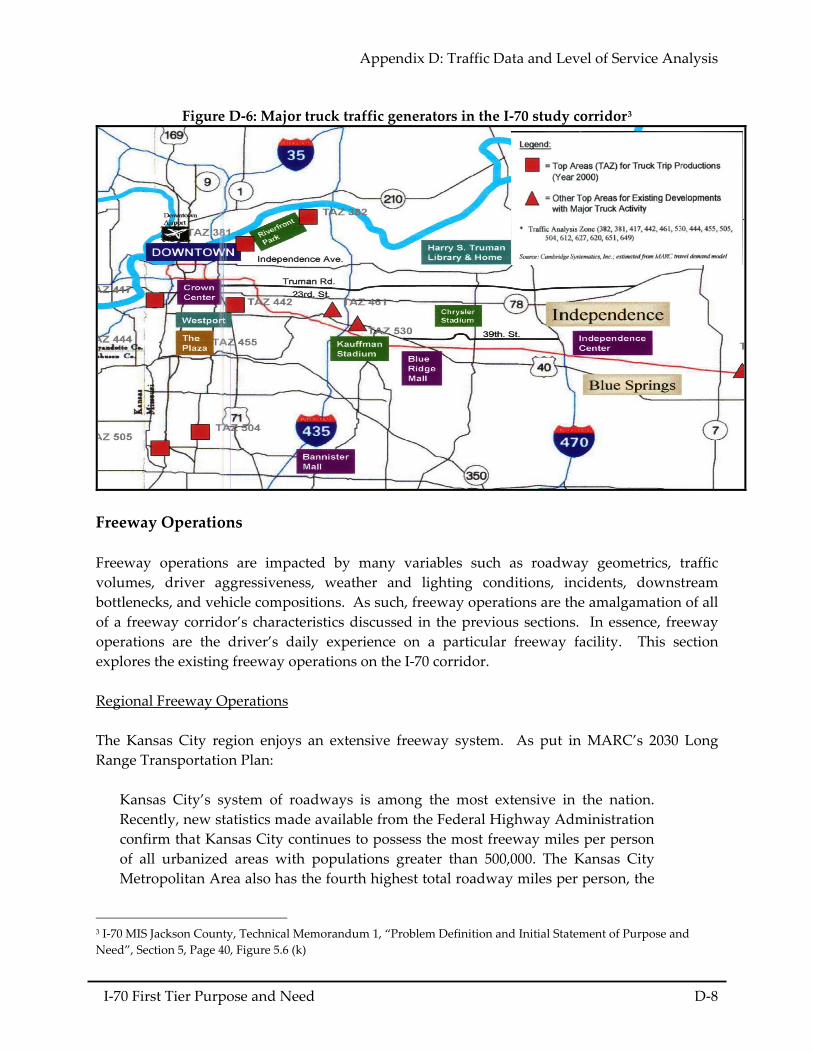
Appendix D: Traffic Data and Level of Service Analysis
I‐70 First Tier Purpose and Need D‐8
Figure D‐6: Major truck traffic generators in the I‐70 study corridor3
Freeway Operations Freeway operations are impacted by many variables such as roadway geometrics, traffic volumes, driver aggressiveness, weather and lighting conditions, incidents, downstream bottlenecks, and vehicle compositions. As such, freeway operations are the amalgamation of all of a freeway corridor’s characteristics discussed in the previous sections. In essence, freeway operations are the driver’s daily experience on a particular freeway facility. This section explores the existing freeway operations on the I‐70 corridor. Regional Freeway Operations The Kansas City region enjoys an extensive freeway system. As put in MARC’s 2030 Long Range Transportation Plan:
Kansas City’s system of roadways is among the most extensive in the nation. Recently, new statistics made available from the Federal Highway Administration confirm that Kansas City continues to possess the most freeway miles per person of all urbanized areas with populations greater than 500,000. The Kansas City Metropolitan Area also has the fourth highest total roadway miles per person, the
3 I‐70 MIS Jackson County, Technical Memorandum 1, “Problem Definition and Initial Statement of Purpose and Need”, Section 5, Page 40, Figure 5.6 (k)
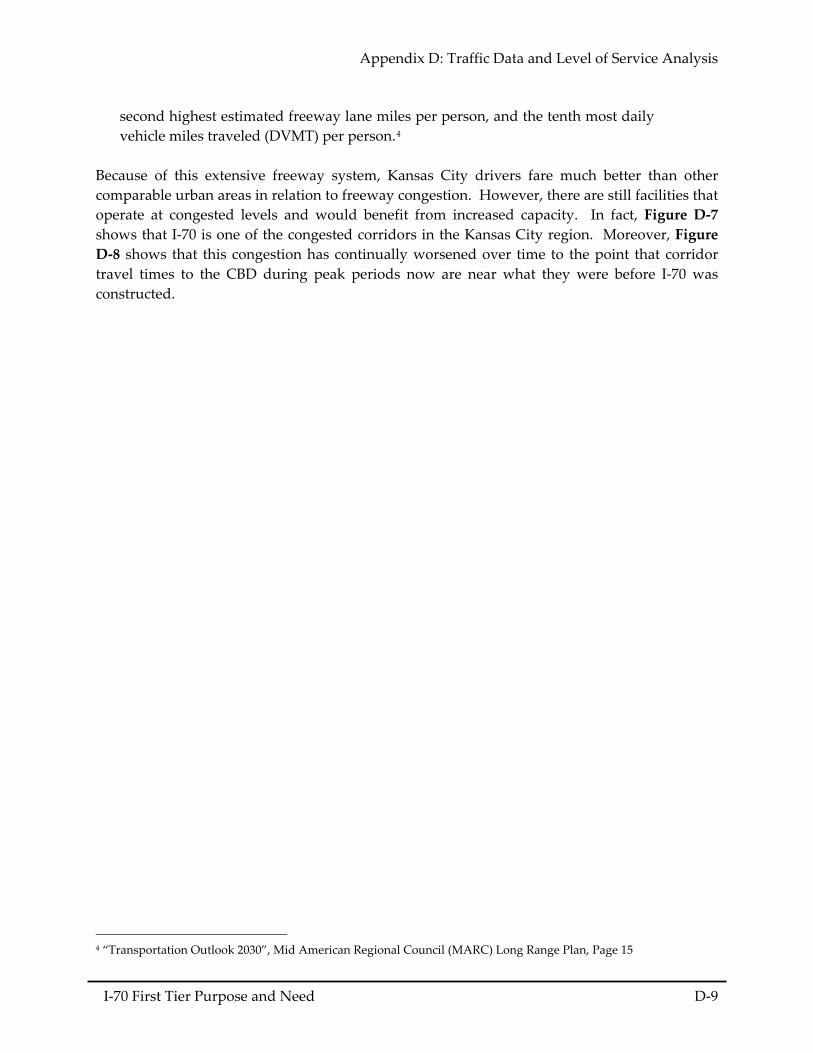
Appendix D: Traffic Data and Level of Service Analysis
I‐70 First Tier Purpose and Need D‐9
second highest estimated freeway lane miles per person, and the tenth most daily vehicle miles traveled (DVMT) per person.4
Because of this extensive freeway system, Kansas City drivers fare much better than other comparable urban areas in relation to freeway congestion. However, there are still facilities that operate at congested levels and would benefit from increased capacity. In fact, Figure D‐7 shows that I‐70 is one of the congested corridors in the Kansas City region. Moreover, Figure D‐8 shows that this congestion has continually worsened over time to the point that corridor travel times to the CBD during peak periods now are near what they were before I‐70 was constructed.
4 “Transportation Outlook 2030”, Mid American Regional Council (MARC) Long Range Plan, Page 15
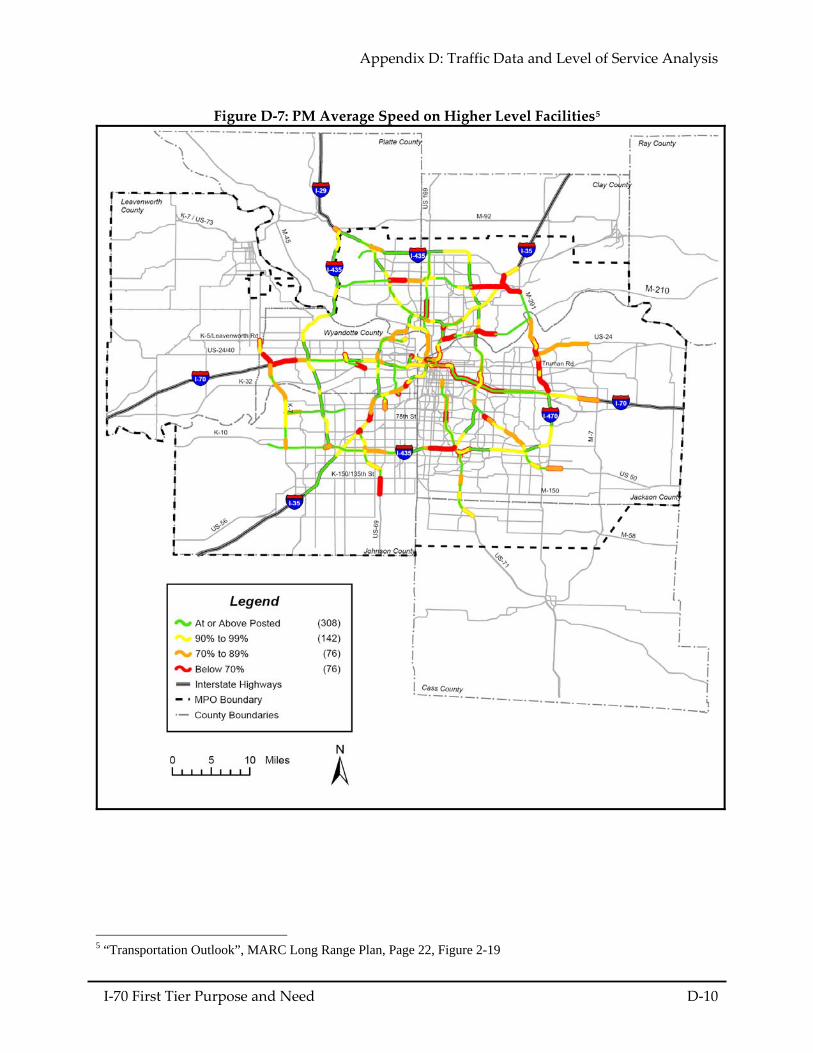
Appendix D: Traffic Data and Level of Service Analysis
I‐70 First Tier Purpose and Need D‐10
Figure D‐7: PM Average Speed on Higher Level Facilities5
5 “Transportation Outlook”, MARC Long Range Plan, Page 22, Figure 2-19
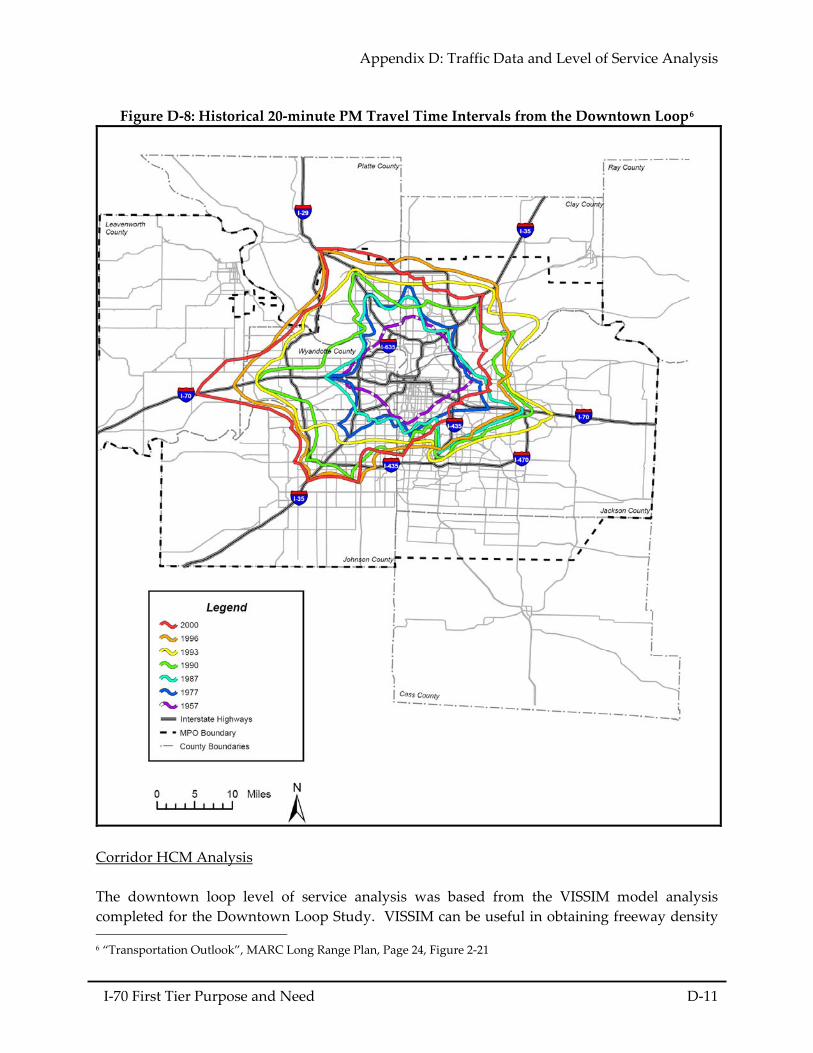
Appendix D: Traffic Data and Level of Service Analysis
I‐70 First Tier Purpose and Need D‐11
Figure D‐8: Historical 20‐minute PM Travel Time Intervals from the Downtown Loop6
Corridor HCM Analysis The downtown loop level of service analysis was based from the VISSIM model analysis completed for the Downtown Loop Study. VISSIM can be useful in obtaining freeway density 6 “Transportation Outlook”, MARC Long Range Plan, Page 24, Figure 2‐21
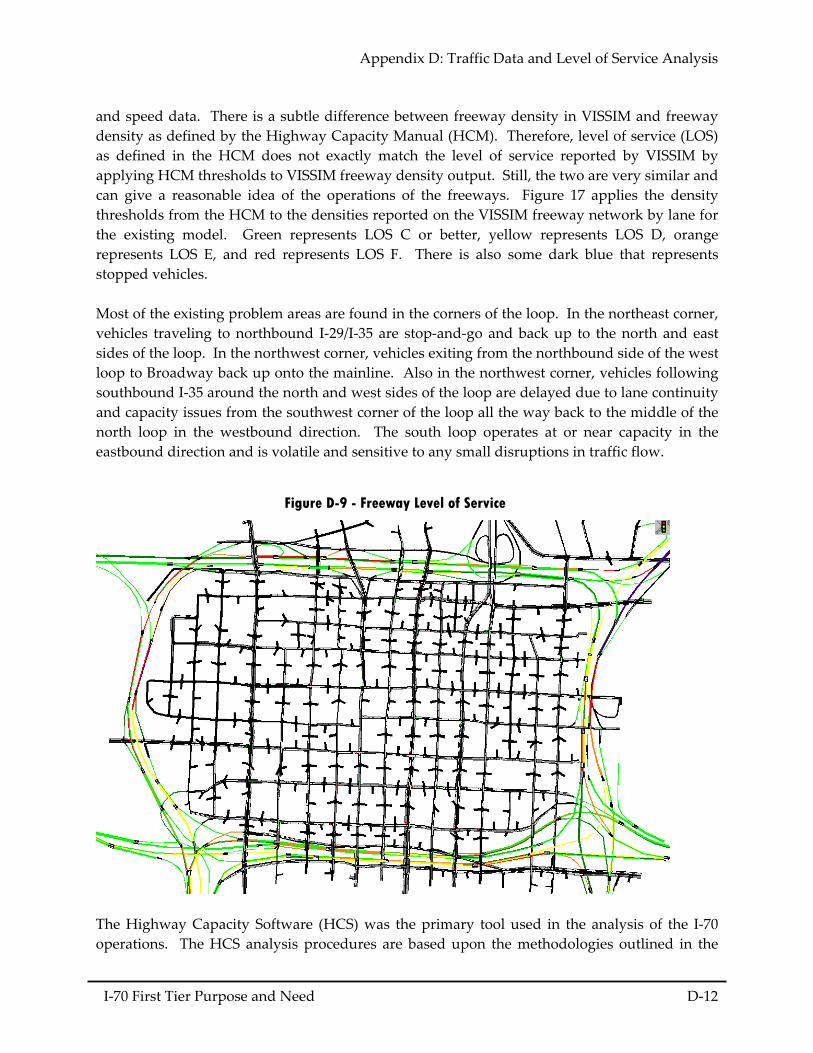
Appendix D: Traffic Data and Level of Service Analysis
I‐70 First Tier Purpose and Need D‐12
and speed data. There is a subtle difference between freeway density in VISSIM and freeway density as defined by the Highway Capacity Manual (HCM). Therefore, level of service (LOS) as defined in the HCM does not exactly match the level of service reported by VISSIM by applying HCM thresholds to VISSIM freeway density output. Still, the two are very similar and can give a reasonable idea of the operations of the freeways. Figure 17 applies the density thresholds from the HCM to the densities reported on the VISSIM freeway network by lane for the existing model. Green represents LOS C or better, yellow represents LOS D, orange represents LOS E, and red represents LOS F. There is also some dark blue that represents stopped vehicles. Most of the existing problem areas are found in the corners of the loop. In the northeast corner, vehicles traveling to northbound I‐29/I‐35 are stop‐and‐go and back up to the north and east sides of the loop. In the northwest corner, vehicles exiting from the northbound side of the west loop to Broadway back up onto the mainline. Also in the northwest corner, vehicles following southbound I‐35 around the north and west sides of the loop are delayed due to lane continuity and capacity issues from the southwest corner of the loop all the way back to the middle of the north loop in the westbound direction. The south loop operates at or near capacity in the astbound direction and is volatile and sensitive to any small disruptions in traffic flow. e
The Highway Capacity Software (HCS) was the primary tool used in the analysis of the I‐70 operations. The HCS analysis procedures are based upon the methodologies outlined in the
Figure D-9 - Freeway Level of Service
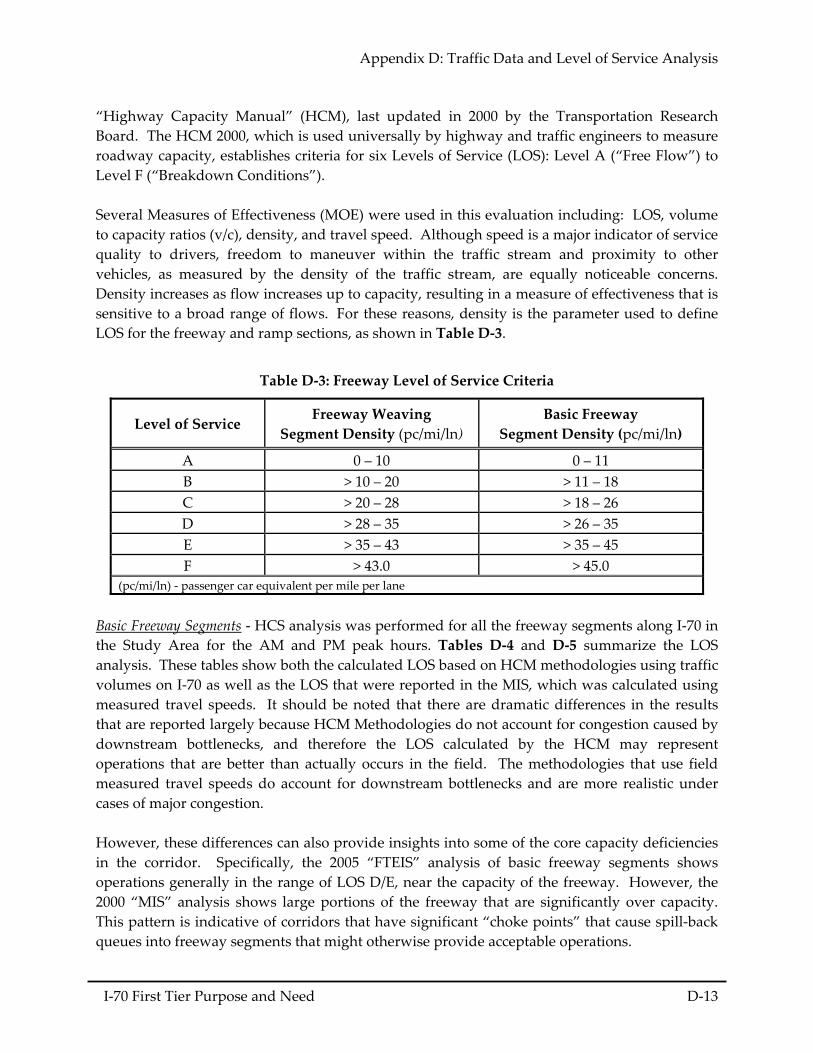
Appendix D: Traffic Data and Level of Service Analysis
I‐70 First Tier Purpose and Need D‐13
“Highway Capacity Manual” (HCM), last updated in 2000 by the Transportation Research Board. The HCM 2000, which is used universally by highway and traffic engineers to measure roadway capacity, establishes criteria for six Levels of Service (LOS): Level A (“Free Flow”) to Level F (“Breakdown Conditions”). Several Measures of Effectiveness (MOE) were used in this evaluation including: LOS, volume to capacity ratios (v/c), density, and travel speed. Although speed is a major indicator of service quality to drivers, freedom to maneuver within the traffic stream and proximity to other vehicles, as measured by the density of the traffic stream, are equally noticeable concerns. Density increases as flow increases up to capacity, resulting in a measure of effectiveness that is sensitive to a broad range of flows. For these reasons, density is the parameter used to define LOS for the freeway and ramp sections, as shown in Table D‐3.
Table D‐3: Freeway Level of Service Criteria
Level of Service Freeway Weaving
Segment Density (pc/mi/ln) Basic Freeway
Segment Density (pc/mi/ln)
A 0 – 10 0 – 11 B > 10 – 20 > 11 – 18 C > 20 – 28 > 18 – 26 D > 28 – 35 > 26 – 35 E > 35 – 43 > 35 – 45 F > 43.0 > 45.0
(pc/mi/ln) ‐ passenger car equivalent per mile per lane
Basic Freeway Segments ‐ HCS analysis was performed for all the freeway segments along I‐70 in the Study Area for the AM and PM peak hours. Tables D‐4 and D‐5 summarize the LOS analysis. These tables show both the calculated LOS based on HCM methodologies using traffic volumes on I‐70 as well as the LOS that were reported in the MIS, which was calculated using measured travel speeds. It should be noted that there are dramatic differences in the results that are reported largely because HCM Methodologies do not account for congestion caused by downstream bottlenecks, and therefore the LOS calculated by the HCM may represent operations that are better than actually occurs in the field. The methodologies that use field measured travel speeds do account for downstream bottlenecks and are more realistic under cases of major congestion. However, these differences can also provide insights into some of the core capacity deficiencies in the corridor. Specifically, the 2005 “FTEIS” analysis of basic freeway segments shows operations generally in the range of LOS D/E, near the capacity of the freeway. However, the 2000 “MIS” analysis shows large portions of the freeway that are significantly over capacity. This pattern is indicative of corridors that have significant “choke points” that cause spill‐back queues into freeway segments that might otherwise provide acceptable operations.
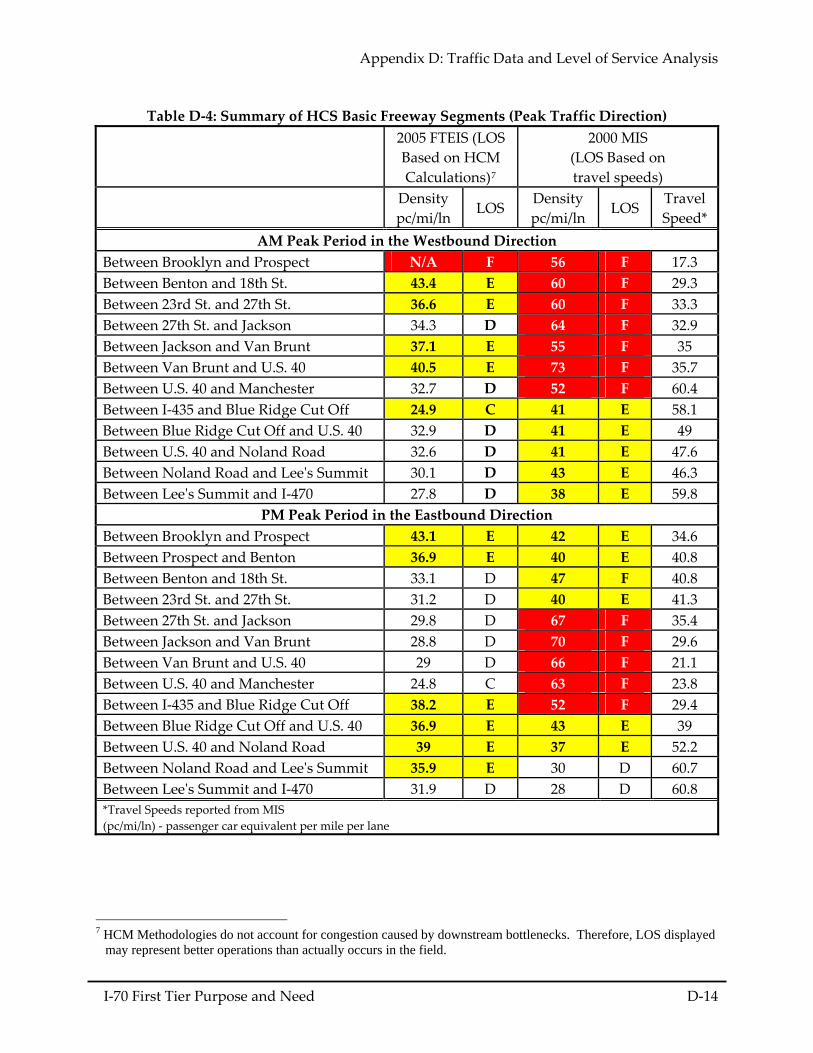
Appendix D: Traffic Data and Level of Service Analysis
I‐70 First Tier Purpose and Need D‐14
Table D‐4: Summary of HCS Basic Freeway Segments (Peak Traffic Direction)
2005 FTEIS (LOS Based on HCM Calculations)7
2000 MIS (LOS Based on travel speeds)
Density pc/mi/ln
LOS Density pc/mi/ln
LOS Travel Speed*
AM Peak Period in the Westbound Direction Between Brooklyn and Prospect N/A F 56 F 17.3 Between Benton and 18th St. 43.4 E 60 F 29.3 Between 23rd St. and 27th St. 36.6 E 60 F 33.3 Between 27th St. and Jackson 34.3 D 64 F 32.9 Between Jackson and Van Brunt 37.1 E 55 F 35 Between Van Brunt and U.S. 40 40.5 E 73 F 35.7 Between U.S. 40 and Manchester 32.7 D 52 F 60.4 Between I‐435 and Blue Ridge Cut Off 24.9 C 41 E 58.1 Between Blue Ridge Cut Off and U.S. 40 32.9 D 41 E 49 Between U.S. 40 and Noland Road 32.6 D 41 E 47.6 Between Noland Road and Leeʹs Summit 30.1 D 43 E 46.3 Between Leeʹs Summit and I‐470 27.8 D 38 E 59.8
PM Peak Period in the Eastbound Direction Between Brooklyn and Prospect 43.1 E 42 E 34.6 Between Prospect and Benton 36.9 E 40 E 40.8 Between Benton and 18th St. 33.1 D 47 F 40.8 Between 23rd St. and 27th St. 31.2 D 40 E 41.3 Between 27th St. and Jackson 29.8 D 67 F 35.4 Between Jackson and Van Brunt 28.8 D 70 F 29.6 Between Van Brunt and U.S. 40 29 D 66 F 21.1 Between U.S. 40 and Manchester 24.8 C 63 F 23.8 Between I‐435 and Blue Ridge Cut Off 38.2 E 52 F 29.4 Between Blue Ridge Cut Off and U.S. 40 36.9 E 43 E 39 Between U.S. 40 and Noland Road 39 E 37 E 52.2 Between Noland Road and Leeʹs Summit 35.9 E 30 D 60.7 Between Leeʹs Summit and I‐470 31.9 D 28 D 60.8 *Travel Speeds reported from MIS (pc/mi/ln) ‐ passenger car equivalent per mile per lane
7 HCM Methodologies do not account for congestion caused by downstream bottlenecks. Therefore, LOS displayed
may represent better operations than actually occurs in the field.
Appendix D: Traffic Data and Level of Service Analysis
I‐70 First Tier Purpose and Need D‐15
Table D‐5: Summary of HCS Basic Freeway Segments (off‐Peak Traffic Direction)
2005 FTEIS
(LOS Based on HCM Calculations)
2000 MIS
Density pc/mi/ln
LOS Density pc/mi/ln
LOS
AM Peak Period in the Eastbound Direction Between Brooklyn and Prospect 17.9 B 18 B Between Benton and 18th St. 14.7 B 17 B Between 23rd St. and 27th St. 15.3 B 16 B Between 27th St. and Jackson 14.6 B 15 B Between Jackson and Van Brunt 14.9 B 11 A Between Van Brunt and U.S. 40 14.5 B 15 B Between U.S. 40 and Manchester 15 B 13 B Between I‐435 and Blue Ridge Cut Off 13.1 B 13 B Between Blue Ridge Cut Off and U.S. 40 16.3 B 12 B Between U.S. 40 and Noland Road 15.4 B 13 B Between Noland Road and Leeʹs Summit 14.1 B 12 B Between Leeʹs Summit and I‐470 14.1 B 11 A
PM Peak Period in the Westbound Direction Between Brooklyn and Prospect 24.1 C 17 B Between Prospect and Benton 23.1 C 15 B Between Benton and 18th St. 19.4 C 20 C Between 23rd St. and 27th St. 18.8 C 16 B Between 27th St. and Jackson 17.4 B 17 B Between Jackson and Van Brunt 18.5 C 16 B Between Van Brunt and U.S. 40 18.3 C 17 B Between U.S. 40 and Manchester 18.1 C 12 B Between I‐435 and Blue Ridge Cut Off 14.3 B 15 B Between Blue Ridge Cut Off and U.S. 40 18.3 C 15 B Between U.S. 40 and Noland Road 18.7 C 17 B Between Noland Road and Leeʹs Summit 18 C 15 B Between Leeʹs Summit and I‐470 18 C 15 B (pc/mi/ln) ‐ passenger car equivalent per mile per lane Merge/Diverge Areas ‐ HCS analysis was performed on all merge and diverge areas along I‐70 in the Study Area for the AM and PM peak hours. Tables D‐6 to D‐9 shows that although the ramps generally operate at acceptable LOS, there are isolated capacity failures at some of the ramps during select time periods. These failures are typical of corridor “chokepoints” that can spill‐back and compromise mainline operations.
Appendix D: Traffic Data and Level of Service Analysis
I‐70 First Tier Purpose and Need D‐16
Table D‐6: Summary of HCS analysis for merge and diverge areas along I‐70 (AM Peak Hour)
2005 FTEIS 2000 MIS LOCATION MOVEMENT DENSITY
(pc/mi/ln) LOS DENSITY
(pc/mi/ln) LOS
WB/NB DIVERGE
25.5 C 29 D
SB/WB MERGE 29.6 D 30.9 D EB/SB DIVERGE 17.9 B 15.9 B
I‐70 / I‐470
NB/EB MERGE 15.5 B 14.4 B EB DIVERGE 19.5 B 17.7 B EB MERGE 17.9 B 16.3 B
WB DIVERGE 32.2 D 33.1 D I‐70 / LEE’S SUMMIT
WB MERGE 32.2 D 34.2 D EB DIVERGE 21.6 C 20 C EB MERGE 18.2 B 16.5 B
WB DIVERGE 33.8 D 34.6 D I‐70 / NOLAND
WB MERGE 32 D 34.3 D I‐70 / BLUE RIDGE
BLVD. EB MERGE 18.7 B 17.3 A
EB DIVERGE 1.1 A 13.3 B EB MERGE 19.2 B 17.8 B
WB DIVERGE 35.2 E 35 E I‐70 / U.S. 40 EAST
WB MERGE 33.9 D 34.9 D I‐70 / STERLING EB DIVERGE 18.1 B 16.6 B
EB DIVERGE 13.6 B 12.4 B EB MERGE 18.1 B 15.7 B
WB DIVERGE 33.2 D 33 D I‐70 / BLUE RIDGE
CUTOFF WB MERGE 26 C 25.6 C WB/NB
DIVERGE N/A A N/A A
WB/SB DIVERGE 39.7 F 37.1 F I‐70 / I‐435 NB/SB/EB MERGE
14.1 B 12.7 B
(pc/mi/ln) ‐ passenger car equivalent per mile per lane
Appendix D: Traffic Data and Level of Service Analysis
I‐70 First Tier Purpose and Need D‐17
Table D‐7: Summary of HCS analysis for merge and diverge areas along I‐70 (AM Peak Hour) 2005 FTEIS 2000 MIS
LOCATION MOVEMENT DENSITY (pc/mi/ln)
LOS DENSITY (pc/mi/ln)
LOS
EB DIVERGE 19.9 B 20.8 C I‐70 / MANCHESTER WB MERGE 31.2 D 30.7 D EB DIVERGE 17.3 B 18 B EB MERGE 17.9 B 18.7 B
WB DIVERGE 32.1 D 31.1 D I‐70 / U.S. 40 WEST
WB MERGE 35.2 E 37.3 E EB DIVERGE 19 B 21.4 C EB MERGE 15.3 B 19.7 B
WB DIVERGE 38.3 E 37.4 E I‐70 / VAN BRUNT
WB MERGE 31.3 D 32.2 D WB DIVERGE 32.3 D 31.4 D
I‐70 / JACKSON EB MERGE 18 B 18 B
I‐70 / 31ST EB DIVERGE 17.5 B 18.2 B EB DIVERGE 18.3 B 19 B
I‐70 / 27TH WB MERGE 35.1 E 34 D EB DIVERGE 18.4 B 19.1 B EB MERGE 16.9 B 17.5 B
WB DIVERGE 34.3 D 33.4 D I‐70 / 23RD
WB MERGE 36.8 F 37.9 E EB DIVERGE 18.6 B 19.3 B EB MERGE 19.1 B 19.7 B
WB DIVERGE 37.7 F 36.9 F I‐70 / 18TH
WB MERGE 35.4 F 35.5 F WB MERGE 19.1 B 19 B
I‐70 / BENTON EB DIVERGE 22.1 C 22.8 C EB DIVERGE 9.9 A 10.5 B EB MERGE 17.1 B 17.7 B
WB DIVERGE 36.5 E 35.6 E I‐70 / PROSPECT
WB MERGE 21.9 C 21.4 C EB DIVERGE 19.2 B 19.8 B
I‐70 / BROOKLYN WB MERGE 26.4 C 25.8 C EB DIVERGE 21.5 C 22.2 C EB MERGE 18.1 B 18.9 B
WB DIVERGE 34.1 D 33.4 D I‐70 / PASEO
WB MERGE 22.7 C 23.3 C (pc/mi/ln) ‐ passenger car equivalent per mile per lane
Appendix D: Traffic Data and Level of Service Analysis
I‐70 First Tier Purpose and Need D‐18
Table D‐8: Summary of HCS analysis for merge and diverge areas along I‐70 (PM Peak Hour) 2005 FTEIS 2000 MIS
LOCATION MOVEMENT DENSITY (pc/mi/ln)
LOS DENSITY (pc/mi/ln)
LOS
WB/NB DIVERGE 17.4 B 17.2 B
SB/WB MERGE 21.1 C 19.8 B EB/SB DIVERGE 34 D 33.8 D
I‐70 / I‐470
NB/EB MERGE 29.3 D 29.9 D EB DIVERGE 37.1 E 36.9 E EB MERGE 32.5 D 33.4 D
WB DIVERGE 23.8 C 22.4 C I‐70 / LEE’S SUMMIT
WB MERGE 22.1 C 20.8 C EB DIVERGE 38.5 E 37.7 E EB MERGE 35.5 E 36.4 E
WB DIVERGE 24.2 C 22.8 C I‐70 / NOLAND
WB MERGE 23.6 C 22.3 C I‐70 / BLUE RIDGE
BLVD. EB MERGE 37.2 E 36.6 E EB DIVERGE 14.6 B 29 D EB MERGE 34.8 D 34.4 D
WB DIVERGE 24.9 C 23.6 C I‐70 / U.S. 40 EAST
WB MERGE 21.4 C 21.8 C I‐70 / STERLING EB DIVERGE 33.1 D 32.6 D
EB DIVERGE 26.6 C 25.9 C EB MERGE 33 D 19.4 B
WB DIVERGE 22 C 20.7 C I‐70 / BLUE RIDGE
CUTOFF WB MERGE 10.9 B 9.8 A WB/NB
DIVERGE N/A A N/A A WB/SB DIVERGE 18.5 B 15 B I‐70 / I‐435
NB/SB/EB MERGE 31.7 F 31.8 F
(pc/mi/ln) ‐ passenger car equivalent per mile per lane
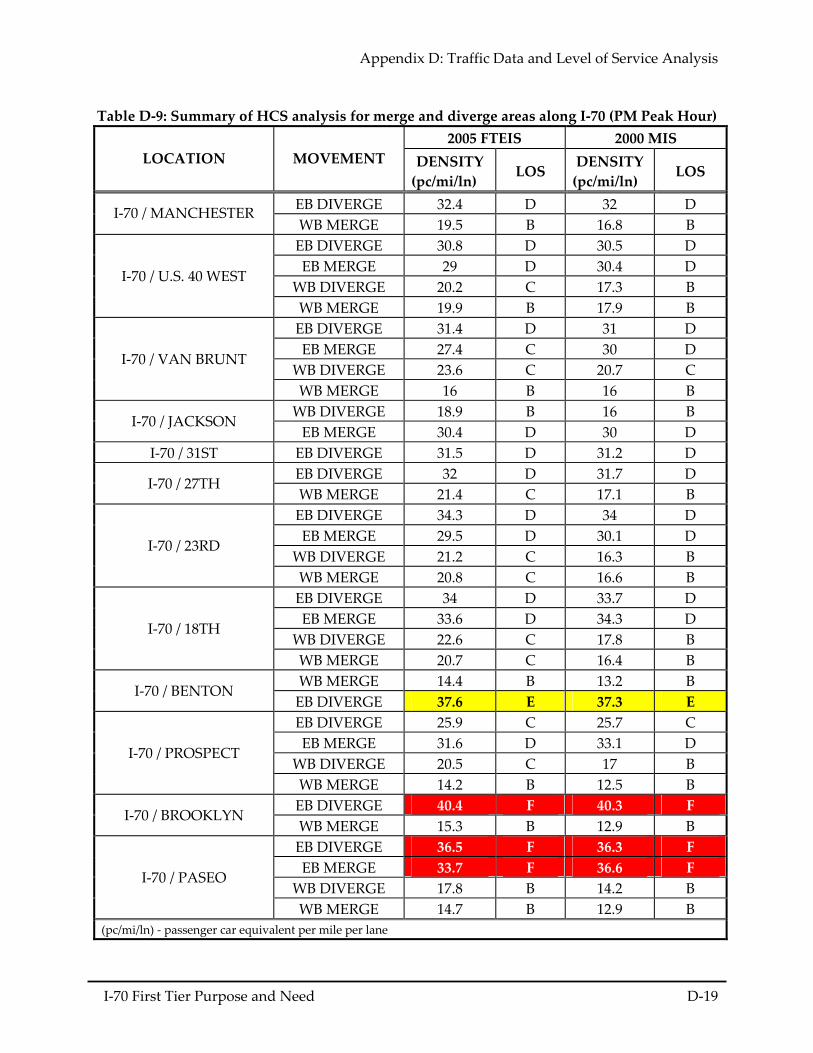
Appendix D: Traffic Data and Level of Service Analysis
I‐70 First Tier Purpose and Need D‐19
Table D‐9: Summary of HCS analysis for merge and diverge areas along I‐70 (PM Peak Hour) 2005 FTEIS 2000 MIS
LOCATION MOVEMENT DENSITY (pc/mi/ln)
LOS DENSITY (pc/mi/ln)
LOS
EB DIVERGE 32.4 D 32 D I‐70 / MANCHESTER WB MERGE 19.5 B 16.8 B EB DIVERGE 30.8 D 30.5 D EB MERGE 29 D 30.4 D
WB DIVERGE 20.2 C 17.3 B I‐70 / U.S. 40 WEST
WB MERGE 19.9 B 17.9 B EB DIVERGE 31.4 D 31 D EB MERGE 27.4 C 30 D
WB DIVERGE 23.6 C 20.7 C I‐70 / VAN BRUNT
WB MERGE 16 B 16 B WB DIVERGE 18.9 B 16 B
I‐70 / JACKSON EB MERGE 30.4 D 30 D
I‐70 / 31ST EB DIVERGE 31.5 D 31.2 D EB DIVERGE 32 D 31.7 D
I‐70 / 27TH WB MERGE 21.4 C 17.1 B EB DIVERGE 34.3 D 34 D EB MERGE 29.5 D 30.1 D
WB DIVERGE 21.2 C 16.3 B I‐70 / 23RD
WB MERGE 20.8 C 16.6 B EB DIVERGE 34 D 33.7 D EB MERGE 33.6 D 34.3 D
WB DIVERGE 22.6 C 17.8 B I‐70 / 18TH
WB MERGE 20.7 C 16.4 B WB MERGE 14.4 B 13.2 B
I‐70 / BENTON EB DIVERGE 37.6 E 37.3 E EB DIVERGE 25.9 C 25.7 C EB MERGE 31.6 D 33.1 D
WB DIVERGE 20.5 C 17 B I‐70 / PROSPECT
WB MERGE 14.2 B 12.5 B EB DIVERGE 40.4 F 40.3 F
I‐70 / BROOKLYN WB MERGE 15.3 B 12.9 B EB DIVERGE 36.5 F 36.3 F EB MERGE 33.7 F 36.6 F
WB DIVERGE 17.8 B 14.2 B I‐70 / PASEO
WB MERGE 14.7 B 12.9 B (pc/mi/ln) ‐ passenger car equivalent per mile per lane
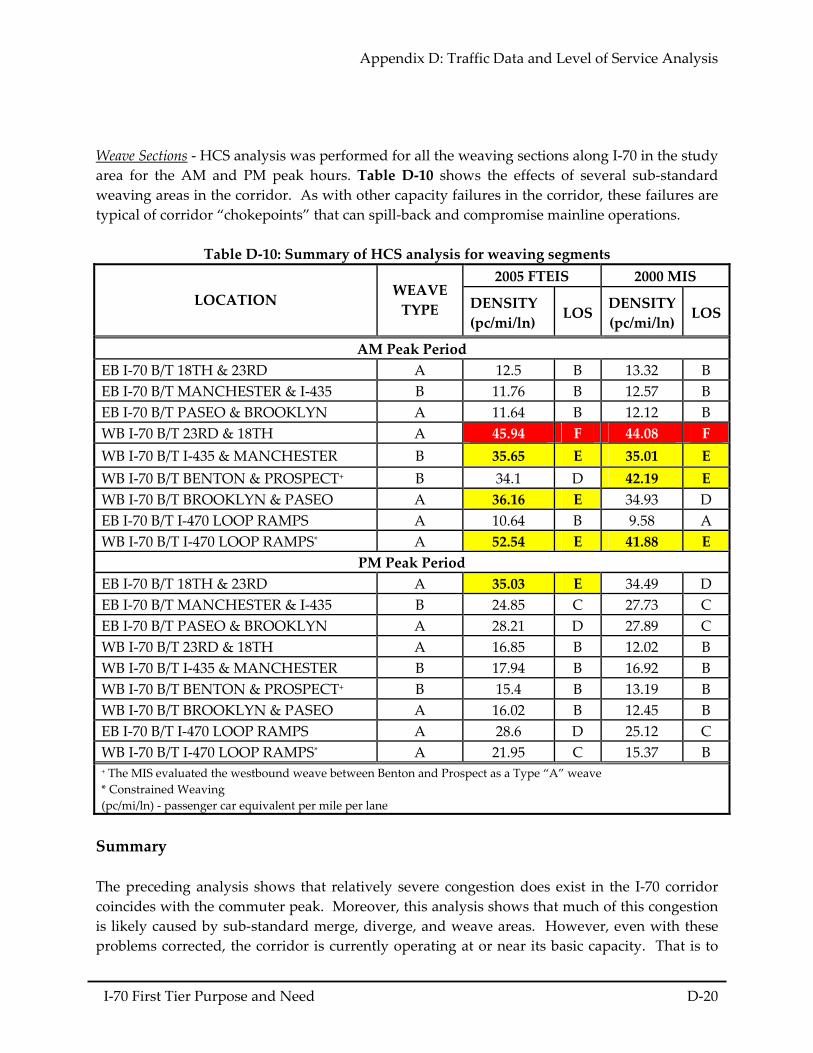
Appendix D: Traffic Data and Level of Service Analysis
I‐70 First Tier Purpose and Need D‐20
Weave Sections ‐ HCS analysis was performed for all the weaving sections along I‐70 in the study area for the AM and PM peak hours. Table D‐10 shows the effects of several sub‐standard weaving areas in the corridor. As with other capacity failures in the corridor, these failures are typical of corridor “chokepoints” that can spill‐back and compromise mainline operations.
Table D‐10: Summary of HCS analysis for weaving segments 2005 FTEIS 2000 MIS
LOCATION WEAVE TYPE DENSITY
(pc/mi/ln) LOS
DENSITY(pc/mi/ln)
LOS
AM Peak Period EB I‐70 B/T 18TH & 23RD A 12.5 B 13.32 B EB I‐70 B/T MANCHESTER & I‐435 B 11.76 B 12.57 B EB I‐70 B/T PASEO & BROOKLYN A 11.64 B 12.12 B WB I‐70 B/T 23RD & 18TH A 45.94 F 44.08 F WB I‐70 B/T I‐435 & MANCHESTER B 35.65 E 35.01 E WB I‐70 B/T BENTON & PROSPECT+ B 34.1 D 42.19 E WB I‐70 B/T BROOKLYN & PASEO A 36.16 E 34.93 D EB I‐70 B/T I‐470 LOOP RAMPS A 10.64 B 9.58 A WB I‐70 B/T I‐470 LOOP RAMPS* A 52.54 E 41.88 E
PM Peak Period EB I‐70 B/T 18TH & 23RD A 35.03 E 34.49 D EB I‐70 B/T MANCHESTER & I‐435 B 24.85 C 27.73 C EB I‐70 B/T PASEO & BROOKLYN A 28.21 D 27.89 C WB I‐70 B/T 23RD & 18TH A 16.85 B 12.02 B WB I‐70 B/T I‐435 & MANCHESTER B 17.94 B 16.92 B WB I‐70 B/T BENTON & PROSPECT+ B 15.4 B 13.19 B WB I‐70 B/T BROOKLYN & PASEO A 16.02 B 12.45 B EB I‐70 B/T I‐470 LOOP RAMPS A 28.6 D 25.12 C WB I‐70 B/T I‐470 LOOP RAMPS* A 21.95 C 15.37 B + The MIS evaluated the westbound weave between Benton and Prospect as a Type “A” weave * Constrained Weaving (pc/mi/ln) ‐ passenger car equivalent per mile per lane
Summary The preceding analysis shows that relatively severe congestion does exist in the I‐70 corridor coincides with the commuter peak. Moreover, this analysis shows that much of this congestion is likely caused by sub‐standard merge, diverge, and weave areas. However, even with these problems corrected, the corridor is currently operating at or near its basic capacity. That is to
Appendix D: Traffic Data and Level of Service Analysis
I‐70 First Tier Purpose and Need D‐21
say, in addition to improving the merge, diverge, and weave sections in the corridor, basic capacity enhancements (e.g., lane additions) are prudent to address the existing needs. Additionally, it does not appear that operations in the corridor have changed significantly between 2000 and 2005. It is interesting to note that peak period volumes are not significantly changing even though the daily traffic volumes are growing as the corridor’s population grows and shifts to the west (away from major regional employment centers). This is likely due to driver’s changing their trip time, destination, and/or route to avoid the over‐saturated freeway corridor during the peak periods. This trend usually creates a “latent” demand in the corridor. That is to say that if capacity is added, corridor peak period traffic volumes are likely to jump as travel times are reduced and drivers adjust their travel decisions to account for the improved conditions. Finally, we explored some specific locations that appear to be major corridor “chokepoints”, as is discussed in the following.
• Downtown Loop
The Downtown loop is congested in the peak hours due to a lane balance issue and tight weaving sections between interchanges. The incoming AM peak is a bottleneck largely because of the congestion from I‐670. The outgoing PM peak experiences congestion due to a lane drop at Prospect Avenue: there is one incoming lane from the downtown loop, one incoming lane from downtown, two incoming lanes from I‐670 but only three outgoing lanes east of Prospect Avenue.
• Benton/Jackson Curves
These curves have substandard interstate operations and geometrics due to poor sight distance and high roadway curvature (speed limit: 55 mph). Although these curves are not a major source of congestion at present, these are areas of high crash rates according to the MIS.
• I‐435
I‐70 at the I‐435 interchange experiences congestion in the AM peak period in the westbound direction and in the PM peak period in the eastbound direction. This is caused by lane drops through the interchange and steep grades on I‐70 leaving the interchange.
• Noland Road
I‐70 at the Noland Road interchange experiences congestion in the AM peak period in the westbound direction and in the PM peak period in the eastbound direction. This can likely be attributed to insufficient ramp capacity, (especially during the PM peak period), grades, and acceleration and deceleration lanes between ramps and mainline.
Appendix D: Traffic Data and Level of Service Analysis
I‐70 First Tier Purpose and Need D‐22
• I‐470 At the I‐70/I‐470 interchange congestion tends to occur on I‐470 and not on I‐70 including tight weaving sections on I‐470 north and south of I‐70. This congestion affects traffic flow onto and off of I‐70.