Embed Size (px)
Citation preview
APPENDIX B
Effects of Aircraft Wake Dynamics on Measured and Simulated
NOx and HOx Wake Chemistry
D.C. Lewellen and W. S. Lewellen
Journal of Geophysical Research
Vol. 106, No. D2 l, pages 27,661-27,672
16 November 2001
12

Effects of aircraft wake dynamics on measured and
simulated NO_ and HO_ wake chemistry
D. C. Lewe]len and W. S. Lewellen
Department of Mev_haaical and Aerospace Engin_ring, West Virginia University, Morgantown,
West Virginia, USA
Abstract. High-resolution numerical large-eddy simulations of the near
wake of a B757 including simplified NO_ and HOz chemistry were performed
to explore the effects of dynamics on chemistry in wakens of ages from afew seconds to several minutes. Dilution plays an important basic role in
the NO_ - Oa chemistry in the wake, while a more interesting interaction
between the chemistry and dynamics occurs for the HO_ species. These
simulation results are compared with published measurements of OH and
HO2 within a B757 wake under cruise conditions in tile upper troposphere
taken during the Subsonic Aircraft Contrail and Cloud Effects Special Study
(SUCCESS} mission in May 1996. The simulation provides a much finer
grained representation of the chemistry and dynamics of the early wake
than is possible from the 1 s data samples taken in situ. The comparison
suggests that the previously reported discrepancy of up to a factor of 20 -
50 between the SUCCESS measurements of the [HO2]/[OH] ratio and that
predicted by simplified theoretical computations is due to the combined
effects of large mixing rates around the wake plume edges and averaging over
volumes containing large species fluctuations. The results demonstrate the
feasibility of using three-dimensional unsteady large-eddy simulations with
coupled chemistry to study such phenomena.
1. Introduction
The possibility that future, increases in the commer-
cial aircraft fleet may have significant environmental
and climatological effects is being widely studied [e.g.,
Penner et. al., 1999; Schumann, 1998: Friedl, 1997].
While the volume of aircraft emissions is not large com-
pared to ground-based sources, these emissions are in-
jected directly into the relatively stable upper tropo-
sphere and lower stratosphere where small emissions
may have potentially significant effects. A number of
field programs have been conducted, e.g., Subsonic Air-
craft Contrail and Cloud Effects Special Study (SUC-
CESS) [Teen and Miake-Lye, 1998], SASS Ozone and
Nitrogen Oxide Experiment (SONEX) [Sinffh et al.,
1999], and AERONOX [Schumann, 1997], which use in
situ measurements in wakes as a means to better deter-
mine the aircraft emi_ions and understand the chemi-
cal kinetics within the wake plume. Our subject in this
work, the effects of wake dynamics on wake _emistry
measurements, is an important source of uncertainty in
interpreting the results of such field measurements or
results from atmospheric chemistry models. When the
sampling volumes being measured (or modeled) con-
rain large fluctuations of some chemical species, the av-
e.rage concentration measured and chemistry inferred
may be quite different from the locM results occurring
within that volume. This is particularly true when re-
action rates between relevant species are faster than
turbulent mixing rates, allowing strong anticorrelated
distributions to occur. This necessarily reduces the ef-
fective reaction rate of average concentrations, making
those rates dependent on mixing rates in the fluid [Sykes
eta/., 1992; Schumann, 1989].
Here our focus is on the dynamics and chemistry
within a wake plume from an age of a few seconds to
several minutes. This is a regime which has been heavily
studied in in situ measurement campaigns. It includes
the partial capturing of the exhatmts by the tr',dIing

vortexpairbehindtheaircraft,thevortex-dominateddynamicswhichd_axila_,icallyexpandthewakeplumebothverticallyandhorizontally,andthesubsequentbuoyantc_scillations of the plume after the vortex dy-
namics subside. We do not consider the chem£stry in
the earliest jet exhaust phase where temperatures are
initially very high but rapidly dilute toward ambient
levels, or the ultimate fate of the wake plume and its
chemical constituents at late times where the dynamics
are dominated by ambient atmospheric turbulence, al-
though both are likely to prove important in assessing
the environmental effects of aviation.
During this time period we are particularly inter-
ested in the impact of species fluctuations on scales that
are typically too small to be measured by trailing air-
craft moving at speeds often in excess of 200 m s kl.
Accordingly, we utilize a three-dimensional (3-D), un-
steady, high-resolution model of the aircraft wake which
is capable of resolving dynamical and/or chemical fea-
tures on scales of a few meters. The large-eddy simu-
lation (LES) code we. employ for the fluid dynamics is
the same one used by Lewellen and LeweUen [1996] to
present detailed dynamics of the vortex pair breakup in
an aircraft wake; by Lewellen et al. [1998} to compare
numerical simulation results of wake dispersion to lidar
observations; and by LewelIen and Lewellen [2001] to
examine effects of wake dynamics on contrail evolution.
Given the computational requirements of the resolution
we employ, we can include only a limited set of chemical
reactions and species within our simulations. Nonethe-
less, this proves sufficient to demonstrate some poten-
tially important effects, while confirming the practical
feasibility of coupling detailed dynamics and chemistry
using LES.
Of particular interest to us in this study were a set of
HO,. measurements taken during SUCCESS {Tan el al..
1998]. These showed an apparently anomalously high
ratio of [ttO2]/[OH] within young wake phlmes, 20 5{)
times greater than expected by simple chemical compu-
tations. The authors suggested that this effect might
be due in part to the _rong ;mticorrelation betwee, n
NO and HO2 in the turbulent fluctuations within the
wake occurring during these measurements. To quan-
titatively test this possibility, we have included HO_
chemistry in addition to basic NO_ - ozone chemistry
in our reaction set for the present work, and have cho-
sen to simulate a B757 wake with nominal conditions
and emissions in agreement with those reported during
the SUCCESS HO_ mea.surements.
Our approach here is complementary to other recent
studies of chemistry in aircraft wake plumes. These in-
LEWELLEN AND LEWELLEN
clude studies of detailed chemistry, in the early hot jet
regime coupled with simple dynamics [e.g., Miake-Lye
et al., 1993; Menon and Wu, 1998; KSrcher et al., 1998];
studies with detailed chemistry in the wake vortex
regime with dynamics modeled in two dimensions [e.g.,
Anderson et al., 1996}; studies of older plumes with de-
tailed box model chemistry but only rudimentary dy-
namics included via some prescribed dilution history
[e.g., Karol et al., 1997]; studies with detailed 3-D air-
craft wake dynamics but only passive tracers for the en-
gine exhausts [e.g., Lewellen and Lewellen, 1996; Gerz
and Ehret, 1996; Gerz et al., 1998; Lewellen et al., 1998];
and studies of ice phase "chemistry" (contrails) inter-
acting with wake dynamics at many different levels of
approximation [e.g., Gierens, 1996; Chlond, 1998; Suss-
mann and Gierens, 1999; Gierens and Jensen, 1999;
Lewellen and Lewel_en, 2001; Sussmann and Gierens,
2001]. Aircraft wake dynamics alone, ignoring the fate
of the engine exhaust products, have also been a sig-
nificant area for research because of potential effects on
closely following aircraft and the resulting safety issues
for takeoff and landing at airports. A recent review of
these efforts, including some large eddy and direct nu-
mericai simulations, has been made by Spalart [1998].
In s_.tion 2 we provide an overview of our LES model
and the conditions simulated. In section 3, we discuss
the simulation results, beginning with the basic wake
dynamics and NO_ - ozone chemistry, as illustrated by
the simulations, and ending with the dramatic effects of
dynamics on measured H()_ chemistry in the wake. A
summary and some final comments follow in section 4.
2. Model Overview and Simulation
Conditions
In order to simulate detailed wake dynamics, species
dispersion, _md the accompanying chemistry, we use
the technique of numerical large-eddy simulation. The
r,'mge of length scales involved in this problem is much
too great to permit a direct numericaJ simu]ation of all
scales with currently available computer resources. In-
stead, we solve the Navier-Stokes equations directly for
the most important scales in the flow (from smaller than
the wake vortex core size to many times the aircraft
wingspan), but only model the etfects of the smaller, un-
resolved eddies. Our simulation is of a B757 flying in the
upper troposphere under cruise conditions, nominally
that relevant for the SUCCESS observations. Details
of our LES model applied to aircraft wake dynamics
have been given by LeweUen and Lewellen [1996, 2001],
along with a discussion of the many choices and corn-
AIRCRAFT WAKE DYNAMICS AND CHEMLSTRY
promises necessarily involved in efficiently tackling such
simulations. A summary of the model and simulation
conditions is given below, first for the fluid dynamics
and then for the chemistry added specifically for the
present work.
2.1. Fluid Mechanics
The LES code we employ for aircraft wake simula-
tions is a modified version of one we use for bound-
ary layer cloud modeling [e.g., Lewellen and LeweUen,
1996], which in turn is based on the implementation of
Sykes and Henn [1989]. It is a 3-D finite difference im-
plementation of the incompressible Navier-Stokes equa-
tions in the Boussinesq approximation, second-order
acc_ate in space, and time. It incorporates a piecewise
parabolic model algorithm for the advection of thermal
energy and species concentrations. The pressure field
is obtained by directly solving the Poisson equation us-
ing fast Fourier transforms in the downstream direction,
the method of Farnell [19801 for nonuniform grids in the
cross-stream direction, and a tridiagonal solver in the
vertical.
The simulation of the interacting trailing vortex pair
in an aircraft wake presents a particular challenge be-
cause both small grid spacings and large domains are re-
quired. A grid spacing of a few percent of the wingspan
or less is required to resolve the trailing vortex cores
and the transport of the engine exhausts around and
into them. At the same time, line vortices have a sizable
long-range influence on the flow field, so domain widths
of several wingspans or more are required to minimize
unwanted boundary interactions. We employ three, de-
vices to help to meet these conflicting demands: (1) a
stretched grid spacing in the vertical and cross-stream
directions to achieve fine spacing where it is m_ded
within the wake. while maintaining large domain sizes;
(2) vertical tracking of the wake to insure that the fine
grid portion of the domain encompasses the descending
wake vortices; and {3) different grids (six in the case
presented here) for different segments of the simulations
as the wake evolves and the optimum grid requirements
change. A variable time step was used in the simula-
tion, with values ranging from 0.003 to t}.02 to 1 s for,
respectively, the early jet, early vortex, ;rod bate time
stages discus_d below.
We errlpIoy a subgrid moctel which u._es a quasi-
equilibrium, second-order turbulence closure scheme
with the suhgrid turbulent kinetic energy carried as a
dynamical variable and the maximum subgrid turbu-
lence length scale related to the numeric',d grid length.
The damping of subgrid turbulence by a stable tern-
3
perature gradient or a stable rotational velocity field
is approximately included via appropriate reductions of
the subgrid turbulence length scale. The incorporation
of rotational damping effects in the subgrid model is
,somewhat unusual, but u,_ful for simulations of _rong
vortices in order to avoid unphysically large rates of core
diffusion. The method is described in detail by Lewellen
et al. [2000], who used it extensively in tornado simula-
tions. It was not included in our earliest aircraft wake
simulations [Lewellen and Lewellen, 1996], but has been
used since [Lewellen et al., 1998; Lewellen and Lewellen,
20011.
We employ periodic boundary, conditions in all three
directions. Effectively, this means there are neighboring
wakes Located at twice the distance to the boundary in
the vertical and crosswise directions evolving in parallel
with our simulated wake. The stretched grid allows us
to place the boundaries at sufficient distance to make
the effects of these image vortices negligible. Period-
icity in the vertical is modified by a temperature shift
between the top and bottom of the domain to permit a
mean stratification to be imposed. In imposing periodic
conditions in the downstream direction we are treating
the wake portion within our domain as if it were laid
down instantaneously. This ks an appropriate approxi-
mation here because the aircraft flight speed is much
greater than the velocity scales of the wake dynam-
ics over the period treated (which excludes the region
within a few wingspans of the aircraft.). The approxi-
mate periodicity of the wake downstream is amply con-
firmed by observations of contrail evolution from ages
of a few seconds to several minutes.
The initial conditions were chosen consistent with
cruise conditions for a B757 flying at 11 km altitude at
210 m s t with a mass of 87,000 kg (which is midway
between the minimum and maximum masses for this
aircraft). For an effective vortex pair separation of 29.4
m this implies a circulation about the vortices of 380
m 2 s 1. The heat produced by the engines per meter
of flight path was taken as 255 K m 2, computed from a
total fuel flow ra_e of 3.1 kg krn -1 (in agre, ement with
that quoted for the SUCCESS measurements by Tan
et aL [1998]), a specific combustion heat of 43 MJ kg t
appropriate for kerosene-type jet fuels, ;rod an assumed
jet engine efficiency of 30%. Tbe integrated momentum
in the exhaust jets per meter of flight path was chosen
_Ls 502 m 3 s t, computed from the as,sumed fuel flow
rate, flight speed, and a specific fuel consumption of
16.9 mg N -j s -1. The detailed cross-stream distribu-
tions of the velocity fields and exhaust products depend
on the roll up of the vorticity shed from the wing and

LEWELLEN AND LEWELLEN
were taken from a UNIWAKE simulation [Quackenbush
eta/., 1996], with values scaled so as to match the de-
sired circulation, jet momentum, engine heat, etc.
As we will discuss in detail below, the fluctuations in
exhaust distribution play an important role in affecting
measured chemistry in the wake. Accordingly, we have
at least approximately included the effects of exhaust
jet turbulence into the initial conditions used for our
chemistry simulation. This was done by performing an
initial simulation of the early wake (without chemistry)
from an age of about 0.5 s to 3.5 s, with high spatial
resolution (0.33 m finest grid spacing), for a short (42
m) downstream portion of wake, to develop some jetturbulence and smaller-scale fluctuations in the exhaust
distribution. These results were periodically continued
to provide the initial conditions for the full downstream
domain employed for the chemistry, simulation.
To complete the initial conditions for our simu-
lations, the aircraft wake is superimposed with an
ambient atmospheric field (the result of a separate
large-eddy simulation), as described by LeweUen and
Lewellen [1996]. The field was generated in the desired
domain, with a nominal value of potential temperature
stratification for the upper troposphere (2.5 K km -1)
and no mean wind shear. Large initial velocity and
temperature perturbations were applied and the subse-
quent evolution followed via LES until the turbulence
and gravity waves had a chance to adjust to the stratifi-
cation, and their amplitude had decayed into a reason-
able range (turbulent dissipation rate of order 2 x 10 -'_
In 2 s- 3 ).
Table 1 summarizes the grids employed for the pri-
mary simulation. The choice of grid for the given seg-ment of the simulation was correlated with the wake
vortex dynamics then occurring, in order to be_t appor-
tion the limited number of grid points available given
the physics that had to bc res_)lved. As the dynam-
ics progress the wake expands mid turbulence levels
fall. so that the finest grid spacing can he increased on
subsequent grids but must cover larger portions of the
domain. Accordingly, when the wake dynaznics would
threaten to outgrow the fin_grid region of the domain,
we simply interpolated the species and flow fields to a
more suitable grid. The domain size was doubled for
the fourth grid. To do this, the final field generated
on the third grid was periodically doubled in the down-
stream direction and added to an _unbient turbulence
field generated by a separate LES on the doubled do-
main.
As noted prcviously, the vertical and cross-stream
domain edges were chc_sen far from the wake to mini-
mize boundary effects and allow a more realistic ambi-
ent turbulence field. There is a different constraint on
the downstream domain size as discussed at length by
Lewellen and Lewellen [1996]. The downstream domain
size. mnst be commensurate with the period of the basic
wake decay mode, the Crow instability (discussed be-
low). For a given aircraft, there is considerable variabil-
ity in the observed periodicity, depending on the wave
and turbulence spectrum in the ambient atmosphere. It
is not unusual to see a factor of 2 variation in period
within a single contrail in the sky. Nonetheless, there
is a preferred range of wavelengths encountered. Here
we choose a downstream domain dimension of 210 m,
expecting a Crow period of approximately that length,
which for the B757 is a little less than the wavelength of
maximum amphfication deduced by Crow [1970] from
a linear stability analysis, and a little greater than the
most favored range found in the direct numerical sim-
ulation study of Spalart and Wray [1996]. In previous
work we have found little variation of the basic wake
decay (rate of wake dispersion, overall vertical and hor-
izontal extent, wake lifetime, etc.) with downstream
domain size. The intcraction between a given Crow pe-
riod and its neighbors is only weakly affected by the
detailed structure of those neighbors, so replacing them
with periodic images proves to be a reasonable approx-
imation. Providing for multiple Crow periods to be
simulated does give additional turbulent realizations of
these structures. We performed an additional simula-
tion analogous to the one presented here but with a dif-
ferent ambient turbulence field (with lower turbulence
intensity) to estimate the variation in our chemistry
results between different turbulent realizations of the
same basic process. For the summary results presented
below, the two sets of results were all very close.
2.2. Chemistry
Given the number of grid points in our simulations,
we use a relatively simple (and therefore numerically
less costly) chemical reaction set, concentrating on im-
portant reactions within the wake plume for ages from
a few seconds to a h_w minutes. The chemical species
considered are NO, NO..,, HONO, HNO3, 03, OH, HO2,
CO, and CIt4, with bmsie reactions:
NO + O,_ ---+ NO2 + 0..,, (1)
NO2+h.+()_ ----+ NO+O,3, (2)
HONO+h. ---+ OH+NO, (3)
Oil + NO ---+ IIONO, (4)
OH+NO._ ---+ HNOa, (5)

AIRCRAFT WAKE DYNAMICS AND CHEMISTRY
Table 1. Grids Used for the B757 Chemistry Simulation _
Grid Domain, m Number of Grid Points Fine Spacing, m Time period, s
0 660x660x42 162x154x130 0.33x0.33x0.33 0.5-3.5
1 660x800x210 124xl16x130 0.8x0.Sxl.6 3.5-50.
2 660x800x210 120x121x162 1.xl.xl.3 50-100
3 660x900x210 152x134x130 1.6xl.6xl.6 100-240
4 1200x1300x420 100xt39x122 3.3x3.3x3.5 240-500
5 1200x1300x420 94xl19x66 6.5x6.5x6.5 500-900
_Domain dimensions, number of grid points, and fine grid spacings are given for the (cross-
stream)x (vertical)x(downstream) directions, respectively. Grid 0 was used for an initial simula-
Lion without chemistry to generate initial conditions including turbulent jet fluctuations for themain simulation.
H02 + NO ---+ OI-I + NOz, (6)
OH + CO + 0.2 ----+ CO2 + tlO.2, (7)
OH + 0:, ---+ ttO.2 + 02, (8)
HO2 + ()._ ---+ OH +202, (9)
OH+CH4+... ----4 HO2+N02+ .... (10)
The reaction rates employed (k_-o+o3 = 2.39x 10 -5,
kOH+NO = 4.63X10 -2 , kOH+NO2 = 9.18X10 -2 ,
/¢HO_+NO = 8.4X10 -2, kOH+CO = 1-29x10 -:_, koH+Oa
= 1.59x10 4 kuo2+o_ = 8.32×10 -s, ko}_+CH4 =
5.2x10 -_, 'all in (ppb s) -l) were taken from DeMote
et al. [1997] for conditions of 217 K and 0.224 arm, ex-
cept for the OH + NO2 re_ction rate, which was taken
from Brown et al. (1999]. Nominal daytime values at 11
km altitude were chosen for the photolysis rates (JNo_
= 0.01 s -1 and J_oNo = 0.0033 s-l). Reaction (10) is
an effective one for the cycling of OH to HO2 through
the intermediary CI1.tO2 in the presence of NO. It is
only of minor importance to the HOz chemistry in the
regime being studied (being dominated by reaction (7)),
but is included approximately at little extra numerical
cost by taking the CH4 concentration as constant. The
variations of the rate constants due to temperature fluc-
tuations within the wake plume have not been included
here. For the wake ages considered, the variations in
temperature encountered are generally of order a de-
gree or less, giving changes in rate constants of a few
percent or less (which is generally below the level of
uncertainty in the rate formulas them_lves).
In choosing the initial chemical concentrations, we
did not try to match a particular SUCCESS flight con-
dition, but did pick values within the ranges measured
during the SUCCESS flights: ambient background lev-
els of HO2 between 10-20 pptv and OH between 0.3-0.5
pptv [Tan et al., 1998]; ambient levels of NO_ = 70
pptv, CO = 120 ppbv, O3 = 65 ppbv, and CH4 = 1750
ppbv [Jaegle et al., 1998]. The actual values used for
the HONO, OH, and H02 concentrations (HONO =
0.36 pptv, OH = 0.42 pptv, and HO2 -- 15 pptv) and
the split of NOz into NO and NO2 (NO = 55 pptv and
NO2 = 15 pptv), were also chosen so that the back-
ground concentrations of any species did not drift sig-
nificantly over the course of the simulation (realizing
that other reactions besides those explidtly treated are
important in setting the background equilibrium con-
centration over timescal_ much longer than we consider
here).
The initial concentration used for each species con-
sisted of a background level plus a plume concentration,
with the latter chosen consistent with measured emis-
sion indices, fuel consumption rates, and flight speeds
f_w the SUCCESS flights. In particular, the NO emis-
sion index is taken a,s 7.,5 g NO2 kg -l fllel [Campos
et al., 1998], with a total fuel usage per flight path of
3.1 g m -l. The volume ratio of CO above background
in the exhaust to NO_ was set at 0.306, consistent with
the median emission index (1.55 g kg 1) measured on
May 4 during SUCCESS [Vay et aL, 1998]. The ratios
of HONO and NO2 to NO, in the jet are set at nominal
values of 0.04 and 0.1, respectively. The initial plume
e×ce_(_ over background for HN():_, O:_, CH4, OH, and
H()2 were taken to be zero.
The biggest numerical costs of including chemical re-
actions within our LES axe the "added memory required
for the 3-D species fields and the added computation
LEWELLEN AND LEWELLEN
involved in advecting and diffusing them as governed
by the flow field. Accordingly, it is useful to minimize
the number of species which must be carried as dy-
namical variables. We reduce, this number by two by
idezatifying three, combinations which are.con,_rved by
equations (1)-(10) (so that their plume concentrations
above background always remain proportional to each
other): NO + NO2 - OH - H02 (essentially NOz within
the plume); H02 + OH + HONO + HNOa (which we
use after the computation to solve for HNO3); and CO
(which is conserved to a high degree of accuracy because
the CO levelseverywhere are so much greater than the
OH levelswhich erode itvia (7)).
In numerically implementing (1)-(10),one point re-
quires particular care. Some of the reactions involv-
ing OH and HO.2 (equations (4)-(6)) proceed on a very.
short timescale within the core of the wake plume where
the NO_ concentrations are high, shorter than the time
step required to accurately follow the flow dynamics.
We cannot simply use equilibrium values for OH and
H02 because the timescale for the relevant reactions
does not remain small (compared to the time step ap-
propriate for the flow dynamics) within the edges of
the plume. Instead, we update the OIt and HO2 chem-
istry semi-implicitly. In short domain tests we have con-
firmed that the simulated OIt and [IO2 concentrations
evolve correctly in time within the plume edges, while
giving the correct equilibrium values within the plume
core, regardless of the time step chosen. The remaining
reactions progress on timescales which are comparable
to or slower than the flow timc_cales; consequently, the
chemistry for the species other than OH and HO.2 are
updated explicitly in time.
3. Results
The chief impact of wake d)mamics on the chemistry
is through plume mixing. This reduces concentrations
of exhaust constituents, mixes fresh ambient air with
plume air, and produces tluctuations in plume distribu-
tions. It is appropriate, then, in explaining the simula-
tion results, that we begin with a summary of a typi-
ca] wake decay history m,d its etfects on passive plume
dispersal. Simple NO_ 03 chemistry is considered
next before turning to tlOr chemistry, where we find
the most interesting effects of dynamics on chemistry
illustrated by our simulations.
3.1. Review of Basic Wake Decay Mode and
Species Dispersion
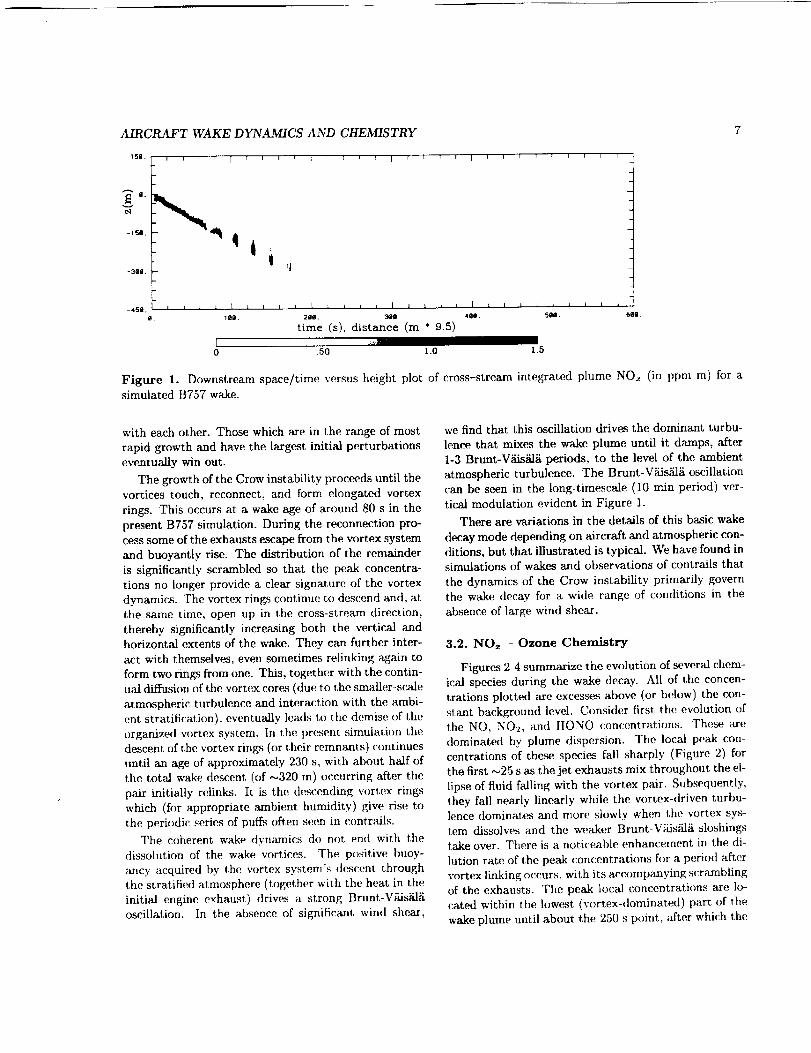
Figure 1 illustrates some of the simulated wake dy-
namics ou_ to an age of 10 rain, as visualized by the
cross-stream integrated NOz distribution in the wake
plume. Since NO_ is es_ntially a conserved species, the
distribution shown is a result of dispersion only. The
format is as described by Lewellen et al. [1998], inspired
by scanning lidar measurements of wakes. The wake is
sampled as if it were being advected at a steady rate
by a mean wind aligned with the wake. The horizontalaxis then varies over time and downstream distance so
that both the temporal evolution and spatial structure
c_a be see_n. The "drift velocity" determining the unit
of distance per unit of time has been chosen to be 9.5 m
s -I , which is in a convenient range for displaying both
the temporal and spatial structure. In the figure the
vertical distance scale has been expanded by a factor of
3 relative to the downstream distance scale for clarity.
The main features of the wake evolution can be fol-
lowed in this figure. We give only a brief summary of
the dynamics here; more detail may be found in our pre-
vious papers. The early wake dynamics are dominated
by the vortex pair which results from the lift gener-
ated by the aircraft's wings. For the first minute or so
the vortex pair descends rapidly. Initia/iy, the engine
exhaust distribution is stretched and advected by the
velocity field accompanying the vortex pair, giving a pe-
riod of very rapid dilution. Subsequently, the exhausts
axe partitioned into three, different populations: rela-
tively high concentrations in and immediately around
the vortex cores where mixing rates are low; midievel
concentrations and mixing rates within the ellipse of
fluid surrounding and descending with the vortex pair;
and lower concentrations and higher mixing rates within
a fraction of the exhausts which is not ultimately en-
trained into the falling vortex system (or becomes de-
trained from i_) and remains c|ose tt) tlight level. The
fraction of exhausts finding its way into each population
is most strongly influenced by the engine placement of
the particular aircraft, but is also influenced to a lesser
extent by the atmospheric turbulence levels, shear, and
stratification.
While the vortices descend, perturbations of the vor-
tices from the ambient atmosphere (and/or unsteady
wing loading or jet turbulence) grow via the Crow in-
stability [Crow, 1970] . The rate of growth depends
primarily on the wavelength of the perturbation, the
vortex spacing, and circulation. In a turbulent atmo-
sphere the w)rtices see a superposition of perturbations,
and the instabilities for different wavelengths compete
A_[RCRAFT WAKE DYNAMICS AND CHEMISTRY
15B. n n i I I
-,s, l
-31111.
-45o, i i J i I
O. 1El0.
IIl_]tlllllllll$l;IJ1Jl
i I I i I 1 i I L _ I i L I I i I I i I i _ i
2an. _, 4.. so°.time (s), distance (m * 9.5)
[ ,;_
0 5O 1.0 1.5
I
6QB.
Figttre 1. Downstream space/time versus height plot of cross-stream integrated plume NO= (in ppm m) for asimulated B757 wake.
with each other. Those which are in the range of most
rapid growth and have the largest initial perturbationseventually win out.
The growth of the Crow instability proceeds until the
vortices touch, reconnect, and form elongated vortex
rings. This occurs at a wake age of around 80 s in the
present B757 simulation. During the reconnection pro-
cess some of the exhausts escape from the vortex system
and buoyantly rise. The distribution of the remainder
is significantly scrambled so that the peak concentra-
tions no longer provide a clear signature of the vortex
dynamics. The vortex rings continue to descend and, at
the same time, open up in the cross-stream direction,
thereby significantly increasing both the vertical and
horizontal extents of the wake. They can further inter-
act with themselves, even sometimes relinking again to
form two rings from one. This, together with the contin-
ual diffusion of the vortex core_s (due to the smaller-sc_aJe
atmc_spheric turbulence and interaction with the ambi-
ent stratification), eventually leads to the demise of the
orgartized vortex system. In the present simulation the
descent of the vortex rings (or their remnasats) continues
until an age of approximately 230 s, with about half of
the total wake descent (of _320 m) occurring after the
pair initially relinks. It is the descending vort,cx rings
which (for appropriate ambient humidity) give rise to
the periodic series of puffs often se.e.n in contrails.
The coherent wake dynamics do not end with the
dissolution of the wake vo_ices. The positive buoy-
ancy acquired by the vortex system's d(_cent through
the stratified atmosphere (together with the heat in the
initial engine exhaust) drives a strong Brunt-V_s/il/i
oscillation. In the absence of signiticant wind shear,
we find that this oscillation drives the dominant turbu-
lence that mixes the wake. plume until it damps, after
1-3 Brunt-V_dsSdg periods, to the level of the ambient
atmospheric turbulence. The Brunt-V_iis_i oscillation
can be seen in the long-timescale (10 min period) ver-
tical modulation evident in Figure 1.
There are variations in the details of this basic wake
decay mode depending on aircraft and atmospheric con-
ditions, but that illustrated is typical. We have found in
simulations of wakes and observations of contrails that
the dynamics of the Crow instability primarily govern
the wake decay for a wide range of conditions in the
absence of large wind shear.
3.2. NO= - Ozone Chemistry
Figures 2-4 summarize the evolution of several chem-
ical species during the wake decay. All of the concen-
trations plotted are excesses above (or below) the con-
stant background level. Consider first the evolution of
the NO, N02, and ]IONO concentrations. These are
dominated by plume dispersion. The local peak con-
centrations of these species fall sharply (Figure 2) for
the first _25 s as the jet exhausts mix throughout the el-
lipse of fluid falling with the vortex pair. Subsequently,
they fall nearly linearly while the vortex-driven turbu-
lence dominates and more slowly when the vortex sys-
tem dissolves and the weaker Brunt-V'Xis:fil_i sloshings
take over. There is a notice_able enhancement in the di-
lution rate of the peak concentrations for a period after
vortex linking occurs, with its accompan_ng scrambling
of the exhausts. The peak local concentrations are lo-
cated within the lowe.st (vortex-dominated) part of the
wake plume until about the 250 s point, after which the

8
!
==
g.10-=
10 -a
[_o.o'_-\ ................ -.
t_--_.\ "--.
\__-[Ho,] /
[o_l I
.... , , , ,,L I, ,,
10' 1# 10 =
ume (.)
_.0
E
t
7,¢)
_o
4a
.5
LEWELLEN AND LEWELLEN
time (s)
Figure 2. Peak concentrations of chemical species in
the wake relative to background versus time.Figure 4. Integrated wake plume concentratiorr_ abovebackground per meter of flight path versus time.
1#
.a
_10-'
Z10 -=
10-=
.... i ........ i
_-.- - [o._J --... ---. ____ -- ,, _-_._,.__ - _.
"_ \ "_--..__" _---I-[NO ] \ "--'-
j......-.'_ ",_ _.___. _-
_....-----'____ -[HOJ _"-_T_-
-- lo.l ............. _ ..... -._"-_ '-.._..,.,_
10' 1Es 10=
Ume (,)
Figure 3. Peak down.ream averaged wake plume con-centrations relative to background versus time.
peak is located near the original flight level, within theupper wake (which, beinl_ less turbulent, dilutes at aslower rate).
In an in situ measurement, a following aircraft ob-tains not a strictly local concentration, but the averageover some finite sampling vohlme. A corresponding plot
of peak mea.sured concentration versus plume age would
look more like that in Figure 3 (corresponding to 1 s
saznples of a chase aircraft maintaining a constant .sep-aration behind the lead aircraft). The NO, NO_, and
HONO concentration histories in Figure 3 are well cor-
related with those in Figure 2, but with some noticeabledifferences• The downstream average peak concentra-
tions drop much more steeply between about 50 and100 s as the vortices are twisted by the growing Crow
instability. The peak measured concentrations remainlocated with the vortices during this period, but sub-
seque.ntly shift to the exhausts released by the vortexsystem during the linking process. These buoyantly riseto rejoin the upper wake at about 18(1 s.
The plume-integrated amounts of NO, NOu, andItONO vary. much more slowly, in response to the wake('hemistry itself (Figure 4). The plume NO is slowly con-verted to NO_ via (1); the initial ratio of [NO_]/[NO]
= 0.11 will eventually rise to approarh its background
equilibrium value for the present conditions of 0.27 asthe plume dilutes. The total HONO is slowly depletedvia photolysis, with a corresponding nearly linear risein HNOa to approximately 2.6% of the plume NO_ at900 s. The time evolution of the peak HNOa concentra-
tion (FigaEe 2) represents a competition between this
production and the plume dilution.
The OH and HO2 behavior in the plume are quali-
tatively different. As we will discuss in more detail be-low, the differences from background for these speciesaxe more nearly constant within the plume, so that the

AIRCRAFT WAKE DYNAMICS AND CHEMISTRY
integrated contribution scales approximately with the
plume volume. There is a sharp initia! increase associ-
ated with the early mixing of the exhaust jets by the
vortices, a nearly linear increase for the next 200 s as the
descending vortices and oscillating vortex rings stretch
the plume volume both vertically and horizontally, and
a slower rate of increase as the vortices dissolve and the
Brunt-Viiisii£i oscillations take over and slowly subside
(Figure 4).
The Oa evolution is more interesting, and we might
expect more subtle interplay between the chemistry and
dynamics for this species since both the NO photolysis
and NO + Oa reaction (for early plume NO concentra-
tions} occur with characteristic timescales of order 100
s, a timescale which is also of importance for the wake
dynamics as seen in Figure 1. The destruction of O:_ by
NO within the plume is larger than the production via
NO photolysis for the first _170 s (Figure 4) and re-
versed afterward so that an Oa deficit forms but is later
replaced by an O3 surplus, with the age of the crossover
point strongly influenced by the plume dynamics. The
magnitudes above or below background are all small,
however. At the given NO concentrations, equation (1)
has difficulty competing with the level of plume dilution
continually mixing in fresh O._ from the air outside the
plume, ff either the NO concentration had been an or-
der of magnitude larger, or the plume dilution rates that
much smaller, the chemistry and dilution rates would
have been comparable and the interaction between the
two would have been more complex. An even larger
change would make the chemistry fast comparcKi to the
mixing, and a much stronger anticorrelation between
NO and O:_ would have developed(as seen in the works
by Schumann [1989] and Sykes et al. [1992]).
3.3. HO_ Chemistry
The effects of the three-dimensional wake dynamics
are much more dramatic for the OH and HO2 chemistry,
and can explain a puzzle found in the in situ observa-
tions of Tan et aL [1998]. hi a series of observations
during SUCCESS. OH, HO2, and NO concentrations
were measured within the wake plume of a B757 for
wake ages from about 10 to 100 s. The measuring DC-
8 also sampled its own wake at much later ages (about
1200 s). As expected (and ms we find here), the mea-
sured Oil levels sharply rose upon entering the plume,
while the HO_ levels sharply fell (of. their Figure I).
The measured ratio of HO2/Ott concentrations as a
function of NO, however, was about 20-50 times larger
than expected (of. their Figure 2). As the anthers
argued, within the plume where the NO levels are high
the sources and sinks of OH and H02 are slow compared
to the exchange reactions between them, so that the
ratio is, to good approximation,
[HO2] _ kou+co[CO]+koH+cm[CH4]+kon+o3[Oa]
[OH] /_o,+_o[NO] + k.o_+o_[O._](11)
It is this prediction which is sometimes greatly exceeded
by the observations.
10 2 , , _,,r_
10
0
o_
_o o
10 -1
10 -2i
10 -1 10 0 10 1 10 2
iNO] (ppbv)
Figure 5. Apparent [IIO2]/[OII] ratio deduced from
simulation data using 210 m sample lengths, versus the
equilibrium expectation (thick line). Small points are
,_ampled from wake plume._ of ages 6 and 10 s; open
circles for plume at 50 s.
Figures 5 and 6 show our simulated [HO2]/[OH] ratio
for sample measurements. The format is ms in Figure. 2
of Tan el al. [1998] (except for the log scale and sorting
lhe data by wake plume age), with the data sampled
in analogous fashion. The time resolution for the mea-
surements was 1 s, which at the average flight speed
of 210 m s 1 of the measuring aircraft means an av-
erage over 210 m for each data sample. Accordingly,
the simulated measurements in Figures 5 and 6 are 210
m averages sampled along lines parallel with the flight
track at many positions within the simulated wake, at
ages as noted. As in the ob_rvations, the analogous
[1102]/[O1t] mea.surement from the simulation shows
values ranging up to 50 times greater than the local
equilibrium predictions (thick line).
In our simulated chemistry there axe two main effects

102
_0 _ , _ v rr" T r T _ _ i i T_ T r r _ * T 1 r_,
io.:_10 1 ___
10 0
10 -I
10 -I 10 0 10 1
[NO] (ppbv)
Figure 6. As m Figure 5, but for wake plume ages of
100 s (dots), and 250 s (circles).
responsible for this discrepancy, both of which critically
involve the wake dynamics. The first stems from the
difficulty with using spatially averaged samples in (11)
when there are significant species fluctuations within
the sampling volume• The second arises because the
equilibrium assumption in (11) is no longer valid around
the edges of the plume. Let us consider eac, h of these
effects, in turn, in more detail.
Figure 7 shows the evolution of the simulated OH
and HO2 concentrations on a vertical streaanwise slice
through the wake. The format is as in Figure 1 ex-
cept the fields are not cross-stream integrated but lie
on a single plane parallel to the wake, initially situated
midway between the aircraft centerline and one of the
trailing vortices. The vertical ,and downstream lengths
are plotted at the same scale in this figure. In most of
the plume volume at any given time OIt is nearly (:on-
stint, 1IO2 is very small, and (though it is not readily
apparent from the figure) equation (ll) is well satisfied.
However, it is clear that our 210 m downstream samples
will in general include a wide range o[" plume conditions,
sometimes both high plume concentrations and air out-
side of the plume. This sampling effect influences the
measured HO2 in the plume more than the measured
OH, and the ratio still more because OH and HO: are
strongly anticorrelated. This can be seen as follows.
Within the plume, where NO is large and the OH HO.2
LEWELLEN AND LEWELLEN
exchange reactions are fast, the dominant source of OH
and H02 is HONO photolysis, and their concentrations
are well represented by the equilibrium values:
[Ott] = JHoNo [HONO] (12)_.+No[NO] + ko.+No_[:NO_]'
[HO2] _ (Ott'l koa+co[CO] (13)L----, }_HO,+NO [NO],
where the lastequation followsfrom keeping the domi-
nant terms in (11). The HONO, NO, and NO2 concen-
trations vary strongly within the plume, but thisis due
mostly to dilution,which acts on each of these species
in essentially the same way. The ratios of these species
(along with OH via (12)) then vary little within the
plume and relatively slowly in time. In contrast, HO2
in the plume varies approximately as [OH]/[NO] since
CO is approximately consl:ant (there is a plume contri-
bution to CO but it is generally well below the back-
ground contribution except for the peak values at the
earliest times in our simulation, when they are com-
parable). In the plume, then, we have approximately
[I-IO2]/[OH] ,_ 1/[NO] (which is why the prediction from
(11) gives a nearly linear curve on the log-log plots of
Figures 5 and 6). The averaging from the finite sam-
ple size affects the measurements on the two axes in
Figures 5 and 6 very differently. The correlation of the
avezages (1/[NO]) and ([NO]) differs greatly from the
correlation of point samples of 1/[NO] and [NO] be-
cause of the nonlinearity of the function being averaged.
When averaging over sample volumes containing large
fluctuations of the NO field, I/([NO]) and <I/[NO]) are
clearly significantly different functions, the latter be-
ing disproportionally enhanced relative to the former
by the contribution of regions with low NO. Moreover,
if ,some air outside of the plume (where (12) and (13)
do not hold) is included within the sampling volume,
then ([HO_])//[OIt]) will be further enhanced because
[HO_]/[OH] in the b_u:kground is so large (_35). It is
for these reasons that this sampling effect leazJs to an
increase in the measured ratio.
The effects of averaging strongly fluctuating concen-
trations over finite volumes will be reduced as the sizes
of the sampling volumes are reduced, and removed en-
tirely for point samples. Figures 8 and 9 are the same as
Figures 5 and 6 but with the data now sampled strictly
locally. This measurement is in much better agreement
with the equilibrium predictions, showing how much the
spatial averaging skewed the previous results. There
are still significant difference, however, due to the in-
'adequacy of the equilibrium approximations in large
regions around the phmm edges (as can be seen from

AIRCRAFT WAKE DYNAMICS AND CHEMISTRY 11
_00.
0.
N
-100.
-200.
I ] I I F i i i I
3 _ 0 I
400
0.
_ _ b
k
i r I i IF i I
20@.
l I
0
200
300
-400
L-
__ i I J I i
@ 50.
(I
I . J I J L i L t
Ig0 15@ 200.
O0 1.0 2.0 30 4.0 50
Figure 7. Concentration fields relative to background on a downstream space/time versus height slice for the
simulated B757 wake: (a) OH (in ppt) and (b) ItO_ (in -5 ppt units).
the regions of enhanced OH in Figure 7). The mixing
into the plume of background HO._ can be an important
source, via reaction (6), of OH in the plume (in addition
to HONO photolysis as assumed in (12)). Here as well,
where NO is lower, the exchange reactions between OH
and HO2 are not necessarily fast compared to the dy-
namics. Again this effect leads to larger [HO_]/[OH]
ratio at a given NO level than predicted in equilibrium,
because reaction (6) converting HO.., to OH (pushing
them to their equilibrium levels) is slowed relative to
the dynamics mLxing HO_ into the region.
The nonequilibrium effect is largest for the young
plume where the vortex-driven mixing is most vigorous,
and becomes steadily less important in the aging plume
as the turbulence levels fall. In contrast, the effect from
sampling finite wfiumes involves ttuctuations on differ-
ent scales at different times during the evolution, and
remains important out to later time_. At early times,
which tend to cover larger values of NO. the sharp edges
of the engine exhaust and its instabilities contribute
most to the effect, with fluctuations on scales of order
10 m or less. Subsequently, the engine exhausts get
smoothed out somewhat by diffusion as they are more
completely rolled into the vortex pair. The dominant
downstream species fluctuations here are of intermedi-
ate scale arising from small axial pressure variations
within the vortex cores (due to ambient turbulence).
These fluctuations can be large for larger ambient tur-
bulence levels (sometimes misreprc.sented as being due
1.o vortex "breakdown" or "bursting") but are modest
here. We see. reduced sampling effects in Figure 5 for
the wake age of 50 s. From about 60 s and later, the dis-
tribution is most strongly affected by the growth of the
Crow instability of the vortex pair. The sampling effect
in Figure 6 from these fluctuations (and presumably in
the SUCCESS observations) is large because the sample
length is approximately equal to the most favored wave-
length for the Crow instability for this aircraft. At later
times these induced fluctuations are slowly eroded down
to a level consistent with the ambient turbulence as the
wake slowly dilutes. By reducing the sampling size well
below the Crow wavelength, the sampling effects could

10 1
O
6_
_-_oo
10 -1
r
r
lO-2 L .h,lll iJ .,JJ .
10 -1 10 0 10 1 10 2
NO] (ppbv)
Figure 8..ks in Figure 5, but using local point samples.
10 2 , t , P I , _ . T r T r t .. F r , , I r r: I
10 1
10 0
10 -1
10 -1 10 0
NO I [ppbv)
lO I
Figure 9. As in Figure 6, but using local point samples.
be significantly reduced for all but the earliest wake
times.
It should be noted that we are almost certainly un-
derestimating the effects of sampling over fluctuations
in the very young wake versus those encountered in
LEWELLEN AND LEWELLEN
the SUCCESS measurements, for at least two reasons.
First, we do not begin the simulation of the exhaust
jets at their earliest and most intense phase, and so
we underpredict the fluctuations from jet turbulence.
Second, and probably more importantly, we. have per-
fectly aligned our sampling lines along the initial wake
axis, while the DC-8 sampling behind the B757 during
SUCCESS would have had difficulty remaining centered
within the small cross section of the young wake plume,
especially given the large wake turbulence present there.
Finally, one apparent difference between Figure 2 of
Tan et al. [1998] and our results deserves comment. As
we have noted, when our measured [HO2]/[OH] ratio
as a fimction of NO differs appreciably from the pre-
diction of (ll), it exceeds it (as is appropriate for the
explanations of this effect given above). This is true for
the bulk of the data points given by Tan et al. [1998]
a.s well, but they also find a small fraction scattered
below the expected values. These may just be stray
data points (they quote a l-a precision for their data
of 0.23 pptv for OH and 0.75 pptv for He2), indicate
fluctuations not considered here in background levels of
some species, or be due to the fact that the NO and
He= probes on the DC-8 were not colocated but on the
starboard and bottom of the fl]selage, respe(:tively.
4. Concluding Remarks
This LES of the near wake of a B757 provides a fine-
grained chemical-dynamical representation of simplified
N()_ -HO_ chemistry in the ezLrly wake. It demonstrates
the feasibility of such simulations to investigate the po-
tential impact of turbulent dynamic interactions with
the wake chemical kinetics. By sampling the simulated
data in a manner similar to that of in situ aircraft mea-
surements, it is possible to interpret results obtained at
the typical sampling rate of 1 Hz. In particular, com-
parison of these simulation results with actual in situ
flight measurements of OIt and ItO._ performed under
cruise conditions in the upper troposphere during SUC-
CESS in May 1996 provides a likely explanation for the
apparent large discrepancy between measurement and
theoretical expectation found by Tan et al. [1998]. The
discrepancy appears to be due to two effects of the wake
dynasnics on the measured chemistry: (1) the effect of
averaging over species fluctuations on a scale smaller
than can be resolved by the sampling rate, and (2) large
turbulent mixing rates near the plume edges dramati-
cally modifying the local equilibrium chemistry predic-
tions. Both arc accentuated by the dramatic difference
in He2 concentration inside and outside of the wake

AIRCRAFT WAKE DYNAMICS AND CHEMISTRY
plume.
We have discussed the fluctuation problem princi-
paUy from the point of view of a sampling size diffi-
culty, but it is clear that any wake model has the same
problem in averaging over large fluctuations within its
representative volume elements. For a plume model
with volume elements consistent with the data sam-
ples, we have confirmed the speculation of Tan et al.
[1998, p. 1723] that "turbulent fluctuations in the
plume may significantly reduce reaction rates between
species which are anti-correlated in distribution, such
as between NO and HO2." Even in our unsteady. 3-D,
high-resolution model, there are probably some volume
elements around the edges of the wake where fluctua-
tions with significant anticorrelation between NO and
ttO2 occur. To correct this, it would be necessary to use
even higher resolution, or to introduce the major effect
of the fluctuations into a subgrid model of the chemical
kinetics. Since the reaction in (6) depends on the aver-
age of the product of NO and HO2 rather than the prod-
uct of their averages, the effective reaction rate will be
increased (reduced) by fluctuations when they are corre-
lated (anticorrelated). Progress has been made toward
generating models which include the influence of the
unresolved covarianee of the reactants within a model
[e.g., Sykes et al., 1994], but a robust model for gen-
eral conditions remains a challenging problem. In our
high-resolution model we believe neglecting such effects
only influences the sharpness of the wake edges, but in
2-D models where all of the downstream 3-D structure
is averaged out in the model wake representation [e.g.,
Anderson et al., 1996], the uncertainty expected should
be similar to that found in the in situ measurements.
In contrast to the strong influence the fluctuations
have on HOz chemistry, the influence on the NOz - Oa
chemistry is relatively benign. For the conditions of this
simulation, dilution of the wake tends to be faster than
the rate at which NO within the wake destroys the O3,
so a relatively small O:_ deficit is generated within the
wake. It is not sufficiently strong to yield a strong anti-
c(_rrelation between NO and Oa within the fluctuations.
Thus the basic effect of the turbulence is straightfor-
ward dilution of the wake which can be captured by
relatively simple Gaussian plume models of the. wake
[e.g., Karol et al., 1997]. This would not be tree if the
emission of the NO_ was an order of magnitude larger
or the dilution rate an order of magnitude smaller.
The simulation presented w,_s perforrned on a desk-
top workstation (a 566 MHz Alpha CPU with 512 Mb
of ram) using just over 4 clays of CPU time, so it is quite
feasible to do other simulations dealing with more corn-
13
plicated chemical pathways of possible interest, and/or
early jet or late plume chemistry. The transition regime
between plume models and 3-D global models presents
a particular challenge given the potential importance of
turbulent mixing and large species fluctuations occur-
ring on scales below typical grid lengths, of order 100
kin, which can be employed. We would not recommend
attempting such a simulation at resolutions capable of
resolving individual plumes while maintaining around
100 possible chemical interactions, but it should be pos-
sible to include the chemical kinetics associated with
10-20 critical species to estimate the uncertainty asso-
ciated with neglecting all of the subgrid fluctuations.
Acknowledgment. This work was supported by NASA
grant NAG-I-2096 as part of NASA's Atmospheric Effects
of Aviation Project, with Bill Grose and Bruce Anderson &q
technical monitors.
References
Anderson, M. R., R. C. Miake-Lye, R. C. Brown, and C. E.
Kolb, Calculation of exhaust plume structure and emis-sions of the ER2 aircraft in the stratosphere, J. Geophys.
Res., 101, 4025-4032, 1996.
Brown, S. B., R. Talukdar, and A. R. Ravishankar, Rateconstants for the OH + NO2 + M _ HNOa + M under
atmospheric conditions. Chem. Phys. Left., _99, 277--284,
1999.
Campos, T., et al., Measurement of NO and NO_ emission
indices during SUCCESS, Geophys. Res. Left., 25, 1713-
1716, 1998.
Chlond, A., Large-eddy simulations of contrails, J. Atmos.
Sci., 55, 796-819, 1998.Crow, S. C., Stability theory for a pair of trailing vortices,
AIAA J., 8, 2172--2179, 1970.
DeMore, W. B., S. P. Sander. C. J. Itoward, A. R. Rav-
ishankara, D. M. Golden, C. E. Kolb, R. F. It;unpson,
M. J. Kurylo, and M..I. Molina (Eds.), Chemical kinetic_
and photochemical data for use in stratospheric model-
ing, JPL Pub. 97-_, 1997.
Farnelt, L., Solution of Poisson equations on a nonuniform
grid, J. Comput. Phys., 35, 4(}8-425, 1980.
Friedl, R. R,. E., Atmospheric effects of subsonic aircraft:
Interim ;L_ement report of the advanced sub,talc tech-
nology program, NASA Ref. Pub. 1._00, 1997.
Gerz, T., _md T. Ehret, Wake dyn_maics and e.xhaust dis-
tribution behind cruising aircraft, AGARD Syrup. Proc..
CP-584, 35.1-35.12, 1996.
Gerz, T., T. Diirbcck, and P. Konopka, Transport and ef-fective diffusion of aircraft emissions, J. Geophys. Res..
103, 25,905-95,913, 1998.
Gierens, K. M., Numerical simulations of persistent con-
trails, J. Atmos. Sci., 52, 3333 3348, 1996.
14 LEWELLEN AND LEWELLEN
Gierens, K. M., and E. Jensen, A numerical study of the
contrail-to-cirrus transition, Geophys. Res. Lett., 25,
4341-4344_ 1999.
Jaegle, L., D. Jacob, W. Brune, D. Tan, I. C. Faloona,
A. Weinheimer, B. Ridley, T. Campos, and G. Sachse,
Sources of HO_ and production of ozone in the upper
troposphere over the United States, Geophys. Re_. Lelt.,
_5, 1709-1712_ 1998.
Kfixcher, B., R. Busch, A. Petzold, F. SchrSder, U. Schu-
mann, and E. Jeasen, Physicochemistry of aircraft-
generated liquid aerosols, soot, and ice particles, 2, Com-
parison with observations and sensitivity studies, J. Geo-
phys. Res., 103, 17,129-17,147, 1998.
Karol, I. L., Y. E. Ozolin, and E. V. Rozanov, Box and
Gau_ian plume models of the exhaust composition evo-
lution of the subsonic transport aircraft in and out of the
flight corridor, Ann. Ceophys., 15, 88-96, 1997.
Lewellen, D. C., and W. S. Lewellen, Large-eddy simulations
of the vortex-pair breakup in aircraft wakes, AIAA J., 3_,
2337-23,15, 1996.
Lewellen, D. C., and W. S. Lewellen, The effects of aircraft
wake dynamics on contrail development, J. Atmos. Sci.,
58, 390-406, 2001.
Lewellen, D. C., W. S. Lewellen, L. R. Poole, R. J. De-
Coursey, G. M. Hansen, and C. A. Hostetler, Large-
eddy simulations and lidar measurements of vortex-pair
breakup in aircraft wakes, AIAA J., ,?6, 1439-1445, 1998.
Lewellen, D. C., W. S. Lewellen, and J. Xia, The influence
of a local swirl ratio on tornado intensification near the
surface, J. Atmos. Sci., 57, 527 544, 2000.
Menon, S., and J. Wu, Effects of micro- and macroseale tur-
bulent mixing on the chemical processes in engine exhaust
plumes. J. Appl. Meteorol., 37, 639-654, 1998.
Miake-Lye, R. C., M. Mart.inez-Sanchez, R. C. Brown, and
C. E. Kolb, Plume and wake dynamites, mixing and
chemistry behind a high speed civil transport aircraft,
J. Aircr., 30,467_179, 1993.
Penner. J. E., D. H. Lister, D. J. Griggs, D. J Dokken,
and M. McFarland (Eds.), Aviation and the Global At-
mosphe_, Cambridge Univ. Press, New York. 1999.
Qnackenbush, T. It., M. E. Teske, and A. J. Bilanin, Dy-
namics of exhanst plume entrainment in aircxaft vortex
wakes, AIAA Pap. 96-07_(7. Am. Inst. of Aeronaut. a_ld
Astronaut., New York, 1996.
Schumann, U., Large-eddy simulation of turbulent diffusion
of chemical reactions in the convective boundary layer,
Atmos. Environ., 23, 1713-1727, 1989.
Schumann, U., The impact of nitrogen oxides emi._sions from
aircraft upon the atmosphere at flight altitudes: Results
from the AERONOX project, Atmos. Environ.. 31, 1723-
1734, 1997.
Schumann, U., Research on the (rffect of aircraft and space-
craft upon the atmosphere, Atrnos. Envaron., 31, 3065-
3066, 1998.
Singh, II. B., A M. Thompson, and 1t. Schlager, SONEX
airborne mission Prod coordinated POLINAT-2 activity:
Overview and accomplishments, Ge.ophys. R_.s. Left., 26,
3053 3056, 1999.
Spalart, P. R., Airplane trailing vortices, Annu. Rev. Fluid
Mech., 30, 107-138, 1998.
Spalart, P. R., and A. A. Wray, Initiation of the Crow insta-
bility by atmospheric turbulence, AGARD Syrup. Proc.,
GP-58_, 18.1-18.8, 1996.
Sussmann, R., and K. M. Gierens, Lidar and numerical stud-
ies on the different evolution of vortex pair and secondary
wake in young contrails, J. Geophys. Res., 10_, 2131-
2142, 1999.
Sussmann, R., and K. M. Gierens, Differences in early con-
trail evolution of two-engine versus four-engine aircraft:
Lidar measurements and numerical simulations, J. Geo-
phys. Res., 106, 4899-4911, 2001.
Sykes, R. 1., and D. S. Henn, Large-eddy simulation of tur-
bulent sheared convection, J. Atmos. Sci., _6, 1106-1118,
1989.
Sykes, R. I., D. S. Henn, S. F. Parker, and W. S. Lewellen,
Large-eddy simulation of a turbulent reacting plume, At-
runs. Environ., 26A, 2565-2574, 1992.
Sykes, R. I., S. F. Parker, 13. S. Henn, and W. S. Lewelleu,
Turbulent mixing with chemical reaction in the planetary
boundary layer, J. Appl. Meteorol., 33, 825-834, 1994.
Tan, D., I. Faloona, W. /3rune, A. _,Veinheimer, T. Campos,
B. Riley, S. Vay, J. Collins, Jr., and G. Sachse, in situ
measurements of HO_ in aircraft exhaust plumes and con-
trails during SUCCESS, Geophys. Res. Lett., 25, 1721-
1724, 1998.
Toon, O. B., and R. C. Miake-Lye, Subsonic Aircraft: Con-
trail and Cloud Effects Special Study (SUCCESS), Geo-
phys. Res. Left., 25, 1109-1112, 1998.
Vay, S,, et al., DC-8-based observations of aircraft CO,
CH4, N20, and }t20(g) emission indices during SUC-
CESS, Geophys. Res. Left., 25, 1717-1720, 1998.
D. C. Lewellen and W. S. Lewellen, Department of
Mechanical and Aerospace Engineering, West Virginia
University, P.O. Box 6106, Morgantown, WV 26506-
6106, USA. ([email protected]; [email protected])
R.eceived Febnlary 21, 2001; revised .lune 28, 2001: accepted
.luly 4, 2001.
This preprint was prepared with AGU's I_TEX macros v5.01,
with the extension package 'AGU _+' by _'. W. l)aly, version 1.6b
from 1999/08/19.


![Wake Under Siege ]...Wake Under Siege ] ,Scarcely had tile VMF-211 planes re- ... the roar of the surf. That evening IJieutenants Kinney and ... aircraft was patched up, personnel](https://img.pdfslide.us/doc/110x75/5eaf5d5cd69f08215337cb17/wake-under-siege-wake-under-siege-scarcely-had-tile-vmf-211-planes-re-.jpg)