Embed Size (px)
Citation preview
APPENDIX B
Community Fisheries Engagement Indices throughout the BSAI Crab Rationalization Program
Prepared by:
Stephen Kasperski Zachary Koehn
Amber Himes-Cornell
August 2016
Appendix B – Community Indices Page 1 10yr Review, BSAI CR Program
Community Fisheries Engagement Indices throughout the BSAI Crab Rationalization Program
By Stephen Kasperski1, Zachary Koehn2,3, and Amber Himes-Cornell4
Introduction
The Alaska Fisheries Science Center’s Economic and Social Sciences Research Program (ESSRP) has developed a set of fisheries engagement indices using pre-existing data for a majority of Alaska communities. These indices allow policymakers to examine the degree to which Alaska communities are involved in commercial fisheries (Kasperski and Himes-Cornell, 2014; Himes-Cornell and Kasperski, 2016). The analysis presented here examines community involvement in a specific catch share fishery in the North Pacific: the Bering Sea and Aleutian Islands (BSAI) Crab Rationalization fisheries. All Crab Rationalization fisheries are aggregated together in this analysis and henceforth will be referred to as the CR crab fisheries. To conduct this analysis, ESSRP gathered information on communities throughout the United States that participate in the fishery either through processing crab locally or owning vessels that harvest CR crab. The purpose of this analysis is to explore the degree to which communities are engaged in the CR crab fisheries and how their engagement has changed over time. Two basic types of crab fisheries involvement are considered, commercial processing and commercial harvesting, and numerical indices of engagement are created for each of them.
Processing engagement represents the scale of the processing industry in the community and represents landings being made in the community. Harvesting engagement represents the communities where the revenue that harvesters are earning from CR crab fishing is likely being spent and is expected to have some economic impacts. Harvesting engagement includes any CR crab activities undertaken by vessels owned by community residents, regardless of landing port. By separating commercial processing from commercial harvesting, the indices presented here highlight the importance for communities that may not have a large amount of crab landings or processing in their community, but have a large number of fishermen and/or vessel owners that participate in the CR crab fisheries that are based in the community. These indicators give policy
1 Corresponding author. National Marine Fisheries Service, Alaska Fisheries Science Center, [email protected] 2 Pacific States Marine Fisheries Commission, under contract to National Marine Fisheries Service, Alaska Fisheries Science Center, [email protected]. 3 School of Aquatic and Fishery Sciences, University of Washington, Seattle, WA 98195-5020, USA 4 Université de Bretagne Occidentale, Brest, France. [email protected].
Appendix B – Community Indices Page 2 10yr Review, BSAI CR Program
makers and communities themselves a quantitative measure of community involvement in the CR crab fisheries which will help provide information about which communities have been most affected by the implementation of the Crab Rationalization Program.
Alternative Analyses Considered
This analysis is our best representation of community engagement in the CR crab fisheries pre- and post-rationalization. Several other models and types of analysis were carried out as part of this process but were ultimately discarded for a variety of reasons. Of particular relevance is the difference in differences approach that was brought before the SSC in April, 2015 (Card and Krueger, 1994). As can be seen from the following analysis, both harvesting and processing engagement is concentrated in a small number of communities. Assuming that these communities were the most impacted by the crab rationalization program, the small number of affected communities makes it difficult to generate adequate treatment and control groups to test whether there were significant differences in socioeconomic conditions between the two over time and whether these differences could be attributed to the BSAI Crab Rationalization Program. These difficulties were exacerbated by the substantial participation of Kodiak and Unalaska/Dutch Harbor which are difficult communities to find similar control communities for in Alaska as well as for communities like Seattle that are highly engaged in fishing but the fishing industry does not constitute a majority of the local economy and changes in the fishing industry are likely to be difficult to disentangle from broader economic trends. If these issues could be overcome, there is still some potential for this approach, but at this time we did not feel that it would be appropriate to include this type of approach as part of the 10-year review of the BSAI Crab Rationalization Program.
Methods
The ESSRP collected secondary data from state and federal sources for 212 communities throughout the U.S., including 27 from Alaska, 96 from Washington, 29 from Oregon, and 60 other communities in the U.S. These communities were aggregated into a smaller set of 32 communities used in the analysis which include all 27 communities in Alaska and then 4 regional groupings including the Seattle Metropolitan Statistical Area (Seattle MSA) which includes 45 communities, Other Washington includes 51 communities, Oregon includes 29 communities, All Other USA includes 60 communities, and the At-Sea sector which includes both catcher/processors and landings made to inshore floating processors. The At-Sea sector grouping combines the catcher/processors and inshore floating processors in this analysis because the location of landings is difficult to assign to a physical community for both groups (which is our primary focus) and is not always consistently reported for this sector over time.
Appendix B – Community Indices Page 3 10yr Review, BSAI CR Program
Communities were included in the study population if any Crab Rationalization Program crab landings were made in the community or if the owner of a vessel that fished in the CR crab fishery resides in the community for any CR crab fishing season from 1998/1999 through 2014/2015.5 The analysis uses and aggregates values for all variables across all CR crab fisheries for each community (or grouping) in a fishing season and separates variables into two categories of fisheries involvement: commercial processing and commercial harvesting. Processing engagement is represented by the amount of CR crab landings and associated revenues from landings in the community, the number of vessels delivering CR crab in the community, and the number of processors in the community processing CR crab. Harvesting engagement is represented by the CR crab landings and revenues associated with vessels owned by community residents, the number of vessels with CR crab landings owned by residents in the community, and the number of distinct vessel owners with CR crab landings in the community.
To examine the relative harvesting and processing engagement of each community, a separate principal components factor analysis (PCFA) was conducted each year for each category to determine a community’s relative engagement. There are 17 fishing seasons in the study and two PCFAs to be conducted for each fishing season (processing engagement and harvesting engagement) for a total of 34 different PCFAs conducted. PCFA is a variable reduction strategy that separates a large number of correlated variables into a set of fewer, linearly independent components. These components are used to create quantitative indices of engagement by using the regression method of summing the standardized coefficient scores multiplied by the included variables. In this case, we achieve a single factor solution for each PCFA and therefore, generate a unique processing index and harvesting index value for each community in each year.6 These indices are relative scores in that they represent each community’s engagement in the CR crab fisheries within a single fishing season relative to all other communities in that fishing season. Indices are then combined across all fishing seasons to create a time series of relative engagement in the CR crab fisheries over time. It is important to note that since these are relative indices, the large decrease in active crab vessels post-rationalization will only cause a change in the indices if one community loses a larger share of their vessels (or other CR crab activities) than another community. If the losses are proportional to the existing CR crab fishery related activities pre-rationalization, there will not be a change in the indices post-rationalization.
Results
A total of 32 communities or groupings met the criteria for inclusion in the analysis. The results of the commercial processing and commercial harvesting engagement analyses are shown in Tables 1 and 2, respectively. Each table presents the eigenvalues, factor loadings, total variance
5 The owner’s community is determined from the CFEC vessel registration in a given year. 6 Each index is normalized to be mean zero and standard deviation one for each fishing season.
Appendix B – Community Indices Page 4 10yr Review, BSAI CR Program
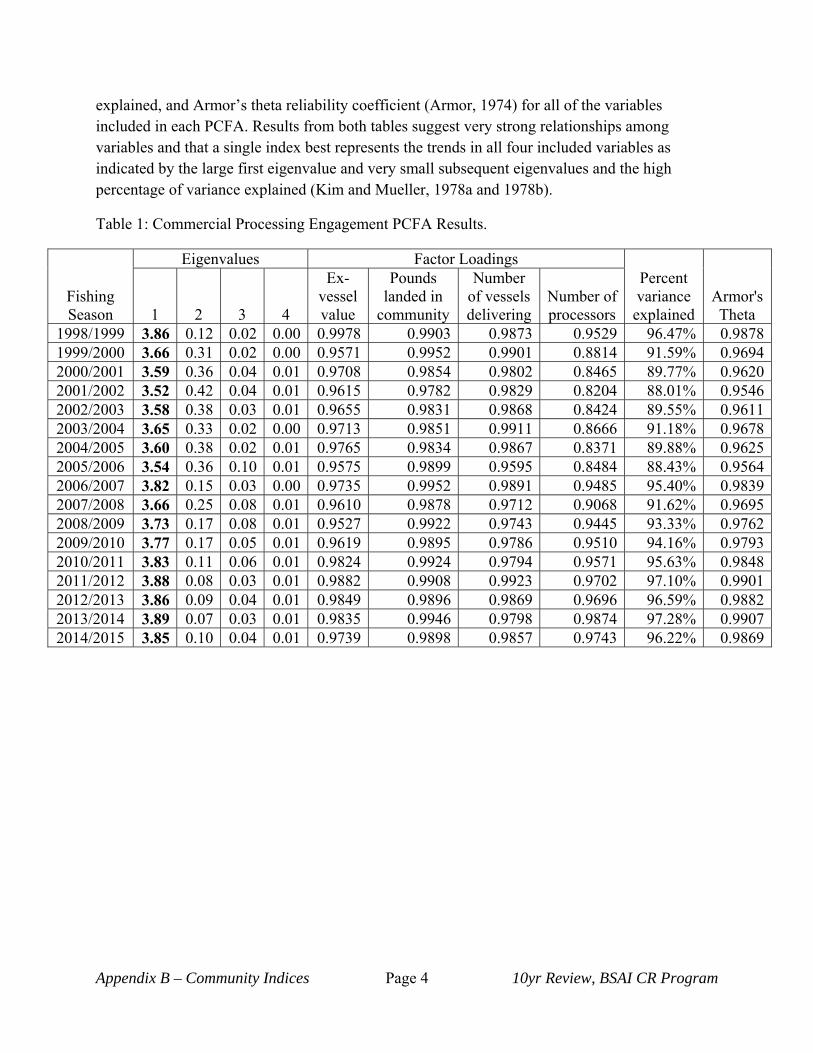
explained, and Armor’s theta reliability coefficient (Armor, 1974) for all of the variables included in each PCFA. Results from both tables suggest very strong relationships among variables and that a single index best represents the trends in all four included variables as indicated by the large first eigenvalue and very small subsequent eigenvalues and the high percentage of variance explained (Kim and Mueller, 1978a and 1978b).
Table 1: Commercial Processing Engagement PCFA Results.
Fishing Season
Eigenvalues Factor Loadings Percent variance explained
Armor's Theta 1 2 3 4
Ex-vessel value
Pounds landed in
community
Number of vessels delivering
Number of processors
1998/1999 3.86 0.12 0.02 0.00 0.9978 0.9903 0.9873 0.9529 96.47% 0.98781999/2000 3.66 0.31 0.02 0.00 0.9571 0.9952 0.9901 0.8814 91.59% 0.96942000/2001 3.59 0.36 0.04 0.01 0.9708 0.9854 0.9802 0.8465 89.77% 0.96202001/2002 3.52 0.42 0.04 0.01 0.9615 0.9782 0.9829 0.8204 88.01% 0.95462002/2003 3.58 0.38 0.03 0.01 0.9655 0.9831 0.9868 0.8424 89.55% 0.96112003/2004 3.65 0.33 0.02 0.00 0.9713 0.9851 0.9911 0.8666 91.18% 0.96782004/2005 3.60 0.38 0.02 0.01 0.9765 0.9834 0.9867 0.8371 89.88% 0.96252005/2006 3.54 0.36 0.10 0.01 0.9575 0.9899 0.9595 0.8484 88.43% 0.95642006/2007 3.82 0.15 0.03 0.00 0.9735 0.9952 0.9891 0.9485 95.40% 0.98392007/2008 3.66 0.25 0.08 0.01 0.9610 0.9878 0.9712 0.9068 91.62% 0.96952008/2009 3.73 0.17 0.08 0.01 0.9527 0.9922 0.9743 0.9445 93.33% 0.97622009/2010 3.77 0.17 0.05 0.01 0.9619 0.9895 0.9786 0.9510 94.16% 0.97932010/2011 3.83 0.11 0.06 0.01 0.9824 0.9924 0.9794 0.9571 95.63% 0.98482011/2012 3.88 0.08 0.03 0.01 0.9882 0.9908 0.9923 0.9702 97.10% 0.99012012/2013 3.86 0.09 0.04 0.01 0.9849 0.9896 0.9869 0.9696 96.59% 0.98822013/2014 3.89 0.07 0.03 0.01 0.9835 0.9946 0.9798 0.9874 97.28% 0.99072014/2015 3.85 0.10 0.04 0.01 0.9739 0.9898 0.9857 0.9743 96.22% 0.9869
Appendix B – Community Indices Page 5 10yr Review, BSAI CR Program
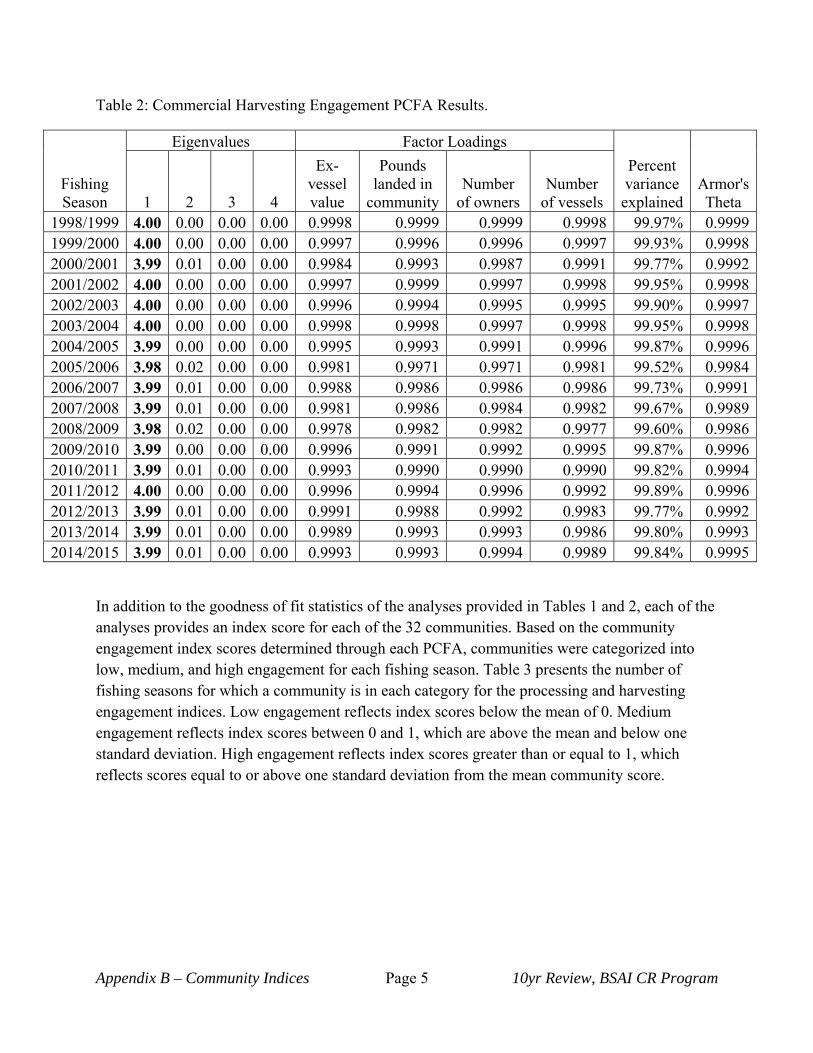
Table 2: Commercial Harvesting Engagement PCFA Results.
Fishing Season
Eigenvalues Factor Loadings
Percent variance explained
Armor's Theta 1 2 3 4
Ex-vessel value
Pounds landed in
communityNumber
of owners Number
of vessels 1998/1999 4.00 0.00 0.00 0.00 0.9998 0.9999 0.9999 0.9998 99.97% 0.99991999/2000 4.00 0.00 0.00 0.00 0.9997 0.9996 0.9996 0.9997 99.93% 0.99982000/2001 3.99 0.01 0.00 0.00 0.9984 0.9993 0.9987 0.9991 99.77% 0.99922001/2002 4.00 0.00 0.00 0.00 0.9997 0.9999 0.9997 0.9998 99.95% 0.99982002/2003 4.00 0.00 0.00 0.00 0.9996 0.9994 0.9995 0.9995 99.90% 0.99972003/2004 4.00 0.00 0.00 0.00 0.9998 0.9998 0.9997 0.9998 99.95% 0.99982004/2005 3.99 0.00 0.00 0.00 0.9995 0.9993 0.9991 0.9996 99.87% 0.99962005/2006 3.98 0.02 0.00 0.00 0.9981 0.9971 0.9971 0.9981 99.52% 0.99842006/2007 3.99 0.01 0.00 0.00 0.9988 0.9986 0.9986 0.9986 99.73% 0.99912007/2008 3.99 0.01 0.00 0.00 0.9981 0.9986 0.9984 0.9982 99.67% 0.99892008/2009 3.98 0.02 0.00 0.00 0.9978 0.9982 0.9982 0.9977 99.60% 0.99862009/2010 3.99 0.00 0.00 0.00 0.9996 0.9991 0.9992 0.9995 99.87% 0.99962010/2011 3.99 0.01 0.00 0.00 0.9993 0.9990 0.9990 0.9990 99.82% 0.99942011/2012 4.00 0.00 0.00 0.00 0.9996 0.9994 0.9996 0.9992 99.89% 0.99962012/2013 3.99 0.01 0.00 0.00 0.9991 0.9988 0.9992 0.9983 99.77% 0.99922013/2014 3.99 0.01 0.00 0.00 0.9989 0.9993 0.9993 0.9986 99.80% 0.99932014/2015 3.99 0.01 0.00 0.00 0.9993 0.9993 0.9994 0.9989 99.84% 0.9995
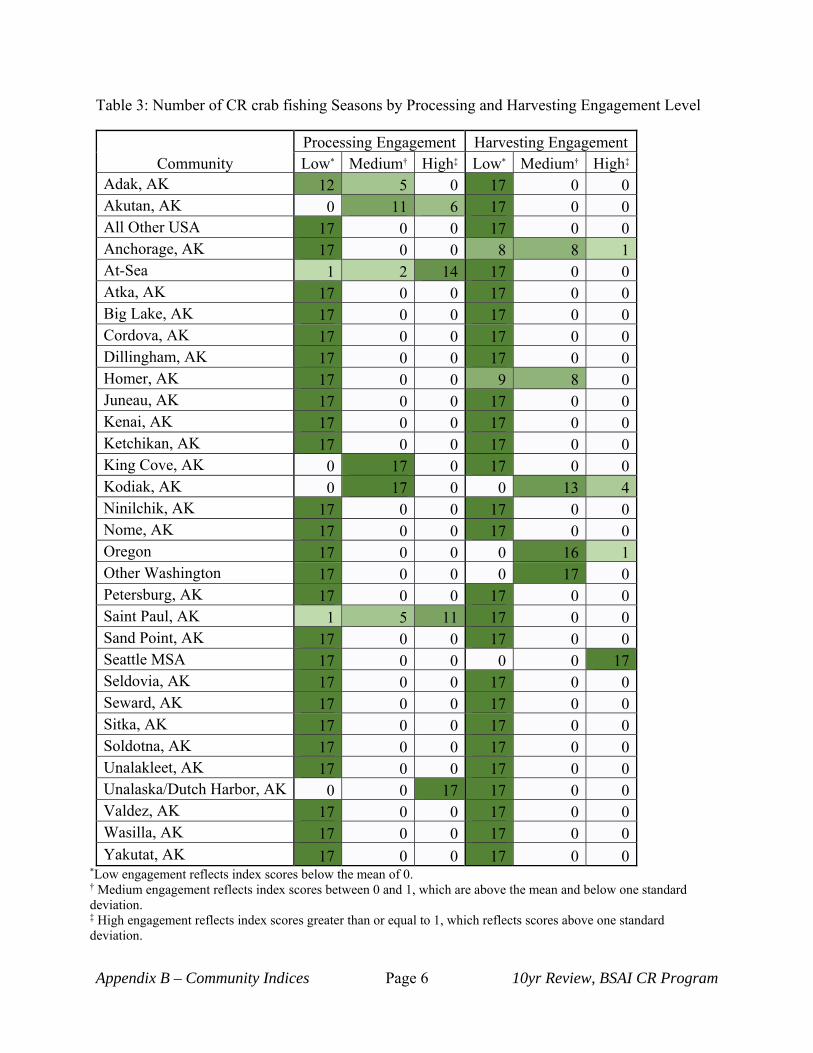
In addition to the goodness of fit statistics of the analyses provided in Tables 1 and 2, each of the analyses provides an index score for each of the 32 communities. Based on the community engagement index scores determined through each PCFA, communities were categorized into low, medium, and high engagement for each fishing season. Table 3 presents the number of fishing seasons for which a community is in each category for the processing and harvesting engagement indices. Low engagement reflects index scores below the mean of 0. Medium engagement reflects index scores between 0 and 1, which are above the mean and below one standard deviation. High engagement reflects index scores greater than or equal to 1, which reflects scores equal to or above one standard deviation from the mean community score.
Appendix B – Community Indices Page 6 10yr Review, BSAI CR Program
Table 3: Number of CR crab fishing Seasons by Processing and Harvesting Engagement Level
Community Processing Engagement Harvesting Engagement Low* Medium† High‡ Low* Medium† High‡
Adak, AK 12 5 0 17 0 0 Akutan, AK 0 11 6 17 0 0 All Other USA 17 0 0 17 0 0 Anchorage, AK 17 0 0 8 8 1 At-Sea 1 2 14 17 0 0 Atka, AK 17 0 0 17 0 0 Big Lake, AK 17 0 0 17 0 0 Cordova, AK 17 0 0 17 0 0 Dillingham, AK 17 0 0 17 0 0 Homer, AK 17 0 0 9 8 0 Juneau, AK 17 0 0 17 0 0 Kenai, AK 17 0 0 17 0 0 Ketchikan, AK 17 0 0 17 0 0 King Cove, AK 0 17 0 17 0 0 Kodiak, AK 0 17 0 0 13 4 Ninilchik, AK 17 0 0 17 0 0 Nome, AK 17 0 0 17 0 0 Oregon 17 0 0 0 16 1 Other Washington 17 0 0 0 17 0 Petersburg, AK 17 0 0 17 0 0 Saint Paul, AK 1 5 11 17 0 0 Sand Point, AK 17 0 0 17 0 0 Seattle MSA 17 0 0 0 0 17 Seldovia, AK 17 0 0 17 0 0 Seward, AK 17 0 0 17 0 0 Sitka, AK 17 0 0 17 0 0 Soldotna, AK 17 0 0 17 0 0 Unalakleet, AK 17 0 0 17 0 0 Unalaska/Dutch Harbor, AK 0 0 17 17 0 0 Valdez, AK 17 0 0 17 0 0 Wasilla, AK 17 0 0 17 0 0 Yakutat, AK 17 0 0 17 0 0
*Low engagement reflects index scores below the mean of 0. † Medium engagement reflects index scores between 0 and 1, which are above the mean and below one standard deviation. ‡ High engagement reflects index scores greater than or equal to 1, which reflects scores above one standard deviation.
Appendix B – Community Indices Page 7 10yr Review, BSAI CR Program
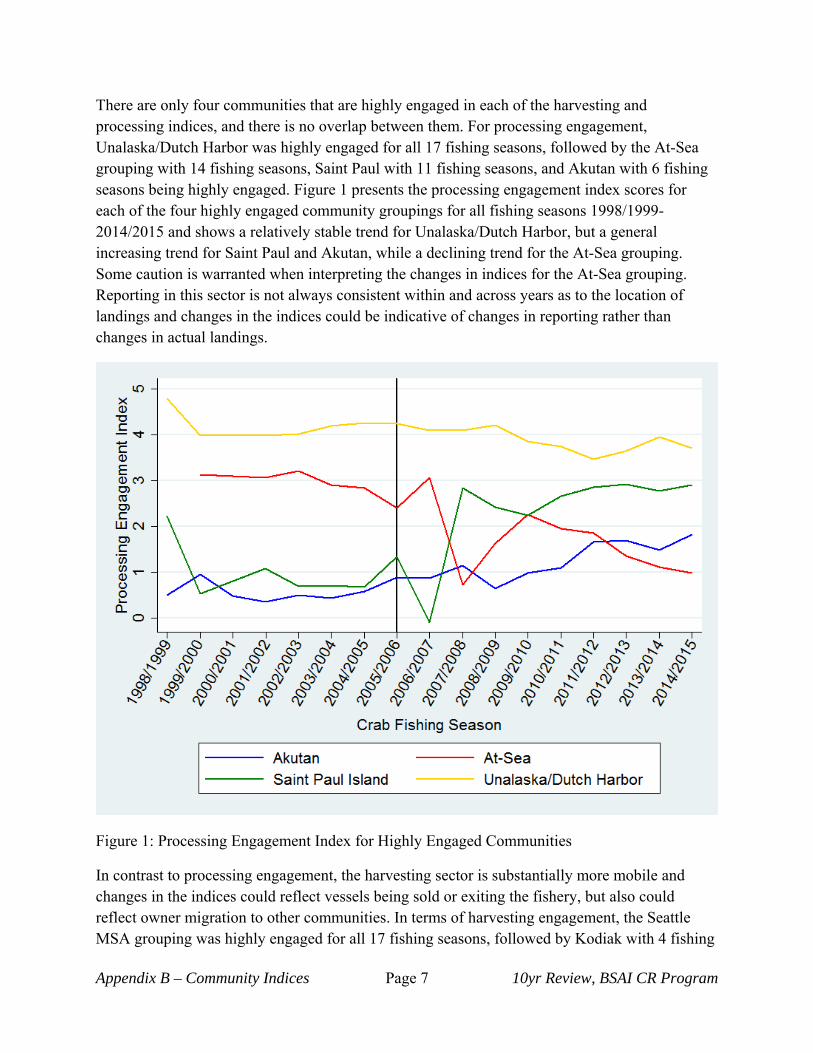
There are only four communities that are highly engaged in each of the harvesting and processing indices, and there is no overlap between them. For processing engagement, Unalaska/Dutch Harbor was highly engaged for all 17 fishing seasons, followed by the At-Sea grouping with 14 fishing seasons, Saint Paul with 11 fishing seasons, and Akutan with 6 fishing seasons being highly engaged. Figure 1 presents the processing engagement index scores for each of the four highly engaged community groupings for all fishing seasons 1998/1999-2014/2015 and shows a relatively stable trend for Unalaska/Dutch Harbor, but a general increasing trend for Saint Paul and Akutan, while a declining trend for the At-Sea grouping. Some caution is warranted when interpreting the changes in indices for the At-Sea grouping. Reporting in this sector is not always consistent within and across years as to the location of landings and changes in the indices could be indicative of changes in reporting rather than changes in actual landings.
Figure 1: Processing Engagement Index for Highly Engaged Communities
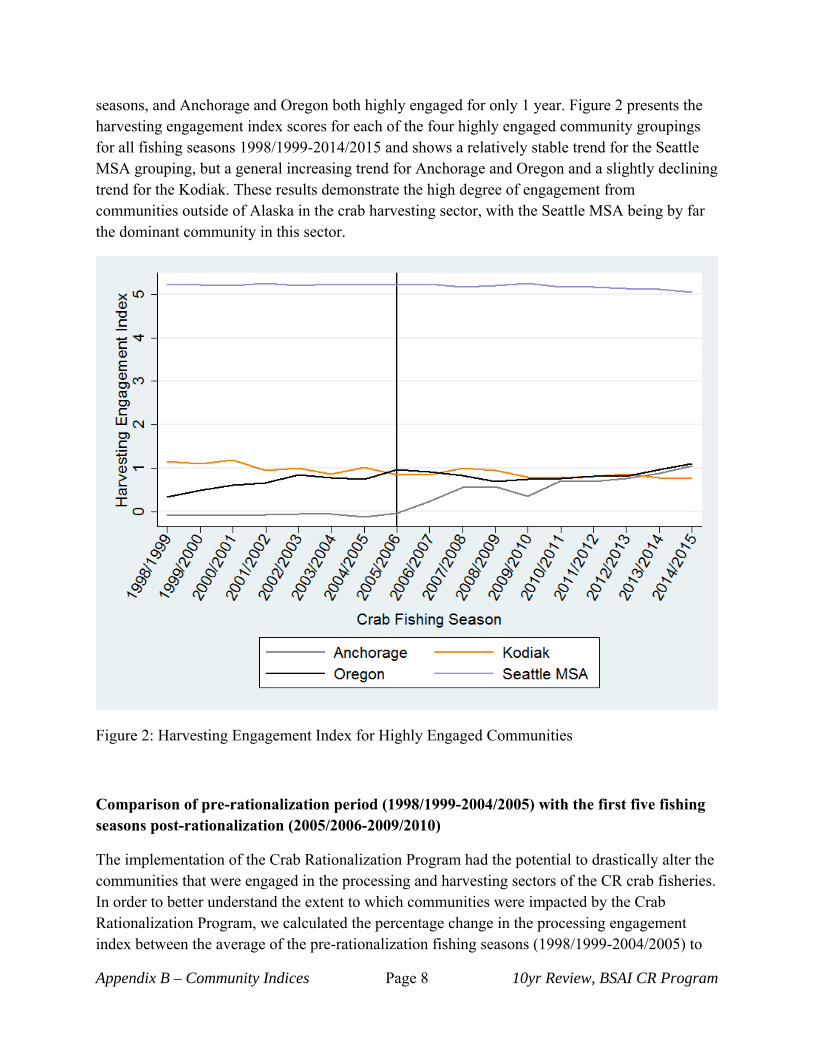
In contrast to processing engagement, the harvesting sector is substantially more mobile and changes in the indices could reflect vessels being sold or exiting the fishery, but also could reflect owner migration to other communities. In terms of harvesting engagement, the Seattle MSA grouping was highly engaged for all 17 fishing seasons, followed by Kodiak with 4 fishing
Appendix B – Community Indices Page 8 10yr Review, BSAI CR Program
seasons, and Anchorage and Oregon both highly engaged for only 1 year. Figure 2 presents the harvesting engagement index scores for each of the four highly engaged community groupings for all fishing seasons 1998/1999-2014/2015 and shows a relatively stable trend for the Seattle MSA grouping, but a general increasing trend for Anchorage and Oregon and a slightly declining trend for the Kodiak. These results demonstrate the high degree of engagement from communities outside of Alaska in the crab harvesting sector, with the Seattle MSA being by far the dominant community in this sector.
Figure 2: Harvesting Engagement Index for Highly Engaged Communities
Comparison of pre-rationalization period (1998/1999-2004/2005) with the first five fishing seasons post-rationalization (2005/2006-2009/2010)
The implementation of the Crab Rationalization Program had the potential to drastically alter the communities that were engaged in the processing and harvesting sectors of the CR crab fisheries. In order to better understand the extent to which communities were impacted by the Crab Rationalization Program, we calculated the percentage change in the processing engagement index between the average of the pre-rationalization fishing seasons (1998/1999-2004/2005) to
Appendix B – Community Indices Page 9 10yr Review, BSAI CR Program
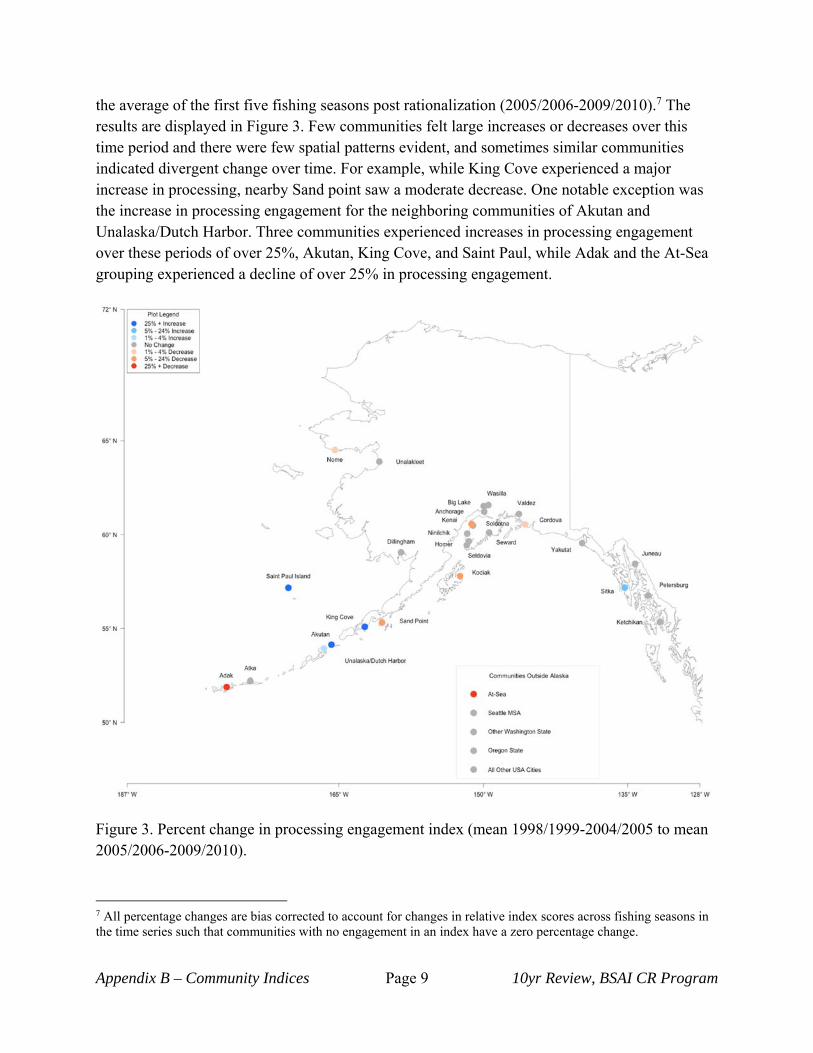
the average of the first five fishing seasons post rationalization (2005/2006-2009/2010).7 The results are displayed in Figure 3. Few communities felt large increases or decreases over this time period and there were few spatial patterns evident, and sometimes similar communities indicated divergent change over time. For example, while King Cove experienced a major increase in processing, nearby Sand point saw a moderate decrease. One notable exception was the increase in processing engagement for the neighboring communities of Akutan and Unalaska/Dutch Harbor. Three communities experienced increases in processing engagement over these periods of over 25%, Akutan, King Cove, and Saint Paul, while Adak and the At-Sea grouping experienced a decline of over 25% in processing engagement.
Figure 3. Percent change in processing engagement index (mean 1998/1999-2004/2005 to mean 2005/2006-2009/2010).
7 All percentage changes are bias corrected to account for changes in relative index scores across fishing seasons in the time series such that communities with no engagement in an index have a zero percentage change.
Appendix B – Community Indices Page 10 10yr Review, BSAI CR Program
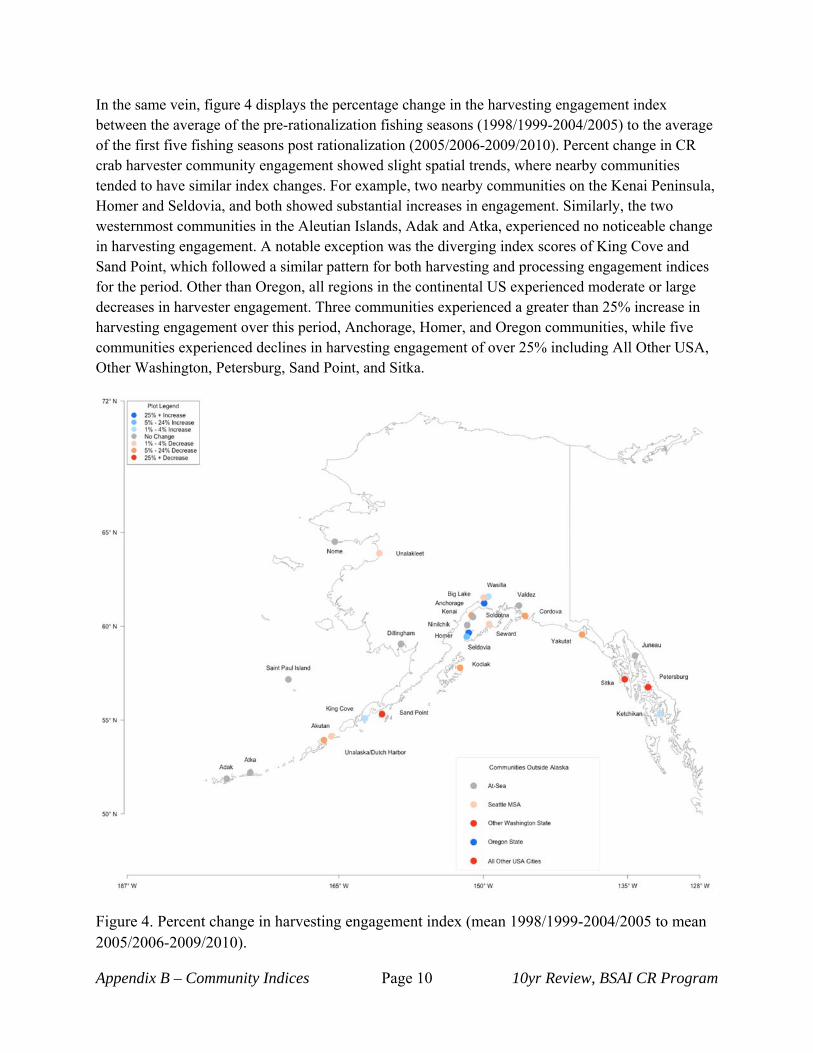
In the same vein, figure 4 displays the percentage change in the harvesting engagement index between the average of the pre-rationalization fishing seasons (1998/1999-2004/2005) to the average of the first five fishing seasons post rationalization (2005/2006-2009/2010). Percent change in CR crab harvester community engagement showed slight spatial trends, where nearby communities tended to have similar index changes. For example, two nearby communities on the Kenai Peninsula, Homer and Seldovia, and both showed substantial increases in engagement. Similarly, the two westernmost communities in the Aleutian Islands, Adak and Atka, experienced no noticeable change in harvesting engagement. A notable exception was the diverging index scores of King Cove and Sand Point, which followed a similar pattern for both harvesting and processing engagement indices for the period. Other than Oregon, all regions in the continental US experienced moderate or large decreases in harvester engagement. Three communities experienced a greater than 25% increase in harvesting engagement over this period, Anchorage, Homer, and Oregon communities, while five communities experienced declines in harvesting engagement of over 25% including All Other USA, Other Washington, Petersburg, Sand Point, and Sitka.
Figure 4. Percent change in harvesting engagement index (mean 1998/1999-2004/2005 to mean 2005/2006-2009/2010).
Appendix B – Community Indices Page 11 10yr Review, BSAI CR Program
Comparison of the first five fishing seasons post-rationalization (2005/2006-2009/2010) with the second five year period post-rationalization (2010/2011-2014/2015)
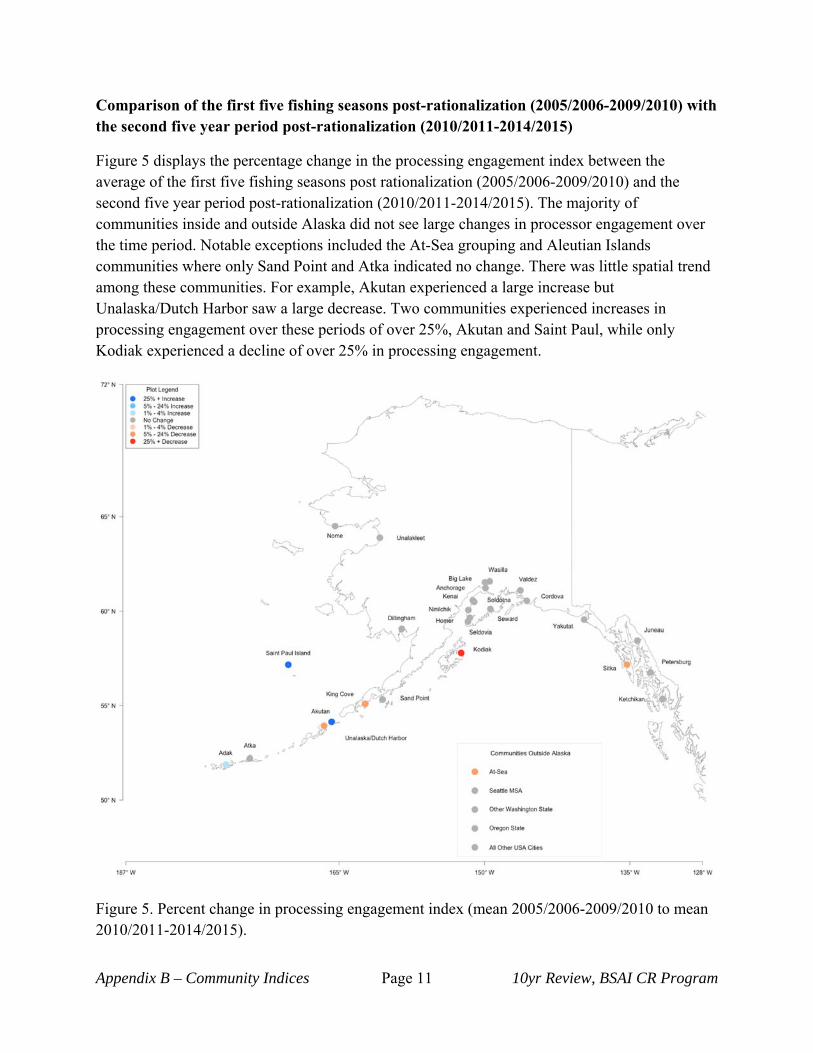
Figure 5 displays the percentage change in the processing engagement index between the average of the first five fishing seasons post rationalization (2005/2006-2009/2010) and the second five year period post-rationalization (2010/2011-2014/2015). The majority of communities inside and outside Alaska did not see large changes in processor engagement over the time period. Notable exceptions included the At-Sea grouping and Aleutian Islands communities where only Sand Point and Atka indicated no change. There was little spatial trend among these communities. For example, Akutan experienced a large increase but Unalaska/Dutch Harbor saw a large decrease. Two communities experienced increases in processing engagement over these periods of over 25%, Akutan and Saint Paul, while only Kodiak experienced a decline of over 25% in processing engagement.
Figure 5. Percent change in processing engagement index (mean 2005/2006-2009/2010 to mean 2010/2011-2014/2015).
Appendix B – Community Indices Page 12 10yr Review, BSAI CR Program
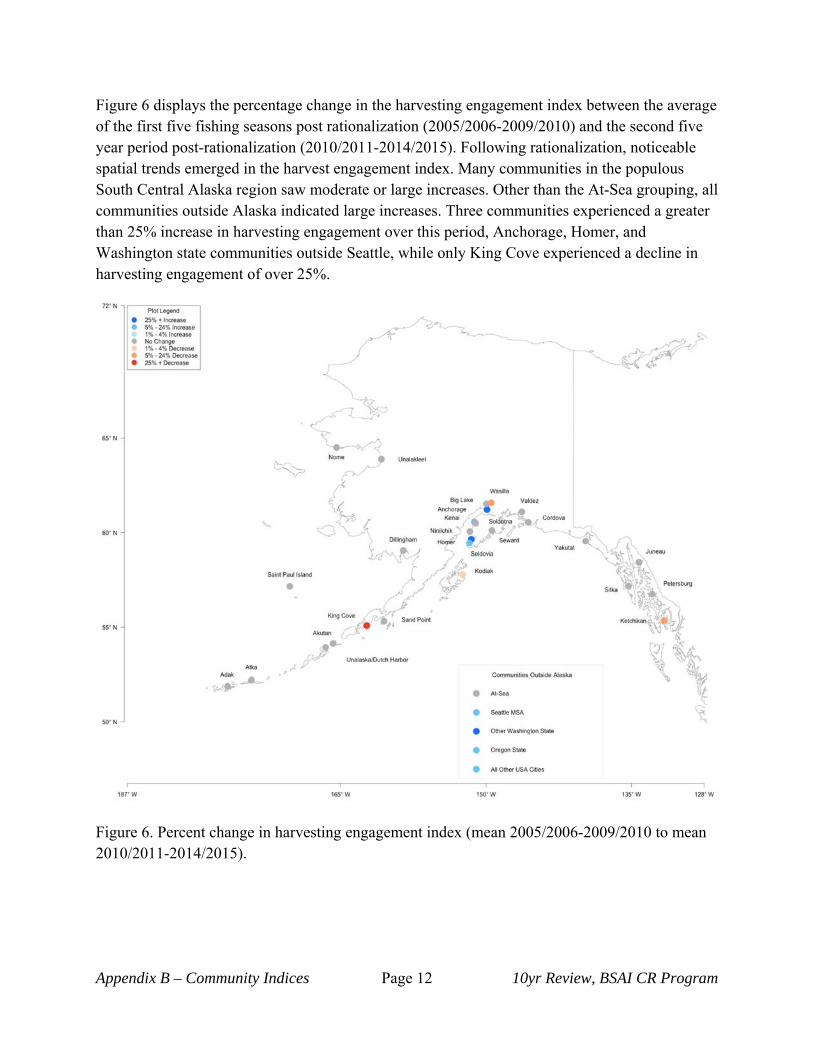
Figure 6 displays the percentage change in the harvesting engagement index between the average of the first five fishing seasons post rationalization (2005/2006-2009/2010) and the second five year period post-rationalization (2010/2011-2014/2015). Following rationalization, noticeable spatial trends emerged in the harvest engagement index. Many communities in the populous South Central Alaska region saw moderate or large increases. Other than the At-Sea grouping, all communities outside Alaska indicated large increases. Three communities experienced a greater than 25% increase in harvesting engagement over this period, Anchorage, Homer, and Washington state communities outside Seattle, while only King Cove experienced a decline in harvesting engagement of over 25%.
Figure 6. Percent change in harvesting engagement index (mean 2005/2006-2009/2010 to mean 2010/2011-2014/2015).
Appendix B – Community Indices Page 13 10yr Review, BSAI CR Program
Comparison of pre-rationalization period (1998/1999-2004/2005) with the most recent five fishing seasons post-rationalization (2010/2011-2014/2015)
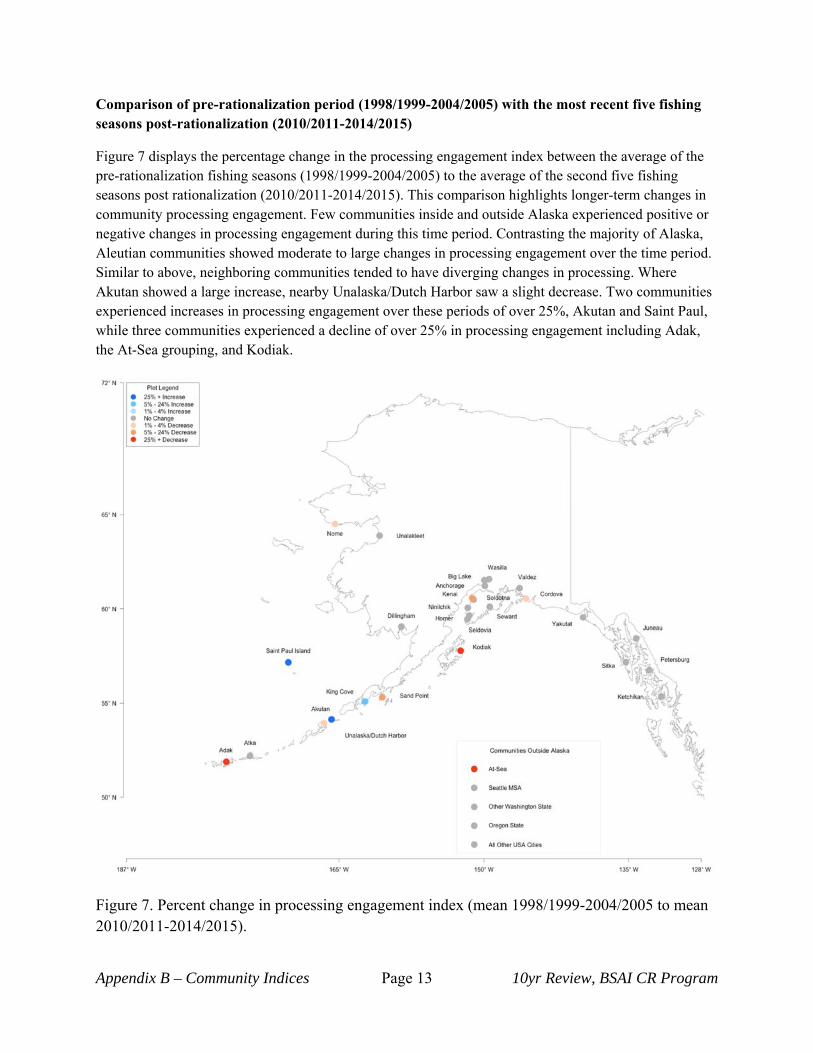
Figure 7 displays the percentage change in the processing engagement index between the average of the pre-rationalization fishing seasons (1998/1999-2004/2005) to the average of the second five fishing seasons post rationalization (2010/2011-2014/2015). This comparison highlights longer-term changes in community processing engagement. Few communities inside and outside Alaska experienced positive or negative changes in processing engagement during this time period. Contrasting the majority of Alaska, Aleutian communities showed moderate to large changes in processing engagement over the time period. Similar to above, neighboring communities tended to have diverging changes in processing. Where Akutan showed a large increase, nearby Unalaska/Dutch Harbor saw a slight decrease. Two communities experienced increases in processing engagement over these periods of over 25%, Akutan and Saint Paul, while three communities experienced a decline of over 25% in processing engagement including Adak, the At-Sea grouping, and Kodiak.
Figure 7. Percent change in processing engagement index (mean 1998/1999-2004/2005 to mean 2010/2011-2014/2015).
Appendix B – Community Indices Page 14 10yr Review, BSAI CR Program
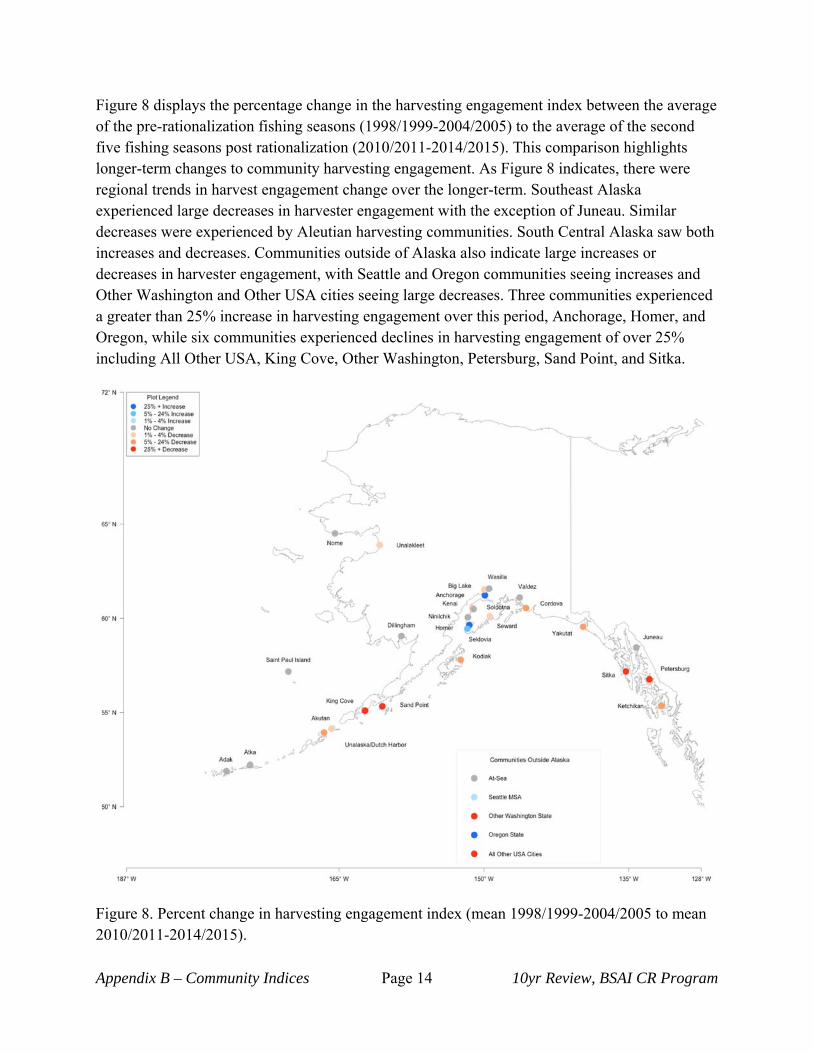
Figure 8 displays the percentage change in the harvesting engagement index between the average of the pre-rationalization fishing seasons (1998/1999-2004/2005) to the average of the second five fishing seasons post rationalization (2010/2011-2014/2015). This comparison highlights longer-term changes to community harvesting engagement. As Figure 8 indicates, there were regional trends in harvest engagement change over the longer-term. Southeast Alaska experienced large decreases in harvester engagement with the exception of Juneau. Similar decreases were experienced by Aleutian harvesting communities. South Central Alaska saw both increases and decreases. Communities outside of Alaska also indicate large increases or decreases in harvester engagement, with Seattle and Oregon communities seeing increases and Other Washington and Other USA cities seeing large decreases. Three communities experienced a greater than 25% increase in harvesting engagement over this period, Anchorage, Homer, and Oregon, while six communities experienced declines in harvesting engagement of over 25% including All Other USA, King Cove, Other Washington, Petersburg, Sand Point, and Sitka.
Figure 8. Percent change in harvesting engagement index (mean 1998/1999-2004/2005 to mean 2010/2011-2014/2015).
Appendix B – Community Indices Page 15 10yr Review, BSAI CR Program
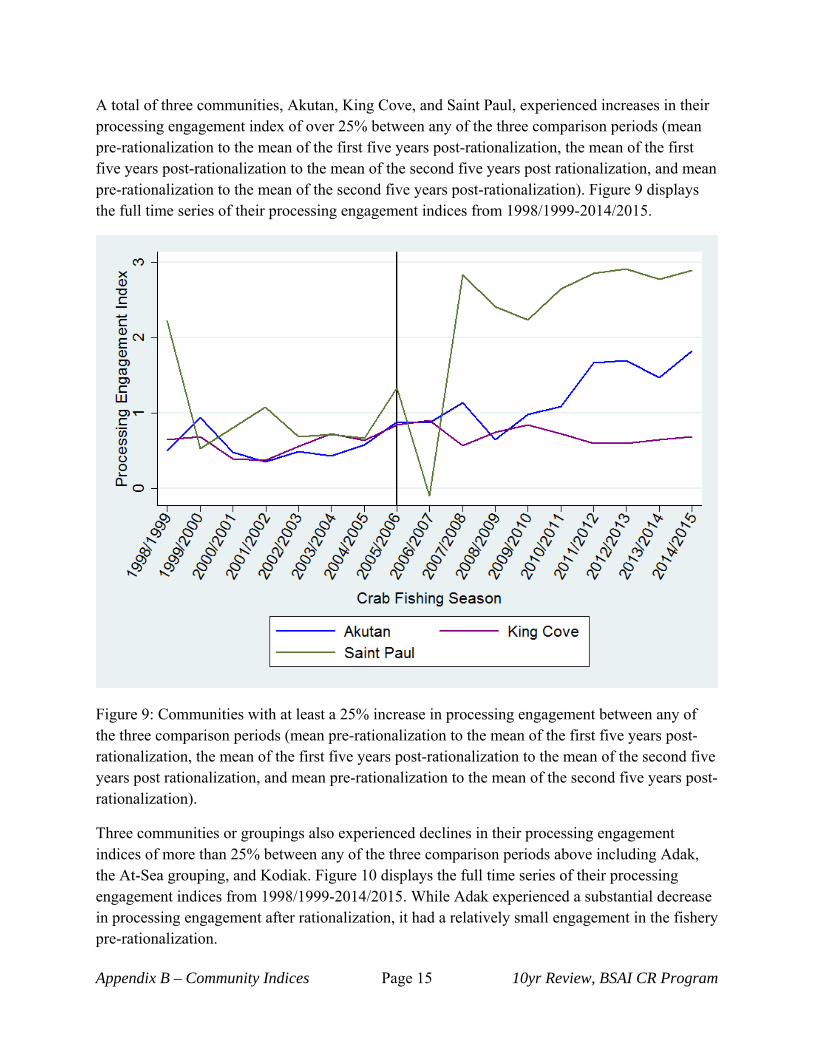
A total of three communities, Akutan, King Cove, and Saint Paul, experienced increases in their processing engagement index of over 25% between any of the three comparison periods (mean pre-rationalization to the mean of the first five years post-rationalization, the mean of the first five years post-rationalization to the mean of the second five years post rationalization, and mean pre-rationalization to the mean of the second five years post-rationalization). Figure 9 displays the full time series of their processing engagement indices from 1998/1999-2014/2015.
Figure 9: Communities with at least a 25% increase in processing engagement between any of the three comparison periods (mean pre-rationalization to the mean of the first five years post-rationalization, the mean of the first five years post-rationalization to the mean of the second five years post rationalization, and mean pre-rationalization to the mean of the second five years post-rationalization).
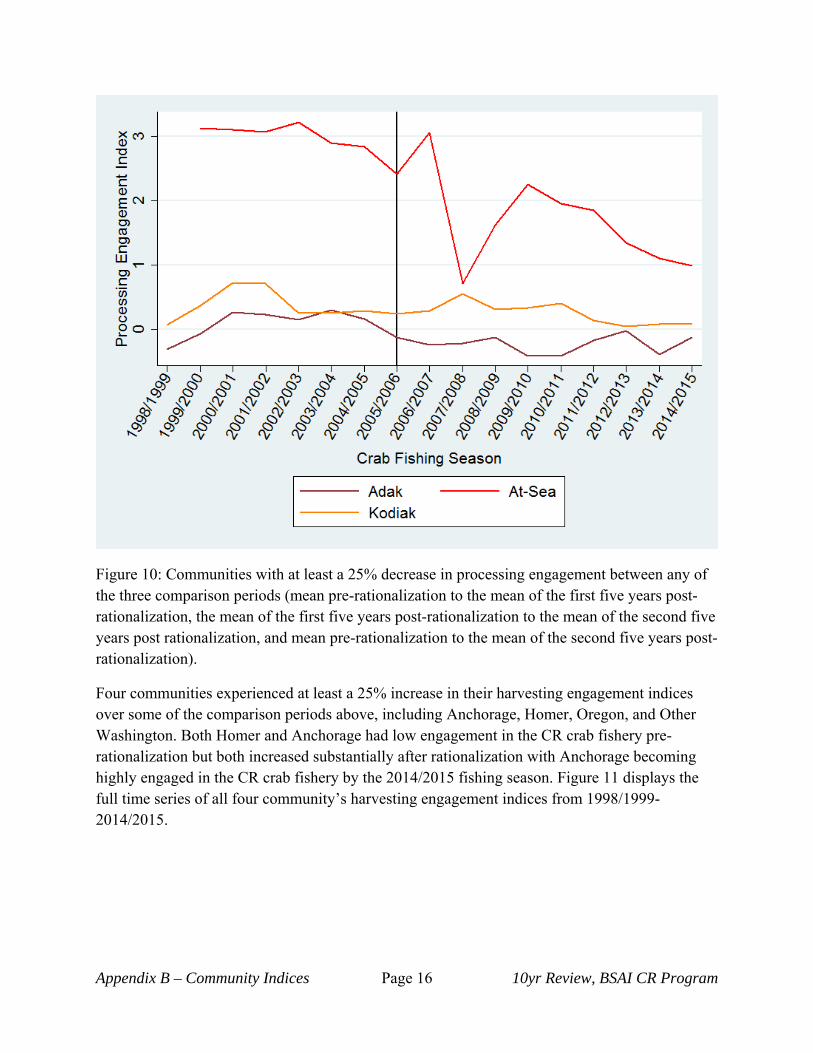
Three communities or groupings also experienced declines in their processing engagement indices of more than 25% between any of the three comparison periods above including Adak, the At-Sea grouping, and Kodiak. Figure 10 displays the full time series of their processing engagement indices from 1998/1999-2014/2015. While Adak experienced a substantial decrease in processing engagement after rationalization, it had a relatively small engagement in the fishery pre-rationalization.
Appendix B – Community Indices Page 16 10yr Review, BSAI CR Program
Figure 10: Communities with at least a 25% decrease in processing engagement between any of the three comparison periods (mean pre-rationalization to the mean of the first five years post-rationalization, the mean of the first five years post-rationalization to the mean of the second five years post rationalization, and mean pre-rationalization to the mean of the second five years post-rationalization).
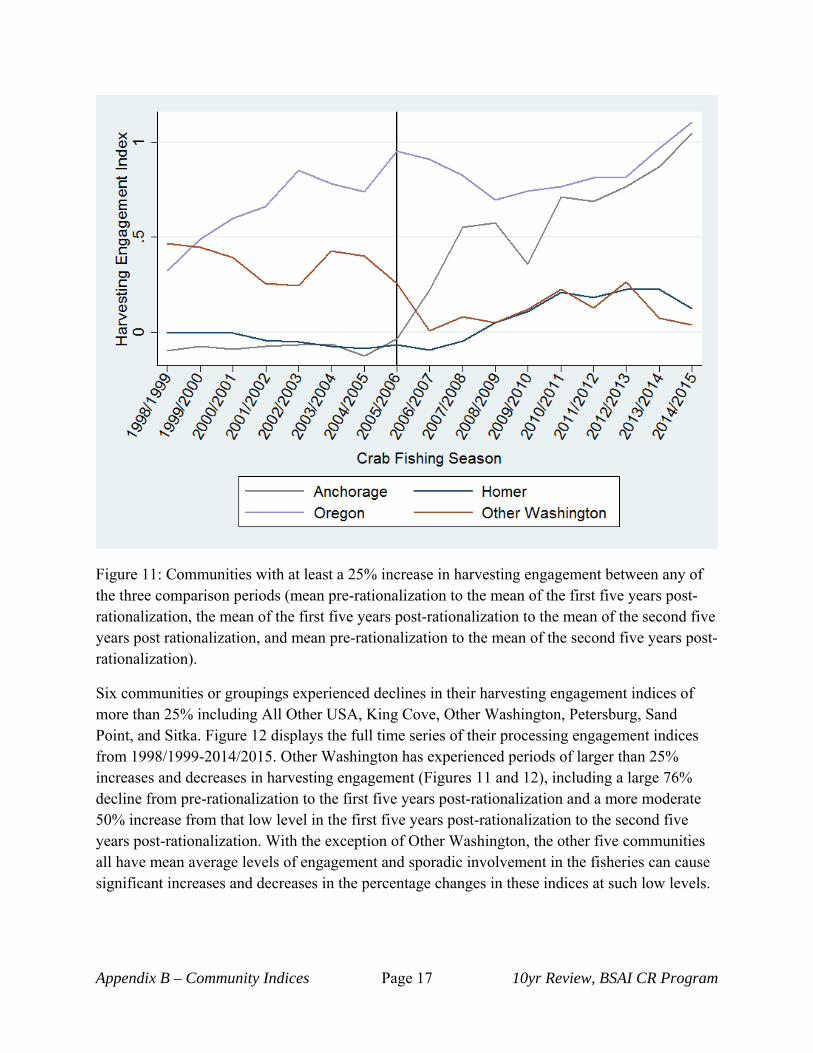
Four communities experienced at least a 25% increase in their harvesting engagement indices over some of the comparison periods above, including Anchorage, Homer, Oregon, and Other Washington. Both Homer and Anchorage had low engagement in the CR crab fishery pre-rationalization but both increased substantially after rationalization with Anchorage becoming highly engaged in the CR crab fishery by the 2014/2015 fishing season. Figure 11 displays the full time series of all four community’s harvesting engagement indices from 1998/1999-2014/2015.
Appendix B – Community Indices Page 17 10yr Review, BSAI CR Program
Figure 11: Communities with at least a 25% increase in harvesting engagement between any of the three comparison periods (mean pre-rationalization to the mean of the first five years post-rationalization, the mean of the first five years post-rationalization to the mean of the second five years post rationalization, and mean pre-rationalization to the mean of the second five years post-rationalization).
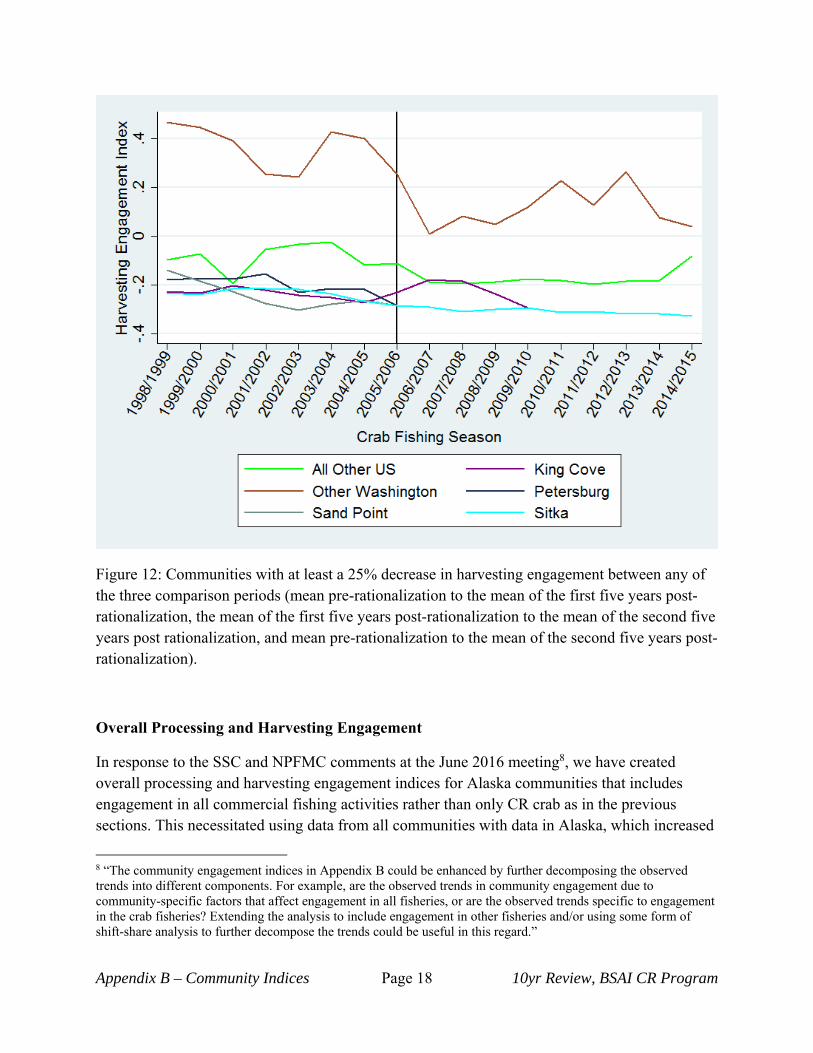
Six communities or groupings experienced declines in their harvesting engagement indices of more than 25% including All Other USA, King Cove, Other Washington, Petersburg, Sand Point, and Sitka. Figure 12 displays the full time series of their processing engagement indices from 1998/1999-2014/2015. Other Washington has experienced periods of larger than 25% increases and decreases in harvesting engagement (Figures 11 and 12), including a large 76% decline from pre-rationalization to the first five years post-rationalization and a more moderate 50% increase from that low level in the first five years post-rationalization to the second five years post-rationalization. With the exception of Other Washington, the other five communities all have mean average levels of engagement and sporadic involvement in the fisheries can cause significant increases and decreases in the percentage changes in these indices at such low levels.
Appendix B – Community Indices Page 18 10yr Review, BSAI CR Program
Figure 12: Communities with at least a 25% decrease in harvesting engagement between any of the three comparison periods (mean pre-rationalization to the mean of the first five years post-rationalization, the mean of the first five years post-rationalization to the mean of the second five years post rationalization, and mean pre-rationalization to the mean of the second five years post-rationalization).
Overall Processing and Harvesting Engagement
In response to the SSC and NPFMC comments at the June 2016 meeting8, we have created overall processing and harvesting engagement indices for Alaska communities that includes engagement in all commercial fishing activities rather than only CR crab as in the previous sections. This necessitated using data from all communities with data in Alaska, which increased
8 “The community engagement indices in Appendix B could be enhanced by further decomposing the observed trends into different components. For example, are the observed trends in community engagement due to community-specific factors that affect engagement in all fisheries, or are the observed trends specific to engagement in the crab fisheries? Extending the analysis to include engagement in other fisheries and/or using some form of shift-share analysis to further decompose the trends could be useful in this regard.”
Appendix B – Community Indices Page 19 10yr Review, BSAI CR Program
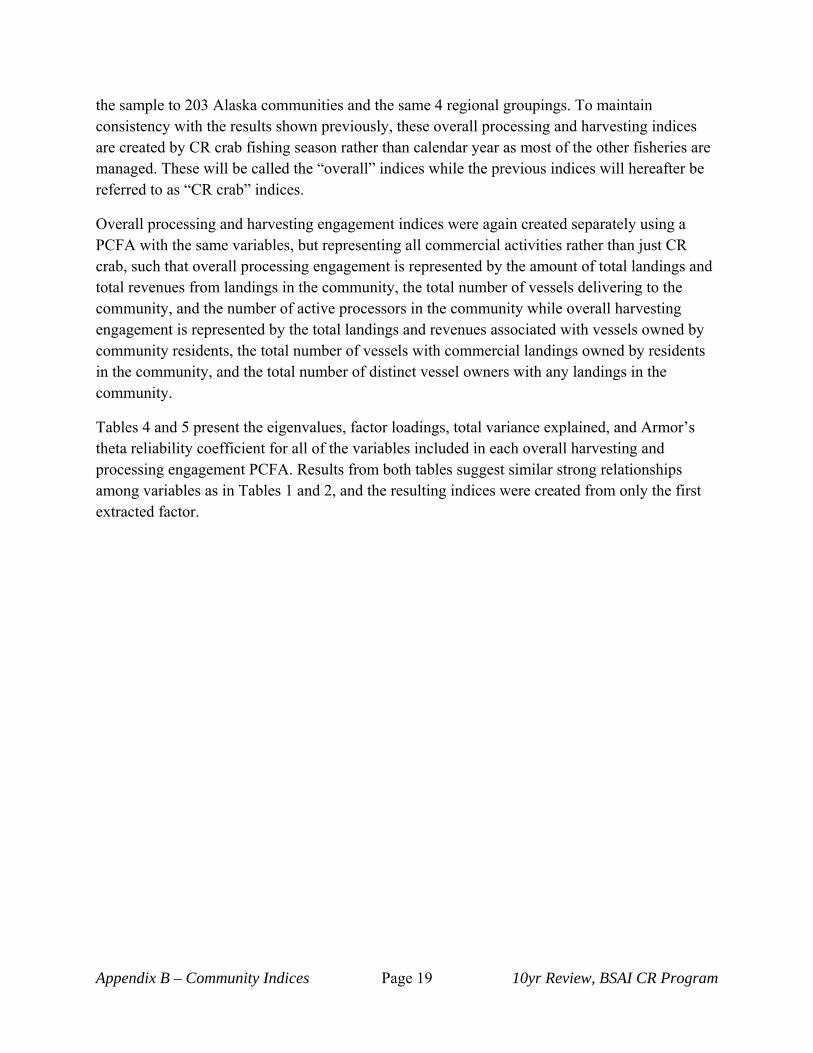
the sample to 203 Alaska communities and the same 4 regional groupings. To maintain consistency with the results shown previously, these overall processing and harvesting indices are created by CR crab fishing season rather than calendar year as most of the other fisheries are managed. These will be called the “overall” indices while the previous indices will hereafter be referred to as “CR crab” indices.
Overall processing and harvesting engagement indices were again created separately using a PCFA with the same variables, but representing all commercial activities rather than just CR crab, such that overall processing engagement is represented by the amount of total landings and total revenues from landings in the community, the total number of vessels delivering to the community, and the number of active processors in the community while overall harvesting engagement is represented by the total landings and revenues associated with vessels owned by community residents, the total number of vessels with commercial landings owned by residents in the community, and the total number of distinct vessel owners with any landings in the community.
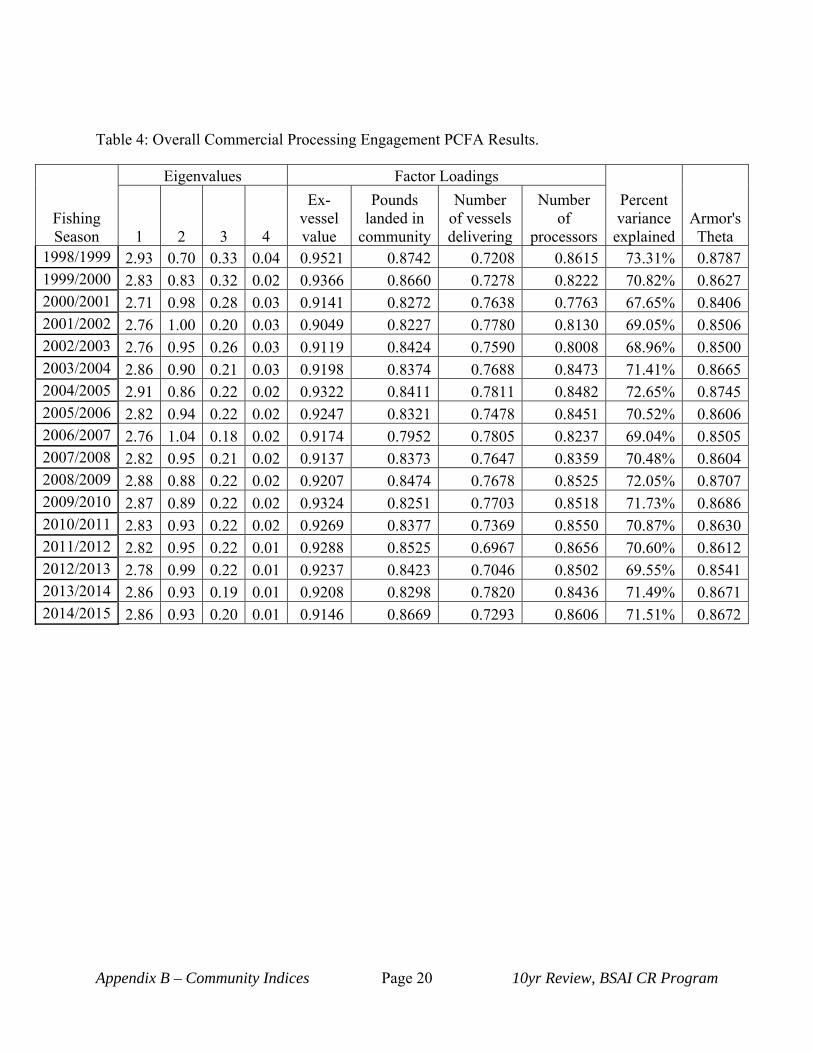
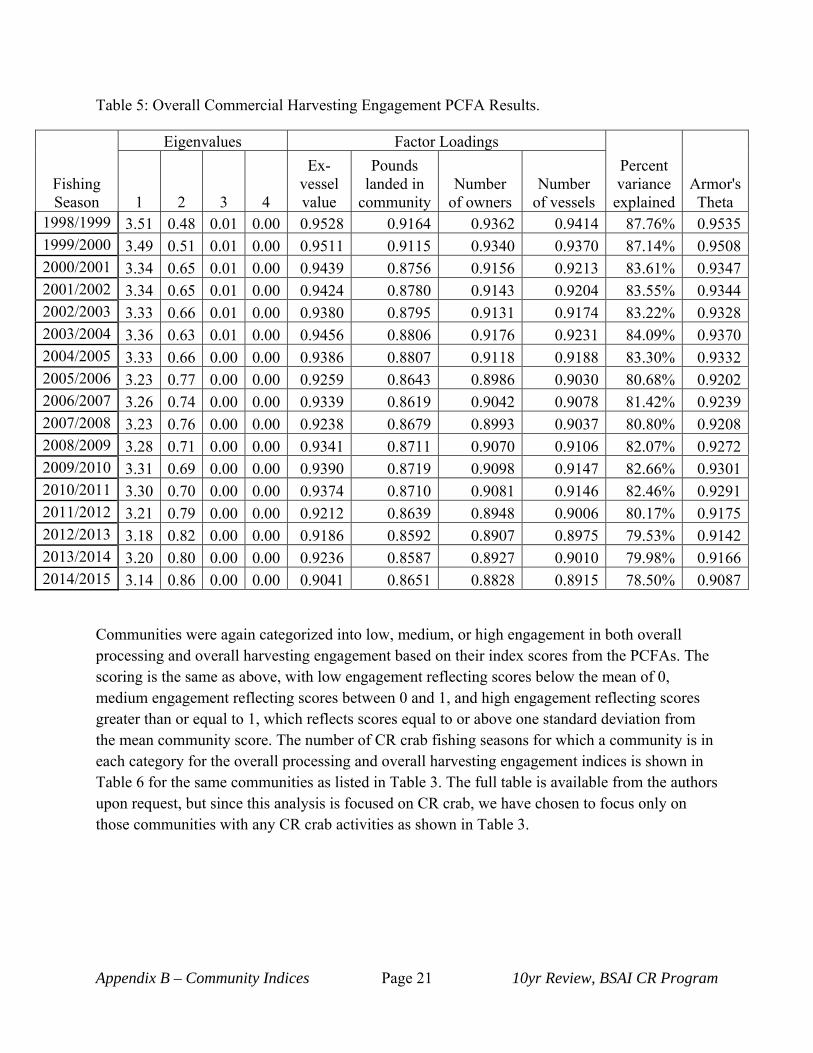
Tables 4 and 5 present the eigenvalues, factor loadings, total variance explained, and Armor’s theta reliability coefficient for all of the variables included in each overall harvesting and processing engagement PCFA. Results from both tables suggest similar strong relationships among variables as in Tables 1 and 2, and the resulting indices were created from only the first extracted factor.
Appendix B – Community Indices Page 20 10yr Review, BSAI CR Program
Table 4: Overall Commercial Processing Engagement PCFA Results.
Fishing Season
Eigenvalues Factor Loadings
Percent variance explained
Armor's Theta 1 2 3 4
Ex-vessel value
Pounds landed in
community
Number of vessels delivering
Number of
processors 1998/1999 2.93 0.70 0.33 0.04 0.9521 0.8742 0.7208 0.8615 73.31% 0.87871999/2000 2.83 0.83 0.32 0.02 0.9366 0.8660 0.7278 0.8222 70.82% 0.86272000/2001 2.71 0.98 0.28 0.03 0.9141 0.8272 0.7638 0.7763 67.65% 0.84062001/2002 2.76 1.00 0.20 0.03 0.9049 0.8227 0.7780 0.8130 69.05% 0.85062002/2003 2.76 0.95 0.26 0.03 0.9119 0.8424 0.7590 0.8008 68.96% 0.85002003/2004 2.86 0.90 0.21 0.03 0.9198 0.8374 0.7688 0.8473 71.41% 0.86652004/2005 2.91 0.86 0.22 0.02 0.9322 0.8411 0.7811 0.8482 72.65% 0.87452005/2006 2.82 0.94 0.22 0.02 0.9247 0.8321 0.7478 0.8451 70.52% 0.86062006/2007 2.76 1.04 0.18 0.02 0.9174 0.7952 0.7805 0.8237 69.04% 0.85052007/2008 2.82 0.95 0.21 0.02 0.9137 0.8373 0.7647 0.8359 70.48% 0.86042008/2009 2.88 0.88 0.22 0.02 0.9207 0.8474 0.7678 0.8525 72.05% 0.87072009/2010 2.87 0.89 0.22 0.02 0.9324 0.8251 0.7703 0.8518 71.73% 0.86862010/2011 2.83 0.93 0.22 0.02 0.9269 0.8377 0.7369 0.8550 70.87% 0.86302011/2012 2.82 0.95 0.22 0.01 0.9288 0.8525 0.6967 0.8656 70.60% 0.86122012/2013 2.78 0.99 0.22 0.01 0.9237 0.8423 0.7046 0.8502 69.55% 0.85412013/2014 2.86 0.93 0.19 0.01 0.9208 0.8298 0.7820 0.8436 71.49% 0.86712014/2015 2.86 0.93 0.20 0.01 0.9146 0.8669 0.7293 0.8606 71.51% 0.8672
Appendix B – Community Indices Page 21 10yr Review, BSAI CR Program
Table 5: Overall Commercial Harvesting Engagement PCFA Results.
Fishing Season
Eigenvalues Factor Loadings
Percent variance explained
Armor's Theta 1 2 3 4
Ex-vessel value
Pounds landed in
communityNumber
of owners Number
of vessels 1998/1999 3.51 0.48 0.01 0.00 0.9528 0.9164 0.9362 0.9414 87.76% 0.95351999/2000 3.49 0.51 0.01 0.00 0.9511 0.9115 0.9340 0.9370 87.14% 0.95082000/2001 3.34 0.65 0.01 0.00 0.9439 0.8756 0.9156 0.9213 83.61% 0.93472001/2002 3.34 0.65 0.01 0.00 0.9424 0.8780 0.9143 0.9204 83.55% 0.93442002/2003 3.33 0.66 0.01 0.00 0.9380 0.8795 0.9131 0.9174 83.22% 0.93282003/2004 3.36 0.63 0.01 0.00 0.9456 0.8806 0.9176 0.9231 84.09% 0.93702004/2005 3.33 0.66 0.00 0.00 0.9386 0.8807 0.9118 0.9188 83.30% 0.93322005/2006 3.23 0.77 0.00 0.00 0.9259 0.8643 0.8986 0.9030 80.68% 0.92022006/2007 3.26 0.74 0.00 0.00 0.9339 0.8619 0.9042 0.9078 81.42% 0.92392007/2008 3.23 0.76 0.00 0.00 0.9238 0.8679 0.8993 0.9037 80.80% 0.92082008/2009 3.28 0.71 0.00 0.00 0.9341 0.8711 0.9070 0.9106 82.07% 0.92722009/2010 3.31 0.69 0.00 0.00 0.9390 0.8719 0.9098 0.9147 82.66% 0.93012010/2011 3.30 0.70 0.00 0.00 0.9374 0.8710 0.9081 0.9146 82.46% 0.92912011/2012 3.21 0.79 0.00 0.00 0.9212 0.8639 0.8948 0.9006 80.17% 0.91752012/2013 3.18 0.82 0.00 0.00 0.9186 0.8592 0.8907 0.8975 79.53% 0.91422013/2014 3.20 0.80 0.00 0.00 0.9236 0.8587 0.8927 0.9010 79.98% 0.91662014/2015 3.14 0.86 0.00 0.00 0.9041 0.8651 0.8828 0.8915 78.50% 0.9087
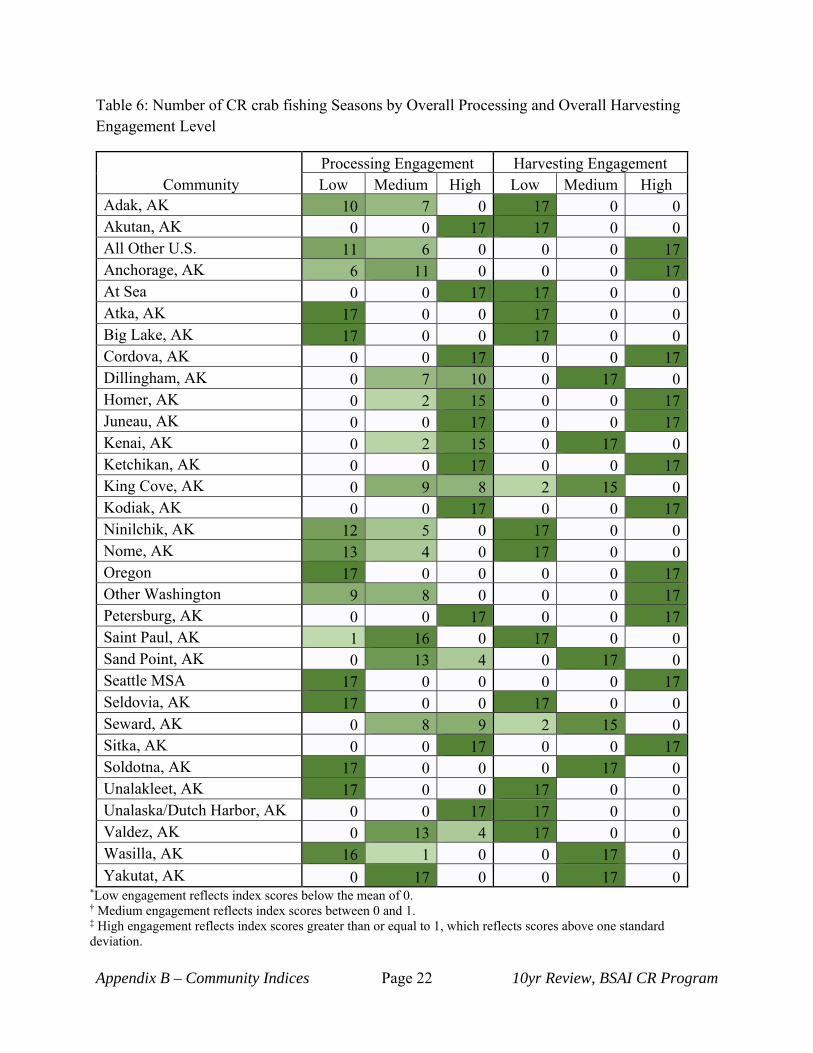
Communities were again categorized into low, medium, or high engagement in both overall processing and overall harvesting engagement based on their index scores from the PCFAs. The scoring is the same as above, with low engagement reflecting scores below the mean of 0, medium engagement reflecting scores between 0 and 1, and high engagement reflecting scores greater than or equal to 1, which reflects scores equal to or above one standard deviation from the mean community score. The number of CR crab fishing seasons for which a community is in each category for the overall processing and overall harvesting engagement indices is shown in Table 6 for the same communities as listed in Table 3. The full table is available from the authors upon request, but since this analysis is focused on CR crab, we have chosen to focus only on those communities with any CR crab activities as shown in Table 3.
Appendix B – Community Indices Page 22 10yr Review, BSAI CR Program
Table 6: Number of CR crab fishing Seasons by Overall Processing and Overall Harvesting Engagement Level
Community Processing Engagement Harvesting Engagement Low Medium High Low Medium High
Adak, AK 10 7 0 17 0 0Akutan, AK 0 0 17 17 0 0All Other U.S. 11 6 0 0 0 17Anchorage, AK 6 11 0 0 0 17At Sea 0 0 17 17 0 0Atka, AK 17 0 0 17 0 0Big Lake, AK 17 0 0 17 0 0Cordova, AK 0 0 17 0 0 17Dillingham, AK 0 7 10 0 17 0Homer, AK 0 2 15 0 0 17Juneau, AK 0 0 17 0 0 17Kenai, AK 0 2 15 0 17 0Ketchikan, AK 0 0 17 0 0 17King Cove, AK 0 9 8 2 15 0Kodiak, AK 0 0 17 0 0 17Ninilchik, AK 12 5 0 17 0 0Nome, AK 13 4 0 17 0 0Oregon 17 0 0 0 0 17Other Washington 9 8 0 0 0 17Petersburg, AK 0 0 17 0 0 17Saint Paul, AK 1 16 0 17 0 0Sand Point, AK 0 13 4 0 17 0Seattle MSA 17 0 0 0 0 17Seldovia, AK 17 0 0 17 0 0Seward, AK 0 8 9 2 15 0Sitka, AK 0 0 17 0 0 17Soldotna, AK 17 0 0 0 17 0Unalakleet, AK 17 0 0 17 0 0Unalaska/Dutch Harbor, AK 0 0 17 17 0 0Valdez, AK 0 13 4 17 0 0Wasilla, AK 16 1 0 0 17 0Yakutat, AK 0 17 0 0 17 0
*Low engagement reflects index scores below the mean of 0. † Medium engagement reflects index scores between 0 and 1. ‡ High engagement reflects index scores greater than or equal to 1, which reflects scores above one standard deviation.
Appendix B – Community Indices Page 23 10yr Review, BSAI CR Program
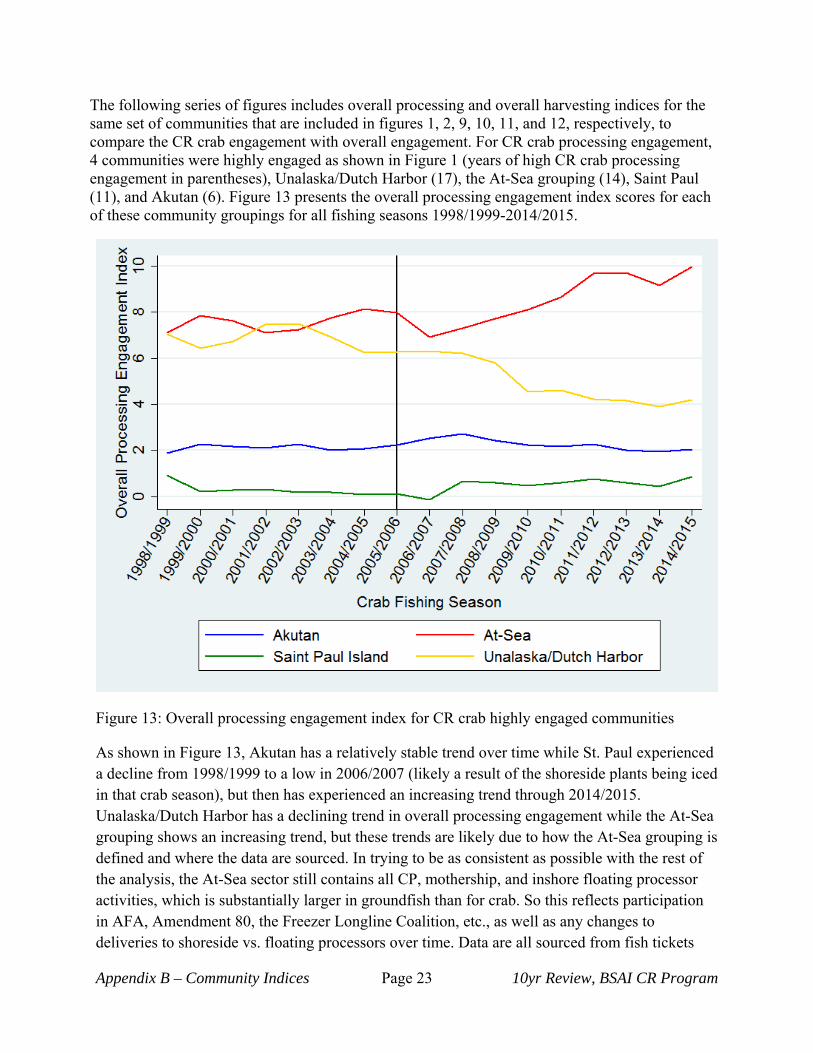
The following series of figures includes overall processing and overall harvesting indices for the same set of communities that are included in figures 1, 2, 9, 10, 11, and 12, respectively, to compare the CR crab engagement with overall engagement. For CR crab processing engagement, 4 communities were highly engaged as shown in Figure 1 (years of high CR crab processing engagement in parentheses), Unalaska/Dutch Harbor (17), the At-Sea grouping (14), Saint Paul (11), and Akutan (6). Figure 13 presents the overall processing engagement index scores for each of these community groupings for all fishing seasons 1998/1999-2014/2015.
Figure 13: Overall processing engagement index for CR crab highly engaged communities
As shown in Figure 13, Akutan has a relatively stable trend over time while St. Paul experienced a decline from 1998/1999 to a low in 2006/2007 (likely a result of the shoreside plants being iced in that crab season), but then has experienced an increasing trend through 2014/2015. Unalaska/Dutch Harbor has a declining trend in overall processing engagement while the At-Sea grouping shows an increasing trend, but these trends are likely due to how the At-Sea grouping is defined and where the data are sourced. In trying to be as consistent as possible with the rest of the analysis, the At-Sea sector still contains all CP, mothership, and inshore floating processor activities, which is substantially larger in groundfish than for crab. So this reflects participation in AFA, Amendment 80, the Freezer Longline Coalition, etc., as well as any changes to deliveries to shoreside vs. floating processors over time. Data are all sourced from fish tickets
Appendix B – Community Indices Page 24 10yr Review, BSAI CR Program
which is a comprehensive accounting for crab landings but not for groundfish, and the increasing engagement in the At-Sea grouping is likely primarily a reflection of greater reporting by this sector in eLandings which increasingly get incorporated into the fish ticket database over time. And as these are relative indices, as a larger share of total activities that can be attributed to the At-Sea grouping will result in a lower score for all other communities, even Unalaska/Dutch Harbor which is still ranked first in two years, second in 11 years, and third in 4 years (Sitka was ranked second in those years). The results are qualitatively similar to those excluding this sector, so it remains included for consistency with the other sections in Appendix B.
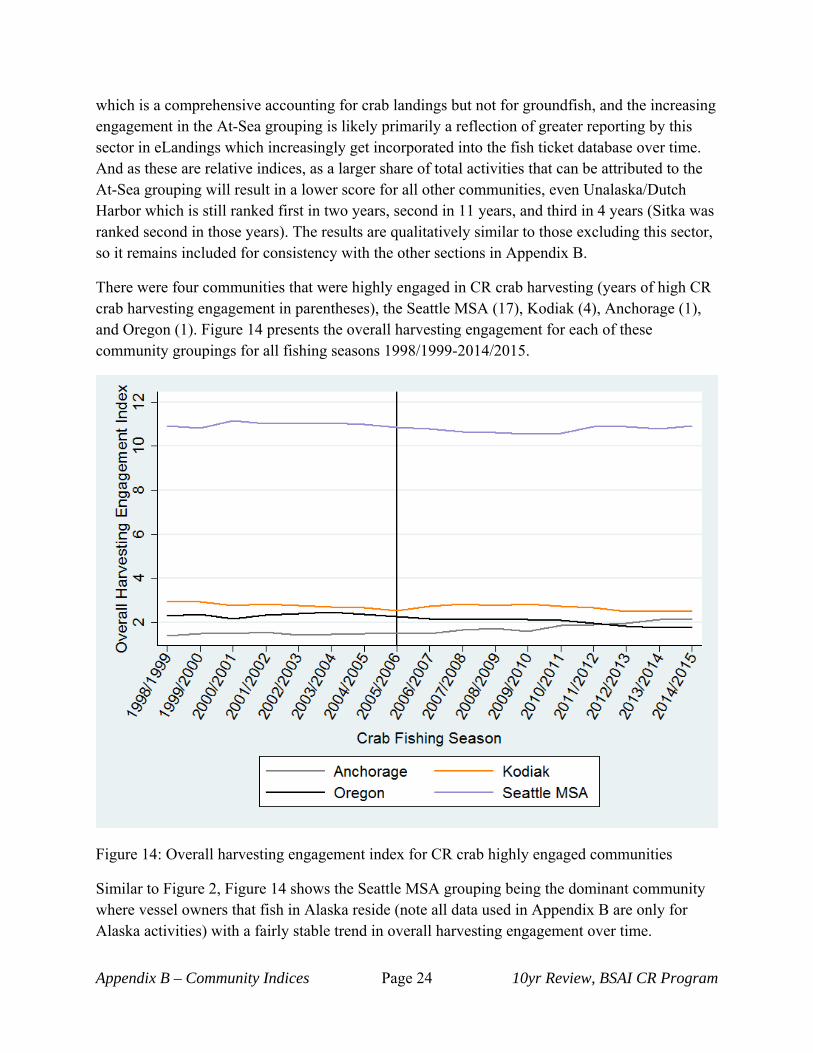
There were four communities that were highly engaged in CR crab harvesting (years of high CR crab harvesting engagement in parentheses), the Seattle MSA (17), Kodiak (4), Anchorage (1), and Oregon (1). Figure 14 presents the overall harvesting engagement for each of these community groupings for all fishing seasons 1998/1999-2014/2015.
Figure 14: Overall harvesting engagement index for CR crab highly engaged communities
Similar to Figure 2, Figure 14 shows the Seattle MSA grouping being the dominant community where vessel owners that fish in Alaska reside (note all data used in Appendix B are only for Alaska activities) with a fairly stable trend in overall harvesting engagement over time.
Appendix B – Community Indices Page 25 10yr Review, BSAI CR Program
Consistent with their trends in CR crab harvesting engagement, Anchorage has a general increasing trend in overall harvesting engagement while Kodiak has a declining trend in overall harvesting engagement over time. In contrast to its CR crab harvesting engagement, Oregon shows a declining trend in overall harvesting engagement.
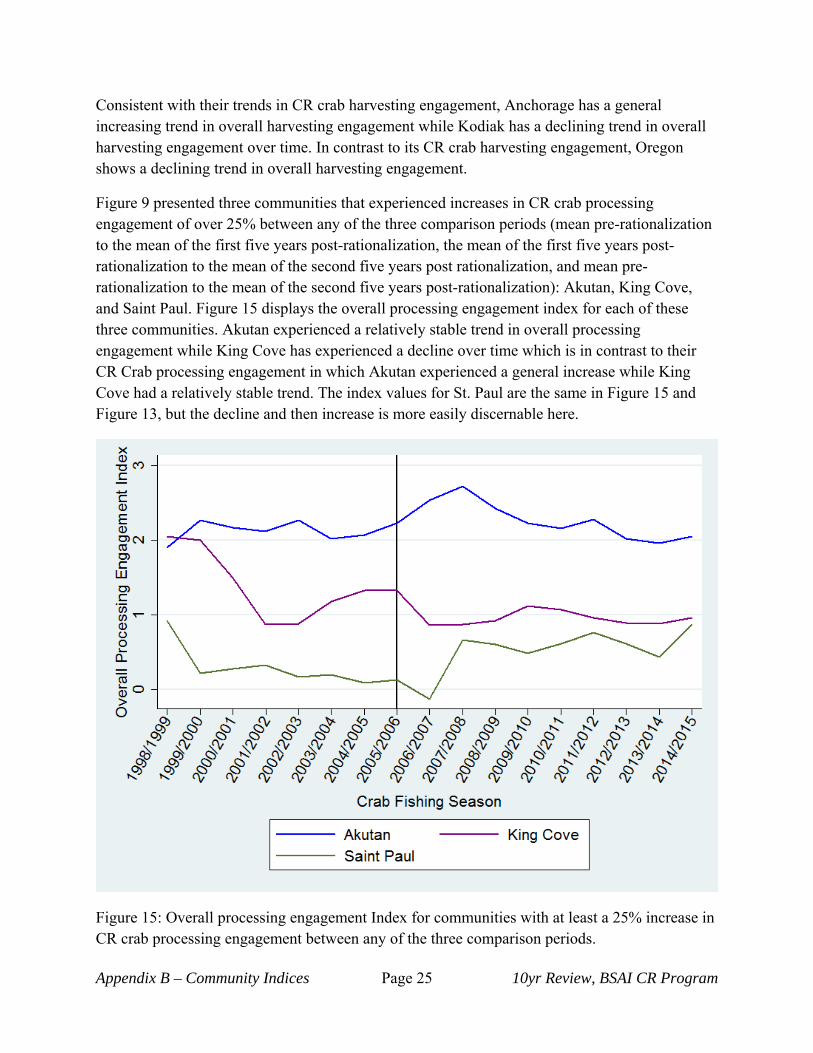
Figure 9 presented three communities that experienced increases in CR crab processing engagement of over 25% between any of the three comparison periods (mean pre-rationalization to the mean of the first five years post-rationalization, the mean of the first five years post-rationalization to the mean of the second five years post rationalization, and mean pre-rationalization to the mean of the second five years post-rationalization): Akutan, King Cove, and Saint Paul. Figure 15 displays the overall processing engagement index for each of these three communities. Akutan experienced a relatively stable trend in overall processing engagement while King Cove has experienced a decline over time which is in contrast to their CR Crab processing engagement in which Akutan experienced a general increase while King Cove had a relatively stable trend. The index values for St. Paul are the same in Figure 15 and Figure 13, but the decline and then increase is more easily discernable here.
Figure 15: Overall processing engagement Index for communities with at least a 25% increase in CR crab processing engagement between any of the three comparison periods.
Appendix B – Community Indices Page 26 10yr Review, BSAI CR Program
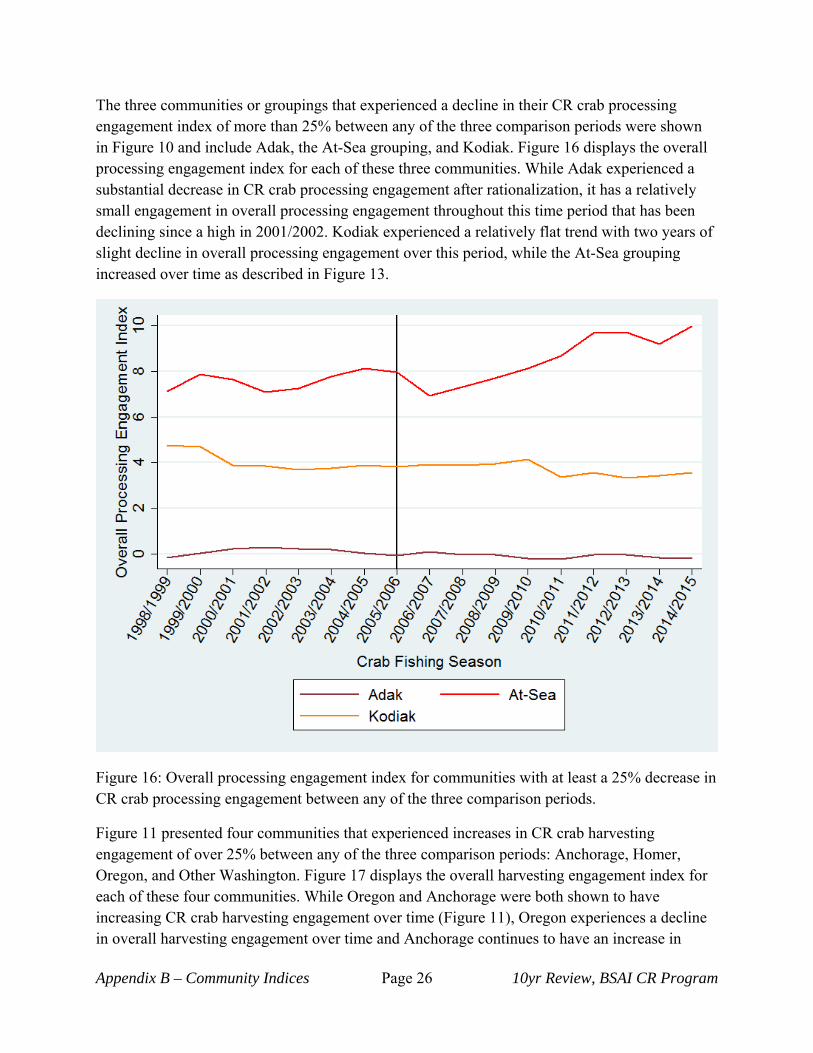
The three communities or groupings that experienced a decline in their CR crab processing engagement index of more than 25% between any of the three comparison periods were shown in Figure 10 and include Adak, the At-Sea grouping, and Kodiak. Figure 16 displays the overall processing engagement index for each of these three communities. While Adak experienced a substantial decrease in CR crab processing engagement after rationalization, it has a relatively small engagement in overall processing engagement throughout this time period that has been declining since a high in 2001/2002. Kodiak experienced a relatively flat trend with two years of slight decline in overall processing engagement over this period, while the At-Sea grouping increased over time as described in Figure 13.
Figure 16: Overall processing engagement index for communities with at least a 25% decrease in CR crab processing engagement between any of the three comparison periods.
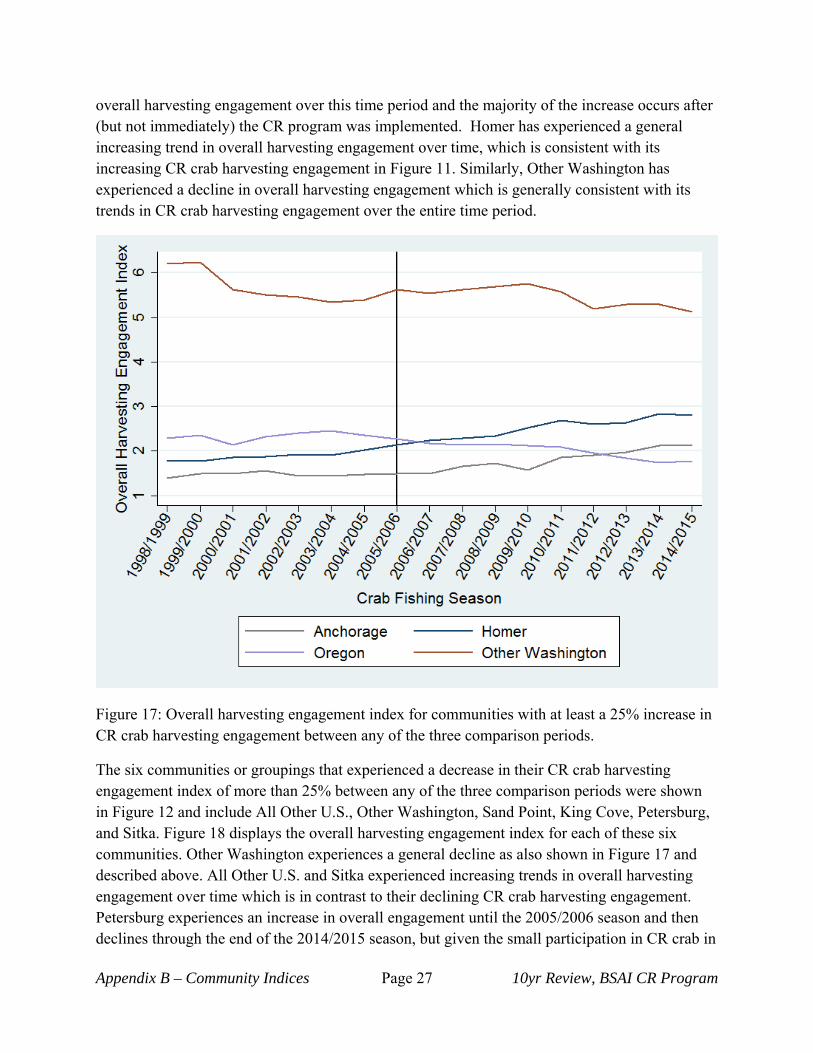
Figure 11 presented four communities that experienced increases in CR crab harvesting engagement of over 25% between any of the three comparison periods: Anchorage, Homer, Oregon, and Other Washington. Figure 17 displays the overall harvesting engagement index for each of these four communities. While Oregon and Anchorage were both shown to have increasing CR crab harvesting engagement over time (Figure 11), Oregon experiences a decline in overall harvesting engagement over time and Anchorage continues to have an increase in
Appendix B – Community Indices Page 27 10yr Review, BSAI CR Program
overall harvesting engagement over this time period and the majority of the increase occurs after (but not immediately) the CR program was implemented. Homer has experienced a general increasing trend in overall harvesting engagement over time, which is consistent with its increasing CR crab harvesting engagement in Figure 11. Similarly, Other Washington has experienced a decline in overall harvesting engagement which is generally consistent with its trends in CR crab harvesting engagement over the entire time period.
Figure 17: Overall harvesting engagement index for communities with at least a 25% increase in CR crab harvesting engagement between any of the three comparison periods.
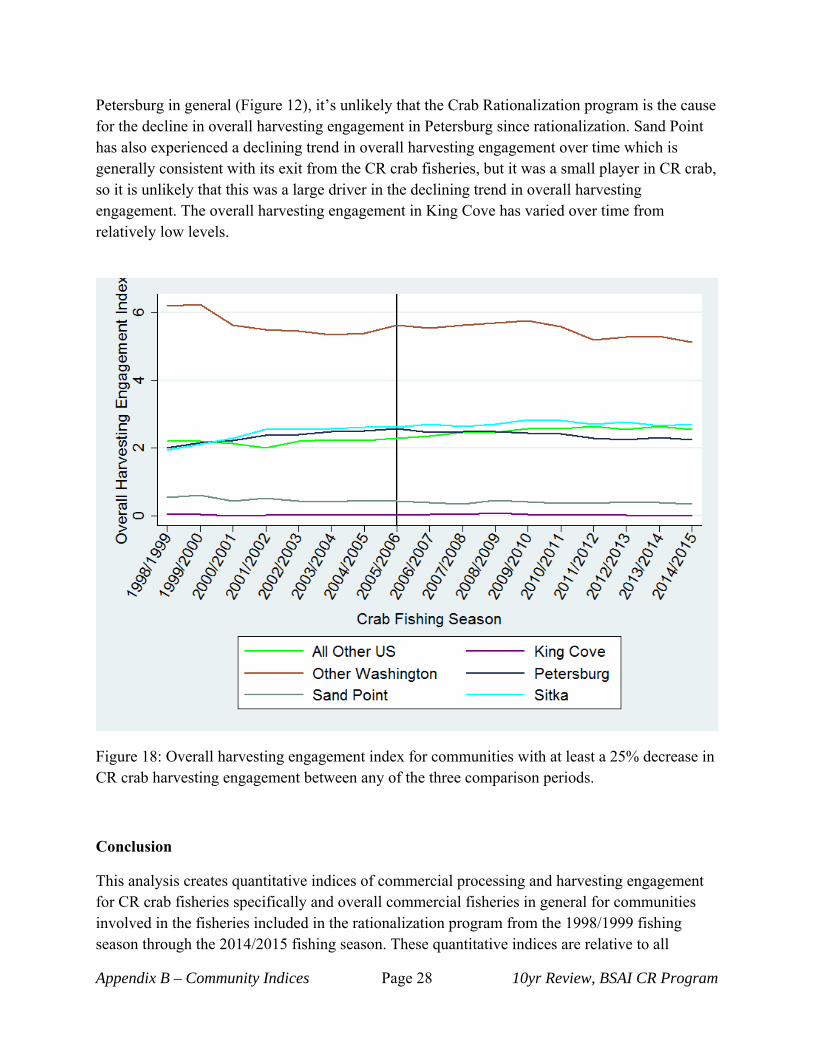
The six communities or groupings that experienced a decrease in their CR crab harvesting engagement index of more than 25% between any of the three comparison periods were shown in Figure 12 and include All Other U.S., Other Washington, Sand Point, King Cove, Petersburg, and Sitka. Figure 18 displays the overall harvesting engagement index for each of these six communities. Other Washington experiences a general decline as also shown in Figure 17 and described above. All Other U.S. and Sitka experienced increasing trends in overall harvesting engagement over time which is in contrast to their declining CR crab harvesting engagement. Petersburg experiences an increase in overall engagement until the 2005/2006 season and then declines through the end of the 2014/2015 season, but given the small participation in CR crab in
Appendix B – Community Indices Page 28 10yr Review, BSAI CR Program
Petersburg in general (Figure 12), it’s unlikely that the Crab Rationalization program is the cause for the decline in overall harvesting engagement in Petersburg since rationalization. Sand Point has also experienced a declining trend in overall harvesting engagement over time which is generally consistent with its exit from the CR crab fisheries, but it was a small player in CR crab, so it is unlikely that this was a large driver in the declining trend in overall harvesting engagement. The overall harvesting engagement in King Cove has varied over time from relatively low levels.
Figure 18: Overall harvesting engagement index for communities with at least a 25% decrease in CR crab harvesting engagement between any of the three comparison periods.
Conclusion
This analysis creates quantitative indices of commercial processing and harvesting engagement for CR crab fisheries specifically and overall commercial fisheries in general for communities involved in the fisheries included in the rationalization program from the 1998/1999 fishing season through the 2014/2015 fishing season. These quantitative indices are relative to all
Appendix B – Community Indices Page 29 10yr Review, BSAI CR Program
communities within a given fishing season and therefore do not measure absolute changes in processing or harvesting engagement. For example, while there was a large and significant decline in harvesting vessels in the fishing seasons following implementation of the crab rationalization program, if the distribution of those vessels exiting was proportional across all communities, these indices would show little or no change. However, what these indices do show are the changes in the relative position of CR crab harvesting engagement away from many smaller Alaska communities toward larger communities such as Anchorage, Homer, and to communities outside of Alaska. In contrast, these trends were not as apparent when looking across overall commercial harvesting or processing engagement. Furthermore, there were more changes in CR crab harvesting engagement than CR crab processing engagement over time, likely as a result of harvester sector related activity being more mobile across communities than processing sector related activity, which was an intentional design feature of the program through regional landing requirements, right of first refusal provisions on the transfer of processor quota, and other community protection measures.
References
Armor, D. J. 1974. Theta reliability and factor scaling. In Sociological Methodology 1973/1974, ed. H. L. Costner, 17–50. San Francisco: Jossey-Bass.
Card, D. and A.B. Krueger. 1994. Minimum Wages and Employment: A Case Study of the Fast-Food Industry in New Jersey and Pennsylvania. American Economic Review 84(4): 772-793.
Himes-Cornell, A. and S. Kasperski. 2016. “Using Socio-Economic and Fisheries Involvement Indices to Better Understand Alaska Fishing Community Well-being.” Coastal Management 44(1): 36-70.
Kasperski, S. and A. Himes-Cornell, 2014. Indicators of Fishing Engagement and Reliance of Alaskan Fishing Communities. Alaska Fisheries Science Center Quarterly Report feature (January-February-March 2014) 7 p. URL: http://www.afsc.noaa.gov/Quarterly/jfm2014/JFM14_Feature.pdf .
Kim, J. O., and C. W. Mueller. 1978a. Introduction to factor analysis. What it is and how to do it. In Sage University Paper Series on Quantitative Applications the Social Sciences, vol. 07–013. Thousand Oaks, CA: Sage.
Kim, J. O., and C. W. Mueller. 1978b. Factor analysis: Statistical methods and practical issues. Sage University Paper Series on Quantitative Applications the Social Sciences, vol. 07–014. Thousand Oaks, CA: Sage.