Embed Size (px)
Citation preview
Heading Here>> Appendix A8
CEG report, “A methodology for estimating expected inflation”,
17 January 2008


A methodology for estimating expected inflation
A report for ElectraNet
Dr. Tom Hird Daniel Young
17 January 2008

Competition Economists Group www.CEG-AP.COM
Table of Contents
1. Preliminaries 1 1.1. Terms of reference 1
2. Analysis 2 2.1. The AER’s approach 2 2.2. The purpose for which expected inflation is being estimated 3 2.3. The AER’s inflation forecast is not a 10 year forecast 4 2.4. Correcting the problems with the AER’s approach 7 2.5. Why BIS Shrapnel forecasts should be excluded 12 2.6. Best estimate of expected inflation over 10 years 15

1 Competition Economists Group www.CEG-AP.COM
1. Preliminaries 1.1. Terms of reference 1. CEG has been commissioned by ElectraNet to review the AER’s methodology for
calculating the real expected yield on a nominal Commonwealth Government Security (CGS) with a maturity of 10 years as found in the ElectraNet Draft Decision.

2 Competition Economists Group www.CEG-AP.COM
2. Analysis 2.1. The AER’s approach 2. The AER’s description of its methodology for deriving the real risk free rate from
the yield on nominal bonds is summarised in the following extract from page 131 of the draft decision.
“The AER notes that no other market-based methodology exists that can be relied upon to objectively derive an inflation forecast. In the absence of an objective market-based methodology to forecast expected inflation the AER will be guided by the Reserve Bank of Australia’s (RBA) assessment of inflationary expectations in adjusting monetary policy. Where the RBA has a bias to tighten monetary policy, inflation will be taken to be at the top of the 2 to 3 per cent inflation target range. Where the RBA has a bias to relax monetary policy, inflation expectations will be taken to be at the bottom of the range. Where the RBA has a neutral position, inflation will be taken to be at the mid-point. This approach should provide certainty to the market in the absence of a well regarded market-based measure.
“The AER recognises that the current market sentiment is that inflationary pressure in the short to medium term may result in a tendency for the RBA to tighten monetary policy. The RBA has recently released its Statement on monetary policy which includes a forecast of inflation over the next few years.
“The RBA forecasts that both CPI inflation and underlying measures are likely to rise above 3 per cent in the near term to June 2008. Over the medium term, the RBA indicated that:
…upward pressure on the inflation rate should diminish, helped in part by the rise in the exchange rate, assuming it is sustained, and some moderation in the pace of demand growth. But with demand growth still close to trend, and pressure on capacity only diminishing gradually, inflation is unlikely to decline far. Underlying and CPI inflation are accordingly both forecast to be close to 3 per cent during 2008 and 2009.
“Consistent with the way in which the WACC is determined, the relevant forecast inflation to be adopted in the revenue proposal should be based on the current market expectation. Accordingly, the AER considers that an inflation forecast of 3 per cent per annum, which is at the upper end of the RBA’s target range, provides the best inflation estimate at this time. The AER notes that, in accordance with the regulatory arrangements under the CPI – X framework, the TNSP’s revenue cap is adjusted for actual inflation outcomes over the regulatory control period.”

3 Competition Economists Group www.CEG-AP.COM
2.2. The purpose for which expected inflation is being estimated 3. The reasonableness of the AER’s methodology for determining ‘expected inflation’
must be assessed by reference to the purpose to which the estimate is to be used. The relevant purpose for which the AER uses its estimate of expected inflation is to derive an estimate of the expected real yield to maturity on Commonwealth Government Securities (CGS) – which is itself a key determinant of the estimate of the real cost of capital required by investors in ElectraNet.
4. The AER estimates the real return investors expect on a 10 year CGS by application of the following formula:
5. The above formula (known as the Fisher equation) is the formula that the AER
uses to derive a real risk free rate. On the right hand side of this equation, expected inflation is removed from the observed yield to maturity (YTM) on CGS with 10 years to maturity. This gives an estimate of the real yield investors expect as a result of holding a nominal CGS with 10 years to maturity.
6. We note that it is for this reason that expected inflation is a critical input into the
PTRM. That is, the reason a higher assumed level of expected inflation results in lower real revenues (more negative ‘X’ factor) is because higher inflation lowers estimated real risk free rate on CGS (and therefore the real return on equity provided in the PTRM).
7. The AER is required by the National Electricity Rules (NER) to derive a real risk
free rate1 by starting with the observed yield on CGS with 10 years to maturity. 6A.6.2 (c) of the NER states that:
“The nominal risk free rate for a regulatory control period is the rate determined for that regulatory control period by the AER on a moving average basis from the annualised yield on Commonwealth Government bonds with a maturity of 10 years...”
8. The only correct measure of expected inflation that can be used in this context is
expected inflation over the life of the 10 year nominal CGS bond from which the inflation estimate is being removed. That is, all of the inputs into the above equation must be specified over the same time horizon. Given we are starting with market participants’ required nominal return over 10 years we must, consistently, attempt to estimate market participants’ expected inflation over the same period.
1 The AER reports a real risk free rate at Table 5.2 of the ElectraNet draft decision. The PTRM model effectively uses
this real risk free rate (and other WACC parameters) to determine the real return on capital.

4 Competition Economists Group www.CEG-AP.COM
9. If this is not the case then an error will result. For example, if expected inflation
over two years is used in the above equation then the calculated value will be meaningless. It will certainly not be an estimate of the expected real return on nominal CGS with ten years to maturity (unless, by coincidence, expected inflation over two years is equal to expected inflation over 10 years).
10. Recognising this context, the only reasonable estimate of expected inflation is
expected inflation over 10 years. 2.3. The AER’s inflation forecast is not a 10 year forecast 11. The AER sums up its methodology for determining expected inflation in the
following manner:
“In the absence of an objective market-based methodology to forecast expected inflation the AER will be guided by the Reserve Bank of Australia’s (RBA) assessment of inflationary expectations in adjusting monetary policy. Where the RBA has a bias to tighten monetary policy, inflation will be taken to be at the top of the 2 to 3 per cent inflation target range. Where the RBA has a bias to relax monetary policy, inflation expectations will be taken to be at the bottom of the range. Where the RBA has a neutral position, inflation will be taken to be at the mid-point.” .... “Consistent with the way in which the WACC is determined, the relevant forecast inflation to be adopted in the revenue proposal should be based on the current market expectation. Accordingly, the AER considers that an inflation forecast of 3 per cent per annum, which is at the upper end of the RBA’s target range, provides the best inflation estimate at this time.”
12. The above methodology for arriving at an expected inflation rate has no basis in
economic literature or in financial practice. It is entirely a creation of the AER and the resulting estimate of expected inflation must be regarded as an AER forecast.
13. Based on the analysis in section 2.2 above, the AER’s forecast methodology can
only be regarded as “consistent with the way in which the WACC has been determined” if it results in an estimate of inflation expectations over 10 years. The AER does not anywhere in the draft decision claim this property for its forecast methodology and we believe that the AER is correct to not make this claim.
14. The AER methodology, at best, gives rise to a short term (one to two years)
forecast of inflation. The logic behind the AER’s methodology can be summarised as follows:

5 Competition Economists Group www.CEG-AP.COM
• The RBA sets monetary policy consistent with its stated objective of keeping inflation within a 2.0% to 3.0% band over the course of the economic cycle;
• When inflation is heading towards the top of the band (3.0%) the RBA will tighten monetary policy in order to reduce inflationary pressures;
• When inflation is heading towards the bottom of the band (2.0%) the RBA will loosen monetary policy in order to increase inflationary pressures (reduce the risk of deflation); and
• When inflation is in the middle of the band (2.5%) the RBA will adopt a ‘neutral’ stance and leave monetary policy unchanged.
15. In our opinion, this is a reasonable short summary of how modern monetary policy
is carried out by central banks around the world, including in Australia. However, solely working from the above precepts the best long-term (10 year) forecast of inflation must be less than 3.0% and more than 2.0%. This follows axiomatically from recognition that the RBA (and other central banks) set monetary policy on the basis of short-term (ie, one to two years) inflationary pressures.
16. Consequently, if the RBA is raising interest rates then it is reasonable to presume
that inflation over the next one to two years will be towards the top of the RBA’s band. However, what the AER’s methodology fails to recognise is that by increasing interest rates the RBA is attempting to reduce inflationary pressures. If the RBA is successful in this policy (as it and other central banks have clearly been in modern history) then, in the medium term inflation can be expected to be less than 3.0%.
17. Similarly, if the RBA is reducing interest rates then one can reasonably expect that
inflation is falling towards the bottom of the RBA’s range (2.0%). However, by lowering interest rates in this situation the RBA is attempting to increase inflationary pressures in order to maintain inflation within its target band (2.0% to 3.0%).
18. Over the long term, repeated application of these policies mean that inflation
should, assuming the RBA is successful, average out to be approximately in the middle of the RBA’s target band. This principle is illustrated in Figure 1 below.

6 Competition Economists Group www.CEG-AP.COM
Figure 1: Inflation over a 10 year cycle
1
1.5
2
2.5
3
3.5
Average inflation over the cycle
Inflation over the cycle
19. Clearly, if inflation cycles between 2% and 3% over the cycle then long term
inflation (ie, inflation that extends over at least one interest rate cycle) will be anchored around 2.5%.
20. This is precisely the advice given to the ACCC by the RBA itself. “Given inflation expectations have been firmly anchored by the Bank’s inflation-target regime for some time, a rough estimate of a real risk-free rate would be the nominal government bond yield less the centre of the inflation target band (ie the nominal yield less 2½ per cent).”2
21. This observation is also entirely borne out by what we have observed over the last
10 years. That is, inflation over the last ten years has sometimes been above and sometimes below the RBA’s target band but has averaged nearly exactly 2.5%. This fact has been noted by the Commonwealth Treasury in precisely this context. “We therefore recommend that the ACCC uses the mid-point of the RBA’s target band for inflation (that is, 2.5 per cent per annum) as the best estimate of inflation.
2 Letter dated 9 August 2007 from Assistant RBA Governor, Mr Guy Debelle, to ACCC Executive General Manager
Mr Joe Dimasi.

7 Competition Economists Group www.CEG-AP.COM
Since the independence of the Reserve Bank board in conducting monetary policy was formalized in 1996, annual inflation has averaged 2.5%.”3
22. This is a relevant observation because a rational investor will have regard to past
experience when forming expectations about the future. In particular, a rational investor will have regard to past experience when determining whether the RBA can credibly be expected to determine monetary policy in a manner consistent with its inflation targets.
23. We agree with the Treasury’s advice. In the absence of any information to the contrary the best estimate of average long term inflation is 2.5%. Specifically, unless there is reason to believe that the RBA’s operation of monetary policy will fail to work in the future as it has in the past, the best estimate of medium to longer term inflation is 2.5%.
24. As we see in the following section, this is precisely the view of professional
forecasters whose average long term (10 year) inflation forecast is in the range of 2.53% to 2.60%.
25. In our opinion, the AER would need very strong grounds to substitute its own
estimate of 3.0% for long term inflation in preference to adopting an estimate of around 2.5% consistent with the basic economic logic outlined above and the advice of:
a) The Reserve Bank of Australia; b) The Australian Commonwealth Treasury;
c) Australian banks (such as the Commonwealth Bank, ANZ and Westpac); and
d) Professional economic forecasters – including Econtech who the AER uses in
the draft decision to forecast wage inflation. 26. The AER has not proffered any such grounds and we are unaware of any such
grounds that might be proffered. 2.4. Correcting the problems with the AER’s approach 27. On the basis of the above, and with no further information, a long term inflation
forecast of 2.5% would be superior to the AER’s proposed forecast of 3.0%. However, there is significant further information available on which to base the best estimate of expected inflation. Specifically, there are professional inflation
3 Letter dated 7 August 2007 from Treasury Executive Director, Mr Jim Murphy, to ACCC Executive General Manager
Mr Joe Dimasi.

8 Competition Economists Group www.CEG-AP.COM
forecasting agencies who provide forecasts of inflation. Given that CPI forecasts depend on the complex interaction of national and international macro-economic variables we have restricted our forecasters to include Government agencies with responsibility for macro-economic (‘whole of economy’) activity (such as the RBA, Commonwealth Treasury and, internationally, the OECD), financial market institutions (such as the major banks) and recognised private sector macro-economic forecasters.4
28. Table 1 below provides a detailed survey of available estimates of expected
inflation from these sources going out 10 years.
4 We have not included CPI forecasts based on consumer sentiment surveys (such as the Melbourne Institute Survey of Consumer Inflationary Expectations) , accounting firms, or made by sectoral specific analysts (such as ABARE or Macromonitor). We do not believe that such sources of forecasts can credibly be believed to reflect the expectations of, nor influence the expectations of, financial market investors. See our prior report for the Victorian gas distribution businesses “A methodology for estimating expected inflation”, 26 October 2006.

9 Competition Economists Group www.CEG-AP.COM
Table 1: Summary of Available Inflation Forecasts – year ended June Forecaster Date 2008 2009 2010 2011 2012 2013 2014 2015 2016 2017 Econtech Dec-07 3.1 2.8 1.9 1.9 2.3 2.5 2.4 2.5 Access Economics Dec-07 2.8 2.8 2.1 2.4 2.8 2.5 2.0 2.0 2.5 2.6 BIS Shrapnel Aug-07 3.0 2.9 2.3 2.9 3.2 3.2 2.7 2.5 3.2 3.6 ANZ Jan-08 3.4 2.8 2.6 2.5 2.5 2.5 2.5 2.5 2.5 2.5 Westpac Sep-07 2.9 2.5 2.5 2.5 2.5 2.5 2.5 2.5 2.5 2.5 Commonwealth Bank Sep/Dec-07 2.7 2.6 2.5 2.5 2.5 2.5 2.5 2.5 2.5 2.5 NAB* Jul-07 2.5 RBA (underlying) Aug/Nov-07 3.3 2.9 2.5 2.5 2.5 2.5 2.5 2.5 2.5 2.5 Commonwealth Treasury Aug/Oct-07 2.8 2.8 2.5 2.5 2.5 2.5 2.5 2.5 2.5 2.5 OECD Dec-07 3.2 2.7 Consensus Economics Oct/Dec-07 2.8 2.7 2.6 2.5 2.6 2.6 2.6 2.6 2.6 2.6 * We have been unable to update the NAB forecast from this July forecast. It is, therefore, the oldest forecast in the table and therefore somewhat less reliable as a predictor of 2008 inflation. However, because this is only one observation in 90 its inclusion has an insignificant impact on mean estimates. We include it in the table for completeness. Sources: Econtech, Australian National, State and Industry Outlook, 21 December 2007. Access Economics, Business Outlook December 2007. BIS Shrapnel, Outlook for Labour Markets and Costs to 2016/17: Electricity, Gas and Water Sector, April 2007. Advice direct from ANZ to CECG provided by email 9 January 2008. Westpac, CPI Forecast and Comment dated 18 September 2007. Commonwealth Bank of Australia, Economic Forecasts, 9 December 2007. Commonwealth Bank of Australia, CBA’s Inflation Forecasts, 26 September 2007. NAB, Australian Outlook, July 2007. RBA, November Statement on Monetary Policy, 12 November 2007. RBA letter dated 9 August 2007 to Joe Dimasi at the ACCC. Commonwealth Treasury, Pre-election Economic and Fiscal Outlook, 23 October 2007. Commonwealth Treasury letter dated 7 August 2007 to Joe Dimasi at the ACCC. OECD, OECD Economic Outlook No. 82 - Australia, 6 December 2007. Consensus Economics, Asia Pacific Consensus Forecasts, 10 December 2007. Consensus Economics, Asia Pacific Consensus Forecasts, 8 October 2007.

10 Competition Economists Group www.CEG-AP.COM
29. Examination of the above table suggests that most forecasters believe that both short and long term inflation will be below 3%. In this regard, it is instructive to examine the summary statistics associated with the raw data detailed in Table 1 above.
Table 2: Summary Statistics Statistic Equal weight
to all forecasters
BIS Shrapnel excluded
Government forecasters excluded
Government and BIS Shrapnel excluded
Mean of all observations
2.60% 2.55% 2.59% 2.53%
Median of all observations
2.50% 2.50% 2.50% 2.50%
Forecasters with mean forecasts equal or greater than 3%
None None None None
Mean of observations from 2008 to 2009
2.84% 2.83% 2.81% 2.79%
Mean of observations from 2010 to 2018
2.51% 2.46% 2.52% 2.45%
Weighted average of short and long term forecasts
2.58% 2.53% 2.58% 2.52%
30. Focussing on the first column of numbers, these show that the mean forecast for
all observations listed in Table 1 is 2.60%. That is, if each annual CPI forecast for each forecaster is given equal weight (whether it be long or short term) the average is 2.60%. Similarly, the median forecast is 2.50% on the same basis. That is, there are the same (or more) number of annual forecasts at or below 2.50% as there are above 2.50%. None of the forecasters has an average inflation forecast (ie, the mean of all years that they forecast) that is equal to or above 3%. Moreover, the forecaster with the highest forecast, BIS Shrapnel, should be given little weight in the current context for the reasons set out in section 2.5 below. This is not just the opinion of CEG but also of BIS Shrapnel itself. .
31. The averages discussed above give all annual estimates the same weight. This
may be problematic because there are more short term than long term forecasts listed in Table 1. As a consequence, this equal weighting approach will tend to result in a biased estimate of long term inflation if the short term forecasts are different to the long term forecasts. To check whether this is a relevant concern we need to separate out short and long term inflation expectations and give them the appropriate weights. Because we are interested in average inflation over 10 years the relevant weights are 20% to the first two years and 80% to the last eight years.5 When this is done the average of all forecasters’ (listed in Table 1)
5 We note that ideally one would take account of the fact that the nominal Government bond the AER is using as its
starting point is not a zero coupon bond. This means that not all of the income from the bond will be received at the

11 Competition Economists Group www.CEG-AP.COM
expectations over the next 10 years (where those expectations are available) is 2.58%.
32. For completeness we have also reported in Table 2 the results if the Government
forecasts of inflation (Treasury, RBA and OECD) are excluded. We do not propose that they should be but this is merely reported to illustrate that there is no material difference between government and private sector forecasts of inflation.
33. It is also relevant to note that Table 1 includes forecasts from Consensus
Economics. These forecasts are the result of surveys that Consensus Economics carries out of other forecasters’ short term inflation expectations. That is, Consensus Economics does not carry out its own forecasts. As such, there is an element of double counting in the Consensus Economics forecasts as these include some of the other forecasters separately detailed in Table 1.6
34. It is also possible to divide the above set of forecasts into government, banks and
professional economic forecasters (BIS Shrapnel, Econtech and Access Economics).7 Unlike the banks, these forecasters do not tend to simply adopt a 2.5% forecast in the medium to short-term. Rather, they employ a range of assumptions and proprietary modelling techniques in an attempt to model annual variations in inflation into the long-term. Nonetheless, they still arrive at a forecast that is anchored around 2.5%.
Table 3: Further Summary Statistics Statistic Government Banks Economic
forecasters Economic
forecasters (excl BIS)
Mean of all observations
2.61% 2.55% 2.62% 2.44%
35. CEG believes that the approaches taken by the banks and economic forecasters
are equally valid and the fact that they arrive at similar answers confirms the logic described in the previous section and the advice to the ACCC from the RBA and Commonwealth Treasury.
time it matures. Consideration of this fact would lead to a higher weight being given to short term inflation than we describe above. Against that consideration is the fact that the 2008 financial year is more than part way through and the forecasts listed in Table 1 for 2008 include some actual inflation that has already occurred – suggesting a lower weight on 2008 forecasts. Given that the average for short term inflation is close to the average for long term inflation any such adjustments to weights would produce an immaterial impact on the weighted average.
6 We note that it is not clear which entities have provided these long term forecasts to Consensus Economics. The short term forecasts published by Consensus Economics include forecasts provided by BIS Shrapnel, Access Economics, ANZ, CBA, Westpac and NAB. The suppliers of long term forecasts are not listed. We have included these forecasts in Table 1 because it is possible that Consensus were able to use estimates of inflation that were not directly available to us in preparing this report.
7 Consensus Economics is excluded from this sample as it provides a summary across all these institutions.

12 Competition Economists Group www.CEG-AP.COM
36. Clearly, based on any view of the consensus amongst all of these organisations the best estimate of long term expected inflation is centred around 2.5% and does not extend materially beyond 2.6%
37. That is not to say that these professional forecasting bodies will not be wrong.
However, unless the AER has reason to believe that it is better informed on matters of inflation forecasting than these professional bodies it should, in our opinion, defer to them. If the AER does have reason to believe it can more accurately forecast inflation than the organisations listed in Table 1 it would appear reasonable to expect the AER to describe the basis for this opinion.
38. In this regard we note that the AER has recently engaged the services of both
Access Economics and Econtech to forecast inflation in wages growth in the Australian economy. In this situation the AER has relied on the internal expertise of these forecasters and, implicitly, on their economic models of the Australian economy. In our opinion this has been an appropriate strategy for the AER reflecting the superior expertise of Access Economics and Econtech in forecasting inflation in wages growth.
39. However, precisely the same rationale would suggest reliance on their services in
the current (and likely more complicated) context of forecasting movements in all prices in the economy (rather than just electricity sector wages) over a longer time period. Had the AER relied on Econtech’s expertise in this area it would have estimated average 10 year inflation of 2.43% pa. Alternatively, had the AER relied on Access Economics’ advice it would similarly have estimated average 10 year inflation of 2.45% pa.
2.5. Why BIS Shrapnel forecasts should be excluded 40. In our opinion the shaded column of numbers in Table 2 above is the most reliable
summary of forecasts for the purpose at hand. This column excludes the forecasts of BIS Shrapnel. The basis for this exclusion is that we are informed that BIS Shrapnel’s forecast is an estimate of the mode and not the mean of inflation outcomes.8 We are further informed that BIS Shrapnel believes that the mean forecast lies below the mode forecast.
8 See 19 October 2007 letter from BIS to SP AusNet where BIS state:
“Over the five year period 2008-2013, we estimate that headline inflation will average 2.9%.
“We consider these forecasts to be the ‘most likely’ outcomes, given our assessment of the outlook for a range of macroeconomic variables. While we expect labour markets to remain tight, a moderation in demand over the period, along with a pick up in productivity, will provide some relief for price pressures.
“However, we believe the Reserve Bank will act to prevent CPI inflation running at over 3.0% for long periods. Accordingly, a ‘mean’ of a range of alternative scenarios would be less than our ‘most likely’ 2.9% figure. Therefore, with regard to the second point raised in your letter, yes, we expect that the probability distribution of possible inflation outcomes has a shorter tail above 3 per cent.”

13 Competition Economists Group www.CEG-AP.COM
41. This is relevant in the current context because from an investor’s perspective, it is the mean inflation forecast – not the mode forecast – that determines the expected real return on holding a nominal government bond. This is because the mode gives 100% weight to the forecast that has the greatest likelihood of occuring – even if there are other inflation outcomes that have a positive probability of occurring instead. By contrast, the mean forecast gives weight to all possible outcomes according to their probability.
42. To see the importance of this consider the example where an investor has the
following probability distribution for inflation outcomes. Table 4: Illustrative Example of a Probability Distribution Potential Inflation
Outcome Probability of each outcome
Probability weighted outcome
3.0% 40% 1.2 2.8% 30% 0.8 2.5% 30% 0.8
Expected inflation (mean) 2.8%
43. In the above example the most likely (mode) outcome is that inflation will be 3.0%.
However, the mean outcome is less than this (2.8%) because there is a material probability (60%) that inflation will be lower than 3.0% and no probability (in this example) that inflation will be higher than 3.0%. Faced with the above probability distribution a rational investor would not use an inflation forecast of 3.0% when attempting to calculate the real return on a nominal bond. To do so would be to give zero weight to the higher real returns that will occur if inflation is less than 3.0% (for which there is a 60% probability). A rational investor would give weight to all possible outcomes equal to the probability of their outcomes.
44. The above example is very simplistic with only three discrete outcomes for
inflation. In reality, investors are likely to have a continuous probability distribution for expected inflation. However, the potential difference between mean and mode forecasts can be illustrated, with the help of a diagram, using a continuous probability distribution.
45. Consider the probability distribution drawn below for inflation over a five year
forecast period. As drawn, the most likely inflation outcome is 3% (the highest point on the probability distribution). This is consistent with a scenario where inflationary pressures are expected to be relatively high over the next five years. However, the mean of all possible outcomes is 2.8% because the tail of the distribution above 3% is shorter than the tail of the distribution below 3%.

14 Competition Economists Group www.CEG-AP.COM
Figure 2: Probability Distribution for Average Inflation over a Five Year Period
3.0% 4%
2%
CPI
Probability
2.8%
46. We understand that, in general terms, this is the shape of the probability
distribution that underlies BIS Shrapnel’s forecasts. The reason for this is that BIS Shrapnel believes that if inflation goes above the top of the RBA’s target range of 2-3% the RBA will actively use monetary policy (raise interest rates) to reduce inflation.9 However, BIS believes that the RBA will not actively seek to increase inflation unless inflation is approaching the bottom of its target range. The combination of these facts mean that when inflationary pressures are high – with inflation nearer the top than the bottom of the RBA’s target range – the distribution of expected inflation is likely to be skewed to the left (and vice versa when inflation pressures are low). Specifically, BIS state:
“However, we believe the Reserve Bank will act to prevent CPI inflation running at over 3.0% for long periods. Accordingly, a ‘mean’ of a range of alternative scenarios would be less than our ‘most likely’ 2.9% figure. Therefore, with regard to the second point raised in your letter, yes, we expect that the probability distribution of possible inflation outcomes has a shorter tail above 3 per cent.”10
47. We find BIS Shrapnel’s analysis of this matter compelling. In our opinion, it is an
accurate reflection of the operation of Australian (and international) monetary policy. It relies on a simple and, to our knowledge, widely accepted assumption.
9 Letter dated 19 October 2007 BIS Shrapnel Senior Economist Mr Richard Robinson, to SP AusNet Manager
(Distribution Regulation) Mr Rob Amphlett Lewis. 10 Ibid, p.1
15 Competition Economists Group www.CEG-AP.COM
Namely, that inflation moving outside the central bank’s target range will more quickly trigger a vigorous monetary policy response than inflation movements within the central bank’s target range.
48. Given that the BIS Shrapnel forecast used in Table 1 above is higher than their
mean forecast, we recommend that this be excluded from the sample (or at least given lower weight). However, we also note that including the BIS Shrapnel forecast does not have a significant impact on the mean forecast (raising it 0.05% from 2.53% to 2.58%)
2.6. Best estimate of expected inflation over 10 years 49. On the basis of the above we recommend that the best estimate of expected
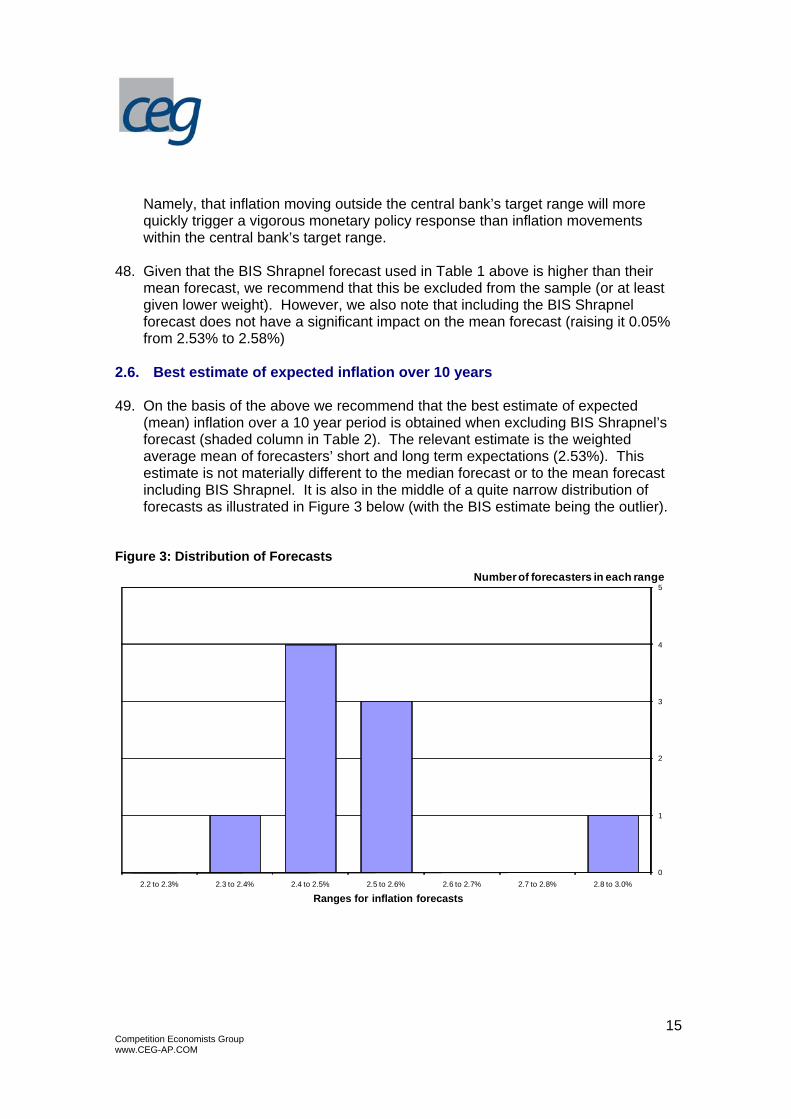
(mean) inflation over a 10 year period is obtained when excluding BIS Shrapnel’s forecast (shaded column in Table 2). The relevant estimate is the weighted average mean of forecasters’ short and long term expectations (2.53%). This estimate is not materially different to the median forecast or to the mean forecast including BIS Shrapnel. It is also in the middle of a quite narrow distribution of forecasts as illustrated in Figure 3 below (with the BIS estimate being the outlier).
Figure 3: Distribution of Forecasts
0
1
2
3
4
5
2.8 to 3.0%2.7 to 2.8%2.6 to 2.7%2.5 to 2.6%2.4 to 2.5%2.3 to 2.4%2.2 to 2.3%
Ranges for inflation forecasts
Number of forecasters in each range

16 Competition Economists Group www.CEG-AP.COM
50. We note that selecting an estimate of 2.53% for expected inflation is also consistent with the written advice of both the RBA and the Commonwealth Treasury who have separately noted that:
“Given inflation expectations have been firmly anchored by the Bank’s inflation-target regime for some time, a rough estimate of a real risk-free rate would be the nominal government bond yield less the centre of the inflation target band (ie the nominal yield less 2½ per cent).”11
“The Australian Government’s suspension of issuance of these inflation-linked bonds, as well as increased demand for this asset class, is likely to cause market-implied inflation estimates to exceed consensus forecasts of inflation over the medium term. We therefore recommend that the ACCC uses the mid-point of the RBA’s target band for inflation (that is, 2.5 per cent per annum) as the best estimate of inflation. Since the independence of the Reserve Bank board in conducting monetary policy was formalized in 1996, annual inflation has averaged 2.5%.”12
51. Therefore, it is our view that 2.53% represents the best estimate of expected
inflation for the purposes of calculating the real expected yield on a nominal CGS with a maturity of 10 years.
11 Letter dated 9 August 2007 from Assistant RBA Governor, Mr Guy Debelle, to ACCC Executive General Manager
Mr Joe Dimasi. 12 Letter dated 7 August 2007 from Treasury Executive Director, Mr Jim Murphy, to ACCC Executive General Manager
Mr Joe Dimasi.