Embed Size (px)
Citation preview
APPENDIX A THE FOCUS GROUPS
1. FOCUS GROUPS: CONDUCT
The focus groups are intended to obtain independent input on the set of factors including the
public understanding of their definition and the suitability of the levels set for each factor. Are
the levels different enough to be distinguishable and do they cover an appropriate range? A
decision was made early on to double the number of focus groups from one to two, as this
would allow a wider range of perceptions to be obtained and offer the opportunity to identify
areas of agreement between as well as within groups.
Recruitment was from University of Leeds staff; a convenient sample was necessary given
the extremely short project time frame. Particular care was made to ensure that a wide
range of socio economic groups were represented and that any academic bias was kept to a
minimum. In order to achieve this, an email recruitment campaign was undertaken that
targeted a wide range of staff groups across the campus. Among the groups targeted were:
Academic and administrative staff across various schools of the University;
Staff at the University nursery, mailing office, media services and sports centre.
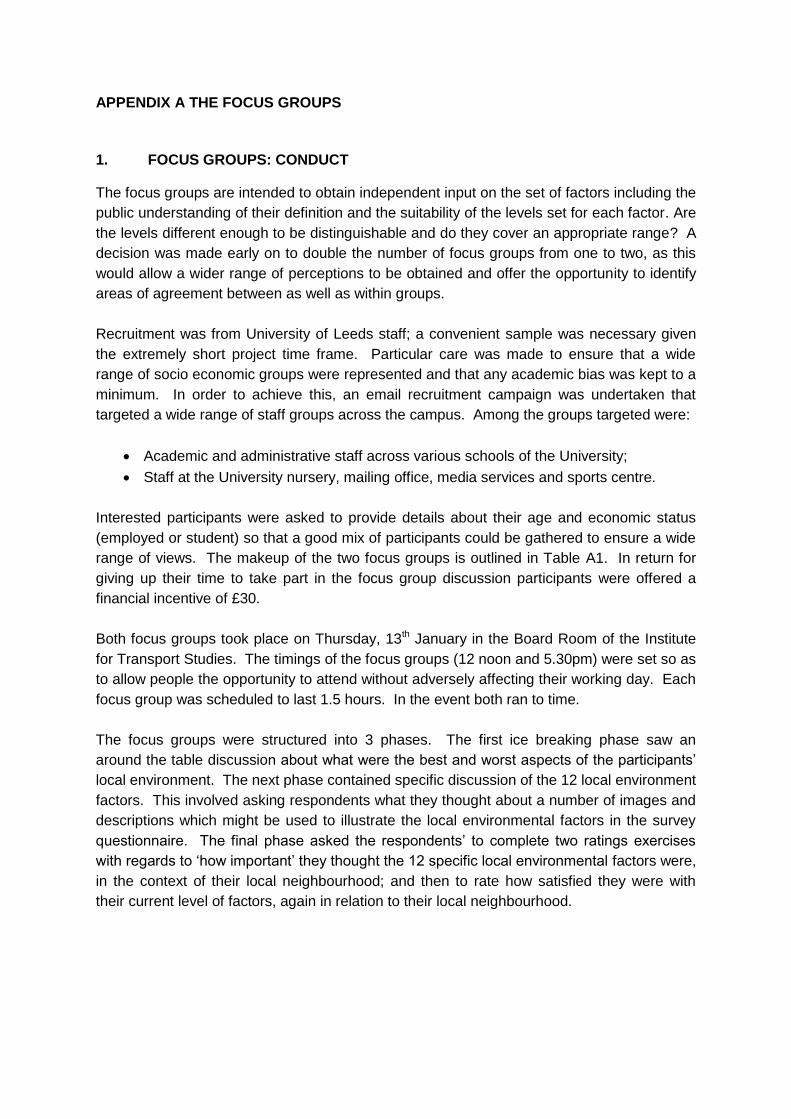
Interested participants were asked to provide details about their age and economic status
(employed or student) so that a good mix of participants could be gathered to ensure a wide
range of views. The makeup of the two focus groups is outlined in Table A1. In return for
giving up their time to take part in the focus group discussion participants were offered a
financial incentive of £30.
Both focus groups took place on Thursday, 13th January in the Board Room of the Institute
for Transport Studies. The timings of the focus groups (12 noon and 5.30pm) were set so as
to allow people the opportunity to attend without adversely affecting their working day. Each
focus group was scheduled to last 1.5 hours. In the event both ran to time.
The focus groups were structured into 3 phases. The first ice breaking phase saw an
around the table discussion about what were the best and worst aspects of the participants‟
local environment. The next phase contained specific discussion of the 12 local environment
factors. This involved asking respondents what they thought about a number of images and
descriptions which might be used to illustrate the local environmental factors in the survey
questionnaire. The final phase asked the respondents‟ to complete two ratings exercises
with regards to „how important‟ they thought the 12 specific local environmental factors were,
in the context of their local neighbourhood; and then to rate how satisfied they were with
their current level of factors, again in relation to their local neighbourhood.
Table A1 Composition of Focus Groups
Gender Economic Status Occupation Age
Male Employed Sports Administrator <35
Male Employed Environmental Officer >35
Female Employed Nursery assistant >35
Female Employed Nursery assistant >35
Male Retired Retired >35
Female Employed Student Advisor <35
Female Employed Marketing Manager <35
Male Employed IT Project Manager >35
Gender Employed Occupation Age
Female Employed Portfolio Manager >35
Male Employed Office support >35
Male Employed Personal Trainer <35
Female Employed Secretary >35
Female Employed Secretary >35
Male Employed Sports Administrator <35
Female Student PHD Student <35
Female Student PHD Student <35
2. FOCUS GROUPS: FINDINGS
2.1 Ice breaker
The “ice breaker” round the table discussion of the best and worst things about your local
environment drew forth the following examples:
Best Thing
Quiet featured strongly with the majority stating they felt their area was quiet
compared to the surrounding roads, i.e. „an oasis of quiet‟, „it‟s quite secluded‟.
Close to the countryside was another factor to come out strongly, i.e. „we are only 10
mins driver from open country‟, „I can be in the countryside within 5 mins‟, „the
countryside is on my doorstep‟.
Proximity or outlook to other features was mentioned, i.e. Parks, allotments, canals,
tree lined streets, living in a cul–de-sac.
At the same time having good access to the city centres or neighbourhood facilities
was another strong point, i.e. „I am only 15 bus rides from Leeds city centre‟, „I can
walk into Leeds city centre in 20 mins‟.
One person liked the busy urban environment they lived in, i.e. „there is lots to do,
plenty of bars etc…).
Another person liked the rural environment, i.e. „I was brought up on a farm and I
want to give my kids a similar experience‟.
Worst Thing
Transport and poor facilities for pedestrians/cyclists featured heavily in this
discussion, i.e. Too much traffic, pavements in poor condition, wheelie bins and poor
parking obstructing pedestrians progress along the pavement, roads poor for cycling
and not safe for cycling.
Litter and noise also prominent, i.e. „litter is appalling, despite the area being
plastered with £75 litter signs which don‟t get enforced‟. I can‟t sit outside in a coffee
bar and enjoy my drink because of the noise‟, „drinkers make a noise when walking
back from the pub‟.
Rubbish was mentioned several times. This problem seemed to be a combination of
seeing the street lined with wheelie bins – „it just makes the whole area look grim‟ –
and is then exacerbated by some bins being overflowing with rubbish, or extra bags
piled up beside them.
A couple of participants mentioned anti-social behaviour.
Another focused on there not being enough light in his area, caused because of the
numerous streets of terrace housing that don‟t let enough natural light in.
Another person found narrow streets and too many cars parked on them difficult to
drive around.
Someone thought the noise from overflying planes was particularly bad in the
summer when sat outside or gardening.
This was a helpful exercise in getting participants thinking about their local environment and
it clearly indicates that at least to these groups quiet and litter emerge as important issues.
The comments about overflowing rubbish bins (which are not a part of this study) suggests
that it will be important to be very clear in our definitions of litter and fly-tipping such that
there is no confusion with household bin collections.
The groups then moved on to examine the presentation of each indicator at different levels.
The images presented to the focus groups (in the form of a powerpoint presentation) may be
found in Appendix A.
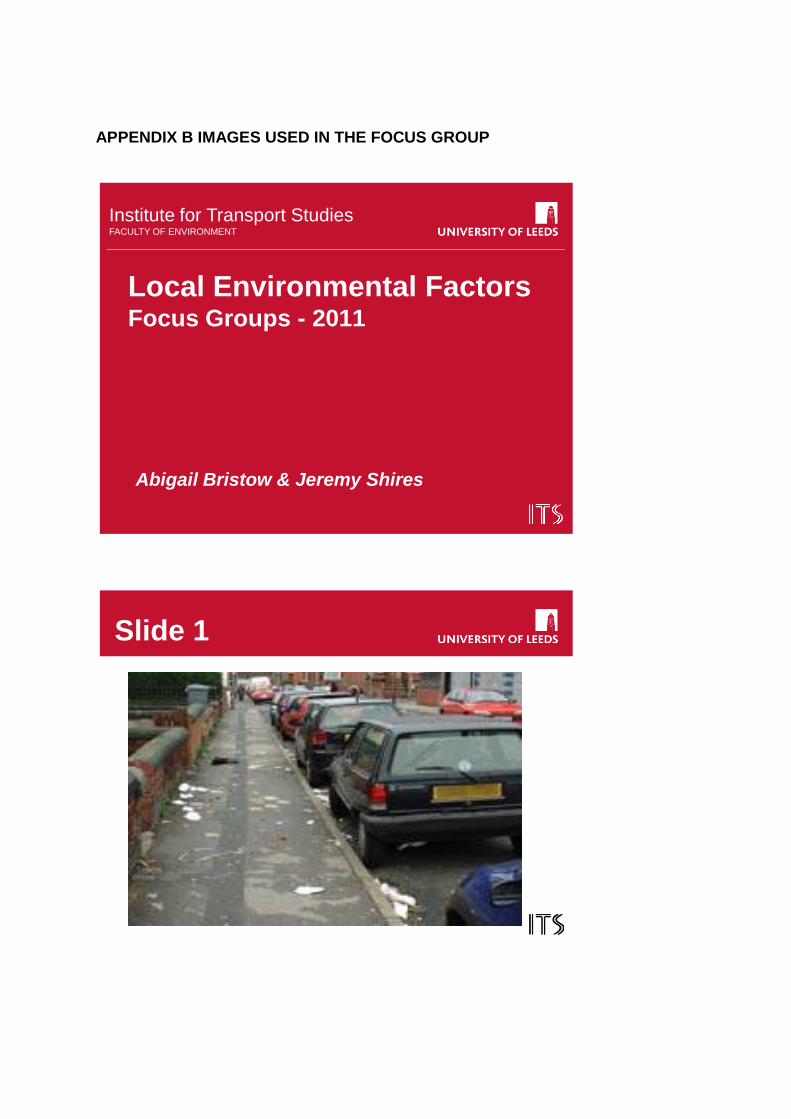
2.2 Litter
Slide 1 Worst Picture of Litter
Whilst litter came across first and obviously – as in „it looks like a Saturday morning‟. There
were other features that participants also commented on:
Poor parking – lots of gaps between the cars – „it‟s a pet hate of mine‟
Poor hygiene
The locals don‟t care about their area.
One participant was not bothered by the litter on the road but was upset by the litter on the
pavement, i.e. „The council will eventually clean up the litter on the road but not on the
pavement‟.
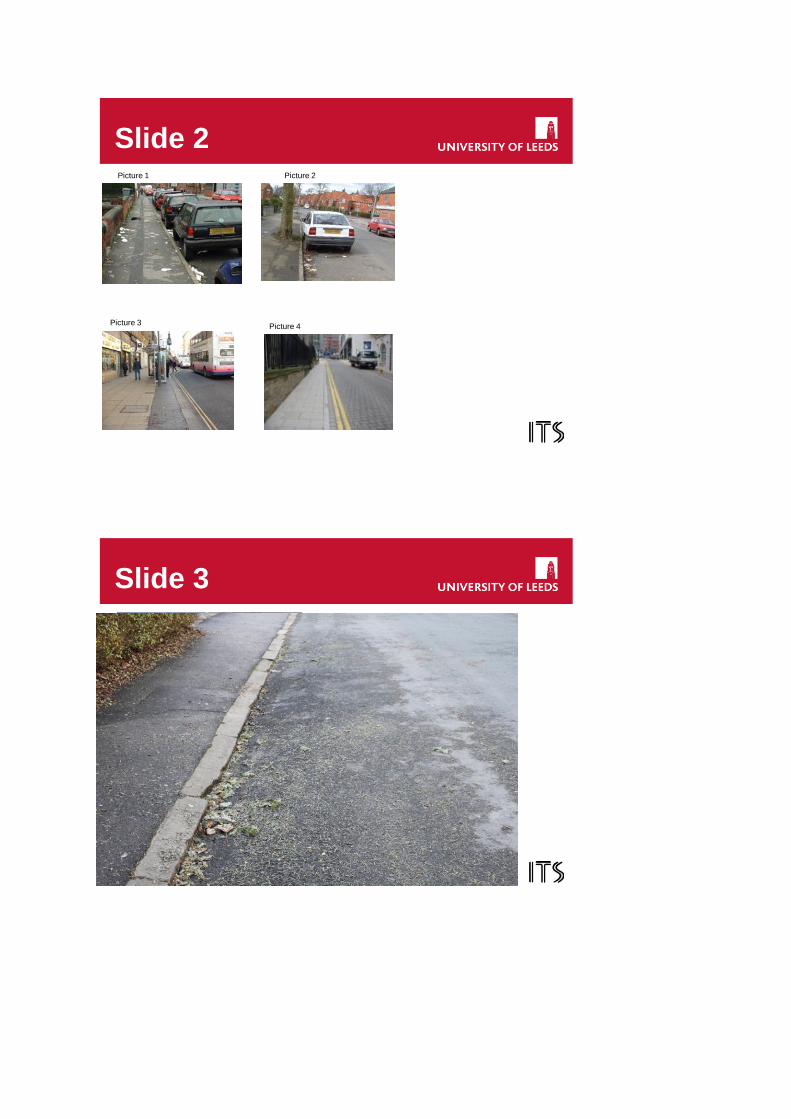
Slide 2 Graded Litter Pictures – 4 levels (NI195 standards pictures)
A number of key points came out of the discussion:
P1 (in each set of pictures they are numbered with P1 being the worst state for the
factor) looks more like overspill from the bins rather than just litter.
The pictures show different types of streets – doesn‟t seem right to be comparing
residential streets (P1 & 2) and city centre streets (P3 & 4). You need to have all the
same type.
You would expect the city centre pictures to be cleaner – they have yellow lines so
street cleaning vehicles can access them easily.
Impact of litter will vary according to the context, i.e. „I would be very disturbed to see
litter in a green area or in gardens but not so much on the road or pavement‟.
Conclusion - Litter
Whilst the NI195 pictures do illustrate different levels of littering, they also introduce
confounding factors by showing very different types of area. This is understandable as they
are designed to illustrate measurable standards to those with responsibility for such
measurement, not to present different levels to the general public. To avoid any confusion a
decision was made to seek pictures of similar residential areas with differing degrees of litter
as the focus of the study is the local environment.
2.3 Detritus
Slide 3 Worst Picture of Detritus
There was some initial confusion as to what this picture was meant to show with several
comments on the state of the pavement and road. After prompting the consensus view was
that this was not a problem, i.e. „it‟s part of nature‟, „it‟s a seasonal thing – you expect to see
that‟.
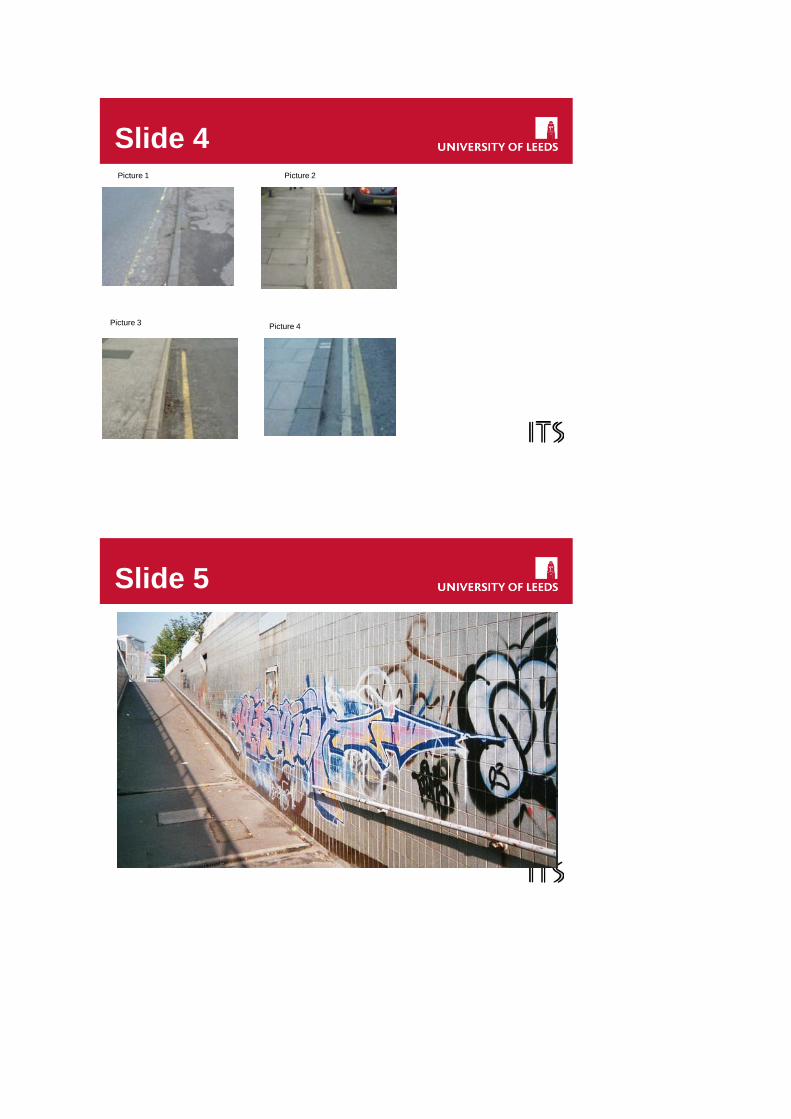
Slide 4 Graded Detritus Pictures - 4 levels (NI195 standards pictures)
There was a strong feeling that the condition of the pavement and roads drew your attention
not the detritus, particularly the state of the yellow lines. It was seen to be difficult to grade
the detritus, particularly as the condition of the roads differed markedly across the pictures.
After prompting, there was a general feeling that it would only become an issue if it was
allowed to build up over time, i.e. „it would not look nice if a substantial amount was left‟, „it
would make cycling a bit more tricky‟, „could make it more difficult for pedestrians if it got
onto the pavement – would be more slippy‟.
Conclusion - Detritus
There was a consensus within and between groups that the NI195 pictures drew attention to
the differing state of the road and yellow lines rather than the detritus. There was also a
view that detritus was not a problem at these levels. Again the decision was to take further
photos – perhaps at only two or three levels given the difficulty in showing variation and the
relative lack of importance attributed to this attribute.
2.4 Graffiti
Slide 5 Worst Picture of Graffiti
There was a consensus that this type of graffiti looks „quite good‟ and is enhancing an
otherwise rundown environment. A clear distinction seemed to be drawn between „good
graffiti‟ and „bad graffiti‟. The former is „artistic‟, „colourful/bright‟ whilst the latter is „scruffy‟,
„offensive‟, „tags‟. The setting is also important and adds another layer to whether graffiti is
„good‟ or „bad‟, i.e. city centre vs Roundhay; concrete wall vs sandstone side of a house.
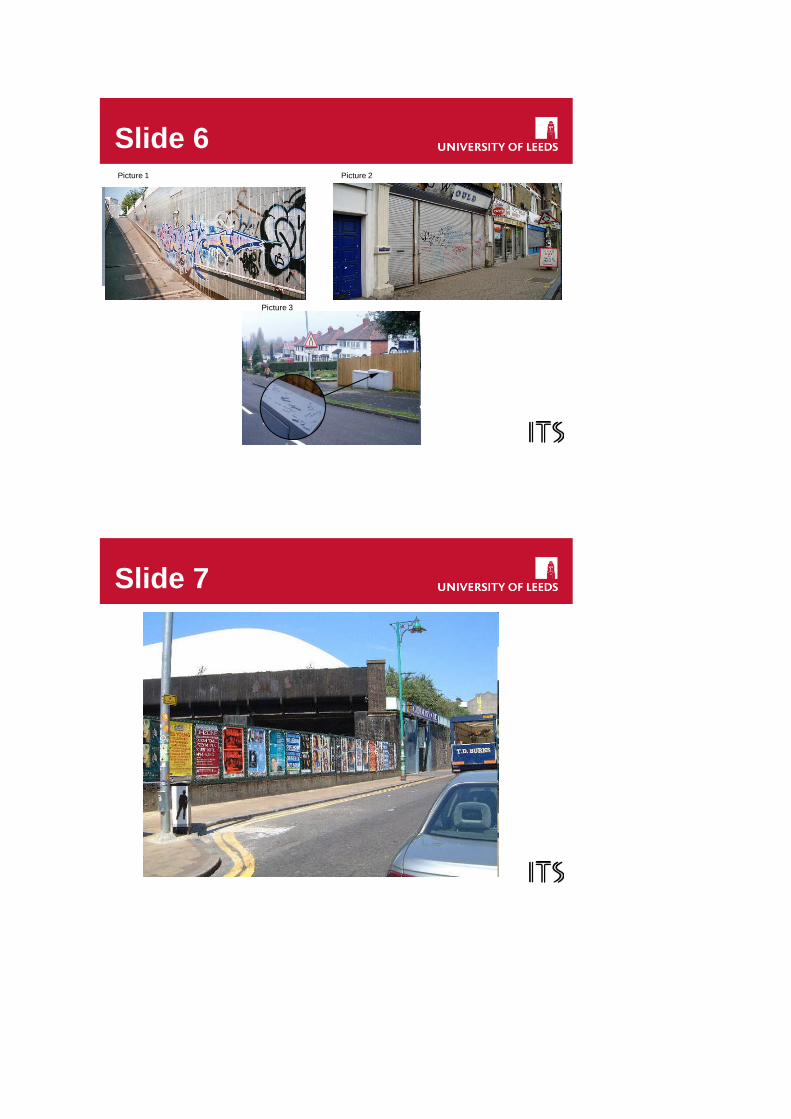
Slide 6 Graded Graffiti Pictures – 3 images (NI195 standards pictures)
P2 looks much worse than P1.
P3 is very minor and not seen as a problem.
Conclusion - Graffiti
The image perceived to be of “artistic” graffiti was removed from the set due to the feeling
within the groups that this was a good thing in the environment shown. The picture of the
shop front was effective and, again there was a need to seek further images.
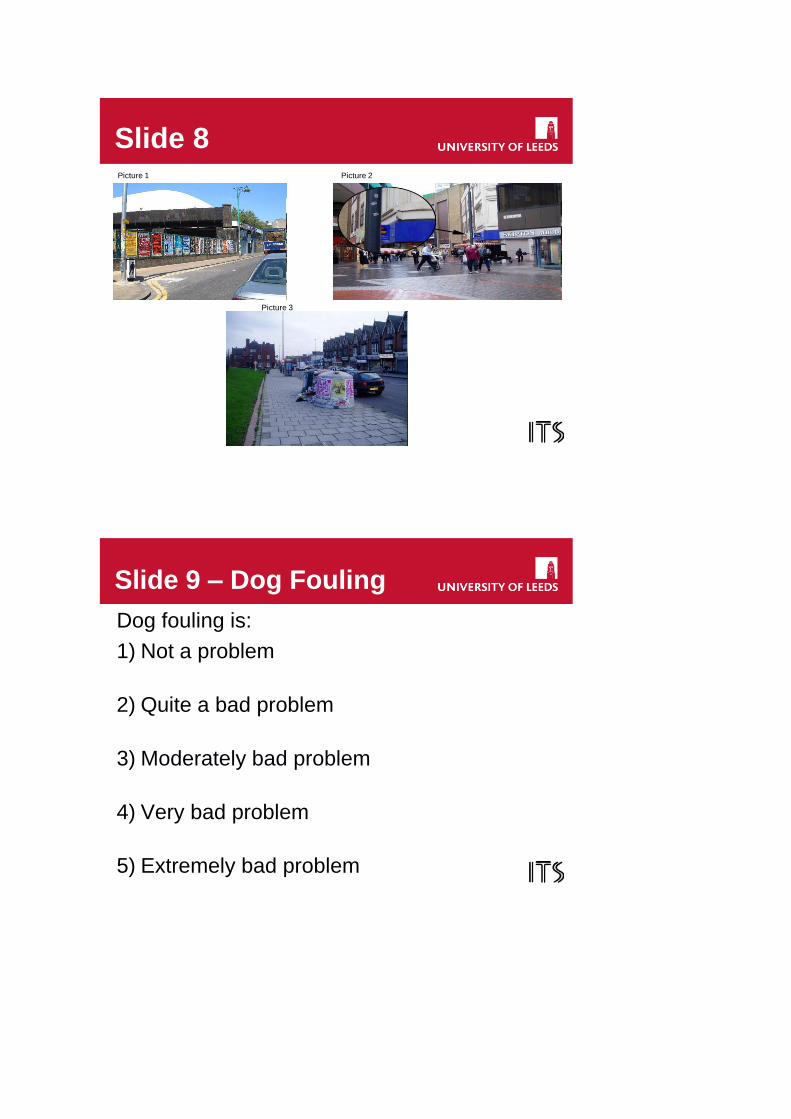
2.5 Fly-posting
Slide 7 Worst Picture of Fly-posting
One group viewed this in a similar way to the “worst” graffiti image, thus it wasn‟t a problem
because it was brightening up an otherwise run down area. The posters also had
information value. The same group felt that the examples of fly-posting on lampposts within
this picture were much worse because, „they don‟t belong there‟. The other group‟s initial
reaction was that there were lots of other „things‟ going on in the background which
distracted them from focusing on the fly-posting. When prompted about the fly-posting –
they too felt that it wasn‟t an issue as it was in an appropriate/designated area.
Slide 8 Graded Fly-Posting Pictures – 3 images (NI195 standards pictures)
It was agreed by everyone that P2 (stickers very high up on lamppost) would not register
with them. P3 (fly-posting on recycling bins) was felt to be worse that P1 as it wasn‟t
appropriate to put them on there. One view was that, „because it isn‟t in a designated area
then the posters will get out of date – thus they have no information value and just wear
away‟. There was a strong view that with P3 some of the emphasis is taken away from the
fly-posting because of the rubbish beside the recycle bins (and their ugliness to begin with).
Conclusion Fly-posting
Again there are confounding effects in the images and the response is not clear – with the
most severe image being viewed favourably and the second worst seen as more about
rubbish. It is clear that different images are needed or a move to a verbal scale. Again it
seems that three levels may be adequate.
2.6 Dog Fouling
Here four different scales were tested:
Slide 9 Dog Fouling – Problem scale
Overwhelming agreement that words are better than pictures here. Participants found it easy
to agree with a description of a very bad situation, i.e. „you are having to look around you all
the time to avoid it‟. But it was more difficult to describe lower levels. Felt probably too
many levels.
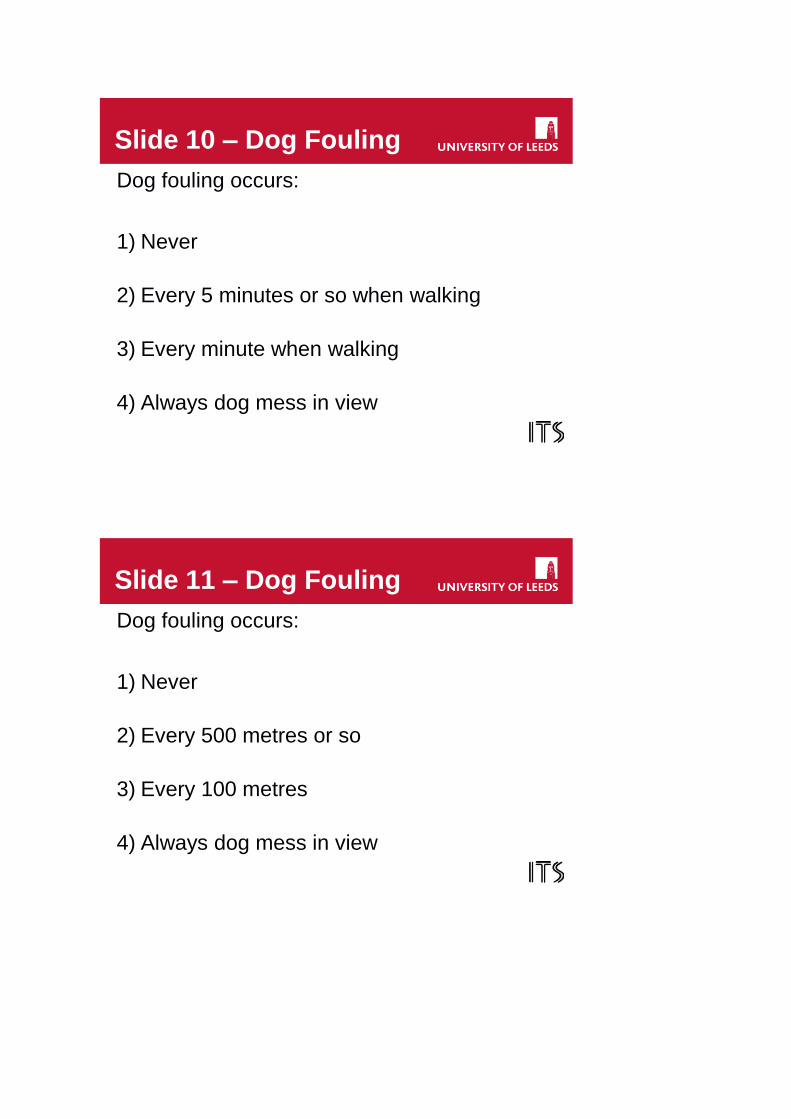
Slide 10 Dog Fouling – Time Occurrence scale
There was a clear view that this was much better and easier to interpret. A feeling that rating
this might vary with location, i.e. park vs city centre. Where there was a view that a park
should be free of fouling. Suggested that respondents be told what area it should apply to.
In terms of the scales used felt that the jump between never to every 5 minutes was too
large so need an extra scale or a general revision.
Slide 11 Dog Fouling – Distance Occurrence scale
There was a view that „judging distances is much harder than judging time‟.
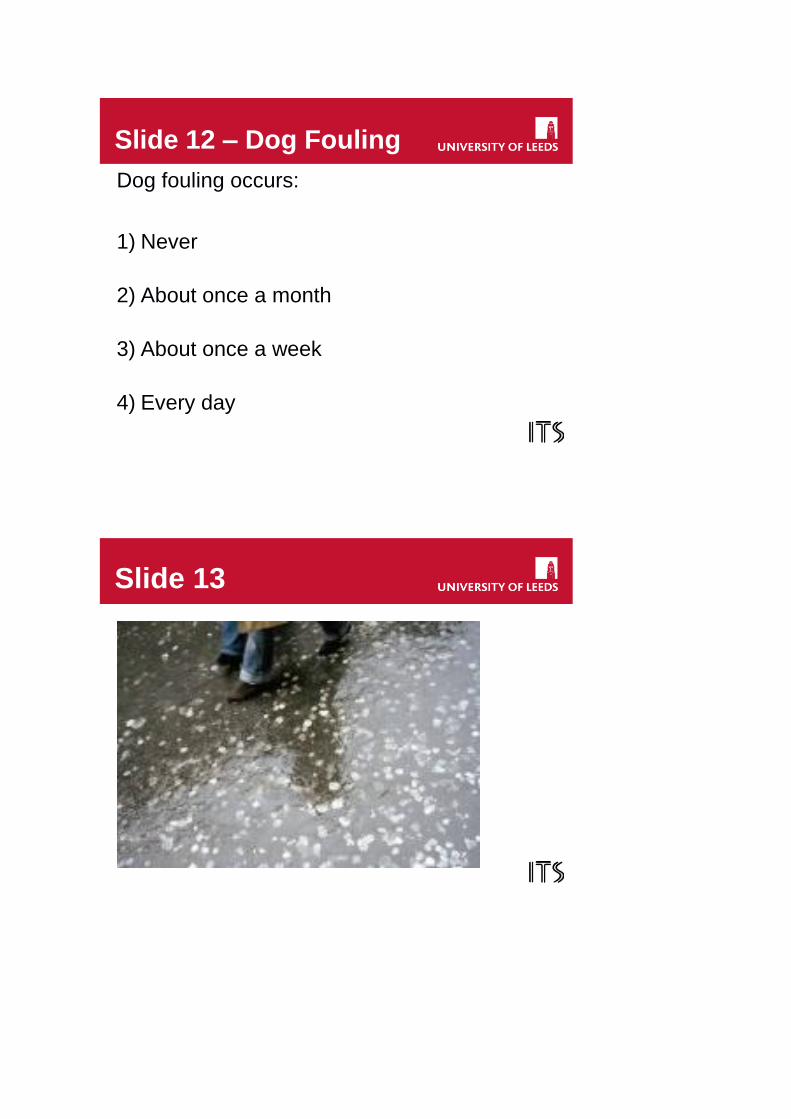
Slide 12 Dog Fouling – Monthly/weekly Occurrence
Here the groups differed. One group thought this was very clear but the other found too
difficult to imagine recalling that information. The groups agreed that “fouling” was the right
word to use. There was also some discussion around the “never” end of the scale – this
might be better expressed as “never or extremely rarely”.
Conclusion – Dog Fouling
A verbal scale based on frequency of occurrence appeared to perform best.

2.7 Discarded Chewing Gum
Slide 13 Worst Picture of Chewing Gum
Both groups agreed that it looked like an extreme level of discarded chewing gum. When
asked what else it could look like some people suggested coins in a well (it had been
raining) or bird droppings. It would be much clearer if the picture had been taken when the
weather was dry.
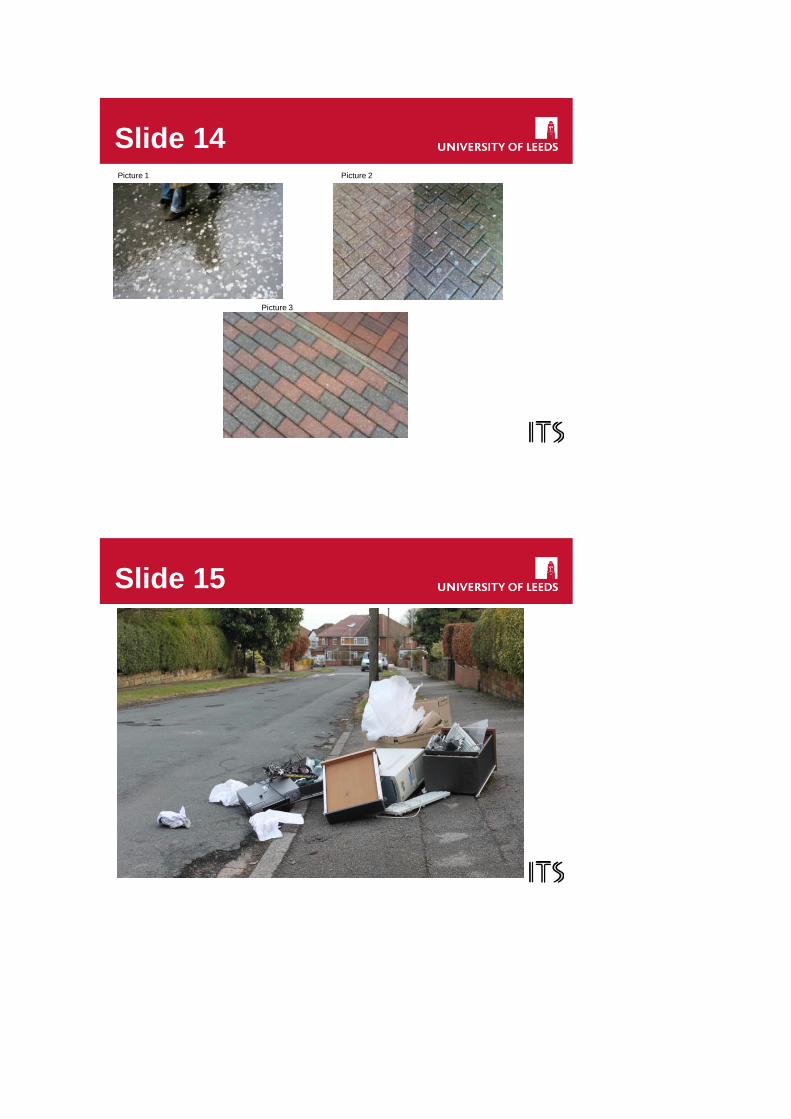
Slide 14 Graded Pictures of Chewing Gum
Agreement that whilst the grading was fine there was a need for all the pictures to be on the
same road or pavement surface and in dry conditions
Conclusion – discarded chewing gum
The pictures do show the levels clearly – but pictures should be obtained to show the
different levels on the same surface. Three levels as here.
2.8 Fly-tipping
When asked a preliminary question about what image fly-tipping conjured up the responses
reached a consensus based around „the dumping of household and industrial waste in quiet
country lanes or wasteland areas, out of view/sight‟, „Vans pulling up in a lay by and throwing
out rubbish particularly industrial waste that would costs firms money to dispose of it‟, „Not
pleasant rubbish hidden in black bin liners‟, „sofas, mattresses‟.
Slide 15 Worst Picture of Fly-Tipping
Strong consensus that the picture shown was not „fly-tipping‟, rather it was rubbish left out
for the bin men to pick up because it was in an urban street environment; the material was
„too personal‟ to be fly-tipping
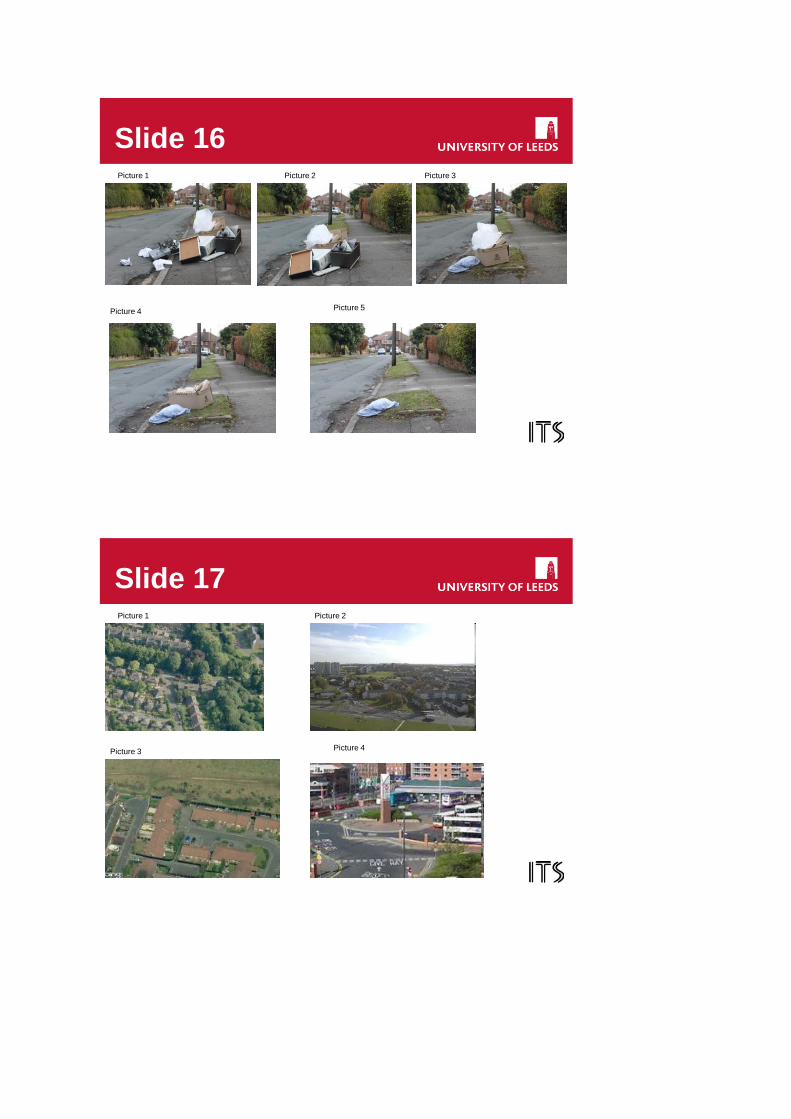
Slide 16 Graded Pictures of Fly-Tipping
As per slide 16.
Conclusion – Fly-tipping
The groups clearly felt that fly-tipping does not occur in standard residential contexts.
Therefore images were needed that show the “typical” levels of such waste – bin bags
and/or furniture in a more appropriate context.
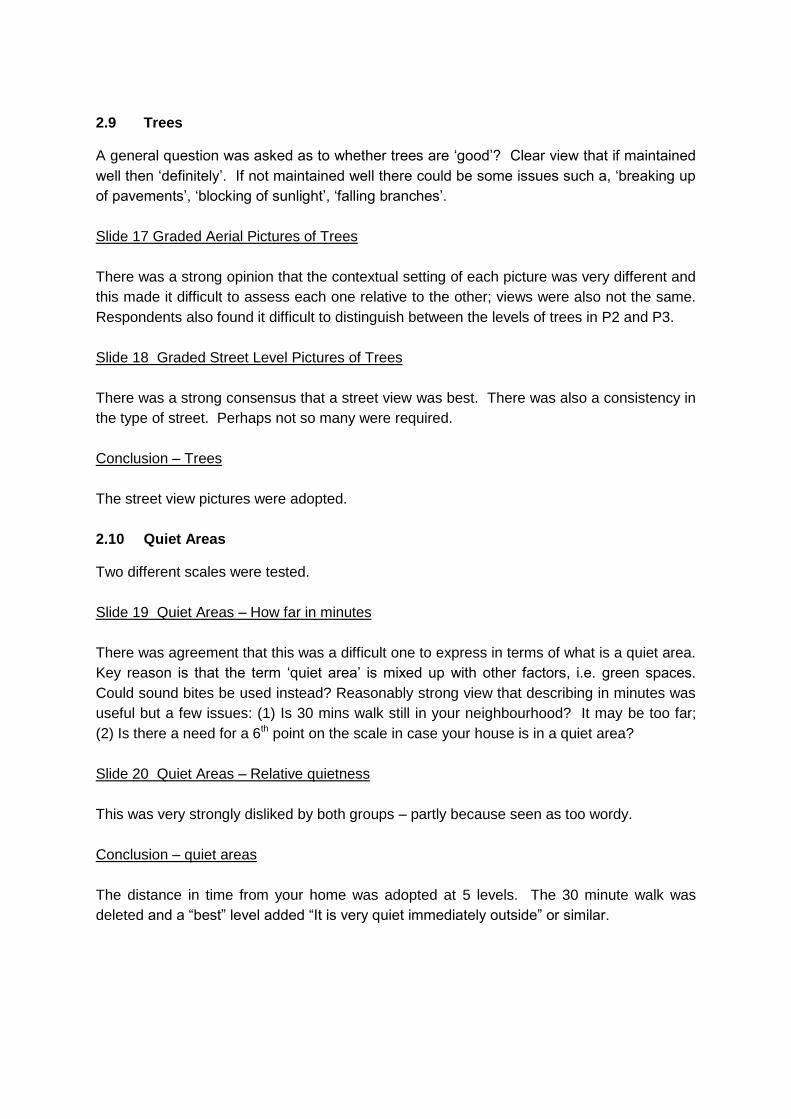
2.9 Trees
A general question was asked as to whether trees are „good‟? Clear view that if maintained
well then „definitely‟. If not maintained well there could be some issues such a, „breaking up
of pavements‟, „blocking of sunlight‟, „falling branches‟.
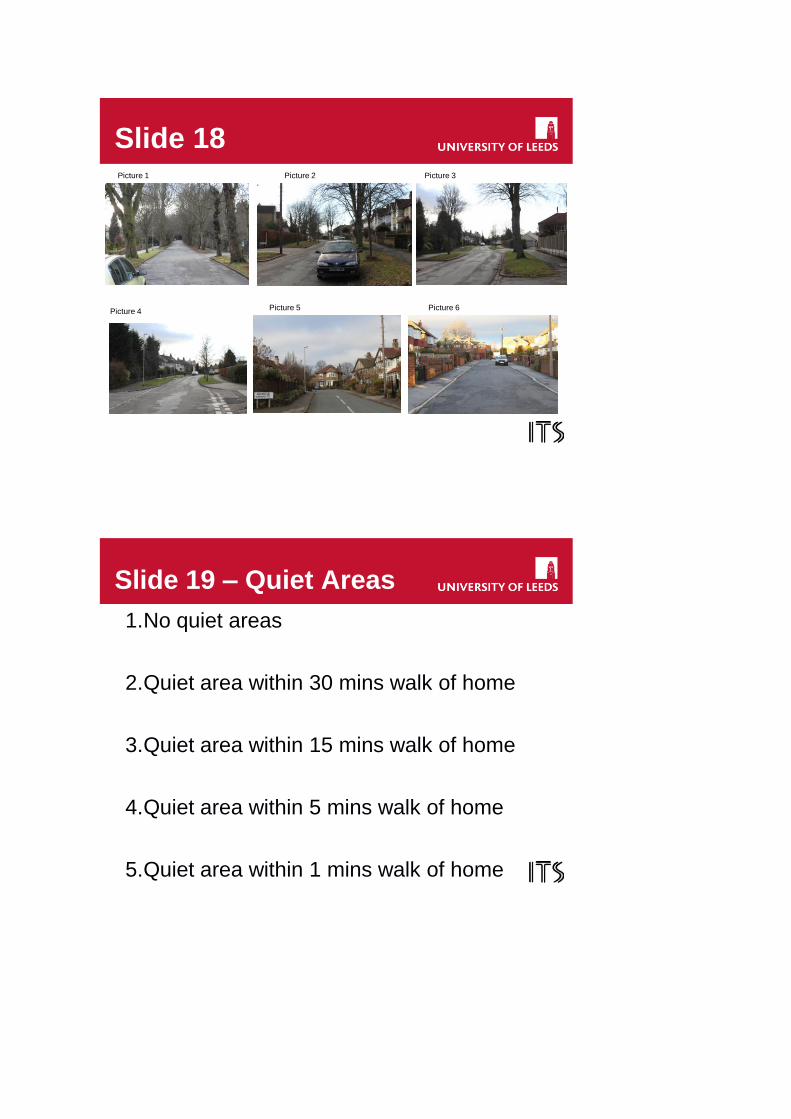
Slide 17 Graded Aerial Pictures of Trees
There was a strong opinion that the contextual setting of each picture was very different and
this made it difficult to assess each one relative to the other; views were also not the same.
Respondents also found it difficult to distinguish between the levels of trees in P2 and P3.
Slide 18 Graded Street Level Pictures of Trees
There was a strong consensus that a street view was best. There was also a consistency in
the type of street. Perhaps not so many were required.
Conclusion – Trees
The street view pictures were adopted.
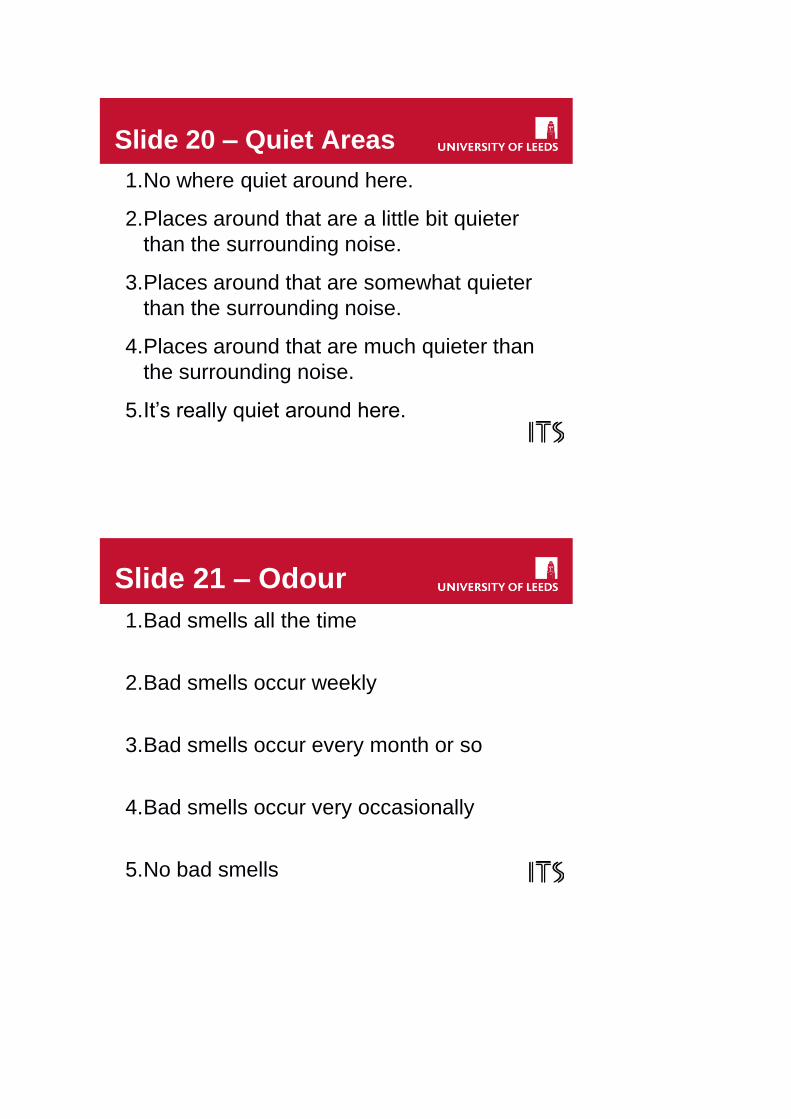
2.10 Quiet Areas
Two different scales were tested.
Slide 19 Quiet Areas – How far in minutes
There was agreement that this was a difficult one to express in terms of what is a quiet area.
Key reason is that the term „quiet area‟ is mixed up with other factors, i.e. green spaces.
Could sound bites be used instead? Reasonably strong view that describing in minutes was
useful but a few issues: (1) Is 30 mins walk still in your neighbourhood? It may be too far;
(2) Is there a need for a 6th point on the scale in case your house is in a quiet area?
Slide 20 Quiet Areas – Relative quietness
This was very strongly disliked by both groups – partly because seen as too wordy.
Conclusion – quiet areas
The distance in time from your home was adopted at 5 levels. The 30 minute walk was
deleted and a “best” level added “It is very quiet immediately outside” or similar.
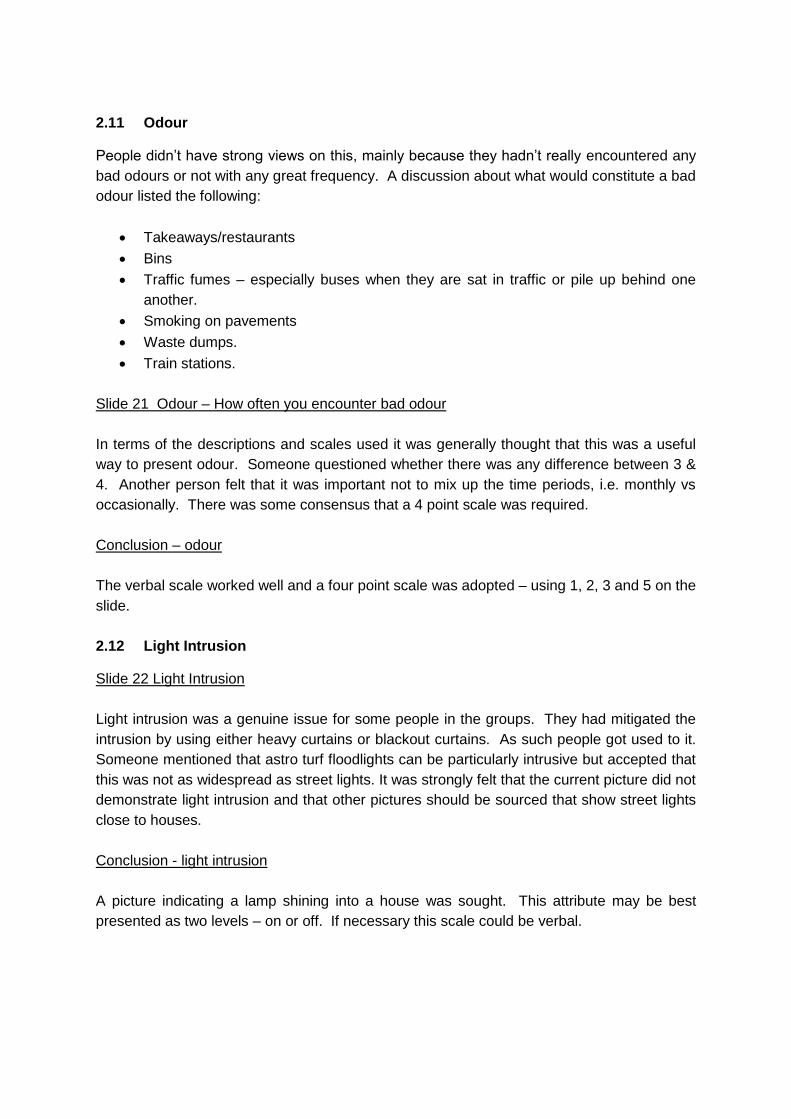
2.11 Odour
People didn‟t have strong views on this, mainly because they hadn‟t really encountered any
bad odours or not with any great frequency. A discussion about what would constitute a bad
odour listed the following:
Takeaways/restaurants
Bins
Traffic fumes – especially buses when they are sat in traffic or pile up behind one
another.
Smoking on pavements
Waste dumps.
Train stations.
Slide 21 Odour – How often you encounter bad odour
In terms of the descriptions and scales used it was generally thought that this was a useful
way to present odour. Someone questioned whether there was any difference between 3 &
4. Another person felt that it was important not to mix up the time periods, i.e. monthly vs
occasionally. There was some consensus that a 4 point scale was required.
Conclusion – odour
The verbal scale worked well and a four point scale was adopted – using 1, 2, 3 and 5 on the
slide.
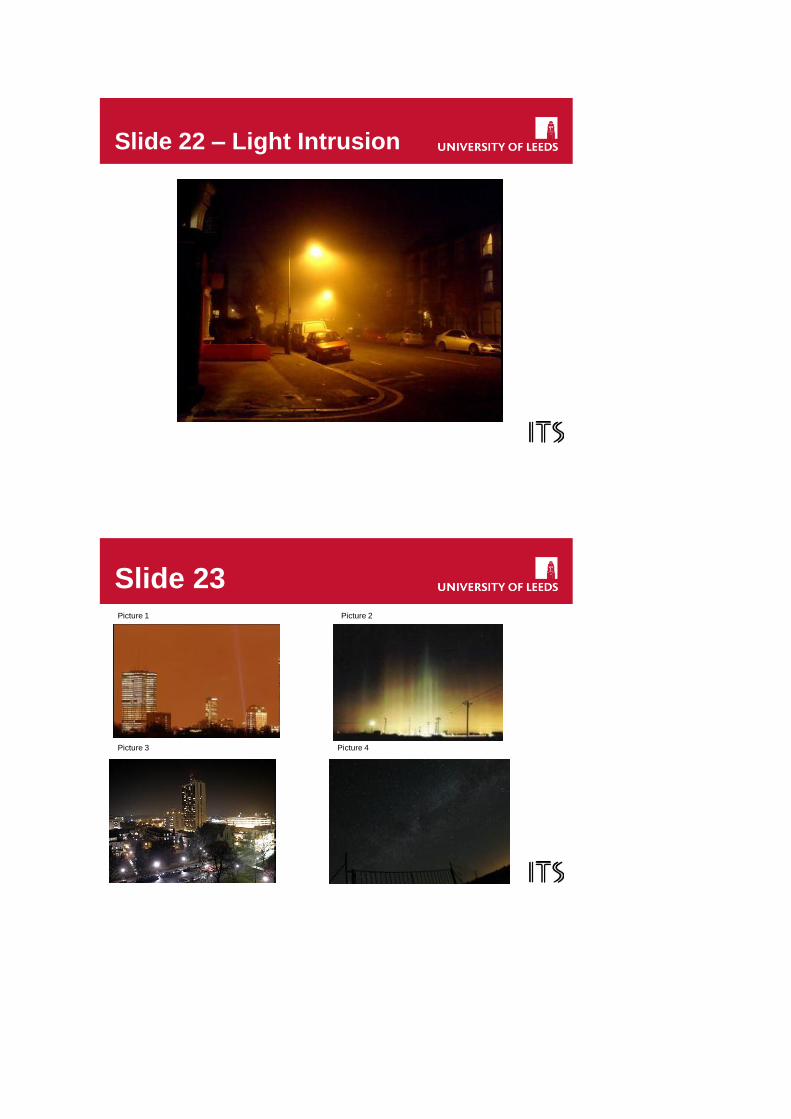
2.12 Light Intrusion
Slide 22 Light Intrusion
Light intrusion was a genuine issue for some people in the groups. They had mitigated the
intrusion by using either heavy curtains or blackout curtains. As such people got used to it.
Someone mentioned that astro turf floodlights can be particularly intrusive but accepted that
this was not as widespread as street lights. It was strongly felt that the current picture did not
demonstrate light intrusion and that other pictures should be sourced that show street lights
close to houses.
Conclusion - light intrusion
A picture indicating a lamp shining into a house was sought. This attribute may be best
presented as two levels – on or off. If necessary this scale could be verbal.
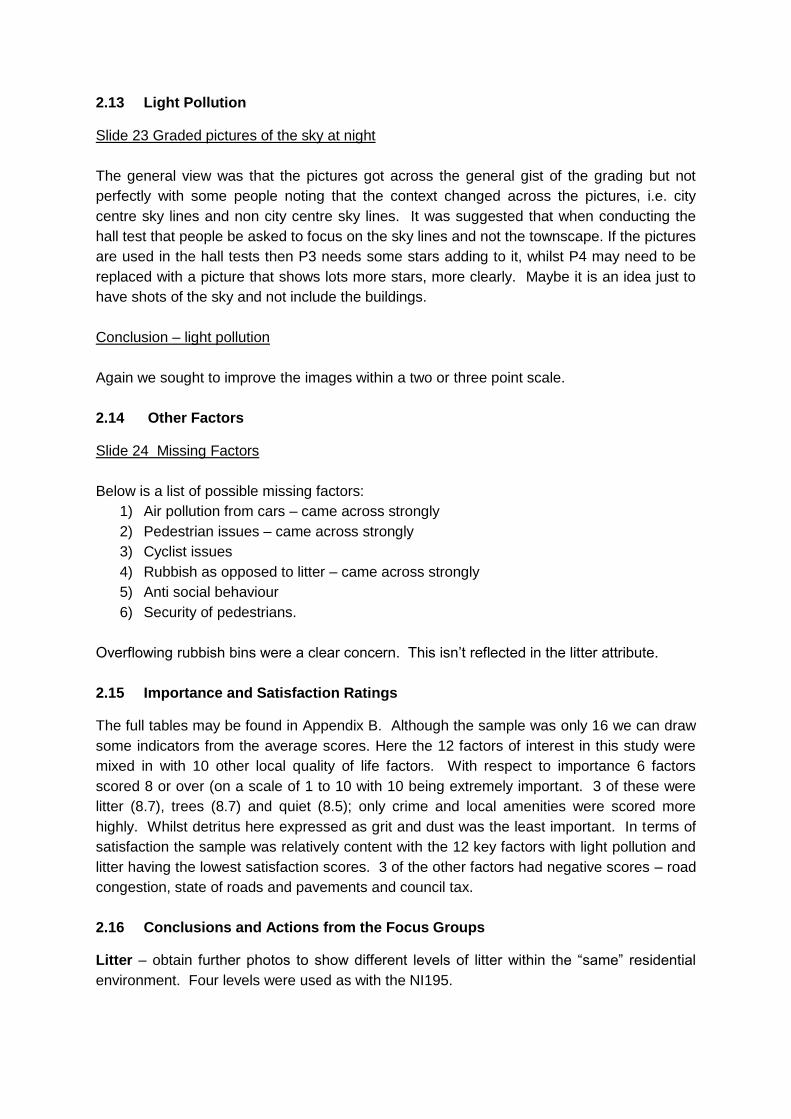
2.13 Light Pollution
Slide 23 Graded pictures of the sky at night
The general view was that the pictures got across the general gist of the grading but not
perfectly with some people noting that the context changed across the pictures, i.e. city
centre sky lines and non city centre sky lines. It was suggested that when conducting the
hall test that people be asked to focus on the sky lines and not the townscape. If the pictures
are used in the hall tests then P3 needs some stars adding to it, whilst P4 may need to be
replaced with a picture that shows lots more stars, more clearly. Maybe it is an idea just to
have shots of the sky and not include the buildings.
Conclusion – light pollution
Again we sought to improve the images within a two or three point scale.
2.14 Other Factors
Slide 24 Missing Factors
Below is a list of possible missing factors:
1) Air pollution from cars – came across strongly
2) Pedestrian issues – came across strongly
3) Cyclist issues
4) Rubbish as opposed to litter – came across strongly
5) Anti social behaviour
6) Security of pedestrians.
Overflowing rubbish bins were a clear concern. This isn‟t reflected in the litter attribute.
2.15 Importance and Satisfaction Ratings
The full tables may be found in Appendix B. Although the sample was only 16 we can draw
some indicators from the average scores. Here the 12 factors of interest in this study were
mixed in with 10 other local quality of life factors. With respect to importance 6 factors
scored 8 or over (on a scale of 1 to 10 with 10 being extremely important. 3 of these were
litter (8.7), trees (8.7) and quiet (8.5); only crime and local amenities were scored more
highly. Whilst detritus here expressed as grit and dust was the least important. In terms of
satisfaction the sample was relatively content with the 12 key factors with light pollution and
litter having the lowest satisfaction scores. 3 of the other factors had negative scores – road
congestion, state of roads and pavements and council tax.
2.16 Conclusions and Actions from the Focus Groups
Litter – obtain further photos to show different levels of litter within the “same” residential
environment. Four levels were used as with the NI195.
Detritus – take further photos to show different levels of detritus on otherwise similar quality
road surfaces. Given the low importance placed on this attribute alongside the difficulty of
clearly showing difference levels only three levels are used.
Graffiti - the slide of “artistic” graffiti was not used due to the feeling within the groups that
this was a good thing in the environment shown. The picture of the shop front was effective
and was used alongside four further images.
Fly-posting - again there are confounding effects in the images and the response is not
clear – with the most severe image being viewed favourably and the second worst seen as
more about rubbish. It was clear that new images were needed and five were obtained.
Dog fouling – verbal scale based on distance or occurrence worked well and was applied at
five levels.
Discarded chewing gum - the pictures do show the levels clearly – but sought to obtain
pictures showing different levels on the same surface. Three levels as here. However,
these images could be used.
Fly-tipping - needed to obtain images that show the “typical” levels of such waste – bin
bags and/or furniture in an appropriate context. Four images were used.
Trees - the street view pictures are appropriate and four levels used.
Quiet areas - the distance in time from your home at 5 levels was adopted. The 30 minute
walk was dropped and a “best” level added “It is very quiet immediately outside” or similar.
Odour - the verbal scale worked well.
Light intrusion – the difficulty in obtaining effective images led to this factor being given a
verbal scale relating to the presence and impacts of intrusion at four levels.
Light pollution – similarly a lack of images that effectively communicated this factor at
different levels led to the Adoption of a verbal scale at three levels based on the visibility of
the stars.
Essentially some scales worked well in the focus groups and others were substantially
revised prior to the pilot survey. The NI195 images do not work well in this context having
been devised to guide grading.
Images in powerpoint lose some precision and will provide “photo packs” for each
respondent. It is also necessary to be very clear about the area respondents should think of
as their local environment and this should be the area where they live.
APPENDIX B IMAGES USED IN THE FOCUS GROUP
Institute for Transport StudiesFACULTY OF ENVIRONMENT
Local Environmental FactorsFocus Groups - 2011
Abigail Bristow & Jeremy Shires
Slide 1
Slide 2Picture 1 Picture 2
Picture 3Picture 4
Slide 3
Slide 4Picture 1 Picture 2
Picture 3Picture 4
Slide 5
Slide 6Picture 1 Picture 2
Picture 3
Picture 4
Slide 7
Slide 8Picture 1 Picture 2
Picture 3
Slide 9 – Dog Fouling
Dog fouling is:
1) Not a problem
2) Quite a bad problem
3) Moderately bad problem
4) Very bad problem
5) Extremely bad problem
Slide 10 – Dog Fouling
Dog fouling occurs:
1) Never
2) Every 5 minutes or so when walking
3) Every minute when walking
4) Always dog mess in view
Slide 11 – Dog Fouling
Dog fouling occurs:
1) Never
2) Every 500 metres or so
3) Every 100 metres
4) Always dog mess in view
Slide 12 – Dog Fouling
Dog fouling occurs:
1) Never
2) About once a month
3) About once a week
4) Every day
Slide 13
Slide 14Picture 1 Picture 2
Picture 3
Slide 15
Slide 16Picture 1 Picture 2 Picture 3
Picture 4 Picture 5
Slide 17Picture 1 Picture 2
Picture 3 Picture 4
Slide 18Picture 1 Picture 2 Picture 3
Picture 4 Picture 5 Picture 6
Slide 19 – Quiet Areas
1.No quiet areas
2.Quiet area within 30 mins walk of home
3.Quiet area within 15 mins walk of home
4.Quiet area within 5 mins walk of home
5.Quiet area within 1 mins walk of home
Slide 20 – Quiet Areas
1.No where quiet around here.
2.Places around that are a little bit quieter
than the surrounding noise.
3.Places around that are somewhat quieter
than the surrounding noise.
4.Places around that are much quieter than
the surrounding noise.
5.It‟s really quiet around here.
Slide 21 – Odour
1.Bad smells all the time
2.Bad smells occur weekly
3.Bad smells occur every month or so
4.Bad smells occur very occasionally
5.No bad smells
Slide 22 – Light Intrusion
Picture 3
Slide 23Picture 1 Picture 2
Picture 3 Picture 4
Slide 22 All Factors
1.Litter
2.Grit & Dust
3.Fly-Posting
4.Graffiti
5.Dog Fouling
6.Discarded Chewing Gum
7.Fly-Tipping
8.Quiet Areas
9.Odour
10.Light Pollution – Intrusive
11.Light Pollution – The Night Sky
12.Trees
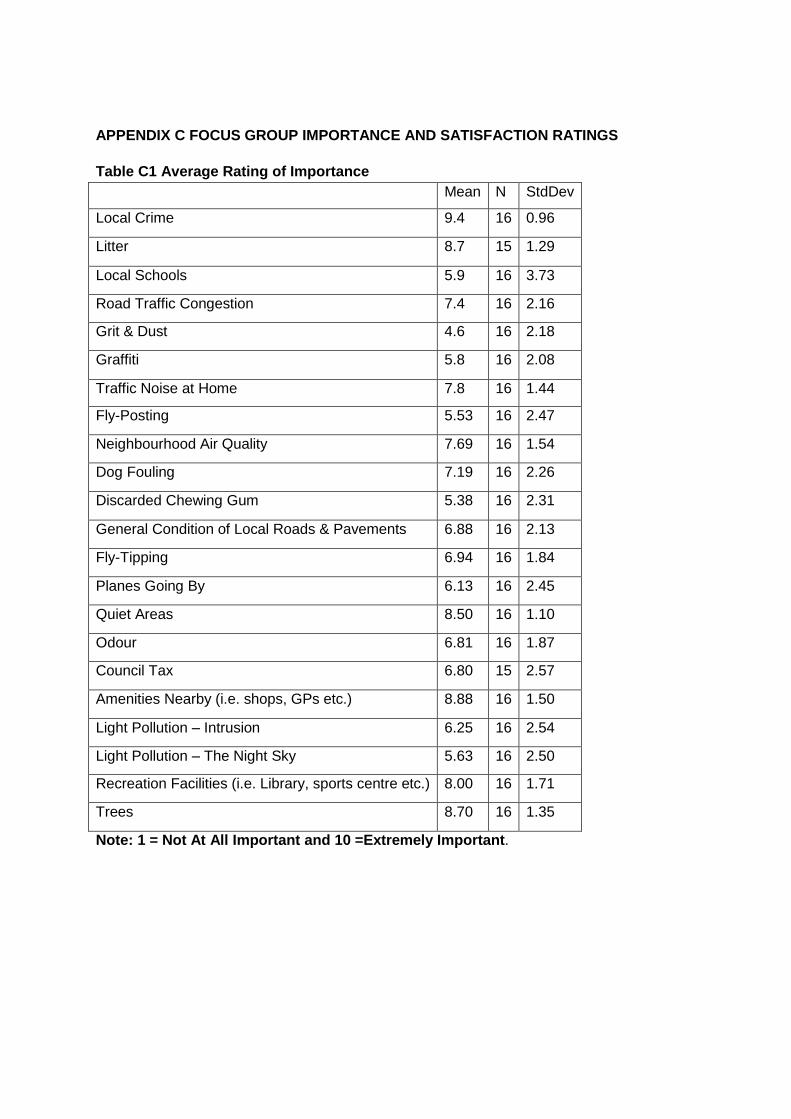
APPENDIX C FOCUS GROUP IMPORTANCE AND SATISFACTION RATINGS
Table C1 Average Rating of Importance
Mean N StdDev
Local Crime 9.4 16 0.96
Litter 8.7 15 1.29
Local Schools 5.9 16 3.73
Road Traffic Congestion 7.4 16 2.16
Grit & Dust 4.6 16 2.18
Graffiti 5.8 16 2.08
Traffic Noise at Home 7.8 16 1.44
Fly-Posting 5.53 16 2.47
Neighbourhood Air Quality 7.69 16 1.54
Dog Fouling 7.19 16 2.26
Discarded Chewing Gum 5.38 16 2.31
General Condition of Local Roads & Pavements 6.88 16 2.13
Fly-Tipping 6.94 16 1.84
Planes Going By 6.13 16 2.45
Quiet Areas 8.50 16 1.10
Odour 6.81 16 1.87
Council Tax 6.80 15 2.57
Amenities Nearby (i.e. shops, GPs etc.) 8.88 16 1.50
Light Pollution – Intrusion 6.25 16 2.54
Light Pollution – The Night Sky 5.63 16 2.50
Recreation Facilities (i.e. Library, sports centre etc.) 8.00 16 1.71
Trees 8.70 16 1.35
Note: 1 = Not At All Important and 10 =Extremely Important.
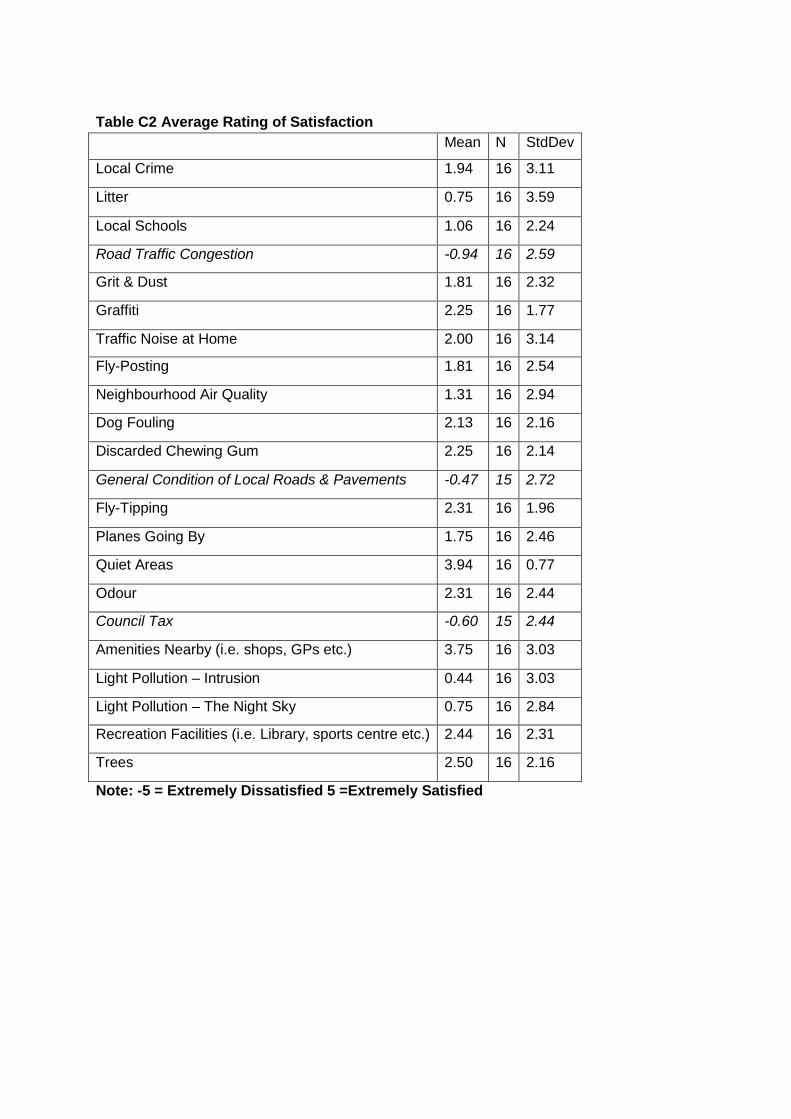
Table C2 Average Rating of Satisfaction
Mean N StdDev
Local Crime 1.94 16 3.11
Litter 0.75 16 3.59
Local Schools 1.06 16 2.24
Road Traffic Congestion -0.94 16 2.59
Grit & Dust 1.81 16 2.32
Graffiti 2.25 16 1.77
Traffic Noise at Home 2.00 16 3.14
Fly-Posting 1.81 16 2.54
Neighbourhood Air Quality 1.31 16 2.94
Dog Fouling 2.13 16 2.16
Discarded Chewing Gum 2.25 16 2.14
General Condition of Local Roads & Pavements -0.47 15 2.72
Fly-Tipping 2.31 16 1.96
Planes Going By 1.75 16 2.46
Quiet Areas 3.94 16 0.77
Odour 2.31 16 2.44
Council Tax -0.60 15 2.44
Amenities Nearby (i.e. shops, GPs etc.) 3.75 16 3.03
Light Pollution – Intrusion 0.44 16 3.03
Light Pollution – The Night Sky 0.75 16 2.84
Recreation Facilities (i.e. Library, sports centre etc.) 2.44 16 2.31
Trees 2.50 16 2.16
Note: -5 = Extremely Dissatisfied 5 =Extremely Satisfied
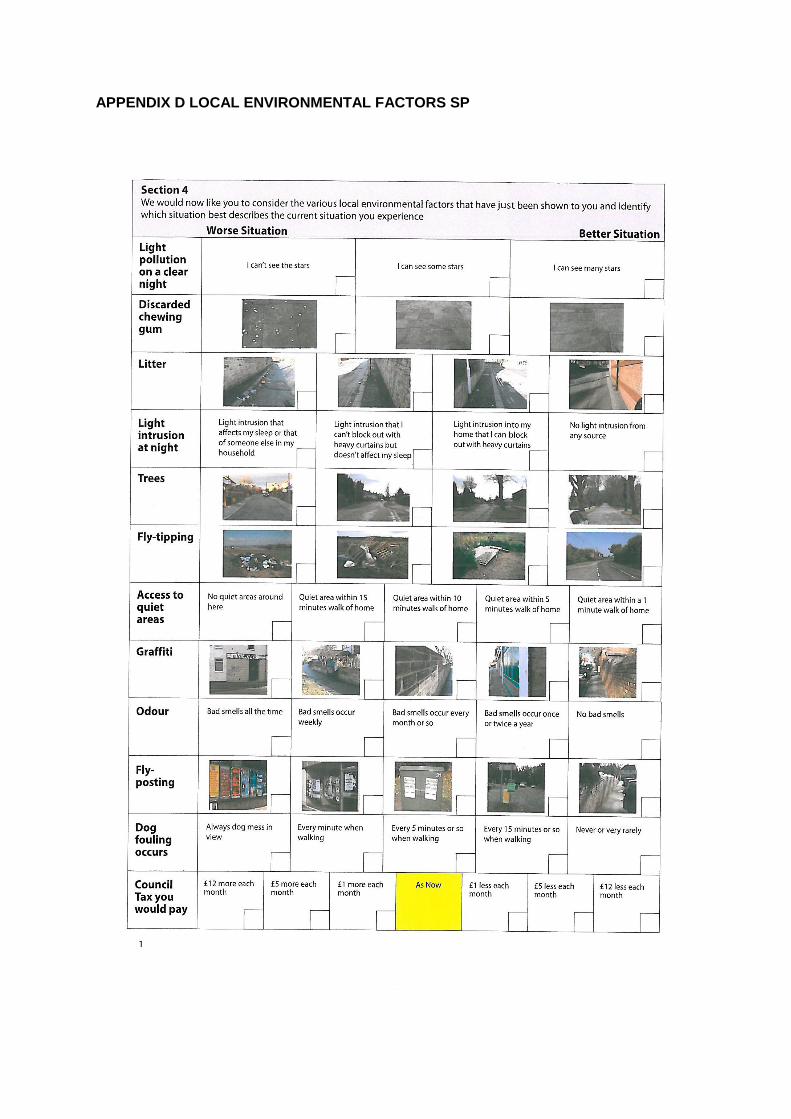
APPENDIX D LOCAL ENVIRONMENTAL FACTORS SP
APPENDIX E RATINGS PHOTOGRAPHS
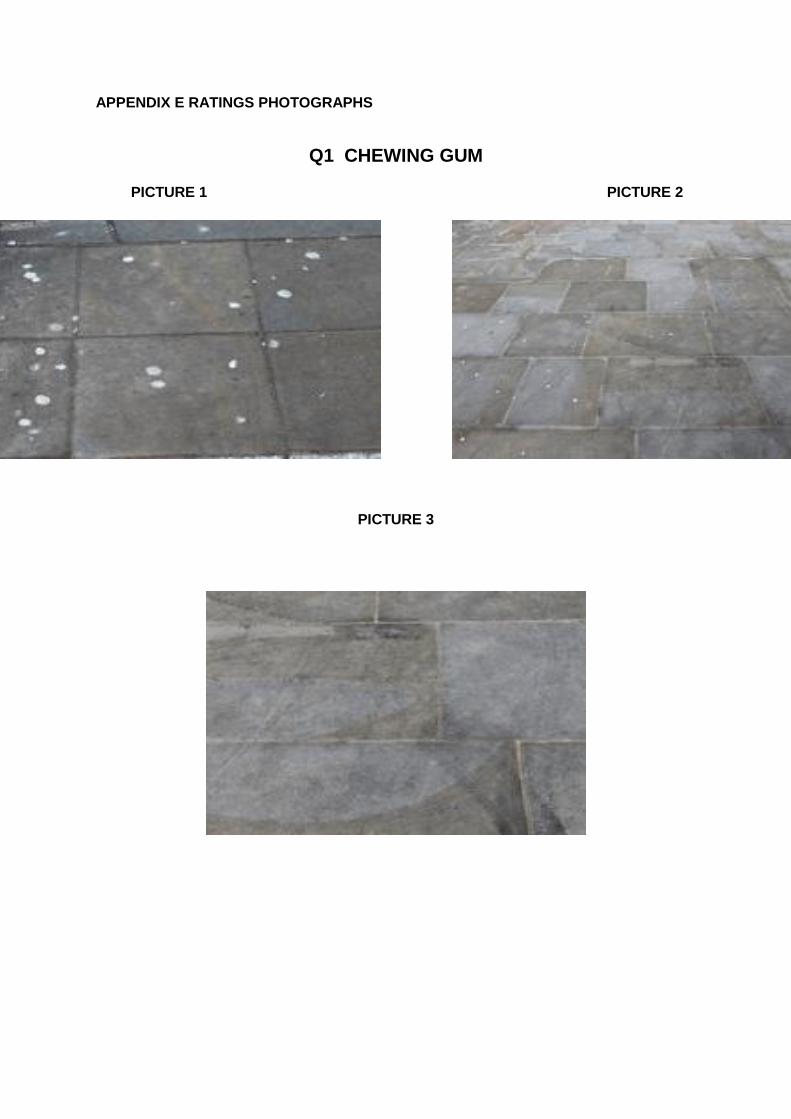
Q1 CHEWING GUM
PICTURE 1 PICTURE 2
PICTURE 3
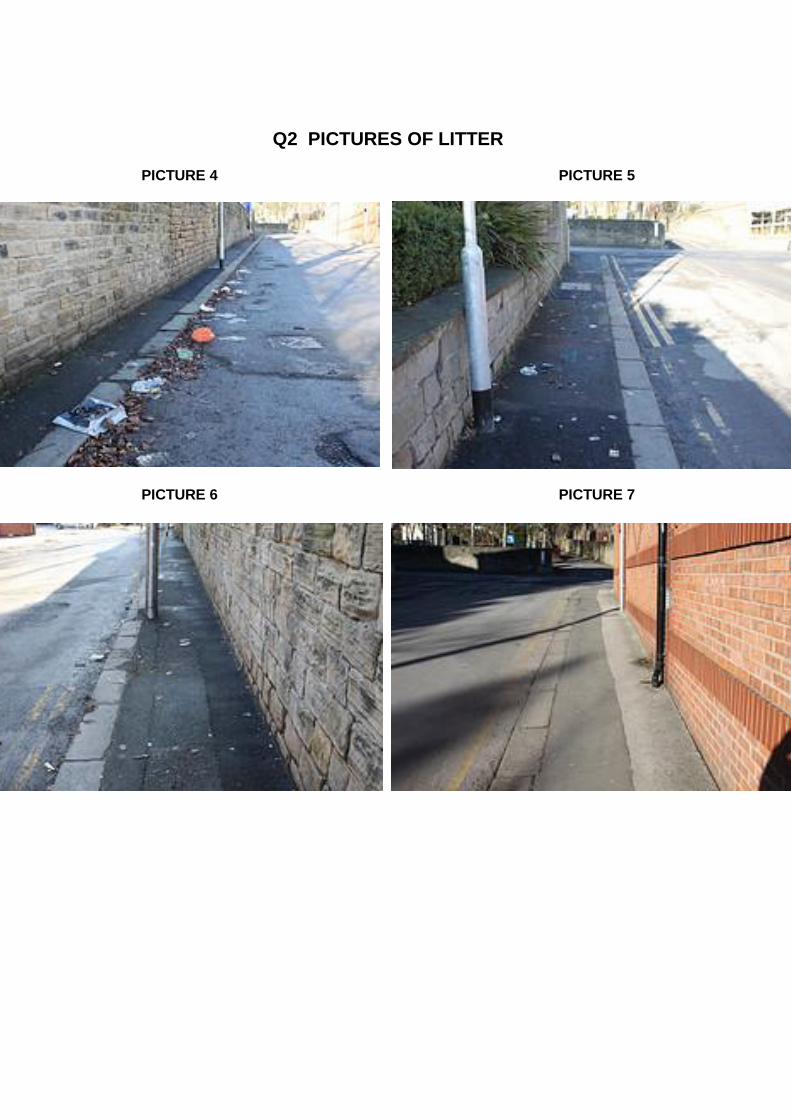
Q2 PICTURES OF LITTER
PICTURE 4 PICTURE 5
PICTURE 6 PICTURE 7
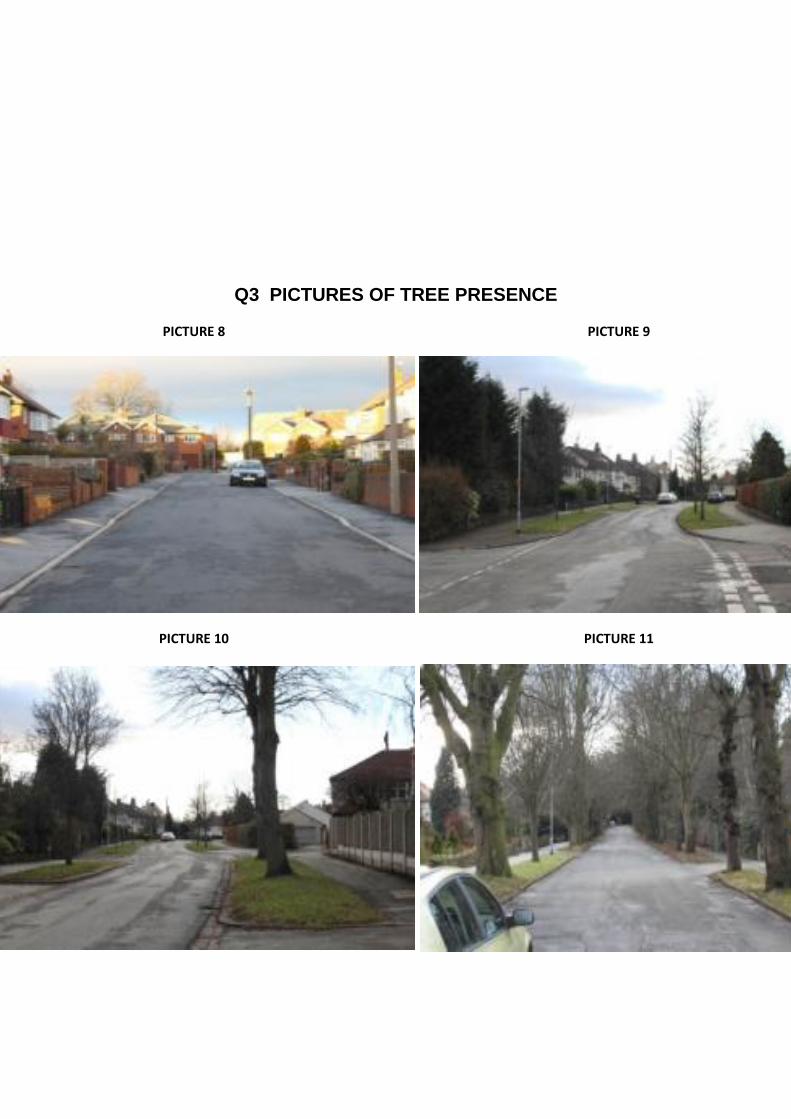
Q3 PICTURES OF TREE PRESENCE
PICTURE 8 PICTURE 9
PICTURE 10 PICTURE 11
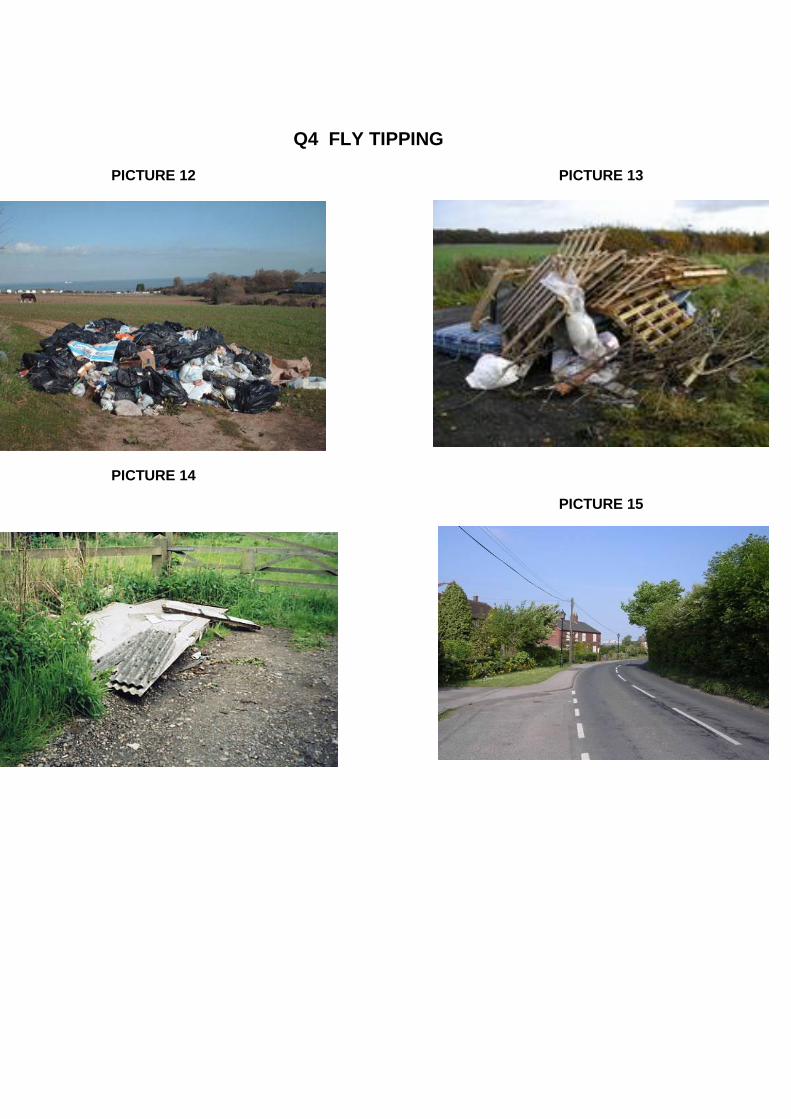
Q4 FLY TIPPING
PICTURE 12 PICTURE 13
PICTURE 14
PICTURE 15
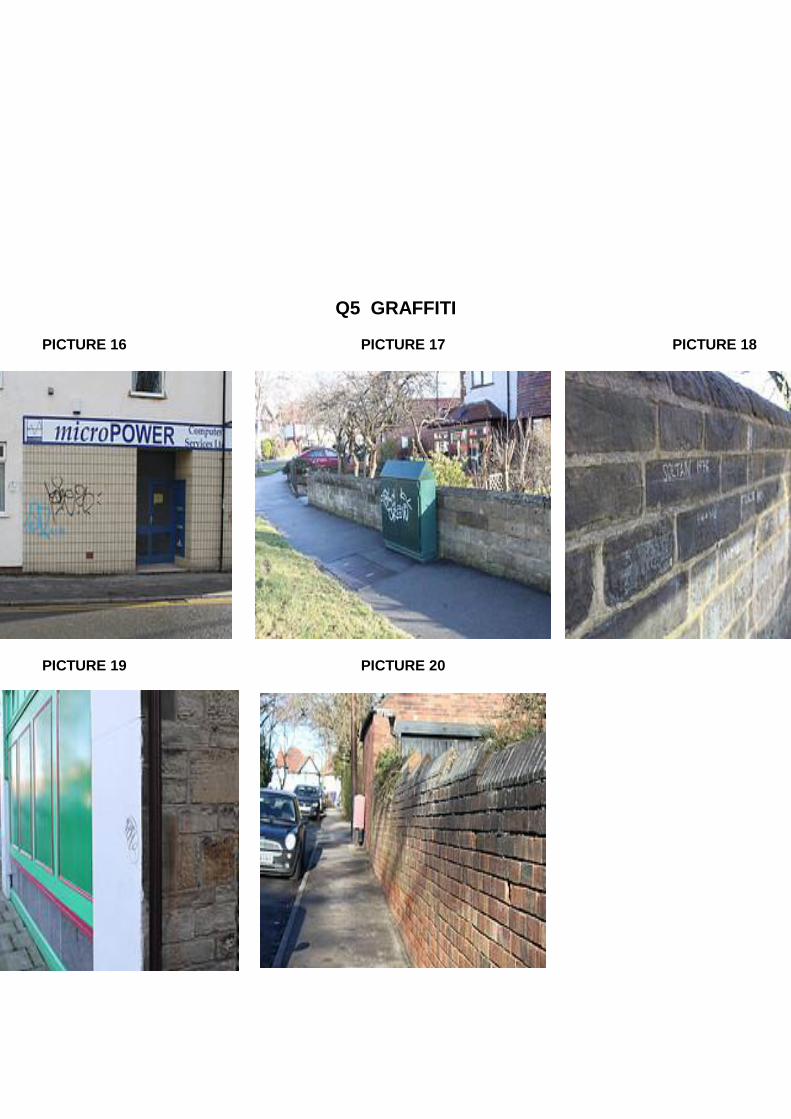
Q5 GRAFFITI
PICTURE 16 PICTURE 17 PICTURE 18
PICTURE 19 PICTURE 20
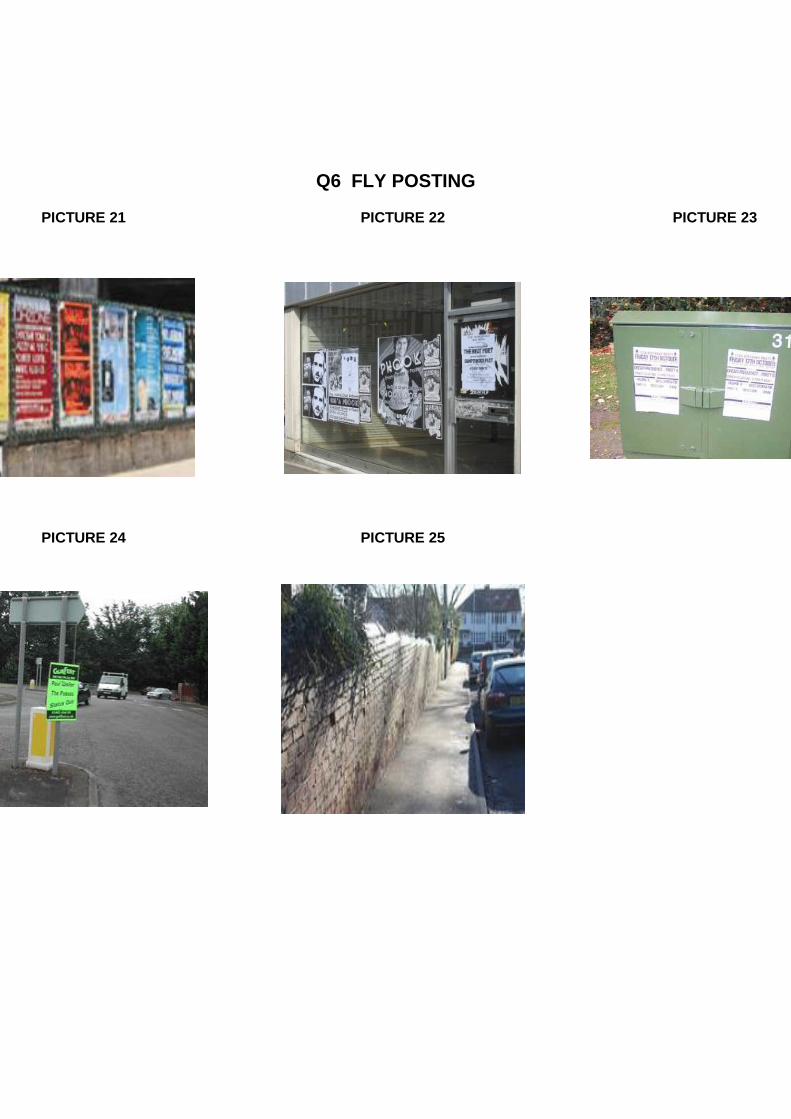
Q6 FLY POSTING
PICTURE 21 PICTURE 22 PICTURE 23
PICTURE 24 PICTURE 25
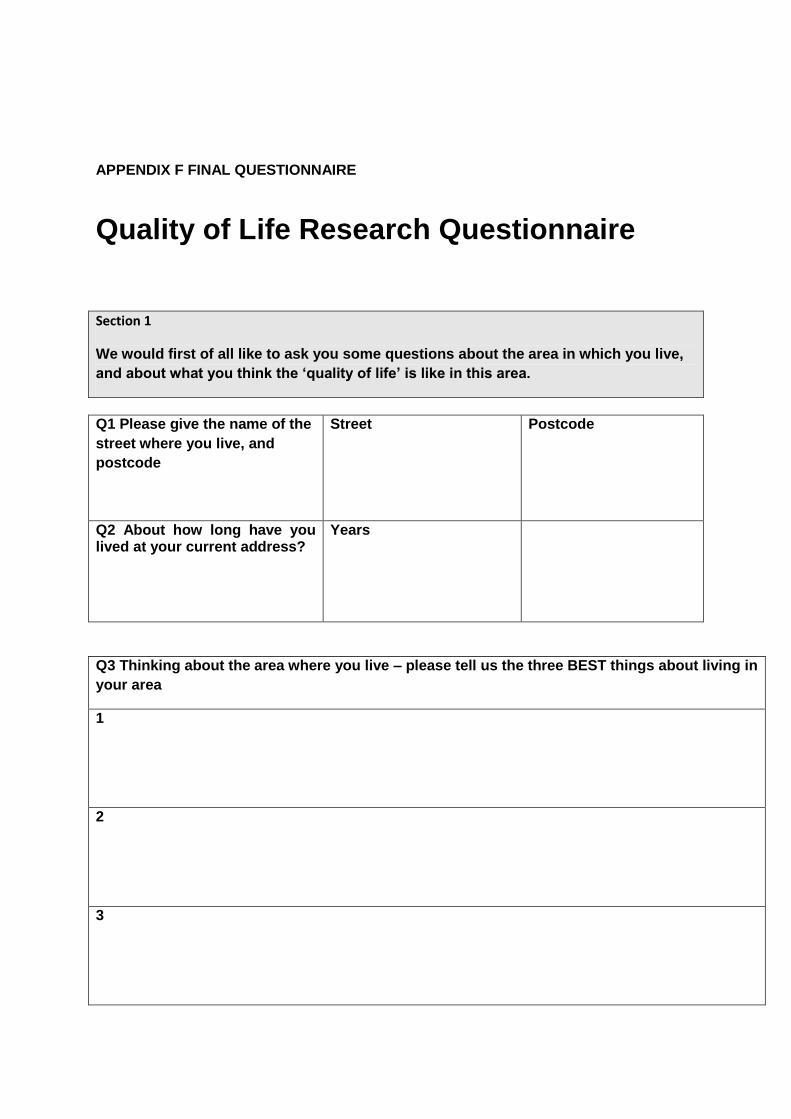
APPENDIX F FINAL QUESTIONNAIRE
Quality of Life Research Questionnaire
Section 1
We would first of all like to ask you some questions about the area in which you live,
and about what you think the ‘quality of life’ is like in this area.
Q1 Please give the name of the
street where you live, and
postcode
Street Postcode
Q2 About how long have you lived at your current address?
Years
Q3 Thinking about the area where you live – please tell us the three BEST things about living in
your area
1
2
3
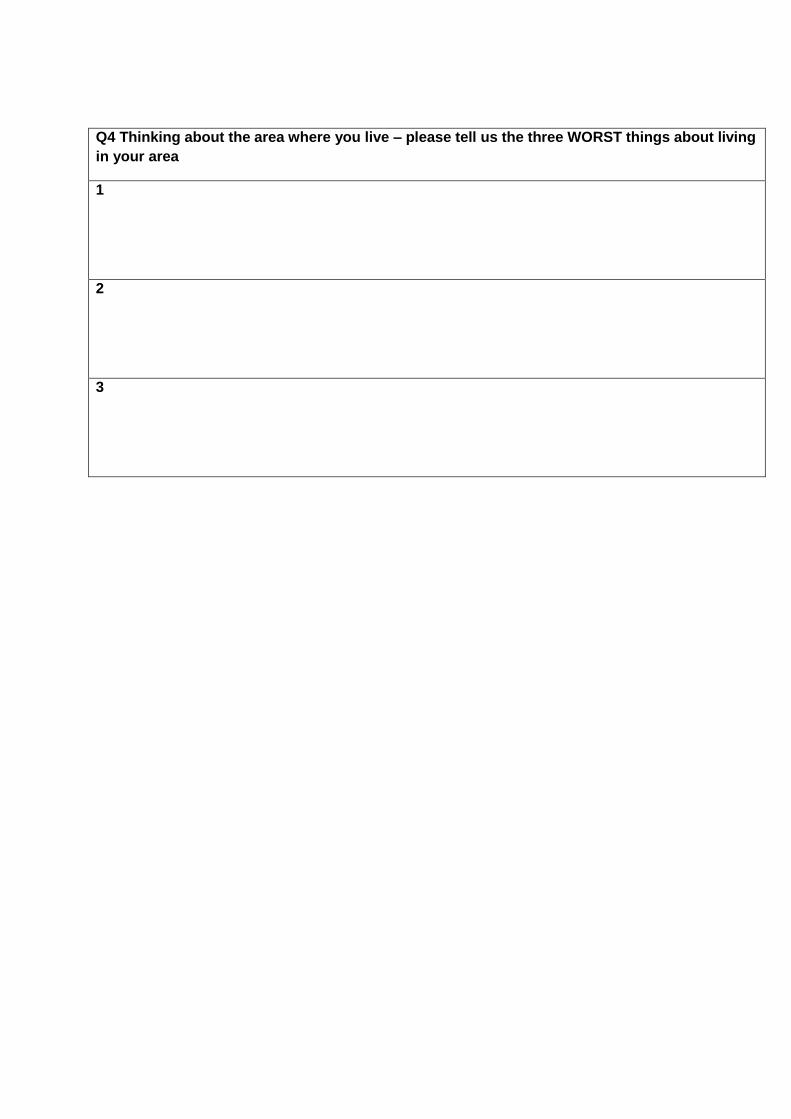
Q4 Thinking about the area where you live – please tell us the three WORST things about living
in your area
1
2
3
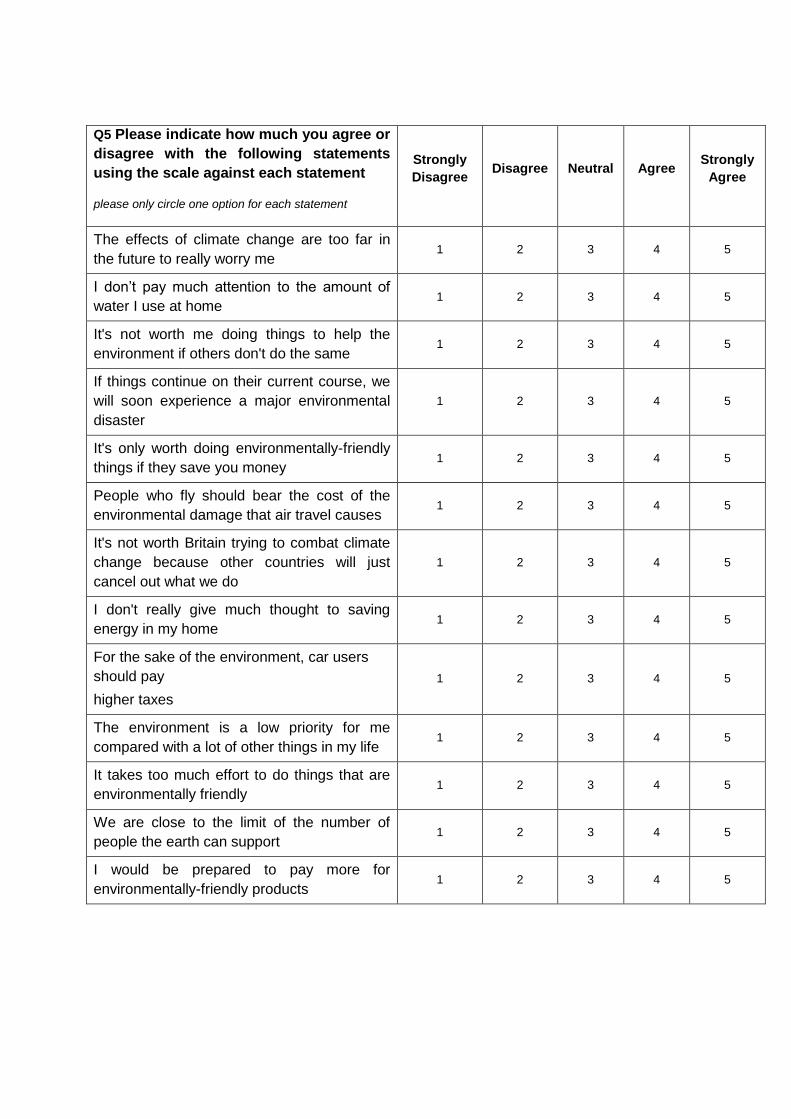
Q5 Please indicate how much you agree or
disagree with the following statements
using the scale against each statement
please only circle one option for each statement
Strongly
Disagree Disagree Neutral Agree
Strongly
Agree
The effects of climate change are too far in
the future to really worry me 1 2 3 4 5
I don‟t pay much attention to the amount of
water I use at home 1 2 3 4 5
It's not worth me doing things to help the
environment if others don't do the same 1 2 3 4 5
If things continue on their current course, we
will soon experience a major environmental
disaster
1 2 3 4 5
It's only worth doing environmentally-friendly
things if they save you money 1 2 3 4 5
People who fly should bear the cost of the
environmental damage that air travel causes 1 2 3 4 5
It's not worth Britain trying to combat climate
change because other countries will just
cancel out what we do
1 2 3 4 5
I don't really give much thought to saving
energy in my home 1 2 3 4 5
For the sake of the environment, car users
should pay
higher taxes
1 2 3 4 5
The environment is a low priority for me
compared with a lot of other things in my life 1 2 3 4 5
It takes too much effort to do things that are
environmentally friendly 1 2 3 4 5
We are close to the limit of the number of
people the earth can support 1 2 3 4 5
I would be prepared to pay more for
environmentally-friendly products 1 2 3 4 5
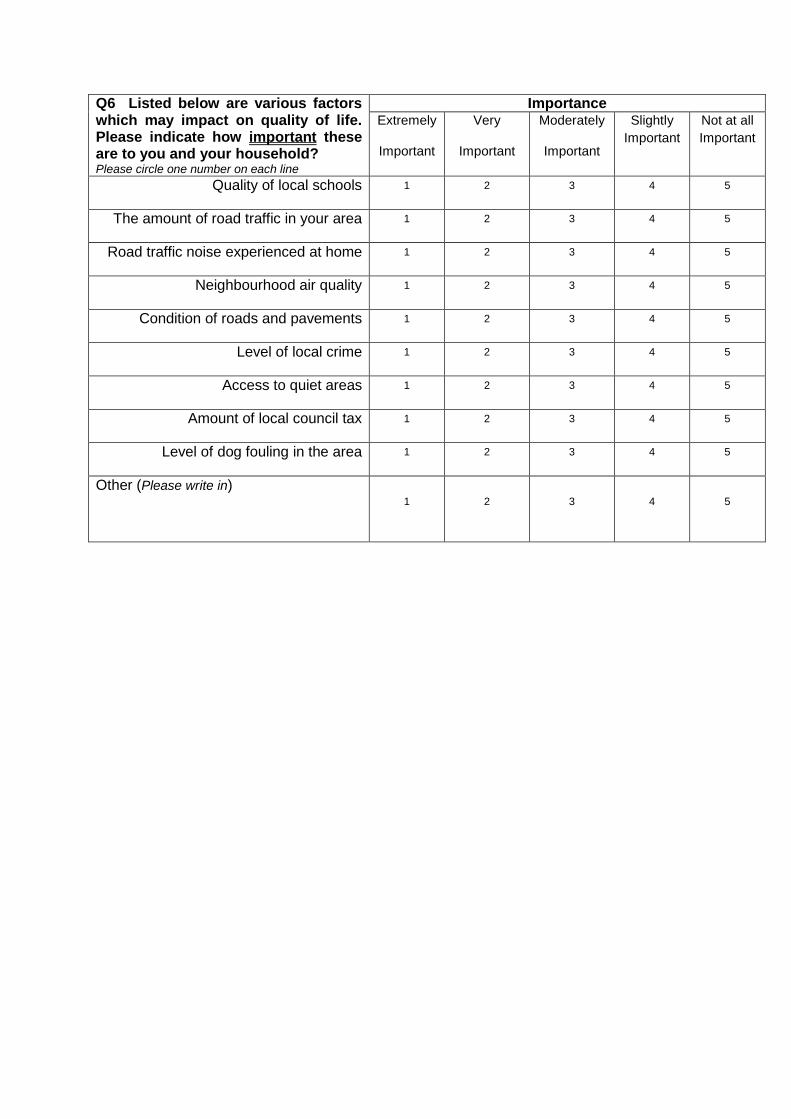
Q6 Listed below are various factors which may impact on quality of life. Please indicate how important these are to you and your household? Please circle one number on each line
Importance Extremely
Important
Very
Important
Moderately
Important
Slightly
Important
Not at all
Important
Quality of local schools 1 2 3 4 5
The amount of road traffic in your area 1 2 3 4 5
Road traffic noise experienced at home 1 2 3 4 5
Neighbourhood air quality 1 2 3 4 5
Condition of roads and pavements 1 2 3 4 5
Level of local crime 1 2 3 4 5
Access to quiet areas 1 2 3 4 5
Amount of local council tax 1 2 3 4 5
Level of dog fouling in the area 1 2 3 4 5
Other (Please write in)
1 2 3 4 5
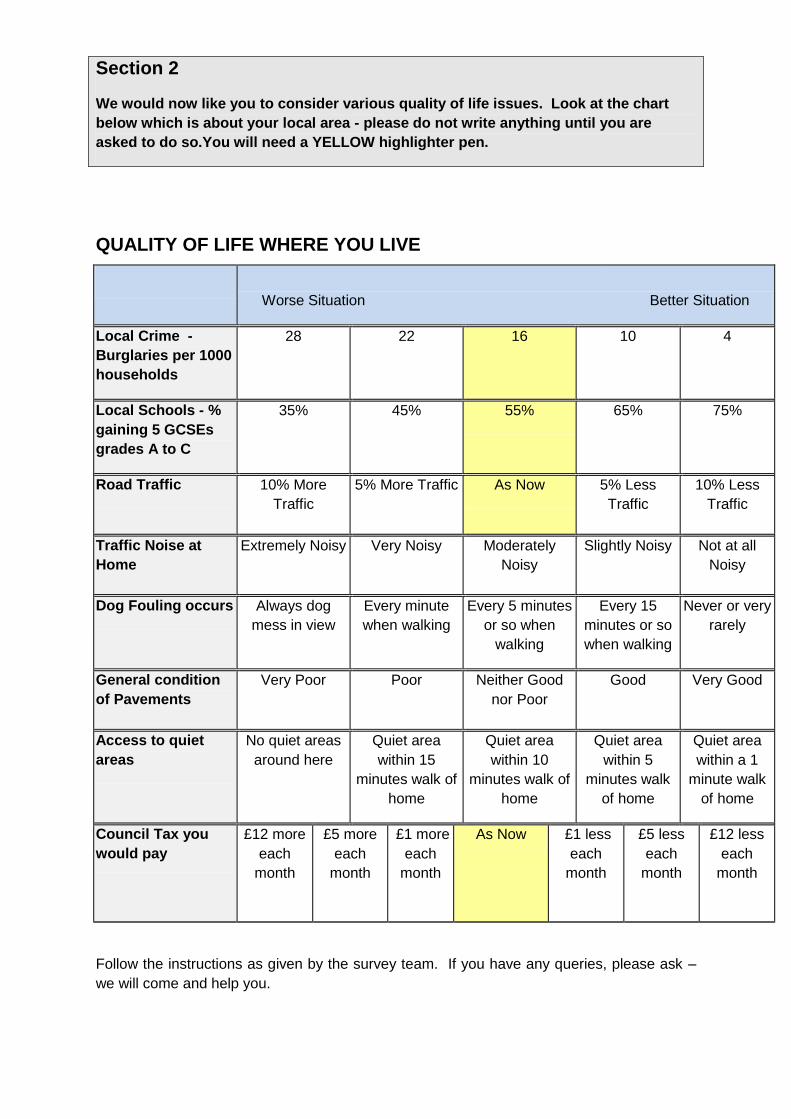
QUALITY OF LIFE WHERE YOU LIVE
Worse Situation Better Situation
Local Crime -
Burglaries per 1000
households
28 22 16 10 4
Local Schools - %
gaining 5 GCSEs
grades A to C
35% 45% 55% 65% 75%
Road Traffic 10% More
Traffic
5% More Traffic As Now 5% Less
Traffic
10% Less
Traffic
Traffic Noise at
Home
Extremely Noisy Very Noisy Moderately
Noisy
Slightly Noisy Not at all
Noisy
Dog Fouling occurs Always dog
mess in view
Every minute
when walking
Every 5 minutes
or so when
walking
Every 15
minutes or so
when walking
Never or very
rarely
General condition
of Pavements
Very Poor Poor Neither Good
nor Poor
Good Very Good
Access to quiet
areas
No quiet areas
around here
Quiet area
within 15
minutes walk of
home
Quiet area
within 10
minutes walk of
home
Quiet area
within 5
minutes walk
of home
Quiet area
within a 1
minute walk
of home
Council Tax you
would pay
£12 more
each
month
£5 more
each
month
£1 more
each
month
As Now £1 less
each
month
£5 less
each
month
£12 less
each
month
Follow the instructions as given by the survey team. If you have any queries, please ask –
we will come and help you.
Section 2
We would now like you to consider various quality of life issues. Look at the chart
below which is about your local area - please do not write anything until you are
asked to do so.You will need a YELLOW highlighter pen.
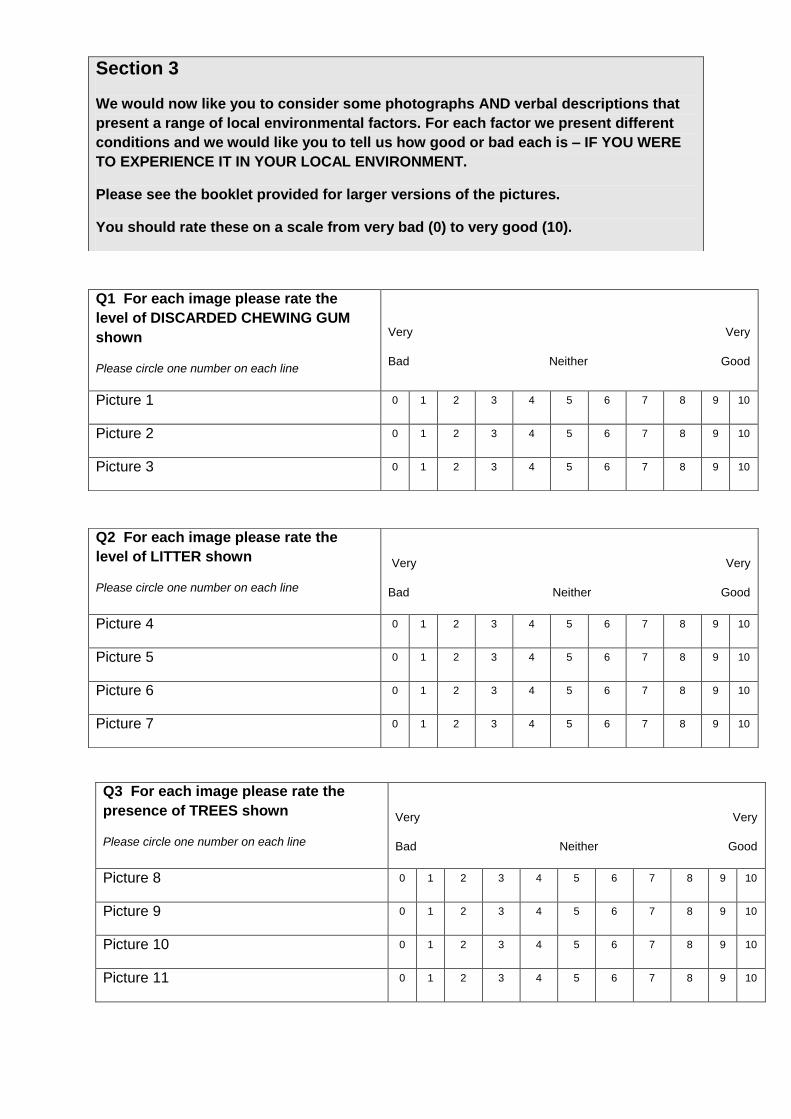
Q3 For each image please rate the
presence of TREES shown
Please circle one number on each line
Very Very
Bad Neither Good
Picture 8 0 1 2 3 4 5 6 7 8 9 10
Picture 9 0 1 2 3 4 5 6 7 8 9 10
Picture 10 0 1 2 3 4 5 6 7 8 9 10
Picture 11 0 1 2 3 4 5 6 7 8 9 10
Section 3
We would now like you to consider some photographs AND verbal descriptions that
present a range of local environmental factors. For each factor we present different
conditions and we would like you to tell us how good or bad each is – IF YOU WERE
TO EXPERIENCE IT IN YOUR LOCAL ENVIRONMENT.
Please see the booklet provided for larger versions of the pictures.
You should rate these on a scale from very bad (0) to very good (10).
Q1 For each image please rate the
level of DISCARDED CHEWING GUM
shown
Please circle one number on each line
Very Very
Bad Neither Good
Picture 1 0 1 2 3 4 5 6 7 8 9 10
Picture 2 0 1 2 3 4 5 6 7 8 9 10
Picture 3 0 1 2 3 4 5 6 7 8 9 10
Q2 For each image please rate the
level of LITTER shown
Please circle one number on each line
Very Very
Bad Neither Good
Picture 4 0 1 2 3 4 5 6 7 8 9 10
Picture 5 0 1 2 3 4 5 6 7 8 9 10
Picture 6 0 1 2 3 4 5 6 7 8 9 10
Picture 7 0 1 2 3 4 5 6 7 8 9 10
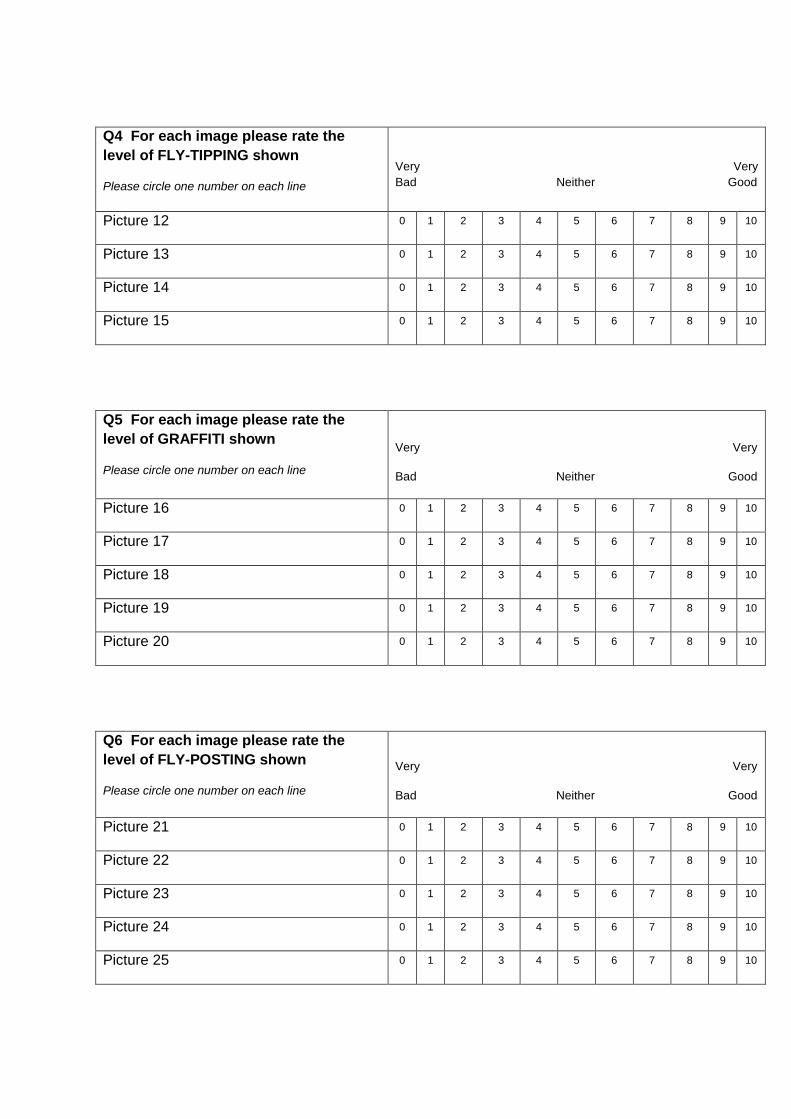
Q4 For each image please rate the
level of FLY-TIPPING shown
Please circle one number on each line
Very Very
Bad Neither Good
Picture 12 0 1 2 3 4 5 6 7 8 9 10
Picture 13 0 1 2 3 4 5 6 7 8 9 10
Picture 14 0 1 2 3 4 5 6 7 8 9 10
Picture 15 0 1 2 3 4 5 6 7 8 9 10
Q5 For each image please rate the
level of GRAFFITI shown
Please circle one number on each line
Very Very
Bad Neither Good
Picture 16 0 1 2 3 4 5 6 7 8 9 10
Picture 17 0 1 2 3 4 5 6 7 8 9 10
Picture 18 0 1 2 3 4 5 6 7 8 9 10
Picture 19 0 1 2 3 4 5 6 7 8 9 10
Picture 20 0 1 2 3 4 5 6 7 8 9 10
Q6 For each image please rate the
level of FLY-POSTING shown
Please circle one number on each line
Very Very
Bad Neither Good
Picture 21 0 1 2 3 4 5 6 7 8 9 10
Picture 22 0 1 2 3 4 5 6 7 8 9 10
Picture 23 0 1 2 3 4 5 6 7 8 9 10
Picture 24 0 1 2 3 4 5 6 7 8 9 10
Picture 25 0 1 2 3 4 5 6 7 8 9 10
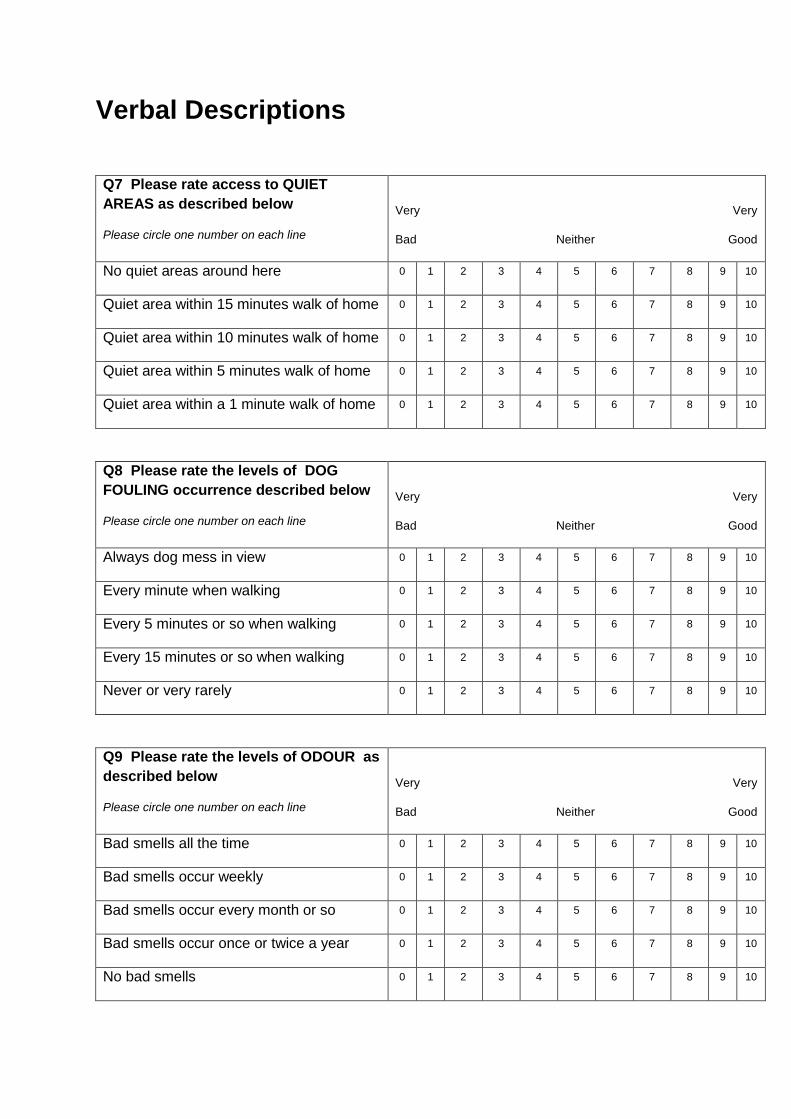
Verbal Descriptions
Q7 Please rate access to QUIET
AREAS as described below
Please circle one number on each line
Very Very
Bad Neither Good
No quiet areas around here 0 1 2 3 4 5 6 7 8 9 10
Quiet area within 15 minutes walk of home 0 1 2 3 4 5 6 7 8 9 10
Quiet area within 10 minutes walk of home 0 1 2 3 4 5 6 7 8 9 10
Quiet area within 5 minutes walk of home 0 1 2 3 4 5 6 7 8 9 10
Quiet area within a 1 minute walk of home 0 1 2 3 4 5 6 7 8 9 10
Q8 Please rate the levels of DOG
FOULING occurrence described below
Please circle one number on each line
Very Very
Bad Neither Good
Always dog mess in view 0 1 2 3 4 5 6 7 8 9 10
Every minute when walking 0 1 2 3 4 5 6 7 8 9 10
Every 5 minutes or so when walking 0 1 2 3 4 5 6 7 8 9 10
Every 15 minutes or so when walking 0 1 2 3 4 5 6 7 8 9 10
Never or very rarely 0 1 2 3 4 5 6 7 8 9 10
Q9 Please rate the levels of ODOUR as
described below
Please circle one number on each line
Very Very
Bad Neither Good
Bad smells all the time 0 1 2 3 4 5 6 7 8 9 10
Bad smells occur weekly 0 1 2 3 4 5 6 7 8 9 10
Bad smells occur every month or so 0 1 2 3 4 5 6 7 8 9 10
Bad smells occur once or twice a year 0 1 2 3 4 5 6 7 8 9 10
No bad smells 0 1 2 3 4 5 6 7 8 9 10
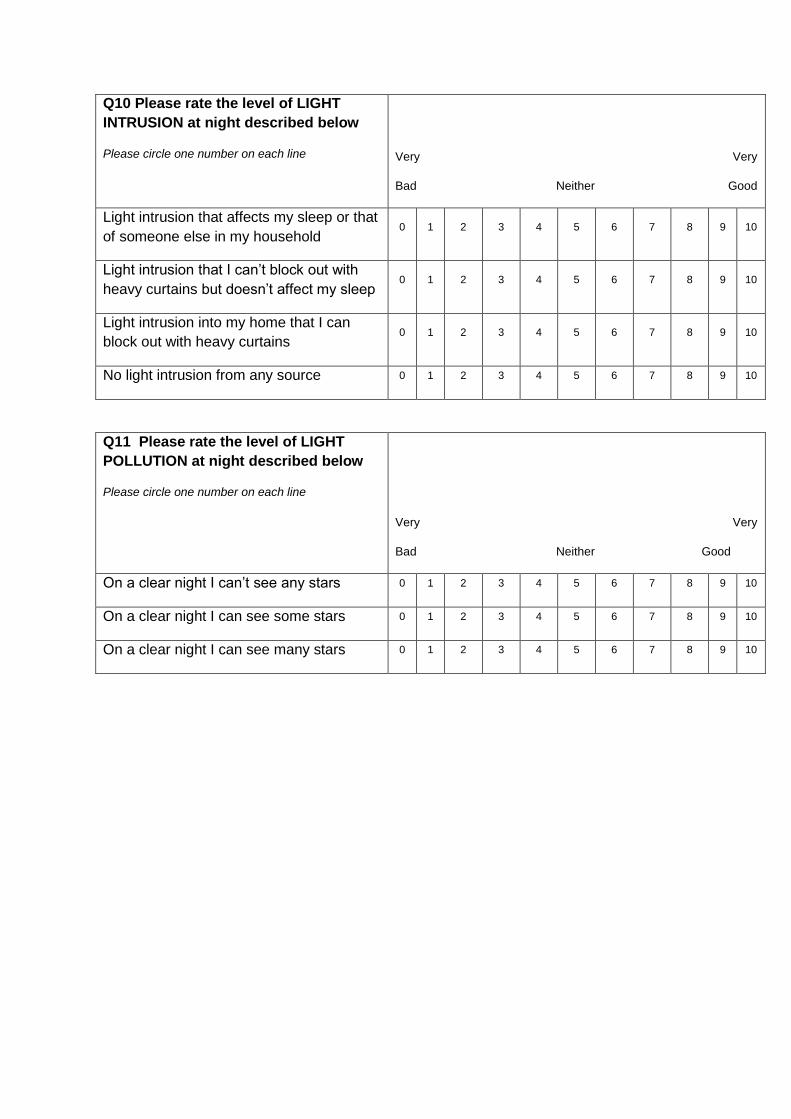
Q10 Please rate the level of LIGHT
INTRUSION at night described below
Please circle one number on each line
Very Very
Bad Neither Good
Light intrusion that affects my sleep or that
of someone else in my household 0 1 2 3 4 5 6 7 8 9 10
Light intrusion that I can‟t block out with
heavy curtains but doesn‟t affect my sleep 0 1 2 3 4 5 6 7 8 9 10
Light intrusion into my home that I can
block out with heavy curtains 0 1 2 3 4 5 6 7 8 9 10
No light intrusion from any source 0 1 2 3 4 5 6 7 8 9 10
Q11 Please rate the level of LIGHT
POLLUTION at night described below
Please circle one number on each line
Very Very
Bad Neither Good
On a clear night I can‟t see any stars 0 1 2 3 4 5 6 7 8 9 10
On a clear night I can see some stars 0 1 2 3 4 5 6 7 8 9 10
On a clear night I can see many stars 0 1 2 3 4 5 6 7 8 9 10
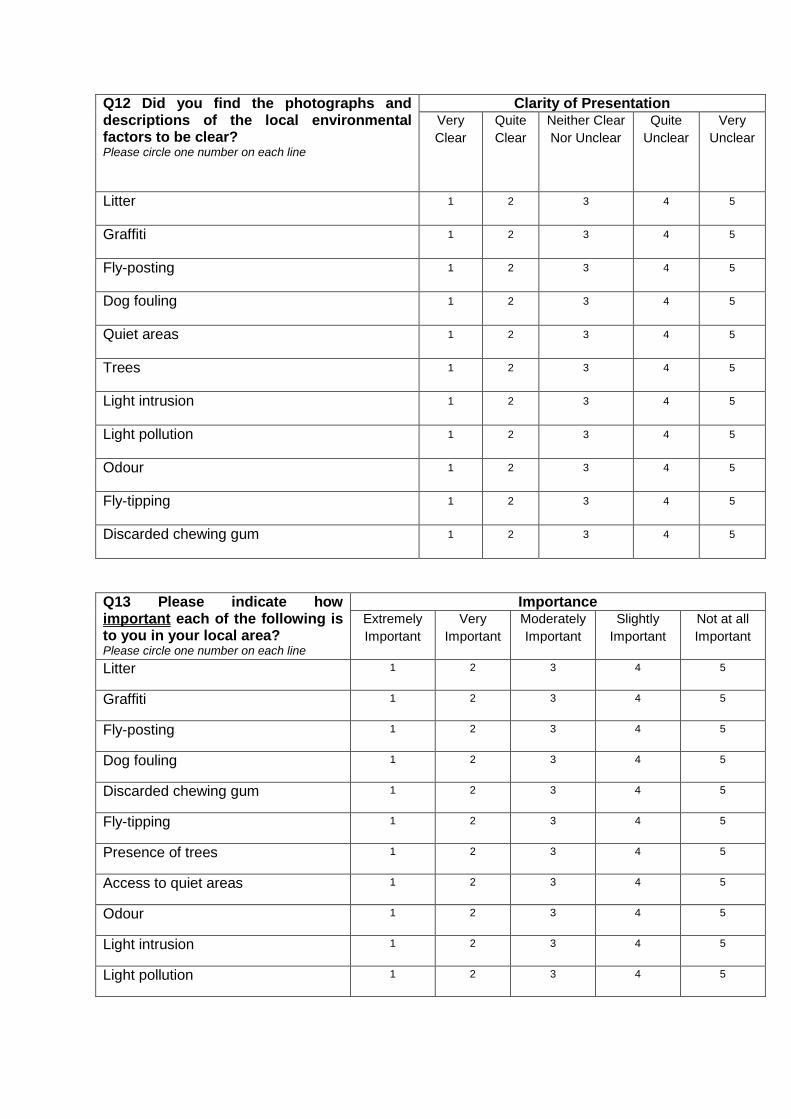
Q12 Did you find the photographs and descriptions of the local environmental factors to be clear? Please circle one number on each line
Clarity of Presentation Very
Clear
Quite
Clear
Neither Clear
Nor Unclear
Quite
Unclear
Very
Unclear
Litter 1 2 3 4 5
Graffiti 1 2 3 4 5
Fly-posting 1 2 3 4 5
Dog fouling 1 2 3 4 5
Quiet areas 1 2 3 4 5
Trees 1 2 3 4 5
Light intrusion 1 2 3 4 5
Light pollution 1 2 3 4 5
Odour 1 2 3 4 5
Fly-tipping 1 2 3 4 5
Discarded chewing gum 1 2 3 4 5
Q13 Please indicate how important each of the following is to you in your local area? Please circle one number on each line
Importance Extremely
Important
Very
Important
Moderately
Important
Slightly
Important
Not at all
Important
Litter 1 2 3 4 5
Graffiti 1 2 3 4 5
Fly-posting 1 2 3 4 5
Dog fouling 1 2 3 4 5
Discarded chewing gum 1 2 3 4 5
Fly-tipping 1 2 3 4 5
Presence of trees 1 2 3 4 5
Access to quiet areas 1 2 3 4 5
Odour 1 2 3 4 5
Light intrusion 1 2 3 4 5
Light pollution 1 2 3 4 5

Section 4 – Appeared as an A3 sized sheet - See Appendix D
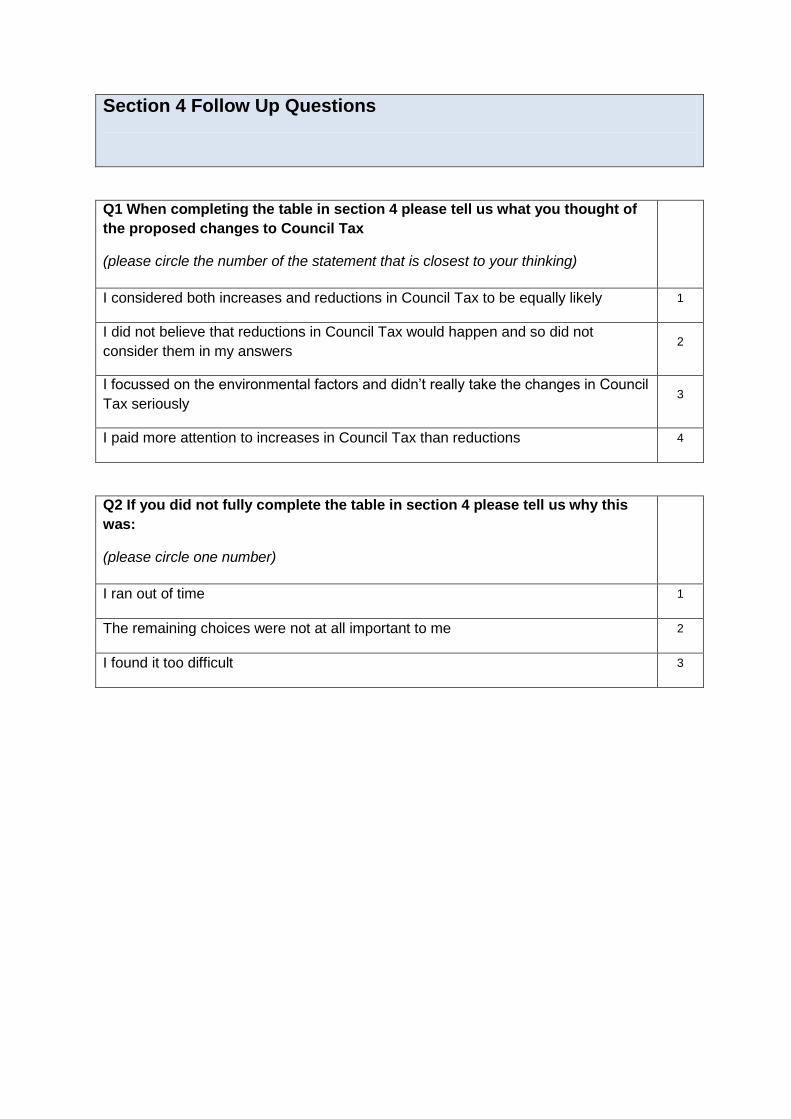
Section 4 Follow Up Questions
Q1 When completing the table in section 4 please tell us what you thought of
the proposed changes to Council Tax
(please circle the number of the statement that is closest to your thinking)
I considered both increases and reductions in Council Tax to be equally likely 1
I did not believe that reductions in Council Tax would happen and so did not
consider them in my answers 2
I focussed on the environmental factors and didn‟t really take the changes in Council
Tax seriously 3
I paid more attention to increases in Council Tax than reductions 4
Q2 If you did not fully complete the table in section 4 please tell us why this
was:
(please circle one number)
I ran out of time 1
The remaining choices were not at all important to me 2
I found it too difficult 3
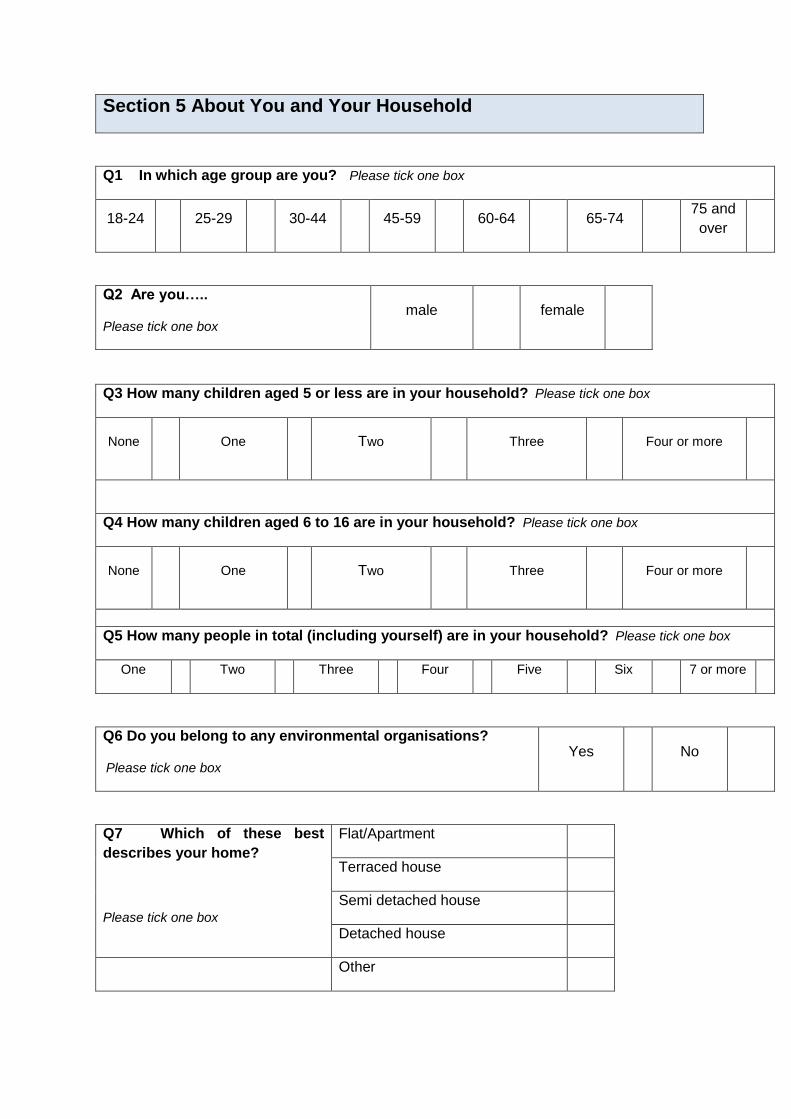
Section 5 About You and Your Household
Q1 In which age group are you? Please tick one box
18-24 25-29 30-44 45-59 60-64 65-74 75 and
over
Q2 Are you…..
Please tick one box
male female
Q3 How many children aged 5 or less are in your household? Please tick one box
None
One Two Three Four or more
Q4 How many children aged 6 to 16 are in your household? Please tick one box
None
One Two Three Four or more
Q5 How many people in total (including yourself) are in your household? Please tick one box
One Two Three Four Five Six 7 or more
Q6 Do you belong to any environmental organisations?
Please tick one box Yes No
Q7 Which of these best
describes your home?
Please tick one box
Flat/Apartment
Terraced house
Semi detached house
Detached house
Other
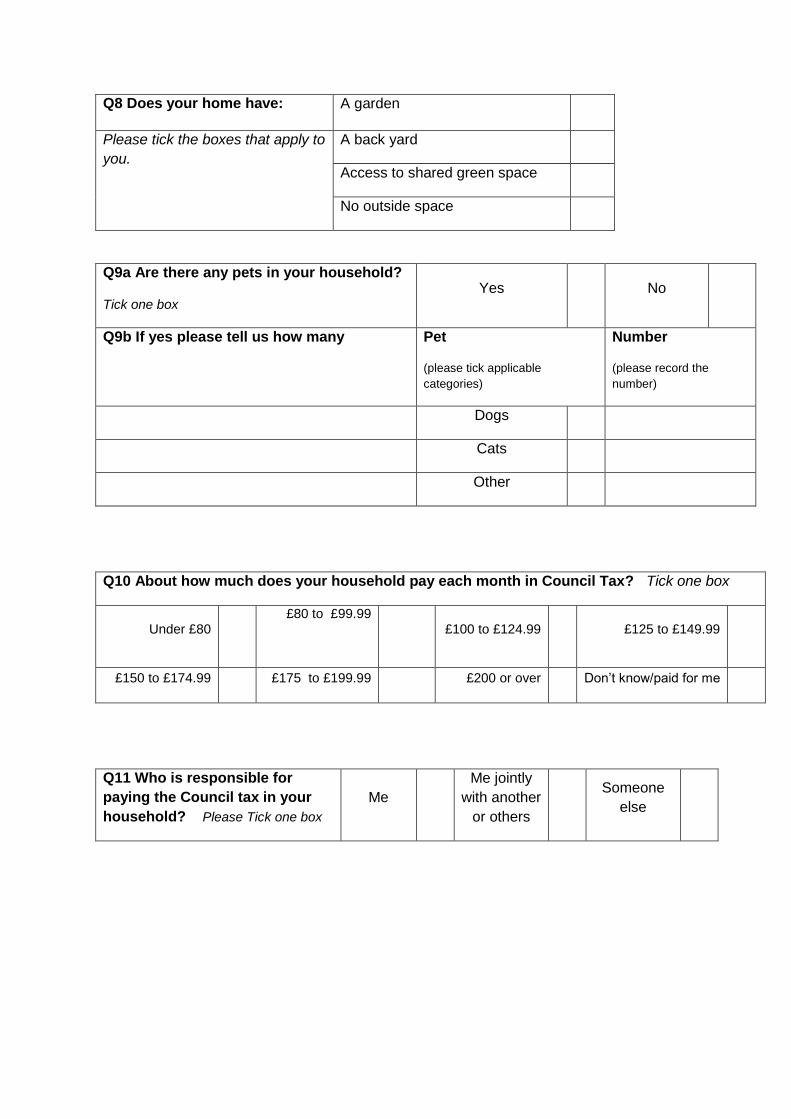
Q8 Does your home have: A garden
Please tick the boxes that apply to
you.
A back yard
Access to shared green space
No outside space
Q9a Are there any pets in your household?
Tick one box Yes No
Q9b If yes please tell us how many Pet
(please tick applicable
categories)
Number
(please record the
number)
Dogs
Cats
Other
Q10 About how much does your household pay each month in Council Tax? Tick one box
Under £80
£80 to £99.99
£100 to £124.99 £125 to £149.99
£150 to £174.99 £175 to £199.99 £200 or over Don‟t know/paid for me
Q11 Who is responsible for
paying the Council tax in your
household? Please Tick one box
Me
Me jointly
with another
or others
Someone
else
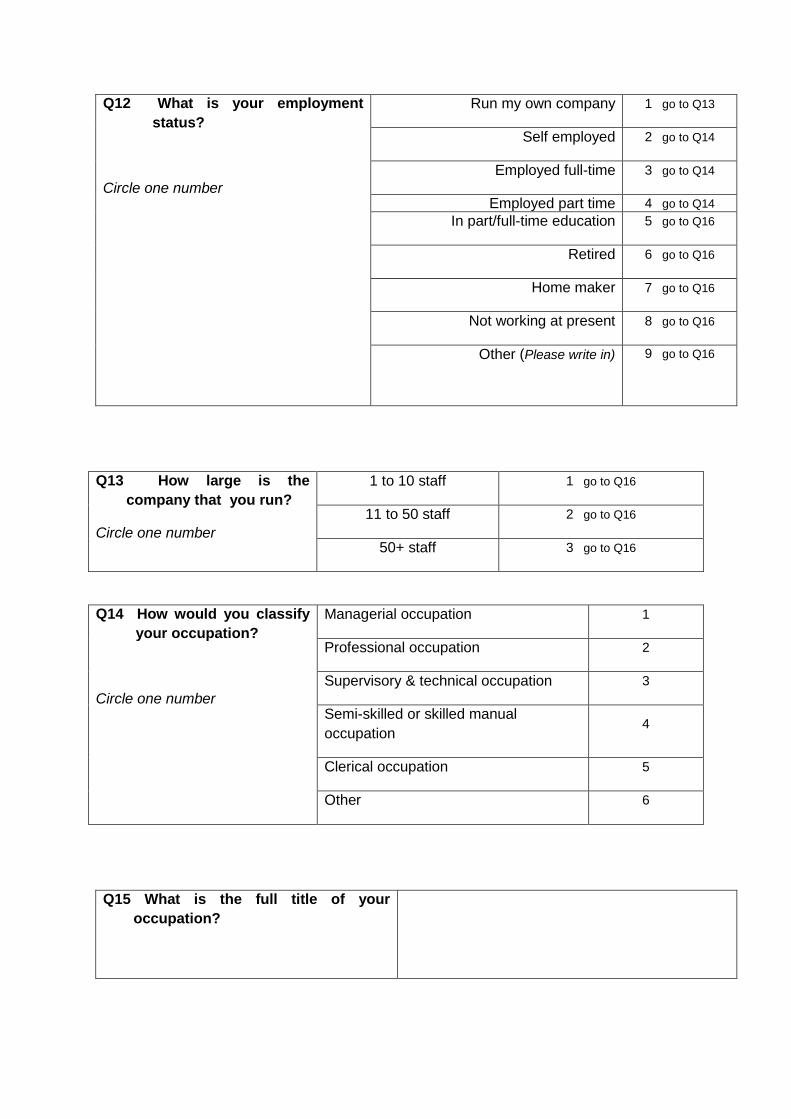
Q12 What is your employment
status?
Circle one number
Run my own company 1 go to Q13
Self employed 2 go to Q14
Employed full-time 3 go to Q14
Employed part time 4 go to Q14
In part/full-time education 5 go to Q16
Retired 6 go to Q16
Home maker 7 go to Q16
Not working at present 8 go to Q16
Other (Please write in) 9 go to Q16
Q13 How large is the
company that you run?
Circle one number
1 to 10 staff 1 go to Q16
11 to 50 staff 2 go to Q16
50+ staff 3 go to Q16
Q14 How would you classify
your occupation?
Circle one number
Managerial occupation 1
Professional occupation 2
Supervisory & technical occupation 3
Semi-skilled or skilled manual
occupation 4
Clerical occupation 5
Other 6
Q15 What is the full title of your
occupation?

Q16 Please provide an estimate your
gross annual household income:
Please Tick One box
Under £10,000
£10-19,999
£20-29,999
£30-39,999
£40-49,999
Over £50,000
Don‟t know


![Focus Groups [PPT]](https://img.pdfslide.us/doc/110x75/5891a2d91a28ab26788b5a52/focus-groups-ppt.jpg)