Embed Size (px)
Citation preview
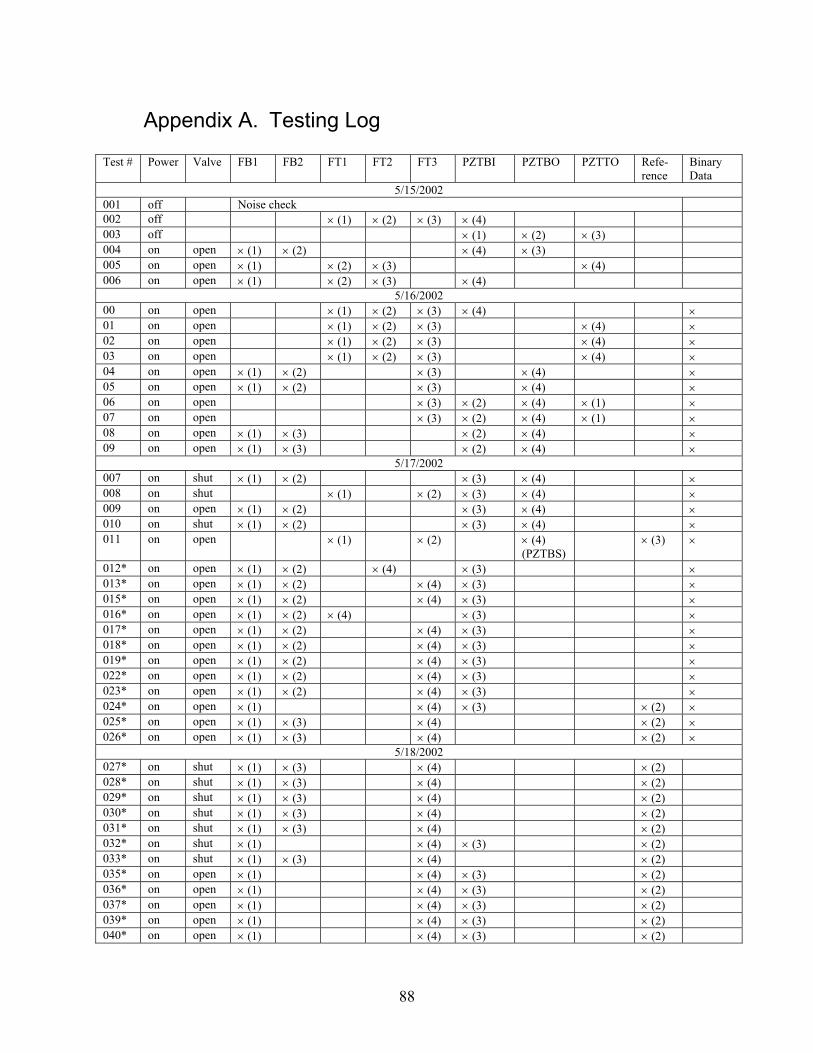
88
Appendix A. Testing Log
Test # Power Valve FB1 FB2 FT1 FT2 FT3 PZTBI PZTBO PZTTO Refe-rence
Binary Data
5/15/2002 001 off Noise check 002 off × (1) × (2) × (3) × (4) 003 off × (1) × (2) × (3) 004 on open × (1) × (2) × (4) × (3) 005 on open × (1) × (2) × (3) × (4) 006 on open × (1) × (2) × (3) × (4)
5/16/2002 00 on open × (1) × (2) × (3) × (4) × 01 on open × (1) × (2) × (3) × (4) × 02 on open × (1) × (2) × (3) × (4) × 03 on open × (1) × (2) × (3) × (4) × 04 on open × (1) × (2) × (3) × (4) × 05 on open × (1) × (2) × (3) × (4) × 06 on open × (3) × (2) × (4) × (1) × 07 on open × (3) × (2) × (4) × (1) × 08 on open × (1) × (3) × (2) × (4) × 09 on open × (1) × (3) × (2) × (4) ×
5/17/2002 007 on shut × (1) × (2) × (3) × (4) × 008 on shut × (1) × (2) × (3) × (4) × 009 on open × (1) × (2) × (3) × (4) × 010 on shut × (1) × (2) × (3) × (4) × 011 on open × (1) × (2) × (4)
(PZTBS) × (3) ×
012* on open × (1) × (2) × (4) × (3) × 013* on open × (1) × (2) × (4) × (3) × 015* on open × (1) × (2) × (4) × (3) × 016* on open × (1) × (2) × (4) × (3) × 017* on open × (1) × (2) × (4) × (3) × 018* on open × (1) × (2) × (4) × (3) × 019* on open × (1) × (2) × (4) × (3) × 022* on open × (1) × (2) × (4) × (3) × 023* on open × (1) × (2) × (4) × (3) × 024* on open × (1) × (4) × (3) × (2) × 025* on open × (1) × (3) × (4) × (2) × 026* on open × (1) × (3) × (4) × (2) ×
5/18/2002 027* on shut × (1) × (3) × (4) × (2) 028* on shut × (1) × (3) × (4) × (2) 029* on shut × (1) × (3) × (4) × (2) 030* on shut × (1) × (3) × (4) × (2) 031* on shut × (1) × (3) × (4) × (2) 032* on shut × (1) × (4) × (3) × (2) 033* on shut × (1) × (3) × (4) × (2) 035* on open × (1) × (4) × (3) × (2) 036* on open × (1) × (4) × (3) × (2) 037* on open × (1) × (4) × (3) × (2) 039* on open × (1) × (4) × (3) × (2) 040* on open × (1) × (4) × (3) × (2)

89
041* on open × (1) × (4) × (3) × (2) 042* on open × (1) × (4) × (3) × (2) 043* on open × (1) × (4) × (3) × (2) 044* on open × (1) × (4) × (3) × (2) 045* on open × (1) × (4) × (3) × (2)
Note: 1. * besides the test number indicates the test was done with magnitude trigger
setting.
2. All data have the screen shot graphs available, however only those with ‘ב in
the Binary Data column have the data in binary format which we can further
process.
90
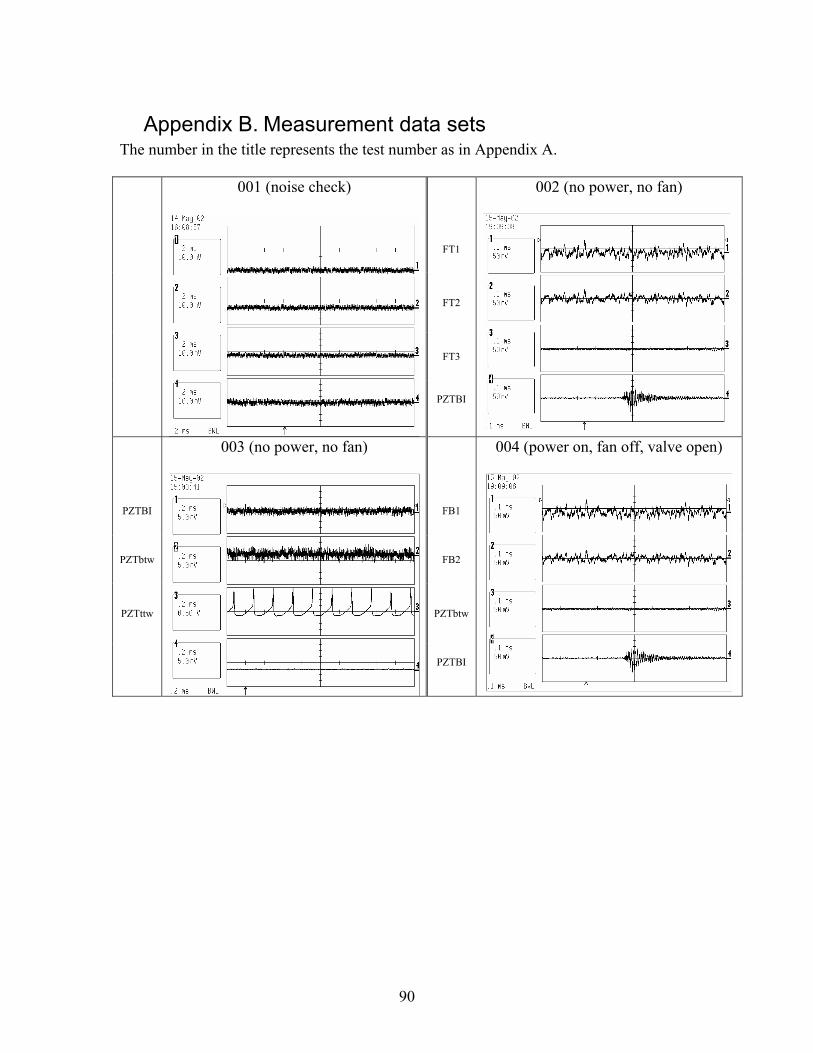
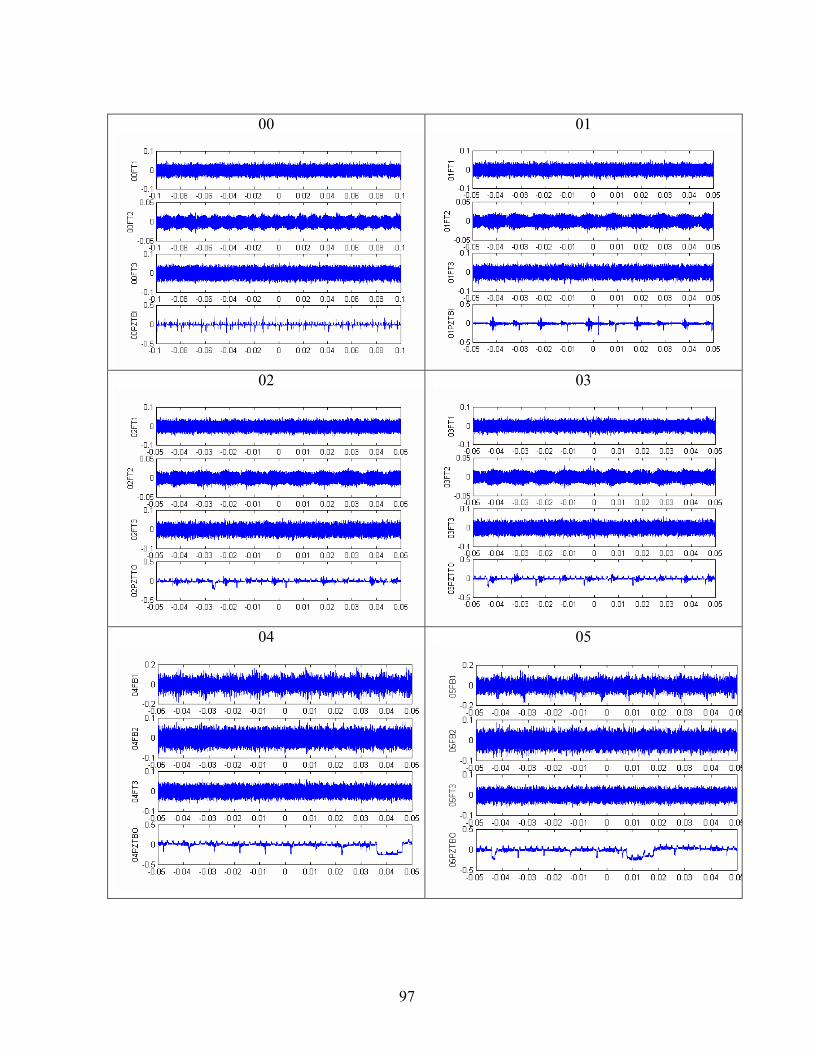
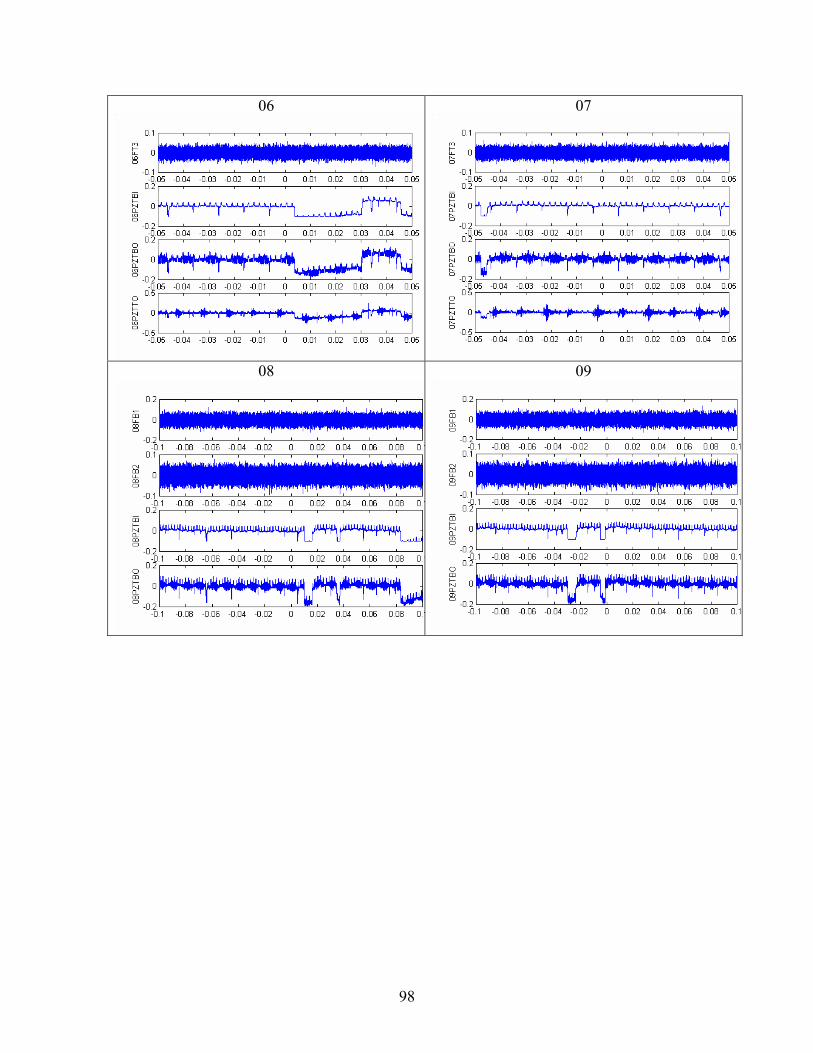
Appendix B. Measurement data sets The number in the title represents the test number as in Appendix A.
FT1
FT2
FT3
001 (noise check)
PZTBI
002 (no power, no fan)
PZTBI
FB1
PZTbtw
FB2
PZTttw
PZTbtw
003 (no power, no fan)
PZTBI
004 (power on, fan off, valve open)
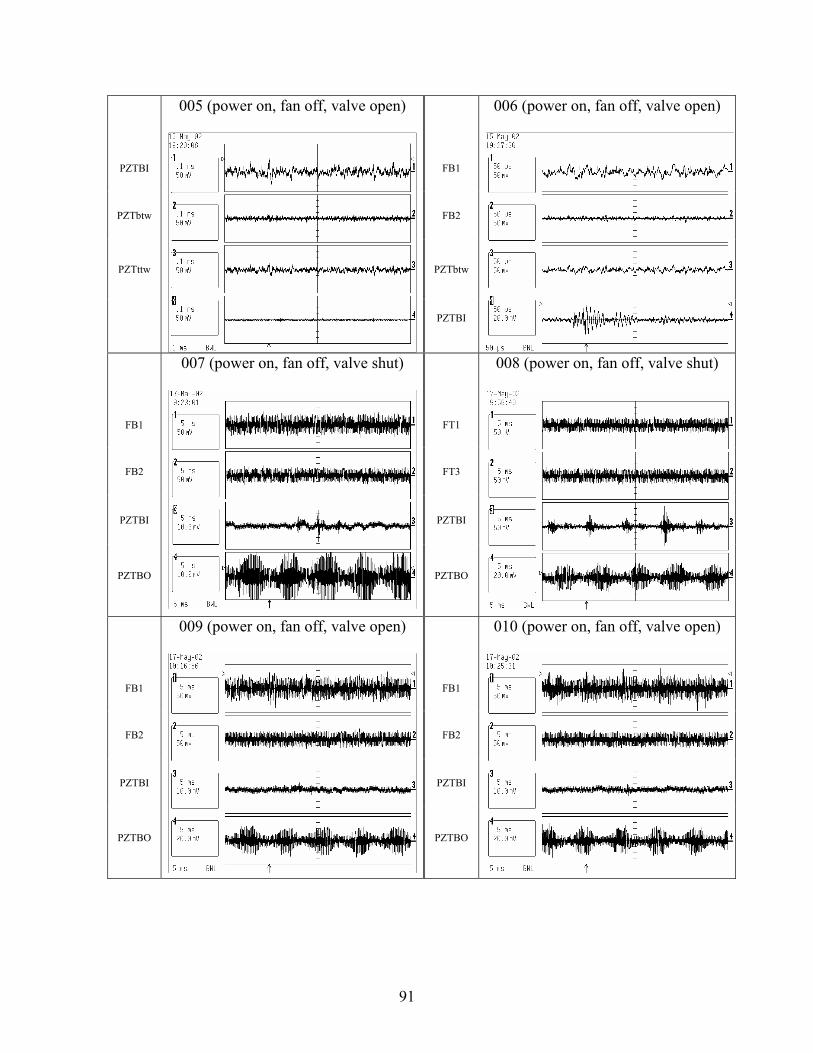
91
PZTBI
FB1
PZTbtw
FB2
PZTttw
PZTbtw
005 (power on, fan off, valve open)
PZTBI
006 (power on, fan off, valve open)
FB1
FT1
FB2
FT3
PZTBI PZTBI
PZTBO
007 (power on, fan off, valve shut)
PZTBO
008 (power on, fan off, valve shut)
FB1
FB1
FB2
FB2
PZTBI PZTBI
PZTBO
009 (power on, fan off, valve open)
PZTBO
010 (power on, fan off, valve open)
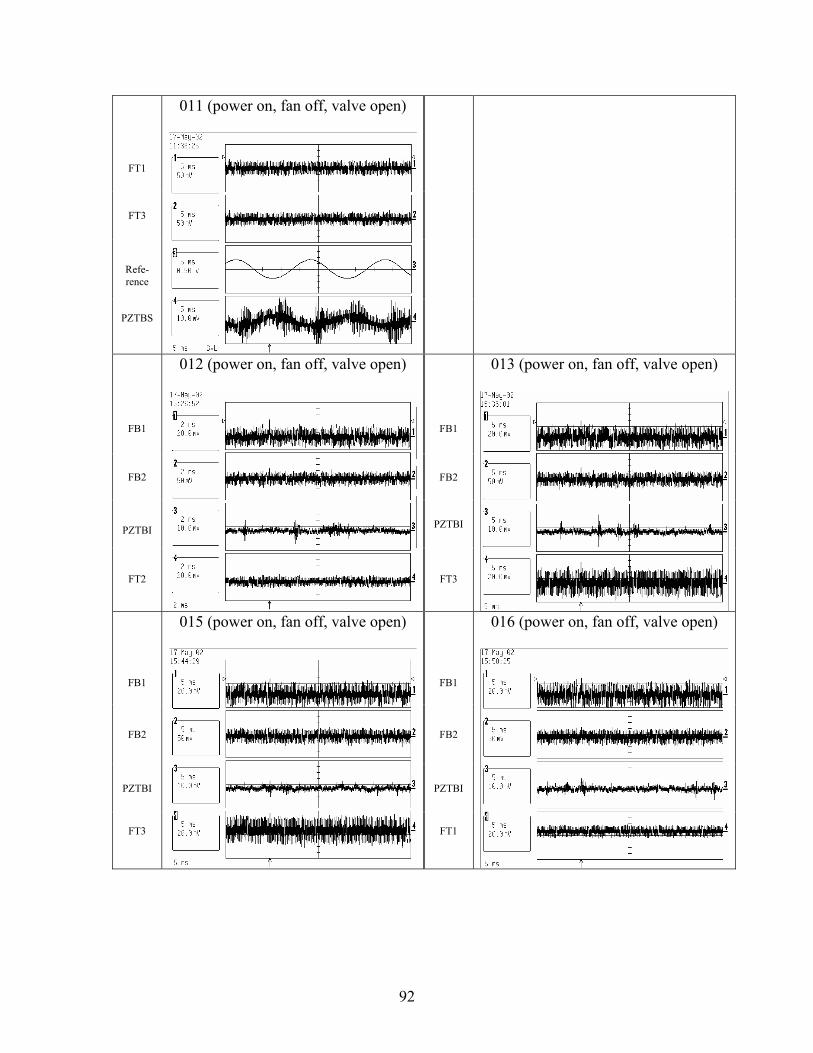
92
FT1
FT3
Refe-rence
PZTBS
011 (power on, fan off, valve open)
FB1
FB1
FB2
FB2
PZTBI PZTBI
FT2
012 (power on, fan off, valve open)
FT3
013 (power on, fan off, valve open)
FB1
FB1
FB2
FB2
PZTBI PZTBI
FT3
015 (power on, fan off, valve open)
FT1
016 (power on, fan off, valve open)
93
FB1
FB1
FB2
FB2
PZTBI PZTBI
FT3
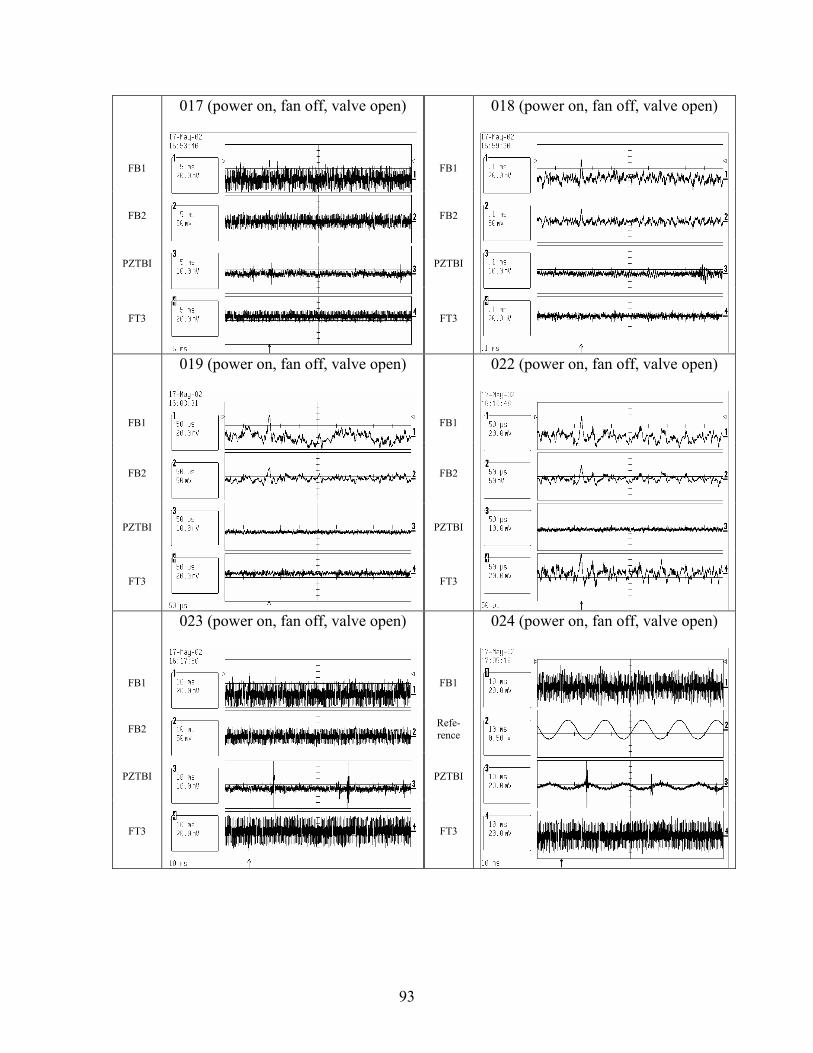
017 (power on, fan off, valve open)
FT3
018 (power on, fan off, valve open)
FB1
FB1
FB2
FB2
PZTBI PZTBI
FT3
019 (power on, fan off, valve open)
FT3
022 (power on, fan off, valve open)
FB1
FB1
FB2
Refe-rence
PZTBI PZTBI
FT3
023 (power on, fan off, valve open)
FT3
024 (power on, fan off, valve open)
94
FB1
FB1
Refe-rence
Refe-rence
FB2 FB2
FT3
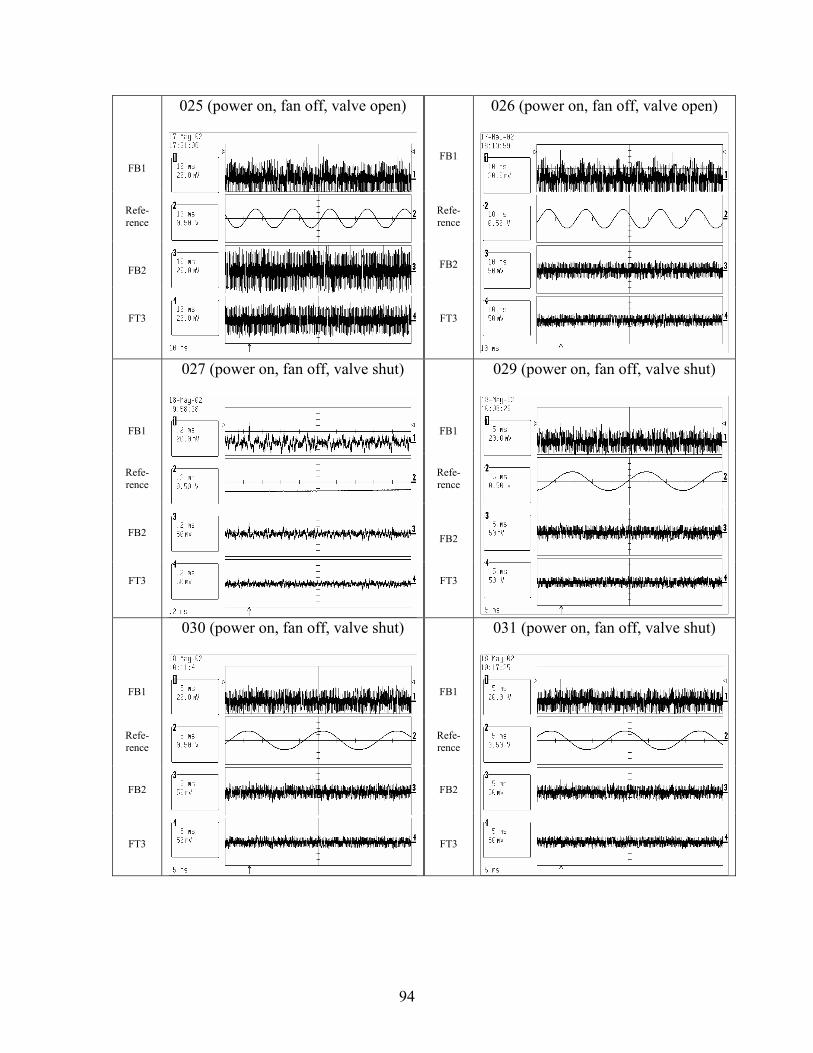
025 (power on, fan off, valve open)
FT3
026 (power on, fan off, valve open)
FB1
FB1
Refe-rence
Refe-rence
FB2 FB2
FT3
027 (power on, fan off, valve shut)
FT3
029 (power on, fan off, valve shut)
FB1
FB1
Refe-rence
Refe-rence
FB2 FB2
FT3
030 (power on, fan off, valve shut)
FT3
031 (power on, fan off, valve shut)
95
FB1
FB1
Refe-rence
Refe-rence
PZTBI FB2
FT3
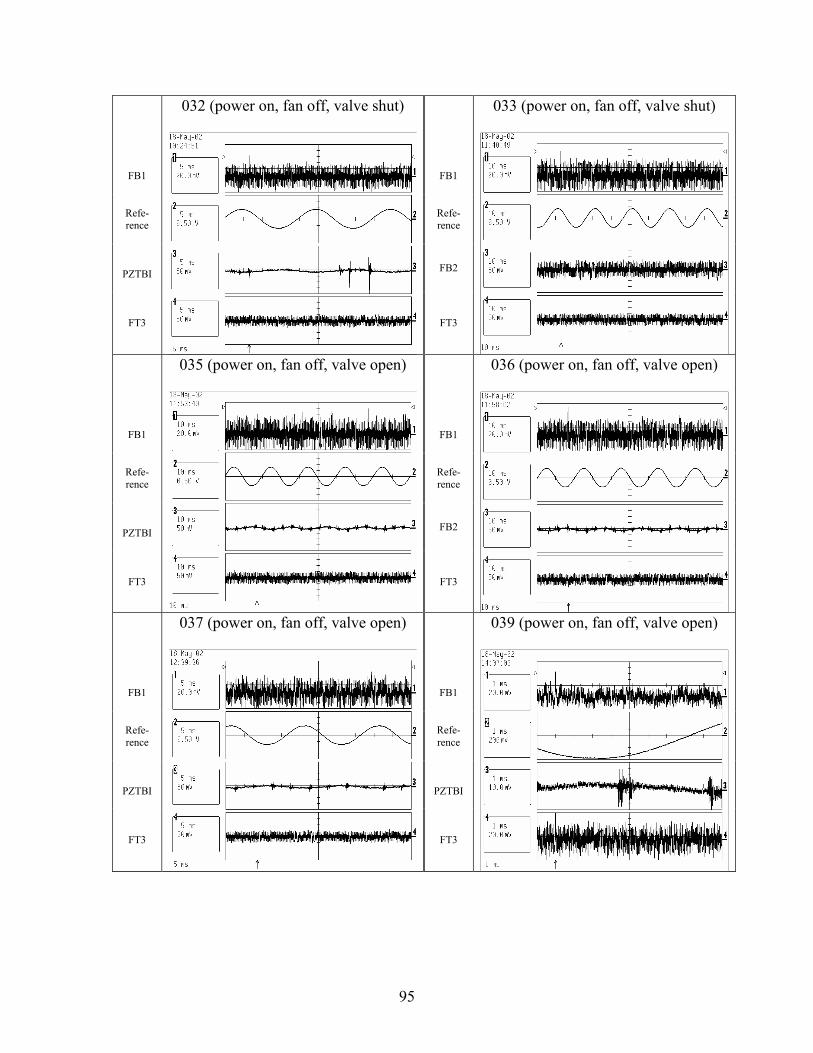
032 (power on, fan off, valve shut)
FT3
033 (power on, fan off, valve shut)
FB1
FB1
Refe-rence
Refe-rence
PZTBI FB2
FT3
035 (power on, fan off, valve open)
FT3
036 (power on, fan off, valve open)
FB1
FB1
Refe-rence
Refe-rence
PZTBI
PZTBI
FT3
037 (power on, fan off, valve open)
FT3
039 (power on, fan off, valve open)
96
FB1
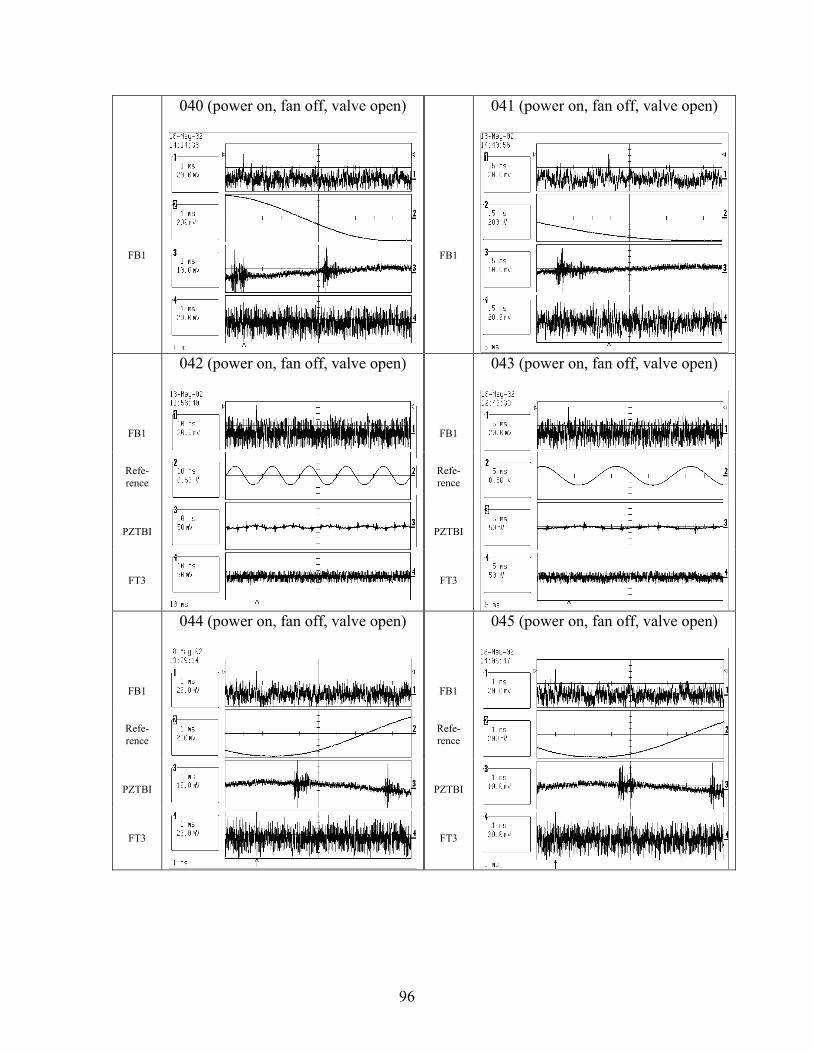
040 (power on, fan off, valve open)
FB1
041 (power on, fan off, valve open)
FB1
FB1
Refe-rence
Refe-rence
PZTBI
PZTBI
FT3
042 (power on, fan off, valve open)
FT3
043 (power on, fan off, valve open)
FB1
FB1
Refe-rence
Refe-rence
PZTBI
PZTBI
FT3
044 (power on, fan off, valve open)
FT3
045 (power on, fan off, valve open)
97
00 01
02 03
04 05
98
06 07
08 09
99
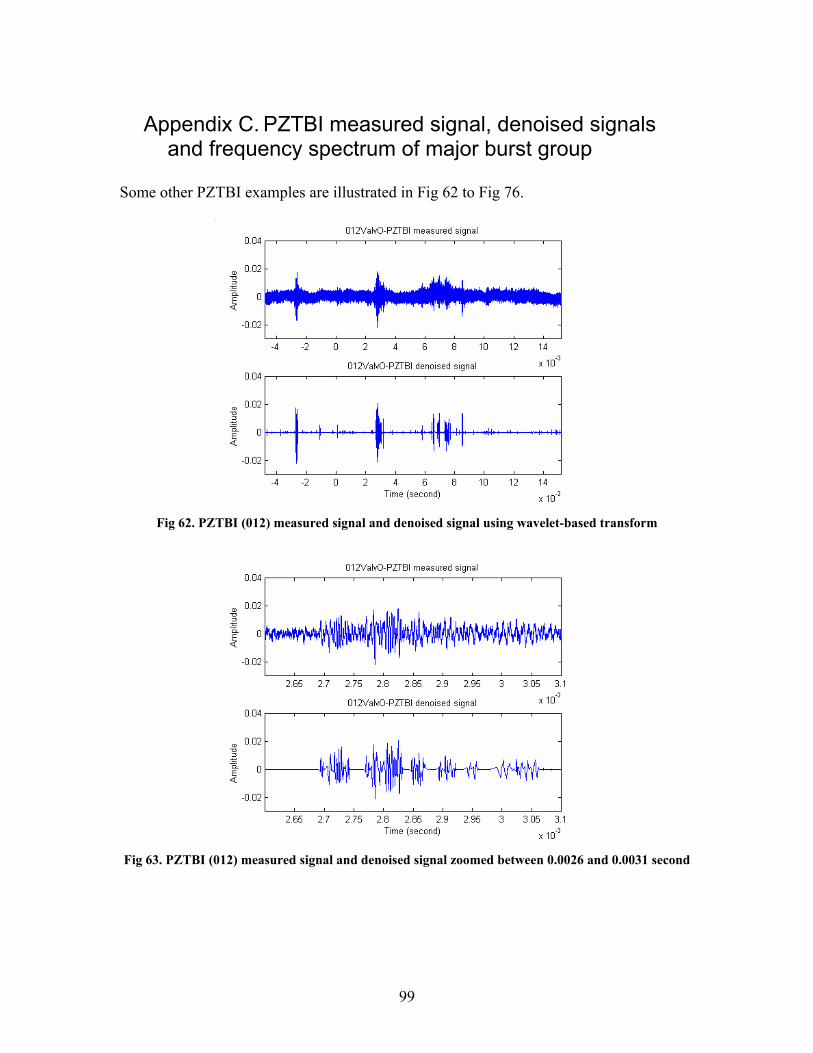
Appendix C. PZTBI measured signal, denoised signals and frequency spectrum of major burst group
Some other PZTBI examples are illustrated in Fig 62 to Fig 76.
Fig 62. PZTBI (012) measured signal and denoised signal using wavelet-based transform
Fig 63. PZTBI (012) measured signal and denoised signal zoomed between 0.0026 and 0.0031 second
100
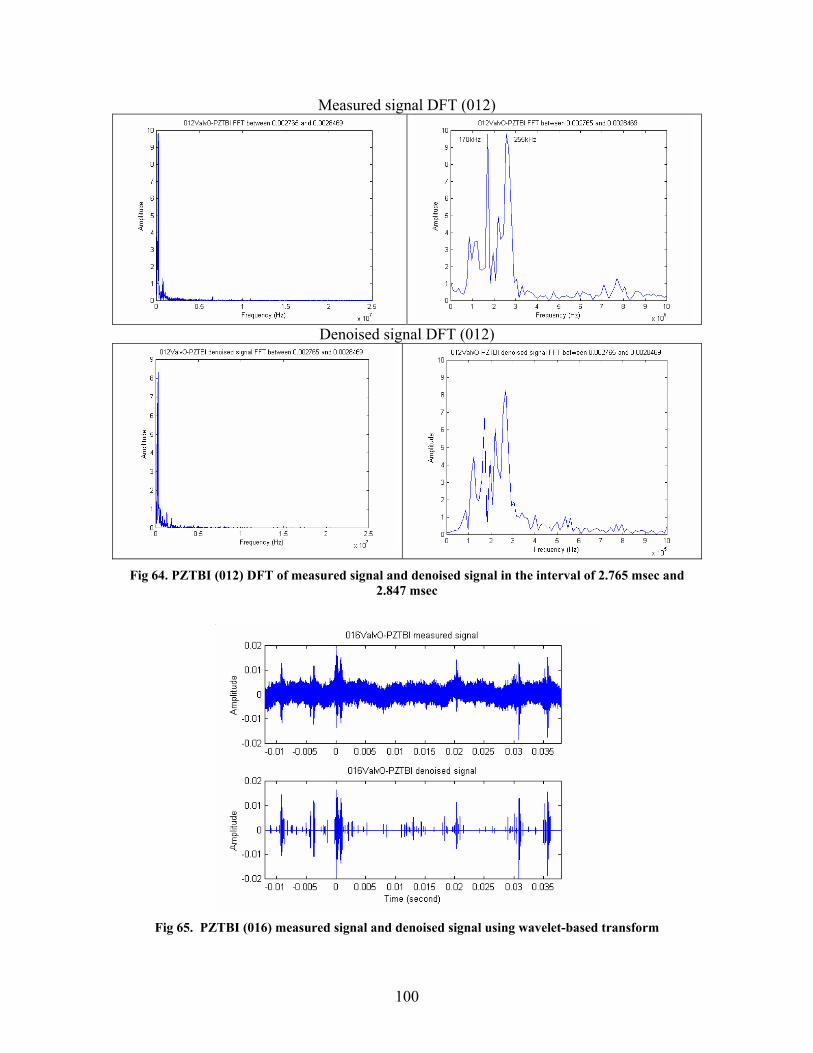
Measured signal DFT (012)
Denoised signal DFT (012)
Fig 64. PZTBI (012) DFT of measured signal and denoised signal in the interval of 2.765 msec and 2.847 msec
Fig 65. PZTBI (016) measured signal and denoised signal using wavelet-based transform
101
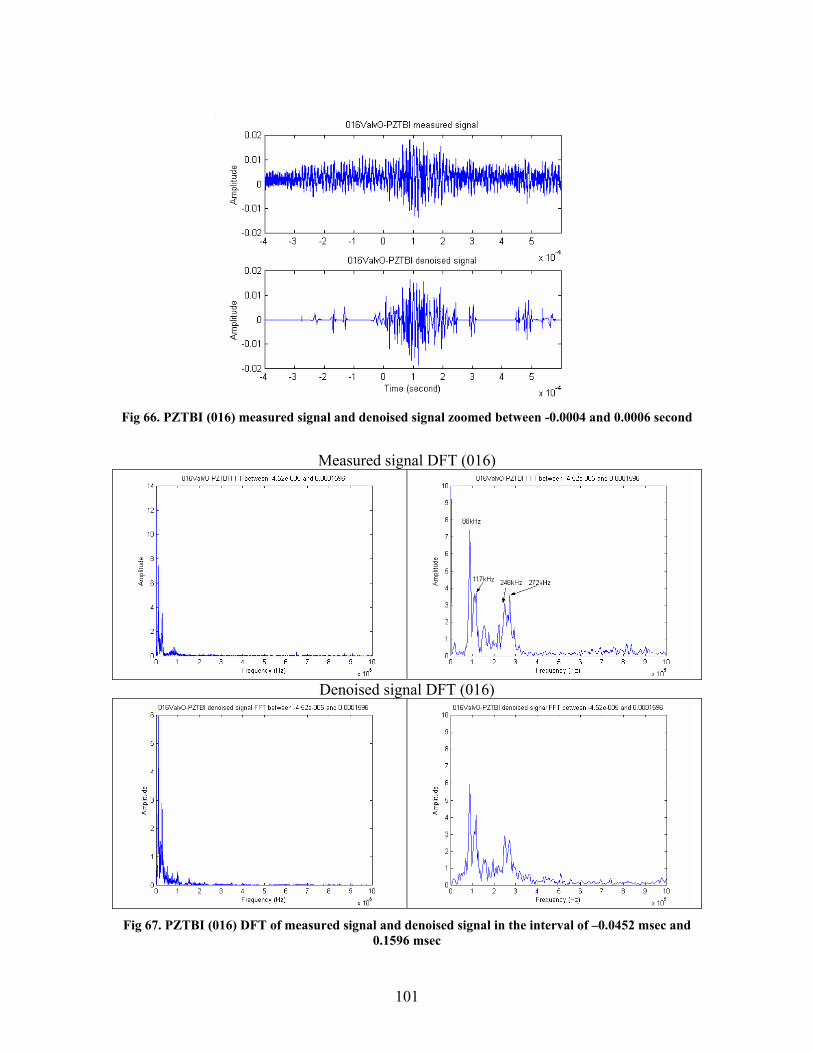
Fig 66. PZTBI (016) measured signal and denoised signal zoomed between -0.0004 and 0.0006 second
Measured signal DFT (016)
Denoised signal DFT (016)
Fig 67. PZTBI (016) DFT of measured signal and denoised signal in the interval of –0.0452 msec and 0.1596 msec
102
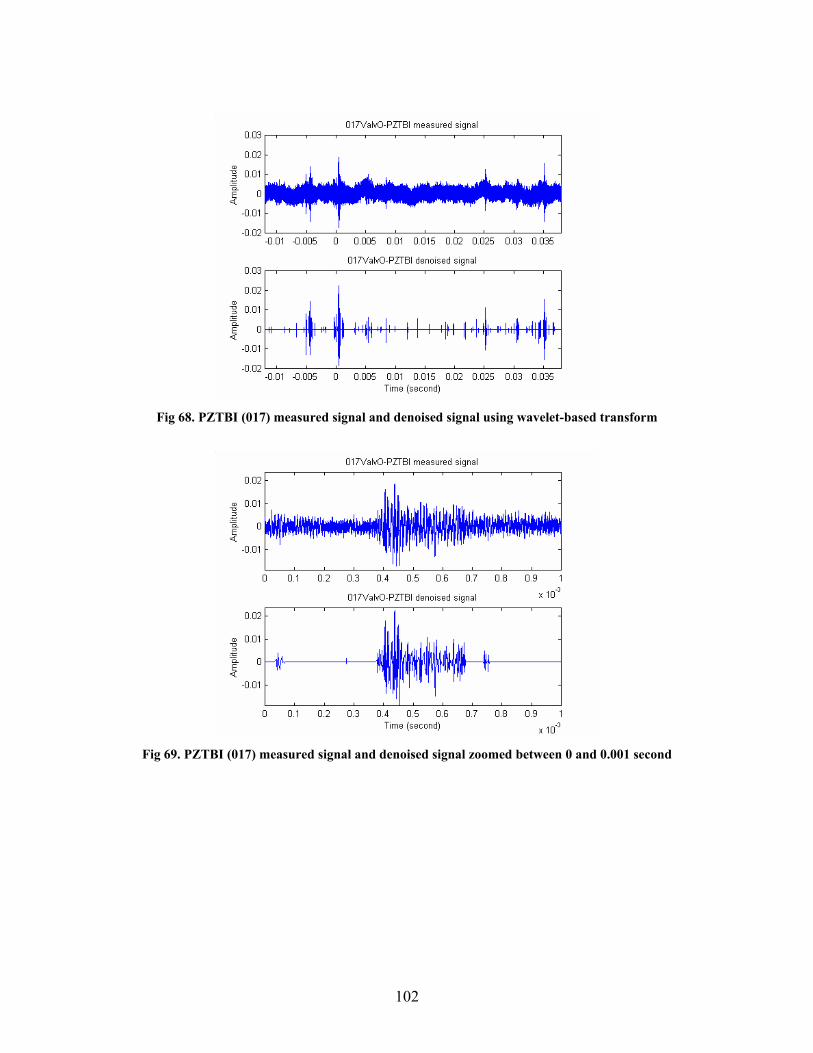
Fig 68. PZTBI (017) measured signal and denoised signal using wavelet-based transform
Fig 69. PZTBI (017) measured signal and denoised signal zoomed between 0 and 0.001 second
103
Measured signal DFT (017)
Denoised signal DFT (017)
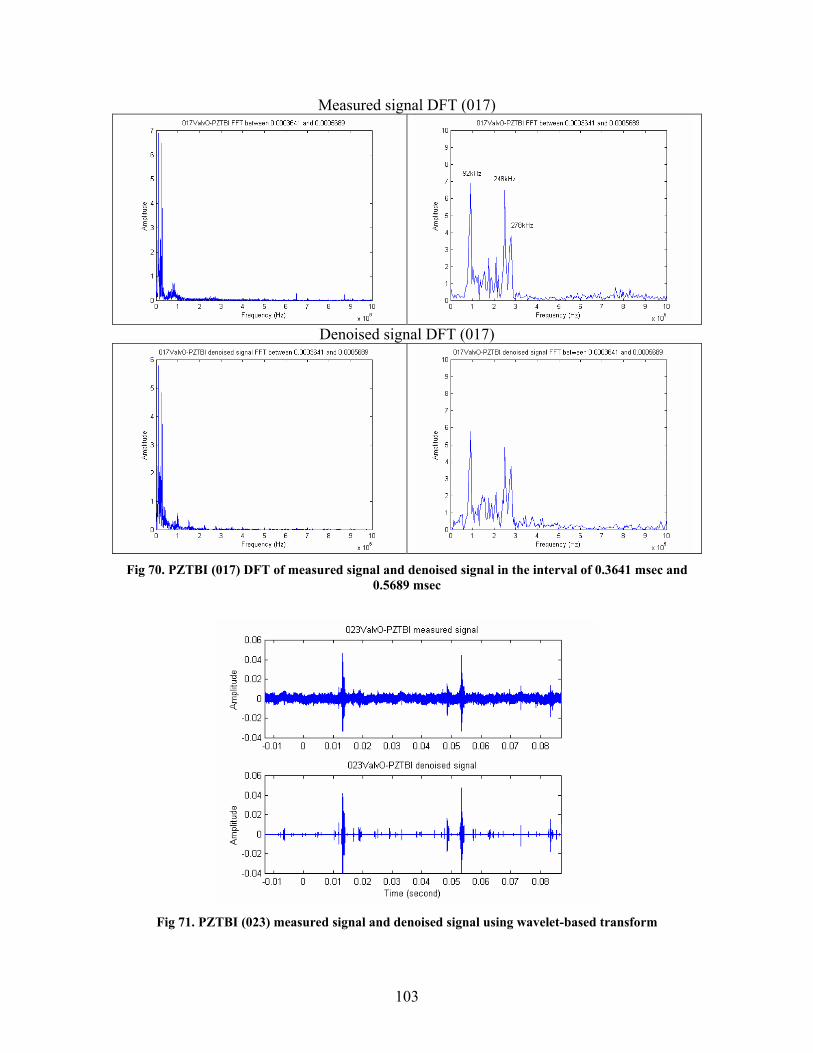
Fig 70. PZTBI (017) DFT of measured signal and denoised signal in the interval of 0.3641 msec and 0.5689 msec
Fig 71. PZTBI (023) measured signal and denoised signal using wavelet-based transform
104
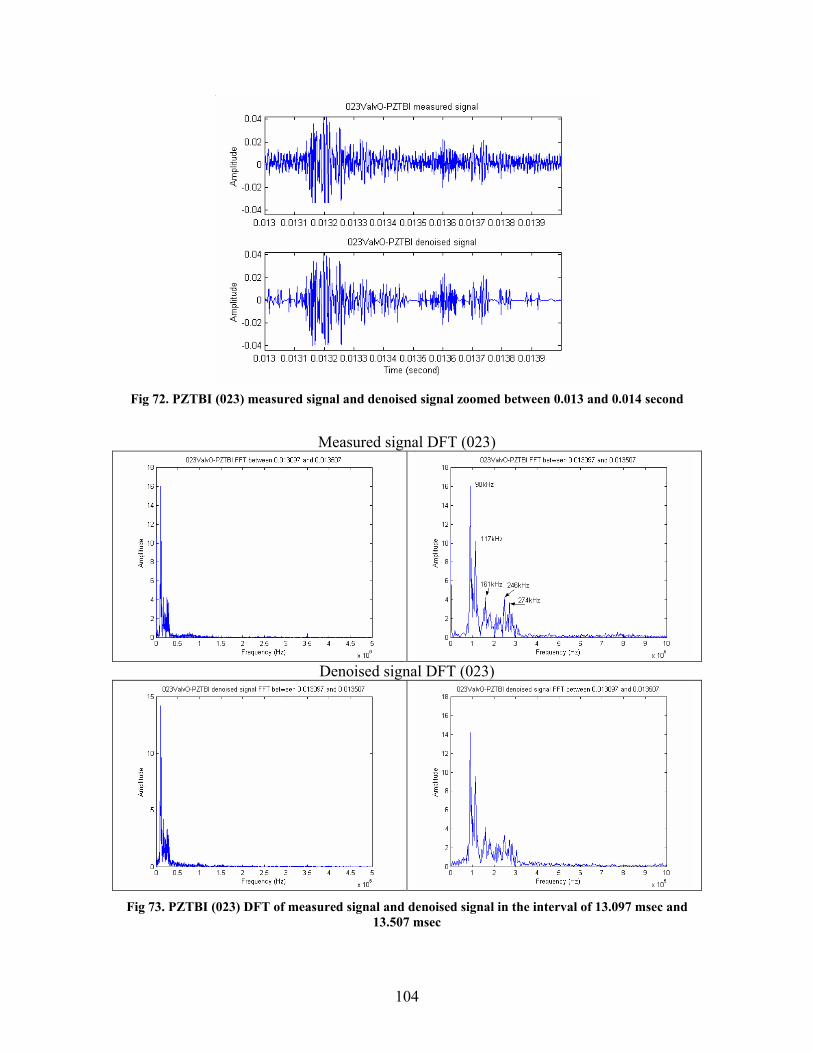
Fig 72. PZTBI (023) measured signal and denoised signal zoomed between 0.013 and 0.014 second
Measured signal DFT (023)
Denoised signal DFT (023)
Fig 73. PZTBI (023) DFT of measured signal and denoised signal in the interval of 13.097 msec and 13.507 msec
105
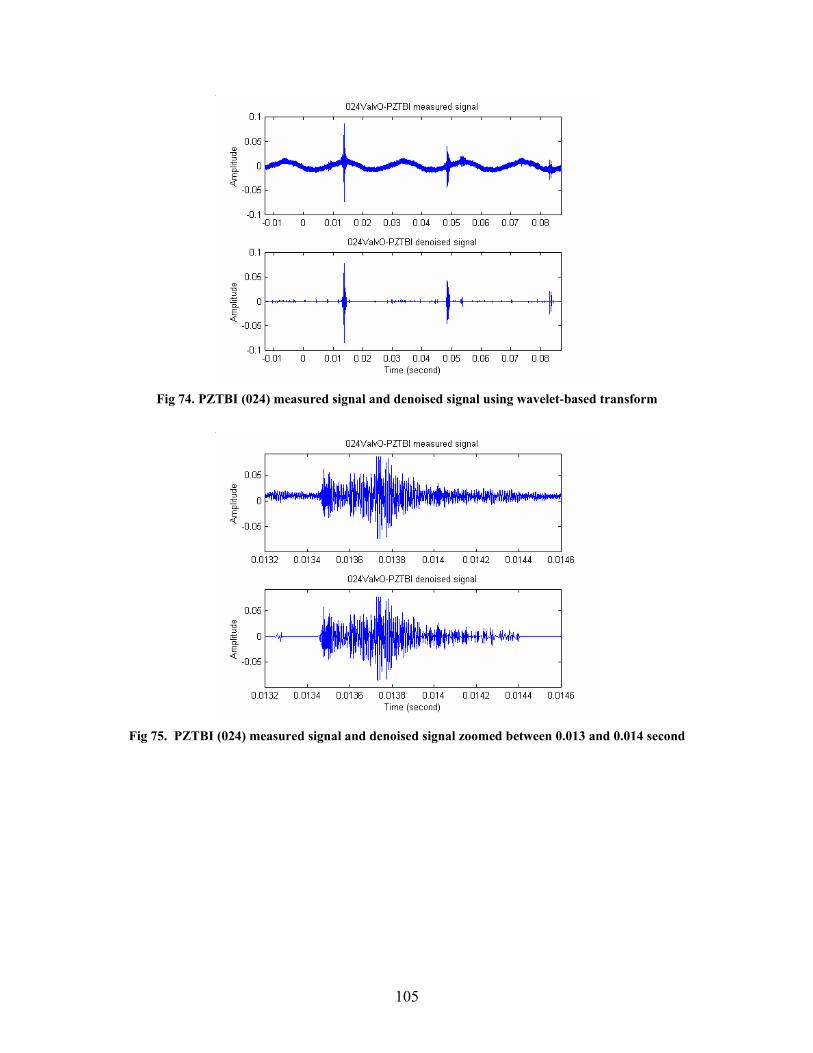
Fig 74. PZTBI (024) measured signal and denoised signal using wavelet-based transform
Fig 75. PZTBI (024) measured signal and denoised signal zoomed between 0.013 and 0.014 second
106
Measured signal DFT (024)
Denoised signal DFT (024)
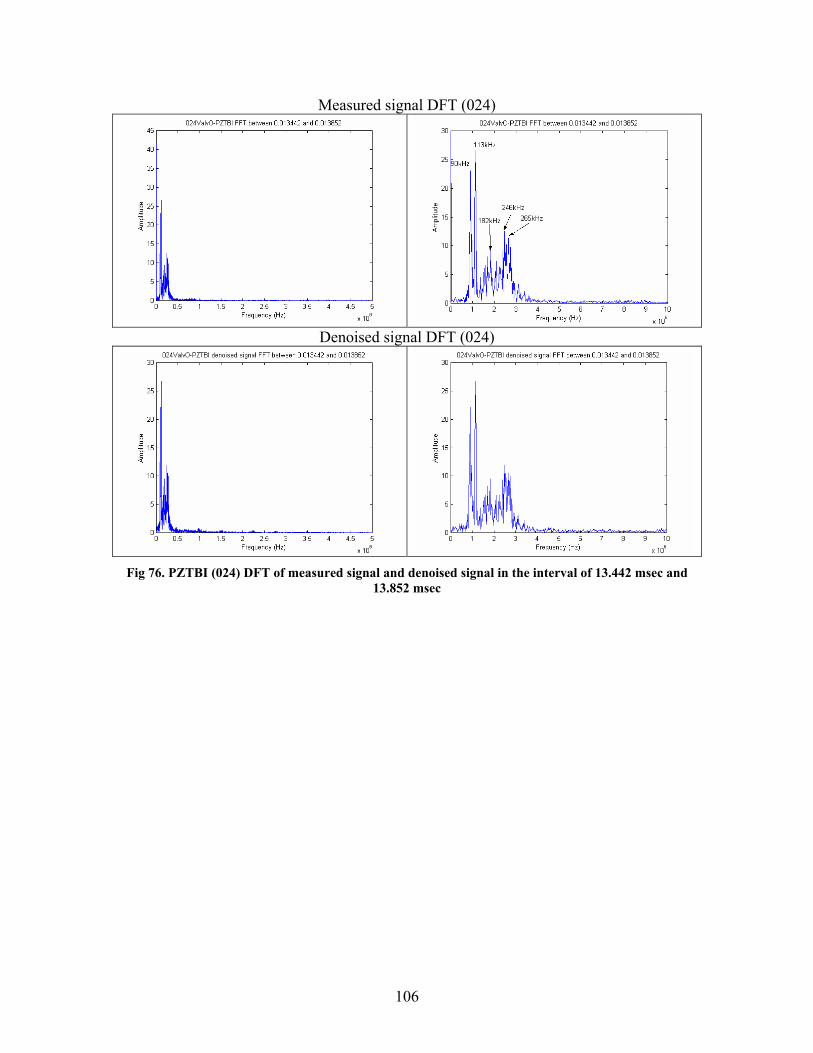
Fig 76. PZTBI (024) DFT of measured signal and denoised signal in the interval of 13.442 msec and 13.852 msec
107
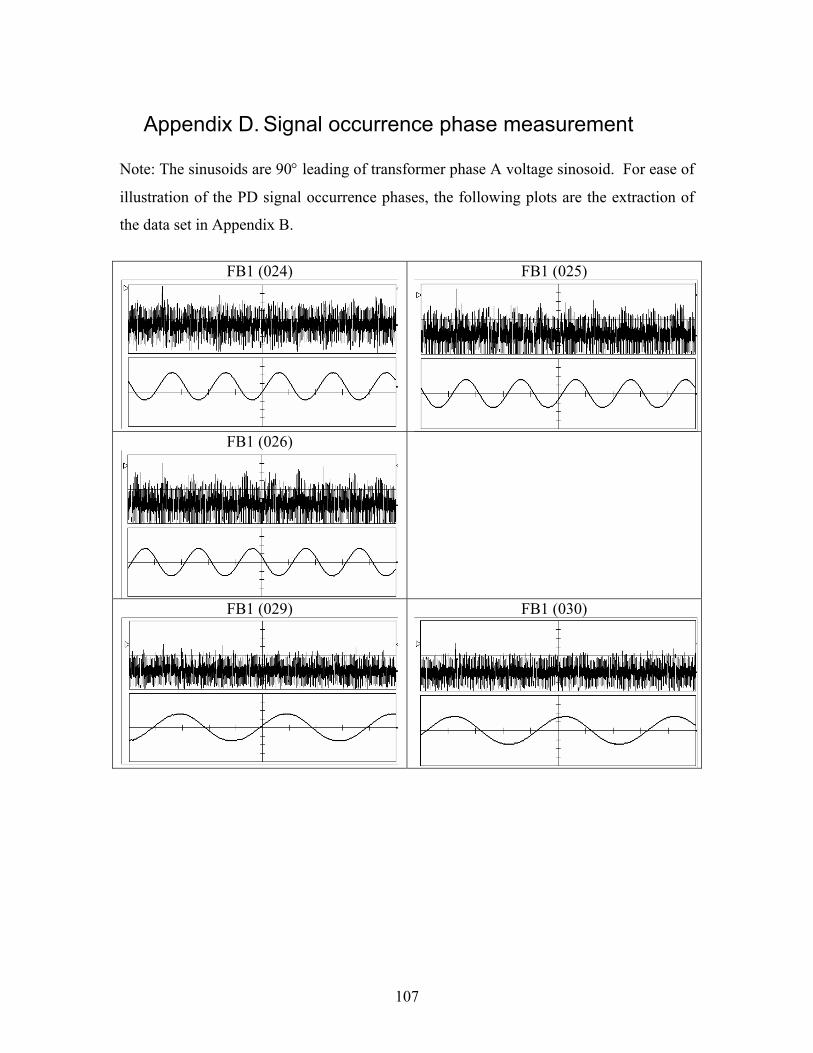
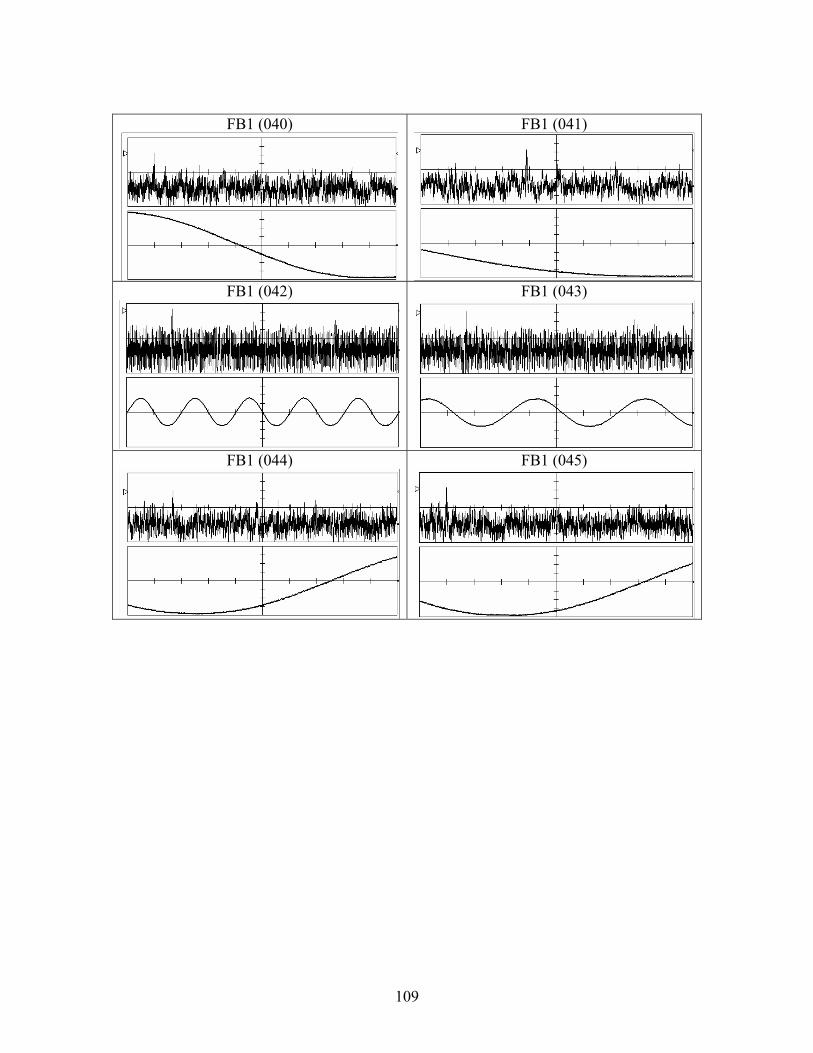
Appendix D. Signal occurrence phase measurement Note: The sinusoids are 90° leading of transformer phase A voltage sinosoid. For ease of
illustration of the PD signal occurrence phases, the following plots are the extraction of
the data set in Appendix B.
FB1 (024)
FB1 (025)
FB1 (026)
FB1 (029)
FB1 (030)
108
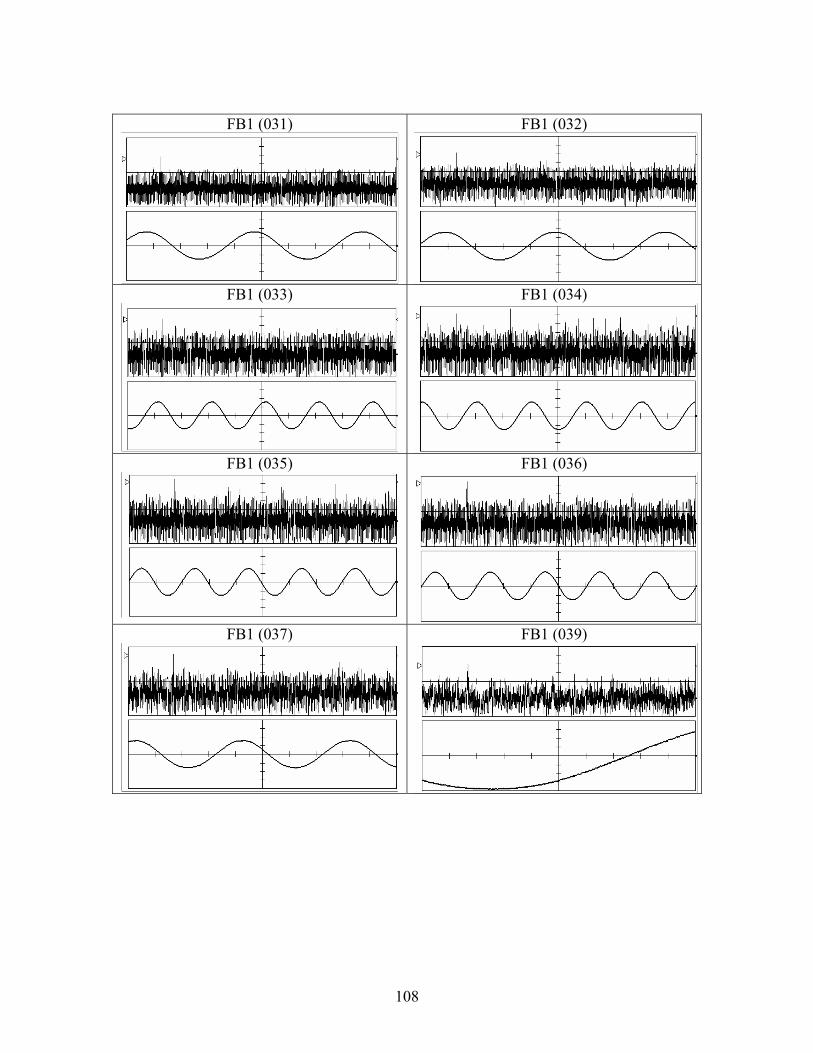
FB1 (031)
FB1 (032)
FB1 (033)
FB1 (034)
FB1 (035)
FB1 (036)
FB1 (037)
FB1 (039)
109
FB1 (040)
FB1 (041)
FB1 (042) FB1 (043)
FB1 (044) FB1 (045)
110
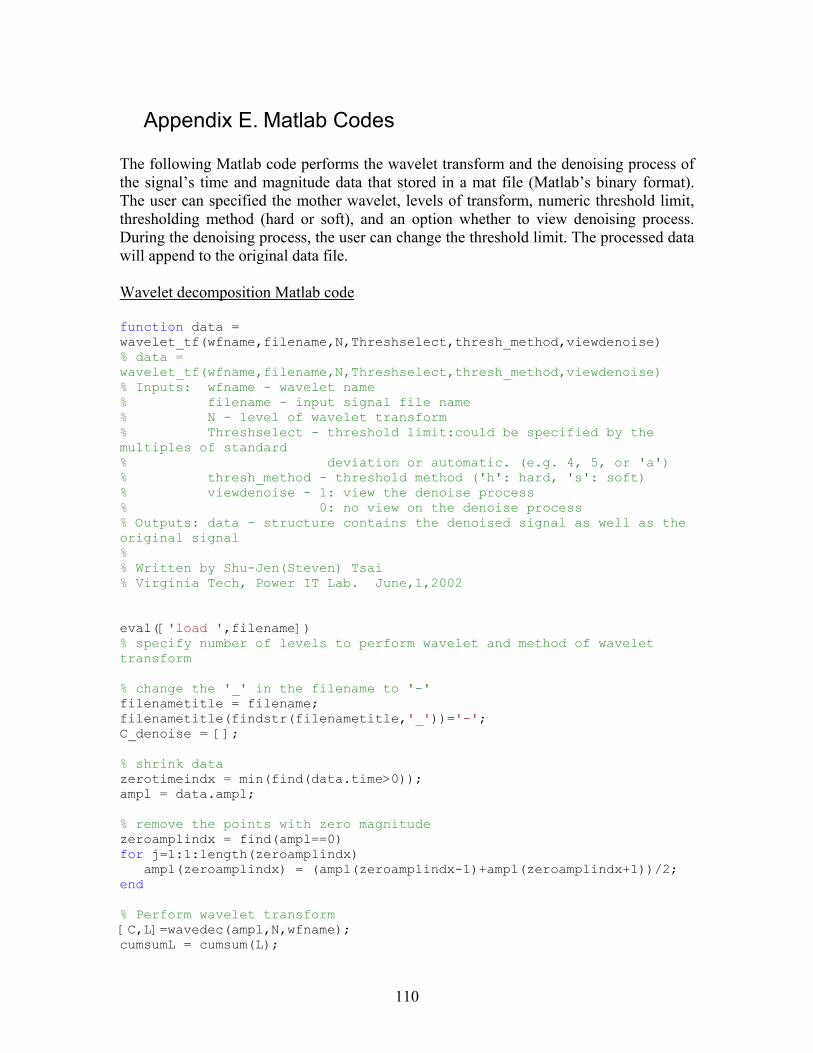
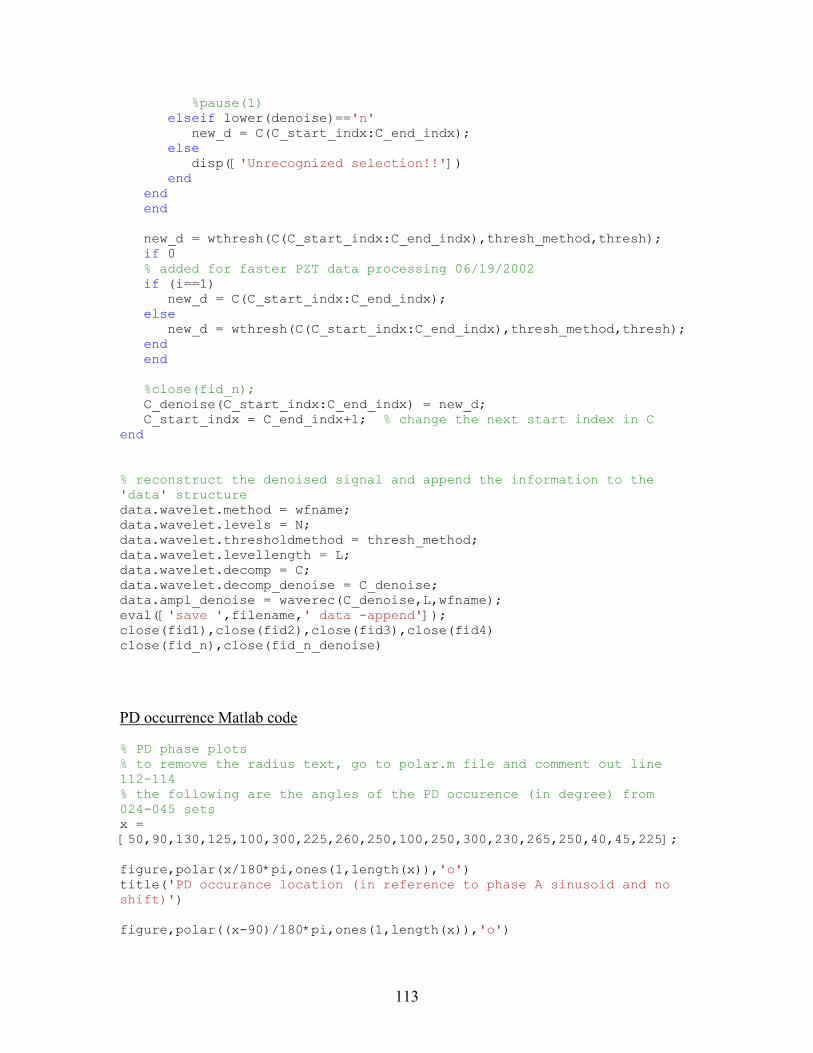
Appendix E. Matlab Codes The following Matlab code performs the wavelet transform and the denoising process of the signal’s time and magnitude data that stored in a mat file (Matlab’s binary format). The user can specified the mother wavelet, levels of transform, numeric threshold limit, thresholding method (hard or soft), and an option whether to view denoising process. During the denoising process, the user can change the threshold limit. The processed data will append to the original data file. Wavelet decomposition Matlab code function data = wavelet_tf(wfname,filename,N,Threshselect,thresh_method,viewdenoise) % data = wavelet_tf(wfname,filename,N,Threshselect,thresh_method,viewdenoise) % Inputs: wfname - wavelet name % filename - input signal file name % N - level of wavelet transform % Threshselect - threshold limit:could be specified by the multiples of standard % deviation or automatic. (e.g. 4, 5, or 'a') % thresh_method - threshold method ('h': hard, 's': soft) % viewdenoise - 1: view the denoise process % 0: no view on the denoise process % Outputs: data - structure contains the denoised signal as well as the original signal % % Written by Shu-Jen(Steven) Tsai % Virginia Tech, Power IT Lab. June,1,2002 eval(['load ',filename]) % specify number of levels to perform wavelet and method of wavelet transform % change the '_' in the filename to '-' filenametitle = filename; filenametitle(findstr(filenametitle,'_'))='-'; C_denoise = []; % shrink data zerotimeindx = min(find(data.time>0)); ampl = data.ampl; % remove the points with zero magnitude zeroamplindx = find(ampl==0) for j=1:1:length(zeroamplindx) ampl(zeroamplindx) = (ampl(zeroamplindx-1)+ampl(zeroamplindx+1))/2; end % Perform wavelet transform [C,L]=wavedec(ampl,N,wfname); cumsumL = cumsum(L);
111
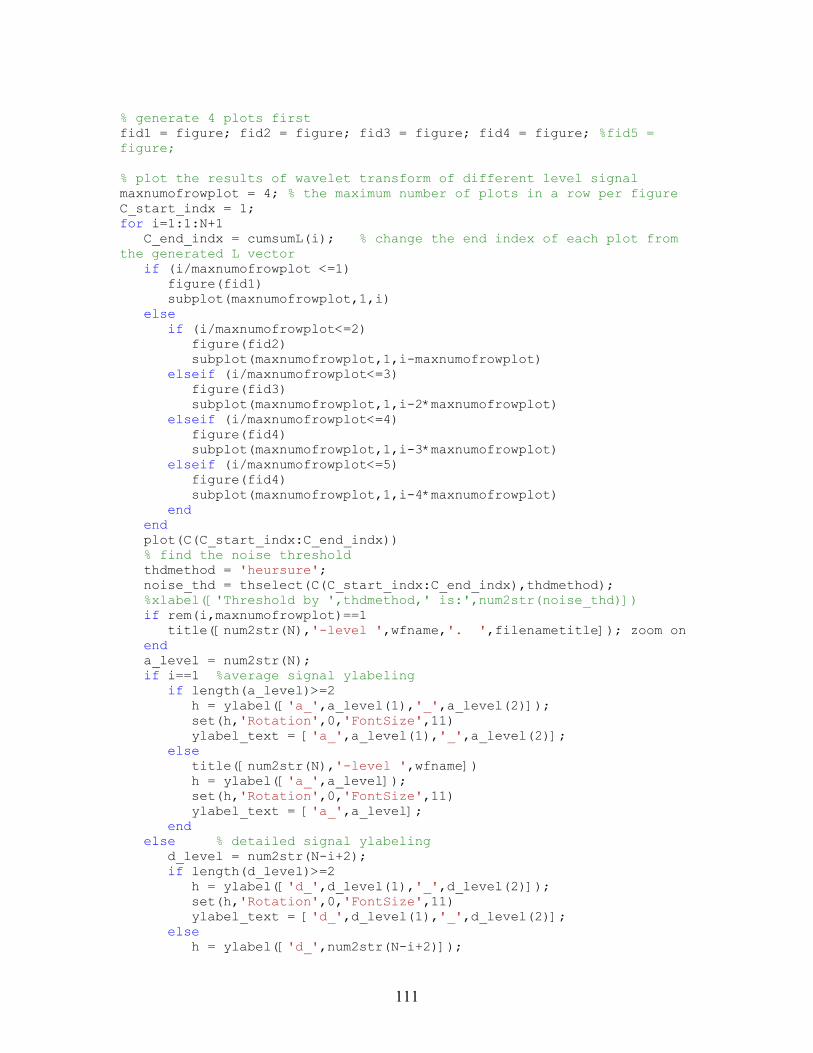
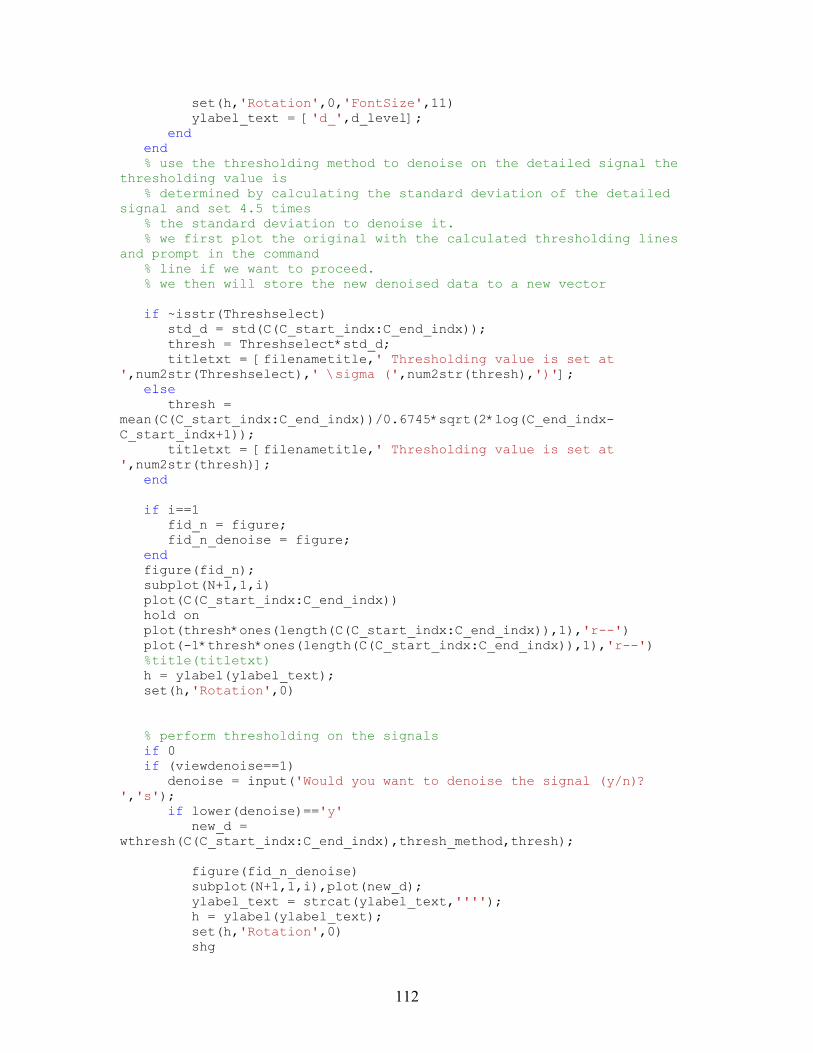
% generate 4 plots first fid1 = figure; fid2 = figure; fid3 = figure; fid4 = figure; %fid5 = figure; % plot the results of wavelet transform of different level signal maxnumofrowplot = 4; % the maximum number of plots in a row per figure C_start_indx = 1; for i=1:1:N+1 C_end_indx = cumsumL(i); % change the end index of each plot from the generated L vector if (i/maxnumofrowplot <=1) figure(fid1) subplot(maxnumofrowplot,1,i) else if (i/maxnumofrowplot<=2) figure(fid2) subplot(maxnumofrowplot,1,i-maxnumofrowplot) elseif (i/maxnumofrowplot<=3) figure(fid3) subplot(maxnumofrowplot,1,i-2*maxnumofrowplot) elseif (i/maxnumofrowplot<=4) figure(fid4) subplot(maxnumofrowplot,1,i-3*maxnumofrowplot) elseif (i/maxnumofrowplot<=5) figure(fid4) subplot(maxnumofrowplot,1,i-4*maxnumofrowplot) end end plot(C(C_start_indx:C_end_indx)) % find the noise threshold thdmethod = 'heursure'; noise_thd = thselect(C(C_start_indx:C_end_indx),thdmethod); %xlabel(['Threshold by ',thdmethod,' is:',num2str(noise_thd)]) if rem(i,maxnumofrowplot)==1 title([num2str(N),'-level ',wfname,'. ',filenametitle]); zoom on end a_level = num2str(N); if i==1 %average signal ylabeling if length(a_level)>=2 h = ylabel(['a_',a_level(1),'_',a_level(2)]); set(h,'Rotation',0,'FontSize',11) ylabel_text = ['a_',a_level(1),'_',a_level(2)]; else title([num2str(N),'-level ',wfname]) h = ylabel(['a_',a_level]); set(h,'Rotation',0,'FontSize',11) ylabel_text = ['a_',a_level]; end else % detailed signal ylabeling d_level = num2str(N-i+2); if length(d_level)>=2 h = ylabel(['d_',d_level(1),'_',d_level(2)]); set(h,'Rotation',0,'FontSize',11) ylabel_text = ['d_',d_level(1),'_',d_level(2)]; else h = ylabel(['d_',num2str(N-i+2)]);
112
set(h,'Rotation',0,'FontSize',11) ylabel_text = ['d_',d_level]; end end % use the thresholding method to denoise on the detailed signal the thresholding value is % determined by calculating the standard deviation of the detailed signal and set 4.5 times % the standard deviation to denoise it. % we first plot the original with the calculated thresholding lines and prompt in the command % line if we want to proceed. % we then will store the new denoised data to a new vector if ~isstr(Threshselect) std_d = std(C(C_start_indx:C_end_indx)); thresh = Threshselect*std_d; titletxt = [filenametitle,' Thresholding value is set at ',num2str(Threshselect),' \sigma (',num2str(thresh),')']; else thresh = mean(C(C_start_indx:C_end_indx))/0.6745*sqrt(2*log(C_end_indx-C_start_indx+1)); titletxt = [filenametitle,' Thresholding value is set at ',num2str(thresh)]; end if i==1 fid_n = figure; fid_n_denoise = figure; end figure(fid_n); subplot(N+1,1,i) plot(C(C_start_indx:C_end_indx)) hold on plot(thresh*ones(length(C(C_start_indx:C_end_indx)),1),'r--') plot(-1*thresh*ones(length(C(C_start_indx:C_end_indx)),1),'r--') %title(titletxt) h = ylabel(ylabel_text); set(h,'Rotation',0) % perform thresholding on the signals if 0 if (viewdenoise==1) denoise = input('Would you want to denoise the signal (y/n)? ','s'); if lower(denoise)=='y' new_d = wthresh(C(C_start_indx:C_end_indx),thresh_method,thresh); figure(fid_n_denoise) subplot(N+1,1,i),plot(new_d); ylabel_text = strcat(ylabel_text,''''); h = ylabel(ylabel_text); set(h,'Rotation',0) shg
113
%pause(1) elseif lower(denoise)=='n' new_d = C(C_start_indx:C_end_indx); else disp(['Unrecognized selection!!']) end end end new_d = wthresh(C(C_start_indx:C_end_indx),thresh_method,thresh); if 0 % added for faster PZT data processing 06/19/2002 if (i==1) new_d = C(C_start_indx:C_end_indx); else new_d = wthresh(C(C_start_indx:C_end_indx),thresh_method,thresh); end end %close(fid_n); C_denoise(C_start_indx:C_end_indx) = new_d; C_start_indx = C_end_indx+1; % change the next start index in C end % reconstruct the denoised signal and append the information to the 'data' structure data.wavelet.method = wfname; data.wavelet.levels = N; data.wavelet.thresholdmethod = thresh_method; data.wavelet.levellength = L; data.wavelet.decomp = C; data.wavelet.decomp_denoise = C_denoise; data.ampl_denoise = waverec(C_denoise,L,wfname); eval(['save ',filename,' data -append']); close(fid1),close(fid2),close(fid3),close(fid4) close(fid_n),close(fid_n_denoise) PD occurrence Matlab code % PD phase plots % to remove the radius text, go to polar.m file and comment out line 112-114 % the following are the angles of the PD occurence (in degree) from 024-045 sets x = [50,90,130,125,100,300,225,260,250,100,250,300,230,265,250,40,45,225]; figure,polar(x/180*pi,ones(1,length(x)),'o') title('PD occurance location (in reference to phase A sinusoid and no shift)') figure,polar((x-90)/180*pi,ones(1,length(x)),'o')

114
title('PD occurance location (in reference to phase A sinusoid with -90^o shift)') figure,polar((x-90-310)/180*pi,ones(1,length(x)),'o') titletxt[40] = ['PD occurance location (in reference to phase A sinusoid with -90^o shift']; titletxt[40] = ['and time delay of -310^o)']; title(titletxt)