Embed Size (px)
Citation preview
APPENDIX A: DESCRIPTIONS OF THE ACCELERATED LOADING FACILITY (ALF), SELECTED LABORATORY MIXTURE TESTS USED TO MEASURE RUTTING
POTENTIAL, AND THE LINEAR KNEADING COMPACTOR
The fliers given in this appendix are intended to be stand alone fliers; therefore, each flier has its own set of table and figure numbers that start at table 1 and figure 1. The numbers do not match the numbers for the rest of the report.
248
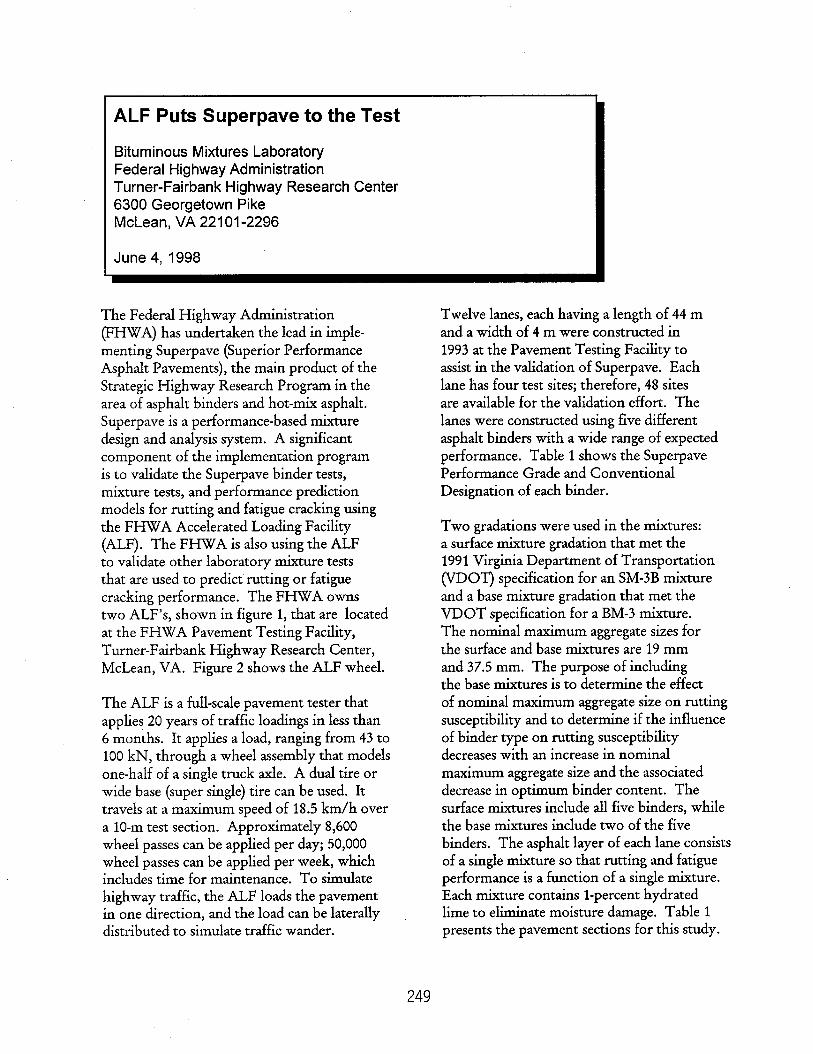
ALF Puts Superpave to the Test
Bituminous Mixtures Laboratory Federal Highway Administration Turner-Fairbank Highway Research Center 6300 Georgetown Pike McLean, VA 22101-2296
June 4, 1998
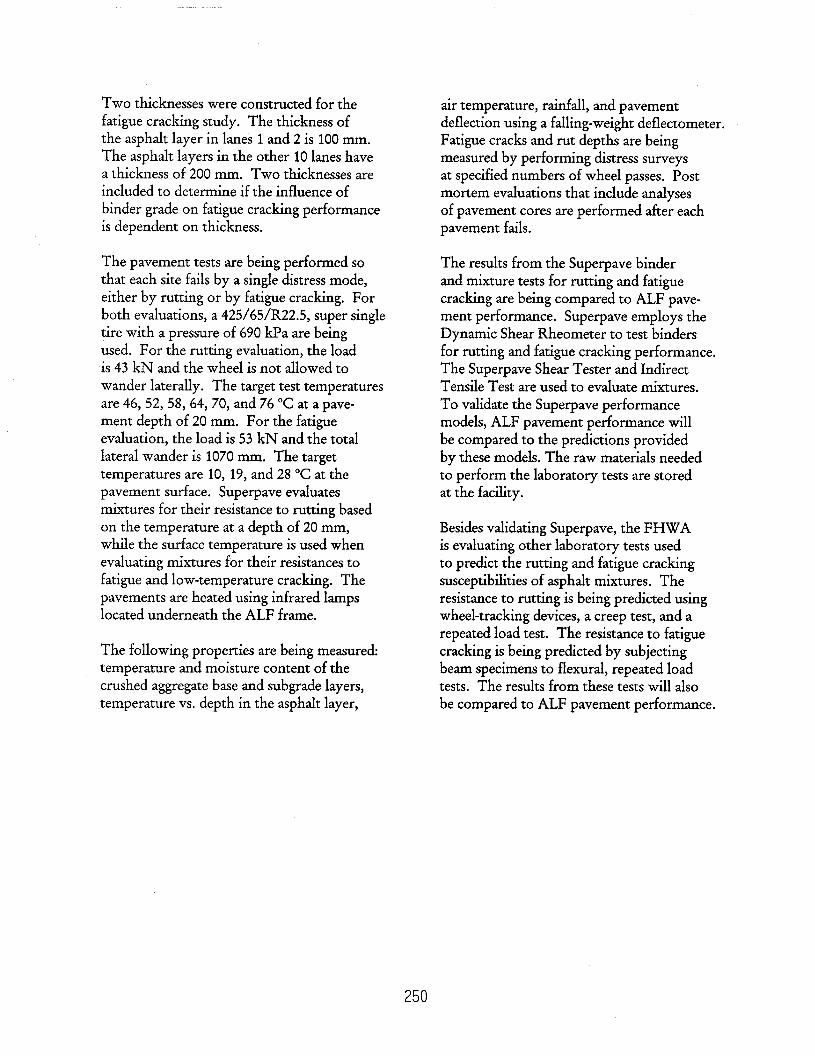
The Federal Highway Administration (FHWA) has undertaken the lead in imple- menting Superpave (Superior Performance Asphalt Pavements), the main product of the Strategic Highway Research Program in the area of asphalt binders and hot-mix asphalt. Superpave is a performance-based mixture design and analysis system. A significant component of the implementation program is to validate the Super-pave binder tests, mixture tests, and performance prediction models for rutting and fatigue cracking using the FHWA Accelerated Loading Facility (ALF). The FHWA is also using the ALF to validate other laboratory mixture tests that are used to predict rutting or fatigue cracking performance. The FHWA owns two ALF’s, shown in figure 1, that are located at the FHWA Pavement Testing Facility, Turner-Fairbank Highway Research Center, McLean, VA. Figure 2 shows the ALF wheel.
The ALF is a full-scale pavement tester that applies 20 years of traffic loadings in less than 6 months. It applies a load, ranging from 43 to 100 kN, through a wheel assembly that models one-half of a single truck axle. A dual tire or wide base (super single) tire can be used. It travels at a maximum speed of 18.5 km/h over a 10-m test section. Approximately 8,600 wheel passes can be applied per day; 50,000 wheel passes can be applied per week, which includes time for maintenance. To simulate highway traffic, the ALF loads the pavement in one direction, and the load can be laterally distributed to simulate traffic wander.
Twelve lanes, each having a length of 44 m and a width of 4 m were constructed in 1993 at the Pavement Testing Facility to assist in the validation of Superpave. Each lane has four test sites; therefore, 48 sites are available for the validation effort. The lanes were constructed using five different asphalt binders with a wide range of expected performance. Table 1 shows the Superpave Performance Grade and Conventional Designation of each binder.
Two gradations were used in the mixtures: a surface mixture gradation that met the 1991 Virginia Department of Transportation (VDOT) specification for an SM3B mixture and a base mixture gradation that met the VDOT specification for a BM-3 mixture. The nominal maximum aggregate sizes for the surface and base mixtures are 19 mm and 37.5 mm. The purpose of including the base mixtures is to determine the effect of nominal maximum aggregate size on rutting susceptibility and to determine if the influence of binder type on rutting susceptibility decreases with an increase in nominal maximum aggregate size and the associated decrease in optimum binder content. The surface mixtures include all five binders, while the base mixtures include two of the five binders. The asphalt layer of each lane consists of a single mixture so that rutting and fatigue performance is a function of a single mixture. Each mixture contains l-percent hydrated lime to eliminate moisture damage. Table 1 presents the pavement sections for this study.
249
Two thicknesses were constructed for the fatigue cracking study. The thickness of the asphalt layer in lanes 1 and 2 is 100 mm. The asphalt layers in the other 10 lanes have a thickness of 200 mm. Two thicknesses are included to determine if the influence of binder grade on fatigue cracking performance is dependent on thickness.
The pavement tests are being performed so that each site fails by a single distress mode, either by rutting or by fatigue cracking. For both evaluations, a 425/65/R22.5, super single tire with a pressure of 690 kl?a are being used. For the rutting evaluation, the load is 43 kN and the wheel is not allowed to wander laterally. The target test temperatures are 46, 52, 58,64,70, and 76 “C at a pave- ment depth of 20 mm. For the fatigue evaluation, the load is 53 kN and the total lateral wander is 1070 mm. The target temperatures are 10, 19, and 28 “C at the pavement surface. Superpave evaluates mixtures for their resistance to rutting based on the temperature at a depth of 20 mm, while the surface temperature is used when evaluating mixtures for their resistances to fatigue and low-temperature cracking. The pavements are heated using infrared lamps located underneath the ALF frame.
The following properties are being measured: temperature and moisture content of the crushed aggregate base and subgrade layers, temperature vs. depth in the asphalt layer,
air temperature, rainfall, and pavement deflection using a falling-weight deflectometer. Fatigue cracks and rut depths are being measured by performing distress surveys at specified numbers of wheel passes. Post mortem evaluations that include analyses of pavement cores are performed after each pavement fails.
The results from the Super-pave binder and mixture tests for rutting and fatigue cracking are being compared to ALF pave- ment performance. Superpave employs the Dynamic Shear Rheometer to test binders for rutting and fatigue cracking performance. The Superpave Shear Tester and Indirect Tensile Test are used to evaluate mixtures. To validate the Super-pave performance models, ALF pavement performance will be compared to the predictions provided by these models. The raw materials needed to perform the laboratory tests are stored at the facility.
Besides validating Superpave, the FHWA is evaluating other laboratory tests used to predict the rutting and fatigue cracking susceptibilities of asphalt mixtures. The resistance to rutting is being predicted using wheel-tracking devices, a creep test, and a repeated load test. The resistance to fatigue cracking is being predicted by subjecting beam specimens to flexural, repeated load tests. The results from these tests will also be compared to ALF pavement performance.
250
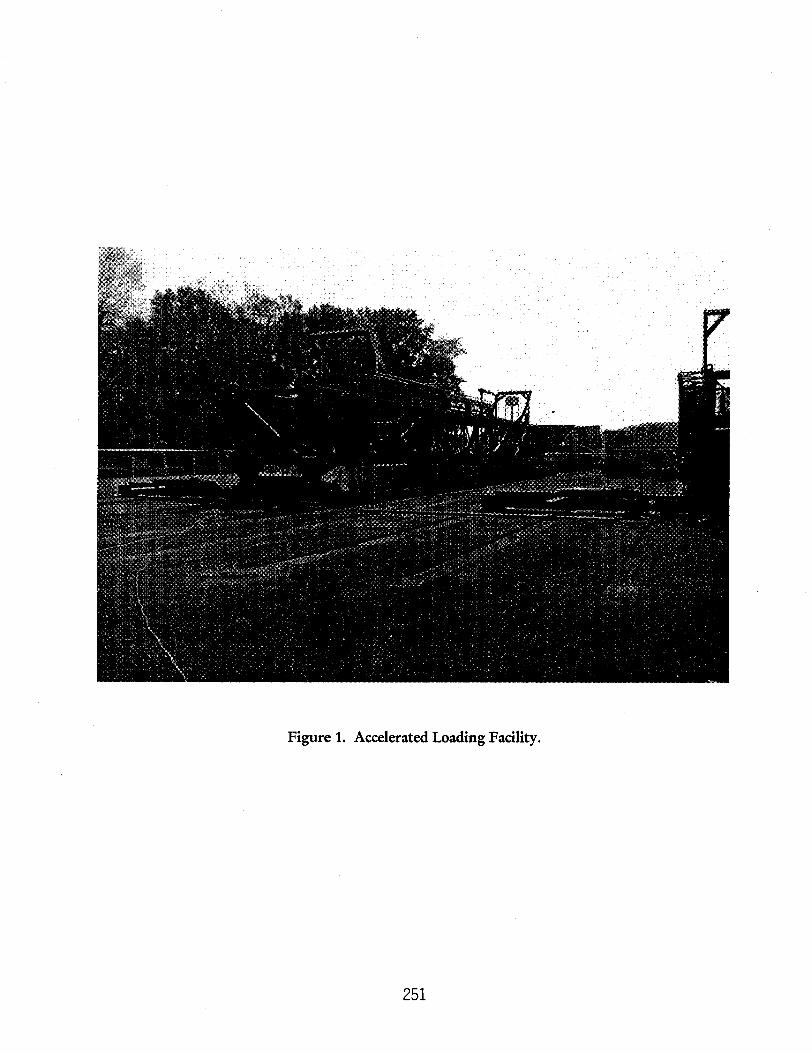
Figure 1. Accelerated Loading Facility.
251
Figure 2. Close-up of the ALF wheel.
252
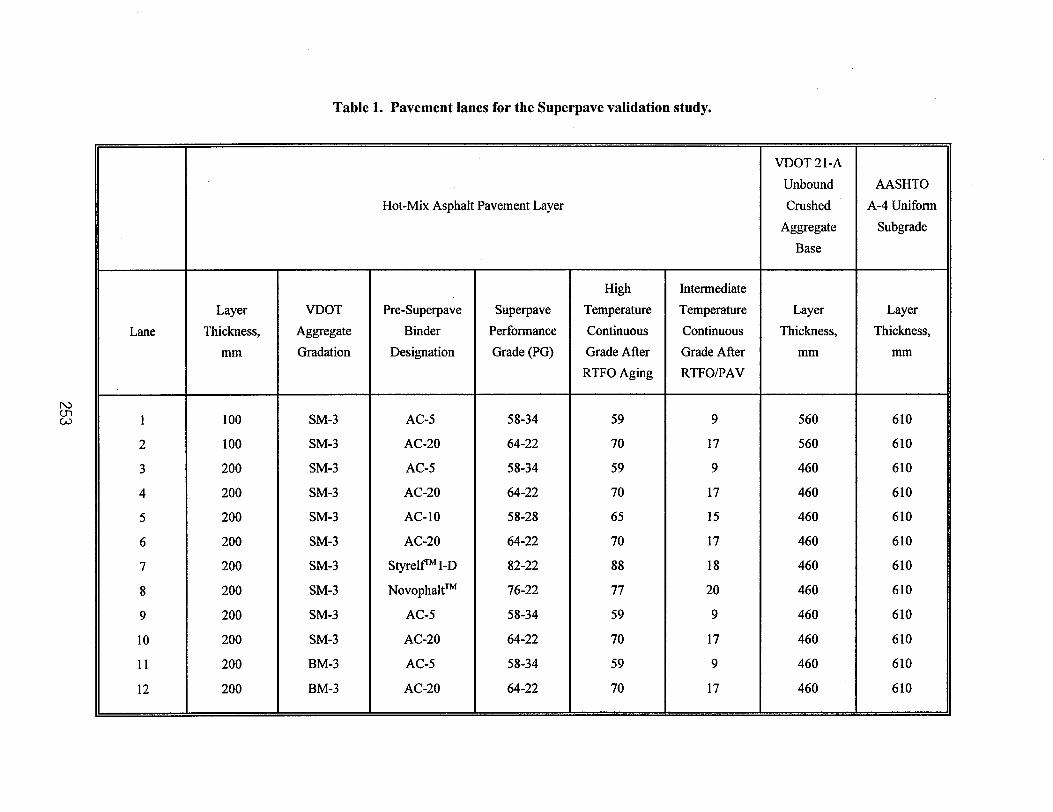
Table 1. Pavement lanes for the Superpave validation study.
Hot-Mix Asphalt Pavement Layer
VDOT 2 1 -A
Unbound Crushed
Aggregate Base
AASHTO
A-4 Uniform Subgrade
Lane
1
2
3
4
5
6
7
8
9
10
11
12
Layer VDOT Pre-Superpave Superpave Thickness, Aggregate Binder Performance
mm Gradation Designation Grade (PG)
100 SM-3 AC-5 58-34
100 SM-3 AC-20 64-22
200 SM-3 AC-5 58-34
200 SM-3 AC-20 64-22
200 SM-3 AC-10 58-28
200 SM-3 AC-20 64-22
200 SM-3 StyrelI? I-D 82-22
200 SM-3 NovophaltTM 76-22
200 SM-3 AC-5 58-34
200 SM-3 AC-20 64-22
200 BM-3 AC-5 58-34
200 BM-3 AC-20 64-22
High Intermediate Temperature Temperature Continuous Continuous Grade After Grade After RTFO Aging RTFO/PAV
59 9
70 17
59 9
70 17
65 15
70 17
88 18
77 20
59 9
70 17
59 9
70 17
Layer Layer Thickness, Thickness,
mm mm
560 610
560 610
460 610
460 610
460 610
460 610
460 610
460 610
460 610
460 610
460 610
460 610
U.S. Corps of Engineers Gyrator-y Testing Machine
Bituminous Mixtures Laboratory Federal Highway Administration Turner-Fairbank Highway Research Center 6300 Georgetown Pike McLean, VA 22101-2296
January 23, 1996
1. Operational Principles of the Gyratory Testing Machine (GTM)
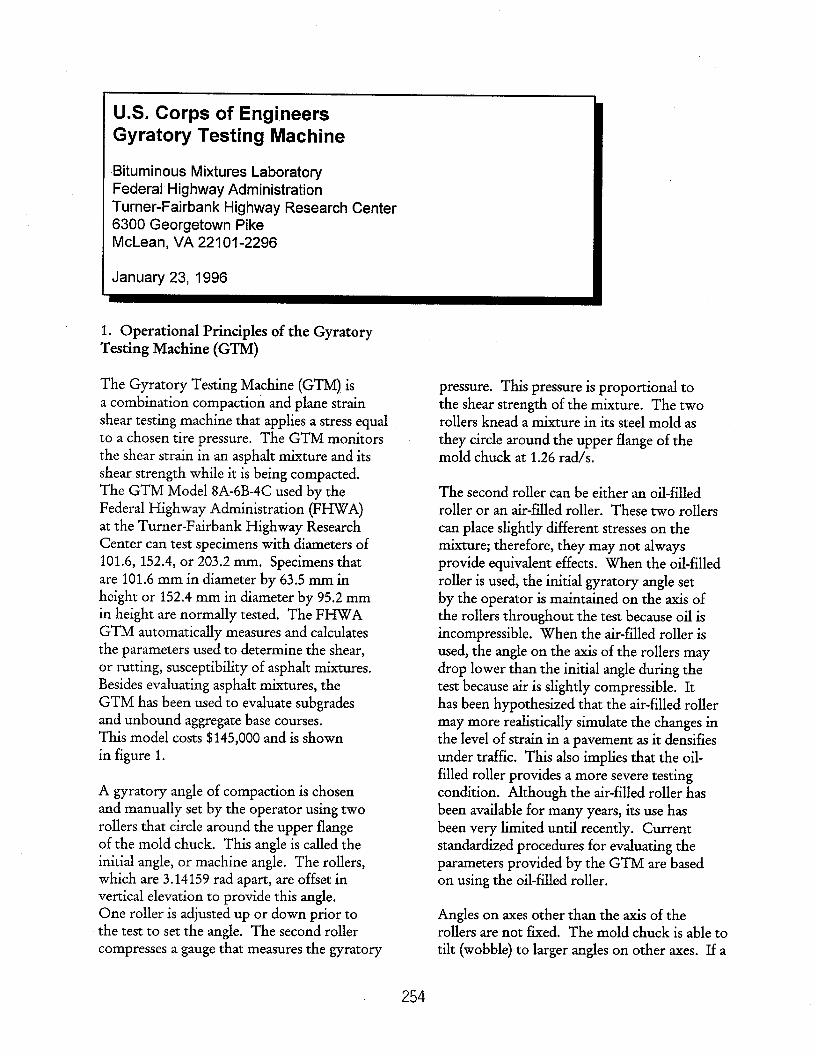
The Gyrator-y Testing Machine (GTM) is a combination compaction and plane strain shear testing machine that applies a stress equal to a chosen tire pressure. The GTM monitors the shear strain in an asphalt mixture and its shear strength while it is being compacted. The GTM Model 8A-6B-4C used by the Federal Highway Administration (FHWA) at the Turner-Fan-bank Highway Research Center can test specimens with diameters of 101.6, 152.4, or 203.2 mm. Specimens that are 101.6 mm in diameter by 63.5 mm in height or 152.4 mm in diameter by 95.2 mm in height are normally tested. The FHWA GTM automatically measures and calculates the parameters used to determine the shear, or rutting, susceptibility of asphalt mixtures. Besides evaluating asphalt mixtures, the GTM has been used to evaluate subgrades and unbound aggregate base courses. This model costs $145,000 and is shown in figure 1.
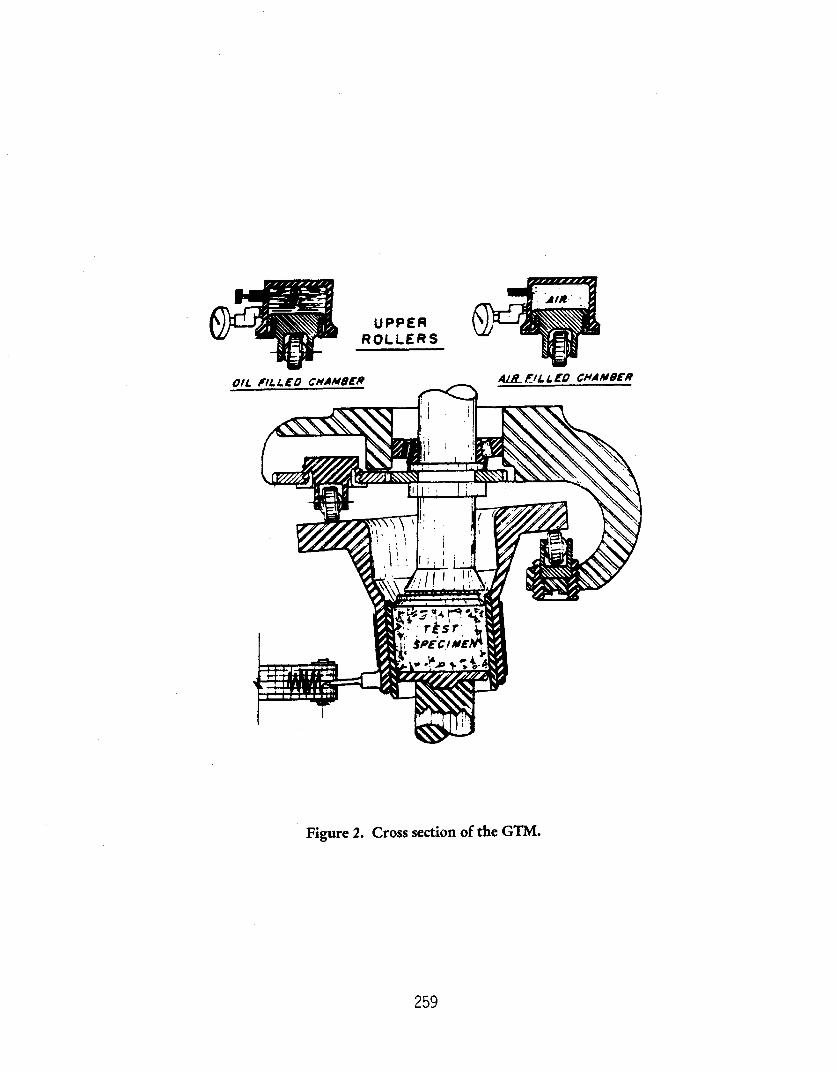
A gyrator-y angle of compaction is chosen and manually set by the operator using two rollers that circle around the upper flange of the mold chuck. This angle is called the initial angle, or machine angle. The rollers, which are 3.14159 rad apart, are offset in vertical elevation to provide this angle. One roller is adjusted up or down prior to the test to set the angle. The second roller compresses a gauge that measures the gyratory
pressure. This pressure is proportional to the shear strength of the mixture. The two rollers knead a mixture in its steel mold as they circle around the upper flange of the mold chuck at 1.26 ratis.
The second roller can be either an oil-filled roller or an air-filled roller. These two rollers can place slightly different stresses on the mixture; therefore, they may not always provide equivalent effects. When the oil-filled roller is used, the initial gyrator-y angle set by the operator is maintained on the axis of the rollers throughout the test because oil is incompressible. When the air-filled roller is used, the angle on the axis of the rollers may drop lower than the initial angle during the test because air is slightly compressible. It has been hypothesized that the air-filled roller may more realistically simulate the changes in the level of strain in a pavement as it densifies under traffic. This also implies that the oil- filled roller provides a more severe testing condition. Although the air-filled roller has been available for many years, its use has been very limited until recently. Current standardized procedures for evaluating the parameters provided by the GTM are based on using the oil-filled roller.
Angles on axes other than the axis of the rollers are not fixed. The mold chuck is able to tilt (wobble) to larger angles on other axes. If a
254
mixture shears while it is being compacted, it moves away from under the rollers, causing the mold and mold chuck to tilt to a larger angle on some other axis. (The mold chuck clamps the mold firmly.) The upper and lower platens remain parallel during the test, but the upper platen is free to slide sideways in a horizontal plane during the test. This allows the mixture to shear and the mold and mold chuck to tilt. The cross section of the GTM is shown in figure 2.
The GTM records the largest angle produced during each revolution. This angle, which may occur on any axis, is a measure of the magnitude of the shear strain in the mixture. After the compaction process is started, the recorded angle is normally higher than the initial angle because the loose mixture shears, causing the mold and mold chuck to tilt. With further compaction, the recorded angle will generally start to decrease because the shear strengths of most mixtures increase with an increase in density.
When a mixture is not shear-susceptible, the angles recorded by the GTM vs. revolutions will be equal to, or close to, the initial angle. The mold and mold chuck tilt will be very little. An angle greater than the initial angle is produced when the mixture is shear- susceptible. A mixture containing rounded, smooth, coarse aggregates may immediately produce a significantly greater angle because these aggregates provide low internal friction and no interlock. With excessive binder contents, the angle at some number of revolutions will start to increase as the mixture approaches its refusal, or ultimate, density. This will occur when testing mixtures containing either rounded or crushed coarse aggregates.
2. GTM Parameters
The three principal GTM parameters used to evaluate asphalt mixtures are the gyratory stability index (GSI), gyrator-y elasto-plastic
index (GEPI), and shear strength (Sg). Other parameters that have been evaluated are the gyrator-y shear factor (GSF), gyrator-y strain classification index (GSCI), gyratory com- patibility index (GCI), and the density of the aggregate.
The GSI is the ratio of the final angle at the end of the test to the minimum intermediate angle. It is a measure of shear susceptibility at the refusal density. The minimum interme- diate angle is the smallest angle that occurs after the compaction process has started. It can be greater than the initial angle. The GSI at 300 revolutions is close to 1.0 for a stable mixture and is significantly above 1.1 for an unstable mixture. (*) (A more definitive criterion for the GSI has not been established. The manufacturer suggests using 1.00 as the maximum allowable GSI to eliminate rutting completely and because some test methods terminate the test at revolutions much lower than 300. When designing a mixture, binder contents that provide a GSI above 1.00 will be susceptible to rutting.)
The GEPI is the ratio of the minimum intermediate angle to the initial angle. It is a measure of internal friction. A GEPI of 1.00 indicates high internal friction. A GEPI significantly above 1.00 indicates low internal friction, generally due to the use of rounded coarse aggregates. (More definitive criteria for the GEPI have not been established. The manufacturer suggests using an acceptable range of 1.00 to 1.50 and a marginal range of 1.51 to 1.65.)
The Sg of a mixture is calculated from the roller pressure. The GTM Model SA-6B-4C continuously monitors the Sg during compac- tion, but current test methods only evaluate the Sg at the refusal density. Reportedly, the Sg should peak and then start to decrease rapidly with increasing binder content. Binder contents higher than the content at the peak Sg may lead to mixtures that are susceptible to rutting.
255
The GSF is the ratio of the Sg to the theoretical maximum shear stress that will be applied to the mixture in a pavement. The theoretical maximum shear stress is obtained by performing a mechanistic analysis of the pavement. A ratio greater than 1.0 indicates that the mixture may fail in shear. If a mechanistic analysis is not available, then a tentative minimum allowable Sg of 350 kPa can be used.
The GSCI is the ratio of the angle at 30 revolutions to the final angle. This approximates the ratio of the strain in the mixture after pavement construction to the strain after densification by traffic. The GSCI is a more recently developed parameter. The benefit of this parameter has not been established. A high GSCI may indicate a susceptibility to rutting. A low GSCI, caused by a decreasing angle during compaction, may indicate that either the aggregate is deteriorating, or, when pavement cores are tested, they may have been damaged by moisture.
The GCI is the ratio of the unit mass of the mixture at 50 revolutions to the unit mass of the mixture at 100 revolutions. This parameter has been used to evaluate the workabilities of mixtures, but the use of 50 and 100 revolutions to compute this parameter is arbitrary.
The density of the aggregate only, as opposed to the density of the total mixture, is evaluated because this is a measure of aggregate structure. Binder contents higher than the content at the peak aggregate density may provide mixtures that are susceptible to rutting.
The height of the specimen is also monitored during compaction. After the compaction process is completed, the specimen is then removed from the mold and tested for bulk specific gravity. This gravity and the maximum specific gravity of the loose mixture are used to calculate the air voids in the specimen. A relationship between
air voids and revolutions, which provides the compaction history of the mixture, can be calculated using the heights. The air voids at the beginning of the compaction history have the greatest amount of error because the bulk specific gravities determined after compaction do not account for the greater volumes of surface voids that are present at the beginning of the test. The height measurements include these voids.
3. GTM Procedures Used by the FHWA
Two test methods have been used by the FHWA, both employing the oil-filled roller. The first procedure is American Society for Testing and Materials (ASTM) Method D 3387, “Compaction and Shear Properties of Bituminous Mixtures by Means of the U.S. Corps of Engineers Gyrator-y Testing Machine (GTM). “Q) This procedure uses a vertical pressure equal to the anticipated maximum tire pressure and a 0.014-rad gyratory angle. The FHWA uses a vertical pressure of 0.827 MPa. Mixtures are com- pacted at typical compaction temperatures to equilibrium, defined as the number of revolutions where the change in density becomes less than 16 kg/m3 per 100 revolu- tions. This point of equilibrium is usually well below 300 revolutions and is often around 200 revolutions. A trace of the gyratory angle vs. revolutions is obtained to determine the minimum intermediate and final angles.
The second procedure is given in the National Cooperative Highway Research Program (NCHRP) Asphalt-Aggregate Mixture Analysis System (AAMAS), which is based on ASTM Method D 3387.n3) This procedure uses a vertical pressure of 0.827 MPa and a 0.035-rad gyratory angle. However, this angle was found to produce specimens with excessively low air-void levels; therefore, a O.Ol+rad angle has been used by the FHWA. The specimens are first compacted to the estimated air-void level that will be obtained in the field after construction, usually between 5 and 8 percent. The number of gyratory revolutions is varied
256
to obtain this air-void level. Trial tests are used to determine the needed number of revolutions. After initial compaction, the specimens in their molds are placed in an oven at 60 “C for 3 h. They are then compacted to refusal density at 60 “C, using 300 revolutions. A trace of the gyrator-y angle vs. revolutions is obtained to determine the minimum inter- mediate and final angles. This procedure was developed so that mixtures would be tested at the typically used high pavement temperature of 60 “C.
4. References
1. Roberts, F.L., P.S. Kandhal, E.R. Brown, D.Y. Lee, and T.W. Kennedy. Hot Mix Asphalt Materiah, Mixture Design, and Construction. National Asphalt Pavement Association (NAPA) Education Foundation, Lanham, MD, 1991.
2. American Society for Testing and Materials. 1994 Annual Book ofASTM Standards, Section 4, Volume 04.03. 1916 Race Street, Philadelphia, PA, April 1994.
3. Von Quintus, H.L, J.A. Scherocman, C.S. Hughes, and T.W. Kennedy. Aspbalt- Aggregate Mixture Analysis System. NCHRI? Report 338, Transportation Research Board, National Research Council, Washington, DC, 1991.
257
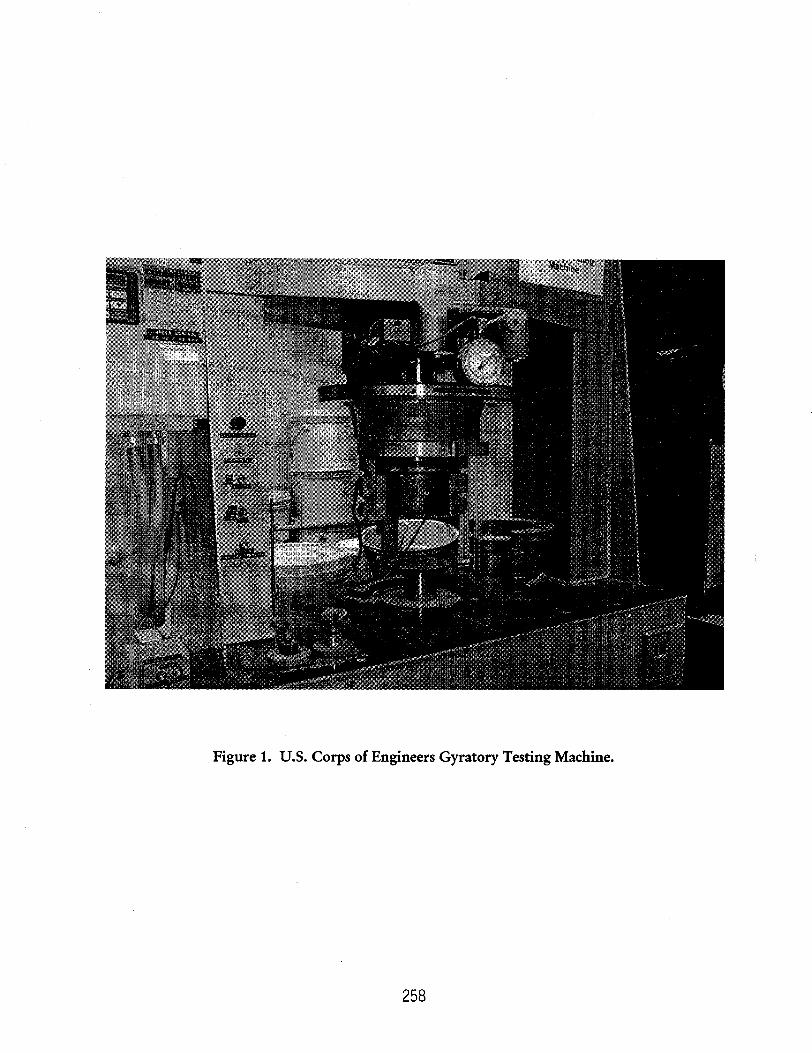
Figure 1. U.S. Corps of Engineers Gyratory Testing Machine.
258
UPPER ROLLERS
Figure 2. Cross section of the GTM.
259
French Pavement Rutting Tester
Bituminous Mixtures Laboratory Federal Highway Administration Turner-Fairbank Highway Research Center 6300 Georgetown Pike McLean, VA 22101-2296
December 19, 1996
The French (Laboratoires des Pants et Chaussees) Pavement Rutting Tester tests slabs for permanent deformation at 60 “C using a smooth, reciprocating, pneumatic rubber tire inflated to 0.60 f 0.03 MPa. This tester is used in France to evaluate mixtures subjected to heavy traffic; mixtures that incorporate materials that tend to lead to rutting, such as some natural sands; and mixtures that have no performance history. It is also used for quality control purposes during construction. This tester costs $85,000 and is shown in figures 1 and 2.
This machine tests a slab with a length of 500 mm, a width of 180 mm, and a thick- ness of either 50 mm or 100 mm. Other thicknesses between 20 and 100 mm can be tested by fabricating a nonstandard-sized mold or by putting the slab on plaster of paris or steel plates. A thickness of 50 mm is specified for mixtures that will be used in surface course layers less than or equal to 50 mm. Thin surface course layers in France are generally placed at thick- nesses ranging from 30 to 40 mm. The loo-mm thickness is specified for mixtures that will be used in surface or base course layers greater than 50 mm. In France, these layers are generally placed at thick- nesses ranging from 60 to 80 mm. A slab cut from a pavement can also be tested, but it must be cut to fit the mold. Cut slabs having small gaps between the slab and the mold must be secured in some way, such as with plaster of paris. The allowable
deviation in thickness for a cut slab is the average thickness *5 mm. The mass of the slab with a thickness of 100 mm is approximately 22 kg.
Slabs are compacted to two to three air-void levels in France. After compaction, the slab is aged at room temperature for up to 7 days.
The density of the slab is obtained after compaction, but the slab is then placed back into the mold for testing.
The machine tests two slabs simultaneously using two reciprocating tires. The wheel load on both slabs must be equal to avoid asymmetric pressures on the tire assembly. However, the two slabs do not have to be replicates and, in fact, the French recommend testing mixtures in random order to account for variabilities associated with the machine over time. Replicate slabs are tested at dif- ferent times using both sides of the machine.
Hydraulic jacks underneath the slabs push them upward to create the load. The standard load is 5,000 ~50 N; the maximum load is 5,500 N. Pressure gauges on the control panel of the machine give the pressure in each jack. Each pressure gauge is calibrated in increments of 0.1 MPa using a load cell. A graph of pressure vs. load is constructed and used to apply the desired load. The weight of the mold and slab are not included in the applied load. The average pressure provided by 5,000 N was determined to be 0.59 MPa for the left tire of the Federal Highway Administration machine
260
and 0.55 MPa for the right tire. The tires were inflated to 0.60 MPa and loaded on flat steel plates to obtain the contact area.
The French Pavement Rutting Tester uses the same type of tire as the French Plate Compactor. Each tire has a diameter of 415 mm and a width of 110 mm. The standard tire pressure is 0.60 kO.03 MPa; the maximum pressure is 0.71 MPa. It takes approximately 0.1 s for the tires to travel from one end of a slab to the center with the speed being fastest at the center. The tires remain at a fixed elevation as they travel back and forth across the slabs. The average speed of each wheel is approximately 7 km/h; each wheel travels approximately 380 mm before reversing direction, and the device operates at approximately 67 cycles/min (134 passes/min). One cycle is defined as two passes of the tire (back and forth).
Initially, 1,000 cycles are applied at 15 to 25 “C to densify the mixture and to provide a smoother surface. This requires approxi- mately 15 min. The thickness of each slab is then calculated by averaging 15 thickness measurements taken at 15 standard positions using a gauge with a minimum accuracy of 0.1 mm. This thickness is considered the initial thickness of the slab. The slabs are then heated to the test temperature of 60 k2 “C for 12 h. A test temperature of 50 +2 “C is sometimes used in France for base courses. The test is started, and the average rut depth in each slab is measured manually at 30, 100, 300, 1,000, and 3,000 cycles when testing 50-mm slabs, and at 300, 1,000,3,000, 10,000, and 30,000 cycles when testing loo-mm slabs. Rut depth measurements at 30, 100, and 300 cycles are included in the IOO-mm slab test if it is hypothesized that the slab will fail before 3,000 cycles. The average percent rut depth based on the initial thickness of the slab is calculated.
The application of 3,000 cycles requires I.5 h, whereas 30,000 cycles require 9 h. The tester can apply 3,000 cycles in approxi-
mately 45 min, but after each rut depth measurement, the temperature of the slab must be reestablished. Rut depths are measured manually, which requires the environmental chamber to be opened.
When testing 50-mm slabs, a mixture is acceptable according to the French specifi- cation if the average percent rut depths at 1,000 and 3,000 cycles are less than or equal to 10 and 20 percent, respectively. When testing IOO-mm slabs, a mixture is acceptable if the average percent rut depth at 30,000 cycles is less than or equal to 10 percent. Slopes for different mixtures taken from log rut depth vs. log cycle plots can also be compared. Rut-susceptible mixtures generally have higher slopes, but there is no French specification on the slope.
The test method reportedly is not valid for mixtures with nominal maximum aggregate sizes greater than 20 mm. The slab width of 180 mm is relatively small compared to the tire width of 110 mm. A space of only 35 mm exists on each side of the slab between the tire and the steel mold. Therefore, mix- tures with aggregates greater than 20 mm may be inhibited from shearing outward and upward. Aggregates larger than 20 mm may also wear the tires severely, and often cannot be compacted properly using the French Plate Compactor. The machine was developed primarily for testing surface layer mixtures. It was later used in France to test surface treatments for chip retention and elasticity. Surface treatments are often placed on stabilized soils when tested.
Disadvantages of the French Pavement Rutting Tester are that the data cannot be used in mechanistic pavement analyses and cannot be used to determine the modulus of the mixture or layer coefficients used by American Association of State Highway and Transportation Officials thickness design procedures. This is due to the complex and unknown state of stress in the slab.
261
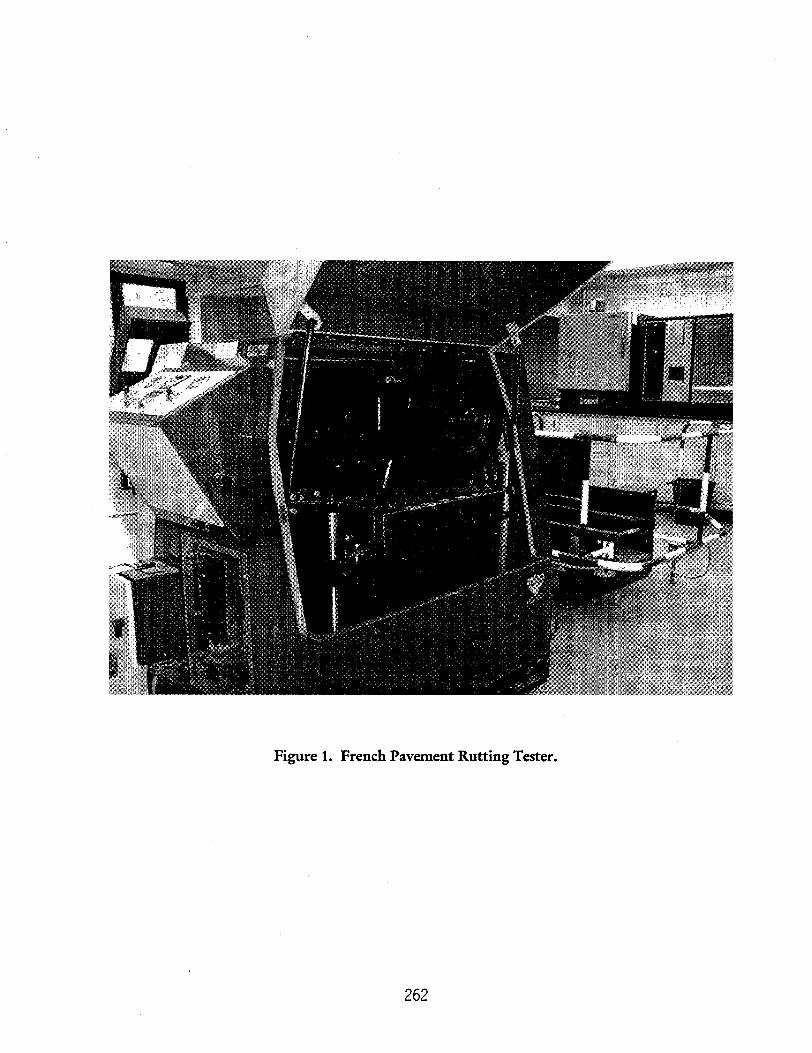
Figure 1. French Pavement Rutting Tester.
262
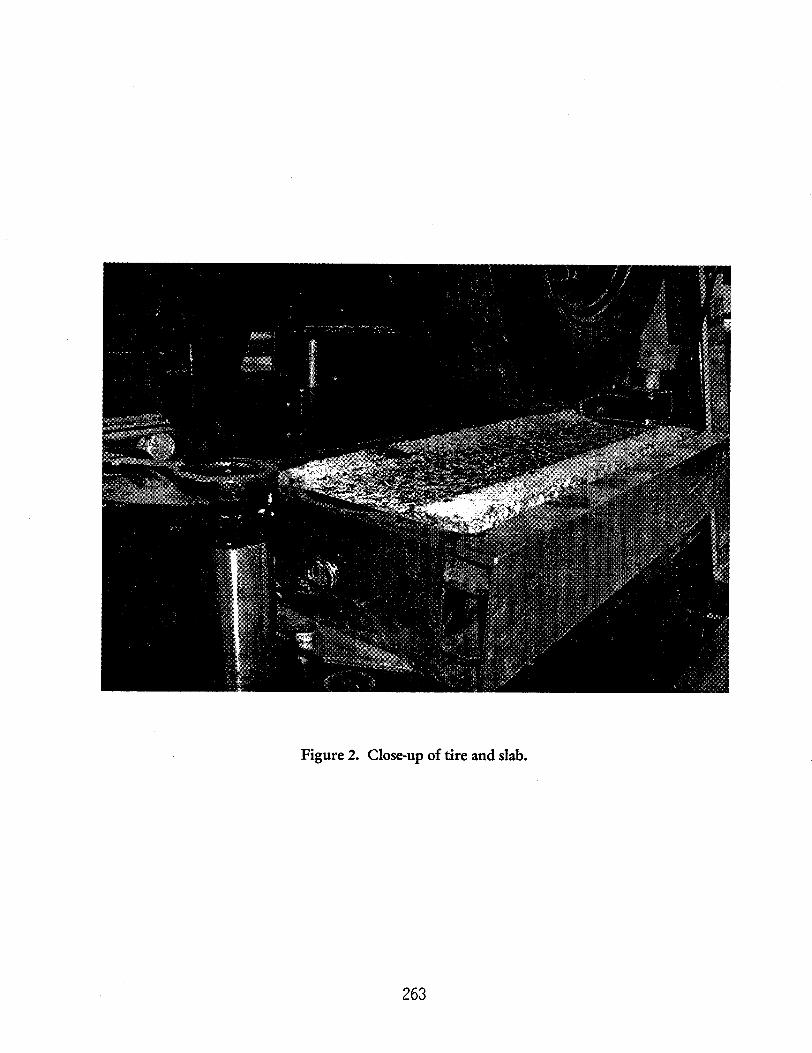
Figure 2. Close-up of tire and slab.
263
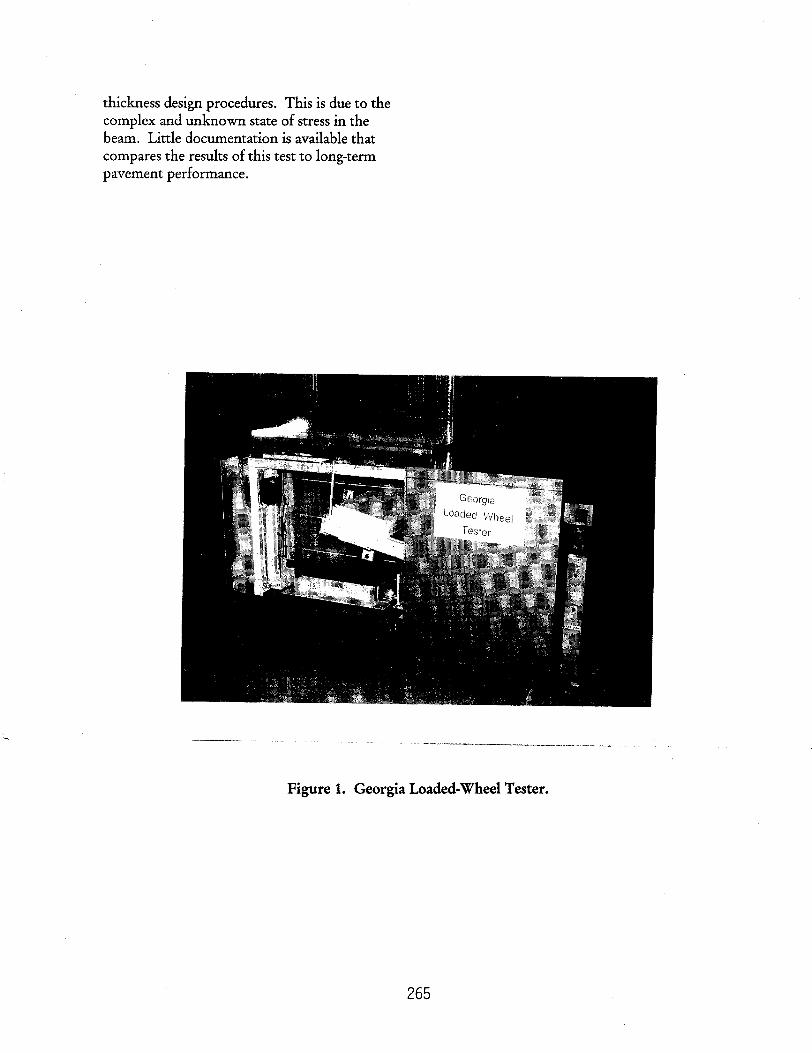
Georgia Loaded-Wheel Tester
Bituminous Mixtures Laboratory Federal Highway Administration Turner-Fairbank Highway Research Center 6300 Georgetown Pike McLean, VA 22101-2296
September 28, 1998
The Georgia Loaded-Wheel Tester (GLWT) measures rutting susceptibility by rolling a steel wheel across a pressurized hose positioned on top of an asphalt concrete beam at 41 “C. The GLWT was developed by the Georgia Department of Transportation (GDOT) and has been refined several times. The model currently used by the Federal Highway Administration (FHWA) at the Turner-Fairbank Highway Research Center cost $10,000 and is shown in figure 1.
Each beam is 125 mm in width, 75 mm in thickness, and 380 mm in length. The mass of a beam is 8.5 kg. Mixtures with maximum aggregate sizes up to 37.5 mm are tested by GDOT, although the maximum aggregate size applicable to this test is not known.
Each beam is aged for 24 h at room temper- ature and for 24 h at the test temperature of 40.6 “C. After aging, a beam is positioned in the GLWT and a stiff, 29-mm diameter, rubber hose pressurized at 0.69 MPa with air is positioned across the top of the beam. A steel wheel loaded with weights rolls back and forth on top of this hose for 8,000 cycles to create a rut. The sides of the beam during the test are confined by steel plates except for the top 12.7 mm. The average speed of the wheel is approximately 2 km/h; the wheel travels approximately 330 mm before reversing in direction, and the device operates at 33 + 1 cycledmin (67 f 2 passes/mm). One cycle is two wheel passes.
The FHWA found that the load varies with the direction of travel. When the wheel is moving from right to left, when viewed from the front of the machine, the load is approximately 740 N at the center of the beam, while it is 630 N when moving from left to right. Across the central region of the beam where the deformations are recorded, each of these loads has a variation of less then f2.5 percent. The load varies because the two arms that connect the wheel to the motor undergo a circular action at the motor. This “locomotion effect” shifts the distribution of the load during the test. (The load may also vary if the height of the beam were to be significantly changed.)
The deformations are measured at three positions: at the center of the beam, 51 mm left of center, and 51 mm right of center. The deformations are averaged. If the average rut depth for three replicate beams exceeds 7.6 mm, the mixture is considered by GDOT to be susceptible to rutting. Testing one beam requires 4 h. The total time to perform a test from start to finish, including specimen fabrication and aging, is 4 days.
Disadvantages of the GLWT are that the data cannot be used in mechanistic pavement analyses and cannot be used to determine the modulus of the mixture or layer coef- ficients used by American Association of State Highway and Transportation Officials
264
thickness design procedures. This is due to the complex and unknown state of stress in the beam. Little documentation is available that compares the results of this test to long-term pavement performance.
.- -. .-.--------- --..- -.. - -I
Figure 1. Georgia Loaded-Wheel Tester.
265
Hamburg Wheel-Tracking Device
Bituminous Mixtures Laboratory Federal Highway Administration Turner-Fairbank Highway Research Center 6300 Georgetown Pike McLean, VA 22101-2296
February 10, 1997
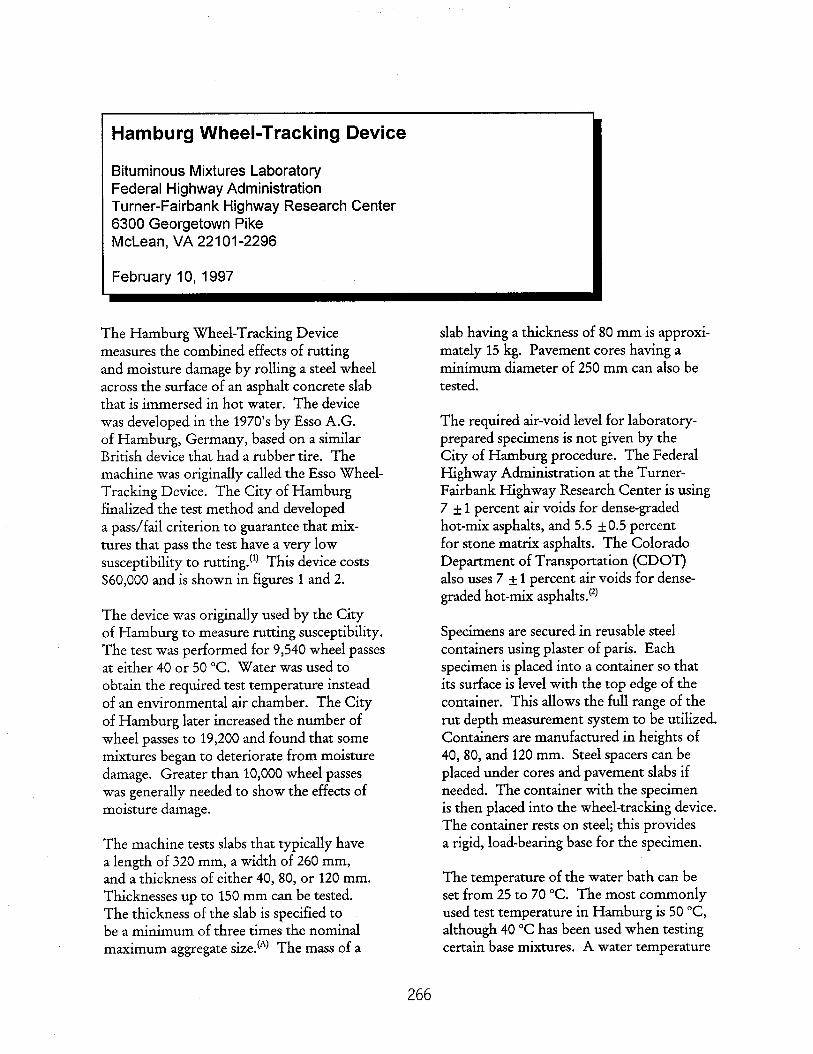
The Hamburg Wheel-Tracking Device measures the combined effects of rutting and moisture damage by rolling a steel wheel across the surface of an asphalt concrete slab that is immersed in hot water. The device was developed in the 1970’s by Esso A.G. of Hamburg, Germany, based on a similar British device that had a rubber tire. The machine was originally called the Esso Wheel- Tracking Device. The City of Hamburg finalized the test method and developed a pass/fail criterion to guarantee that mix- tures that pass the test have a very low susceptibility to rutting.(‘) This device costs $60,000 and is shown in figures 1 and 2.
The device was originally used by the City of Hamburg to measure rutting susceptibility. The test was performed for 9,540 wheel passes at either 40 or 50 “C. Water was used to obtain the required test temperature instead of an environmental air chamber. The City of Hamburg later increased the number of wheel passes to 19,200 and found that some mixtures began to deteriorate from moisture damage. Greater than 10,000 wheel passes was generally needed to show the effects of moisture damage.
The machine tests slabs that typically have a length of 320 mm, a width of 260 mm, and a thickness of either 40, 80, or 120 mm. Thicknesses up to 150 mm can be tested. The thickness of the slab is specified to be a minimum of three times the nominal maximum aggregate size. (*) The mass of a
slab having a thickness of 80 mm is approxi- mately 15 kg. Pavement cores having a minimum diameter of 250 mm can also be tested.
The required air-void level for laboratory- prepared specimens is not given by the City of Hamburg procedure. The Federal Highway Administration at the Turner- Fairbank Highway Research Center is using 7 f 1 percent air voids for dense-graded hot-mix asphalts, and 5.5 f0.5 percent for stone matrix asphalts. The Colorado Department of Transportation (CDOT) also uses 7 f 1 percent air voids for dense- graded hot-mix asphalts.(*)
Specimens are secured in reusable steel containers using plaster of paris. Each specimen is placed into a container so that its surface is level with the top edge of the container. This allows the full range of the rut depth measurement system to be utilized. Containers are manufactured in heights of 40, 80, and 120 mm. Steel spacers can be placed under cores and pavement slabs if needed. The container with the specimen is then placed into the wheel-tracking device. The container rests on steel; this provides a rigid, load-bearing base for the specimen.
The temperature of the water bath can be set from 25 to 70 “C. The most commonly used test temperature in Hamburg is 50 “C, although 40 “C has been used when testing certain base mixtures. A water temperature
266
of 50 “C is reached within 45 min. Specimens are conditioned at the test temperature for a minimum of 30 min. Heat is provided by heated coils in the water. The temperature of the water is then maintained by these heating coils and by introducing cold water from a faucet.@)
The device tests two slabs simultaneously using two reciprocating solid steel wheels. The wheels have a diameter of 203.5 mm and a width of 47.0 mm. The load is fixed at 685 N and the average contact stress given by the manufacturer is 0.73 MPa. This assumes an average contact area of 970 mm*, which is based on the 47.0-mm wheel width and an average contact length of 20.6 mm in the direction of travel. However, the contact area increases with rut depth, and thus the contact stress is variable. The manufacturer states that a contact stress of 0.73-MPa approximates the stress produced by one rear tire of a double-axle truck. The aver- age speed of each wheel is approximately 1.1 km/h; each wheel travels approximately 230 mm before reversing direction, and the device operates at approximately 53 k2 wheel passes/min.
The number of wheel passes being used in the United States is 20,000, although up to 100,000 wheel passes can be applied. CDOT recommends maximum allowable rut depths of 4 mm at 10,000 wheel passes and 10 mm at 20,000 wheel passes, based on correlations between the test results and moisture damage in dense-graded hot-mix asphalt pavements.c3) The City of Hamburg uses a maximum allowable rut depth of 4 mm at 19,200 wheel passes. The rut depth in each slab is measured automatically and continuously by a linear variable differential transformer that has an accuracy of 0.01 mm. A printout of the data can be obtained at every 2~50, 100, or 200 wheel passes. Approximately 6.5 h are needed to apply 20,000 wheel passes; however, the device will automatically stop if the rut depth in one of the slabs exceeds 30 mm. The total time to perform a test from
start to finish, including specimen fabrication, is 3 days.
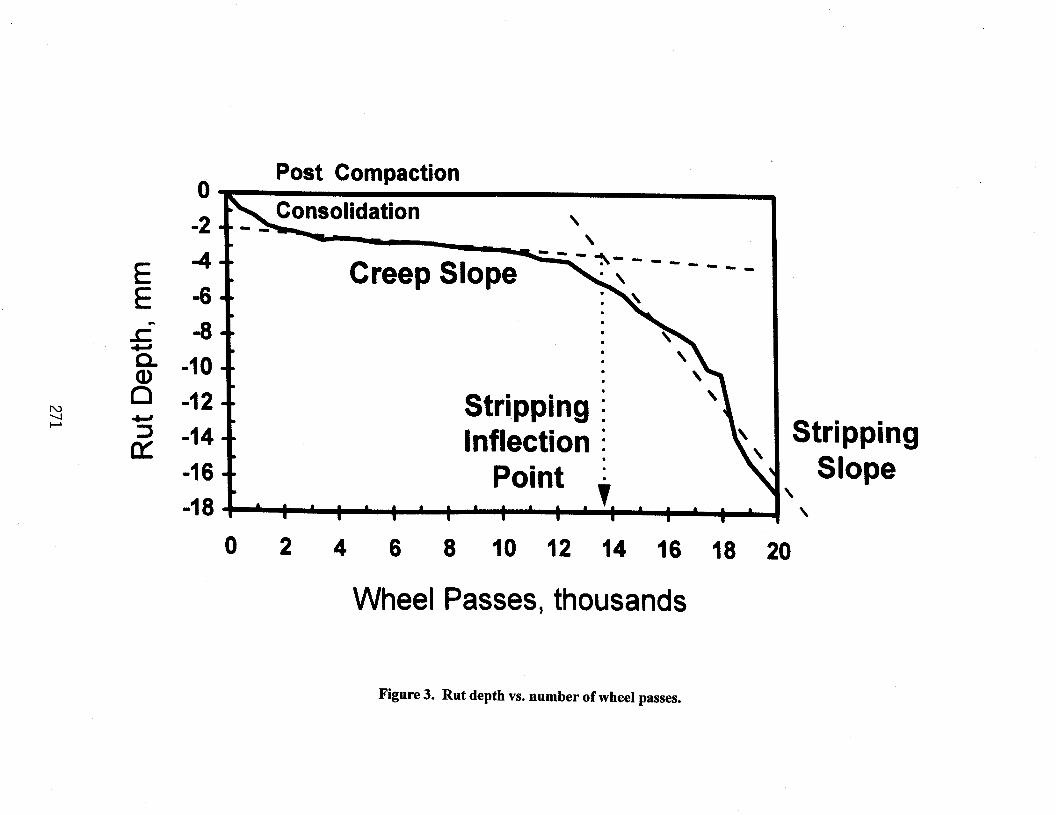
The post-compaction consolidation, creep slope, stripping inflection point, and stripping slope, shown in figure 3, can also be analyzed.(4) The post-compaction consolidation is the deformation (mm) at 1,000 wheel passes. It is called post-compaction consolidation because it is assumed that the wheel is densifying the mixture within the first 1,000 wheel passes.
The creep slope is used to measure rutting susceptibility. It measures the accumulation of permanent deformation primarily due to mechanisms other than moisture damage. It is the inverse of the rate of deformation (wheel passes per l-mm rut depth) in the linear region of the plot between the post- compaction consolidation and the stripping inflection point. Creep slopes have been used to evaluate rutting susceptibility instead of rut depths because the number of wheel passes at which moisture damage starts to affect performance varies widely from mixture to mixture. Furthermore, the rut depths often exceed the maximum measurable rut depth of 25 to 30 mm, even if there is no moisture damage.
The stripping inflection point and the strip- ping slope are used to measure moisture damage. The stripping inflection point is the number of wheel passes at the intersection of the creep slope and the stripping slope. This is the number of wheel passes at which moisture damage starts to dominate perform- ance. CDOT reports that an inflection point below 10,000 wheel passes indicates moisture susceptibility. t3) The stripping slope measures the accumulation of permanent deformation primarily due to moisture damage. It is the inverse of the rate of deformation (wheel passes per l-mm rut depth) after the stripping inflection point.
Inverse slopes are used for both the creep slope and the stripping slope so that these slopes can be reported in terms of wheel passes along with
267
the number of wheel passes at the strippIng inflection point. Higher creep slopes, stripping inflection points, and stripping slopes indicate less damage.c4)
The shape of the curve in figure 2 is the same as typical permanent deformation curves provided by creep and repeated load tests. The curves from these tests are also broken down into three regions. The final region, called the tertiary region, is where the specimen is rapidly failing. Based on the examination of many slabs and pavement cores, the tertiary regions of the curves produced by the Hamburg Wheel-Tracking Device appear to be primarily related to moisture damage, rather than to other mechanisms that cause permanent defor- mation, such as viscous flow. Mixtures that are susceptible to moisture damage also tend to start losing fine aggregates around the stripping inflection point, and coarse aggregate particles may become dislodged. However, there is no method for separating the deformation due to viscous flow from the deformation due to moisture damage, because dry specimens cannot be tested. There is also no method for determining the amount of deformation and the amount of fine particles generated if any of the aggregate particles are crushed by the steel wheel.(‘)
Additional disadvantages are that the data cannot be used in mechanistic pavement analyses and cannot be used to determine the modulus of the mixture or layer coeffi- cients used by American Association of State Highway and Transportation Officials thickness design procedures. This is due to the complex and unknown state of stress in the slab.
Footnotes
A. The effect of thickness on the test results has not been determined.
B. 3%xe may be some variability in the data resulting from the use of tap water. Distilled water is specified in most test methods used to determine the moisture susceptibility of asphalt mixtures in order to reduce the between-laboratory testing variability.
C. Correlating the test data to field performance is difficult since the test combines two distress modes and the steel wheel can crush some aggregates.
References
1.
2.
3.
4.
Tracking Test, Determination of the Track Depth of High-Stability Binding Layers. Construction Bureau, Civil Engineering Office, Department of City Traffic, Hamburg, Germany, 199 1.
Aschenbrener, T. “Evaluation of the Hamburg Wheel-Tracking Device to Predict Moisture Damage in Hot-Mix Asphalt.” Transportation Research Record 2492, Transportation Research Board, Washington, D.C., 1995, pp. 193-201.
Aschenbrener, T., R. Terrel, and R. Zamora. Comparison of the Ham burg wheel- Tracking Device and the Environmental Conditioning System to Pavements of Known Stri$ping Performance (CDOT-DTD-R-94-1) Colorado Department of Transportation, Denver, CO, January 1994.
Hines, M. “The Hamburg Wheel- Tracking Device.” Proceedings of the Twenty-Eighth Paving and Transportation Conference. Civil Engineering Department, The University of New Mexico, Albuquerque, NM, 1991.
268
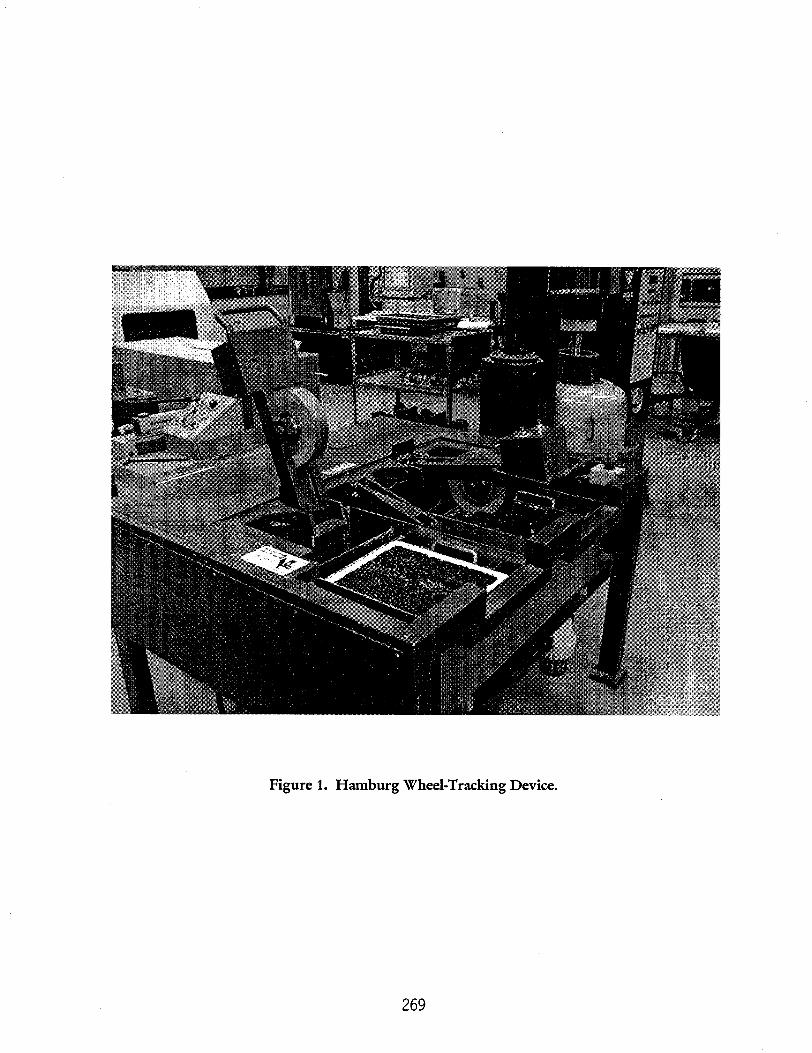
Figure 1. Hamburg Wheel-Tracking Device.
269
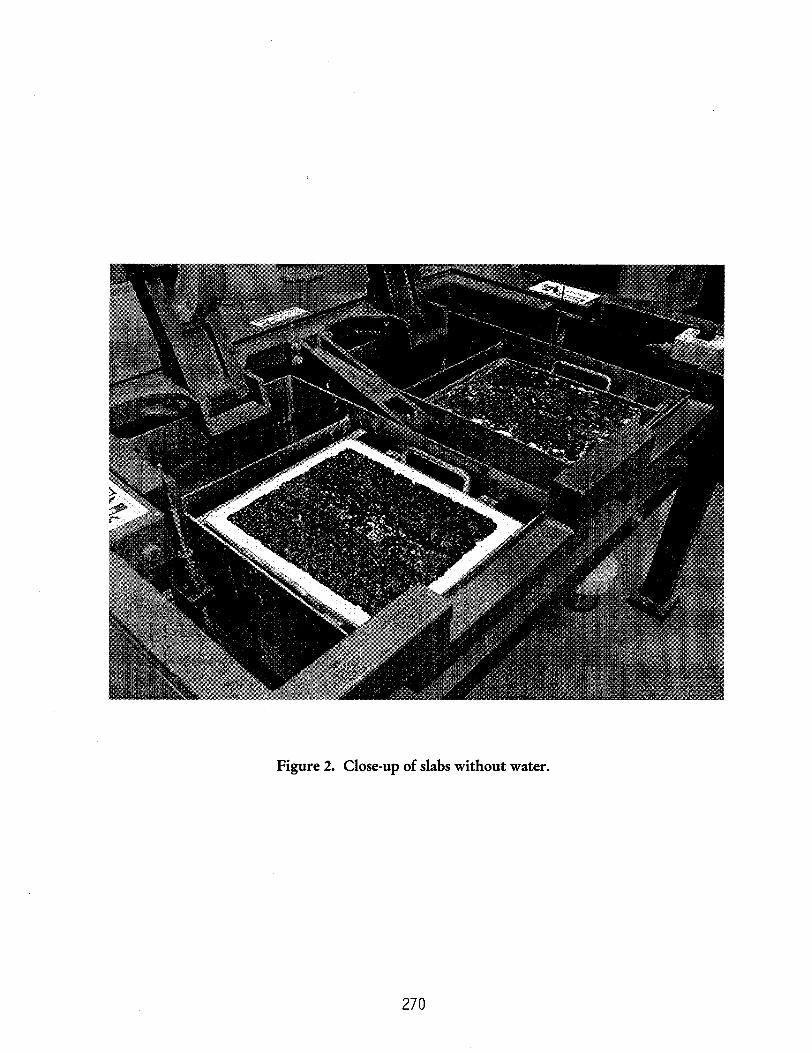
Figure 2. Close-up of slabs without water.
270
Post Compaction
-8 -10 f
.
.
.
. \
.
.
\
\ . . \
-12 -14
t -16 Inflection i
Point i 48 ! . ; a ; . ; . ; . ; . ; .v. . . . . . I I 1
0 2 4 6 8 10 12 14 16 18 20
Wheel Passes, thousands
Stripping Slope
\ \
Figure 3. Rut depth vs. number of wheel passes.
Superpave Shear Tester
Bituminous Mixtures Laboratory Federal Highway Administration Turner-Fairbank Highway Research Center 6300 Georgetown Pike McLean, VA 22101-2296
September 23, 1998
The Superpave Shear Tester (SST) is a closed- loop feedback, servo-hydraulic system that can apply axial loads, shear loads, and confinement pressures to asphalt concrete specimens at controlled temperatures. The response of asphalt concrete to these loads can be used as inputs to performance prediction models such as Superpave.
The SST has six main components: testing chamber, test control system, environmental system, hydraulic system, air pressurization system, and measurement transducers.
The testing chamber includes a reaction frame and a shear table. It also houses various components that are driven by other systems such as temperature control, pressure control, hydraulic actuators, and input and output transducers. The reaction frame is extremely rigid so that precise specimen displacement measurements can be achieved without prob- lems related to displacements in the frame itself, which is called machine compliance. The shear table holds a specimen during testing and is capable of applying shear loads. The specimens normally have a diameter of 150 mm and a height of 50 mm; however, specimens with diameters and heights up 200 mm can be tested with only minor modifications to the system. The temperature inside the testing chamber is precisely con- trolled by the environmental system. A diagram of the testing chamber is shown in figure 1.
The test control system consists of hardware and software. The hardware interfaces with the testing chamber through input and output transducers. It consists of controllers, signal conditioners, and a computer and its periph- erals. The software consists of preprogramed algorithms required to provide the load and acquire the data during testing. Closed-looped feedback control allows the SST to make adjustments during testing so that the machine precisely performs the test.
The environmental system is a forced-air conditioning unit and an insulated enclosure surrounding the testing chamber. Temper- atures from 0 to 70 OC can be provided. The unit can be controlled through the SST computer. The insulated enclosure keeps the temperature constant during testing.
The hydraulic system provides the loads. Interlaken Series 3410 hydraulic motors power two actuators, each with a capacity of approximately 32 kN. One actuator applies the vertical, axial force. A horizontal actuator moves the shear table, which applies the shear loads.
The air pressurization system consists of an air compressor, a storage tank for pressurized air, hoses, and filters. The storage tank is needed because pressurized air must be supplied to the testing chamber at high rates. A rate of 70 kPa/s is used in some Super-pave tests.
272
The measurement transducers consist of two load cells, one for the vertical axial load and one for the horizontal shear load, several linear variable differential transformers (LVDT’s) with ranges from 0.05 to 50 mm, and a pressure cell with a range from 0 to 1000 kPa. LVDT’s mounted on the specimens measure the response of the specimen to the applied testing loads. Three types of LVDT’s are employed: shear LVDT’s that measure the relative deformation of the specimen at two heights; axial LVDT’s that measure the relative motion of the upper and lower platens, and circumferential LVDT’s that measure changes in the diameter of the specimen. Any of these LVDT’s can be used as feedback signals for the closed loop control. The system is designed to compensate for the effects of the moving masses of the machine on the load measure- ments during testing because these effects can be relatively high compared to the load measurements.
Six Superpave tests were preprogramed when the SST was purchased:
l volumetric, l uniaxial strain, l repeated shear at constant height, l repeated shear at constant stress ratio, l simple shear at constant height, and l frequency sweep at constant height.
These tests are described in detailed in AASHTO Provisional Standard TP 7. Other tests can be programmed using the QuikTestTM software provided with the SST.
The SST in the Bituminous Mixtures Laboratory, shown in figure 2, was purchased from Interlaken Technologies in 1995 at a cost of $230,000. Identical SST’s were purchased for the five Superpave Centers located in the United States.
273
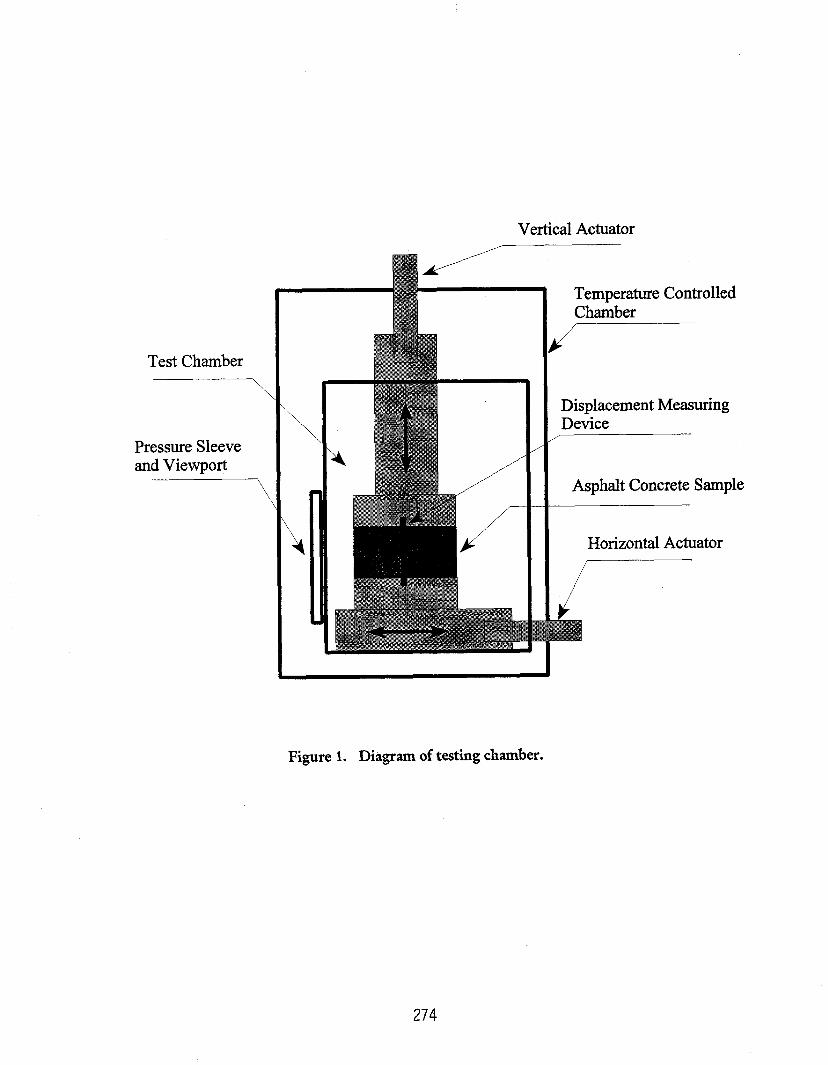
Vertical Actuator
Test Chamber
\
Pressure Sleeve and Viewport
\
Temperature Controlled Chamber /
i
Displacement Measuring Device
Asphalt Concrete Sample
Horizontal Actuator
Figure 1. Diagram of testing chamber.
274
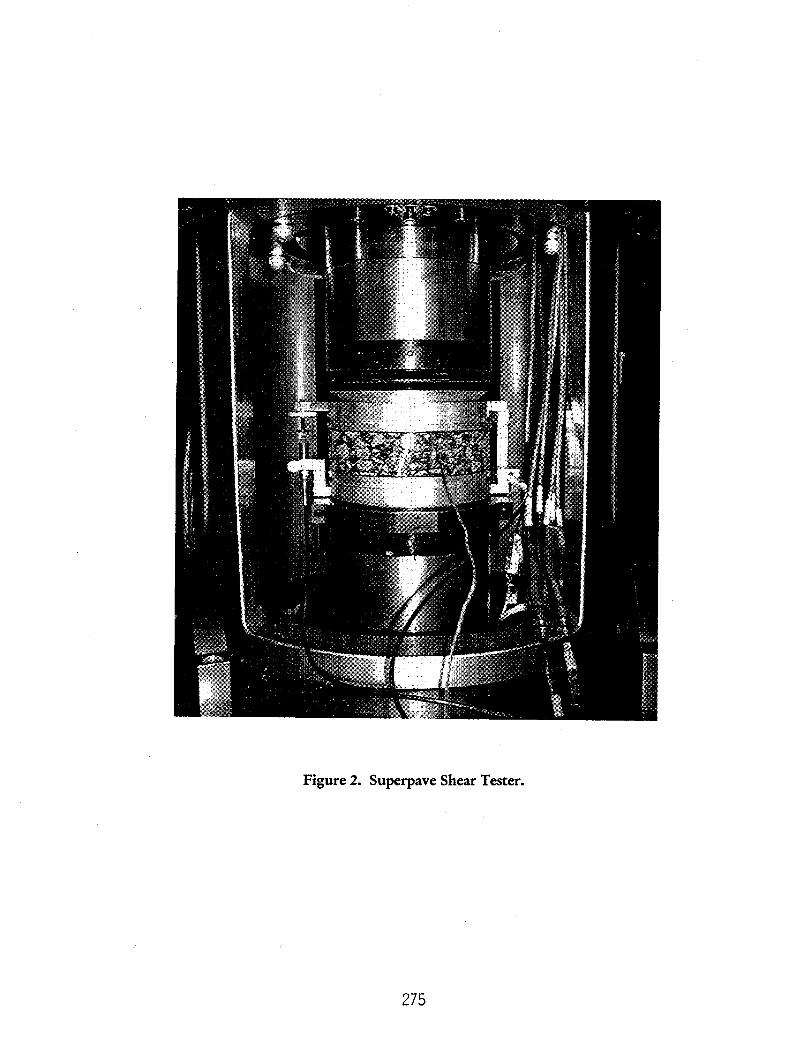
Figure 2. Superpave Shear Tester.
275
Linear Kneading Compactor
Bituminous Mixtures Laboratory Federal Highway Administration Turner-Fairbank Highway Research Center 6300 Georgetown Pike McLean, VA 22101-2296
January 23, 1996
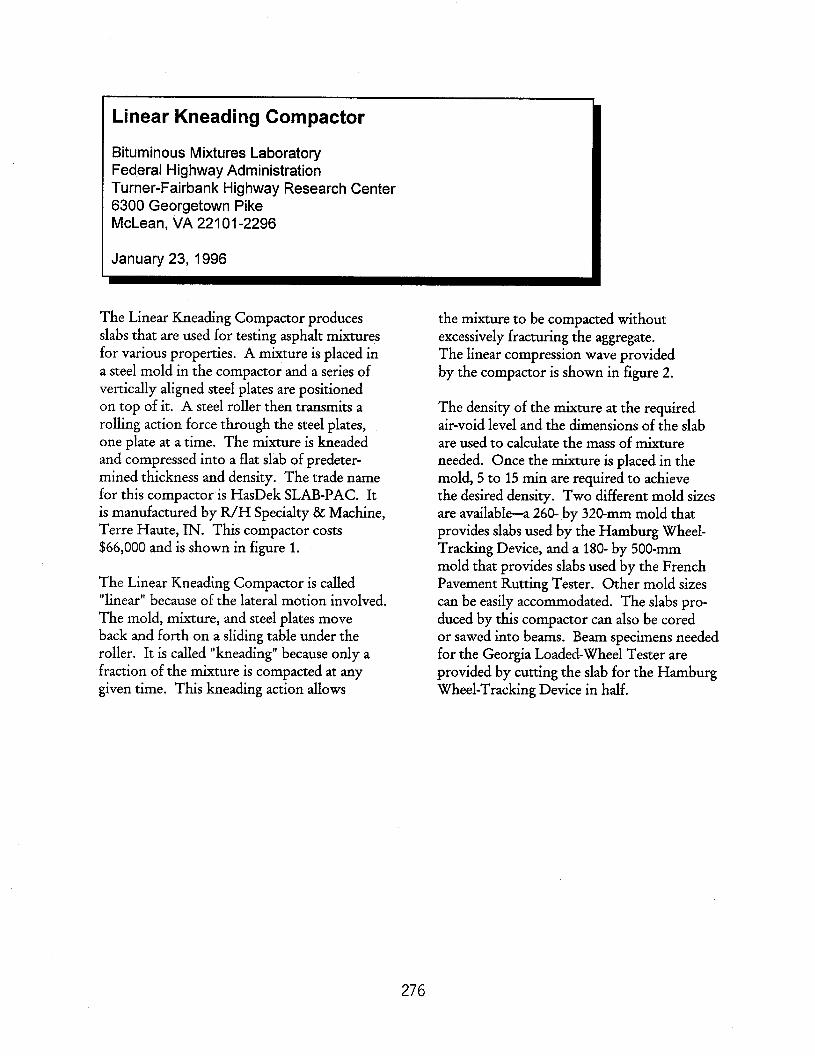
The Linear Kneading Compactor produces slabs that are used for testing asphalt mixtures for various properties. A mixture is placed in a steel mold in the compactor and a series of vertically aligned steel plates are positioned on top of it. A steel roller then transmits a rolling action force through the steel plates, one plate at a time. The mixture is kneaded and compressed into a flat slab of predeter- mined thickness and density. The trade name for this compactor is HasDek SLAB-PAC. It is manufactured by R/H Specialty & Machine, Terre Haute, IN. This compactor costs $66,000 and is shown in figure 1.
The Linear Kneading Compactor is called “linear” because of the lateral motion involved. The mold, mixture, and steel plates move back and forth on a sliding table under the roller. It is called “kneading” because only a fraction of the mixture is compacted at any given time. This kneading action allows
the mixture to be compacted without excessively fracturing the aggregate. The linear compression wave provided by the compactor is shown in figure 2.
The density of the mixture at the required air-void level and the dimensions of the slab are used to calculate the mass of mixture needed. Once the mixture is placed in the mold, 5 to 15 min are required to achieve the desired density. Two different mold sizes are available-a 260- by 320~mm mold that provides slabs used by the Hamburg Wheel- Tracking Device, and a 180- by 500~mm mold that provides slabs used by the French Pavement Rutting Tester. Other mold sizes can be easily accommodated. The slabs pro- duced by this compactor can also be cored or sawed into beams. Beam specimens needed for the Georgia Loaded-Wheel Tester are provided by cutting the slab for the Hamburg Wheel-Tracking Device in half.
276
Figure 1. SLAB-PAC Linear Kneading Compactor.
277
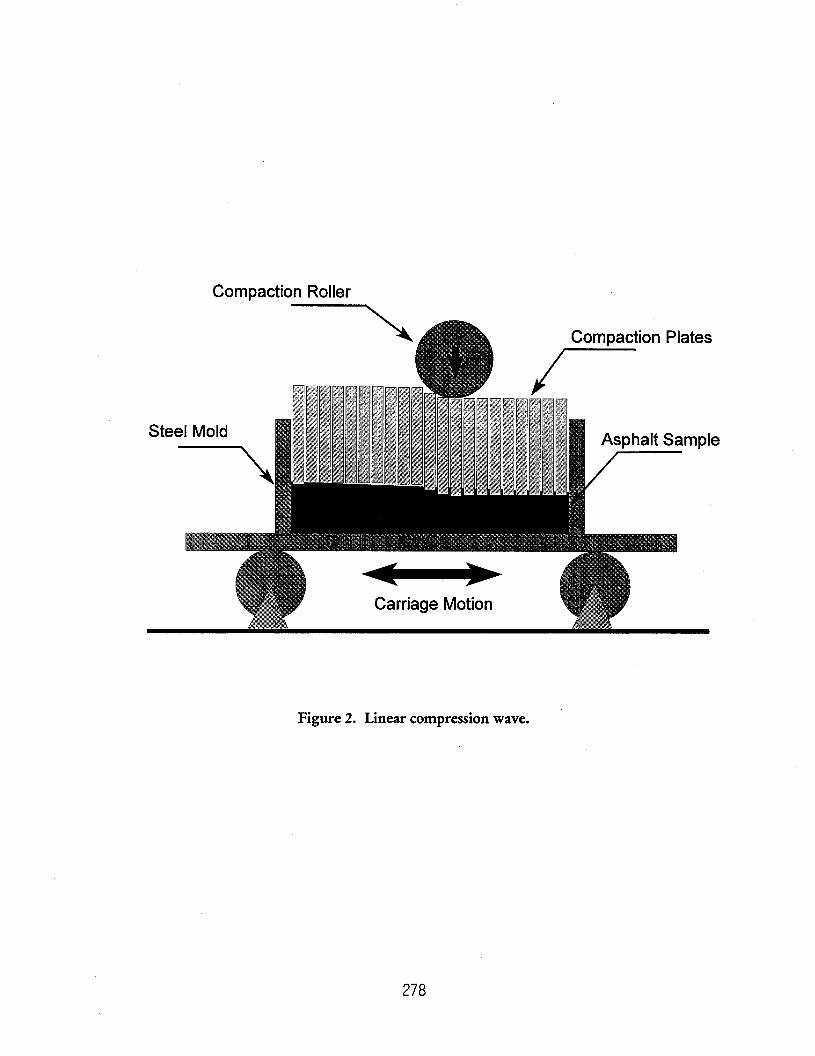
Compaction Roller
Figure 2. Linear compression wave.
278