Embed Size (px)
Citation preview
Basic Mathematical Tools
Read Wooldridge, Appendix A
Basic Mathematical Tools . Intensive Course in Mathematics and Statistics . Chairat Aemkulwat
Outline
I. Summation Operation and Descriptive Statistics
II. Properties of Linear FunctionsIII. Proportions and PercentagesIV. Special FunctionsV. Differential Calculus
2I. Summation II. Linear III. Prop&Perc IV. SpecFunc V. Calculus Basic Mathematical Tools . Intensive Course in Mathematics and Statistics . Chairat Aemkulwat
I. Summation Operation and Descriptive Statistics• Summation operator () involves the sum of many numbers.
• Given a sequence of n numbers{xi; i=1, …, n}
• The sum of these numbers
xi = x1 + x2 + …. + xn
3
1
n
i
I. Summation II. Linear III. Prop&Perc IV. SpecFunc V. Calculus Basic Mathematical Tools . Intensive Course in Mathematics and Statistics . Chairat Aemkulwat I. Summation Operation and Descriptive Statistics
Summation Operation
• Property s.1: For any constant c,
• The sum of n constants (c) equals the product of n and c
1
n
ic nc
4I. Summation II. Linear III. Prop&Perc IV. SpecFunc V. Calculus Basic Mathematical Tools . Intensive Course in Mathematics and Statistics . Chairat Aemkulwat I. Summation Operation and Descriptive Statistics
Summation Operation
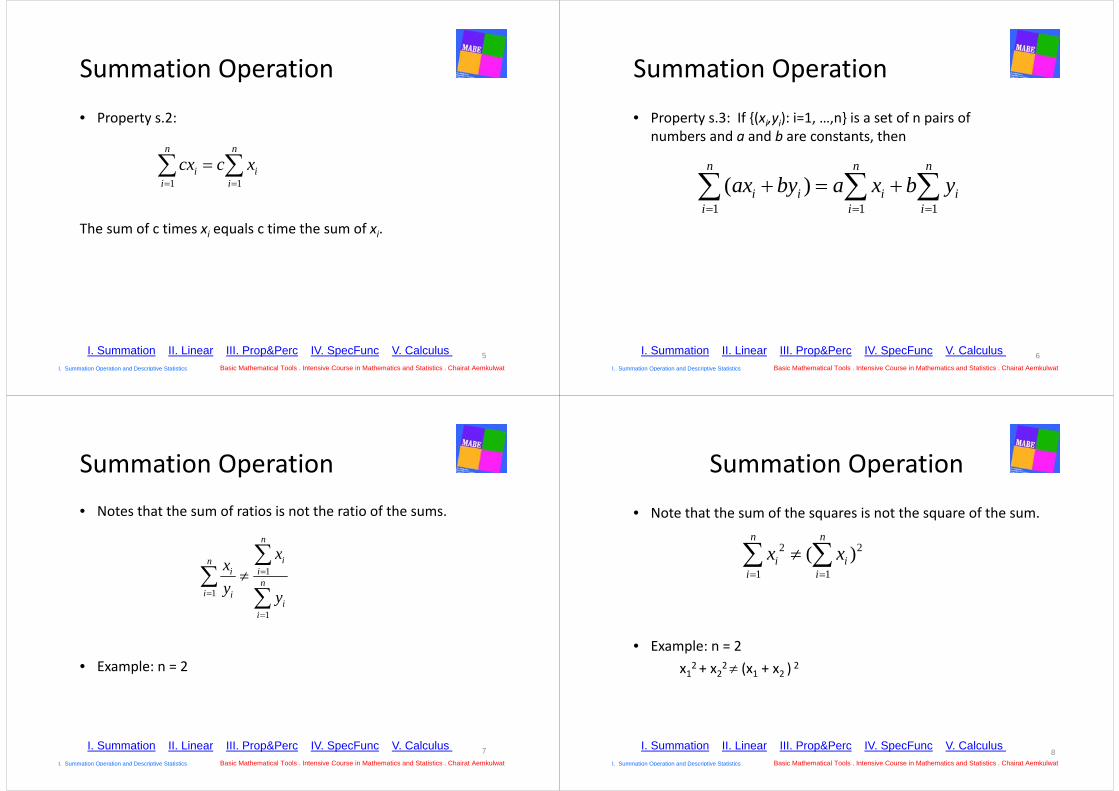
• Property s.2:
The sum of c times xi equals c time the sum of xi.
1 1
n n
i ii i
cx c x
5I. Summation II. Linear III. Prop&Perc IV. SpecFunc V. Calculus Basic Mathematical Tools . Intensive Course in Mathematics and Statistics . Chairat Aemkulwat I. Summation Operation and Descriptive Statistics
Summation Operation
• Property s.3: If {(xi,yi): i=1, …,n} is a set of n pairs of numbers and a and b are constants, then
1 1 1( )
n n n
i i i ii i i
ax by a x b y
6I. Summation II. Linear III. Prop&Perc IV. SpecFunc V. Calculus Basic Mathematical Tools . Intensive Course in Mathematics and Statistics . Chairat Aemkulwat I. Summation Operation and Descriptive Statistics
Summation Operation• Notes that the sum of ratios is not the ratio of the sums.
• Example: n = 2
1
1
1
n
ini i
ni i
ii
xxy y
7I. Summation II. Linear III. Prop&Perc IV. SpecFunc V. Calculus Basic Mathematical Tools . Intensive Course in Mathematics and Statistics . Chairat Aemkulwat I. Summation Operation and Descriptive Statistics
Summation Operation
• Note that the sum of the squares is not the square of the sum.
• Example: n = 2x12 + x22 (x1 + x2 ) 2
2 2
1 1( )
n n
i ii i
x x
8I. Summation II. Linear III. Prop&Perc IV. SpecFunc V. Calculus
Basic Mathematical Tools . Intensive Course in Mathematics and Statistics . Chairat Aemkulwat I. Summation Operation and Descriptive Statistics
Summation Operation and Descriptive Statistics
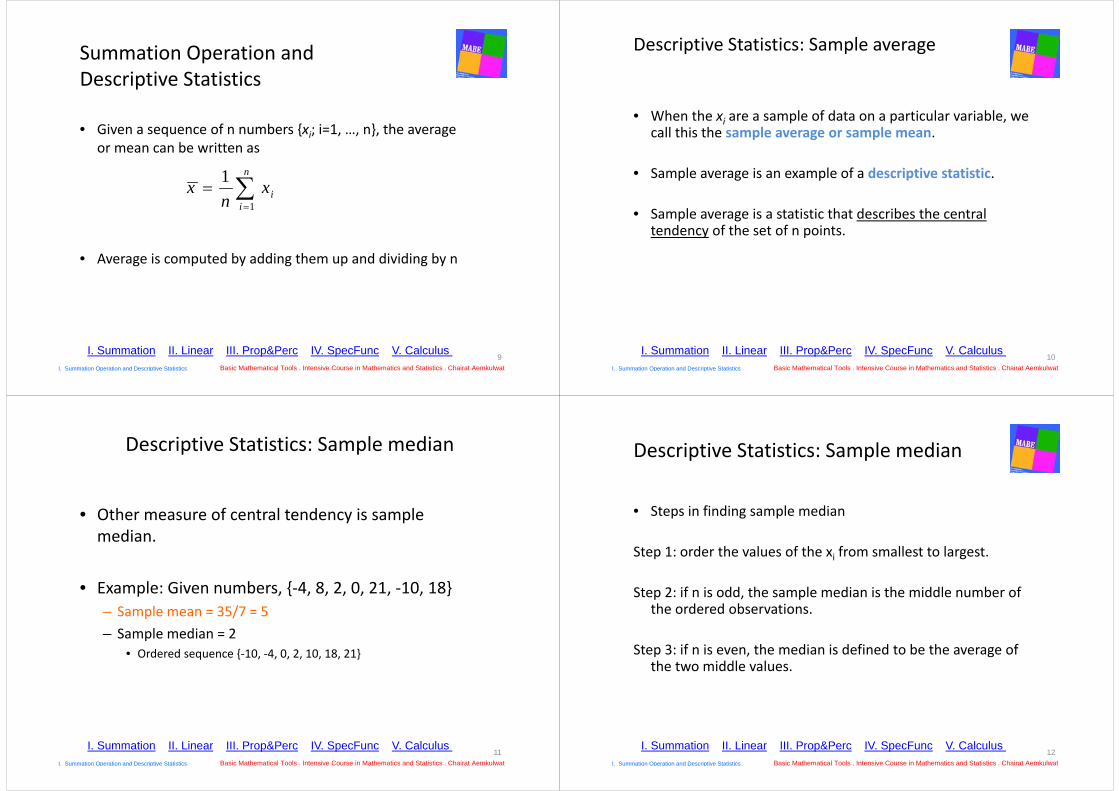
• Given a sequence of n numbers {xi; i=1, …, n}, the average or mean can be written as
• Average is computed by adding them up and dividing by n
1
1 n
ii
x xn
I. Summation II. Linear III. Prop&Perc IV. SpecFunc V. Calculus 9
Basic Mathematical Tools . Intensive Course in Mathematics and Statistics . Chairat Aemkulwat I. Summation Operation and Descriptive Statistics
Descriptive Statistics: Sample average
• When the xi are a sample of data on a particular variable, we call this the sample average or sample mean.
• Sample average is an example of a descriptive statistic.
• Sample average is a statistic that describes the central tendency of the set of n points.
I. Summation II. Linear III. Prop&Perc IV. SpecFunc V. Calculus 10
Basic Mathematical Tools . Intensive Course in Mathematics and Statistics . Chairat Aemkulwat I. Summation Operation and Descriptive Statistics
Descriptive Statistics: Sample median
• Other measure of central tendency is sample median.
• Example: Given numbers, {‐4, 8, 2, 0, 21, ‐10, 18}– Sample mean = 35/7 = 5– Sample median = 2
• Ordered sequence {‐10, ‐4, 0, 2, 10, 18, 21}
I. Summation II. Linear III. Prop&Perc IV. SpecFunc V. Calculus 11
Basic Mathematical Tools . Intensive Course in Mathematics and Statistics . Chairat Aemkulwat I. Summation Operation and Descriptive Statistics
Descriptive Statistics: Sample median
• Steps in finding sample median
Step 1: order the values of the xi from smallest to largest.
Step 2: if n is odd, the sample median is the middle number of the ordered observations.
Step 3: if n is even, the median is defined to be the average of the two middle values.
I. Summation II. Linear III. Prop&Perc IV. SpecFunc V. Calculus 12
Basic Mathematical Tools . Intensive Course in Mathematics and Statistics . Chairat Aemkulwat I. Summation Operation and Descriptive Statistics
Descriptive Statistics: Sample median
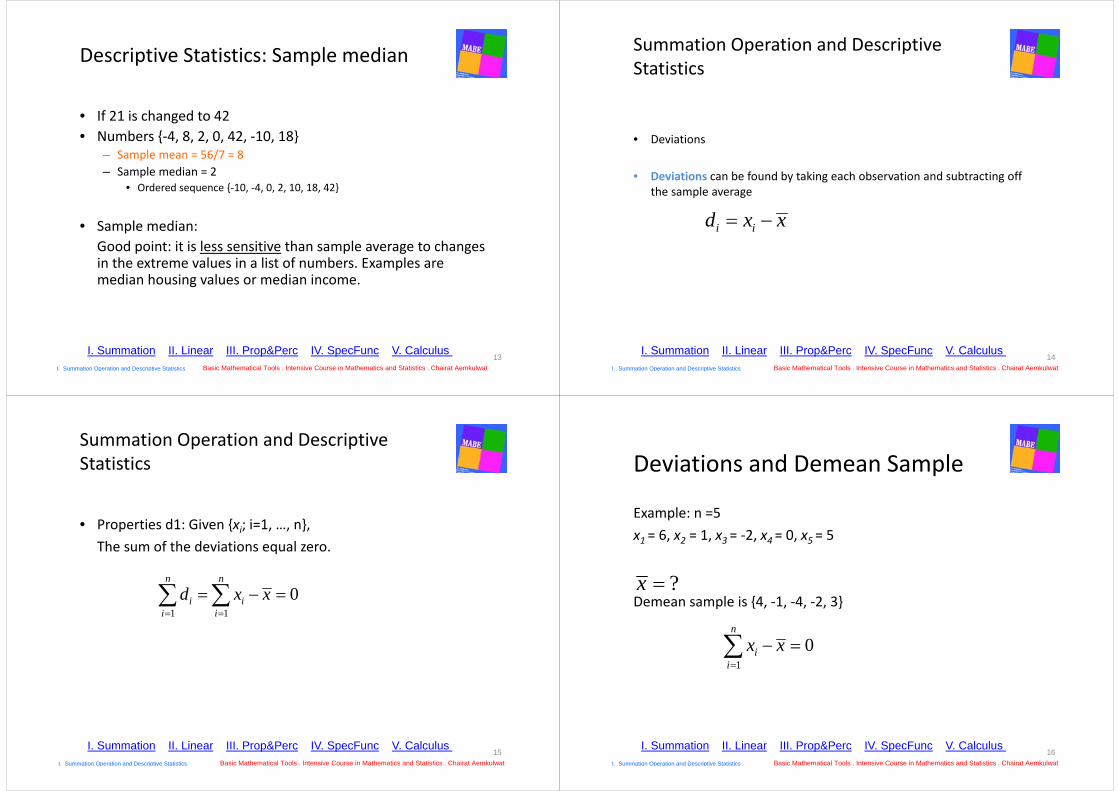
• If 21 is changed to 42• Numbers {‐4, 8, 2, 0, 42, ‐10, 18}
– Sample mean = 56/7 = 8– Sample median = 2
• Ordered sequence {‐10, ‐4, 0, 2, 10, 18, 42}
• Sample median: Good point: it is less sensitive than sample average to changes in the extreme values in a list of numbers. Examples are median housing values or median income.
I. Summation II. Linear III. Prop&Perc IV. SpecFunc V. Calculus 13
Basic Mathematical Tools . Intensive Course in Mathematics and Statistics . Chairat Aemkulwat I. Summation Operation and Descriptive Statistics
Summation Operation and Descriptive Statistics
• Deviations
• Deviations can be found by taking each observation and subtracting off the sample average
i id x x
I. Summation II. Linear III. Prop&Perc IV. SpecFunc V. Calculus 14
Basic Mathematical Tools . Intensive Course in Mathematics and Statistics . Chairat Aemkulwat I. Summation Operation and Descriptive Statistics
Summation Operation and Descriptive Statistics
• Properties d1: Given {xi; i=1, …, n},The sum of the deviations equal zero.
1 10
n n
i ii i
d x x
I. Summation II. Linear III. Prop&Perc IV. SpecFunc V. Calculus 15
Basic Mathematical Tools . Intensive Course in Mathematics and Statistics . Chairat Aemkulwat I. Summation Operation and Descriptive Statistics
Deviations and Demean Sample
Example: n =5x1 = 6, x2 = 1, x3 = ‐2, x4 = 0, x5 = 5
Demean sample is {4, ‐1, ‐4, ‐2, 3}?x
10
n
ii
x x
I. Summation II. Linear III. Prop&Perc IV. SpecFunc V. Calculus 16
Basic Mathematical Tools . Intensive Course in Mathematics and Statistics . Chairat Aemkulwat I. Summation Operation and Descriptive Statistics
Descriptive Statistics: Algebraic Fact
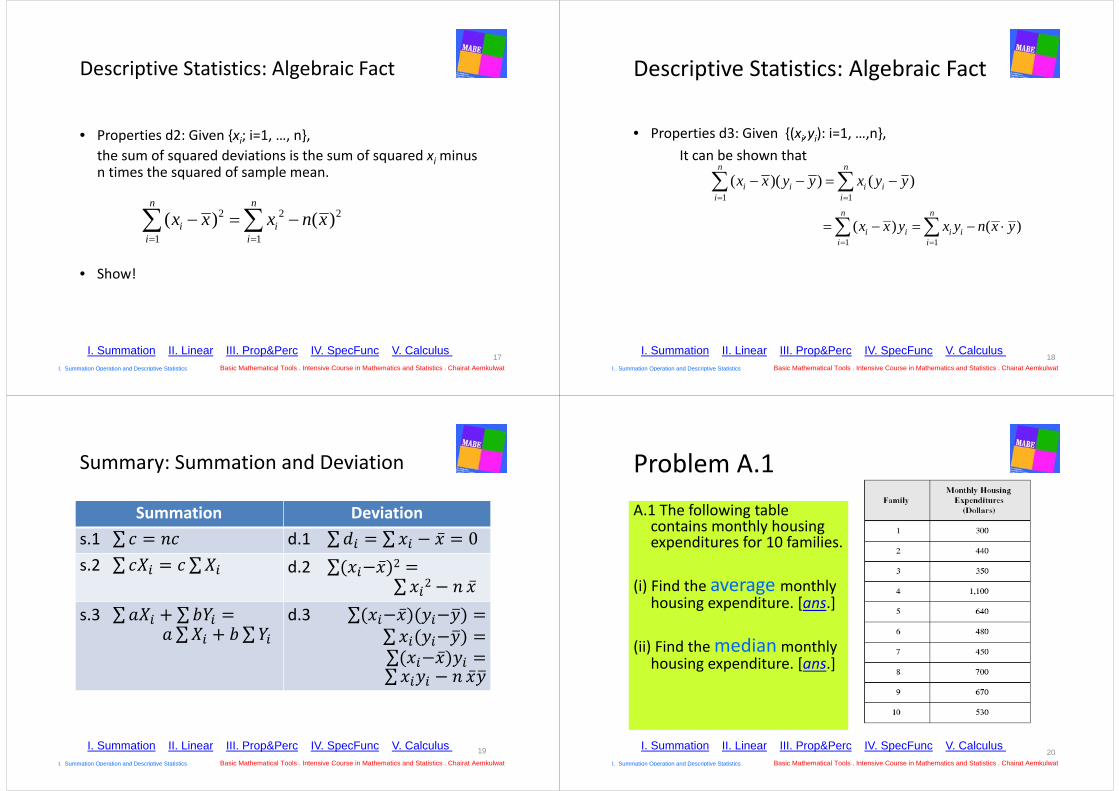
• Properties d2: Given {xi; i=1, …, n},the sum of squared deviations is the sum of squared xi minus n times the squared of sample mean.
• Show!
2 2 2
1 1( ) ( )
n n
i ii i
x x x n x
I. Summation II. Linear III. Prop&Perc IV. SpecFunc V. Calculus 17
Basic Mathematical Tools . Intensive Course in Mathematics and Statistics . Chairat Aemkulwat I. Summation Operation and Descriptive Statistics
Descriptive Statistics: Algebraic Fact
• Properties d3: Given {(xi,yi): i=1, …,n},It can be shown that
1 1( )( ) ( )
n n
i i i ii i
x x y y x y y
1 1( ) ( )
n n
i i i ii i
x x y x y n x y
I. Summation II. Linear III. Prop&Perc IV. SpecFunc V. Calculus 18
Basic Mathematical Tools . Intensive Course in Mathematics and Statistics . Chairat Aemkulwat I. Summation Operation and Descriptive Statistics
Summation Deviations.1 d.1 s.2 d.2 2 2s.3 d.3
Summary: Summation and Deviation
19I. Summation II. Linear III. Prop&Perc IV. SpecFunc V. Calculus Basic Mathematical Tools . Intensive Course in Mathematics and Statistics . Chairat Aemkulwat I. Summation Operation and Descriptive Statistics
Problem A.1A.1 The following table
contains monthly housing expenditures for 10 families.
(i) Find the average monthly housing expenditure. [ans.]
(ii) Find the median monthly housing expenditure. [ans.]
I. Summation II. Linear III. Prop&Perc IV. SpecFunc V. Calculus 20
Basic Mathematical Tools . Intensive Course in Mathematics and Statistics . Chairat Aemkulwat I. Summation Operation and Descriptive Statistics
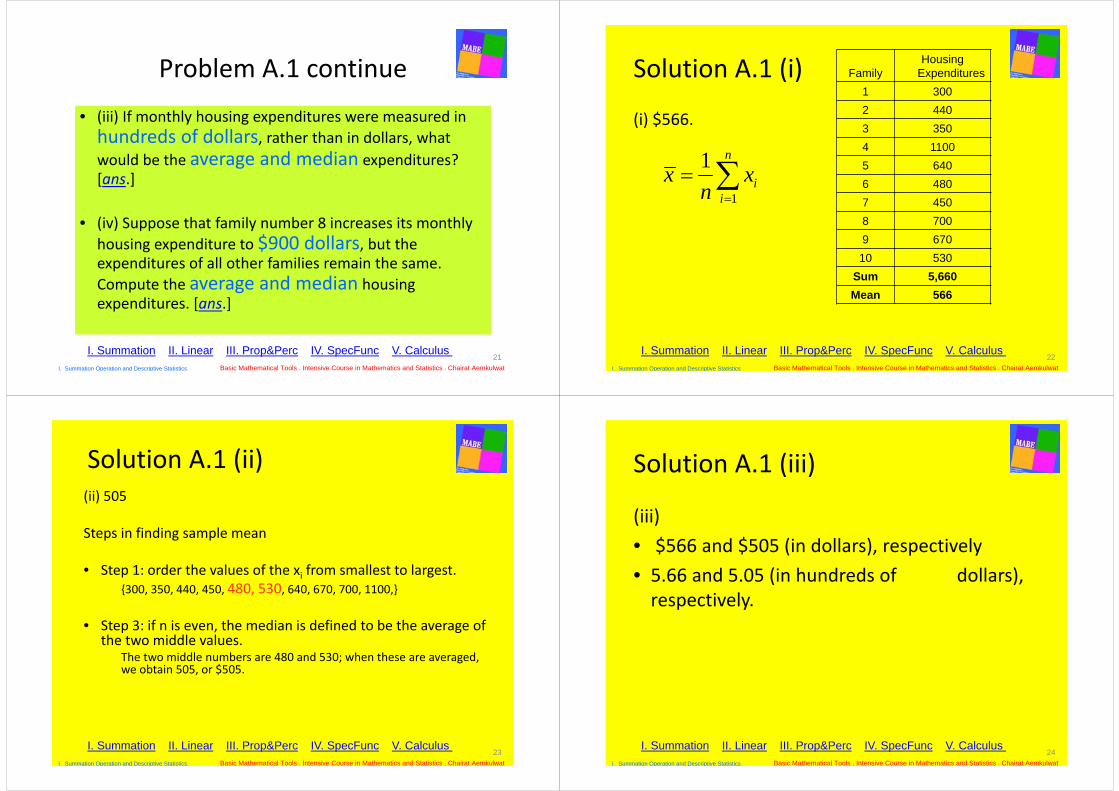
Problem A.1 continue• (iii) If monthly housing expenditures were measured in hundreds of dollars, rather than in dollars, what would be the average and median expenditures? [ans.]
• (iv) Suppose that family number 8 increases its monthly housing expenditure to $900 dollars, but the expenditures of all other families remain the same. Compute the average and median housing expenditures. [ans.]
I. Summation II. Linear III. Prop&Perc IV. SpecFunc V. Calculus 21
Basic Mathematical Tools . Intensive Course in Mathematics and Statistics . Chairat Aemkulwat I. Summation Operation and Descriptive Statistics
Solution A.1 (i)
(i) $566.
1
1 n
ii
x xn
FamilyHousing
Expenditures1 3002 4403 3504 11005 6406 4807 4508 7009 67010 530
Sum 5,660Mean 566
I. Summation II. Linear III. Prop&Perc IV. SpecFunc V. Calculus 22
Basic Mathematical Tools . Intensive Course in Mathematics and Statistics . Chairat Aemkulwat I. Summation Operation and Descriptive Statistics
Solution A.1 (ii)(ii) 505
Steps in finding sample mean
• Step 1: order the values of the xi from smallest to largest.{300, 350, 440, 450, 480, 530, 640, 670, 700, 1100,}
• Step 3: if n is even, the median is defined to be the average of the two middle values.
The two middle numbers are 480 and 530; when these are averaged, we obtain 505, or $505.
I. Summation II. Linear III. Prop&Perc IV. SpecFunc V. Calculus 23
Basic Mathematical Tools . Intensive Course in Mathematics and Statistics . Chairat Aemkulwat I. Summation Operation and Descriptive Statistics
Solution A.1 (iii)
(iii)• $566 and $505 (in dollars), respectively• 5.66 and 5.05 (in hundreds of dollars), respectively.
I. Summation II. Linear III. Prop&Perc IV. SpecFunc V. Calculus 24
Basic Mathematical Tools . Intensive Course in Mathematics and Statistics . Chairat Aemkulwat I. Summation Operation and Descriptive Statistics
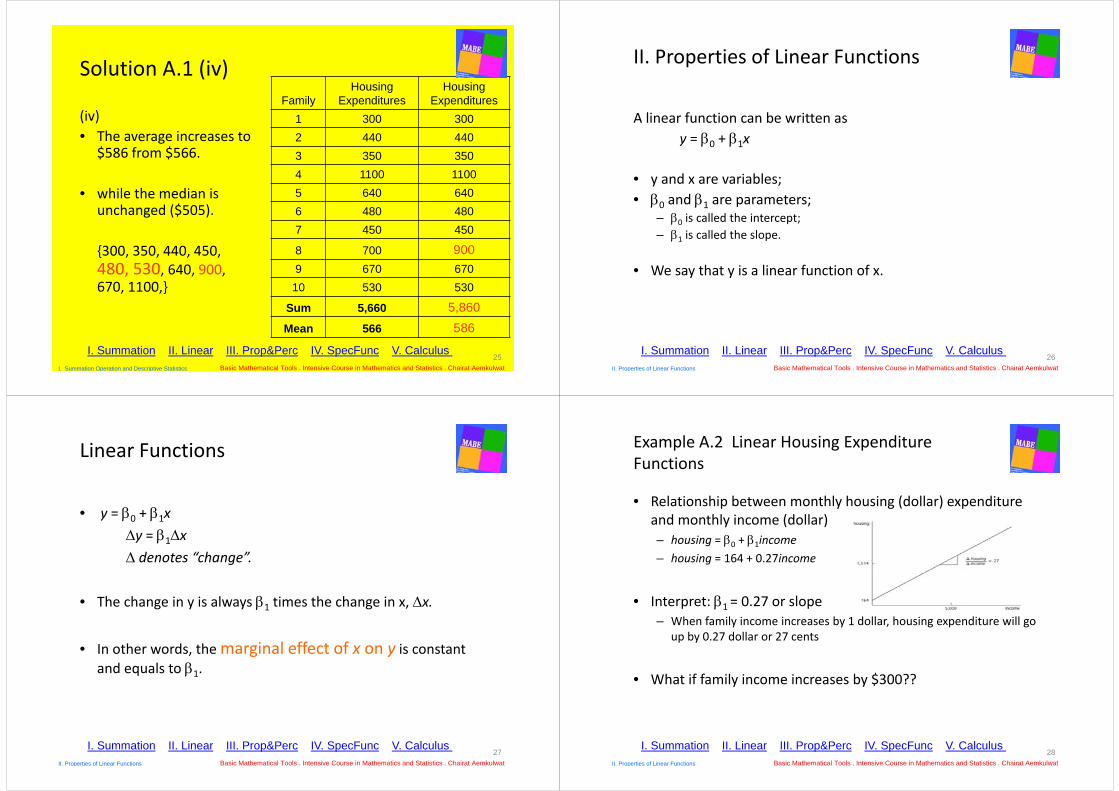
Solution A.1 (iv)
(iv) • The average increases to
$586 from $566.
• while the median is unchanged ($505).
{300, 350, 440, 450, 480, 530, 640, 900, 670, 1100,}
FamilyHousing
ExpendituresHousing
Expenditures1 300 3002 440 4403 350 3504 1100 11005 640 6406 480 4807 450 450
8 700 9009 670 670
10 530 530
Sum 5,660 5,860Mean 566 586
I. Summation II. Linear III. Prop&Perc IV. SpecFunc V. Calculus 25
Basic Mathematical Tools . Intensive Course in Mathematics and Statistics . Chairat Aemkulwat I. Summation Operation and Descriptive Statistics
II. Properties of Linear Functions
A linear function can be written asy = 0 + 1x
• y and x are variables;• 0 and 1 are parameters;
– 0 is called the intercept;– 1 is called the slope.
• We say that y is a linear function of x.
I. Summation II. Linear III. Prop&Perc IV. SpecFunc V. Calculus 26
Basic Mathematical Tools . Intensive Course in Mathematics and Statistics . Chairat Aemkulwat II. Properties of Linear Functions
Linear Functions
• y = 0 + 1xy = 1x denotes “change”.
• The change in y is always 1 times the change in x, x.
• In other words, the marginal effect of x on y is constant and equals to 1.
I. Summation II. Linear III. Prop&Perc IV. SpecFunc V. Calculus 27
Basic Mathematical Tools . Intensive Course in Mathematics and Statistics . Chairat Aemkulwat II. Properties of Linear Functions
Example A.2 Linear Housing Expenditure Functions
• Relationship between monthly housing (dollar) expenditure and monthly income (dollar)– housing = 0 + 1income– housing = 164 + 0.27income
• Interpret: 1 = 0.27 or slope – When family income increases by 1 dollar, housing expenditure will go
up by 0.27 dollar or 27 cents
• What if family income increases by $300??
I. Summation II. Linear III. Prop&Perc IV. SpecFunc V. Calculus 28
Basic Mathematical Tools . Intensive Course in Mathematics and Statistics . Chairat Aemkulwat II. Properties of Linear Functions
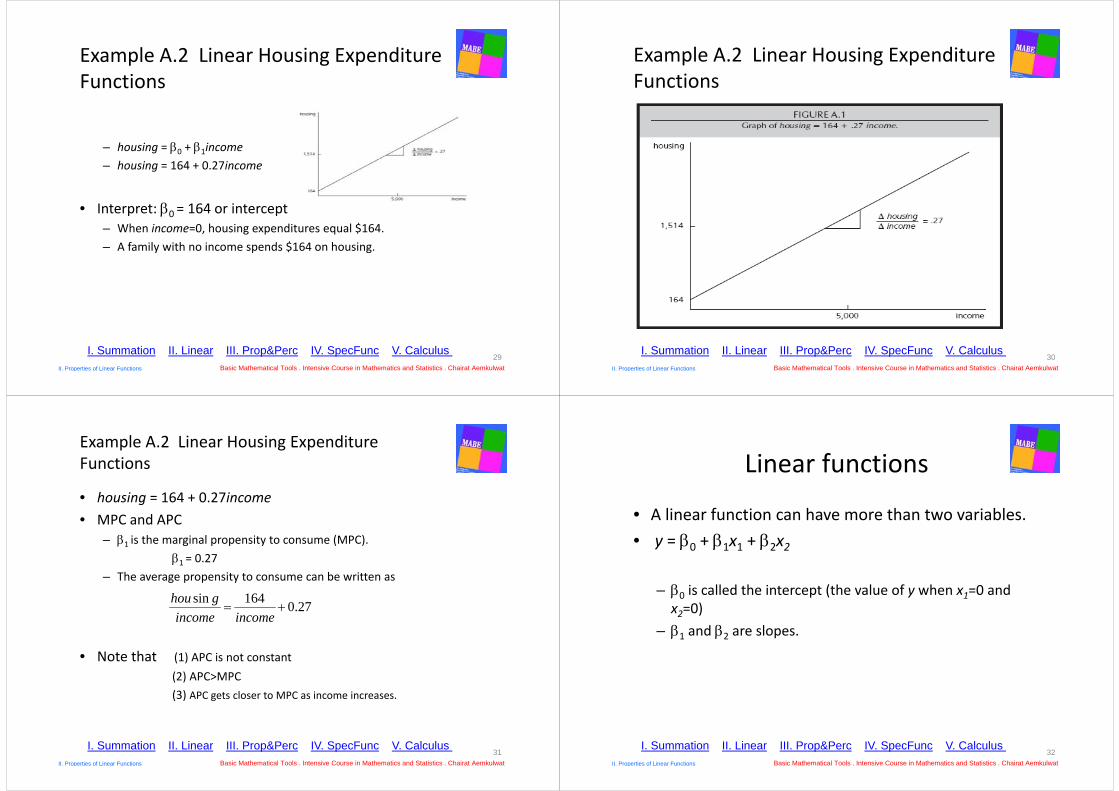
Example A.2 Linear Housing Expenditure Functions
– housing = 0 + 1income– housing = 164 + 0.27income
• Interpret: 0 = 164 or intercept– When income=0, housing expenditures equal $164.– A family with no income spends $164 on housing.
I. Summation II. Linear III. Prop&Perc IV. SpecFunc V. Calculus 29
Basic Mathematical Tools . Intensive Course in Mathematics and Statistics . Chairat Aemkulwat II. Properties of Linear Functions
Example A.2 Linear Housing Expenditure Functions
I. Summation II. Linear III. Prop&Perc IV. SpecFunc V. Calculus 30
Basic Mathematical Tools . Intensive Course in Mathematics and Statistics . Chairat Aemkulwat II. Properties of Linear Functions
Example A.2 Linear Housing Expenditure Functions
• housing = 164 + 0.27income• MPC and APC
– 1 is the marginal propensity to consume (MPC).1 = 0.27
– The average propensity to consume can be written as
• Note that (1) APC is not constant (2) APC>MPC (3) APC gets closer to MPC as income increases.
sin 164 0.27hou gincome income
I. Summation II. Linear III. Prop&Perc IV. SpecFunc V. Calculus 31
Basic Mathematical Tools . Intensive Course in Mathematics and Statistics . Chairat Aemkulwat II. Properties of Linear Functions
Linear functions
• A linear function can have more than two variables.• y = 0 + 1x1 + 2x2
– 0 is called the intercept (the value of y when x1=0 and x2=0)
– 1 and 2 are slopes.
I. Summation II. Linear III. Prop&Perc IV. SpecFunc V. Calculus 32
Basic Mathematical Tools . Intensive Course in Mathematics and Statistics . Chairat Aemkulwat II. Properties of Linear Functions
Linear functions• y = 0 + 1x1 + 2x2
• The change in y, for given changes in x1 and x2 isy = 1 x1 + 2 x2
• If x2 does not change (x2 =0), theny = 1 x1 if x2 =0.
• If x1 does not change (x1 =0), theny = 2 x2 if x1 =0.
I. Summation II. Linear III. Prop&Perc IV. SpecFunc V. Calculus 33
Basic Mathematical Tools . Intensive Course in Mathematics and Statistics . Chairat Aemkulwat II. Properties of Linear Functions
Linear functions• 1 is the slope of the relationship in the direction of x1
• 1 is how y changes with x1, holding x2 fixed. We called the partial effect of x1 on y.
• The notion of ceteris paribus.Note that partial effect involves holding some factors fixed.
1 21
.... 0y if xx
I. Summation II. Linear III. Prop&Perc IV. SpecFunc V. Calculus 34
Basic Mathematical Tools . Intensive Course in Mathematics and Statistics . Chairat Aemkulwat II. Properties of Linear Functions
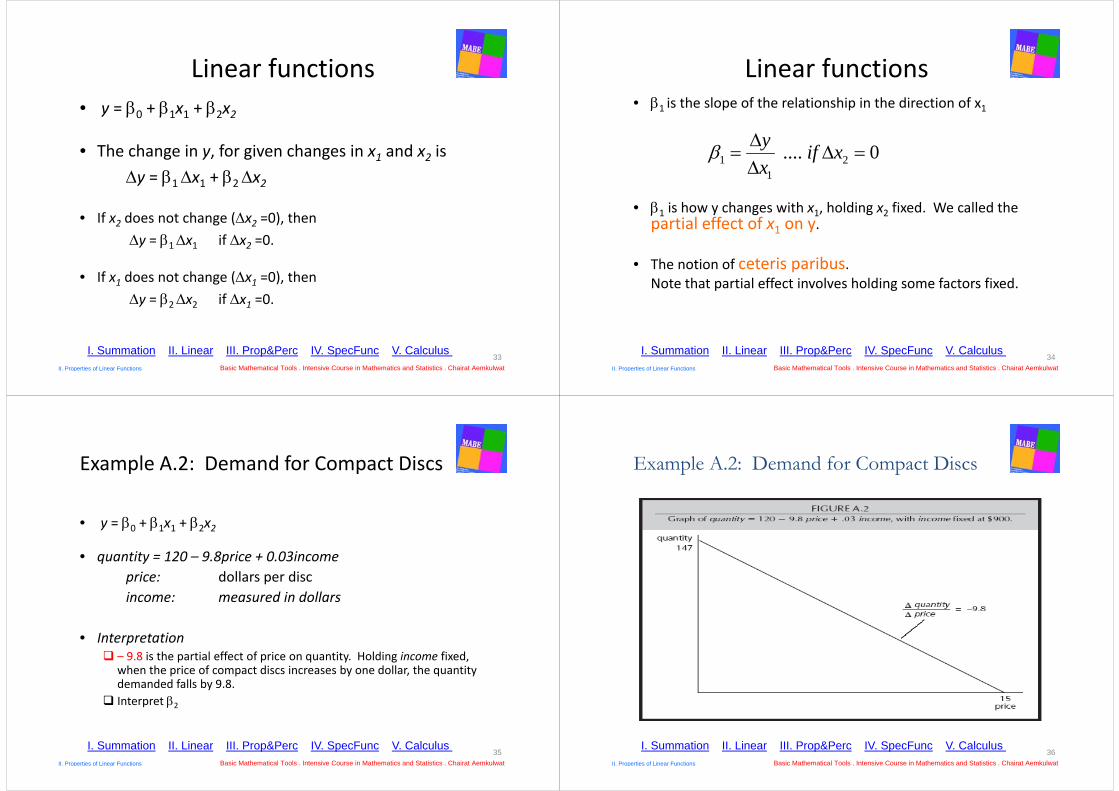
Example A.2: Demand for Compact Discs
• y = 0 + 1x1 + 2x2
• quantity = 120 – 9.8price + 0.03incomeprice: dollars per discincome: measured in dollars
• Interpretation – 9.8 is the partial effect of price on quantity. Holding income fixed,
when the price of compact discs increases by one dollar, the quantity demanded falls by 9.8.
Interpret 2
I. Summation II. Linear III. Prop&Perc IV. SpecFunc V. Calculus 35
Basic Mathematical Tools . Intensive Course in Mathematics and Statistics . Chairat Aemkulwat II. Properties of Linear Functions
Example A.2: Demand for Compact Discs
I. Summation II. Linear III. Prop&Perc IV. SpecFunc V. Calculus 36
Basic Mathematical Tools . Intensive Course in Mathematics and Statistics . Chairat Aemkulwat II. Properties of Linear Functions
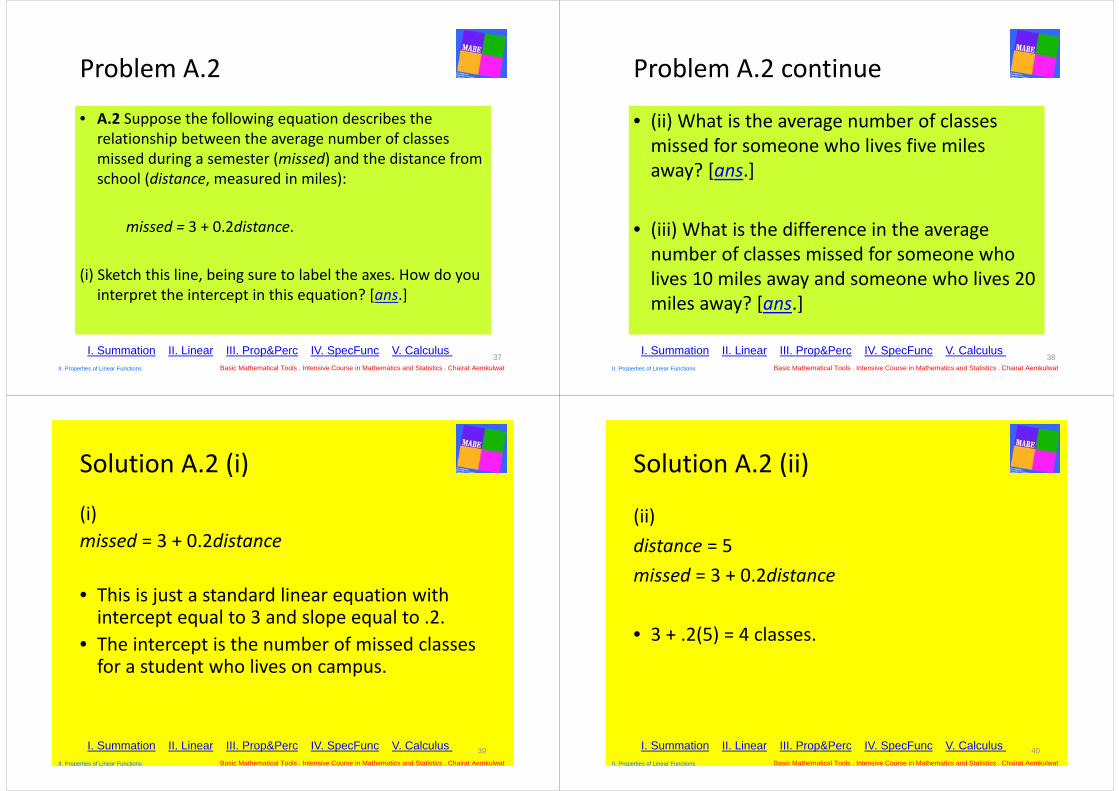
Problem A.2
• A.2 Suppose the following equation describes the relationship between the average number of classes missed during a semester (missed) and the distance from school (distance, measured in miles):
missed = 3 + 0.2distance.
(i) Sketch this line, being sure to label the axes. How do you interpret the intercept in this equation? [ans.]
I. Summation II. Linear III. Prop&Perc IV. SpecFunc V. Calculus 37
Basic Mathematical Tools . Intensive Course in Mathematics and Statistics . Chairat Aemkulwat II. Properties of Linear Functions
Problem A.2 continue
• (ii) What is the average number of classes missed for someone who lives five miles away? [ans.]
• (iii) What is the difference in the average number of classes missed for someone who lives 10 miles away and someone who lives 20 miles away? [ans.]
I. Summation II. Linear III. Prop&Perc IV. SpecFunc V. Calculus 38
Basic Mathematical Tools . Intensive Course in Mathematics and Statistics . Chairat Aemkulwat II. Properties of Linear Functions
Solution A.2 (i)
(i) missed = 3 + 0.2distance
• This is just a standard linear equation with intercept equal to 3 and slope equal to .2.
• The intercept is the number of missed classes for a student who lives on campus.
39I. Summation II. Linear III. Prop&Perc IV. SpecFunc V. Calculus Basic Mathematical Tools . Intensive Course in Mathematics and Statistics . Chairat Aemkulwat II. Properties of Linear Functions
Solution A.2 (ii)
(ii)distance = 5missed = 3 + 0.2distance
• 3 + .2(5) = 4 classes.
40I. Summation II. Linear III. Prop&Perc IV. SpecFunc V. Calculus Basic Mathematical Tools . Intensive Course in Mathematics and Statistics . Chairat Aemkulwat II. Properties of Linear Functions
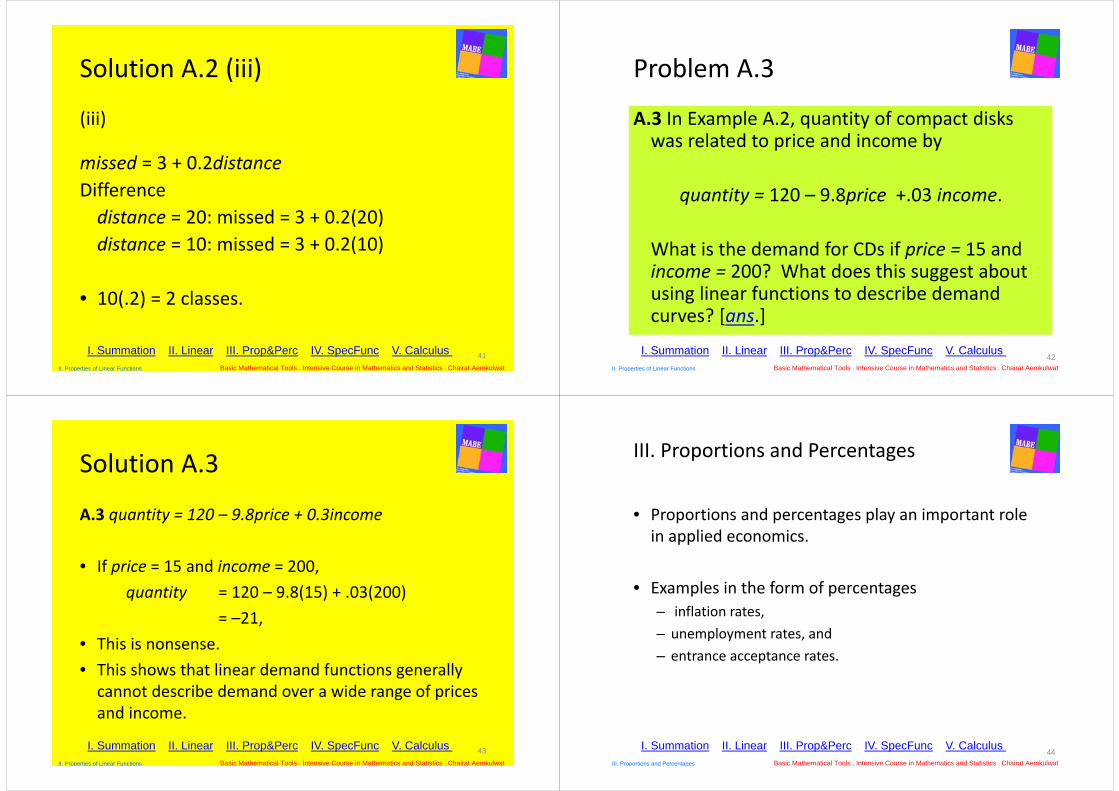
Solution A.2 (iii)
(iii)
missed = 3 + 0.2distanceDifferencedistance = 20: missed = 3 + 0.2(20)distance = 10: missed = 3 + 0.2(10)
• 10(.2) = 2 classes.
41I. Summation II. Linear III. Prop&Perc IV. SpecFunc V. Calculus Basic Mathematical Tools . Intensive Course in Mathematics and Statistics . Chairat Aemkulwat II. Properties of Linear Functions
Problem A.3
A.3 In Example A.2, quantity of compact disks was related to price and income by
quantity = 120 – 9.8price +.03 income.
What is the demand for CDs if price = 15 and income = 200? What does this suggest about using linear functions to describe demand curves? [ans.]
I. Summation II. Linear III. Prop&Perc IV. SpecFunc V. Calculus 42
Basic Mathematical Tools . Intensive Course in Mathematics and Statistics . Chairat Aemkulwat II. Properties of Linear Functions
Solution A.3
A.3 quantity = 120 – 9.8price + 0.3income
• If price = 15 and income = 200,quantity = 120 – 9.8(15) + .03(200)
= –21, • This is nonsense. • This shows that linear demand functions generally cannot describe demand over a wide range of prices and income.
43Basic Mathematical Tools . Intensive Course in Mathematics and Statistics . Chairat Aemkulwat II. Properties of Linear Functions
I. Summation II. Linear III. Prop&Perc IV. SpecFunc V. Calculus
III. Proportions and Percentages
• Proportions and percentages play an important role in applied economics.
• Examples in the form of percentages– inflation rates, – unemployment rates, and – entrance acceptance rates.
I. Summation II. Linear III. Prop&Perc IV. SpecFunc V. Calculus 44
Basic Mathematical Tools . Intensive Course in Mathematics and Statistics . Chairat Aemkulwat III. Proportions and Percentages
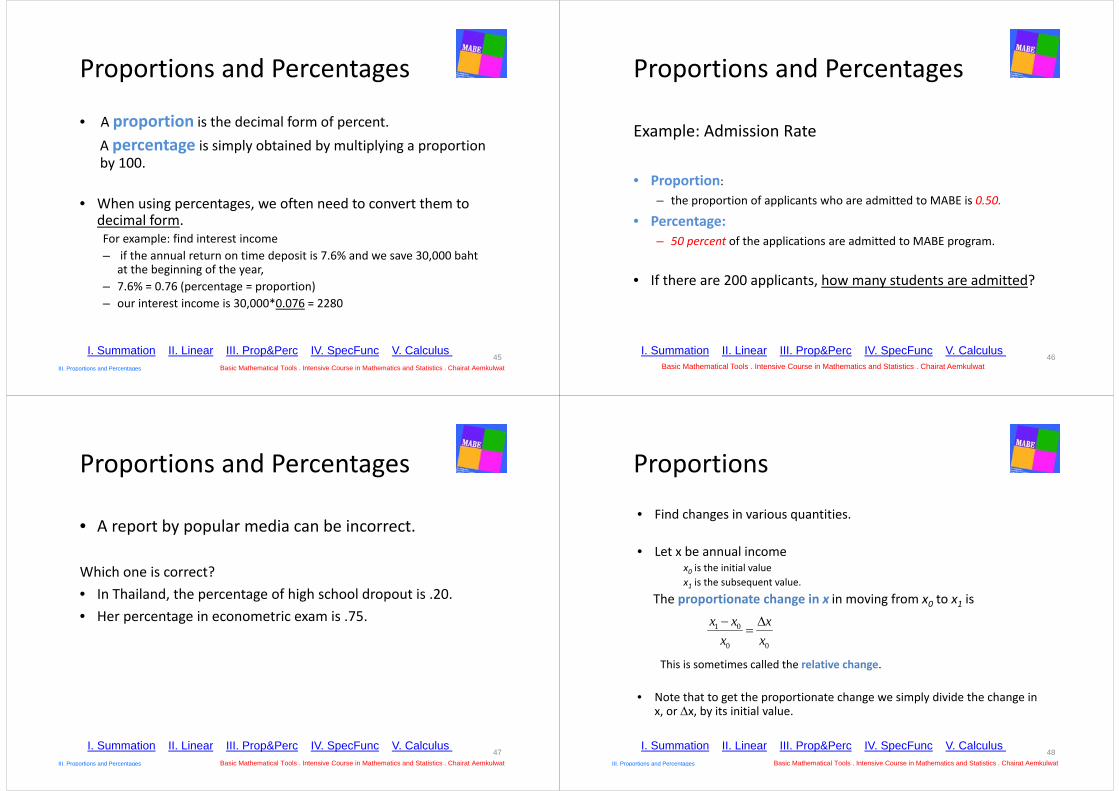
Proportions and Percentages
• A proportion is the decimal form of percent. A percentage is simply obtained by multiplying a proportion by 100.
• When using percentages, we often need to convert them to decimal form. For example: find interest income– if the annual return on time deposit is 7.6% and we save 30,000 baht
at the beginning of the year,– 7.6% = 0.76 (percentage = proportion)– our interest income is 30,000*0.076 = 2280
I. Summation II. Linear III. Prop&Perc IV. SpecFunc V. Calculus 45
Basic Mathematical Tools . Intensive Course in Mathematics and Statistics . Chairat Aemkulwat III. Proportions and Percentages
Proportions and Percentages
Example: Admission Rate
• Proportion: – the proportion of applicants who are admitted to MABE is 0.50.
• Percentage:– 50 percent of the applications are admitted to MABE program.
• If there are 200 applicants, how many students are admitted?
I. Summation II. Linear III. Prop&Perc IV. SpecFunc V. Calculus 46
Basic Mathematical Tools . Intensive Course in Mathematics and Statistics . Chairat Aemkulwat
Proportions and Percentages
• A report by popular media can be incorrect.
Which one is correct?• In Thailand, the percentage of high school dropout is .20.• Her percentage in econometric exam is .75.
I. Summation II. Linear III. Prop&Perc IV. SpecFunc V. Calculus 47
Basic Mathematical Tools . Intensive Course in Mathematics and Statistics . Chairat Aemkulwat III. Proportions and Percentages
Proportions
• Find changes in various quantities.
• Let x be annual income x0 is the initial valuex1 is the subsequent value.
The proportionate change in x in moving from x0 to x1 is
This is sometimes called the relative change.
• Note that to get the proportionate change we simply divide the change in x, or x, by its initial value.
1 0
0 0
x x xx x
I. Summation II. Linear III. Prop&Perc IV. SpecFunc V. Calculus 48
Basic Mathematical Tools . Intensive Course in Mathematics and Statistics . Chairat Aemkulwat III. Proportions and Percentages
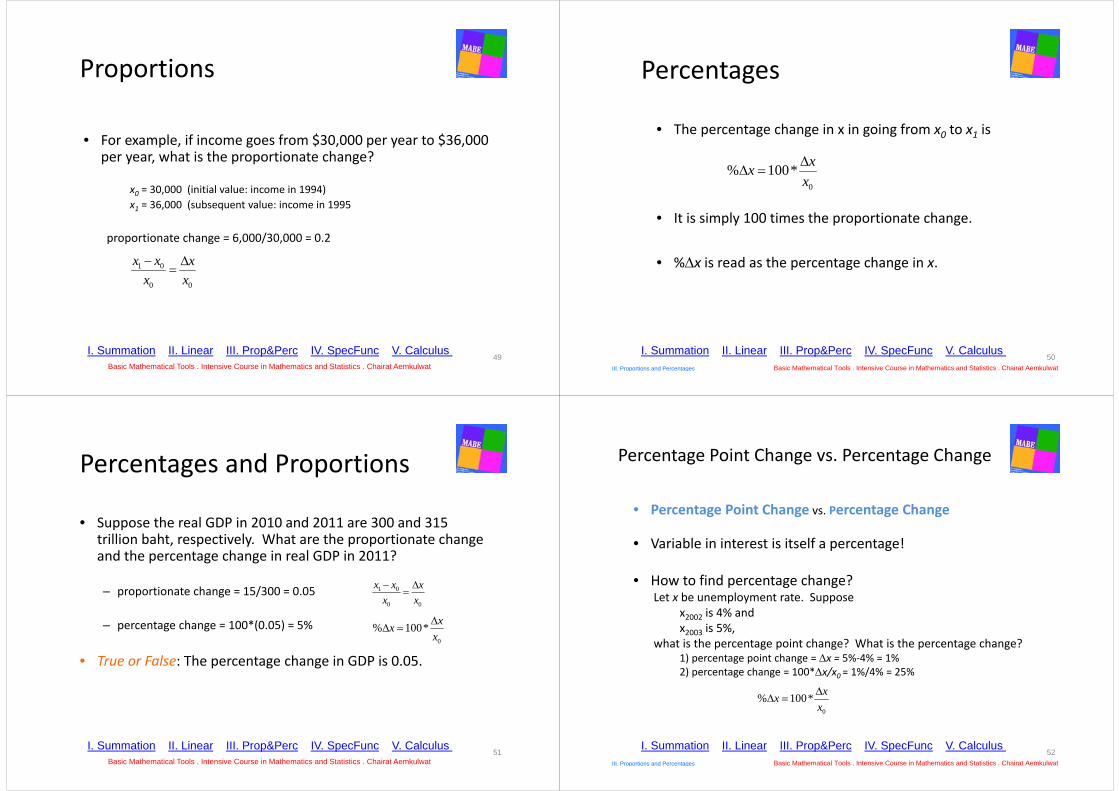
Proportions
• For example, if income goes from $30,000 per year to $36,000 per year, what is the proportionate change?
x0 = 30,000 (initial value: income in 1994) x1 = 36,000 (subsequent value: income in 1995
proportionate change = 6,000/30,000 = 0.2
I. Summation II. Linear III. Prop&Perc IV. SpecFunc V. Calculus 49
Basic Mathematical Tools . Intensive Course in Mathematics and Statistics . Chairat Aemkulwat
1 0
0 0
x x xx x
Percentages
• The percentage change in x in going from x0 to x1 is
• It is simply 100 times the proportionate change.
• %x is read as the percentage change in x.
0
% 100* xxx
I. Summation II. Linear III. Prop&Perc IV. SpecFunc V. Calculus 50
Basic Mathematical Tools . Intensive Course in Mathematics and Statistics . Chairat Aemkulwat III. Proportions and Percentages
Percentages and Proportions
• Suppose the real GDP in 2010 and 2011 are 300 and 315 trillion baht, respectively. What are the proportionate change and the percentage change in real GDP in 2011?
– proportionate change = 15/300 = 0.05
– percentage change = 100*(0.05) = 5%
• True or False: The percentage change in GDP is 0.05.
I. Summation II. Linear III. Prop&Perc IV. SpecFunc V. Calculus 51
Basic Mathematical Tools . Intensive Course in Mathematics and Statistics . Chairat Aemkulwat
0
% 100* xxx
1 0
0 0
x x xx x
Percentage Point Change vs. Percentage Change
• Percentage Point Change vs. Percentage Change
• Variable in interest is itself a percentage!
• How to find percentage change?Let x be unemployment rate. Suppose
x2002 is 4% and x2003 is 5%,
what is the percentage point change? What is the percentage change?1) percentage point change = x = 5%‐4% = 1%2) percentage change = 100*x/x0 = 1%/4% = 25%
I. Summation II. Linear III. Prop&Perc IV. SpecFunc V. Calculus 52
Basic Mathematical Tools . Intensive Course in Mathematics and Statistics . Chairat Aemkulwat III. Proportions and Percentages
0
% 100* xxx
Percentages
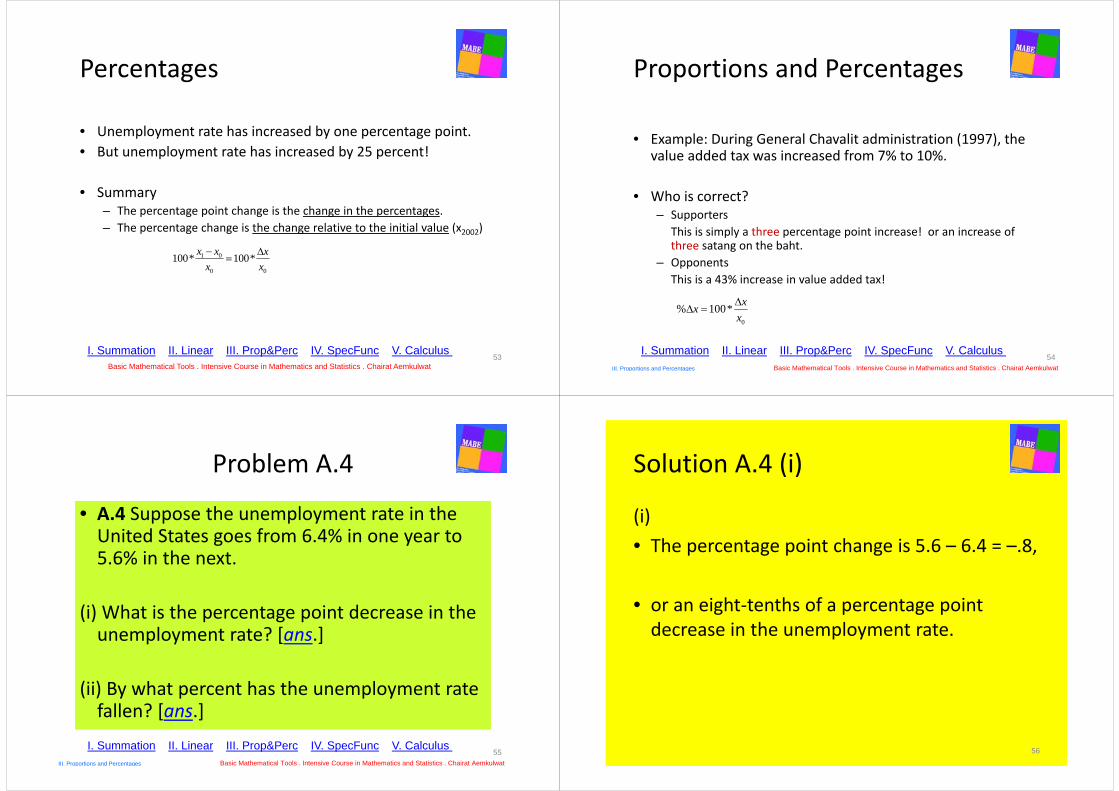
• Unemployment rate has increased by one percentage point.• But unemployment rate has increased by 25 percent!
• Summary– The percentage point change is the change in the percentages.– The percentage change is the change relative to the initial value (x2002)
I. Summation II. Linear III. Prop&Perc IV. SpecFunc V. Calculus 53
Basic Mathematical Tools . Intensive Course in Mathematics and Statistics . Chairat Aemkulwat
1 0
0 0
100* 100*x x xx x
Proportions and Percentages
• Example: During General Chavalit administration (1997), the value added tax was increased from 7% to 10%.
• Who is correct?– Supporters
This is simply a three percentage point increase! or an increase of three satang on the baht.
– OpponentsThis is a 43% increase in value added tax!
I. Summation II. Linear III. Prop&Perc IV. SpecFunc V. Calculus 54
Basic Mathematical Tools . Intensive Course in Mathematics and Statistics . Chairat Aemkulwat III. Proportions and Percentages
0
% 100* xxx
Problem A.4
• A.4 Suppose the unemployment rate in the United States goes from 6.4% in one year to 5.6% in the next.
(i) What is the percentage point decrease in the unemployment rate? [ans.]
(ii) By what percent has the unemployment rate fallen? [ans.]
55I. Summation II. Linear III. Prop&Perc IV. SpecFunc V. Calculus
Basic Mathematical Tools . Intensive Course in Mathematics and Statistics . Chairat Aemkulwat III. Proportions and Percentages
Solution A.4 (i)
(i) • The percentage point change is 5.6 – 6.4 = –.8,
• or an eight‐tenths of a percentage point decrease in the unemployment rate.
56
Solution A.4 (ii)
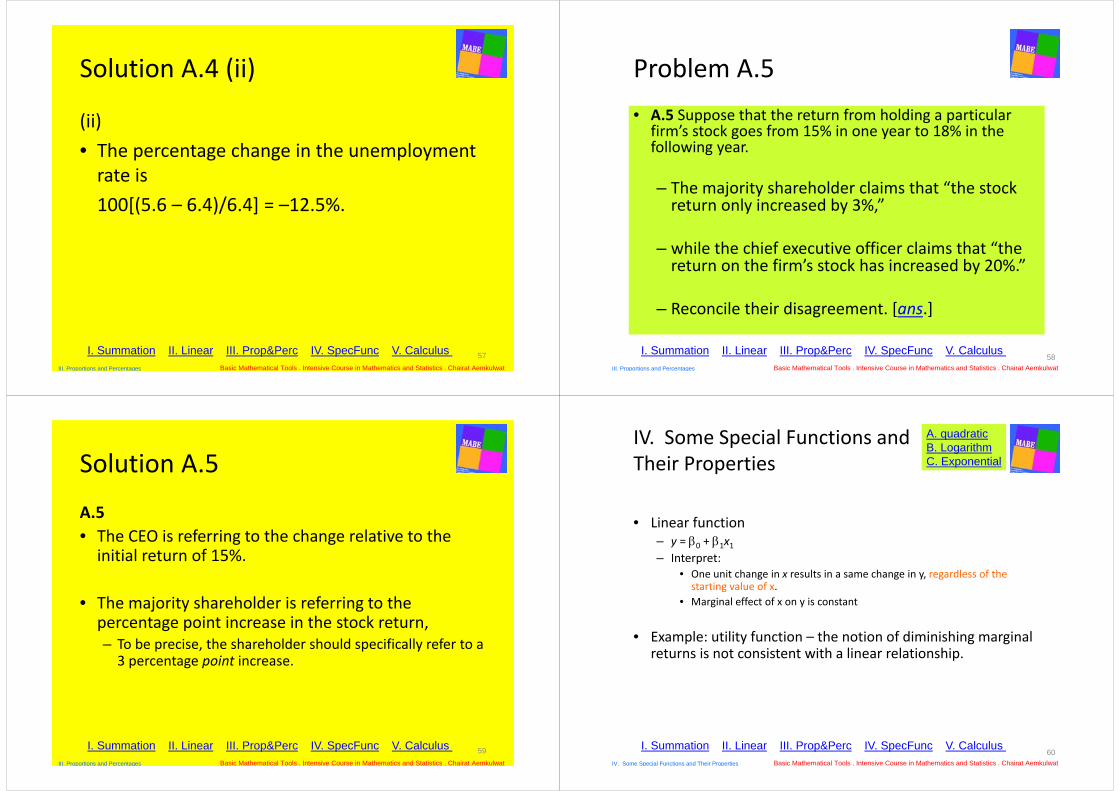
(ii) • The percentage change in the unemployment rate is 100[(5.6 – 6.4)/6.4] = –12.5%.
57I. Summation II. Linear III. Prop&Perc IV. SpecFunc V. Calculus Basic Mathematical Tools . Intensive Course in Mathematics and Statistics . Chairat Aemkulwat III. Proportions and Percentages
Problem A.5• A.5 Suppose that the return from holding a particular
firm’s stock goes from 15% in one year to 18% in the following year.
– The majority shareholder claims that “the stock return only increased by 3%,”
– while the chief executive officer claims that “the return on the firm’s stock has increased by 20%.”
– Reconcile their disagreement. [ans.]
I. Summation II. Linear III. Prop&Perc IV. SpecFunc V. Calculus 58
Basic Mathematical Tools . Intensive Course in Mathematics and Statistics . Chairat Aemkulwat III. Proportions and Percentages
Solution A.5
A.5• The CEO is referring to the change relative to the initial return of 15%.
• The majority shareholder is referring to the percentage point increase in the stock return, – To be precise, the shareholder should specifically refer to a 3 percentage point increase.
59I. Summation II. Linear III. Prop&Perc IV. SpecFunc V. Calculus Basic Mathematical Tools . Intensive Course in Mathematics and Statistics . Chairat Aemkulwat III. Proportions and Percentages
IV. Some Special Functions and Their Properties
• Linear function– y = 0 + 1x1– Interpret:
• One unit change in x results in a same change in y, regardless of the starting value of x.
• Marginal effect of x on y is constant
• Example: utility function – the notion of diminishing marginal returns is not consistent with a linear relationship.
A. quadraticB. LogarithmC. Exponential
I. Summation II. Linear III. Prop&Perc IV. SpecFunc V. Calculus 60
Basic Mathematical Tools . Intensive Course in Mathematics and Statistics . Chairat Aemkulwat IV. Some Special Functions and Their Properties
Some Special Functions and Their Properties
• Many economic phenomena requires the use of nonlinear functions
• Nonlinear function is characterized by the fact that the change in y for a given change in x depends on the starting value of x.
• Quadratic functions• Natural Logarithm• Exponential Function
A. quadraticB. LogarithmC. Exponential
I. Summation II. Linear III. Prop&Perc IV. SpecFunc V. Calculus 61
Basic Mathematical Tools . Intensive Course in Mathematics and Statistics . Chairat Aemkulwat IV. Some Special Functions and Their Properties
Quadratic functions
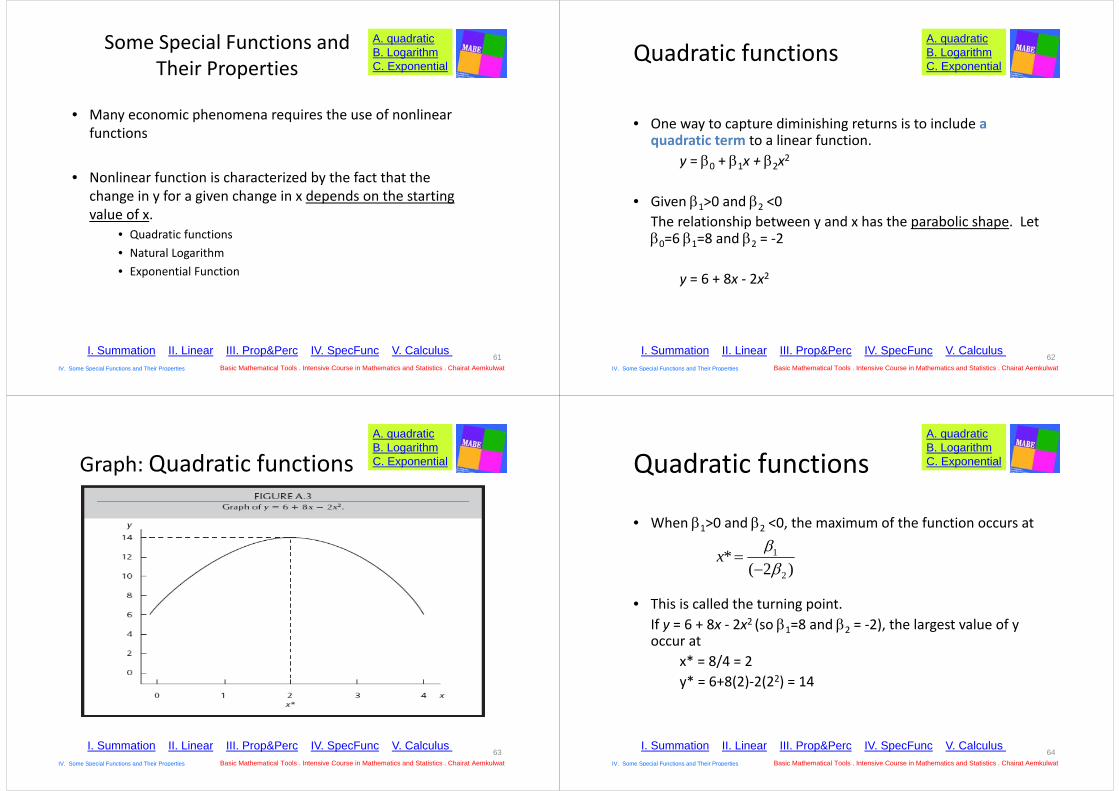
• One way to capture diminishing returns is to include a quadratic term to a linear function.
y = 0 + 1x + 2x2
• Given 1>0 and 2 <0The relationship between y and x has the parabolic shape. Let 0=6 1=8 and 2 = ‐2
y = 6 + 8x ‐ 2x2
A. quadraticB. LogarithmC. Exponential
I. Summation II. Linear III. Prop&Perc IV. SpecFunc V. Calculus 62
Basic Mathematical Tools . Intensive Course in Mathematics and Statistics . Chairat Aemkulwat IV. Some Special Functions and Their Properties
Graph: Quadratic functionsA. quadraticB. LogarithmC. Exponential
I. Summation II. Linear III. Prop&Perc IV. SpecFunc V. Calculus 63
Basic Mathematical Tools . Intensive Course in Mathematics and Statistics . Chairat Aemkulwat IV. Some Special Functions and Their Properties
Quadratic functions
• When 1>0 and 2 <0, the maximum of the function occurs at
• This is called the turning point.If y = 6 + 8x ‐ 2x2 (so 1=8 and 2 = ‐2), the largest value of y occur at
x* = 8/4 = 2 y* = 6+8(2)‐2(22) = 14
1
2
*( 2 )
x
A. quadraticB. LogarithmC. Exponential
I. Summation II. Linear III. Prop&Perc IV. SpecFunc V. Calculus 64
Basic Mathematical Tools . Intensive Course in Mathematics and Statistics . Chairat Aemkulwat IV. Some Special Functions and Their Properties
Quadratic functions
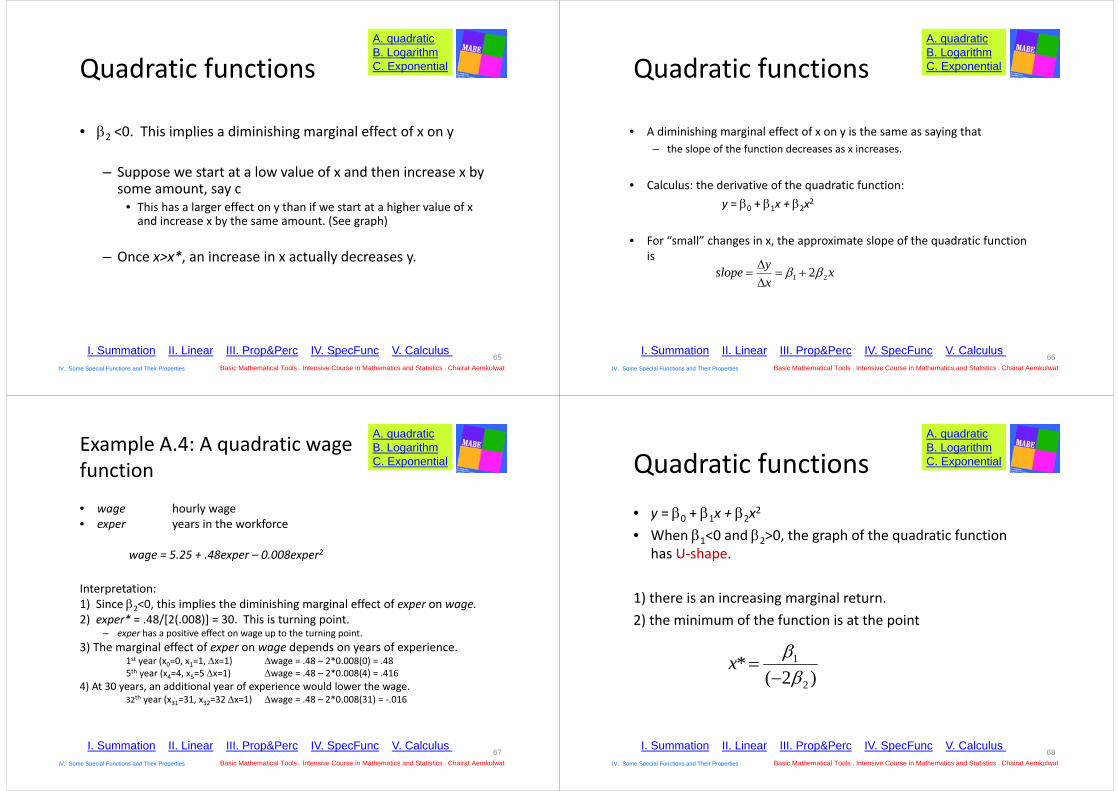
• 2 <0. This implies a diminishing marginal effect of x on y
– Suppose we start at a low value of x and then increase x by some amount, say c
• This has a larger effect on y than if we start at a higher value of x and increase x by the same amount. (See graph)
– Once x>x*, an increase in x actually decreases y.
A. quadraticB. LogarithmC. Exponential
I. Summation II. Linear III. Prop&Perc IV. SpecFunc V. Calculus 65
Basic Mathematical Tools . Intensive Course in Mathematics and Statistics . Chairat Aemkulwat IV. Some Special Functions and Their Properties
Quadratic functions
• A diminishing marginal effect of x on y is the same as saying that – the slope of the function decreases as x increases.
• Calculus: the derivative of the quadratic function: y = 0 + 1x + 2x2
• For “small” changes in x, the approximate slope of the quadratic function is
1 22yslope xx
A. quadraticB. LogarithmC. Exponential
I. Summation II. Linear III. Prop&Perc IV. SpecFunc V. Calculus 66
Basic Mathematical Tools . Intensive Course in Mathematics and Statistics . Chairat Aemkulwat IV. Some Special Functions and Their Properties
Example A.4: A quadratic wage function
• wage hourly wage• exper years in the workforce
wage = 5.25 + .48exper – 0.008exper2
Interpretation:1) Since 2<0, this implies the diminishing marginal effect of exper on wage.2) exper* = .48/[2(.008)] = 30. This is turning point.
– exper has a positive effect on wage up to the turning point.3) The marginal effect of exper on wage depends on years of experience.
1st year (x0=0, x1=1, x=1) wage = .48 – 2*0.008(0) = .485th year (x4=4, x5=5 x=1) wage = .48 – 2*0.008(4) = .416
4) At 30 years, an additional year of experience would lower the wage.32th year (x31=31, x32=32 x=1) wage = .48 – 2*0.008(31) = ‐.016
A. quadraticB. LogarithmC. Exponential
I. Summation II. Linear III. Prop&Perc IV. SpecFunc V. Calculus 67
Basic Mathematical Tools . Intensive Course in Mathematics and Statistics . Chairat Aemkulwat IV. Some Special Functions and Their Properties
Quadratic functions• y = 0 + 1x + 2x2
• When 1<0 and 2>0, the graph of the quadratic function has U‐shape.
1) there is an increasing marginal return.2) the minimum of the function is at the point
1
2
*( 2 )
x
A. quadraticB. LogarithmC. Exponential
I. Summation II. Linear III. Prop&Perc IV. SpecFunc V. Calculus 68
Basic Mathematical Tools . Intensive Course in Mathematics and Statistics . Chairat Aemkulwat IV. Some Special Functions and Their Properties
Natural Logarithm
• The natural logarithm, an important nonlinear function, plays an important role in econometric analysis.
• We denotes the natural logarithm as the log function
y = log(x)
• Other common symbols include loge(x) and ln(x).– Most calculators use ln(x).– Different symbols are useful when we use logarithm with different bases.
A. quadraticB. LogarithmC. Exponential
I. Summation II. Linear III. Prop&Perc IV. SpecFunc V. Calculus 69
Basic Mathematical Tools . Intensive Course in Mathematics and Statistics . Chairat Aemkulwat IV. Some Special Functions and Their Properties
Natural Logarithm
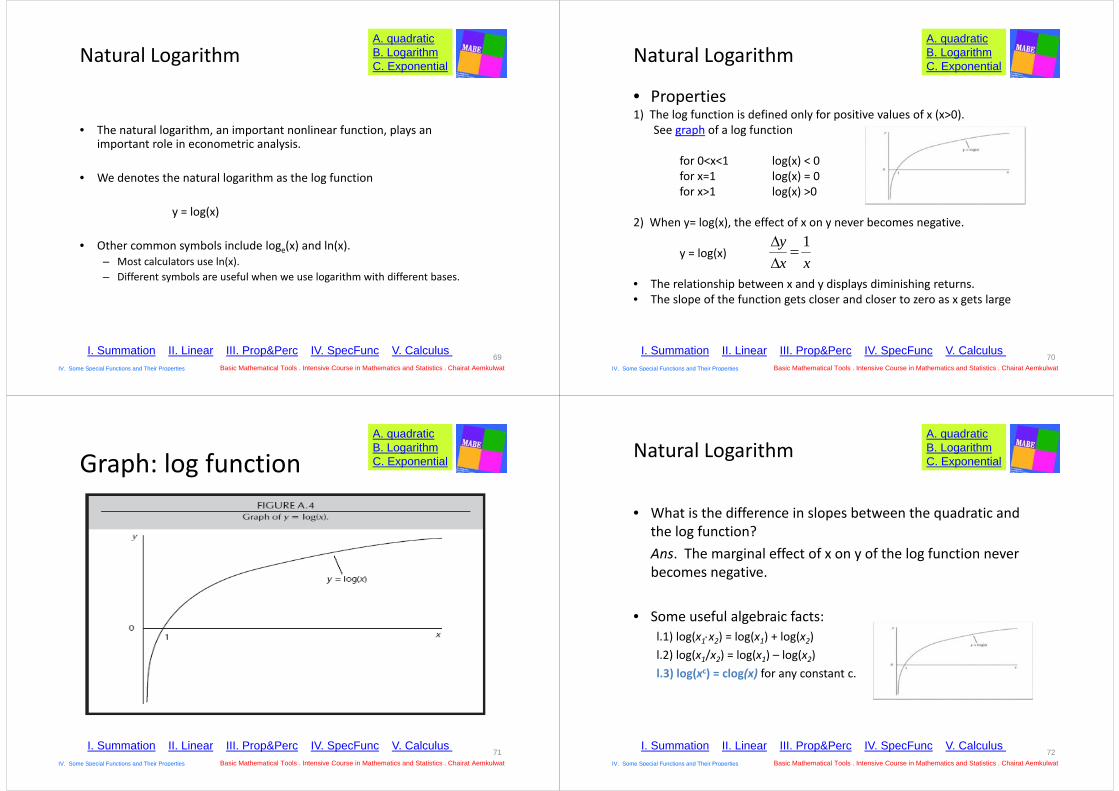
• Properties1) The log function is defined only for positive values of x (x>0).
See graph of a log function
for 0<x<1 log(x) < 0for x=1 log(x) = 0for x>1 log(x) >0
2) When y= log(x), the effect of x on y never becomes negative.
y = log(x)
• The relationship between x and y displays diminishing returns.• The slope of the function gets closer and closer to zero as x gets large
1yx x
A. quadraticB. LogarithmC. Exponential
I. Summation II. Linear III. Prop&Perc IV. SpecFunc V. Calculus 70
Basic Mathematical Tools . Intensive Course in Mathematics and Statistics . Chairat Aemkulwat IV. Some Special Functions and Their Properties
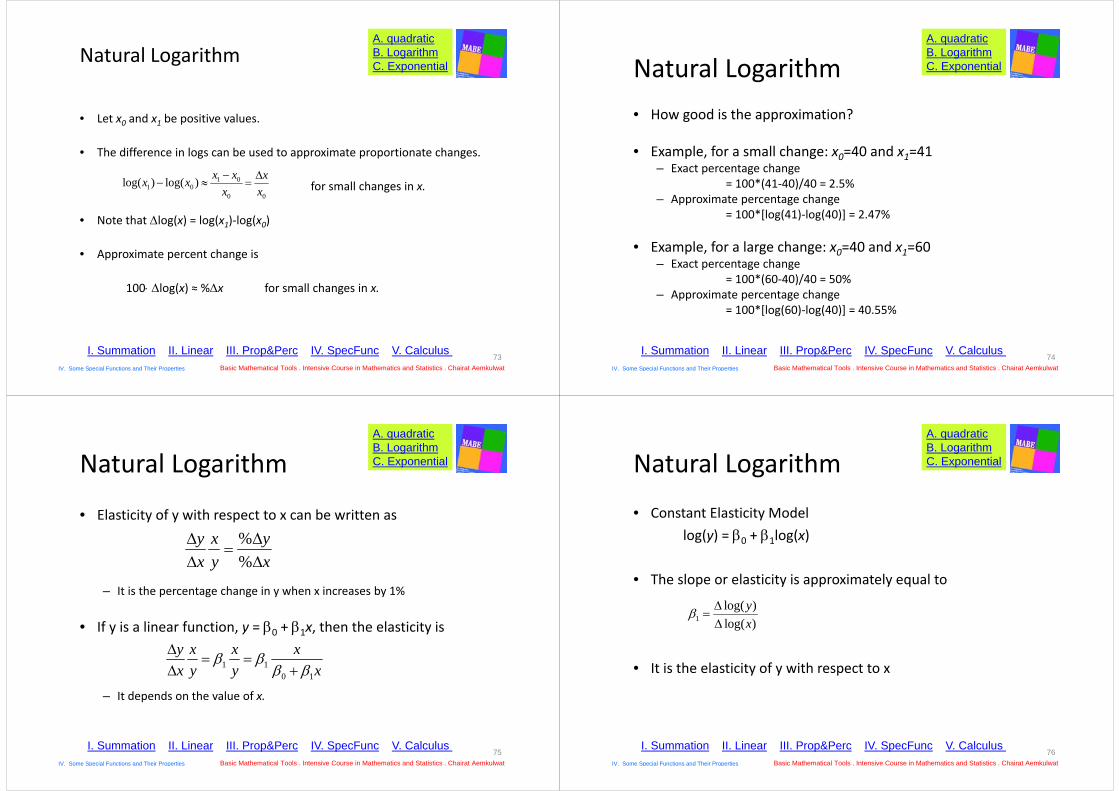
Graph: log functionA. quadraticB. LogarithmC. Exponential
I. Summation II. Linear III. Prop&Perc IV. SpecFunc V. Calculus 71
Basic Mathematical Tools . Intensive Course in Mathematics and Statistics . Chairat Aemkulwat IV. Some Special Functions and Their Properties
Natural Logarithm
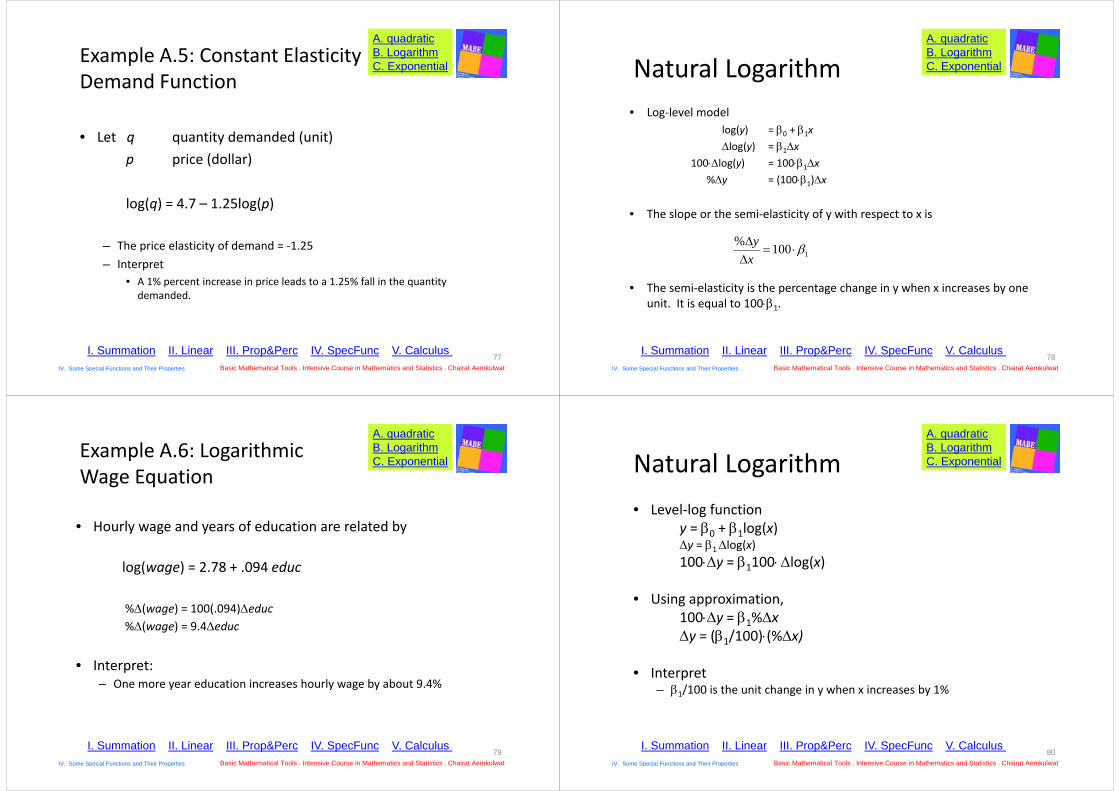
• What is the difference in slopes between the quadratic and the log function? Ans. The marginal effect of x on y of the log function never becomes negative.
• Some useful algebraic facts:l.1) log(x1x2) = log(x1) + log(x2)l.2) log(x1/x2) = log(x1) – log(x2)l.3) log(xc) = clog(x) for any constant c.
A. quadraticB. LogarithmC. Exponential
I. Summation II. Linear III. Prop&Perc IV. SpecFunc V. Calculus 72
Basic Mathematical Tools . Intensive Course in Mathematics and Statistics . Chairat Aemkulwat IV. Some Special Functions and Their Properties
Natural Logarithm
• Let x0 and x1 be positive values.
• The difference in logs can be used to approximate proportionate changes.
for small changes in x.
• Note that log(x) = log(x1)‐log(x0)
• Approximate percent change is
100 log(x) ≈ %x for small changes in x.
1 01 0
0 0
log( ) log( ) x x xx xx x
A. quadraticB. LogarithmC. Exponential
I. Summation II. Linear III. Prop&Perc IV. SpecFunc V. Calculus 73
Basic Mathematical Tools . Intensive Course in Mathematics and Statistics . Chairat Aemkulwat IV. Some Special Functions and Their Properties
Natural Logarithm• How good is the approximation?
• Example, for a small change: x0=40 and x1=41 – Exact percentage change
= 100*(41‐40)/40 = 2.5%– Approximate percentage change
= 100*[log(41)‐log(40)] = 2.47%
• Example, for a large change: x0=40 and x1=60 – Exact percentage change
= 100*(60‐40)/40 = 50%– Approximate percentage change
= 100*[log(60)‐log(40)] = 40.55%
A. quadraticB. LogarithmC. Exponential
I. Summation II. Linear III. Prop&Perc IV. SpecFunc V. Calculus 74
Basic Mathematical Tools . Intensive Course in Mathematics and Statistics . Chairat Aemkulwat IV. Some Special Functions and Their Properties
Natural Logarithm
• Elasticity of y with respect to x can be written as
– It is the percentage change in y when x increases by 1%
• If y is a linear function, y = 0 + 1x, then the elasticity is
– It depends on the value of x.
1 10 1
y x x xx y y x
%%
y x yx y x
A. quadraticB. LogarithmC. Exponential
I. Summation II. Linear III. Prop&Perc IV. SpecFunc V. Calculus 75
Basic Mathematical Tools . Intensive Course in Mathematics and Statistics . Chairat Aemkulwat IV. Some Special Functions and Their Properties
Natural Logarithm
• Constant Elasticity Modellog(y) = 0 + 1log(x)
• The slope or elasticity is approximately equal to
• It is the elasticity of y with respect to x
1log( )log( )
yx
A. quadraticB. LogarithmC. Exponential
I. Summation II. Linear III. Prop&Perc IV. SpecFunc V. Calculus 76
Basic Mathematical Tools . Intensive Course in Mathematics and Statistics . Chairat Aemkulwat IV. Some Special Functions and Their Properties
Example A.5: Constant Elasticity Demand Function
• Let q quantity demanded (unit)p price (dollar)
log(q) = 4.7 – 1.25log(p)
– The price elasticity of demand = ‐1.25– Interpret
• A 1% percent increase in price leads to a 1.25% fall in the quantity demanded.
A. quadraticB. LogarithmC. Exponential
77Basic Mathematical Tools . Intensive Course in Mathematics and Statistics . Chairat Aemkulwat IV. Some Special Functions and Their Properties
I. Summation II. Linear III. Prop&Perc IV. SpecFunc V. Calculus
Natural Logarithm• Log‐level model
log(y) = 0 + 1xlog(y) = 1x
100log(y) = 1001x%y = (1001)x
• The slope or the semi‐elasticity of y with respect to x is
• The semi‐elasticity is the percentage change in y when x increases by one unit. It is equal to 1001.
1% 100y
x
A. quadraticB. LogarithmC. Exponential
I. Summation II. Linear III. Prop&Perc IV. SpecFunc V. Calculus 78
Basic Mathematical Tools . Intensive Course in Mathematics and Statistics . Chairat Aemkulwat IV. Some Special Functions and Their Properties
Example A.6: Logarithmic Wage Equation
• Hourly wage and years of education are related by
log(wage) = 2.78 + .094 educ
%(wage) = 100(.094)educ%(wage) = 9.4educ
• Interpret:– One more year education increases hourly wage by about 9.4%
A. quadraticB. LogarithmC. Exponential
I. Summation II. Linear III. Prop&Perc IV. SpecFunc V. Calculus 79
Basic Mathematical Tools . Intensive Course in Mathematics and Statistics . Chairat Aemkulwat IV. Some Special Functions and Their Properties
Natural Logarithm• Level‐log function
y = 0 + 1log(x)y = 1 log(x) 100y = 1100 log(x)
• Using approximation, 100y = 1%xy = (1/100)(%x)
• Interpret– 1/100 is the unit change in y when x increases by 1%
A. quadraticB. LogarithmC. Exponential
I. Summation II. Linear III. Prop&Perc IV. SpecFunc V. Calculus 80
Basic Mathematical Tools . Intensive Course in Mathematics and Statistics . Chairat Aemkulwat IV. Some Special Functions and Their Properties
Example A.7: Labor Supply Function
• Let hours hours worked per weekwage hourly wage
hours = 33 + 45.1log(wage)hours = (45.1/100)(%wage)hours = 0.451(%wage)
• Interpret1% increase in wage increases the weekly hours worked by about 0.45, or slightly less than one‐half hour.
A. quadraticB. LogarithmC. Exponential
I. Summation II. Linear III. Prop&Perc IV. SpecFunc V. Calculus 81
Basic Mathematical Tools . Intensive Course in Mathematics and Statistics . Chairat Aemkulwat IV. Some Special Functions and Their Properties
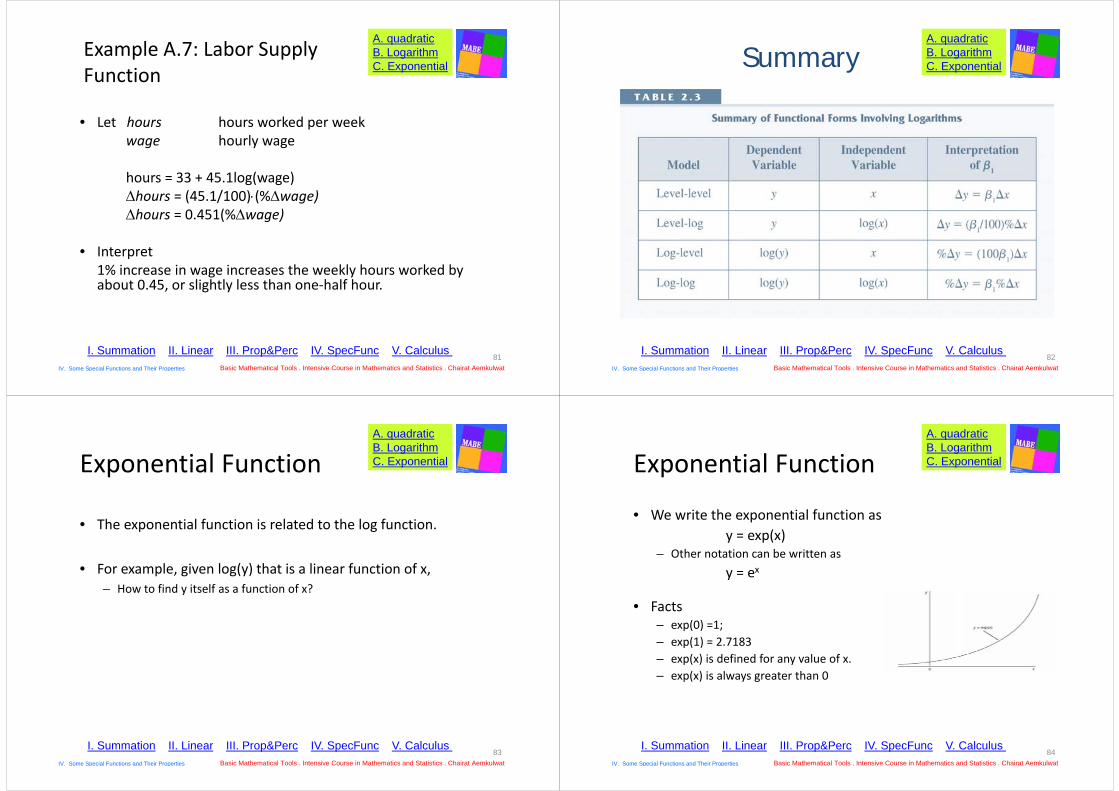
SummaryA. quadraticB. LogarithmC. Exponential
I. Summation II. Linear III. Prop&Perc IV. SpecFunc V. Calculus 82
Basic Mathematical Tools . Intensive Course in Mathematics and Statistics . Chairat Aemkulwat IV. Some Special Functions and Their Properties
Exponential Function
• The exponential function is related to the log function.
• For example, given log(y) that is a linear function of x, – How to find y itself as a function of x?
A. quadraticB. LogarithmC. Exponential
I. Summation II. Linear III. Prop&Perc IV. SpecFunc V. Calculus 83
Basic Mathematical Tools . Intensive Course in Mathematics and Statistics . Chairat Aemkulwat IV. Some Special Functions and Their Properties
Exponential Function
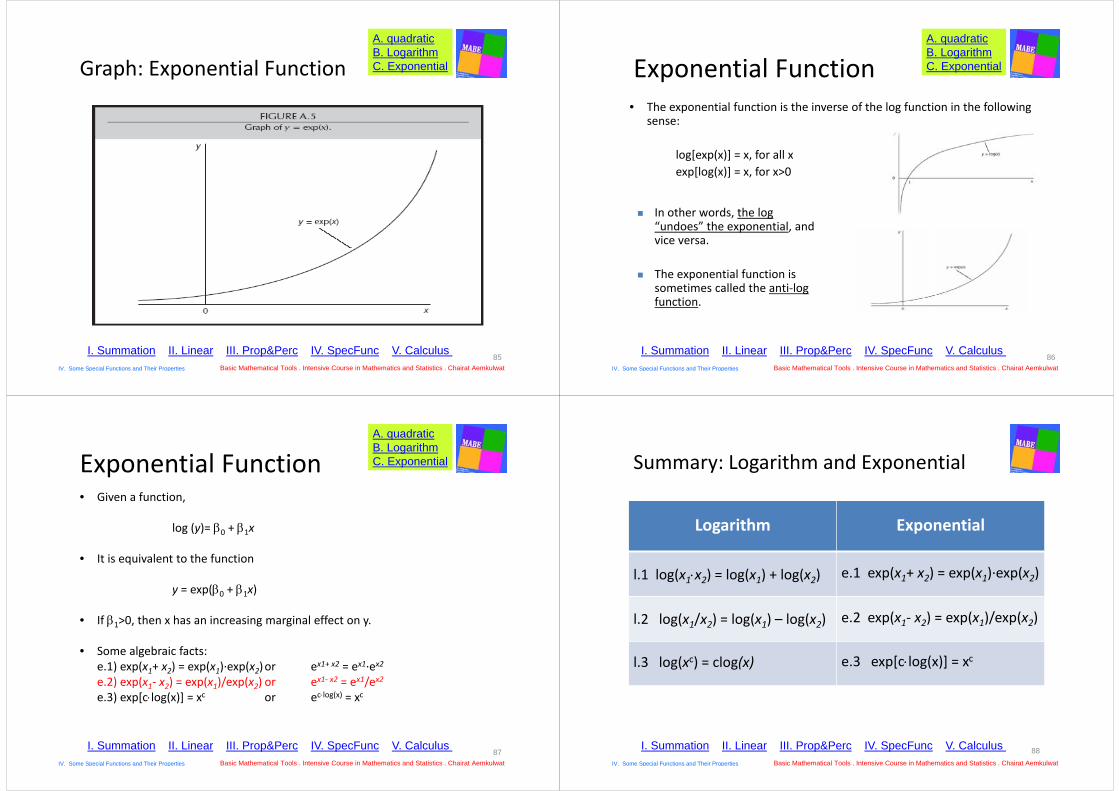
• We write the exponential function asy = exp(x)
– Other notation can be written asy = ex
• Facts– exp(0) =1; – exp(1) = 2.7183 – exp(x) is defined for any value of x.– exp(x) is always greater than 0
A. quadraticB. LogarithmC. Exponential
I. Summation II. Linear III. Prop&Perc IV. SpecFunc V. Calculus 84
Basic Mathematical Tools . Intensive Course in Mathematics and Statistics . Chairat Aemkulwat IV. Some Special Functions and Their Properties
Graph: Exponential FunctionA. quadraticB. LogarithmC. Exponential
I. Summation II. Linear III. Prop&Perc IV. SpecFunc V. Calculus 85
Basic Mathematical Tools . Intensive Course in Mathematics and Statistics . Chairat Aemkulwat IV. Some Special Functions and Their Properties
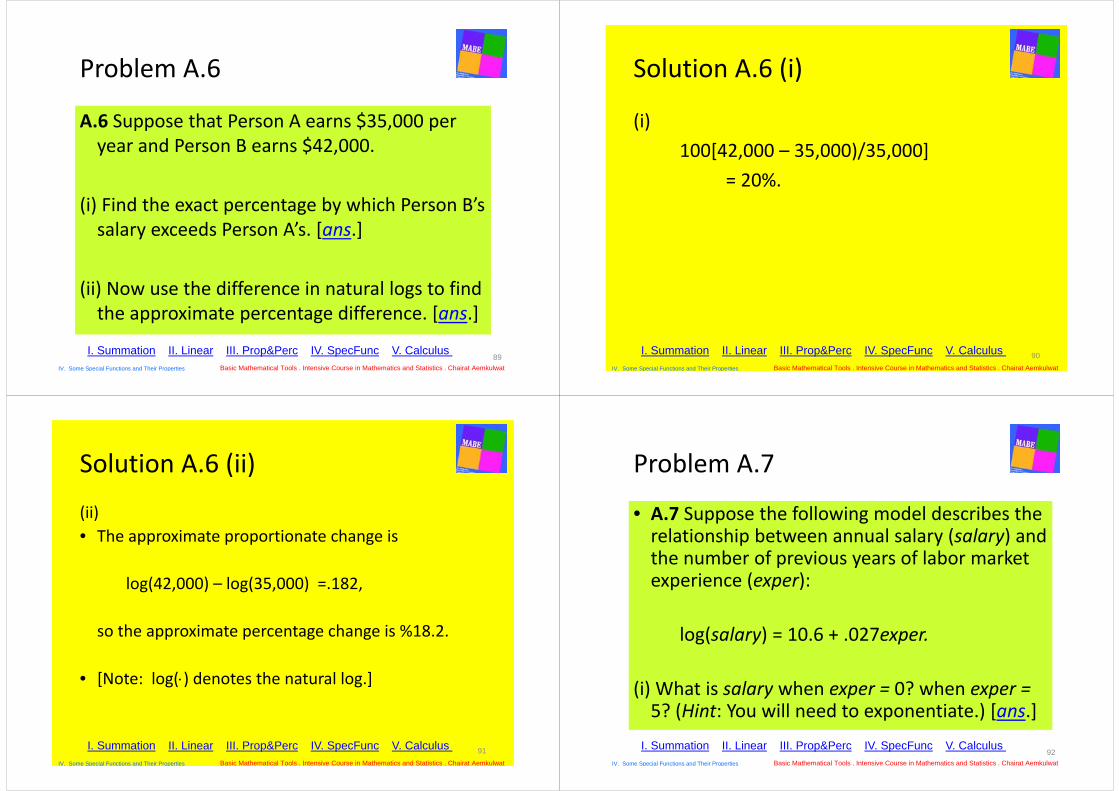
Exponential Function• The exponential function is the inverse of the log function in the following
sense:
log[exp(x)] = x, for all xexp[log(x)] = x, for x>0
In other words, the log “undoes” the exponential, and vice versa.
The exponential function is sometimes called the anti‐log function.
A. quadraticB. LogarithmC. Exponential
I. Summation II. Linear III. Prop&Perc IV. SpecFunc V. Calculus 86
Basic Mathematical Tools . Intensive Course in Mathematics and Statistics . Chairat Aemkulwat IV. Some Special Functions and Their Properties
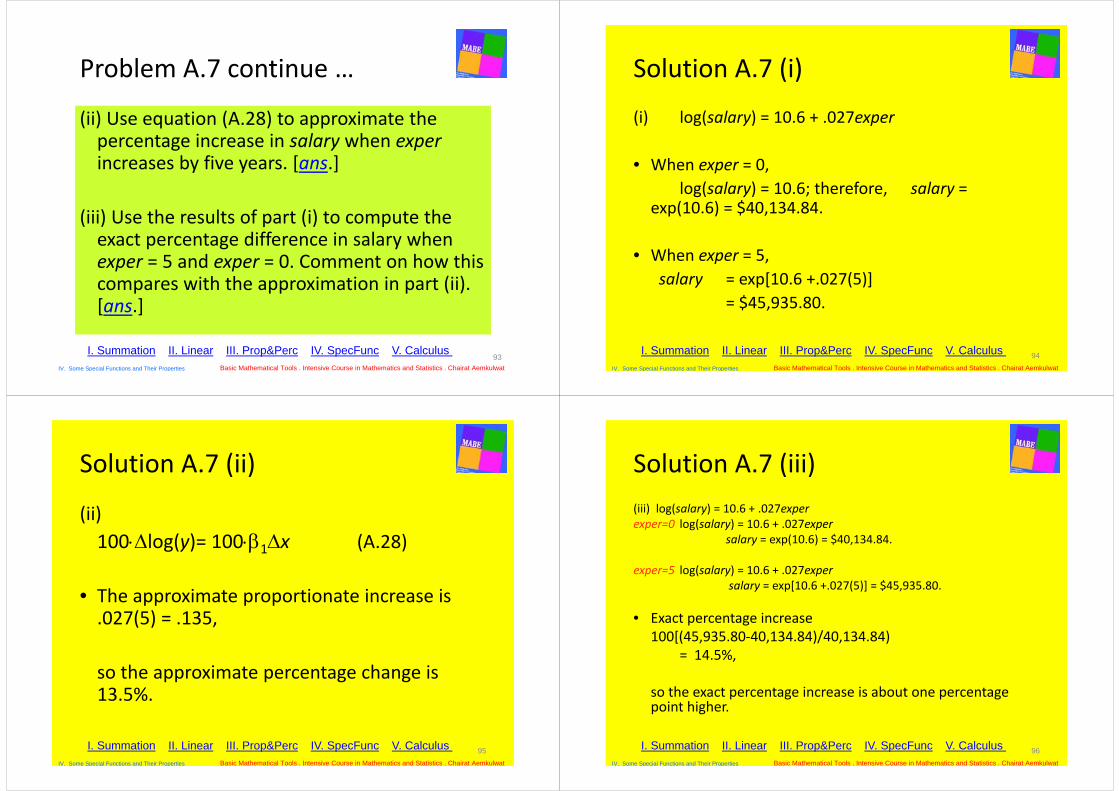
Exponential Function• Given a function,
log (y)= 0 + 1x
• It is equivalent to the function
y = exp(0 + 1x)
• If 1>0, then x has an increasing marginal effect on y.
• Some algebraic facts:e.1) exp(x1+ x2) = exp(x1)∙exp(x2)or ex1+ x2 = ex1∙ex2e.2) exp(x1‐ x2) = exp(x1)/exp(x2) or ex1‐ x2 = ex1/ex2e.3) exp[clog(x)] = xc or eclog(x) = xc
A. quadraticB. LogarithmC. Exponential
I. Summation II. Linear III. Prop&Perc IV. SpecFunc V. Calculus 87
Basic Mathematical Tools . Intensive Course in Mathematics and Statistics . Chairat Aemkulwat IV. Some Special Functions and Their Properties
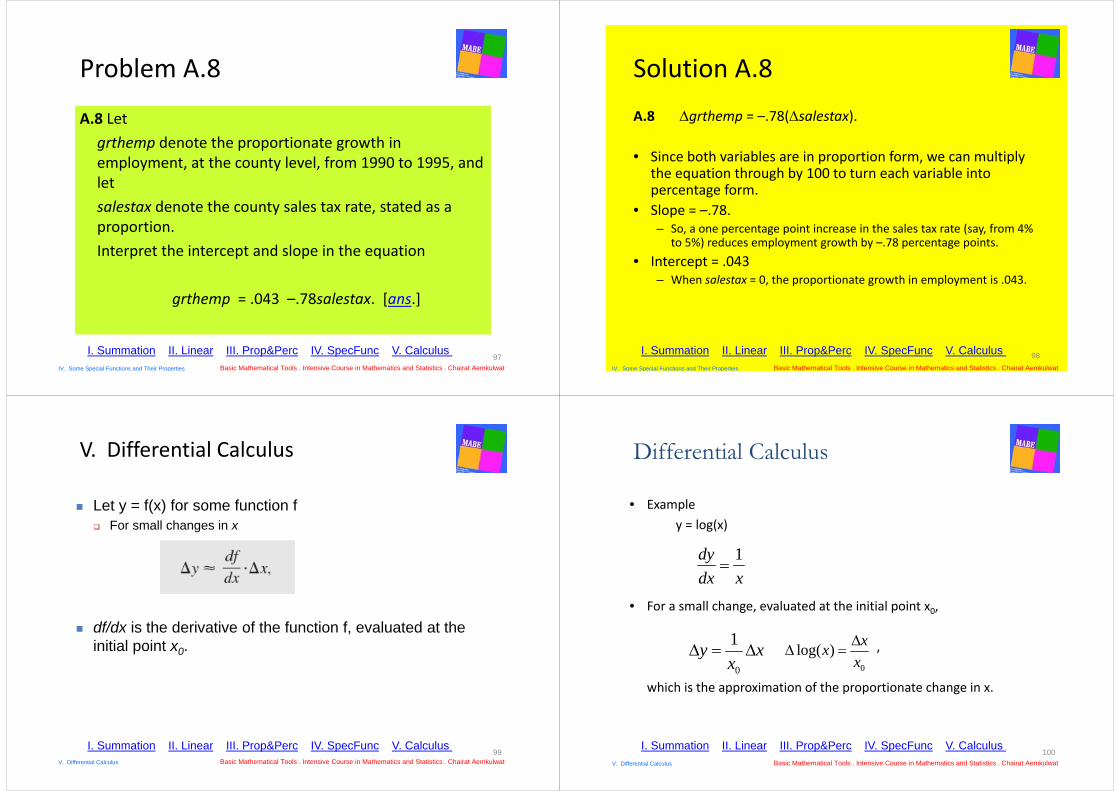
Logarithm Exponential
l.1 log(x1x2) = log(x1) + log(x2) e.1 exp(x1+ x2) = exp(x1)∙exp(x2)
l.2 log(x1/x2) = log(x1) – log(x2) e.2 exp(x1‐ x2) = exp(x1)/exp(x2)
l.3 log(xc) = clog(x) e.3 exp[clog(x)] = xc
Summary: Logarithm and Exponential
88I. Summation II. Linear III. Prop&Perc IV. SpecFunc V. Calculus Basic Mathematical Tools . Intensive Course in Mathematics and Statistics . Chairat Aemkulwat IV. Some Special Functions and Their Properties
Problem A.6
A.6 Suppose that Person A earns $35,000 per year and Person B earns $42,000.
(i) Find the exact percentage by which Person B’s salary exceeds Person A’s. [ans.]
(ii) Now use the difference in natural logs to find the approximate percentage difference. [ans.]
I. Summation II. Linear III. Prop&Perc IV. SpecFunc V. Calculus 89
Basic Mathematical Tools . Intensive Course in Mathematics and Statistics . Chairat Aemkulwat IV. Some Special Functions and Their Properties
Solution A.6 (i)
(i)100[42,000 – 35,000)/35,000]
= 20%.
90I. Summation II. Linear III. Prop&Perc IV. SpecFunc V. Calculus Basic Mathematical Tools . Intensive Course in Mathematics and Statistics . Chairat Aemkulwat IV. Some Special Functions and Their Properties
Solution A.6 (ii)
(ii) • The approximate proportionate change is
log(42,000) – log(35,000) =.182,
so the approximate percentage change is %18.2.
• [Note: log() denotes the natural log.]
91I. Summation II. Linear III. Prop&Perc IV. SpecFunc V. Calculus Basic Mathematical Tools . Intensive Course in Mathematics and Statistics . Chairat Aemkulwat IV. Some Special Functions and Their Properties
Problem A.7
• A.7 Suppose the following model describes the relationship between annual salary (salary) and the number of previous years of labor market experience (exper):
log(salary) = 10.6 + .027exper.
(i) What is salary when exper = 0? when exper =5? (Hint: You will need to exponentiate.) [ans.]
I. Summation II. Linear III. Prop&Perc IV. SpecFunc V. Calculus 92
Basic Mathematical Tools . Intensive Course in Mathematics and Statistics . Chairat Aemkulwat IV. Some Special Functions and Their Properties
Problem A.7 continue …
(ii) Use equation (A.28) to approximate the percentage increase in salary when exper increases by five years. [ans.]
(iii) Use the results of part (i) to compute the exact percentage difference in salary when exper = 5 and exper = 0. Comment on how this compares with the approximation in part (ii). [ans.]
I. Summation II. Linear III. Prop&Perc IV. SpecFunc V. Calculus 93
Basic Mathematical Tools . Intensive Course in Mathematics and Statistics . Chairat Aemkulwat IV. Some Special Functions and Their Properties
Solution A.7 (i)
(i) log(salary) = 10.6 + .027exper
• When exper = 0, log(salary) = 10.6; therefore, salary =
exp(10.6) = $40,134.84.
• When exper = 5, salary = exp[10.6 +.027(5)]
= $45,935.80.
94I. Summation II. Linear III. Prop&Perc IV. SpecFunc V. Calculus Basic Mathematical Tools . Intensive Course in Mathematics and Statistics . Chairat Aemkulwat IV. Some Special Functions and Their Properties
Solution A.7 (ii)
(ii) 100log(y)= 1001x (A.28)
• The approximate proportionate increase is .027(5) = .135,
so the approximate percentage change is 13.5%.
95I. Summation II. Linear III. Prop&Perc IV. SpecFunc V. Calculus Basic Mathematical Tools . Intensive Course in Mathematics and Statistics . Chairat Aemkulwat IV. Some Special Functions and Their Properties
Solution A.7 (iii)(iii) log(salary) = 10.6 + .027experexper=0 log(salary) = 10.6 + .027exper
salary = exp(10.6) = $40,134.84.
exper=5 log(salary) = 10.6 + .027expersalary = exp[10.6 +.027(5)] = $45,935.80.
• Exact percentage increase100[(45,935.80‐40,134.84)/40,134.84)
= 14.5%,
so the exact percentage increase is about one percentage point higher.
96I. Summation II. Linear III. Prop&Perc IV. SpecFunc V. Calculus Basic Mathematical Tools . Intensive Course in Mathematics and Statistics . Chairat Aemkulwat IV. Some Special Functions and Their Properties
Problem A.8
A.8 Let grthemp denote the proportionate growth in employment, at the county level, from 1990 to 1995, and let salestax denote the county sales tax rate, stated as a proportion. Interpret the intercept and slope in the equation
grthemp = .043 –.78salestax. [ans.]
I. Summation II. Linear III. Prop&Perc IV. SpecFunc V. Calculus 97
Basic Mathematical Tools . Intensive Course in Mathematics and Statistics . Chairat Aemkulwat IV. Some Special Functions and Their Properties
Solution A.8A.8 grthemp = –.78(salestax).
• Since both variables are in proportion form, we can multiply the equation through by 100 to turn each variable into percentage form.
• Slope = –.78. – So, a one percentage point increase in the sales tax rate (say, from 4%
to 5%) reduces employment growth by –.78 percentage points.• Intercept = .043
– When salestax = 0, the proportionate growth in employment is .043.
98I. Summation II. Linear III. Prop&Perc IV. SpecFunc V. Calculus Basic Mathematical Tools . Intensive Course in Mathematics and Statistics . Chairat Aemkulwat IV. Some Special Functions and Their Properties
V. Differential Calculus
Let y = f(x) for some function f For small changes in x
df/dx is the derivative of the function f, evaluated at the initial point x0.
I. Summation II. Linear III. Prop&Perc IV. SpecFunc V. Calculus 99
Basic Mathematical Tools . Intensive Course in Mathematics and Statistics . Chairat Aemkulwat V. Differential Calculus
0
1y xx
• Exampley = log(x)
• For a small change, evaluated at the initial point x0,
,
which is the approximation of the proportionate change in x.0
log( ) xxx
1dydx x
Differential Calculus
I. Summation II. Linear III. Prop&Perc IV. SpecFunc V. Calculus 100
Basic Mathematical Tools . Intensive Course in Mathematics and Statistics . Chairat Aemkulwat V. Differential Calculus
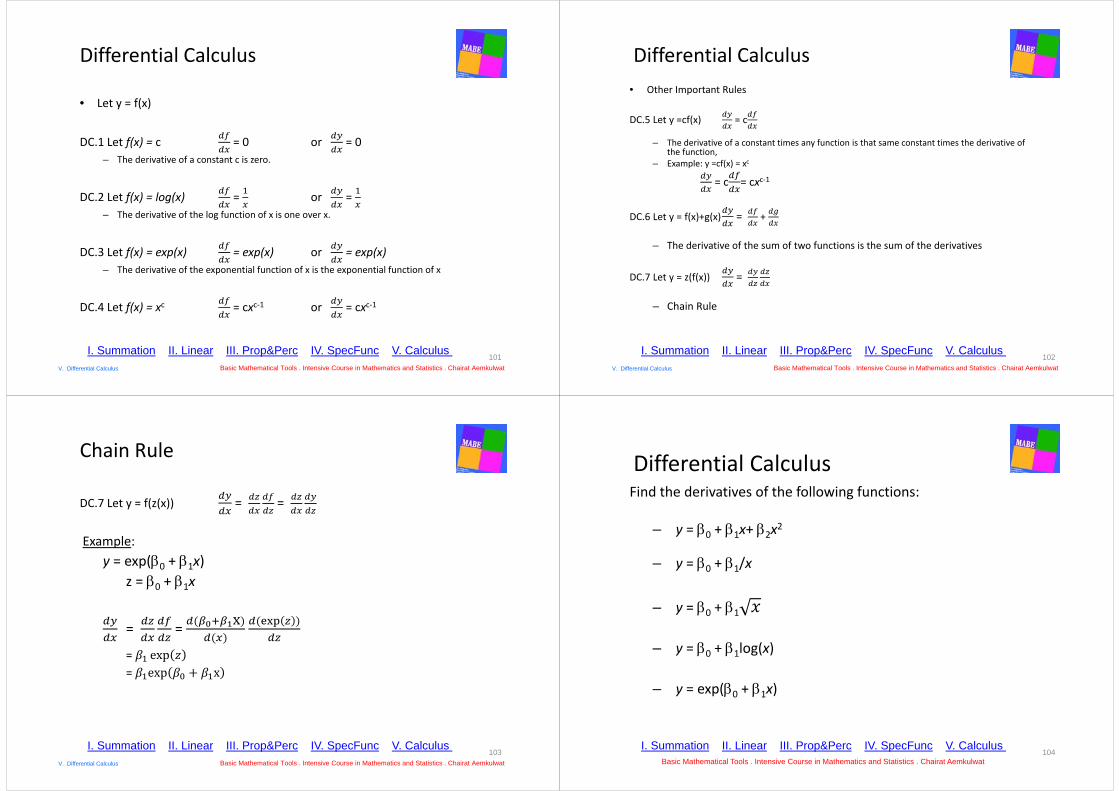
Differential Calculus
• Let y = f(x)
DC.1 Let f(x) = c = 0 or = 0– The derivative of a constant c is zero.
DC.2 Let f(x) = log(x) = or = – The derivative of the log function of x is one over x.
DC.3 Let f(x) = exp(x) = exp(x) or = exp(x)– The derivative of the exponential function of x is the exponential function of x
DC.4 Let f(x) = xc = cxc‐1 or = cxc‐1
I. Summation II. Linear III. Prop&Perc IV. SpecFunc V. Calculus 101
Basic Mathematical Tools . Intensive Course in Mathematics and Statistics . Chairat Aemkulwat V. Differential Calculus
Differential Calculus• Other Important Rules
DC.5 Let y =cf(x) = c
– The derivative of a constant times any function is that same constant times the derivative of the function,
– Example: y =cf(x) = xc
= c = cxc‐1
DC.6 Let y = f(x)+g(x) = +
– The derivative of the sum of two functions is the sum of the derivatives
DC.7 Let y = z(f(x)) =
– Chain Rule
I. Summation II. Linear III. Prop&Perc IV. SpecFunc V. Calculus 102
Basic Mathematical Tools . Intensive Course in Mathematics and Statistics . Chairat Aemkulwat V. Differential Calculus
Chain Rule
DC.7 Let y = f(z(x)) = =
Example:y = exp(0 + 1x)
z = 0 + 1x
= = x= exp= exp x
I. Summation II. Linear III. Prop&Perc IV. SpecFunc V. Calculus 103
Basic Mathematical Tools . Intensive Course in Mathematics and Statistics . Chairat Aemkulwat V. Differential Calculus
Differential CalculusFind the derivatives of the following functions:
– y = 0 + 1x+ 2x2
– y = 0 + 1/x
– y = 0 + 1
– y = 0 + 1log(x)
– y = exp(0 + 1x)
I. Summation II. Linear III. Prop&Perc IV. SpecFunc V. Calculus 104
Basic Mathematical Tools . Intensive Course in Mathematics and Statistics . Chairat Aemkulwat
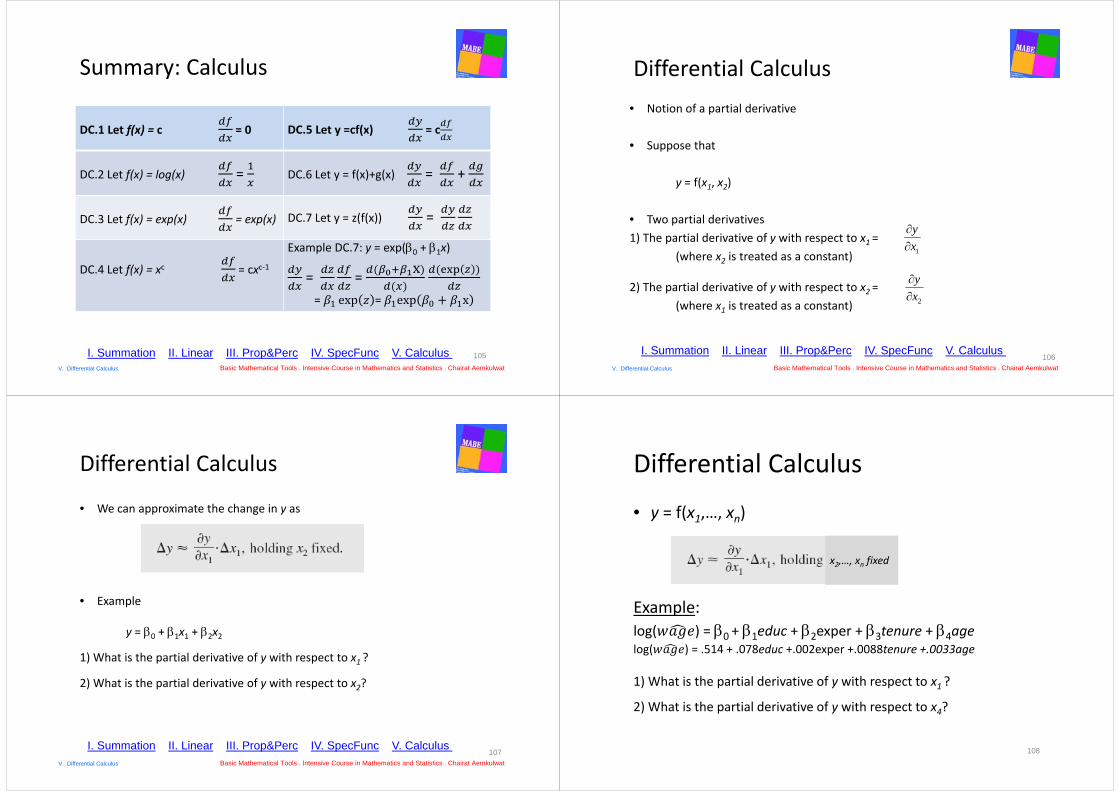
DC.1 Let f(x) = c = 0 DC.5 Let y =cf(x) = c
DC.2 Let f(x) = log(x) = DC.6 Let y = f(x)+g(x) = +
DC.3 Let f(x) = exp(x) = exp(x) DC.7 Let y = z(f(x)) =
DC.4 Let f(x) = xc = cxc‐1Example DC.7: y = exp(0 + 1x)
= = x= exp = exp x
Summary: Calculus
105I. Summation II. Linear III. Prop&Perc IV. SpecFunc V. Calculus Basic Mathematical Tools . Intensive Course in Mathematics and Statistics . Chairat Aemkulwat V. Differential Calculus
Differential Calculus• Notion of a partial derivative
• Suppose that
y = f(x1, x2)
• Two partial derivatives1) The partial derivative of y with respect to x1 =
(where x2 is treated as a constant)
2) The partial derivative of y with respect to x2 =(where x1 is treated as a constant)
2
yx
I. Summation II. Linear III. Prop&Perc IV. SpecFunc V. Calculus 106
1
yx
Basic Mathematical Tools . Intensive Course in Mathematics and Statistics . Chairat Aemkulwat V. Differential Calculus
Differential Calculus
• We can approximate the change in y as
• Example
y = 0 + 1x1 + 2x2
1) What is the partial derivative of y with respect to x1 ?
2) What is the partial derivative of y with respect to x2?
I. Summation II. Linear III. Prop&Perc IV. SpecFunc V. Calculus 107
Basic Mathematical Tools . Intensive Course in Mathematics and Statistics . Chairat Aemkulwat V. Differential Calculus
Differential Calculus
• y = f(x1,…, xn)
Example:log( ) = 0 + 1educ + 2exper + 3tenure + 4agelog( ) = .514 + .078educ +.002exper +.0088tenure +.0033age
1) What is the partial derivative of y with respect to x1 ?
2) What is the partial derivative of y with respect to x4?
108
x2,…, xn fixed
Differential Calculus
• Example
1) What is the partial derivative of y with respect to x1 ?
2) What is the partial derivative of y with respect to x2?
I. Summation II. Linear III. Prop&Perc IV. SpecFunc V. Calculus 109
Basic Mathematical Tools . Intensive Course in Mathematics and Statistics . Chairat Aemkulwat V. Differential Calculus
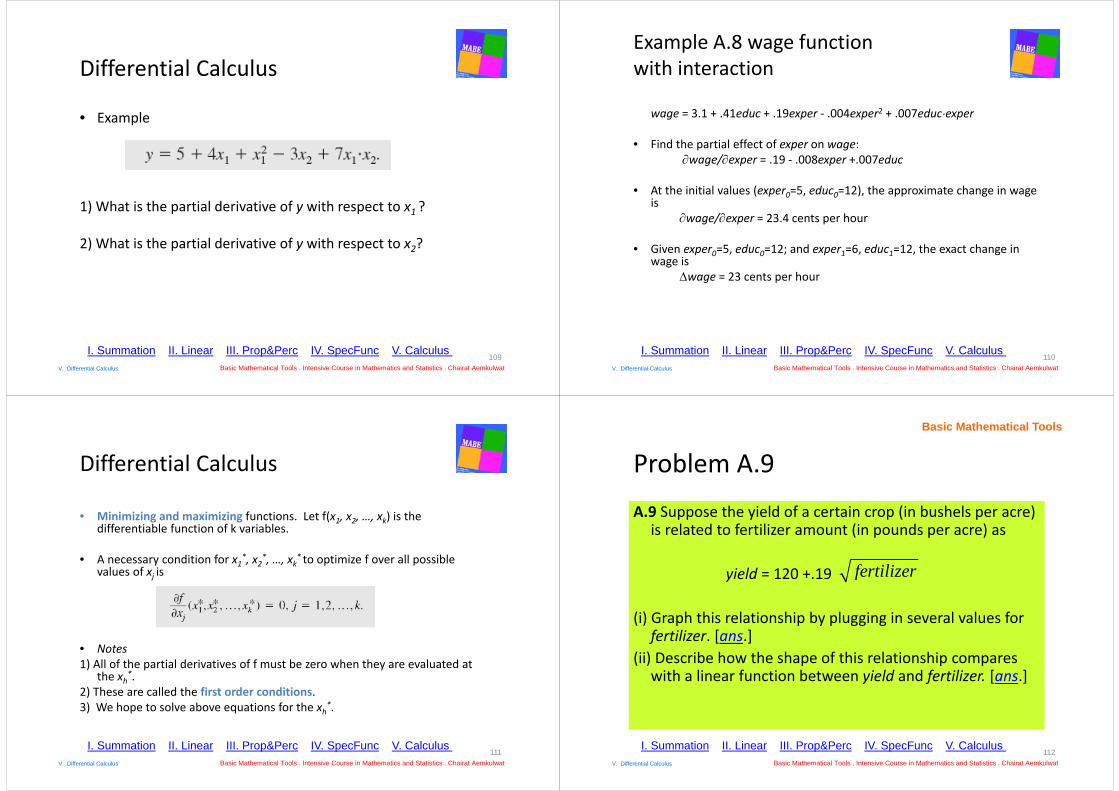
Example A.8 wage function with interaction
wage = 3.1 + .41educ + .19exper ‐ .004exper2 + .007educexper
• Find the partial effect of exper on wage:wage/exper = .19 ‐ .008exper +.007educ
• At the initial values (exper0=5, educ0=12), the approximate change in wage is
wage/exper = 23.4 cents per hour
• Given exper0=5, educ0=12; and exper1=6, educ1=12, the exact change in wage is
wage = 23 cents per hour
I. Summation II. Linear III. Prop&Perc IV. SpecFunc V. Calculus 110
Basic Mathematical Tools . Intensive Course in Mathematics and Statistics . Chairat Aemkulwat V. Differential Calculus
Differential Calculus
• Minimizing and maximizing functions. Let f(x1, x2, …, xk) is the differentiable function of k variables.
• A necessary condition for x1*, x2*, …, xk* to optimize f over all possible values of xj is
• Notes1) All of the partial derivatives of f must be zero when they are evaluated at
the xh*.2) These are called the first order conditions.3) We hope to solve above equations for the xh*.
I. Summation II. Linear III. Prop&Perc IV. SpecFunc V. Calculus 111
Basic Mathematical Tools . Intensive Course in Mathematics and Statistics . Chairat Aemkulwat V. Differential Calculus
Problem A.9A.9 Suppose the yield of a certain crop (in bushels per acre)
is related to fertilizer amount (in pounds per acre) as
yield = 120 +.19
(i) Graph this relationship by plugging in several values for fertilizer. [ans.]
(ii) Describe how the shape of this relationship compares with a linear function between yield and fertilizer. [ans.]
fertilizer
Basic Mathematical Tools
I. Summation II. Linear III. Prop&Perc IV. SpecFunc V. Calculus 112
Basic Mathematical Tools . Intensive Course in Mathematics and Statistics . Chairat Aemkulwat V. Differential Calculus
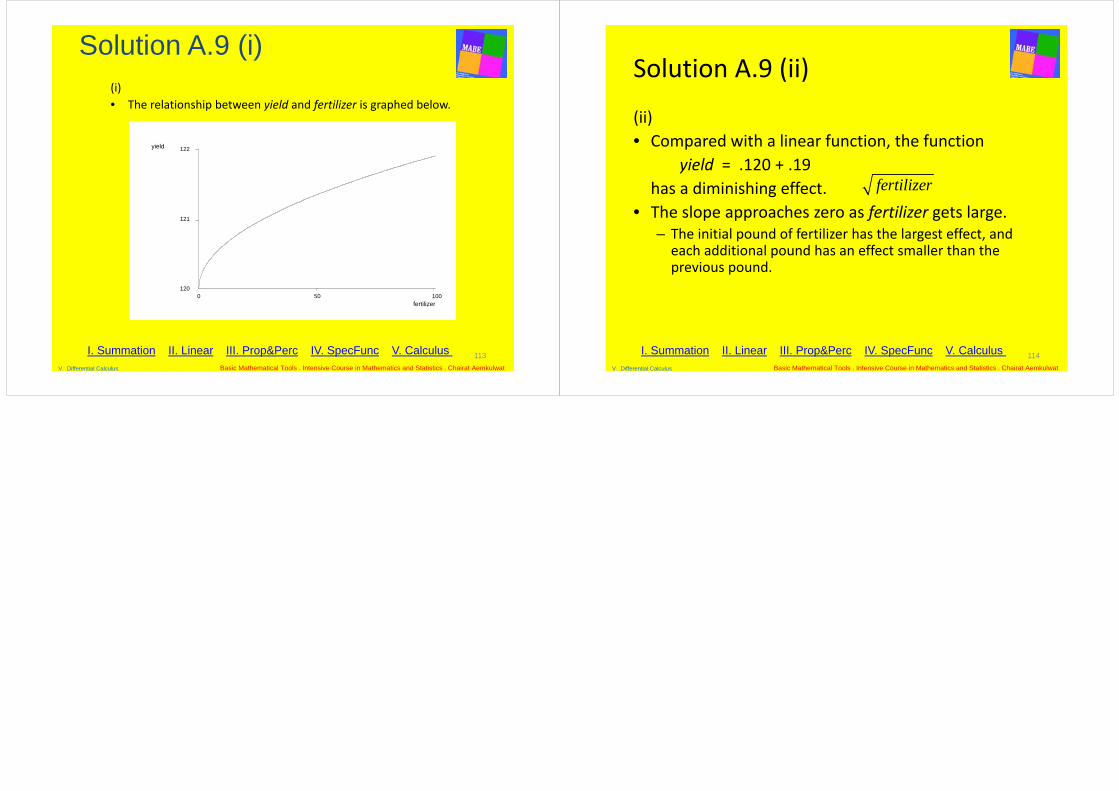
113
(i) • The relationship between yield and fertilizer is graphed below.
fertilizer0 50 100
120
121
yield 122
Solution A.9 (i)
I. Summation II. Linear III. Prop&Perc IV. SpecFunc V. Calculus Basic Mathematical Tools . Intensive Course in Mathematics and Statistics . Chairat Aemkulwat V. Differential Calculus
Solution A.9 (ii)
(ii) • Compared with a linear function, the function
yield = .120 + .19has a diminishing effect.
• The slope approaches zero as fertilizer gets large. – The initial pound of fertilizer has the largest effect, and each additional pound has an effect smaller than the previous pound.
114
fertilizer
I. Summation II. Linear III. Prop&Perc IV. SpecFunc V. Calculus Basic Mathematical Tools . Intensive Course in Mathematics and Statistics . Chairat Aemkulwat V. Differential Calculus