Embed Size (px)
Citation preview

- 103 -
APPENDIX A : EXAMINATION OF FLIGHT DATA RECORDER RACK
A.1 Background The flight data recorder (FDR) was dislodged from its rack, and was found on the floor of the rear fuselage of Airbus A340-541 A6-ERG (Figure A1). The FDR and associated rack were examined at the Australian Transport Safety Bureau laboratory.
Figure A1: FDR and rack as found on-site
A.2 Physical examination The FDR was normally secured in the rack with two attachment hooks on the front of the unit. The fasteners used for securing the FDR are known as positive self locking retainers, and work on a spring loaded mechanism (Figure A2). The knurled outer sections of the fastener are placed over the hooks on the front of the FDR, and then tightened via the internal nut to lock it in position. The spring forces the lower section to lock onto the top segment (closest to the rack) which cannot rotate around the rod. The fastener is loosened by pulling on one side of the outer casing, to release the locked mating faces, allowing for the threaded nut to be undone.

- 104 -
Figure A2: Schematic diagram showing the orientation of rack/FDR in aircraft
Flight data recorder
Examination of the FDR revealed it to be in a generally good condition. Evidence of minor dents and scratches were observed at a number of locations on the outer surfaces of the recorder. These markings were consistent with the FDR’s contact with surrounding objects following its separation from the rack.
The front hooks were in good condition, with no evidence of deformation or mechanical damage. Some paint had been removed in the area adjacent to the right attachment hook.
FDR rack
The following identification markings were observed on the label on the rear of the FDR rack;
TRAY PN 404-050L1DPX2-1
SN 2143
- 105 -
On-site photographs (Figure A3) indicated that the left fastener (as viewed from the front of the rack) was slightly less engaged than the right. On the left, a total of 18 threads were visible from the top of the threaded rod to the intersection point with the top nut, while 14 threads were visible on right.
Figure A3: On-site photograph showing the original position of the threaded fasteners following the occurrence
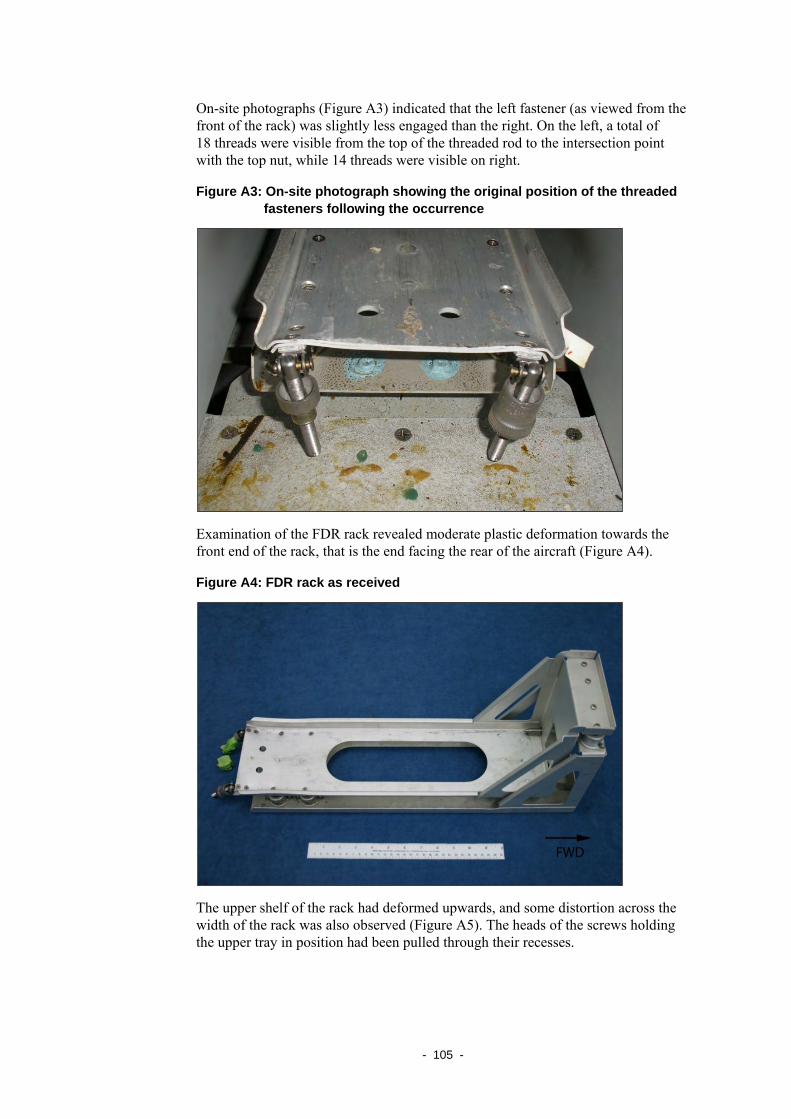
Examination of the FDR rack revealed moderate plastic deformation towards the front end of the rack, that is the end facing the rear of the aircraft (Figure A4).
Figure A4: FDR rack as received
The upper shelf of the rack had deformed upwards, and some distortion across the width of the rack was also observed (Figure A5). The heads of the screws holding the upper tray in position had been pulled through their recesses.

- 106 -
Figure A5: Magnified views of the damaged end of the FDR rack
Plastic deformation was also observed on the underside of the upper tray in the areas adjacent to the fasteners (Figure A6). Note the plastic deformation appeared to have affected the upper tray of the rack only, displacing it upwards and outwards. No contact marks were evident on the underside of the rack or fasteners.
Figure A6: Underside of rack showing deformation in the region adjacent to the fasteners
A number of dimensional checks were performed on the rack. The length and base plate width measurements were generally consistent with the engineering diagram provided by the manufacturer . The height of the upper tray was also measured in several locations, with a permanent deformation of approximately 14mm recorded towards the front. Width measurements were taken at several locations along the upper tray and a variation observed along the length.
The left fastener was damaged, with the bottom section (including the spring and the circlip used to hold the spring in place) no longer attached to the assembly. The bottom section of the fastener, and the circlip were found in the rear fuselage, however the spring was not recovered. Yellow paint was observed on the outside surface of the nut, along with some minor scoring damage. The circlip and associated components were examined visually, but no evidence of damage to identify the failure mechanism was observed.
The recorder was placed in the rack to assess the location of the fasteners in relation to the hooks. While the pins could be inserted into the rear face of the unit, the FDR
- 107 -
did not sit flush with the upper plate due to the permanent deformation of the rack. As a result, the right fastener could not be secured over the hook on the front of the FDR in the as-received position. The threaded nut of the left fastener appeared to be further from the hook; however it should be noted that a full examination of the effectiveness could not be performed, as the spring loaded mechanism was not recovered.
A.3 Maintenance The documentation provided by the operator indicated that the FDR was installed in A6-ERG on 17 September 2008, following overhaul on 13 September 2008. The overhaul notes stated that the underwater locator beacon battery was replaced at this time.
Instructions and procedures for the FDR had only one line referencing the fastening mechanism during installation. The installation instruction stated, “Lift the fasteners and tighten the knurled nuts until the DFDR is correctly attached”. The document had no reference to how tight the nuts should be fastened.
A.4 Conclusion The damage observed on the FDR rack was considered to be the result of the tailstrike event. The vertical forces from the impact, acting on the weight of the FDR unit, would have imparted sufficient load to the rack through the fasteners, to permanently deform the aluminium sheet of the upper tray. The upper tray exhibited permanent plastic deformation/buckling along the vertical axis, towards the fastener end, in the order of 14 millimetres.
With the upper tray deformed, the nuts would have been able to disconnect from the FDR hooks, leaving the unit unsecured. The deformation was observed to be equal on the left and right sides of the upper tray, which indicated that both fasteners were secured at the time of the occurrence.
While a part of the left fastener had been separated from the rack (the spring assembly), the reason for the failure could not be determined.


- 109 -
APPENDIX B : AIRCRAFT INFORMATION
B.1 General Figure B1: A340-541
Source: A340-500 FCOM Vol 1
The aircraft data at the commencement of the flight is listed in the following tabulated format.
Manufacturer Airbus
Model A340-541
Serial number 608
Registration A6-ERG
Year of manufacture 2004
Certificate of registration
Issuing authority General Civil Aviation Authority United Arab Emirates
Issue date 30 November 2004
Certificate of airworthiness
Issuing authority General Civil Aviation Authority United Arab Emirates
Issue date 30 November 2004
Period of validity 30 November 2008 to 29 November 2009
Total airframe hours/cycles 22,526/2,598
Last maintenance check 11 March 2009
Next scheduled maintenance due 29 March 2009
Maximum certified take-off weight 372,000 kg
Maximum certified landing weight 243,000 kg
Maximum certified zero fuel weight 230,000 kg

- 110 -
B.2 Engines The aircraft was equipped with four Rolls-Royce Trent 553-61 high-bypass turbofan engines. Each engine was certificated at 270 kN (60,000 lb) thrust and de-rated91F
1 to 248 kN (55,780 lb) thrust for operation on the A340-500 series aircraft.
B.3 Airworthiness The Aircraft Technical Log entry for the flight indicated that a pre-flight inspection was completed at Melbourne by the ground engineers at 2130 in preparation for the flight to Dubai. The log noted ‘nil defects’ from the previous flight. A label on the overhead panel indicated that the No 2 high frequency (HF) radio transmitter was inoperative.
B.4 Weight and balance The following information, from the ACARS loadsheet (Appendix H), was transmitted to the flight crew at 1053:31 UTC:
Dry operating weight92F
2 183,235 kg
Zero fuel weight 226,549 kg
Take-off fuel 135,300 kg
Take-off weight 361,849 kg
Fuel burn-off 125,300 kg
Landing weight 236,549 kg
The above weights were within the approved limits for the aircraft. The ACARS landing weight was for the intended landing at Dubai. The approximate landing weight at Melbourne following the accident was 280,000 kg.
Take-off centre of gravity was 27.1% of the mean aerodynamic chord93F
3, and was within the approved limits for the aircraft.
B.5 Overweight landing Although the aircraft landed at a weight in excess of the maximum landing weight of 243,000 kg, the operator reported that an overweight inspection was not required in accordance with the Aircraft Maintenance Manual, as the vertical loads during the landing were less than 0.6 g.
1 De-rating an engine restricts the thrust output to a level below the potential maximum for the
engine design. 2 The dry operating weight is the total weight of an aircraft for a specific type of operation,
excluding the usable fuel and traffic load (cargo, passengers and bags). 3 Mean aerodynamic chord. The chord of an imaginary wing of constant section that has the same
force vectors under all conditions as those of the actual wing. The centre of gravity location is normally referenced relative to the mean aerodynamic chord.

- 111 -
B.6 High lift devices The aircraft was equipped with leading edge slats (slats) and trailing edge flaps (flaps) to increase the lift from the wings. The aircraft also drooped the ailerons (lowered their trailing edge) when the flaps were lowered to further increase the lift while maintaining lateral control (Figure B2).
Figure B2: High lift devices
Source: A340-500 FCOM Vol 1
The various configurations of flap, slat and aileron droop that were available to the crew are shown in Table B1.
Table B1: High lift device configurations
Lever Position Slats Flaps Ailerons Indication
on ECAM Flight Phase
0 0 0 0
Cruise
1 21 0 0 1 Hold
17 10 1 + F Takeoff
2 24 17 10 2
Approach 24 22 10 2
Takeoff 3 24 29 10 3
Landing FULL 24 34 10 FULL
Source: A340-500 FCOM Vol 1
B.7 Crew rest facility The aircraft’s crew rest facility provided an area for flight and cabin crews to rest during long duration flights that was separate from the passenger cabin. Air conditioned and located under the rear cabin floor (Figure B3), the rest area was accessed via a lockable door and ladder. It contained 10 bunk beds (two for flight crew and eight for cabin crew) and two seats. The Flight Crew Operating Manual noted that the facility was to be unoccupied during taxi, takeoff and landing.
Ailerons
Slats
Flaps

- 112 -
Figure B3: Crew rest facility location
B.8 Flight Management and Guidance System
B.8.1 General
The aircraft’s Flight Management and Guidance System (FMGS) is an integrated electronic system within the aircraft that performs navigation and flight planning (vertical and lateral) functions. By integrating with other aircraft systems, the FMGS can be used to guide the aircraft along a pre-planned flight path and performance profile. The FMGS consists of the following items (as shown in Figure B4)
• two Flight Management and Guidance Computers (FMGC), not shown
• three Multipurpose Control and Display Units (MCDU)
• one Flight Control Unit (FCU)
• one Flight Management Source Selector.
The FMGS also interfaces with the crew through the thrust levers and the Electronic Flight Instrument System (EFIS).
The FMGS provides for ‘managed’ and ‘selected’ flight guidance modes. Managed guidance is a long-term mode and will guide the aircraft along the flight plan route and profile. Selected guidance is a short-term mode that guides the aircraft to parameters entered by the flight crew on the FCU.
Crew rest facility

- 113 -
Figure B4: Flight management and guidance system
Note: example shown for illustration only and does not contain data from the accident flight
B.8.2 Flight Management and Guidance Computer
The FMGC is a computer that contains databases of navigation waypoints, airline configuration data, aircraft performance models and magnetic variation. The flight crew build a flight plan (lateral route and vertical speed profiles) using the waypoints in the database and the FMGC calculates the targets (including speed, altitude and heading) required to guide the aircraft along that flight plan. The FMGC includes flight director, autopilot and autothrust functions used to guide the aircraft along the flight-planned route.
Incorporated into the FMGC are components for calculating and monitoring important flight envelope functions and a fault isolation and detection system. Included in the flight envelope functions is the calculation of characteristic speeds; such as the minimum flap retraction speed, the minimum slat retraction speed, and the green dot speed.
B.8.3 Multipurpose Control and Display Units
Three MCDUs are located in the centre pedestal between the flight crew and provide the primary interface between the FMGS and the flight crew. The MCDU is used by the flight crew to enter and review data from the FMGC, allowing them to build and select flight plans and to maintain other flight management functions.
MCDU 2
Flight Control Unit
MCDU 1
Captain First Officer
MCDU 3
Flight Management Source Selector
Thrust Levers
Primary flight
display (PFD)
PFD

- 114 -
The MCDU contains a screen for presenting FMGC information, a keypad, to allow the flight crew to navigate through the various pages and enter and modify data, and status annunciators (Figure B5).
Figure B5: Multipurpose Control and Display Unit
B.8.4 Determination and presentation of the take-off weight
The take-off weight for the aircraft is the zero fuel weight plus the block fuel. The flight crew enter the zero fuel weight (and zero fuel weight centre of gravity) and the block fuel, in tonnes, into the INIT B page (second page of the initialisation pages) on the MCDU (Figure B6). The FMGC then adds the figures and presents the take-off weight to the crew.
Figure B6: FMGS INIT B page
Note: example shown for illustration only and does not contain data from the accident flight
Entered by flight crew
Calculated by FMGS
Screen
Keypad
Annunciators Annunciators
Annunciators
Line Select Keys
Function and page keys
Line Select Keys

- 115 -
The aircraft’s current gross weight (GW) and gross weight centre of gravity position (GWCG) were calculated by the FMGS and permanently displayed on the electronic centralised aircraft monitor (ECAM) lower system display (Figure B7). These values changed as fuel was burnt off.
Figure B7: ECAM system display - Gross weight and centre of gravity
Note: example shown for illustration only and does not contain data from the accident flight
B.9 Take-off performance information The information used by the flight crew and aircraft during the takeoff includes data that is manually entered into the FMGS PERF [performance] TAKE OFF page by the flight crew, or that is calculated by the FMGS (Figure B8). The FMGS PERF TAKE OFF page is only available during the pre-departure phase.
Gross weight and centre of gravity position

- 116 -
Figure B8: FMGS PERF TAKE OFF page
Note: example shown for illustration only and does not contain data from the accident flight.
The flight crew enter the take-off reference speeds (V1, VR, and V2), runway number, take-off shift (if the takeoff is not from the beginning of the runway), the take-off flap setting, the trimmable horizontal stabiliser (THS) setting, the flexible take-off temperature and the engine out acceleration altitude.
The take-off reference speeds, minimum flap retraction speed (F), minimum slat retraction speed (S) and green dot speed (O) are also displayed on the speed tape on the primary flight display (Figure B9). There is also an automated audible message of V1 during the take-off run.
Figure B9: Take-off reference speeds displayed on PFD
Note: Example shown for illustration only and does not contain data from the accident flight.
PFD Speed Tape (during takeoff)
MCDU Screen PFD Speed Tape
(after takeoff)
Entered by flight crew
Calculated by FMGS
Entered by flight crew
- 117 -
B.9.2 Thrust Levers
The Flight Guidance component of the FMGS includes an autothrust feature. When the autothrust feature is engaged, the FMGC will determine the required thrust and send the appropriate thrust command to the engine control systems. The thrust levers provide an interface between the flight crew and the thrust management/engine control systems. The thrust levers are used to:
• manually select the engine thrust
• arm and activate the autothrust
• engage reverse thrust
• engage take-off and go-around mode.
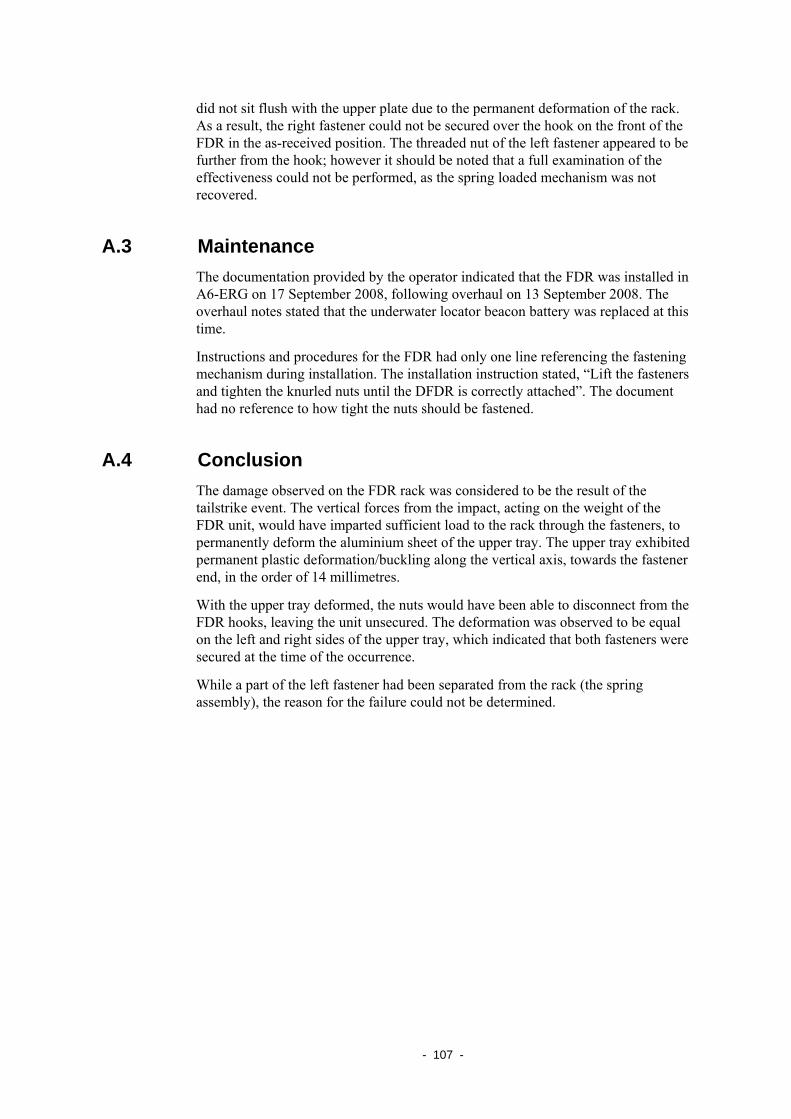
The thrust levers can be set at any position within their range (setting either the desired thrust or the maximum thrust delivered by the autothrottle), but the thrust lever quadrant also has four detent positions (Figure B10).
Figure B10: Thrust levers
B.10 Return to service Following the accident, the aircraft was inspected by engineers from the aircraft manufacturer and temporary repairs were carried out in Melbourne before it was ferried, unpressurised, to Toulouse, France. Permanent repairs were completed by the manufacturer and the aircraft returned to service in December 2009.
TO GA Sets maximum take-off / go-around thrust
FLX MCT Sets maximum continuous thrust (flexible thrust at takeoff)
CL Sets maximum climb thrust
IDLE Sets idle thrust


- 119 -
APPENDIX C : GRAPHICAL REPRESENTATION OF RECORDED FLIGHT DATA
Two plots of the relevant flight data from the digital aircraft condition monitoring system recorder (DAR) were prepared and are at Figure C11and C12.
Figure C11: Selected DAR parameters for the take-off roll

- 120 -
Figure C12: Selected DAR parameters for the 30 seconds surrounding lift-off

- 121 -
APPENDIX D : DETAILED REVIEW OF SIMILAR OCCURRENCES TO THE ACCIDENT
The investigation used the research from the Australian Transport Safety Bureau safety research report AR-2009-052 Take-off performance calculation and entry errors: A global perspective, and the Laboratoire d’Anthropologie Appliquée report Use of Erroneous Parameters at Takeoff to identify those events which shared multiple similarities with the accident.
Details of these events, including explanation of the event to provide the context of the error and subsequent use of erroneous data, are reproduced below.
McDonnell Douglas DC-8: March 1991
Location: New York, United States
In preparation for takeoff, the flight engineer calculated the take-off reference speeds (or V speeds) and horizontal stabiliser trim setting. The captain and first officer did not confirm the data. During the takeoff, the captain (the pilot flying) noticed that the force required to rotate was greater than normal and that at the V speeds calculated, the aircraft would not fly. In response, the captain rejected the takeoff. The crew were unable to stop the aircraft within the remaining runway length. The aircraft struck the instrument landing system equipment, the landing gear collapsed and all four engines were torn away.
It was determined that the flight engineer calculated the take-off performance data based on a take-off weight (TOW) of 242,000 lbs (109,771 kg) instead of 342,000 lbs (155,131 kg).
Boeing B767: August 1999
Location: Copenhagen, Denmark
The first officer entered the runway in use, temperature, and other flight details into the aircraft communication addressing and reporting system (ACARS). The TOW was not entered because the flight crew had not yet received the loadsheet. Once the loadsheet arrived, the captain entered the zero fuel weight (ZFW)94F
95 into the FMS. The first officer then entered the ZFW into the aircraft TOW prompt in ACARS. The calculations were made at the mainframe computer and sent back via ACARS to the flight crew.
The relief pilot noticed that the mean aerodynamic chord (MAC) was 7.0%, which did not appear to be correct. According to the loadsheet, the MAC was 19.0%. The first officer amended the ACARS accordingly. The captain entered the V speeds into the FMS.
During the takeoff, the tailskid pan came into contact with the runway, the aircraft failed to become airborne and the captain rejected the takeoff.
95 The zero fuel weight is the total weight of an aircraft for a specific type of operation including the
traffic load (cargo, passengers and bags), but excluding the usable fuel.

- 122 -
It was determined that the first officer had limited experience on the B767 but had previously flown the McDonnell Douglas MD-80, where the ZFW was the take-off input parameter. The flight crew did check the performance data, however their attention was drawn to the MAC and not the TOW and V speeds. The layout of the ACARS print out could have resulted in a misinterpretation of the TOW, with the crew possibly believing they had ‘found the value they were looking for’ but at the wrong location. In addition, the flight crew’s normal procedures may have been interrupted by the relief pilot observing the MAC value discrepancy which, in turn, may have stopped them from checking the remaining take-off data.
Airbus A330: June 2002
Location: Frankfurt, Germany
While preparing the aircraft for the flight, the crew received the initial load figures from the ACARS and entered the TOW (222,700 kg) and V speeds into the MCDU. Shortly after, the crew received the final load figures with a revised TOW of 221,200 kg. During pushback or taxi, the pilot not flying inserted the final load figures and V speeds into the MCDU. When doing so, a V1 speed of 126 kts was entered instead of 156 kts. The crew did not detect the error and during takeoff, aircraft rotation was initiated at 133 kts. Due to over rotation the aircraft sustained a tailstrike.
Boeing B747: March 2003
Location: Johannesburg, South Africa
During flight preparations, the crew were distracted by a problem with the auxiliary power unit. They were also advised by ATC to expect a 45-minute delay, subsequently reduced to a 30-minute delay.
The flight engineer received the aircraft loadsheet and inadvertently entered the ZFW into the handheld performance computer instead of the TOW. The resultant V speeds were transferred onto the take-off data card. The captain checked the V speeds because the first officer, who normally conducted this check, was busy. Both pilots set the speed bugs on their respective airspeed indicators. During the takeoff, the captain sensed that the aircraft was nose heavy. In response, rotation was delayed by 15 kts. After becoming airborne, the captain felt the aircraft was sluggish and requested more thrust. The crew were notified by ATC that the aircraft had sustained a tailstrike.
Boeing B747: March 2003
Location: Auckland, New Zealand
During early pre-departure preparations, the flight crew determined that additional 7,700 kg fuel would be required to that already on the aircraft. When they boarded the aircraft about 15 minutes prior to departing, they realised that only 4,500 kg had been uploaded. They requested the additional fuel be loaded and obtained a revised loadsheet. The final loadsheet was delivered to the flight crew about the same time the aircraft was scheduled to depart.
The captain called out the ZFW and TOW figures and the stabiliser trim setting for the first officer to write on the take-off data card. During this transcription, the first

- 123 -
officer recorded the TOW as 247,400 kg instead of the actual TOW of 347,400 kg. The first officer normally added the ZFW to the fuel figure to verify the TOW, however on this flight he either added them incorrectly or did not get a chance to add them together during this stage of the pre-departure phase of flight.
The first officer used the TOW of 247,400 kg to obtain the V speeds for takeoff and then passed the take-off data card to the captain. The captain entered the ZFW from the loadsheet into the flight management computer (FMC). The FMC automatically added the ZFW to the onboard fuel weight to display a gross weight. The captain verified that the FMC-calculated gross weight corresponded to the TOW from the loadsheet (which it did). He then entered the V speeds from the take-off data card, replacing those automatically calculated by the FMC.
Normally the third relief pilot would check the take-off data card, however he was distracted by explaining the delay to the station manager and did not complete this check. During the takeoff, the aircraft sustained a tailstrike.
The investigation determined that, in addition to the errors noted above, the flight crew were pressured to hurry their preparations due to the delay with refuelling; that the captain had only recently converted to the B747 from the A340, which had a VR speed range which matched the incorrect VR speed calculated for the accident flight; there were no specific duties for the relief, or third, pilot; and the FMC did not challenge the discrepancies between the V speeds it had calculated and what the pilot entered, despite the difference being in the order of 20 kts.
Boeing B747: October 2003
Location: Tokyo, Japan
The aircraft was being prepared for departure as a cargo flight, with a captain, first officer training as a first officer, a flight engineer and the first officer. Upon arriving at the aircraft, the flight engineer noted the loading was behind schedule. The flight engineer obtained the weight and balance manifest from the load planner and prepared the take-off data card. When obtaining the V speeds from the take-off performance charts, he inadvertently used a TOW of 550,000 lbs (249, 480 kg) instead of the actual TOW of 745,000 lbs (337, 932 kg). Due to the flight being behind schedule, the flight engineer did not verify the accuracy of the figures, because this would have delayed the flight further.
During the takeoff, the aircraft did not respond during rotation and sustained a tailstrike. The investigation determined that while the flight engineer made the error, the captain, training pilot and first officer did not suspect or crosscheck the figures. The training pilot stated the weight always used in the simulator was 530,000 lbs and that, in addition, he had previously used kilograms as a unit of measurement and did not immediately detect the mistake in the numbers.
Airbus A340: July 2004
Location: Paris, France
During pre-departure preparation, the flight crew were given an expected TOW figure of 268,600 kg, which they rounded to 270,000 kg and used to submit a take-off data calculation request from Flight Operations via ACARS. The resultant take-off performance parameters were verified by the flight crew.
- 124 -
Shortly after, the flight crew were advised that the actual TOW was 5,200 kg less than the expected, resulting in a TOW of 264,800 kg. As the change was greater than 5,000 kg, the crew were required to submit a new ACARS request. When they entered the revised TOW into the flight management and guidance system (FMGS) interface, a weight of 165,000 kg, which was close to the ZFW, was inadvertently entered. The resultant V speeds and FLEX temperature values were entered into the FMGS. The captain confirmed the parameters, however, he did not detect the error because he read the MTOW from the ACARS printout instead of the TOW.
The pilot flying reported that, during the takeoff the aircraft felt heavy and noticed the V2 speed was slower than the lowest selectable speed. The aircraft sustained a tailstrike on rotation.
The investigation noted that the FMGS accepted the lower V speeds without challenge and did not compare the V2 figure with the lowest selectable speed, despite both being known before takeoff. In addition, the layout of the ACARS values may have led to confusion between TOW and ZFW and the take-off briefing procedures did not require a comparison between the TOW and speed characteristics.
Boeing B747: October 2004
Location: Halifax, Canada
The aircraft was to be operated as a cargo flight with two captains, one first officer, two flight engineers, a loadmaster and a ground engineer. During takeoff the rear fuselage came in contact with the runway momentarily and then again with greater force. Despite becoming airborne past the end of the runway, the aircraft struck an earth embankment supporting the instrument landing system antenna, and then the terrain, resulting in the aircraft being destroyed by impact forces and a subsequent fire. All seven of the crew members received fatal injuries.
The investigation determined that the take-off data calculated in the Boeing Laptop Tool (BLT) was nearly identical to the take-off data from the previous airport and not what was required for the takeoff from Halifax. It was likely that an independent check of the take-off data card was not performed by the crew as required by procedures, nor was a gross error check conducted in accordance with procedures. In addition, the crew were at a low level of performance due to fatigue which degraded their ability to detect the error and the dark take-off environment contributed to a loss of situational awareness.
Airbus A340: August 2005
Location: Shanghai-Pudong, China
About 30 minutes prior to the scheduled departure, the crew received the preliminary load information via the ACARS with a ZFW of 179,110 kg and a TOW of 259,514 kg. The captain was temporarily away from the cockpit so pre-departure preparations had been delegated to the second officer. When entering the data into the ACARS take-off data calculation (TODC) computer, the ZFW was entered instead of the TOW. Soon after, the final loadsheet was received and the TODC was not updated.
When the captain arrived, the majority of the pre-flight preparations had been completed. The captain checked the loadsheet and flight plan and the second officer

- 125 -
read out the TODC speeds to the captain, who entered them into the MCDU. The captain observed the difference between the V1 and VR speeds were small, but no further action was taken. The captain believed the last line of defence was incorporated into the ACARS TODC, similar to that previously experienced when he had flown the Boeing 767.
The captain and first officer verified the take-off data calculations prior to departing the gate and while taxiing, but the error was not detected. During the takeoff, the aircraft did not lift off as expected, the fuselage contacted the runway and take-off/go-around (TO/GA) thrust was applied by the first officer at the same time the aircraft became airborne.
The investigation determined that the second officer did not have immediate access to the flight plan to confirm the aircraft’s TOW and the captain had been temporarily pre-occupied. The ACARS TODC computer required input of the TOW, while the MCDU required input of the ZFW. All crewmembers were previously qualified on the Boeing 767 aircraft where the TOW was similar to the ZFW of an A340. The data was entered into the TODC computer using a third MCDU which was not visible to the other two crewmembers. The captain and first officer were also qualified on the Airbus A330, where the V speeds and thrust settings are lower than that of the A340. The V speeds were verbally provided to the pilot flying; the printed calculations were not shown. The ACARS TODC software accepted unrealistic low weights and mismatched V speeds without challenge. The duties of the second officer were not clearly defined by the airline.
Boeing B747: December 2006
Location: Paris, France
When determining the take-off performance parameters for the flight, the captain provided the first officer with a ZFW from the weight and balance sheet, which he increased by 1.6 tonnes, and the TOW. The first officer then entered the ZFW into the FMS. The TOW was entered into the BLT and the take-off performance parameters calculated. The first officer handed the BLT to the captain to crosscheck and when the captain handed it back, the first officer unintentionally turned off the laptop, erasing the data. At the same time, the captain was dealing with a mechanic in the cockpit regarding a systems failure.
When the new data was being entered into the BLT, the captain inadvertently called out the ZFW instead of the TOW, resulting in a weight of 242,300 kg being entered into the BLT as TOW, instead of 341,300 kg. The captain entered the resultant data into the FMS, replacing the values automatically calculated by the FMS. The first officer verified the BLT and FMS values were identical. The captain queried the reduced thrust value with the first officer, who justified these figures by the fact the QNH (barometric air pressure) was high and ambient air temperature was low.
The crew did not detect the aircraft’s acceleration was lower than normal; however at the V1 speed they noted a reasonable amount of runway remaining and they began to doubt the V speeds, resulting in the captain delaying rotation. When rotation was initiated by the first officer, he felt the aircraft was heavy and pitched up slowly, followed by activation of the aircraft’s stick shaker. He reduced the pitch up command and applied full thrust.
The investigation determined that the captain was dealing with a hydraulic failure at the time the performance calculations were taking place and after the data was

- 126 -
entered into the FMS, there was no requirement for a comparison to be made with the TOW. There was also no requirement to compare data entered into the BLT with the data entered into the FMS.
Airbus A330: October 2008
Location: Montego Bay, Jamaica
During pre-departure preparations, the crew were unable to locate the aircraft’s performance manual. The captain contacted the flight dispatch department via telephone to request that the take-off performance data be calculated and relayed the relevant information. The resultant figures were read back to the captain, the telephone was then passed to the first officer and this process repeated as a check. The figures were then entered into the FMGS.
During takeoff, the aircraft appeared to accelerate as normal, however the aircraft did not ‘feel right’ at rotation, so the captain applied TO/GA thrust and the aircraft became airborne and climbed away.
While the exact source of the error could not be identified, the investigation determined that a TOW of 120,800 kg was used by the dispatcher instead of 210,183 kg, resulting in V speeds which were too low for the aircraft’s actual weight. The procedure for calculating and verifying the calculations was not completely carried out, as a second dispatcher was not used to verify what was entered by the first dispatcher.
Boeing 767: December 2008
Location: Manchester, United Kingdom
During calculation of the take-off performance parameters, the crew inadvertently entered the ZFW instead of the TOW. The calculated V speeds and thrust setting were then entered into the FMC. The aircraft left the gate about 15 minutes behind schedule.
While taxiing, it began to rain heavily and the engine anti-ice was required to be on. Accordingly, the first officer re-calculated the V speeds and informed the captain there was no change. The crew’s attention was focussed on the taxi, due to works in progress on some taxiways.
During takeoff, the captain noted the aircraft had sluggish acceleration and delayed the V1 call. Upon rotation the tailskid message illuminated, indicated the aircraft had sustained a tailstrike.
The investigation determined that the captain had flown a number of sectors in an empty Boeing 767 prior to the accident flight, consequently the slow V speeds did not trigger an alert to him. The crew were distracted by the works in progress on the taxiways and the delay in departing led to a time pressure on the crew.

- 127 -
APPENDIX E : OPERATOR’S PROCEDURES FOR CALCULATING TAKE-OFF PERFORMANCE

- 128 -

- 129 -

- 130 -

- 131 -

- 133 -
APPENDIX F : PREVIOUS RECOMMENDATIONS RELATING TO THE MONITORING OF TAKE-OFF PERFORMANCE
F.1 Introduction There have been a number of accidents and incidents involving civil transport aircraft relating to the monitoring of take-off performance.
The occurrences summarised below represent some of the accidents involving high capacity aircraft and the associated safety recommendations from investigation agencies relating to the monitoring of take-off performance.
This appendix also discusses the current status of the research and development of take-off performance monitoring systems (TOPMS) by various organisations.
F.2 Occurrences and recommendations
McDonnell Douglas DC-8: November 197095F
1
Location: Anchorage, United States (US)
On 27 November 1970 a McDonnell Douglas DC-8-63F, registered N4909C, with 10 crew and 219 passengers, overran runway 06R at while taking off at Anchorage International Airport, Alaska. The overrun was determined to be due to high frictional drag caused by all main landing wheels not rotating. This resulted in 46 passengers and one cabin crew member sustaining fatal injuries, and the destruction of the aircraft.
As a result of this accident, on 20 January 1971 the US National Transportation Safety Board (NTSB) issued the following recommendation to the US Federal Aviation Administration (FAA):
Federal Aviation Administration determine and implement takeoff procedures that will provide the flight crew with time or distance reference to enable him to make appropriate judgment with regard to the airplane's acceleration rate to the V1 speed, particularly for critical length runways, and for runway surface conditions that may impede acceleration [Recommendation A-71-003].
On 2 February 1973, the NTSB further evaluated the recommendation and decided that it had been superseded by recommendations issued on 3 January 1972 relating to an accident during takeoff at San Francisco in 1971 (see below).
1 National Transportation Safety Board, 1972. Aircraft Accident Report, Capitol International
Airways, Inc., DC-8-63F, N4909C, Anchorage, Alaska, November 27, 1970 (Report No. NTSB-AAR-72-12).

- 134 -
Boeing 747: July 197196F
2
Location: San Francisco, US
On 30 July 1971 a Boeing 747-121, registered N747PA, with 19 crew and 199 passengers, collided with the Approach Light System (ALS) structure while taking off from runway 01R at San Francisco International Airport, California. The flight crew continued the takeoff and, after an in-flight inspection for damage, dumped fuel and returned for a landing at San Francisco. The aircraft had been dispatched for a departure from a closed runway and, upon changing to an open runway, the crew did not recompute the proper reference speeds for takeoff under the existing conditions. Two passengers were injured during the impact with the ALS and eight others sustained serious back injuries during the evacuation after the landing.
On 3 January 1972, the NTSB issued five recommendations to the FAA during the investigation into this accident including the following two recommendations relating to flight crew awareness of take-off performance:
3. require the installation of runway distance markers at all civil airports where air carrier aircraft are authorized to operate [Recommendation A-72-003].
4. require the use of takeoff procedures which will provide the flight crew with time and distance reference to associate with acceleration to v1 speed [Recommendation A-72-004].
The NTSB closed both recommendations on 16 September 1977 with the FAA response to recommendation No 3 being notated ‘unacceptable action’.
McDonnell Douglas DC-10: September 198097F
3
Location: London Heathrow, United Kingdom (UK)
On 16 September 1980 a McDonnell Douglas DC-10-30, N83NA, with 17 crew and 220 passengers, sustained a tyre burst during the take-off run on runway 28R at London Heathrow Airport. The tyre burst was observed by the occupants of a runway clearance vehicle parked to one side of the runway, who transmitted the information to the control tower. This message was overheard by the aircraft commander who, as a result, rejected the takeoff at 168 kts, which was 8 kts above the calculated V1 speed of 160 kts.
The crew brought the aircraft to a stop about 110 m before the end of the runway. A successful evacuation was carried out using the escape slides on the left side, although one passenger suffered a broken leg. Two localised fires, which had developed in the centre and right wheel bogies, were extinguished by the Airport Fire Service.
2 National Transportation Safety Board, 1972. Aircraft Accident Report, Pan American World
Airways, Inc., Boeing 747, N747PA, San Francisco, California, July 30, 1971 (Report No. NTSB-AAR-72-17).
3 Accidents Investigation Branch, Department of Trade, 1982. Report on the Accident to McDonnell Douglas DC10-30 N83NA at London Heathrow Airport, on 16 September 1980 (Aircraft Accident Report No. 2/82).

- 135 -
The then UK Accidents Investigation Branch (AIB) issued the following recommendation in the investigation report dated 12 July 1982:
It is recommended that:
Development of a ‘take-off performance monitor’, with a cockpit display, be undertaken as a matter of urgency [Recommendation 4.15].
The UK Civil Aviation Authority responses to AAIB recommendation received up to 31 December 1989 were published in Civil Aviation Publication (CAP) 593 Air Accidents Investigation Branch (AAIB) Recommendations: Progress Report 1990. The progress report stated in relation to the above recommendation:
A reliable ‘take-off performance monitor’ in the cockpit would undoubtedly ease the pilots task during the ground run and the CAA would welcome the introduction of such an instrument. Efforts to develop an acceptable monitor have been underway for a number of years but, unfortunately, it appears that it may take some time before one is produced.
Boeing 737: January 198298F
4
Location: Washington, US
On 13 January 1982 a Boeing 737-222, registered N62AF, with five crew and 74 passengers on board, impacted the 14th Street Bridge and descended into the Potomac River after a takeoff from runway 36 at Washington National Airport, Washington, D.C. The aircraft came to rest in the water beyond the western side of the bridge about 0.75 NM (1.4 km) from the departure end of runway 36. Four passengers and one crewmember survived the accident. Four people in vehicles on the bridge sustained fatal injuries.
The NTSB determined that the accident resulted from the flight crew’s failure to use engine anti-ice during ground operation and takeoff, their decision to take off with snow/ice on the airfoil surfaces of the aircraft, and the captain’s failure to reject the takeoff during the early stage when his attention was called to anomalous engine instrument readings.
While the NTSB did not issue any specific recommendations in relation to take-off performance monitoring, it reiterated Safety Recommendation A-72-003 (see above) regarding the installation of runway distance markers.
As a result of this accident and another accident ten days later at Boston (see below) a Joint Aviation/Industry Landing and Takeoff Performance Task Group was formed to examine the concept of a take-off performance monitoring system.
4 National Transportation Safety Board, 1982. Aircraft Accident Report, Air Florida, Inc., Boeing
737-222, N62AF, Collision with 14th Street Bridge, near Washington National Airport, Washington, D.C., January 13, 1982 (Report No. NTSB-AAR-82-8).

- 136 -
McDonnell Douglas DC-10: January 198299F
5
Location: Boston, US
On 23 January 1982 a McDonnell Douglas DC-10-30CF, registered N113WA, with 12 crew and 200 passengers on board, touched down 2,800 ft (853 m) beyond the displaced threshold of runway 15R at Boston-Logan International Airport. During the landing roll the aircraft veered to avoid the approach light pier at the departure end of the runway and slid into the shallow water of Boston Harbour. The nose section separated from the forward fuselage as the aircraft dropped from the shore embankment. The NTSB determined that the accident resulted from the minimal braking effectiveness on the ice-covered runway. Two passengers were not found and were presumed dead. The other people on board evacuated the aircraft safely but with some injuries.
On 23 December 1982, the NTSB issued 18 recommendations to the FAA as a result of the investigation into this accident including the following recommendation relating to flight crew awareness of take-off performance:
Convene an industry-government group which includes the National Aeronautics and Space Administration to define a program for the development of a reliable takeoff acceleration monitoring system [Recommendation A-82-169]100F
6
The FAA requested the Society of Automotive Engineers (SAE) to form an ad hoc committee to establish the requirements for a take-off performance monitoring system. In October 1987 the Society released SAE Aerospace Standard AS 8044, Takeoff Performance Monitor (TOPM) System, Airplane, Minimum Performance Standard for, which established a standard for TOPM systems, including the technical requirements and sampling and methods of test or inspection.
The NTSB noted the release of the SAE standard and evaluated the FAA advice of 5 May 1987 regarding the SAE activities. The NTSB advised the FAA on 1 April 1988 that it was closing recommendation A-82-169 with the FAA response being considered as ‘Acceptable Action’.
5 National Transportation Safety Board, 1985. Aircraft Accident Report, World Airways, Inc., Flight
30H, McDonnell Douglas DC-10-30CF, N113WA, Boston-Logan International Airport, Boston, Massachusetts, January 23, 1982 (Report No. NTSB/AAR-85/06). This report superseded an earlier report into the accident issued by the NTSB in 1982 (Report No. NTSB-AAR-82-15).
6 Recommendation A-82-169 was also discussed in NTSB’s report into the issue of aircraft performance in adverse airport conditions; refer National Transportation Safety Board, 1983. Special Investigation Report, Large Airplane Operations on Contaminated Runways (NTSB/SIR-83/02).

- 137 -
McDonnell Douglas MD-82: March 1994101F
7
Location: New York, US
On 2 March 1994, a McDonnell Douglas MD-82, registered N18835 with 6 crew and 110 passengers on board, sustained substantial damage following a rejected takeoff roll on runway 13 at LaGuardia Airport, Flushing, New York. The aircraft overran the runway and came to rest on a dyke. There were no fatalities or serious injuries but one flight crew member and 29 passengers sustained minor injuries during the evacuation of the aircraft. The NTSB determined that the accident resulted from the flight crew’s failure to turn on the pitot/static heat system and their untimely response to anomalous airspeed indications with the consequent rejection of the takeoff at an actual speed of 5 kts above V1.
The NTSB issued an investigation report into the accident on 14 March 1996. The report contained six recommendations to the FAA including the following three recommendations relating to the monitoring of take-off performance:
Require manufacturers of airplanes operated by air carriers to publish and distribute to operators specific elapsed times to target speeds (given normal acceleration, the times to given airspeeds) [Recommendation A-95-18].
Require that the elapsed times to target speeds be incorporated as part of the takeoff performance data available to air carrier flightcrews [Recommendation A-95-19].
Require that air carrier rejected takeoff training include elapsed time to target speed takeoff performance data [Recommendation A-95-20].
The FAA advised the NTSB on 28 February 1996 that it ‘ ... continues to believe that requiring a time/speed check during takeoff may result in unnecessary and potentially hazardous rejected takeoffs and increase flightcrew workload ... It [FAA] plans no further action on these recommendations’.
The NTSB closed the three recommendations on 14 May 1996 with the FAA response to the recommendations being considered as ‘unacceptable action’. The Board stated that it ‘ ... continues to believe that until a takeoff performance system is developed, the use of time/speed checks would add an additional level of safety to takeoff performance without adding additional monitoring burdens to flightcrews’.
7 National Transportation Safety Board, 1995. Aircraft Accident Report, Runway Overrun
Following Rejected Takeoff, Continental Airlines Flight 795, McDonnell Douglas MD-82, N18835, LaGuardia Airport, Flushing, New York, March 2, 1994 (Report No. NTSB/AAR-95/01).

- 138 -
Boeing 747: October 2004102F
8
Location: Halifax, Canada
On 14 October 2004, a Boeing 747-244SF, registered 9G-MKJ, attempted to take off from runway 24 at the Halifax International Airport. The aircraft overshot the end of the runway for a distance of 825 ft (251 m), became airborne for 325 ft, then struck an earth mound. The aircraft’s tail section broke away from the fuselage, and the aircraft remained in the air for another 1,200 ft before it struck terrain and burst into flames. The aircraft was destroyed by impact forces and a severe post-crash fire. All seven crew members were fatally injured.
The Transportation Safety Board of Canada (TSB) found that the accident resulted from a flight crew member not recognising that the laptop computer used to calculate the take-off performance data contained an incorrect aircraft weight from the previous flight. This incorrect weight was used to calculate performance data for the takeoff from Halifax, which resulted in incorrect take-off speeds and thrust settings being generated by the laptop computer. The crew then used the incorrect speeds and thrust settings which were too low to enable the aircraft to take off safely for the actual weight of the aircraft.
The Canadian TSB issued the following recommendation in the investigation report released on 29 June 2006:
Therefore, the Board recommends that:
The Department of Transport, in conjunction with the International Civil Aviation Organization, the Federal Aviation Administration, the European Aviation Safety Agency, and other regulatory organizations, establish a requirement for transport category aircraft to be equipped with a take-off performance monitoring system that would provide flight crews with an accurate and timely indication of inadequate take-off performance [Recommendation A06-07].
In 2007 the Canadian regulator, Transport Canada, formed a project team to examine the issue of a take-off performance monitoring system (TOPMS). In February 2009 Transport Canada tasked the National Research Council (NRC) of Canada to conduct a study into the background, technology, issues and certificatability associated with TOPMS.
The NRC released a report on the technology status of TOPMS in April 2009103F
9. The report contained a proposal for a flight research and evaluation project to be conducted in the Council’s Dassault Falcon 20 aircraft to ascertain the certificatability of current TOPM technology. This research and evaluation project did not proceed due to lack of funding and no further progress has been made regarding the TOPMS issue at the time of publishing this investigation report.
On 9 March 2011 the TSB noted that:
8 Transportation Safety Board of Canada, 2006. Aviation Investigation Report, Reduced Power at
Take-off and Collision with Terrain, MK Airlines Limited, Boeing 747-244SF, 9G-MKJ, Halifax International Airport, Nova Scotia, 14 October 2004 (Report No. A04H0004).
9 Brown, A. P., and Abbasi, H., 2009. Takeoff performance monitoring systems, technology, certificatability and operability status, Flight Research Laboratory, Institute for Aerospace Research National Research Council, Canada.

- 139 -
The Board is concerned that TC [Transport Canada] has ended its research into TOPM technology. While the Board understands the complexity associated with such an undertaking, the fact that similar occurrences happen on a regular basis means that a mitigation strategy has to be developed. Because this is a global issue, the Board strongly encourages TC to continue its leadership in TOPM research but to also approach other agencies that could contribute resources.
However, at this date, the TC has stopped all work on TPMS [take-off performance monitoring system] technology and will only revisit this issue when a certifiable product is developed. This action plan will not substantially reduce or eliminate the safety deficiency.
Therefore, the Board assesses TC’s response as Unsatisfactory
Airbus A330: October 2008104F
10
Location: Montego Bay, Jamaica
On 28 October 2008, an Airbus A330-243, registered G-OJMC, with 13 crew and 318 passengers, was taking off from runway 07 at Montego Bay/Sangster International Airport, Jamaica. Following the first officer’s call to ‘rotate’, the captain pulled back on the sidestick and pitched the aircraft to about 10° nose up but the aircraft did not become airborne as expected. The captain then selected TO/GA power and the aircraft became airborne, climbed away safely, and the flight continued to the scheduled destination.
The UK AAIB investigation into the incident found that incorrect speeds were used for the takeoff due to an error in the take-off performance calculations. While the exact source of the error could not be determined, the investigation found deficiencies in the operator’s procedures for calculating performance using their computerised performance tool.
The AAIB report into the incident, released in November 2009, stated that:
A system which actively monitors takeoff performance can add an additional safety net, independent of data input by flight crews. However, despite being identified as having a positive impact, little or no progress has been made in the development of takeoff performance monitoring systems in recent years. Such a system would require a high level of maturity before being introduced to avoid unnecessary and potentially unsafe crew actions.
As a consequence, the following recommendations are made:
Safety Recommendation 2009-080
It is recommended that the European Aviation Safety Agency develop a specification for an aircraft takeoff performance monitoring system which provides a timely alert to flight crews when achieved takeoff performance is inadequate for given aircraft configurations and airfield conditions.
Safety Recommendation 2009-081
10 Air Accidents Investigation Branch (AAIB), Department for Transport, 2009. AAIB Bulletin
Report on serious incident to Airbus A330-243, G-OJMC at Sangster International Airport, Montego Bay, Jamaica on 28 October 2008 (AAIB Bulletin No. 11/2009).

- 140 -
It is recommended that the European Aviation Safety Agency establish a requirement for transport category aircraft to be equipped with a takeoff performance monitoring system which provides a timely alert to flight crews when achieved takeoff performance is inadequate for given aircraft configurations and airfield conditions.
On 7 July and 27 September 2011, the European Aviation Safety Agency (EASA) responded to the above recommendations by advising the AAIB that the Agency considered the feasibility of a take-off performance monitoring system had not been demonstrated and that the Agency did not intend to establish a certification specification ‘at this time’. The Agency also advised that the issue:
...has been proposed to be added to the European Organization for Civil Aviation Equipment (EUROCAE) Technical Work Programme. It is expected that a working group of experts will review the state of the art on the feasibility of such system. If it appears that technology is available, then the working group would propose a standard.
Airbus A340: December 2009105F
11
Location: London Heathrow, UK
On 12 December 2009, an Airbus A340-642, registered G-VYOU, with 16 crew and 282 passengers, was taking off from London Heathrow Airport, UK. During the take-off roll the handling pilot ‘ ... noticed that the acceleration was slightly lower than it should have been but did not consider it particularly abnormal’. The aircraft was also slow to rotate and the initial climb performance was degraded with a low rate of climb at between 500 and 600 ft/min.
The UK AAIB investigation into the incident found that:
During pre-flight preparations, the estimated landing weight was used to calculate takeoff performance rather than the takeoff weight. The error was not detected and the aircraft took off using values for VR and V2 that were significantly lower than those required for the actual takeoff weight.
The AAIB investigation report referred to the two recommendations regarding take-off performance monitoring systems that were issued following the G-OJMC incident at Montego Bay in 2008. The AAIB stated that:
At the time of writing [June 2010], the AAIB had not received a detailed response from the EASA [European Aviation Safety Agency] regarding the recommendations but their nature is such that it will probably be a considerable time before a solution is operational. In the meantime, the Green Dot gross error check should provide a way to highlight that an error has been made in time for it to be investigated before departure.
As noted in the previous sub-section, in 2011 the AAIB received responses from EASA regarding the G-OJMC investigation recommendations.
11 Air Accidents Investigation Branch (AAIB), Department for Transport, 2010. AAIB Bulletin
Report on serious incident to Airbus A340-642, G-VYOU at London Heathrow Airport, on 12 December 2009 (AAIB Bulletin No. 7/2010).
- 141 -
F.3 Take-off performance monitoring systems The concept of onboard take-off performance monitoring systems (TOPMS) has been proposed since the 1950s106F
12 and the system has been the subject of over 30 US patents during the period from 1956 to 2007.
Several organisations, including the US National Aeronautics and Space Administration,107F
13 Cranfield University in the UK,108F
14 the Dutch National Aerospace Laboratory (NLR), the University of Saskatchewan, Canada109F
15 and Risø National Laboratory, Denmark110F
16 have conducted research into TOPMS including the development and testing of prototypes. At the time of publication of this investigation report, there was no commercially available system for use in civil transport aircraft.
12 Morris, G. J., and Lina, L. J., 1954. Description and preliminary flight investigation of an
instrument for detecting subnormal acceleration during take-off, National Advisory Committee for Aeronautics, Technical Note 3252, Washington, D.C.
13 Middleton, D. B., Srivatsan, R., and Person, L. H., 1992. Simulator Evaluation of Displays for a Revised Takeoff Performance Monitoring System, National Aeronautics and Space Administration, Technical Paper 3270, Washington, D.C.
14 Zammit-Mangion, D., and Eshelby, M., 2008. Design, Integration, and Preliminary Assessment of a Takeoff Monitor Display, Journal of Aircraft Vol. 45, No. 2, 371-380.
15 Brown, A. P., and Abbasi, H., 2009. Takeoff performance monitoring systems, technology, certificatability and operability status, Flight Research Laboratory, Institute for Aerospace Research National Research Council, Canada.
16 Bove, T, and Andersen, H. B., 2002. The effect of an advisory system on pilots’ go/no-go decision during take-off, Reliability Engineering and System Safety 75, 179-191.


- 143 -
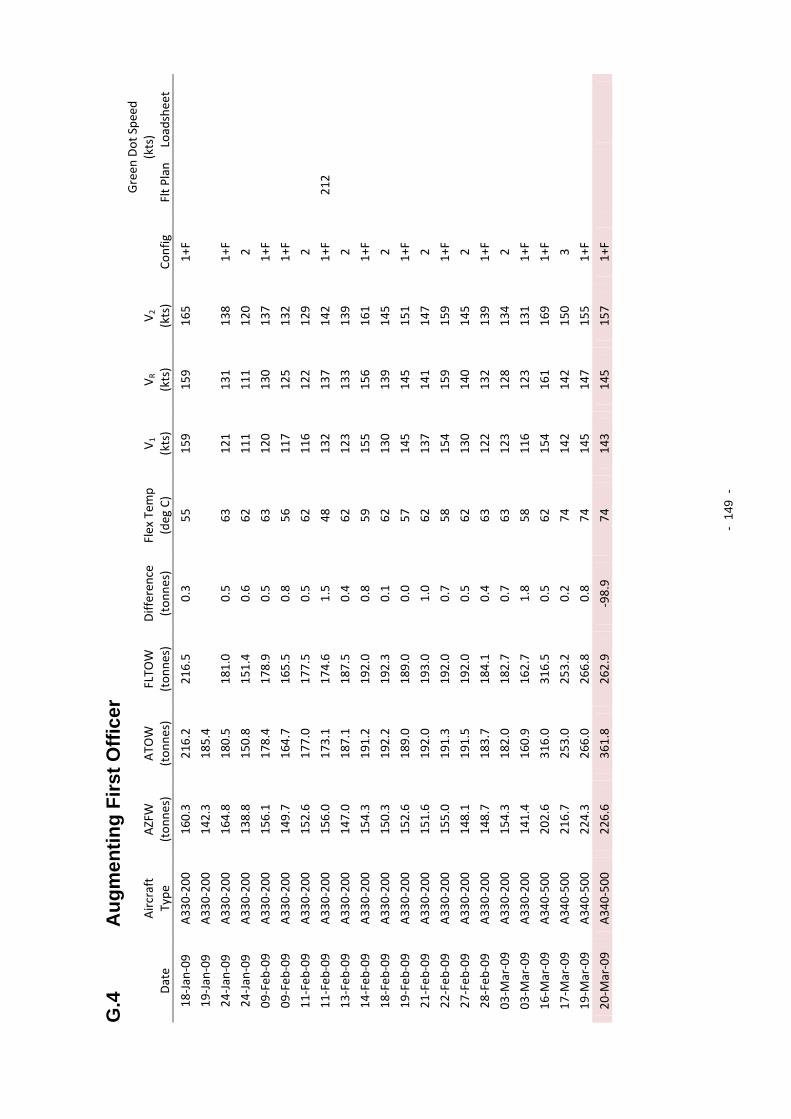
APPENDIX G : PREVIOUS OPERATIONAL DATA FOR THE FLIGHT CREW
Copies of the flight plans and loadsheets for all four flight crew for the 2 months prior to the accident were obtained from the operator. The following is a summary of the relevant performance parameters from those documents.
The flight plans provided were the ‘Master’ copies for the flights because the respective captain’s copies were not archived by the operator.
Legend for tables
Date The date the flight was commenced.
Aircraft type A330-243, A340-313K, or A340-541 aircraft.
AZFW Aircraft zero fuel weight, in tonnes, from the loadsheet and rounded to nearest 100 kg (0.1 tonne).
ATOW Actual take-off weight, in tonnes, from the loadsheet and rounded to nearest 100 kg (0.1 tonne).
FLTOW Flex limiting take-off weight, in tonnes, from the flight plan.
Difference FLTOW minus ATOW, in tonnes. Calculated by the investigation.
Flex Temp Flexible take-off temperature, in °C, from the flight plan.
V1 V1, in kts, from the flight plan.
VR VR, in kts, from the flight plan.
V2 V2, in kts, from the flight plan.
Config Flap configuration from the flight plan.
Green dot speed The green dot speed, in kts, that was identified on the flight plan and/or the loadsheet. Note that there was no consistency in how or where this was marked.


- 14
5 -
G.1
C
apta
in
Dat
e A
ircr
aft
Type
A
ZFW
(t
onne
s)
ATO
W
(ton
nes)
FL
TOW
(t
onne
s)
Diff
eren
ce
(ton
nes)
Fl
ex T
emp
(deg
C)
V 1
(kts
) V R
(k
ts)
V 2
(kts
) Co
nfig
Gre
en D
ot S
peed
(k
ts)
Flt P
lan
L
oads
heet
21-J
an-0
9 A
340-
500
216.
2 33
5.7
335.
8 0.
1 54
15
3 16
1 17
0 3
254
22
-Jan
-09
A34
0-50
0 20
9.2
243.
9 24
4.0
0.1
74
142
142
149
3 21
8
24-J
an-0
9 A
340-
500
222.
8 25
7.4
258.
0 0.
6 75
14
4 14
4 15
2 3
223
223
25-J
an-0
9 A
340-
500
219.
0 35
0.5
351.
5 1.
0 48
15
1 16
2 17
3 3
260
01
-Feb
-09
A34
0-30
0 15
3.3
211.
7 21
2.4
0.7
55
134
139
146
1+F
242
04
-Feb
-09
A34
0-30
0 16
7.2
255.
6 25
6.2
0.6
39
142
150
157
2
11
-Feb
-09
A34
0-30
0 15
8.8
225.
6 22
6.5
0.9
54
150
153
158
1+F
25
1
12-F
eb-0
9 A
340-
300
166.
3 21
9.3
220.
0 0.
7 53
13
8 14
4 15
5 1+
F
19
-Feb
-09
A34
0-50
0 21
1.5
333.
7 33
4.2
0.5
52
150
156
167
3 25
4
21-F
eb-0
9 A
340-
500
225.
7 36
0.0
360.
4 0.
4 45
15
1 16
2 17
3 3
264
25
-Feb
-09
A34
0-30
0 16
7.6
215.
5 21
6.0
0.5
54
134
140
147
1+F
245
244
27-F
eb-0
9 A
340-
300
175.
8 21
9.1
(1)
03-M
ar-0
9 A
340-
500
202.
4 31
4.3
315.
0 0.
7 60
14
9 15
6 16
5 2
05-M
ar-0
9 A
340-
500
227.
8 36
1.1
(1)
10-M
ar-0
9 A
340-
300
163.
6 22
2.7
223.
0 0.
3 50
13
6 14
1 14
8 1+
F 24
9
12-M
ar-0
9 A
340-
300
159.
7 22
5.1
225.
5 0.
4 36
14
4 15
4 16
0 1+
F 25
0
18-M
ar-0
9 A
340-
500
202.
5 31
7.5
318.
6 1.
1 52
14
8 15
2 16
3 3
20-M
ar-0
9 A
340-
500
226.
6 36
1.8
262.
9 -9
8.9
74
143
145
157
1+F
(1)
Flig
ht p
lan
not s
uppl
ied,
arc
hive
d co
py n
ot lo
cate
d.

- 14
6 -
G.2
Fi
rst O
ffice
r
Dat
e A
ircr
aft
Type
A
ZFW
(t
onne
s)
ATO
W
(ton
nes)
FL
TOW
(t
onne
s)
Diff
eren
ce
(ton
nes)
Fl
ex T
emp
(deg
C)
V 1
(kts
) V R
(k
ts)
V 2
(kts
) Co
nfig
Gre
en D
ot S
peed
(k
ts)
Flt P
lan
L
oads
heet
19-J
an-0
9 A
330-
200
152.
4 19
7.0
198.
0 1.
0 63
14
8 14
8 15
4 1+
F
20
-Jan
-09
A33
0-20
0 13
6.1
169.
0 16
9.0
0.0
60
118
127
133
1+F
26-J
an-0
9 A
330-
200
151.
3 18
9.5
190.
2 0.
7 63
12
7 13
7 14
3 2
221
221
27-J
an-0
9 A
330-
200
139.
9 17
0.6
171.
4 0.
8 62
11
5 12
0 12
7 2
210
209
30-J
an-0
9 A
340-
300
170.
3 23
8.9
240.
0 1.
1 49
15
2 15
5 16
1 1+
F
31
-Jan
-09
A34
0-30
0 17
0.9
220.
8 22
1.5
0.7
54
144
151
157
1+F
09-F
eb-0
9 A
330-
200
152.
3 19
0.1
190.
2 0.
1 63
12
7 13
8 14
3 2
10-F
eb-0
9 A
330-
200
141.
6 16
9.0
169.
1 0.
1 62
11
3 11
5 12
2 3
20-F
eb-0
9 A
340-
500
218.
5 34
6.8
348.
6 1.
8 50
15
7 16
4 17
2 3
259
22
-Feb
-09
A34
0-50
0 19
5.4
313.
0 31
4.0
1.0
57
148
153
162
3
03
-Mar
-09
A34
0-50
0 21
2.2
269.
3 27
0.4
1.1
74
144
146
155
1+F
04-M
ar-0
9 A
340-
500
206.
0 25
1.7
252.
8 1.
1 68
14
1 14
3 15
2 1+
F
09
-Mar
-09
A34
0-50
0 20
2.8
322.
3 32
3.7
1.4
58
155
161
169
3
11
-Mar
-09
A34
0-50
0 22
4.3
356.
9 35
7.4
0.5
45
150
160
172
3
15
-Mar
-09
A33
0-20
0 15
1.2
180.
8 (1
)
15
-Mar
-09
A33
0-20
0 14
6.6
165.
2 (1
)
18
-Mar
-09
A34
0-50
0 20
2.5
317.
5 31
8.6
1.1
52
148
152
163
3
20
-Mar
-09
A34
0-50
0 22
6.6
361.
8 26
2.9
-98.
9 74
14
3 14
5 15
7 1+
F
(1
) Fl
ight
pla
n no
t sup
plie
d, a
rchi
ved
copy
not
loca
ted.

- 14
7 -
G.3
A
ugm
entin
g C
apta
in
Dat
e A
ircr
aft
Type
A
ZFW
(t
onne
s)
ATO
W
(ton
nes)
FL
TOW
(t
onne
s)
Diff
eren
ce
(ton
nes)
Fl
ex T
emp
(deg
C)
V 1
(kts
) V R
(k
ts)
V 2
(kts
) Co
nfig
Gre
en D
ot S
peed
(k
ts)
Flt P
lan
L
oads
heet
19-J
an-0
9 A
330-
200
141.
6 18
5.3
186.
0 0.
7 63
12
3 13
4 14
0 1+
F
218
20-J
an-0
9 A
330-
200
151.
0 17
7.3
178.
0 0.
7 59
12
0 13
0 13
7 1+
F
213
21-J
an-0
9 A
330-
200
149.
4 16
3.8
163.
9 0.
1 63
11
3 11
6 12
4 2
20
5
22-J
an-0
9 A
330-
200
141.
8 15
1.2
152.
0 0.
8 63
11
1 11
1 12
0 2
19
8
23-J
an-0
9 A
330-
200
160.
9 20
2.1
202.
7 0.
6 62
15
4 15
4 16
0 1+
F
228
23-J
an-0
9 A
330-
200
149.
5 17
0.0
170.
8 0.
8 63
11
8 12
6 13
4 1+
F
209
26-J
an-0
9 A
330-
200
155.
8 17
2.2
172.
8 0.
6 63
11
6 12
0 12
7 2
27-J
an-0
9 A
330-
200
144.
9 15
8.4
159.
0 0.
6 62
11
2 11
3 12
2 2
20
2
30-J
an-0
9 A
330-
200
160.
1 17
9.8
180.
0 0.
2 63
12
1 13
1 13
7 1+
F 21
5 21
5
31-J
an-0
9 A
330-
200
131.
7 14
7.0
148.
0 1.
0 63
11
1 11
1 12
0 2
196
03
-Feb
-09
A34
0-30
0 15
7.0
226.
4 22
6.5
0.1
53
144
151
156
1+F
251
251
04-F
eb-0
9 A
340-
300
142.
4 15
6.2
156.
5 0.
3 54
12
9 13
0 13
9 2
209
209
04-F
eb-0
9 A
340-
300
146.
0 19
4.6
195.
0 0.
4 54
13
0 13
1 13
8 3
232
232
05-F
eb-0
9 A
340-
300
173.
7 23
0.0
230.
5 0.
5 48
13
7 14
3 15
0 1+
F 25
3 25
3
10-F
eb-0
9 A
330-
200
167.
9 20
0.3
201.
0 0.
7 62
15
1 15
1 15
7 1+
F 22
8 22
7
10-F
eb-0
9 A
330-
200
165.
1 19
4.8
195.
3 0.
5 55
13
9 13
9 14
5 2
224
224
13-F
eb-0
9 A
330-
200
151.
5 18
7.9
188.
0 0.
1 63
13
3 13
5 14
1 2
220
13
-Feb
-09
A33
0-20
0 15
2.7
174.
4 17
5.0
0.6
62
116
121
128
2 21
2 21
2
16-F
eb-0
9 A
330-
200
155.
6 19
5.4
196.
1 0.
7 58
13
7 13
7 14
3 2
22
4
16-F
eb-0
9 A
330-
200
144.
3 16
6.7
167.
2 0.
5 61
11
7 12
4 13
2 1+
F
207
19-F
eb-0
9 A
340-
300
168.
0 23
9.1
240.
2 1.
1 47
14
8 15
3 15
9 1+
F 25
9 25
8
20-F
eb-0
9 A
330-
200
138.
9 15
1.9
153.
0 1.
1 62
11
4 11
7 12
7 1+
F 19
9 19
8
20-F
eb-0
9 A
330-
200
140.
3 18
2.8
184.
4 1.
6 62
12
1 13
0 13
6 2
218
217
21-F
eb-0
9 A
340-
300
161.
3 21
3.9
214.
0 0.
1 54
13
4 14
0 14
7 1+
F 24
3 24
3
24-F
eb-0
9 A
330-
200
146.
2 17
3.6
173.
6 0.
0 62
11
6 12
1 12
7 2
211
211

- 14
8 -
Dat
e A
ircr
aft
Type
A
ZFW
(t
onne
s)
ATO
W
(ton
nes)
FL
TOW
(t
onne
s)
Diff
eren
ce
(ton
nes)
Fl
ex T
emp
(deg
C)
V 1
(kts
) V R
(k
ts)
V 2
(kts
) Co
nfig
Gre
en D
ot S
peed
(k
ts)
Flt P
lan
L
oads
heet
25-F
eb-0
9 A
330-
200
149.
3 17
3.5
175.
0 1.
5 62
11
6 12
1 12
8 2
211
211
26-F
eb-0
9 A
330-
200
161.
6 17
8.4
179.
5 1.
1 62
11
8 12
5 13
1 2
214
214
27-F
eb-0
9 A
330-
200
142.
2 15
7.8
158.
4 0.
6 62
11
2 11
3 12
2 2
202
01
-Mar
-09
A33
0-20
0 15
8.7
201.
0 20
1.8
0.8
60
151
154
159
2
228
01-M
ar-0
9 A
330-
200
161.
3 18
9.1
189.
8 0.
7 61
13
8 13
8 14
4 2
22
0
09-M
ar-0
9 A
340-
500
197.
2 29
5.6
296.
3 0.
7 66
14
9 15
5 16
4 1+
F
238
10-M
ar-0
9 A
340-
500
216.
4 31
2.6
313.
0 0.
4 50
14
7 15
1 16
1 3
16-M
ar-0
9 A
340-
500
202.
6 31
6.0
316.
5 0.
5 62
15
4 16
1 16
9 1+
F
17
-Mar
-09
A34
0-50
0 21
6.7
253.
0 25
3.2
0.2
74
142
142
150
3
19
-Mar
-09
A34
0-50
0 22
4.3
266.
0 26
6.8
0.8
74
145
147
155
1+F
20-M
ar-0
9 A
340-
500
226.
6 36
1.8
262.
9 -9
8.9
74
143
145
157
1+F
- 14
9 -
G.4
A
ugm
entin
g Fi
rst O
ffice
r
Dat
e A
ircr
aft
Type
A
ZFW
(t
onne
s)
ATO
W
(ton
nes)
FL
TOW
(t
onne
s)
Diff
eren
ce
(ton
nes)
Fl
ex T
emp
(deg
C)
V 1
(kts
) V R
(kts
) V 2
(k
ts)
Conf
ig
Gre
en D
ot S
peed
(k
ts)
Flt P
lan
L
oads
heet
18-J
an-0
9 A
330-
200
160.
3 21
6.2
216.
5 0.
3 55
15
9 15
9 16
5 1+
F
19
-Jan
-09
A33
0-20
0 14
2.3
185.
4
24-J
an-0
9 A
330-
200
164.
8 18
0.5
181.
0 0.
5 63
12
1 13
1 13
8 1+
F
24
-Jan
-09
A33
0-20
0 13
8.8
150.
8 15
1.4
0.6
62
111
111
120
2
09
-Feb
-09
A33
0-20
0 15
6.1
178.
4 17
8.9
0.5
63
120
130
137
1+F
09-F
eb-0
9 A
330-
200
149.
7 16
4.7
165.
5 0.
8 56
11
7 12
5 13
2 1+
F
11
-Feb
-09
A33
0-20
0 15
2.6
177.
0 17
7.5
0.5
62
116
122
129
2
11
-Feb
-09
A33
0-20
0 15
6.0
173.
1 17
4.6
1.5
48
132
137
142
1+F
212
13
-Feb
-09
A33
0-20
0 14
7.0
187.
1 18
7.5
0.4
62
123
133
139
2
14
-Feb
-09
A33
0-20
0 15
4.3
191.
2 19
2.0
0.8
59
155
156
161
1+F
18-F
eb-0
9 A
330-
200
150.
3 19
2.2
192.
3 0.
1 62
13
0 13
9 14
5 2
19-F
eb-0
9 A
330-
200
152.
6 18
9.0
189.
0 0.
0 57
14
5 14
5 15
1 1+
F
21
-Feb
-09
A33
0-20
0 15
1.6
192.
0 19
3.0
1.0
62
137
141
147
2
22
-Feb
-09
A33
0-20
0 15
5.0
191.
3 19
2.0
0.7
58
154
159
159
1+F
27-F
eb-0
9 A
330-
200
148.
1 19
1.5
192.
0 0.
5 62
13
0 14
0 14
5 2
28-F
eb-0
9 A
330-
200
148.
7 18
3.7
184.
1 0.
4 63
12
2 13
2 13
9 1+
F
03
-Mar
-09
A33
0-20
0 15
4.3
182.
0 18
2.7
0.7
63
123
128
134
2
03
-Mar
-09
A33
0-20
0 14
1.4
160.
9 16
2.7
1.8
58
116
123
131
1+F
16-M
ar-0
9 A
340-
500
202.
6 31
6.0
316.
5 0.
5 62
15
4 16
1 16
9 1+
F
17
-Mar
-09
A34
0-50
0 21
6.7
253.
0 25
3.2
0.2
74
142
142
150
3
19
-Mar
-09
A34
0-50
0 22
4.3
266.
0 26
6.8
0.8
74
145
147
155
1+F
20-M
ar-0
9 A
340-
500
226.
6 36
1.8
262.
9 -9
8.9
74
143
145
157
1+F


- 151 -
APPENDIX H : OPERATIONAL FLIGHT DOCUMENTS The following are copies of the first page of the ‘Master’ flight plan and the Aircraft Communications Addressing and Reporting System (ACARS) loadsheet from the occurrence flight. The annotations on the documents were made by the flight crew during the flight.
H.1 ‘Master’ flight plan The flight plan contained information on the planned route. The take-off performance calculations were transcribed onto page ‘1’ during the pre-departure preparation.
Captain’s name Captain’s signature

- 152 -
H.2 Loadsheet The loadsheet was sent to the aircraft via the ACARS and was printed on the aircraft printer by the flight crew. The captain annotated the loadsheet with the time that he received it.
Captain’s signature Staff number

- 153 -
APPENDIX I : SOURCES AND SUBMISSIONS
Sources of Information The main sources of information during the investigation included the:
• flight crew and cabin of the aircraft
• aircraft operator
• aircraft manufacturer
• flight data, cockpit voice and digital aircraft condition monitoring system recorders
• airport operator.
Submissions Under Part 4, Division 2 (Investigation Reports), Section 26 of the Transport Safety Investigation Act 2003 (the Act), the Australian Transport Safety Bureau (ATSB) may provide a draft report, on a confidential basis, to any person whom the ATSB considers appropriate. Section 26 (1) (a) of the Act allows a person receiving a draft report to make submissions to the ATSB about the draft report.
A draft of this report was provided to the flight crew, the United Arab Emirates General Civil Aviation Authority (GCAA), the aircraft operator, the French Bureau d’Enquêtes et d’Analyses pour la sécurité de l’aviation civile (BEA), the aircraft manufacturer, the European Aviation Safety Agency (EASA), the United States (US) National Transportation Safety Board, the US Federal Aviation Administration, the Civil Aviation Safety Authority and Airservices Australia (Airservices). Submissions were received from the flight crew, the operator, the GCAA, EASA, the BEA, the aircraft manufacturer and Airservices. The submissions were reviewed and, where considered appropriate, the text of the report was amended accordingly.

ATSB TRANSPORT SAFETY REPORT Aviation Occurrence Investigation
AO-2009-012Final
Tailstrike and runway overrunMelbourne Airport, Victoria
20 March 2009A6-ERG
Airbus A340-541
Tailstrike and runway overrun - M
elbourne Airport, V
ictoria, 20 March 2009
A6-ER
G A
irbus A340-541