Embed Size (px)
Citation preview

55
FAA Aerospace Forecast Fiscal Years 2010–2030
APPENDIX A ALTERNATIvE FORECAST SCENARIOS
Uncertainty abounds in all industries, but especially in the commercial air travel industry. Increasingly, the FAA has been requested to provide alternative scenarios to their baseline forecasts. These requests come from policy makers, private industry, associations, and consultants. This year, the FAA has responded to its customers, fully understanding that more information, not less, will help stakeholders to better prepare for the future.
To create the baseline forecast, economic assumptions for both U.S. and international regions from Global Insight’s October 2009 forecast were used to generate enplanements, mainline real yield, and nominal yield. The baseline forecast of passenger trip length (an input variable used to forecast mainline real yield) was derived from recent historical trends and analyst judgment. To develop the alternative scenarios, assumptions from the optimistic and pessimistic scenarios contained in the September 2009 edition of Global Insight’s U.S. long range forecast were used. Inputs from these scenarios were substituted for the baseline scenario inputs to create a “high” and “low” traffic, capacity, and yield forecast. The baseline forecast trip length was adjusted in the optimistic and pessimistic scenarios based on the movement of oil prices in Global Insight’s alternative forecasts relative to the baseline forecast.
International passengers and traffic are primarily determined by GDP Thus, the baseline forecast of GDP for both the U.S. and international regions is modified using the optimistic and pessimistic forecasts of GDP described above in order to create a high and low case.
SCENARIO ASSUMPTIONSFAA’s baseline forecast assumes that the economy recovers from the current downturn and suffers no major mishaps such as large oil price shocks, swings in macroeconomic policy, or financial meltdowns. In the alternative scenarios, the economy is postulated to proceed smoothly as well, however at a different pace than projected under the baseline forecast. Projections for economic growth in Global Insight’s alternative scenarios are rooted in demographics. In Global Insight’s optimistic forecast scenario, population grows more rapidly than in the baseline due to higher net immigration. The reverse is true for the pessimistic forecast; population grows more slowly than the baseline forecast due to slower net immigration.
FAA’s high case forecast uses Global Insight’s optimistic forecast. The optimistic forecast is characterized by lower inflation and faster growth in the labor force and capital stock than in the baseline forecast. In this scenario productivity growth is higher and potential output climbs more rapidly, with GDP (used as an input variable to the FAA’s base, high and low forecasts of enplanements) growing about 0.7 percentage points quicker per year than the baseline forecast. Conversely, FAA’s low case forecast is based on Global Insight’s pessimistic scenario. In the low case forecast, inflation runs higher and the labor force and capital stock growth run lower than in the baseline. As a result, the U.S. economy grows 0.7 percentage points slower per year than in the baseline due to slower productivity and lower potential output growth.
FAA Aerospace Forecast Fiscal Years 2010–2030
56
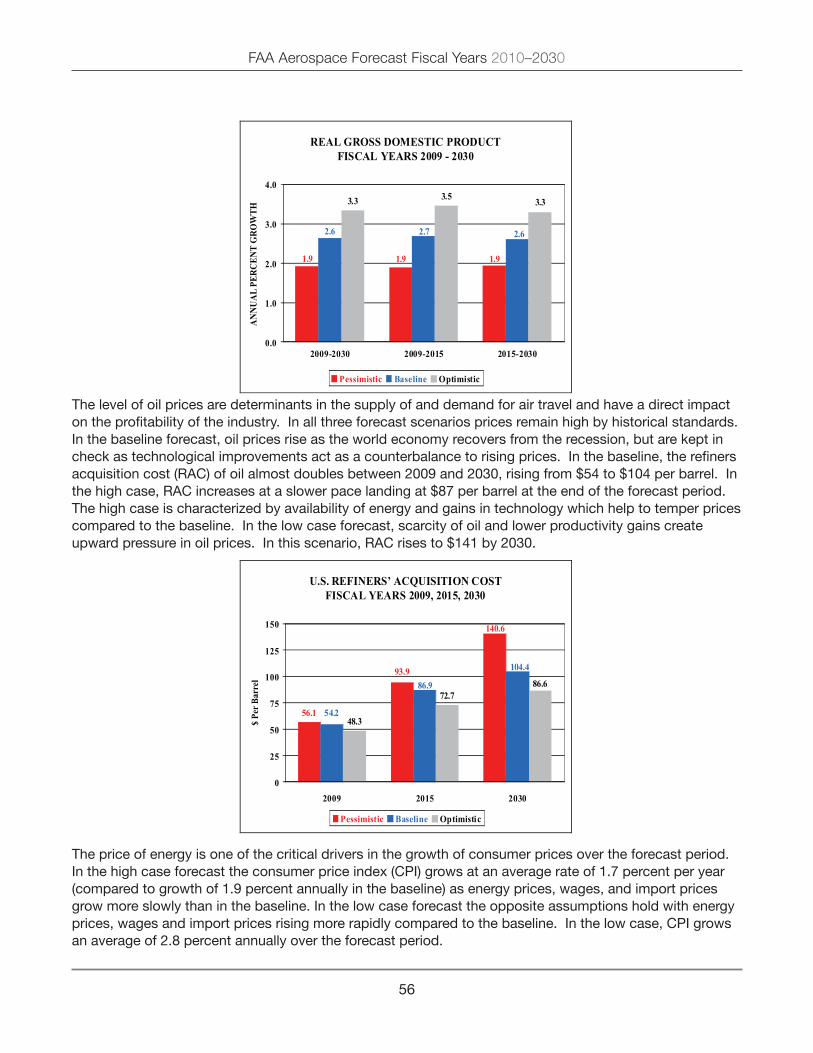
The level of oil prices are determinants in the supply of and demand for air travel and have a direct impact on the profitability of the industry. In all three forecast scenarios prices remain high by historical standards. In the baseline forecast, oil prices rise as the world economy recovers from the recession, but are kept in check as technological improvements act as a counterbalance to rising prices. In the baseline, the refiners acquisition cost (RAC) of oil almost doubles between 2009 and 2030, rising from $54 to $104 per barrel. In the high case, RAC increases at a slower pace landing at $87 per barrel at the end of the forecast period. The high case is characterized by availability of energy and gains in technology which help to temper prices compared to the baseline. In the low case forecast, scarcity of oil and lower productivity gains create upward pressure in oil prices. In this scenario, RAC rises to $141 by 2030.
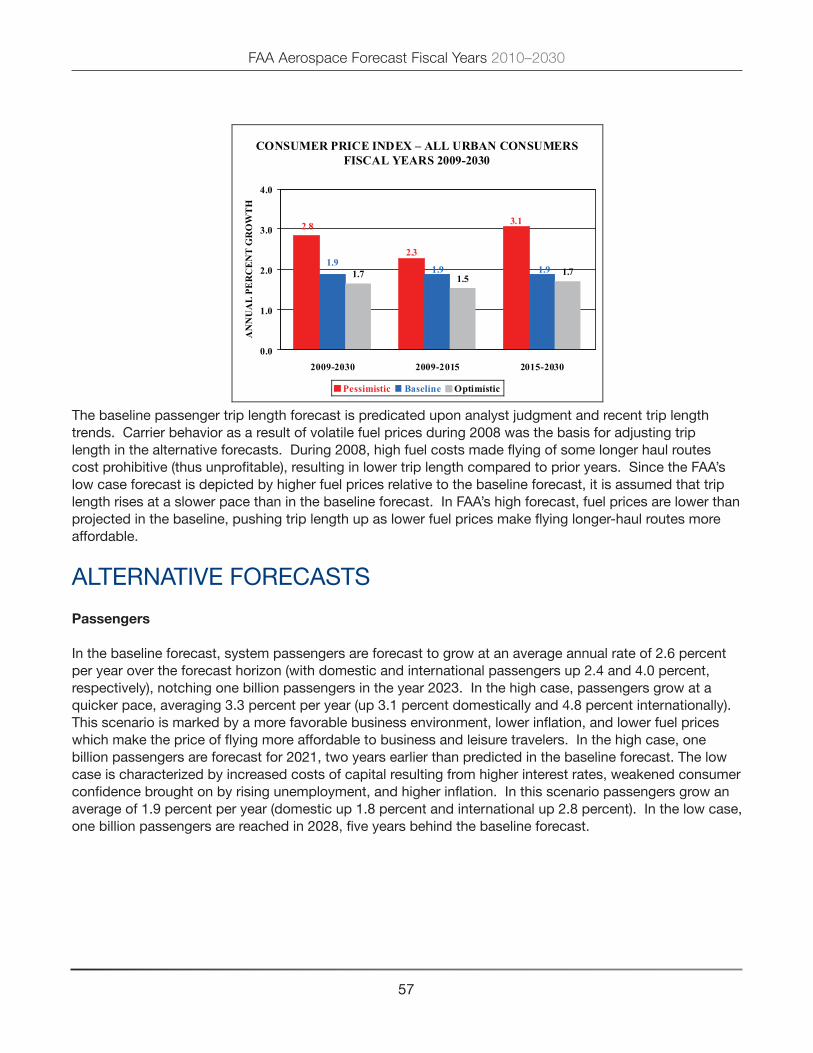
The price of energy is one of the critical drivers in the growth of consumer prices over the forecast period. In the high case forecast the consumer price index (CPI) grows at an average rate of 1.7 percent per year (compared to growth of 1.9 percent annually in the baseline) as energy prices, wages, and import prices grow more slowly than in the baseline. In the low case forecast the opposite assumptions hold with energy prices, wages and import prices rising more rapidly compared to the baseline. In the low case, CPI grows an average of 2.8 percent annually over the forecast period.
REAL GROSS DOMESTIC PRODUCT FISCAL YEARS 2009 - 2030
1.9
3.3 3.5 3.3
1.9 1.9
2.72.6 2.6
0.0
1.0
2.0
3.0
4.0
2009-2030 2009-2015 2015-2030
Pessimistic Baseline Optimistic
ANNU
AL P
ERCE
NT G
ROW
TH
U.S. REFINERS’ ACQUISITION COST FISCAL YEARS 2009, 2015, 2030
56.148.3
72.786.6
93.9
140.6
86.9
54.2
104.4
0
25
50
75
100
125
150
2009 2015 2030
Pessimistic Baseline Optimistic
$ Pe
r Bar
rel
57
FAA Aerospace Forecast Fiscal Years 2010–2030
The baseline passenger trip length forecast is predicated upon analyst judgment and recent trip length trends. Carrier behavior as a result of volatile fuel prices during 2008 was the basis for adjusting trip length in the alternative forecasts. During 2008, high fuel costs made flying of some longer haul routes cost prohibitive (thus unprofitable), resulting in lower trip length compared to prior years. Since the FAA’s low case forecast is depicted by higher fuel prices relative to the baseline forecast, it is assumed that trip length rises at a slower pace than in the baseline forecast. In FAA’s high forecast, fuel prices are lower than projected in the baseline, pushing trip length up as lower fuel prices make flying longer-haul routes more affordable.
ALTERNATIvE FORECASTS
passengers
In the baseline forecast, system passengers are forecast to grow at an average annual rate of 2.6 percent per year over the forecast horizon (with domestic and international passengers up 2.4 and 4.0 percent, respectively), notching one billion passengers in the year 2023. In the high case, passengers grow at a quicker pace, averaging 3.3 percent per year (up 3.1 percent domestically and 4.8 percent internationally). This scenario is marked by a more favorable business environment, lower inflation, and lower fuel prices which make the price of flying more affordable to business and leisure travelers. In the high case, one billion passengers are forecast for 2021, two years earlier than predicted in the baseline forecast. The low case is characterized by increased costs of capital resulting from higher interest rates, weakened consumer confidence brought on by rising unemployment, and higher inflation. In this scenario passengers grow an average of 1.9 percent per year (domestic up 1.8 percent and international up 2.8 percent). In the low case, one billion passengers are reached in 2028, five years behind the baseline forecast.
CONSUMER PRICE INDEX – ALL URBAN CONSUMERS FISCAL YEARS 2009-2030
2.8
1.7 1.51.7
2.3
3.1
1.91.9
1.9
0.0
1.0
2.0
3.0
4.0
2009-2030 2009-2015 2015-2030
Pessimistic Baseline Optimistic
AN
NU
AL
PER
CE
NT
GR
OW
TH
FAA Aerospace Forecast Fiscal Years 2010–2030
58
revenue passenger miles
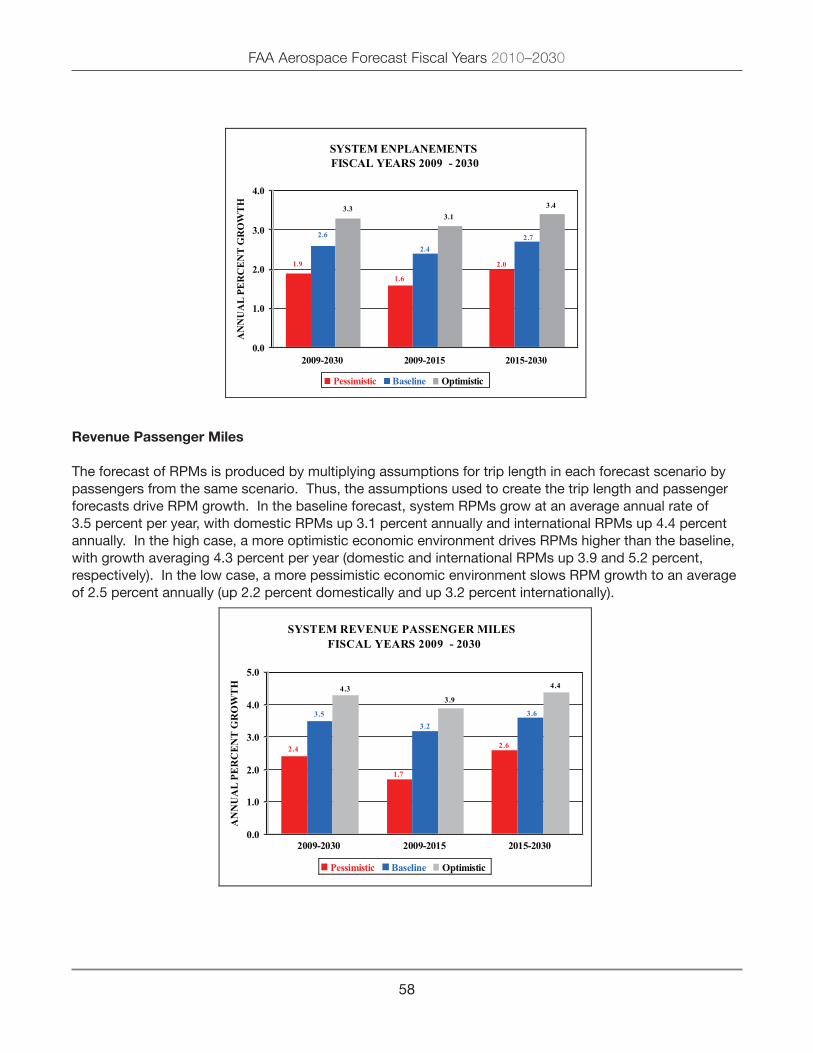
The forecast of RPMs is produced by multiplying assumptions for trip length in each forecast scenario by passengers from the same scenario. Thus, the assumptions used to create the trip length and passenger forecasts drive RPM growth. In the baseline forecast, system RPMs grow at an average annual rate of 3.5 percent per year, with domestic RPMs up 3.1 percent annually and international RPMs up 4.4 percent annually. In the high case, a more optimistic economic environment drives RPMs higher than the baseline, with growth averaging 4.3 percent per year (domestic and international RPMs up 3.9 and 5.2 percent, respectively). In the low case, a more pessimistic economic environment slows RPM growth to an average of 2.5 percent annually (up 2.2 percent domestically and up 3.2 percent internationally).
SYSTEM ENPLANEMENTS FISCAL YEARS 2009 - 2030
1.9
3.33.1
3.4
1.6
2.0
2.4
2.6 2.7
0.0
1.0
2.0
3.0
4.0
2009-2030 2009-2015 2015-2030
Pessimistic Baseline Optimistic
AN
NU
AL
PER
CE
NT
GR
OW
TH
SYSTEM REVENUE PASSENGER MILESFISCAL YEARS 2009 - 2030
2.4
4.33.9
4.4
1.7
2.6
3.23.5 3.6
0.0
1.0
2.0
3.0
4.0
5.0
2009-2030 2009-2015 2015-2030
Pessimistic Baseline Optimistic
AN
NU
AL
PER
CE
NT
GR
OW
TH
59
FAA Aerospace Forecast Fiscal Years 2010–2030
available seat miles
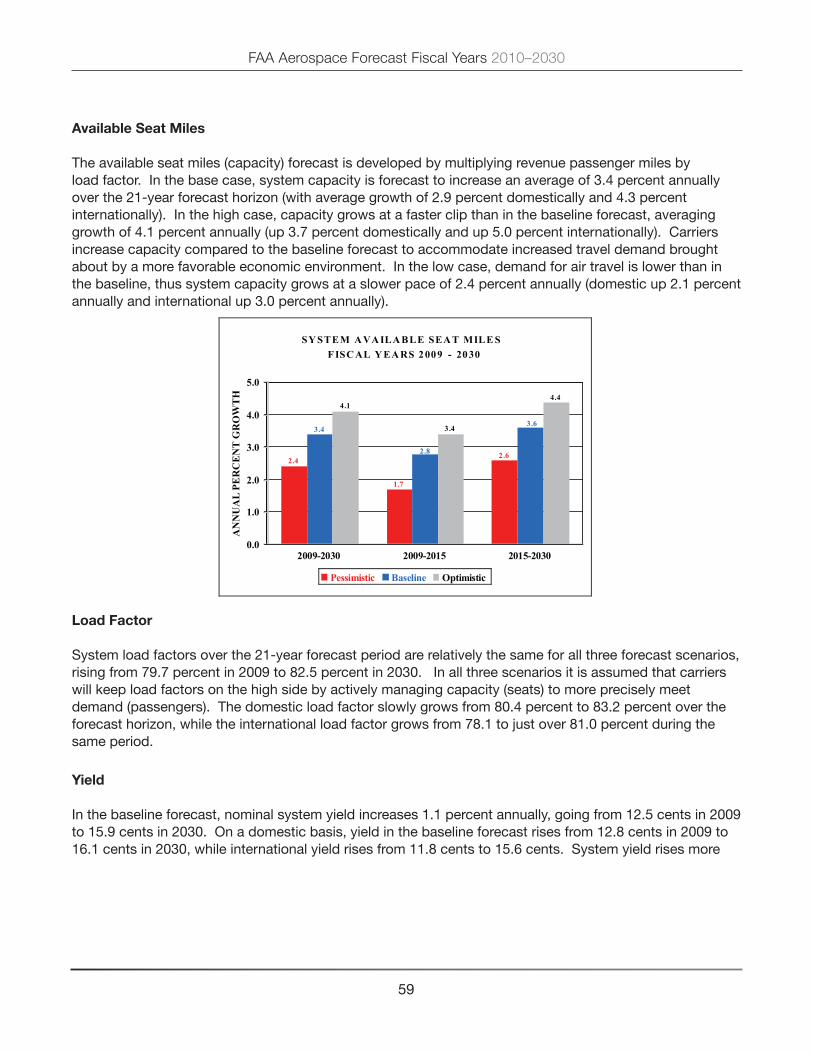
The available seat miles (capacity) forecast is developed by multiplying revenue passenger miles by load factor. In the base case, system capacity is forecast to increase an average of 3.4 percent annually over the 21-year forecast horizon (with average growth of 2.9 percent domestically and 4.3 percent internationally). In the high case, capacity grows at a faster clip than in the baseline forecast, averaging growth of 4.1 percent annually (up 3.7 percent domestically and up 5.0 percent internationally). Carriers increase capacity compared to the baseline forecast to accommodate increased travel demand brought about by a more favorable economic environment. In the low case, demand for air travel is lower than in the baseline, thus system capacity grows at a slower pace of 2.4 percent annually (domestic up 2.1 percent annually and international up 3.0 percent annually).
load Factor
System load factors over the 21-year forecast period are relatively the same for all three forecast scenarios, rising from 79.7 percent in 2009 to 82.5 percent in 2030. In all three scenarios it is assumed that carriers will keep load factors on the high side by actively managing capacity (seats) to more precisely meet demand (passengers). The domestic load factor slowly grows from 80.4 percent to 83.2 percent over the forecast horizon, while the international load factor grows from 78.1 to just over 81.0 percent during the same period.
Yield
In the baseline forecast, nominal system yield increases 1.1 percent annually, going from 12.5 cents in 2009 to 15.9 cents in 2030. On a domestic basis, yield in the baseline forecast rises from 12.8 cents in 2009 to 16.1 cents in 2030, while international yield rises from 11.8 cents to 15.6 cents. System yield rises more
SY STEM A VA ILA BLE SEA T MILE SFISC AL Y EA RS 2009 - 2030
2.4
4.1
3.4
4.4
1.7
2.62.8
3.43.6
0.0
1.0
2.0
3.0
4.0
5.0
2009-2030 2009-2015 2015-2030
Pessimistic Baseline Optimistic
AN
NU
AL
PER
CE
NT
GR
OW
TH
FAA Aerospace Forecast Fiscal Years 2010–2030
60
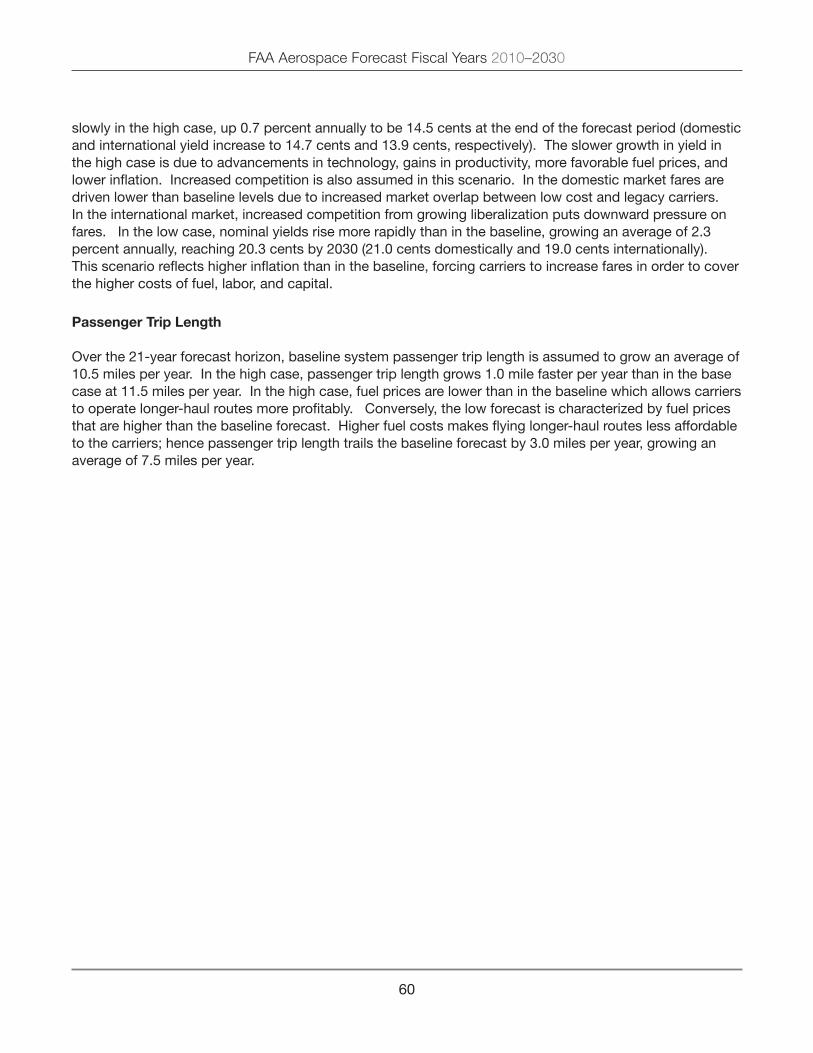
slowly in the high case, up 0.7 percent annually to be 14.5 cents at the end of the forecast period (domestic and international yield increase to 14.7 cents and 13.9 cents, respectively). The slower growth in yield in the high case is due to advancements in technology, gains in productivity, more favorable fuel prices, and lower inflation. Increased competition is also assumed in this scenario. In the domestic market fares are driven lower than baseline levels due to increased market overlap between low cost and legacy carriers. In the international market, increased competition from growing liberalization puts downward pressure on fares. In the low case, nominal yields rise more rapidly than in the baseline, growing an average of 2.3 percent annually, reaching 20.3 cents by 2030 (21.0 cents domestically and 19.0 cents internationally). This scenario reflects higher inflation than in the baseline, forcing carriers to increase fares in order to cover the higher costs of fuel, labor, and capital.
passenger trip length
Over the 21-year forecast horizon, baseline system passenger trip length is assumed to grow an average of 10.5 miles per year. In the high case, passenger trip length grows 1.0 mile faster per year than in the base case at 11.5 miles per year. In the high case, fuel prices are lower than in the baseline which allows carriers to operate longer-haul routes more profitably. Conversely, the low forecast is characterized by fuel prices that are higher than the baseline forecast. Higher fuel costs makes flying longer-haul routes less affordable to the carriers; hence passenger trip length trails the baseline forecast by 3.0 miles per year, growing an average of 7.5 miles per year.
61
FAA
Aerospace Forecast Fiscal Years 2010–2030
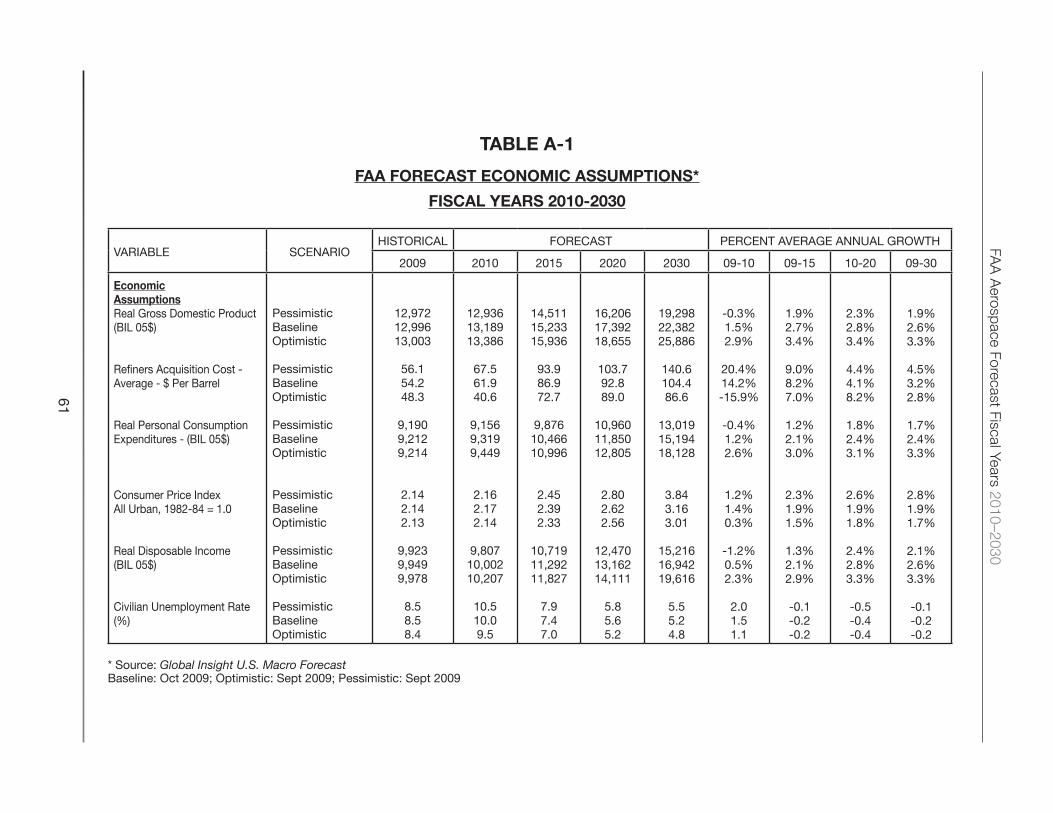
taBle a-1
Faa Forecast ecoNomic assUmptioNs*
Fiscal Years 2010-2030
vARIABLE SCENARIOHISTORICAL FORECAST PERCENT AvERAGE ANNUAL GROWTH
2009 2010 2015 2020 2030 09-10 09-15 10-20 09-30
economicassumptionsReal Gross Domestic Product(BIL 05$)
Refiners Acquisition Cost -Average - $ Per Barrel
Real Personal ConsumptionExpenditures - (BIL 05$)
Consumer Price IndexAll Urban, 1982-84 = 1.0
Real Disposable Income(BIL 05$)
Civilian Unemployment Rate(%)
PessimisticBaselineOptimistic PessimisticBaselineOptimistic PessimisticBaselineOptimistic
PessimisticBaselineOptimistic PessimisticBaselineOptimistic
PessimisticBaselineOptimistic
12,972 12,996 13,003
56.1 54.2 48.3
9,190 9,212 9,214
2.14 2.14 2.13
9,923 9,949 9,978
8.5 8.5 8.4
12,936 13,189 13,386
67.5 61.9 40.6
9,156 9,319 9,449
2.16 2.17 2.14
9,807 10,002 10,207
10.5 10.0 9.5
14,511 15,233 15,936
93.9 86.9 72.7
9,876 10,466 10,996
2.45 2.39 2.33
10,719 11,292 11,827
7.9 7.4 7.0
16,206 17,392 18,655
103.7 92.8 89.0
10,960 11,850 12,805
2.80 2.62 2.56
12,470 13,162 14,111
5.8 5.6 5.2
19,298 22,382 25,886
140.6 104.4 86.6
13,019 15,194 18,128
3.84 3.16 3.01
15,216 16,942 19,616
5.5 5.2 4.8
-0.3%1.5%2.9%
20.4%14.2%-15.9%
-0.4%1.2%2.6%
1.2%1.4%0.3%
-1.2%0.5%2.3%
2.01.51.1
1.9%2.7%3.4%
9.0%8.2%7.0%
1.2%2.1%3.0%
2.3%1.9%1.5%
1.3%2.1%2.9%
-0.1-0.2-0.2
2.3%2.8%3.4%
4.4%4.1%8.2%
1.8%2.4%3.1%
2.6%1.9%1.8%
2.4%2.8%3.3%
-0.5-0.4-0.4
1.9%2.6%3.3%
4.5%3.2%2.8%
1.7%2.4%3.3%
2.8%1.9%1.7%
2.1%2.6%3.3%
-0.1-0.2-0.2
* Source: Global Insight U.S. Macro ForecastBaseline: Oct 2009; Optimistic: Sept 2009; Pessimistic: Sept 2009

FAA
Aerospace Forecast Fiscal Years 2010–2030
62
taBle a-2
Faa Forecast oF domestic aviatioN activitY
Fiscal Years 2010-2030
vARIABLE SCENARIOHISTORICAL FORECAST PERCENT AvERAGE ANNUAL GROWTH
2009 2010 2015 2020 2030 09-10 09-15 10-20 10-30
domesticaviation activityAvailable Seat Miles(BIL)
Revenue Passenger Miles(BIL)
Enplanements(MIL)
Miles Flown(MIL) Departures(000s)
Nominal Passenger yield(cents)
PessimisticBaselineOptimistic PessimisticBaselineOptimistic PessimisticBaselineOptimistic
PessimisticBaselineOptimistic PessimisticBaselineOptimistic
PessimisticBaselineOptimistic
683.8 683.8 683.8
549.5 549.5 549.5
631.3 631.3 631.3
5,608.7 5,608.7 5,608.7
9,084.6 9,084.6 9,084.6
12.84 12.84 12.84
665.8 676.2 686.9
543.0 551.5 560.2
624.6 634.1 642.6
5,475.9 5,562.7 5,648.8
8,827.1 8,952.2 9,091.5
13.34 13.34 13.10
749.2 788.5 828.7
617.8 650.3 683.6
692.4 723.1 753.9
6,149.8 6,476.1 6,802.4
9,543.9 9,897.7
10,385.3
14.79 14.18 13.52
849.3 926.5 997.2
703.7 767.8 826.7
768.1 821.4 876.0
6,949.8 7,581.2 8,160.3
10,363.0 10,990.1 11,795.5
16.38 14.73 13.99
1,048.8 1,253.6 1,460.2
872.2 1,042.6 1,215.0
908.3 1,045.6 1,195.8
8,482.8 10,139.4 11,810.7
11,834.0 13,487.0 15,512.7
20.95 16.08 14.72
-2.6%-1.1%0.4%
-1.2%0.4%1.9%
-1.1%0.4%1.8%
-2.4%-0.8%0.7%
-2.8%-1.5%0.1%
3.9%3.9%2.0%
1.5%2.4%3.3%
2.0%2.8%3.7%
1.6%2.3%3.0%
1.5%2.4%3.3%
0.8%1.4%2.3%
2.4%1.7%0.9%
2.5%3.2%3.8%
2.6%3.4%4.0%
2.1%2.6%3.1%
2.4%3.1%3.7%
1.6%2.1%2.6%
2.1%1.0%0.7%
2.1%2.9%3.7%
2.2%3.1%3.9%
1.7%2.4%3.1%
2.0%2.9%3.6%
1.3%1.9%2.6%
2.4%1.1%0.7%
63
FAA
Aerospace Forecast Fiscal Years 2010–2030
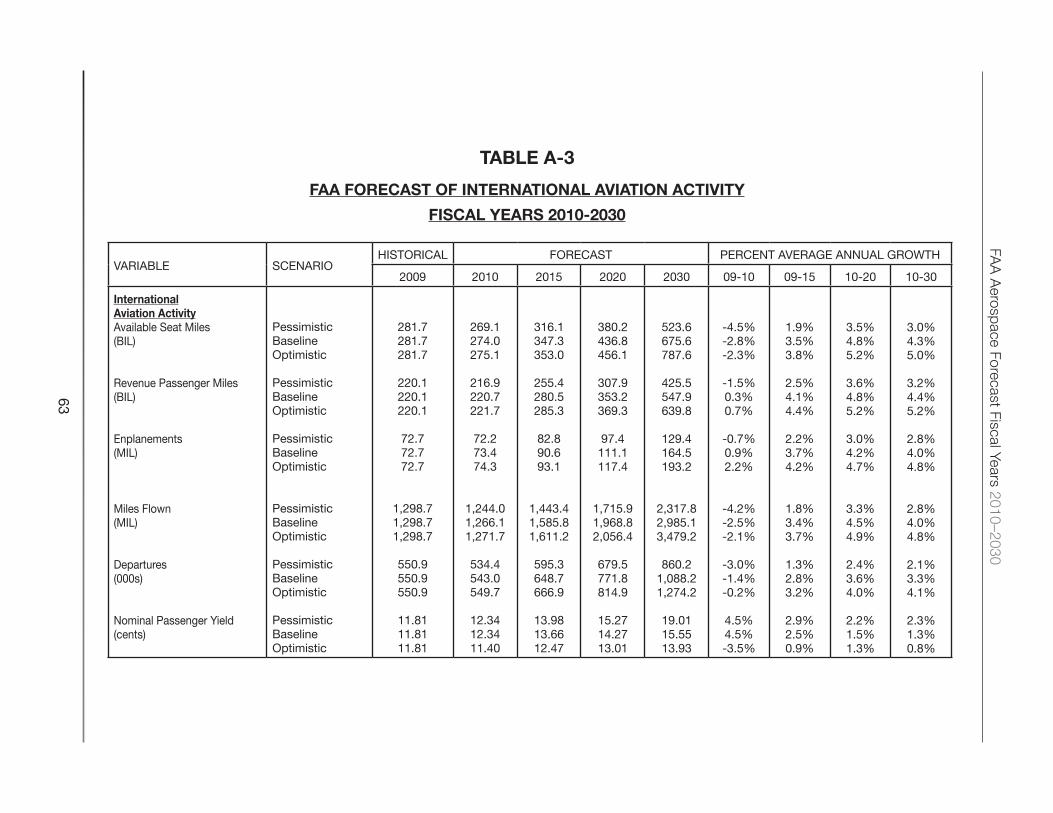
taBle a-3
Faa Forecast oF iNterNatioNal aviatioN activitY
Fiscal Years 2010-2030
vARIABLE SCENARIOHISTORICAL FORECAST PERCENT AvERAGE ANNUAL GROWTH
2009 2010 2015 2020 2030 09-10 09-15 10-20 10-30
internationalaviation activityAvailable Seat Miles(BIL)
Revenue Passenger Miles(BIL)
Enplanements(MIL)
Miles Flown(MIL) Departures(000s)
Nominal Passenger yield(cents)
PessimisticBaselineOptimistic PessimisticBaselineOptimistic PessimisticBaselineOptimistic
PessimisticBaselineOptimistic PessimisticBaselineOptimistic
PessimisticBaselineOptimistic
281.7 281.7 281.7
220.1 220.1 220.1
72.7 72.7 72.7
1,298.7 1,298.7 1,298.7
550.9 550.9 550.9
11.81 11.81 11.81
269.1 274.0 275.1
216.9 220.7 221.7
72.2 73.4 74.3
1,244.0 1,266.1 1,271.7
534.4 543.0 549.7
12.34 12.34 11.40
316.1 347.3 353.0
255.4 280.5 285.3
82.8 90.6 93.1
1,443.4 1,585.8 1,611.2
595.3 648.7 666.9
13.98 13.66 12.47
380.2 436.8 456.1
307.9 353.2 369.3
97.4 111.1 117.4
1,715.9 1,968.8 2,056.4
679.5 771.8 814.9
15.27 14.27 13.01
523.6 675.6 787.6
425.5 547.9 639.8
129.4 164.5 193.2
2,317.8 2,985.1 3,479.2
860.2 1,088.2 1,274.2
19.01 15.55 13.93
-4.5%-2.8%-2.3%
-1.5%0.3%0.7%
-0.7%0.9%2.2%
-4.2%-2.5%-2.1%
-3.0%-1.4%-0.2%
4.5%4.5%-3.5%
1.9%3.5%3.8%
2.5%4.1%4.4%
2.2%3.7%4.2%
1.8%3.4%3.7%
1.3%2.8%3.2%
2.9%2.5%0.9%
3.5%4.8%5.2%
3.6%4.8%5.2%
3.0%4.2%4.7%
3.3%4.5%4.9%
2.4%3.6%4.0%
2.2%1.5%1.3%
3.0%4.3%5.0%
3.2%4.4%5.2%
2.8%4.0%4.8%
2.8%4.0%4.8%
2.1%3.3%4.1%
2.3%1.3%0.8%

![Intégrales doubles [Correction] · []éditéle16octobre2015 Enoncés 1 Intégrales doubles Calculs d’intégrales doubles Exercice 1 [ 01947 ] [Correction] Calculer I= ZZ D](https://img.pdfslide.us/doc/110x75/5e7dab322672273fc1050594/intgrales-doubles-correction-ditle16octobre2015-enoncs-1-intgrales.jpg)