Embed Size (px)
Citation preview

CALTRAIN DESIGN CRITERIA APPENDIX A
SEPTEMBER 30, 2011 A-1
APPENDIX A
ABBREVIATIONS
- A -
A Vertical Acceleration AAR Association of American Railroads AASHTO American Association of State
Highway and Transportation Officials
ABS Automatic Block System
ac Alternating Current
AC Asphalt Concrete AC Transit Alameda-Contra Costa Transit
District ACE Altamont Commuter Express
ACI American Concrete Institute
ACTS Advanced Train Control System
ADA Americans with Disabilities Act ADAAG Americans with Disabilities Act
Accessibility Guidelines ADT Average Daily Traffic
AG Average Grade
AIM Advance Information Management
AISC American Institute of Steel Construction
AISI American Iron and Steel Institute
AMP Ampere AMTRAK National Passenger Railroad
Corporation ATCS Advanced Train Control System ANSI American National Standards
Institute APC American Power Conversion
API American Petroleum Institute AREA American Railway Engineering
Association AREMA American Railroad Equipment and
Maintenance of Way Association
ASCE American Society of Civil Engineers ASHRAE American Society of Heating,
Refrigerating and Air-Conditioning Engineers, Incorporated
ASME American Society of Mechanical Engineers
ASPRS American Society of Photogrammetry and Remote Sensing
ASTM American Standard for Testing and Materials (ASTM International)
ATCS Advanced Train Control System
AWG American Wire Gage
AWPA American Wood Preservers Association
AWS American Welding Society
AWWA American Water Works Association
- B -
BAA Boarding Assistance Area BAAQD Bay Area Air Quality District BART Bay Area Rapid Transit District
BER Bit Error Rate
BDS (Caltrans) Bridge Design Specifications Manual
BICSI Building Industries Consulting Services International
BIH Bureau International de I’Heuer
BMP Best Management Practices
BTU British Thermal Unit
BVC Beginning of Vertical Curve
- C -
C Celcius
CADD Computer-Aided Design And Drafting

CALTRAIN DESIGN CRITERIA APPENDIX A
SEPTEMBER 30, 2011 A-2
CAL/OSHA California Occupational Safety And Health Administration
CAT Category CBC California Building Codes
CBSC California Building Standards Code
CC Point of Compound Curve CCF Central Control Facility CCJPA Capital Corridor Joint Powers
Authority CCR California Code of Regulations
CCS California Coordinate System
CCTV Closed Circuit Television CEMOF Centralized Equipment Maintenance
and Operations Facility CEQA California Environmental Quality Act
CER Communications Equipment Room CFR Code of Federal Regulations
CHSRA California High Speed Rail Authority
CIC Communication Interface Cabinet
CID Card Interface Device
CIF Common Intermediate Format
CLEC Competitive Local Exchange Carrier
CM Circuit Merit
C & S Communications and Signals CORS Continually Operating Referencing
Stations CP Control Point CPTED Crime Prevention Through
Environmental Design CPUC California Public Utilities Commission
CRC Cyclical Redundancy Check
CRSI Concrete Reinforcing Steel Institute
CS Curve to Spiral
CSRC California Spatial Reference Center
CTC Centralized Traffic Control
CTS Cable Transmission System
CTX CalTrain Express
CWA Clean Water Act
CWR Continuous Welded Rail
CWT Constant Warning Time
- D -
D Absolute value of the difference in rates of grades expressed in decimal
DC Degree of Curvature
DAQ Delivered Audio Quality DAT Digital Audio Tape
dB Decibel
DB Design Build
DBB Design Bid Build
DBM Design Basis Memorandum
dc Direct Current
DC Distribution Cabinet
DG Distance Grade
DED Dragging Equipment Detector
DOD Department of Defense
DOJ Department of Justice
DOT Department of Transportation
DRC Dumbarton Rail Corridor
DS0 base-band
DTM Digital Terrain Model
DTX Digital Touch Exchange
DTX Downtown Extension
DVR Digital Video Recorder
� Delta, Total Intersection Angle
- E -
e Equilibrium Superelevation
Ea Actual Superelevation
Eu Unbalanced Superelevation EIA Electronic Industry Alliance
EIC Employee in Charge
EL Elevation
EMI Electromagnetic Interference
EPA Environmental Protection Agency
ERBC Error Rate Block Control ERP Effective Radiated Power
EVC End of Vertical Curve

CALTRAIN DESIGN CRITERIA APPENDIX A
SEPTEMBER 30, 2011 A-3
- F -
F Fahrenheit FCC Federal Communications Commission FEC Forward Error Correction FGCS Federal Geodetic Control
Subcommittee FHWA Federal Highway Administration FIDS Fire and Intrusion Detection System
FOC Fiber Optic Cable
FM Frequency Modulation
FPS Feet Per Second
FRA Federal Railroad Administration
FT Feet
FTA Federal Transit Administration
- G -
G Gradient
Gbps Gigabits per second
GCOR General Code of Operating Rules GETS General Electric Transportation
Systems GIS Geographic Information System
GMSK Gaussian Minimum Shift Keying
GO General Orders
GPS Global Positioning System
GRS Galvanized Rigid Steel
GRS Geodetic Reference System
- H -
HARN High Accuracy Reference Network
HDPE High-Density Polyethylene
HF Head Free
HMAC Hot Mixed Asphalt Concrete
HSP Hub Signage Program
HST High Speed Train HVAC Heating, Ventilating and Air
Conditioning Hz Hertz
- I -
I Total Intersection Angle ICEA Insulated Cable Engineers Association,
Incorporated IEEE Institute of Electrical and Electronic
Engineers
IESNA Illuminating Engineering Society of North America
IFB Issue for Bid
IN inches
I/O Input / Output
IP Internet Protocol IPCEA Insulated Power Cable Engineers
Association ITE Institute of Transportation Engineers
ITE Institute of Traffic Engineers
- J -
JPB Joint Powers Board
JPEG Joint Photographic Experts Group
- K -
K 2.15 conversion factor to give L, in feet, for a vertical curve
- L -
L Length
Lc Length of curve
Ls Length of spiral
LA Local Agency
LAN Local Area Network
LCD Liquid Crystal Display
LED Light Emitting Diode
LOS Loss-of-Shunt
Level of Service LRT Light Rail Train
CALTRAIN DESIGN CRITERIA APPENDIX A
SEPTEMBER 30, 2011 A-4
- M -
M Correction in Elevation at PVI MAS Maximum Authorized Speed
Mbps Megabits per second
MCP Mobile Communications Package
MDF Main Distribution Frame
MEP Mechanical, Electrical, Plumbing
MM Multi-Mode Cable
MOW Maintenance of Way
MPEG Moving Pictures Expert Group
MPH Miles per hour
MPOE Main Point of Entry
MT Main Track
MTA Municipal Transportation Agency MTC Metropolitan Transportation
Commission MUTCD Manual on Uniform Traffic Control
Devices
- N -
NAD North American Datum NAVD North American Vertical Datum NEC National Electric Code
NEC Northeast Corridor NEEE National Electrical and Electronic
Engineers NEMA National Electrical Manufacturers
Association NEPA National Environmental Policy Act NESC National Electrical Safety Code
NETA National Electrical Testing Association
NF Negative Feeder NFPA National Fire Protection Agency NGS National Geodetic Survey
NGVD National Geodetic Vertical Datum
NMAS National Map Accuracy Standards NPDES National Pollutant Discharge
Elimination System NPSH Net Positive Suction Head
NRHP National Register of Historic Places NSRS National Spatial Reference System
NTSB National Transportation Safety Board
NWR Normal Switch Control Relay
- O -
O&M Operations & Maintenance
ORR Operating Railroad of Record OS On Station OSHA Occupational Safety and Health
Administration OTM Other Track Materials
- P -
PA Public Address PAS Public Address System
PC Point of Curve
PCA Portland Cement Association
PCC Portland Cement Concrete
PCI Precast/Prestressed Concrete Institute PCJPB The Peninsula Corridor Joint Powers
Board PDF Portable Document Format
PF Point of Frog
pH Potential of Hydrogen
PI Point of Intersection
PIDS Passenger Information Display System PNA Passenger Needed Assistance
POC Point of Connection
POE Power Over Ethernet
POTS Plain Old Telephone System
PPM Parking Permit Machine
ppm Parts Per Million
PS Paralleling Station
PS Point of Switch (Chapter 2)
PT Point of Tangent
PTP Point to Point
PTT Push to Talk
PTZ Pan Tilt Zoom
CALTRAIN DESIGN CRITERIA APPENDIX A
SEPTEMBER 30, 2011 A-5
PVC Polyvinyl Chloride PVI Point of Intersection for Vertical
Curve
- Q - QA Quality Assurance
QC Quality Control
- R -
R Radius RCP Reinforced Concrete Pipe
RE AREMA Rail Section Code
RF Radio Frequency
RFI Request for Information RHGCH Railroad-Highway Grade Crossing
Handbook RMS Root Mean Square
ROCS Rail Operations Control System
ROW Right-of-Way
RR Railroad
RSI Random Signature Island
RSSI Received Signal Strength Indicator RTK Real Time Kinematics
RUS Rural Utilities Services
RWP Roadway Worker Protection
RWQCB Regional Water Quality Control Board
RWR Reverse Switch Control Relay
- S -
S1 Slope of Entering Tangent in Percent S2 Slope of Departing Tangent in
Percent SamTrans San Mateo County Transit District
SBHRS South Bay Historical Railroad Society
SC Spiral to Curve SCADA Supervisory Control And Data
Acquisition SCC Station Communication Cabinet
SCFMR Safety Code for Mechanical Refrigeration
SCRRA Southern California Regional Rail Authority
SCS Supervisory Control Systems
SD Standard Drawings
Sec Second
SFMTA San Francisco Metropolitan Transportation Agency
SF MUNI San Francisco Municipal Railway
SFO San Francisco Airport
SHPO State Historic Preservation Office
SINAD Signal In Noise And Distortion SM Single-Mode SMACNA Sheet Metal and Air Conditioning
Contractors National Association SMRC Safety Modification Review Committee
S/N Signal to Noise Ratio
SOGR State of Good Repair
SP Southern Pacific Railroad SSPWC Standard Specifications for Public
Works Association SSWP Site Specific Work Plan
ST Spiral to Tangent
STI Speech Transmission Index SSCC Solid State Crossing Controllers
SWPPP Storm Water Pollution Prevention Plan
- T -
T Tangent Distance (Semi-Tangent) TASI Transit American Services Incorporated
Tc Tangent of Circular Curve
TCE Temporary Construction Easement
TCG Track Clearance Green
TCP Transmission Control Protocol TDMM Telecommunications Distribution
Methods Manual TELCO Telecommunications
TES Traction Electrification System
TIA Telecommunications Industry Associates
CALTRAIN DESIGN CRITERIA APPENDIX A
SEPTEMBER 30, 2011 A-6
TID Transit Information Display TIN Triangulated Irregular Network
TJPA Transbay Joint Powers Authority
TN Ton
T.O. Turnout
TOD Transit-Oriented Development
TPOB Ton Per Operative Brake
TOR Top of Rail
TPC Train Performance Calculator
TS Tangent to Spiral
TSAM Transmitter Steering Audio Matrix
TSSS Total Station Survey System
TTC Transbay Terminal Center
TVM Ticket Vending Machine
- U - UBC Uniform Building Code
UDP User Datagram Protocol UL Underwriters Laboratories,
Incorporated UP Union Pacific Railroad
UPRR Union Pacific Railroad
UPS Uninterruptible Power Supply USACE United States Army Corps of
Engineers USDOT United States Department of
Transportation
- V -
V Design Speed
V Volt
Vac Volt alternating current
Vdc Volt direct current
VHF Very High Frequency
VHLC Vital Logic Control
VLAN Virtual Local Area Network
VMS Visual Message Sign
VOX Voice Activated
VTA Santa Clara Transportation Authority
- W - WAN Wild Area Network
WCO West Coast Operations
WCP World Climate Program WGS World Geodetic System

CALTRAIN DESIGN CRITERIA APPENDIX B
SEPTEMBER 30, 2011 B-1
APPENDIX B
PCJPB/CALTRAIN STANDARDS AND REFERENCES 1.0 PCJPB General Provisions 2.0 PCJPB Special Conditions 3.0 Caltrain Design Criteria 4.0 Caltrain Standard Drawings 5.0 Caltrain Standard Specifications 6.0 PCJPB Standards For Design And Maintenance Of Structures 5.0 PCJPB Engineering Standards For Excavation Support Systems 6.0 Caltrain CADD Manual 7.0 Caltrain Track Charts, Right-of-Way And Rail Corridor Infrastructure Assets 8.0 “Signal System Headway/ Capacity Study”, Task 1 – Quantification Of Signal
System Headway And Capacity Constraints, prepared by Systra Consulting for PCJPB, December 31, 2005, Revised February 10, 2006 (copy of the report at the end of the Appendix B
9.0 Caltrain Safety And Security Certification Program Plan

Capital Project Operations Planning Support
Caltrain JPB Work Directive No. 2999 SYSTRA Project No. 5592
Signal System Headway/Capacity Study
Task 1 Quantification of Signal System Headway and
Capacity Constraints
Submitted By
December 31, 2005 Revised February 10, 2006

Caltrain JPB Work Directive No. 2999 SYSTRA Project No. 5592
Signal System Headway/Capacity Study Task 1 – Quantification of Signal System Headway and Capacity Constraints
SYSTRA Consulting, Inc. - 1 - February 10, 2006
1.0 INTRODUCTION The achievable headways and capacities of a commuter-railroad signal system affect both train scheduling and train operations. Ideally, trains should be scheduled far enough apart (in terms of time) so that there are no signal delays under normal on-time operations. And when one moving train is following another moving train, the signal system (signal locations, block lengths and signal-aspect sequences) keeps the following train a significant distance and time interval behind the preceding train.
If trains are scheduled closer together than the signal system can accommodate at the Maximum Authorized Speed (MAS), trains will encounter signal delays even under normal/ideal conditions. While not desirable, some high-density commuter railroads do schedule “built-in” signal delays in order to achieve the optimum capacities of their rail systems (at intermediate speeds that are less than the Maximum Authorized Speed). This is quite common on the Long Island Rail Road (LIRR), and their published peak-period scheduled running times (especially between Jamaica and Manhattan) reflect the expected level of signal delays. SYSTRA prepared and issued the Task 4.1 “Signal System Study – Updated Signal System Headways” report dated November 11, 2003 to support SYSTRA’s and Caltrain’s efforts in preparing the new “Caltrain Express/Baby Bullet” timetable schedules. That 2003 report was based on the CTC signal-system design as it “stood” in early 2003, and that report did not reflect the As-Built signal system. Because of safety checks and other analyses that were performed of the signal-system design during the same 2003 time frame, some signal locations were “moved” and some signal-aspect sequences were modified after the 2003 Task 4.1 report was issued. SYSTRA and Caltrain recently agreed that the 2003 Signal System Headway report needed to be updated to reflect the As-Built signal system and plans, and this new report presents the Signal System Headway and Capacity Constraints of the As-Built CTC Signal System. 2.0 METHODOLOGY Specialized Train Performance Calculator (TPC) simulations were processed to quantify the signal-system headway characteristics of the As-Built signal layout and signal-aspect sequences for same-direction express and local trains by individual wayside signal. The Theoretical Headway constraint of a signal is defined as the time interval from when the head-end of a train passes the signal displaying a particular favorable aspect (usually

Caltrain JPB Work Directive No. 2999 SYSTRA Project No. 5592
Signal System Headway/Capacity Study Task 1 – Quantification of Signal System Headway and Capacity Constraints
SYSTRA Consulting, Inc. - 2 - February 10, 2006
Clear) until that same signal again displays that same aspect for a following train. Theoretical (signal-system) Headways are not achievable or stable. When a signal aspect “upgrades” just as the head-end of a train passes it, the engineer (at that moment) is no longer in a position to see the signal-aspect upgrade. For wayside signaling without cab signaling such as exists at Caltrain, SYSTRA defines the Practical Headway constraint of a signal to be the Theoretical Headway constraint plus an additive of at least 1 minute for local trains and at least 1.5 minutes for non-stop trains. This minimum additional 1.0 to 1.5 minutes not only allows for signal “sighting”, but also provides for a minimum level of operational reliability when trains operate on close headways. Please be reminded that when a following train encounters signal delay because of a preceding train, the following train must slow down to comply with the signal aspect(s) displayed. Since the following/second train is being delayed by restrictive signals, the time and distance separation between the two trains is normally continually increasing when the second/following train is operating under signal delay from the first train. When the signals again display Clear for the second/following train allowing it to accelerate back to the MAS speed, the following train winds up being spaced behind its leader by a time interval that is greater than the Theoretical Headway constraints. On a commuter railroad, the Theoretical and Practical Headways of individual signals are directly affected by the station-stopping pattern and by the station-dwell times. (This is not the case on most transit systems, where all trains operating on a given track typically make the same station stops, and where the station-dwell times for all trains operating on the same track at a given station are assumed to be the same.) Non-stop express trains generally have the shortest signal-system headways and all-stop local trains generally have the longest signal-system headways. The station-dwell times used in our calculations are based on the Caltrain Dwell-Time Study that was conducted in 2000. As will be explained in more detail later in this report, the signal-system headway constraints for following trains can be somewhat affected/increased by any delays inherent in the signal system, especially when electronic track circuits are used without line circuits (as they are at Caltrain) between successive interlockings. These signal-system delays have been included in the Theoretical Headway and Practical Headway results presented in this report. The TPC simulation output was analyzed to determine whether two express trains not making any station stops could be scheduled 4 minutes apart without the following train being delayed. For this to be feasible, the Clear/Green Theoretical Headways should generally all be no greater than 2.5 minutes (the Clear/Green Practical Headways should generally all be no greater than 4.0 minutes). This report identifies those signals for which

Caltrain JPB Work Directive No. 2999 SYSTRA Project No. 5592
Signal System Headway/Capacity Study Task 1 – Quantification of Signal System Headway and Capacity Constraints
SYSTRA Consulting, Inc. - 3 - February 10, 2006
the Clear/Green Theoretical and Practical Headways between express trains exceed 2.5 minutes and 4.0 minutes respectively. The TPC simulation output was also analyzed to determine whether two local trains making all of the typical local station stops could be scheduled 5 minutes apart without the following train being delayed. For this to be feasible, the Advance Approach/Flashing Yellow (AA/FY) Theoretical Headways should generally all be no greater than 4.0 minutes (the Advance Approach/Flashing Yellow Practical Headways should generally all be no greater than 5.0 minutes). This report identifies those signals for which the AA/FY Theoretical and Practical Headways between local trains exceed 4.0 minutes and 5.0 minutes respectively. Normally, all signal-system headways are computed based on trains operating under Clear/Green signal aspects. However, as will be seen later in this report, the Caltrain signal-system headways for Clear/Green signal aspects to be displayed behind local trains are unusually long in duration. This is because of the relatively close station “spacings” between San Francisco and San Jose in concert with the signal-block lengths, which cause more than one station to be located within the Clear/Green “control line” of many signals. The close station “spacings” at Caltrain do minimize the attainable speeds between successive station stops. Fortunately, the 50-mph Limited Speed prescribed by the AA/FY signal aspect marginally permits local trains to maintain the scheduled running times. This, in turn, makes it reasonable to calculate all-stop local-train signal-system headways (both theoretical and practical) based on the AA/FY signal aspect and not on the Clear/Green signal aspect as is usually done. Thus, the local-train headways reported herein are based on operating under a low level of signal delay. Each station-stopping pattern has its own unique signal-system headway characteristics, since each station-stopping pattern requires a different amount of time for a train to operate the length of a signal’s control line. However, it is not deemed practical to compute (and use for train scheduling) a large number of signal-system headway tabulations. Instead, it is common to compute the signal-system headways for both express/non-stop and local/all-stop (the two extreme) operating patterns as we have done for Caltrain, and to use these signal-system constraints as a guide when preparing train schedules and timetables, which timetables may include a mix of local, express, skip-stop and zone station-stopping schedule operating patterns. As this report will demonstrate, there are many signals for which the Clear/Green Practical Headway constraint between express trains exceeds 4.0 minutes, and for which the AA/FY Practical Headway constraint between local trains exceeds 5.0 minutes. These larger than desirable signal-system headways do occur in the commuter-railroad industry when signal systems are designed not just for passenger trains, but also for freight

Caltrain JPB Work Directive No. 2999 SYSTRA Project No. 5592
Signal System Headway/Capacity Study Task 1 – Quantification of Signal System Headway and Capacity Constraints
SYSTRA Consulting, Inc. - 4 - February 10, 2006
trains that have much longer safe-braking distances. The Caltrain signal system south of MP 5.2 (near the Bayshore Station) was designed for a freight-train MAS of 50 mph because of Caltrain’s contractual responsibilities to the UPRR. As with any signal system, trains should not be scheduled closer together than can be supported by the signal locations and signal-aspect sequences. As will be seen, the Caltrain signal-system headway constraints vary significantly by location and by direction. This report provides the information that is necessary to properly schedule trains with respect to the many signal-system headway constraints that currently exist. This report also identifies the signals that have the longest (worst-case) headway constraints, which information can and will be used under Task 2 to develop signal-system improvements that will be designed to reduce the longest headway constraints and thereby increase overall line capacity. The headway “benchmarks” for signal-system analysis previously stated in this report of 2.5-minute Theoretical Headways and 4.0-minute Practical Headways for express/non-stop trains, and 4.0-minute Theoretical Headways and 5.0-minute Practical Headways for local/all-stop trains, are somewhat arbitrary. During the review of this report with Caltrain, Caltrain will be able to direct SYSTRA to use shorter or longer headway “yardsticks” during Task 2, under which we will be developing site-specific modifications to the existing signal system for the purpose of enhancing and optimizing the signal-system headways and capacities. We previously presented definitions for Theoretical Headway and Practical Headway. Theoretical Capacity for a particular stopping pattern is defined to be:
Theoretical Capacity = 60 minutes divided by the Theoretical Headway (in minutes), with the result being in trains per hour.
For similar reasons to those presented earlier in this report, Theoretical Capacities are not achievable or stable. For wayside signaling without cab signaling such as exists at Caltrain, SYSTRA defines the Practical Capacity to be:
Practical Capacity = 0.9 (60 minutes divided by the Practical Headway), with the result again being in trains per hour.

Caltrain JPB Work Directive No. 2999 SYSTRA Project No. 5592
Signal System Headway/Capacity Study Task 1 – Quantification of Signal System Headway and Capacity Constraints
SYSTRA Consulting, Inc. - 5 - February 10, 2006
The 90% factor has been chosen to provide for a minimum level of operational reliability when many successive trains are operated on close headways. Track capacity is very complex and dependent on the mix of train traffic that is operated. If all of the signals on a route supported an express-train Practical Headway of 4 minutes, our estimate of Practical Capacity would be 0.9(60/4) = 13.5 trains per hour. The express trains in this illustration do not make any intermediate station stops – no Millbrae, no Hillsdale, etc. If all of the signals on a route supported a local-train Practical Headway of 5 minutes, our estimate of Practical Capacity would be 0.9(60/5) = 10.8 trains per hour. Mixing trains of dissimilar average operating speeds (without scheduling overtakes) would (depending on the level of signal delays that is tolerated) generally result in a Practical Capacity that is much less that the lower of the two values - much less than 10.8 trains per hour. It is for this reason that zone trains typically use significant amounts of capacity when interspersed between local trains. Passing tracks (such as those constructed at Caltrain) allow trains with dissimilar operating speeds to be operated while reducing the amount of capacity required/used by such trains. In summary, line capacity is a very complex issue that is affected by the line configuration and availability of passing tracks, by the types of trains and schedule patterns operated, by the traffic mix, and by how “cleverly” the trains are scheduled. 3.0 SIGNAL-SYSTEM DELAYS WHEN SIGNAL ASPECTS UPGRADE When electronic track circuits are used instead of line circuits, as they are at Caltrain, there is a propagation delay ("tumble-up") time in upgrading following signal aspects behind a train. In consultation with Caltrain, Southwest Signal Engineering Company (SWE) (Caltrain’s Signal Engineering Consultant) and Harmon (the equipment supplier) in late 1999, and based upon more recent information from SWE, it was agreed that we would assume the following typical signal-system delays for non-interlocking track circuits in our signal-system headway analyses when there are no extra cut-sections: 1) The Red aspect upgrades to a Yellow aspect 4 seconds (0.067 minutes) after the block is cleared. 2) The Yellow aspect upgrades to a Flashing Yellow aspect another 4 seconds later, or a total of 8 seconds (0.133 minutes) after the next "downstream" block is cleared.

Caltrain JPB Work Directive No. 2999 SYSTRA Project No. 5592
Signal System Headway/Capacity Study Task 1 – Quantification of Signal System Headway and Capacity Constraints
SYSTRA Consulting, Inc. - 6 - February 10, 2006
3) The Flashing Yellow aspect upgrades to a Green aspect another 4 seconds later, or a total of 12 seconds (0.200 minutes) after the "second-downstream" block is cleared. 4) For each additional non-interlocking electronic track circuit involved, the upgrading time increases by 4 seconds (0.067 minutes). The above illustration and explanation are for the typical sequence of aspects approaching an occupied block, and do not apply to interlocking track circuits, which we have been advised “pass through” signal-logic upgrades much more quickly. Our calculations that are presented in this report reflect the site-specific track-circuit configurations and signal-aspect sequences that exist at each location. Commuter railroads such as the LIRR and MetroNorth do not use electronic track circuits on lines with high traffic volumes. They use conventional track circuits with line circuits, which cause signals to upgrade almost instantaneously as trains vacate downstream blocks. The same is true for Amtrak on the high-density portions of the Northeast Corridor (NEC). In addition, the LIRR, MetroNorth and Amtrak only provide 5 seconds of loss-of-shunt (LOS) protection within interlockings (the minimum required by 49CFR236.309) versus the 10 seconds provided at Caltrain.) In recent (2005) conversations with GE Transportation (who purchased Harmon), we were advised that the Electro Code 5 signal-aspect upgrades may be somewhat slower than reported herein. 4.0 TPC SPEED TABLES The southbound and northbound TPC speed tables for all six of the TPC simulations that were processed are presented in Exhibit 1. The first two pages are the express-train speed tables – southbound first and northbound second. The third and fourth pages are the local-train speed tables based on the Clear/Green signal aspect being displayed. The fifth and sixth pages are the local-train speed tables based on the Advance Approach/Flashing Yellow signal aspect being displayed permitting train movements to be made at the 50-mph passenger-train Limited Speed. The TPC speed tables are based on the current Caltrain “employee-timetable” maximum speeds and speed restrictions.

Caltrain JPB Work Directive No. 2999 SYSTRA Project No. 5592
Signal System Headway/Capacity Study Task 1 – Quantification of Signal System Headway and Capacity Constraints
SYSTRA Consulting, Inc. - 7 - February 10, 2006
5.0 TPC SPEED VERSUS LOCATION PLOTS The southbound and northbound TPC speed versus location plots for all six of the TPC simulations that were processed are presented in Exhibit 2. The first two pages are the express-train speed plots – southbound first and northbound second. The third and fourth pages are the local-train speed plots based on the Clear/Green signal aspect being displayed. The fifth and sixth pages are the local-train speed plots based on the Advance Approach/Flashing Yellow signal aspect being displayed. The TPC speed plots reflect the TPC speed tables and are based on the current Caltrain “employee-timetable” maximum speeds and speed restrictions. 6.0 SIGNAL-SYSTEM HEADWAYS BETWEEN NON-STOP EXPRESS TRAINS 6.1 Southbound Non-Stop Express-Train Headway Constraints Exhibit 3 presents a 4-page tabulation of the southbound signals and the Practical Headways of each individual signal for non-stop express trains, and these values include the signal-system delays previously discussed. All Practical Headways in excess of 4.0 minutes are shown in the color red. The “Signal Aspect” column lists the minimum signal aspect that we believe is necessary for the following train not to be delayed. For CP 4th Street, we assumed a 15-mph route with Reduced Slow Speed signal aspects being displayed. Please note that the signal-system delay times because of the electronic track circuits (which increase signal-system headways) are as much as 16 to 20 seconds (0.27 to 0.33 minutes) for many signals, which is not operationally desirable. These non-stop express-train headways only directly apply when two successive trains are operating non-stop through an area. Following the 4-page tabulation is a “bar chart” that graphically depicts the signal-system headways in geographical sequence. Following the first “bar chart” is a second “bar chart” that graphically depicts the signal-system headways in a “worst-signal-longest-headway to best-signal-shortest-headway sequence”. The signal-system headways reported for CP Franklin Signal 4S, CP Stockton Signal 8Ea, CP Julian Signal 6Ea and CP West Cahill Signal 14E are all based on the following/second train being routed to a different track at Diridon Station. The assumed route-reset time used

Caltrain JPB Work Directive No. 2999 SYSTRA Project No. 5592
Signal System Headway/Capacity Study Task 1 – Quantification of Signal System Headway and Capacity Constraints
SYSTRA Consulting, Inc. - 8 - February 10, 2006
in our calculations is 23 seconds, which includes Caltrain’s 10-second LOS protection. The other 13 seconds allow for code transmission times, human reaction times, switch “throw” times, etc. For the arbitrary 4.0-minute Practical Headway benchmark, there are up to 20 signal-system headways that need to be reduced. Signal-system headways can be improved by classical techniques such as by reducing or eliminating the electronic-track-circuit delays, changing signal-aspect sequences, moving signals, and/or adding signals. These options as well as the headway benchmarks to be applied will be discussed during the review of this report. The Task 2 work will be based on the decisions and technical direction emanating from these discussions. 6.2 Northbound Non-Stop Express-Train Headway Constraints Exhibit 4 presents a 4-page tabulation of the northbound signals and the Practical Headways of each individual signal for non-stop express trains, and these values include the signal-system delays previously discussed. All Practical Headways in excess of 4.0 minutes are shown in the color red. The “Signal Aspect” column lists the minimum signal aspect that we believe is necessary for the following train not to be delayed. For CP 4th Street, we assumed a 20-mph route with Slow Speed signal aspects being displayed. For CP Common, we also assumed (and included in our calculations) the recently approved most-favorable-signal-aspect changes to Approach Slow (Y/Y/R) for the straight moves and Medium Approach Slow (R/Y/Y) for the diverging moves, which require a reduction from 40 mph to 35 mph upon passing the CP Common northbound signals. Please note that the signal-system delay times because of the electronic track circuits (which increase signal-system headways) are as much as 16 to 20 seconds for many signals, which is not operationally desirable. These non-stop express-train headways only directly apply when two successive trains are operating non-stop through an area. Following the 4-page tabulation is a “bar chart” that graphically depicts the signal-system headways in geographical sequence. Following the first “bar chart” is a second “bar chart” that graphically depicts the signal-system headways in a “worst-signal-longest-headway to best-signal-shortest-headway sequence”. The signal-system headways reported for CP Common Signal 2N and CP 4th Street Signal 80L are both based on the following/second train being routed to a different track at the 4th

Caltrain JPB Work Directive No. 2999 SYSTRA Project No. 5592
Signal System Headway/Capacity Study Task 1 – Quantification of Signal System Headway and Capacity Constraints
SYSTRA Consulting, Inc. - 9 - February 10, 2006
and King Station. The assumed route-reset time used in our calculations is 23 seconds, which includes Caltrain’s 10-second LOS protection. For the arbitrary 4.0-minute Practical Headway benchmark, there are up to 23 signal-system headways that need to be reduced. 7.0 SIGNAL-SYSTEM HEADWAYS BETWEEN LOCAL TRAINS 7.1 Southbound Local-Train Headway Constraints Exhibit 5 presents a 4-page tabulation of the southbound signals and the Practical Headways of each individual signal for all-stop local trains, and these values include the signal-system delays previously discussed. All Practical Headways in excess of 5.0 minutes are shown in the color red. The “Signal Aspect” column lists the minimum signal aspect that we believe is necessary for the following train not to be delayed below the passenger-train 50-mph Limited Speed. (This 50-mph criterion was applied north of CP Michael.) For CP 4th Street, we assumed a 15-mph route with Reduced Slow Speed signal aspects being displayed. The TPC calculations presented in Exhibit 5 are based on the assumption that a train will operate at 50 mph (or the MAS when it is less than 50 mph) when traversing a block governed by a FY aspect. These local-train headways apply when two successive trains make common station stops. These signal-system headways are based on trains making all of the common station stops. This excludes Broadway, Atherton and College Park. Following the 4-page tabulation is a “bar chart” that graphically depicts the signal-system headways in geographical sequence. The tabulation and the first “bar chart” include the signaling south of Diridon Station to CP Lick Following the first “bar chart” is a second “bar chart” that graphically depicts the signal-system headways in a “worst-signal-longest-headway to best-signal-shortest-headway sequence”. The second “bar chart” does not include the signals south of Diridon Station because short headways are not required in that area. The signal-system headways reported for CP Stockton Signal 8Ea, CP Julian Signal 6Ea and CP West Cahill Signal 14E are all based on the following/second train being routed to a different track at Diridon Station. The assumed route-reset time used in our calculations is 23 seconds.

Caltrain JPB Work Directive No. 2999 SYSTRA Project No. 5592
Signal System Headway/Capacity Study Task 1 – Quantification of Signal System Headway and Capacity Constraints
SYSTRA Consulting, Inc. - 10 - February 10, 2006
For the arbitrary 5.0-minute Practical Headway benchmark, there are up to 25 signal-system headways that need to be reduced. SYSTRA recommends changing the local-train headway benchmark to a 6.0-minute Practical Headway, which would require up to 5 signal-system headways (a more manageable number) to be reduced. Otherwise, we are talking about a major redesign of the signal system and not just “spot” improvements. The 7.93-minute Practical Headway reported for CP Mary Signal 4S is based on waiting for a Y/FG/R (AL) aspect to be displayed (requiring three blocks to be unoccupied) and not predicating the calculations on a Y/G/R (AM) aspect requiring two blocks to be unoccupied). Our analysis has indicated that the Y/G/R (AM) aspect may be sufficient in this case. In any case, we will be recommending during Task 2 that CP Mary Signal 4S display FY/R/R (AA) when the next CP Hendy Signal 4S displays R/Y/R (MA). This change would allow a train to operate through the entire block at Limited Speed and would provide a “better” and more-definitive warning that the train must stop in two blocks. We thought that Caltrain may be interested in knowing the local-train Practical Headways for operation under Clear/Green signal aspects. These results are included as Exhibit 6. As can be seen, the Green/Clear local-train headways are very large (many are above 8 minutes), and we recommend using the 50-mph headways presented in Exhibit 5 instead, which are based on operating under some signal delay. 7.2 Northbound Local-Train Headway Constraints Exhibit 7 presents a 4-page tabulation of the northbound signals and the Practical Headways of each individual signal for all-stop local trains, and these values include the signal-system delays previously discussed. All Practical Headways in excess of 5.0 minutes are shown in the color red. The “Signal Aspect” column lists the minimum signal aspect that we believe is necessary for the following train not to be delayed below the passenger-train 50-mph Limited Speed. (This 50-mph criterion was applied north of CP Michael.) For CP 4th Street, we assumed a 20-mph route with Slow Speed signal aspects being displayed. The TPC calculations presented in Exhibit 7 are based on the assumption that a train will operate at 50 mph (or the MAS when it is less than 50 mph) when traversing a block governed by a FY aspect. For CP Common, we also assumed (and included in our calculations) the recently approved most-favorable-signal-aspect changes to Approach Slow (Y/Y/R) for the straight moves and Medium Approach Slow (R/Y/Y) for the diverging moves, which require a reduction from 40 mph to 35 mph upon passing the CP Common northbound signals.

Caltrain JPB Work Directive No. 2999 SYSTRA Project No. 5592
Signal System Headway/Capacity Study Task 1 – Quantification of Signal System Headway and Capacity Constraints
SYSTRA Consulting, Inc. - 11 - February 10, 2006
These local-train headways apply when two successive trains make common station stops. These signal-system headways are based on trains making all of the common station stops. This excludes Broadway, Atherton and College Park. Following the 4-page tabulation is a “bar chart” that graphically depicts the signal-system headways in geographical sequence. The tabulation and the first “bar chart” include the signaling south of Diridon Station to CP Lick Following the first “bar chart” is a second “bar chart” that graphically depicts the signal-system headways in a “worst-signal-longest-headway to best-signal-shortest-headway sequence”. The second “bar chart” does not include the signals south of Diridon Station because short headways are not required in that area. The signal-system headways reported for CP Common Signal 2N and CP 4th Street Signal 80L are both based on the following/second train being routed to a different track at the 4th and King Station. The assumed route-reset time used in our calculations is 23 seconds, which includes Caltrain’s 10-second LOS protection. For the arbitrary 5.0-minute Practical Headway benchmark, there are up to 25 signal-system headways that need to be reduced. SYSTRA recommends changing the local-train headway benchmark to a 6.0-minute Practical Headway, which would require up to 5 signal-system headways (a more manageable number) to be reduced. Otherwise, we are talking about a major redesign of the signal system and not just “spot” improvements. We thought that Caltrain may be interested in knowing the local-train Practical Headways for operation under Clear/Green signal aspects. These results are included as Exhibit 8. As can be seen, the Green/Clear local-train headways are very large (many are above 8 minutes), and we recommend using the 50-mph headways presented in Exhibit 7 instead, which are based on operating under some signal delay. 8.0 ASSUMED TRAIN OPERATING SPEEDS FOR THE ADVANCE
APPROACH/FLASHING-YELLOW ASPECT It is somewhat unusual (but not unprecedented) for signal-system headway/capacity calculations on a commuter railroad to be based on other than Clear/Green signal aspects. However, because many of the stations are located very close together, local passenger trains should be able to operate under Flashing Yellow/Advance Approach aspects without

Caltrain JPB Work Directive No. 2999 SYSTRA Project No. 5592
Signal System Headway/Capacity Study Task 1 – Quantification of Signal System Headway and Capacity Constraints
SYSTRA Consulting, Inc. - 12 - February 10, 2006
incurring any significant delays or increased trip times. Our analyses to determine local-train (but not express-train) signal-system headways are largely based on local trains only needing Advance Approach/Flashing Yellow aspects to proceed expeditiously along the railroad. Specifically, our TPC calculations are based on the assumption that passenger-train engineers will attempt to maintain the AA/FY Limited Speed of 50 mph (or the MAS when the MAS is less than 50 mph) when traversing a block governed by a FY aspect. If this assumption does not prove true in actual operations, the real-world signal-system headways may be slightly longer/worse than calculated and documented herein. However, we believe that this is a very reasonable assumption. One reason for this belief is that SWE did not assign the AA/FY aspect to an aspect sequence unless the length of the second block was at least approximately 2,500 feet. Trains should be able to easily stop within this distance since the 50-mph safe-stopping distance under the historical CE205 Pennsylvania Railroad safe-braking criteria is only 2,083 feet. The CE205 was in effect for many decades and trains should normally be able to stop within 75% of this distance. 9.0 HEADWAY/CAPACITY EVALUATION CRITERIA The signal-system-headway-evaluation criteria that has been used in this study is slightly aggressive but in line with our years of experience in using and applying Publication 405-1/R of the International Union of Railways (UIC), which is titled “Method to be Used for the Determination of the Capacity of Lines”. The standards and formulas contained in this UIC manual are the result of actual research and experiments, and are used and endorsed by many railroads around the world.
10.0 CONCLUDING COMMENTS
This report presents the results of Task 1 – Quantification of Signal System Headway and Capacity Constraints. The scope of Task 2 is to Enhance and Optimize the Existing Signaling (reduce the governing signal-system headways and increase capacity) by making “spot” improvements using classical/standard techniques. This includes such things as reducing or eliminating the electronic-track-circuit delays, changing signal-aspect sequences, moving signals, and/or adding signals. This Task 1 report will be reviewed with Caltrain and these options as well as the headway benchmarks to be applied will be discussed. The Task 2 work will be based on the decisions and technical direction emanating from these discussions. The results of Task 2 will be the identification of modified signal-system configurations (signal locations, aspect sequences, etc.) for which the headway constraints of each and every signal on the line will conform to a maximum headway standard for the entire line.

Caltrain JPB Work Directive No. 2999 SYSTRA Project No. 5592
Signal System Headway/Capacity Study Task 1 – Quantification of Signal System Headway and Capacity Constraints
SYSTRA Consulting, Inc. - 13 - February 10, 2006
This will ensure that the entire line supports the specified “design headway” requirements, whatever they are defined to be during our review (of Task 1) meeting with Caltrain.
***** End of Report Text *****

Exhibit 1
TPC Speed Tables
Non-Stop Southbound Non-Stop Northbound Local Southbound Based on Green/Clear Aspects Local Northbound Based on Green/Clear Aspects Local Southbound Based on Advance Approach/Flashing Yellow Aspects Local Northbound Based on Advance Approach/Flashing Yellow Aspects
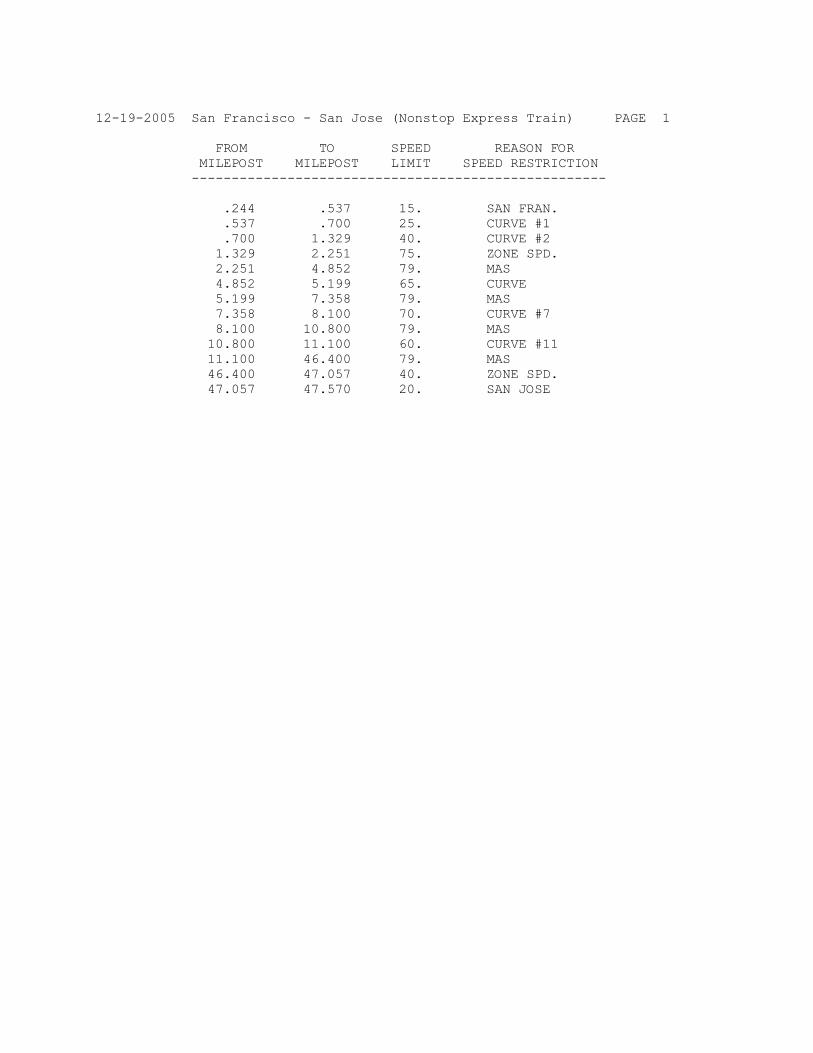
12-19-2005 San Francisco - San Jose (Nonstop Express Train) PAGE 1 FROM TO SPEED REASON FOR MILEPOST MILEPOST LIMIT SPEED RESTRICTION ---------------------------------------------------- .244 .537 15. SAN FRAN. .537 .700 25. CURVE #1 .700 1.329 40. CURVE #2 1.329 2.251 75. ZONE SPD. 2.251 4.852 79. MAS 4.852 5.199 65. CURVE 5.199 7.358 79. MAS 7.358 8.100 70. CURVE #7 8.100 10.800 79. MAS 10.800 11.100 60. CURVE #11 11.100 46.400 79. MAS 46.400 47.057 40. ZONE SPD. 47.057 47.570 20. SAN JOSE

12-20-2005 San Jose - San Francisco (Nonstop Express Train) PAGE 1 FROM TO SPEED REASON FOR MILEPOST MILEPOST LIMIT SPEED RESTRICTION ---------------------------------------------------- 47.470 47.057 20. SAN JOSE 47.057 46.300 40. MP 47.1 46.300 14.200 79. MAS 14.200 13.700 75. CURVE 13.700 11.100 79. MAS 11.100 10.800 60. CURVE #11 10.800 8.100 79. MAS 8.100 7.358 70. CURVE #7 7.358 5.199 79. MAS 5.199 4.852 65. CURVE 4.852 2.251 79. MAS 2.251 1.329 75. ZONE SPD. 1.329 .700 40. CURVE #2 .700 .537 25. CURVE #1 .537 .214 20. 4TH ST. IL .214 .166 10. SAN FRAN.

12-21-2005 San Francisco - MP 60 (Local Train at 79-mph. MAS) PAGE 1 FROM TO SPEED REASON FOR MILEPOST MILEPOST LIMIT SPEED RESTRICTION ---------------------------------------------------- .257 .537 15. SAN FRAN. .537 .700 25. CURVE #1 .700 1.329 40. CURVE #2 1.329 2.251 75. ZONE SPD. 2.251 4.852 79. MAS 4.852 4.941 65. CURVE 4.941 5.106 50. TO-TUNNEL 5.106 6.945 70. MAS TRK.#4 6.945 7.040 50. TO BRISBNE 7.040 8.100 70. CURVE #7 8.100 10.800 79. MAS 10.800 11.100 60. CURVE #11 11.100 39.362 79. MAS 39.362 39.458 50. TO HENDY 39.458 40.899 70. MAS TRK.#4 40.899 41.609 50. AL ON 4S 41.609 46.400 79. MAS 46.400 47.057 40. ZONE SPD. 47.057 47.890 20. SAN JOSE 47.890 49.721 35. M47.8-49.7 49.721 51.638 79. MAS 51.638 51.858 50. TO LICK 51.858 52.450 60. UP MAS 52.450 53.464 40. (HE) CPTL (DIB) 53.464 60.000 60. UP MAS

12-20-2005 MP 60 - San Francisco (Local Train at 79 MPH.) PAGE 1 FROM TO SPEED REASON FOR MILEPOST MILEPOST LIMIT SPEED RESTRICTION ---------------------------------------------------- 60.000 55.650 60. UP MAS 55.650 54.178 40. (HE) BLSM (DIB) 54.178 51.858 60. UP MAS 51.858 51.638 50. TO LICK 51.638 49.700 79. MAS 49.700 47.908 35. M47.8-49.7 47.908 47.057 20. SAN JOSE 47.057 46.300 40. MP 47.1 46.300 41.609 79. MAS 41.609 41.507 50. TO BOWERS 41.507 40.140 70. MAS TRK.#3 40.140 39.362 50. AL @ 411-3 39.362 14.200 79. MAS 14.200 13.700 75. CURVE 13.700 11.100 79. MAS 11.100 10.800 60. CURVE #11 10.800 8.100 79. MAS 8.100 7.040 70. CURVE #7 7.040 6.945 50. XO-BRISBN 6.945 5.199 70. MAS TRK.#3 5.199 5.106 65. CURVE 5.106 4.941 50. TO TUNNEL 4.941 4.852 65. CURVE 4.852 2.251 79. MAS 2.251 1.329 75. ZONE SPD. 1.329 .700 40. CURVE #2 .700 .537 25. CURVE #1 .537 .214 20. 4TH ST. IL .214 .166 10. SAN FRAN.

12-19-2005 San Francisco - MP 60 (Local Train at 50 mph.) PAGE 1 FROM TO SPEED REASON FOR MILEPOST MILEPOST LIMIT SPEED RESTRICTION ---------------------------------------------------- .257 .537 15. SAN FRAN. .537 .700 25. CURVE #1 .700 1.329 40. CURVE #2 1.329 46.400 50. ZONE SPD. 46.400 47.057 40. ZONE SPD. 47.057 47.890 20. SAN JOSE 47.890 49.721 35. M47.8-49.7 49.721 51.638 79. MAS 51.638 51.858 50. TO LICK 51.858 52.450 60. UP MAS 52.450 53.464 40. (HE) CPTL (DIB) 53.464 60.000 60. UP MAS

12-20-2005 MP 60 - San Francisco (Local Train at 50 mph.) PAGE 1 FROM TO SPEED REASON FOR MILEPOST MILEPOST LIMIT SPEED RESTRICTION ---------------------------------------------------- 60.000 55.650 60. UP MAS 55.650 54.178 40. (HE) BLSM (DIB) 54.178 51.858 60. UP MAS 51.858 51.638 50. TO LICK 51.638 49.700 79. MAS 49.700 47.908 35. M47.8-49.7 47.908 47.057 20. SAN JOSE 47.057 46.300 40. MP 47.1 46.300 1.329 50. MAS 1.329 .700 40. CURVE #2 .700 .537 25. CURVE #1 .537 .214 20. 4TH ST. IL .214 .157 10. SAN FRAN.

Exhibit 2
TPC Speed versus Location Plots
Non-Stop Southbound Non-Stop Northbound Local Southbound Based on Green/Clear Aspects Local Northbound Based on Green/Clear Aspects Local Southbound Based on Advance Approach/Flashing Yellow Aspects Local Northbound Based on Advance Approach/Flashing Yellow Aspects

San Francisco - San JoseSouthward Express Train (Nonstop)
One MP36PH-3C Engine + 4 Bombardier Bi-Level Cars
0
10
20
30
40
50
60
70
80
0 5 10 15 20 25 30 35 40 45
Distance from San Francisco (Miles)
Spee
d Li
mit
and
Sim
ulat
ed T
rain
Spe
ed (M
PH)
Train Speed Speed Limit

San Jose - San FranciscoNorthward Express Train (Nonstop)
One MP36PH-3C Engine + 4 Bombardier Bi-Level Cars
0
10
20
30
40
50
60
70
80
0 5 10 15 20 25 30 35 40 45
Distance from San Jose (Miles)
Spee
d Li
mit
and
Sim
ulat
ed T
rain
Spe
ed
Train Speed Speed Limit

San Francisco to MP 60 (South of Blossom Hill) Southward Local Train - One F40PH Engine + 5 Gallery Cars
With 79-mph MAS Where Permitted
0
10
20
30
40
50
60
70
80
0 10 20 30 40 50
Distance from San Francisco (Miles)
Spee
d Li
mit
and
Sim
ulat
ed T
rain
Spe
ed (M
PH)
Train Speed Speed Limit

MP 60 (South of Blossom Hill) to San Francisco Northward Local Train - One F40PH Engine + 5 Gallery Cars
With 79 mph MAS Where Permitted
0
10
20
30
40
50
60
70
80
0 10 20 30 40 50
Distance from MP 60 (Miles)
Spee
d Li
mit
and
Sim
ulat
ed T
rain
Spe
ed (M
PH)
Train Speed Speed Limit

San Francisco to MP 60 (South of Blossom Hill) Southward Local Train - One F40PH Engine + 5 Gallery Cars
50-mph. Maximum Speed North of CP "Michael" and Up To 79-mph. South of CP "Michael"
0
10
20
30
40
50
60
70
80
0 10 20 30 40 50
Distance from San Francisco (Miles)
Spee
d Li
mit
and
Sim
ulat
ed T
rain
Spe
ed (M
PH)
Train Speed Speed Limit

MP 60 (South of Blossom Hill) to San Francisco Northward Local Train - One F40PH Engine + 5 Gallery Cars
Up To 79 mph South of CP "Michael" and50-mph Limited Speed North of CP "Michael"
0
10
20
30
40
50
60
70
80
0 10 20 30 40 50
Distance from MP 60 (Miles)
Spee
d Li
mit
and
Sim
ulat
ed T
rain
Spe
ed (M
PH)
Train Speed Speed Limit

Exhibit 3
Southbound Non-Stop Express-Train Headway Constraints
Tabulation of Signals and Associated Headways Geographical Bar Chart of Practical Headways by Individual Signal Bar Chart of Practical Headways by Individual Signal in Ranked Order

Page 1 of 4 .
Base Number of Total ActualTheoreticalHeadway
76R Fourth St. RSC 1.58 1 0.07 1.65 3.15
86R Fourth St. C 2.38 3 0.20 2.58 4.08
4S Common C 2.46 4 0.27 2.72 4.22
(16-2) C 1.83 3 0.20 2.03 3.53
4S Army C 2.33 3 0.20 2.53 4.03
32-2 C 2.02 3 0.20 2.22 3.72
42-2 C 1.92 3 0.20 2.12 3.62
4S Tunnel C 1.69 3 0.20 1.89 3.39
4S Geneva C 2.11 3 0.20 2.31 3.81
64-2 C 2.35 4 0.27 2.62 4.12
4Sa Brisbane C 2.73 4 0.27 2.99 4.49
4S Sierra C 2.59 4 0.27 2.85 4.35
92-2 C 2.70 3 0.20 2.90 4.40
102-2 C 2.20 3 0.20 2.40 3.90
110-2 C 2.16 3 0.20 2.36 3.86
122-2 C 1.46 3 0.20 1.66 3.16
4S Center C 1.86 3 0.20 2.06 3.56
(1) Number of track circuits involved in signal-aspect upgrade, excluding interlocking track circuits.
(2) Sum of cascading electronic-track-circuit delay times.
(3) Based on wayside signals without cab-signaling.
Track Circuits (1)
Delay Time (2)
Theoretical Headway
Signal Aspect
Southbound Non-Stop Signal System Headways
Practical Headway (3)
Caltrain Capital Project Operations Planning SupportSYSTRA Project No. 5592; Task 1 - Signal System Headways
Headway Constraints by Individual Signal
Signal
Direction: S/B . Stopping Pattern: Non-stop .

Page 2 of 4 .
Base Number of Total ActualTheoreticalHeadway
138-2 C 1.77 3 0.20 1.97 3.47
4S Trousdale C 2.19 3 0.20 2.39 3.89
152-2 C 1.93 3 0.20 2.13 3.63
160-2 C 2.19 5 0.34 2.53 4.03
170-2 C 2.12 5 0.34 2.45 3.95
176-2 C 1.60 4 0.27 1.87 3.37
4S Palm C 1.92 3 0.20 2.12 3.62
188-2 C 1.88 3 0.20 2.08 3.58
196-2 C 2.05 4 0.27 2.32 3.82
204-2 C 1.92 4 0.27 2.19 3.69
212-2 C 1.41 3 0.20 1.61 3.11
4S Ralston C 1.66 3 0.20 1.86 3.36
222-2 C 2.01 3 0.20 2.21 3.71
230-2 C 2.40 4 0.27 2.67 4.17
236-2 C 2.69 4 0.27 2.96 4.46
248-2 C 2.26 4 0.27 2.53 4.03
4S Dumbarton C 2.01 3 0.20 2.21 3.71
(1) Number of track circuits involved in signal-aspect upgrade, excluding interlocking track circuits.
(2) Sum of cascading electronic-track-circuit delay times.
(3) Based on wayside signals without cab-signaling.
Track Circuits (1)
Delay Time (2)
Direction: S/B .
Signal Signal Aspect
Theoretical Headway
Practical Headway (3)
Stopping Pattern: Non-stop .
Caltrain Capital Project Operations Planning SupportSYSTRA Project No. 5592; Task 1 - Signal System Headways
Headway Constraints by Individual Signal

Page 3 of 4 .
Base Number of Total ActualTheoreticalHeadway
4S Junction C 1.57 4 0.27 1.84 3.34
276-2 C 1.70 4 0.27 1.96 3.46
286-2 C 1.56 4 0.27 1.83 3.33
4S Alma C 1.98 3 0.20 2.18 3.68
300-2 C 2.11 3 0.20 2.31 3.81
306-2 C 2.38 3 0.20 2.58 4.08
316-2 C 2.44 3 0.20 2.64 4.14
326-2 C 2.60 3 0.20 2.80 4.30
4S Mayfield C 2.33 3 0.20 2.53 4.03
348-2 C 2.13 3 0.20 2.33 3.83
358-2 C 1.72 4 0.27 1.99 3.49
366-2 C 2.15 4 0.27 2.41 3.91
376-2 C 2.07 4 0.27 2.34 3.84
4S Mary C 2.17 3 0.20 2.37 3.87
4S Hendy C 2.38 4 0.27 2.65 4.15
402-2 C 1.79 3 0.20 2.00 3.50
410-2 C 1.95 4 0.27 2.22 3.72
(1) Number of track circuits involved in signal-aspect upgrade, excluding interlocking track circuits.
(2) Sum of cascading electronic-track-circuit delay times.
(3) Based on wayside signals without cab-signaling.
Signal Aspect
Theoretical Headway
Direction: S/B .
SignalTrack
Circuits (1)Delay
Time (2)Practical
Headway (3)
Headway Constraints by Individual Signal
Stopping Pattern: Non-stop .
Caltrain Capital Project Operations Planning SupportSYSTRA Project No. 5592; Task 1 - Signal System Headways

Page 4 of 4 .
Base Number of Total ActualTheoreticalHeadway
4Sa Bowers C 1.99 4 0.27 2.25 3.75
424-2 C 2.72 5 0.34 3.06 4.56
432-2 C 1.99 3 0.20 2.19 3.69
4S De La Cruz C 2.75 3 0.20 2.96 4.46
4S Franklin C 3.93 2 0.13 4.06 5.56
8Ea Stockton AA 2.87 1 0.07 2.94 4.44
6Ea Julian A 1.74 0 0.00 1.74 3.24
14E West Cahill R 1.01 0 0.00 1.01 2.51
(1) Number of track circuits involved in signal-aspect upgrade, excluding interlocking track circuits.
(2) Sum of cascading electronic-track-circuit delay times.
(3) Based on wayside signals without cab-signaling.
Track Circuits (1)
Delay Time (2)Signal Signal
AspectTheoretical Headway
Caltrain Capital Project Operations Planning SupportSYSTRA Project No. 5592; Task 1 - Signal System Headways
Headway Constraints by Individual Signal
Direction: S/B .
Practical Headway (3)
Stopping Pattern: Non-stop .

Exhibit 4
Northbound Non-Stop Express-Train Headway Constraints
Tabulation of Signals and Associated Headways Geographical Bar Chart of Practical Headways by Individual Signal Bar Chart of Practical Headways by Individual Signal in Ranked Order

Page 1 of 4 .
Base Number of Total ActualTheoreticalHeadway
10Wc West Cahill C 2.25 1 0.07 2.32 3.82
4W Julian AA 3.21 2 0.13 3.35 4.85
6W Stockton C 2.48 3 0.20 2.68 4.18
2N Franklin C 1.80 4 0.27 2.07 3.57
2N Coast C 1.47 3 0.20 1.67 3.17
2N De La Cruz C 1.94 4 0.27 2.21 3.71
433-1 C 1.95 4 0.27 2.22 3.72
425-1 C 1.79 3 0.20 2.00 3.50
2N Bowers C 1.69 3 0.20 1.89 3.39
411-1 C 2.01 3 0.20 2.21 3.71
401-1 C 2.07 4 0.27 2.34 3.84
2Na Hendy C 2.22 4 0.27 2.49 3.99
2N Mary C 1.89 4 0.27 2.15 3.65
375-1 C 2.13 3 0.20 2.33 3.83
367-1 C 2.15 3 0.20 2.35 3.85
359-1 C 2.60 3 0.20 2.80 4.30
347-1 C 2.44 3 0.20 2.64 4.14
(1) Number of electronic track circuits involved in signal-aspect upgrade, excluding interlocking track circuits.
(2) Sum of cascading electronic-track-circuit delay times.
(3) Based on wayside signals without cab-signaling.
Northbound Non-Stop Signal System Headways
Practical Headway (3)
Caltrain Capital Project Operations Planning SupportSYSTRA Project No. 5592; Task 1 - Signal System Headways
Headway Constraints by Individual Signal
Stopping Pattern: Non-stop .
Signal
Direction: N/B .
Track Circuits (1)
Delay Time (2)
Theoretical Headway
Signal Aspect

Page 2 of 4 .
Base Number of Total ActualTheoreticalHeadway
2N Mayfield C 2.56 3 0.20 2.76 4.26
325-1 C 2.11 3 0.20 2.31 3.81
317-1 C 1.81 3 0.20 2.01 3.51
305-1 C 1.56 4 0.27 1.83 3.33
299-1 C 1.70 4 0.27 1.96 3.46
2N Alma C 2.44 5 0.34 2.77 4.27
285-1 C 1.87 3 0.20 2.07 3.57
277-1 C 2.26 4 0.27 2.53 4.03
2N Junction C 2.85 4 0.27 3.12 4.62
2N Dumbarton C 2.54 5 0.34 2.87 4.37
249-1 C 2.42 5 0.34 2.75 4.25
237-1 C 1.94 5 0.34 2.28 3.78
229-1 C 2.57 5 0.34 2.90 4.40
2N Ralston C 1.65 3 0.20 1.85 3.35
211-1 C 1.88 3 0.20 2.08 3.58
203-1 C 1.72 3 0.20 1.92 3.42
197-1 C 2.12 5 0.34 2.45 3.95
(1) Number of electronic track circuits involved in signal-aspect upgrade, excluding interlocking track circuits.
(2) Sum of cascading electronic-track-circuit delay times.
(3) Based on wayside signals without cab-signaling.
Practical Headway (3)
Stopping Pattern: Non-stop .
Caltrain Capital Project Operations Planning SupportSYSTRA Project No. 5592; Task 1 - Signal System Headways
Headway Constraints by Individual Signal
Direction: N/B .
Signal Signal Aspect
Theoretical Headway
Track Circuits (1)
Delay Time (2)

Page 3 of 4 .
Base Number of Total ActualTheoreticalHeadway
187-1 C 1.45 4 0.27 1.72 3.22
2N Palm C 1.84 4 0.27 2.11 3.61
175-1 C 1.93 3 0.20 2.13 3.63
169-1 C 1.94 3 0.20 2.14 3.64
159-1 C 1.80 3 0.20 2.00 3.50
151-1 C 1.59 3 0.20 1.79 3.29
2N Trousdale C 1.74 3 0.20 1.94 3.44
2N BART C 2.11 3 0.20 2.31 3.81
2N Center C 2.49 3 0.20 2.69 4.19
123-1 C 2.69 3 0.20 2.89 4.39
111-1 C 2.41 3 0.20 2.61 4.11
103-1 C 2.66 3 0.20 2.86 4.36
91-1 C 2.35 3 0.20 2.55 4.05
2Na Sierra C 2.64 4 0.27 2.91 4.41
2N Brisbane C 2.51 4 0.27 2.78 4.28
63-1 C 1.93 3 0.20 2.13 3.63
2N Geneva C 2.32 4 0.27 2.58 4.08
(1) Number of electronic track circuits involved in signal-aspect upgrade, excluding interlocking track circuits.
(2) Sum of cascading electronic-track-circuit delay times.
(3) Based on wayside signals without cab-signaling.
Stopping Pattern: Non-stop .
Practical Headway (3)
Direction: N/B .
SignalTrack
Circuits (1)
SYSTRA Project No. 5592; Task 1 - Signal System Headways Headway Constraints by Individual Signal
Caltrain Capital Project Operations Planning Support
Delay Time (2)
Signal Aspect
Theoretical Headway

Page 4 of 4 .
Base Number of Total ActualTheoreticalHeadway
2Na Tunnel C 2.36 4 0.27 2.62 4.12
41-1 C 2.33 5 0.34 2.67 4.17
31-1 C 3.16 5 0.34 3.50 5.00
2N Army AL 2.54 4 0.27 2.81 4.31
13-1 AA 1.68 2 0.13 1.81 3.31
2N Common AS 2.06 1 0.07 2.13 3.63
80L 4th Street SC 0.97 0 0.00 0.97 2.47
(1) Number of electronic track circuits involved in signal-aspect upgrade, excluding interlocking track circuits.
(2) Sum of cascading electronic-track-circuit delay times.
(3) Based on wayside signals without cab-signaling.
Practical Headway (3)
Caltrain Capital Project Operations Planning SupportSYSTRA Project No. 5592; Task 1 - Signal System Headways
Headway Constraints by Individual Signal
Stopping Pattern: Non-stop .Direction: N/B .
Signal Signal Aspect
Theoretical Headway
Track Circuits (1)
Delay Time (2)

Exhibit 5
Southbound Local-Train Headway Constraints for
Advance Approach/Flashing Yellow Signal Aspects to be Displayed
Tabulation of Signals and Associated Headways Geographical Bar Chart of Practical Headways by Individual Signal Bar Chart of Practical Headways by Individual Signal in Ranked Order

Page 1 of 4 .
Base Number of Total ActualTheoreticalHeadway
76R Fourth St. RSC 1.69 1 0.07 1.76 2.76
86R Fourth St. C 3.99 3 0.20 4.19 5.19
4S Common AA 3.76 3 0.20 3.96 4.96
(16-2) AA 1.91 2 0.13 2.05 3.05
4S Army AA 2.47 2 0.13 2.61 3.61
32-2 AA 2.36 2 0.13 2.49 3.49
42-2 AL 4.38 3 0.20 4.58 5.58
4S Tunnel LAA 3.27 2 0.13 3.41 4.41
8S Geneva AA 2.00 2 0.13 2.13 3.13
64-4 AL 2.20 2 0.13 2.34 3.34
4Sd Brisbane LAA 2.78 3 0.20 2.98 3.98
4S Sierra AA 4.47 3 0.20 4.68 5.68
92-2 AA 4.14 2 0.13 4.28 5.28
102-2 AA 4.20 2 0.13 4.33 5.33
110-2 AA 3.77 2 0.13 3.91 4.91
122-2 AA 3.79 2 0.13 3.93 4.93
4S Center C 5.11 3 0.20 5.31 6.31
(1) Number of track circuits involved in signal-aspect upgrade, excluding interlocking track circuits.
(2) Sum of cascading electronic-track-circuit delay times.
(3) Based on wayside signals without cab-signaling.
Practical Headway (3)
Southbound All-Stop Local Signal System HeadwaysCaltrain Capital Project Operations Planning Support
SYSTRA Project No. 5592; Task 1 - Signal System Headways Headway Constraints by Individual Signal
Signal
Direction: S/B .
Track Circuits (1)
Delay Time (2)
Theoretical Headway
Signal Aspect
Stopping Pattern: Local .

Stopping Pattern: Local . Page 2 of 4 .
Base Number of Total ActualTheoreticalHeadway
138-2 AA 2.14 2 0.13 2.27 3.27
4S Trousdale AA 2.33 2 0.13 2.46 3.46
152-2 AA 3.88 2 0.13 4.02 5.02
160-2 AA 3.86 2 0.13 3.99 4.99
170-2 AL 4.04 4 0.27 4.31 5.31
176-2 AA 3.18 3 0.20 3.38 4.38
4S Palm AA 3.76 2 0.13 3.89 4.89
188-2 AA 5.48 2 0.13 5.61 6.61
196-2 AA 3.69 2 0.13 3.82 4.82
204-2 AL 4.00 3 0.20 4.20 5.20
212-2 AA 3.02 2 0.13 3.15 4.15
4S Ralston AA 3.44 2 0.13 3.57 4.57
222-2 AA 3.48 2 0.13 3.61 4.61
230-2 AA 4.02 2 0.13 4.16 5.16
236-2 AA 4.99 3 0.20 5.19 6.19
248-2 AA 4.83 3 0.20 5.04 6.04
4S Dumbarton AA 2.17 2 0.13 2.30 3.30
(1) Number of track circuits involved in signal-aspect upgrade, excluding interlocking track circuits.
(2) Sum of cascading electronic-track-circuit delay times.
(3) Based on wayside signals without cab-signaling.
Practical Headway (3)
Caltrain Capital Project Operations Planning SupportSYSTRA Project No. 5592; Task 1 - Signal System Headways
Headway Constraints by Individual Signal
Direction: S/B .
Signal Signal Aspect
Theoretical Headway
Track Circuits (1)
Delay Time (2)

Stopping Pattern: Local . Page 3 of 4 .
Base Number of Total ActualTheoreticalHeadway
4S Junction AA 1.90 2 0.13 2.04 3.04
276-2 AA 3.34 3 0.20 3.54 4.54
286-2 AA 3.34 3 0.20 3.54 4.54
4S Alma AA 3.99 2 0.13 4.12 5.12
300-2 AA 4.27 2 0.13 4.41 5.41
306-2 AA 4.28 2 0.13 4.41 5.41
316-2 AA 4.24 2 0.13 4.37 5.37
326-2 AA 4.42 2 0.13 4.55 5.55
4S Mayfield AA 4.64 2 0.13 4.77 5.77
348-2 AA 4.39 2 0.13 4.52 5.52
358-2 AA 4.05 2 0.13 4.18 5.18
366-2 AA 1.96 3 0.20 2.16 3.16
376-2 AA 4.15 3 0.20 4.35 5.35
4S Mary AL 6.73 3 0.20 6.93 7.93
4S Hendy LAA 3.44 2 0.13 3.57 4.57
402-4 AA 3.38 2 0.13 3.52 4.52
410-4 AL 3.36 4 0.27 3.63 4.63
(1) Number of track circuits involved in signal-aspect upgrade, excluding interlocking track circuits.
(2) Sum of cascading electronic-track-circuit delay times.
(3) Based on wayside signals without cab-signaling.
Practical Headway (3)
Caltrain Capital Project Operations Planning SupportSYSTRA Project No. 5592; Task 1 - Signal System Headways
Headway Constraints by Individual Signal
Direction: S/B .
SignalTrack
Circuits (1)Delay
Time (2)Signal Aspect
Theoretical Headway

Stopping Pattern: Local . Page 4 of 4 .
Base Number of Total ActualTheoreticalHeadway
4Sd Bowers LAA 2.37 3 0.20 2.57 3.57
424-2 AA 1.80 3 0.20 2.01 3.01
432-2 C 4.70 3 0.20 4.90 5.90
4S De La Cruz AA 4.16 2 0.13 4.29 5.29
4S Franklin AA 3.09 2 0.13 3.22 4.22
8Ea Stockton AA 2.91 1 0.07 2.98 3.98
6Ea Julian A 1.78 0 0.00 1.78 2.78
14E West Cahill R 1.05 0 0.00 1.05 2.05
22Ea East Cahill AA 2.79 2 0.13 2.93 3.93
4E Delmas AA 3.37 2 0.13 3.51 4.51
8E Mack AA 4.36 2 0.13 4.50 5.50
4S Michael C 7.70 4 0.27 7.97 8.97
504-2 AD 5.90 3 0.20 6.10 7.10
1W Lick DC 11.29 3 0.20 11.49 12.49
(1) Number of track circuits involved in signal-aspect upgrade, excluding interlocking track circuits.
(2) Sum of cascading electronic-track-circuit delay times.
(3) Based on wayside signals without cab-signaling.
Practical Headway (3)
Caltrain Capital Project Operations Planning SupportSYSTRA Project No. 5592; Task 1 - Signal System Headways
Headway Constraints by Individual Signal
Direction: S/B .
Signal Signal Aspect
Theoretical Headway
Track Circuits (1)
Delay Time (2)

Exhibit 6
Southbound Local-Train Headway Constraints for
Green/Clear Signal Aspects to be Displayed Tabulation of Signals and Associated Headways Geographical Bar Chart of Practical Headways by Individual Signal Bar Chart of Practical Headways by Individual Signal in Ranked Order

Page 1 of 4 .
Base Number of Total ActualTheoreticalHeadway
76R Fourth St. RSC 1.69 1 0.07 1.76 2.76
86R Fourth St. C 3.99 3 0.20 4.19 5.19
4S Common C 4.56 4 0.27 4.82 5.82
(16-2) C 2.76 3 0.20 2.96 3.96
4S Army C 3.02 3 0.20 3.23 4.23
32-2 C 3.96 3 0.20 4.16 5.16
42-2 AL 4.07 3 0.20 4.27 5.27
4S Tunnel LC 3.94 3 0.20 4.14 5.14
8S Geneva C 3.02 3 0.20 3.22 4.22
64-4 AL 1.93 2 0.13 2.07 3.07
4Sd Brisbane LC 5.33 4 0.27 5.60 6.60
4S Sierra C 5.03 4 0.27 5.30 6.30
92-2 C 7.05 3 0.20 7.25 8.25
102-2 C 4.57 3 0.20 4.77 5.77
110-2 C 6.71 3 0.20 6.91 7.91
122-2 C 4.33 3 0.20 4.53 5.53
4S Center C 4.90 3 0.20 5.10 6.10
(1) Number of track circuits involved in signal-aspect upgrade, excluding interlocking track circuits.
(2) Sum of cascading electronic-track-circuit delay times.
(3) Based on wayside signals without cab-signaling.
Practical Headway (3)
Southbound All-Stop Local Signal System HeadwaysCaltrain Capital Project Operations Planning Support
SYSTRA Project No. 5592; Task 1 - Signal System Headways Headway Constraints by Individual Signal
Signal
Direction: S/B .
Track Circuits (1)
Delay Time (2)
Theoretical Headway
Signal Aspect
Stopping Pattern: Local @ 79 mph .

Page 2 of 4 .
Base Number of Total ActualTheoreticalHeadway
138-2 C 2.80 3 0.20 3.00 4.00
4S Trousdale C 4.82 3 0.20 5.02 6.02
152-2 C 4.58 3 0.20 4.78 5.78
160-2 C 6.78 5 0.34 7.12 8.12
170-2 C 6.67 5 0.34 7.01 8.01
176-2 C 5.85 4 0.27 6.11 7.11
4S Palm C 6.39 3 0.20 6.59 7.59
188-2 C 6.36 3 0.20 6.56 7.56
196-2 C 6.55 4 0.27 6.81 7.81
204-2 C 4.79 4 0.27 5.06 6.06
212-2 C 3.82 3 0.20 4.02 5.02
4S Ralston C 5.86 3 0.20 6.06 7.06
222-2 C 4.73 3 0.20 4.93 5.93
230-2 C 7.22 4 0.27 7.49 8.49
236-2 C 5.98 4 0.27 6.25 7.25
248-2 C 5.25 4 0.27 5.51 6.51
4S Dumbarton C 2.78 3 0.20 2.98 3.98
(1) Number of track circuits involved in signal-aspect upgrade, excluding interlocking track circuits.
(2) Sum of cascading electronic-track-circuit delay times.
(3) Based on wayside signals without cab-signaling.
Practical Headway (3)
Caltrain Capital Project Operations Planning SupportSYSTRA Project No. 5592; Task 1 - Signal System Headways
Headway Constraints by Individual Signal
Direction: S/B . Stopping Pattern: Local @ 79 mph .
Signal Signal Aspect
Theoretical Headway
Track Circuits (1)
Delay Time (2)

Page 3 of 4 .
Base Number of Total ActualTheoreticalHeadway
4S Junction C 3.73 4 0.27 4.00 5.00
276-2 C 4.15 4 0.27 4.42 5.42
286-2 C 6.14 4 0.27 6.41 7.41
4S Alma C 5.20 3 0.20 5.40 6.40
300-2 C 6.99 3 0.20 7.19 8.19
306-2 C 5.24 3 0.20 5.44 6.44
316-2 C 7.10 3 0.20 7.31 8.31
326-2 C 5.62 3 0.20 5.82 6.82
4S Mayfield C 7.32 3 0.20 7.53 8.53
348-2 C 5.33 3 0.20 5.53 6.53
358-2 C 4.58 4 0.27 4.85 5.85
366-2 C 4.98 4 0.27 5.25 6.25
376-2 C 4.76 4 0.27 5.03 6.03
4S Mary AL 6.50 3 0.20 6.70 7.70
4S Hendy LC 4.17 3 0.20 4.37 5.37
402-4 AL 4.29 3 0.20 4.49 5.49
410-4 AL 2.96 4 0.27 3.23 4.23
(1) Number of track circuits involved in signal-aspect upgrade, excluding interlocking track circuits.
(2) Sum of cascading electronic-track-circuit delay times.
(3) Based on wayside signals without cab-signaling.
Practical Headway (3)
Caltrain Capital Project Operations Planning SupportSYSTRA Project No. 5592; Task 1 - Signal System Headways
Headway Constraints by Individual Signal
Direction: S/B .
SignalTrack
Circuits (1)Delay
Time (2)
Stopping Pattern: Local @ 79 mph .
Signal Aspect
Theoretical Headway

Page 4 of 4 .
Base Number of Total ActualTheoreticalHeadway
4Sd Bowers LC 2.35 4 0.27 2.62 3.62
424-2 C 5.32 5 0.34 5.66 6.66
432-2 C 4.44 3 0.20 4.64 5.64
4S De La Cruz C 5.34 3 0.20 5.54 6.54
4S Franklin C 4.54 2 0.13 4.68 5.68
8Ea Stockton AA 2.91 1 0.07 2.98 3.98
6Ea Julian A 1.78 0 0.00 1.78 2.78
14E West Cahill R 1.05 0 0.00 1.05 2.05
22Ea East Cahill AA 2.79 2 0.13 2.93 3.93
4E Delmas AA 3.37 2 0.13 3.51 4.51
8E Mack AA 4.36 2 0.13 4.50 5.50
4S Michael C 7.70 4 0.27 7.97 8.97
504-2 AD 5.90 3 0.20 6.10 7.10
1W Lick DC 11.29 3 0.20 11.49 12.49
(1) Number of track circuits involved in signal-aspect upgrade, excluding interlocking track circuits.
(2) Sum of cascading electronic-track-circuit delay times.
(3) Based on wayside signals without cab-signaling.
Practical Headway (3)
Caltrain Capital Project Operations Planning SupportSYSTRA Project No. 5592; Task 1 - Signal System Headways
Headway Constraints by Individual Signal
Direction: S/B .
Signal Signal Aspect
Theoretical Headway
Track Circuits (1)
Delay Time (2)
Stopping Pattern: Local @ 79 mph .

Exhibit 7
Northbound Local-Train Headway Constraints for
Advance Approach/Flashing Yellow Signal Aspects to be Displayed
Tabulation of Signals and Associated Headways Geographical Bar Chart of Practical Headways by Individual Signal Bar Chart of Practical Headways by Individual Signal in Ranked Order

Page 1 of 4 .
Base Number of Total ActualTheoreticalHeadway
2E Lick DC 5.47 4 0.27 5.73 6.73
505-2 C 6.39 5 0.34 6.72 7.72
4N Michael AA 3.94 2 0.13 4.07 5.07
8W Mack AA 2.43 2 0.13 2.57 3.57
4W Delmas A 1.58 1 0.07 1.64 2.64
22W East Cahill R 1.28 0 0.00 1.28 2.28
10Wc West Cahill C 2.34 1 0.07 2.41 3.41
4W Julian AA 3.51 2 0.13 3.65 4.65
6W Stockton AA 4.01 2 0.13 4.15 5.15
2N Franklin AA 3.31 2 0.13 3.44 4.44
2N Coast C 2.66 3 0.20 2.86 3.86
2N De La Cruz AA 2.20 3 0.20 2.40 3.40
433-1 AA 2.24 3 0.20 2.45 3.45
425-1 AL 4.54 3 0.20 4.74 5.74
2N Bowers LAA 3.56 2 0.13 3.69 4.69
411-3 AA 3.50 2 0.13 3.64 4.64
401-3 AL 4.00 2 0.13 4.14 5.14
(1) Number of electronic track circuits involved in signal-aspect upgrade, excluding interlocking track circuits.
(2) Sum of cascading electronic-track-circuit delay times.
(3) Based on wayside signals without cab-signaling.
Signal
Direction: N/B .
Track Circuits (1)
Theoretical Headway
Signal Aspect
Northbound All-Stop Local Signal System Headways
Practical Headway (3)
Stopping Pattern: Local .
Caltrain Capital Project Operations Planning SupportSYSTRA Project No. 5592; Task 1 - Signal System Headways
Headway Constraints by Individual Signal
Delay Time (2)

Page 2 of 4 .
Base Number of Total ActualTheoreticalHeadway
2Nd Hendy LAA 4.21 3 0.20 4.41 5.41
2N Mary AA 2.22 3 0.20 2.42 3.42
375-1 AA 4.01 2 0.13 4.15 5.15
367-1 AA 4.48 2 0.13 4.61 5.61
359-1 AA 4.36 2 0.13 4.49 5.49
347-1 AA 4.38 2 0.13 4.51 5.51
2N Mayfield AA 4.56 2 0.13 4.69 5.69
325-1 AA 4.30 2 0.13 4.44 5.44
317-1 AA 4.50 2 0.13 4.64 5.64
305-1 AA 3.77 2 0.13 3.90 4.90
299-1 AA 3.49 3 0.20 3.69 4.69
2N Alma AA 3.74 3 0.20 3.95 4.95
285-1 C 3.09 3 0.20 3.29 4.29
277-1 AA 1.94 2 0.13 2.08 3.08
2N Junction AA 5.17 3 0.20 5.38 6.38
2N Dumbarton AA 5.27 3 0.20 5.47 6.47
249-1 AA 4.05 3 0.20 4.26 5.26
(1) Number of electronic track circuits involved in signal-aspect upgrade, excluding interlocking track circuits.
(2) Sum of cascading electronic-track-circuit delay times.
(3) Based on wayside signals without cab-signaling.
Direction: N/B .
Signal Signal Aspect
Theoretical Headway
Track Circuits (1)
Delay Time (2)
Caltrain Capital Project Operations Planning SupportSYSTRA Project No. 5592; Task 1 - Signal System Headways
Headway Constraints by Individual Signal
Stopping Pattern: Local .
Practical Headway (3)

Page 3 of 4 .
Base Number of Total ActualTheoreticalHeadway
237-1 AA 5.68 4 0.27 5.95 6.95
229-1 AA 3.97 3 0.20 4.17 5.17
2N Ralston AA 1.74 2 0.13 1.87 2.87
211-1 AA 3.59 2 0.13 3.73 4.73
203-1 AA 5.42 2 0.13 5.56 6.56
197-1 AL 5.74 4 0.27 6.01 7.01
187-1 AA 3.14 3 0.20 3.34 4.34
2N Palm AA 3.51 3 0.20 3.71 4.71
175-1 AA 4.05 2 0.13 4.18 5.18
169-1 AA 3.85 2 0.13 3.98 4.98
159-1 AA 2.00 2 0.13 2.14 3.14
151-1 AA 1.93 2 0.13 2.06 3.06
2N Trousdale AA 3.78 2 0.13 3.91 4.91
2N BART AA 3.99 2 0.13 4.12 5.12
2N Center AA 4.34 2 0.13 4.47 5.47
123-1 AA 4.24 2 0.13 4.37 5.37
111-1 AA 4.12 2 0.13 4.25 5.25
(1) Number of electronic track circuits involved in signal-aspect upgrade, excluding interlocking track circuits.
(2) Sum of cascading electronic-track-circuit delay times.
(3) Based on wayside signals without cab-signaling.
Delay Time (2)
Stopping Pattern: Local .
Caltrain Capital Project Operations Planning SupportSYSTRA Project No. 5592; Task 1 - Signal System Headways
Headway Constraints by Individual Signal
Practical Headway (3)
Signal Aspect
Theoretical Headway
Direction: N/B .
SignalTrack
Circuits (1)

Page 4 of 4 .
Base Number of Total ActualTheoreticalHeadway
103-1 AA 4.17 2 0.13 4.31 5.31
91-1 AA 2.80 2 0.13 2.94 3.94
2Na Sierra AL 3.05 3 0.20 3.25 4.25
2N Brisbane LAA 1.56 2 0.13 1.69 2.69
63-3 AA 2.95 2 0.13 3.08 4.08
10N Geneva AL 3.86 2 0.13 3.99 4.99
2Nd Tunnel LAA 2.82 3 0.20 3.02 4.02
41-1 AA 2.23 3 0.20 2.44 3.44
31-1 AA 3.74 3 0.20 3.94 4.94
2N Army AL 4.34 4 0.27 4.61 5.61
13-1 AA 1.72 2 0.13 1.85 2.85
2N Common AS 2.10 1 0.07 2.17 3.17
80L 4th Street SC 1.01 0 0.00 1.01 2.01
(1) Number of electronic track circuits involved in signal-aspect upgrade, excluding interlocking track circuits.
(2) Sum of cascading electronic-track-circuit delay times.
(3) Based on wayside signals without cab-signaling.
SYSTRA Project No. 5592; Task 1 - Signal System Headways
Signal Aspect
Theoretical Headway
Track Circuits (1)
Delay Time (2)
Practical Headway (3)
Direction: N/B .
Signal
Headway Constraints by Individual Signal
Stopping Pattern: Local .
Caltrain Capital Project Operations Planning Support

Exhibit 8
Northbound Local-Train Headway Constraints for
Green/Clear Signal Aspects to be Displayed
Tabulation of Signals and Associated Headways Geographical Bar Chart of Practical Headways by Individual Signal Bar Chart of Practical Headways by Individual Signal in Ranked Order

Page 1 of 4 .
Base Number of Total ActualTheoreticalHeadway
2E Lick DC 5.47 4 0.27 5.73 6.73
505-2 C 6.39 5 0.34 6.72 7.72
4N Michael AA 3.94 2 0.13 4.07 5.07
8W Mack AA 2.43 2 0.13 2.57 3.57
4W Delmas A 1.58 1 0.07 1.64 2.64
22W East Cahill R 1.28 0 0.00 1.28 2.28
10Wc West Cahill C 2.34 1 0.07 2.41 3.41
4W Julian AA 3.43 2 0.13 3.56 4.56
6W Stockton C 4.79 3 0.20 5.00 6.00
2N Franklin C 4.20 4 0.27 4.47 5.47
2N Coast C 2.40 3 0.20 2.60 3.60
2N De La Cruz C 2.71 4 0.27 2.98 3.98
433-1 C 2.72 4 0.27 2.99 3.99
425-1 AL 4.28 3 0.20 4.48 5.48
2N Bowers LC 4.36 3 0.20 4.56 5.56
411-3 AL 6.55 3 0.20 6.76 7.76
401-3 AL 3.99 2 0.13 4.13 5.13
(1) Number of electronic track circuits involved in signal-aspect upgrade, excluding interlocking track circuits.
(2) Sum of cascading electronic-track-circuit delay times.
(3) Based on wayside signals without cab-signaling.
Signal
Direction: N/B .
Track Circuits (1)
Theoretical Headway
Signal Aspect
Northbound All-Stop Local Signal System Headways
Practical Headway (3)
Stopping Pattern: Local @ 79 mph .
Caltrain Capital Project Operations Planning SupportSYSTRA Project No. 5592; Task 1 - Signal System Headways
Headway Constraints by Individual Signal
Delay Time (2)

Page 2 of 4 .
Base Number of Total ActualTheoreticalHeadway
2Nd Hendy LC 4.97 4 0.27 5.24 6.24
2N Mary C 4.77 4 0.27 5.04 6.04
375-1 C 5.17 3 0.20 5.37 6.37
367-1 C 6.91 3 0.20 7.11 8.11
359-1 C 5.70 3 0.20 5.90 6.90
347-1 C 6.83 3 0.20 7.03 8.03
2N Mayfield C 5.74 3 0.20 5.94 6.94
325-1 C 7.02 3 0.20 7.23 8.23
317-1 C 5.24 3 0.20 5.44 6.44
305-1 C 6.26 4 0.27 6.53 7.53
299-1 C 4.52 4 0.27 4.79 5.79
2N Alma C 4.98 5 0.34 5.31 6.31
285-1 C 2.51 3 0.20 2.71 3.71
277-1 C 5.02 4 0.27 5.29 6.29
2N Junction C 5.93 4 0.27 6.19 7.19
2N Dumbarton C 7.49 5 0.34 7.82 8.82
249-1 C 6.99 5 0.34 7.32 8.32
(1) Number of electronic track circuits involved in signal-aspect upgrade, excluding interlocking track circuits.
(2) Sum of cascading electronic-track-circuit delay times.
(3) Based on wayside signals without cab-signaling.
Direction: N/B .
Signal Signal Aspect
Theoretical Headway
Track Circuits (1)
Delay Time (2)
Caltrain Capital Project Operations Planning SupportSYSTRA Project No. 5592; Task 1 - Signal System Headways
Headway Constraints by Individual Signal
Stopping Pattern: Local @ 79 mph .
Practical Headway (3)

Page 3 of 4 .
Base Number of Total ActualTheoreticalHeadway
237-1 C 6.38 5 0.34 6.72 7.72
229-1 C 7.33 5 0.34 7.66 8.66
2N Ralston C 4.27 3 0.20 4.47 5.47
211-1 C 6.10 3 0.20 6.30 7.30
203-1 C 6.03 3 0.20 6.23 7.23
197-1 C 6.74 5 0.34 7.08 8.08
187-1 C 4.16 4 0.27 4.43 5.43
2N Palm C 6.20 4 0.27 6.46 7.46
175-1 C 4.97 3 0.20 5.17 6.17
169-1 C 4.42 3 0.20 4.62 5.62
159-1 C 2.61 3 0.20 2.81 3.81
151-1 C 4.28 3 0.20 4.48 5.48
2N Trousdale C 4.66 3 0.20 4.86 5.86
2N BART C 6.89 3 0.20 7.09 8.09
2N Center C 5.18 3 0.20 5.38 6.38
123-1 C 6.87 3 0.20 7.07 8.07
111-1 C 5.03 3 0.20 5.23 6.23
(1) Number of electronic track circuits involved in signal-aspect upgrade, excluding interlocking track circuits.
(2) Sum of cascading electronic-track-circuit delay times.
(3) Based on wayside signals without cab-signaling.
Delay Time (2)
Stopping Pattern: Local @ 79 mph .
Caltrain Capital Project Operations Planning SupportSYSTRA Project No. 5592; Task 1 - Signal System Headways
Headway Constraints by Individual Signal
Practical Headway (3)
Signal Aspect
Theoretical Headway
Direction: N/B .
SignalTrack
Circuits (1)

Page 4 of 4 .
Base Number of Total ActualTheoreticalHeadway
103-1 C 5.22 3 0.20 5.43 6.43
91-1 C 3.33 3 0.20 3.53 4.53
2Na Sierra AL 2.58 3 0.20 2.78 3.78
2N Brisbane LC 3.60 3 0.20 3.80 4.80
63-3 C 4.18 3 0.20 4.38 5.38
10N Geneva AL 3.74 2 0.13 3.87 4.87
2Nd Tunnel LC 3.26 4 0.27 3.53 4.53
41-1 C 4.37 5 0.34 4.71 5.71
31-1 C 5.02 5 0.34 5.36 6.36
2N Army AL 4.31 4 0.27 4.58 5.58
13-1 AA 1.72 2 0.13 1.85 2.85
2N Common AS 2.10 1 0.07 2.17 3.17
80L 4th Street SC 1.01 0 0.00 1.01 2.01
(1) Number of electronic track circuits involved in signal-aspect upgrade, excluding interlocking track circuits.
(2) Sum of cascading electronic-track-circuit delay times.
(3) Based on wayside signals without cab-signaling.
SYSTRA Project No. 5592; Task 1 - Signal System Headways
Signal Aspect
Theoretical Headway
Track Circuits (1)
Delay Time (2)
Practical Headway (3)
Direction: N/B .
Signal
Headway Constraints by Individual Signal
Stopping Pattern: Local @ 79 mph .
Caltrain Capital Project Operations Planning Support


CALTRAIN DESIGN CRITERIA APPENDIX C
SEPTEMBER 30, 2011 C-1
APPENDIX C
REGULATORY AGENCIES AND INDUSTRY STANDARDS 1.0 APPLICABLE GOVERNMENT CODES AND REGULATIONS All improvements of the facilities within the jurisdiction of the PCJPB shall be in strict
conformance with government codes, regulations, laws, and standards where applicable, including but not limited to the codes, regulations, laws, and ordinances stated in sections and subsections below.
1.1 Federal 1.1.1 Codes of Federal Regulations (CFR) – Title 49, Transportation:
a. Part 37 Appendix A – Standard for Accessible Transportation Facilities, ADA Accessibility Guidelines for Buildings and Facilities
b. Part 192 Transportation of Natural and Other Gas by Pipeline
c. Part 195 Transportation of Hazardous Liquids by Pipeline
d. Part 213 Track Safety Standards for Class 5 Track
e. Part 214 Railroad Workplace Safety
f. Part 234 Grade Crossing Signal System Safety
g. Part 235 Instructions Governing Applications for Approval of a Discontinuance or Material Modification of a Signal System or Relief From the Requirements of Part 236
h. Part 236 Rules, Standards, and Instructions Governing the Installation, Inspection, Maintenance, and Repair of Signal and Train Control Systems, Devices, and Appliances
1.1.2 Manual of Uniform Traffic Control Devices (MUTCD) 1.2 State
a. California Department of Transportation (Caltrans)
1. Caltrans Highway Design Manual
2. Caltrans Standard Specifications
3. Caltrans Standard Plans
4. Bridge Design Specifications 1.2.1 California Public Utility Commission - CPUC General Orders:
a. CPUC GO No. 26 Clearances
b. CPUC GO No. 33 Interlocking Plants

CALTRAIN DESIGN CRITERIA APPENDIX C
SEPTEMBER 30, 2011 C-2
c. CPUC GO No. 36 Abolition of Services
d. CPUC GO No. 72 At-Grade Crossings
e. CPUC GO No. 75 Protection of Crossings
f. CPUC GO No. 88 Rules for Altering Public Grade Crossings
g. CPUC GO No. 95 Rules Governing Overhead Electric Line Construction
h. CPUC GO No. 112 Utility Construction
i. CPUC GO No. 118 Walkways Maintenance and Construction
j. CPUC GO No. 128 Rules for Underground Electric Construction
1.2.2 State of California Codes and Code of Regulations (CCR)
a. Title 5, Division 1, Part 1, Chapter 5.5, The Elder California Pipeline Safety Act of 1981.
b. Title 8, Industrial Relations
1. California Occupational Safety and Health Administration (Cal/OSHA)
c. Title 24, Parts 1 to 10 and Part 12, California Building Standards Code (CBSC)
d. California Disabled Accessibility Guidebook (CalDAG)
1.2.3 State Historic Preservation Office (SHPO) 2. 0 APPLICABLE ORDINANCES AND DESIGN CRITERIA
2.1 Cities and Counties
a. City and County of San Francisco
b. San Mateo County
c. Cities in the San Mateo County
d. Santa Clara County
e. Cities in the Santa Clara County
3.0 APPLICABLE GUIDELINES AND INDUSTRY STANDARDS The design guidelines and criteria in this Criteria are based on the best industry
practice. The following industry publications, standards, and design guidelines were
used as references to develop this design criteria manual.
a. American Association of State Highway and Transportation Officials (AASHTO)
b. American Concrete Institute (ACI)
c. American Institute of Steel Construction (AISC)
d. American Iron and Steel Institute (AISI)
e. American National Standards Institute (ANSI)

CALTRAIN DESIGN CRITERIA APPENDIX C
SEPTEMBER 30, 2011 C-3
1. 455 Standard Test Procedure for Fiber Optic Fibers, Cables, Transducers and Other Fiber Optic Components
2. 568-B Commercial Building Telecommunications Cabling Standard
3. 569-B Commercial Building Standard for Telecommunications Pathways and Spaces – October, 2004
4. 606-A Administration Standard for the Telecommunications Infrastructure of Commercial Buildings – May, 2002
5. J-STD-607-A Commercial Building Grounding and Bonding Requirements for Telecommunications – October, 2002
6. Z55.1 Gray Finishes for Industrial Apparatus and Equipment
f. American Railway Engineering and Maintenance-of-Way Association (AREMA)
1. AREMA Communications and Signals Manual and Recommended Practices
Part 1.5.10 Recommended Instructions for Painting and ` Protective Coatings
2. AREMA Manual for Railway Engineering
3. AREMA Portfolio of Trackwork Plans
g. American Society of Heating, Refrigerating and Air-Conditioning Engineers, Inc. (ASHRAE)
h. American Society for Testing and Materials International (ASTM)
1. A48 Standard Specification for Gray Iron Castings
2. A153/A153M Standard Specification for Zinc Coating (Hot-Dip) on Iron and Steel Hardware
3. B3 Specification for Soft or Annealed Copper Wire
i. American Welding Society (AWS)
j. Americans with Disabilities Act Accessibility Guidelines (ADAAG) for Buildings and Facilities
k. Building Industries Consulting Services International (BICSI) Telecommunications Distribution Methods Manual (TDMM) – Edition 10, 2003
l. Crime Prevention Through Environmental Design (CPTED)
m. Electronic Industry Alliance (EIA)
1. 310-D Cabinets, Racks, Panels, and Associated Equipment
n. Illuminating Engineering Society of North America (IESNA)
o. International Building Code (IBC)
p. Institute of Electrical and Electronics Engineers, Inc. (IEEE)
q. Insulated Cable Engineers Association, Inc. (ICEA)
1. S-84-608-2002 Filled Telecommunications Cable, Polyolefin, Insulated, Copper Conductor

CALTRAIN DESIGN CRITERIA APPENDIX C
SEPTEMBER 30, 2011 C-4
r. Motorola R56 grounding standard
s. National Electric Code (NEC)
t. National Electrical Safety Code (NESC)
u. National Electrical Manufacturers Association (NEMA)
1. WC5 Thermoplastic-Insulated Wire and Cable for the Transmission and Distribution of Electrical Energy
2. WC7 Cross Linked Thermosetting Polyethylene Insulated Wire and Cable for the Transmission and Distribution of Electrical Energy
v. National Fire Protection Association (NFPA)
1. 70E Standard for Electrical Safety Requirements for Employee Work places
2. 71 Central Station Signaling Systems
3. 72 National Fire Alarm Code
4. 75 Protection of Electronic Computer Data Processing Equipment
5. 101 Life Safety Code
6. 130 Standard for Fixed Guideway and Passenger Rail System
7. 262 Standard Method of Test for Flame Travel and Smoke of Wires and Cables for Use in Air-Handling Spaces
8. 297 Guide on Principles and Practices for Communications Systems
9. 780 Standard for the Installation of Lightning Protection Systems
w. Rural Utilities Services (RUS)
1. Specification for Filled Telephone Cable with Expanded Insulation (7 CFR 1755.890)
2. Specification for Acceptance Teats and Measurements of Telecommunications Plant (7 CFR 1755, Bulletin 1753F-201)
x. Safety Code For Mechanical Refrigeration (SCFMR)
y. Southern California Public Works Handbook (Green Book)
z. Telecommunications Industry Associates/ Electronic Industry Alliance (TIA/EIA)
1. TSB67 Transmission Performance Specifications for Field Testing of Unshielded Twisted Pair Cabling Systems
2. TSB72 Centralized Optical Cabling Guidelines
3. TSB75 Additional Horizontal Cabling Practices for Open Offices
aa. Underwriters Laboratories (UL)
1. 1581 Reference Standard for Electrical Wire, Cable, and Flexible Cords” UL-969, Standard for Marking and Labeling Systems
2. 444 Communication Cables

CALTRAIN DESIGN CRITERIA APPENDIX C
SEPTEMBER 30, 2011 C-5
3. 1690 Data Processing Cable
bb. Uniform Building Code (UBC)


CALTRAIN DESIGN CRITERIA APPENDIX E
SEPTEMBER 30, 2011 E-1
APPENDIX E
CALTRAIN HISTORY AND BACKGROUND
A. PENINSULA CORRIDOR 1.0 HISTORY OF PASSENGER SERVICE San Francisco and San Jose Railroad Company began passenger service in the
peninsula corridor from San Francisco to San Jose on October 18, 1863. In 1870, the Company was acquired by the firm that was eventually consolidated into the Southern Pacific Railway. Southern Pacific double-tracked the line in 1904, and operated passenger service in the corridor successfully until after World War II. In 1977, citing declined ridership, Southern Pacific petitioned the State of California Public Utilities Commission (CPUC) to abandon the passenger service.
From 1980 until 1992, California Department of Transportation (or Caltrans), sharing
operating subsidies with the San Francisco, San Mateo and Santa Clara counties, contracted with Southern Pacific to continue the service. Caltrans assumed sole responsibility for station acquisitions and other capital improvements until the formation of the Peninsula Corridor Joint Powers Board (PCJPB) in 1987.
2.0 CALTRAIN COMMUTER RAIL SERVICE PCJPB assumed the operating responsibilities for the commuter rail service or
Caltrain effective July 1, 1992, and began to shoulder 100 percent of the operating subsidy a year later.
In December 1991, PCJPB purchased Caltrain right-of-way between San Francisco
and San Jose (51.5 miles), and trackage rights further south to Gilroy (26 miles). Caltrans deeded 26 stations, 20 diesel locomotives and 73 bi-level passenger cars to the PCJPB in 1993. The Union Pacific Railroad (UP) acquired Southern Pacific in 1996, and retains rights to operate freight service along the corridor. PCJPB contracted with Amtrak to operate/maintain Caltrain until late 2011 when Transit America Service, Inc. (TASI) took over.
B. DUMBARTON RAIL CORRIDOR In 1994, SamTrans purchased the Dumbarton Rail Corridor between Redwood
Junction and Newark Junction for future commuter rail service. The Dumbarton Rail Corridor (DRC) will extend commuter rail service across the bay between the Peninsula and the East Bay.

CALTRAIN DESIGN CRITERIA APPENDIX E
SEPTEMBER 30, 2011 E-2
C. CALTRAIN DESIGN DOCUMENTS AND GUIDELINES 1.0 CALTRAIN DESIGN STANDARDS
In 1994, Caltrain developed its first design standards and guidelines (PCJPB Standards, Volumes 1 and 2). These documents, drawn largely from former Southern Pacific’s standards, provided general guidelines to the construction and encroachment activities within the corridor. They were used for several projects (stations and grade separations) sponsored and managed by the Cities. In 1999, Caltrain developed its first design criteria and standard technical drawings for signals (Communication/ Signal Engineering Standards, and Communication/ Signal Design Standards), and for track (Track Standard Drawings). In 2007, the above documents (including all others as except those listed in APPENDIX B) were superseded by Caltrain Engineering Standards. These Standards, consisting of Design Criteria, Standard Drawings, and Standard Specifications were the first Caltrain comprehensive Engineering Standards. Together with ‘Standards for Maintenance and Construction of Structures” (2003), “Engineering Standards for Excavation Support System” (2003), and ‘CADD Manual’ (2003), they formed complete Caltrain Engineering Standards. This 2011 documents are the first revision of the above 2007 Standards.
2.0 CALTRAIN CONSTRUCTION DOCUMENTS
In 1999, Caltrain completed its first comprehensive construction documents for use on the 1998/99 Facility Upgrade Project (Ponderosa). The construction documents included General Conditions (Division 0) and Special Provisions (Division 1) and Standard Specifications (Divisions 2 through 16 and 18). These documents, including the construction drawings, have since been used as a basis for design and construction of subsequent capital and maintenance projects. They were also the basis for the development of the Caltrain Engineering Standards 2007.
3.0 CALTRAIN SIGNAL SYSTEM MIGRATION 3.1 Migration of Caltrain Signal System Defined as Bidirectional The Migration of the Caltrain Signal System was defined as follows:
1. Replacement of Relay Based Systems with Microprocessor based ones: All areas outside the San Francisco and San Jose Terminals completed in 2006.
2. Replacement of telephone leased lines with Advanced Train Control System
(ATCS) Radio: ATCS Radio is the primary medium of train control communication with Telco back up at 80% of the Control Points completed in 2003.
CALTRAIN DESIGN CRITERIA APPENDIX E
SEPTEMBER 30, 2011 E-3
3. Replacement of dc track circuits and line circuits with Electronic Coded Track circuits: OS (On Station) tracks remain dc and there are some dc track circuits in locations where the coded track is on line circuits completed in 2003.
4. Replacement of system of single direction running ABS (Automatic Block System) with double direction running CTC: Completed in 2003 with the completion of the construction of Caltrain CTX projects.
5. Installation of a Positive Train Control System 6. Implementation of a signal system that will also function in an electrified
environment By defining the path of migration, projects today will lay the groundwork for future
projects. Since the railroad was originally defined as single direction running, many highway grade crossings were designed for greatly reduced speeds in the reverse direction. In times where one track is removed from service due to construction, or operational difficulties, the service disruption was magnified by the reduced speed required over these crossings.
Once the path of migration was defined as a bidirectional running railroad on both
tracks, grade crossings were designed to accommodate the ultimate 79 MPH (miles per hour) operation on both tracks. Non-signaled moves are limited by Federal regulation to 59 MPH. The crossings were designed to allow for 79 MPH operation when the track became signaled in both directions. This approach avoided costly retrofit or replacement when the implementation of the signal migration for the whole corridor took place.
3.2 Migration to Centralized Traffic Control (CTC) Caltrain has successfully migrated to Centralized Traffic Control (CTC). With the
construction of express tracks and a track structure of numbers 20 (Limited Speed), 14 (Medium Speed) and 10 (Slow Speed) powered turnouts, it became apparent that the Route Signal Aspects would not support the optimal operation. Speed Signaling was placed in service north of CP Coast. Speed Signaling alerts the train operator when the train is approaching a higher speed turnout. Different aspects are displayed for moves through number 20 turnouts, number 14 turnouts, and number 10 turnouts. In a Route Signal System, a train only knows it is to take a diverging route and must approach a control point with different sized turnouts prepared to take the turnout at the lowest speed of any turnout, which can be reached, from that signal.
Control Points have been designed to accommodate the presently funded projects,
and as much as possible, facilities were sized to allow for future projects. Currently trains are governed by wayside signals. In the future, there will be some on board enforcement of signal indications. With increased rail traffic, this important safety feature will be necessary. Express train operation may call for trains to operate at greater than 79 MPH. This too will require on board control of locomotives by the

CALTRAIN DESIGN CRITERIA APPENDIX E
SEPTEMBER 30, 2011 E-4
signal system. Whether it is a form of intermittent automatic train stop, or a form of automatic train control, the present system has been designed to allow for the addition of the new equipment.
3.3 Signal System and Future Electrification Caltrain Board of Directors have mandated future electrification of the Caltrain
corridor. Equipment installed today must be sized to allow for the addition of necessary filtering and other equipment required for operation in a high noise traction power environment. Funding guidelines prohibit purchasing equipment for projects other than that funded. However, an intelligent design with a defined path of migration, allows for the future projects to build upon the present projects, and for newly installed equipment to be reused as much as possible.
The migration path has been defined as moving the Caltrain signal system from a
single-direction running automatic block between Control Points, to one of bidirectional CTC with express tracks. This has been accomplished. Relay logic is being replaced with programmable solid state microprocessor based logic. Leased telephone lines are being replaced with ATCS radios. Caltrain’s new criteria on signal system uses Electrode 4+ Code Rates. While this is a system manufactured by GETS, the code rate structure is an open architecture and can be emulated by competitive vendors. This equipment can be augmented to operate in an electrified environment, and it can support on board train control equipment.
3.4 Signal System at Pedestrian Crossings In addition to the high number of motor vehicles, which cross the railroad, there are a
large number of pedestrians who cross the Caltrain tracks. The safest crossing for both pedestrians and motorists is one which is at a separate grade, either over or under the tracks. The ideal scenario is to have no at grade crossings. In the meantime, necessary crossing points for pedestrians are to be treated in the same manner as necessary crossings for motorists. These will have microprocessor based Constant Warning Time systems, and pedestrian gates. At stations, and on sidewalks where major work is taking place, auxiliary sidewalk gate arms will be added to the roadway gate, and a new gate assembly will be installed in the off quadrant on the sidewalk for pedestrians.
This Caltrain Design Criteria incorporates many lessons learned from recent
projects, a commitment to the judicious use of public funds by defining the migration path, and recognizing the risk inherent to pedestrians and vehicles crossing the railroad at grade.
4.0 CALTRAIN GRADE CROSSINGS
The Caltrain line is the oldest passenger line west of the Mississippi. As such, it has been a double track operation through the city centers of a major west coast metropolitan area for over 100 years. Grade crossing control systems have evolved to enhance public safety and to provide more efficient train operations.

CALTRAIN DESIGN CRITERIA APPENDIX E
SEPTEMBER 30, 2011 E-5
4.1 Vehicular Crossings
The former Southern Pacific Railroad (SP) developed several innovative treatments for the grade crossing control systems. Among these treatments was a series of calibrated track circuits where speed measurements were used to determine whether a train approaching a grade crossing was going to stop short of the crossing, or go through the crossing. These applications were costly in terms of relays, insulated joints and cabling. In the 1960’s, in order to enhance the operation through grade crossing, the SP, in partnership with Stanford University sponsored the development of Constant Warning Time devices, known as predictors. In 1990, as part of the rehabilitation of the property as a condition of sale to the State of California, the SP upgraded 10 vehicular crossings with “next generation” microprocessor based Constant Warning Time devices. These crossings were Broadway Avenue (Burlingame), Holly Street, Watkins Avenue, Rengstorff Avenue, Castro Avenue, Sunnyvale Avenue, Stockton Avenue, Lenzen Avenue, Auzerais Avenue, and Virginia Street. The benefits of the upgrade are enhancement to both vehicular and train operations through the crossings. As part of the 1998/1999 Facility Upgrade project (Ponderosa), Caltrain began an extensive vehicular grade crossing rehabilitation. The three most important components of the rehabilitation are installation of new signal control equipment, removable concrete panels, and drainage system. There have since been several projects of rehabilitating the grade crossings.
4.2 Pedestrian Crossings at Stations In 1998, during the construction of BART extension to the San Francisco Airport (BART SFO Extension), it became necessary to relocate the San Bruno station to just north of I-380 Overpass. Since this area was just north of a 3 degree track curve, it was observed that a person crossing the tracks would have only about 5 seconds to visually detect an approaching northbound train. To complicate the matter further, the area was also a high noise environment with both the freeway and the flight paths to San Francisco Airport (SFO) being directly overhead. The permanent San Bruno station is now just south of the I-380 overpass.
4.3 Caltrain Grade Crossing Standards The need was clear to reevaluate the pedestrian at-grade crossings. There are, however, no nationally or state recognized standards for the design of pedestrian crossing warning systems on railroads. This was the catalyst for the development of the Caltrain Pedestrian crossing at stations. At its own initiative, Caltrain, in collaboration with Signal and other Consultants developed its own recommended practices of pedestrian grade crossing configuration at stations.

CALTRAIN DESIGN CRITERIA APPENDIX E
SEPTEMBER 30, 2011 E-6
These resulting standards utilize active warning devices similar to those of vehicular crossings, signal equipment modified from that of vehicular crossing, crossing gate arm, and a crossing configuration. These standards are an example of the integrated effort required from the various disciplines to provide a safe and effective means for pedestrians to cross the tracks. This prototype was first used at the relocated San Bruno station, and during the Ponderosa project at the San Mateo, Hayward Park, Redwood City, Menlo Park and Mountain View stations. In 2004, the then new San Bruno Station was built to this standard, and the Sunnyvale station was brought into conformance with this standard.
D. CALTRAIN TODAY 1.0 CALTRAIN SERVICES Currently Caltrain’s service includes Express (“Baby Bullet”) service on top of a blend
of local, skip stop, and limited express services. Caltrain is a diesel push-pull system operating over a mostly double track line, with a small amount of three and four track sections of bypass tracks. All trains operate at the maximum authorized speed (MAS) of 79 miles per hour. Average ridership is over 32,000 passengers (2006).
The Baby Bullet service (or Express service) began in June 2004. The current
service includes 11 morning and 11 afternoon/evening weekday trains, shortening the commute time between San Francisco and San Jose to just under one hour. Baby Bullet trains make up time by stopping at fewer stations and by bypassing other trains.
Caltrain’s current commuter service includes (2011), which is reduced from a high of
96 trains on weekday.
a. 86 scheduled weekday trains (including 22 express service, and 28 limited express service)
b. 36 (Saturday) and 32 (Sunday) scheduled trains including 4 express service each weekend day
c. 34 Stations, most with parking d. About 40 bicycle spaces per train consist e. Transfer to San Francisco MUNI system at 4th and King Station f. Transfer to BART system at Millbrae Station g. Transfer to VTA system at Mountain View Station h. Transfer to VTA, Capitol Corridor, and Amtrak at San Jose Diridon Station i. Transfer to Altamont Corridor Express (ACE) at Santa Clara Station and San
Jose Diridon Station 2.0 CALTRAIN CORRIDOR ASSETS Caltrain corridor assets include the following.
a. 77 route miles b. 105 miles of main tracks and controlled sidings

CALTRAIN DESIGN CRITERIA APPENDIX E
SEPTEMBER 30, 2011 E-7
c. 34 passenger stations (67 boarding platforms) d. 31 locomotives, 112 cars, including 34 cab cars e. 106 support buildings and station buildings f. 65 railroad bridges, 13 pedestrian underpasses, and 4 tunnels g. 31 control points h. 48 grade crossings between San Francisco and San Jose i. 38 grade crossings between San Jose and Gilroy j. 612 acres fee owned operating rail corridor k. 79 acres of easement operating rail corridor
For more details, see Caltrain Track Charts, Right-of-Way and Rail Corridor
Infrastructure Assets.


CALTRAIN DESIGN CRITERIA APPENDIX F
SEPTEMBER 30, 2011 F-1
APPENDIX F
ROLLING STOCK A. CARS
Nippon-Sharryo : Quantity: 52
Weight: 118,000 lbs Length: 85 ft
Bike 32: No Nippon-Sharryo :
Quantity: 14 Weight: 122,000 lbs Length: 85 ft
Bike 32: No Nippon-Sharryo :
Quantity: 21 Weight: 125,000 lbs Length: 85 ft
Bike 32: Yes Nippon-Sharryo :
Quantity: 6 Weight: 127,000 lbs Length: 85’
Bike 32: Yes Bombardier :
Quantity: 10 Weight: 119,000 lbs Length: 85 ft
Bike 32: No Bombardier :
Quantity: 5 Weight: 122,000 lbs Length: 85 ft
Bike 16: Yes Bombardier :
Quantity: 2 Weight: 122,000 lbs Length: 85 ft
Bike 16: No
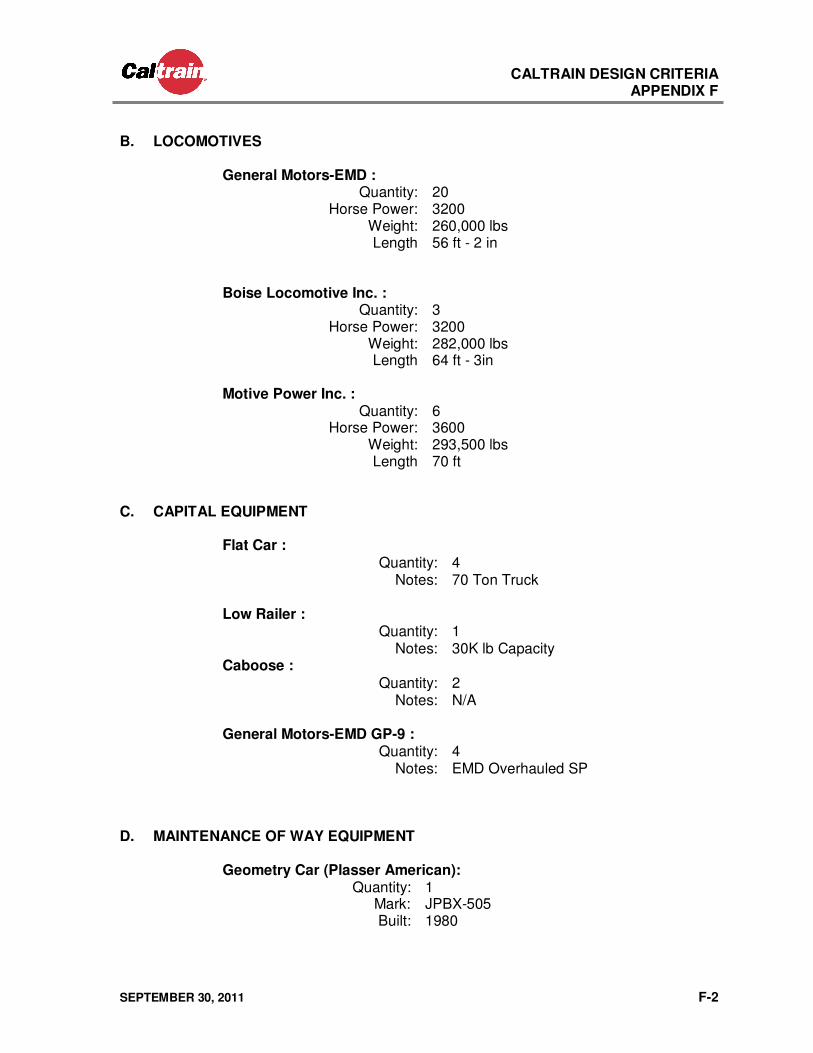
CALTRAIN DESIGN CRITERIA APPENDIX F
SEPTEMBER 30, 2011 F-2
B. LOCOMOTIVES
General Motors-EMD : Quantity: 20
Horse Power: 3200 Weight: 260,000 lbs Length 56 ft - 2 in
Boise Locomotive Inc. :
Quantity: 3 Horse Power: 3200
Weight: 282,000 lbs Length 64 ft - 3in
Motive Power Inc. :
Quantity: 6 Horse Power: 3600
Weight: 293,500 lbs Length 70 ft
C. CAPITAL EQUIPMENT
Flat Car : Quantity: 4
Notes: 70 Ton Truck Low Railer :
Quantity: 1 Notes: 30K lb Capacity
Caboose : Quantity: 2
Notes: N/A General Motors-EMD GP-9 :
Quantity: 4 Notes: EMD Overhauled SP
D. MAINTENANCE OF WAY EQUIPMENT
Geometry Car (Plasser American): Quantity: 1
Mark: JPBX-505 Built: 1980

CALTRAIN DESIGN CRITERIA APPENDIX F
SEPTEMBER 30, 2011 F-3
Track Stabilizer (Plasser PTS-62): Quantity: 1
Built: 2009 GP-9 :
Quantity: 2 Horse Power: 1750
Built: 1959
MP 15DC : Quantity: 2
Horse Power: 1500 Built: 1974
Caboose :
Quantity: 2 Built: 1974
Flat Car :
Quantity: 8 Gondola :
Quantity: 1 Model: E530
Built: 1976 Hopper, Ballast :
Quantity: 6 Mark: JPBX
Capacity: 100 tons Hopper, Ballast :
Quantity: 15 Mark: AMTK
Capacity: 100 tons Difco M110 Side Dump :
Quantity: 3 Capacity: 100 tons
Built: 1978


CALTRAIN STATIONS AND FACILITIES
SUSTAINABILITY DESIGN CRITERIA
Prepared for Caltrain by Mary Nowee and ……….
Under Work Directive No. 5250
Submitted: June 28, 2011

TABLE OF CONTENTS
1. GENERAL
1.1. CALTRAIN POLICY 1.2. SCOPE AND APPLICABILITY
2. REFERENCE STANDARDS AND PRACTICES 2.1. GOVERNMENT 2.2. INDUSTRY
3. PLANNING AND DESIGN 3.1. SITE SELECTION AND OPTIMIZATION 3.2. TRANSIT‐ORIENTED DEVELOPMENT 3.3. REDUCE IMPACT OF PROJECT SITE
4. ENERGY EFFICIENCY 4.1. PASSIVE DESIGN 4.2. BUILDING ENVELOPE 4.3. BUILDING MECHANICAL SYSTEMS 4.4. LIGHTING 4.5. TOTAL BUILDING PERFORMANCE 4.6. ON‐SITE RENEWABLE ENERGY SYSTEMS
5. WATER EFFICIENCY AND CONSERVATION 5.1. LANDSCAPE 5.2. PLUMBING FIXTURES 5.3. VEHICLE WASHER
6. MATERIALS CONSERVATION AND RESOURCE EFFICIENCY 6.1. LIFE CYCLE EVALUATION OF FACILITIES 6.2. EVALUATION OF MAJOR BUILDING MATERIALS AND ASSEMBLIES 6.3. EVALUATE AND SPECIFY MATERIALS AND CONSTRUCTION PRACTICES 6.4. CONSTRUCTION WASTE REDUCTION, DISPOSAL AND RECYCLING 6.5. SUSTAINABLE MATERIALS AND POLLUTANT CONTROL 6.6. OPERATION AND MAINTENANCE
7. ENVIRONMENTAL QUALITY 7.1. CONSTRUCTION INDOOR AIR QUALITY PLAN 7.2. INDOOR AIR QUALITY (IAQ) 7.3. LIGHTING AND VIEWS 7.4. ACOUSTICAL AND VIBRATION CONTROL
8. ABBREVIATIONS AND DEFINITIONS
CALTRAIN STATIONS AND FACILITIES ‐ SUSTAINABILITY DESIGN CRITERIA ______________________________________________________________________________
2 of 17
1.0 GENERAL
These design criteria establish requirements for sustainability for Caltrain infrastructure development and improvements, in particular for stations and facilities. Sustainability refers to meeting the needs of today without sacrificing the capacity of future generations to meet their own needs.
1.1 CALTRAIN POLICY
It is Caltrain’s intent to follow the general policy commitment of SamTrans (San Mateo County Transit District) in regards to sustainability as follows:
1. Deploy sustainability‐themed programs that encourage the use of public transit and that support our local communities.
2. Evaluate and improve the long‐term resource efficiency of our facilities and equipment, including the life cycle return on investment.
3. Streamline business practices to reduce waste and improve operational effectiveness.
4. Educate and incentivize Caltrain employees to integrate sustainability practices into their work and their personal lives.
5. Encourage business partners to incorporate sustainability practices into their own operations
6. Measure the environmental impacts of our activities on an ongoing basis, and set and meet targets to reduce our impacts.
1.2 SCOPE AND APPLICABILITY
These design criteria concern new facilities, refurbishment or renovation of existing facilities. Their purpose is to integrate sustainable design into Caltrain facility development, renovation and maintenance, including the following areas:
1. Planning and Design 2. Energy Efficiency 3. Water Efficiency and Conservation 4. Materials Conservation and Resource Efficiency 5. Environmental Quality
Caltrain capital improvement projects shall establish project specific sustainability goals, following the framework of the California Building Code, Part 11, Green Building Standards Code (CalGreen). New construction shall comply with CalGreen Nonresidential Mandatory Measures and these design criteria. Renovation and rehabilitation projects shall develop project specific goals following these design criteria and the general principles and design considerations per CalGreen.

CALTRAIN STATIONS AND FACILITIES ‐ SUSTAINABILITY DESIGN CRITERIA ______________________________________________________________________________
3 of 17
Compliance with CalGreen Nonresidential Voluntary Measures, including Tier 1 and Tier 2, shall be considered and added based on cost/benefit considerations. CalGreen Tier 1 and Tier 2 measures are intended to further encourage incorporation of additional green building practices that improve public health, safety, and welfare as well as encourage environmental sustainability.
Designers for each project shall complete a sustainability design compliance checklist, detailing sustainability targets for each area.
2.0 REFERENCE STANDARDS AND PRACTICES
2.1 GOVERNMENT
1. California Code of Regulations, Title 24
a. Part 6, California Energy Code (CEC)
http://www.energy.ca.gov/2008publications/CEC‐400‐2008‐001/CEC‐400‐2008‐001‐CMF.PDF
b. Part 11, Green Building Standards Code (CalGreen)
http://www.documents.dgs.ca.gov/bsc/CALGreen/2010_CA_Green_Bldg.pdf
2. California Division of the State Architect Environmentally Preferable Products Database
http://www.dgs.ca.gov/Default.aspx?alias=www.dgs.ca.gov/buyinggreen
3. Comprehensive Procurement Guidelines (CPG) website ‘buy‐recycled’ product list
http://www.epa.gov/epawaste/conserve/tools/cpg/index.htm
4. Environmental Protection Agency (EPA) Environmentally Preferred Purchasing. This site is useful for consumers, particularly those engaged in sustainable design projects, to find and evaluate green products, services and tools.
http://www.epa.gov/epp/index.htm
5. Transit Green Building Action Plan, a Report to Congress. Federal Transit Administration (FTA), July 2009
http://www.fta.dot.gov/documents/Transit_Green_Building_Action_Plan.pdf

CALTRAIN STATIONS AND FACILITIES ‐ SUSTAINABILITY DESIGN CRITERIA ______________________________________________________________________________
4 of 17
2.2 INDUSTRY
1. American National Standards Institute (ANSI). Standards developed in conjunction with the American Society of Heating, Refrigerating, and Air‐Conditioning Engineers.
2. American Society of Heating, Refrigerating, and Air‐Conditioning Engineers (ASHRAE) 189.1‐ 2009, Standard for the Design of High‐Performance Green Buildings Except Low‐rise residential:
http://www.ashrae.org/publications/page/927
3. American Society of Heating, Refrigerating, and Air‐Conditioning Engineers (ASHRAE), 62.1‐2010, Ventilation for Acceptable Indoor Air Quality.
4. American Public Transit Association (APTA) Transit Sustainability Guidelines: Framework for Approaching Sustainability and Overview of Best Practices.
http://www.aptastandards.com/LinkClick.aspx?fileticket=FWiDPdAQdU8%3d&tabid=330&mid=1686&language=en‐US
5. Collaborative for High Performance Schools (CHPS) criteria, 2009
6. National Institute of Standards and Technology’s (NIST). Building for Environmental and Economic Sustainability (BEES) 3.0, Building for Environmental and Economic Sustainability Technical Manual and User Guide.
http://www.nist.gov/el/economics/BEESSoftware.cfm
7. Resilient Floor Covering Institute (RFCI) FloorScore Program
8. US Green Building Council Leadership (USGBC) in Energy and Environmental Design (LEEDTM) Green Building Rating System for New Construction (NC); Existing Buildings: Operations and Maintenance (EB:O&M); and Neighborhood Development (ND).
http://www.usgbc.org/
3.0 PLANNING AND DESIGN
3.1 SITE SELECTION AND OPTIMIZATION
Site selection shall optimize transit use and access, including intermodal opportunities such as pedestrian and bike routes, and the potential for transit‐oriented development
CALTRAIN STATIONS AND FACILITIES ‐ SUSTAINABILITY DESIGN CRITERIA ______________________________________________________________________________
5 of 17
(TOD). Site selection shall comply with the Nonresidential Voluntary Measures described in Section A5.103 of CalGreen concerning community connectivity and brownfield and greyfield sites and shall avoid site disturbance or development on previously undeveloped land having an elevation lower than 5 feet above the elevation of the 100 year flood as defined by USFEMA.
Consideration should be given to locating facilities in an existing building envelope, on a brownfield site, or on a greyfield site. A brownfield site is a site that is contaminated or potentially contaminated, and a greyfield site is one which is previously developed with impervious surfaces over 50 percent or more of site.
3.2 TRANSIT‐ORIENTED DEVELOPMENT
Caltrain supports and encourages community planners to explore opportunities to develop transit‐oriented development (TOD) adjacent to Caltrain facilities. TODs are mixed‐use, walkable communities developed around transit stops.
1. In developing opportunities for TOD at existing or proposed Caltrain stations, consider exercising the principles of high‐performance, sustainable neighborhoods, as addressed in the LEED for Neighborhood Development (ND) guidance, and in compliance with potential local Sustainable Communities planning requirements under SB 375.
2. Consider modifications at existing facilities that would support the construction and operation of TOD on or adjacent to Caltrain property.
3. Parking is an important factor in TOD. Housing developed in close proximity to a station should include fewer parking spaces per unit than is typically required. Consider replacing station surface parking with a parking structure freeing up land for TOD. Since parking may be plentiful at stations after hours and on weekends, TOD may incorporate attractions that draw primarily after‐hours patrons that could share station parking facilities.
3.3 REDUCE IMPACT OF PROJECT SITE
Designers and planners shall consider the range of impacts, including erosion, stormwater, heat island effect, light pollution, noise, and vibration, a site can have on the surrounding community, and investigate means to reduce those impacts.
1. Stormwater: Limit disruption and pollution of natural water flows by managing stormwater runoff.1
1 LEED NC SS 6.1 or LEED ND GIB credit 8 are relevant areas of the USGBC system that pertain to this topic.

CALTRAIN STATIONS AND FACILITIES ‐ SUSTAINABILITY DESIGN CRITERIA ______________________________________________________________________________
6 of 17
a. Stormwater design: Design stormwater system in accordance with the Nonresidential Voluntary Measures of the CalGreen Code or local requirements, whichever are stricter.
b. Use site planning, design, construction, and maintenance strategies to maintain or restore, to the maximum extent technically feasible, the predevelopment hydrology of sites with regard to the temperature, rate, volume, and duration of flow.
c. Evaluate multiple techniques to limit disruption and pollution of natural stormwater flows including: i. Minimize impervious surfaces through use of pervious paving and other
elements ii. Raingardens, or bioretention areas, are planted depressions that allow the
collection, filtration, and infiltration of rainwater runoff from impervious surfaces
iii. Vegetative roof treatments iv. Collect stormwater and use it for site irrigation, toilet and urinal flushing,
and custodial uses
2. Mitigation of heat island effect on both hardscapes and roofs (CalGreen A5.106.11): The term "heat island" describes built up areas that are hotter than nearby rural areas. Heat islands can affect communities by increasing summertime peak energy demand, air conditioning costs, air pollution and greenhouse gas emissions, heat‐related illness and mortality, and water quality.
Site Hardscape (For the purposes of this requirement, a site’s hardscape includes roads, sidewalks, courtyards, and parking lots, but not constructed building services, or any portion covered by photovoltaic panels generating electricity or other solar energy systems): Designers shall evaluate providing at least 50 percent of the site hardscape with one or any combination of the following or put 50 percent of parking underground.
a. Existing trees and vegetation or new bio‐diverse planting or native plants and adapted plants located to provide shade within five years.
b. Paving materials with a minimum initial Solar Reflectance Index (SRI) of 0.29. This applies to porous pavers, and open‐graded aggregate materials as well as conventional pavement. These materials should be light colored and high‐albedo.
c. Shading through the use of structures, provided that the top surface of the shading structure complies solar reflectance and thermal requirements in CalGreen A5.106.11.
d. Building or structures that provide shade to the site hardscape.

CALTRAIN STATIONS AND FACILITIES ‐ SUSTAINABILITY DESIGN CRITERIA ______________________________________________________________________________
7 of 17
e. Use open‐grid pavement system for non‐walking surfaces. Open‐grid pavement is a system that is less than 50 percent impervious and contains vegetation in open cells. Special design considerations shall be given to ensure even walking surfaces and ease of maintenance.
3. Light Pollution: In addition to following Caltrain’s design criteria for lighting, follow CalGreen requirements in Section 5.106.8 regarding light pollution and design interior and exterior lighting such that zero direct‐beam illumination leaves the building site. This shall eliminate, to the extent possible, light trespass from the buildings and site to improve night sky access and reduce the impact of facilities on nocturnal environments.
4. Noise and Vibration: Per Caltrain’s Design Criteria, the designer shall consider noise and vibration mitigation as part of facility development. The object of this design requirement is to minimize the impacts to the adjacent residents from train loads and traffic.
4.0 ENERGY EFFICIENCY
Designers shall evaluate opportunities for buildings to achieve exemplary performance in the area of energy efficiency, and in compliance with the goal stated in CalGreen Section A5.201 designers shall evaluate methods to achieve at least a 15 percent reduction in energy usage when compared to the State’s mandatory efficiency standards.
4.1 PASSIVE DESIGN
Passive design strategies are the lowest cost way to minimize energy consumption for buildings and facilities. Optimally orient the station or facility to minimize heat gain in summer, while maximizing natural light. Consider solar orientation, wind direction, and natural features.
4.2 BUILDING ENVELOPE
1. Design building envelope to optimize energy efficiency including the following:
a. Provide adequate insulation b. Utilize cool roofing to decrease heat gain through roof and to reduce heat island
effect c. Place windows and skylights to provide natural lighting while using glazing
types, shading, and orientation to reduce heating and air conditioning energy use.

CALTRAIN STATIONS AND FACILITIES ‐ SUSTAINABILITY DESIGN CRITERIA ______________________________________________________________________________
8 of 17
d. Optimize natural ventilation through use of operable windows, vents, and other devices.
e. Optimize building tightness to increase heating and cooling efficiencies during periods when natural ventilation is not sufficient for comfort.
2. Building Envelope Requirements:
The building envelope shall comply with the relevant code criteria, including the CalGreenCode and California Energy Code (CEC). Designers shall comply to the extent practicable with CalGreen Section A5.205.
4.3 BUILDING MECHANICAL SYSTEM
Optimize building mechanical systems energy use through maximizing systems performance and using energy efficient appliances and equipment.
Designers shall select energy efficient appliances and equipment (EnergyStar and Environmentally Preferred Purchasing).
4.4 LIGHTING
Maximize lighting system performance through selection of energy efficient equipment and controls and incorporating natural lighting to the extent practical. Lighting shall comply with the Nonresidential Voluntary Measures in CalGreen A5.209.
4.5 TOTAL BUILDING PERFORMANCE
1. New facilities should be commissioned in a manner that is equal to the provisions of CalGreen Nonresidential Mandatory Measures Section 5.410.2, or preferably, Voluntary Measures Section A504.4. Commissioning is a systematic process that starts during design and helps assure that building performance meets project requirements, including energy efficiency, air quality, and water conservation.
2. Consider the following in the design and operations and maintenance of facilities for optimum energy efficiency and other performance criteria:
a. Utilize building controls / automation and reporting systems to help ensure optimum energy use. Allow for optimization of building performance and energy and water consumption over time.
b. Recommend a program of periodic re‐commissioning of buildings to check and then adjust building mechanical and other systems.
c. Incorporate and optimize energy and environmental control devices and procedures as follows:

CALTRAIN STATIONS AND FACILITIES ‐ SUSTAINABILITY DESIGN CRITERIA ______________________________________________________________________________
9 of 17
i. Incorporate, commission, and maintain control and monitoring devices including CO2 monitoring sensors; energy monitoring/optimization devices; and temperature, ventilation, and humidity control devices.
ii. Add control devices to existing facilities for optimum energy and environmental performance.
iii. Establish and perform procedures including calibration and validation of control devices and sampling for air quality.
3. Energy Budget:: Achieve a level of energy performance above that required by the California Energy Code by reducing energy costs compared to the energy cost budget for energy systems as demonstrated by a whole building simulation using the performance approach described in CalGreen Section A5.203
4.6 ON‐SITE RENEWABLE ENERGY SYSTEM
Evaluate and consider implementing on‐site renewable energy systems that provide at least 1 percent of the electric power for each facility. Calculation and documentation should comply with CalGreen A 5.211.
5.0 WATER EFFICIENCY AND CONSERVATION
5.1 LANDSCAPE
Comply with CalGreen Division 5.3 and, to the extent practicable, with the Nonresidential Voluntary Measures, Division A 5.3, in the CalGreen Code and the following requirements.
1. Landscaping and any landscape irrigation system shall be designed to be water‐efficient and to reduce or eliminate the need for irrigation, herbicides, pesticides, and fertilizers. Plant selection shall be done in accordance with water conservation strategy. At minimum, 60% of the landscaping shall be in bio‐diverse planting of native plants and adapted plants. In general, landscaping shall not include turfgrass.
2. Irrigation system design: Design irrigation system so that it will deliver the amount of water the specific plants need. Where practical, group plants by how much irrigation water they need. The goal for landscaping should be to eliminate the need for potable water in the irrigation system and maximize the use of rain water catchment, drip irrigation systems, and recycled water from water treatment facilities. Alternatively, eliminate the need for a permanent irrigation completely through plant selection. The irrigation system shall be controlled by a smart

CALTRAIN STATIONS AND FACILITIES ‐ SUSTAINABILITY DESIGN CRITERIA ______________________________________________________________________________
10 of 17
controller. A smart controller is a device with moisture sensors so that irrigation systems only operate when soil is dry and there is no pending rainfall.
3. Use recycled water for landscape irrigation where available. Where landscape irrigation is provided and no recycled water source is available, design system for conversion to recycled water whenever such becomes available at the site.
5.2 PLUMBING FIXTURES
Comply with the mandatory measures of CalGreen Division 5.3 and to the extent practicable with the Nonresidential Voluntary Measure in the CalGreen Code.
Plumbing fixtures (water closets and urinals) and fittings (faucets and showerheads) shall be water efficient and comply with CalGreen Section 5.303.
5.3 VEHICLE WASHER
Minimize the amount of vehicle wash water usage. Filter, recycle, and reuse vehicle wash water.
6.0 MATERIAL CONSERVATION AND RESOURCE EFFICIENCY
6.1 LIFE CYCLE EVALUATION OF FACILITIES
To optimize the facility’s performance over its entire life‐span, an analysis of life cycle value of the facility should be performed as part of evaluating construction materials and systems. A life cycle value of a facility shall consist of the initial investment, operability, maintainability, longevity, and life cycle operational and maintenance costs, as well as its reusability and adaptability. Life cycle value considers the total performance of materials and assemblies in an objective, balanced approach.
6.2 EVALUATION OF MAJOR BUILDING MATERIALS AND ASSEMBLIES
To optimize the embodied impacts (e.g. land use, resource use, climate change, ozone layer depletion, human health effects, ecotoxicity, smog, acidification, and eutrophication) of the facility due to materials, consider making a life cycle analysis evaluation of major building materials and assemblies to reduce consumption of natural resources and reduce the impact on the natural environment using Building for Environmental and Economic Sustainability (BEES), Athena Impact Estimator, or equivalent method acceptable to Caltrain, in accordance with ISO Standard 14044. 2
2 BEES software incorporates a technique for balancing environmental and economic performance o f building projects. It includes actual environmental and economic performance data for a number of building products.

CALTRAIN STATIONS AND FACILITIES ‐ SUSTAINABILITY DESIGN CRITERIA ______________________________________________________________________________
11 of 17
Consult http://www.wbdg.org/tools/tools_cat.php?c=3 for BEES and Athena Impact Estimator software and other analysis tools to assist with life cycle analysis.
The designers should use the results of the evaluation to select the alternative that has a 5% improvement over other alternatives assessed in the life cycle analysis, in a minimum of two impact categories .
6.3 EVALUATION AND SPECIFICATION OF MATERIALS AND CONSTRUCTION PRACTICES
Evaluate materials and assemblies and configure construction contract requirements to reduce consumption of natural resources and reduce the impact on the natural world.
1. Incorporate recycled materials into transit projects when transit‐specific requirements are met, (including longevity, durability, low‐maintenance), and favor post‐consumer recycled content.
2. Favor materials that can be further reused within the transportation system or recycled at the end of their useful life within the transportation system.
Designers shall use tools such as EPA’s Environmentally Preferred Purchasing and Comprehensive Procurement Guidelines in selecting materials and assemblies. Designers shall incorporate selected materials and assemblies in construction contact documents.
Note: Materials traditionally considered environmentally preferable are not always best for transit systems. Designers shall select materials that meet both environmental and performance objectives.
6.4 CONSTRUCTION WASTE REDUCTION, DISPOSAL AND RECYCLING
Require that construction contractors and demolition contractors shall develop a construction waste management plan for diverted materials according to CalGreen Section 5.408, or meet local construction and demolition waste ordinances, whichever is more stringent. In addition to the construction waste reduction required under the CalGreen Code, consider requiring the enhanced construction waste reduction, Tier 1 or Tier 2, in accordance with the Nonresidential Voluntary Measures of the CalGreen Code.
1. All subcontractors shall comply with the contractor’s waste management plan. 2. Require in the construction contract that Caltrain projects generate the least
amount of waste possible by planning and ordering carefully, following proper storage and handling procedures to reduce broken and damaged materials, and reusing materials whenever possible.
Athena Institute’s Impactor Estimator for Building helps designers assess the environmental implications of new buildings and renovations to existing buildings.

CALTRAIN STATIONS AND FACILITIES ‐ SUSTAINABILITY DESIGN CRITERIA ______________________________________________________________________________
12 of 17
6.5 SUSTAINABLE MATERIALS AND POLLUTANT CONTROL
1. Heating, Ventilating, and Air Conditioning (HVAC) Equipment: Select equipment which utilizes no CFC and no HCFC‐based refrigerants, or ozone‐depleting materials. When appropriate, phase‐out CFCs in existing building HVAC equipment.
2. Install HVAC, refrigeration, and fire suppression equipment that do not contain halons.
3. Designers shall evaluate the use of sustainable materials as described in CalGreen Section A5.405.
4. Designers shall specify materials, equivalent in performance to virgin materials, with postconsumer or preconsumer recycled content value for a minimum of 10 percent of the total value, based on estimated cost of materials on the project.
5. Finish material pollutant control: Finish materials shall comply with CalGreen Sections 5.504.4.1 through 5.504.4.4. These sections detail standards for VOC limits, based on the local and regional air pollution control or air quality management district rules for California.
6. For floor area receiving resilient flooring, install resilient flooring complying with the VOC‐emission limits defined in the 2009 Collaborative for High Performance Schools (CHPS) criteria and listed on its Low‐emitting Materials List (or products registry) or certified under the Resilient Floor Covering Institute (RFCI) FloorScore program.
Also, consider the use of linoleum, a rapidly renewable product, where resilient flooring is required.
6.6 OPERATION AND MAINTENANCE
Establish and follow routine maintenance procedures to maintain and optimize HVAC equipment itself as well as of control devices.
Minimize pollution resulting from operation and maintenance.
1. Use environmentally preferred purchasing for lubricants, cleaning agents and paint. 2. Utilize methods that reduce pollution including methods that extend life of
lubricants and reduce pesticide, herbicide, and fertilizer use. 3. Recycle magnetic ballast and older fluorescent lamps containing poly‐chlorinated
biphenyls (PCBs) and other toxic chemicals in such a manner that potentially dangerous chemicals are safely reprocessed.

CALTRAIN STATIONS AND FACILITIES ‐ SUSTAINABILITY DESIGN CRITERIA ______________________________________________________________________________
13 of 17
7.0 ENVIRONMENTAL QUALITY
7.1 CONSTRUCTION INDOOR AIR QUALITY PLAN
In addition to the CalGreen Code requirements for Indoor Air Quality during construction, consider implementing the Nonresidential Voluntary Measures, Section A 5.504 for the construction and pre‐occupancy phases of buildings to prevent indoor air quality problems resulting from construction.
7.2 INDOOR AIR QUALITY
Indoor air quality shall be addressed throughout facilities’ life cycle including during construction and through operations and maintenance.
Design and operate facility to ensure indoor air quality as follows:
1. Incorporate indoor air quality procedures into construction contracts. Procedures shall include for protection of air quality in selection and application of materials and protection of permanent HVAC system from dust and other contaminants.
2. Ventilation requirements: The building shall comply with California Energy Code, 2008 Building Efficiency Standards, Section 121. Designers shall evaluate methods to increase ventilation rates above the minimum.
3. Outdoor air delivery monitoring: For spaces ventilated by mechanical systems, a permanently mounted, direct total outdoor airflow measurement device shall be provided that is capable of measuring the system minimum outdoor airflow rate.
4. Filtration Requirements: The particulate matter filters or air cleaners shall have a minimum efficiency reporting value (MERV) of not less than 8 and shall comply with and be provided for all regularly occupied areas of the building. Designers shall evaluate the use of MERV 13 filters for all regularly occupied areas of the building.
5. Building Entrance: All building entrances shall employ an entry mat system that shall have a scraper surface, an absorption surface, and a finishing surface. Each surface shall be a minimum of the width of the entry opening, and the minimum length, 6 feet, is measured in the primary direction of travel.
6. Thermal Comfort: The building shall be designed, at a minimum, to comply with A5.507 of CalGreen.
7. Low Emitting Materials: Select construction products to minimize indoor air pollution, in compliance with CalGreen 5.504. Comply to the extent practicable with CalGreen Nonresidential Voluntary Measures Section A 5.504.

CALTRAIN STATIONS AND FACILITIES ‐ SUSTAINABILITY DESIGN CRITERIA ______________________________________________________________________________
14 of 17
7.3 LIGHTING AND VIEWS
Design spaces and provide openings to visually connect the indoor environment and outdoor spaces, particularly the natural environment.
1. Daylight regularly occupied spaces 2. Provide quality lighting to maximize productivity and safety 3. Views: To the extent practicable, design spaces and provide openings to visually
connect the indoor environment and outdoor spaces, particularly the natural environment
7.4 ACOUSTIC AND VIBRATION CONTROL
Comply with CalGreen Section 5.507 concerning the selection of materials with appropriate Sound Transmission Class coefficient values and design indoor environments for comfort and audibility in regard to the acoustics and vibration. Control impact noise and vibration to the extent possible as part of ensuring occupants’ comfort and productivity.
8.0 ABBREVIATIONS AND DEFINITIONS
Abbreviations:
APTA American Public Transportation Association
ANSI American National Standards Institute
ASHRAE American Society of Heating, Refrigerating, and Air‐Conditioning Engineers
BEES Building for Economic and Environmental Sustainability
CEC California Energy Code
CFC Chlorofluorocarbon
CHPS Collaborative for High Performance Schools
CPG Comprehensive Procurement Guidelines
EPA Environmental Protection Agency
EPP EPA’s Environmentally Preferred Purchasing
FTA Federal Transit Administration
HCFC Hydrochloroflurocarbon
HVAC Heating, Ventilation and Air Conditioning
IAQ Indoor Air Quality
ISO International Standards Organization

CALTRAIN STATIONS AND FACILITIES ‐ SUSTAINABILITY DESIGN CRITERIA ______________________________________________________________________________
15 of 17
LCA Life Cycle Assessment
LEEDTM Leadership in Energy and Environmental Design
MERV Minimum Efficiency Reporting Value
NIST National Institute of Standards and Technology
PCB Poly‐Chlorinated Biphenyl
RFCI Resilient Floor Covering Institute
SB 375 State Bill 375 (California’s Sustainable Communities and Climate Protection Act)
SRI Solar Reflectance Index
TOD Transit Oriented Development
USFEMA United States Federal Emergency Management Agency
USGBC United States Green Building Council
VOC Volatile Organic Compound
Definitions:
Albedo: Synonymous with solar reflectance, which is a ratio of the energy reflected back into the atmosphere to the energy absorbed by the surface, with 100 percent being total reflectance.
Bioretention (raingarden): A shallow depression that utilizes conditioned soil and vegetation for the storage, treatment, or infiltration of storm water runoff
Brownfield Site: Real property, the expansion, redevelopment or reuse of which may be complicated by the presence or potential presence of a hazardous substance, pollutant or contaminant, with certain legal exclusions and additions.
Building Commissioning: A systematic quality assurance process that spans the entire design and construction process, including verifying and documenting that building systems and components are planned, designed, installed, tested, operated and maintained to meet the owner’s project requirements.
Chlorofluorocarbons (CFC): An organic compound, a hydrocarbon, commonly used as a refrigerant, with a direct environmental impact of ozone depletion.
Embodied Energy: The energy used for raw material extraction, transportation, manufacturing, assembly, installation and disposal during the life of a product, including the potential energy stored within the product.

CALTRAIN STATIONS AND FACILITIES ‐ SUSTAINABILITY DESIGN CRITERIA ______________________________________________________________________________
16 of 17
Energy Star: A joint program of the US Environmental Protection Agency and the US Department of Energy. Energy Star is a voluntary program designed to identify and promote energy‐efficient products and practices.
Eutrophication: A syndrome of ecosystem responses to human activities that fertilize water bodies with nitrogen (N) and phosphorus (P), often leading to degradation of water and habitat quality.
Greyfield site: Any site previously developed with at least 50 percent of the surface area covered with impervious material.
Graywater: Untreated household waste which has not come into contact with toilet waste. This includes water from bathtubs, showers, bathroom wash basins and water from clothes washing machines and laundry tubs.
Halons: A compound consisting of bromine, fluorine, and carbon, commonly used as a fire extinguishing agent. It contributes to ozone depletion.
Heat Island. Describes built up areas that are hotter than nearby rural areas.
Hydrochloroflourocarbons (HCFC): A refrigerant, a subclass of CFCs but containing hydrogen, developed as a substitute for CFCs. HCFCs do not deplete stratospheric ozone layer, but some have a high global warming potential, so are not environmentally benign.
Life Cycle Assessment (LCA): A technique to evaluate the relevant energy and material consumed and environmental emissions associated with the entire life of a product, process, activity or service.
Low Impact Development (LID): Control of stormwater at its source to mimic drainage services provided by an undisturbed site.
Permeable Paving: Permeable paving materials and techniques which allow the movement of water around the paving material and allow precipitation to percolate through the paving surface to the soil below.
Potable Water: Water that is drinkable and meets the US Environmental Protection Agency (EPA) Drinking Water Standards.
Recycled Water: Water which, as a result of treatment of waste, is suitable for a direct beneficial use or a controlled use that would not otherwise occur.
MERV: Filter minimum efficiency reporting value, based on ASHRAE 52.2‐1999

CALTRAIN STATIONS AND FACILITIES ‐ SUSTAINABILITY DESIGN CRITERIA ______________________________________________________________________________
17 of 17
Solar Reflectance Index: The fraction of the incident solar energy reflected by a given surface is its solar reflectance. Solar reflectance and thermal emittance are importance factors affecting surface and near‐surface ambient temperatures. Determination of solar reflectance and thermal emittance, and subsequent calculation of the relative temperature of the surfaces with respect to black and white reference temperatures is the Solar Reflectance Index (SRI).
Sound Transmission Class (STC): STC is a single number rating of the barrier effect of a material or assembly. Higher STC values are more efficient for reducing sound transmission.
Volatile Organic Compound (VOC): Carbon compounds with vapor pressures greater than 0.1 millimeters of mercury at room temperature, i.e., they become a gas at normal room temperatures. These compounds typically contain hydrogen and may contain oxygen, nitrogen, and other elements.