Embed Size (px)
Citation preview
6.8.3
Appendix 8.3: Ground Investigation Report
River Humber Gas Pipeline Replacement Project
Under Regulation 5(2)(a) of the Infrastructure Planning (Applications: Prescribed Forms and Procedure) Regulations 2009
D O
C U
M E
N T
Application Reference: EN060004
April 2015
Feeder 9 - River Humber Gas Pipeline Replacement Project
Ground Investigation Report 064298/F9/GEO/RPT/101 B
0
Property and Infrastructure
Feeder 9 - River Humber Gas
Pipeline Replacement Project
Ground Investigation Report
CS / 064298/F9/GEO/RPT/101 B
Feeder 9 - River Humber Gas Pipeline Replacement Project
Ground Investigation Report 064298/F9/GEO/RPT/101 B
i
Quality Management
Job No CS/064298
Project Feeder 9 - River Humber Gas Pipeline Replacement Project
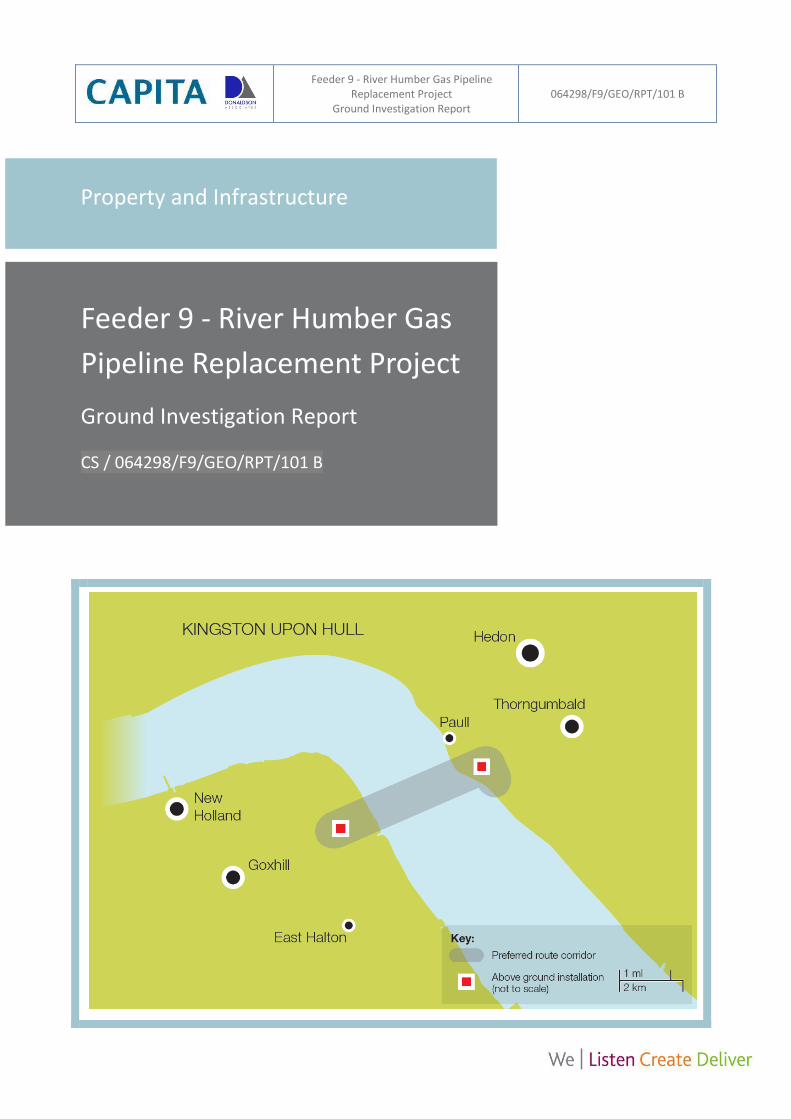
Location Paull & Goxhill, Humber Estuary
Title Ground Investigation Report
Document Ref 064298/F9/GEO/RPT/101 B Issue / Revision Rev B
Date 25th November 2014
Prepared by Sophie Norgate
Martin Huggins
Asanka Amarasinghe
Ben Tucker
Trevor Muten
Signature (for file)
Checked by Tim Connolly
Neil Greenwood
Signature (for file)
Authorised by Andrew Petch Signature (for file)
Authorised by NG Signature (for file)
Revision Status / History
Rev Date Issue / Purpose/ Comment Prepared Checked Authorised
A 16/09/2014 Interim SN, MH, AA, BT, TM
TC, NG AP
B 25/11/2014 Incorporating Client comments & updated lab results
SN, MH, AA, BT, TM
TC, NG AP
Document Hold Points
Hold Point Description

Feeder 9 - River Humber Gas Pipeline Replacement Project
Ground Investigation Report 064298/F9/GEO/RPT/101 B
ii
Contents
1. EXECUTIVE SUMMARY .................................................................................................................................. 1
2. INTRODUCTION ............................................................................................................................................ 4
2.1 SCOPE AND OBJECTIVE OF REPORT ...................................................................................................................... 4
2.2 DESCRIPTION OF PROJECT .................................................................................................................................. 4
2.3 GEOTECHNICAL CATEGORY OF PROJECT ................................................................................................................ 5
2.4 OTHER RELEVANT INFORMATION ........................................................................................................................ 5
3. EXISTING INFORMATION .............................................................................................................................. 6
3.1 SITE DESCRIPTION ............................................................................................................................................ 6
3.2 TOPOGRAPHY AND GEOMORPHOLOGY ................................................................................................................. 6
3.3 PUBLISHED GEOLOGY ........................................................................................................................................ 7
3.4 HYDROLOGY .................................................................................................................................................... 8
3.5 HYDROGEOLOGY .............................................................................................................................................. 8
3.6 CONTAMINATED LAND .................................................................................................................................... 10
3.7 INFORMATION FROM STATUTORY AUTHORITIES ................................................................................................... 13
3.8 FLOOD RECORDS ............................................................................................................................................ 14
3.9 ARCHAEOLOGICAL INVESTIGATIONS ................................................................................................................... 14
3.10 HISTORICAL GROUND INVESTIGATIONS ............................................................................................................... 14
3.11 MINING INSTABILITY AND NATURAL UNDERGROUND CAVITIES ................................................................................ 16
3.12 RECORDS OF SEISMIC ACTIVITY ......................................................................................................................... 16
3.13 AERIAL PHOTOGRAPHS .................................................................................................................................... 16
4. FIELD AND LABORATORY STUDIES ............................................................................................................... 17
4.1 WALKOVER SURVEY ........................................................................................................................................ 17
4.2 TOPOGRAPHICAL SURVEY ................................................................................................................................. 17
4.3 SERVICE SEARCH ............................................................................................................................................ 18
4.4 GEOPHYSICAL SURVEYS ................................................................................................................................... 18
4.5 GROUND INVESTIGATIONS ............................................................................................................................... 20
4.6 LABORATORY TESTING ..................................................................................................................................... 25
4.7 SCOPE CHANGES AND GROUND INVESTIGATION FEEDBACK ..................................................................................... 26
5. GROUND SUMMARY ................................................................................................................................... 30
5.1 GROUND CONDITIONS .................................................................................................................................... 30
5.2 GOXHILL GROUND CONDITIONS ........................................................................................................................ 32
5.3 HUMBER GROUND CONDITIONS ....................................................................................................................... 35
5.3 PAULL GROUND CONDITIONS ........................................................................................................................... 36
5.4 GROUNDWATER CONDITIONS ........................................................................................................................... 38
6. GROUND CONDITIONS AND MATERIAL PROPERTIES ................................................................................... 41
6.1 ALLUVIUM .................................................................................................................................................... 41
6.2 GLACIAL DEPOSITS ......................................................................................................................................... 49
6.3 FLAMBOROUGH CHALK ................................................................................................................................... 54
6.4 BURNHAM CHALK .......................................................................................................................................... 70
6.5 CHEMICAL TESTING ........................................................................................................................................ 80
6.6 SOIL GAS MONITORING RESULTS ...................................................................................................................... 87
Feeder 9 - River Humber Gas Pipeline Replacement Project
Ground Investigation Report 064298/F9/GEO/RPT/101 B
iii
6.7 GROUNDWATER ............................................................................................................................................. 88
7. ENGINEERING ASSESSMENT ........................................................................................................................ 96
7.1 GEOTECHNICAL PROPERTIES ............................................................................................................................. 96
7.2 GROUNDWATER PIEZOMETRY ........................................................................................................................... 97
7.3 GROUNDWATER CHEMISTRY ............................................................................................................................ 98
7.4 HYDROGEOLOGICAL / GROUNDWATER – PERMEABILITY DATA AND GROUNDWATER FLOW ............................................ 98
8. GEOTECHNICAL RISK REGISTER .................................................................................................................. 100
REFERENCES ............................................................................................................................................................. 108
GLOSSARY ............................................................................................................................................................... 110
DRAWINGS .............................................................................................................................................................. 115
FIGURES .................................................................................................................................................................. 116
Appendix A Geophysical survey
Appendix B Generic Assessment Criteria
Appendix C Groundwater/Gas Monitoring Field Data
Appendix D Geological Markers
Feeder 9 - River Humber Gas Pipeline Replacement Project
Ground Investigation Report 064298/F9/GEO/RPT/101 B
iv
List of Tables
Table 3.3.1 Generalised Geological Succession for Site Area
Table 3.6.2 Summary of Environmental Records Review
Table 3.6.1 Summary of Historic Land Uses
Table 3.10.1 Summary of Historical Ground Investigation Data
Table 4.5.1 Summary of Drilling Details and Installations for Land Boreholes
Table 4.5.2 Summary of Drilling Details for Marine Boreholes
Table 4.5.3 Summary of Specialist In situ Testing within Land Boreholes
Table 4.5.4 Summary of Specialist In situ Testing within Overwater Boreholes
Table 4.5.5 Summary of CPT Details
Table 4.5.6 Summary of Trial Pitting
Table 4.6.1a Summary of Geotechnical Testing - Soil
Table 4.6.1b Summary of Geotechnical Testing – Rock
Table 4.6.1c Summary of BRE SD1 Testing – Soil and Rock
Table 4.6.2 Summarised Geoenvironmental Testing
Table 4.7.1 Feedback from Drilling Operations
Table 5.1.1 Strata Thicknesses Encountered During Phase 1 Site Works
Table 5.2.2 Subdivisions of Chalk Grades
Table 6.1.1 Classification Tests - Alluvium
Table 6.1.2 Undrained Shear Strength and SPT Strength Test Summary – Alluvium
Table 6.1.3 Shear Box Tests - Alluvium
Table 6.2.1 Classification Tests – Glacial Deposits
Table 6.2.2 Strength Test Summary - Glacial Deposits
Table 6.2.3 Shear Box Tests - Glacial Deposits
Table 6.3.1 Classification of CAI
Table 6.3.2 Packer test results within the Flamborough Chalk
Table 6.3.3 Variable Head Test Results within the Flamborough Chalk
Table 6.3.4 Summary of HPD testing in Flamborough Chalk
Table 6.3.5 Summary of Results and Corresponding Modulus of Elasticity, E for Flamborough Chalk
Table 6.4.1 Packer Test Results within the Burnham Chalk
Table 6.4.2 Variable Head Test Results within Burnham Chalk
Table 6.4.3 Summary of HPD Testing in Burnham Chalk
Table 6.4.4 Summary of Results and Corresponding Modulus of Elasticity, E for Burnham Chalk
Table 6.5.1 Statistical Data for Key Determinands
Table 6.5.2 Statistical Data for Key Determinands
Table 6.5.3 Statistical Data for Key Determinands
Table 6.5.4 Leachate GAC Exceedances
Table 6.5.5 Summary of BRE SD1 Soil Chemical Test Results - Alluvium
Table 6.5.6 Summary of BRE SD1 Soil Chemical Test Results - Glacial
Table 6.5.7 Summary of BRE SD1 Soil Chemical Test Results - Chalk

Feeder 9 - River Humber Gas Pipeline Replacement Project
Ground Investigation Report 064298/F9/GEO/RPT/101 B
v
Table 6.6.1 Soil Gas Statistics
Table 6.7.1a Groundwater Monitoring Results - Goxhill
Table 6.7.1b Groundwater Monitoring Results - Paull
Table 6.7.2 Field Permeability Values
Table 7.1.1 Summary of Geotechnical Laboratory and In situ Testing
Feeder 9 - River Humber Gas Pipeline Replacement Project
Ground Investigation Report 064298/F9/GEO/RPT/101 B
vi
List of Abbreviations
ACM Asbestos Contain Material
AGI Above Ground Installation
Alv Alluvial
AOD Above Ordnance Datum
BCk Burnham Chalk Formation
BGS British Geological Survey
BH Borehole
BRE Building Research Establishment
BS British Standard
BS EN British Standard European Norm
BT British Telecom
C4SL Category 4 Screening Levels
CAI Cerchar Abrasivity Index
CEGB Central Electric Generation Board
CE Clay of extremely high plasticity (wL>90%)
CH Clay of high plasticity (50%<wL<70%)
CI Clay of intermediate plasticity (35%<wL<50%)
CIRIA Construction Industry Research and Information association
CL Clay of low plasticity (wL<35%)
CLEA Contaminated Land Exposure Assessment
CoC Contaminates of concern
CPT Cone Penetration Test
CWAC Controlled Water Acceptance Criteria
CV Clay of very high plasticity (70%<wl<90%)
DEFRA Department of Environment, Food and Rural Affairs
DWS Drinking Water Standards
e Void Ratio
E Modulus of Elasticity
Eave Modulus of Elasticity average
Eur Modulus of Elasticity from unload reload loops
EA Environment Agency
EAC Environmental Assessment Criteria
ESG Environmental Scientifics Group
EQS Environmental Quality Standards
EU European Union
FCk Flamborough Chalk Formation
FFD Freshwater Fish Directive
FRA Flood Risk Assessment
G Shear modulus
Gi Initial Shear Modulus
Gur Shear Modulus from unload reload loop
GAC Generic Assessment Criteria
Gcl Glacial Deposits
GIR Ground Investigation Report
GPa Gigapascals
Feeder 9 - River Humber Gas Pipeline Replacement Project
Ground Investigation Report 064298/F9/GEO/RPT/101 B
vii
GQRA Generic Quantitative Risk Assessment
H Head of Water
HPD High Pressure Dilatometer
IL Liquidity index
IP Plasticity index
Is(50) Point load Index normalised to an equivalent 50mm diameter sample
IBA Important Bird Area
JECFA Joint Expert Committee on Food Additives
k Permeability
kg Kilograms
kh Horizontal permeability
kv Vertical permeability
km kilometres
kN Kilonewton
kNm-3
Kilonewton per cubic metre
kPa Kilopascals or kN/m2
l Litres
m metres
m bgl metres below ground level
mcm/d million cubic metres per day
mm millimetres
ug/l microgram per litre
mg/l milligram per litre
mg/kg milligram per kilogram
m AOD metres above Ordnance Datum
m3 cubic metres
mv Coefficient of volume compressibility
ms Coefficient of volume expansibility
ME Silt of extremely high plasticity (wl>90%)
Mgm-3
Megagrams per cubic metre
MH Silt of high plasticity (50%<wl<70%)
MI Silt of intermediate plasticity (35%<wl<50%)
ML Silt of low plasticity (wl<35%)
MN Meganewton
MPA Mineral Planning Authority
MPa Megapascal
MV Silt of very high plasticity (70%<wl<90%)
N SPT N value or Newton
NG National Grid
NTS National Transmission System
OD Ordnance Datum
PAH Polyaromatic Hydrocarbons
ppm Parts per million
PLT Pont Load Test
PTWI Provisional Tolerable Weekly Intake
RAMSAR Wetlands of International Importance
qc Cone Resistance
Feeder 9 - River Humber Gas Pipeline Replacement Project
Ground Investigation Report 064298/F9/GEO/RPT/101 B
viii
Q Flow rate
Rf CPT Friction Ratio
RQD Rock Quality Designation
SAC Special Area of Conservation
SCR Solid Core Recovery
SGV Soil Guidance Value
SMC Saturated moisture content
SOM Solid Organic Matter
SP Standpipe
SPA Special Protected Area
SPZ Source Protection Zone
SPT Standard Penetration Test
SSSI Site of Special Scientific Interest
TCR Total Core Recovery
TP Trial Pit
TPH Total Petroleum Hydrocarbon
UCS Unconfined compressive strength
UU Unconsolidated Undrained
UXO Unexploded Ordnance
VWP Vibrating Wire Piezometers
WAC Waste Acceptance Criteria
WFD Water Framework Directive
c' Apparent cohesion
cu Undrained shear strength
Bulk density
d Dry density
s Particle density
w Natural moisture content
wL Liquid limit
wP Plastic limit
' Friction angle
° Degrees oC Degrees Celsius
% Percentage
Poisson’s Ratio
Weight density
Feeder 9 - River Humber Gas Pipeline Replacement Project
Ground Investigation Report 064298/F9/GEO/RPT/101 B
1
1. Executive Summary
The No. 9 Feeder National Transmission System (NTS) pipeline connects the above ground
installations (AGI’s) between Paull on the north bank of the Humber Estuary and Goxhill on the
southern bank. This 5 kilometer (km) long section of pipeline includes a 3 km crossing of the Humber
Estuary and provides a critical bulk transportation route for gas from the NTS entry points in East
Yorkshire into the wider transmission system in Lincolnshire.
Commissioned in 1984, the pipeline was laid in open trench along the Humber Estuary bed and
infilled. However, in 2010 it was found that sections of the pipeline were becoming exposed due to
erosion associated with strong tidal currents. This has required ongoing innovative remedial works in
the form of gravel filled bags and frond mattress protection. However, it is only considered a
relatively short term solution and consequently, it is proposed to construct a new replacement
pipeline mainly within tunnel with on-shore pipeline tie-ins and AGI modifications at Paull.
To facilitate the proposed works, numerous project surveys have been undertaken but most notably
a geophysical survey within the Humber Estuary in October / November 2013 and which informed
the design of the main Phase 1 Intrusive Ground Investigation. The Phase 1 site works were
completed in July 2014 and included land and marine exploratory holes and an extensive scope of
laboratory testing. At the time of writing, some laboratory testing is still ongoing and post site works
ground water monitoring continues.
This ground investigation report (GIR) reviews available information and characterises the lithology,
hydrology, hydrogeology and engineering properties of the various strata underlying the site. As
such, this report facilitates the choice of site specific ground models and geotechnical design
parameters pertinent to the proposed works. Residual hazards have also been discussed with the
need for further ground investigations identified where appropriate. This report has been written in
accordance with the requirements of BS EN 1997-1:2004 (+A1:2013), BS EN 1997-2:2007 with due
reference to National Grid document T/SP/CE/2.
The site is located at Goxhill, within the county of North Lincolnshire and crosses the Humber
Estuary into Paull within the county of East Riding in Yorkshire. Goxhill and Paull are both small
residential areas predominately surrounded by agricultural land. The actual site boundaries are
located outside the residential areas but are within agricultural land near National Grid AGI’s.
The Humber Estuary is an area of ecological importance and is an internationally designated
RAMSAR site; a European designated Special Area of Conservation (SAC) and a Special Protected
Area (SPA); a nationally designated Site of Special Scientific Interest (SSSI) and an Important Bird
Area (IBA).
The River Humber is a busy and important shipping lane connecting the North Sea to the important
ports of Hull, Immingham and Grimsby. The main shipping channel is located to the east side of the
estuary. Within the area of interest, a large sand bank is located in the centre and to the west of the
river and has a transient morphology due to the high current flows and tidal influences. Tidal
variations in the order of 6.4 m are to be expected.
Feeder 9 - River Humber Gas Pipeline Replacement Project
Ground Investigation Report 064298/F9/GEO/RPT/101 B
2
Historically, there has been little change in land use in the area other than recent extension works to
the Paull AGI, improvements in flood defence and development of the Paull Holm Strays Nature
Reserve and associated mudflats. Historical landfill sites are located at Paull proximate to the
proposed reception pit at Paull Cow Hill and Paull Holme Quarry. Information indicates these were
filled with construction and demolition waste, brick rubble, soils and hardcore. However, suspected
asbestos containing materials were confirmed in recent investigations at the site for the proposed
reception pit owned by Stoneledge Plant and Transport Ltd.
The site is underlain by a variable sequence of drift deposits comprising marine and estuarine
alluvium and/or glacial deposits, with thicknesses varying between 8.8 m to 13.8 m at Goxhill, 5.5 m
to 21.1 m across the Humber Estuary and 29.3 m to 34.0 m at Paull. Extended depths of alluvial
deposits up to 13.7 m were noted at Goxhill possibly associated with a former estuary alignment. At
Paull, localised depths of soft deposits in the order of 12 m were noted at the AGI with depths of soft
deposits reducing at the proposed location of the reception pit being replaced by more extensive
depths of granular deposits. The underlying bedrock is formed of the marl seam bearing
Flamborough Chalk Formation overlying the flint bearing Burnham Chalk Formation of the White
Chalk Subgroup. The Flamborough Chalk thins out to the west of the site to thicknesses of only 3 m.
The Flamborough and Burnham interface dips at approximately 1o so that on the Paull side, the
Burnham Chalk was not encountered at depths of up to 55 m. The upper 5 m to 10 m of chalk was
noted to be destructured and probably associated with periglacial effects during each ice age with
greater depths encountered at Goxhill.
The most significant hydrological feature at Paull is Thorngumbald Drain which is interconnected
with drains in the area that assist with land drainage. East Halton Beck is the main tributary entering
the Humber Estuary on the Goxhill side. Measured groundwater levels were near surface with
recorded values ranging from -0.45 m AOD to 1.83 m AOD at Paull and from -1.47 m AOD to 2.07 m
AOD at Goxhill.
The site is underlain by the principal aquifer in the White Chalk Subgroup with secondary aquifers
within the sand and gravel units of the Quaternary deposits.
The areas surrounding the Humber Estuary are identified by the Environment Agency as being at risk
of flooding in the case of a 1 in 200 year event. However, the areas of Goxhill and Paull both benefit
from flood defence systems which were installed within the past decade although part of the flood
protection was overtopped in December 2013 in response to an exceptional high tide resulting in
localised flooding at Goxhill.
Additional intrusive investigations are recommended to facilitate detailed design with the aim of
providing further geotechnical and geo-environmental information on the ground and groundwater
conditions. The scope includes areas of known data gaps following a review of available data and
feedback from findings from the recently completed Phase 1 ground investigation.
This Ground Investigation Report has been based on laboratory and field data received up to Friday
31st October 2014. As previously mentioned, the laboratory testing and in situ groundwater
monitoring is ongoing with the groundwater sampling just recently completed. As such, this report is

Feeder 9 - River Humber Gas Pipeline Replacement Project
Ground Investigation Report 064298/F9/GEO/RPT/101 B
3
a live document and it is proposed to update and review in consideration of Client comments and
when additional laboratory and field data becomes available.
Feeder 9 - River Humber Gas Pipeline Replacement Project
Ground Investigation Report 064298/F9/GEO/RPT/101 B
4
2. Introduction
2.1 Scope and Objective of Report
This Ground Investigation Report has been prepared for the Feeder 9 – River Humber Gas Pipeline
Replacement Project for National Grid (NG). The report has been written in general accordance with
the requirements of BS EN 1997-1:2004 (+A1:2013), BS EN 1997-2:2007 and with due reference to
National Grid document T/SP/CE/2.
The report has been written with the following objectives:
Summarise pertinent points considered relevant to the proposed works from the deskstudy;
Comment on the ground investigation works undertaken and the overall quality of the data
collected;
Describe the ground conditions to be encountered for the scheme;
Interpret the geological and geotechnical conditions along the proposed tunnel alignment,
including drive pit and reception pit and AGI tie-ins;
Provide appropriate information to facilitate the choice of ground model and geotechnical
design parameters required for design of pavements, foundations, earthworks, excavations,
pit and tunnelling as required;
Identify geotechnical risks and suggest suitable mitigation measures for each of the
identified geotechnical risks
This Ground Investigation Report includes a Geotechnical Risk Register associated with ground risk
on cost and programme along with any risk to health and safety of staff and the general public.
2.2 Description of project
The No. 9 Feeder National Transmission System (NTS) pipeline is one of the most critical pipelines on
the National Transmission System (NTS) transporting between 70 and 100 million cubic metres per
day (mcm/d) of gas from the NTS entry points in East Yorkshire into the wider transmission system in
Lincolnshire, through a crossing under the River Humber. However, in 2010 it was found that
sections of pipeline were becoming exposed due to erosion. A short to medium term solution was
put in place by installing fronded mattresses and gravel ‘dumpy’ bags to prevent further erosion but
due to the national importance of this pipeline, this is not considered an acceptable long term
solution.
National Grid proposes to replace the existing No. 9 Feeder NTS pipeline with a new pipeline in order
to safeguard supplies from future estuary erosion. The proposed solution will involve the
construction of a tunnel under the Humber Estuary with a drive pit to be located at Goxhill and a
reception pit at Paull; on-shore pipeline tie-ins between pits and AGI’s; and AGI modification at Paull.
The location of the site and the study area is shown in Figure 2.2.1 below.

Feeder 9 - River Humber Gas Pipeline Replacement Project
Ground Investigation Report 064298/F9/GEO/RPT/101 B
5
Figure 2.2.1 Site Location Plan
2.3 Geotechnical Category of Project
In accordance with BS EN 1997-1:2004 (+A1:2013), the proposed works have been classified as a
Category 2 design as the proposed design includes conventional types of structures and foundations
with no exceptional risk or difficult ground or loading conditions. The Geotechnical Category of the
project requires reviewing throughout the project and on the receipt of any additional information.
2.4 Other Relevant Information
For information on historical ground investigations, environmental setting and the history of the site,
reference should be made to the Desk Study report (Capita, 2014 a).
The laboratory testing and in situ ground water monitoring are ongoing and this revision of the
Ground Investigation Report has been based on laboratory and field data received up to Friday 31st
October 2014. Additional laboratory and field monitoring data will become available subsequent to
the issue of this report. However, this report is a live document and it is proposed to update and
review in consideration of Client comments and when additional laboratory and field data becomes
available.
Paull
Goxhill
Approximate Location of Pipeline
Feeder 9 - River Humber Gas Pipeline Replacement Project
Ground Investigation Report 064298/F9/GEO/RPT/101 B
6
3. Existing Information
A range of existing information has been reviewed as part of the Feeder 9 River Humber Gas Pipeline
Replacement Project and a full description of the findings are provided in the Desk Study Report. The
following sections summarise the main points considered pertinent to the project and reference
should be made to the Desk Study Report for more detailed discussions.
3.1 Site Description
The site starts in Goxhill, within North Lincolnshire, and crosses the River Humber into Paull, East
Riding of Yorkshire. The site is located approximately 5 km south of Hull and 15 km downstream of
the Humber Bridge.
The Goxhill area comprises mainly open fields and is bounded to the west by Horsegate Field Road
and Ruard Road to the north. Chapel Field Road coming from the south provides an access route to
the centre of the site.
The site then leads on in a north-easterly direction across the Humber Estuary for approximately 2.6
km to the marshland area of Paull.
The site area at Paull consists of farmland and fields, scattered with a few industrial sites. The Paull
site includes an area occupied by National Grid’s Paull AGI site, Paull Holme Strays Nature Reserve
and Fort Paull, which is located just off the River Humber to the north-west. St Andrew’s Church is
located 300 m north-east of this location. The residential area of the town of Paull is located on the
north-west side of the site.
3.2 Topography and Geomorphology
The site and the surrounding area are generally flat. Ground levels at Paull are around 2 m AOD with
a few small isolated hills reaching elevations of 15 m AOD. Ground levels at the Goxhill site are also
generally flat around 2 m AOD.
The Humber Estuary formed when pre-existing valleys were flooded at the end of the last glaciation.
It has a significant tidal range, amplified as the tide propagates up the estuary, producing a mean
spring tidal range of 5.7 m at Spurn Head, 7.4 m at Saltend and 6.9 m at Hessle 45 km inland.
Turbidity in the River Humber and estuary mainly derives from suspended sediment from the
eroding boulder clay cliffs along the Holderness coast, but also from riverine sediments. Deposition
of these sediments maintains the estuary's important mudflats, sandflats and saltmarsh habitats.
The tidal range moves substantial quantities of sediment over time, contributing to erosion of the
river bed resulting in the existing National Grid pipeline in parts becoming exposed and requiring
remedial works.
The landward geomorphology of the site is determined by the low-lying topography and drift
geology. On both sides of the estuary, the intertidal land below 5 m AOD comprises flat, estuarine
mudflats and marshland, underlain by alluvium. On the Paull side, the site of Fort Paull Battery is
located on an outcrop of Kelsey Hill gravels, rising to a height of approximately 12 m AOD.
Feeder 9 - River Humber Gas Pipeline Replacement Project
Ground Investigation Report 064298/F9/GEO/RPT/101 B
7
3.3 Published Geology
The site lies within the Humber district which includes the Humber Estuary with most of the district
within the low-lying coastal plain. The main bedrock is the Northern Province Chalk which dips gently
towards the east at approximately 1°. The main outcrop of chalk is to the west of the site which
forms the Lincolnshire Wolds. The bedrock is largely concealed by Quaternary glacial deposits and in
areas surrounding the River Humber, additional superficial deposits associated with the river conceal
the glacial deposits.
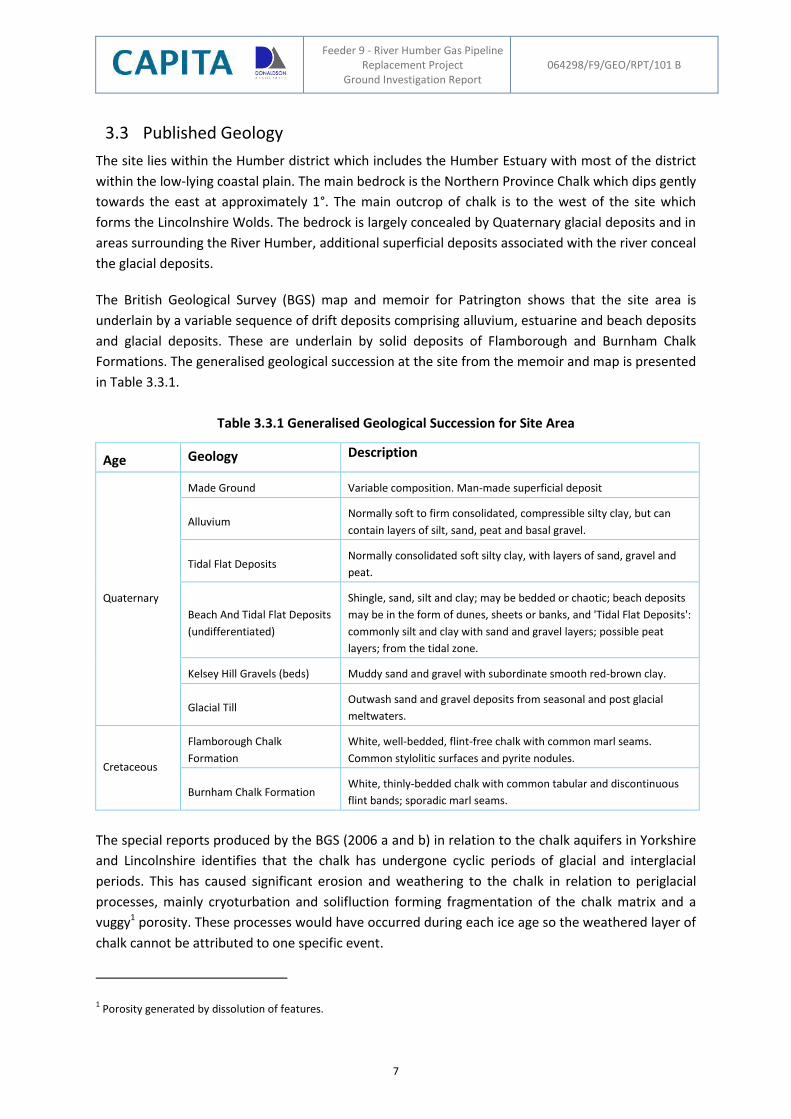
The British Geological Survey (BGS) map and memoir for Patrington shows that the site area is
underlain by a variable sequence of drift deposits comprising alluvium, estuarine and beach deposits
and glacial deposits. These are underlain by solid deposits of Flamborough and Burnham Chalk
Formations. The generalised geological succession at the site from the memoir and map is presented
in Table 3.3.1.
Table 3.3.1 Generalised Geological Succession for Site Area
Age Geology Description
Quaternary
Made Ground Variable composition. Man-made superficial deposit
Alluvium Normally soft to firm consolidated, compressible silty clay, but can
contain layers of silt, sand, peat and basal gravel.
Tidal Flat Deposits Normally consolidated soft silty clay, with layers of sand, gravel and
peat.
Beach And Tidal Flat Deposits
(undifferentiated)
Shingle, sand, silt and clay; may be bedded or chaotic; beach deposits
may be in the form of dunes, sheets or banks, and 'Tidal Flat Deposits':
commonly silt and clay with sand and gravel layers; possible peat
layers; from the tidal zone.
Kelsey Hill Gravels (beds) Muddy sand and gravel with subordinate smooth red-brown clay.
Glacial Till Outwash sand and gravel deposits from seasonal and post glacial
meltwaters.
Cretaceous
Flamborough Chalk
Formation
White, well-bedded, flint-free chalk with common marl seams.
Common stylolitic surfaces and pyrite nodules.
Burnham Chalk Formation White, thinly-bedded chalk with common tabular and discontinuous
flint bands; sporadic marl seams.
The special reports produced by the BGS (2006 a and b) in relation to the chalk aquifers in Yorkshire
and Lincolnshire identifies that the chalk has undergone cyclic periods of glacial and interglacial
periods. This has caused significant erosion and weathering to the chalk in relation to periglacial
processes, mainly cryoturbation and solifluction forming fragmentation of the chalk matrix and a
vuggy1 porosity. These processes would have occurred during each ice age so the weathered layer of
chalk cannot be attributed to one specific event.
1 Porosity generated by dissolution of features.
Feeder 9 - River Humber Gas Pipeline Replacement Project
Ground Investigation Report 064298/F9/GEO/RPT/101 B
8
The BGS memoir also discusses the Kirmington Buried Channel, a 2 km wide and up to 50 m deep
channel carved into the chalk bedrock traversing from Brocklesby to Immingham just south of the
site and thought to have been formed during the Anglian Ice Age. The channel is thought to have
formed during a catastrophic but localised escapement of melt water which was under huge
hydrostatic pressures near the periphery of an ice sheet. With a feature of this size the surrounding
chalk bedrock is likely to have undergone significant erosion and weathering during this event
alongside the normal periglacial weathering associated with the close proximity of the ice sheet.
In addition, the memoir notes that the lower glacial deposits from the Anglian Ice Age have been
affected by periglacial effects from proceeding ice ages and later paleogenesis.
3.4 Hydrology
A number of small and large water courses and tributaries connect with the River Humber, the
Humber Estuary and the mouth of the Humber along its course in the study area.
The most significant hydrological feature within the Paull site is a small tributary located to the south
of Fort Paull battlements and identified as the Thorngumbald Drain. This is interconnected with
numerous drains that assist in the management of water levels in the low lying areas. These drains
include the Haylands Drain, Green’s Drain, South Ends and Thorney Crofts Drain, the Pant Drain and
numerous unnamed field drains.
The East Halton Beck is the main tributary entering the River Humber on the Goxhill side that rises
north of Keelby and flows northwards into the East Halton Skitter, south of the Goxhill site. In areas
such as the Lincolnshire Wolds where there is little cover from superficial deposits, many of the
water courses have a groundwater fed baseflow. The water courses within the low permeability
superficial deposits are usually formed and fed by surface water runoff and infiltration rates are very
low within the cohesive materials. Over much of the low lying areas, including reclaimed marshes,
the water levels in the drains and tributaries are managed by sluice gates and weirs.
The desk study identified one active licensed surface water abstraction within the study area from a
tributary of the Carr Gutter.
3.5 Hydrogeology
The hydrogeology of the area includes the principal aquifer in the Northern Province Chalk with
secondary aquifers within the sand and gravel units of the Quaternary deposits. From the desk study
and review of previous reports, it is undetermined whether the near-surface secondary aquifer units
are in hydraulic continuity with the chalk aquifer due to the presence of low permeability units
within the glacial till deposits and other low permeability horizons within the Quaternary deposits.
Localised shallow perched groundwater may also be present above low permeability layers within
the Quaternary glacial till, gravels, beach, tidal flat and alluvium deposits and within any made
ground that may be present.
Groundwater levels within the chalk and near surface Quaternary deposits are a function of several
factors including the recharge volumes and areas; the rate of groundwater movement and storage
Feeder 9 - River Humber Gas Pipeline Replacement Project
Ground Investigation Report 064298/F9/GEO/RPT/101 B
9
volumes within the aquifer units; springs and outflows from the aquifer; the potential for hydraulic
interaction between the aquifer units where present; the volumes abstracted and localised
depression of the water table in response to present day abstraction and localised impact of
rebound from historic over abstraction.
The Environment Agency (EA) classifies the chalk as a principal aquifer and the productive
Quaternary strata as secondary aquifers
The Goxhill and Paull sites are not within any Source Protection Zone (SPZ). The nearest SPZ is a Zone
3 designation located over 2.4 km south-west from the Goxhill site boundary and approximately 3.6
km south-south-west from the position of the drive pit at Goxhill. The nearest SPZ Zone 2 boundary
is 4.1 km to the south-south-west from the Goxhill drive pit and approximately 3.0 km to the south
of the Goxhill site boundary. The nearest SPZ Zone 1 boundary is 4.6 km south-south-west from the
Goxhill drive pit and over 3.5 km south of the Goxhill site boundary. The nearest SPZ to the Paull site
is over 10 km to the west-north-west.
The Grimsby Ancholme Louth Chalk Unit (EA Waterbody ID GB40401G401500 including Goxhill) has
a current and 2015 predicted quantitative quality and the chemical quality status designated by the
EA as “Poor” with an upward chemical trend with an overall risk as “At Risk”.
The Hull and East Riding Chalk Unit (EA Waterbody ID GB 40401G700700 including the Paull site) has
a current and 2015 predicted quantitative quality and chemical quality designated by the EA as
“Poor” with an upward chemical trend with an overall risk designated as “At Risk”.
Groundwater Levels Regional groundwater flow tends to follow the dip of the chalk strata i.e. towards the North Sea
coast in a north-east direction. The groundwater level in the chalk aquifer is understood to vary
seasonally in response to rainfall and surface water infiltration recharge.
The majority of recorded historic borehole water strikes are in the alluvium. For boreholes in the
Paull site area, measurements of groundwater levels range from -0.45 m AOD to 1.83 m AOD over
the period 24 April 2014 to 22 October 2014. On the Goxhill side of the site, the groundwater levels
range from -1.47 m AOD to 2.07 m AOD over the same period. This demonstrates that groundwater
levels are generally shallow, with deeper water levels observed at Goxhill when compared with
Paull. There are a number of influencing factors to explain these observations (See Section 6.6).
Groundwater Abstractions Ten groundwater abstractions were identified in the desk study in the vicinity of the study area with
the respective licenses appearing to be active.
Historically induced saline intrusion in response to over abstraction within the aquifers surrounding
the River Humber (although not close to the Goxhill and Paull sites) has led to a progressive lowering
of the chalk groundwater level. More recent reductions in licensed groundwater abstractions have
helped alleviate the saline intrusion; although once common, artesian groundwater levels are rare.
This historic over abstraction of the chalk aquifer may have led to saline intrusions into the
secondary and principal aquifers along some coastal and estuarine areas of the Humber Estuary and
Feeder 9 - River Humber Gas Pipeline Replacement Project
Ground Investigation Report 064298/F9/GEO/RPT/101 B
10
surrounding area. Sustained abstraction may have also reduced or removed artesian groundwater
conditions both within the site and the surrounding areas.
Groundwater Flooding The Stage 1 Flood Risk Assessment completed by Hyder (2014) identifies that the surface water and
some groundwater levels at both Paull and Goxhill are controlled by a series of drainage ditches and
outflows to small streams and rivers discharging directly to the Humber. This flood risk assessment
shows that the risk of groundwater flooding of above ground construction infrastructure should only
be expected as a result of hydraulic continuity of groundwater in the alluvium and glacial deposits
with the land drains. These drains would only likely be a source of fluvial flood risk in times of
sustained high water levels within the drains and water levels in the interconnected stream, rivers
and Humber Estuary. The risk from groundwater flooding is regarded as low and would be far
outweighed by the risk of direct fluvial flooding from the drains and the estuary.
On the basis of geological outcrops, surface water drainage is expected to affect near surface and
perched water table levels in the superficial deposits rather than groundwater levels in the chalk
aquifer at depth.
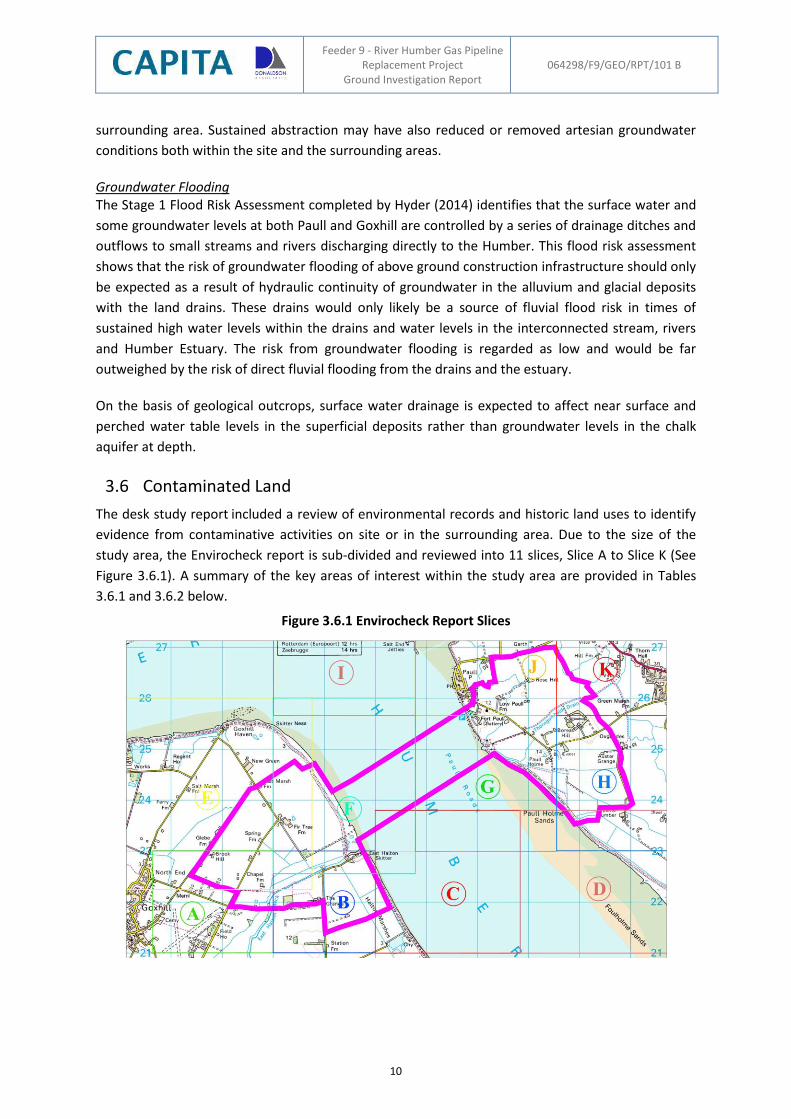
3.6 Contaminated Land
The desk study report included a review of environmental records and historic land uses to identify
evidence from contaminative activities on site or in the surrounding area. Due to the size of the
study area, the Envirocheck report is sub-divided and reviewed into 11 slices, Slice A to Slice K (See
Figure 3.6.1). A summary of the key areas of interest within the study area are provided in Tables
3.6.1 and 3.6.2 below.
Figure 3.6.1 Envirocheck Report Slices
Feeder 9 - River Humber Gas Pipeline Replacement Project
Ground Investigation Report 064298/F9/GEO/RPT/101 B
11
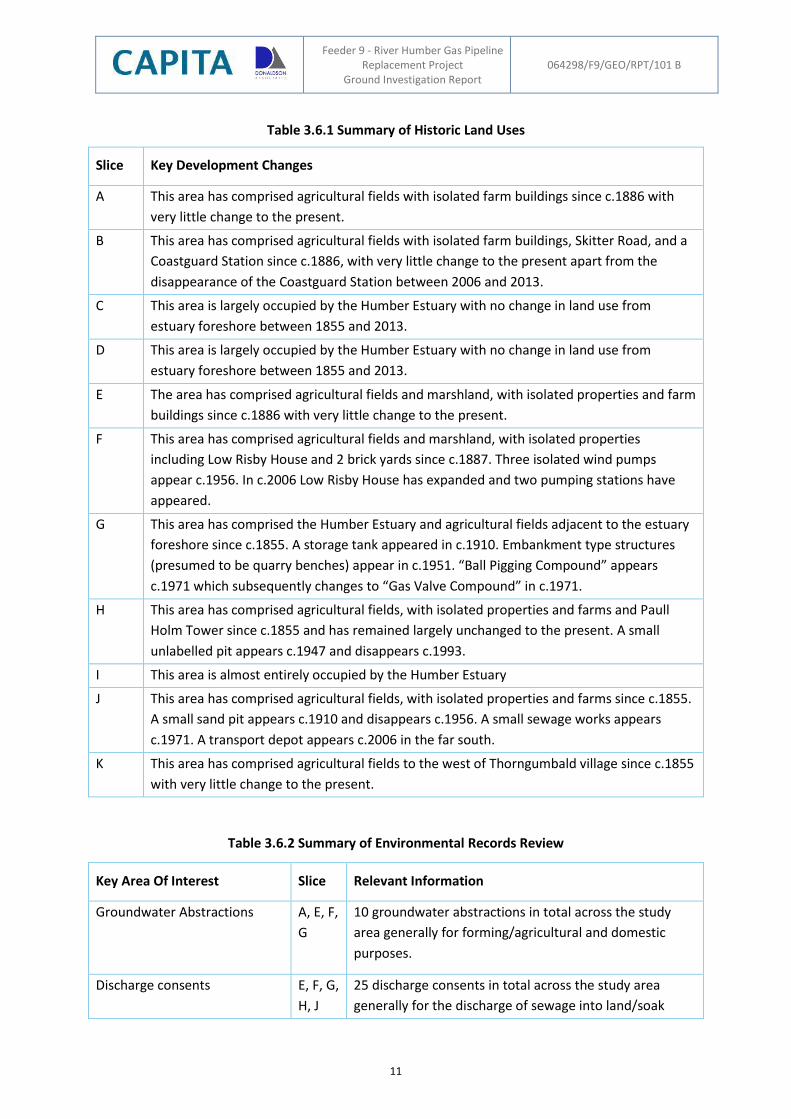
Table 3.6.1 Summary of Historic Land Uses
Slice Key Development Changes
A This area has comprised agricultural fields with isolated farm buildings since c.1886 with
very little change to the present.
B This area has comprised agricultural fields with isolated farm buildings, Skitter Road, and a
Coastguard Station since c.1886, with very little change to the present apart from the
disappearance of the Coastguard Station between 2006 and 2013.
C This area is largely occupied by the Humber Estuary with no change in land use from
estuary foreshore between 1855 and 2013.
D This area is largely occupied by the Humber Estuary with no change in land use from
estuary foreshore between 1855 and 2013.
E The area has comprised agricultural fields and marshland, with isolated properties and farm
buildings since c.1886 with very little change to the present.
F This area has comprised agricultural fields and marshland, with isolated properties
including Low Risby House and 2 brick yards since c.1887. Three isolated wind pumps
appear c.1956. In c.2006 Low Risby House has expanded and two pumping stations have
appeared.
G This area has comprised the Humber Estuary and agricultural fields adjacent to the estuary
foreshore since c.1855. A storage tank appeared in c.1910. Embankment type structures
(presumed to be quarry benches) appear in c.1951. “Ball Pigging Compound” appears
c.1971 which subsequently changes to “Gas Valve Compound” in c.1971.
H This area has comprised agricultural fields, with isolated properties and farms and Paull
Holm Tower since c.1855 and has remained largely unchanged to the present. A small
unlabelled pit appears c.1947 and disappears c.1993.
I This area is almost entirely occupied by the Humber Estuary
J This area has comprised agricultural fields, with isolated properties and farms since c.1855.
A small sand pit appears c.1910 and disappears c.1956. A small sewage works appears
c.1971. A transport depot appears c.2006 in the far south.
K This area has comprised agricultural fields to the west of Thorngumbald village since c.1855
with very little change to the present.
Table 3.6.2 Summary of Environmental Records Review
Key Area Of Interest Slice Relevant Information
Groundwater Abstractions A, E, F,
G
10 groundwater abstractions in total across the study
area generally for forming/agricultural and domestic
purposes.
Discharge consents E, F, G,
H, J
25 discharge consents in total across the study area
generally for the discharge of sewage into land/soak
Feeder 9 - River Humber Gas Pipeline Replacement Project
Ground Investigation Report 064298/F9/GEO/RPT/101 B
12
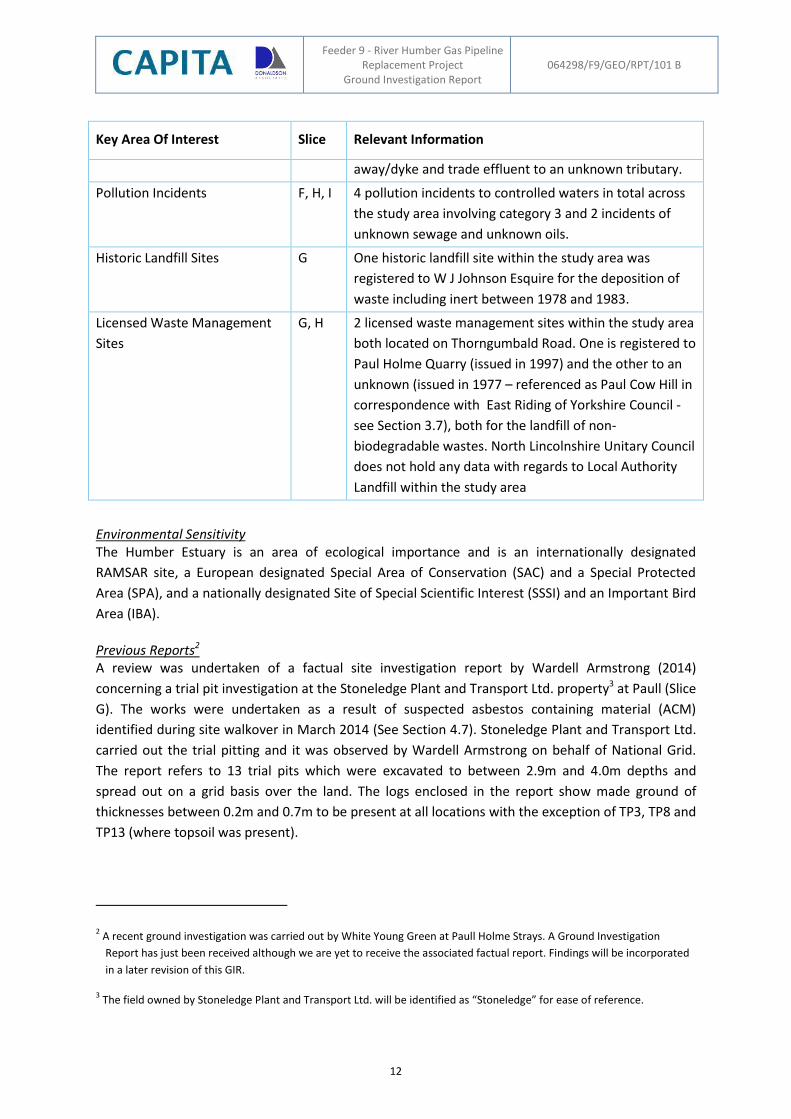
Key Area Of Interest Slice Relevant Information
away/dyke and trade effluent to an unknown tributary.
Pollution Incidents F, H, I 4 pollution incidents to controlled waters in total across
the study area involving category 3 and 2 incidents of
unknown sewage and unknown oils.
Historic Landfill Sites G One historic landfill site within the study area was
registered to W J Johnson Esquire for the deposition of
waste including inert between 1978 and 1983.
Licensed Waste Management
Sites
G, H 2 licensed waste management sites within the study area
both located on Thorngumbald Road. One is registered to
Paul Holme Quarry (issued in 1997) and the other to an
unknown (issued in 1977 – referenced as Paul Cow Hill in
correspondence with East Riding of Yorkshire Council -
see Section 3.7), both for the landfill of non-
biodegradable wastes. North Lincolnshire Unitary Council
does not hold any data with regards to Local Authority
Landfill within the study area
Environmental Sensitivity The Humber Estuary is an area of ecological importance and is an internationally designated
RAMSAR site, a European designated Special Area of Conservation (SAC) and a Special Protected
Area (SPA), and a nationally designated Site of Special Scientific Interest (SSSI) and an Important Bird
Area (IBA).
Previous Reports2 A review was undertaken of a factual site investigation report by Wardell Armstrong (2014)
concerning a trial pit investigation at the Stoneledge Plant and Transport Ltd. property3 at Paull (Slice
G). The works were undertaken as a result of suspected asbestos containing material (ACM)
identified during site walkover in March 2014 (See Section 4.7). Stoneledge Plant and Transport Ltd.
carried out the trial pitting and it was observed by Wardell Armstrong on behalf of National Grid.
The report refers to 13 trial pits which were excavated to between 2.9m and 4.0m depths and
spread out on a grid basis over the land. The logs enclosed in the report show made ground of
thicknesses between 0.2m and 0.7m to be present at all locations with the exception of TP3, TP8 and
TP13 (where topsoil was present).
2 A recent ground investigation was carried out by White Young Green at Paull Holme Strays. A Ground Investigation
Report has just been received although we are yet to receive the associated factual report. Findings will be incorporated
in a later revision of this GIR.
3 The field owned by Stoneledge Plant and Transport Ltd. will be identified as “Stoneledge” for ease of reference.
Feeder 9 - River Humber Gas Pipeline Replacement Project
Ground Investigation Report 064298/F9/GEO/RPT/101 B
13
The made ground horizon was described as comprising brick rubble with occasional sand, fabric,
metal fragments, ash, clinker and at least one sample of asbestos cement material (TP11). Below the
made ground, the natural strata comprises firm brown, then soft blue grey clays. Groundwater
seepages were observed. Preliminary bulk analysis verified the presence of asbestos.
3.7 Information from Statutory Authorities
As part of the 2007 draft Environmental Statement assessment for the pipeline route, a consultation
response was received from East Riding of Yorkshire Council in relation to a request for information
concerning minerals and waste sites within the search area of the proposed route. With regard to
minerals sites, the consultation response revealed that the Council held:
No details of any past underground or surface mining/quarrying within the pipeline corridor
No current permissions or applications for mineral working within the pipeline corridor
No representations made to the Mineral Planning Authority (MPA) in respect of land within
the pipeline corridor
No Allocated Sites or Areas of Search within the pipeline corridor, or sites previously
rejected or not brought forward.
The proposed location for the reception pit at Paull is in close proximity to mapped4 “recorded
landfill sites”. East Riding of Yorkshire Council’s consultation response revealed that the Council
held:
One possible landfill site and two known closed landfill sites.
The possible landfill site is a former gravel quarry located several hundred meters to the east
and dating from approximately 1886. Nothing is known about whether or not this former
quarry has been filled or the nature of the fill (if any).
The two known landfill sites are identified as Paull-Cow Hill (northern site) and Paul Holme
Quarry (southern site). Very little is known about these sites but the Council does have
information provided by the Environment Agency which indicates they were filled with
construction and demolition waste, brick rubble, soils and hardcore.
No investigations have taken place at any of the sites identified in this search therefore the
Council can neither confirm nor deny the presence of contamination.
Further details and information on statutory authorities can be found in the Desk Study report.
The Mineral Safe Guarding report indicates the presence of sand and gravel prospects within the site
at Paull. Theses sand and gravel deposits are likely Kelsey Hill glacial deposits. Although the statutory
authorities’ response indicates there has been no mineral extraction or current applications for
mineral extraction of these deposits, the guarded areas fall under the Councils Mineral and Waste
Resource Plan so will need permission from the MPA for extraction.
4 According to the Envirocheck Report
Feeder 9 - River Humber Gas Pipeline Replacement Project
Ground Investigation Report 064298/F9/GEO/RPT/101 B
14
3.8 Flood Records
A review of the available flood record on the EA website indicates that both the Goxhill and Paull
areas fall within the Flood Level 3 category. This is summarised as:
“An area that could be affected by flooding, either from rivers or the sea, if there were no flood defences. This area could be flooded:
from the sea by a flood that has a 0.5 per cent (1 in 200) or greater chance of happening each year;
or from a river by a flood that has a 1 per cent (1 in 100) or greater chance of happening each year.”
It is noted that both areas benefit from flood protection measures which are earthwork or rock
bunds. The map indicates that these defences have been constructed within the last decade or so
and may incorporate old flood defences for smaller flood events. Part of the flood protection wall
was over-topped by river/sea water on 5th December 2013 in response to high tide. This was not a
breach of the flood defences, although the over-topping of the wall led to localised flooding of fields
to a depth of 200 mm to 300 mm beyond Goxhill AGI and East Marsh Road. Further details of
flooding in an area by area basis can be found within the desk study report.
Management of flood risk from the Humber forms part of a long-term strategy. The EA’s Humber
Flood Risk Management Strategy details ongoing and completed work. This includes the managed
realignment at Paull Holme Strays in 2003, comprising the construction of a new defence inland of
the existing defence and then breaching of the original defence in two places so the land between
the defences is flooded on most tides. The new reinforced grassed bank includes 20,000 tonnes of
rock armour and concrete block protection. An equivalent project is proposed for Goxhill in the
future.
3.9 Archaeological Investigations
Archaeological sites are known in the area and have been considered in earlier feasibility studies.
Further details on the archaeological Investigations undertaken for the scheme are found in the
report produced by AMEC (2007). Archaeological investigations undertaken as part of this phase of
works would be undertaken by Hyder under the environmental aspects of the scheme.
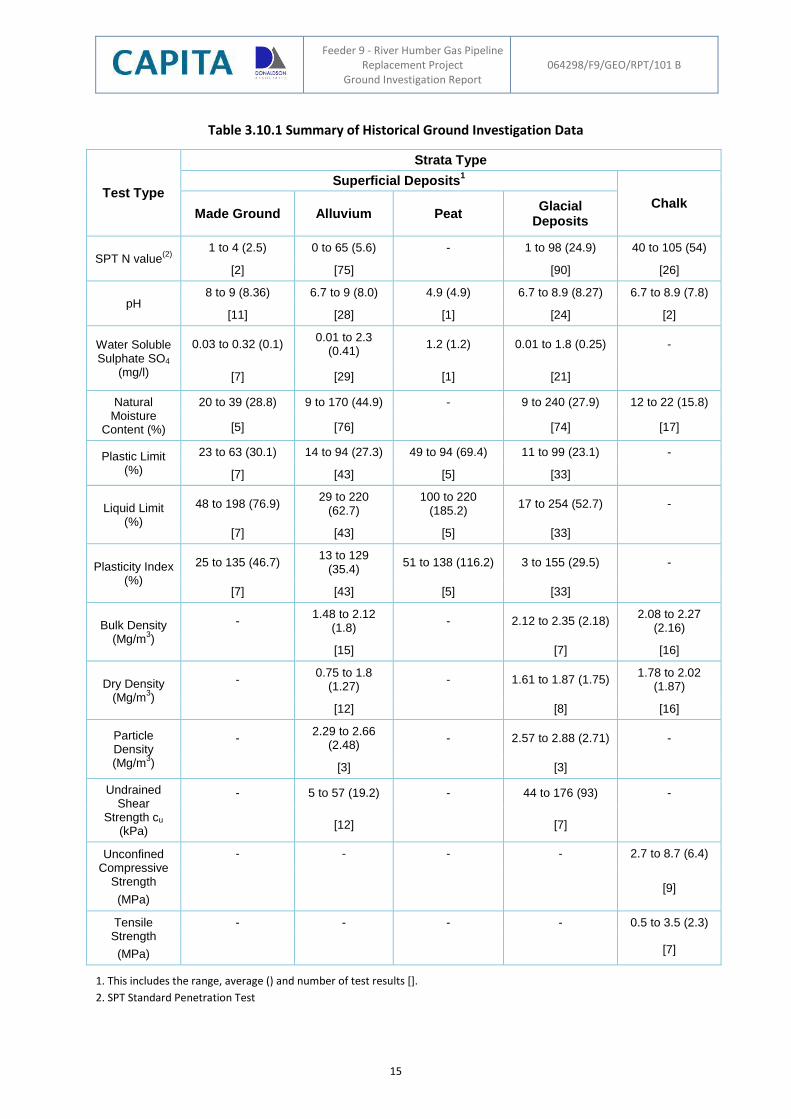
3.10 Historical Ground Investigations
A number of historical ground investigations or borehole logs were available for review. Only the
more recent investigations contain usable data / information as most of the reports received were
either incomplete or missing key information. From the usable information provided by National
Grid or collected from the British Geological Survey, a summary of the lab testing results can be
found in Table 3.10.1.
Feeder 9 - River Humber Gas Pipeline Replacement Project
Ground Investigation Report 064298/F9/GEO/RPT/101 B
15
Table 3.10.1 Summary of Historical Ground Investigation Data
Test Type
Strata Type
Superficial Deposits1
Chalk Made Ground Alluvium Peat
Glacial Deposits
SPT N value(2)
1 to 4 (2.5) 0 to 65 (5.6) - 1 to 98 (24.9) 40 to 105 (54)
[2] [75] [90] [26]
pH 8 to 9 (8.36) 6.7 to 9 (8.0) 4.9 (4.9) 6.7 to 8.9 (8.27) 6.7 to 8.9 (7.8)
[11] [28] [1] [24] [2]
Water Soluble Sulphate SO4
(mg/l)
0.03 to 0.32 (0.1) 0.01 to 2.3
(0.41) 1.2 (1.2) 0.01 to 1.8 (0.25) -
[7] [29] [1] [21]
Natural Moisture
Content (%)
20 to 39 (28.8) 9 to 170 (44.9) - 9 to 240 (27.9) 12 to 22 (15.8)
[5] [76] [74] [17]
Plastic Limit (%)
23 to 63 (30.1) 14 to 94 (27.3) 49 to 94 (69.4) 11 to 99 (23.1) -
[7] [43] [5] [33]
Liquid Limit (%)
48 to 198 (76.9) 29 to 220
(62.7) 100 to 220
(185.2) 17 to 254 (52.7) -
[7] [43] [5] [33]
Plasticity Index (%)
25 to 135 (46.7) 13 to 129
(35.4) 51 to 138 (116.2) 3 to 155 (29.5) -
[7] [43] [5] [33]
Bulk Density (Mg/m
3)
- 1.48 to 2.12
(1.8) - 2.12 to 2.35 (2.18)
2.08 to 2.27 (2.16)
[15] [7] [16]
Dry Density (Mg/m
3)
- 0.75 to 1.8
(1.27) - 1.61 to 1.87 (1.75)
1.78 to 2.02 (1.87)
[12] [8] [16]
Particle Density (Mg/m
3)
- 2.29 to 2.66
(2.48) - 2.57 to 2.88 (2.71) -
[3] [3]
Undrained Shear
Strength cu (kPa)
- 5 to 57 (19.2) - 44 to 176 (93) -
[12] [7]
Unconfined Compressive
Strength
(MPa)
- - - - 2.7 to 8.7 (6.4)
[9]
Tensile Strength
(MPa)
- - - - 0.5 to 3.5 (2.3)
[7]
1. This includes the range, average () and number of test results [].
2. SPT Standard Penetration Test
Feeder 9 - River Humber Gas Pipeline Replacement Project
Ground Investigation Report 064298/F9/GEO/RPT/101 B
16
3.11 Mining Instability and Natural Underground Cavities
A review of the coal authority report provided indicates that the risk from mining instability within
the site is minimal.
3.12 Records of Seismic Activity
An initial screening process concluded there was no significant regional seismic hazard, unfavourable
ground conditions or unfavourable structural features due to seismicity. It is therefore considered
that the structural design will not need to consider seismic design although the project specific
seismic design requirements will need to be guided by National Grid.
3.13 Aerial Photographs
Fifteen aerial photographs provided by National Grid were reviewed to identify features with geotechnical or geological issues. To the limit of detail provided on the photos, no obvious areas of geotechnical or geological issues are evident.
Feeder 9 - River Humber Gas Pipeline Replacement Project
Ground Investigation Report 064298/F9/GEO/RPT/101 B
17
4. Field and Laboratory Studies
A number of field and laboratory studies were undertaken to gather information to inform the
design of the proposed gas pipeline. Details of these studies are described below.
4.1 Walkover Survey
Walkover surveys at Goxhill and Paull were undertaken as a series of visits during September and
October 2013. Details of the existing structures, ground conditions and site access were assessed
and any associated risk within the areas identified. Further walkovers were undertaken during
February and March 2014 with the Ground Investigation Contractors representative to discuss
access, constraints and methods of ground investigation. Further details of the findings of the
walkover surveys can be found in the Desk Study Report.
The site walkovers identified that outside of the AGI’s, the area of interest at Paull and Goxhill are
formed mostly of agricultural fields or overgrown areas of open space or mudflats with some
isolated properties. At Paull, the fields were ploughed during the site visits and appeared well
drained other than at the access points. Later in the year during the Phase 1 ground investigation,
the fields contained cereal crops. An area of overgrown hard standing owned by Stoneledge Plant
and Transport Ltd, was noted to contain construction rubble with suspected asbestos tiles requiring
further investigation. The area to the west of the AGI was protected by large flood defences
associated with the managed realignment at Paull Holme Strays and associated mudflats. Just south
of the Paull AGI was the EA car park and wildlife sanctuary. Thorngumbald drain was located north of
the AGI.
At Goxhill the fields were ploughed during the site visits and appeared well drained other than at the
access points and a few isolated areas near the river defence bank. During the walkover in February
2014, it was noted that a section of the river defence bank had failed during recent flooding. Later in
the year it was noted the fields contained cereal crops and beans. The area to the estuary side of the
flood defence bank was largely over grown. Small tributaries indicate that the mudflats do flood, but
not enough to impact on the vegetation.
4.2 Topographical Survey
A topographical survey of the two land based areas, Goxhill and Paull were undertaken using spot
heights in late 2013. The current topographical plans complied from this survey can be found in
Appendix 4 of the Desk Study Report.
During the topographical survey nothing unusual or unexpected was identified. The survey
confirmed the flat low lying land around Goxhill with the river defence bank along the edge of the
river. At Paull, it confirmed the river defence bank with the low lying flat fields with a slight incline to
the south of the site due to a small hill though to be formed of gravel deposits.
Feeder 9 - River Humber Gas Pipeline Replacement Project
Ground Investigation Report 064298/F9/GEO/RPT/101 B
18
4.3 Service Search
A service search was under taken by 40Seven Ltd for the entire site area (See Appendix 6 of the
deskstudy). A number of services were found within the site boundary both onshore and offshore
which include:
Gas
Pipes (unidentified)
Overhead Electricity
British Telecom
Water
Underground Electricity
Pipes (unidentified)
Centrica Pipe
Foul Drainage
The service search at Paull identified the Centrica, Feeder 9 and Feeder 24 gas pipelines crossing the
proposed pipeline route. In addition, BT Cables and water services run along Thorngumbald.
The service search at Goxhill identified the presence of the Feeder 1 and Feeder 9 pipelines crossing
the proposed pipeline route with a BT cable near the river defence bank. The service plans do not
account for field drainage which is known to be present.
The service search across the River Humber indicates that the Centrica and Feeder 9 gas pipelines
are the only services the proposed pipeline route crosses.
4.4 Geophysical Surveys
During the early stages of the project, overwater geophysical surveys were undertaken to help
inform the ground investigation design. The works were split into two phases as follows;
Phase 1 Survey
The Phase 1 geophysical survey was undertaken between 21st October 2013 and 18th November
2013 by Environmental Scientifics Group (ESG). The main aims of the survey were to provide
information on the following:
Information on seabed bathymetry
To identify seabed features and obstructions
Details on sub-bottom geology as part of the pre-engineering survey
The works were completed by undertaking a number of survey techniques to inform the later
interpretation undertaken by ESG and included:
Swathe Bathymetric Survey
Single Beam Bathymetric Survey
Side Scan Sonar Survey
Feeder 9 - River Humber Gas Pipeline Replacement Project
Ground Investigation Report 064298/F9/GEO/RPT/101 B
19
Magnetometer Survey
Multichannel Seismic Reflection Survey (Bubble Pulsar)
Single Channel Seismic Reflection Survey (Pinger Uniboom)
Full details of the works undertaken and the results from the surveys alongside ESG’s interpretation
of geological boundaries and seabed features can be found in ESG report (2014 a).
The Phase 1 geophysics work established a detailed topography of the river bed which showed a
series of channels and bars within the river, with the main channel located on the eastern side of the
river. Areas of steep sided platforms and gullies were noted within the main shipping channel. The
survey also identified the presence of gas pipelines along the river bed including the areas of erosion
and remediation. No faulting or significant scour features were noted although a buried channel
probably associated with the previous river alignment was noted to the east of the survey area.
In addition it was possible to establish the predominant grain size of the river bed material and as
would be expected the grading size increased in the areas of high energy, with the finer materials in
the areas of low energy, usually close to the river banks or top of the bars. The magnetic survey
identified several magnetic anomalies within the survey area although the exact nature was not
established at the time.
The single channel and multichannel surveys identified the top of chalk rock head and in some areas
the boundaries between alluvial and glacial deposits and was used to inform the ground
investigation design. However, it should be noted that after completion of the Phase 1 intrusive
survey (See Section 4.5), the actual verified boundaries were not in agreement with the interpreted
geophysical data.
Phase 2 Survey
Following completion of the Phase 1 geophysical survey, the preferred route alignment option was
selected and the intrusive ground investigation scoped. The site had been designated as a high risk
area for Unexploded Ordnance (UXO) due to the number of air strikes during the war at the
harbours and battlements in the surrounding area. The UXO risk assessment ascertained the need
for mitigation measures, with the marine works requiring clearance for both the borehole location
and the jack up rig footprint. It was decided to undertake localised and detail surveys of each
borehole location in the form of a 50 m x 50 m box to allow some scope to move the boreholes
should an anomaly be encountered. Where anomalies were located preventing a safe positioning,
the survey box would be extended.
The Phase 2 survey commenced on the 10th February 2014 and was completed on the 20th February
2014. A total of 23 survey “boxes” were completed using:
Swathe Bathymetric Survey
Single Beam Bathymetric Survey
Side Scan Sonar Survey
Magnetometer Survey
Feeder 9 - River Humber Gas Pipeline Replacement Project
Ground Investigation Report 064298/F9/GEO/RPT/101 B
20
A 10 m spacing between each survey line was adopted to ensure good coverage of the estuary bed.
A full summary of the works undertaken and the results from the survey alongside ESG’s
interpretation of magnetic features can be found in the ESG report (2014 b)
The Phase 2 geophysical works identified 43 metallic anomalies on the river bed within the areas of
the proposed jack up locations. The exact nature of the metallic objects was not established, but
exploratory holes were repositioned to ensure either the drilling string or jack up platform legs
would come within close proximity to any anomalies identified due to the risk of UXO.5
4.5 Ground Investigations
The Phase 16 intrusive ground investigation was undertaken by Soil Engineering Geoservices Ltd.
over 12 weeks with both the land and marine works running concurrently. The land works
commenced in late April 2014 during normal day working hours Monday to Friday. The marine works
begun 1 week later into the programme with 24 hour working including weekends and was
completed in 4.5 weeks. The land works were completed in mid-July. The as built borehole locations
areas are shown on drawings H160/BH/04/01/F9/102 (Sheets 1 to 3).
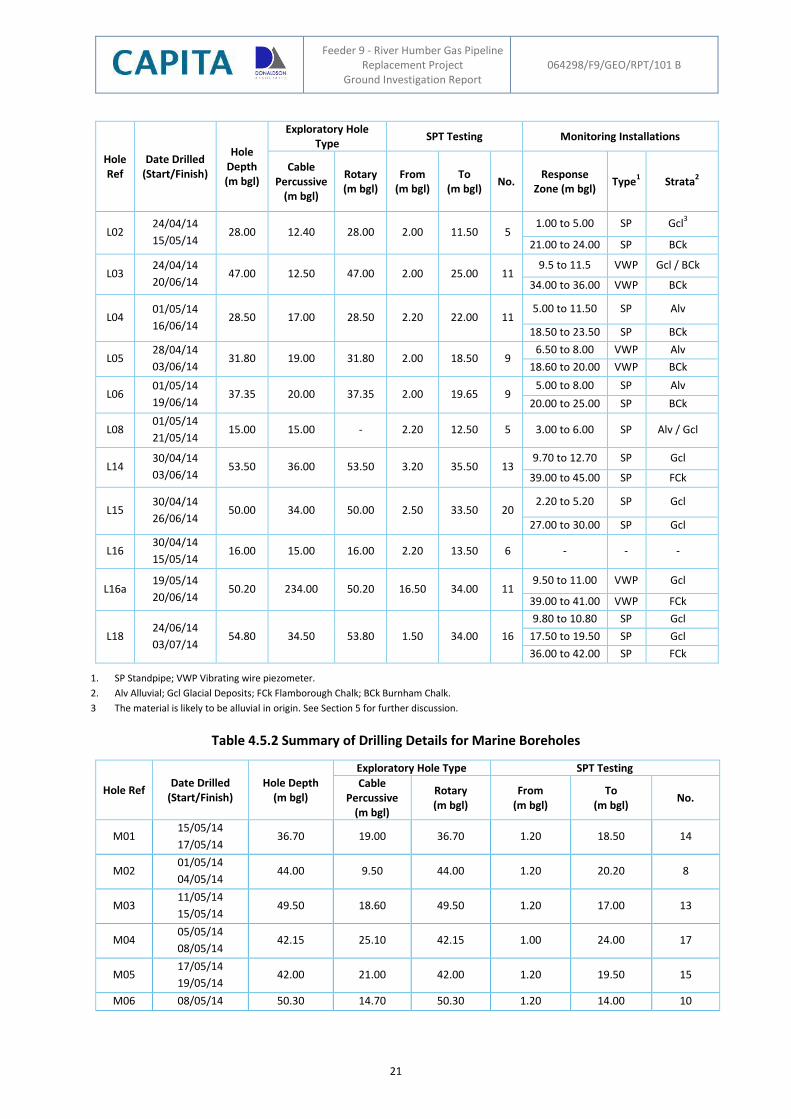
The completed land works consisted of 12 boreholes, 25 cone penetration tests (CPT) and 5 Trial
Pits. The Marine works consisted of 16 boreholes. All the boreholes drilled, with the exception of
L08, were constructed by cable percussive techniques with rotary used as a follow-on technique. L08
was constructed by cable percussive techniques only. In L16, blowing sands was noted during rotary
drilling resulting in a repositioning and redrilling of the borehole (L16A). A full summary of the cable
percussive and rotary drilling depths can be found in Table 4.51 and 4.5.2 split by land and marine
works. Depths are reported as metres below ground level (m bgl).
Table 4.5.1 Summary of Drilling Details and Installations for Land Boreholes
Hole Ref
Date Drilled (Start/Finish)
Hole Depth (m bgl)
Exploratory Hole Type
SPT Testing Monitoring Installations
Cable Percussive
(m bgl)
Rotary (m bgl)
From (m bgl)
To (m bgl)
No. Response
Zone (m bgl) Type
1 Strata
2
L01 23/04/14
09/05/14 27.90 12.00 27.90 2.00 17.60 7 9.30 to 12.30 SP FCk
5 Due to the proximity of proposed overwater boreholes to the existing Feeder 9 and Centrica gas pipelines, it was
important to establish a safe working distance to allow the overwater jack-up operations to progress safely. A desk based
study (CS-064298-F9-RPT-006 Establishing a Safe Working Distance for Undertaking Overwater Jack-up Operations
Proximate to Gas Pipeline Assets. Capita (2014)) was undertaken that assessed current industry practice and a qualitative
risk assessment was carried out to establish what was considered a conservative exclusion zone within which no jack-up
barge would encroach.
6 The Phase 1 Ground Investigation will be referred to as “Phase 1” for ease of reference and not to be confused with the
Phase 1 geophysical survey. The factual report (Soil Engineering Geoservices Ltd. (2014)) is currently in draft format
awaiting completion of laboratory testing and final commenting.
Feeder 9 - River Humber Gas Pipeline Replacement Project
Ground Investigation Report 064298/F9/GEO/RPT/101 B
21
Hole Ref
Date Drilled (Start/Finish)
Hole Depth (m bgl)
Exploratory Hole Type
SPT Testing Monitoring Installations
Cable Percussive
(m bgl)
Rotary (m bgl)
From (m bgl)
To (m bgl)
No. Response
Zone (m bgl) Type
1 Strata
2
L02 24/04/14
15/05/14 28.00 12.40 28.00 2.00 11.50 5
1.00 to 5.00 SP Gcl3
21.00 to 24.00 SP BCk
L03 24/04/14
20/06/14 47.00 12.50 47.00 2.00 25.00 11
9.5 to 11.5 VWP Gcl / BCk
34.00 to 36.00 VWP BCk
L04 01/05/14
16/06/14 28.50 17.00 28.50 2.20 22.00 11
5.00 to 11.50 SP Alv
18.50 to 23.50 SP BCk
L05 28/04/14
03/06/14 31.80 19.00 31.80 2.00 18.50 9
6.50 to 8.00 VWP Alv
18.60 to 20.00 VWP BCk
L06 01/05/14
19/06/14 37.35 20.00 37.35 2.00 19.65 9
5.00 to 8.00 SP Alv
20.00 to 25.00 SP BCk
L08 01/05/14
21/05/14 15.00 15.00 - 2.20 12.50 5 3.00 to 6.00 SP Alv / Gcl
L14 30/04/14
03/06/14 53.50 36.00 53.50 3.20 35.50 13
9.70 to 12.70 SP Gcl
39.00 to 45.00 SP FCk
L15 30/04/14
26/06/14 50.00 34.00 50.00 2.50 33.50 20
2.20 to 5.20 SP Gcl
27.00 to 30.00 SP Gcl
L16 30/04/14
15/05/14 16.00 15.00 16.00 2.20 13.50 6 - - -
L16a 19/05/14
20/06/14 50.20 234.00 50.20 16.50 34.00 11
9.50 to 11.00 VWP Gcl
39.00 to 41.00 VWP FCk
L18 24/06/14
03/07/14 54.80 34.50 53.80 1.50 34.00 16
9.80 to 10.80 SP Gcl
17.50 to 19.50 SP Gcl
36.00 to 42.00 SP FCk
1. SP Standpipe; VWP Vibrating wire piezometer.
2. Alv Alluvial; Gcl Glacial Deposits; FCk Flamborough Chalk; BCk Burnham Chalk.
3 The material is likely to be alluvial in origin. See Section 5 for further discussion.
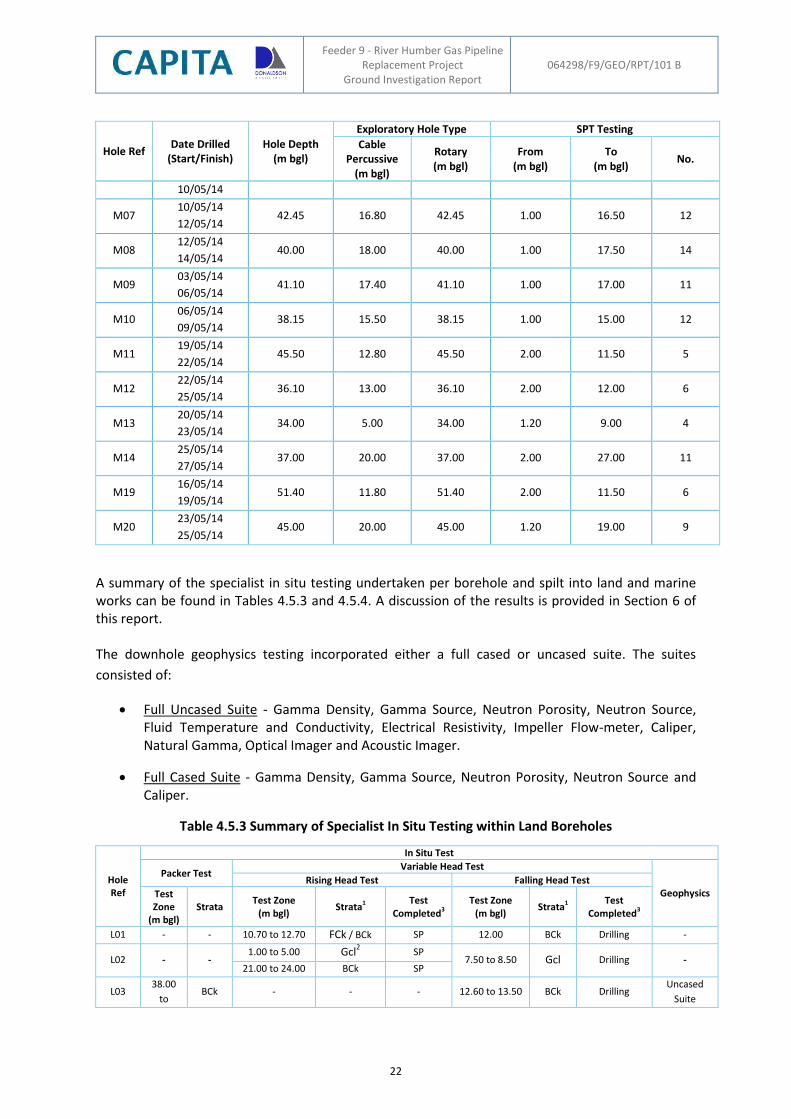
Table 4.5.2 Summary of Drilling Details for Marine Boreholes
Hole Ref Date Drilled
(Start/Finish) Hole Depth
(m bgl)
Exploratory Hole Type SPT Testing
Cable Percussive
(m bgl)
Rotary (m bgl)
From (m bgl)
To (m bgl)
No.
M01 15/05/14
17/05/14 36.70 19.00 36.70 1.20 18.50 14
M02 01/05/14
04/05/14 44.00 9.50 44.00 1.20 20.20 8
M03 11/05/14
15/05/14 49.50 18.60 49.50 1.20 17.00 13
M04 05/05/14
08/05/14 42.15 25.10 42.15 1.00 24.00 17
M05 17/05/14
19/05/14 42.00 21.00 42.00 1.20 19.50 15
M06 08/05/14 50.30 14.70 50.30 1.20 14.00 10
Feeder 9 - River Humber Gas Pipeline Replacement Project
Ground Investigation Report 064298/F9/GEO/RPT/101 B
22
Hole Ref Date Drilled
(Start/Finish) Hole Depth
(m bgl)
Exploratory Hole Type SPT Testing
Cable Percussive
(m bgl)
Rotary (m bgl)
From (m bgl)
To (m bgl)
No.
10/05/14
M07 10/05/14
12/05/14 42.45 16.80 42.45 1.00 16.50 12
M08 12/05/14
14/05/14 40.00 18.00 40.00 1.00 17.50 14
M09 03/05/14
06/05/14 41.10 17.40 41.10 1.00 17.00 11
M10 06/05/14
09/05/14 38.15 15.50 38.15 1.00 15.00 12
M11 19/05/14
22/05/14 45.50 12.80 45.50 2.00 11.50 5
M12 22/05/14
25/05/14 36.10 13.00 36.10 2.00 12.00 6
M13 20/05/14
23/05/14 34.00 5.00 34.00 1.20 9.00 4
M14 25/05/14
27/05/14 37.00 20.00 37.00 2.00 27.00 11
M19 16/05/14
19/05/14 51.40 11.80 51.40 2.00 11.50 6
M20 23/05/14
25/05/14 45.00 20.00 45.00 1.20 19.00 9
A summary of the specialist in situ testing undertaken per borehole and spilt into land and marine works can be found in Tables 4.5.3 and 4.5.4. A discussion of the results is provided in Section 6 of this report. The downhole geophysics testing incorporated either a full cased or uncased suite. The suites
consisted of:
Full Uncased Suite - Gamma Density, Gamma Source, Neutron Porosity, Neutron Source, Fluid Temperature and Conductivity, Electrical Resistivity, Impeller Flow-meter, Caliper, Natural Gamma, Optical Imager and Acoustic Imager.
Full Cased Suite - Gamma Density, Gamma Source, Neutron Porosity, Neutron Source and Caliper.
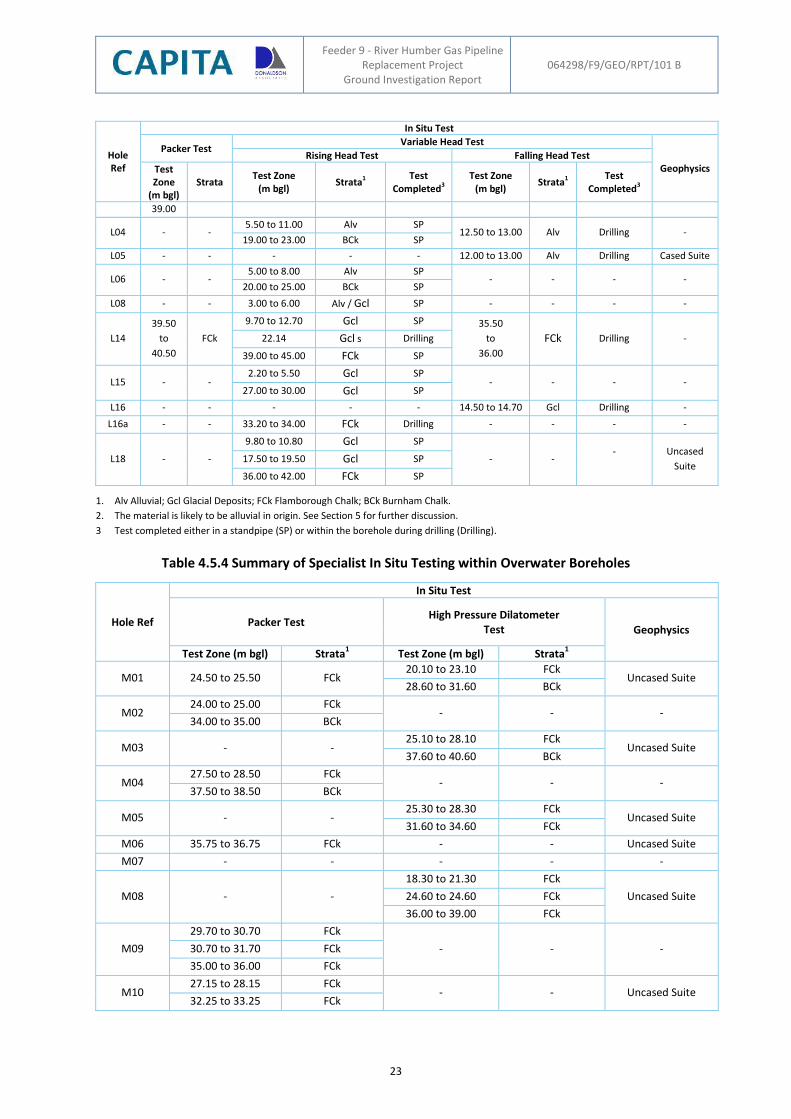
Table 4.5.3 Summary of Specialist In Situ Testing within Land Boreholes
Hole Ref
In Situ Test
Packer Test Variable Head Test
Geophysics Rising Head Test Falling Head Test
Test Zone
(m bgl) Strata
Test Zone (m bgl)
Strata1 Test
Completed3 Test Zone
(m bgl) Strata1
Test Completed3
L01 - - 10.70 to 12.70 FCk / BCk SP 12.00 BCk Drilling -
L02 - - 1.00 to 5.00 Gcl
2 SP
7.50 to 8.50 Gcl Drilling - 21.00 to 24.00 BCk SP
L03 38.00
to BCk - - - 12.60 to 13.50 BCk Drilling
Uncased
Suite
Feeder 9 - River Humber Gas Pipeline Replacement Project
Ground Investigation Report 064298/F9/GEO/RPT/101 B
23
Hole Ref
In Situ Test
Packer Test Variable Head Test
Geophysics Rising Head Test Falling Head Test
Test Zone
(m bgl) Strata
Test Zone (m bgl)
Strata1 Test
Completed3 Test Zone
(m bgl) Strata1
Test Completed3
39.00
L04 - - 5.50 to 11.00 Alv SP
12.50 to 13.00 Alv Drilling - 19.00 to 23.00 BCk SP
L05 - - - - - 12.00 to 13.00 Alv Drilling Cased Suite
L06 - - 5.00 to 8.00 Alv SP
- - - - 20.00 to 25.00 BCk SP
L08 - - 3.00 to 6.00 Alv / Gcl SP - - - -
L14
39.50
to
40.50
FCk
9.70 to 12.70 Gcl SP 35.50
to
36.00
FCk Drilling - 22.14 Gcl s Drilling
39.00 to 45.00 FCk SP
L15 - - 2.20 to 5.50 Gcl SP
- - - - 27.00 to 30.00 Gcl SP
L16 - - - - - 14.50 to 14.70 Gcl Drilling -
L16a - - 33.20 to 34.00 FCk Drilling - - - -
L18 - -
9.80 to 10.80 Gcl SP
- - -
Uncased
Suite 17.50 to 19.50 Gcl SP
36.00 to 42.00 FCk SP
1. Alv Alluvial; Gcl Glacial Deposits; FCk Flamborough Chalk; BCk Burnham Chalk.
2. The material is likely to be alluvial in origin. See Section 5 for further discussion.
3 Test completed either in a standpipe (SP) or within the borehole during drilling (Drilling).
Table 4.5.4 Summary of Specialist In Situ Testing within Overwater Boreholes
Hole Ref
In Situ Test
Packer Test High Pressure Dilatometer
Test Geophysics
Test Zone (m bgl) Strata1 Test Zone (m bgl) Strata
1
M01 24.50 to 25.50 FCk 20.10 to 23.10 FCk
Uncased Suite 28.60 to 31.60 BCk
M02 24.00 to 25.00 FCk
- - - 34.00 to 35.00 BCk
M03 - - 25.10 to 28.10 FCk
Uncased Suite 37.60 to 40.60 BCk
M04 27.50 to 28.50 FCk
- - - 37.50 to 38.50 BCk
M05 - - 25.30 to 28.30 FCk
Uncased Suite 31.60 to 34.60 FCk
M06 35.75 to 36.75 FCk - - Uncased Suite
M07 - - - - -
M08 - -
18.30 to 21.30 FCk
Uncased Suite 24.60 to 24.60 FCk
36.00 to 39.00 FCk
M09
29.70 to 30.70 FCk
- - - 30.70 to 31.70 FCk
35.00 to 36.00 FCk
M10 27.15 to 28.15 FCk
- - Uncased Suite 32.25 to 33.25 FCk
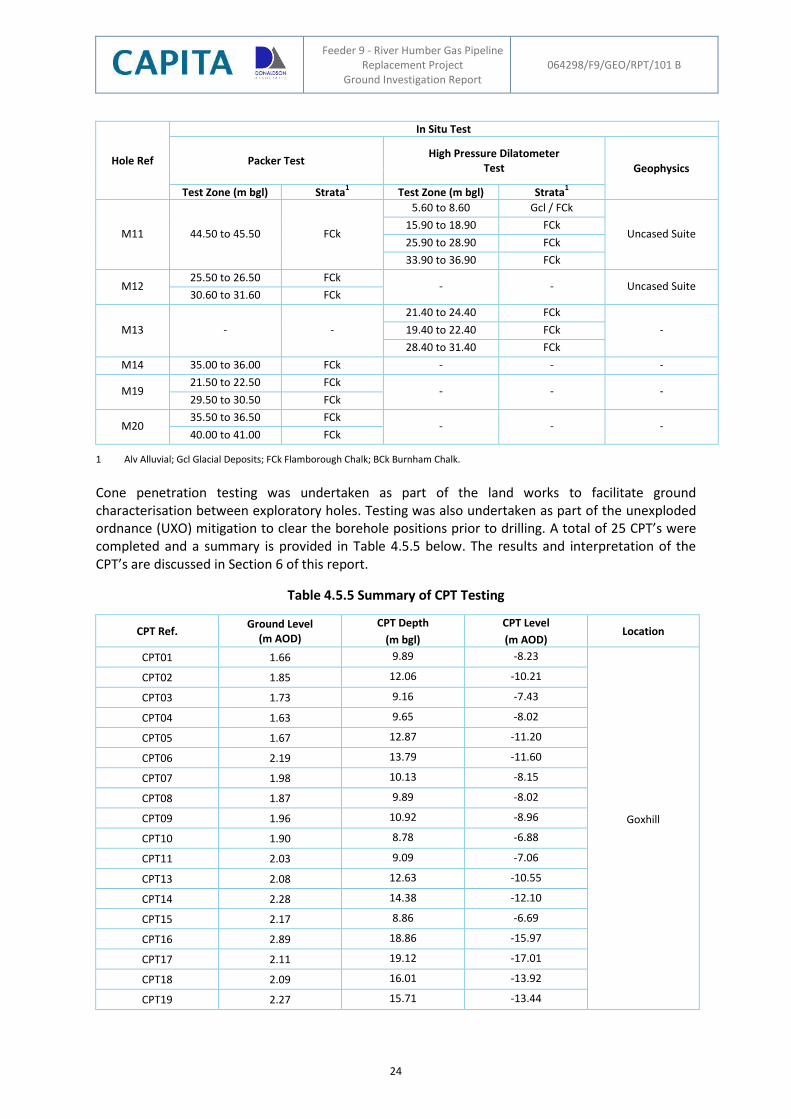
Feeder 9 - River Humber Gas Pipeline Replacement Project
Ground Investigation Report 064298/F9/GEO/RPT/101 B
24
Hole Ref
In Situ Test
Packer Test High Pressure Dilatometer
Test Geophysics
Test Zone (m bgl) Strata1 Test Zone (m bgl) Strata
1
M11 44.50 to 45.50 FCk
5.60 to 8.60 Gcl / FCk
Uncased Suite 15.90 to 18.90 FCk
25.90 to 28.90 FCk
33.90 to 36.90 FCk
M12 25.50 to 26.50 FCk
- - Uncased Suite 30.60 to 31.60 FCk
M13 - -
21.40 to 24.40 FCk
- 19.40 to 22.40 FCk
28.40 to 31.40 FCk
M14 35.00 to 36.00 FCk - - -
M19 21.50 to 22.50 FCk
- - - 29.50 to 30.50 FCk
M20 35.50 to 36.50 FCk
- - - 40.00 to 41.00 FCk
1 Alv Alluvial; Gcl Glacial Deposits; FCk Flamborough Chalk; BCk Burnham Chalk.
Cone penetration testing was undertaken as part of the land works to facilitate ground characterisation between exploratory holes. Testing was also undertaken as part of the unexploded ordnance (UXO) mitigation to clear the borehole positions prior to drilling. A total of 25 CPT’s were completed and a summary is provided in Table 4.5.5 below. The results and interpretation of the CPT’s are discussed in Section 6 of this report.
Table 4.5.5 Summary of CPT Testing
CPT Ref. Ground Level
(m AOD)
CPT Depth
(m bgl)
CPT Level
(m AOD) Location
CPT01 1.66 9.89 -8.23
Goxhill
CPT02 1.85 12.06 -10.21
CPT03 1.73 9.16 -7.43
CPT04 1.63 9.65 -8.02
CPT05 1.67 12.87 -11.20
CPT06 2.19 13.79 -11.60
CPT07 1.98 10.13 -8.15
CPT08 1.87 9.89 -8.02
CPT09 1.96 10.92 -8.96
CPT10 1.90 8.78 -6.88
CPT11 2.03 9.09 -7.06
CPT13 2.08 12.63 -10.55
CPT14 2.28 14.38 -12.10
CPT15 2.17 8.86 -6.69
CPT16 2.89 18.86 -15.97
CPT17 2.11 19.12 -17.01
CPT18 2.09 16.01 -13.92
CPT19 2.27 15.71 -13.44
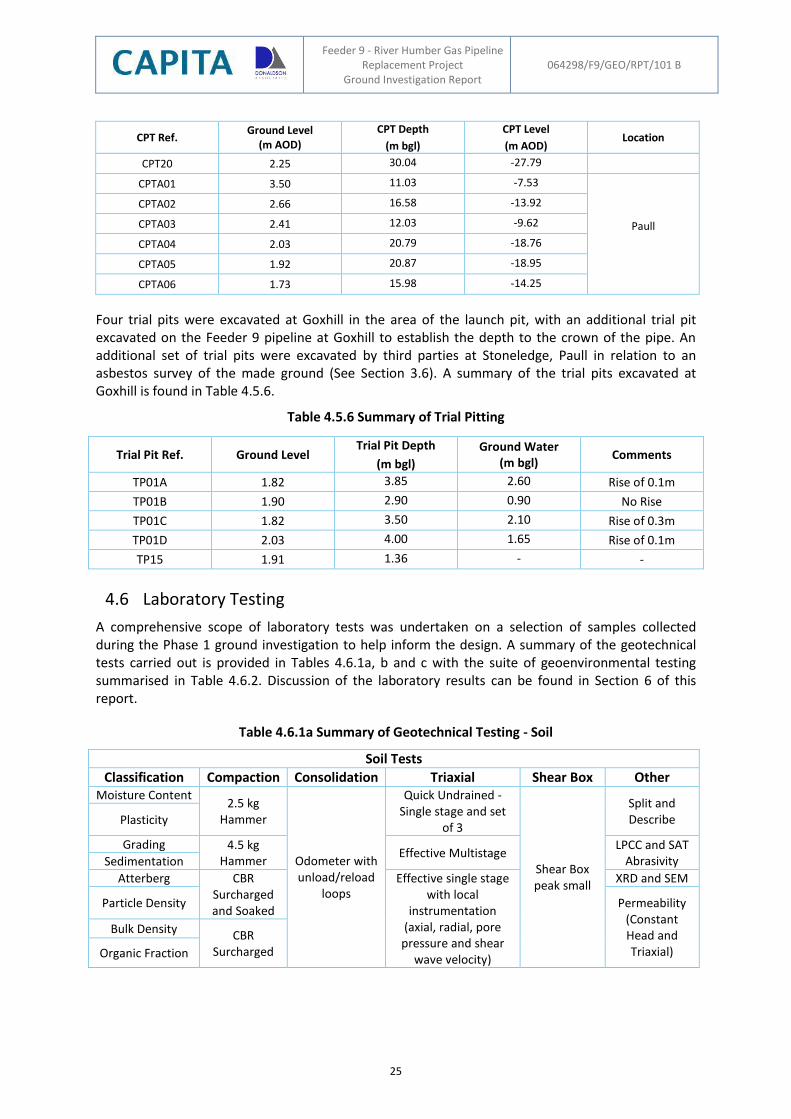
Feeder 9 - River Humber Gas Pipeline Replacement Project
Ground Investigation Report 064298/F9/GEO/RPT/101 B
25
CPT Ref. Ground Level
(m AOD)
CPT Depth
(m bgl)
CPT Level
(m AOD) Location
CPT20 2.25 30.04 -27.79
CPTA01 3.50 11.03 -7.53
Paull
CPTA02 2.66 16.58 -13.92
CPTA03 2.41 12.03 -9.62
CPTA04 2.03 20.79 -18.76
CPTA05 1.92 20.87 -18.95
CPTA06 1.73 15.98 -14.25
Four trial pits were excavated at Goxhill in the area of the launch pit, with an additional trial pit excavated on the Feeder 9 pipeline at Goxhill to establish the depth to the crown of the pipe. An additional set of trial pits were excavated by third parties at Stoneledge, Paull in relation to an asbestos survey of the made ground (See Section 3.6). A summary of the trial pits excavated at Goxhill is found in Table 4.5.6.
Table 4.5.6 Summary of Trial Pitting
Trial Pit Ref. Ground Level Trial Pit Depth
(m bgl)
Ground Water (m bgl)
Comments
TP01A 1.82 3.85 2.60 Rise of 0.1m
TP01B 1.90 2.90 0.90 No Rise
TP01C 1.82 3.50 2.10 Rise of 0.3m
TP01D 2.03 4.00 1.65 Rise of 0.1m
TP15 1.91 1.36 - -
4.6 Laboratory Testing
A comprehensive scope of laboratory tests was undertaken on a selection of samples collected during the Phase 1 ground investigation to help inform the design. A summary of the geotechnical tests carried out is provided in Tables 4.6.1a, b and c with the suite of geoenvironmental testing summarised in Table 4.6.2. Discussion of the laboratory results can be found in Section 6 of this report.
Table 4.6.1a Summary of Geotechnical Testing - Soil
Soil Tests
Classification Compaction Consolidation Triaxial Shear Box Other Moisture Content
2.5 kg Hammer
Odometer with unload/reload
loops
Quick Undrained - Single stage and set
of 3
Shear Box peak small
Split and Describe Plasticity
Grading 4.5 kg Hammer
Effective Multistage LPCC and SAT
Abrasivity Sedimentation
Atterberg CBR Surcharged and Soaked
Effective single stage with local
instrumentation (axial, radial, pore pressure and shear
wave velocity)
XRD and SEM
Particle Density Permeability (Constant Head and Triaxial)
Bulk Density CBR Surcharged Organic Fraction
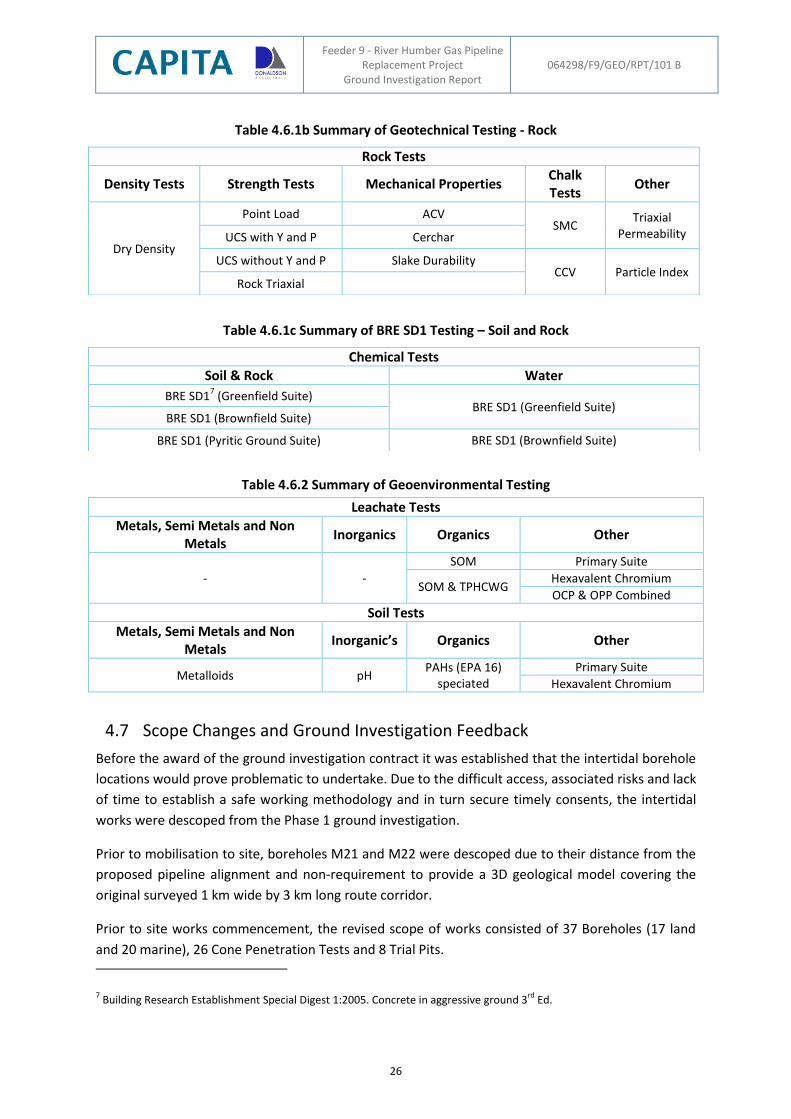
Feeder 9 - River Humber Gas Pipeline Replacement Project
Ground Investigation Report 064298/F9/GEO/RPT/101 B
26
Table 4.6.1b Summary of Geotechnical Testing - Rock
Table 4.6.1c Summary of BRE SD1 Testing – Soil and Rock
Table 4.6.2 Summary of Geoenvironmental Testing
Leachate Tests
Metals, Semi Metals and Non Metals
Inorganics Organics Other
- -
SOM Primary Suite
SOM & TPHCWG Hexavalent Chromium
OCP & OPP Combined
Soil Tests
Metals, Semi Metals and Non Metals
Inorganic’s Organics Other
Metalloids pH PAHs (EPA 16)
speciated Primary Suite
Hexavalent Chromium
4.7 Scope Changes and Ground Investigation Feedback
Before the award of the ground investigation contract it was established that the intertidal borehole
locations would prove problematic to undertake. Due to the difficult access, associated risks and lack
of time to establish a safe working methodology and in turn secure timely consents, the intertidal
works were descoped from the Phase 1 ground investigation.
Prior to mobilisation to site, boreholes M21 and M22 were descoped due to their distance from the
proposed pipeline alignment and non-requirement to provide a 3D geological model covering the
original surveyed 1 km wide by 3 km long route corridor.
Prior to site works commencement, the revised scope of works consisted of 37 Boreholes (17 land
and 20 marine), 26 Cone Penetration Tests and 8 Trial Pits.
7 Building Research Establishment Special Digest 1:2005. Concrete in aggressive ground 3
rd Ed.
Rock Tests
Density Tests Strength Tests Mechanical Properties Chalk Tests
Other
Dry Density
Point Load ACV SMC
Triaxial Permeability UCS with Y and P Cerchar
UCS without Y and P Slake Durability CCV Particle Index
Rock Triaxial
Chemical Tests
Soil & Rock Water
BRE SD17 (Greenfield Suite)
BRE SD1 (Greenfield Suite) BRE SD1 (Brownfield Suite)
BRE SD1 (Pyritic Ground Suite) BRE SD1 (Brownfield Suite)
Feeder 9 - River Humber Gas Pipeline Replacement Project
Ground Investigation Report 064298/F9/GEO/RPT/101 B
27
Suspected asbestos containing material was identified during a site visit in March 2014 at
Stoneledge, the location for the reception pit. Consequently, the ground investigation scope in this
field (3 boreholes, 6 CPT’s and 4 trial pits) was suspended pending further investigation. Trial pits
were undertaken in June 2014 by the landowner to ascertain whether any ACM was in fact present
at the site. The results of the landowner’s investigation are summarised in the Wardell Armstrong
report (2014) and separate bulk analysis confirmed the presence of Chrysotile and Amosite.
However, due to available time frame, it was decided to descope all the works planned at
Stoneledge, L11 to L13 and associated CPT’s and to undertake the works as part of a future
investigation. The original scope of proposed trial pits were undertaken as part of the landowners
trial pitting scope.
To ensure preliminary information was available to inform the design and reduce ground risks, the
closest borehole to the proposed reception pit, L15, was extended to 50 m bgl.
During the site works, marine boreholes M15 to M18 inclusive were descoped.
Boreholes L07 and L17 were located in environmentally sensitive locations that required consents
from the Environment Agency, Natural England and local authority. Due to the timeframes
associated with the application and approval of consents from the statutory bodies, L07 was
descoped. L17 was relocated from its originally proposed position at the end of the spit due to
difficulties associated with access and establishing a safe system of work. This was subsequently
descoped with a view to undertaking in a later phase of ground investigation.
CPT12 was descoped on site as a suitable location could not be found due to the presence of the
Feeder 9 Gas Pipeline and ecological constraints. CPT21 was also descoped as only one exploratory
hole was allowed in this area to ensure the consent could be signed off for L07.
During the field works it was agreed to undertake an additional 6 CPTs at Paull (CPTA01 to CPTA06)
to provide data associated with an option to relocate the reception pit south of Stoneledge.
Land based drilling was initially undertaken using cable percussion and conventional rotary drilling
techniques adopting air mist. In comparison, the overwater drilling used cable percussion and
geobor rotary drilling. However, recoveries were poor due to the destructured and fractured nature
of the chalk. In line with the contract, the ground investigation contractor was required to
demonstrate an optimal drilling technique was being adopted. Drilling speeds and cutter heads were
varied and an optimal cutter identified. To improve progress on land, geobor was adopted for rotary
drilling. A water flush trial was also undertaken. A feedback summary from the ground investigation
operations is provided in Table 4.7.1 below.
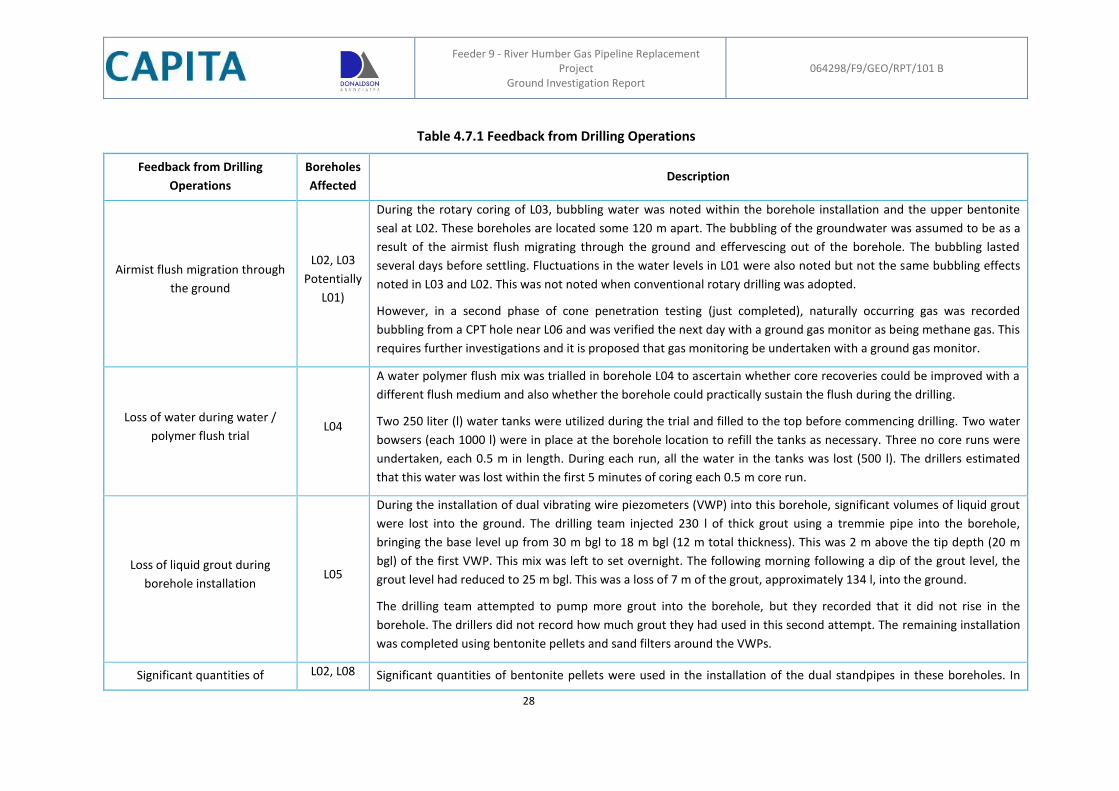
Feeder 9 - River Humber Gas Pipeline Replacement
Project Ground Investigation Report
064298/F9/GEO/RPT/101 B
28
Table 4.7.1 Feedback from Drilling Operations
Feedback from Drilling
Operations
Boreholes
Affected Description
Airmist flush migration through
the ground
L02, L03
Potentially
L01)
During the rotary coring of L03, bubbling water was noted within the borehole installation and the upper bentonite
seal at L02. These boreholes are located some 120 m apart. The bubbling of the groundwater was assumed to be as a
result of the airmist flush migrating through the ground and effervescing out of the borehole. The bubbling lasted
several days before settling. Fluctuations in the water levels in L01 were also noted but not the same bubbling effects
noted in L03 and L02. This was not noted when conventional rotary drilling was adopted.
However, in a second phase of cone penetration testing (just completed), naturally occurring gas was recorded
bubbling from a CPT hole near L06 and was verified the next day with a ground gas monitor as being methane gas. This
requires further investigations and it is proposed that gas monitoring be undertaken with a ground gas monitor.
Loss of water during water /
polymer flush trial L04
A water polymer flush mix was trialled in borehole L04 to ascertain whether core recoveries could be improved with a
different flush medium and also whether the borehole could practically sustain the flush during the drilling.
Two 250 liter (l) water tanks were utilized during the trial and filled to the top before commencing drilling. Two water
bowsers (each 1000 l) were in place at the borehole location to refill the tanks as necessary. Three no core runs were
undertaken, each 0.5 m in length. During each run, all the water in the tanks was lost (500 l). The drillers estimated
that this water was lost within the first 5 minutes of coring each 0.5 m core run.
Loss of liquid grout during
borehole installation L05
During the installation of dual vibrating wire piezometers (VWP) into this borehole, significant volumes of liquid grout
were lost into the ground. The drilling team injected 230 l of thick grout using a tremmie pipe into the borehole,
bringing the base level up from 30 m bgl to 18 m bgl (12 m total thickness). This was 2 m above the tip depth (20 m
bgl) of the first VWP. This mix was left to set overnight. The following morning following a dip of the grout level, the
grout level had reduced to 25 m bgl. This was a loss of 7 m of the grout, approximately 134 l, into the ground.
The drilling team attempted to pump more grout into the borehole, but they recorded that it did not rise in the
borehole. The drillers did not record how much grout they had used in this second attempt. The remaining installation
was completed using bentonite pellets and sand filters around the VWPs.
Significant quantities of L02, L08 Significant quantities of bentonite pellets were used in the installation of the dual standpipes in these boreholes. In
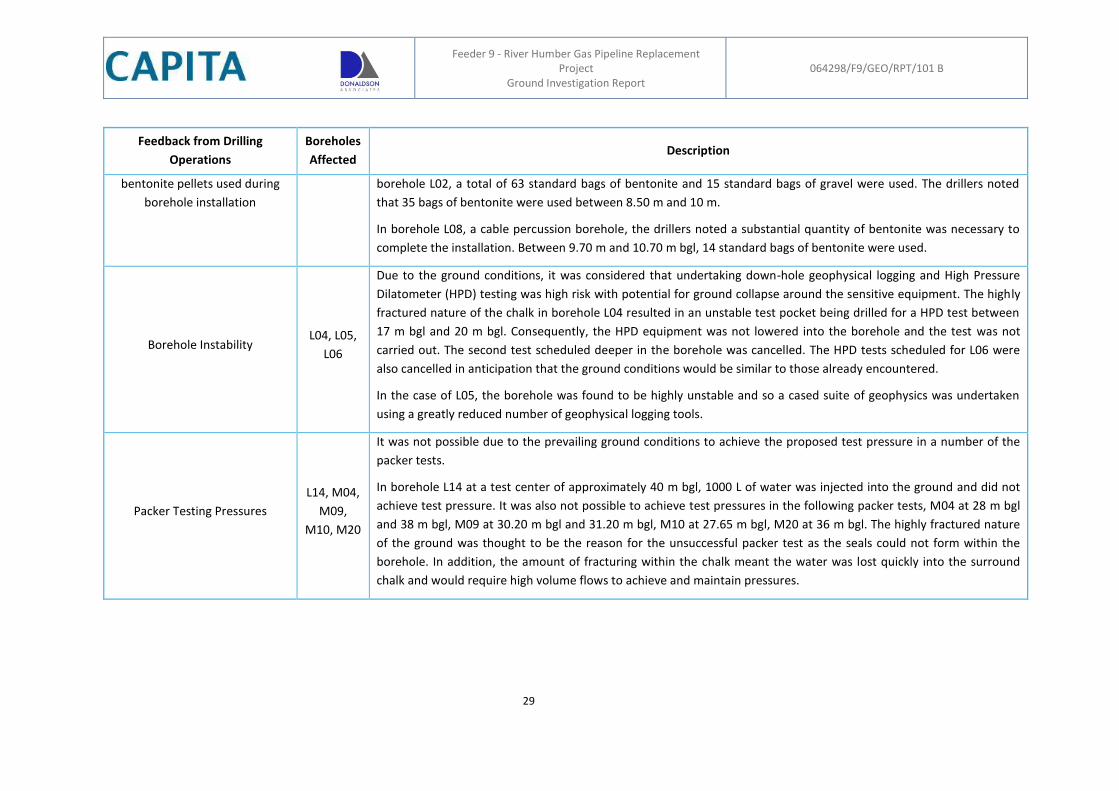
Feeder 9 - River Humber Gas Pipeline Replacement
Project Ground Investigation Report
064298/F9/GEO/RPT/101 B
29
Feedback from Drilling
Operations
Boreholes
Affected Description
bentonite pellets used during
borehole installation
borehole L02, a total of 63 standard bags of bentonite and 15 standard bags of gravel were used. The drillers noted
that 35 bags of bentonite were used between 8.50 m and 10 m.
In borehole L08, a cable percussion borehole, the drillers noted a substantial quantity of bentonite was necessary to
complete the installation. Between 9.70 m and 10.70 m bgl, 14 standard bags of bentonite were used.
Borehole Instability L04, L05,
L06
Due to the ground conditions, it was considered that undertaking down-hole geophysical logging and High Pressure
Dilatometer (HPD) testing was high risk with potential for ground collapse around the sensitive equipment. The highly
fractured nature of the chalk in borehole L04 resulted in an unstable test pocket being drilled for a HPD test between
17 m bgl and 20 m bgl. Consequently, the HPD equipment was not lowered into the borehole and the test was not
carried out. The second test scheduled deeper in the borehole was cancelled. The HPD tests scheduled for L06 were
also cancelled in anticipation that the ground conditions would be similar to those already encountered.
In the case of L05, the borehole was found to be highly unstable and so a cased suite of geophysics was undertaken
using a greatly reduced number of geophysical logging tools.
Packer Testing Pressures
L14, M04,
M09,
M10, M20
It was not possible due to the prevailing ground conditions to achieve the proposed test pressure in a number of the
packer tests.
In borehole L14 at a test center of approximately 40 m bgl, 1000 L of water was injected into the ground and did not
achieve test pressure. It was also not possible to achieve test pressures in the following packer tests, M04 at 28 m bgl
and 38 m bgl, M09 at 30.20 m bgl and 31.20 m bgl, M10 at 27.65 m bgl, M20 at 36 m bgl. The highly fractured nature
of the ground was thought to be the reason for the unsuccessful packer test as the seals could not form within the
borehole. In addition, the amount of fracturing within the chalk meant the water was lost quickly into the surround
chalk and would require high volume flows to achieve and maintain pressures.
Feeder 9 - River Humber Gas Pipeline Replacement Project
Ground Investigation Report 064298/F9/GEO/RPT/101 B
30
5. Ground Summary
Based on pertinent available information8, a ground model cross-section was developed along the
line of the proposed tunnel route (see drawings H160/BH/07/01/F9/101 and
H160/BH/07/01/F9/104). To facilitate the development of the geological section and associated
ground model, it was necessary to indentify from the exploratory log descriptions the geological
formation for the strata encountered. This latter information is not always provided on
exploratory logs so it was necessary to review and identify where possible based on typical
geological markers associated with the deposition environment. A summary of the designated
geological formations and markers used as part of this identification has been provided in
Appendix D. It should be noted that sometimes, the markers are not clear or the differentiation
between alluvial and glacial was based solely on the presence of a gravel fraction, associated
angularity and reference to surrounding strata so the geological designation can be subjective.
The model has also been based on the Phase 1 ground investigation factual report which is
currently undergoing review so changes are to be anticipated. For example, soft deposits have
been noted in boreholes L01, L02 and L03 but with the presence of angular to subrounded gravel
fractions in the descriptions, these have been identified as glacial in origin. However, reference to
laboratory gradings and site observations indicate the lack of gravel fraction and are probably
alluvial in origin. Such discrepancies will be resolved on agreement of the final Phase 1 factual
report. However, regardless of the geology, it is the material behaviour and associated
geotechnical parameters that will dictate the design.
In the following section, ground conditions for the site as whole are discussed followed by more
detailed discussions of the conditions anticipated at the Goxhill, Humber and Paull sections of the
site. As will be seen, there is a significant variability in the depths and makeup of the superficial
deposits so ultimately, the development of localised ground models based on localised
exploratory hole information will be necessary for the structure under review.
5.1 Ground Conditions
Made Ground
No made ground was identified during the Phase 1 intrusive ground investigation, but made
ground was identified in the trial pits undertaken at Stoneledge as part of the asbestos
investigations. Details of the ground investigation at Stoneledge can be found in the report
produced by Wardell Armstrong (2014).
8 Only boreholes were used for the creation of the geological boundaries as these allow a visual assessment to be
undertaken in comparison to CPT’s although an assessment of the boundary from the CPT’s has also been undertaken
and identified in the section for comparison purposes. Due to the shallow depth of trial pits, these have also not been
included as they add no further information to the cross-section.
Feeder 9 - River Humber Gas Pipeline Replacement Project
Ground Investigation Report 064298/F9/GEO/RPT/101 B
31
Topsoil
Topsoil was identified in all the land boreholes at both Goxhill and Paull ranging in thickness from
0.05 m to 0.4 m. No topsoil was identified in any of the marine boreholes as would be expected.
Marine and Estuarine Alluvium
Alluvium was identified in 20 boreholes, (13 marine and 7 land boreholes).The alluvium is
associated with a marine and estuarine environment and formed of both cohesive and granular
strata. These are generally described as either:
Loose to medium dense orangish brown mottled dark grey clayey, silty fine to
coarse sand. Sometimes containing subrounded to rounded fine to coarse gravel.
or
Very soft to soft, sometimes organic, brown mottled dark grey slightly sandy clayey silt or
silty clay.
The alluvial deposits were more typically cohesive at Goxhill but becoming more interlayered
granular / cohesive for the Humber and Paull areas.
Borehole’s L04, L05 and L08 at Goxhill all encountered layers of peat within the alluvial strata. The
peat was generally described as “soft to firm brown peat”. Peat was also noted within the
historical exploratory holes undertaken within the AGI at Paull.
Glacial Till
Glacial deposits were identified in 21 boreholes, (11 marine and 10 land boreholes). The glacial
deposits are formed of both cohesive and granular strata. These are generally described as either:
Dense to very dense, brown, slightly clayey, slightly gravelly, fine to coarse sand.
Gravel is fine to coarse angular to subrounded chalk and mixed lithologies.
Occasionally dense to very dense brown slightly clayey slightly sandy fine to coarse
gravel of angular to subrounded chalk and mixed lithologies. Sand is fine to coarse.
or
Firm to very stiff, brownish grey, slightly sandy, slightly gravelly silty clay. Sand is
fine to coarse. Gravel is angular to subrounded fine to coarse chalk and mixed
lithologies.
Flamborough Chalk
The Flamborough Chalk was identified in all boreholes drilled during the ground investigation
except L04 where the chalk was absent. The chalk was generally described as:
Weak medium to high density white chalk with extremely closely to closely spaced
laminations of grey marl and some trace fossils with occasional black sponges.
Burnham Chalk
The Burnham Chalk was identified in 12 boreholes (5 marine and 7 Land boreholes) The chalk is
generally described as:
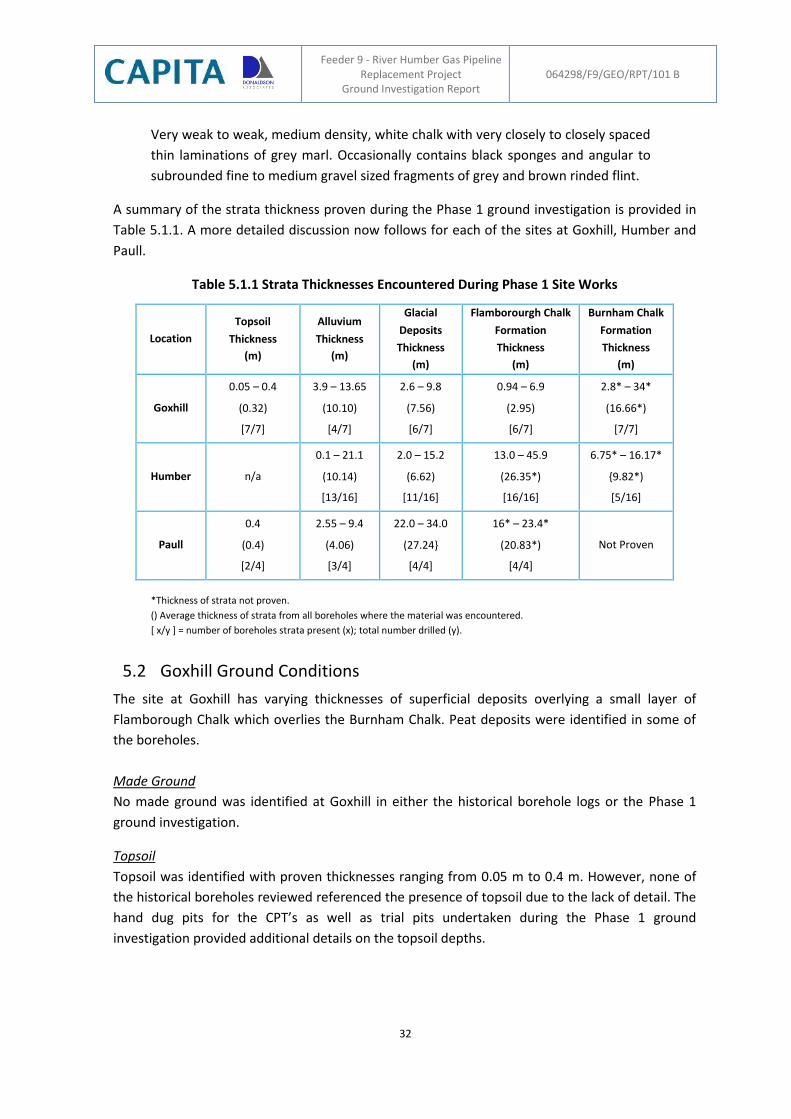
Feeder 9 - River Humber Gas Pipeline Replacement Project
Ground Investigation Report 064298/F9/GEO/RPT/101 B
32
Very weak to weak, medium density, white chalk with very closely to closely spaced
thin laminations of grey marl. Occasionally contains black sponges and angular to
subrounded fine to medium gravel sized fragments of grey and brown rinded flint.
A summary of the strata thickness proven during the Phase 1 ground investigation is provided in
Table 5.1.1. A more detailed discussion now follows for each of the sites at Goxhill, Humber and
Paull.
Table 5.1.1 Strata Thicknesses Encountered During Phase 1 Site Works
Location
Topsoil
Thickness
(m)
Alluvium
Thickness
(m)
Glacial
Deposits
Thickness
(m)
Flamborourgh Chalk
Formation
Thickness
(m)
Burnham Chalk
Formation
Thickness
(m)
Goxhill
0.05 – 0.4
(0.32)
[7/7]
3.9 – 13.65
(10.10)
[4/7]
2.6 – 9.8
(7.56)
[6/7]
0.94 – 6.9
(2.95)
[6/7]
2.8* – 34*
(16.66*)
[7/7]
Humber n/a
0.1 – 21.1
(10.14)
[13/16]
2.0 – 15.2
(6.62)
[11/16]
13.0 – 45.9
(26.35*)
[16/16]
6.75* – 16.17*
{9.82*)
[5/16]
Paull
0.4
(0.4)
[2/4]
2.55 – 9.4
(4.06)
[3/4]
22.0 – 34.0
(27.24}
[4/4]
16* – 23.4*
(20.83*)
[4/4]
Not Proven
*Thickness of strata not proven.
() Average thickness of strata from all boreholes where the material was encountered.
[ x/y ] = number of boreholes strata present (x); total number drilled (y).
5.2 Goxhill Ground Conditions
The site at Goxhill has varying thicknesses of superficial deposits overlying a small layer of
Flamborough Chalk which overlies the Burnham Chalk. Peat deposits were identified in some of
the boreholes.
Made Ground
No made ground was identified at Goxhill in either the historical borehole logs or the Phase 1
ground investigation.
Topsoil
Topsoil was identified with proven thicknesses ranging from 0.05 m to 0.4 m. However, none of
the historical boreholes reviewed referenced the presence of topsoil due to the lack of detail. The
hand dug pits for the CPT’s as well as trial pits undertaken during the Phase 1 ground
investigation provided additional details on the topsoil depths.
Feeder 9 - River Humber Gas Pipeline Replacement Project
Ground Investigation Report 064298/F9/GEO/RPT/101 B
33
Marine and Estuarine Alluvium
Alluvium was identified in 4 out of the 7 Phase 1 boreholes and in all of the 17 historical
boreholes reviewed but the thickness of the alluvium was only proven in 11 of these boreholes.
Based on the available data for strata identified as alluvium, a thickness range of >0.91 m to
>18.29 m was noted from all exploratory holes (proven thickness range of 2.8 m to 16.15 m).
Peat was identified in 3 out of the 7 Phase 1 boreholes and in 1 of the 17 historical boreholes
reviewed. Unfortunately most of the historical boreholes lack detail on the strata description.
Peat was also identified in one of the Phase 1 trial pits. Based on available data for strata
identified as peat, a proven thickness range of 1.82 m to 2.13 m was established.
Glacial Till
Glacial Deposits were identified in 5 out of the 7 Phase 1 boreholes and in 9 of the 17 historical
boreholes. Based on the available data for glacial deposits, they have a proven thickness range of
0.8 m to 16.46 m.
Chalk
Chalk was identified in all 7 Phase 1 boreholes and in 11 of the 17 historical boreholes reviewed
but the overall thickness of chalk was not proven. The Phase 1 boreholes identified the two chalk
formations underlying the site, but the historical boreholes reviewed lack this detail in the
descriptions. Based on the available data, chalk was verified to at least 102.4 m depth. Details on
the thickness of the Flamborough and Burnham Chalk formation established from the recent Soil
Engineering ground investigation can be found in Table 5.1.1.
General
Referring to the long section (drawings H160/BH/07/01/F9/101 and H160/BH/07/01/F9/104), a
buried channel is noted to the east of the Goxhill site with up to 13.7 m of alluvium encountered
overlying localised peat deposits in areas. The section also indicates very little, if any, glacial
deposits at the deepest point of the channel. The wider review of the historical boreholes
indicates areas of even deeper alluvium, with again some of the logs identifying no glacial
deposits between the alluvium and underlying chalk rock head. This supports the presence of
variable alluvial stratum, criss-crossed by a series of deeper cut channels and tributaries which in
places have removed all the underlying glacial deposits. The variable and changeable strata
emphasises the importance of adopting a structure specific ground model based on localised
exploratory logs during the design process due to the changeable ground characteristics over
short distances.
The CPT data from the Phase 1 ground investigation generally supports the long sections,
particularly through the buried channel. To the west of the site, the inferred base of alluvium
from an interpretation of the CPT results has been highlighted on the cross section as a dotted
red line. As discussed at the introduction to this chapter, geological formations have been
identified based on soil description markers from boreholes. However, in boreholes L01, L02 and
L03, whist descriptions on the logs identify the presence of angular to subrounded gravel and a
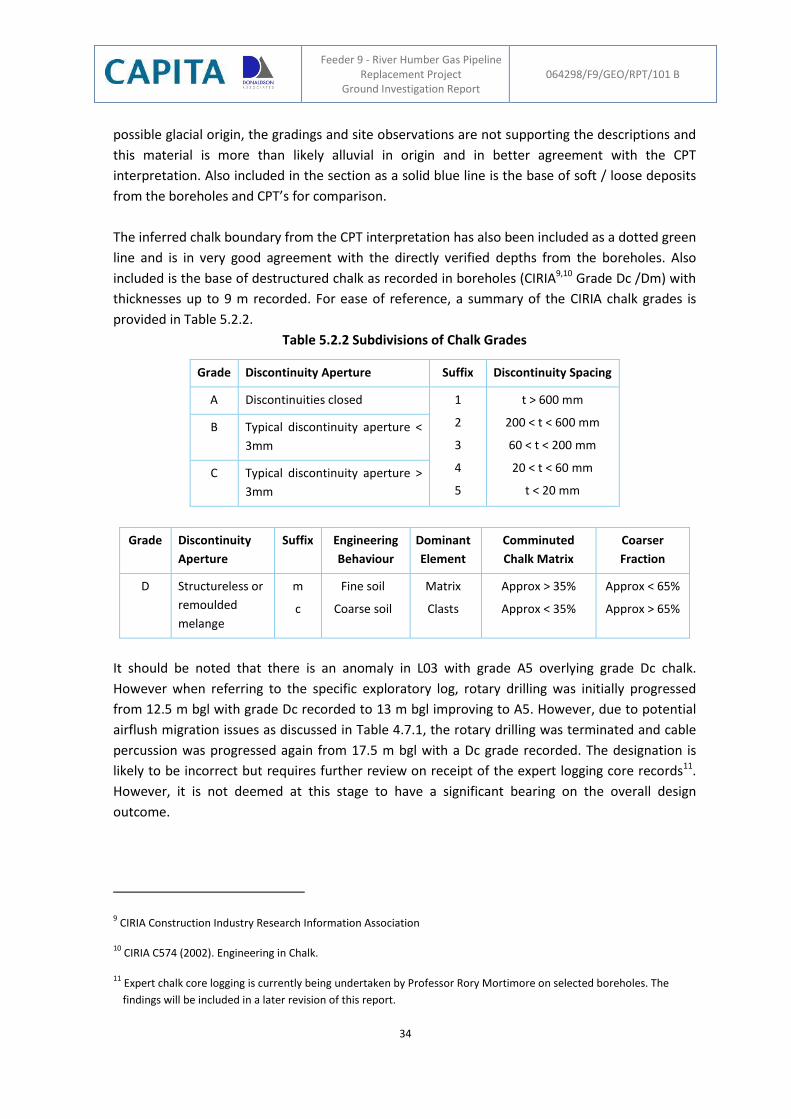
Feeder 9 - River Humber Gas Pipeline Replacement Project
Ground Investigation Report 064298/F9/GEO/RPT/101 B
34
possible glacial origin, the gradings and site observations are not supporting the descriptions and
this material is more than likely alluvial in origin and in better agreement with the CPT
interpretation. Also included in the section as a solid blue line is the base of soft / loose deposits
from the boreholes and CPT’s for comparison.
The inferred chalk boundary from the CPT interpretation has also been included as a dotted green
line and is in very good agreement with the directly verified depths from the boreholes. Also
included is the base of destructured chalk as recorded in boreholes (CIRIA9,10 Grade Dc /Dm) with
thicknesses up to 9 m recorded. For ease of reference, a summary of the CIRIA chalk grades is
provided in Table 5.2.2.
Table 5.2.2 Subdivisions of Chalk Grades
Grade Discontinuity Aperture Suffix Discontinuity Spacing
A Discontinuities closed 1
2
3
4
5
t > 600 mm
200 < t < 600 mm
60 < t < 200 mm
20 < t < 60 mm
t < 20 mm
B Typical discontinuity aperture <
3mm
C Typical discontinuity aperture >
3mm
Grade Discontinuity
Aperture
Suffix Engineering
Behaviour
Dominant
Element
Comminuted
Chalk Matrix
Coarser
Fraction
D Structureless or
remoulded
melange
m
c
Fine soil
Coarse soil
Matrix
Clasts
Approx > 35%
Approx < 35%
Approx < 65%
Approx > 65%
It should be noted that there is an anomaly in L03 with grade A5 overlying grade Dc chalk.
However when referring to the specific exploratory log, rotary drilling was initially progressed
from 12.5 m bgl with grade Dc recorded to 13 m bgl improving to A5. However, due to potential
airflush migration issues as discussed in Table 4.7.1, the rotary drilling was terminated and cable
percussion was progressed again from 17.5 m bgl with a Dc grade recorded. The designation is
likely to be incorrect but requires further review on receipt of the expert logging core records11.
However, it is not deemed at this stage to have a significant bearing on the overall design
outcome.
9 CIRIA Construction Industry Research Information Association
10 CIRIA C574 (2002). Engineering in Chalk.
11 Expert chalk core logging is currently being undertaken by Professor Rory Mortimore on selected boreholes. The
findings will be included in a later revision of this report.
Feeder 9 - River Humber Gas Pipeline Replacement Project
Ground Investigation Report 064298/F9/GEO/RPT/101 B
35
Regardless of the uncertainties in the geological profile, referring to the strength profile,
associated SPT N values and the base of soft / loose deposits, it is clear the depth of soft deposits
reduces from 13.7 m bgl to the east of the site to approximately 4 m bgl in the vicinity of the
proposed drive pit. This overlies more competent superficial deposits with the depth of
destructured chalk in the order of 8 m to 9 m below top of chalk.
5.3 Humber Ground Conditions
The ground model for the Humber crossing shows varying thicknesses of superficial deposits with
limited depths of glacial deposits to the western and central portion of the estuary and no alluvial
deposits within the main shipping channel. This overlies Flamborough Chalk and Burnham Chalk.
Made Ground
No made ground was identified across the River Humber in either the historical borehole logs or
the recent ground investigation by Soil Engineering.
Marine and Estuarine Alluvium
Alluvium was identified in 13 out of the 16 Phase 1 boreholes and in 4 of the 6 historical
boreholes reviewed. It typically comprised interbedded sands with silts or clays. Based on the
available data for strata identified as alluvium, a thickness range of 0.4 m to 21.1 m was
established from all exploratory holes. The majority of material encountered was granular in
nature although the alluvium was notably absent from the main shipping channel. Peat was not
identified in either the historical borehole logs or the recent ground investigation.
Glacial Till
Glacial deposits, mainly cohesive, were identified in 11 out of the 16 boreholes drilled by Soil
Engineering and in 4 out of 6 historical boreholes. Outside of the main shipping channel, the
depths of glacial deposits where encountered were less than 4 m with a proven thickness
between 2.0 m and 34. m.
Chalk
Chalk was identified in all 16 Phase 1 boreholes and in all 6 historical boreholes reviewed but the
thickness of chalk was never proven. The more recent boreholes identified the two chalk
formations, but the historical boreholes reviewed lack this detail in the descriptions. Details on
the thickness of the Flamborough and Burnham Chalk formation established from the recent
Phase 1 ground investigation can be found in Table 5.1.1.
General
The long section (See drawing H160/BH/07/01/F9/101) indicates the presence of buried channels
over the western and central portions of the Humber Estuary with a proven thickness of alluvium
ranging between 14.9 m and 21.1 m associated with reduced depths or absence of glacial
deposits. Within the main channel and on the eastern slope, there is a general absence of alluvial
deposits probably associated with strong tidal currents and associated erosion. Referring to the
Central Electricity Governing Board (1968) exploratory holes completed directly north within the
Feeder 9 - River Humber Gas Pipeline Replacement Project
Ground Investigation Report 064298/F9/GEO/RPT/101 B
36
estuary and a greater thickness of alluvium was recorded (10.97 m to 20.12 m) with an absence of
glacial deposits. As part of the Phase 1 Geophysical Survey, implied geological boundaries12 were
also identified over the 1 km wide survey area and thickened areas of alluvial deposits have been
identified although the differences between the intrusive and geophysical interpretations have
been previously highlighted. In general, there does appear to be buried channels running
approximately parallel to the present day main channel and are most likely historical main
channels or tributaries.
The glacial deposits begin to form a more laterally uniform layer to the east of the buried
channels under the large sand bar located roughly in the centre of the Humber. The thickness of
glacial deposits continues to thicken as you progress east, likely due to the dipping underlying
rock head.
Due to the dipping of the chalk, the Burnham Chalk was only identified up to M06. It should also
be noted that in comparison to Goxhill, there is a reduced thickness of destructured chalk in the
order of 5m to 6m.
5.3 Paull Ground Conditions
A reduced scope of Phase 1 exploratory holes were undertaken at Paull (See Section 4.7) although
it is proposed to carry out a Phase 2 ground investigation in the area to further inform the design.
Consequently, there are no exploratory holes between M20 and L16A with the latter located
approximately 150 m from the proposed tunnel route alignment. Similarly, no exploratory holes
have been undertaken at Stoneledge with reliance being placed on L15 and historical boreholes.
Reference to the available information identifies varying thicknesses of superficial deposits
overlying an increased thickness of Flamborough Chalk. The Burnham Chalk was not identified in
available exploratory holes. Varying depths of alluvium were also noted including organic deposits
with an increased thickness at Paull AGI.
Made Ground
Made ground was identified in 10 historical borehole logs and in the third party trial pitting
undertaken at Stoneledge but no made ground was identified during the recent Phase 1 ground
investigation. A thickness ranging from 0.1 m to 1.7 m were noted.
Topsoil
Topsoil was identified in the recent Phase 1 ground investigation and within 1 of the historical
boreholes. The hand dug pits for the Phase 1 CPT’s also provided additional detail on the topsoil
depths. A thickness ranging from 0.15 m to 0.8 m (PA40) was noted based on all exploratory
holes.
12 The survey was correlated against the Central Electricity Generating Board 1968 exploratory holes.
Feeder 9 - River Humber Gas Pipeline Replacement Project
Ground Investigation Report 064298/F9/GEO/RPT/101 B
37
Marine and Estuarine Alluvium
Alluvium was identified in 3 out of the 4 Phase 1 boreholes and in 50 of the 55 historical
boreholes reviewed although the thickness was only proven in 28 exploratory holes. Based on the
available data, a thickness range of >0.76 m to 14.9 m (proven thickness range of 2.55 m to 14.9
m) can be established.
Whilst peat was not identified in the Phase 1 ground investigation, it was noted in 7 of the 55
historical boreholes reviewed around and within the AGI although the peat thickness was only
proven in 3 of these boreholes. Based on the available data, a proven thickness range of 0.1 m to
0.7 m was established although a peat thickness in excess of 2.6 m was noted in historical
borehole PA26 at Paull.
Glacial Till
Glacial Deposits were identified in all 4 Phase 1 boreholes and in 30 of the 55 historical boreholes
reviewed but the thickness of the glacial deposits was only proven in 6 of these boreholes. Based
on the available data, a proven thickness range of 13.4 m to 40.99 m was established.
Chalk
Chalk was identified in all 4 Phase 1 boreholes and in 2 of the 55 historical boreholes reviewed
but the thickness of chalk was never proven and only the Flamborough chalk was encountered
due to the increased depth to the top of the Burnham Chalk Formation. Based on the available
data, chalk was verified to 102 m depth.
General
As discussed at the introduction to this chapter, geological formations have been identified based
on soil description markers from boreholes. However, in boreholes L15 and L18, whilst
descriptions on the logs identify the presence of angular to subrounded gravel of a possible
glacial origin, the gradings and site observations are not supporting the descriptions and
indications are the materials to 7.5 m bgl and 9.4 m bgl respectively are more than likely alluvial
in origin.
A review of the historical boreholes also indicates areas of even deeper alluvium particularly at
Paull AGI with depths reducing as you move further east/south-east from the area to higher
ground. This implies a variable alluvial strata sequence associated with a range of depositional
environments including possible organic rich ponds or tributaries in the areas of peat deposits. As
with Goxhill, the variable and changeable strata over short distances emphasises the importance
of adopting during the design process a structure specific ground model based on information
established from localised exploratory holes.
The glacial deposits are significantly thicker at Paull than at Goxhill partly controlled by the
natural dip of the underlying chalk rock head and less erosion by the River Humber. The deposits
are interlayered granular and cohesive with significant depths of granular deposits noted in L15 in
particular.
Feeder 9 - River Humber Gas Pipeline Replacement Project
Ground Investigation Report 064298/F9/GEO/RPT/101 B
38
Due to the dipping of the chalk, the Burnham Chalk was not identified. In comparison to Goxhill,
there is a reduced thickness of destructured chalk in the order of 5 m.
5.4 Groundwater Conditions
Top Soil
The top soil forms a thin non-continuous layer of varying thickness between 0.05 m to 0.4 m in
boreholes L01 to L08 at Goxhill and up to 0.4 m at Paull. It provides a pathway and minor
contribution to temporary storage of rainfall recharge to the near surface groundwater in the
Paull and Goxhill areas. However, the thickness and general understanding of the soil structure
indicates that it does not have a substantive impact on the groundwater or hydrogeology of the
area. For the purposes of this assessment, the soil is not expected to have a significant effect on
the hydrogeology and rainfall-recharge is not appreciably retarded due to the presence of the top
soil. No further assessment of the top soil has been advanced as part of this study.
Marine and Estuarine Alluvium
The marine and estuarine alluvium was found to be highly variable laterally and vertically. Distinct
layers of soft to firm clays and silts are found both at the Paull and Goxhill sites, with variable
sand and gravel fractions within the clays and silts. Occasional gravelly silty sand or sand and
gravel are found towards the base of the alluvial deposits for example, at L04 at Goxhill. As the
sand and gravel horizons and sub-horizons are expected to be more transmissive than the sub-
units with significant clay and silt content, groundwater movement through the alluvium will be
characteristically through the more granular deposits.
The lateral extent of the sand and gravel dominant horizons and sub-horizons affects the
potential for groundwater movement. Groundwater may move along a laterally continuous sand
or gravel unit, either as a perched groundwater system or interconnected with the main
groundwater surface of the alluvium; whereas a lenticular sub-unit of sand or gravel may not
result in substantial release of groundwater.
There are also occasional peat layers in L04, L05 and L08 and TP01B at Goxhill. However, whilst
peat was not observed in the Phase 1 boreholes or trial pits at Paull or within the marine
boreholes, the historical boreholes at Paull have recorded peat within the AGI. The notable clay
component of the alluvium in the Goxhill and Paull sites affects the potential groundwater
movement, retarding vertical groundwater movement; and limiting substantive lateral
groundwater movement to within thin horizons.
The marine boreholes show a greater fraction of granular material than identified at the Goxhill
or Paull sites comprising sand, silty sand, gravelly silty sand and sandy silt. The larger grain sizes
infer a high permeability and potential for more groundwater within these beds than within the
alluvium at Goxhill and Paull with the higher clay and silt fraction. Therefore, groundwater
movement within the alluvium beneath the Humber has the potential to move more rapidly
through the sand and gravel layers than the silts and clay dominant layers with the added effect
of the River Humber.
Feeder 9 - River Humber Gas Pipeline Replacement Project
Ground Investigation Report 064298/F9/GEO/RPT/101 B
39
Due to the variable grain size of the alluvium deposits, proximity to the Humber Estuary and
drainage channels means, it is likely that groundwater flows and seepages within the coarser
elements of the alluvium may interact with these channels and the tidal estuary with
groundwater emerging within cuttings and excavations. Therefore, monitoring of the
groundwater piezometry and flows will be required throughout construction, with the provision
for additional drainage and dewatering during the construction period.
Glacial Deposits
The glacial deposits are highly variable laterally and vertically. There are distinct layers of clays,
silts, sands and gravels containing a range of grain sizes, described as sand and gravel, sandy
gravelly clay, gravelly clay, clayey gravelly sand and clayey sand, with soft to firm. The glacial
deposits are present from near ground surface to between 8.8 m bgl to 9.8 m bgl in L01, L02 and
L0813 in Goxhill, with minimal alluvial cover. Therefore, to the west of the Goxhill site, the glacial
deposits form the main cover geology to the chalk aquifer but thins considerably from L04
eastwards across the Humber Estuary as far as M11, covered by a substantive thickness of marine
and estuarine alluvium. From M12 eastwards and at the Paull site, the alluvium thins or is absent
and the glacial deposits form a substantive thickness of cover to the chalk aquifer to a thickness
of between 22 m and 34 m in L18, L16, L14 and L15 at the Paull site.
As with the alluvial deposits, the variable grain size of the glacial deposits and network of
drainage channels and watercourses on low lying ground in the Goxhill and Paull areas means
that the groundwater flows and seepages are associated with the coarser elements of the glacial
deposits namely horizons with a significant sand and gravel fraction and with low clay and silt
content.
Chalk
The top of the Flamborough Chalk was noted to be weathered structureless chalk, comprising a
layer of “putty” 14 chalk with clays of variable thickness. There is a transition from the
structureless chalk to highly fractured extremely weak to weak medium to high density chalk with
laminations of grey marl. This leads to the upper layer of chalk underlying the structureless chalk
being highly transmissive extending up to 10 m to 20 m. The putty chalk, the highly fractured
chalk and other weathered characteristics of the top of the Flamborough chalk are associated
with glacial and periglacial processes.
The Flamborough Chalk underlies the study area from Goxhill to Paull and is entirely concealed
beneath Quaternary deposits. It has distinct and identifiable bedding surfaces with frequent marl
bands throughout and generally none or negligible flints. The chalk is characterised by white
chalk, softer than the underlying Burnham Chalk. Groundwater flow is affected and controlled by
its setting, lithostratigraphy and sub-structure. The overlying deposits limit recharge to the
aquifer at the Paull and Goxhill sites. Preferential groundwater movement is associated with
13 It is probable the upper soft deposits are actually alluvial in origin.
14 A term used in relation to destructured, remoulded chalk material.
Feeder 9 - River Humber Gas Pipeline Replacement Project
Ground Investigation Report 064298/F9/GEO/RPT/101 B
40
fissures and fractures, developed through dissolution of structural weaknesses in the chalk.
Groundwater movement also preferentiates flows along bedding plains and either through the
more brittle and fractured marl seams or above such marl layers that form a vertical barrier to
groundwater movement.
The Burnham Chalk is thinly bedded and laminated, with continuous flint bands of varying
thickness from 10 mm to 300 mm. Much of the Burnham Chalk Formation outcrop is concealed
beneath thick Quaternary deposits. The Burnham Chalk underlies the Flamborough Chalk
Formation at the study area, and is characterised by hard, thinly bedded chalks with frequent
tabular flints and discontinuous flint bands (Sumbler, 1999). Gale and Rutter (2006) report that
the basal part of the Burnham Chalk Formation is particularly flinty, with individual flint bands of
up to 0.3 m or more in thickness.
Gale and Rutter (2006) establish from observations from groundwater recessions that the semi-
confined aquifer north of Hull and the semi-confined chalk aquifer west of the buried cliffline
indicate that there is a relatively high degree of connectivity between the drift deposits and the
chalk. This is probably the case in areas where the drift is dominated by glacial sand and gravel
and where boulder clay is thin or absent (Chadha et al., 1997). Hence in the area north of Hull –
such as Dunswell and Cottingham, the drift may be contributing a significant amount of water to
supply boreholes abstracting from the chalk. However, to the east of the buried Ipswichian
coastline, Gale and Rutter (2006) report that the thick cover of impermeable drift deposits
effectively mean that the chalk aquifer is confined. Barker et al. (1984) also assert that clay bands
within the chalk may also act as locally confining layers. The geology of both land sites along the
tunnel route is laterally and vertically changeable making it difficult to model the water flow and
recharge status for the chalk.
Feeder 9 - River Humber Gas Pipeline Replacement Project
Ground Investigation Report 064298/F9/GEO/RPT/101 B
41
6. Ground Conditions and Material Properties
A review has been undertaken of the available geotechnical data up to the 31st October 2014 with
a summary of the findings presented below. It should be noted that laboratory testing and in situ
ground water monitoring are ongoing and additional results will become available subsequent to
the issue of this report. However, this is very much a “live” document and it is proposed to
update and review this report in consideration of National Grid comments and when additional
information becomes available. The overriding aim of this section to present the data to facilitate
the choice of ground models and associated design parameters.
It should be noted that ground levels at Paull and Goxhill are similar and due to the variable bed
levels along the Humber Estuary, results have generally been plotted against elevation although
comparisons were made using depth below ground level (or depth below top of chalk) to ensure
data trends were fully analysed. In general, data has been reported against elevation for ease of
interpretation and design use or depth below top of chalk.
Relevant historical results have also been included using the Paull (PA), overwater Humber (OW)
and Goxhill (GH) designations. Reference should be made to the deskstudy for relevant
exploratory logs.
6.1 Alluvium
6.1.1 General
The material was formed in a marine and estuarine environment and consists of both cohesive
and granular deposits. These are generally described as either loose to medium dense orangish
brown mottled dark grey clayey, silty fine to coarse sand sometimes containing subrounded to
rounded fine to coarse gravel; Very soft to soft brown mottled dark grey slightly sandy clayey silt
or clay with evidence of organic matter. Layers of dark brown to brown pseudo fibrous peat are
also present within this deposit.
6.1.2 Classification
Samples of alluvium were tested in the laboratory for index properties including natural moisture
content (w), liquid limit (wL), plastic limit (wP), particle density (s), bulk density () and particle
size distribution. A summary of classification tests carried out on alluvium can be found in Table
6.1.1
Particle Size Distribution
The results of particle size distribution tests are presented in Figure 6.1.1 divided into the land
(Paull and Goxhill) and overwater (Humber). In addition to the Phase 1 ground investigation,
results from historical ground investigations (as summarised in the deskstudy report) have also
been included. As previously discussed, minimal depths of granular deposits were encountered at
Feeder 9 - River Humber Gas Pipeline Replacement Project
Ground Investigation Report 064298/F9/GEO/RPT/101 B
42
Goxhill and is reflected by the majority of tests, other than two, having in excess of 20 % fines (silt
and clay fraction < 0.063 mm) implying a cohesive material15.
For Paull, mixed granular and cohesive deposits were encountered and are represented by two
distinct grading envelopes with historic test results recording an increased fines fraction
associated with the alluvial deposits at Paull AGI.
For the overwater boreholes, a significant quantity of uniformly graded sands were noted in
comparison to tests undertaken at Paull and Goxhill but also reflects the extent of sands
encountered. The fines fraction varied between 2 % and 82 % in comparison to Paull and Goxhill
where increased quantities up to 100 % were recorded. Some gravels were noted in line with the
results for Paull and Goxhill but once again, there are two distinct grading envelopes. When the
results are reviewed as a whole, 3 distinct grading envelopes are noted covering the full spectrum
from clays to gravels.
Moisture Content and Atterberg Limits
The results from Atterberg Limit and natural moisture content tests are presented in Figure 6.1.2
along with historical data.
Referring to the moisture content w, historic and recent data are in overall agreement although
elevated values are noted for historic data at Paull associated with the alluvial deposits at the
AGI. The results are somewhat variable up to -10 m AOD with elevated values recorded up to 170
% associated within organic materials. There is a discernible trend of an initial moisture content
of around 10 % increasing to approximately 50 % around 0 m AOD then an apparent subsequent
reduction in moisture content with depth in line with a strength gain. This would be in agreement
with an initial stronger surface deposit as noted in the recent ground investigation overlying soft
deposits.
Reference to the plasticity indices (IP) shows values largely above 20 %, approaching a maximum
of 50 % (See Figure 6.1.3) over the upper 3 m (0 m AOD) with isolated elevated values associated
with organic materials. There does appear to be a trend of reducing IP with depth. There is also a
significantly reduced scatter in plastic limit wp values when compared to liquid limit wL results
(Figure 6.1.2).
The liquidity index (IL) is a relationship which allows a comparison of the soils natural moisture content with the plasticity index and is defined as follows:
IL = (w-wP)/(wL-wP)
A positive value indicates the material is “wet” of the plastic limit and conversely a negative value
is “dry” of the plastic limit. A value of 0 and 1.0 indicates a soil at plastic limit or liquid limit
respectively.
15 In the Highways Agency Series 600 Earthworks, the acceptability criteria for a Class 1 granular material is for < 15%
passing the 63um sieve i.e. the silt and clay fraction.
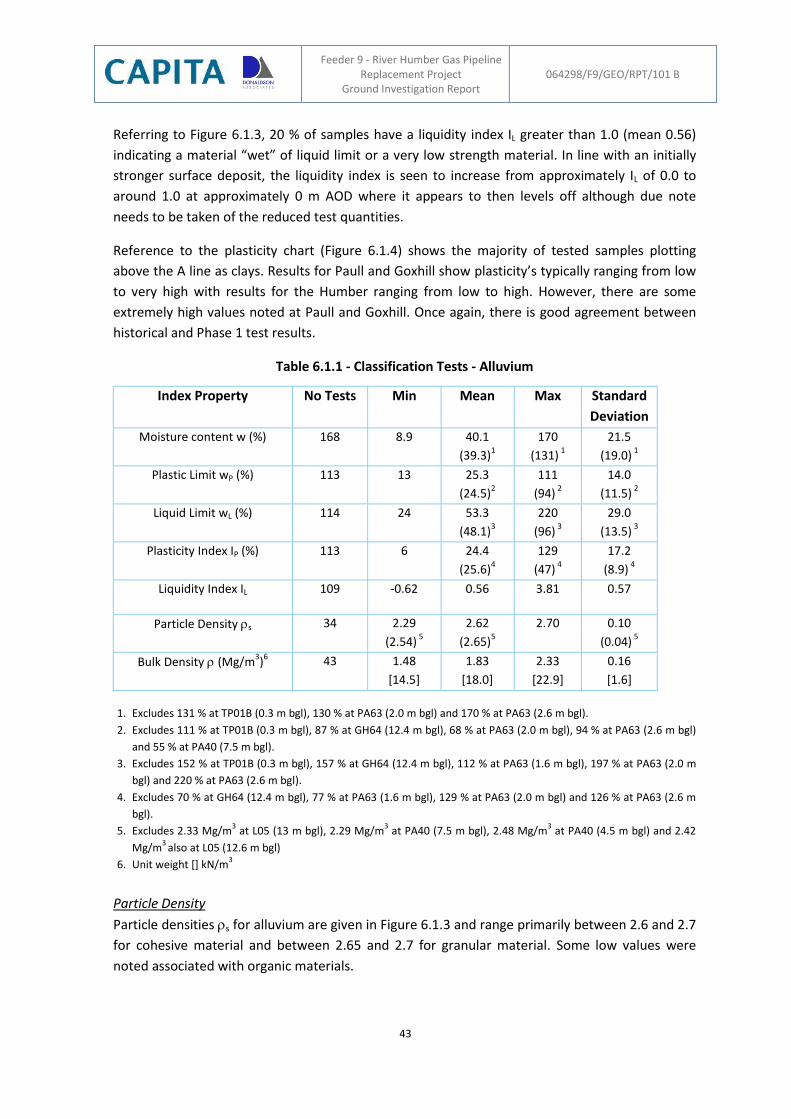
Feeder 9 - River Humber Gas Pipeline Replacement Project
Ground Investigation Report 064298/F9/GEO/RPT/101 B
43
Referring to Figure 6.1.3, 20 % of samples have a liquidity index IL greater than 1.0 (mean 0.56)
indicating a material “wet” of liquid limit or a very low strength material. In line with an initially
stronger surface deposit, the liquidity index is seen to increase from approximately IL of 0.0 to
around 1.0 at approximately 0 m AOD where it appears to then levels off although due note
needs to be taken of the reduced test quantities.
Reference to the plasticity chart (Figure 6.1.4) shows the majority of tested samples plotting
above the A line as clays. Results for Paull and Goxhill show plasticity’s typically ranging from low
to very high with results for the Humber ranging from low to high. However, there are some
extremely high values noted at Paull and Goxhill. Once again, there is good agreement between
historical and Phase 1 test results.
Table 6.1.1 - Classification Tests - Alluvium
Index Property No Tests Min Mean Max Standard
Deviation
Moisture content w (%) 168 8.9 40.1
(39.3)1
170
(131) 1
21.5
(19.0) 1
Plastic Limit wP (%) 113 13 25.3
(24.5)2
111
(94) 2
14.0
(11.5) 2
Liquid Limit wL (%) 114 24 53.3
(48.1)3
220
(96) 3
29.0
(13.5) 3
Plasticity Index IP (%) 113 6 24.4
(25.6)4
129
(47) 4
17.2
(8.9) 4
Liquidity Index IL 109 -0.62 0.56 3.81 0.57
Particle Density s 34 2.29
(2.54) 5
2.62
(2.65)5
2.70 0.10
(0.04) 5
Bulk Density (Mg/m3)
6 43 1.48
[14.5]
1.83
[18.0]
2.33
[22.9]
0.16
[1.6]
1. Excludes 131 % at TP01B (0.3 m bgl), 130 % at PA63 (2.0 m bgl) and 170 % at PA63 (2.6 m bgl).
2. Excludes 111 % at TP01B (0.3 m bgl), 87 % at GH64 (12.4 m bgl), 68 % at PA63 (2.0 m bgl), 94 % at PA63 (2.6 m bgl)
and 55 % at PA40 (7.5 m bgl).
3. Excludes 152 % at TP01B (0.3 m bgl), 157 % at GH64 (12.4 m bgl), 112 % at PA63 (1.6 m bgl), 197 % at PA63 (2.0 m
bgl) and 220 % at PA63 (2.6 m bgl).
4. Excludes 70 % at GH64 (12.4 m bgl), 77 % at PA63 (1.6 m bgl), 129 % at PA63 (2.0 m bgl) and 126 % at PA63 (2.6 m
bgl).
5. Excludes 2.33 Mg/m3 at L05 (13 m bgl), 2.29 Mg/m
3 at PA40 (7.5 m bgl), 2.48 Mg/m
3 at PA40 (4.5 m bgl) and 2.42
Mg/m3
also at L05 (12.6 m bgl)
6. Unit weight [] kN/m3
Particle Density
Particle densities s for alluvium are given in Figure 6.1.3 and range primarily between 2.6 and 2.7
for cohesive material and between 2.65 and 2.7 for granular material. Some low values were
noted associated with organic materials.
Feeder 9 - River Humber Gas Pipeline Replacement Project
Ground Investigation Report 064298/F9/GEO/RPT/101 B
44
Bulk Density
Bulk density () tests were undertaken on 43 cohesive samples (Figure 6.1.3) with values of
ranging between 1.47 Mg/m3 and 2.33 Mg/m3 with the low values associated with organic soils.
There is a significant scatter in the results due to the variable nature of the alluvial deposits and
there does appear to be initially higher values at surface reducing with depth before levelling off.
6.1.3 Strength
Laboratory and in situ testing included tests to measure the strength of the alluvium in the form
of unconsolidated “quick” undrained (UU) triaxial tests and indirectly through standard
penetration tests. A summary of the results is given in Table 6.1.2 below.
Undrained Shear Strength
Referring to Figure 6.1.5, a limited number of UU tests were undertaken due to the lack of intact
samples and what has been carried out, was undertaken on samples obtained through cable
percussive techniques. However, there does appear to be good agreement between historic and
Phase 1 test results with undrained shear strength cu values typically ranging between 5 kPa and
30 kPa or a material of extremely low to low strength in accordance with BS5930 (2010). When
results are viewed as a whole, there does appear to be a slight trend of increasing strength with
depth. There are several high values at shallow depths which would to be in agreement with the
lower moisture contents and liquidity indices at upper elevations. A UU test using 3 no. 38mm
diameter samples at 1.2 m depth from L08 has also been highlighted and demonstrates the
variation that can occur in laboratory results.
Standard Penetration Tests (SPTs)
The results of the in situ SPT test are shown in Figures 6.1.6 and 6.1.7 differentiated on the basis
of cohesive and granular deposits.
Once again, there does appear to be reasonable agreement between historic and Phase 1 results
where available. Due to the reduced scope of site works undertaken at Paull and with the
majority of material encountered being granular in the Phase 1 ground investigation, there are
minimal Phase 1 cohesive results to compare in Figure 6.1.6. Referring to Table 6.1.2, on average,
the SPT N values in the granular materials are 3.5 times greater than the cohesive.
With reference to the cohesive tests, the majority of results are less than 6 which based on a cu/N
ratio of 4.5 (CIRIA 143 (1995) implies an undrained shear strength cu of less than 30 kPa or a
material of low strength at best. This is in agreement with the presence of extensive depths of
soft deposits at the site. Looking at the data as a whole, there does appear to be an increase in
strength with depth but it is not significant.
Referring to Figure 6.1.7 and the granular deposits, a much greater scatter in the results are
notable with N values typically ranging from 1 to 25 or very loose to medium dense16 based on
BS5930 with an indication of an increase in density with depth and associated strength increase.
16 Very Loose N = 0 - 4; Loose N = 4 - 10; Medium Dense N = 10 – 30; Dense N = 30 – 50; From BS5930 1999+A2:2010.
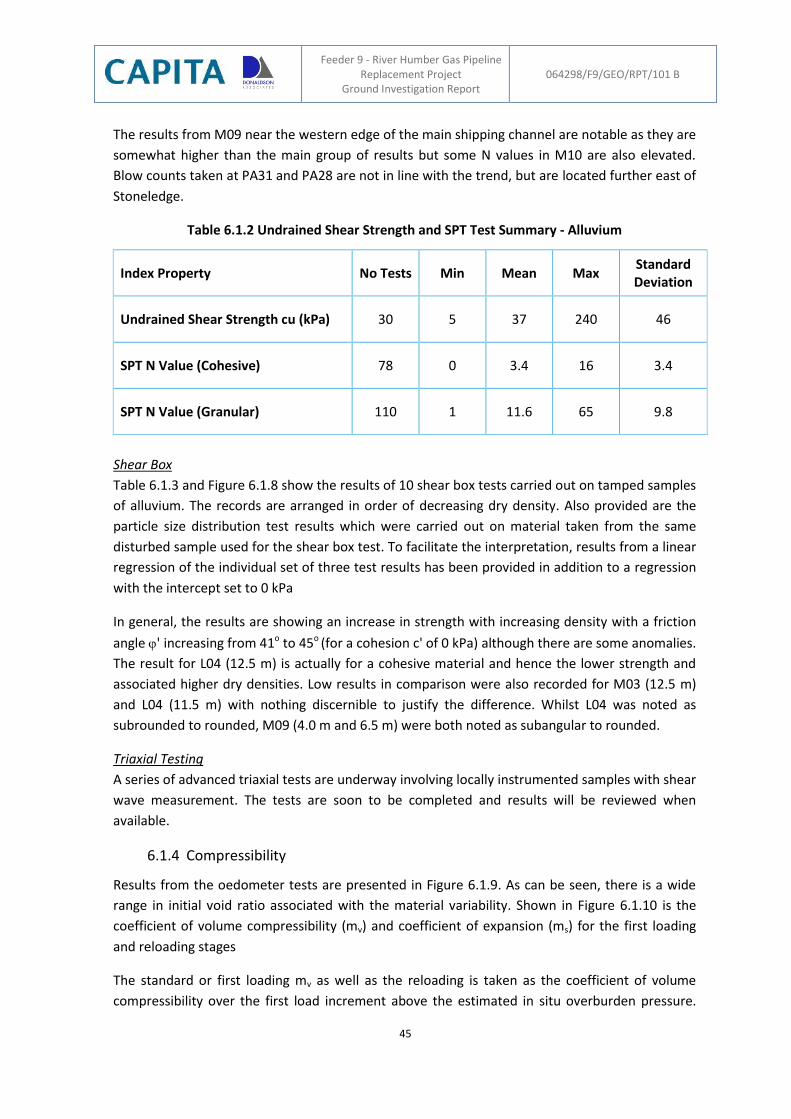
Feeder 9 - River Humber Gas Pipeline Replacement Project
Ground Investigation Report 064298/F9/GEO/RPT/101 B
45
The results from M09 near the western edge of the main shipping channel are notable as they are
somewhat higher than the main group of results but some N values in M10 are also elevated.
Blow counts taken at PA31 and PA28 are not in line with the trend, but are located further east of
Stoneledge.
Table 6.1.2 Undrained Shear Strength and SPT Test Summary - Alluvium
Index Property No Tests Min Mean Max Standard Deviation
Undrained Shear Strength cu (kPa) 30 5 37 240 46
SPT N Value (Cohesive) 78 0 3.4 16 3.4
SPT N Value (Granular) 110 1 11.6 65 9.8
Shear Box
Table 6.1.3 and Figure 6.1.8 show the results of 10 shear box tests carried out on tamped samples
of alluvium. The records are arranged in order of decreasing dry density. Also provided are the
particle size distribution test results which were carried out on material taken from the same
disturbed sample used for the shear box test. To facilitate the interpretation, results from a linear
regression of the individual set of three test results has been provided in addition to a regression
with the intercept set to 0 kPa
In general, the results are showing an increase in strength with increasing density with a friction
angle 'increasing from 41o to 45o (for a cohesion c' of 0 kPa) although there are some anomalies.
The result for L04 (12.5 m) is actually for a cohesive material and hence the lower strength and
associated higher dry densities. Low results in comparison were also recorded for M03 (12.5 m)
and L04 (11.5 m) with nothing discernible to justify the difference. Whilst L04 was noted as
subrounded to rounded, M09 (4.0 m and 6.5 m) were both noted as subangular to rounded.
Triaxial Testing
A series of advanced triaxial tests are underway involving locally instrumented samples with shear
wave measurement. The tests are soon to be completed and results will be reviewed when
available.
6.1.4 Compressibility
Results from the oedometer tests are presented in Figure 6.1.9. As can be seen, there is a wide
range in initial void ratio associated with the material variability. Shown in Figure 6.1.10 is the
coefficient of volume compressibility (mv) and coefficient of expansion (ms) for the first loading
and reloading stages
The standard or first loading mv as well as the reloading is taken as the coefficient of volume
compressibility over the first load increment above the estimated in situ overburden pressure.
Feeder 9 - River Humber Gas Pipeline Replacement Project
Ground Investigation Report 064298/F9/GEO/RPT/101 B
46
Similarly, the expansion ms values are taken as the first load decrement from the estimated in situ
overburden pressures. As to be expected, the reloading compressibility values are lower than the
first loading stage and are considered more representative of the in situ compressibility. In
general the compressibility of the material reduces with increasing depth.
6.1.5 Permeability
Results from permeability testing undertaken in situ and within the laboratory are shown in
Figure 6.1.11. Referring to Table 4.5.3, all rising head tests were carried out in standpipes
whereas the falling head tests were carried out in boreholes during drilling. The laboratory testing
were constant head tests in a permeameter.
For the rising head test, the test zone will have covered several strata but were generally either
clays or peat with measured pearmeability k ranging from 4 x 10⁻⁶ ms-1 to 9.4 x 10⁻⁶ ms-1. The
failing head tests were undertaken in either a gravel or a clay and hence the significant difference
in values (3.7 x 10⁻⁵ ms-1 and 9.4 x 10⁻⁸ ms-1). The constant head tests were undertaken on either
gravels (6.3 x 10⁻⁶ ms-1 and 6.5 x 10⁻⁵ ms-1) or sands (3.5 x 10⁻⁶ ms-1 and 6.0 x 10⁻⁶ ms-1).
What must be taken into consideration when comparing results is the difference between testing
techniques and flow directionality with the measured permeability highly affected by the in situ
anisotropy. Similarly, tests in the constant head permeameter will be based on placed densities
and may not replicate the in situ macrofabric although they do provide a useful indication of
values to be encountered. Further discussions of the results have been provided in Section 6.7.
6.1.6 Cone Penetration Testing
A total of 19 static cone penetration tests were undertaken at Goxhill and 6 at Paull. For Goxhill,
CPT’s 01 to 07 were undertaken around the proposed drive pit (Figure 6.1.12) with the remaining
CPT’s carried out along the tunnel alignment (Figure 6.1.13). The CPT’s at Paull were additional to
the main Phase 1 scope (Figure 6.1.14). It should be noted that Figures 6.1.12 to 6.1.14 include
results from CPT’s in the alluvial and glacial deposits and the following sections discuss the results
as a whole to facilitate comparison.
As previously discussed in Section 5, it is likely the upper 3 m to 4 m of material in CPT01 to CPT13
are alluvial in origin. Referring to Figure 6.1.12, values of cone end resistance qc are initially less
than 1 MPa to around -1m OD before increasing to around 5 MPa at -3 m OD and then dropping
to around 2 MPa at -6m OD before starting to increase again. The corresponding friction ratio Rf,
is showing a greater amount of scatter to -1 m OD with values ranging between 4 % and 11 %
before levelling off around 5 % on average with a slight increase in scatter at around -6 m OD.
The CPT response to -1 m OD is typically associated with organic materials becoming clays as the
qc increases. Based on the CPT response, it is likely alluvial deposits extend to around -1 m OD
with the resulting change being indicative of glacial deposits. This interpretation is more in
agreement with laboratory results and field observations during hand dug pitting. At -6m OD, the
behaviour is more associated with the chalk. In general, there is a noticeable uniformity in the
CPT results.
Feeder 9 - River Humber Gas Pipeline Replacement Project
Ground Investigation Report 064298/F9/GEO/RPT/101 B
47
In Figure 6.1.13, CPT’s from outside the drive pit area have been compared. These correspond to
an increase in alluvial thickness as discussed in Section 5. Once again, what is noticeable is the low
qc values in CPT16, CPT17 and CPT18 corresponding to the greatest depths of alluvial deposits.
Similar low values have been noted for all the tests but to varying levels before increasing to
around 5 MPa as per CPT01 to CPT07. Similar trends are also noticeable with the friction ratio
with initially high values between 4 % and 13 % to 0 m OD before to reducing to values between 1
% and 5 %. Typically, low values of qc associated with low Rf values correspond to sensitive fine
grained materials whereas higher values of Rf correspond to more organic materials. Once again,
the depths of alluvial deposits when compared to nearby boreholes are corresponding to low qc
values.
For Paull, referring to Figure 6.1.13, there is a more marked variation in qc values with the higher
values noted in CPTA01 to CPTA03 corresponding to granular materials. The responses in CPTA04
to CPTA06 are indicative of organic clays to clays. Increased depths of alluvial deposits were
noted around Paull AGI with depths reducing and the material becoming more granular outside
the AGI. This localised variation in geology is visible in the CPT results.
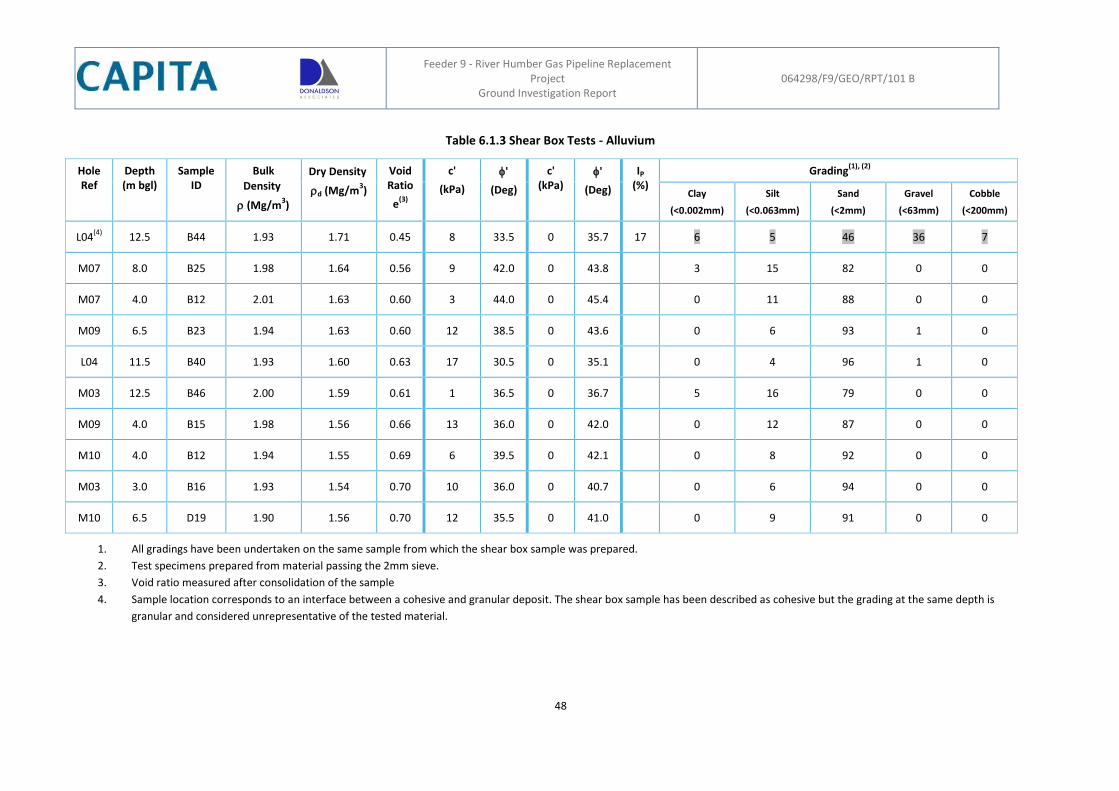
Feeder 9 - River Humber Gas Pipeline Replacement
Project Ground Investigation Report
064298/F9/GEO/RPT/101 B
48
Table 6.1.3 Shear Box Tests - Alluvium
Hole Ref
Depth (m bgl)
Sample ID
Bulk
Density
(Mg/m3)
Dry Density
d (Mg/m3)
Void Ratio
e(3)
c'
(kPa)
'
(Deg)
c' (kPa)
'
(Deg)
IP (%)
Grading(1), (2)
Clay
(<0.002mm)
Silt
(<0.063mm)
Sand
(<2mm)
Gravel
(<63mm)
Cobble
(<200mm)
L04(4)
12.5 B44 1.93 1.71 0.45 8 33.5 0 35.7 17 6 5 46 36 7
M07 8.0 B25 1.98 1.64 0.56 9 42.0 0 43.8
3 15 82 0 0
M07 4.0 B12 2.01 1.63 0.60 3 44.0 0 45.4
0 11 88 0 0
M09 6.5 B23 1.94 1.63 0.60 12 38.5 0 43.6
0 6 93 1 0
L04 11.5 B40 1.93 1.60 0.63 17 30.5 0 35.1
0 4 96 1 0
M03 12.5 B46 2.00 1.59 0.61 1 36.5 0 36.7
5 16 79 0 0
M09 4.0 B15 1.98 1.56 0.66 13 36.0 0 42.0
0 12 87 0 0
M10 4.0 B12 1.94 1.55 0.69 6 39.5 0 42.1
0 8 92 0 0
M03 3.0 B16 1.93 1.54 0.70 10 36.0 0 40.7
0 6 94 0 0
M10 6.5 D19 1.90 1.56 0.70 12 35.5 0 41.0
0 9 91 0 0
1. All gradings have been undertaken on the same sample from which the shear box sample was prepared.
2. Test specimens prepared from material passing the 2mm sieve.
3. Void ratio measured after consolidation of the sample
4. Sample location corresponds to an interface between a cohesive and granular deposit. The shear box sample has been described as cohesive but the grading at the same depth is
granular and considered unrepresentative of the tested material.
Feeder 9 - River Humber Gas Pipeline Replacement Project
Ground Investigation Report 064298/F9/GEO/RPT/101 B
49
6.2 Glacial Deposits
6.2.1 General
The glacial deposits consist of interbedded layers of cohesive and granular deposits. The cohesive
deposits are described as firm to very stiff, brownish grey, slightly sandy, slightly gravelly silty clay.
Sand is fine to coarse. Gravel is angular to subrounded fine to coarse chalk and mixed lithologies. The
granular deposits are typically described as dense to very dense, brown, slightly clayey, slightly
gravelly, fine to coarse sand. Gravel is fine to coarse angular to subrounded chalk and mixed
lithologies. Occasionally dense to very dense brown slightly clayey slightly sandy fine to coarse gravel
of angular to subrounded chalk and mixed lithologies. Sand is fine to coarse.
6.2.2 Classification
Samples of glacial deposits were tested in the laboratory for index properties including natural
moisture content (w), liquid limit (wL), plastic limit (wP), particle density (s), bulk density () and
particle size distribution. A summary of classification tests carried out on alluvium can be found in
Table 6.2.1
Particle size distribution The results of particle size distributions curves are presented in Figure 6.2.1. For Goxhill, the majority
of samples tested were cohesive containing between 18 % and 96 % clay and silt although some
gradings show high fractions of sands and gravels. When compared to tests undertaken in the
overwater boreholes and at Paull, there is a very similar envelope of results. However, a second
envelope ranging from uniformly graded sands to gravels is visible at Paull and the Humber. When
the results are reviewed as a whole, 2 distinct grading envelopes are noted covering the full spectrum
from clays to gravels.
Moisture Content and Atterberg Limits
The results from Atterberg Limit and natural moisture content tests are presented in Figure 6.2.2
along with historical data.
Referring to the moisture content w, historic and recent data are in overall agreement. The results
are somewhat variable to -5 m AOD with elevated values recorded up to 240 % associated with
organic materials. Below this elevation, the moisture content is reasonably consistent ranging
between 10 % and 30 %.
Reference to the plasticity indices (IP) shows values largely below 20 % although there is a reasonable
variation in results down to -5 m AOD with some elevated values up to 155 % recorded (Figure 6.2.3).
There does appear to be a trend of reducing IP with depth. There is also a significantly reduced
scatter in plastic limit wp values when compared to liquid limit wL results (Figure 6.2.2).
The majority of samples have liquidity indices IL less than 0.6 (mean 0.26) although there are some
tests, particularly at shallower depths closer to 1.0.
Reference to the plasticity chart (Figure 6.2.4) shows the majority of tested samples plotting above
the A line as clays with plasticity’s typically ranging from low to high. However, there are some
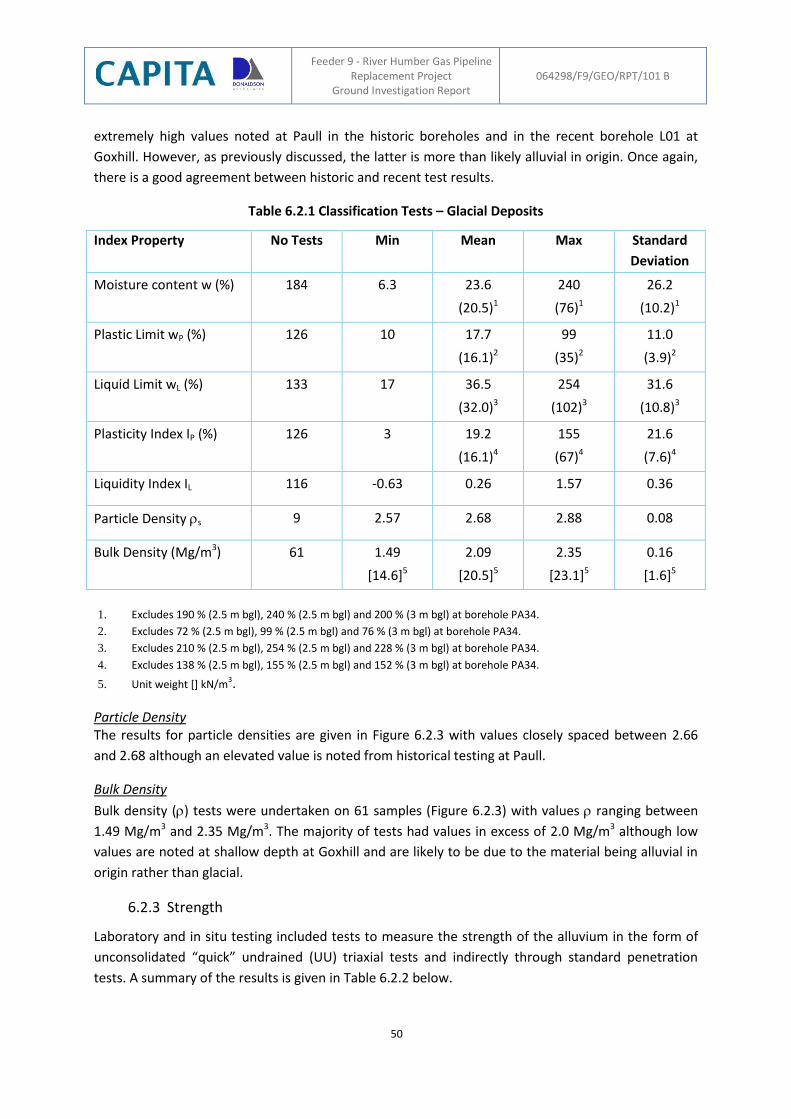
Feeder 9 - River Humber Gas Pipeline Replacement Project
Ground Investigation Report 064298/F9/GEO/RPT/101 B
50
extremely high values noted at Paull in the historic boreholes and in the recent borehole L01 at
Goxhill. However, as previously discussed, the latter is more than likely alluvial in origin. Once again,
there is a good agreement between historic and recent test results.
Table 6.2.1 Classification Tests – Glacial Deposits
Index Property No Tests Min Mean Max Standard
Deviation
Moisture content w (%) 184 6.3 23.6
(20.5)1
240
(76)1
26.2
(10.2)1
Plastic Limit wP (%) 126 10 17.7
(16.1)2
99
(35)2
11.0
(3.9)2
Liquid Limit wL (%) 133 17 36.5
(32.0)3
254
(102)3
31.6
(10.8)3
Plasticity Index IP (%) 126 3 19.2
(16.1)4
155
(67)4
21.6
(7.6)4
Liquidity Index IL 116 -0.63 0.26 1.57 0.36
Particle Density s 9 2.57 2.68 2.88 0.08
Bulk Density (Mg/m3) 61 1.49
[14.6]5
2.09
[20.5]5
2.35
[23.1]5
0.16
[1.6]5
1. Excludes 190 % (2.5 m bgl), 240 % (2.5 m bgl) and 200 % (3 m bgl) at borehole PA34.
2. Excludes 72 % (2.5 m bgl), 99 % (2.5 m bgl) and 76 % (3 m bgl) at borehole PA34.
3. Excludes 210 % (2.5 m bgl), 254 % (2.5 m bgl) and 228 % (3 m bgl) at borehole PA34.
4. Excludes 138 % (2.5 m bgl), 155 % (2.5 m bgl) and 152 % (3 m bgl) at borehole PA34.
5. Unit weight [] kN/m3.
Particle Density The results for particle densities are given in Figure 6.2.3 with values closely spaced between 2.66
and 2.68 although an elevated value is noted from historical testing at Paull.
Bulk Density
Bulk density () tests were undertaken on 61 samples (Figure 6.2.3) with values ranging between
1.49 Mg/m3 and 2.35 Mg/m3. The majority of tests had values in excess of 2.0 Mg/m3 although low
values are noted at shallow depth at Goxhill and are likely to be due to the material being alluvial in
origin rather than glacial.
6.2.3 Strength
Laboratory and in situ testing included tests to measure the strength of the alluvium in the form of
unconsolidated “quick” undrained (UU) triaxial tests and indirectly through standard penetration
tests. A summary of the results is given in Table 6.2.2 below.
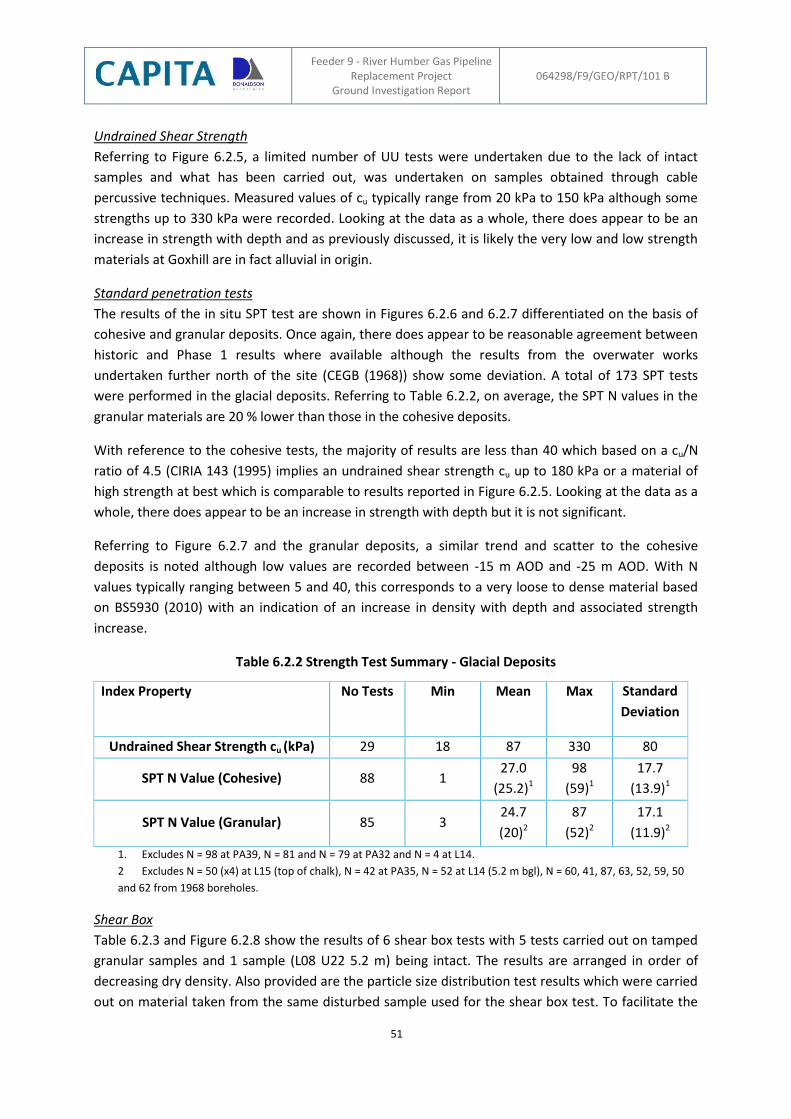
Feeder 9 - River Humber Gas Pipeline Replacement Project
Ground Investigation Report 064298/F9/GEO/RPT/101 B
51
Undrained Shear Strength
Referring to Figure 6.2.5, a limited number of UU tests were undertaken due to the lack of intact
samples and what has been carried out, was undertaken on samples obtained through cable
percussive techniques. Measured values of cu typically range from 20 kPa to 150 kPa although some
strengths up to 330 kPa were recorded. Looking at the data as a whole, there does appear to be an
increase in strength with depth and as previously discussed, it is likely the very low and low strength
materials at Goxhill are in fact alluvial in origin.
Standard penetration tests
The results of the in situ SPT test are shown in Figures 6.2.6 and 6.2.7 differentiated on the basis of
cohesive and granular deposits. Once again, there does appear to be reasonable agreement between
historic and Phase 1 results where available although the results from the overwater works
undertaken further north of the site (CEGB (1968)) show some deviation. A total of 173 SPT tests
were performed in the glacial deposits. Referring to Table 6.2.2, on average, the SPT N values in the
granular materials are 20 % lower than those in the cohesive deposits.
With reference to the cohesive tests, the majority of results are less than 40 which based on a cu/N
ratio of 4.5 (CIRIA 143 (1995) implies an undrained shear strength cu up to 180 kPa or a material of
high strength at best which is comparable to results reported in Figure 6.2.5. Looking at the data as a
whole, there does appear to be an increase in strength with depth but it is not significant.
Referring to Figure 6.2.7 and the granular deposits, a similar trend and scatter to the cohesive
deposits is noted although low values are recorded between -15 m AOD and -25 m AOD. With N
values typically ranging between 5 and 40, this corresponds to a very loose to dense material based
on BS5930 (2010) with an indication of an increase in density with depth and associated strength
increase.
Table 6.2.2 Strength Test Summary - Glacial Deposits
Index Property No Tests Min Mean Max Standard
Deviation
Undrained Shear Strength cu (kPa) 29 18 87 330 80
SPT N Value (Cohesive) 88 1 27.0
(25.2)1
98
(59)1
17.7
(13.9)1
SPT N Value (Granular) 85 3 24.7
(20)2
87
(52)2
17.1
(11.9)2
1. Excludes N = 98 at PA39, N = 81 and N = 79 at PA32 and N = 4 at L14.
2 Excludes N = 50 (x4) at L15 (top of chalk), N = 42 at PA35, N = 52 at L14 (5.2 m bgl), N = 60, 41, 87, 63, 52, 59, 50
and 62 from 1968 boreholes.
Shear Box
Table 6.2.3 and Figure 6.2.8 show the results of 6 shear box tests with 5 tests carried out on tamped
granular samples and 1 sample (L08 U22 5.2 m) being intact. The results are arranged in order of
decreasing dry density. Also provided are the particle size distribution test results which were carried
out on material taken from the same disturbed sample used for the shear box test. To facilitate the
Feeder 9 - River Humber Gas Pipeline Replacement Project
Ground Investigation Report 064298/F9/GEO/RPT/101 B
52
interpretation, results from a linear regression of the individual set of three test results has been
provided in addition to a regression with the intercept set to 0 kPa.
In general, the results are showing a nominal increase in strength with increasing density with a
friction angle 'increasing from 34o to 36o (for a cohesion c' of 0 kPa). However, the fines fraction
and variation in results due to the test procedure could readily account for the slight differences
recorded. The intact sample (L08) has recorded an elevated value in comparison but is from a very
stiff gravelly clay gravelly clay and the friction angles ' of 35.5o is not too dissimilar to values
reported in CIRIA C504 (1999).
Triaxial Testing
A series of advanced triaxial tests are underway involving locally instrumented samples with shear
wave measurement. The tests are soon to be completed and results will be reviewed when available.
Figure 6.2.9 shows the stress path of 4 multistage consolidated undrained triaxial tests carried out on
glacial samples obtained from L01, L02 and L14. The two tests at Goxhill recorded shear strengths c'
10 kPa, ' 33o and c' 32 kPa, ' 22o respectively while the two tests at Paull recorded shear strengths
c' 15 kPa, ' 22o and c' 32 kPa, ' 22o respectively. A detailed analysis will be undertaken of the test
results on completion of the scheduled triaxial testing.
6.2.4 Consolidation and Compressibility
Results from the oedometer tests are presented in Figure 6.2.10. As can be seen, there is a wide
range in initial void ratio associated with the material variability. Shown in Figure 6.2.11 is the
coefficient of volume compressibility (mv) and coefficient of expansion (ms) for the first loading and
reloading stages. As to be expected, the reloading compressibility values are lower than the first
loading stage and are considered more representative of the insitu compressibility. In general the
compressibility of the material reduces with increasing depth with the compressibility ranging from
0.08 m2/MN and 0.65 m2/MN.
6.2.5 Permeability
Results from permeability testing undertaken in situ and within the laboratory are shown in Figure
6.1.12. Referring to Table 4.5.3, all falling head tests were carried out in boreholes and all rising head
tests in standpipes other than the test in L14 at 22.14 m bgl which was a rising head tests carried out
in the borehole during drilling operations. Detailed discussions of the results have been provided in
Section 6.7.
6.2.6 Cone Penetration Testing
A total of 19 static cone penetration tests were undertaken at Goxhill and 6 at Paull. For Goxhil, CPT’s
01 to 07 were undertaken around the proposed drive pit (Figure 6.1.12) with the remaining CPT’s
carried out along the tunnel alignment (Figure 6.1.13). The CPT’s at Paull were additional to the main
Phase 1 scope (Figure 6.1.14). Reference should be made to Section 6.1.6 where the results have
been discussed in further detail.
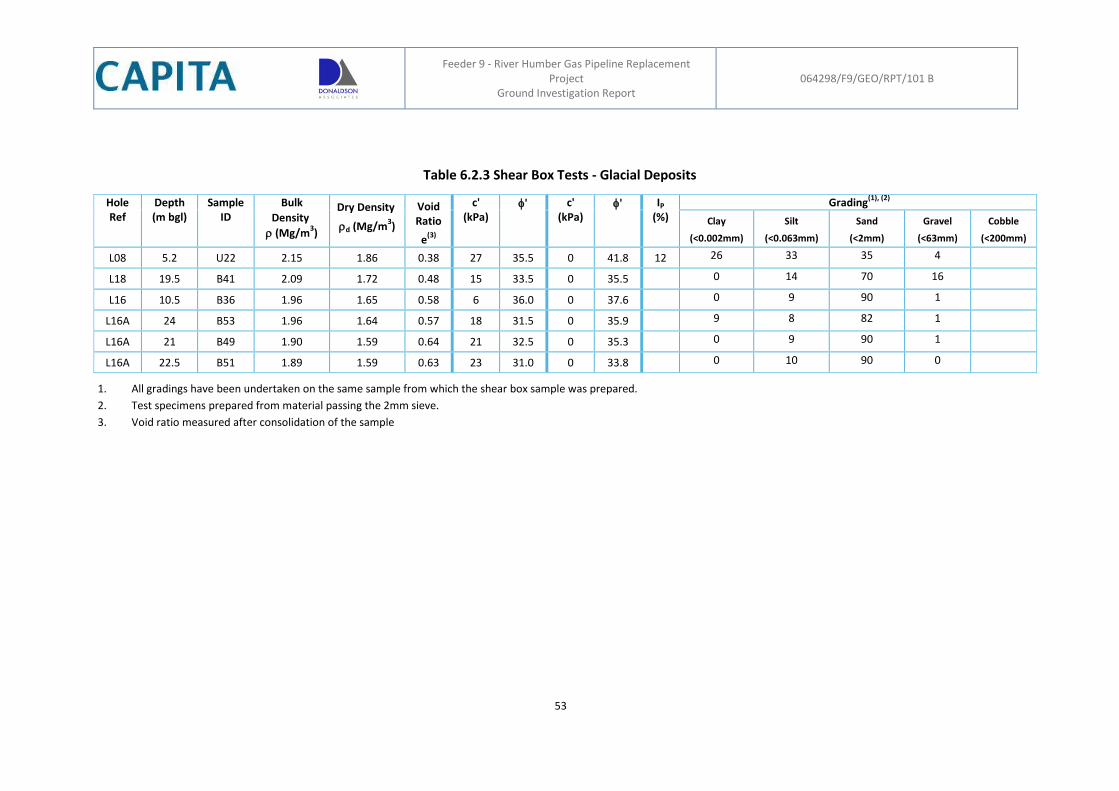
Feeder 9 - River Humber Gas Pipeline Replacement
Project Ground Investigation Report
064298/F9/GEO/RPT/101 B
53
Table 6.2.3 Shear Box Tests - Glacial Deposits
Hole Ref
Depth (m bgl)
Sample ID
Bulk
Density
(Mg/m3)
Dry Density
d (Mg/m3)
Void Ratio
e(3)
c' (kPa)
' c' (kPa)
' IP (%)
Grading(1), (2)
Clay
(<0.002mm)
Silt
(<0.063mm)
Sand
(<2mm)
Gravel
(<63mm)
Cobble
(<200mm)
L08
5.2 U22 2.15 1.86 0.38 27 35.5 0 41.8 12 26 33 35 4
L18 19.5 B41 2.09 1.72 0.48 15 33.5 0 35.5
0 14 70 16
L16 10.5 B36 1.96 1.65 0.58 6 36.0 0 37.6
0 9 90 1
L16A 24 B53 1.96 1.64 0.57 18 31.5 0 35.9
9 8 82 1
L16A 21 B49 1.90 1.59 0.64 21 32.5 0 35.3
0 9 90 1
L16A 22.5 B51 1.89 1.59 0.63 23 31.0 0 33.8
0 10 90 0
1. All gradings have been undertaken on the same sample from which the shear box sample was prepared.
2. Test specimens prepared from material passing the 2mm sieve.
3. Void ratio measured after consolidation of the sample
Feeder 9 - River Humber Gas Pipeline Replacement Project
Ground Investigation Report 064298/F9/GEO/RPT/101 B
54
6.3 Flamborough Chalk
6.3.1 General
The Flamborough Chalk is described as very weak (locally extremely weak) to weak medium to high
density white chalk with extremely closely to closely spaced laminations of grey marl. Fractures are
extremely closely to medium spaced. The chalk is described as being locally stained orange and
comprising occasional black sponges, cream shell fragments and trace fossils. It was observed to be
generally free of flint.
6.3.2 Index Properties
Dry Density
Several authors have shown (CIRIA C574 (2002)) that the most easily measured property of chalk
indicative of its mass behaviour is the dry density d of intact blocks. Although a range of index tests
exist for intact chalk, CIRIA C574 goes on to suggest that dry density should be the index normally
reported.
Table 3.2 of CIRIA C574 notes the following divisions for dry density;
Low density < 1.55 Mg/m3
Medium density 1.55 to 1.70 Mg/m3
High density 1.70 to 1.95 Mg/m3
Very high density > 1.95 Mg/m3
Test results have been plotted against elevation and are presented as Figure 6.3.1
For the Flamborough Chalk, it can be seen that results are broadly between 1.75 Mg/m3 and 2.00
Mg/m3 with a mean value of 1.87 Mg/m3. This is indicative of a high to very high dry density chalk
with the mean value signifying high density.
The high density values recorded here are typical for the northern chalks of Yorkshire and
Lincolnshire. Clayton (1983) notes; While the chalk of Yorkshire and Lincolnshire is known to have a
uniformly higher density, chalks in southern England are much more variable.
Figures 12 and 13 in Clayton go on to quantify this with measured values provided. It is notable, that
although the values recorded here suggest high to very high density, the mean value for the
Flamborough Chalk is towards the lower range of values presented in the histogram for Yorkshire and
Lincolnshire (Figure 13 of Clayton). Figure 12 of Clayton’s paper presents measured values for
northern chalk in the form of values overlain on a map of eastern England. There are three values
provided around the Humber with a mean value of 2.09 Mg/m3. Around 50 km east-north-east of the
site, the chalk outcrops at Flamborough Head. The mean value from five values given here is 2.24
Mg/m3. Conversely, values reported for Cambridgeshire and Suffolk are around 1.50 Mg/m3.
Feeder 9 - River Humber Gas Pipeline Replacement Project
Ground Investigation Report 064298/F9/GEO/RPT/101 B
55
Bulk density
Results from bulk densities are presented in Figure 6.3.2. Measured values from 273 tests broadly
range from 2.05 Mg/m3 to 2.25 Mg/m3 with a mean value of 2.16 Mg/m3. Although a few tests lie
outside the main body of results, the majority of tests lie within a fairly narrow range with no
discernible trend with elevation.
Saturated Moisture Content
Results for saturated moisture content (SMC) for Flamborough Chalk are presented as Figure 6.3.3.
The SMC is the percentage of water required to fill all voids and is directly related to dry density and
porosity and is derived from the intact dry density. Values from 112 tests typically range between 13
% and 20 %, mean 16.1 %, although one test in L14 was recorded at 32 % at -42.5 m AOD.
CIRIA C574 notes that there can be a large variation in SMC (and porosity) in chalk. This variability is
due to a variation of deposition and diagenesis followed by alteration and weathering. Figure 4.1 of
CIRIA C574 depicts a histogram from a survey of English chalk with a wide range of values between 4
and 40 %.
The results recorded here are in fairly narrow range when compared to variation reported in the
CIRIA Report.
Natural Moisture Content and Atterberg Limits
Figure 6.3.4 presents the natural moisture content w, plastic limit wp, liquid limit wL, plasticity index
Ip, and liquidity index IL. Figure 6.3.5 depicts the A-Line plot for Flamborough Chalk.
Natural moisture content has been recorded as generally between 12 % and 22 %. There is a trend of
slightly higher values recorded in material recovered from higher elevations. However, caution
should be exercised when considering natural moisture values. It is noted in CIRIA C574 that
determination of the in situ water content is difficult owing to the rapid rate of evaporation that
occurs once the material is exposed. Notwithstanding this, the results reported above for SMC are
broadly in the same range as natural moisture content. On this basis, the recorded natural moisture
content values can be considered as appropriate for use.
Atterberg Limits testing has been undertaken on samples of the chalk that have been crushed. It can
be seen from Figures 6.3.4 and 6.3.5 that the plasticity index (IP) is generally low with values from the
majority of tests less than 10 %. Typically, the liquid limit (wL) is between 20 % and 30 %. Test results
indicate all material tested can be classified as clay or a silt of low plasticity (CL or ML respectively).
CIRIA C574 notes; while the Cenomanian contains sufficient clay to alter its plasticity the great
majority of chalk can be considered (with the exception of the flint) as almost pure calcium carbonate.
This “white chalk” has a very limited range of plasticity compared with that of the whole deposit. The
report goes on to note typical values for this “white chalk” of between 4 % and 9 % for plasticity
index and between 18 % and 32 % for liquid limit.
It can be concluded that results recorded are typically low plasticity and correlate with the “white
chalk” values quoted in CIRIA C574. However it should be noted that numerous thin to thick
Feeder 9 - River Humber Gas Pipeline Replacement Project
Ground Investigation Report 064298/F9/GEO/RPT/101 B
56
laminations of marl have been recorded in the Flamborough Chalk which will typically exhibit higher
plasticity than those recorded here.
Slake Durability
Slake durability testing comprises rotating ‘rock’ within a wire drum in water. The weight retained
after a fixed time period is recorded and expressed as a percentage compared with the original value.
This value is known as the slake durability index.
The tests carried out here are dual cycle tests. A test is undertaken for a period of time (ten minutes)
and the durability index determined. This is then repeated and the durability index determined for
this second cycle.
The tests provide a useful index of material degradability, reflecting the behaviour of a ‘rock’ when
wet at a tunnel face. Attewell (1995) notes that such tests should be regarded as essential for
mudrocks, limestones, chalk, and dolomites in order to quantify possible slaking problems in the
tunnel.
The test results have been summarised in Figure 6.3.6 in terms of material retained after first cycle
and second cycle. It can be seen in this plot that for 52 tests, the first cycle lies between 95 and 99 %.
The second cycle lies between 92 % and 98 %. The difference between first and second cycles ranges
between 0 % and 3.6 %.
These results suggest that the material tested is durable. Attewell notes that slaking can be
problematic where values are less than 85 %. However it should be noted that intact chalk pieces
have been tested here rather than softer marl and that results need to be reviewed in the context of
local geology and hydrology.
Results have been compared with Figure 11.16 as presented by Harris et al (1996). This figure
presents data from slake durability tests undertaken in chalk for the Channel Tunnel. These are noted
as having relatively high slake durability with first cycle tests typically between 90 %and 98 % and
second cycle typically between 81 % and 92 %. Harris et al notes that this suggests that the calcium
carbonate present in the samples is acting as an effective cementing agent and suppressing
breakdown and swelling. The results achieved in Flamborough Chalk at the Feeder 9 site suggest that
the chalk here is more durable than that described by Harris et al.
Cerchar Abrasivity Test
The Cerchar Abrasivity Test is based on a steel pin with defined geometry and hardness that
scratches the surface of a rough rock sample over a distance of 10 mm under a static load of 70 N.
The Cerchar Abrasivity Index (CAI) is calculated from the measured diameter of the resulting wear on
the pin.
Tests have been undertaken on chalk and flint where present and sampled. Table 6.3.1 (after Kasling
and Thuro, 2010) notes the following classification;
Feeder 9 - River Humber Gas Pipeline Replacement Project
Ground Investigation Report 064298/F9/GEO/RPT/101 B
57
Table 6.3.1 Classification of CAI
CAI Abrasivity Classification Examples
0.0 to 0.3 Not abrasive Organic material
0.3 to 0.5 Not very abrasive Mudstone, marl
0.5 to 1.0 Slightly abrasive Slate, limestone
1.0 to 2.0 Medium abrasive Schist, sandstone
2.0 t0 4.0 Very abrasive Basalt, quartzitic sandstone
4.0 to 6.0 Extremely abrasive Amphibolite, quartzite
Results to date are presented in Figure 6.3.7. It can be seen that the values are generally zero with a
few tests having nominal values, the maximum being 0.19. Results suggest the chalk is not abrasive.
Flint is generally not present in the Flamborough Chalk and no flint samples have been tested.
6.3.3 Intact Properties
Unconfined Compressive Strength and Point Load Tests Unconfined compressive strength (UCS) and point load tests (PLT) have been carried out on intact
chalk samples. It is notable that when compared to the amount of rotary coring undertaken, a
relatively small proportion of the core recovered was suitable for UCS testing.
UCS testing is universally used in rock mechanics to ascertain the unconfined compressive strength of
the material being tested. However, it is notable for chalk, that CIRIA C574 states the test should be
strictly regarded as an index test. The point load test was originally developed as an index test to
predict the UCS when recovered core was too broken for conventional UCS testing.
To obtain an equivalent UCS value from point load testing a correlation factor, K, must be applied
where K = UCS / (PLT index Is(50)). Is(50) is the point load index normalized to equivalent 50 mm
diameter samples.
Figure 6.3.8 presents correlated Is(50) values for UCS and measured UCS tests against elevation. Figure
6.3.9 presents the same data against depth below top of chalk.
In order to ascertain a suitable correlation between Is(50) and UCS, the measured UCS values have
been compared against the closest point load tests. Disregarding spurious results, the resultant mean
value of K is 21.6.
Reference to Figure 4 in Bowden et al (1998) suggests a value of K = 17 for a UCS of 7 MPa and K = 20
for UCS of 10 MPa. Albeit the figure relates to southern chalks. On the basis of the test results and
Bowden et al a K value of 18 is considered reasonable for Flamborough Chalk.
It can be seen that there is significant scatter in the results, especially with regard to the point load
tests with the measured UCS values showing less variability. However, there is no discernible increase
in strength with elevation or depth below top of chalk. A mean value of 7.1 MPa is recorded from 9
UCS tests. When correlated point load tests are considered, the mean value is 9.8 MPa. Results
generally indicate chalk to be very weak to weak.
Feeder 9 - River Humber Gas Pipeline Replacement Project
Ground Investigation Report 064298/F9/GEO/RPT/101 B
58
It is notable that Figure 4.17 in CIRIA C574 depicts a plot of UCS versus density based on information
presented by Matthews and Clayton (1993). When the mean value for UCS is compared with mean
value for dry density as presented above, 1.87 Mg/m3, it can be seen that results here are close to
the ‘design line’ for saturated chalk.
Brazilian Tensile Testing
Results from 13 Brazilian Tensile tests undertaken on samples recovered from Flamborough Chalk are
presented in Figure 6.3.10. Measured values lie between approximately 0.6 and 1.0 MPa, with a
mean value 0.89 MPa recorded. Based on a mean value of 9.8 MPa for UCS, the resulting ratio
between compressive and tensile strength is 11.0.
Effective Strength Tests are ongoing and results will be reviewed when available.
Modulus of Elasticity (from UCS and Triaxial)
At time of writing, triaxial tests are ongoing and results will be reviewed when available. However,
the Modulus of Elasticity (E) has been directly measured on 8 UCS locally instrumented samples. Full
results have not been received for all tests with 3 tests received as Eave in tabular format only. As a
consequence, results have been summarised in Figure 6.3.11 and 6.3.12 as Eave versus elevation and
depth below top of chalk. Secant and tangential moduli are not considered at this time. As can be
seen, there is no discernible trend in Eave value with elevation or depth below top of chalk. Values
range between 6.97 GPa and 19.90 GPa with a mean value of 10.86 GPa.
Poisson’s Ratio (measured in UCS)
The Poisson’s Ratio was also measured on the 8 locally instrumented samples described above.
Results against elevation are presented in Figure 6.3.13 with values ranging between 0.185 and
0.399, with a mean value of 0.3 recorded.
Permeability Results from the triaxial permeability have not been received at time of writing.
6.3.4 Mass Properties
Rock Quality
Structureless / Grade Dc Chalk
Static cone penetration tests (CPTs) at Goxhill will have encountered structureless / Grade Dc chalk
below the glacial and alluvial deposits. However, due to the nature of static cone testing it is not
possible to distinguish which parts of the test were within the Flamborough Chalk and which were
completed in the Burnham Chalk. However, when comparing with the thickness of the Flamborough
Chalk encountered in the nearest exploratory holes, it is likely a significant amount of chalk
encountered by the CPTs is Flamborough Chalk.
A total of 13 CPTs penetrated at least 1m into the chalk layer. In Figures 6.3.14 and 6.3.15, cone end
resistance (qc) and friction ratio (Rf) recorded in chalk in all CPTs are plotted into two individual
graphs, qc and Rf against depth from top of chalk.
Feeder 9 - River Humber Gas Pipeline Replacement Project
Ground Investigation Report 064298/F9/GEO/RPT/101 B
59
The typical qc value of the chalk is 5 MPa to 35 MPa, increasing to 10 MPa to 35 MPa when the chalk
becomes more competent / less weathered at 2m below top of chalk. The typical friction ratio of the
chalk is 0 % to 2 %, with the exception of first 1.5 m of the chalk where the friction ratio is slightly
higher, up to 6 to 8 % in places.
Within the cable percussive boreholes standard penetration tests were completed in the
structureless / Grade Dc chalk. Referring to Figure 6.3.16, SPT’s of between 30 and 50 / Refusal are
typically encountered within the structureless / Grade Dc Flamborough Chalk. However, CIRIA C574
warns against the correlation of SPT values with chalk weathering grade although it can be noted that
SPTs were generally not completed below 6m penetration into the Flamborough chalk.
Grade A Chalk
The quality of the chalk rock encountered was recorded through the Rock Quality Designation (RQD)
logging of the chalk cores. Total Core Recovery (TCR) and Solid Core Recovery (SCR) are not always
related to rock quality and are not discussed further.
RQD can be generally correlated to the common tunnelling classification as follows (after Deere et al,
1970):
Excellent 90 – 100 %
Good 75 – 90 %
Fair 50 – 75 %
Poor 25 – 50 %
Very Poor 0 – 25 %
A plot of all RQD data for the chalk (Flamborough and Burnham) has been presented in Figure 6.3.17.
This shows that for the initial 5 m of rock core the RQD was typically Very Poor and that an RQD of
Good or Excellent was not typically achieved until at least 10m penetration into chalk. It was not
until typically 20 m to 25 m penetration into the chalk that Very Poor rock was generally not
encountered.
Comparison of the RQD as logged from the recovered core was compared against the “theoretical”
RQD from fractures that were logged within the optical and acoustic geophysics logs (Figure 6.3.18).
Although the comparison should be treated with caution (the geophysics may have missed some
natural fractures) it does indicate that rock quality may be better than that recovered from the
borehole.
Down-hole Geophysics
The downhole geophysics are discussed in detail within Appendix A and examines the data provided
by the caliper, natural gamma, resistivity, density, porosity, fluid temperature, fluid conductivity,
salinity, fluid velocity and optical and acoustical borehole imager tools. Key points noted with respect
to the geophysics testing are:
Feeder 9 - River Humber Gas Pipeline Replacement Project
Ground Investigation Report 064298/F9/GEO/RPT/101 B
60
In general the exploratory hole bores are relatively smooth which is backed up by the optical images and, to a lesser extent, acoustic images.
Breakouts recorded by the caliper are generally as a result of wide major fractures, multiple fractures, steeply inclined fractures or a combination of these.
In situ density (bulk density) recorded by the density tool (2.25 Mg/m3) correlates well with literature and laboratory test results. There is no noticeable difference in bulk density recorded by the density tool between the Flamborough and Burnham Chalks.
Porosity values of 23 % to 35 % recorded by the porosity tool correlates well with literature and laboratory test results and indicate a typically high to very high density chalk. There is no noticeable difference in porosity recorded by the porosity tool between the Flamborough and Burnham Chalks.
Water conductivity, salinity and temperature measurements are higher in the marine boreholes due to the use of water from the River Humber as a flush. Fluid velocities recorded indicate that there is no flow into or out of the chalk.
Optical and acoustical data indicates that rock quality of the chalk is generally better than that of the core recovered from the boreholes.
Structural data obtained from the optical and acoustical data indicates that the bedding is
approximately horizontal which correlates well with literature. The primary orientation of fractures is
approximately horizontal. There is no clear secondary fracture orientation.
Distribution of Flint / Marl The locations of flint gravel/cobbles and marl bands were obtained from the chalk descriptions within
the borehole logs. Generally the flint and marl was recorded within the logs at specific depths,
however, where they were included in the general description the depth of the flint / marl was
represented at the mid-point of the strata depth range. The locations were then plotted against
elevation (m AOD) for land boreholes (Figure 6.3.19) and marine boreholes (Figure 6.3.20).
As can be clearly seen in Figures 6.3.19 and 6.3.20 flint is largely absent from the Flamborough Chalk.
This is generally in accordance with the geological memoir (British Geological Survey, 1994) which
records the Flamborough Chalk as having “sporadic bands of white flint” with the “tabular grey flint
marker beds that typify the underlying formations absent”. Although flint is recorded in the
Flamborough Chalk on the Goxhill side of the site the thickness of the Flamborough Chalk is limited (0
m to 6.9 m thick / typically 2.3 m to 2.75 m thick) and structureless. Within the marine boreholes the
flint is restricted to the boreholes on the western side of the Humber (M01, M02, M03 and M05).
Flints within the Flamborough Chalk are typically described as light grey or white in colour and rarely
tabular.
Marl bands are recorded in the Flamborough Chalk within the marine boreholes and the land
boreholes at Paull. As the Flamborough chalk on the Goxhill side of the Humber is structureless chalk
it would not be expected for marl bands to be discernible. The marl bands are typically described as
soft grey thin (<6 mm) to thick laminations (6 mm to 20 mm) and are typically extremely closely (<20
mm) to closely (60 mm to 200 mm) spaced.
Feeder 9 - River Humber Gas Pipeline Replacement Project
Ground Investigation Report 064298/F9/GEO/RPT/101 B
61
In situ Permeability Testing (packers and variable head tests)
Packer Testing
The packer testing results have been interpreted in accordance with the general principles set out in
Section 25.5.1 of BS 5930 (2010). The characteristic permeabilities were determined in accordance
with Appendix 5 of CIRIA Report R113 (1986), Houlsby (1976) and BS EN ISO 22282-3 (2012). Failed
tests were not used to obtain information on permeability except for a single test in borehole M20 at
40 m bgl where only the final test stage was not completed due to a failed pump. The use of “Divers”
to obtain detailed direct pressure measurements within and above the test zone was completed for
the majority of the tests although this data has not been received at the time of writing and
therefore all pressure measurements are based on the surface gauge reading. It should be noted that
the surface gauge was connected by a thin high pressure plastic pipe directly into the test section and
not to the top of the drill rods. Although this is not a direct measurement, the friction loss due to the
pipe has been confirmed as minimal by the ground investigation contractor. For all tests it has been
assumed that water has not been escaping past the packer.
For each test the permeability (k) and flow rate (Q) was plotted against the differential pressure head
(H) of water for each test stage. Additionally the Lugeon pattern was plotted against the test
pressures. Plots of Q against H were compared against the examples in Annex B of BS EN 22282-3 and
the Lugeon pattern was compared with Table 1 of Houlsby (1976). Where there were discrepancies
between flow type Q against H plot and the Lugeon pattern, the Lugeon pattern took precedence.
The flow behaviour was categorised into one of the following five categories according to the closest
matching graph / pattern:
GOUP A – Laminar Flow
GROUP B – Turbulent Flow
GROUP C – Dilation
GROUP D – Wash-out
GROUP E – Void Filling
Once the dominant flow type was identified, the stage of the test at which the characteristic
permeability would be recorded was identified in accordance with the guidance given in Table 1 of
Houlsby (1976).
The plots of Q and k against H and Lugeon Pattern for all tests in Flamborough Chalk are presented in
Figures 6.3.21 to 6.3.32 along with the selection of the “Characteristic Permeability”. The results of
this interpretation of the packer tests within the Flamborough Chalk is summarised in Table 6.3.2
below.
Permeability values quoted in the factual report are based on the slope of the “best fit” line for the Q
against H plot and an approximate conversion from Lugeon value to permeability. This is appropriate
for the factual report only and these values have not been considered in this interpretation.
Feeder 9 - River Humber Gas Pipeline Replacement Project
Ground Investigation Report 064298/F9/GEO/RPT/101 B
62
The borehole log and core photography have been examined at each test location along with the
geophysics optical (where water clarity permitted) and acoustic logs. There is a significant
discrepancy between the quality of the core recovered and the apparent quality of the in situ rock
from the geophysics. This is discussed further in the geophysics interpretation in Appendix A
although in general the quality of the in situ rock appears to be significantly better than that
recovered. The number of fractures within the test section, as recorded by the geophysics, are noted
in Table 6.3.2 below although in general there are very few discontinuities recorded, most of which
are minor fractures. Although not all test locations were covered by the geophysics, it is worth noting
that the test failed at the only location where a major fracture (this was within the Flamborough
Chalk) was recorded in situ within the test section. The failure of the test (unable to record pressure
within the test section) may not be due to the permeability of the fracture however and it is not
possible to confirm that a successful test was completed in a section that contained such a fracture
or fracture zone. It is therefore possible that the permeabilities calculated from the packer testing
may only represent the lower end of the permeabilities within the chalk. Higher permeabilities
associated with fracture zones may not be represented within this testing.
It should be noted that the CIRIA C574 incorrectly references BS 5930 to recommend the use of 3m
long test sections. Tests completed on this project were completed over a 1m long test section in
accordance with CIRIA Report R113 (>10 x hole radius). This is deemed to be an appropriate test
length for the equipment used.
A total of 18 packer tests were completed within the Flamborough Chalk of which 6 of these tests
failed due to not being able to record a test pressure within the test section.
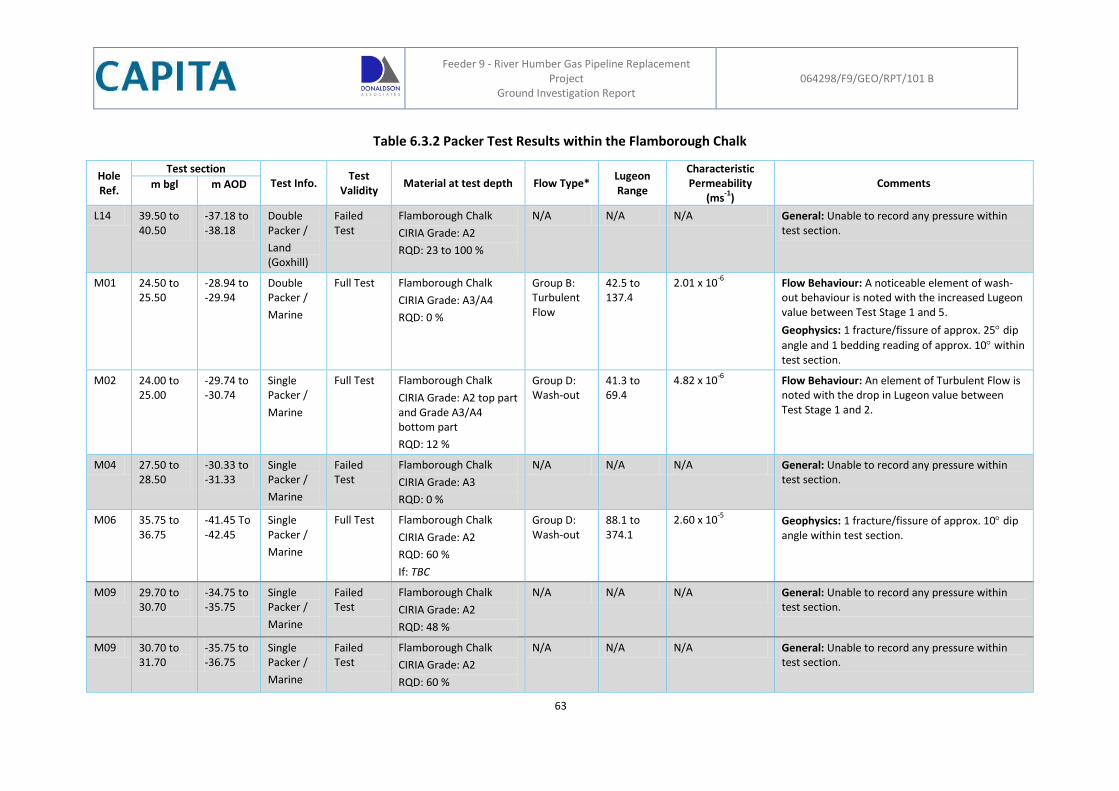
Feeder 9 - River Humber Gas Pipeline Replacement
Project Ground Investigation Report
064298/F9/GEO/RPT/101 B
63
Table 6.3.2 Packer Test Results within the Flamborough Chalk
Hole Ref.
Test section Test Info.
Test Validity
Material at test depth Flow Type* Lugeon Range
Characteristic Permeability
(ms-1
) Comments m bgl m AOD
L14 39.50 to 40.50
-37.18 to -38.18
Double Packer /
Land (Goxhill)
Failed Test
Flamborough Chalk
CIRIA Grade: A2
RQD: 23 to 100 %
N/A N/A N/A General: Unable to record any pressure within test section.
M01 24.50 to 25.50
-28.94 to -29.94
Double Packer /
Marine
Full Test Flamborough Chalk
CIRIA Grade: A3/A4
RQD: 0 %
Group B: Turbulent Flow
42.5 to 137.4
2.01 x 10⁻⁶
Flow Behaviour: A noticeable element of wash-out behaviour is noted with the increased Lugeon value between Test Stage 1 and 5.
Geophysics: 1 fracture/fissure of approx. 25 dip
angle and 1 bedding reading of approx. 10 within test section.
M02 24.00 to 25.00
-29.74 to -30.74
Single Packer /
Marine
Full Test Flamborough Chalk
CIRIA Grade: A2 top part and Grade A3/A4 bottom part
RQD: 12 %
Group D: Wash-out
41.3 to 69.4
4.82 x 10⁻⁶
Flow Behaviour: An element of Turbulent Flow is noted with the drop in Lugeon value between Test Stage 1 and 2.
M04 27.50 to 28.50
-30.33 to -31.33
Single Packer /
Marine
Failed Test
Flamborough Chalk
CIRIA Grade: A3
RQD: 0 %
N/A N/A N/A General: Unable to record any pressure within test section.
M06 35.75 to 36.75
-41.45 To -42.45
Single Packer /
Marine
Full Test Flamborough Chalk
CIRIA Grade: A2
RQD: 60 %
If: TBC
Group D: Wash-out
88.1 to 374.1
2.60 x 10⁻⁵
Geophysics: 1 fracture/fissure of approx. 10 dip angle within test section.
M09 29.70 to 30.70
-34.75 to -35.75
Single Packer /
Marine
Failed Test
Flamborough Chalk
CIRIA Grade: A2
RQD: 48 %
N/A N/A N/A General: Unable to record any pressure within test section.
M09 30.70 to 31.70
-35.75 to -36.75
Single Packer /
Marine
Failed Test
Flamborough Chalk
CIRIA Grade: A2
RQD: 60 %
N/A N/A N/A General: Unable to record any pressure within test section.
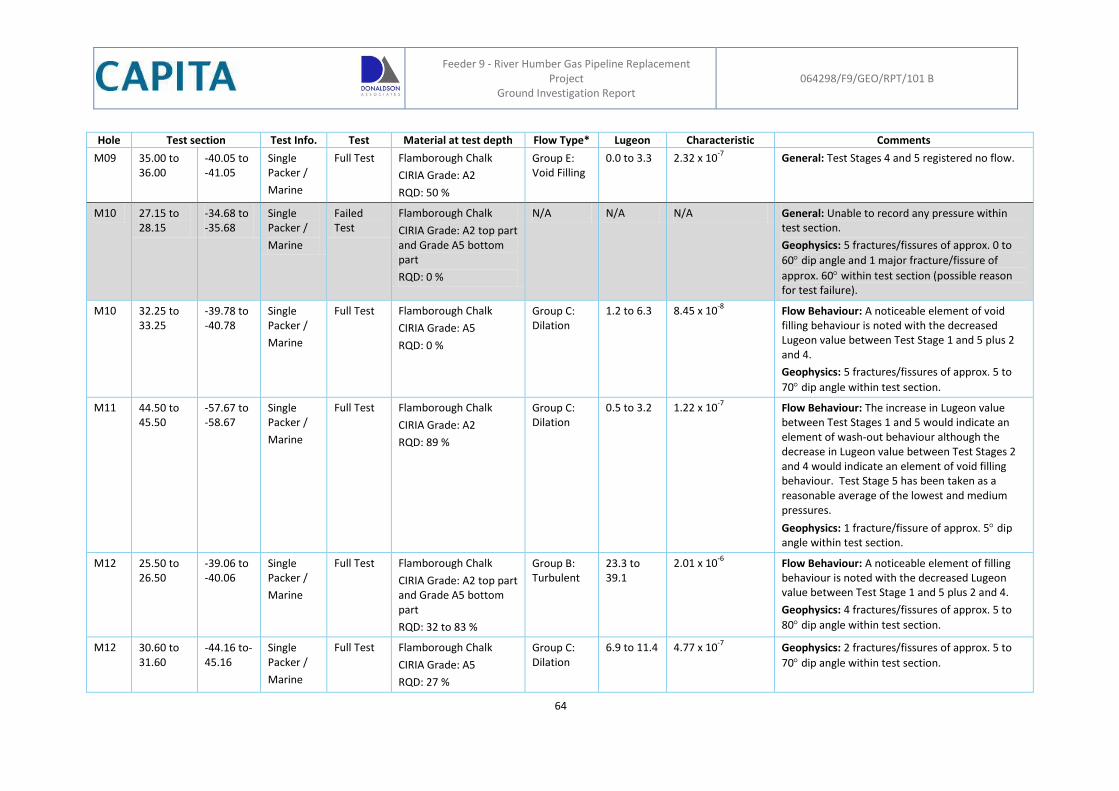
Feeder 9 - River Humber Gas Pipeline Replacement
Project Ground Investigation Report
064298/F9/GEO/RPT/101 B
64
Hole Ref.
Test section Test Info. Test Validity
Material at test depth Flow Type* Lugeon Range
Characteristic Permeability
(ms-1
)
Comments
M09 35.00 to 36.00
-40.05 to -41.05
Single Packer /
Marine
Full Test Flamborough Chalk
CIRIA Grade: A2
RQD: 50 %
Group E: Void Filling
0.0 to 3.3 2.32 x 10⁻⁷
General: Test Stages 4 and 5 registered no flow.
M10 27.15 to 28.15
-34.68 to -35.68
Single Packer /
Marine
Failed Test
Flamborough Chalk
CIRIA Grade: A2 top part and Grade A5 bottom part
RQD: 0 %
N/A N/A N/A General: Unable to record any pressure within test section.
Geophysics: 5 fractures/fissures of approx. 0 to
60 dip angle and 1 major fracture/fissure of
approx. 60 within test section (possible reason for test failure).
M10 32.25 to 33.25
-39.78 to -40.78
Single Packer /
Marine
Full Test Flamborough Chalk
CIRIA Grade: A5
RQD: 0 %
Group C: Dilation
1.2 to 6.3 8.45 x 10⁻⁸
Flow Behaviour: A noticeable element of void filling behaviour is noted with the decreased Lugeon value between Test Stage 1 and 5 plus 2 and 4.
Geophysics: 5 fractures/fissures of approx. 5 to
70 dip angle within test section.
M11 44.50 to 45.50
-57.67 to -58.67
Single Packer /
Marine
Full Test Flamborough Chalk
CIRIA Grade: A2
RQD: 89 %
Group C: Dilation
0.5 to 3.2 1.22 x 10⁻⁷
Flow Behaviour: The increase in Lugeon value between Test Stages 1 and 5 would indicate an element of wash-out behaviour although the decrease in Lugeon value between Test Stages 2 and 4 would indicate an element of void filling behaviour. Test Stage 5 has been taken as a reasonable average of the lowest and medium pressures.
Geophysics: 1 fracture/fissure of approx. 5 dip angle within test section.
M12 25.50 to 26.50
-39.06 to -40.06
Single Packer /
Marine
Full Test Flamborough Chalk
CIRIA Grade: A2 top part and Grade A5 bottom part
RQD: 32 to 83 %
Group B: Turbulent
23.3 to 39.1
2.01 x 10⁻⁶
Flow Behaviour: A noticeable element of filling behaviour is noted with the decreased Lugeon value between Test Stage 1 and 5 plus 2 and 4.
Geophysics: 4 fractures/fissures of approx. 5 to
80 dip angle within test section.
M12 30.60 to 31.60
-44.16 to-45.16
Single Packer /
Marine
Full Test Flamborough Chalk
CIRIA Grade: A5
RQD: 27 %
Group C: Dilation
6.9 to 11.4 4.77 x 10⁻⁷
Geophysics: 2 fractures/fissures of approx. 5 to
70 dip angle within test section.
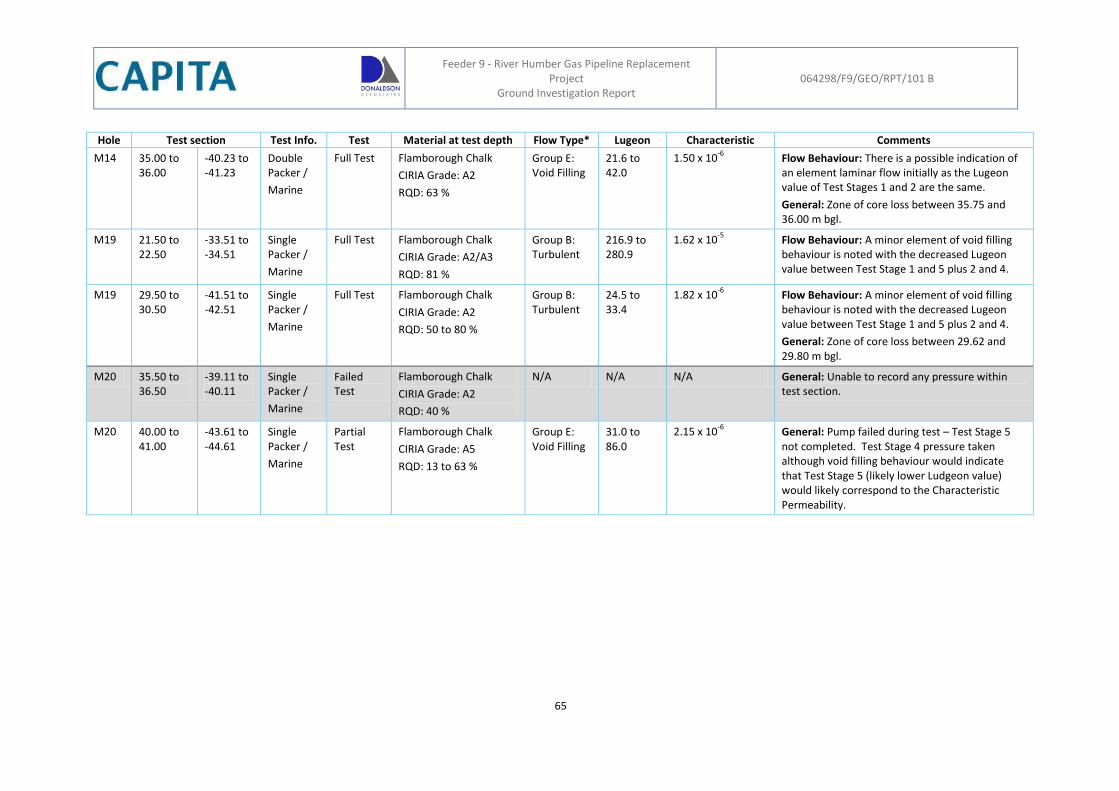
Feeder 9 - River Humber Gas Pipeline Replacement
Project Ground Investigation Report
064298/F9/GEO/RPT/101 B
65
Hole Ref.
Test section Test Info. Test Validity
Material at test depth Flow Type* Lugeon Range
Characteristic Permeability
(ms-1
)
Comments
M14 35.00 to 36.00
-40.23 to -41.23
Double Packer /
Marine
Full Test Flamborough Chalk
CIRIA Grade: A2
RQD: 63 %
Group E: Void Filling
21.6 to 42.0
1.50 x 10⁻⁶
Flow Behaviour: There is a possible indication of an element laminar flow initially as the Lugeon value of Test Stages 1 and 2 are the same.
General: Zone of core loss between 35.75 and 36.00 m bgl.
M19 21.50 to 22.50
-33.51 to -34.51
Single Packer /
Marine
Full Test Flamborough Chalk
CIRIA Grade: A2/A3
RQD: 81 %
Group B: Turbulent
216.9 to 280.9
1.62 x 10⁻⁵
Flow Behaviour: A minor element of void filling behaviour is noted with the decreased Lugeon value between Test Stage 1 and 5 plus 2 and 4.
M19 29.50 to 30.50
-41.51 to -42.51
Single Packer /
Marine
Full Test Flamborough Chalk
CIRIA Grade: A2
RQD: 50 to 80 %
Group B: Turbulent
24.5 to 33.4
1.82 x 10⁻⁶
Flow Behaviour: A minor element of void filling behaviour is noted with the decreased Lugeon value between Test Stage 1 and 5 plus 2 and 4.
General: Zone of core loss between 29.62 and 29.80 m bgl.
M20 35.50 to 36.50
-39.11 to -40.11
Single Packer /
Marine
Failed Test
Flamborough Chalk
CIRIA Grade: A2
RQD: 40 %
N/A N/A N/A General: Unable to record any pressure within test section.
M20 40.00 to 41.00
-43.61 to -44.61
Single Packer /
Marine
Partial Test
Flamborough Chalk
CIRIA Grade: A5
RQD: 13 to 63 %
Group E: Void Filling
31.0 to 86.0
2.15 x 10⁻⁶
General: Pump failed during test – Test Stage 5 not completed. Test Stage 4 pressure taken although void filling behaviour would indicate that Test Stage 5 (likely lower Ludgeon value) would likely correspond to the Characteristic Permeability.
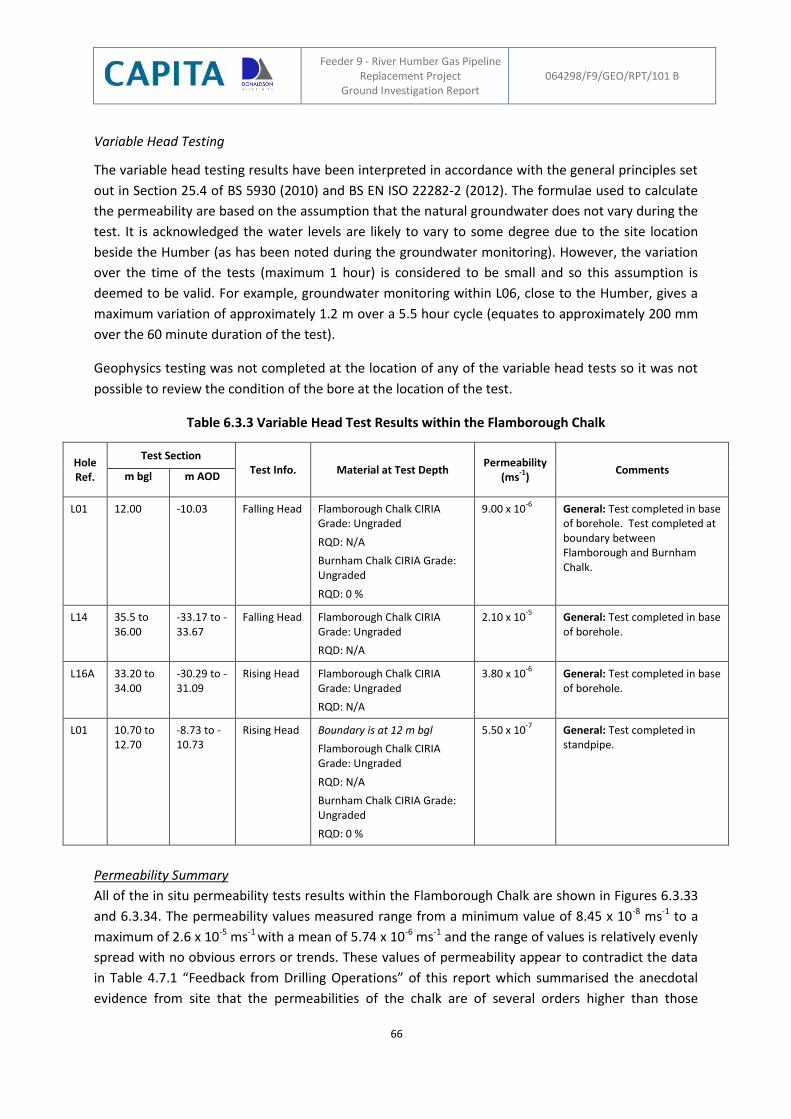
Feeder 9 - River Humber Gas Pipeline Replacement Project
Ground Investigation Report 064298/F9/GEO/RPT/101 B
66
Variable Head Testing
The variable head testing results have been interpreted in accordance with the general principles set
out in Section 25.4 of BS 5930 (2010) and BS EN ISO 22282-2 (2012). The formulae used to calculate
the permeability are based on the assumption that the natural groundwater does not vary during the
test. It is acknowledged the water levels are likely to vary to some degree due to the site location
beside the Humber (as has been noted during the groundwater monitoring). However, the variation
over the time of the tests (maximum 1 hour) is considered to be small and so this assumption is
deemed to be valid. For example, groundwater monitoring within L06, close to the Humber, gives a
maximum variation of approximately 1.2 m over a 5.5 hour cycle (equates to approximately 200 mm
over the 60 minute duration of the test).
Geophysics testing was not completed at the location of any of the variable head tests so it was not
possible to review the condition of the bore at the location of the test.
Table 6.3.3 Variable Head Test Results within the Flamborough Chalk
Hole Ref.
Test Section Test Info. Material at Test Depth
Permeability (ms
-1)
Comments m bgl m AOD
L01 12.00 -10.03 Falling Head Flamborough Chalk CIRIA Grade: Ungraded
RQD: N/A
Burnham Chalk CIRIA Grade: Ungraded
RQD: 0 %
9.00 x 10⁻⁶
General: Test completed in base of borehole. Test completed at boundary between Flamborough and Burnham Chalk.
L14 35.5 to 36.00
-33.17 to -33.67
Falling Head Flamborough Chalk CIRIA Grade: Ungraded
RQD: N/A
2.10 x 10⁻⁵
General: Test completed in base of borehole.
L16A 33.20 to 34.00
-30.29 to -31.09
Rising Head Flamborough Chalk CIRIA Grade: Ungraded
RQD: N/A
3.80 x 10⁻⁶
General: Test completed in base of borehole.
L01 10.70 to 12.70
-8.73 to -10.73
Rising Head Boundary is at 12 m bgl
Flamborough Chalk CIRIA Grade: Ungraded
RQD: N/A
Burnham Chalk CIRIA Grade: Ungraded
RQD: 0 %
5.50 x 10⁻⁷
General: Test completed in standpipe.
Permeability Summary
All of the in situ permeability tests results within the Flamborough Chalk are shown in Figures 6.3.33
and 6.3.34. The permeability values measured range from a minimum value of 8.45 x 10⁻⁸ ms-1 to a
maximum of 2.6 x 10⁻⁵ ms-1 with a mean of 5.74 x 10⁻⁶ ms-1 and the range of values is relatively evenly
spread with no obvious errors or trends. These values of permeability appear to contradict the data
in Table 4.7.1 “Feedback from Drilling Operations” of this report which summarised the anecdotal
evidence from site that the permeabilities of the chalk are of several orders higher than those
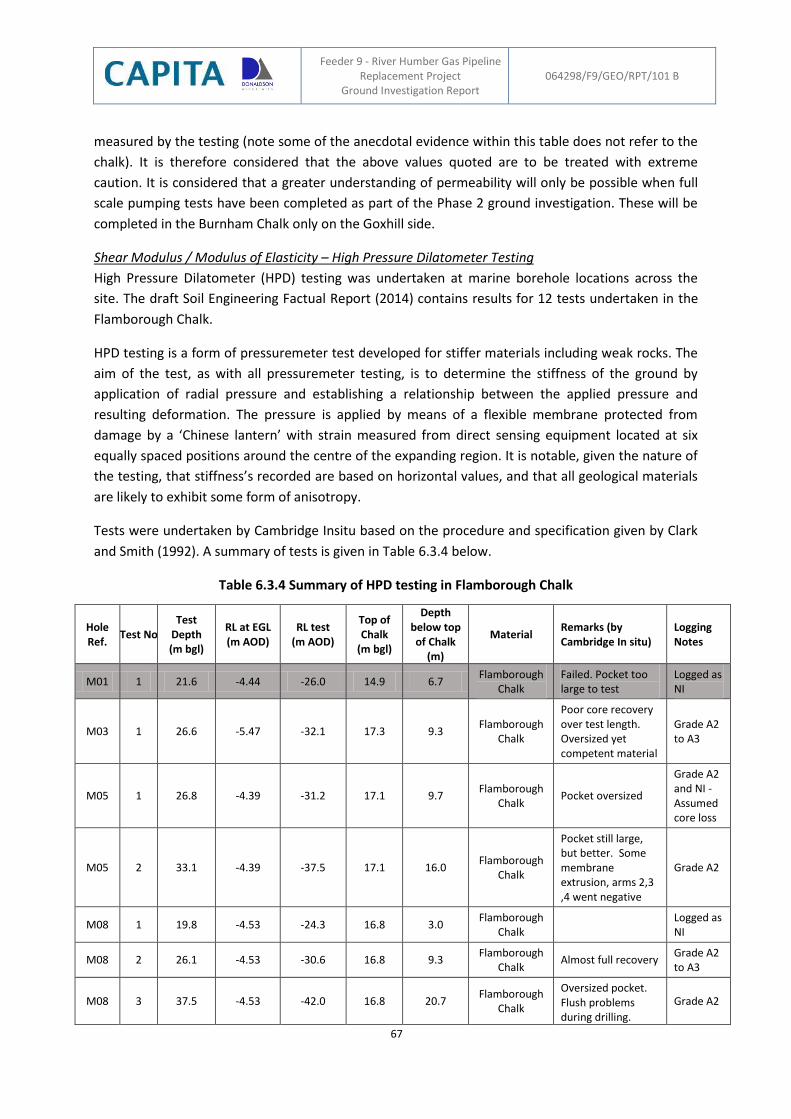
Feeder 9 - River Humber Gas Pipeline Replacement Project
Ground Investigation Report 064298/F9/GEO/RPT/101 B
67
measured by the testing (note some of the anecdotal evidence within this table does not refer to the
chalk). It is therefore considered that the above values quoted are to be treated with extreme
caution. It is considered that a greater understanding of permeability will only be possible when full
scale pumping tests have been completed as part of the Phase 2 ground investigation. These will be
completed in the Burnham Chalk only on the Goxhill side.
Shear Modulus / Modulus of Elasticity – High Pressure Dilatometer Testing
High Pressure Dilatometer (HPD) testing was undertaken at marine borehole locations across the
site. The draft Soil Engineering Factual Report (2014) contains results for 12 tests undertaken in the
Flamborough Chalk.
HPD testing is a form of pressuremeter test developed for stiffer materials including weak rocks. The
aim of the test, as with all pressuremeter testing, is to determine the stiffness of the ground by
application of radial pressure and establishing a relationship between the applied pressure and
resulting deformation. The pressure is applied by means of a flexible membrane protected from
damage by a ‘Chinese lantern’ with strain measured from direct sensing equipment located at six
equally spaced positions around the centre of the expanding region. It is notable, given the nature of
the testing, that stiffness’s recorded are based on horizontal values, and that all geological materials
are likely to exhibit some form of anisotropy.
Tests were undertaken by Cambridge Insitu based on the procedure and specification given by Clark
and Smith (1992). A summary of tests is given in Table 6.3.4 below.
Table 6.3.4 Summary of HPD testing in Flamborough Chalk
Hole Ref.
Test No Test
Depth (m bgl)
RL at EGL (m AOD)
RL test (m AOD)
Top of Chalk
(m bgl)
Depth below top of Chalk
(m)
Material Remarks (by Cambridge In situ)
Logging Notes
M01 1 21.6 -4.44 -26.0 14.9 6.7 Flamborough
Chalk Failed. Pocket too large to test
Logged as NI
M03 1 26.6 -5.47 -32.1 17.3 9.3 Flamborough
Chalk
Poor core recovery over test length. Oversized yet competent material
Grade A2 to A3
M05 1 26.8 -4.39 -31.2 17.1 9.7 Flamborough
Chalk Pocket oversized
Grade A2 and NI - Assumed core loss
M05 2 33.1 -4.39 -37.5 17.1 16.0 Flamborough
Chalk
Pocket still large, but better. Some membrane extrusion, arms 2,3 ,4 went negative
Grade A2
M08 1 19.8 -4.53 -24.3 16.8 3.0 Flamborough
Chalk
Logged as NI
M08 2 26.1 -4.53 -30.6 16.8 9.3 Flamborough
Chalk Almost full recovery
Grade A2 to A3
M08 3 37.5 -4.53 -42.0 16.8 20.7 Flamborough
Chalk
Oversized pocket. Flush problems during drilling.
Grade A2
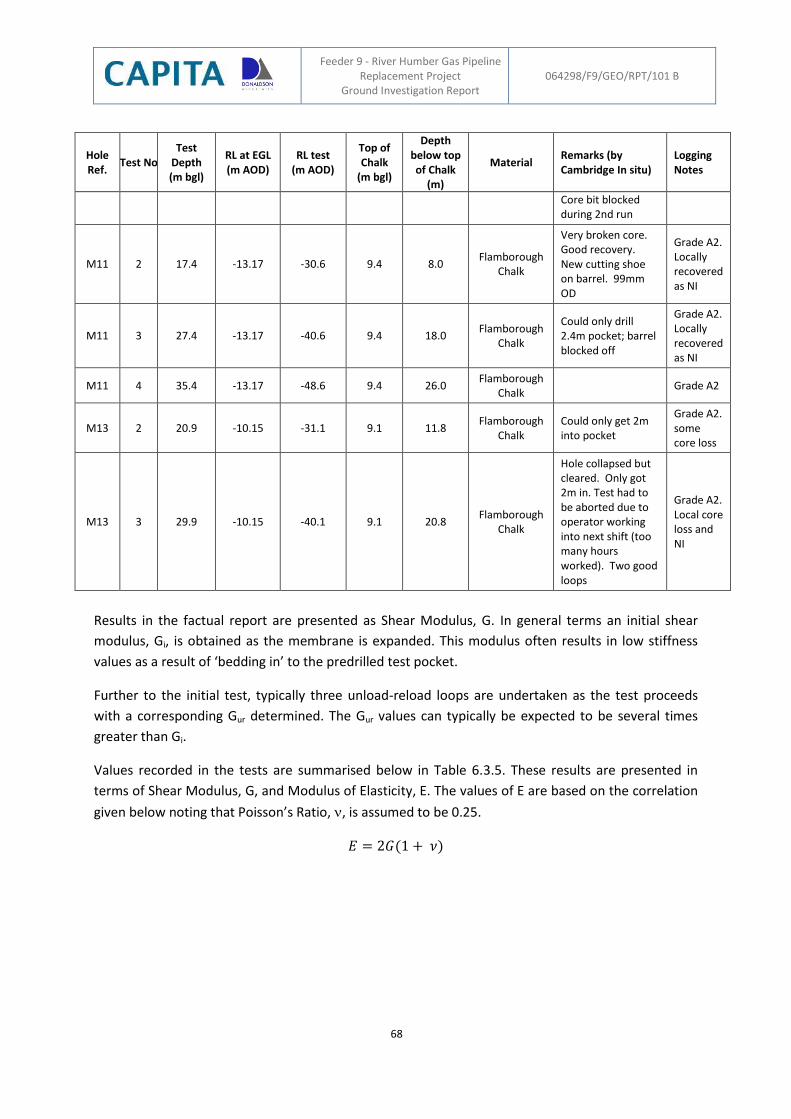
Feeder 9 - River Humber Gas Pipeline Replacement Project
Ground Investigation Report 064298/F9/GEO/RPT/101 B
68
Hole Ref.
Test No Test
Depth (m bgl)
RL at EGL (m AOD)
RL test (m AOD)
Top of Chalk
(m bgl)
Depth below top of Chalk
(m)
Material Remarks (by Cambridge In situ)
Logging Notes
Core bit blocked during 2nd run
M11 2 17.4 -13.17 -30.6 9.4 8.0 Flamborough
Chalk
Very broken core. Good recovery. New cutting shoe on barrel. 99mm OD
Grade A2. Locally recovered as NI
M11 3 27.4 -13.17 -40.6 9.4 18.0 Flamborough
Chalk
Could only drill 2.4m pocket; barrel blocked off
Grade A2. Locally recovered as NI
M11 4 35.4 -13.17 -48.6 9.4 26.0 Flamborough
Chalk Grade A2
M13 2 20.9 -10.15 -31.1 9.1 11.8 Flamborough
Chalk Could only get 2m into pocket
Grade A2. some core loss
M13 3 29.9 -10.15 -40.1 9.1 20.8 Flamborough
Chalk
Hole collapsed but cleared. Only got 2m in. Test had to be aborted due to operator working into next shift (too many hours worked). Two good loops
Grade A2. Local core loss and NI
Results in the factual report are presented as Shear Modulus, G. In general terms an initial shear
modulus, Gi, is obtained as the membrane is expanded. This modulus often results in low stiffness
values as a result of ‘bedding in’ to the predrilled test pocket.
Further to the initial test, typically three unload-reload loops are undertaken as the test proceeds
with a corresponding Gur determined. The Gur values can typically be expected to be several times
greater than Gi.
Values recorded in the tests are summarised below in Table 6.3.5. These results are presented in
terms of Shear Modulus, G, and Modulus of Elasticity, E. The values of E are based on the correlation
given below noting that Poisson’s Ratio, , is assumed to be 0.25.
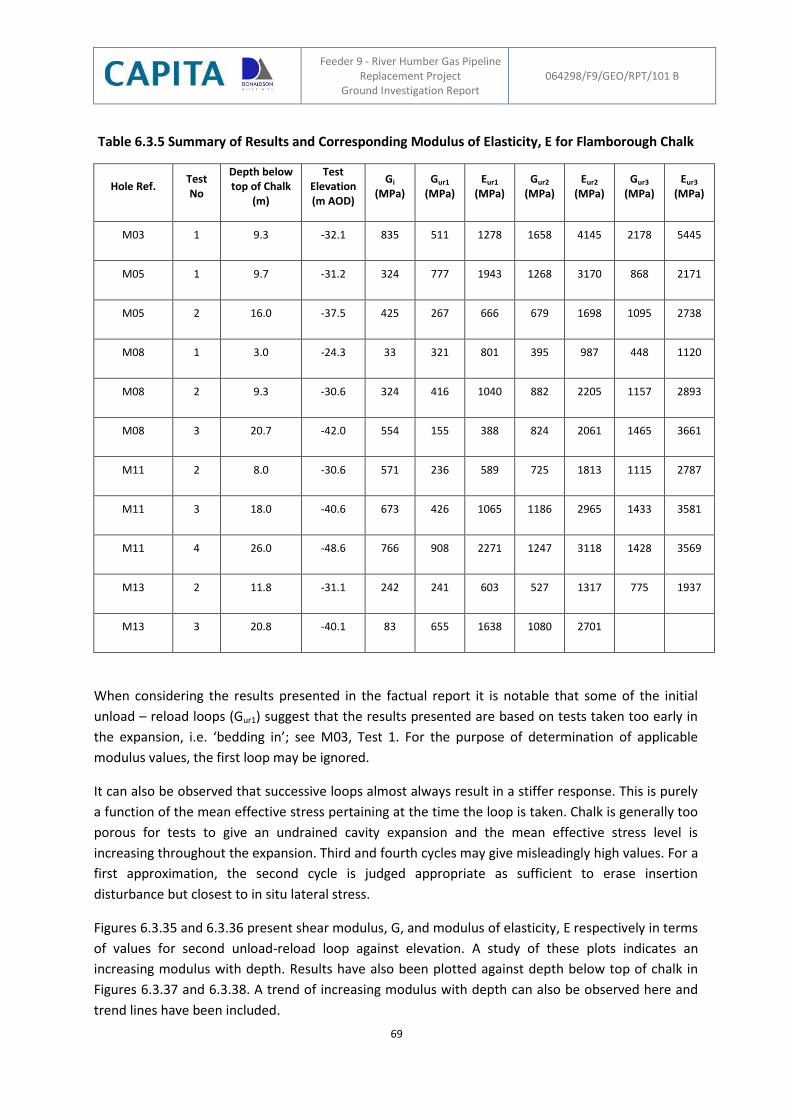
Feeder 9 - River Humber Gas Pipeline Replacement Project
Ground Investigation Report 064298/F9/GEO/RPT/101 B
69
Table 6.3.5 Summary of Results and Corresponding Modulus of Elasticity, E for Flamborough Chalk
Hole Ref. Test No
Depth below top of Chalk
(m)
Test Elevation (m AOD)
Gi
(MPa) Gur1
(MPa) Eur1
(MPa) Gur2
(MPa) Eur2
(MPa) Gur3
(MPa) Eur3
(MPa)
M03 1 9.3 -32.1 835 511 1278 1658 4145 2178 5445
M05 1 9.7 -31.2 324 777 1943 1268 3170 868 2171
M05 2 16.0 -37.5 425 267 666 679 1698 1095 2738
M08 1 3.0 -24.3 33 321 801 395 987 448 1120
M08 2 9.3 -30.6 324 416 1040 882 2205 1157 2893
M08 3 20.7 -42.0 554 155 388 824 2061 1465 3661
M11 2 8.0 -30.6 571 236 589 725 1813 1115 2787
M11 3 18.0 -40.6 673 426 1065 1186 2965 1433 3581
M11 4 26.0 -48.6 766 908 2271 1247 3118 1428 3569
M13 2 11.8 -31.1 242 241 603 527 1317 775 1937
M13 3 20.8 -40.1 83 655 1638 1080 2701
When considering the results presented in the factual report it is notable that some of the initial
unload – reload loops (Gur1) suggest that the results presented are based on tests taken too early in
the expansion, i.e. ‘bedding in’; see M03, Test 1. For the purpose of determination of applicable
modulus values, the first loop may be ignored.
It can also be observed that successive loops almost always result in a stiffer response. This is purely
a function of the mean effective stress pertaining at the time the loop is taken. Chalk is generally too
porous for tests to give an undrained cavity expansion and the mean effective stress level is
increasing throughout the expansion. Third and fourth cycles may give misleadingly high values. For a
first approximation, the second cycle is judged appropriate as sufficient to erase insertion
disturbance but closest to in situ lateral stress.
Figures 6.3.35 and 6.3.36 present shear modulus, G, and modulus of elasticity, E respectively in terms
of values for second unload-reload loop against elevation. A study of these plots indicates an
increasing modulus with depth. Results have also been plotted against depth below top of chalk in
Figures 6.3.37 and 6.3.38. A trend of increasing modulus with depth can also be observed here and
trend lines have been included.
Feeder 9 - River Humber Gas Pipeline Replacement Project
Ground Investigation Report 064298/F9/GEO/RPT/101 B
70
It should be noted that HPD tests have been undertaken where the chalk is of reasonable quality,
generally CIRIA grades A2 and A3. Due to collapse of boreholes, tests have, generally, not been
undertaken through Structureless, Grade Dc, chalk. The single test undertaken in non-intact chalk
indicated above is Test 1, M08. It is notable that results recorded here are the lowest values
recorded.
6.4 Burnham Chalk
6.4.1 General
The Burnham Chalk is described as very weak to weak medium (occasionally high) density white
chalk, occasionally stained orange or yellow, with very closely to closely spaced thin laminations of
grey marl. Fractures are extremely to medium spaced. Occasionally contains black sponges and
frequent angular to subrounded fine to coarse gravel sized (occasionally cobble sized) fragments of
grey and brown rinded flint.
6.4.2 Index Properties
Dry Density
The results for the Burnham Chalk are presented in Figure 6.4.1 and broadly range between 1.90
Mg/m3 and 2.10 Mg/m3 with a mean value of 1.95 Mg/m3. This is indicative of High to Very High dry
density as for the Flamborough Chalk, although the higher mean value for the Burnham Chalk
indicates very high density.
The high density values recorded here are typical for the northern chalks of Yorkshire and
Lincolnshire as described in the dry density section for Flamborough Chalk.
Bulk density
Results from bulk densities are presented in Figure 6.4.2. Measured values from 153 tests mainly
range from 2.1 Mg/m3 to 2.3 Mg/m3 with a mean value of 2.22 Mg/m3. The majority of tests lie
within a fairly narrow range with no discernible trend with elevation.
Saturated Moisture Content
Results for saturated moisture content (SMC) for Burnham Chalk are presented as Figure 6.4.3. The
SMC is the percentage of water required to fill all voids and is directly related to dry density and
porosity and is derived from the intact dry density. Values from 32 tests typically range between 10
and 20 %, mean of 14.7 %.
CIRIA C574 notes that there can be a large variation in SMC (and porosity) in chalk due to a variation
of deposition and digenesis followed by alteration and weathering. Figure 4.1 of CIRIA C574 depicts a
histogram from a survey of English chalk with a wide range of values between 4 and 40 %.
The results recorded here are in fairly narrow range when compared to variation reported in the
CIRIA Report.
Feeder 9 - River Humber Gas Pipeline Replacement Project
Ground Investigation Report 064298/F9/GEO/RPT/101 B
71
Natural Moisture Content and Atterberg Limits
Figure 6.4.4 presents natural moisture content w, plastic limit wp, liquid limit wL, plasticity index IP,
and liquidity index IL. Figure 6.4.5 depicts the A-Line plot for Burnham Chalk.
Natural moisture content has been recorded as generally between 12 and 24 %. There is a trend of
slightly higher values recorded in material recovered from higher elevations. However, caution
should be exercised when considering natural moisture values. It is noted in CIRIA C574 that
determination of the in situ water content is difficult owing to the rapid rate of evaporation that
occurs once material is exposed. Notwithstanding this, the results reported above for SMC are
broadly in the same range as natural moisture content. On this basis, the recorded natural moisture
content values can be considered as appropriate for use.
Atterberg Limits testing has been undertaken on samples of the chalk that have been crushed. It can
be seen from Figures 6.4.4 and 6.4.5 that the plasticity index (IP) is generally low with values less than
10 %. Typically, the liquid limit (wL) is between 20 % and 25 %. Test results indicate all material tested
can be classified as clay or silt of low plasticity (CL or ML respectively).
CIRIA C574 notes; while the Cenomanian contains sufficient clay to alter its plasticity the great
majority of chalk can be considered (with the exception of the flint) as almost pure calcium carbonate.
This “white chalk” has a very limited range of plasticity compared with that of the whole deposit. The
report goes on to note typical values for this “white chalk” of between 4 %and 9 % for plasticity index
and between 18 % and 32 % for liquid limit.
It can be concluded that results recorded are typically low plasticity and correlate with the “white
chalk” values quoted in CIRIA C574. However it should be noted that numerous thin to thick
laminations of marl have been recorded in the Burnham Chalk which will typically exhibit higher
plasticity than that recorded here.
Slake Durability
As previously discussed, slake durability tests provide a useful index of material degradability,
reflecting the behaviour of a ‘rock’ when wet at a tunnel face. A total of 16 tests were undertaken in
the Burnham Chalk and a summary is provided in Figure 6.4.6 in terms of material retained after first
cycle and second cycle. As can be seen, whereas the first cycle lies between 96 %and 99%, the second
cycle lies between 93 % and 98 %. The difference between first and second cycles ranges between
1.2 % and 2.6 %.
These results suggest that the material tested is durable. Attewell notes that slaking can be
problematic where values are less than 85 %. However it should be noted that intact chalk pieces
have been tested here rather than softer marl and that results need to be reviewed in the context of
local geology and hydrology.
Results have been compared with Figure 11.16 as presented by Harris et al (1996). This figure
presents data from slake durability tests undertaken in chalk for the Channel Tunnel. These are noted
as having relatively high slake durability with first cycle tests typically between 90 % and 98 % and
second cycle typically between 81 % and 92 %. Harris et al notes that this suggests that the calcium
Feeder 9 - River Humber Gas Pipeline Replacement Project
Ground Investigation Report 064298/F9/GEO/RPT/101 B
72
carbonate present in the samples is acting as an effective cementing agent and suppressing
breakdown and swelling. The results achieved at the Feeder 9 site suggest that the chalk here is more
durable than that described by Harris et al.
Cerchar Abrasivity Test
Cerchar Abrasivity Tests have been undertaken on samples of chalk and flint where present and
sampled with the results presented in Figure 6.4.7.
Referring to Figure 6.4.7, it can be seen that for chalk, the values are generally zero with one test
having a nominal value of 0.04. Results suggest the chalk is not abrasive.
Cerchar tests have also been carried out on 9 flint samples recovered. Values recorded lie between
1.65 and 3.65 with a mean value of 3.12. On the basis of results recorded the flint may be classified
as very abrasive.
6.4.3 Intact Properties
Unconfined Compressive Strength and Point Load Tests Unconfined compressive strength (UCS) and point load tests (PLT) have been carried out on intact
chalk samples. It is notable that when compared to the amount of rotary coring undertaken, a
relatively small proportion of the core recovered was suitable for UCS testing.
UCS testing is universally used in rock mechanics to ascertain the unconfined compressive strength of
the material being tested. However, it is notable for chalk, that CIRIA C574 states the test should be
strictly regarded as an index test. The point load test was originally developed as an index test to
predict the UCS when recovered core was too broken for conventional UCS testing.
To obtain an equivalent UCS value from point load testing a correlation factor, K, must be applied
where K = UCS / (PLT index Is(50)). Is(50) is the point load index normalized to 50 mm diameter samples.
Figure 6.4.8 considers correlated Is(50) values for UCS and measured UCS tests against elevation.
Figure 6.4.9 presents the same data against depth below top of chalk.
In order to ascertain a suitable correlation between Is(50) and UCS, the measured UCS values have
been compared against the closest point load tests resulting in a K of 27.5. However, only 2 UCS
results are recorded here so this value should be treated with caution.
Reference to Figure 4 in Bowden et al (1998) suggests a value of K=17 for a UCS of 7 MPa and K=20
for UCS of 10 MPa albeit the figure relates to southern chalks. On the basis of the test results and
Bowden et al a K value of 18 is considered reasonable for Burnham Chalk.
It can be seen that there is significant scatter in the results. However, there is no discernible increase
in strength with elevation or depth below top of chalk. A mean value of 10.5 MPa is recorded from
the UCS tests, but this is based on 2 tests only. When correlated point load tests are considered the
mean value is 10.6 MPa. Results generally indicate the chalk to be very weak to weak.
Feeder 9 - River Humber Gas Pipeline Replacement Project
Ground Investigation Report 064298/F9/GEO/RPT/101 B
73
It is notable that Figure 4.17 in CIRIA C574 depicts a plot of UCS versus density based on information
presented by Matthews and Clayton (1993). When the mean value for UCS is compared with mean
value for dry density as presented above, 1.95 Mg/m3, it can be seen that results here are close to
the ‘design line’ for saturated chalk.
Brazilian Tensile Testing
Results from 2 Brazilian Tensile tests undertaken on samples recovered from Burnham Chalk are
presented in Figure 6.4.10. The test quantities were limited due to the quality of material recovered
which prevented further testing in this material. Measured values are 0.72 MPa and 0.84 MPa with a
mean value 0.78 MPa. Based on a mean value of 10.6 MPa for UCS, the resulting ratio between
compressive and tensile strength is 13.6 although this should be regarded with caution due to the
low number of tensile tests.
Effective Strength
Tests are ongoing and results will be reviewed when available
Modulus of Elasticity (from UCS and Triaxial)
At time of writing, triaxial tests are ongoing and results will be reviewed when available. However,
the Modulus of Elasticity (E) has been directly measured on 2 UCS locally instrumented samples. Full
results have not been received for both tests with one of the tests received as Eave in tabular format
only. As a consequence, results have been summarised in Figures 6.4.11 and 6.4.12 as Eave versus
elevation and depth below top of chalk. Secant and tangential moduli are not considered at this time.
A mean value of 20.3 GPa is recorded for the 2 tests.
Poisson’s Ratio (measured in UCS)
The Poisson’s Ratio has also been measured on the 2 locally instrumented UCS tests described above. Results against elevation are presented in Figure 6.4.13 with values of 0.421 and 0.160, with a mean value of 0.291 recorded.
Permeability Results from the triaxial permeability have been received at the time of writing.
6.4.4 Mass Properties
Rock Quality
Structureless / Grade Dc Chalk
The static cone penetration tests (CPTs) are likely to have encountered minimal thickness of
structureless / Grade Dc Burnham Chalk and are not considered further.
Within the cable percussive boreholes standard penetration tests were completed in the
structureless / Grade Dc Burnham Chalk. Referring to Figure 6.4.14, SPT’s of between 30 and 50 /
Refusal are typically encountered within the structureless / Grade Dc Burnham Chalk. CIRIA C574
warns against the correlation of SPT values with chalk weathering grade although it can be noted that
SPT’s were completed at up to 16 m penetration (below top of chalk) in the Burnham chalk.
Feeder 9 - River Humber Gas Pipeline Replacement Project
Ground Investigation Report 064298/F9/GEO/RPT/101 B
74
Grade A Chalk
The quality of the chalk rock encountered was recorded through the Rock Quality Designation (RQD)
logging of the chalk cores. Total Core Recovery (TCR) and Solid Core Recovery (SCR) are not always
related to rock quality and are not discussed further.
RQD can be generally correlated to the common tunnelling classification as follows (after Deere et al,
1970):
Excellent 90 – 100 %
Good 75 – 90 %
Fair 50 – 75 %
Poor 25 – 50 %
Very Poor 0 – 25 %
A plot of all RQD data for the chalk (Flamborough and Burnham) has been produced in Figure 6.3.17.
This shows that for the initial 5 m of rock core the RQD was typically Very Poor and that an RQD of
Good or Excellent was not typically achieved until at least 10 m penetration into chalk. It was not
until typically 20 m to 25 m penetration into the chalk that Very Poor rock was generally not
encountered.
Comparison of the RQD as logged from the recovered core was compared against the “theoretical”
RQD from fractures that were logged within the optical and acoustic geophysics logs (Figure 6.3.18).
Although the comparison should be treated with caution (the geophysics may have missed some
natural fractures) it does indicate that rock quality in situ may be better than that recovered from the
borehole.
Down-hole Geophysics The downhole geophysics are discussed in detail within Appendix A which examines the data
provided by the caliper, natural gamma, resistivity, density, porosity, fluid temperature, fluid
conductivity, salinity, fluid velocity and optical and acoustical borehole imager tools. Key points noted
with respect to the geophysics testing are:
In general the exploratory hole bores are relatively smooth which is backed up by the optical images and, to a lesser extent, acoustic images.
Breakouts recorded by the caliper are generally as a result of wide major fractures, multiple fractures, steeply inclined fractures or a combination of these.
In situ density (bulk density) recorded by the density tool (2.25 Mg/m3) correlates well with literature and laboratory test results. There is no noticeable difference in bulk density recorded by the density tool between the Flamborough and Burnham Chalks.
Porosity values of 23 % to 35 % recorded by the porosity tool correlate well with literature and laboratory test results and indicate a typically high to very high density chalk. There is no
Feeder 9 - River Humber Gas Pipeline Replacement Project
Ground Investigation Report 064298/F9/GEO/RPT/101 B
75
noticeable difference in porosity recorded by the porosity tool between the Flamborough and Burnham Chalks.
Water conductivity, salinity and temperature measurements are higher in the marine boreholes due to the use of water from the River Humber as a flush. Fluid velocities recorded indicate that there is no flow into or out of the chalk.
Optical and acoustical data indicates that rock quality of the chalk in situ is generally better than that of the core recovered from the boreholes.
Structural data obtained from the optical and acoustical data indicates that the bedding is
approximately horizontal which correlates well with literature. The primary orientation of fractures
is approximately horizontal. There is no clear secondary fracture orientation.
Distribution of Flint / Marl
The locations of flint gravel/cobbles and marl bands were obtained from the chalk descriptions within
the borehole logs. Generally the flint and marl was recorded within the logs at specific depths,
however, where they were included in the general description the depth of the flint / marl was
represented at the mid-point of the strata depth range. The locations were then plotted against
elevation (m AOD) for land boreholes (Figure 6.3.19) and marine boreholes (Figure 6.3.20).
As can be clearly seen in Figures 6.3.19 and 6.3.20 flint is present throughout the Burnham Chalk.
This is generally in accordance with the geological memoir (British Geological Survey, 1994) which
records the Burnham Chalk as having “tabular grey flint marker beds” typically near the base of the
formation as well as white and grey flints described at various levels within the formation. Flints
within the Burnham Chalk are typically described as grey, brown or black in colour and are
occasionally tabular.
Marl bands are recorded in all the boreholes within the Burnham Chalk. The marl bands are typically
described as soft grey thin (<6 mm) to thick laminations (6 mm to 20 mm) and are typically extremely
closely (<20 mm) to closely (60 mm to 200 mm) spaced.
In situ Permeability Testing (packers and variable head tests)
Packer Testing
For a detailed description of the theory for the interpretation of the packer testing refer to Section
6.3.3.
Only 3 packer tests were completed within the Burnham Chalk of which 1 of these tests failed due to
not being able to record a test pressure within the test section.
The plots of Q and k against H and Lugeon Pattern for all tests in Burnham Chalk are presented in
Figures 6.4.15 and 6.4.16 along with the selection of the “Characteristic Permeability”. The results of
this interpretation of the packer tests within the Burnham Chalk are summarised in Table 6.4.1
below.
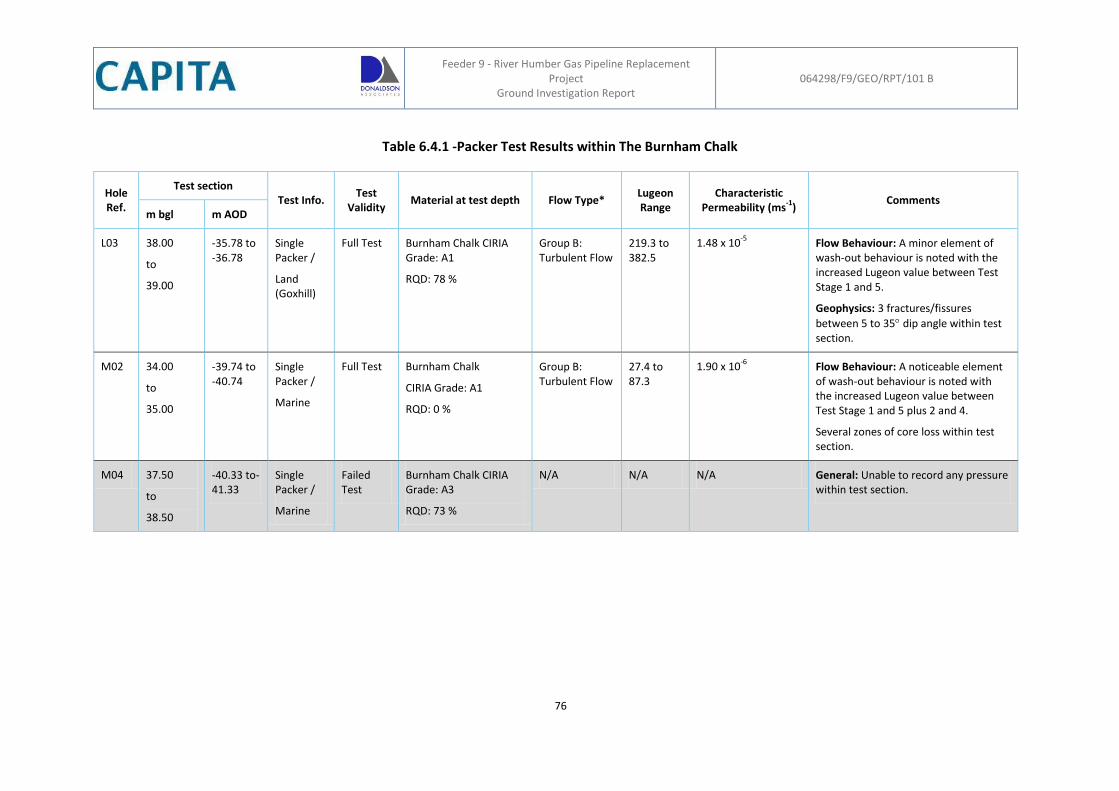
Feeder 9 - River Humber Gas Pipeline Replacement
Project Ground Investigation Report
064298/F9/GEO/RPT/101 B
76
Table 6.4.1 -Packer Test Results within The Burnham Chalk
Hole Ref.
Test section Test Info.
Test Validity
Material at test depth Flow Type* Lugeon Range
Characteristic Permeability (ms
-1)
Comments m bgl m AOD
L03 38.00
to
39.00
-35.78 to -36.78
Single Packer /
Land (Goxhill)
Full Test Burnham Chalk CIRIA Grade: A1
RQD: 78 %
Group B: Turbulent Flow
219.3 to 382.5
1.48 x 10⁻⁵
Flow Behaviour: A minor element of wash-out behaviour is noted with the increased Lugeon value between Test Stage 1 and 5.
Geophysics: 3 fractures/fissures
between 5 to 35 dip angle within test section.
M02 34.00
to
35.00
-39.74 to -40.74
Single Packer /
Marine
Full Test Burnham Chalk
CIRIA Grade: A1
RQD: 0 %
Group B: Turbulent Flow
27.4 to 87.3
1.90 x 10⁻⁶
Flow Behaviour: A noticeable element of wash-out behaviour is noted with the increased Lugeon value between Test Stage 1 and 5 plus 2 and 4.
Several zones of core loss within test section.
M04 37.50
to
38.50
-40.33 to-41.33
Single Packer /
Marine
Failed Test
Burnham Chalk CIRIA Grade: A3
RQD: 73 %
N/A N/A N/A General: Unable to record any pressure within test section.
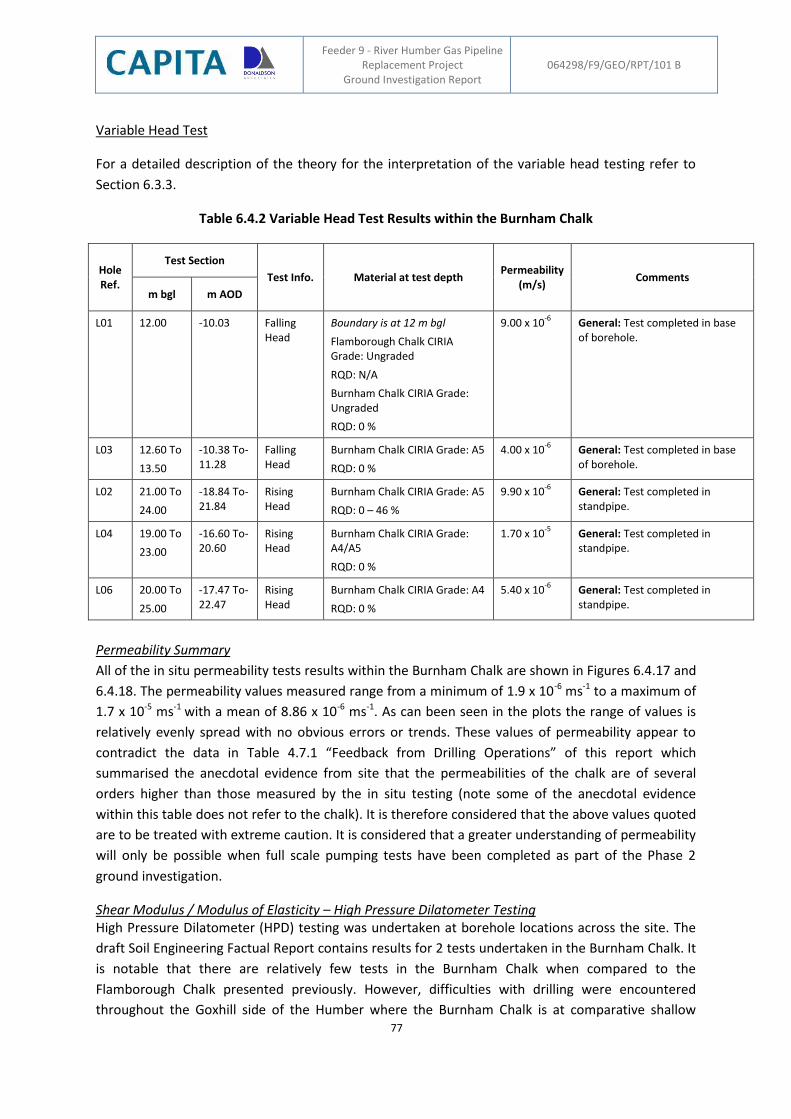
Feeder 9 - River Humber Gas Pipeline Replacement Project
Ground Investigation Report 064298/F9/GEO/RPT/101 B
77
Variable Head Test
For a detailed description of the theory for the interpretation of the variable head testing refer to
Section 6.3.3.
Table 6.4.2 Variable Head Test Results within the Burnham Chalk
Hole Ref.
Test Section
Test Info. Material at test depth Permeability
(m/s) Comments
m bgl m AOD
L01 12.00 -10.03 Falling Head
Boundary is at 12 m bgl
Flamborough Chalk CIRIA Grade: Ungraded
RQD: N/A
Burnham Chalk CIRIA Grade: Ungraded
RQD: 0 %
9.00 x 10⁻⁶
General: Test completed in base of borehole.
L03 12.60 To
13.50
-10.38 To-11.28
Falling Head
Burnham Chalk CIRIA Grade: A5
RQD: 0 %
4.00 x 10⁻⁶
General: Test completed in base of borehole.
L02 21.00 To
24.00
-18.84 To-21.84
Rising Head
Burnham Chalk CIRIA Grade: A5
RQD: 0 – 46 %
9.90 x 10⁻⁶
General: Test completed in standpipe.
L04 19.00 To
23.00
-16.60 To-20.60
Rising Head
Burnham Chalk CIRIA Grade: A4/A5
RQD: 0 %
1.70 x 10⁻⁵
General: Test completed in standpipe.
L06 20.00 To
25.00
-17.47 To-22.47
Rising Head
Burnham Chalk CIRIA Grade: A4
RQD: 0 %
5.40 x 10⁻⁶
General: Test completed in standpipe.
Permeability Summary
All of the in situ permeability tests results within the Burnham Chalk are shown in Figures 6.4.17 and
6.4.18. The permeability values measured range from a minimum of 1.9 x 10⁻⁶ ms-1 to a maximum of
1.7 x 10⁻⁵ ms-1 with a mean of 8.86 x 10⁻⁶ ms-1. As can been seen in the plots the range of values is
relatively evenly spread with no obvious errors or trends. These values of permeability appear to
contradict the data in Table 4.7.1 “Feedback from Drilling Operations” of this report which
summarised the anecdotal evidence from site that the permeabilities of the chalk are of several
orders higher than those measured by the in situ testing (note some of the anecdotal evidence
within this table does not refer to the chalk). It is therefore considered that the above values quoted
are to be treated with extreme caution. It is considered that a greater understanding of permeability
will only be possible when full scale pumping tests have been completed as part of the Phase 2
ground investigation.
Shear Modulus / Modulus of Elasticity – High Pressure Dilatometer Testing High Pressure Dilatometer (HPD) testing was undertaken at borehole locations across the site. The
draft Soil Engineering Factual Report contains results for 2 tests undertaken in the Burnham Chalk. It
is notable that there are relatively few tests in the Burnham Chalk when compared to the
Flamborough Chalk presented previously. However, difficulties with drilling were encountered
throughout the Goxhill side of the Humber where the Burnham Chalk is at comparative shallow
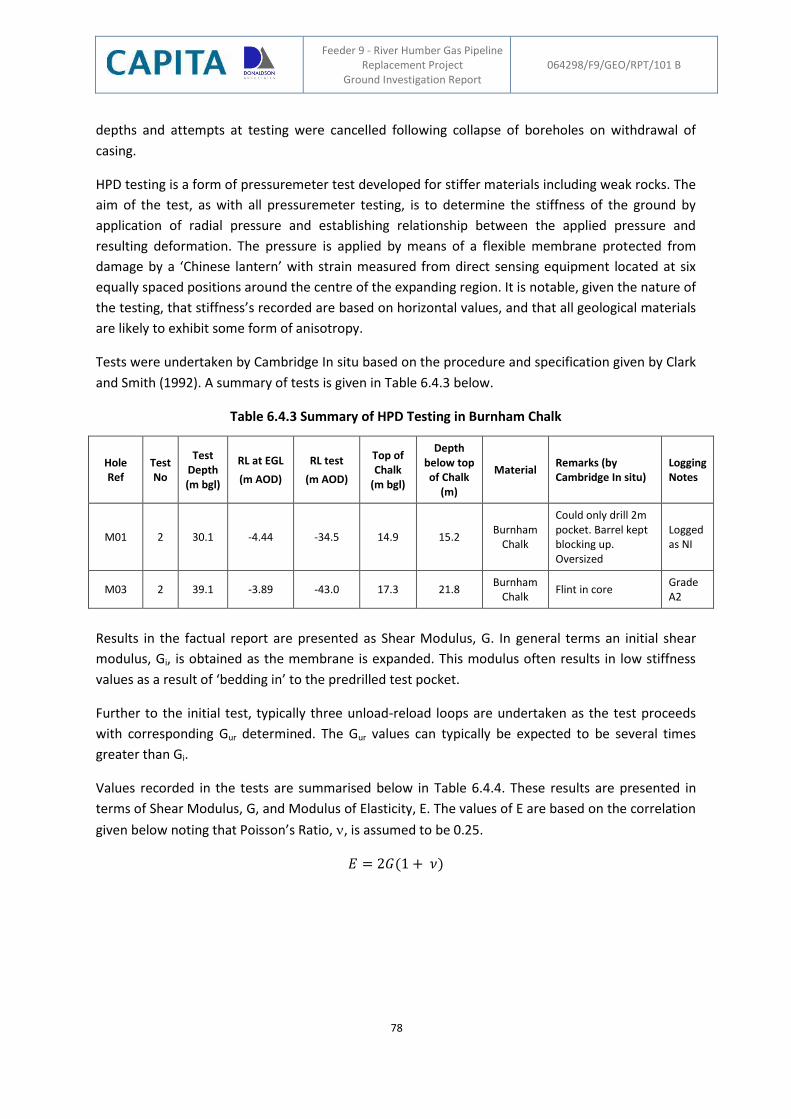
Feeder 9 - River Humber Gas Pipeline Replacement Project
Ground Investigation Report 064298/F9/GEO/RPT/101 B
78
depths and attempts at testing were cancelled following collapse of boreholes on withdrawal of
casing.
HPD testing is a form of pressuremeter test developed for stiffer materials including weak rocks. The
aim of the test, as with all pressuremeter testing, is to determine the stiffness of the ground by
application of radial pressure and establishing relationship between the applied pressure and
resulting deformation. The pressure is applied by means of a flexible membrane protected from
damage by a ‘Chinese lantern’ with strain measured from direct sensing equipment located at six
equally spaced positions around the centre of the expanding region. It is notable, given the nature of
the testing, that stiffness’s recorded are based on horizontal values, and that all geological materials
are likely to exhibit some form of anisotropy.
Tests were undertaken by Cambridge In situ based on the procedure and specification given by Clark
and Smith (1992). A summary of tests is given in Table 6.4.3 below.
Table 6.4.3 Summary of HPD Testing in Burnham Chalk
Hole Ref
Test No
Test Depth (m bgl)
RL at EGL
(m AOD)
RL test
(m AOD)
Top of Chalk
(m bgl)
Depth below top of Chalk
(m)
Material Remarks (by Cambridge In situ)
Logging Notes
M01 2 30.1 -4.44 -34.5 14.9 15.2 Burnham
Chalk
Could only drill 2m pocket. Barrel kept blocking up. Oversized
Logged as NI
M03 2 39.1 -3.89 -43.0 17.3 21.8 Burnham
Chalk Flint in core
Grade A2
Results in the factual report are presented as Shear Modulus, G. In general terms an initial shear
modulus, Gi, is obtained as the membrane is expanded. This modulus often results in low stiffness
values as a result of ‘bedding in’ to the predrilled test pocket.
Further to the initial test, typically three unload-reload loops are undertaken as the test proceeds
with corresponding Gur determined. The Gur values can typically be expected to be several times
greater than Gi.
Values recorded in the tests are summarised below in Table 6.4.4. These results are presented in
terms of Shear Modulus, G, and Modulus of Elasticity, E. The values of E are based on the correlation
given below noting that Poisson’s Ratio, , is assumed to be 0.25.
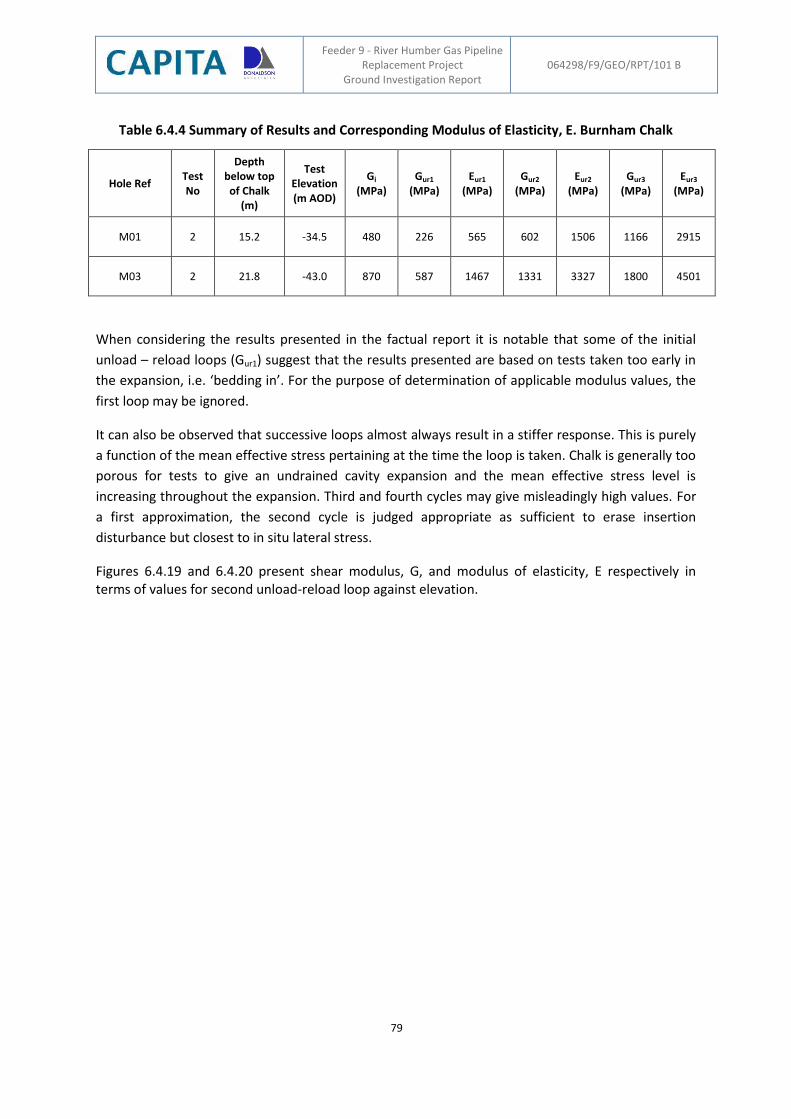
Feeder 9 - River Humber Gas Pipeline Replacement Project
Ground Investigation Report 064298/F9/GEO/RPT/101 B
79
Table 6.4.4 Summary of Results and Corresponding Modulus of Elasticity, E. Burnham Chalk
Hole Ref Test No
Depth below top of Chalk
(m)
Test Elevation (m AOD)
Gi
(MPa) Gur1
(MPa) Eur1
(MPa) Gur2
(MPa) Eur2
(MPa) Gur3
(MPa) Eur3
(MPa)
M01 2 15.2 -34.5 480 226 565 602 1506 1166 2915
M03 2 21.8 -43.0 870 587 1467 1331 3327 1800 4501
When considering the results presented in the factual report it is notable that some of the initial
unload – reload loops (Gur1) suggest that the results presented are based on tests taken too early in
the expansion, i.e. ‘bedding in’. For the purpose of determination of applicable modulus values, the
first loop may be ignored.
It can also be observed that successive loops almost always result in a stiffer response. This is purely
a function of the mean effective stress pertaining at the time the loop is taken. Chalk is generally too
porous for tests to give an undrained cavity expansion and the mean effective stress level is
increasing throughout the expansion. Third and fourth cycles may give misleadingly high values. For
a first approximation, the second cycle is judged appropriate as sufficient to erase insertion
disturbance but closest to in situ lateral stress.
Figures 6.4.19 and 6.4.20 present shear modulus, G, and modulus of elasticity, E respectively in terms of values for second unload-reload loop against elevation.
Feeder 9 - River Humber Gas Pipeline Replacement Project
Ground Investigation Report 064298/F9/GEO/RPT/101 B
80
6.5 Chemical Testing
6.5.1 Soil Chemical Testing
A total of 48 soil samples from the ground investigation have been tested for commonly occurring
Contaminants of Concern (CoC) and those associated with the previous use of the site and
surrounding areas. These and other parameters tested are listed within Tables A, B and C of the
Capita Specification for Ground Investigation Report (2014 c) (not all samples were subject to the full
suite shown).
The vast majority of samples are taken from the land based exploratory holes, though a limited
number of samples have been collected from the bed of the estuary from the marine boreholes.
Samples are representative of topsoil, alluvium/estuarine, glacial and chalk materials. The testing
included total and leachate analyses.
In addition, thirteen waste acceptance criteria (WAC) tests were performed on a variety of strata
including alluvium/estuarine, glacial materials and chalk. Each of the WAC tests has a corresponding
Table A and Table B suite which accommodates the requirements of such reporting tools as
Hazwaste Online.
No testing was scheduled for the Stoneledge Plant and Transport Ltd. property at Paull as no access
was granted to this area.
Assessment Criteria for Human Health The assessment for risks to human health was undertaken in accordance with the Environment
Agency Model Procedures for the Management of Land Contamination CLR 11 (2004). A first stage
approach to risk assessment was adopted comprising a Generic Quantitative Risk Assessment
(GQRA).
The long term health risk to human health from exposure to soil contamination is initially assessed
by comparing results of the soil laboratory analysis against generic assessment criteria (GAC). GACs
comprise either published Soil Guidance Values (SGVs) or are modelled using the CLEA v1.06
software tool. Derived values comply with the EA/DEFRA Contaminated Land Exposure Assessment
(CLEA) Framework documents.
Capita note that currently there is ambiguity associated with the risk assessment approach for lead,
due to the withdrawal of the old Soil Guidance Values and a previously established provisional
tolerable weekly intake (PTWI) lead dose of 25 ug/kg bw (Joint FAO/WHO Expert Committee on Food
Additives (JECFA)). It has therefore been considered appropriate to screen the lead concentrations
against the recently published Category 4 Screening Levels (C4SL) for lead (Residential Housing) of
310 mg/kg.
The depth profile of contaminants of concern for human health risks in soils are subdivided into two
groups, namely shallow soils at depths of less than one metre and deep soils at depths greater than
one metre. Modelled values are based on a scenario of residential housing without gardens, sandy
soil with 1 % soil organic matter for conservatism. Full screening tables are provided in Appendix B.
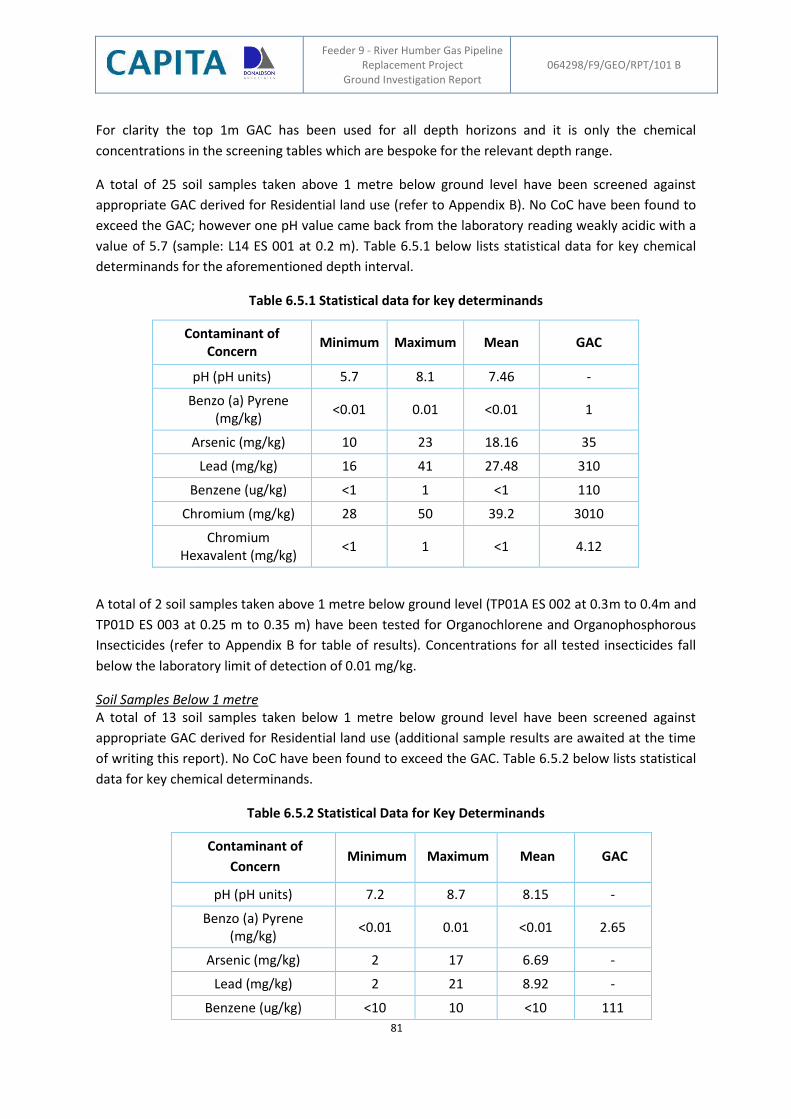
Feeder 9 - River Humber Gas Pipeline Replacement Project
Ground Investigation Report 064298/F9/GEO/RPT/101 B
81
For clarity the top 1m GAC has been used for all depth horizons and it is only the chemical
concentrations in the screening tables which are bespoke for the relevant depth range.
A total of 25 soil samples taken above 1 metre below ground level have been screened against
appropriate GAC derived for Residential land use (refer to Appendix B). No CoC have been found to
exceed the GAC; however one pH value came back from the laboratory reading weakly acidic with a
value of 5.7 (sample: L14 ES 001 at 0.2 m). Table 6.5.1 below lists statistical data for key chemical
determinands for the aforementioned depth interval.
Table 6.5.1 Statistical data for key determinands
Contaminant of Concern
Minimum Maximum Mean GAC
pH (pH units) 5.7 8.1 7.46 -
Benzo (a) Pyrene (mg/kg)
<0.01 0.01 <0.01 1
Arsenic (mg/kg) 10 23 18.16 35
Lead (mg/kg) 16 41 27.48 310
Benzene (ug/kg) <1 1 <1 110
Chromium (mg/kg) 28 50 39.2 3010
Chromium Hexavalent (mg/kg)
<1 1 <1 4.12
A total of 2 soil samples taken above 1 metre below ground level (TP01A ES 002 at 0.3m to 0.4m and
TP01D ES 003 at 0.25 m to 0.35 m) have been tested for Organochlorene and Organophosphorous
Insecticides (refer to Appendix B for table of results). Concentrations for all tested insecticides fall
below the laboratory limit of detection of 0.01 mg/kg.
Soil Samples Below 1 metre A total of 13 soil samples taken below 1 metre below ground level have been screened against
appropriate GAC derived for Residential land use (additional sample results are awaited at the time
of writing this report). No CoC have been found to exceed the GAC. Table 6.5.2 below lists statistical
data for key chemical determinands.
Table 6.5.2 Statistical Data for Key Determinands
Contaminant of
Concern Minimum Maximum Mean GAC
pH (pH units) 7.2 8.7 8.15 -
Benzo (a) Pyrene (mg/kg)
<0.01 0.01 <0.01 2.65
Arsenic (mg/kg) 2 17 6.69 -
Lead (mg/kg) 2 21 8.92 -
Benzene (ug/kg) <10 10 <10 111
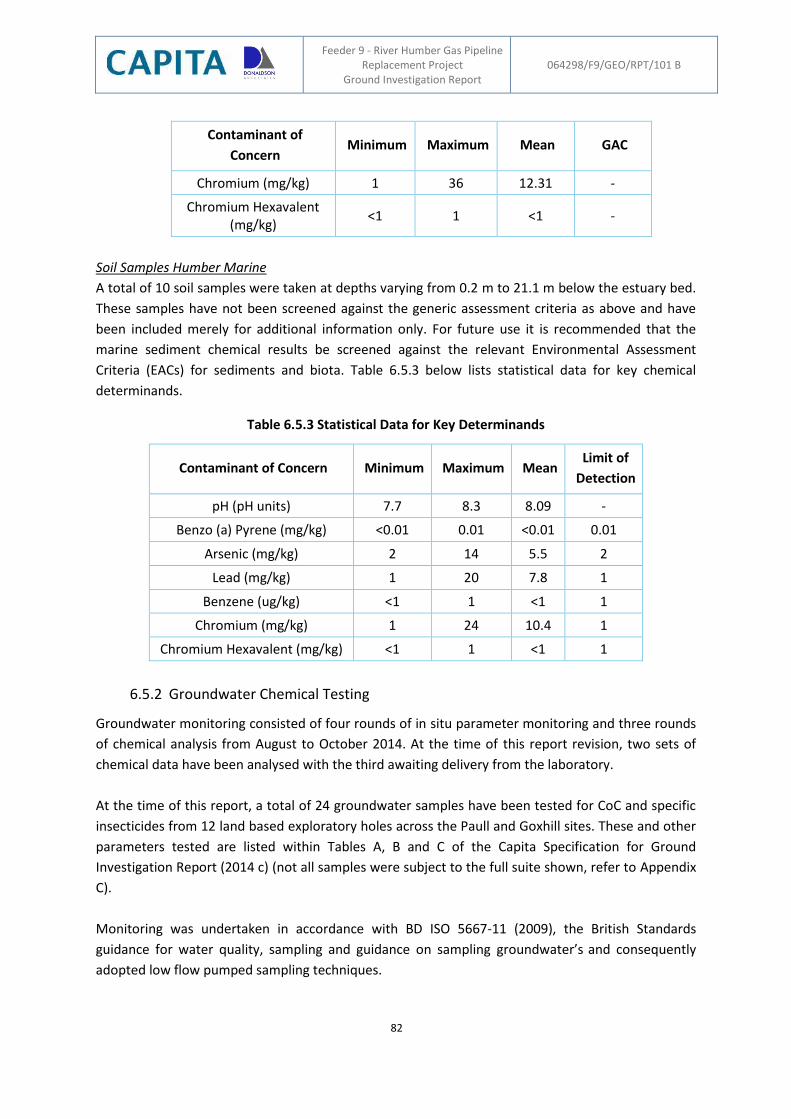
Feeder 9 - River Humber Gas Pipeline Replacement Project
Ground Investigation Report 064298/F9/GEO/RPT/101 B
82
Contaminant of
Concern Minimum Maximum Mean GAC
Chromium (mg/kg) 1 36 12.31 -
Chromium Hexavalent (mg/kg)
<1 1 <1 -
Soil Samples Humber Marine
A total of 10 soil samples were taken at depths varying from 0.2 m to 21.1 m below the estuary bed.
These samples have not been screened against the generic assessment criteria as above and have
been included merely for additional information only. For future use it is recommended that the
marine sediment chemical results be screened against the relevant Environmental Assessment
Criteria (EACs) for sediments and biota. Table 6.5.3 below lists statistical data for key chemical
determinands.
Table 6.5.3 Statistical Data for Key Determinands
Contaminant of Concern Minimum Maximum Mean Limit of
Detection
pH (pH units) 7.7 8.3 8.09 -
Benzo (a) Pyrene (mg/kg) <0.01 0.01 <0.01 0.01
Arsenic (mg/kg) 2 14 5.5 2
Lead (mg/kg) 1 20 7.8 1
Benzene (ug/kg) <1 1 <1 1
Chromium (mg/kg) 1 24 10.4 1
Chromium Hexavalent (mg/kg) <1 1 <1 1
6.5.2 Groundwater Chemical Testing
Groundwater monitoring consisted of four rounds of in situ parameter monitoring and three rounds
of chemical analysis from August to October 2014. At the time of this report revision, two sets of
chemical data have been analysed with the third awaiting delivery from the laboratory.
At the time of this report, a total of 24 groundwater samples have been tested for CoC and specific
insecticides from 12 land based exploratory holes across the Paull and Goxhill sites. These and other
parameters tested are listed within Tables A, B and C of the Capita Specification for Ground
Investigation Report (2014 c) (not all samples were subject to the full suite shown, refer to Appendix
C).
Monitoring was undertaken in accordance with BD ISO 5667-11 (2009), the British Standards
guidance for water quality, sampling and guidance on sampling groundwater’s and consequently
adopted low flow pumped sampling techniques.
Feeder 9 - River Humber Gas Pipeline Replacement Project
Ground Investigation Report 064298/F9/GEO/RPT/101 B
83
In all monitoring rounds water levels were dipped and the base of the well recorded before taking
parameter readings and water samples. Water level results can be found within Section 6.7 of this
report.
Assessment Criteria for Controlled Waters Groundwater laboratory results were screened against current published Controlled Water
Assessment Criteria (CWAC) values, which are the lower of the published EU Environmental Quality
Standards (EQS) within the Water Framework Directive (WFD) or the EU Drinking Water Standards
(DWS) for conservatism.
The groundwater results are described below in terms of the principal chemical constituents and
particular attention is made where these exceed the adopted CWACs.
Field Index Parameters The in situ index parameters were collected on all 4 monitoring visits (refer to Appendix C for data
table). During the first and second rounds, pH readings were fluctuating between high alkalinity and
moderately acidic not anticipated for this site setting. On return of the probe to the manufacturer
the pH element of the sonde was found to be faulty and was replaced. Therefore only field pH
readings for the third and fourth rounds have been included within this report. Stabilisation of the
chemistry of the pumped samples in all rounds was monitored using the dissolved oxygen,
temperature, conductivity and oxygen requirement potential sub probes with stabilisation of these
parameters achieved prior to collecting water samples on all occasions.
Results indicate that the waters are of near neutral pH status with an average of 7.28. All pH results
for rounds 3 and 4 fell between 6.90 and 7.55. The field conductivity varied largely between
locations and depth of well with the maximum concentrations being recorded at L04/117 (4.262
ms/cm) and the minimum concentration being recorded at L01, L14/2, L15/2 and L15/1 (0.0013
ms/cm). Throughout the 4 rounds of field data collection, well locations L04 and L06 appear to show
the highest conductivity levels indicating the likely presence of saline to brackish water, with the
further inland wells L01, L02 and L15 showing the lowest conductivity levels indicating a presence of
fresh water/near fresh. This is further endorsed by low levels of chloride and sodium within L01 and
L02 as described below.
Field dissolved oxygen readings were taken for each well location in each of over the 4 monitoring
rounds. Results provide a mean dissolved oxygen level for the Goxhill site of 0.84 mg/l (7 %
saturation using an average temperature of 11.07 oC) and the Paull site provided a level of 1.25 mg/l
(12 % saturation using an average temperature of 11.03 oC). All levels within the groundwater are
considered low when compared to the UK Freshwater Fish Directive (FFD) with a standard of 50 % >
/= 7 mg/l. The FFD screening standard has been used for the event of dewatering aquifers to nearby
streams and ditches.
17 In line with the ground investigation factual report, where dual installations, the deepest installation has a “/1” notation
added to the borehole reference i.e. L01/1 and the upper installation “/2” or L01/2. For L18, where there are 3
installations a “/3”notation is added to the borehole reference for the shallowest installation.
Feeder 9 - River Humber Gas Pipeline Replacement Project
Ground Investigation Report 064298/F9/GEO/RPT/101 B
84
Groundwater Quality A total of 24 groundwater samples were tested for inorganic parameters. Sulphate was found to be
elevated relative to the adopted screening value on 9 occasions at borehole locations L06/2 (1600
mg/l), L08 (1700 mg/l and 1600 mg/l), L14/2 (490 mg/l and 520 mg/l), L14/1 (550 mg/l and 360 mg/l)
and L18 (270 mg/l). The concentrations of sulphate in L06/2 and L08 were the most elevated as
compared with the remaining wells.
Chloride concentrations were elevated above the DWS of 250 mg/l within all borehole locations
except L01, with a maximum concentration of 12000 mg/l within borehole L06/2. The pattern of
chloride concentrations at the Goxhill sub site for the chalk is one of decreasing chloride content as
you move inland from the estuary, for example L04/1 has a 3300 mg/l chloride content whereas as
L01/1 has 56 mg/l. There is no such pattern at Paull in the chalk where the levels are all in the
brackish range of 1400 mg/l to 2000 mg/l. The shallow (ie superficial) wells at each site show higher
chloride concentrations than its deep well counterpart.
Elevated levels of sodium were recorded within all borehole locations apart from L01. This supports
the fresher status of the chalk waters at L01 as found in the chloride test results. A maximum
concentration of 5600 mg/l was recorded within L06/2 considerably higher than the DWS screening
value of 200 mg/l.
Elevated concentrations of ammonia as NH4 were ubiquitous across each site. The maximum
exceedance value was almost 70 times GWAC of 33 mg/l in L04/2 and L06/2, which are both located
at Goxhill. This screening uses the screening criteria of 0.5 mg/l total ammonia as ammoniacal
nitrogen screening criteria for freshwater lakes (listed in the WFD).
The mean pH for the 24 groundwater samples was 7.79 which correspond with the field index
parameters mean over Round 3 and 4 of 7.28. All laboratory tested pH values fell between 7.00 and
8.00.
Nitrate concentrations within the data set all fell below the laboratory limit of detection of 0.5 mg/l,
and considerably below the GWAC of 50 mg/l. All nitrite concentrations fell below the laboratory
limit of detection of 0.1 mg/l apart from a single reading (0.4 mg/l in L18) and again considerably
below the GWAC of 50 mg/l.
Elevated levels of arsenic were found on 12 occasions within borehole locations L01 (11 mg/l), L04/2
(64 ug/l and 66 ug/l), L04/1 (24 ug/l), L06/1 (95 ug/l and 110 ug/l), L06/2 (43 ug/l and 29 ug/l), L08
(11 ug/l), L14/2 (11 ug/l), L14/1 (13 ug/l). As L01, L08, L14/2 and L14/1 only marginally exceed the
EQS screening value of 10 ug/l.
Boron was recorded marginally above the EQS screening value of 1 ug/l on 6 occasions with a
maximum concentration of 3.7 ug/l within L04/2 and a mean concentration of 0.79 ug/l across the
data set.
Elevated levels of nickel were found on 6 occasions within borehole locations L06/2 (20 ug/l and 21
ug/l), L06/1 (240 ug/l and 210 ug/l) and L08 (25 ug/l and 29 ug/l). L06/2 levels marginally exceeded
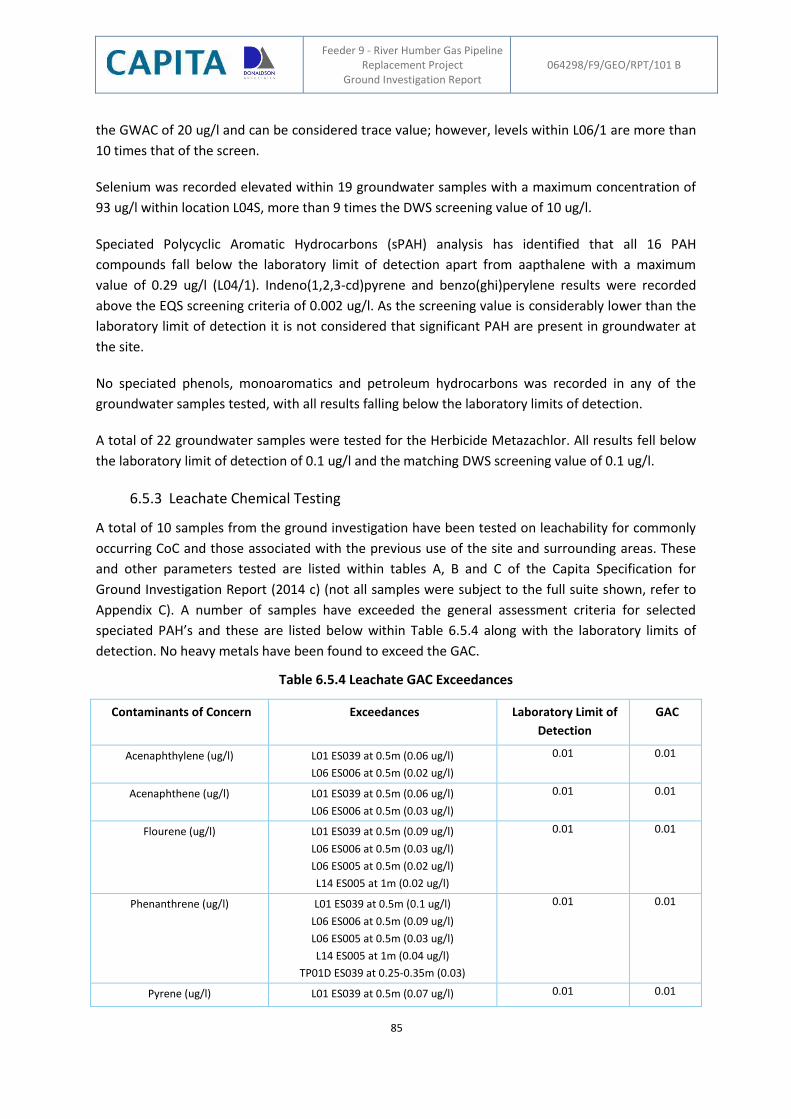
Feeder 9 - River Humber Gas Pipeline Replacement Project
Ground Investigation Report 064298/F9/GEO/RPT/101 B
85
the GWAC of 20 ug/l and can be considered trace value; however, levels within L06/1 are more than
10 times that of the screen.
Selenium was recorded elevated within 19 groundwater samples with a maximum concentration of
93 ug/l within location L04S, more than 9 times the DWS screening value of 10 ug/l.
Speciated Polycyclic Aromatic Hydrocarbons (sPAH) analysis has identified that all 16 PAH
compounds fall below the laboratory limit of detection apart from aapthalene with a maximum
value of 0.29 ug/l (L04/1). Indeno(1,2,3-cd)pyrene and benzo(ghi)perylene results were recorded
above the EQS screening criteria of 0.002 ug/l. As the screening value is considerably lower than the
laboratory limit of detection it is not considered that significant PAH are present in groundwater at
the site.
No speciated phenols, monoaromatics and petroleum hydrocarbons was recorded in any of the
groundwater samples tested, with all results falling below the laboratory limits of detection.
A total of 22 groundwater samples were tested for the Herbicide Metazachlor. All results fell below
the laboratory limit of detection of 0.1 ug/l and the matching DWS screening value of 0.1 ug/l.
6.5.3 Leachate Chemical Testing
A total of 10 samples from the ground investigation have been tested on leachability for commonly
occurring CoC and those associated with the previous use of the site and surrounding areas. These
and other parameters tested are listed within tables A, B and C of the Capita Specification for
Ground Investigation Report (2014 c) (not all samples were subject to the full suite shown, refer to
Appendix C). A number of samples have exceeded the general assessment criteria for selected
speciated PAH’s and these are listed below within Table 6.5.4 along with the laboratory limits of
detection. No heavy metals have been found to exceed the GAC.
Table 6.5.4 Leachate GAC Exceedances
Contaminants of Concern Exceedances Laboratory Limit of
Detection
GAC
Acenaphthylene (ug/l) L01 ES039 at 0.5m (0.06 ug/l)
L06 ES006 at 0.5m (0.02 ug/l)
0.01 0.01
Acenaphthene (ug/l) L01 ES039 at 0.5m (0.06 ug/l)
L06 ES006 at 0.5m (0.03 ug/l)
0.01 0.01
Flourene (ug/l) L01 ES039 at 0.5m (0.09 ug/l)
L06 ES006 at 0.5m (0.03 ug/l)
L06 ES005 at 0.5m (0.02 ug/l)
L14 ES005 at 1m (0.02 ug/l)
0.01 0.01
Phenanthrene (ug/l) L01 ES039 at 0.5m (0.1 ug/l)
L06 ES006 at 0.5m (0.09 ug/l)
L06 ES005 at 0.5m (0.03 ug/l)
L14 ES005 at 1m (0.04 ug/l)
TP01D ES039 at 0.25-0.35m (0.03)
0.01 0.01
Pyrene (ug/l) L01 ES039 at 0.5m (0.07 ug/l) 0.01 0.01
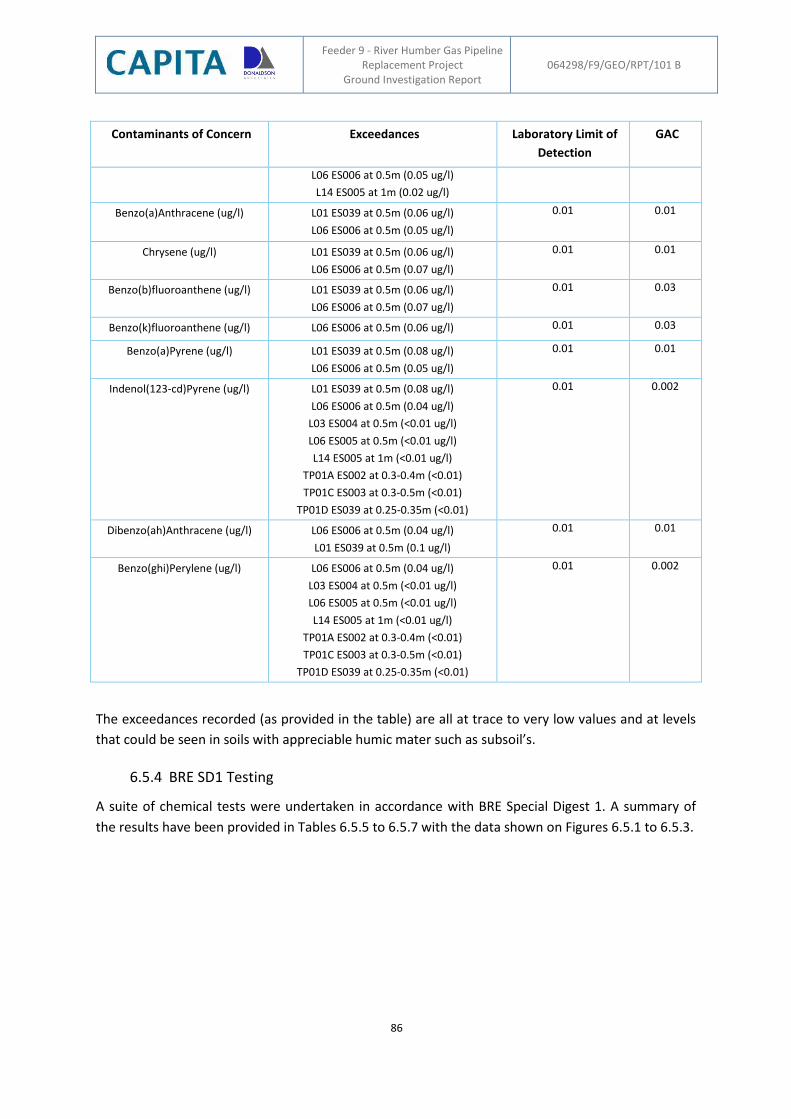
Feeder 9 - River Humber Gas Pipeline Replacement Project
Ground Investigation Report 064298/F9/GEO/RPT/101 B
86
Contaminants of Concern Exceedances Laboratory Limit of
Detection
GAC
L06 ES006 at 0.5m (0.05 ug/l)
L14 ES005 at 1m (0.02 ug/l)
Benzo(a)Anthracene (ug/l) L01 ES039 at 0.5m (0.06 ug/l)
L06 ES006 at 0.5m (0.05 ug/l)
0.01 0.01
Chrysene (ug/l) L01 ES039 at 0.5m (0.06 ug/l)
L06 ES006 at 0.5m (0.07 ug/l)
0.01 0.01
Benzo(b)fluoroanthene (ug/l) L01 ES039 at 0.5m (0.06 ug/l)
L06 ES006 at 0.5m (0.07 ug/l)
0.01 0.03
Benzo(k)fluoroanthene (ug/l) L06 ES006 at 0.5m (0.06 ug/l) 0.01 0.03
Benzo(a)Pyrene (ug/l) L01 ES039 at 0.5m (0.08 ug/l)
L06 ES006 at 0.5m (0.05 ug/l)
0.01 0.01
Indenol(123-cd)Pyrene (ug/l) L01 ES039 at 0.5m (0.08 ug/l)
L06 ES006 at 0.5m (0.04 ug/l)
L03 ES004 at 0.5m (<0.01 ug/l)
L06 ES005 at 0.5m (<0.01 ug/l)
L14 ES005 at 1m (<0.01 ug/l)
TP01A ES002 at 0.3-0.4m (<0.01)
TP01C ES003 at 0.3-0.5m (<0.01)
TP01D ES039 at 0.25-0.35m (<0.01)
0.01 0.002
Dibenzo(ah)Anthracene (ug/l) L06 ES006 at 0.5m (0.04 ug/l)
L01 ES039 at 0.5m (0.1 ug/l)
0.01 0.01
Benzo(ghi)Perylene (ug/l) L06 ES006 at 0.5m (0.04 ug/l)
L03 ES004 at 0.5m (<0.01 ug/l)
L06 ES005 at 0.5m (<0.01 ug/l)
L14 ES005 at 1m (<0.01 ug/l)
TP01A ES002 at 0.3-0.4m (<0.01)
TP01C ES003 at 0.3-0.5m (<0.01)
TP01D ES039 at 0.25-0.35m (<0.01)
0.01 0.002
The exceedances recorded (as provided in the table) are all at trace to very low values and at levels
that could be seen in soils with appreciable humic mater such as subsoil’s.
6.5.4 BRE SD1 Testing
A suite of chemical tests were undertaken in accordance with BRE Special Digest 1. A summary of
the results have been provided in Tables 6.5.5 to 6.5.7 with the data shown on Figures 6.5.1 to 6.5.3.
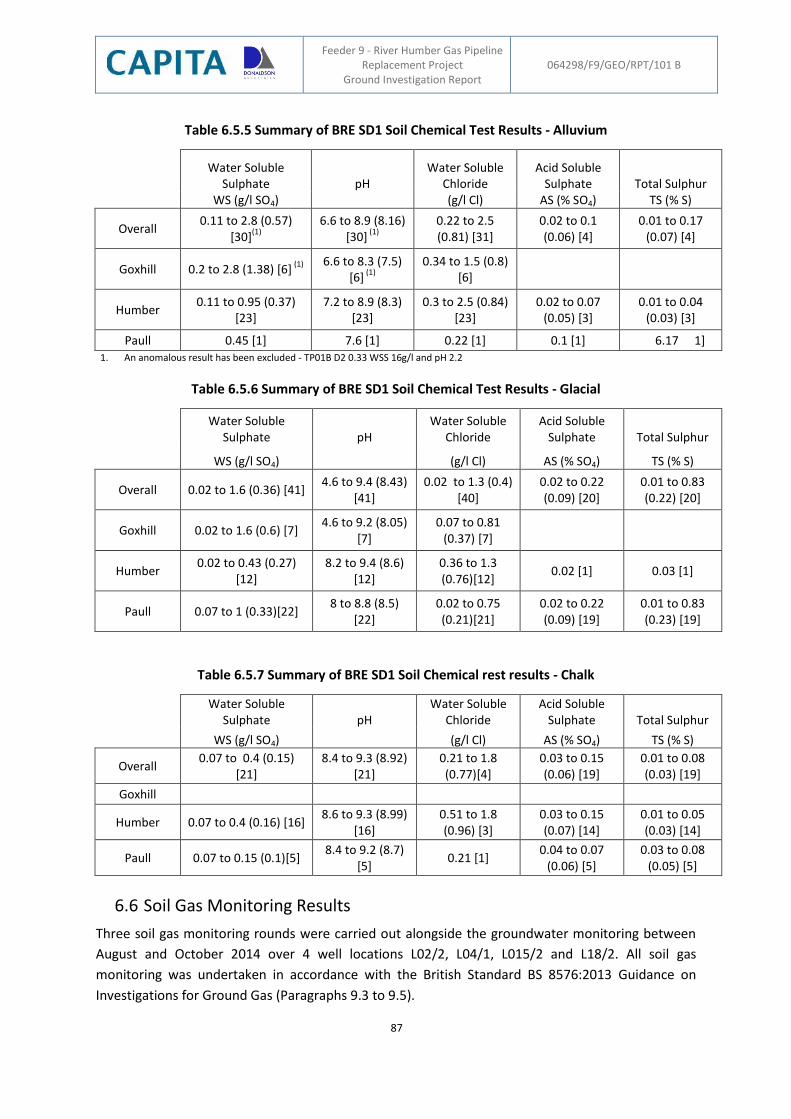
Feeder 9 - River Humber Gas Pipeline Replacement Project
Ground Investigation Report 064298/F9/GEO/RPT/101 B
87
Table 6.5.5 Summary of BRE SD1 Soil Chemical Test Results - Alluvium
Water Soluble Sulphate pH
Water Soluble Chloride
Acid Soluble Sulphate Total Sulphur
WS (g/l SO4) (g/l Cl) AS (% SO4) TS (% S)
Overall 0.11 to 2.8 (0.57)
[30](1)
6.6 to 8.9 (8.16)
[30] (1)
0.22 to 2.5 (0.81) [31]
0.02 to 0.1 (0.06) [4]
0.01 to 0.17 (0.07) [4]
Goxhill 0.2 to 2.8 (1.38) [6] (1)
6.6 to 8.3 (7.5)
[6] (1)
0.34 to 1.5 (0.8)
[6]
Humber 0.11 to 0.95 (0.37)
[23] 7.2 to 8.9 (8.3)
[23] 0.3 to 2.5 (0.84)
[23] 0.02 to 0.07
(0.05) [3] 0.01 to 0.04
(0.03) [3]
Paull 0.45 [1] 7.6 [1] 0.22 [1] 0.1 [1] 6.17 1] 1. An anomalous result has been excluded - TP01B D2 0.33 WSS 16g/l and pH 2.2
Table 6.5.6 Summary of BRE SD1 Soil Chemical Test Results - Glacial
Water Soluble Sulphate pH
Water Soluble Chloride
Acid Soluble Sulphate Total Sulphur
WS (g/l SO4) (g/l Cl) AS (% SO4) TS (% S)
Overall 0.02 to 1.6 (0.36) [41] 4.6 to 9.4 (8.43)
[41] 0.02 to 1.3 (0.4)
[40] 0.02 to 0.22 (0.09) [20]
0.01 to 0.83 (0.22) [20]
Goxhill 0.02 to 1.6 (0.6) [7] 4.6 to 9.2 (8.05)
[7] 0.07 to 0.81
(0.37) [7]
Humber 0.02 to 0.43 (0.27)
[12] 8.2 to 9.4 (8.6)
[12] 0.36 to 1.3 (0.76)[12]
0.02 [1] 0.03 [1]
Paull 0.07 to 1 (0.33)[22] 8 to 8.8 (8.5)
[22] 0.02 to 0.75 (0.21)[21]
0.02 to 0.22 (0.09) [19]
0.01 to 0.83 (0.23) [19]
Table 6.5.7 Summary of BRE SD1 Soil Chemical rest results - Chalk
Water Soluble Sulphate pH
Water Soluble Chloride
Acid Soluble Sulphate Total Sulphur
WS (g/l SO4) (g/l Cl) AS (% SO4) TS (% S)
Overall 0.07 to 0.4 (0.15)
[21] 8.4 to 9.3 (8.92)
[21] 0.21 to 1.8 (0.77)[4]
0.03 to 0.15 (0.06) [19]
0.01 to 0.08 (0.03) [19]
Goxhill
Humber 0.07 to 0.4 (0.16) [16] 8.6 to 9.3 (8.99)
[16] 0.51 to 1.8 (0.96) [3]
0.03 to 0.15 (0.07) [14]
0.01 to 0.05 (0.03) [14]
Paull 0.07 to 0.15 (0.1)[5] 8.4 to 9.2 (8.7)
[5] 0.21 [1]
0.04 to 0.07 (0.06) [5]
0.03 to 0.08 (0.05) [5]
6.6 Soil Gas Monitoring Results
Three soil gas monitoring rounds were carried out alongside the groundwater monitoring between
August and October 2014 over 4 well locations L02/2, L04/1, L015/2 and L18/2. All soil gas
monitoring was undertaken in accordance with the British Standard BS 8576:2013 Guidance on
Investigations for Ground Gas (Paragraphs 9.3 to 9.5).
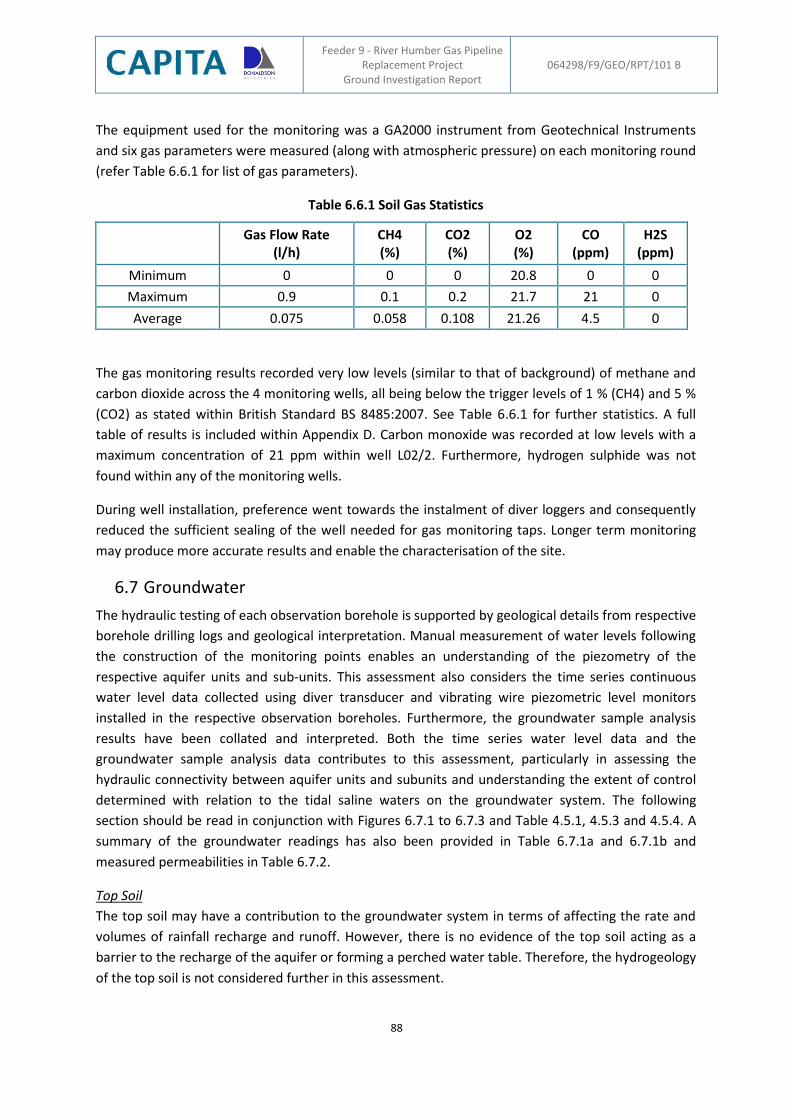
Feeder 9 - River Humber Gas Pipeline Replacement Project
Ground Investigation Report 064298/F9/GEO/RPT/101 B
88
The equipment used for the monitoring was a GA2000 instrument from Geotechnical Instruments
and six gas parameters were measured (along with atmospheric pressure) on each monitoring round
(refer Table 6.6.1 for list of gas parameters).
Table 6.6.1 Soil Gas Statistics
Gas Flow Rate (l/h)
CH4 (%)
CO2 (%)
O2 (%)
CO (ppm)
H2S (ppm)
Minimum 0 0 0 20.8 0 0
Maximum 0.9 0.1 0.2 21.7 21 0
Average 0.075 0.058 0.108 21.26 4.5 0
The gas monitoring results recorded very low levels (similar to that of background) of methane and
carbon dioxide across the 4 monitoring wells, all being below the trigger levels of 1 % (CH4) and 5 %
(CO2) as stated within British Standard BS 8485:2007. See Table 6.6.1 for further statistics. A full
table of results is included within Appendix D. Carbon monoxide was recorded at low levels with a
maximum concentration of 21 ppm within well L02/2. Furthermore, hydrogen sulphide was not
found within any of the monitoring wells.
During well installation, preference went towards the instalment of diver loggers and consequently
reduced the sufficient sealing of the well needed for gas monitoring taps. Longer term monitoring
may produce more accurate results and enable the characterisation of the site.
6.7 Groundwater
The hydraulic testing of each observation borehole is supported by geological details from respective
borehole drilling logs and geological interpretation. Manual measurement of water levels following
the construction of the monitoring points enables an understanding of the piezometry of the
respective aquifer units and sub-units. This assessment also considers the time series continuous
water level data collected using diver transducer and vibrating wire piezometric level monitors
installed in the respective observation boreholes. Furthermore, the groundwater sample analysis
results have been collated and interpreted. Both the time series water level data and the
groundwater sample analysis data contributes to this assessment, particularly in assessing the
hydraulic connectivity between aquifer units and subunits and understanding the extent of control
determined with relation to the tidal saline waters on the groundwater system. The following
section should be read in conjunction with Figures 6.7.1 to 6.7.3 and Table 4.5.1, 4.5.3 and 4.5.4. A
summary of the groundwater readings has also been provided in Table 6.7.1a and 6.7.1b and
measured permeabilities in Table 6.7.2.
Top Soil
The top soil may have a contribution to the groundwater system in terms of affecting the rate and
volumes of rainfall recharge and runoff. However, there is no evidence of the top soil acting as a
barrier to the recharge of the aquifer or forming a perched water table. Therefore, the hydrogeology
of the top soil is not considered further in this assessment.
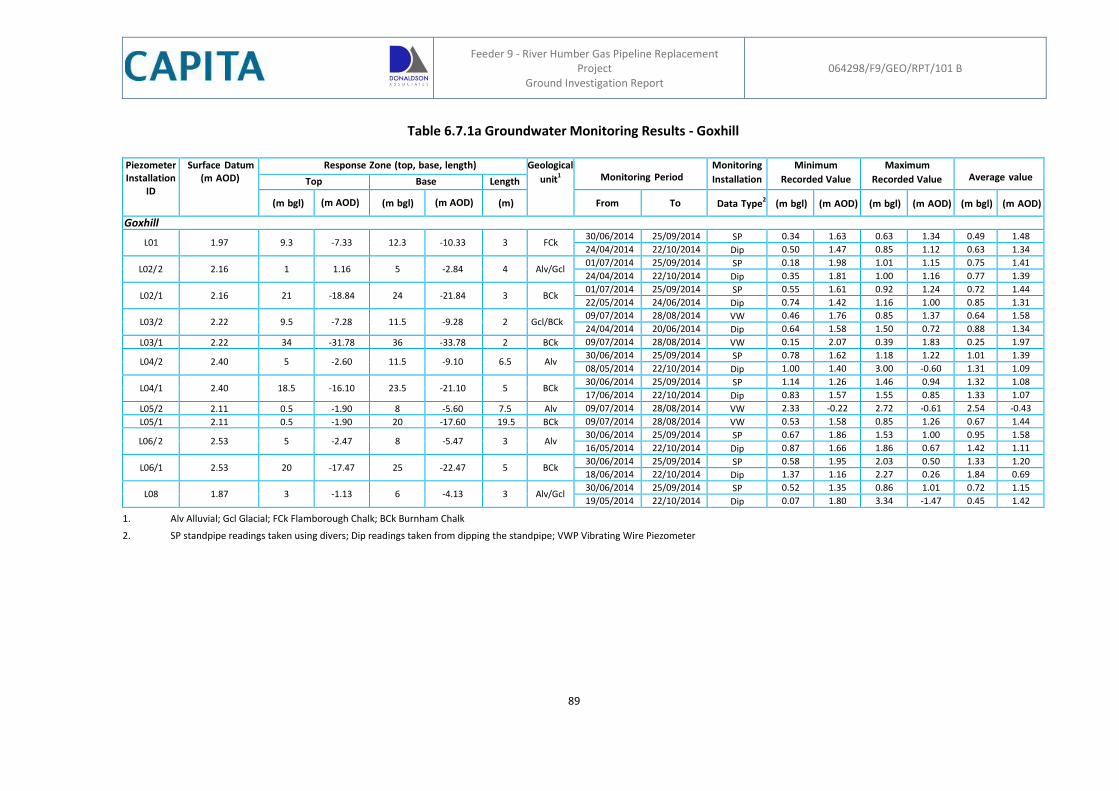
Feeder 9 - River Humber Gas Pipeline Replacement
Project Ground Investigation Report
064298/F9/GEO/RPT/101 B
89
Table 6.7.1a Groundwater Monitoring Results - Goxhill Piezometer Installation
ID
Surface Datum (m AOD)
Response Zone (top, base, length) Geological
unit1
Monitoring Period
Monitoring
Installation
Minimum
Recorded Value
Maximum
Recorded Value
Average value Top Base Length
(m bgl) (m AOD) (m bgl) (m AOD) (m) From To
Data Type2
(m bgl) (m AOD)
(m bgl)
(m AOD)
(m bgl)
(m AOD)
Goxhill
L01 1.97 9.3 -7.33 12.3 -10.33 3 FCk 30/06/2014 25/09/2014 SP 0.34 1.63 0.63 1.34 0.49 1.48
24/04/2014 22/10/2014 Dip 0.50 1.47 0.85 1.12 0.63 1.34
L02/2 2.16 1 1.16 5 -2.84 4 Alv/Gcl 01/07/2014 25/09/2014 SP 0.18 1.98 1.01 1.15 0.75 1.41
24/04/2014 22/10/2014 Dip 0.35 1.81 1.00 1.16 0.77 1.39
L02/1 2.16 21 -18.84 24 -21.84 3 BCk 01/07/2014 25/09/2014 SP 0.55 1.61 0.92 1.24 0.72 1.44
22/05/2014 24/06/2014 Dip 0.74 1.42 1.16 1.00 0.85 1.31
L03/2 2.22 9.5 -7.28 11.5 -9.28 2 Gcl/BCk 09/07/2014 28/08/2014 VW 0.46 1.76 0.85 1.37 0.64 1.58
24/04/2014 20/06/2014 Dip 0.64 1.58 1.50 0.72 0.88 1.34
L03/1 2.22 34 -31.78 36 -33.78 2 BCk 09/07/2014 28/08/2014 VW 0.15 2.07 0.39 1.83 0.25 1.97
L04/2 2.40 5 -2.60 11.5 -9.10 6.5 Alv 30/06/2014 25/09/2014 SP 0.78 1.62 1.18 1.22 1.01 1.39
08/05/2014 22/10/2014 Dip 1.00 1.40 3.00 -0.60 1.31 1.09
L04/1 2.40 18.5 -16.10 23.5 -21.10 5 BCk 30/06/2014 25/09/2014 SP 1.14 1.26 1.46 0.94 1.32 1.08
17/06/2014 22/10/2014 Dip 0.83 1.57 1.55 0.85 1.33 1.07
L05/2 2.11 0.5 -1.90 8 -5.60 7.5 Alv 09/07/2014 28/08/2014 VW 2.33 -0.22 2.72 -0.61 2.54 -0.43
L05/1 2.11 0.5 -1.90 20 -17.60 19.5 BCk 09/07/2014 28/08/2014 VW 0.53 1.58 0.85 1.26 0.67 1.44
L06/2 2.53 5 -2.47 8 -5.47 3 Alv 30/06/2014 25/09/2014 SP 0.67 1.86 1.53 1.00 0.95 1.58
16/05/2014 22/10/2014 Dip 0.87 1.66 1.86 0.67 1.42 1.11
L06/1 2.53 20 -17.47 25 -22.47 5 BCk 30/06/2014 25/09/2014 SP 0.58 1.95 2.03 0.50 1.33 1.20
18/06/2014 22/10/2014 Dip 1.37 1.16 2.27 0.26 1.84 0.69
L08 1.87 3 -1.13 6 -4.13 3 Alv/Gcl 30/06/2014 25/09/2014 SP 0.52 1.35 0.86 1.01 0.72 1.15
19/05/2014 22/10/2014 Dip 0.07 1.80 3.34 -1.47 0.45 1.42
1. Alv Alluvial; Gcl Glacial; FCk Flamborough Chalk; BCk Burnham Chalk
2. SP standpipe readings taken using divers; Dip readings taken from dipping the standpipe; VWP Vibrating Wire Piezometer
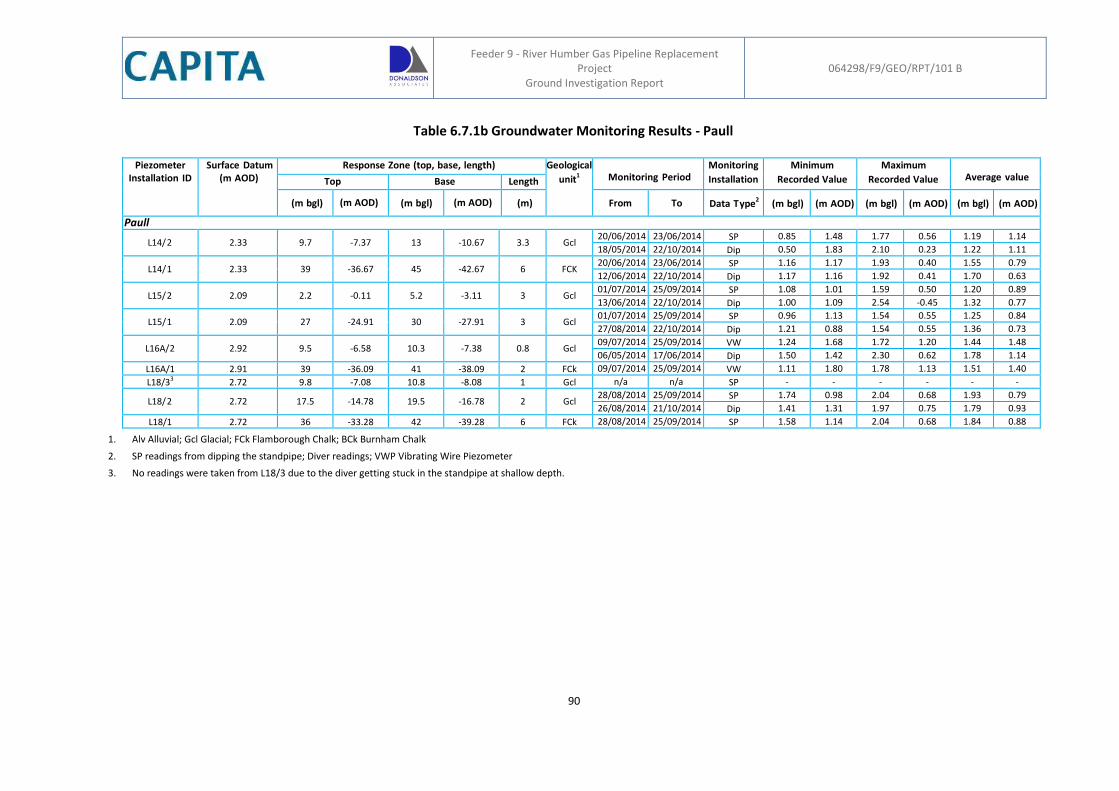
Feeder 9 - River Humber Gas Pipeline Replacement
Project Ground Investigation Report
064298/F9/GEO/RPT/101 B
90
Table 6.7.1b Groundwater Monitoring Results - Paull
Piezometer Installation ID
Surface Datum (m AOD)
Response Zone (top, base, length) Geological
unit1
Monitoring Period
Monitoring
Installation
Minimum
Recorded Value
Maximum
Recorded Value
Average value Top Base Length
(m bgl) (m AOD) (m bgl) (m AOD) (m) From To
Data Type2
(m bgl) (m AOD)
(m bgl)
(m AOD)
(m bgl)
(m AOD)
Paull
L14/2 2.33 9.7 -7.37 13 -10.67 3.3 Gcl 20/06/2014 23/06/2014 SP 0.85 1.48 1.77 0.56 1.19 1.14
18/05/2014 22/10/2014 Dip 0.50 1.83 2.10 0.23 1.22 1.11
L14/1 2.33 39 -36.67 45 -42.67 6 FCK 20/06/2014 23/06/2014 SP 1.16 1.17 1.93 0.40 1.55 0.79
12/06/2014 22/10/2014 Dip 1.17 1.16 1.92 0.41 1.70 0.63
L15/2 2.09 2.2 -0.11 5.2 -3.11 3 Gcl 01/07/2014 25/09/2014 SP 1.08 1.01 1.59 0.50 1.20 0.89
13/06/2014 22/10/2014 Dip 1.00 1.09 2.54 -0.45 1.32 0.77
L15/1 2.09 27 -24.91 30 -27.91 3 Gcl 01/07/2014 25/09/2014 SP 0.96 1.13 1.54 0.55 1.25 0.84
27/08/2014 22/10/2014 Dip 1.21 0.88 1.54 0.55 1.36 0.73
L16A/2 2.92 9.5 -6.58 10.3 -7.38 0.8 Gcl 09/07/2014 25/09/2014 VW 1.24 1.68 1.72 1.20 1.44 1.48
06/05/2014 17/06/2014 Dip 1.50 1.42 2.30 0.62 1.78 1.14
L16A/1 2.91 39 -36.09 41 -38.09 2 FCk 09/07/2014 25/09/2014 VW 1.11 1.80 1.78 1.13 1.51 1.40
L18/33 2.72 9.8 -7.08 10.8 -8.08 1 Gcl n/a n/a SP - - - - - -
L18/2 2.72 17.5 -14.78 19.5 -16.78 2 Gcl 28/08/2014 25/09/2014 SP 1.74 0.98 2.04 0.68 1.93 0.79
26/08/2014 21/10/2014 Dip 1.41 1.31 1.97 0.75 1.79 0.93
L18/1 2.72 36 -33.28 42 -39.28 6 FCk 28/08/2014 25/09/2014 SP 1.58 1.14 2.04 0.68 1.84 0.88
1. Alv Alluvial; Gcl Glacial; FCk Flamborough Chalk; BCk Burnham Chalk
2. SP readings from dipping the standpipe; Diver readings; VWP Vibrating Wire Piezometer
3. No readings were taken from L18/3 due to the diver getting stuck in the standpipe at shallow depth.
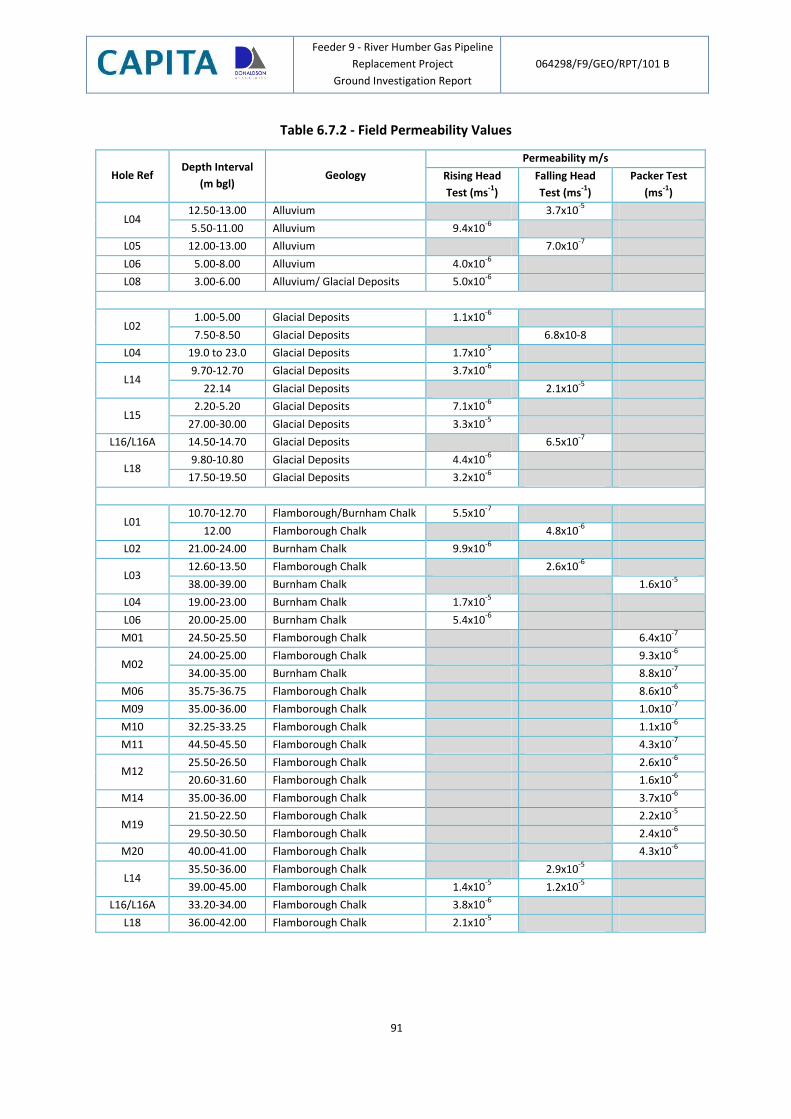
Feeder 9 - River Humber Gas Pipeline
Replacement Project
Ground Investigation Report
064298/F9/GEO/RPT/101 B
91
Table 6.7.2 - Field Permeability Values
Hole Ref Depth Interval
(m bgl) Geology
Permeability m/s
Rising Head
Test (ms-1
)
Falling Head
Test (ms-1
)
Packer Test
(ms-1
)
L04 12.50-13.00 Alluvium 3.7x10
-5
5.50-11.00 Alluvium 9.4x10⁻⁶
L05 12.00-13.00 Alluvium 7.0x10⁻⁷
L06 5.00-8.00 Alluvium 4.0x10⁻⁶
L08 3.00-6.00 Alluvium/ Glacial Deposits 5.0x10⁻⁶
L02 1.00-5.00 Glacial Deposits 1.1x10
-6
7.50-8.50 Glacial Deposits 6.8x10⁻⁸
L04 19.0 to 23.0 Glacial Deposits 1.7x10⁻⁵
L14 9.70-12.70 Glacial Deposits 3.7x10
-6
22.14 Glacial Deposits 2.1x10⁻⁵
L15 2.20-5.20 Glacial Deposits 7.1x10
-6
27.00-30.00 Glacial Deposits 3.3x10⁻⁵
L16/L16A 14.50-14.70 Glacial Deposits 6.5x10⁻⁷
L18 9.80-10.80 Glacial Deposits 4.4x10
-6
17.50-19.50 Glacial Deposits 3.2x10⁻⁶
L01 10.70-12.70 Flamborough/Burnham Chalk 5.5x10
-7
12.00 Flamborough Chalk 4.8x10⁻⁶
L02 21.00-24.00 Burnham Chalk 9.9x10⁻⁶
L03 12.60-13.50 Flamborough Chalk 2.6x10
-6
38.00-39.00 Burnham Chalk 1.6x10⁻⁵
L04 19.00-23.00 Burnham Chalk 1.7x10⁻⁵
L06 20.00-25.00 Burnham Chalk 5.4x10⁻⁶
M01 24.50-25.50 Flamborough Chalk 6.4x10⁻⁷
M02 24.00-25.00 Flamborough Chalk 9.3x10
-6
34.00-35.00 Burnham Chalk 8.8x10⁻⁷
M06 35.75-36.75 Flamborough Chalk 8.6x10⁻⁶
M09 35.00-36.00 Flamborough Chalk 1.0x10⁻⁷
M10 32.25-33.25 Flamborough Chalk 1.1x10⁻⁶
M11 44.50-45.50 Flamborough Chalk 4.3x10⁻⁷
M12 25.50-26.50 Flamborough Chalk 2.6x10
-6
20.60-31.60 Flamborough Chalk 1.6x10⁻⁶
M14 35.00-36.00 Flamborough Chalk 3.7x10⁻⁶
M19 21.50-22.50 Flamborough Chalk 2.2x10
-5
29.50-30.50 Flamborough Chalk 2.4x10⁻⁶
M20 40.00-41.00 Flamborough Chalk 4.3x10⁻⁶
L14 35.50-36.00 Flamborough Chalk 2.9x10
-5
39.00-45.00 Flamborough Chalk 1.4x10⁻⁵
1.2x10⁻⁵
L16/L16A 33.20-34.00 Flamborough Chalk 3.8x10⁻⁶
L18 36.00-42.00 Flamborough Chalk 2.1x10⁻⁵
Feeder 9 - River Humber Gas Pipeline
Replacement Project
Ground Investigation Report
064298/F9/GEO/RPT/101 B
92
Marine and Estuarine Alluvium
Three groundwater monitoring points were installed in the alluvium at Goxhill referenced L04, L05
and L06. Groundwater piezometry measured in L04 and L06 from 08 May 2014 to 22 October 2014
found the piezometric levels ranging from 0.78 m bgl to 3.00 m bgl in L04 and from 0.67 m bgl to
1.86 m bgl in L06.
Variable (rising and falling) head tests were successfully undertaken in L04, L05, L06 and L08 with the
resultant data analysed to determine the permeability values. These are found to range between
7.0x10⁻⁷ ms-1 to 3.7x10⁻⁵ ms-1. Other hydraulic tests in the standpipes installed in the alluvium did not
yield meaningful results. The large range in permeability values determined for the alluvium reflects
the highly variable lithology, grain size, lateral continuity and hydraulic connectivity of these
deposits. The permeability of horizons with less clay and silts tend to be larger whereas clay and silt
dominated horizons tend to have lower permeability. The lateral extent and continuity of the more
permeable layers is unknown, and therefore the transmissivity of each layer has not been quantified.
It is observed that the water level measurements taken on 11 June 2014 show a similar piezometric
surface in L06 as observed in the glacial deposits in L02. However, in subsequent measurements in
June 2014, the water level in the alluvium was up to 0.3 m above that of the glacial deposits at the
Goxhill site. This infers that there is a degree of vertical and less so lateral hydraulic connectivity
between the alluvium and the glacial deposits in the Goxhill area. At this location it was observed
that L05 had a perched piezometric surface approximately 1 m below nearby locations L04 and L06.
This is understood to be a result of the marine and estuarine alluvium directly above the chalk
without a separation layer of glacial till as observed in L04 and L05. Furthermore, this infers a greater
degree of vertical connectivity between the alluvium and the chalk.
The continuous piezometric level data from the piezometers installed in the alluvium at Goxhill
confirm an observable diurnal tidal response in this area. This is particularly the case in L06, where
the tidal range in the groundwater level is up to approximately 1.3 m. The hydraulic influence of the
tide in L04 is less, with a tidal range in the order of 0.1m, inferring a pronounced tidal influence in
L06 with less of a tidal range than L04.
There is hydraulic inter-connectivity between the alluvium and glacial deposits at the Goxhill site,
with the continuous piezometric data showing a similar pattern between monitoring points in the
alluvium – L04 and L06 – and monitoring in the glacial deposits – L02 and L08. The piezometric levels
in the alluvium are between 0.4 m and 0.9 m lower than the piezometric levels in the glacial deposits
over the period 23 May 2014 to 25 September 2014.
Due to the reduced scope of works and the limited depths of alluvial deposits encountered, there
are currently no installations in the alluvial deposits at Paull. Consequently, the focus is on the glacial
deposits.
Glacial Deposits
Variable head tests in the glacial deposits were completed in L01 and L02 at the Goxhill site; and in
L14, L15, L16/L16A and L18 at the Paull site. These tests recorded permeability of the glacial deposits
ranging from 6.8x10⁻⁸ ms-1 in L02 to 9.0x10⁻⁶ ms-1 at L01 at the Goxhill site; and between 6.5x10⁻⁷ ms-
1 and 3.3x10⁻⁵ ms-1 in L14 at the Paull site.
Feeder 9 - River Humber Gas Pipeline
Replacement Project
Ground Investigation Report
064298/F9/GEO/RPT/101 B
93
The water levels in the glacial deposits observed from manual dip readings measured between 24
April 2014 to 22 October 2014 find the piezometric surface of the glacial deposits to be marginally
higher than the Alluvial deposits closer to the estuary at the Goxhill site. This piezometric head
difference is in the order of between 0.15 m to 0.5 m at the Goxhill site between observation
borehole measurements points over this period. Groundwater piezometry between the two
superficial deposit groups can be considered effectively hydraulically continuous, with some
perching or retardation of flow, particularly in the vertical rather than the lateral plane, associated
with clay and silt horizons. As the piezometric surface of the alluvium deposits has not been
explicitly monitored at the Paull site, the difference between the piezometry of the two superficial
deposits at Paull has not been determined.
Assessment of the continuous time series transducer and vibrating wire data compared with tidal
data shows there is influence on the piezometry of the Glacial Deposits at both Paull and Goxhill
sites.
There is a clear indication of tidal influence within the glacial deposits at the Paull site, with the
continuous piezometric data in L15 and L16 showing a distinct response to diurnal tidal fluctuations.
The piezometric surface in the glacial deposits at Goxhill as measured in L02 and L08 is found to be
similar to or slightly above the level of the low tide recorded in the Humber Estuary. This continuous
water level monitoring data in the glacial deposits display a hydraulic signal in response to the
diurnal tidal range is in the order of 0.05 m. This infers the tidal influence is dampened relative to
the tidal movements.
The tidal influence on the piezometry of the glacial deposits at Paull site is substantially greater than
Goxhill, with a notable diurnal hydraulic tidal response in L15 and L16, implying that there is a
notable tidal influence at the Paull site.
The conductivity signature for the Glacial Deposits in observation borehole L15 at the Paull site does
not show a diurnal fluctuation suggesting a degree of separation from the estuary water body.
Chalk
Analysis of the variable head tests completed in the chalk installed piezometers find that the
permeability of the Flamborough Chalk at Goxhill site at L01 and L03 ranges between 5.5x10⁻⁷ ms-1
and 4.8x10⁻⁶ ms-1; and the permeability of the Flamborough Chalk at the Paull site was identified in
the variable head tests to be between 3.9 x 10⁻⁷ ms-1 and 2.9 x 10⁻⁵ ms-1. Analysis of data from the
packer tests completed for the marine boreholes M01, M02, M04, M06, M09, M10, M11, M12, M14,
M19 and M20 found the permeability of the Flamborough Chalk beneath the Humber Estuary to
ranges between 1.0 x 10⁻⁷ ms-1 and 2.2 x 10⁻⁵ ms-1.
Packer tests18 and variable head tests in the Burnham Chalk beneath the Flamborough Chalk found
the permeability to range from 5.4 x 10⁻⁶ ms-1 to 1.7 x 10⁻⁵ ms-1 beneath the Goxhill site from tests
completed in L01, L02, L04 and L06; and 8.8 x 10⁻⁷ ms-1 beneath the Humber Estuary in M02. The
18 Quoted results are from the factual report.
Feeder 9 - River Humber Gas Pipeline
Replacement Project
Ground Investigation Report
064298/F9/GEO/RPT/101 B
94
groundwater in the Burnham Chalk beneath the Paull site was not assessed as part of the intrusive
investigation and hydraulic testing due to its depth.
The piezometric surface differs between the near-surface superficial aquifer and the chalk aquifer at
depth. This difference is nominal to the south of Goxhill, where the piezometric surface in the chalk
and glacial deposits is essentially the same in L01 and L02. The transducer continuous time series
piezometric data confirms and informs this understanding with a parallel time series within 0.04m
difference between L01 monitoring levels in the chalk and L02 monitoring levels in the glacial
deposits. It is unclear from the manual water level measurement data assessed whether there is
connectivity within the observation borehole L02 or not as the piezometric head in the upper and
lower monitoring levels in L02 tends to be identical. However, elsewhere in the Goxhill site, towards
the Humber Estuary, the piezometric surfaces in the superficial deposits and the chalk aquifer
diverge, with the piezometric head in the Flamborough Chalk at L06 approximately 0.6m lower than
the piezometric head in the alluvium; and the piezometric head in the Burnham Chalk approximately
0.5m lower than the piezometric head in the alluvium in L04. This divergence in the piezometry,
closer to the Humber, may infer the alluvium is isolated as a groundwater unit from that in the chalk
in this particular land sector. There is limited piezometric data available from the Paull site for the
chalk aquifer. However, the manual measurements indicate that the piezometric surface in the
Flamborough Chalk aquifer is approximately 0.6 m lower than the piezometric surface of the glacial
deposits in L14.
Measurements by manual dips in June 2014 finds the piezometric surface of the Burnham Chalk
aquifer at Goxhill in boreholes L01 L02, L04 and L06 to be at or close to the level of the low tide and
not affected by the rising or high tide water level. However, the continuous time series transducer
and vibrating wire piezometric data for the chalk aquifer confirms there is a tidal hydraulic
connectivity on the piezometry of the chalk aquifer units – notably within the chalk monitoring
boreholes L15 and L16 which show a distinct diurnal tidal cycle in piezometric head. The continuous
time series data is considered the more accurate in capturing the tidal variation.
The groundwater levels in the chalk aquifer are similar to the levels in the superficial deposits
overlying the chalk aquifer. Notably, the piezometric head in L01, L02 (shallow in the glacial deposits
and deep in the Burnham Chalk) and L06 shallow in the Alluvium have very similar groundwater
levels when measured manually. However, the level in the Burnham Chalk in L06/1 is approximately
0.1m below that of the alluvium at L06 in June 2014; therefore the interconnectivity between the
alluvium at L06 and the Burnham Chalk and glacial deposits at L01 and L02 is inferred. The
combination of glacial deposits and the alluvium to the south of Goxhill provides a degree of
confinement to the Flamborough and Burnham Chalk aquifer in this area.
Piezometric levels in the chalk beneath the Paull site in June 2014 were approximately 0.6m lower
than that of the glacial deposits at the near surface. This infers that there is limited hydraulic
continuity between the glacial deposits and the chalk aquifer and the glacial deposits form a
hydraulic barrier or protective cover to the chalk aquifer at depth.
In addition to the tidal hydraulic signal in some of the observation boreholes, the conductivity
loggers installed in the chalk aquifer in L04 and L06 inform the understanding of extent of the
Feeder 9 - River Humber Gas Pipeline
Replacement Project
Ground Investigation Report
064298/F9/GEO/RPT/101 B
95
hydraulic connectivity and chemical influence of the tidal and saline estuarine marine waters of the
Humber Estuary on the groundwater in the Flamborough and Burnham Chalk aquifer. The
conductivity signature for the two Goxhill wells both show a diurnal fluctuation indicating a degree
of connection with the estuary and the amplitude of fluctuation of the L06 is larger than that of L04
which reflects the closer position to the edge of the estuary. The conductivity of L06 in mid
September is unusually high (averaging in excess of 6 mS/cm) which may suggest the logger has lost
its calibration following removal for down loading. The conductivity of L06 in mid-September is
unusually high (averaging in excess of 6 mS/cm) which may suggest the logger has lost its calibration
following removal for down loading.
During the drilling of L03, a noticeable pressure response was reported in L02, located 120m south-
west from L03. Bubbling water was also observed in the bentonite seal and borehole installation in
L02 during the construction of L03. This bubbling was observed for several days. This implies a direct
and rapid hydraulic connectivity between L03 and L02. This is possibly associated with the highly
weathered Flamborough Chalk or its immediate overburden and the associated high transmissive
preferential flow along this horizon.
Substantial loss of water was recorded during the trial water flush coring of L04 with 500 litres of
water lost within the first 5 minutes of coring at each of the 0.5am core runs.
Similarly, during the construction of the dual vibrating wire piezometers (VWP) in L05, significant
volumes of liquid grout were lost to the ground over the interval 18 m bgl to 30 m bgl; with
additional group pumped into L05 in response to this loss. This interval is below the Flamborough
Chalk and below the top of the Burnham Chalk at 16 m bgl. This implies a transmissive preferential
flow horizon or developed void space within the Burnham Chalk at a lower depth than the
weathered surface of the chalk immediately beneath the Glacial Deposits, as observed in other
piezometers at the Goxhill site.
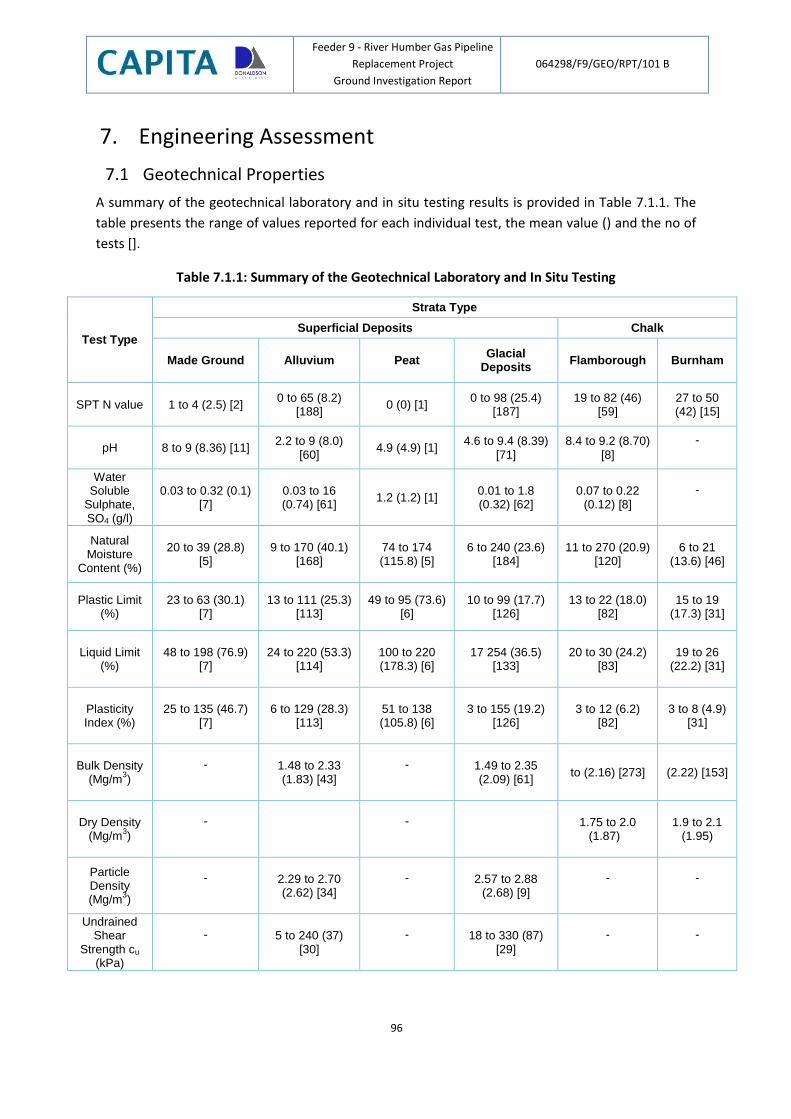
Feeder 9 - River Humber Gas Pipeline
Replacement Project
Ground Investigation Report
064298/F9/GEO/RPT/101 B
96
7. Engineering Assessment
7.1 Geotechnical Properties
A summary of the geotechnical laboratory and in situ testing results is provided in Table 7.1.1. The
table presents the range of values reported for each individual test, the mean value () and the no of
tests [].
Table 7.1.1: Summary of the Geotechnical Laboratory and In Situ Testing
Test Type
Strata Type
Superficial Deposits Chalk
Made Ground Alluvium Peat Glacial
Deposits Flamborough Burnham
SPT N value 1 to 4 (2.5) [2] 0 to 65 (8.2)
[188] 0 (0) [1]
0 to 98 (25.4) [187]
19 to 82 (46) [59]
27 to 50 (42) [15]
pH 8 to 9 (8.36) [11] 2.2 to 9 (8.0)
[60] 4.9 (4.9) [1]
4.6 to 9.4 (8.39) [71]
8.4 to 9.2 (8.70) [8]
-
Water Soluble
Sulphate, SO4 (g/l)
0.03 to 0.32 (0.1) [7]
0.03 to 16 (0.74) [61]
1.2 (1.2) [1] 0.01 to 1.8 (0.32) [62]
0.07 to 0.22 (0.12) [8]
-
Natural Moisture
Content (%)
20 to 39 (28.8) [5]
9 to 170 (40.1) [168]
74 to 174 (115.8) [5]
6 to 240 (23.6) [184]
11 to 270 (20.9) [120]
6 to 21 (13.6) [46]
Plastic Limit (%)
23 to 63 (30.1) [7]
13 to 111 (25.3) [113]
49 to 95 (73.6) [6]
10 to 99 (17.7) [126]
13 to 22 (18.0) [82]
15 to 19 (17.3) [31]
Liquid Limit (%)
48 to 198 (76.9) [7]
24 to 220 (53.3) [114]
100 to 220 (178.3) [6]
17 254 (36.5) [133]
20 to 30 (24.2) [83]
19 to 26 (22.2) [31]
Plasticity Index (%)
25 to 135 (46.7) [7]
6 to 129 (28.3) [113]
51 to 138 (105.8) [6]
3 to 155 (19.2) [126]
3 to 12 (6.2) [82]
3 to 8 (4.9) [31]
Bulk Density (Mg/m
3)
-
1.48 to 2.33 (1.83) [43]
-
1.49 to 2.35 (2.09) [61]
to (2.16) [273] (2.22) [153]
Dry Density (Mg/m
3)
-
-
1.75 to 2.0 (1.87)
1.9 to 2.1 (1.95)
Particle Density (Mg/m
3)
-
2.29 to 2.70 (2.62) [34]
-
2.57 to 2.88 (2.68) [9]
-
-
Undrained Shear
Strength cu (kPa)
-
5 to 240 (37) [30]
-
18 to 330 (87) [29]
-
-
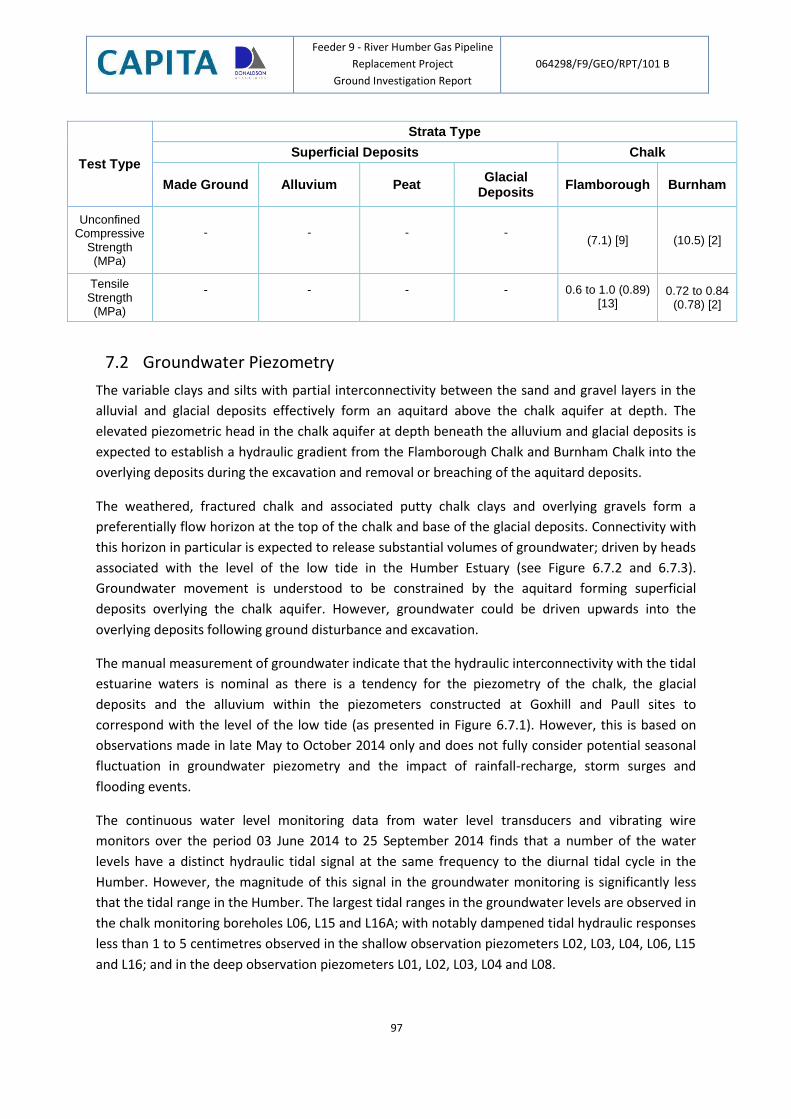
Feeder 9 - River Humber Gas Pipeline
Replacement Project
Ground Investigation Report
064298/F9/GEO/RPT/101 B
97
Test Type
Strata Type
Superficial Deposits Chalk
Made Ground Alluvium Peat Glacial
Deposits Flamborough Burnham
Unconfined Compressive
Strength (MPa)
-
-
-
-
(7.1) [9] (10.5) [2]
Tensile Strength (MPa)
-
-
-
-
0.6 to 1.0 (0.89) [13]
0.72 to 0.84 (0.78) [2]
7.2 Groundwater Piezometry
The variable clays and silts with partial interconnectivity between the sand and gravel layers in the
alluvial and glacial deposits effectively form an aquitard above the chalk aquifer at depth. The
elevated piezometric head in the chalk aquifer at depth beneath the alluvium and glacial deposits is
expected to establish a hydraulic gradient from the Flamborough Chalk and Burnham Chalk into the
overlying deposits during the excavation and removal or breaching of the aquitard deposits.
The weathered, fractured chalk and associated putty chalk clays and overlying gravels form a
preferentially flow horizon at the top of the chalk and base of the glacial deposits. Connectivity with
this horizon in particular is expected to release substantial volumes of groundwater; driven by heads
associated with the level of the low tide in the Humber Estuary (see Figure 6.7.2 and 6.7.3).
Groundwater movement is understood to be constrained by the aquitard forming superficial
deposits overlying the chalk aquifer. However, groundwater could be driven upwards into the
overlying deposits following ground disturbance and excavation.
The manual measurement of groundwater indicate that the hydraulic interconnectivity with the tidal
estuarine waters is nominal as there is a tendency for the piezometry of the chalk, the glacial
deposits and the alluvium within the piezometers constructed at Goxhill and Paull sites to
correspond with the level of the low tide (as presented in Figure 6.7.1). However, this is based on
observations made in late May to October 2014 only and does not fully consider potential seasonal
fluctuation in groundwater piezometry and the impact of rainfall-recharge, storm surges and
flooding events.
The continuous water level monitoring data from water level transducers and vibrating wire
monitors over the period 03 June 2014 to 25 September 2014 finds that a number of the water
levels have a distinct hydraulic tidal signal at the same frequency to the diurnal tidal cycle in the
Humber. However, the magnitude of this signal in the groundwater monitoring is significantly less
that the tidal range in the Humber. The largest tidal ranges in the groundwater levels are observed in
the chalk monitoring boreholes L06, L15 and L16A; with notably dampened tidal hydraulic responses
less than 1 to 5 centimetres observed in the shallow observation piezometers L02, L03, L04, L06, L15
and L16; and in the deep observation piezometers L01, L02, L03, L04 and L08.
Feeder 9 - River Humber Gas Pipeline
Replacement Project
Ground Investigation Report
064298/F9/GEO/RPT/101 B
98
7.3 Groundwater Chemistry
Analysis of the continuous conductivity data monitored using the diver conductivity loggers shows
there are diurnal inflows of saline waters to affect the overall salinity of the chalk groundwater at
Goxhill. This does not appear to be the case at the single monitoring point installed at Paull.
Field conductivity monitoring during water sampling rounds and the laboratory testing for chloride
content show shallow well locations L04 and L06 at Goxhill to be of near saline condition. Most other
wells appear brackish with the exception of L01 and L02 which are chalk wells with near fresh water.
At Goxhill there is a pattern of less saline waters the further inland from the Humber Estuary
travelled.
Dissolved metal water quality status is on the whole good in the chalk and poorer in the shallow
wells. Elevated arsenic, nickel, selenium and sodium are present in the shallow wells, across both
Paull and Goxhill sites. Arsenic was recorded 10 times the EQS and sodium 28 times the DWS in the
shallow L06 well at Goxhill. Selenium was recorded at 9 times the DWS in the shallow L04 well at
Goxhill with nickel being recorded at 12 times the DWS in the deep L06 well. Marginally elevated
levels of boron were found only at the Goxhill site and not Paull however the majority of the levels
are considered trace value.
Dissolved phase nutrient analysis found no nitrate or nitrite concentrations above the laboratory
limit of detection; however ammonia as NH4 showed moderately elevated levels through but 66
times the EQS in shallow L04 and L06 wells. Total phosphate showed elevated levels within L04/2
and L06/2 wells as well as L04/1, with shallow L04 recording a concentration 24 times the DWS.
No impact with TPH fractions, speciated PAHs, speciated phenols and monaromatics with recorded
levels less than the laboratory limit of detection. Furthermore, the testing for herbicide metazachlor
was not recorded within any groundwater samples across all tested wells.
7.4 Hydrogeological / Groundwater – permeability data and groundwater flow
The Packer Tests and Variable Head Tests undertaken following construction of the observation
boreholes identify the permeability of the targeted horizons and the immediate strata and therefore
provide an invaluable understanding for the potential groundwater movement within more
permeable horizons and the retardation of groundwater within less permeable horizons such as clay
and silt layers. However, these short duration tests were principally focused on the water bearing
strata and sub-strata in the near vicinity of each observation borehole. Long terms pumping tests
would improve the understanding of the transmissivity of the aquifer units and sub-units and lead to
improve the analysis of lateral and vertical interconnectivity.
The site observations during the construction of the piezometers at Goxhill site indicate the possible
presence of a highly transmissive zone or horizon associated with the top of the chalk and the base
of the glacial deposits. Groundwater movement is expected to flow rapidly and preferentially along
this horizon. The loss of fluids, bentonite and gravel associated with this depth during the
construction of several of the Goxhill piezometers at the top of the chalk and base of the glacial
Feeder 9 - River Humber Gas Pipeline
Replacement Project
Ground Investigation Report
064298/F9/GEO/RPT/101 B
99
deposits corresponds with a highly weathered, brittle fractured chalk with putty chalk and
weathered clay above as reported in the drillers’ logs. This horizon could allow for rapid hydraulic
interconnectivity over significant distances (for example gaseous response over 120 m between L02
and L03 during construction of L03) and requires consideration during the design and construction.
Furthermore, there is evidence to indicate there is a preferential flow horizon in the Burnham Chalk
Formation. The depth and detail of this horizon or group of horizons is undetermined. The
preferential flow may be associated with fractures or marl bands within the Burnham Chalk. Further
consideration of the preferential groundwater movement within the design and construction is
required to determine the anticipated risk and quantify the volume of groundwater associated with
the preferential flow horizons in the Burnham Chalk.
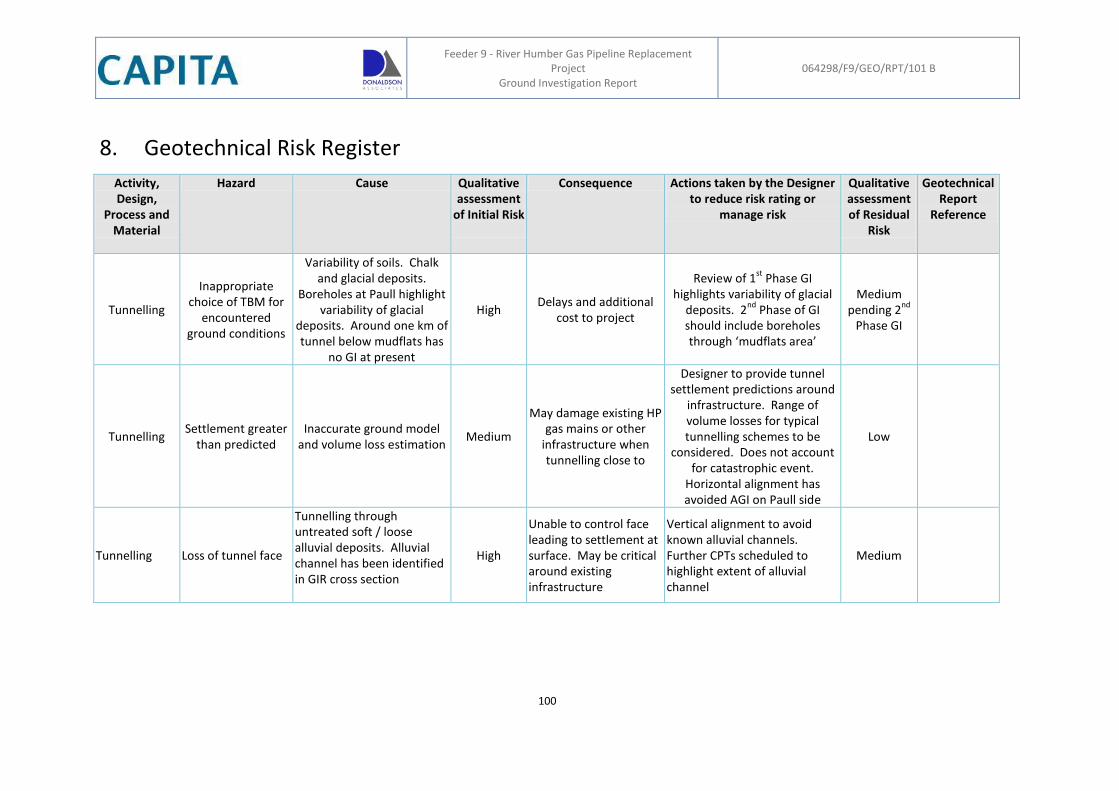
Feeder 9 - River Humber Gas Pipeline Replacement
Project Ground Investigation Report
064298/F9/GEO/RPT/101 B
100
8. Geotechnical Risk Register
Activity, Design,
Process and Material
Hazard Cause Qualitative assessment
of Initial Risk
Consequence Actions taken by the Designer to reduce risk rating or
manage risk
Qualitative assessment of Residual
Risk
Geotechnical Report
Reference
Tunnelling
Inappropriate choice of TBM for
encountered ground conditions
Variability of soils. Chalk and glacial deposits.
Boreholes at Paull highlight variability of glacial
deposits. Around one km of tunnel below mudflats has
no GI at present
High Delays and additional
cost to project
Review of 1st
Phase GI highlights variability of glacial
deposits. 2nd
Phase of GI should include boreholes through ‘mudflats area’
Medium pending 2
nd
Phase GI
Tunnelling Settlement greater
than predicted Inaccurate ground model
and volume loss estimation Medium
May damage existing HP gas mains or other
infrastructure when tunnelling close to
Designer to provide tunnel settlement predictions around
infrastructure. Range of volume losses for typical tunnelling schemes to be
considered. Does not account for catastrophic event.
Horizontal alignment has avoided AGI on Paull side
Low
Tunnelling Loss of tunnel face
Tunnelling through untreated soft / loose alluvial deposits. Alluvial channel has been identified in GIR cross section
High
Unable to control face leading to settlement at surface. May be critical around existing infrastructure
Vertical alignment to avoid known alluvial channels. Further CPTs scheduled to highlight extent of alluvial channel
Medium
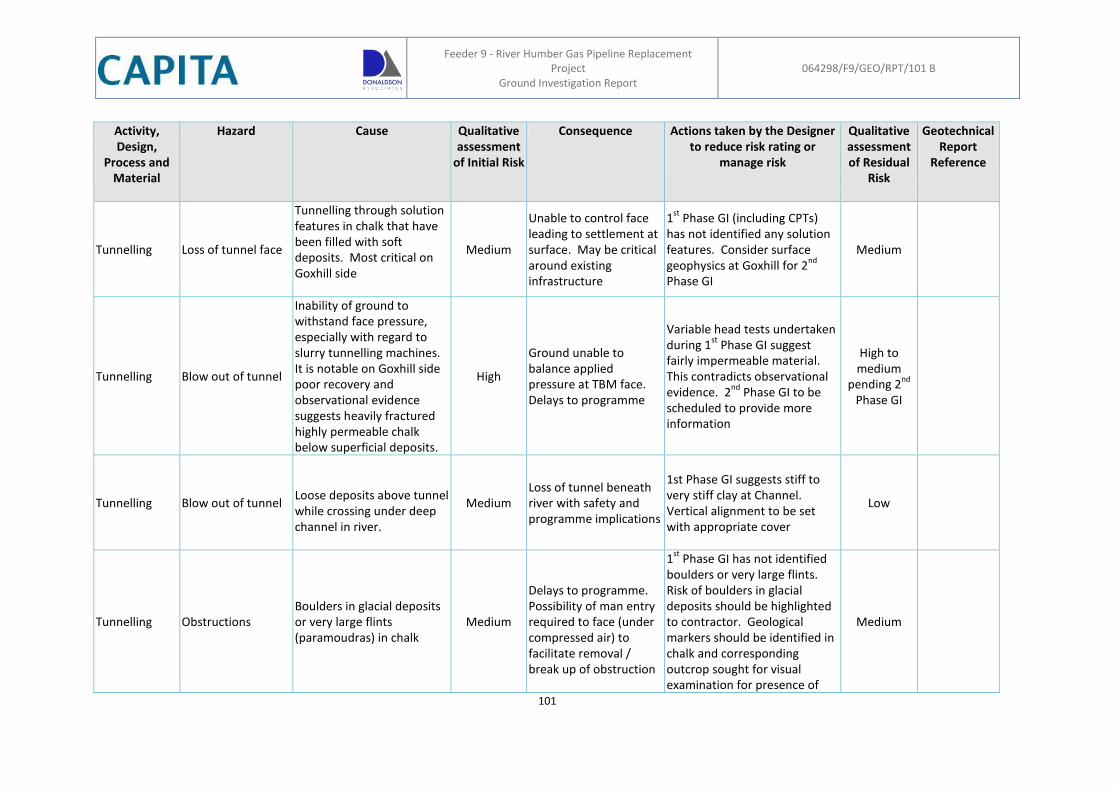
Feeder 9 - River Humber Gas Pipeline Replacement
Project Ground Investigation Report
064298/F9/GEO/RPT/101 B
101
Activity, Design,
Process and Material
Hazard Cause Qualitative assessment
of Initial Risk
Consequence Actions taken by the Designer to reduce risk rating or
manage risk
Qualitative assessment of Residual
Risk
Geotechnical Report
Reference
Tunnelling Loss of tunnel face
Tunnelling through solution features in chalk that have been filled with soft deposits. Most critical on Goxhill side
Medium
Unable to control face leading to settlement at surface. May be critical around existing infrastructure
1st
Phase GI (including CPTs) has not identified any solution features. Consider surface geophysics at Goxhill for 2
nd
Phase GI
Medium
Tunnelling Blow out of tunnel
Inability of ground to withstand face pressure, especially with regard to slurry tunnelling machines. It is notable on Goxhill side poor recovery and observational evidence suggests heavily fractured highly permeable chalk below superficial deposits.
High
Ground unable to balance applied pressure at TBM face. Delays to programme
Variable head tests undertaken during 1
st Phase GI suggest
fairly impermeable material. This contradicts observational evidence. 2
nd Phase GI to be
scheduled to provide more information
High to medium
pending 2nd
Phase GI
Tunnelling Blow out of tunnel
Loose deposits above tunnel while crossing under deep channel in river.
Medium Loss of tunnel beneath river with safety and programme implications
1st Phase GI suggests stiff to very stiff clay at Channel. Vertical alignment to be set with appropriate cover
Low
Tunnelling Obstructions Boulders in glacial deposits or very large flints (paramoudras) in chalk
Medium
Delays to programme. Possibility of man entry required to face (under compressed air) to facilitate removal / break up of obstruction
1st
Phase GI has not identified boulders or very large flints. Risk of boulders in glacial deposits should be highlighted to contractor. Geological markers should be identified in chalk and corresponding outcrop sought for visual examination for presence of
Medium
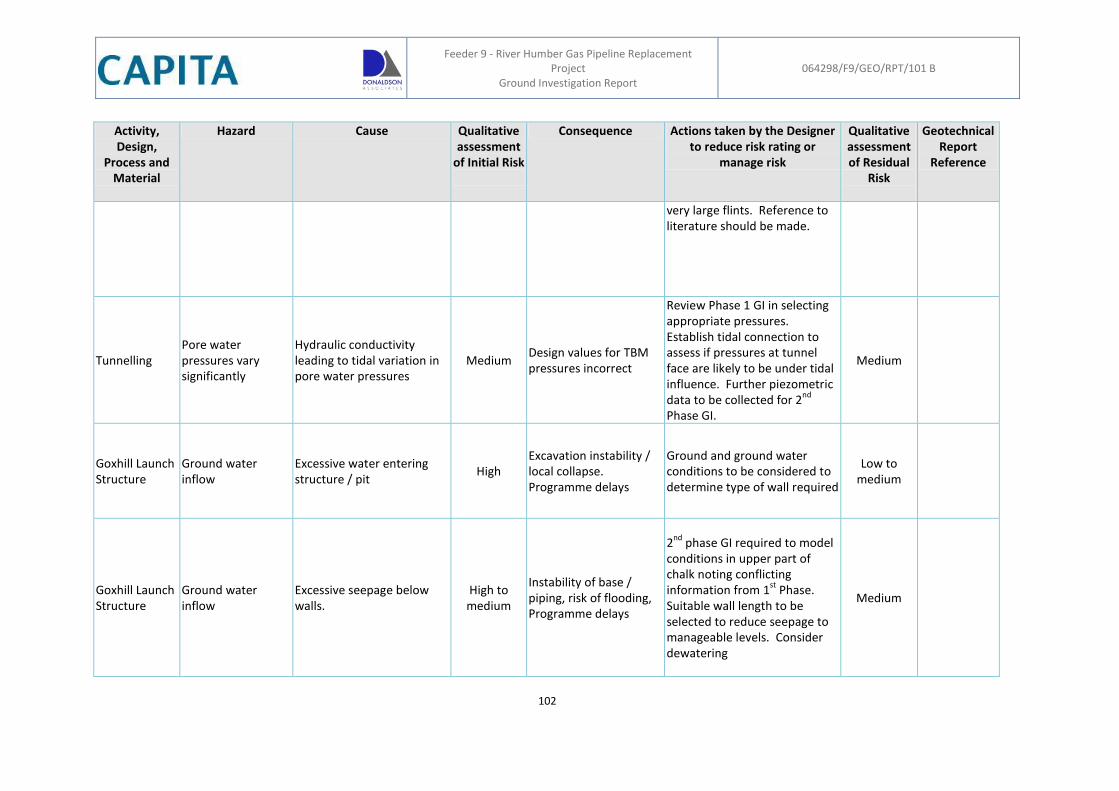
Feeder 9 - River Humber Gas Pipeline Replacement
Project Ground Investigation Report
064298/F9/GEO/RPT/101 B
102
Activity, Design,
Process and Material
Hazard Cause Qualitative assessment
of Initial Risk
Consequence Actions taken by the Designer to reduce risk rating or
manage risk
Qualitative assessment of Residual
Risk
Geotechnical Report
Reference
very large flints. Reference to literature should be made.
Tunnelling Pore water pressures vary significantly
Hydraulic conductivity leading to tidal variation in pore water pressures
Medium Design values for TBM pressures incorrect
Review Phase 1 GI in selecting appropriate pressures. Establish tidal connection to assess if pressures at tunnel face are likely to be under tidal influence. Further piezometric data to be collected for 2
nd
Phase GI.
Medium
Goxhill Launch Structure
Ground water inflow
Excessive water entering structure / pit
High Excavation instability / local collapse. Programme delays
Ground and ground water conditions to be considered to determine type of wall required
Low to medium
Goxhill Launch Structure
Ground water inflow
Excessive seepage below walls.
High to medium
Instability of base / piping, risk of flooding, Programme delays
2
nd phase GI required to model
conditions in upper part of chalk noting conflicting information from 1
st Phase.
Suitable wall length to be selected to reduce seepage to manageable levels. Consider dewatering
Medium
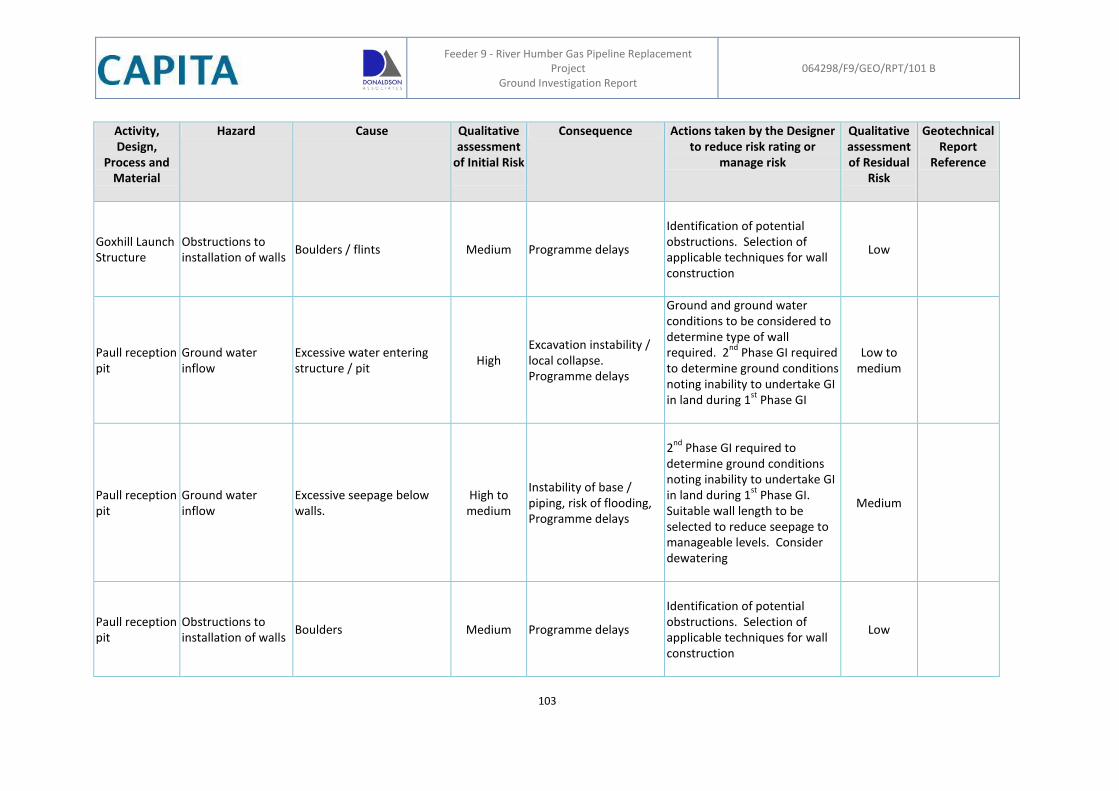
Feeder 9 - River Humber Gas Pipeline Replacement
Project Ground Investigation Report
064298/F9/GEO/RPT/101 B
103
Activity, Design,
Process and Material
Hazard Cause Qualitative assessment
of Initial Risk
Consequence Actions taken by the Designer to reduce risk rating or
manage risk
Qualitative assessment of Residual
Risk
Geotechnical Report
Reference
Goxhill Launch Structure
Obstructions to installation of walls
Boulders / flints Medium Programme delays
Identification of potential obstructions. Selection of applicable techniques for wall construction
Low
Paull reception pit
Ground water inflow
Excessive water entering structure / pit
High Excavation instability / local collapse. Programme delays
Ground and ground water conditions to be considered to determine type of wall required. 2
nd Phase GI required
to determine ground conditions noting inability to undertake GI in land during 1
st Phase GI
Low to medium
Paull reception pit
Ground water inflow
Excessive seepage below walls.
High to medium
Instability of base / piping, risk of flooding, Programme delays
2
nd Phase GI required to
determine ground conditions noting inability to undertake GI in land during 1
st Phase GI.
Suitable wall length to be selected to reduce seepage to manageable levels. Consider dewatering
Medium
Paull reception pit
Obstructions to installation of walls
Boulders Medium Programme delays
Identification of potential obstructions. Selection of applicable techniques for wall construction
Low
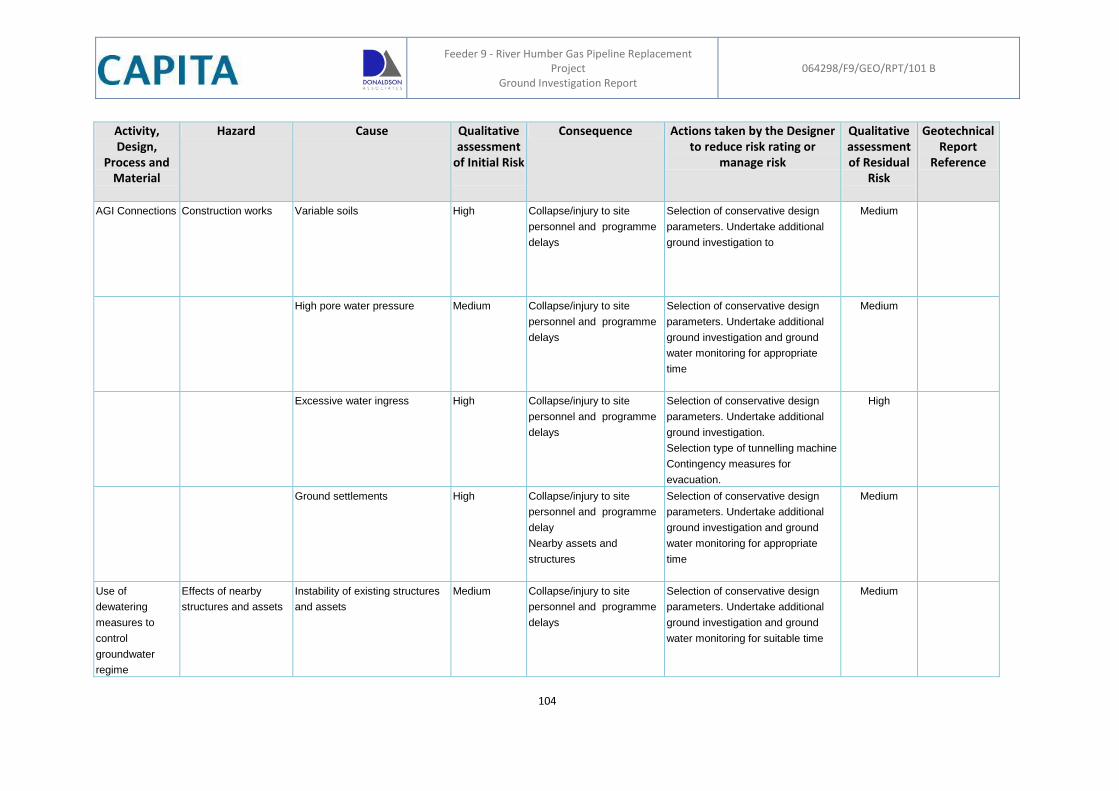
Feeder 9 - River Humber Gas Pipeline Replacement
Project Ground Investigation Report
064298/F9/GEO/RPT/101 B
104
Activity, Design,
Process and Material
Hazard Cause Qualitative assessment
of Initial Risk
Consequence Actions taken by the Designer to reduce risk rating or
manage risk
Qualitative assessment of Residual
Risk
Geotechnical Report
Reference
AGI Connections Construction works Variable soils High Collapse/injury to site
personnel and programme
delays
Selection of conservative design
parameters. Undertake additional
ground investigation to
Medium
High pore water pressure Medium Collapse/injury to site
personnel and programme
delays
Selection of conservative design
parameters. Undertake additional
ground investigation and ground
water monitoring for appropriate
time
Medium
Excessive water ingress High Collapse/injury to site
personnel and programme
delays
Selection of conservative design
parameters. Undertake additional
ground investigation.
Selection type of tunnelling machine
Contingency measures for
evacuation.
High
Ground settlements High Collapse/injury to site
personnel and programme
delay
Nearby assets and
structures
Selection of conservative design
parameters. Undertake additional
ground investigation and ground
water monitoring for appropriate
time
Medium
Use of
dewatering
measures to
control
groundwater
regime
Effects of nearby
structures and assets
Instability of existing structures
and assets
Medium Collapse/injury to site
personnel and programme
delays
Selection of conservative design
parameters. Undertake additional
ground investigation and ground
water monitoring for suitable time
Medium
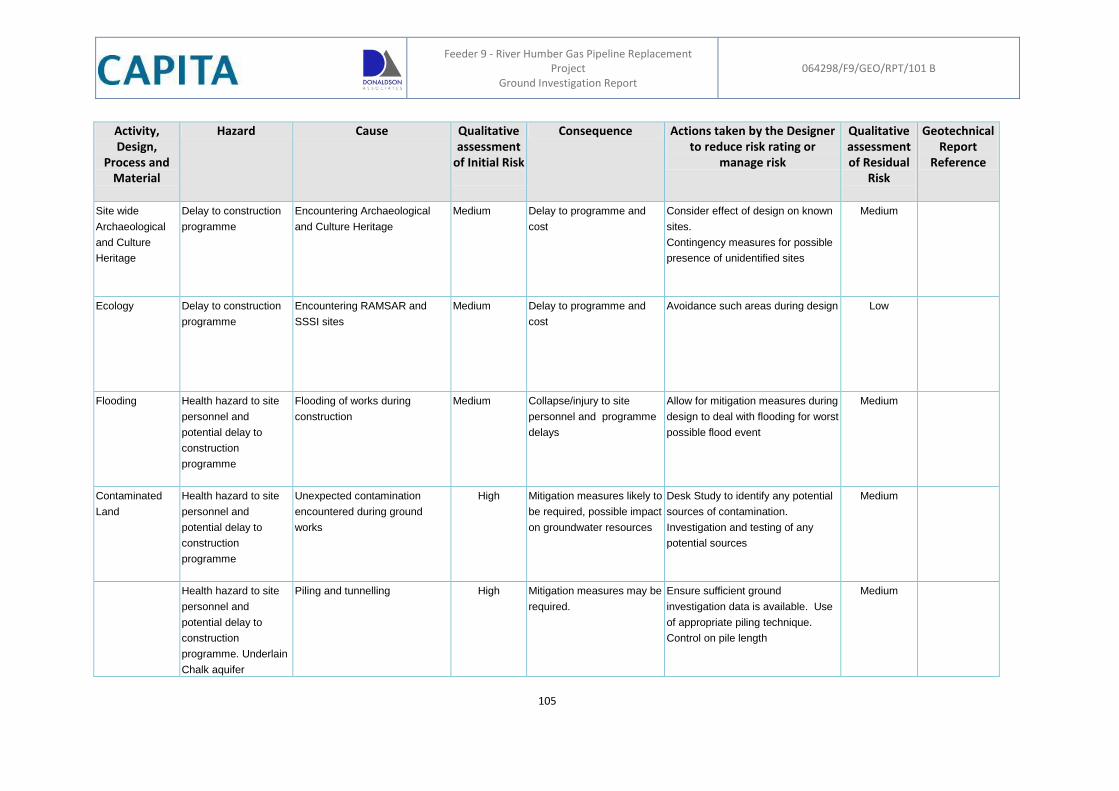
Feeder 9 - River Humber Gas Pipeline Replacement
Project Ground Investigation Report
064298/F9/GEO/RPT/101 B
105
Activity, Design,
Process and Material
Hazard Cause Qualitative assessment
of Initial Risk
Consequence Actions taken by the Designer to reduce risk rating or
manage risk
Qualitative assessment of Residual
Risk
Geotechnical Report
Reference
Site wide
Archaeological
and Culture
Heritage
Delay to construction
programme
Encountering Archaeological
and Culture Heritage
Medium Delay to programme and
cost
Consider effect of design on known
sites.
Contingency measures for possible
presence of unidentified sites
Medium
Ecology Delay to construction
programme
Encountering RAMSAR and
SSSI sites
Medium Delay to programme and
cost
Avoidance such areas during design Low
Flooding Health hazard to site
personnel and
potential delay to
construction
programme
Flooding of works during
construction
Medium Collapse/injury to site
personnel and programme
delays
Allow for mitigation measures during
design to deal with flooding for worst
possible flood event
Medium
Contaminated
Land
Health hazard to site
personnel and
potential delay to
construction
programme
Unexpected contamination
encountered during ground
works
High Mitigation measures likely to
be required, possible impact
on groundwater resources
Desk Study to identify any potential
sources of contamination.
Investigation and testing of any
potential sources
Medium
Health hazard to site
personnel and
potential delay to
construction
programme. Underlain
Chalk aquifer
Piling and tunnelling High Mitigation measures may be
required.
Ensure sufficient ground
investigation data is available. Use
of appropriate piling technique.
Control on pile length
Medium
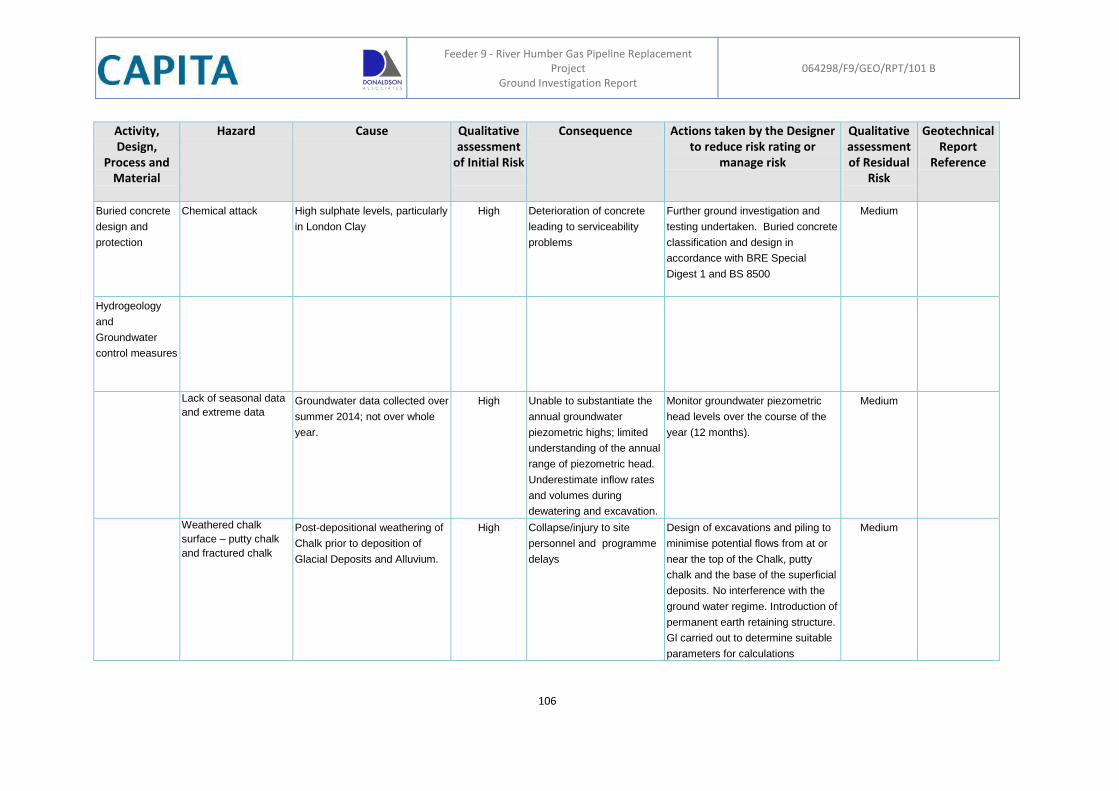
Feeder 9 - River Humber Gas Pipeline Replacement
Project Ground Investigation Report
064298/F9/GEO/RPT/101 B
106
Activity, Design,
Process and Material
Hazard Cause Qualitative assessment
of Initial Risk
Consequence Actions taken by the Designer to reduce risk rating or
manage risk
Qualitative assessment of Residual
Risk
Geotechnical Report
Reference
Buried concrete
design and
protection
Chemical attack High sulphate levels, particularly
in London Clay
High Deterioration of concrete
leading to serviceability
problems
Further ground investigation and
testing undertaken. Buried concrete
classification and design in
accordance with BRE Special
Digest 1 and BS 8500
Medium
Hydrogeology
and
Groundwater
control measures
Lack of seasonal data
and extreme data Groundwater data collected over
summer 2014; not over whole
year.
High Unable to substantiate the
annual groundwater
piezometric highs; limited
understanding of the annual
range of piezometric head.
Underestimate inflow rates
and volumes during
dewatering and excavation.
Monitor groundwater piezometric
head levels over the course of the
year (12 months).
Medium
Weathered chalk
surface – putty chalk
and fractured chalk
Post-depositional weathering of
Chalk prior to deposition of
Glacial Deposits and Alluvium.
High Collapse/injury to site
personnel and programme
delays
Design of excavations and piling to
minimise potential flows from at or
near the top of the Chalk, putty
chalk and the base of the superficial
deposits. No interference with the
ground water regime. Introduction of
permanent earth retaining structure.
Gl carried out to determine suitable
parameters for calculations
Medium
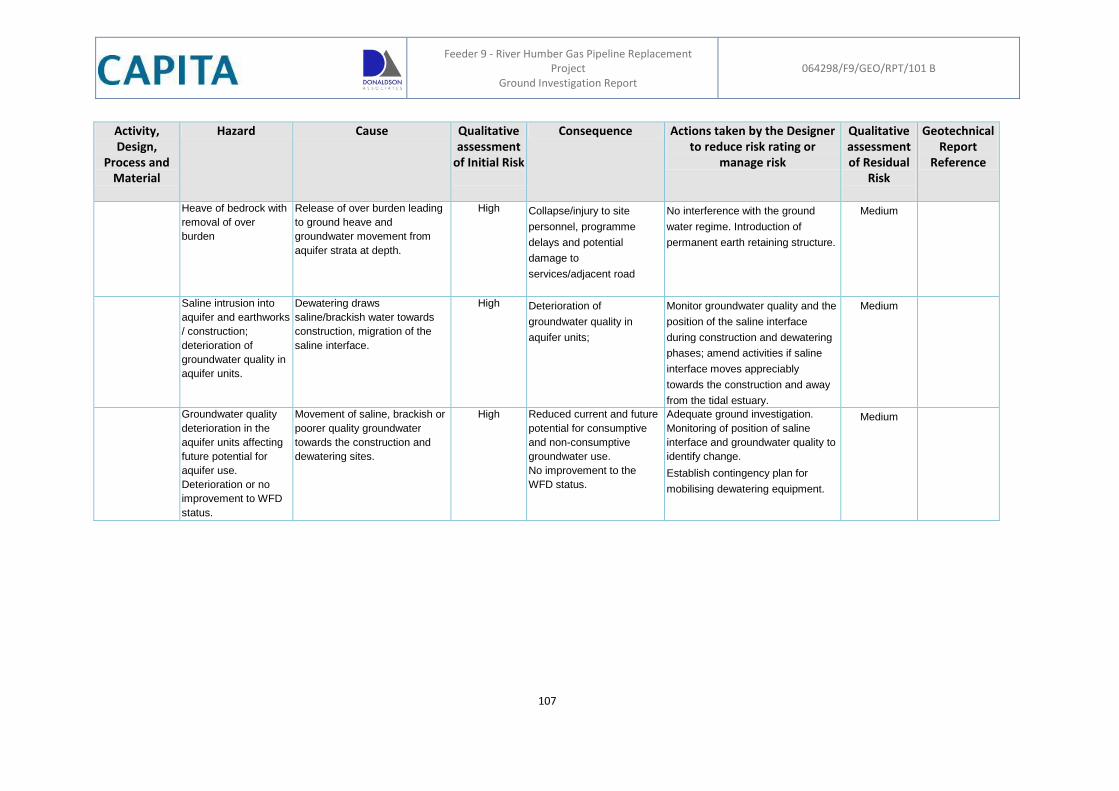
Feeder 9 - River Humber Gas Pipeline Replacement
Project Ground Investigation Report
064298/F9/GEO/RPT/101 B
107
Activity, Design,
Process and Material
Hazard Cause Qualitative assessment
of Initial Risk
Consequence Actions taken by the Designer to reduce risk rating or
manage risk
Qualitative assessment of Residual
Risk
Geotechnical Report
Reference
Heave of bedrock with
removal of over
burden
Release of over burden leading
to ground heave and
groundwater movement from
aquifer strata at depth.
High Collapse/injury to site
personnel, programme
delays and potential
damage to
services/adjacent road
No interference with the ground
water regime. Introduction of
permanent earth retaining structure.
Medium
Saline intrusion into
aquifer and earthworks
/ construction;
deterioration of
groundwater quality in
aquifer units.
Dewatering draws
saline/brackish water towards
construction, migration of the
saline interface.
High Deterioration of
groundwater quality in
aquifer units;
Monitor groundwater quality and the
position of the saline interface
during construction and dewatering
phases; amend activities if saline
interface moves appreciably
towards the construction and away
from the tidal estuary.
Medium
Groundwater quality
deterioration in the
aquifer units affecting
future potential for
aquifer use.
Deterioration or no
improvement to WFD
status.
Movement of saline, brackish or
poorer quality groundwater
towards the construction and
dewatering sites.
High Reduced current and future
potential for consumptive
and non-consumptive
groundwater use.
No improvement to the
WFD status.
Adequate ground investigation.
Monitoring of position of saline
interface and groundwater quality to
identify change.
Establish contingency plan for
mobilising dewatering equipment.
Medium
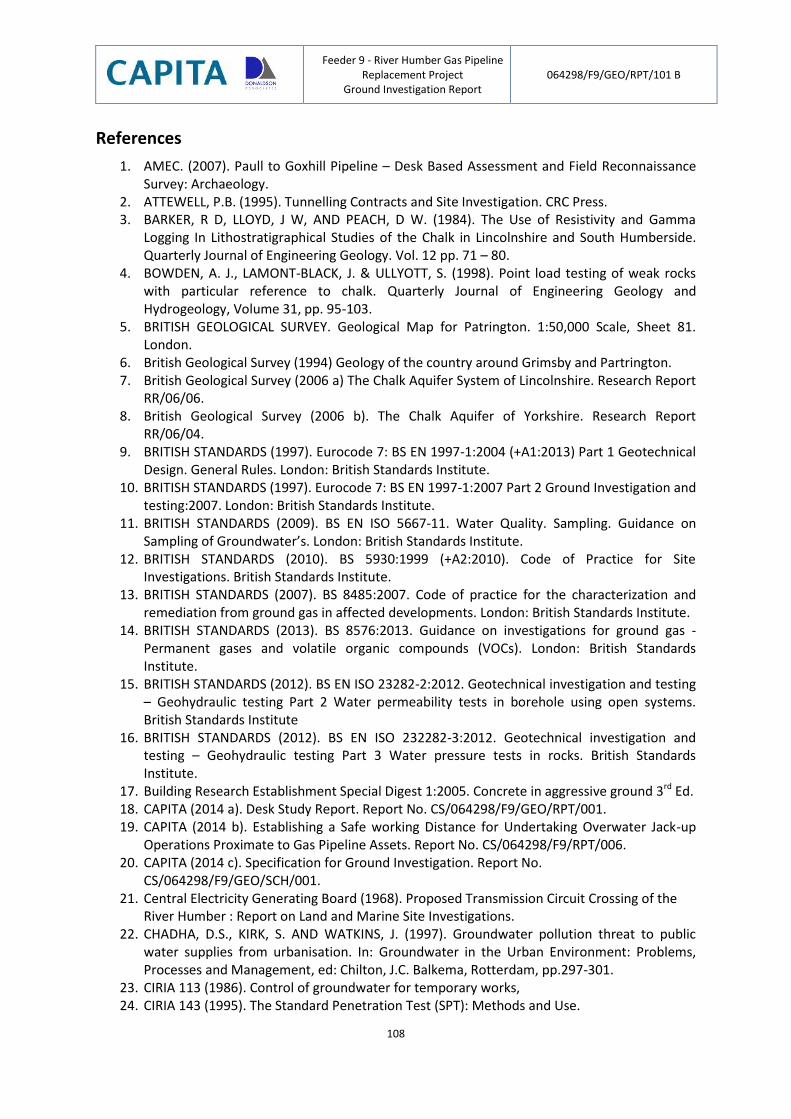
Feeder 9 - River Humber Gas Pipeline Replacement Project
Ground Investigation Report 064298/F9/GEO/RPT/101 B
108
References
1. AMEC. (2007). Paull to Goxhill Pipeline – Desk Based Assessment and Field Reconnaissance Survey: Archaeology.
2. ATTEWELL, P.B. (1995). Tunnelling Contracts and Site Investigation. CRC Press. 3. BARKER, R D, LLOYD, J W, AND PEACH, D W. (1984). The Use of Resistivity and Gamma
Logging In Lithostratigraphical Studies of the Chalk in Lincolnshire and South Humberside. Quarterly Journal of Engineering Geology. Vol. 12 pp. 71 – 80.
4. BOWDEN, A. J., LAMONT-BLACK, J. & ULLYOTT, S. (1998). Point load testing of weak rocks with particular reference to chalk. Quarterly Journal of Engineering Geology and Hydrogeology, Volume 31, pp. 95-103.
5. BRITISH GEOLOGICAL SURVEY. Geological Map for Patrington. 1:50,000 Scale, Sheet 81. London.
6. British Geological Survey (1994) Geology of the country around Grimsby and Partrington. 7. British Geological Survey (2006 a) The Chalk Aquifer System of Lincolnshire. Research Report
RR/06/06. 8. British Geological Survey (2006 b). The Chalk Aquifer of Yorkshire. Research Report
RR/06/04. 9. BRITISH STANDARDS (1997). Eurocode 7: BS EN 1997-1:2004 (+A1:2013) Part 1 Geotechnical
Design. General Rules. London: British Standards Institute. 10. BRITISH STANDARDS (1997). Eurocode 7: BS EN 1997-1:2007 Part 2 Ground Investigation and
testing:2007. London: British Standards Institute. 11. BRITISH STANDARDS (2009). BS EN ISO 5667-11. Water Quality. Sampling. Guidance on
Sampling of Groundwater’s. London: British Standards Institute. 12. BRITISH STANDARDS (2010). BS 5930:1999 (+A2:2010). Code of Practice for Site
Investigations. British Standards Institute. 13. BRITISH STANDARDS (2007). BS 8485:2007. Code of practice for the characterization and
remediation from ground gas in affected developments. London: British Standards Institute. 14. BRITISH STANDARDS (2013). BS 8576:2013. Guidance on investigations for ground gas -
Permanent gases and volatile organic compounds (VOCs). London: British Standards Institute.
15. BRITISH STANDARDS (2012). BS EN ISO 23282-2:2012. Geotechnical investigation and testing – Geohydraulic testing Part 2 Water permeability tests in borehole using open systems. British Standards Institute
16. BRITISH STANDARDS (2012). BS EN ISO 232282-3:2012. Geotechnical investigation and testing – Geohydraulic testing Part 3 Water pressure tests in rocks. British Standards Institute.
17. Building Research Establishment Special Digest 1:2005. Concrete in aggressive ground 3rd Ed. 18. CAPITA (2014 a). Desk Study Report. Report No. CS/064298/F9/GEO/RPT/001. 19. CAPITA (2014 b). Establishing a Safe working Distance for Undertaking Overwater Jack-up
Operations Proximate to Gas Pipeline Assets. Report No. CS/064298/F9/RPT/006. 20. CAPITA (2014 c). Specification for Ground Investigation. Report No.
CS/064298/F9/GEO/SCH/001. 21. Central Electricity Generating Board (1968). Proposed Transmission Circuit Crossing of the
River Humber : Report on Land and Marine Site Investigations. 22. CHADHA, D.S., KIRK, S. AND WATKINS, J. (1997). Groundwater pollution threat to public
water supplies from urbanisation. In: Groundwater in the Urban Environment: Problems, Processes and Management, ed: Chilton, J.C. Balkema, Rotterdam, pp.297-301.
23. CIRIA 113 (1986). Control of groundwater for temporary works, 24. CIRIA 143 (1995). The Standard Penetration Test (SPT): Methods and Use.
Feeder 9 - River Humber Gas Pipeline Replacement Project
Ground Investigation Report 064298/F9/GEO/RPT/101 B
109
25. CIRIA C504 (1999). Engineering in Glacial Tills. 26. CIRIA C574 (2002). Engineering in Chalk. 27. CLARK, B.G., SMITH, A. (1992). A Model Specification for Radial Displacement Measuring
Pressuremeters. Ground Engineering. March 1992. 28. CLAYTON, C.R.I. (1983). The Influence of Diagenesis on Some Index Properties of Chalk In
England. Geotechnique. Vol 33, pp 225-241. 29. Council of the European Union (1978). Council Directive 78/659/EEC. Council Directive on
the quality of fresh waters needing protection or improvement in order to support fish life (Freshwater Fish Directive).
30. Council of the European Union (1998). Council Directive 98/83/EC. Council Directive on the quality of water intended for human consumption (Drinking Water Directive).
31. Deere, D.U., Peck, R.B., Parker, H.Monsees, J.E. & Schmidt, B. (1970). Design of tunnel support systems. Highway Research Report, No. 339 pgs 26-33.
32. ENVIRONMENTAL SCIENTIFICS GROUP. (2014 a). Feeder 9 – River Humber Pipeline Replacement Project marine Geophysical Survey. Reference no. L3224-13.
33. ENVIRONMENTAL SCIENTIFICS GROUP. (2014 b). Feeder 9 - River Humber Pipeline Replacement Project marine Geophysical Survey, Report on UXO Survey. Reference no. L3224-13/02.
34. GALE, I N, AND RUTTER, H K. (2006). The Chalk aquifer of Yorkshire. British Geological Survey Research Report, RR/06/04. pp68.
35. HARRIS, C.S., HART, M.D., VARLEY, P., WARREN, C. (1996). Engineering Geology of the Channel Tunnel. London: Thomas Telford Ltd
36. HIGHWAYS AGENCY (2009). Manual of Contract Documents for Highways Works. Volume 1 Specification for Highways Work. Series 600 Earthworks.
37. HOULSBY, A. C., (1976). Routine Interpretation of the Lugeon Water-Test. Quarterly Journal of Engineering Geology. Volume 9, pp. 303-313.
38. Hyder (2014).Feeder No. 9 – Humber Pipeline Replacement Project Flood Risk Assessment Stage 1. Rep No. 0007-UA006029-UU41R-01.
39. Kasling, H. And Thuro, K. (2010). Determining rock abrasivity in the laboratory. Proc. European Rock Mechanics Symposium EUROCK 2010, Lausanne, Switzerland.
40. MATTHEWS, M.C., CLAYTON, C.R.I. Compressibility of jointed rock masses with specific reference to chalk. Proceedings Eurock ’92, Chester. Thomas Telford, London, pp445-450.
41. SOIL ENGINEERING GEOSERVICES LIMITED. (2014). Report on a Ground Investigation for Feeder 9 – River Humber Pipeline Replacement Project, GI (Volumes 1 to 4, Currently draft). Reference no. TA7335 D01.
42. SUMBLER, M. G. (1999). The Stratigraphy of the Chalk Group in Yorkshire and Lincolnshire. British Geological Survey Technical Report WA/99/02.
43. The European Parliament and the Council of the European Union (2009). Directive 2009/31/EC. Directive establishing a framework for Community action in the field of water policy (Water Framework Directive).
44. National Grid (2009). T/SP/CE/2). Specification for the Design, Construction and testing of civil and structural works – Geotechnical, Ground Works and Foundations.
45. WARDELL ARMSTRONG. (2014). Trial Pitting – Stoneledge Field. Reference no. LE12311 001. 46. WHITEHEAD, E J, AND LAWRENCE, A R. (2006). The Chalk Aquifer System of Lincolnshire.
British Geological Survey Research Report, RR/06/03. pp70.
Feeder 9 - River Humber Gas Pipeline Replacement Project
Ground Investigation Report 064298/F9/GEO/RPT/101 B
110
Glossary
Term Description
Alluvium Material deposited by rivers, consisting of silt, sand, clay, and gravel, and often containing a good deal of organic matter.
Anglian Period of time between 320,000 and 480,000 years ago that includes an Ice Age.
Artesian Artesian conditions occur when the hydrostatic pressure exerted on an aquifer is great enough to cause the water to rise above the water table.
Aquiclude An impermeable body of rock or stratum of sediment that acts as a barrier to the flow of groundwater.
Aquifer A permeable geological stratum or formation that is capable of both storing and transmitting water in significant amounts.
Aquitard A confining bed that retards but does not completely stop the flow of water to or from an adjacent Aquifer.
Atterberg limits A basic measure of the nature of a fine-grained soil. Depending on the water content of the soil, it may appear in four states: solid, semi-solid, plastic and liquid. In each state, the consistency and behaviour of a soil is different and thus so are its engineering properties. Thus, the boundary between each state can be defined based on a change in the soil’s behaviour. The Atterberg limits can be used to distinguish between silt and clay, and it can distinguish between different types of silts and clays.
Borehole A hole excavated into the ground to obtain geological information.
Bulk density A property of materials and defined as the mass of particles divided by the total volume.
Burnham Chalk Formation White, thinly-bedded chalk with common tabular and discontinuous flint bands; sporadic marl seams. Formal subdivision; none as defined here, but there are many named marl and flint bands throughout the succession that are used to divide the formation. They are all of bed status.
Cenomanian The lowest stage of the Upper Cretaceous series spanning between 93.5 to 99.6 millions years ago.
Cerchar Abrasively Test A test to determine the potential abrasivity of the material.
Chalk In England, the Chalk topographically forms what are known as the ‘Downs’ in southern and eastern counties. It is comprised of a sequence of mainly soft, white, very fine-grained, extremely pure limestones which are commonly 300-400m thick. These rocks consist mainly of coccolith biomicrites formed from the skeletal elements of minute planktonic green algae, associated with varying proportions of larger microscopic fragments of bivalves, foraminifera and ostracods.
Cretaceous A geologic period and system from circa 145.5 ± 4 to 65.5 ± 0.3 million years (Ma) ago. In the geologic timescale, the Cretaceous follows on the Jurassic Period and is followed by the Paleogene Period of the Cenozoic Era. It is the youngest period of the Mesozoic Era and, at 80 million years long, the longest period of the Phanerozoic Eon. The end of the Cretaceous defines the boundary between the Mesozoic and Cenozoic eras. In many languages this period is known as ‘chalk period’.
The Cretaceous is divided into Early and Late Cretaceous epochs or Lower and Upper Cretaceous series.
Feeder 9 - River Humber Gas Pipeline Replacement Project
Ground Investigation Report 064298/F9/GEO/RPT/101 B
111
Term Description
Cryoturbation The disturbance (stirring and churning) of soil by frost action
Desk study An investigation of relevant available historical, archival and current information associated with a site and used to inform the decision process.
Dewatering The removal of water from solid material or soil by wet classification, centrifugation, filtration, or similar solid-liquid separation processes, such as removal of residual liquid from a filter cake by a filter press as part of various industrial processes.
Construction dewatering is a term used to describe removal or draining groundwater or surface water from a riverbed, construction site, caisson or mine shaft, by pumping or evaporation.
Dry Density The density of a sample containing no water.
Erosion The wearing away of any part of the Earth’s surface by natural agencies. These may include: mass wasting, action of waves, winds, streams and glaciers.
Eurocodes A set of harmonized technical rules developed by the European Committee for Standardisation for the design of construction works in the European Union.
Flamborough Chalk Formation
White, well bedded, flint free chalk with common marl seams (typically about 1 per meter). Common stylolitic surfaces and pyrite nodules. Part of the White Chalk Subgroup (WHCK).
Glacial A period during an Ice Age in which there is a considerable increase in the total area covered by Glaciers and Ice Sheets.
Glacial deposits Deposits formed through glacial processes, either directly related to an ice sheet or on the margins of an advancing or retreating ice sheet. Material can be highly variable.
Groundwater Water located beneath the ground surface in soil pore spaces and in the fractures of rock formations.
Holocene The Holocene is a geological epoch which began approximately 12,000 years ago (10,000
14C years ago). According to traditional geological thinking, the Holocene
continues to the present. The Holocene is part of the Quaternary period. It has been identified with the current warm period, known as MIS 1, and can be considered an interglacial in the current ice age.
Hydrogeology The area of geology that deals with the distribution and movement of groundwater in the soil and rocks of the Earth’s crust (commonly in aquifers).
Hydrology The study of the movement, distribution, and quality of water throughout the Earth, including the hydrologic cycle, water resources and environmental watershed sustainability.
Hydrostatic head The pressure at a given point in a liquid measured in terms of the vertical height of a column of the liquid needed to produce the same pressure
Interbedded Strata being positioned between or alternated with other layers of dissimilar character.
Interglacial The warmer interval between glacial periods during an Ice Age
Intertidal The intertidal zone, also known as the foreshore and seashore and sometimes referred to as the littoral zone, is the area that is above water at low tide and under water at high tide
Feeder 9 - River Humber Gas Pipeline Replacement Project
Ground Investigation Report 064298/F9/GEO/RPT/101 B
112
Term Description
Invert Level The base interior level of a pipe, trench or tunnel.
Laminations The formation of laminae or the state of being laminated specifically the finest stratification.
Lithology The physical characteristics of a rock, including colour, composition and texture.
Lithostratigraphy Stratigraphy concerned with the organisation of strata into units based on lithological character and the correlation of these units.
Liquid Limit The minimum moisture content at which the soil can flow under its own weight.
Made ground Area of dry land that has been constructed by people, generally through the reclamation of marshes, lakes, or shorelines. An artificial fill (landfill) is used, consisting of natural materials, refuse, etc.
Moisture content The quantity of water contained in a material expressed as mass of water divided by mass of dry mass.
Natural moisture content The amount of water which can be removed when a soil sample is dried at the temperature of 105°C.
Oedometer An instrument for measuring the rate and amount of consolidation of a soil specimen under pressure.
Ordnance Datum A vertical datum used by Ordnance Survey for deriving levels
Paedogenesis Formation of soil that formed over time as a consequence of climatic, mineral and biological processes.
Particle Density The density of the particles that make up the sample
Particle size distribution A list of values or a mathematical function that defines the relative amount of a sample, typically by mass, of particles present according to size.
Periphery A line that forms the boundary of an area
Periglacial Having locations, conditions, processes and topographical features that are adjacent to the boarders of a glacier.
Perched water Groundwater that is unconfined and separated from an underlying main body of groundwater by an unsaturated zone.
Permeability A measure of the ability of a material (such as rocks) to transmit fluids.
Piezometer A small-diameter observation well used to measure the hydraulic head of groundwater in aquifers; a standpipe, tube, vibrating wire piezometer or manometer used to measure the pressure of a fluid at a specific location in a column.
Plastic Limit The minimum moisture content in which the soil can be rolled into a 3mm diameter thread without breaking
Pleistocene The epoch from 2,588,000 to 12,000 years BC covering the world’s recent period of repeated glaciations.
Principal aquifer These are layers of rock or drift deposits that have high intergranular and/or
fracture permeability – meaning they usually provide a high level of water storage.
They may support water supply and/or river base flow on a strategic scale. In
most cases, principal aquifers are aquifers previously designated as major aquifer.
Putty (Chalk) A term used in relation to destructured, remoulded Chalk material
Feeder 9 - River Humber Gas Pipeline Replacement Project
Ground Investigation Report 064298/F9/GEO/RPT/101 B
113
Term Description
Pyrite (FeS2) An iron sulphide with a metallic lustre and pale-to-normal, brass-yellow hue, also known as ‘fool’s gold’ because of its resemblance to gold.
Pyrite is the most common of the sulphide minerals and is usually found associated with other sulphides or oxides in quartz veins, sedimentary rock and metamorphic rock, as well as in coal beds, and as a replacement mineral in fossils.
Quaternary The most recent of the three periods of the Cenozoic Era in the geologic timescale of the ICS. It follows the Tertiary Period, spanning 2.588 ± 0.005 million years ago to the present. The Quaternary includes two geologic epochs: the Pleistocene and the Holocene Epochs.
Saline Intrusion The movement of saline water into freshwater aquifers, which can lead to contamination of drinking water sources and other consequences. Certain human activities, especially groundwater pumping from coastal freshwater wells, have increased saltwater intrusion in many coastal areas. Water extraction drops the level of fresh groundwater, reducing its water pressure and allowing saltwater to flow further inland.
Secondary Aquifer These include a wide range of rock layers or drift deposits with an equally wide
range of water permeability and storage. Secondary aquifers are subdivided into
two types:
Secondary A - permeable layers capable of supporting water supplies at a local
rather than strategic scale, and in some cases forming an important source of base
flow to rivers. These are generally aquifers formerly classified as minor aquifers;
Secondary B - predominantly lower permeability layers which may store and yield
limited amounts of groundwater due to localised features such as fissures, thin
permeable horizons and weathering. These are generally the water-bearing parts
of the former non-aquifers.
Secondary Undifferentiated - has been assigned in cases where it has not been
possible to attribute either category A or B to a rock type. In most cases, this
means that the layer in question has previously been designated as both minor
and non-aquifer in different locations due to the variable characteristics of the
rock type.
Seismic Relating to or caused by earthquakes or artificially produced earth tremors.
Shear box An apparatus which can determine the resistance of a rock or soil to shearing. The soil is placed into a layered box. While a normal force is applied to the top layer, the bottom layer is pulled out sideways. The shear strength of the soil is the force which needs to be applied to deform the sample.
Silt Granular material of a grain size between sand and clay derived from soil or rock. Silt may occur as a soil or as suspended sediment (also known as suspended load) in a surface water body. It may also exist as soil deposited at the bottom of a water body.
Site of Special Strategic Importance
A conservation designation denoting a protected area.
Slake Durability A test to estimate the resistance of rocks, particularly argillaceous rocks, to a
combination of wetting and abrasion. Test results are expressed as a slake-
Feeder 9 - River Humber Gas Pipeline Replacement Project
Ground Investigation Report 064298/F9/GEO/RPT/101 B
114
Term Description
durability index for each particular rock.
Solifluction The slow down slope movement of water-logged earth material. Usually occurs in areas of permafrost when formed in cold environments.
Source Protection Zones These zones show the risk of contamination from any activities that might cause
pollution in the area. The closer the activity, the greater the risk. The maps show
three main zones (inner, outer and total catchment) and a fourth zone of special
interest, which are occasionally applied, to a groundwater source.
Stratum (pl. Strata) A layer of rock or soil with internally consistent characteristics that distinguish it from other layers. Each layer is generally one of a number of parallel layers that lie one upon another, laid down by natural forces.
Stratigraphy (adj. Stratigraphic; stratigraphical)
The study of rock strata, especially the distribution, deposition, and age of sedimentary rocks.
Superficial deposits Geological deposits typically of Quaternary age. May include stream channel and floodplain deposits, beach sands, talus gravels and glacial drift and moraine.
Topography The study of Earth’s surface shape and features or those of planets, moons, and asteroids. It is also the description of such surface shapes and features (especially their depiction in maps).
Triaxial test A common method to measure the mechanical properties of many deformable solids, especially soil, sand, clay, and other granular materials or powders.
Unexploded Ordnance Unexploded ordinance, mortar, artillery shells or cluster bombs which have not exploded.
Vuggy (Porosity) Due to vugs in calcareous rocks e.g the cavities formed by the dissolution of ooliths in limestone.
Weathering A destructive natural process by which rocks are altered with little or no transport of the fragmented or altered material. Maybe through mechanical or chemical weathering processes.

Feeder 9 - River Humber Gas Pipeline Replacement Project
Ground Investigation Report 064298/F9/GEO/RPT/101 B
115
Drawings
H160/BH/07/01/F9/101 P2 Ground Model Long Section
H160/BH/04/01/F9/102 B As Built Exploratory Hole Location Plan (Sheet 1 of 3)
H160/BH/04/01/F9/102 B As Built Exploratory Hole Location Plan (Sheet 2 of 3)
H160/BH/04/01/F9/102 B As Built Exploratory Hole Location Plan (Sheet 3 of 3)
H160/BH/07/01/F9/104 P1 Goxhill Ground Model Long Section
Feeder 9 - River Humber Gas Pipeline Replacement Project
Ground Investigation Report 064298/F9/GEO/RPT/101 B
116
Figures
Figure 2.2.1
Figure 3.3.1
Figure 3.6.1
Site Location Plan
Generalised Geological Succession for Site Area
Envirocheck Report Slices
Alluvium
Figure 6.1.1 Particle Size Distribution
Figure 6.1.2 Summary of Classification Data
Figure 6.1.3 Summary of Classification Data
Figure 6.1.4 Plasticity Chart
Figure 6.1.5 Undrained Shear Strength versus Reduced Level
Figure 6.1.6 SPT N versus Reduced Level in Cohesive Deposits
Figure 6.1.7 SPT N versus Reduced Level in Granular Deposits
Figure 6.1.8 Shear box Test
Figure 6.1.9 Oedometer Consolidation
Figure 6.1.10 In situ Coefficients of Volume Compressibility, mv and Swelling ms versus Elevation
Figure 6.1.11 Permeability versus Reduced Level
Figure 6.1.12 CPT Results around Drive Pit at Goxhill (Alluvial and Glacial Deposits)
Figure 6.1.13 CPT Results excluding Drive Pit at Goxhill (Alluvial and Glacial Deposits)
Figure 6.1.14 CPT Results at Paull (Alluvial and Glacial Deposits)
Glacial Deposits
Figure 6.2.1 Particle Size Distribution
Figure 6.2.2 Summary of Classification Data
Figure 6.2.3 Summary of Classification Data
Figure 6.2.4 Plasticity Chart
Figure 6.2.5 Undrained Shear Strength versus Reduced Level
Figure 6.2.6 SPT N versus Reduced Level in Cohesive Deposits
Figure 6.2.7 SPT N versus Reduced Level in Granular Deposits
Figure 6.2.8 Shear box Test
Figure 6.2.9 Consolidated Undrained Triaxial Test Multistage Stress Plot
Figure 6.2.10 Oedometer Consolidation
Figure 6.2.11 In situ Coefficients of Volume Compressibility, mv and Swelling ms versus Reduced Level
Figure 6.2.12 Permeability versus Reduced Level
Flamborough Chalk
Figure 6.3.1 Dry Density
Figure 6.3.2 Bulk Density
Figure 6.3.3 Saturated Moisture Content
Feeder 9 - River Humber Gas Pipeline Replacement Project
Ground Investigation Report 064298/F9/GEO/RPT/101 B
117
Figure 6.3.4 Natural Moisture Content, Plastic Limit, Liquid Limit, Plasticity Index and Liquidity Index.
Figure 6.3.5 Plasticity Chart
Figure 6.3.6 Slake Durability Index (first to second cycle)
Figure 6.3.7 Cerchar Abrasivity Index
Figure 6.3.8 UCS and Point Load Tests (Is50 correlation, K=18) against Reduced Level
Figure 6.3.9 UCS and Point Load Tests (Is50 correlation, K=18) against Depth Below Top of Chalk
Figure 6.3.10 Brazilian Tensile Test
Figure 6.3.11 Intact Modulus of Elasticity from UCS testing against Reduced Level
Figure 6.3.12 Intact Modulus of Elasticity from UCS testing against Depth Below Top of Chalk
Figure 6.3.13 Poisson’s Ratio
Figure 6.3.14 CPT Cone Resistance
Figure 6.3.15 CPT Friction Ratio
Figure 6.3.16 SPT N Value
Figure 6.3.17 RQD Values for all Boreholes
Figure 6.3.18 RQD Comparison with Geophysics
Figure 6.3.19 Flint and Marl Band Locations – Land Boreholes
Figure 6.3.20 Flint and Marl Band Locations – Marine Boreholes
Figure 6.3.21 Packer Test (M01 @ 24.5 m bgl)
Figure 6.3.22 Packer Test (M02 @ 24.0 m bgl)
Figure 6.3.23 Packer Test (M06 @ 35.75 m bgl)
Figure 6.3.24 Packer Test (M09 @ 35.0 m bgl)
Figure 6.3.25 Packer Test (M10 @ 32.25 m bgl)
Figure 6.3.26 Packer Test (M11 @ 45.5 m bgl)
Figure 6.3.27 Packer Test (M12 @ 25.5 m bgl)
Figure 6.3.28 Packer Test (M12 @ 30.6 m bgl)
Figure 6.3.29 Packer Test (M14 @ 35.0 m bgl)
Figure 6.3.30 Packer Test (M19 @ 21.5 m bgl)
Figure 6.3.31 Packer Test (M19 @ 29.5 m bgl)
Figure 6.3.32 Packer Test (M20 @ 40.0 m bgl)
Figure 6.3.33 Permeability Testing against Depth Below Ground Level
Figure 6.3.34 Permeability Testing against Reduced Level
Figure 6.3.35 HPD Testing - Shear Modulus against Reduced Level.
Figure 6.3.36 HPD Testing- Modulus of Elasticity against Reduced Level.
Figure 6.3.37 HPD Testing- Shear Modulus against Depth Below Top of Chalk.
Figure 6.3.38 HPD Testing- Modulus of Elasticity against Depth Below Top of Chalk.
Burnham Chalk
Figure 6.4.1 Dry Density
Feeder 9 - River Humber Gas Pipeline Replacement Project
Ground Investigation Report 064298/F9/GEO/RPT/101 B
118
Figure 6.4.2 Bulk Density
Figure 6.4.3 Saturated Moisture Content
Figure 6.4.4 Natural Moisture Content, Plastic Limit, Liquid Limit, Plasticity Index and Liquidity Index.
Figure 6.4.5 Plasticity Chart Index
Figure 6.4.6 Slake Durability Index (first to second cycle)
Figure 6.4.7 Cerchar Abrasivity
Figure 6.4.8 UCS and Point Load Tests (Is50 correlation, K=18) against Reduced Level
Figure 6.4.9 UCS and Point Load Tests (Is50 correlation, K=18) against Depth Below Top of Chalk.
Figure 6.4.10 Brazilian Tensile Test
Figure 6.4.11 Intact Elastic Modulus from UCS testing against Reduced Level
Figure 6.4.12 Intact Elastic Modulus from UCS testing against Depth Below Top of Chalk
Figure 6.4.13 Poisson’s Ratio
Figure 6.4.14 SPT N Value
Figure 6.4.15 Packer Test (L03 @ 38.0 m bgl)
Figure 6.4.16 Packer Test (M02 @ 34.0 m bgl)
Figure 6.4.17 Permeability Testing Results against Depth Below Ground Level
Figure 6.4.18 Permeability Testing Results against Reduced Level
Figure 6.4.19 HPD Testing – Shear Modulus against Reduced Level
Figure 6.4.20 HPD Testing – Modulus of Elasticity against with Reduced Level
BRE SD1
Figure 6.5.1 BRE SD1 Testing - Alluvium
Figure 6.52 BRE SD1 Testing - Glacial
Figure 6.5.3 BRE SD1 Testing - Chalk
Groundwater
Figure 6.7.1 Manual Water Level Measurements
Figure 6.7.2 Goxhill Diver Data – Piezometric Head as m AOD
Figure 6.7.3 Paull Diver Data – Piezometric Head as m AOD
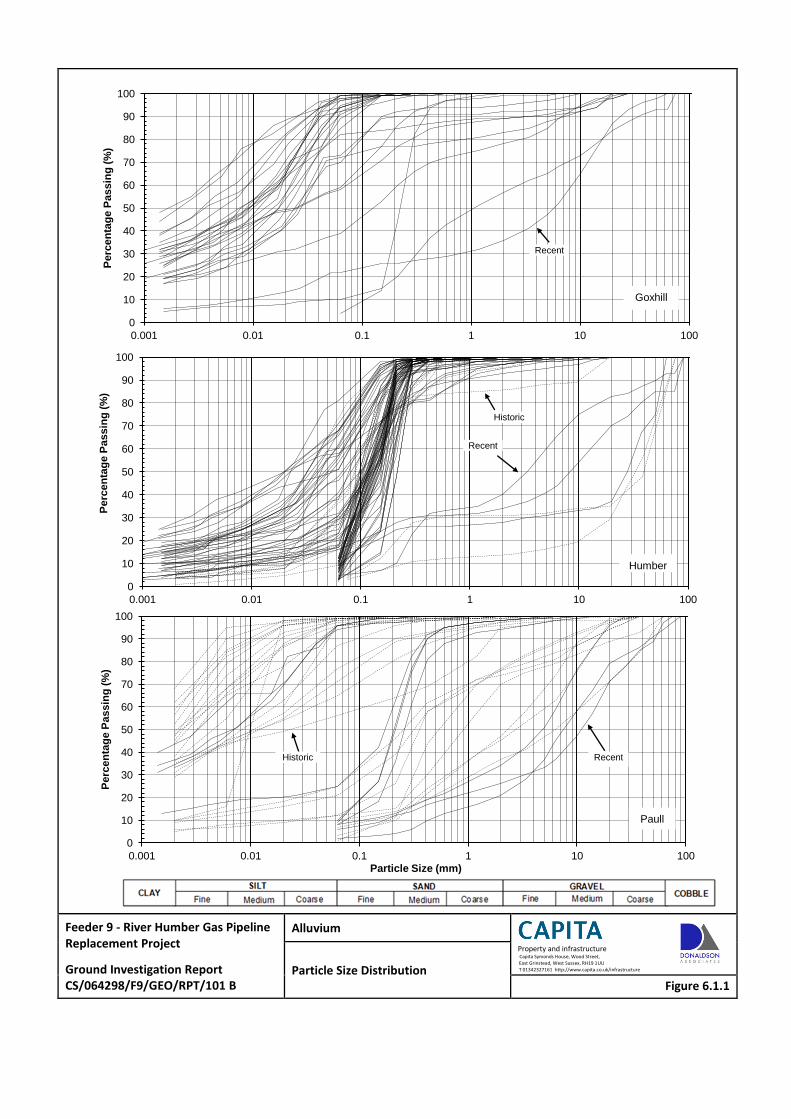
Feeder 9 - River Humber Gas Pipeline Replacement Project
Ground Investigation Report CS/064298/F9/GEO/RPT/101 B
Alluvium
Property and infrastructure Capita Symonds House, Wood Street, East Grinstead, West Sussex, RH19 1UU T 01342327161 http://www.capita.co.uk/infrastructure Particle Size Distribution
Figure 6.1.1
0
10
20
30
40
50
60
70
80
90
100
0.001 0.01 0.1 1 10 100
Perc
en
tag
e P
assin
g (
%)
Goxhill
Recent
0
10
20
30
40
50
60
70
80
90
100
0.001 0.01 0.1 1 10 100
Perc
en
tag
e P
assin
g (
%)
Humber
Historic
Recent
0
10
20
30
40
50
60
70
80
90
100
0.001 0.01 0.1 1 10 100
Perc
en
tag
e P
assin
g (
%)
Particle Size (mm)
Paull
Recent Historic
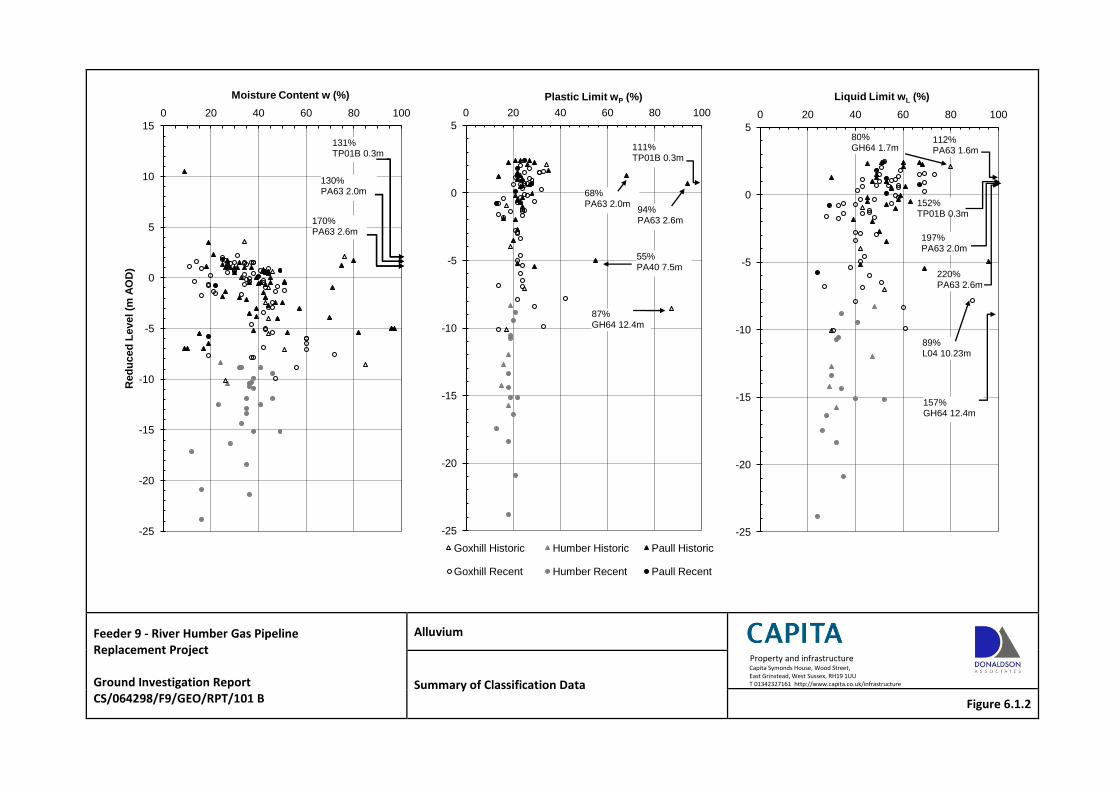
Feeder 9 - River Humber Gas Pipeline Replacement Project Ground Investigation Report CS/064298/F9/GEO/RPT/101 B
Alluvium
Property and infrastructure Capita Symonds House, Wood Street, East Grinstead, West Sussex, RH19 1UU T 01342327161 http://www.capita.co.uk/infrastructure Summary of Classification Data
Figure 6.1.2
-25
-20
-15
-10
-5
0
5
10
15
0 20 40 60 80 100
Red
uc
ed
Le
vel (m
AO
D)
Moisture Content w (%)
130% PA63 2.0m
170% PA63 2.6m
131% TP01B 0.3m
-25
-20
-15
-10
-5
0
5
0 20 40 60 80 100
Plastic Limit wP (%)
Goxhill Historic Humber Historic Paull Historic
Goxhill Recent Humber Recent Paull Recent
111% TP01B 0.3m
87% GH64 12.4m
68% PA63 2.0m
94% PA63 2.6m
55% PA40 7.5m
-25
-20
-15
-10
-5
0
5
0 20 40 60 80 100
Liquid Limit wL (%)
157% GH64 12.4m
89% L04 10.23m
80% GH64 1.7m
112% PA63 1.6m
152% TP01B 0.3m
197% PA63 2.0m
220% PA63 2.6m
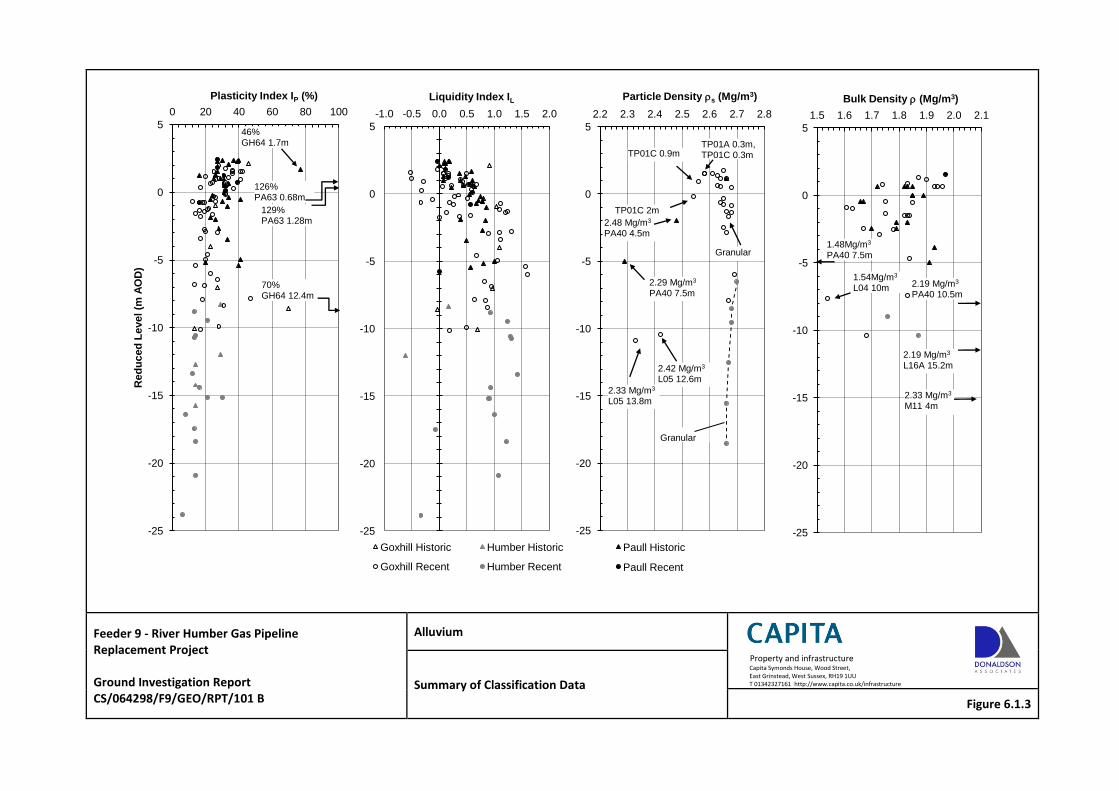
Feeder 9 - River Humber Gas Pipeline Replacement Project Ground Investigation Report CS/064298/F9/GEO/RPT/101 B
Alluvium
Property and infrastructure Capita Symonds House, Wood Street, East Grinstead, West Sussex, RH19 1UU T 01342327161 http://www.capita.co.uk/infrastructure Summary of Classification Data
Figure 6.1.3
-25
-20
-15
-10
-5
0
5
0 20 40 60 80 100
Red
uc
ed
Le
vel (m
AO
D)
Plasticity Index IP (%)
70% GH64 12.4m
46% GH64 1.7m
126% PA63 0.68m
129% PA63 1.28m
-25
-20
-15
-10
-5
0
5
-1.0 -0.5 0.0 0.5 1.0 1.5 2.0
Liquidity Index IL
Goxhill Historic Humber Historic
Goxhill Recent Humber Recent
-25
-20
-15
-10
-5
0
5
2.2 2.3 2.4 2.5 2.6 2.7 2.8
Particle Density s (Mg/m3)
Paull Historic
Paull Recent
2.42 Mg/m3
L05 12.6m
2.33 Mg/m3
L05 13.8m
TP01A 0.3m, TP01C 0.3m TP01C 0.9m
TP01C 2m
Granular
2.29 Mg/m3
PA40 7.5m
2.48 Mg/m3
PA40 4.5m
Granular
-25
-20
-15
-10
-5
0
5
1.5 1.6 1.7 1.8 1.9 2.0 2.1
Bulk Density (Mg/m3)
2.19 Mg/m3
PA40 10.5m
2.19 Mg/m3
L16A 15.2m
2.33 Mg/m3
M11 4m
1.54Mg/m3
L04 10m
1.48Mg/m3
PA40 7.5m
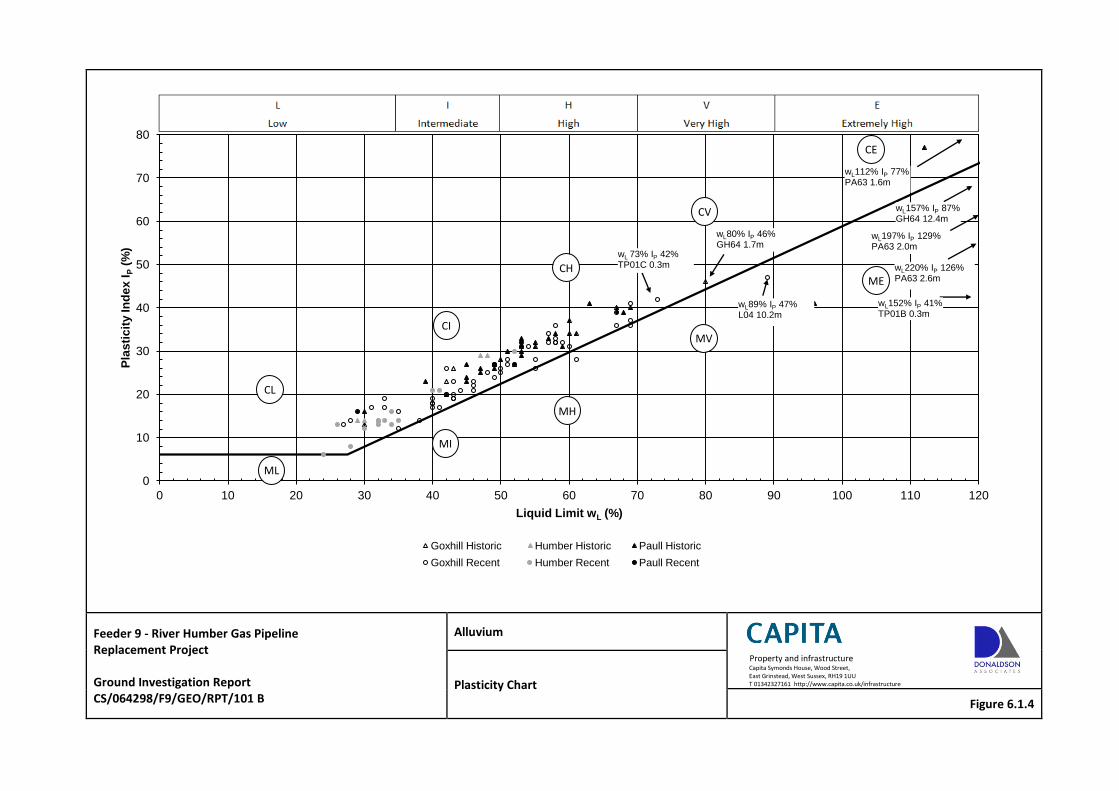
Feeder 9 - River Humber Gas Pipeline Replacement Project Ground Investigation Report CS/064298/F9/GEO/RPT/101 B
Alluvium
Property and infrastructure Capita Symonds House, Wood Street, East Grinstead, West Sussex, RH19 1UU T 01342327161 http://www.capita.co.uk/infrastructure Plasticity Chart
Figure 6.1.4
0
10
20
30
40
50
60
70
80
0 10 20 30 40 50 60 70 80 90 100 110 120
Pla
sti
cit
y I
nd
ex
IP (
%)
Liquid Limit wL (%)
Goxhill Historic Humber Historic Paull Historic
Goxhill Recent Humber Recent Paull Recent
CL
CI
ML
MI
CH
MV
CV
MH
CE
ME
wL157% IP 87% GH64 12.4m
wL80% IP 46% GH64 1.7m
wL 73% IP 42% TP01C 0.3m
wL89% IP 47% L04 10.2m
wL152% IP 41% TP01B 0.3m
wL112% IP 77% PA63 1.6m
wL197% IP 129% PA63 2.0m
wL220% IP 126% PA63 2.6m
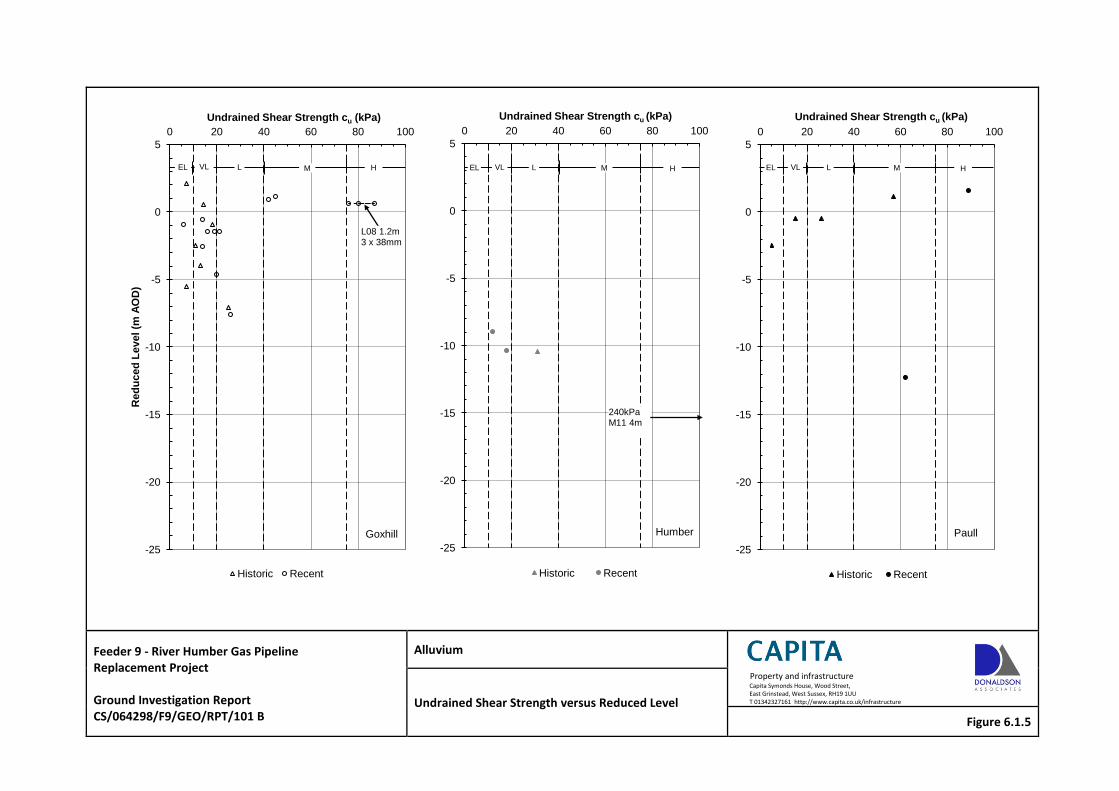
Feeder 9 - River Humber Gas Pipeline Replacement Project Ground Investigation Report CS/064298/F9/GEO/RPT/101 B
Alluvium
Property and infrastructure Capita Symonds House, Wood Street, East Grinstead, West Sussex, RH19 1UU T 01342327161 http://www.capita.co.uk/infrastructure Undrained Shear Strength versus Reduced Level
Figure 6.1.5
-25
-20
-15
-10
-5
0
5
0 20 40 60 80 100 R
ed
uc
ed
Le
vel (m
AO
D)
Undrained Shear Strength cu (kPa)
Historic Recent
EL L M H VL
L08 1.2m 3 x 38mm
Goxhill
-25
-20
-15
-10
-5
0
5
0 20 40 60 80 100
Undrained Shear Strength cu (kPa)
Historic Recent
EL L M H VL
Humber
240kPa M11 4m
-25
-20
-15
-10
-5
0
5
0 20 40 60 80 100
Undrained Shear Strength cu (kPa)
Historic Recent
EL L M H VL
Paull
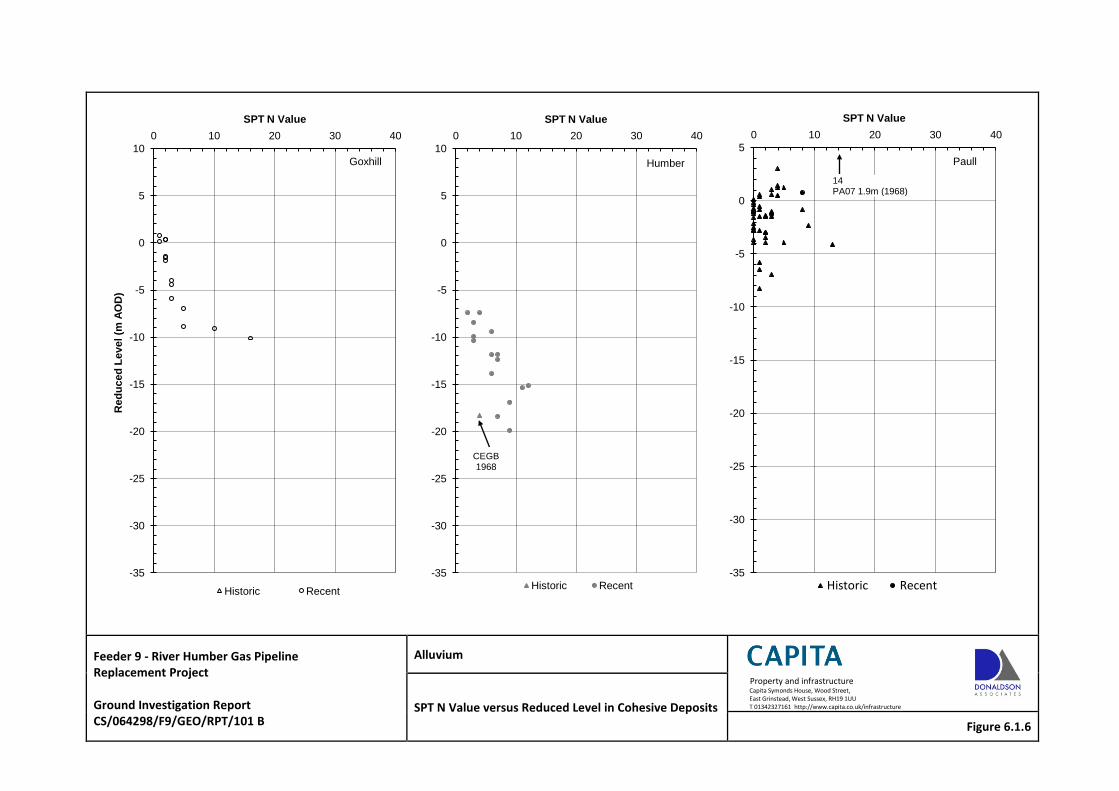
Feeder 9 - River Humber Gas Pipeline Replacement Project Ground Investigation Report CS/064298/F9/GEO/RPT/101 B
Alluvium
Property and infrastructure Capita Symonds House, Wood Street, East Grinstead, West Sussex, RH19 1UU T 01342327161 http://www.capita.co.uk/infrastructure SPT N Value versus Reduced Level in Cohesive Deposits
Figure 6.1.6
-35
-30
-25
-20
-15
-10
-5
0
5
10
0 10 20 30 40
Red
uc
ed
Le
vel (m
AO
D)
SPT N Value
Historic Recent
Goxhill
-35
-30
-25
-20
-15
-10
-5
0
5
10
0 10 20 30 40
SPT N Value
Historic Recent
Humber
CEGB 1968
-35
-30
-25
-20
-15
-10
-5
0
5
0 10 20 30 40
SPT N Value
Historic Recent
Paull
14 PA07 1.9m (1968)
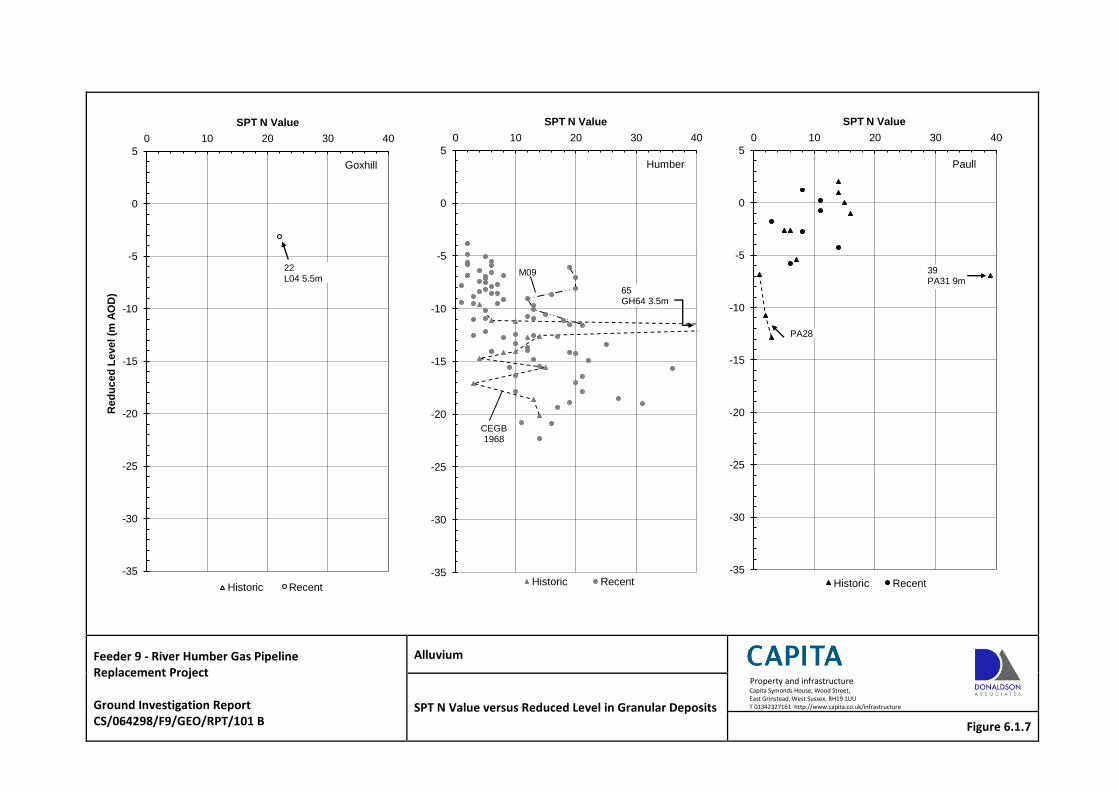
Feeder 9 - River Humber Gas Pipeline Replacement Project Ground Investigation Report CS/064298/F9/GEO/RPT/101 B
Alluvium
Property and infrastructure Capita Symonds House, Wood Street, East Grinstead, West Sussex, RH19 1UU T 01342327161 http://www.capita.co.uk/infrastructure SPT N Value versus Reduced Level in Granular Deposits
Figure 6.1.7
-35
-30
-25
-20
-15
-10
-5
0
5
0 10 20 30 40
Red
uc
ed
Le
vel (m
AO
D)
SPT N Value
Historic Recent
Goxhill
22 L04 5.5m
-35
-30
-25
-20
-15
-10
-5
0
5
0 10 20 30 40
SPT N Value
Historic Recent
Humber
M09
CEGB 1968
65 GH64 3.5m
-35
-30
-25
-20
-15
-10
-5
0
5
0 10 20 30 40
SPT N Value
Historic Recent
Paull
39 PA31 9m
PA28
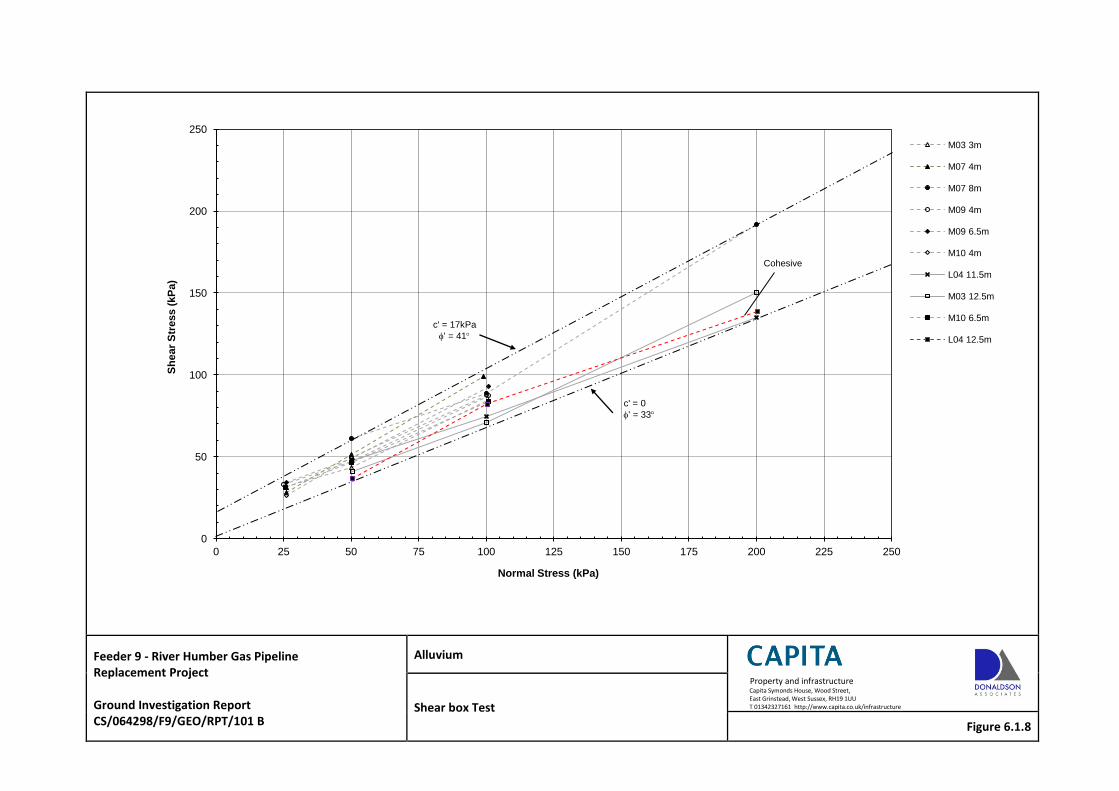
Feeder 9 - River Humber Gas Pipeline Replacement Project Ground Investigation Report CS/064298/F9/GEO/RPT/101 B
Alluvium
Property and infrastructure Capita Symonds House, Wood Street, East Grinstead, West Sussex, RH19 1UU T 01342327161 http://www.capita.co.uk/infrastructure Shear box Test
Figure 6.1.8
0
50
100
150
200
250
0 25 50 75 100 125 150 175 200 225 250
Sh
ear
Str
ess (
kP
a)
Normal Stress (kPa)
M03 3m
M07 4m
M07 8m
M09 4m
M09 6.5m
M10 4m
L04 11.5m
M03 12.5m
M10 6.5m
L04 12.5m
c' = 17kPa
' = 41
c' = 0
' = 33
Cohesive
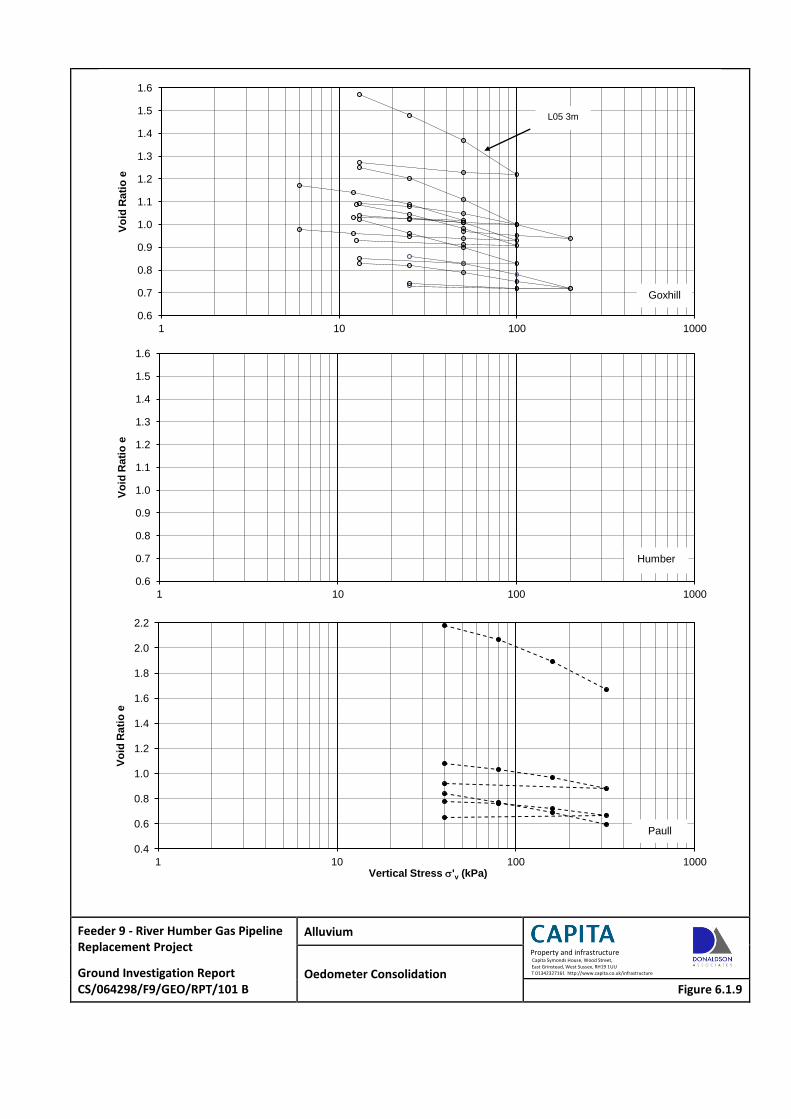
Feeder 9 - River Humber Gas Pipeline Replacement Project
Ground Investigation Report CS/064298/F9/GEO/RPT/101 B
Alluvium
Property and infrastructure Capita Symonds House, Wood Street, East Grinstead, West Sussex, RH19 1UU T 01342327161 http://www.capita.co.uk/infrastructure Oedometer Consolidation
Figure 6.1.9
0.6
0.7
0.8
0.9
1.0
1.1
1.2
1.3
1.4
1.5
1.6
1 10 100 1000
Vo
id R
ati
o e
Goxhill
L05 3m
0.6
0.7
0.8
0.9
1.0
1.1
1.2
1.3
1.4
1.5
1.6
1 10 100 1000
Vo
id R
ati
o e
Humber
0.4
0.6
0.8
1.0
1.2
1.4
1.6
1.8
2.0
2.2
1 10 100 1000
Vo
id R
ati
o e
Vertical Stress 'v (kPa)
Paull
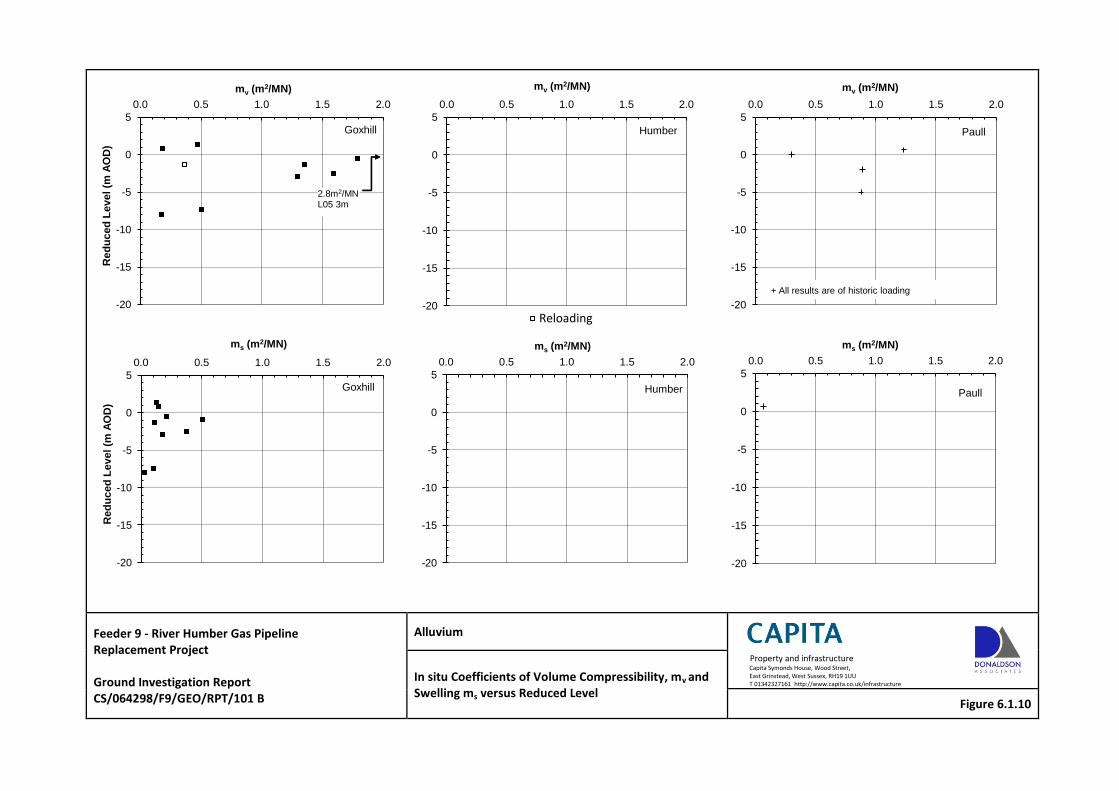
Feeder 9 - River Humber Gas Pipeline Replacement Project Ground Investigation Report CS/064298/F9/GEO/RPT/101 B
Alluvium
Property and infrastructure Capita Symonds House, Wood Street, East Grinstead, West Sussex, RH19 1UU T 01342327161 http://www.capita.co.uk/infrastructure In situ Coefficients of Volume Compressibility, mv and
Swelling ms versus Reduced Level Figure 6.1.10
-20
-15
-10
-5
0
5
0.0 0.5 1.0 1.5 2.0 R
ed
uc
ed
Le
vel (m
AO
D)
mv (m2/MN)
Goxhill
2.8m2/MN L05 3m
-20
-15
-10
-5
0
5
0.0 0.5 1.0 1.5 2.0
mv (m2/MN)
Reloading
Humber
-20
-15
-10
-5
0
5
0.0 0.5 1.0 1.5 2.0
mv (m2/MN)
Paull
+ All results are of historic loading
-20
-15
-10
-5
0
5
0.0 0.5 1.0 1.5 2.0
Red
uc
ed
Le
vel (m
AO
D)
ms (m2/MN)
Goxhill
-20
-15
-10
-5
0
5
0.0 0.5 1.0 1.5 2.0
ms (m2/MN)
Humber
-20
-15
-10
-5
0
5
0.0 0.5 1.0 1.5 2.0
ms (m2/MN)
Paull
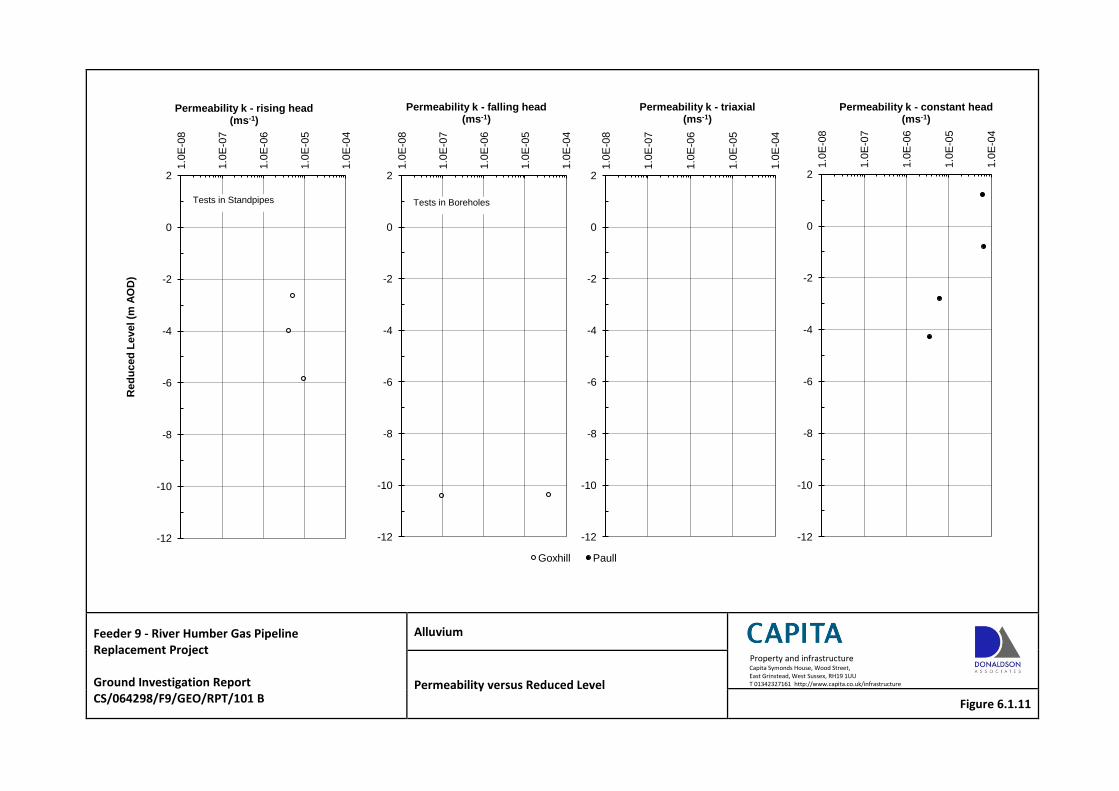
Feeder 9 - River Humber Gas Pipeline Replacement Project Ground Investigation Report CS/064298/F9/GEO/RPT/101 B
Alluvium
Property and infrastructure Capita Symonds House, Wood Street, East Grinstead, West Sussex, RH19 1UU T 01342327161 http://www.capita.co.uk/infrastructure Permeability versus Reduced Level
Figure 6.1.11
-12
-10
-8
-6
-4
-2
0
2 1.0
E-0
8
1.0
E-0
7
1.0
E-0
6
1.0
E-0
5
1.0
E-0
4
Red
uc
ed
Le
vel (m
AO
D)
Permeability k - rising head (ms-1)
Tests in Standpipes
-12
-10
-8
-6
-4
-2
0
2
1.0
E-0
8
1.0
E-0
7
1.0
E-0
6
1.0
E-0
5
1.0
E-0
4
Permeability k - falling head (ms-1)
Goxhill
Tests in Boreholes
-12
-10
-8
-6
-4
-2
0
2
1.0
E-0
8
1.0
E-0
7
1.0
E-0
6
1.0
E-0
5
1.0
E-0
4
Permeability k - triaxial (ms-1)
Paull
-12
-10
-8
-6
-4
-2
0
2
1.0
E-0
8
1.0
E-0
7
1.0
E-0
6
1.0
E-0
5
1.0
E-0
4
Permeability k - constant head (ms-1)
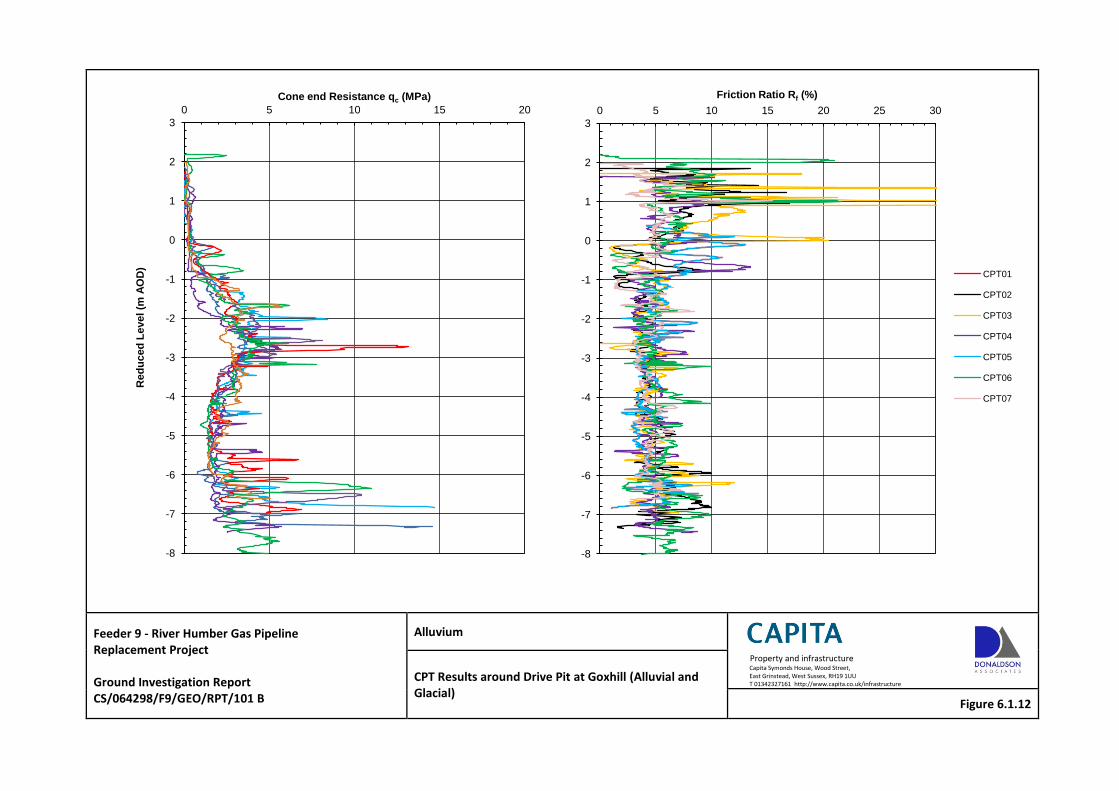
Feeder 9 - River Humber Gas Pipeline Replacement Project Ground Investigation Report CS/064298/F9/GEO/RPT/101 B
Alluvium
Property and infrastructure Capita Symonds House, Wood Street, East Grinstead, West Sussex, RH19 1UU T 01342327161 http://www.capita.co.uk/infrastructure CPT Results around Drive Pit at Goxhill (Alluvial and
Glacial) Figure 6.1.12
-8
-7
-6
-5
-4
-3
-2
-1
0
1
2
3
0 5 10 15 20
Red
uc
ed
Le
vel (m
AO
D)
Cone end Resistance qc (MPa)
-8
-7
-6
-5
-4
-3
-2
-1
0
1
2
3
0 5 10 15 20 25 30
Friction Ratio Rf (%)
CPT01
CPT02
CPT03
CPT04
CPT05
CPT06
CPT07
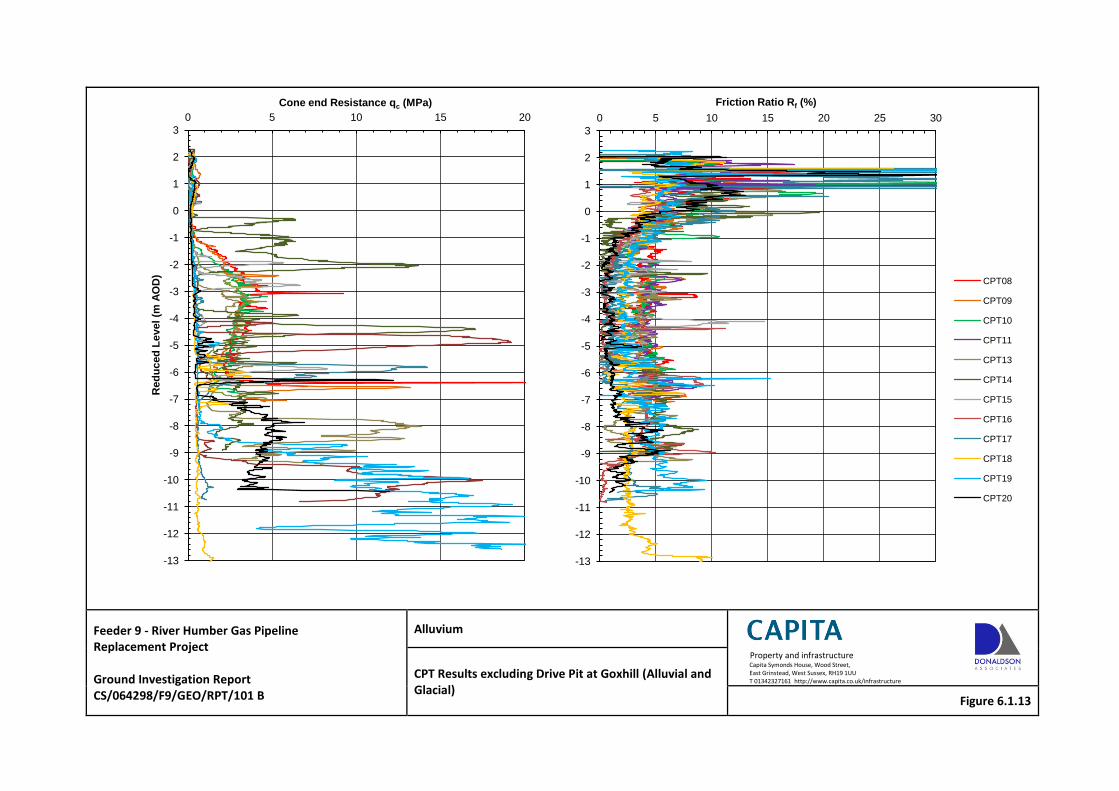
Feeder 9 - River Humber Gas Pipeline Replacement Project Ground Investigation Report CS/064298/F9/GEO/RPT/101 B
Alluvium
Property and infrastructure Capita Symonds House, Wood Street, East Grinstead, West Sussex, RH19 1UU T 01342327161 http://www.capita.co.uk/infrastructure CPT Results excluding Drive Pit at Goxhill (Alluvial and
Glacial) Figure 6.1.13
-13
-12
-11
-10
-9
-8
-7
-6
-5
-4
-3
-2
-1
0
1
2
3
0 5 10 15 20
Red
uc
ed
Le
vel (m
AO
D)
Cone end Resistance qc (MPa)
-13
-12
-11
-10
-9
-8
-7
-6
-5
-4
-3
-2
-1
0
1
2
3
0 5 10 15 20 25 30
Friction Ratio Rf (%)
CPT08
CPT09
CPT10
CPT11
CPT13
CPT14
CPT15
CPT16
CPT17
CPT18
CPT19
CPT20
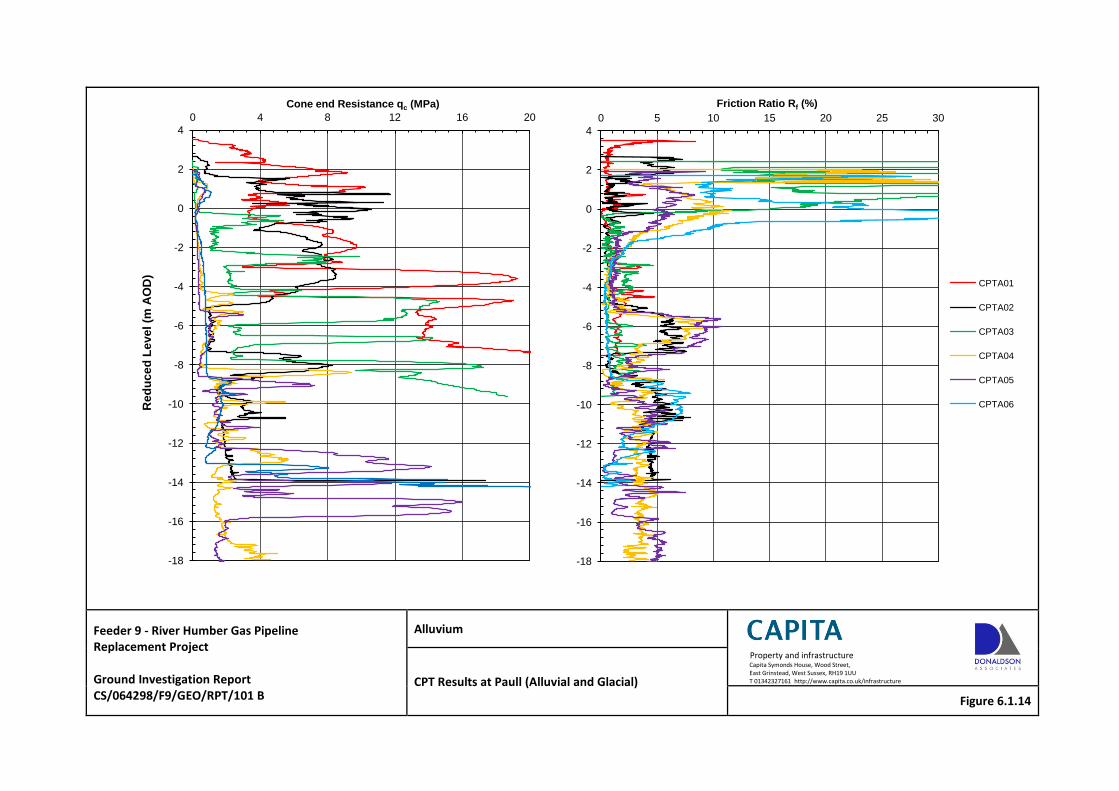
Feeder 9 - River Humber Gas Pipeline Replacement Project Ground Investigation Report CS/064298/F9/GEO/RPT/101 B
Alluvium
Property and infrastructure Capita Symonds House, Wood Street, East Grinstead, West Sussex, RH19 1UU T 01342327161 http://www.capita.co.uk/infrastructure CPT Results at Paull (Alluvial and Glacial)
Figure 6.1.14
-18
-16
-14
-12
-10
-8
-6
-4
-2
0
2
4
0 4 8 12 16 20
Red
uc
ed
Le
ve
l (m
AO
D)
Cone end Resistance qc (MPa)
-18
-16
-14
-12
-10
-8
-6
-4
-2
0
2
4
0 5 10 15 20 25 30
Friction Ratio Rf (%)
CPTA01
CPTA02
CPTA03
CPTA04
CPTA05
CPTA06
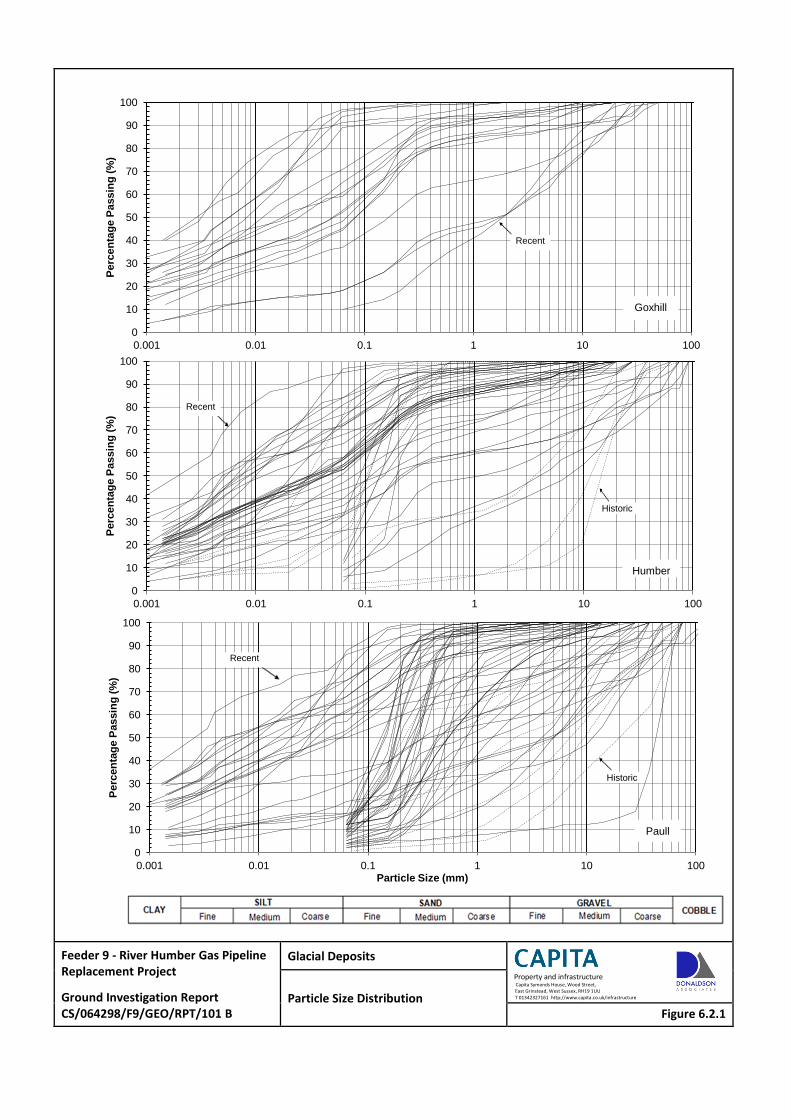
Feeder 9 - River Humber Gas Pipeline Replacement Project
Ground Investigation Report CS/064298/F9/GEO/RPT/101 B
Glacial Deposits
Property and infrastructure Capita Symonds House, Wood Street, East Grinstead, West Sussex, RH19 1UU T 01342327161 http://www.capita.co.uk/infrastructure Particle Size Distribution
Figure 6.2.1
0
10
20
30
40
50
60
70
80
90
100
0.001 0.01 0.1 1 10 100
Perc
en
tag
e P
assin
g (
%)
Goxhill
Recent
0
10
20
30
40
50
60
70
80
90
100
0.001 0.01 0.1 1 10 100
Perc
en
tag
e P
assin
g (
%)
Humber
Historic
Recent
0
10
20
30
40
50
60
70
80
90
100
0.001 0.01 0.1 1 10 100
Perc
en
tag
e P
assin
g (
%)
Particle Size (mm)
Paull
Recent
Historic
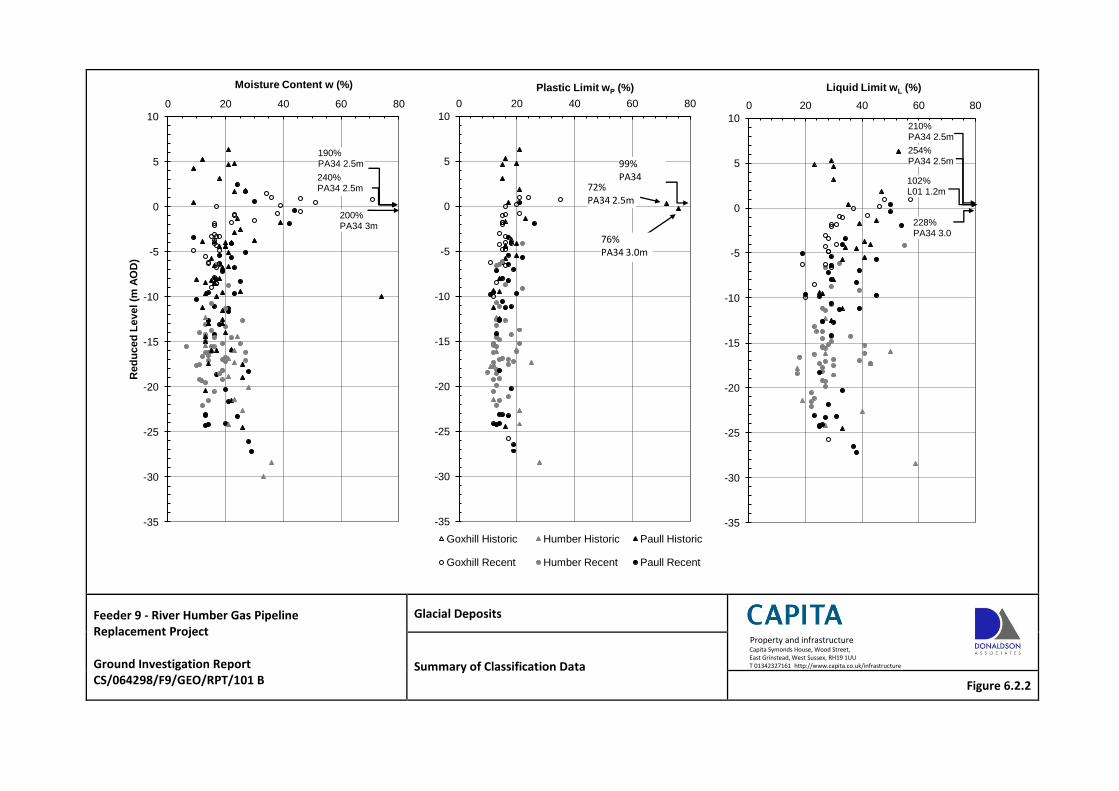
Feeder 9 - River Humber Gas Pipeline Replacement Project Ground Investigation Report CS/064298/F9/GEO/RPT/101 B
Glacial Deposits
Property and infrastructure Capita Symonds House, Wood Street, East Grinstead, West Sussex, RH19 1UU T 01342327161 http://www.capita.co.uk/infrastructure Summary of Classification Data
Figure 6.2.2
-35
-30
-25
-20
-15
-10
-5
0
5
10
0 20 40 60 80
Red
uc
ed
Le
vel (m
AO
D)
Moisture Content w (%)
190% PA34 2.5m
200% PA34 3m
240% PA34 2.5m
-35
-30
-25
-20
-15
-10
-5
0
5
10
0 20 40 60 80
Plastic Limit wP (%)
Goxhill Historic Humber Historic Paull Historic
Goxhill Recent Humber Recent Paull Recent
72% PA34 2.5m
76% PA34 3.0m
99% PA34
-35
-30
-25
-20
-15
-10
-5
0
5
10
0 20 40 60 80
Liquid Limit wL (%)
102% L01 1.2m
210% PA34 2.5m
254% PA34 2.5m
228% PA34 3.0
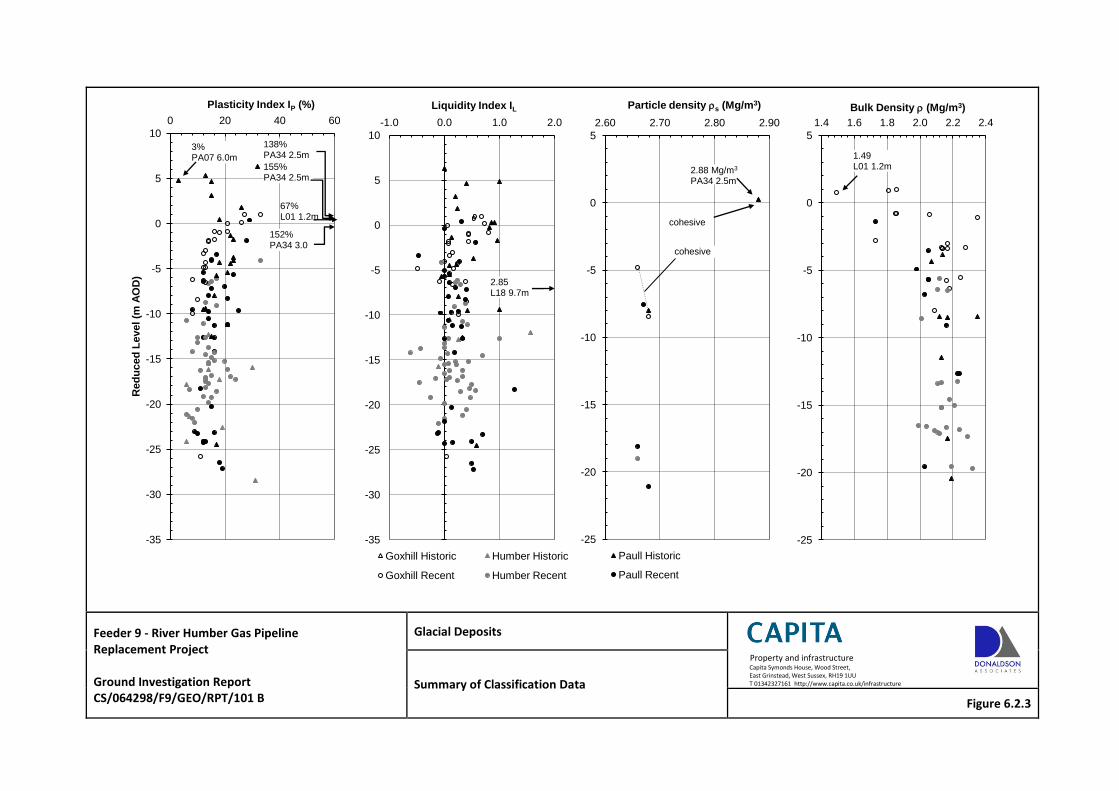
Feeder 9 - River Humber Gas Pipeline Replacement Project Ground Investigation Report CS/064298/F9/GEO/RPT/101 B
Glacial Deposits
Property and infrastructure Capita Symonds House, Wood Street, East Grinstead, West Sussex, RH19 1UU T 01342327161 http://www.capita.co.uk/infrastructure Summary of Classification Data
Figure 6.2.3
-35
-30
-25
-20
-15
-10
-5
0
5
10
0 20 40 60
Red
uc
ed
Le
vel (m
AO
D)
Plasticity Index IP (%)
67% L01 1.2m
138% PA34 2.5m
155% PA34 2.5m
152% PA34 3.0
3% PA07 6.0m
-35
-30
-25
-20
-15
-10
-5
0
5
10
-1.0 0.0 1.0 2.0
Liquidity Index IL
Goxhill Historic Humber Historic
Goxhill Recent Humber Recent
2.85 L18 9.7m
-25
-20
-15
-10
-5
0
5
2.60 2.70 2.80 2.90
Particle density s (Mg/m3)
Paull Historic
Paull Recent
2.88 Mg/m3
PA34 2.5m
cohesive
cohesive
-25
-20
-15
-10
-5
0
5
1.4 1.6 1.8 2.0 2.2 2.4
Bulk Density (Mg/m3)
1.49 L01 1.2m
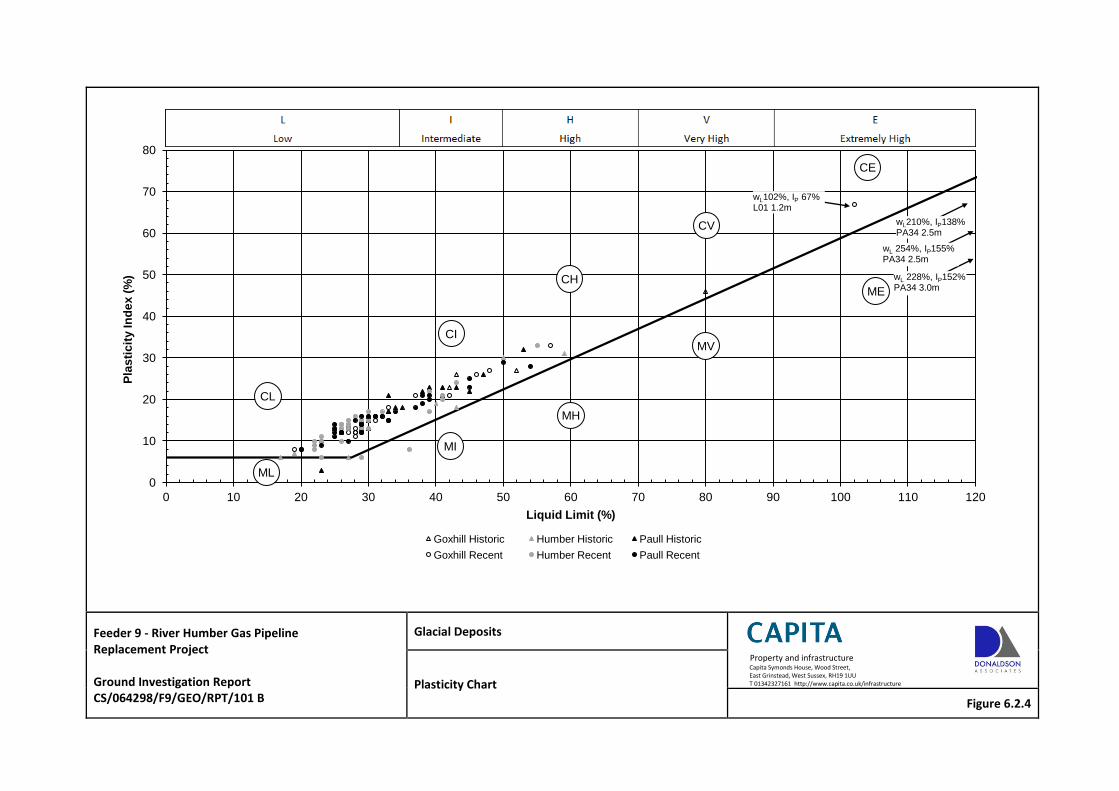
Feeder 9 - River Humber Gas Pipeline Replacement Project Ground Investigation Report CS/064298/F9/GEO/RPT/101 B
Glacial Deposits
Property and infrastructure Capita Symonds House, Wood Street, East Grinstead, West Sussex, RH19 1UU T 01342327161 http://www.capita.co.uk/infrastructure Plasticity Chart
Figure 6.2.4
0
10
20
30
40
50
60
70
80
0 10 20 30 40 50 60 70 80 90 100 110 120
Pla
sti
cit
y I
nd
ex
(%
)
Liquid Limit (%)
Goxhill Historic Humber Historic Paull Historic
Goxhill Recent Humber Recent Paull Recent
wL210%, IP138% PA34 2.5m
CL
CI
ML
MI
CH
MV
CV
MH
CE
ME
wL102%, IP 67% L01 1.2m
wL 254%, IP155% PA34 2.5m
wL 228%, IP152% PA34 3.0m
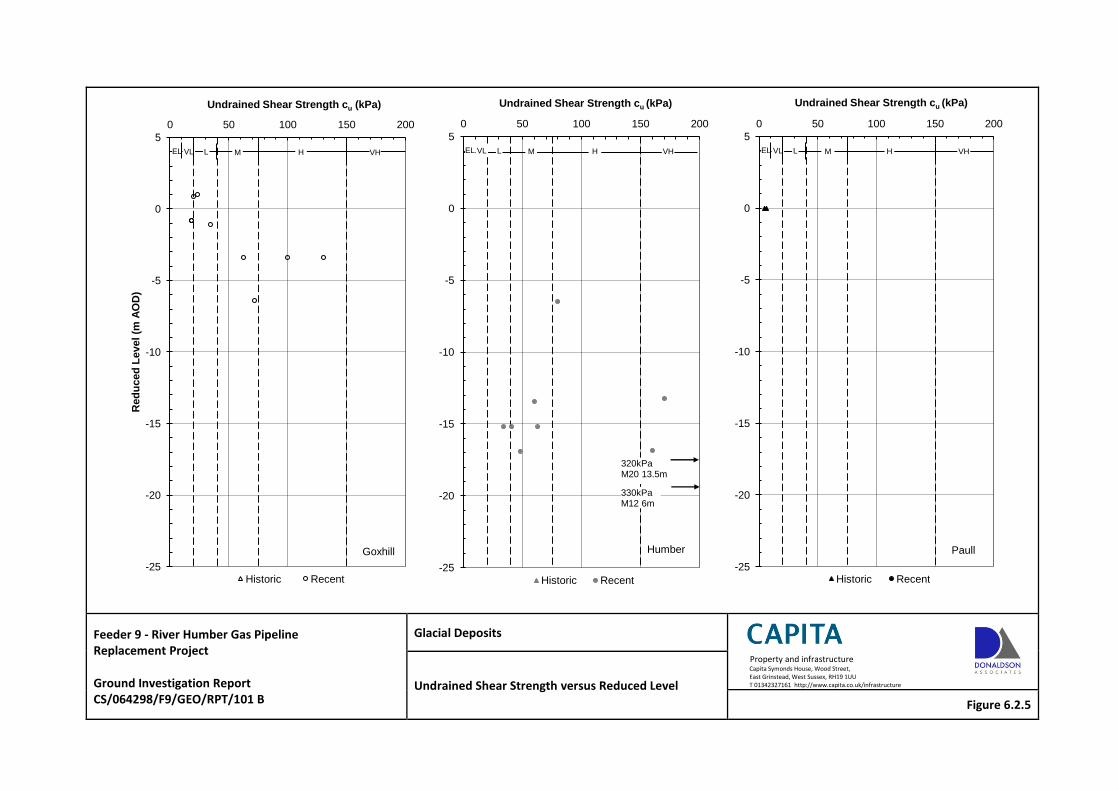
Feeder 9 - River Humber Gas Pipeline Replacement Project Ground Investigation Report CS/064298/F9/GEO/RPT/101 B
Glacial Deposits
Property and infrastructure Capita Symonds House, Wood Street, East Grinstead, West Sussex, RH19 1UU T 01342327161 http://www.capita.co.uk/infrastructure Undrained Shear Strength versus Reduced Level
Figure 6.2.5
-25
-20
-15
-10
-5
0
5
0 50 100 150 200 R
ed
uc
ed
Le
vel (m
AO
D)
Undrained Shear Strength cu (kPa)
Historic Recent
EL L M H VH VL
Goxhill
-25
-20
-15
-10
-5
0
5
0 50 100 150 200
Undrained Shear Strength cu (kPa)
Historic Recent
VH EL L M H VL
330kPa M12 6m
Humber
320kPa M20 13.5m
-25
-20
-15
-10
-5
0
5
0 50 100 150 200
Undrained Shear Strength cu (kPa)
Historic Recent
VH EL L M H VL
Paull
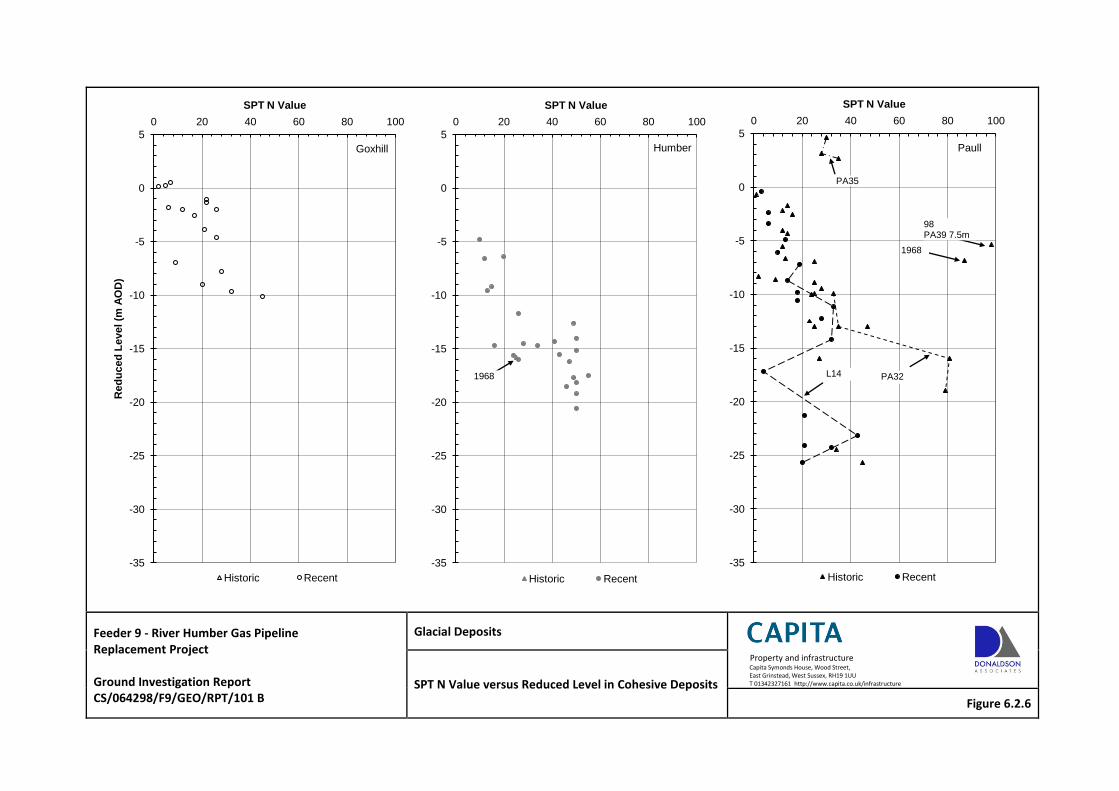
Feeder 9 - River Humber Gas Pipeline Replacement Project Ground Investigation Report CS/064298/F9/GEO/RPT/101 B
Glacial Deposits
Property and infrastructure Capita Symonds House, Wood Street, East Grinstead, West Sussex, RH19 1UU T 01342327161 http://www.capita.co.uk/infrastructure SPT N Value versus Reduced Level in Cohesive Deposits
Figure 6.2.6
-35
-30
-25
-20
-15
-10
-5
0
5
0 20 40 60 80 100 R
ed
uc
ed
Le
vel (m
AO
D)
SPT N Value
Historic Recent
Goxhill
-35
-30
-25
-20
-15
-10
-5
0
5
0 20 40 60 80 100
SPT N Value
Historic Recent
Humber
1968
-35
-30
-25
-20
-15
-10
-5
0
5
0 20 40 60 80 100
SPT N Value
Historic Recent
Paull
PA35
98 PA39 7.5m
PA32 L14
1968
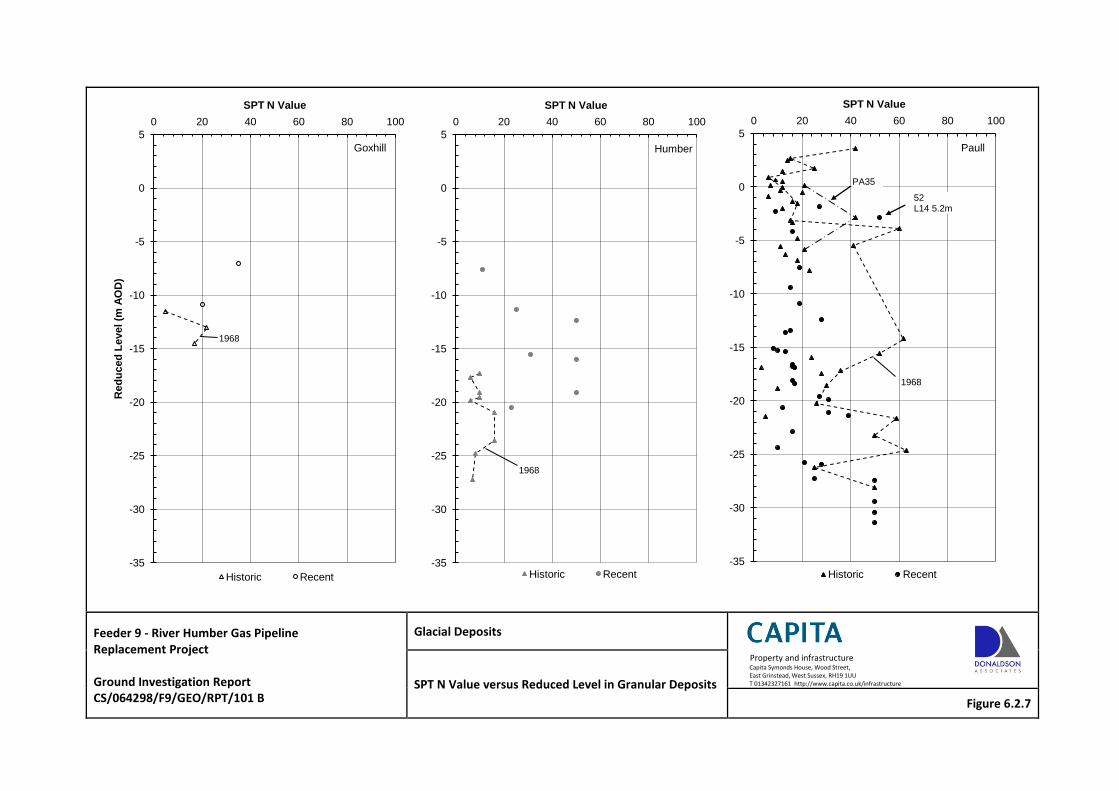
Feeder 9 - River Humber Gas Pipeline Replacement Project Ground Investigation Report CS/064298/F9/GEO/RPT/101 B
Glacial Deposits
Property and infrastructure Capita Symonds House, Wood Street, East Grinstead, West Sussex, RH19 1UU T 01342327161 http://www.capita.co.uk/infrastructure SPT N Value versus Reduced Level in Granular Deposits
Figure 6.2.7
-35
-30
-25
-20
-15
-10
-5
0
5
0 20 40 60 80 100 R
ed
uc
ed
Le
vel (m
AO
D)
SPT N Value
Historic Recent
Goxhill
1968
-35
-30
-25
-20
-15
-10
-5
0
5
0 20 40 60 80 100
SPT N Value
Historic Recent
1968
Humber
-35
-30
-25
-20
-15
-10
-5
0
5
0 20 40 60 80 100
SPT N Value
Historic Recent
Paull
PA35
52 L14 5.2m
1968
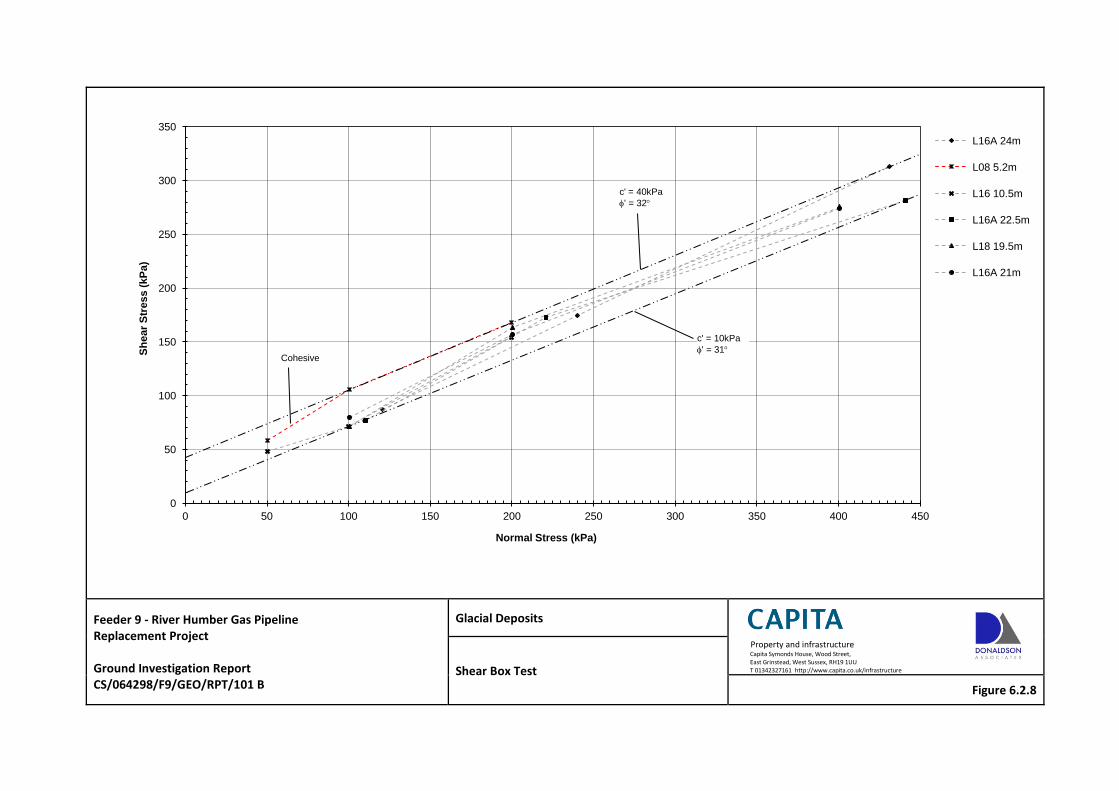
Feeder 9 - River Humber Gas Pipeline Replacement Project Ground Investigation Report CS/064298/F9/GEO/RPT/101 B
Glacial Deposits
Property and infrastructure Capita Symonds House, Wood Street, East Grinstead, West Sussex, RH19 1UU T 01342327161 http://www.capita.co.uk/infrastructure Shear Box Test
Figure 6.2.8
0
50
100
150
200
250
300
350
0 50 100 150 200 250 300 350 400 450
Sh
ear
Str
ess (
kP
a)
Normal Stress (kPa)
L16A 24m
L08 5.2m
L16 10.5m
L16A 22.5m
L18 19.5m
L16A 21m
c' = 10kPa
' = 31
c' = 40kPa
' = 32
Cohesive
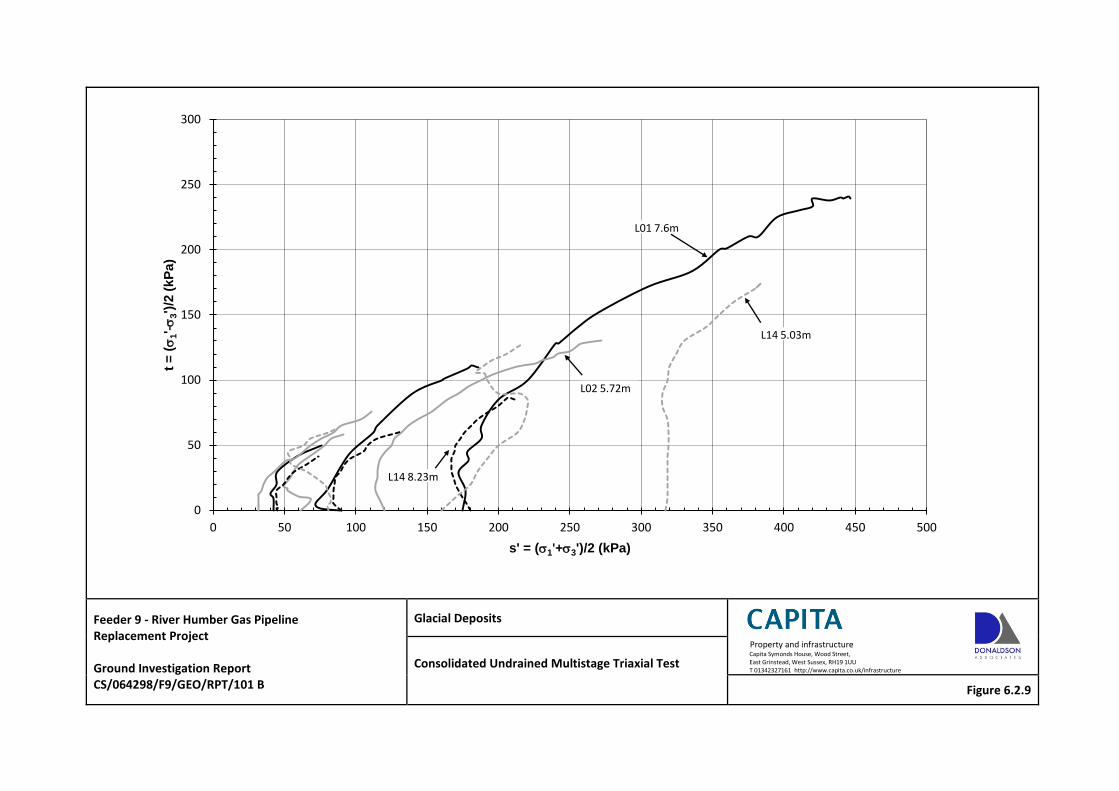
Feeder 9 - River Humber Gas Pipeline Replacement Project Ground Investigation Report CS/064298/F9/GEO/RPT/101 B
Glacial Deposits
Property and infrastructure Capita Symonds House, Wood Street, East Grinstead, West Sussex, RH19 1UU T 01342327161 http://www.capita.co.uk/infrastructure Consolidated Undrained Multistage Triaxial Test
Figure 6.2.9
0
50
100
150
200
250
300
0 50 100 150 200 250 300 350 400 450 500
t =
(
1'-
3')
/2 (
kP
a)
s' = (1'+3')/2 (kPa)
L01 7.6m
L14 5.03m
L02 5.72m
L14 8.23m
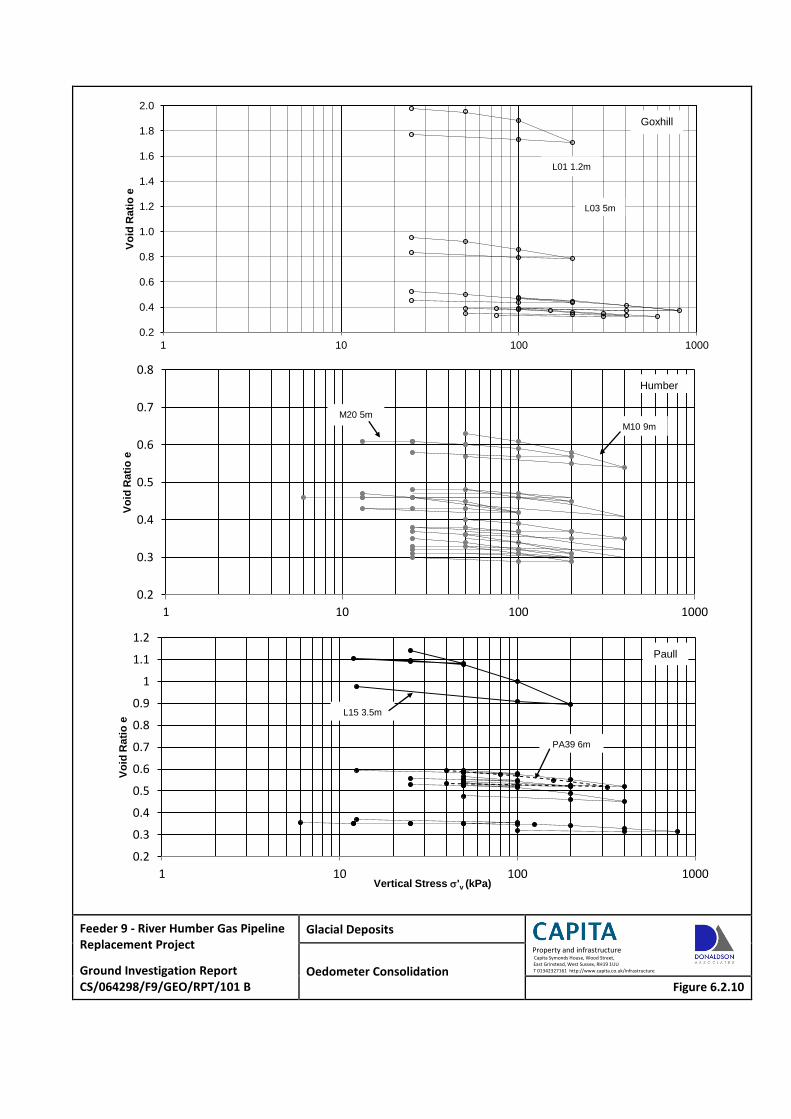
Feeder 9 - River Humber Gas Pipeline Replacement Project
Ground Investigation Report CS/064298/F9/GEO/RPT/101 B
Glacial Deposits
Property and infrastructure Capita Symonds House, Wood Street, East Grinstead, West Sussex, RH19 1UU T 01342327161 http://www.capita.co.uk/infrastructure Oedometer Consolidation
Figure 6.2.10
0.2
0.4
0.6
0.8
1.0
1.2
1.4
1.6
1.8
2.0
1 10 100 1000
Vo
id R
ati
o e
Goxhill
L01 1.2m
L03 5m
0.2
0.3
0.4
0.5
0.6
0.7
0.8
1 10 100 1000
Vo
id R
ati
o e
Humber
M10 9m
M20 5m
0.2
0.3
0.4
0.5
0.6
0.7
0.8
0.9
1
1.1
1.2
1 10 100 1000
Vo
id R
ati
o e
Vertical Stress 'v (kPa)
Paull
L15 3.5m
PA39 6m
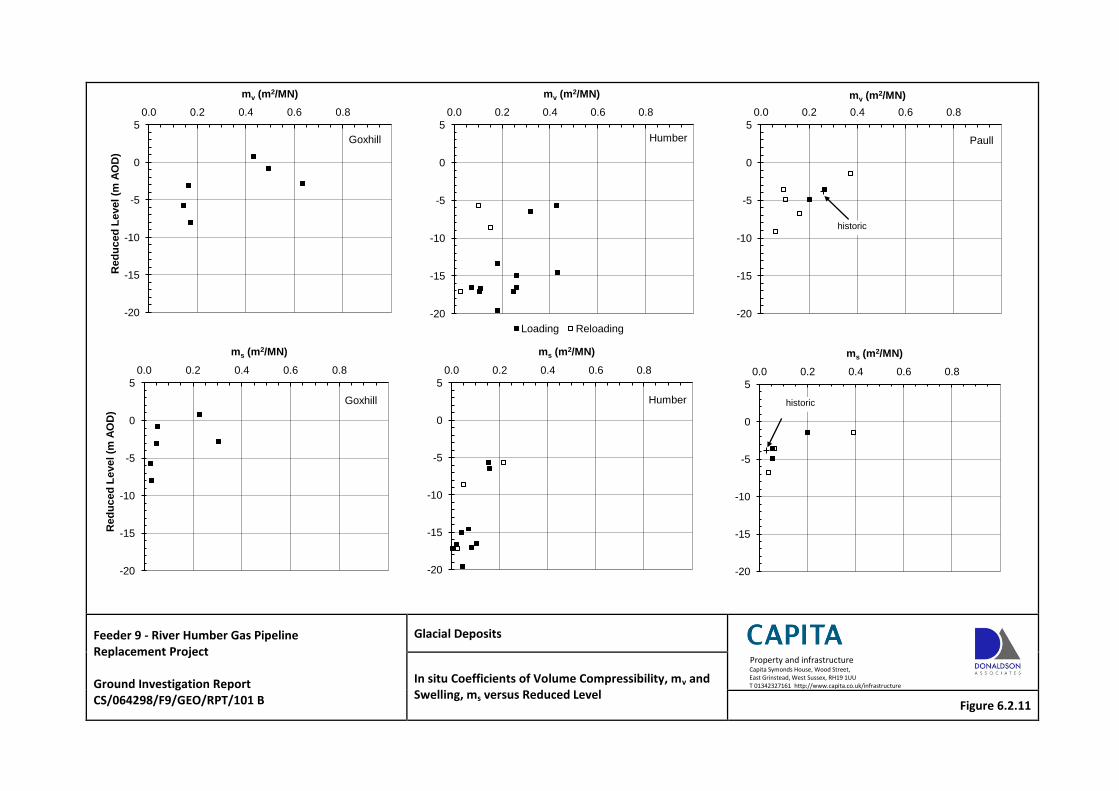
Feeder 9 - River Humber Gas Pipeline Replacement Project Ground Investigation Report CS/064298/F9/GEO/RPT/101 B
Glacial Deposits
Property and infrastructure Capita Symonds House, Wood Street, East Grinstead, West Sussex, RH19 1UU T 01342327161 http://www.capita.co.uk/infrastructure In situ Coefficients of Volume Compressibility, mv and
Swelling, ms versus Reduced Level Figure 6.2.11
-20
-15
-10
-5
0
5
0.0 0.2 0.4 0.6 0.8 R
ed
uc
ed
Le
vel (m
AO
D)
mv (m2/MN)
Goxhill
-20
-15
-10
-5
0
5
0.0 0.2 0.4 0.6 0.8
mv (m2/MN)
Loading Reloading
Humber
-20
-15
-10
-5
0
5
0.0 0.2 0.4 0.6 0.8
mv (m2/MN)
Paull
historic
-20
-15
-10
-5
0
5
0.0 0.2 0.4 0.6 0.8
Red
uc
ed
Le
vel (m
AO
D)
ms (m2/MN)
Goxhill
-20
-15
-10
-5
0
5
0.0 0.2 0.4 0.6 0.8
ms (m2/MN)
Humber
-20
-15
-10
-5
0
5
0.0 0.2 0.4 0.6 0.8
ms (m2/MN)
historic
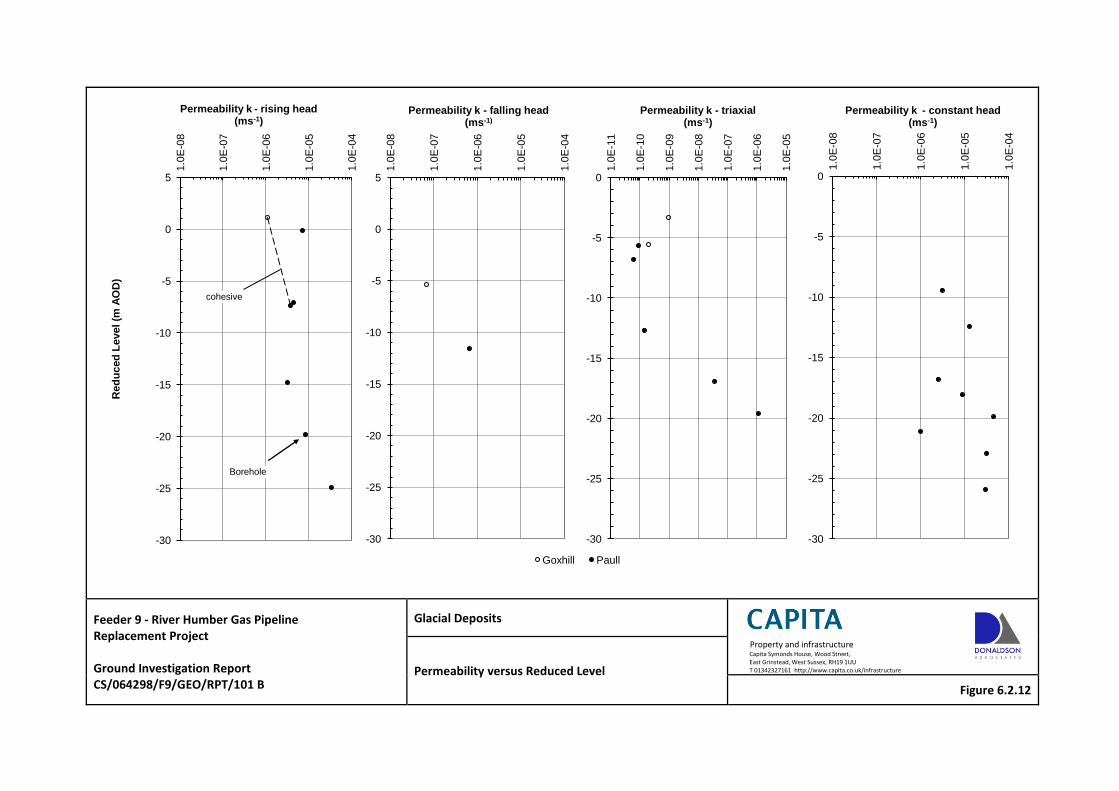
Feeder 9 - River Humber Gas Pipeline Replacement Project Ground Investigation Report CS/064298/F9/GEO/RPT/101 B
Glacial Deposits
Property and infrastructure Capita Symonds House, Wood Street, East Grinstead, West Sussex, RH19 1UU T 01342327161 http://www.capita.co.uk/infrastructure Permeability versus Reduced Level
Figure 6.2.12
-30
-25
-20
-15
-10
-5
0
5 1.0
E-0
8
1.0
E-0
7
1.0
E-0
6
1.0
E-0
5
1.0
E-0
4
Red
uc
ed
Le
vel (m
AO
D)
Permeability k - rising head (ms-1)
Borehole
cohesive
-30
-25
-20
-15
-10
-5
0
5
1.0
E-0
8
1.0
E-0
7
1.0
E-0
6
1.0
E-0
5
1.0
E-0
4
Permeability k - falling head (ms-1)
Goxhill
-30
-25
-20
-15
-10
-5
0
1.0
E-1
1
1.0
E-1
0
1.0
E-0
9
1.0
E-0
8
1.0
E-0
7
1.0
E-0
6
1.0
E-0
5
Permeability k - triaxial (ms-1)
Paull
-30
-25
-20
-15
-10
-5
0
1.0
E-0
8
1.0
E-0
7
1.0
E-0
6
1.0
E-0
5
1.0
E-0
4
Permeability k - constant head (ms-1)
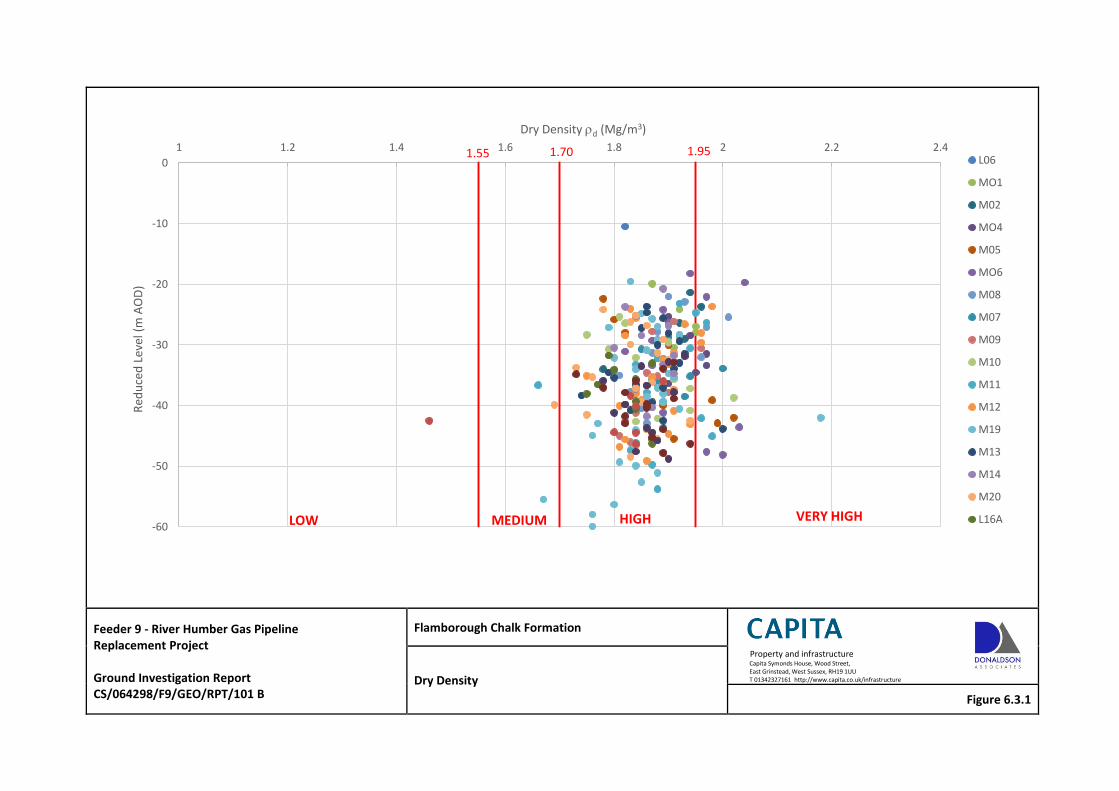
Feeder 9 - River Humber Gas Pipeline Replacement Project Ground Investigation Report CS/064298/F9/GEO/RPT/101 B
Flamborough Chalk Formation
Property and infrastructure Capita Symonds House, Wood Street, East Grinstead, West Sussex, RH19 1UU T 01342327161 http://www.capita.co.uk/infrastructure Dry Density
Figure 6.3.1
-60
-50
-40
-30
-20
-10
0
1 1.2 1.4 1.6 1.8 2 2.2 2.4 R
edu
ced
Lev
el (
m A
OD
) Dry Density d (Mg/m3)
L06
MO1
M02
MO4
M05
MO6
M08
M07
M09
M10
M11
M12
M19
M13
M14
M20
L16A
1.55 1.95 1.70
LOW MEDIUM HIGH VERY HIGH
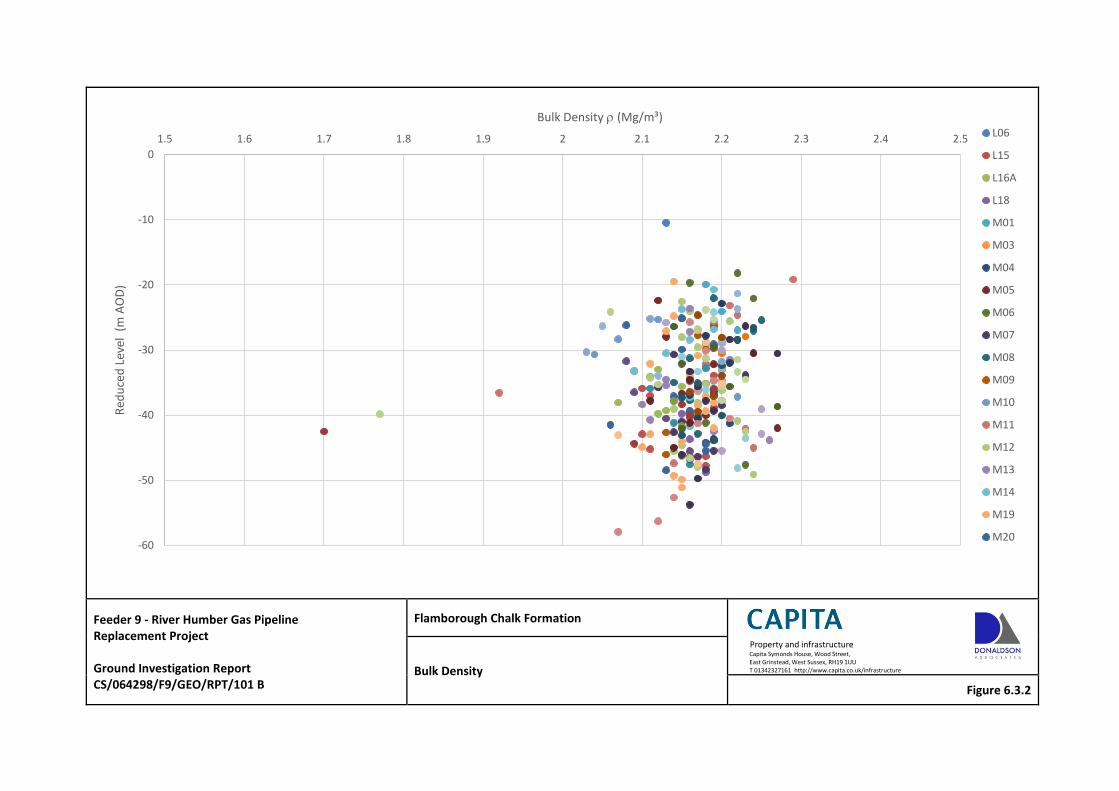
Feeder 9 - River Humber Gas Pipeline Replacement Project Ground Investigation Report CS/064298/F9/GEO/RPT/101 B
Flamborough Chalk Formation
Property and infrastructure Capita Symonds House, Wood Street, East Grinstead, West Sussex, RH19 1UU T 01342327161 http://www.capita.co.uk/infrastructure Bulk Density
Figure 6.3.2
-60
-50
-40
-30
-20
-10
0
1.5 1.6 1.7 1.8 1.9 2 2.1 2.2 2.3 2.4 2.5
Red
uce
d L
evel
(m
AO
D)
Bulk Density (Mg/m³) L06
L15
L16A
L18
M01
M03
M04
M05
M06
M07
M08
M09
M10
M11
M12
M13
M14
M19
M20
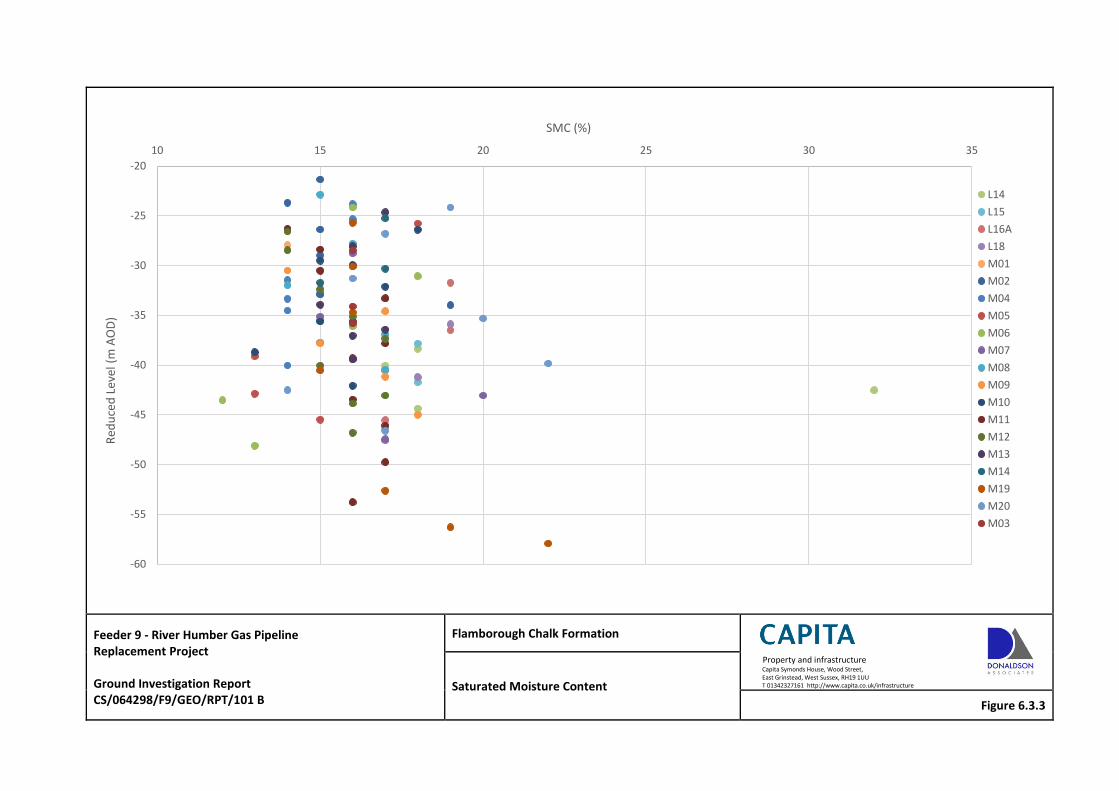
Feeder 9 - River Humber Gas Pipeline Replacement Project Ground Investigation Report CS/064298/F9/GEO/RPT/101 B
Flamborough Chalk Formation
Property and infrastructure Capita Symonds House, Wood Street, East Grinstead, West Sussex, RH19 1UU T 01342327161 http://www.capita.co.uk/infrastructure Saturated Moisture Content
Figure 6.3.3
-60
-55
-50
-45
-40
-35
-30
-25
-20
10 15 20 25 30 35
Red
uce
d L
evel
(m
AO
D)
SMC (%)
L14
L15
L16A
L18
M01
M02
M04
M05
M06
M07
M08
M09
M10
M11
M12
M13
M14
M19
M20
M03
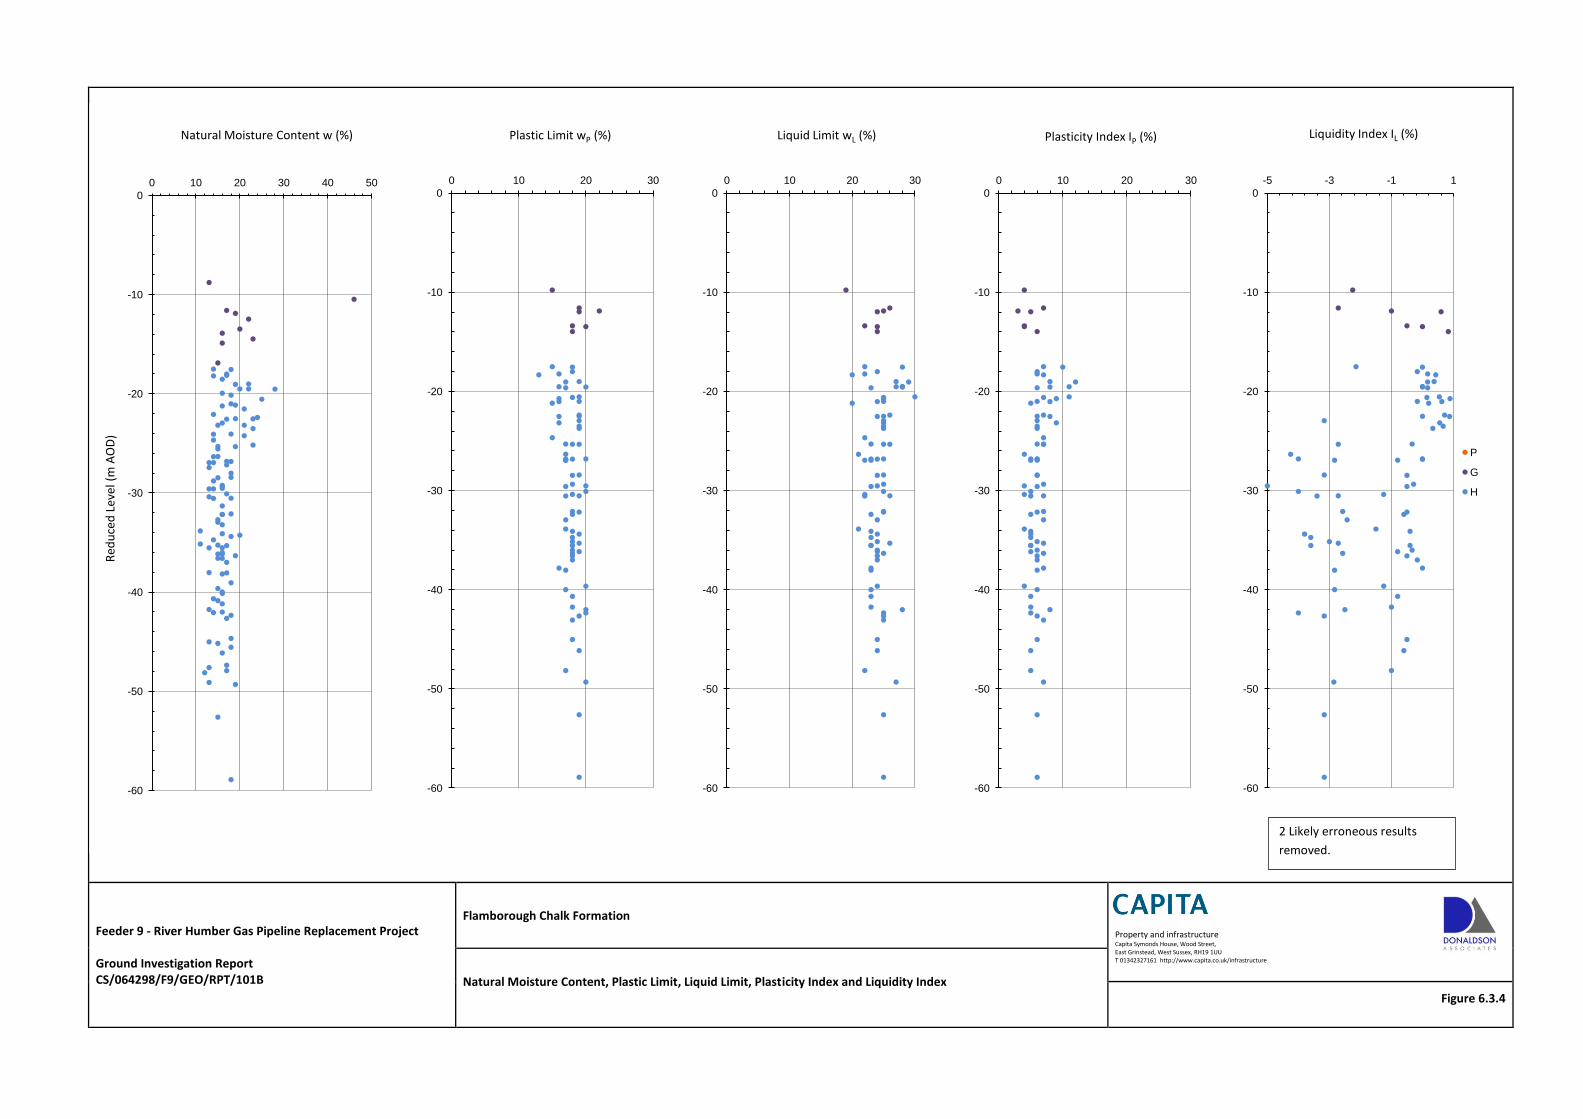
Feeder 9 - River Humber Gas Pipeline Replacement Project Ground Investigation Report CS/064298/F9/GEO/RPT/101B
Flamborough Chalk Formation
Property and infrastructure Capita Symonds House, Wood Street, East Grinstead, West Sussex, RH19 1UU T 01342327161 http://www.capita.co.uk/infrastructure
Natural Moisture Content, Plastic Limit, Liquid Limit, Plasticity Index and Liquidity Index
Figure 6.3.4
-60
-50
-40
-30
-20
-10
0
0 10 20 30 40 50
Red
uce
d L
evel
(m
AO
D)
Natural Moisture Content w (%)
-60
-50
-40
-30
-20
-10
0
0 10 20 30
Plastic Limit wP (%)
-60
-50
-40
-30
-20
-10
0
0 10 20 30
Liquid Limit wL (%)
-60
-50
-40
-30
-20
-10
0
0 10 20 30
Plasticity Index IP (%)
-60
-50
-40
-30
-20
-10
0
-5 -3 -1 1
Liquidity Index IL (%)
P
G
H
2 Likely erroneous results
removed.
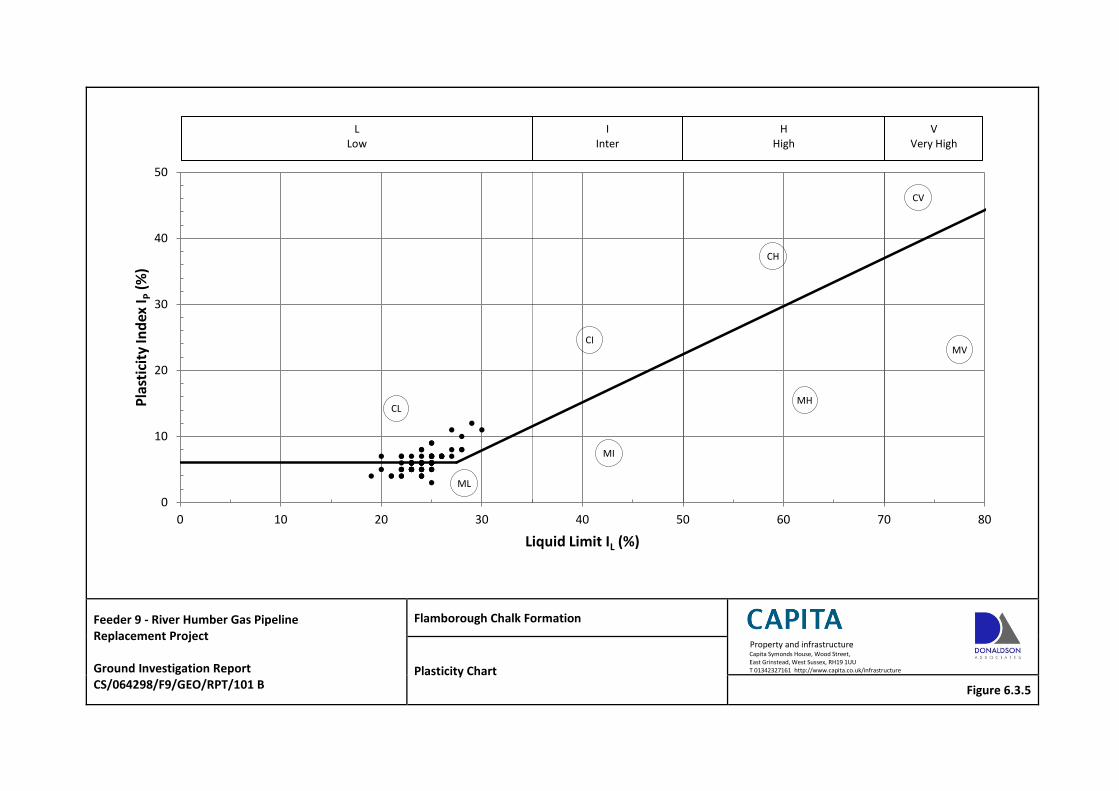
Feeder 9 - River Humber Gas Pipeline Replacement Project Ground Investigation Report CS/064298/F9/GEO/RPT/101 B
Flamborough Chalk Formation
Property and infrastructure Capita Symonds House, Wood Street, East Grinstead, West Sussex, RH19 1UU T 01342327161 http://www.capita.co.uk/infrastructure Plasticity Chart
Figure 6.3.5
0
10
20
30
40
50
0 10 20 30 40 50 60 70 80
Pla
stic
ity
Ind
ex I P
(%
)
Liquid Limit IL (%)
L Low
I Inter
H High
V Very High
CL
ML
CI
MI
CH
MH
CV
MV
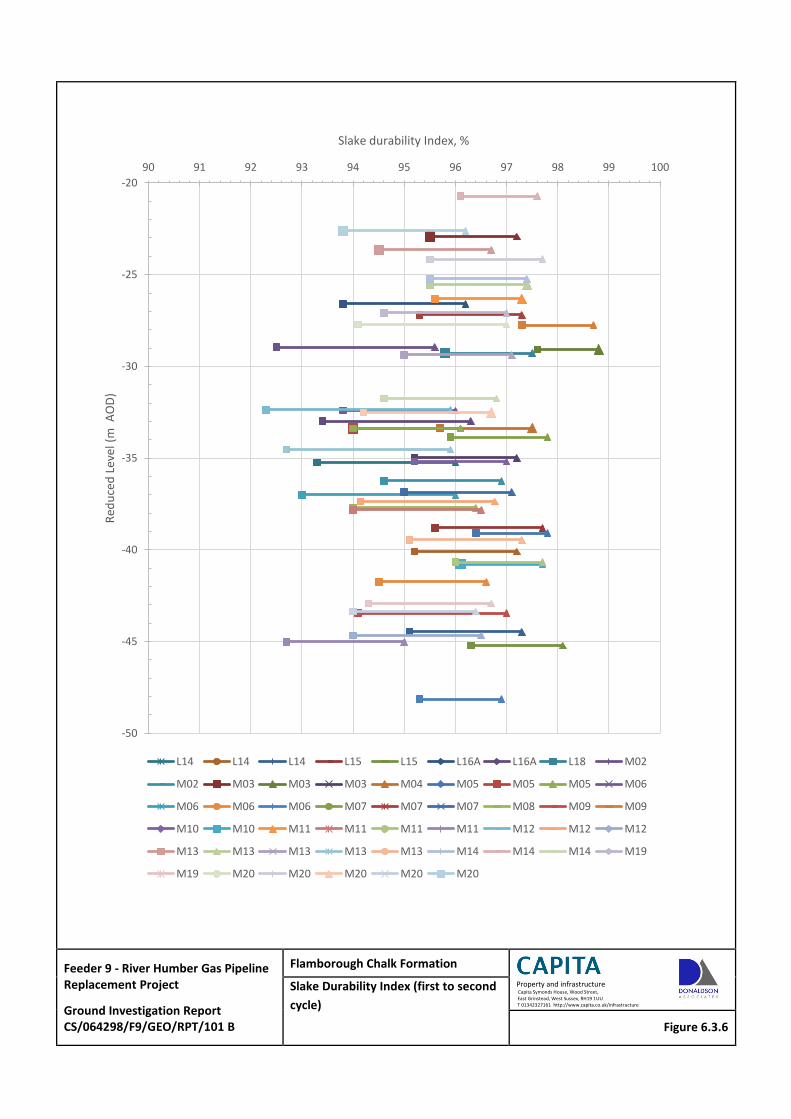
Feeder 9 - River Humber Gas Pipeline Replacement Project
Ground Investigation Report CS/064298/F9/GEO/RPT/101 B
Flamborough Chalk Formation
Property and infrastructure Capita Symonds House, Wood Street, East Grinstead, West Sussex, RH19 1UU T 01342327161 http://www.capita.co.uk/infrastructure
Slake Durability Index (first to second
cycle)
Figure 6.3.6
-50
-45
-40
-35
-30
-25
-20
90 91 92 93 94 95 96 97 98 99 100
Red
uce
d L
evel
(m
AO
D)
Slake durability Index, %
L14 L14 L14 L15 L15 L16A L16A L18 M02
M02 M03 M03 M03 M04 M05 M05 M05 M06
M06 M06 M06 M07 M07 M07 M08 M09 M09
M10 M10 M11 M11 M11 M11 M12 M12 M12
M13 M13 M13 M13 M13 M14 M14 M14 M19
M19 M20 M20 M20 M20 M20
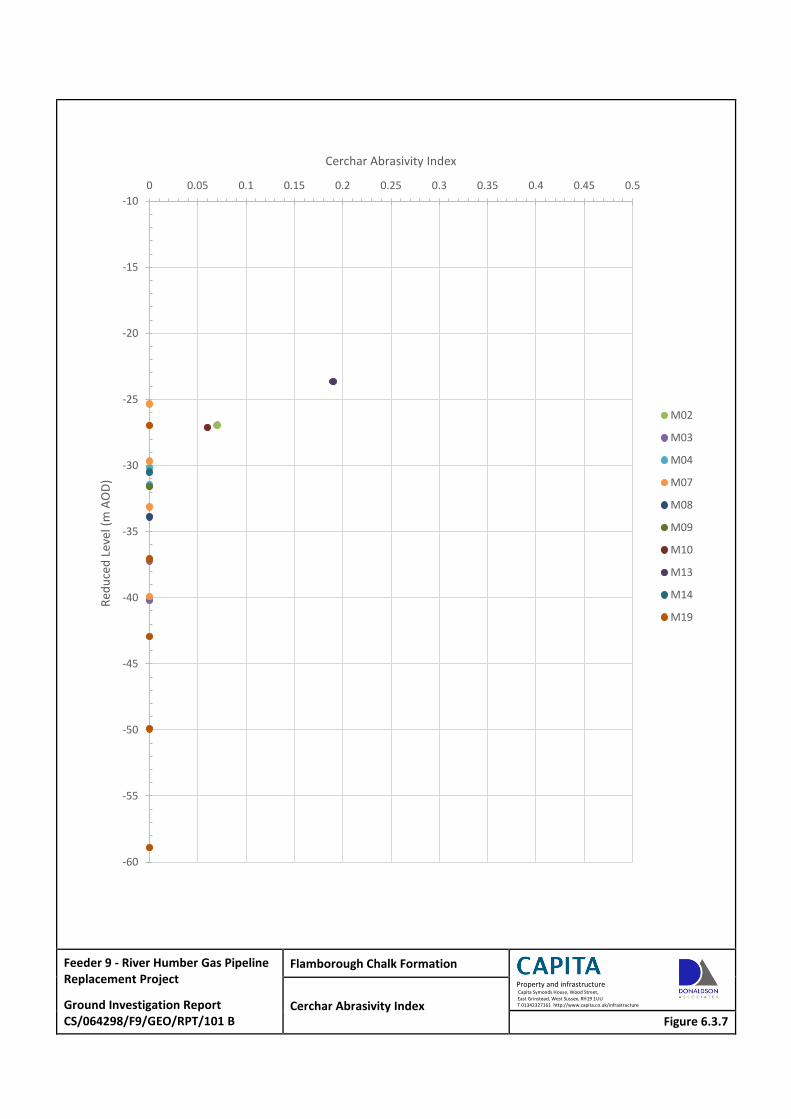
Feeder 9 - River Humber Gas Pipeline Replacement Project
Ground Investigation Report CS/064298/F9/GEO/RPT/101 B
Flamborough Chalk Formation
Property and infrastructure Capita Symonds House, Wood Street, East Grinstead, West Sussex, RH19 1UU T 01342327161 http://www.capita.co.uk/infrastructure Cerchar Abrasivity Index
Figure 6.3.7
-60
-55
-50
-45
-40
-35
-30
-25
-20
-15
-10
0 0.05 0.1 0.15 0.2 0.25 0.3 0.35 0.4 0.45 0.5
Red
uce
d L
evel
(m
AO
D)
Cerchar Abrasivity Index
M02
M03
M04
M07
M08
M09
M10
M13
M14
M19
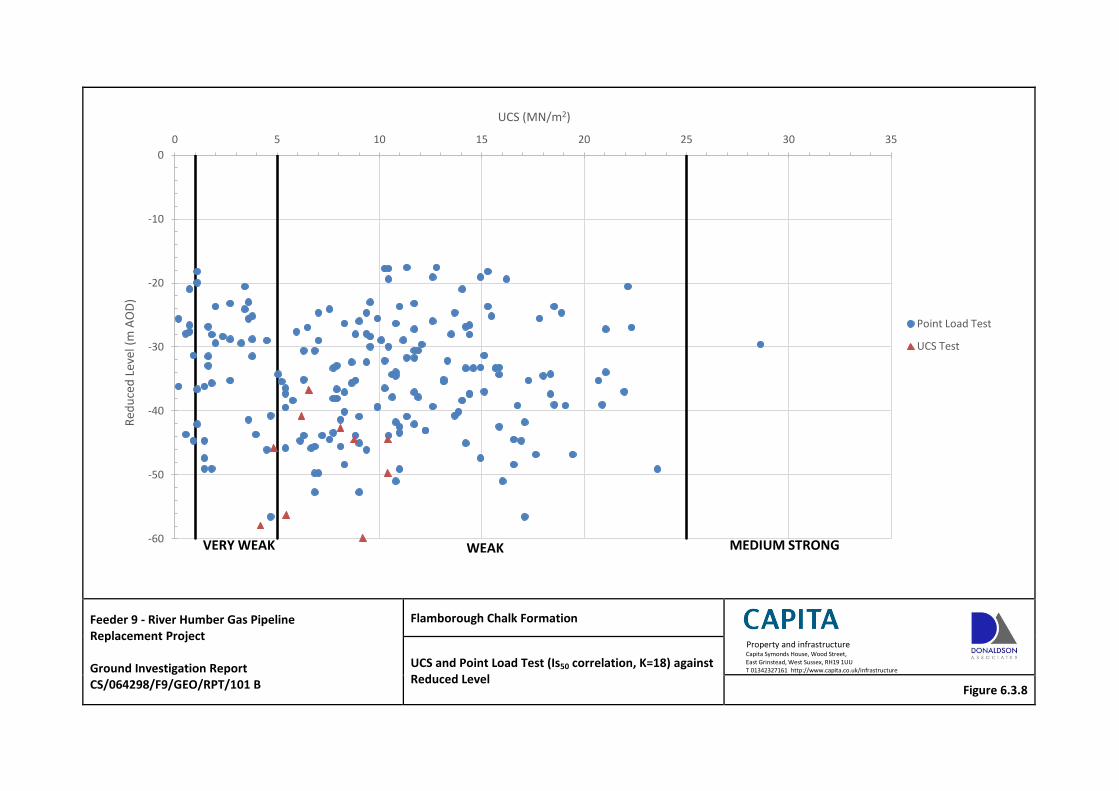
Feeder 9 - River Humber Gas Pipeline Replacement Project Ground Investigation Report CS/064298/F9/GEO/RPT/101 B
Flamborough Chalk Formation
Property and infrastructure Capita Symonds House, Wood Street, East Grinstead, West Sussex, RH19 1UU T 01342327161 http://www.capita.co.uk/infrastructure UCS and Point Load Test (Is50 correlation, K=18) against
Reduced Level Figure 6.3.8
-60
-50
-40
-30
-20
-10
0
0 5 10 15 20 25 30 35 R
edu
ced
Lev
el (
m A
OD
) UCS (MN/m2)
Point Load Test
UCS Test
VERY WEAK WEAK MEDIUM STRONG
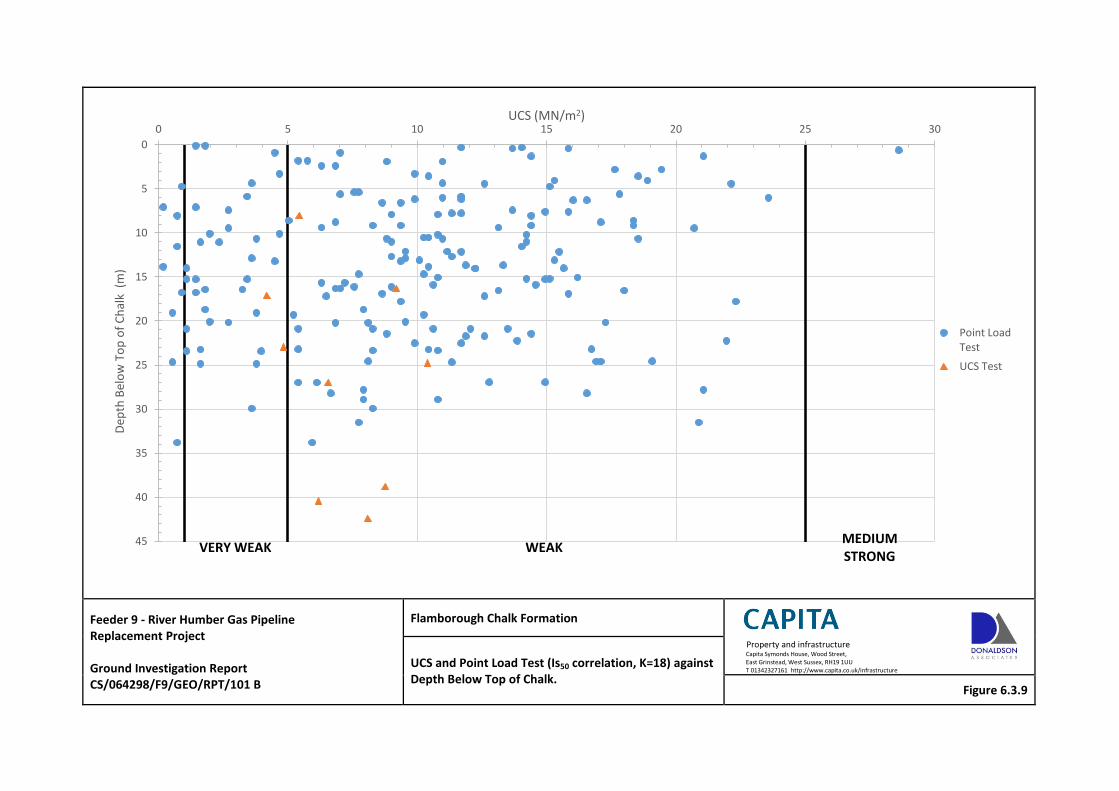
Feeder 9 - River Humber Gas Pipeline Replacement Project Ground Investigation Report CS/064298/F9/GEO/RPT/101 B
Flamborough Chalk Formation
Property and infrastructure Capita Symonds House, Wood Street, East Grinstead, West Sussex, RH19 1UU T 01342327161 http://www.capita.co.uk/infrastructure UCS and Point Load Test (Is50 correlation, K=18) against
Depth Below Top of Chalk. Figure 6.3.9
0
5
10
15
20
25
30
35
40
45
0 5 10 15 20 25 30 D
epth
Bel
ow
To
p o
f C
hal
k (
m)
UCS (MN/m2)
Point Load Test
UCS Test
VERY WEAK WEAK MEDIUM STRONG
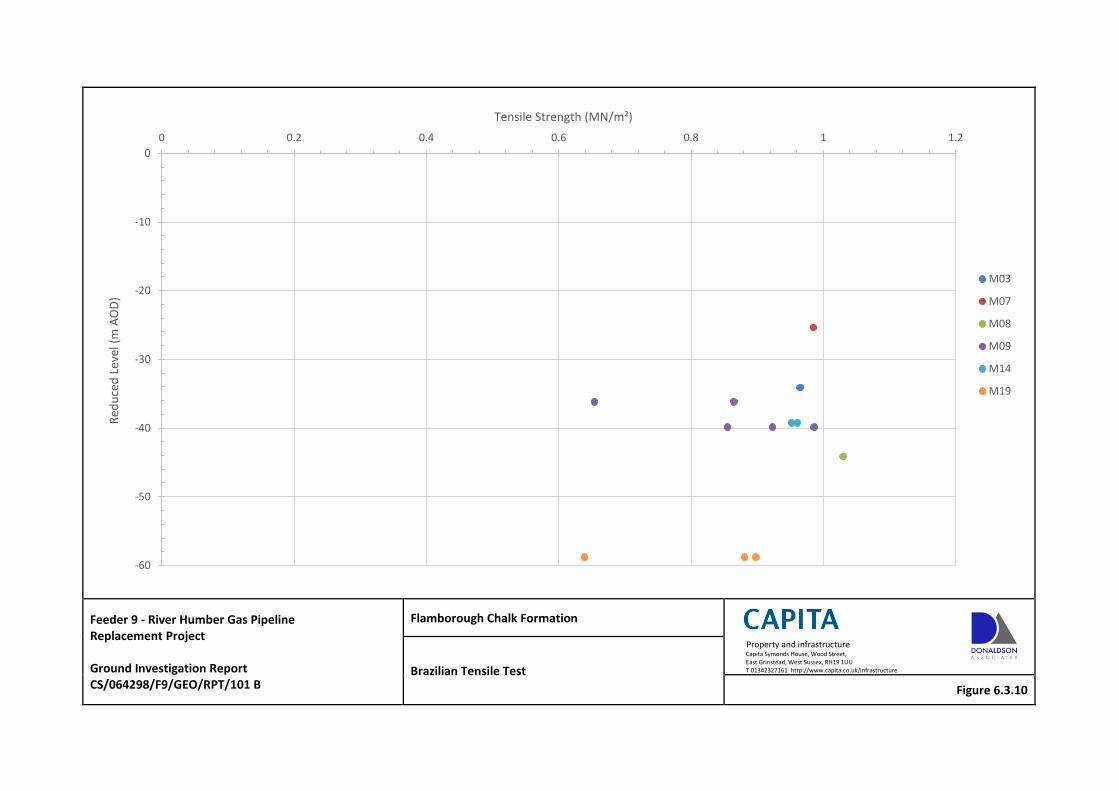
Feeder 9 - River Humber Gas Pipeline Replacement Project Ground Investigation Report CS/064298/F9/GEO/RPT/101 B
Flamborough Chalk Formation
Property and infrastructure Capita Symonds House, Wood Street, East Grinstead, West Sussex, RH19 1UU T 01342327161 http://www.capita.co.uk/infrastructure Brazilian Tensile Test
Figure 6.3.10
-60
-50
-40
-30
-20
-10
0
0 0.2 0.4 0.6 0.8 1 1.2
Red
uce
d L
evel
(m
AO
D) Tensile Strength (MN/m²)
M03
M07
M08
M09
M14
M19
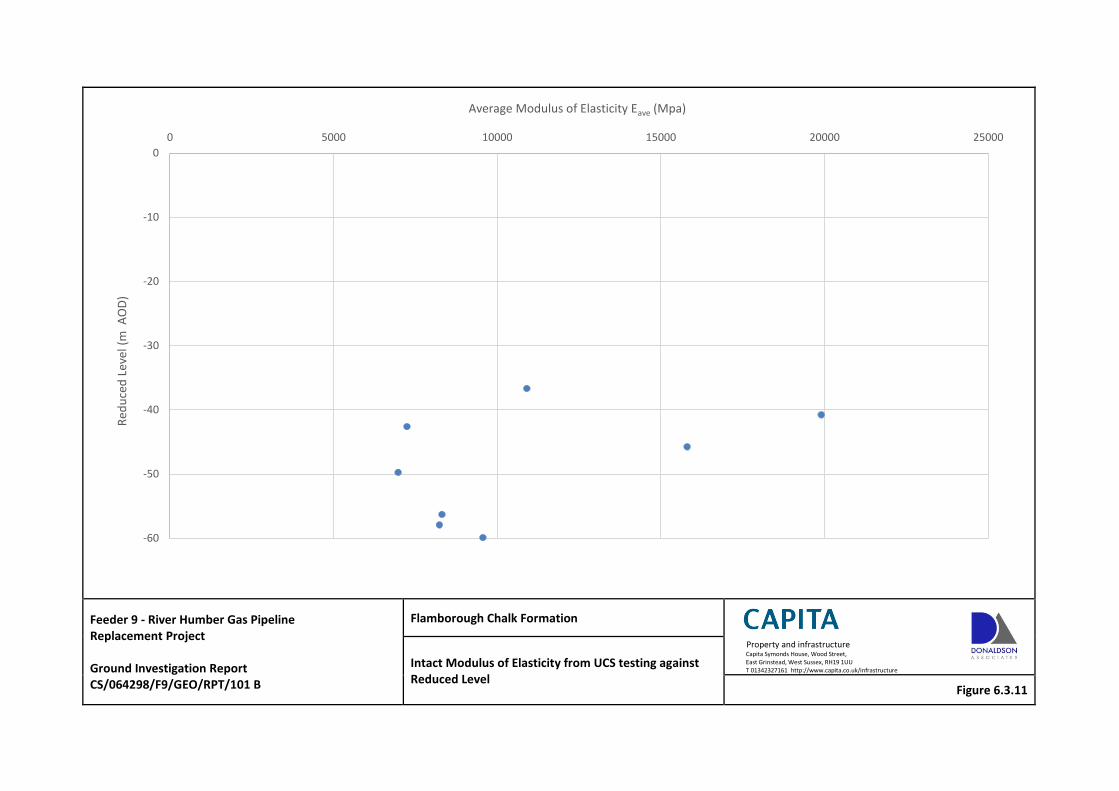
Feeder 9 - River Humber Gas Pipeline Replacement Project Ground Investigation Report CS/064298/F9/GEO/RPT/101 B
Flamborough Chalk Formation
Property and infrastructure Capita Symonds House, Wood Street, East Grinstead, West Sussex, RH19 1UU T 01342327161 http://www.capita.co.uk/infrastructure Intact Modulus of Elasticity from UCS testing against
Reduced Level Figure 6.3.11
-60
-50
-40
-30
-20
-10
0
0 5000 10000 15000 20000 25000
Red
uce
d L
evel
(m
AO
D)
Average Modulus of Elasticity Eave (Mpa)
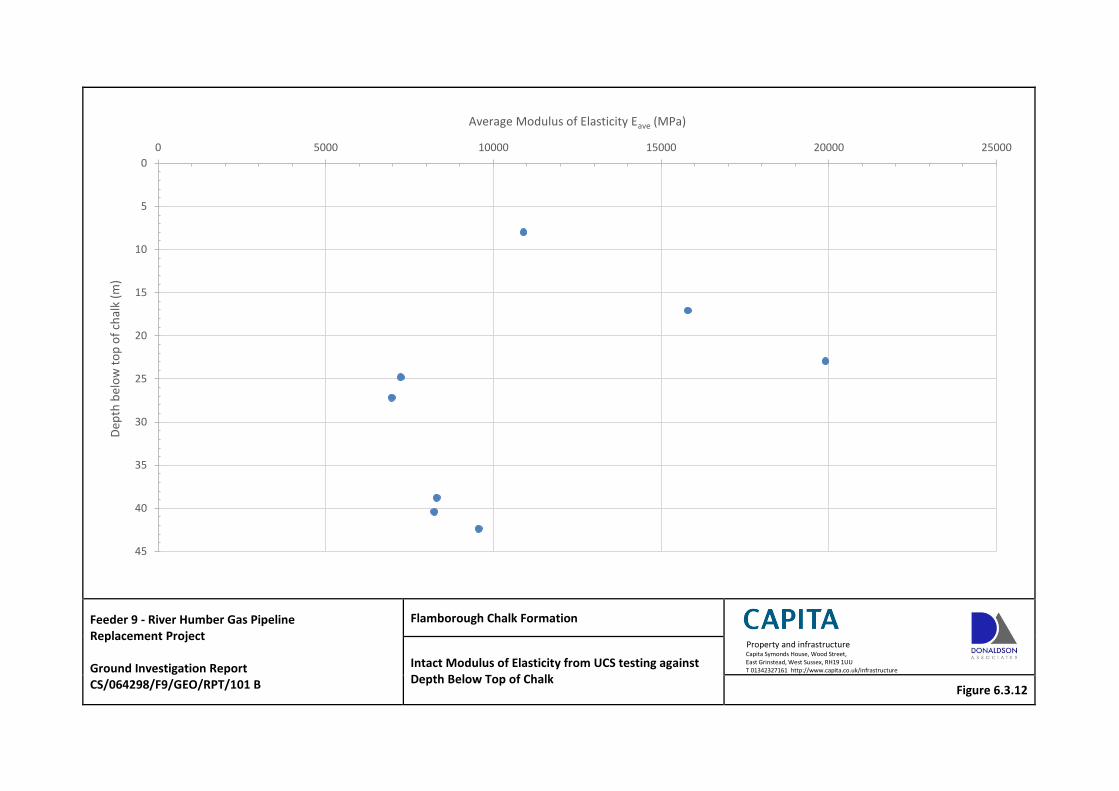
Feeder 9 - River Humber Gas Pipeline Replacement Project Ground Investigation Report CS/064298/F9/GEO/RPT/101 B
Flamborough Chalk Formation
Property and infrastructure Capita Symonds House, Wood Street, East Grinstead, West Sussex, RH19 1UU T 01342327161 http://www.capita.co.uk/infrastructure Intact Modulus of Elasticity from UCS testing against
Depth Below Top of Chalk Figure 6.3.12
0
5
10
15
20
25
30
35
40
45
0 5000 10000 15000 20000 25000
Dep
th b
elo
w t
op
of
chal
k (m
) Average Modulus of Elasticity Eave (MPa)
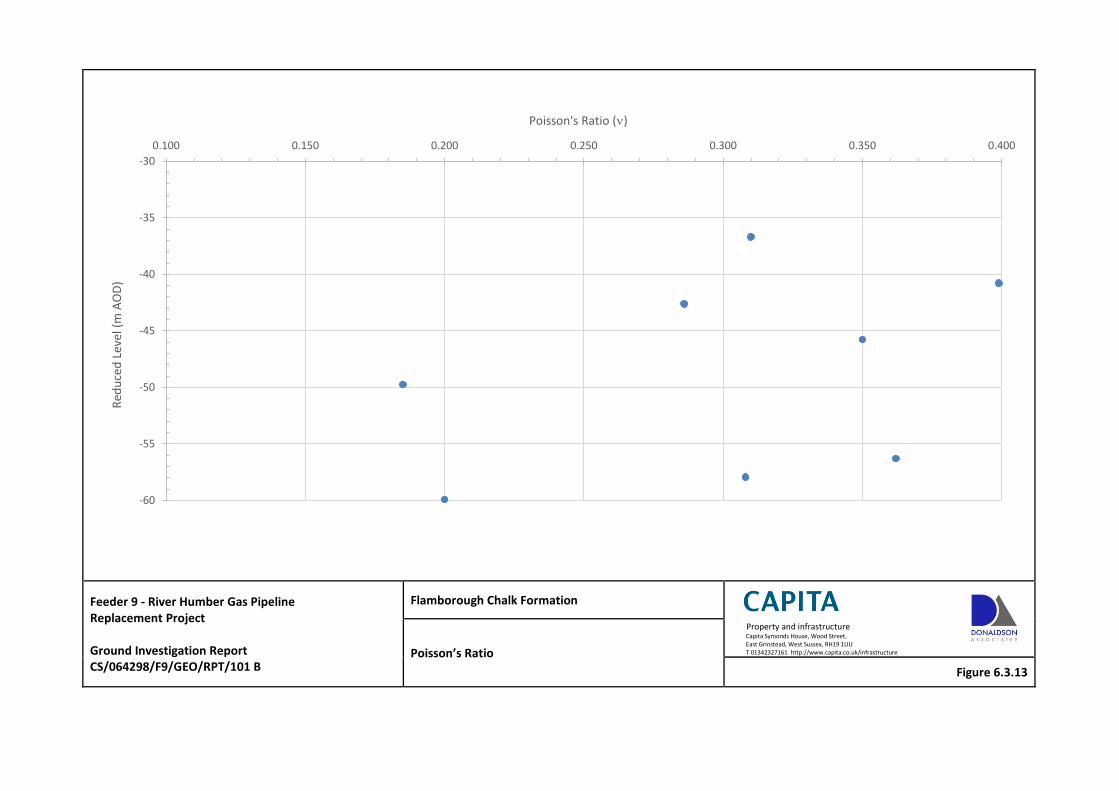
Feeder 9 - River Humber Gas Pipeline Replacement Project Ground Investigation Report CS/064298/F9/GEO/RPT/101 B
Flamborough Chalk Formation
Property and infrastructure Capita Symonds House, Wood Street, East Grinstead, West Sussex, RH19 1UU T 01342327161 http://www.capita.co.uk/infrastructure Poisson’s Ratio
Figure 6.3.13
-60
-55
-50
-45
-40
-35
-30
0.100 0.150 0.200 0.250 0.300 0.350 0.400
Red
uce
d L
evel
(m
AO
D)
Poisson's Ratio ()
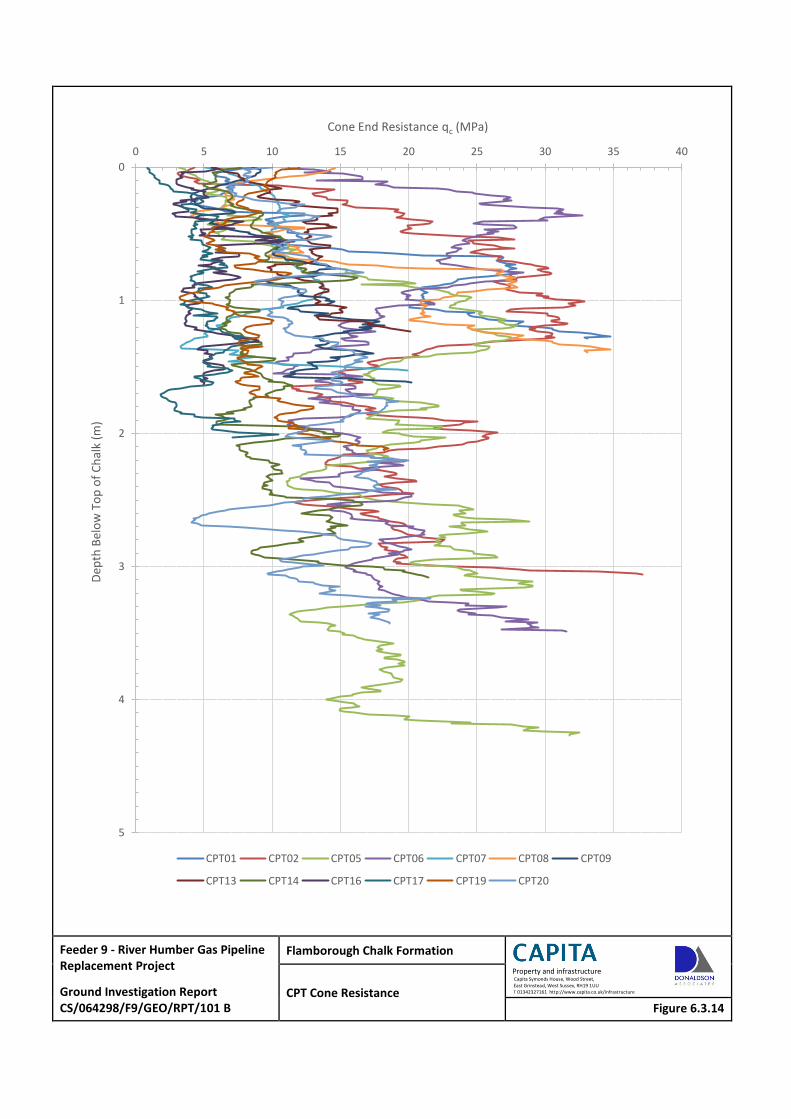
Feeder 9 - River Humber Gas Pipeline Replacement Project
Ground Investigation Report CS/064298/F9/GEO/RPT/101 B
Flamborough Chalk Formation
Property and infrastructure Capita Symonds House, Wood Street, East Grinstead, West Sussex, RH19 1UU T 01342327161 http://www.capita.co.uk/infrastructure CPT Cone Resistance
Figure 6.3.14
0
1
2
3
4
5
0 5 10 15 20 25 30 35 40
Dep
th B
elo
w T
op
of
Ch
alk
(m)
Cone End Resistance qc (MPa)
CPT01 CPT02 CPT05 CPT06 CPT07 CPT08 CPT09
CPT13 CPT14 CPT16 CPT17 CPT19 CPT20
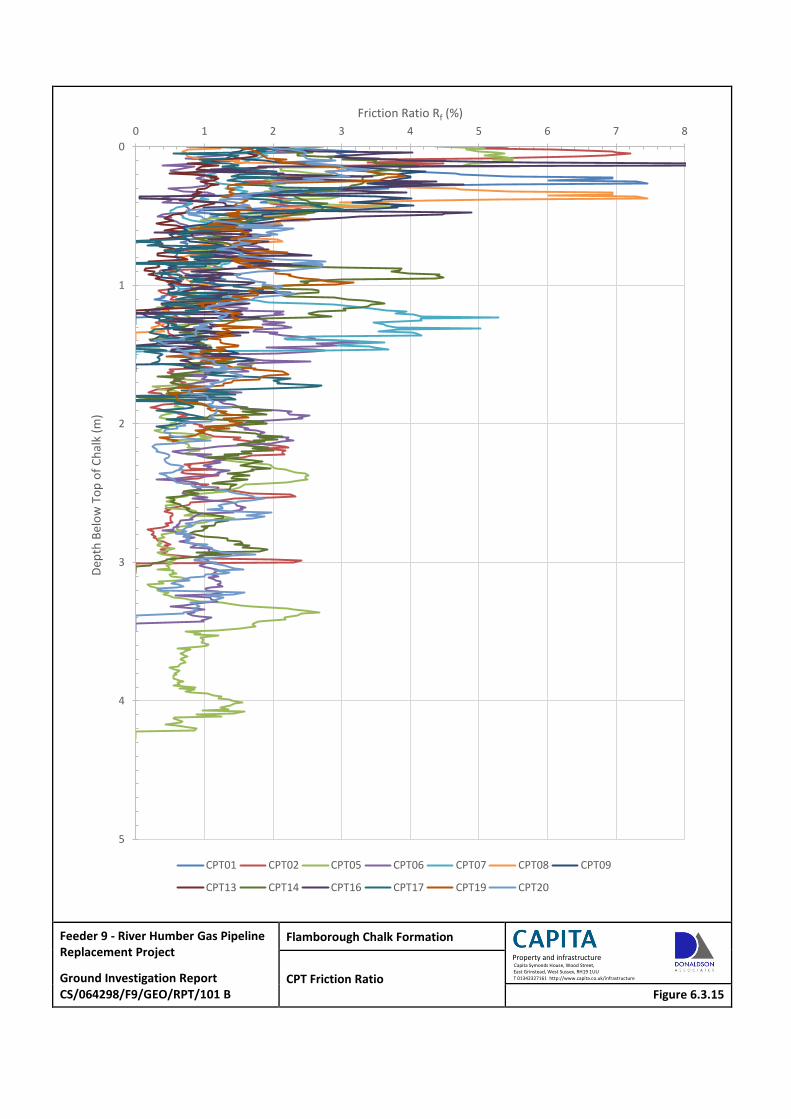
Feeder 9 - River Humber Gas Pipeline Replacement Project
Ground Investigation Report CS/064298/F9/GEO/RPT/101 B
Flamborough Chalk Formation
Property and infrastructure Capita Symonds House, Wood Street, East Grinstead, West Sussex, RH19 1UU T 01342327161 http://www.capita.co.uk/infrastructure CPT Friction Ratio
Figure 6.3.15
0
1
2
3
4
5
0 1 2 3 4 5 6 7 8
Dep
th B
elo
w T
op
of
Ch
alk
(m)
Friction Ratio Rf (%)
CPT01 CPT02 CPT05 CPT06 CPT07 CPT08 CPT09
CPT13 CPT14 CPT16 CPT17 CPT19 CPT20
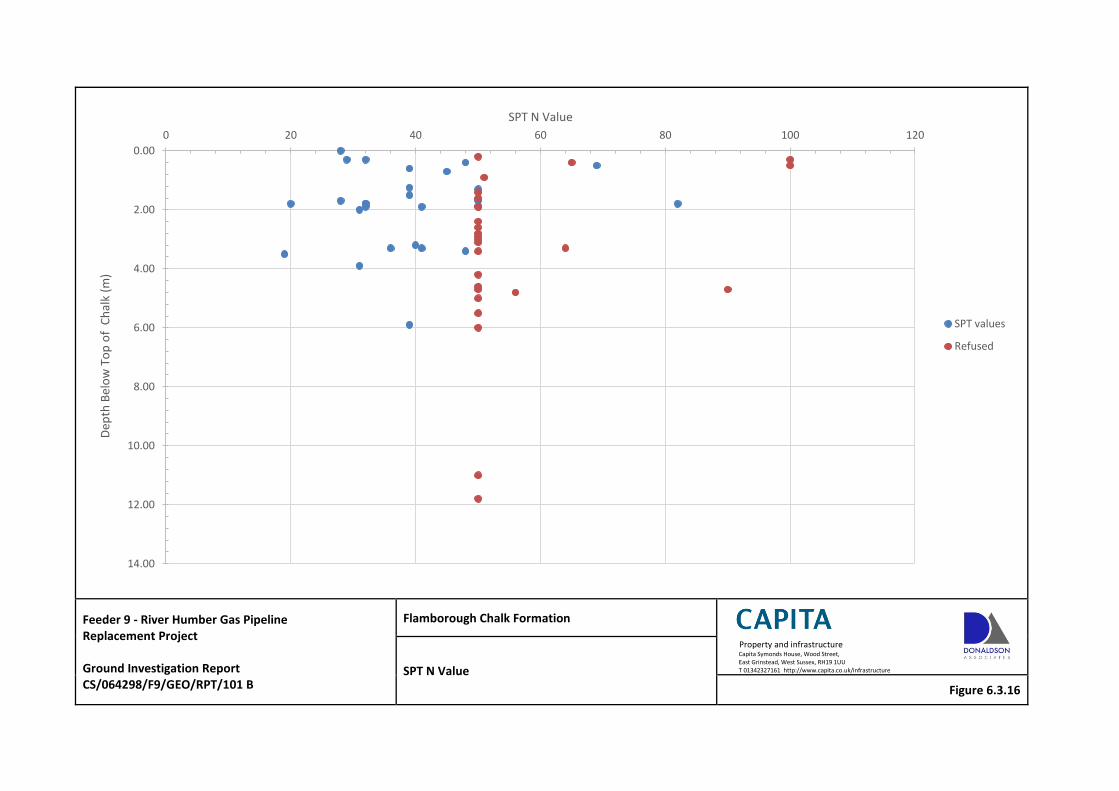
Feeder 9 - River Humber Gas Pipeline Replacement Project Ground Investigation Report CS/064298/F9/GEO/RPT/101 B
Flamborough Chalk Formation
Property and infrastructure Capita Symonds House, Wood Street, East Grinstead, West Sussex, RH19 1UU T 01342327161 http://www.capita.co.uk/infrastructure SPT N Value
Figure 6.3.16
0.00
2.00
4.00
6.00
8.00
10.00
12.00
14.00
0 20 40 60 80 100 120
Dep
th B
elo
w T
op
of
Ch
alk
(m)
SPT N Value
SPT values
Refused
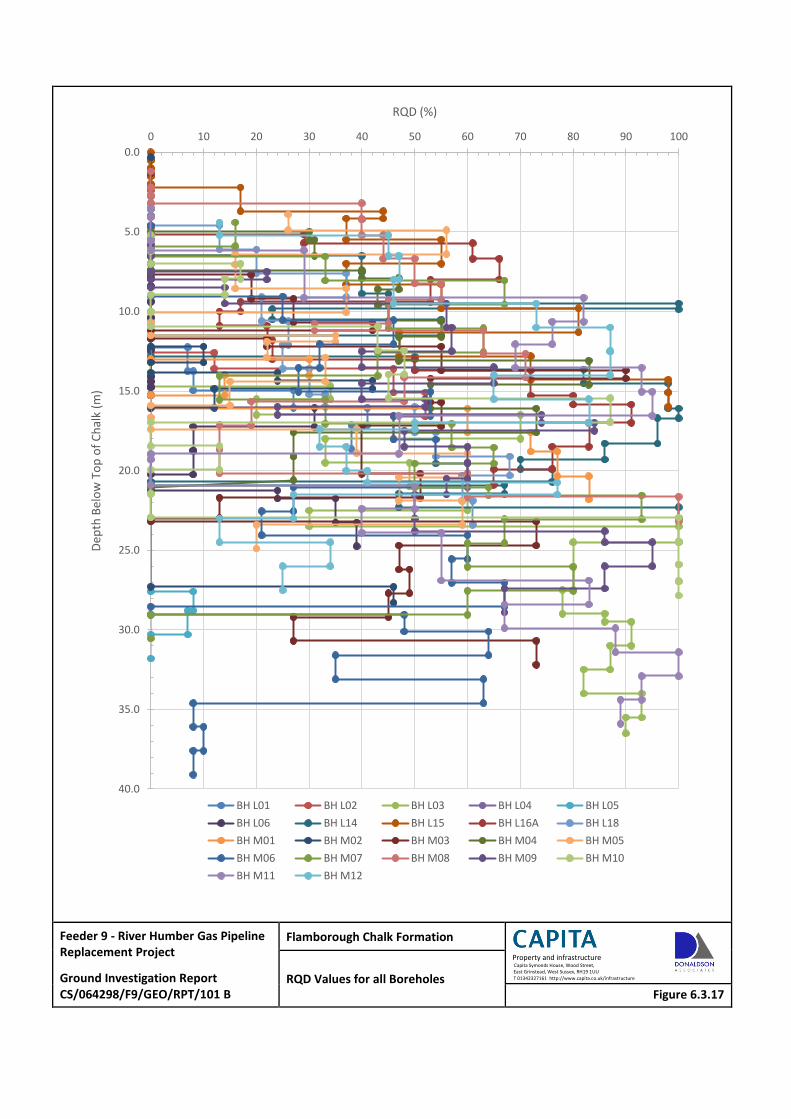
Feeder 9 - River Humber Gas Pipeline Replacement Project
Ground Investigation Report CS/064298/F9/GEO/RPT/101 B
Flamborough Chalk Formation
Property and infrastructure Capita Symonds House, Wood Street, East Grinstead, West Sussex, RH19 1UU T 01342327161 http://www.capita.co.uk/infrastructure RQD Values for all Boreholes
Figure 6.3.17
0.0
5.0
10.0
15.0
20.0
25.0
30.0
35.0
40.0
0 10 20 30 40 50 60 70 80 90 100
Dep
th B
elo
w T
op
of
Ch
alk
(m)
RQD (%)
BH L01 BH L02 BH L03 BH L04 BH L05
BH L06 BH L14 BH L15 BH L16A BH L18
BH M01 BH M02 BH M03 BH M04 BH M05
BH M06 BH M07 BH M08 BH M09 BH M10
BH M11 BH M12
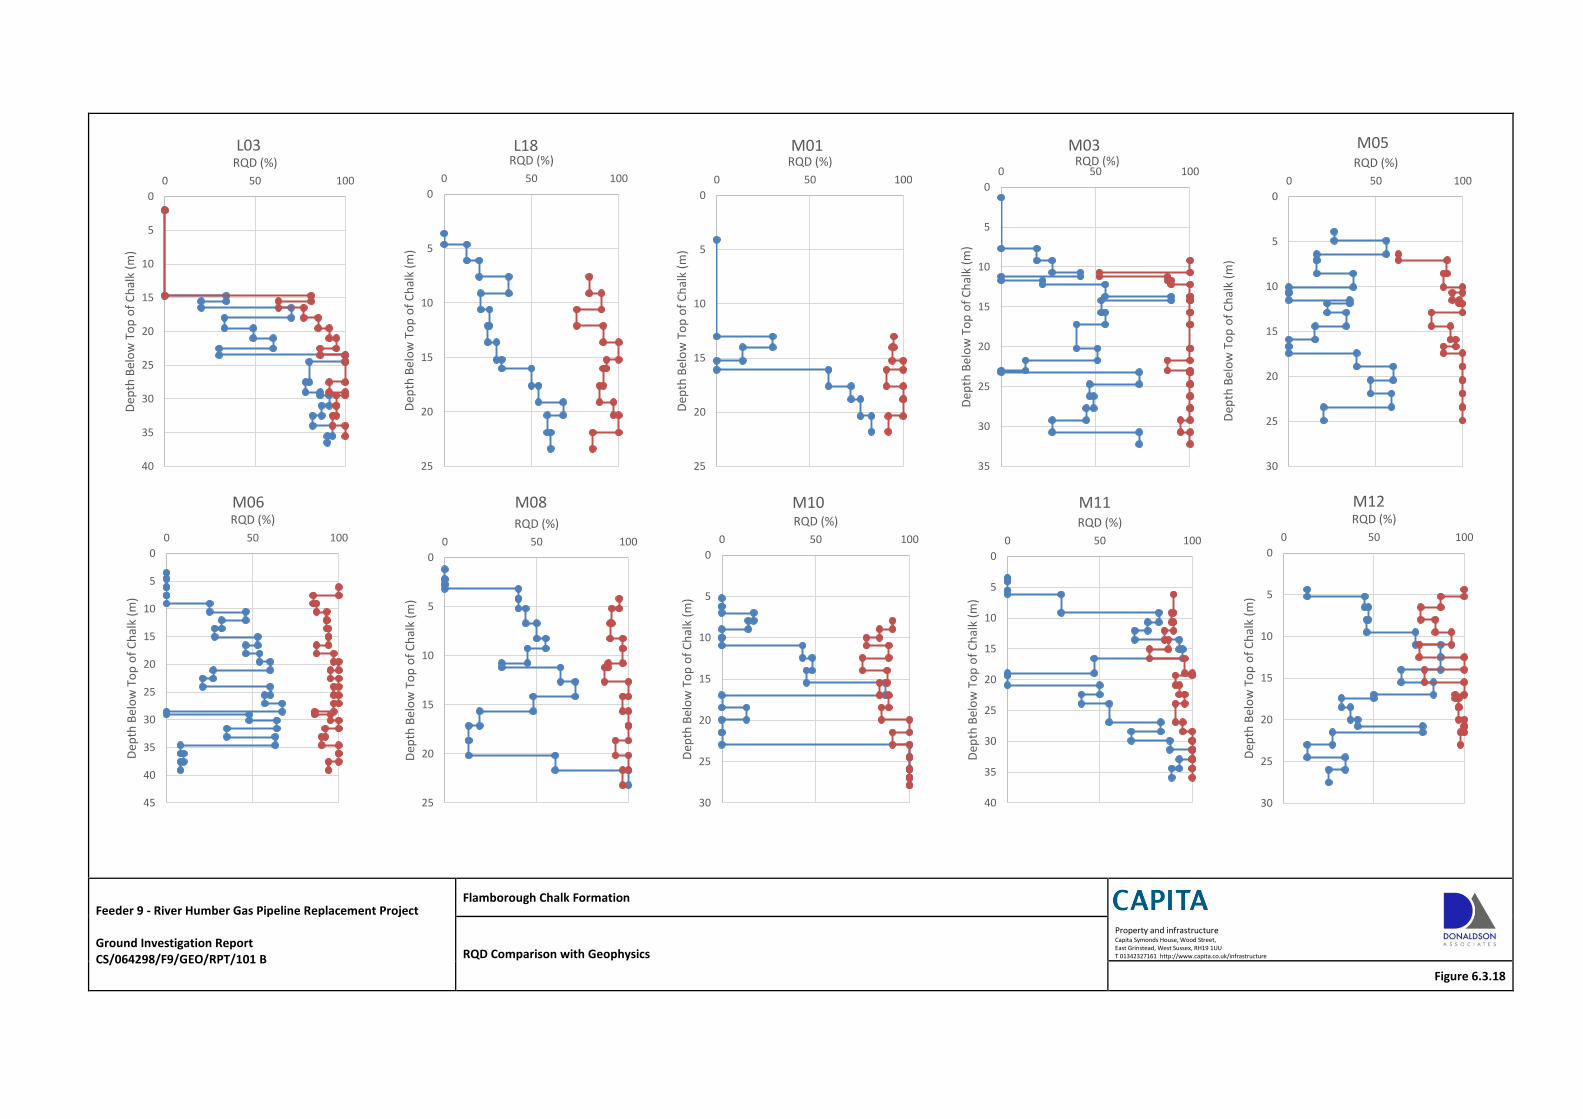
Feeder 9 - River Humber Gas Pipeline Replacement Project Ground Investigation Report CS/064298/F9/GEO/RPT/101 B
Flamborough Chalk Formation Property and infrastructure Capita Symonds House, Wood Street, East Grinstead, West Sussex, RH19 1UU T 01342327161 http://www.capita.co.uk/infrastructure RQD Comparison with Geophysics
Figure 6.3.18
0
5
10
15
20
25
30
35
40
0 50 100
Dep
th B
elo
w T
op
of
Ch
alk
(m)
RQD (%) L03
0
5
10
15
20
25
0 50 100
Dep
th B
elo
w T
op
of
Ch
alk
(m)
RQD (%) L18
0
5
10
15
20
25
0 50 100
Dep
th B
elo
w T
op
of
Ch
alk
(m)
RQD (%) M01
0
5
10
15
20
25
30
35
0 50 100
Dep
th B
elo
w T
op
of
Ch
alk
(m)
RQD (%) M03
0
5
10
15
20
25
30
0 50 100
Dep
th B
elo
w T
op
of
Ch
alk
(m)
RQD (%)
M05
0
5
10
15
20
25
30
35
40
45
0 50 100
Dep
th B
elo
w T
op
of
Ch
alk
(m)
RQD (%) M06
0
5
10
15
20
25
0 50 100
Dep
th B
elo
w T
op
of
Ch
alk
(m)
RQD (%)
M08
0
5
10
15
20
25
30
0 50 100
Dep
th B
elo
w T
op
of
Ch
alk
(m)
RQD (%)
M10
0
5
10
15
20
25
30
35
40
0 50 100
Dep
th B
elo
w T
op
of
Ch
alk
(m)
RQD (%)
M11
0
5
10
15
20
25
30
0 50 100
Dep
th B
elo
w T
op
of
Ch
alk
(m)
RQD (%) M12
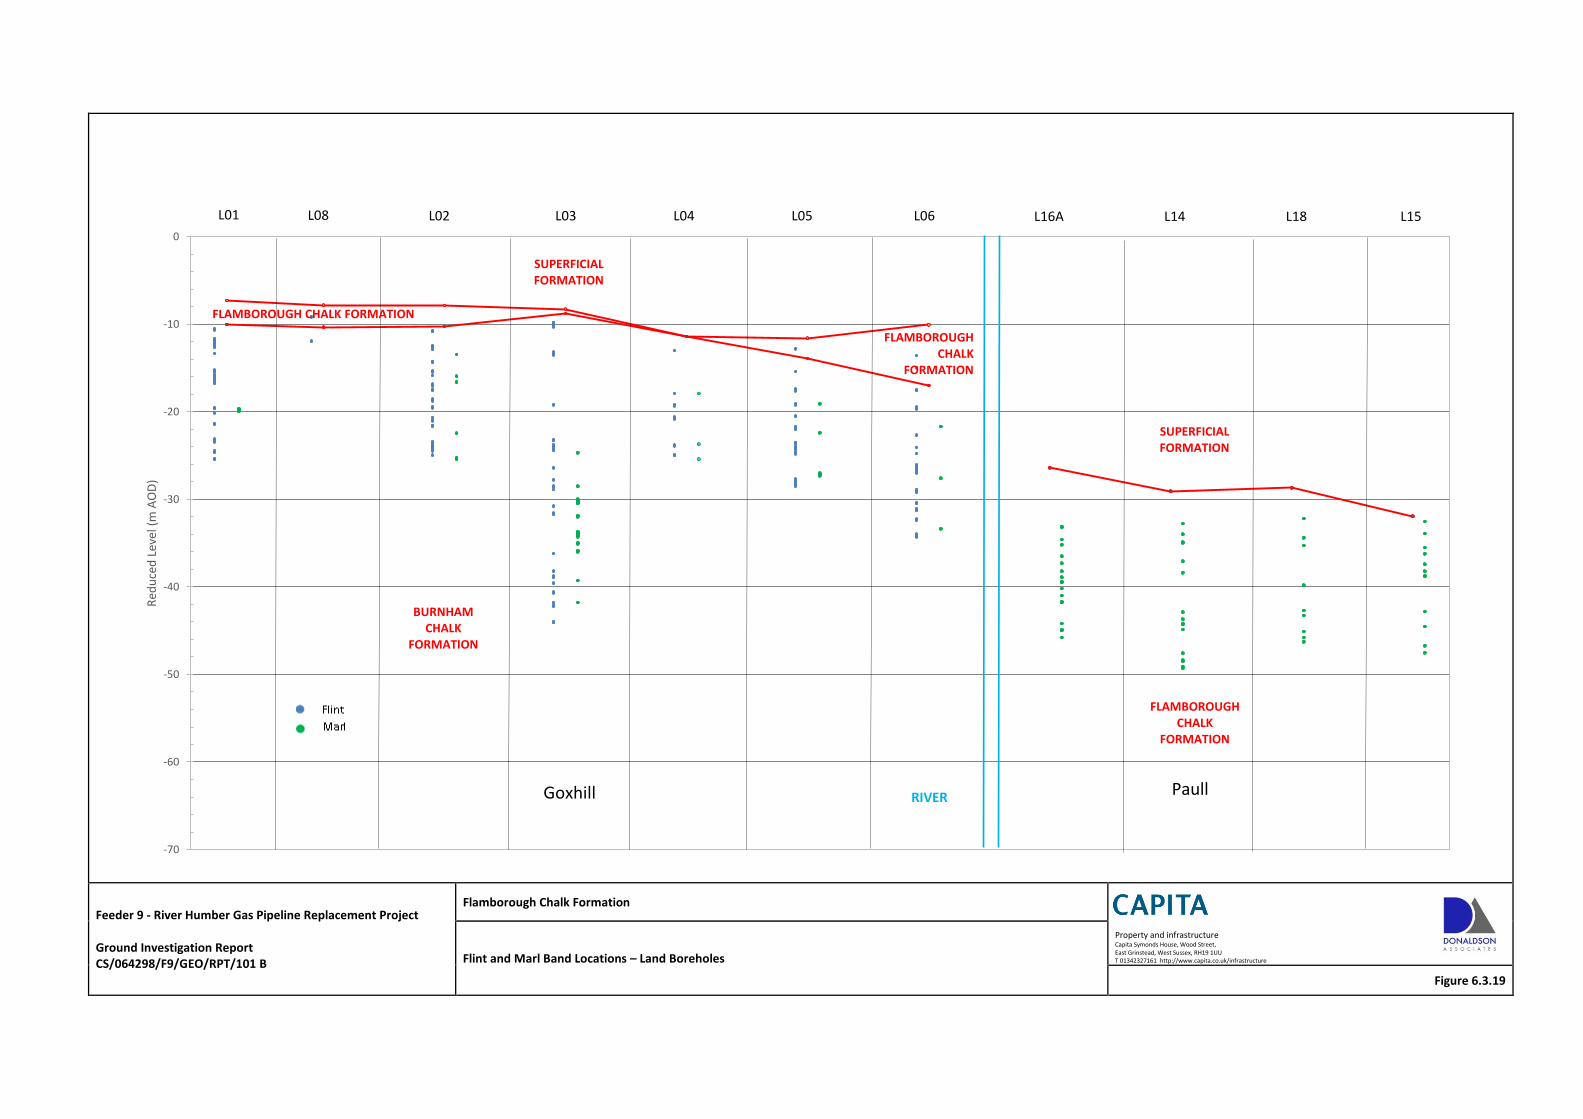
Feeder 9 - River Humber Gas Pipeline Replacement Project Ground Investigation Report CS/064298/F9/GEO/RPT/101 B
Flamborough Chalk Formation Property and infrastructure Capita Symonds House, Wood Street, East Grinstead, West Sussex, RH19 1UU T 01342327161 http://www.capita.co.uk/infrastructure Flint and Marl Band Locations – Land Boreholes
Figure 6.3.19
-70
-60
-50
-40
-30
-20
-10
0
Red
uce
d L
evel
(m
AO
D)
RIVER
L01 L08 L02 L03 L04 L05 L06
BURNHAM CHALK
FORMATION
L16A L18 L15 L14
FLAMBOROUGH CHALK
FORMATION
SUPERFICIAL FORMATION
SUPERFICIAL FORMATION
FLAMBOROUGH CHALK
FORMATION
FLAMBOROUGH CHALK FORMATION
Goxhill Paull
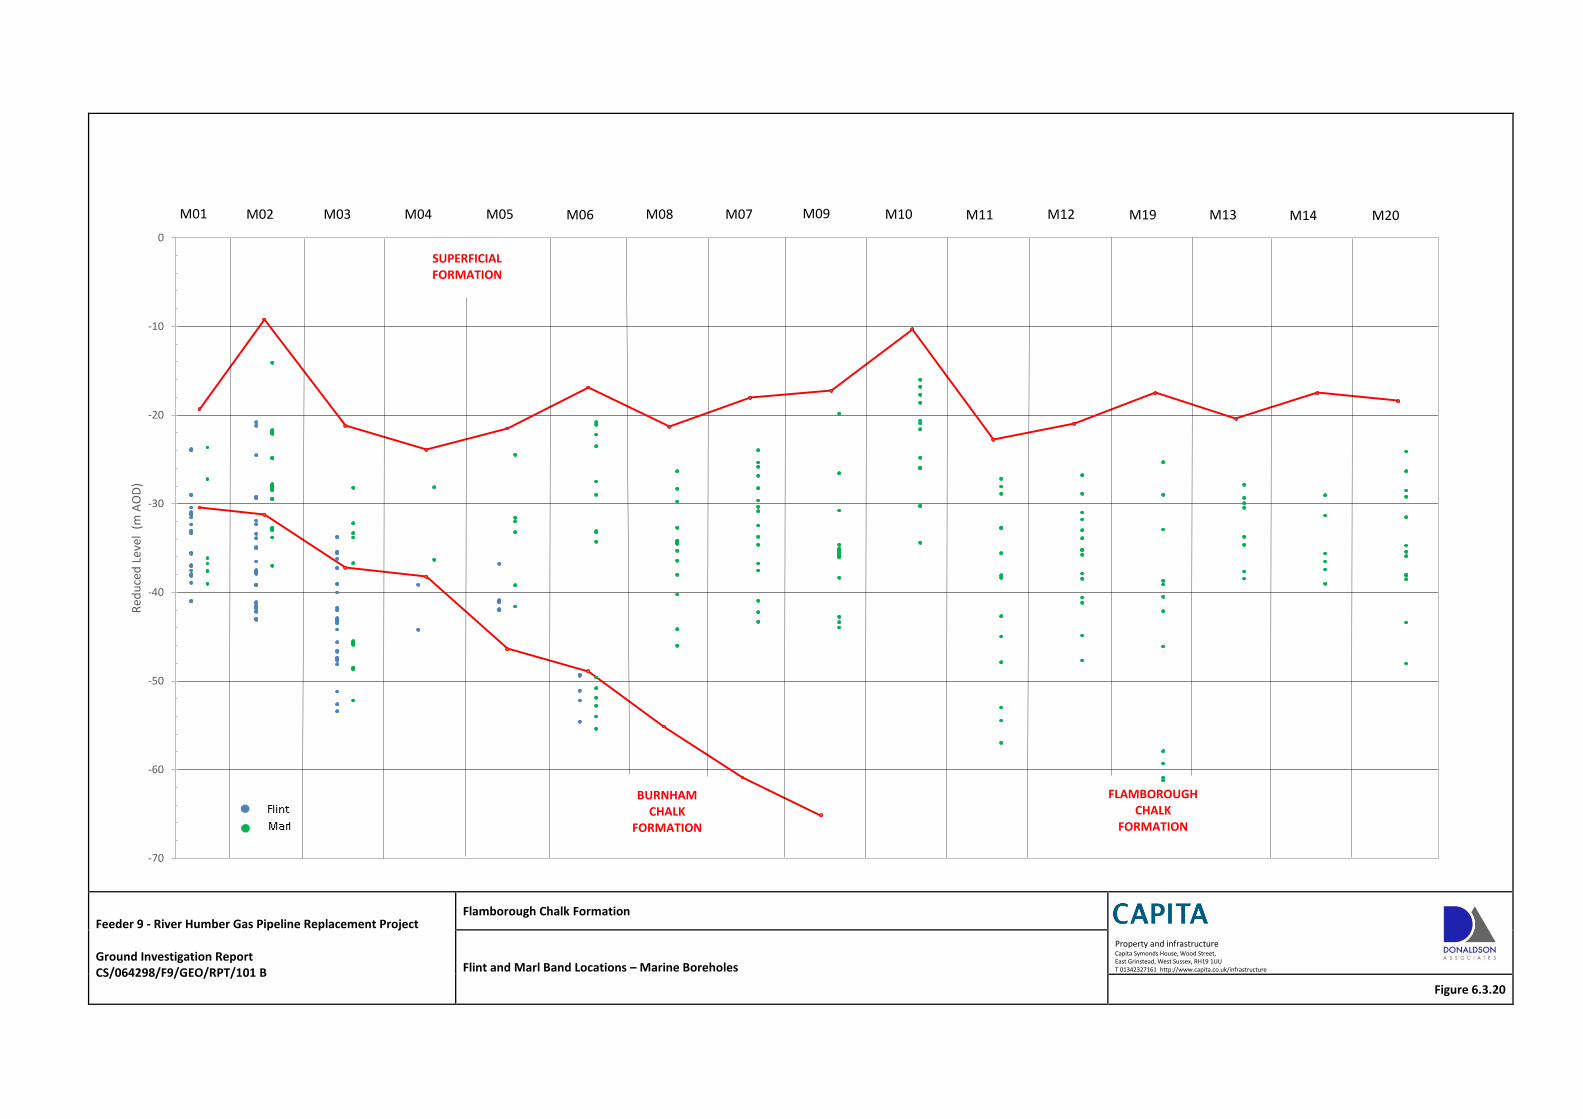
Feeder 9 - River Humber Gas Pipeline Replacement Project Ground Investigation Report CS/064298/F9/GEO/RPT/101 B
Flamborough Chalk Formation Property and infrastructure Capita Symonds House, Wood Street, East Grinstead, West Sussex, RH19 1UU T 01342327161 http://www.capita.co.uk/infrastructure Flint and Marl Band Locations – Marine Boreholes
Figure 6.3.20
-70
-60
-50
-40
-30
-20
-10
0
Red
uce
d L
evel
(m
AO
D)
M01 M02 M03 M04 M05 M06 M08 M07 M10 M11 M09
FLAMBOROUGH CHALK
FORMATION
BURNHAM CHALK
FORMATION
M12 M20 M14 M13 M19
SUPERFICIAL FORMATION
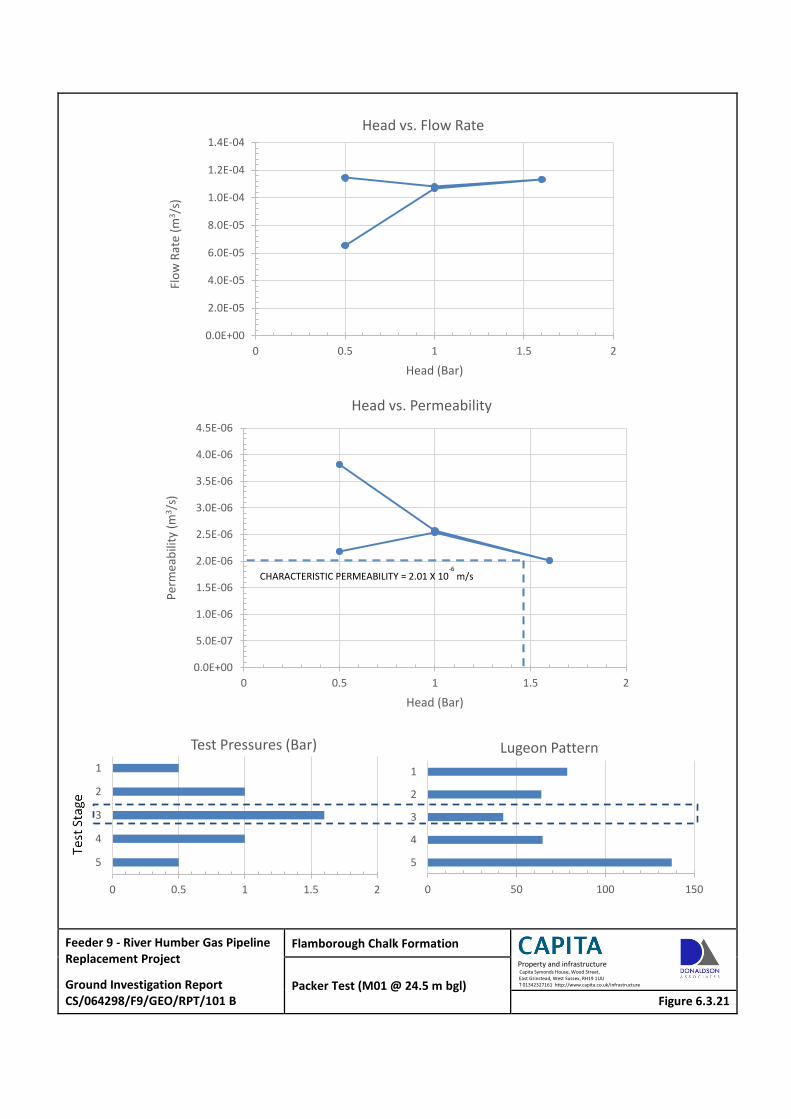
Feeder 9 - River Humber Gas Pipeline Replacement Project
Ground Investigation Report CS/064298/F9/GEO/RPT/101 B
Flamborough Chalk Formation
Property and infrastructure Capita Symonds House, Wood Street, East Grinstead, West Sussex, RH19 1UU T 01342327161 http://www.capita.co.uk/infrastructure Packer Test (M01 @ 24.5 m bgl)
Figure 6.3.21
0.0E+00
2.0E-05
4.0E-05
6.0E-05
8.0E-05
1.0E-04
1.2E-04
1.4E-04
0 0.5 1 1.5 2
Flo
w R
ate
(m3 /
s)
Head (Bar)
Head vs. Flow Rate
0.0E+00
5.0E-07
1.0E-06
1.5E-06
2.0E-06
2.5E-06
3.0E-06
3.5E-06
4.0E-06
4.5E-06
0 0.5 1 1.5 2
Per
mea
bili
ty (
m3/s
)
Head (Bar)
Head vs. Permeability
0 0.5 1 1.5 2
1
2
3
4
5
Test Pressures (Bar)
0 50 100 150
1
2
3
4
5
Lugeon Pattern
CHARACTERISTIC PERMEABILITY = 2.01 X 10⁻⁶
m/s
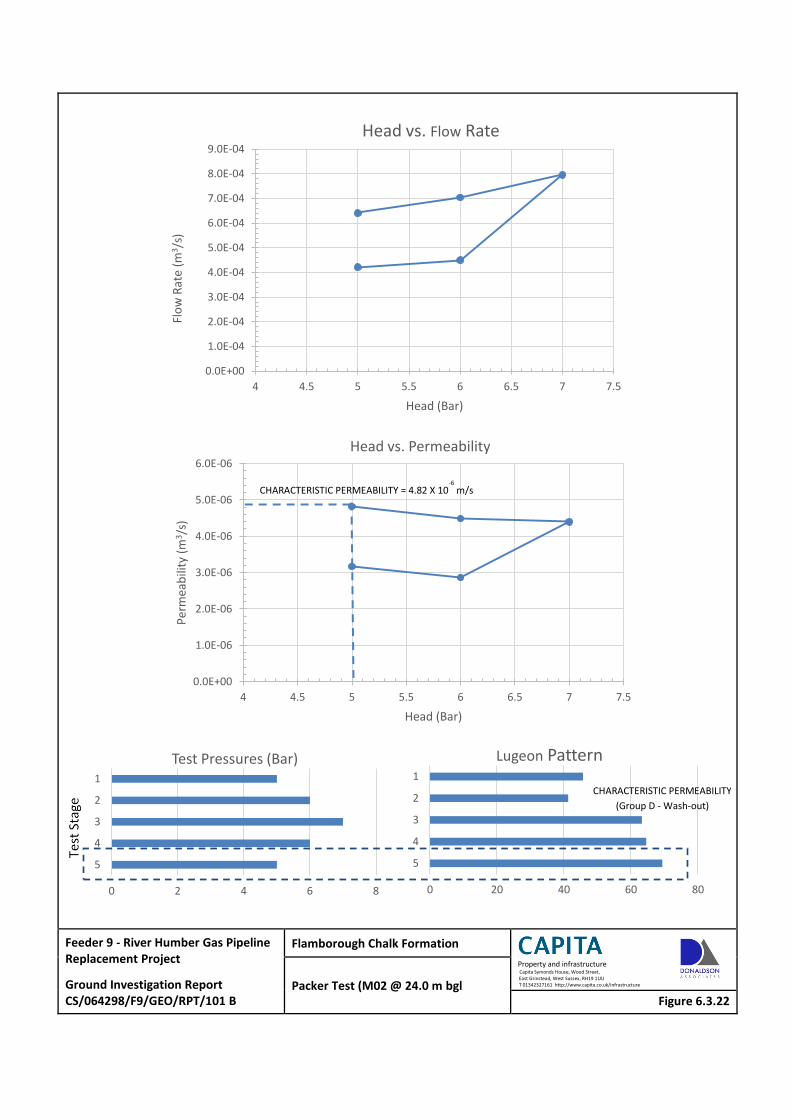
Feeder 9 - River Humber Gas Pipeline Replacement Project
Ground Investigation Report CS/064298/F9/GEO/RPT/101 B
Flamborough Chalk Formation
Property and infrastructure Capita Symonds House, Wood Street, East Grinstead, West Sussex, RH19 1UU T 01342327161 http://www.capita.co.uk/infrastructure Packer Test (M02 @ 24.0 m bgl
Figure 6.3.22
0.0E+00
1.0E-04
2.0E-04
3.0E-04
4.0E-04
5.0E-04
6.0E-04
7.0E-04
8.0E-04
9.0E-04
4 4.5 5 5.5 6 6.5 7 7.5
Flo
w R
ate
(m3/s
)
Head (Bar)
Head vs. Flow Rate
0.0E+00
1.0E-06
2.0E-06
3.0E-06
4.0E-06
5.0E-06
6.0E-06
4 4.5 5 5.5 6 6.5 7 7.5
Per
mea
bili
ty (
m3/s
)
Head (Bar)
Head vs. Permeability
0 2 4 6 8
1
2
3
4
5
Test Pressures (Bar)
0 20 40 60 80
1
2
3
4
5
Lugeon Pattern
CHARACTERISTIC PERMEABILITY = 4.82 X 10⁻⁶
m/s
CHARACTERISTIC PERMEABILITY (Group D - Wash-out)
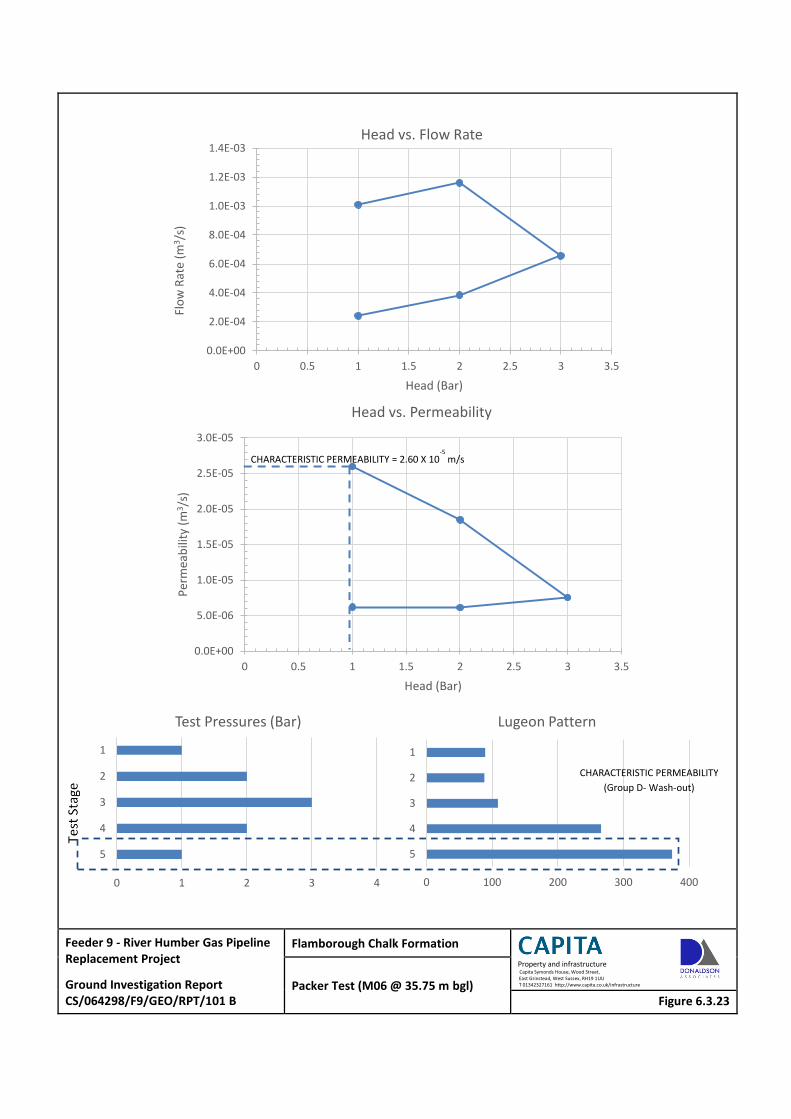
Feeder 9 - River Humber Gas Pipeline Replacement Project
Ground Investigation Report CS/064298/F9/GEO/RPT/101 B
Flamborough Chalk Formation
Property and infrastructure Capita Symonds House, Wood Street, East Grinstead, West Sussex, RH19 1UU T 01342327161 http://www.capita.co.uk/infrastructure Packer Test (M06 @ 35.75 m bgl)
Figure 6.3.23
0.0E+00
2.0E-04
4.0E-04
6.0E-04
8.0E-04
1.0E-03
1.2E-03
1.4E-03
0 0.5 1 1.5 2 2.5 3 3.5
Flo
w R
ate
(m3 /
s)
Head (Bar)
Head vs. Flow Rate
0.0E+00
5.0E-06
1.0E-05
1.5E-05
2.0E-05
2.5E-05
3.0E-05
0 0.5 1 1.5 2 2.5 3 3.5
Per
mea
bili
ty (
m3 /
s)
Head (Bar)
Head vs. Permeability
0 1 2 3 4
1
2
3
4
5
Test Pressures (Bar)
0 100 200 300 400
1
2
3
4
5
Lugeon Pattern
CHARACTERISTIC PERMEABILITY (Group D- Wash-out)
CHARACTERISTIC PERMEABILITY = 2.60 X 10⁻⁵
m/s
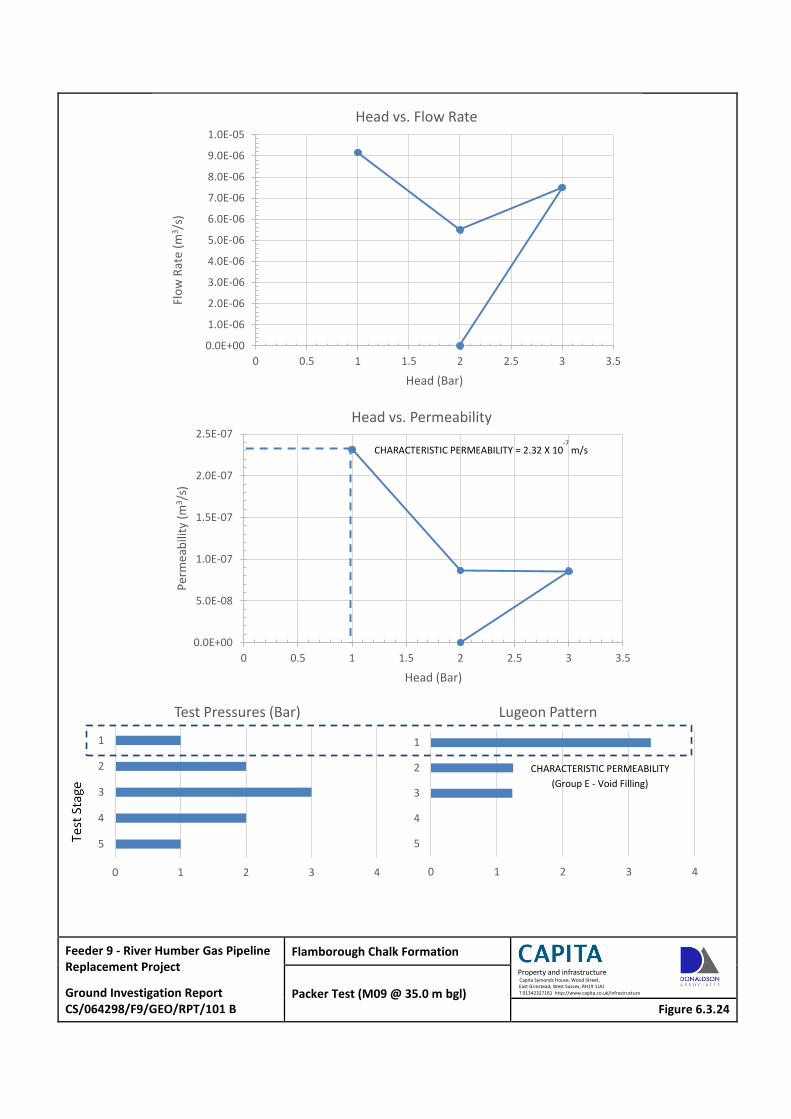
Feeder 9 - River Humber Gas Pipeline Replacement Project
Ground Investigation Report CS/064298/F9/GEO/RPT/101 B
Flamborough Chalk Formation
Property and infrastructure Capita Symonds House, Wood Street, East Grinstead, West Sussex, RH19 1UU T 01342327161 http://www.capita.co.uk/infrastructure Packer Test (M09 @ 35.0 m bgl)
Figure 6.3.24
0.0E+00
1.0E-06
2.0E-06
3.0E-06
4.0E-06
5.0E-06
6.0E-06
7.0E-06
8.0E-06
9.0E-06
1.0E-05
0 0.5 1 1.5 2 2.5 3 3.5
Flo
w R
ate
(m3 /
s)
Head (Bar)
Head vs. Flow Rate
0.0E+00
5.0E-08
1.0E-07
1.5E-07
2.0E-07
2.5E-07
0 0.5 1 1.5 2 2.5 3 3.5
Per
mea
bili
ty (
m3 /
s)
Head (Bar)
Head vs. Permeability
0 1 2 3 4
1
2
3
4
5
Test Pressures (Bar)
0 1 2 3 4
1
2
3
4
5
Lugeon Pattern
CHARACTERISTIC PERMEABILITY = 2.32 X 10⁻⁷
m/s
CHARACTERISTIC PERMEABILITY (Group E - Void Filling)
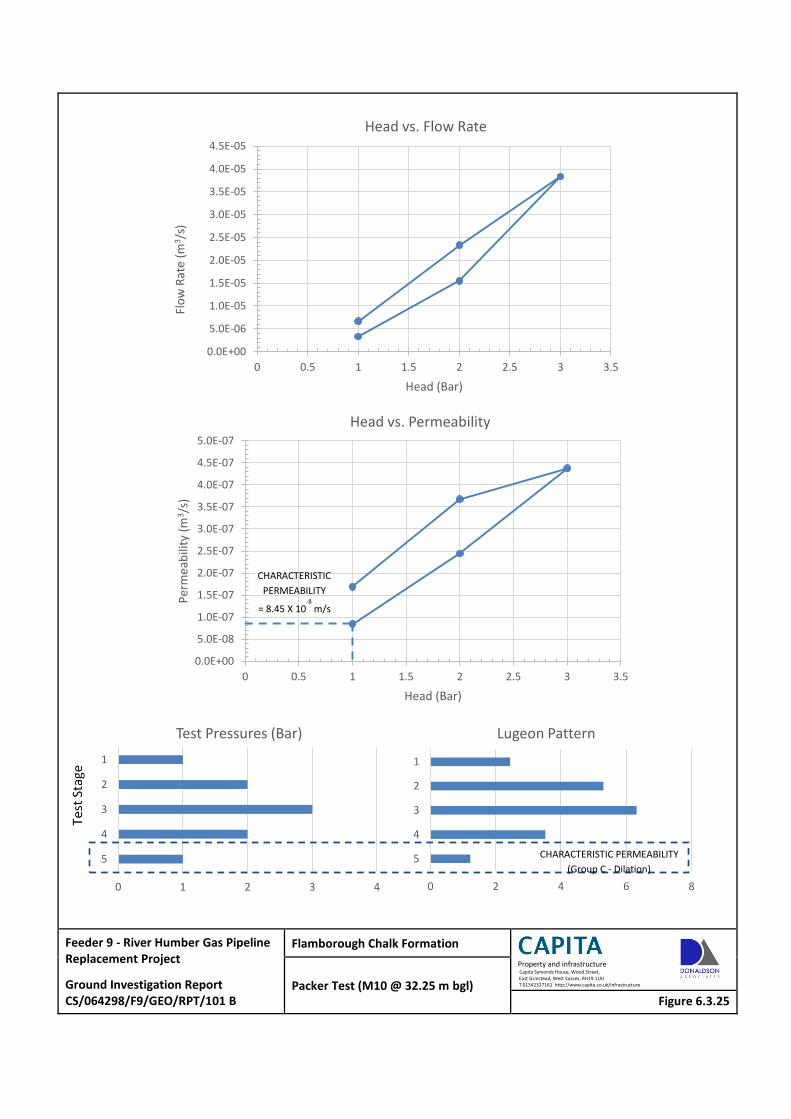
Feeder 9 - River Humber Gas Pipeline Replacement Project
Ground Investigation Report CS/064298/F9/GEO/RPT/101 B
Flamborough Chalk Formation
Property and infrastructure Capita Symonds House, Wood Street, East Grinstead, West Sussex, RH19 1UU T 01342327161 http://www.capita.co.uk/infrastructure Packer Test (M10 @ 32.25 m bgl)
Figure 6.3.25
0.0E+00
5.0E-06
1.0E-05
1.5E-05
2.0E-05
2.5E-05
3.0E-05
3.5E-05
4.0E-05
4.5E-05
0 0.5 1 1.5 2 2.5 3 3.5
Flo
w R
ate
(m3 /
s)
Head (Bar)
Head vs. Flow Rate
0.0E+00
5.0E-08
1.0E-07
1.5E-07
2.0E-07
2.5E-07
3.0E-07
3.5E-07
4.0E-07
4.5E-07
5.0E-07
0 0.5 1 1.5 2 2.5 3 3.5
Per
mea
bili
ty (
m3 /
s)
Head (Bar)
Head vs. Permeability
0 1 2 3 4
1
2
3
4
5
Test Pressures (Bar)
0 2 4 6 8
1
2
3
4
5
Lugeon Pattern
CHARACTERISTIC
PERMEABILITY = 8.45 X 10
-8
m/s
CHARACTERISTIC PERMEABILITY (Group C - Dilation)
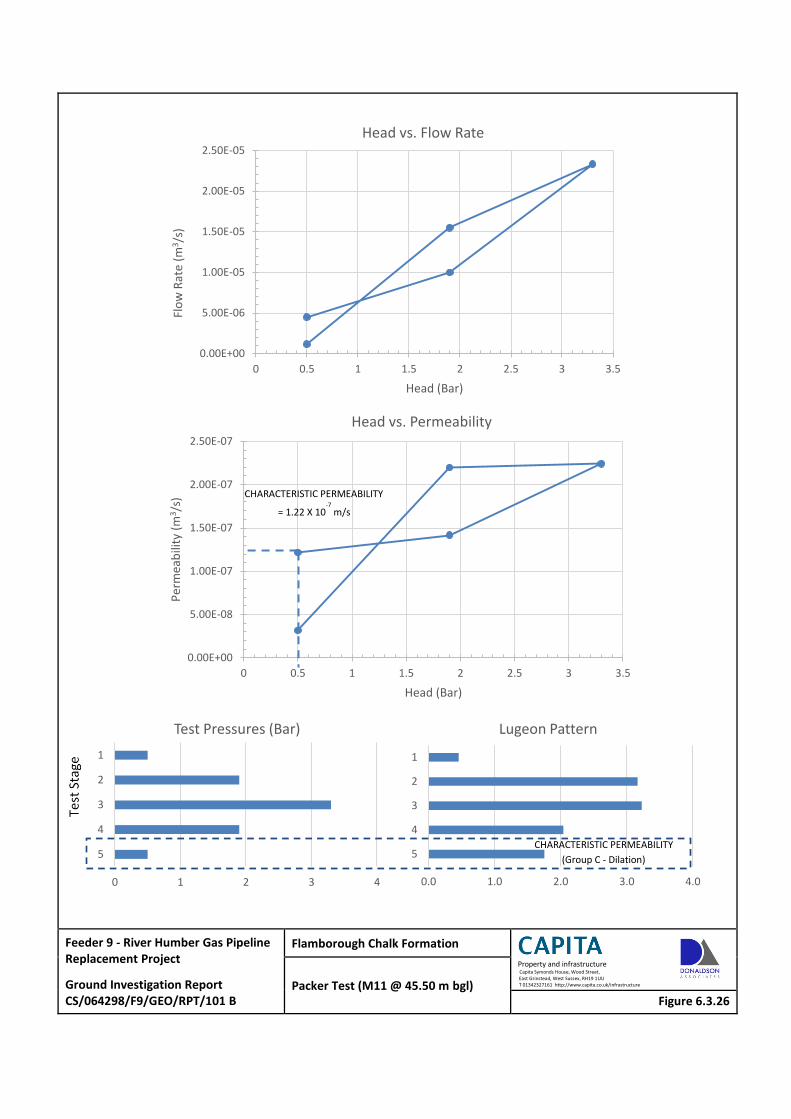
Feeder 9 - River Humber Gas Pipeline Replacement Project
Ground Investigation Report CS/064298/F9/GEO/RPT/101 B
Flamborough Chalk Formation
Property and infrastructure Capita Symonds House, Wood Street, East Grinstead, West Sussex, RH19 1UU T 01342327161 http://www.capita.co.uk/infrastructure Packer Test (M11 @ 45.50 m bgl)
Figure 6.3.26
0.00E+00
5.00E-06
1.00E-05
1.50E-05
2.00E-05
2.50E-05
0 0.5 1 1.5 2 2.5 3 3.5
Flo
w R
ate
(m3 /
s)
Head (Bar)
Head vs. Flow Rate
0.00E+00
5.00E-08
1.00E-07
1.50E-07
2.00E-07
2.50E-07
0 0.5 1 1.5 2 2.5 3 3.5
Per
mea
bili
ty (
m3/s
)
Head (Bar)
Head vs. Permeability
0 1 2 3 4
1
2
3
4
5
Test Pressures (Bar)
0.0 1.0 2.0 3.0 4.0
1
2
3
4
5
Lugeon Pattern
CHARACTERISTIC PERMEABILITY (Group C - Dilation)
CHARACTERISTIC PERMEABILITY
= 1.22 X 10⁻⁷
m/s
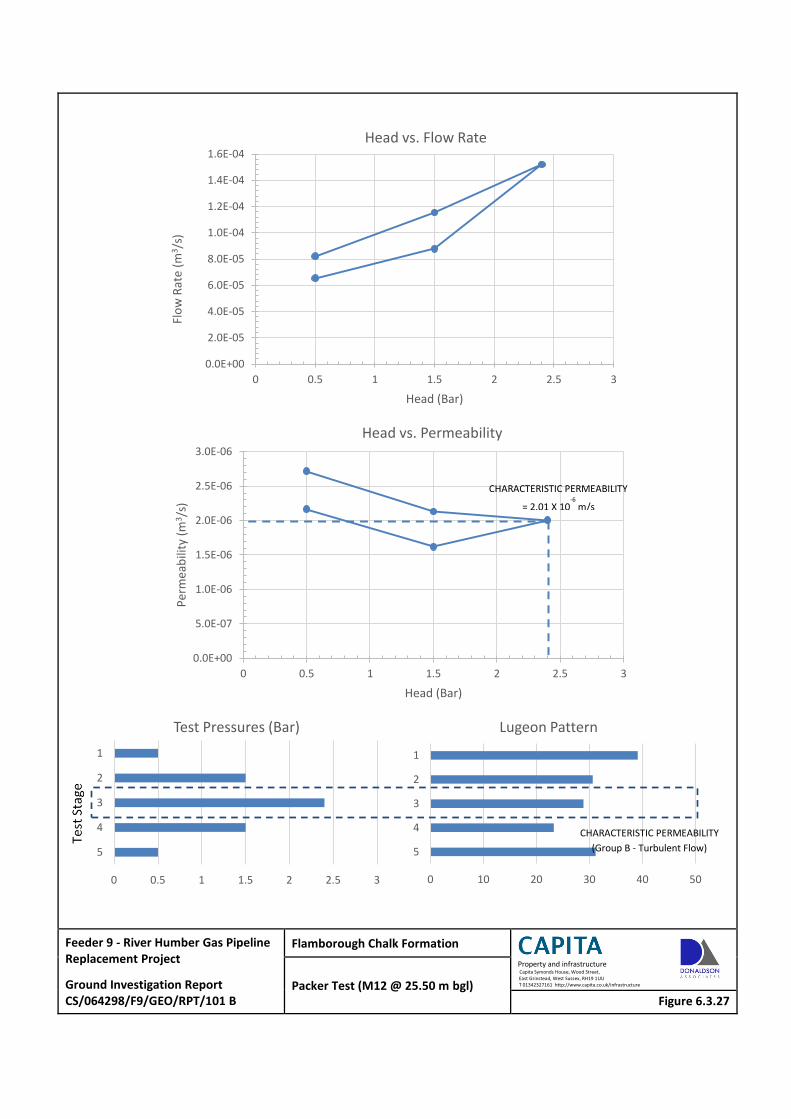
Feeder 9 - River Humber Gas Pipeline Replacement Project
Ground Investigation Report CS/064298/F9/GEO/RPT/101 B
Flamborough Chalk Formation
Property and infrastructure Capita Symonds House, Wood Street, East Grinstead, West Sussex, RH19 1UU T 01342327161 http://www.capita.co.uk/infrastructure Packer Test (M12 @ 25.50 m bgl)
Figure 6.3.27
0.0E+00
2.0E-05
4.0E-05
6.0E-05
8.0E-05
1.0E-04
1.2E-04
1.4E-04
1.6E-04
0 0.5 1 1.5 2 2.5 3
Flo
w R
ate
(m3 /
s)
Head (Bar)
Head vs. Flow Rate
0.0E+00
5.0E-07
1.0E-06
1.5E-06
2.0E-06
2.5E-06
3.0E-06
0 0.5 1 1.5 2 2.5 3
Per
mea
bili
ty (
m3 /
s)
Head (Bar)
Head vs. Permeability
0 0.5 1 1.5 2 2.5 3
1
2
3
4
5
Test Pressures (Bar)
0 10 20 30 40 50
1
2
3
4
5
Lugeon Pattern
CHARACTERISTIC PERMEABILITY (Group B - Turbulent Flow)
CHARACTERISTIC PERMEABILITY
= 2.01 X 10⁻⁶
m/s

Feeder 9 - River Humber Gas Pipeline Replacement Project
Ground Investigation Report CS/064298/F9/GEO/RPT/101 B
Flamborough Chalk Formation
Property and infrastructure Capita Symonds House, Wood Street, East Grinstead, West Sussex, RH19 1UU T 01342327161 http://www.capita.co.uk/infrastructure Packer Test (M12 @ 30.60 m bgl)
Figure 6.3.28
0.0E+00
1.0E-05
2.0E-05
3.0E-05
4.0E-05
5.0E-05
6.0E-05
7.0E-05
8.0E-05
9.0E-05
0 0.5 1 1.5 2 2.5 3 3.5 4
Flo
w R
ate
(m3 /
s)
Head (Bar)
Head vs. Flow Rate
0.0E+00
1.0E-07
2.0E-07
3.0E-07
4.0E-07
5.0E-07
6.0E-07
7.0E-07
8.0E-07
9.0E-07
0 0.5 1 1.5 2 2.5 3 3.5 4
Per
mea
bili
ty (
m3/s
)
Head (Bar)
Head vs. Permeability
0 1 2 3 4
1
2
3
4
5
Test Pressures (Bar)
0 2 4 6 8 10 12
1
2
3
4
5
Lugeon Pattern CHARACTERISTIC PERMEABILITY
(Group C - Dilation)
CHARACTERISTIC PERMEABILITY
= 4.77 X 10⁻⁷
m/s
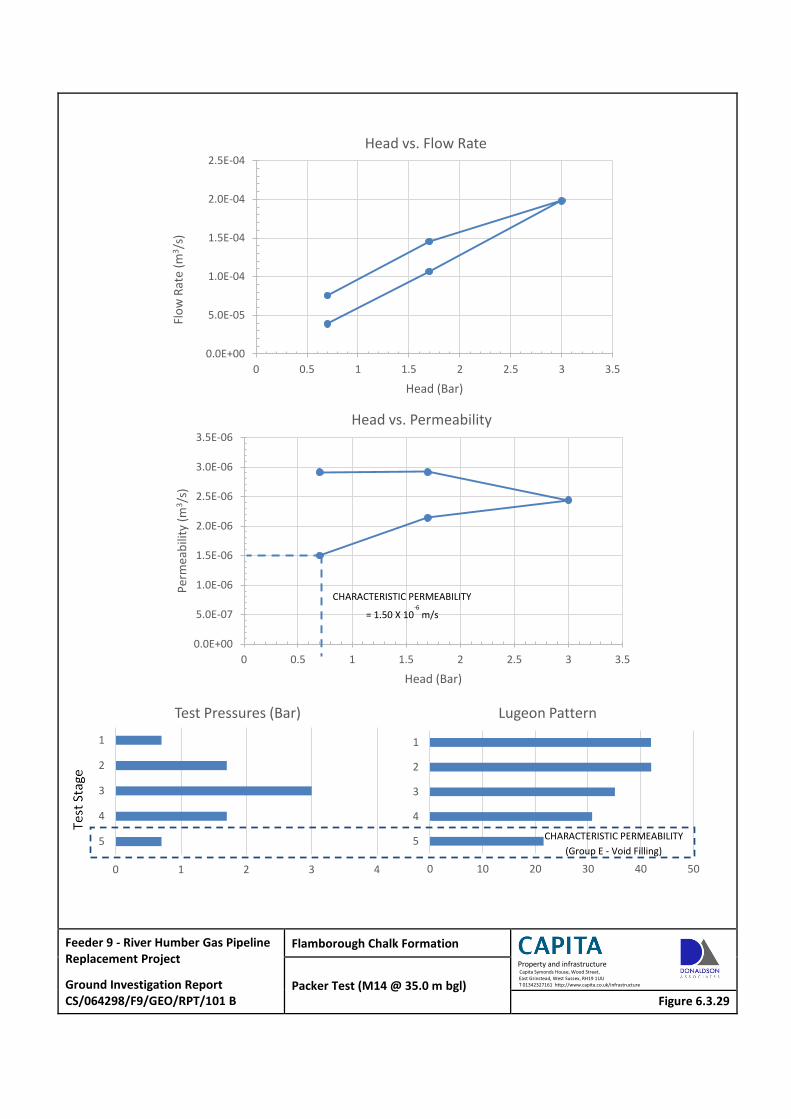
Feeder 9 - River Humber Gas Pipeline Replacement Project
Ground Investigation Report CS/064298/F9/GEO/RPT/101 B
Flamborough Chalk Formation
Property and infrastructure Capita Symonds House, Wood Street, East Grinstead, West Sussex, RH19 1UU T 01342327161 http://www.capita.co.uk/infrastructure Packer Test (M14 @ 35.0 m bgl)
Figure 6.3.29
0.0E+00
5.0E-05
1.0E-04
1.5E-04
2.0E-04
2.5E-04
0 0.5 1 1.5 2 2.5 3 3.5
Flo
w R
ate
(m3/s
)
Head (Bar)
Head vs. Flow Rate
0.0E+00
5.0E-07
1.0E-06
1.5E-06
2.0E-06
2.5E-06
3.0E-06
3.5E-06
0 0.5 1 1.5 2 2.5 3 3.5
Per
mea
bili
ty (
m3 /
s)
Head (Bar)
Head vs. Permeability
0 1 2 3 4
1
2
3
4
5
Test Pressures (Bar)
0 10 20 30 40 50
1
2
3
4
5
Lugeon Pattern
CHARACTERISTIC PERMEABILITY (Group E - Void Filling)
CHARACTERISTIC PERMEABILITY
= 1.50 X 10⁻⁶
m/s
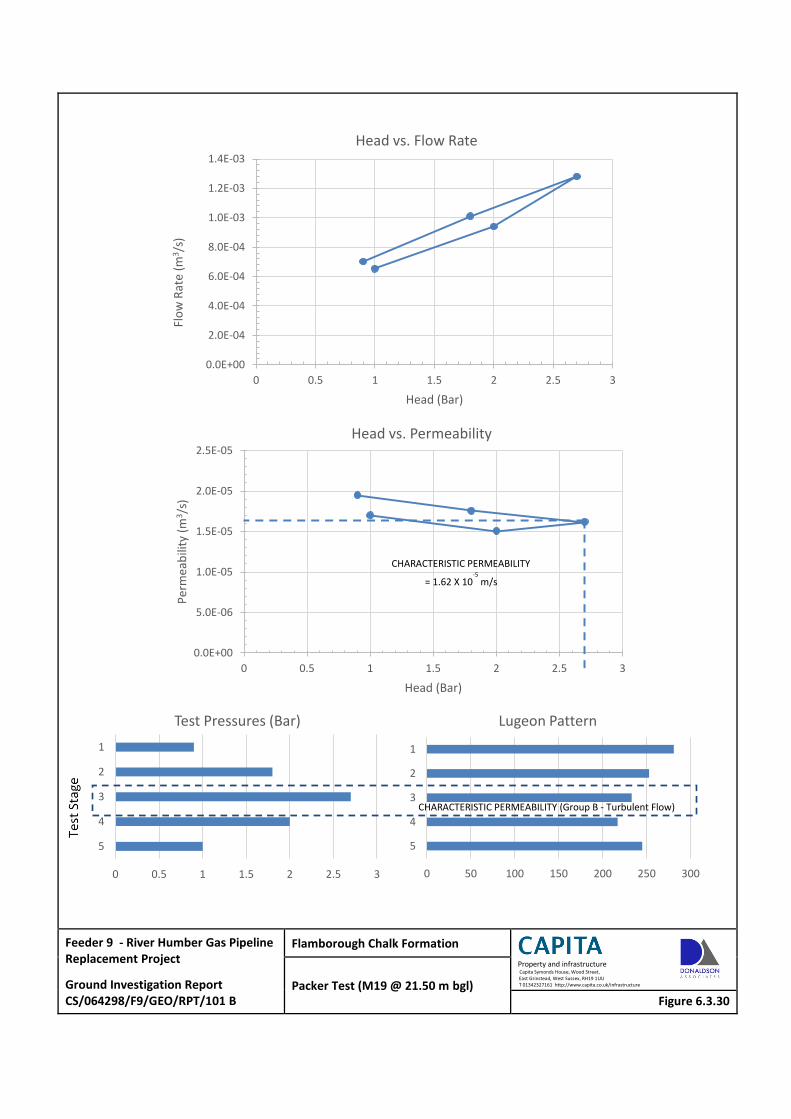
Feeder 9 - River Humber Gas Pipeline Replacement Project
Ground Investigation Report CS/064298/F9/GEO/RPT/101 B
Flamborough Chalk Formation
Property and infrastructure Capita Symonds House, Wood Street, East Grinstead, West Sussex, RH19 1UU T 01342327161 http://www.capita.co.uk/infrastructure Packer Test (M19 @ 21.50 m bgl)
Figure 6.3.30
0.0E+00
2.0E-04
4.0E-04
6.0E-04
8.0E-04
1.0E-03
1.2E-03
1.4E-03
0 0.5 1 1.5 2 2.5 3
Flo
w R
ate
(m3/s
)
Head (Bar)
Head vs. Flow Rate
0.0E+00
5.0E-06
1.0E-05
1.5E-05
2.0E-05
2.5E-05
0 0.5 1 1.5 2 2.5 3
Per
mea
bili
ty (
m3 /
s)
Head (Bar)
Head vs. Permeability
0 0.5 1 1.5 2 2.5 3
1
2
3
4
5
Test Pressures (Bar)
0 50 100 150 200 250 300
1
2
3
4
5
Lugeon Pattern
CHARACTERISTIC PERMEABILITY (Group B - Turbulent Flow)
CHARACTERISTIC PERMEABILITY
= 1.62 X 10⁻⁵
m/s
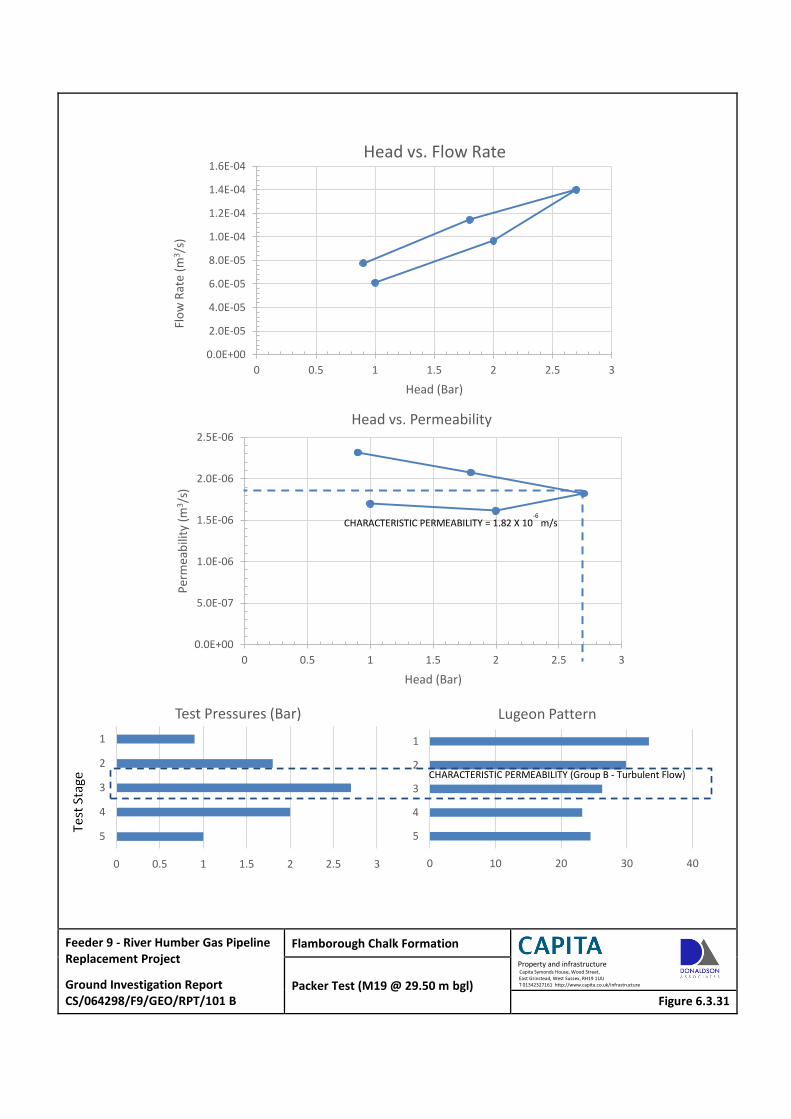
Feeder 9 - River Humber Gas Pipeline Replacement Project
Ground Investigation Report CS/064298/F9/GEO/RPT/101 B
Flamborough Chalk Formation
Property and infrastructure Capita Symonds House, Wood Street, East Grinstead, West Sussex, RH19 1UU T 01342327161 http://www.capita.co.uk/infrastructure Packer Test (M19 @ 29.50 m bgl)
Figure 6.3.31
0.0E+00
2.0E-05
4.0E-05
6.0E-05
8.0E-05
1.0E-04
1.2E-04
1.4E-04
1.6E-04
0 0.5 1 1.5 2 2.5 3
Flo
w R
ate
(m3 /
s)
Head (Bar)
Head vs. Flow Rate
0.0E+00
5.0E-07
1.0E-06
1.5E-06
2.0E-06
2.5E-06
0 0.5 1 1.5 2 2.5 3
Per
mea
bili
ty (
m3 /
s)
Head (Bar)
Head vs. Permeability
0 0.5 1 1.5 2 2.5 3
1
2
3
4
5
Test Pressures (Bar)
0 10 20 30 40
1
2
3
4
5
Lugeon Pattern
CHARACTERISTIC PERMEABILITY (Group B - Turbulent Flow)
CHARACTERISTIC PERMEABILITY = 1.82 X 10⁻⁶
m/s
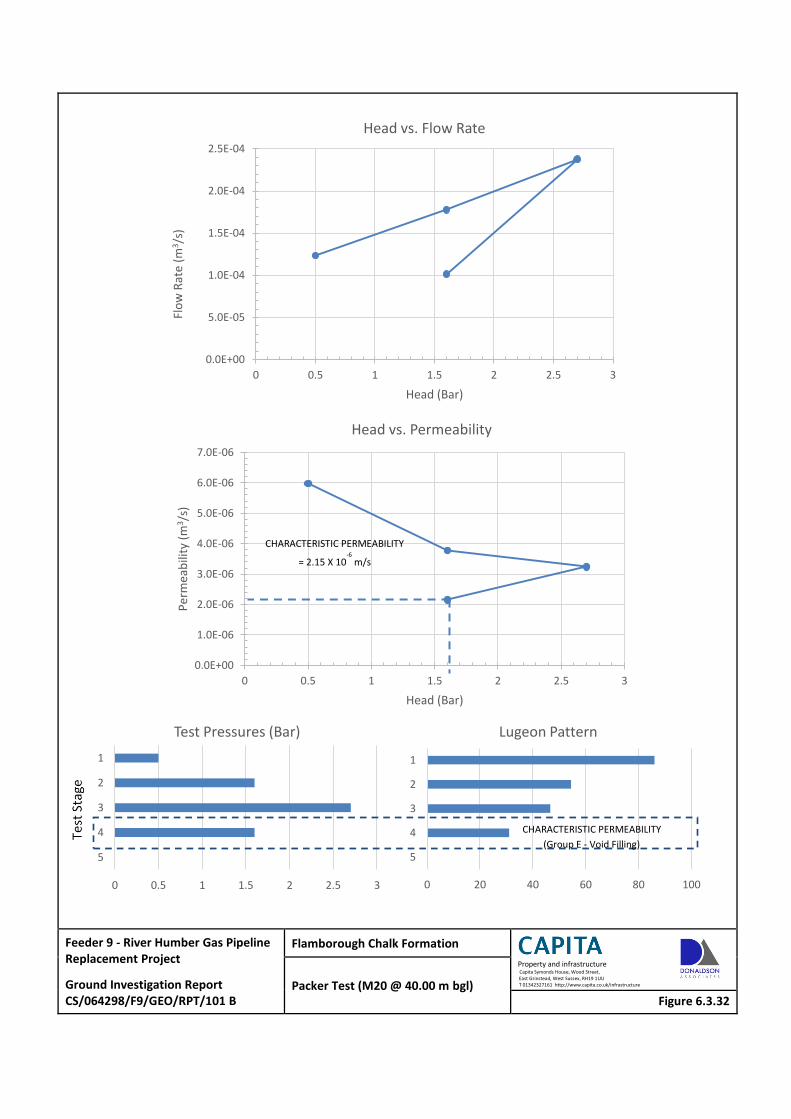
Feeder 9 - River Humber Gas Pipeline Replacement Project
Ground Investigation Report CS/064298/F9/GEO/RPT/101 B
Flamborough Chalk Formation
Property and infrastructure Capita Symonds House, Wood Street, East Grinstead, West Sussex, RH19 1UU T 01342327161 http://www.capita.co.uk/infrastructure Packer Test (M20 @ 40.00 m bgl)
Figure 6.3.32
0.0E+00
5.0E-05
1.0E-04
1.5E-04
2.0E-04
2.5E-04
0 0.5 1 1.5 2 2.5 3
Flo
w R
ate
(m3/s
)
Head (Bar)
Head vs. Flow Rate
0.0E+00
1.0E-06
2.0E-06
3.0E-06
4.0E-06
5.0E-06
6.0E-06
7.0E-06
0 0.5 1 1.5 2 2.5 3
Per
mea
bili
ty (
m3/s
)
Head (Bar)
Head vs. Permeability
0 0.5 1 1.5 2 2.5 3
1
2
3
4
5
Test Pressures (Bar)
0 20 40 60 80 100
1
2
3
4
5
Lugeon Pattern
CHARACTERISTIC PERMEABILITY (Group E - Void Filling)
CHARACTERISTIC PERMEABILITY
= 2.15 X 10⁻⁶
m/s
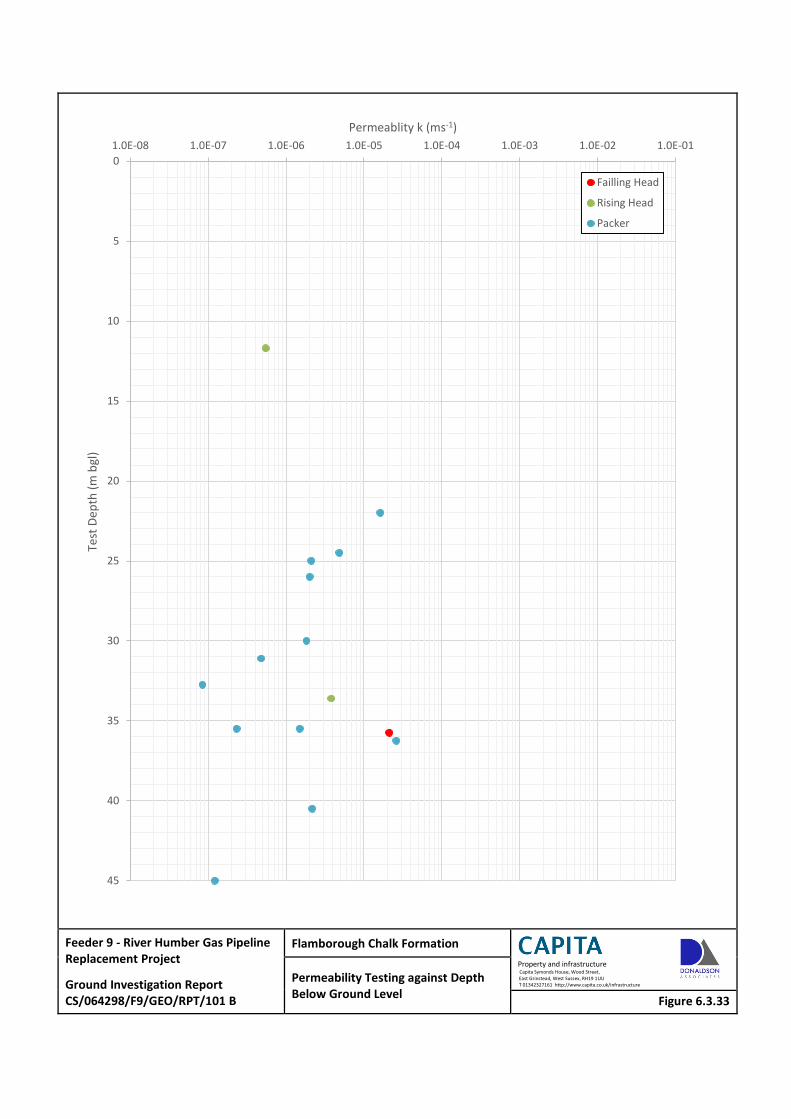
Feeder 9 - River Humber Gas Pipeline Replacement Project
Ground Investigation Report CS/064298/F9/GEO/RPT/101 B
Flamborough Chalk Formation
Property and infrastructure Capita Symonds House, Wood Street, East Grinstead, West Sussex, RH19 1UU T 01342327161 http://www.capita.co.uk/infrastructure Permeability Testing against Depth
Below Ground Level Figure 6.3.33
0
5
10
15
20
25
30
35
40
45
1.0E-08 1.0E-07 1.0E-06 1.0E-05 1.0E-04 1.0E-03 1.0E-02 1.0E-01
Test
Dep
th (
m b
gl)
Permeablity k (ms-1)
Failling Head
Rising Head
Packer
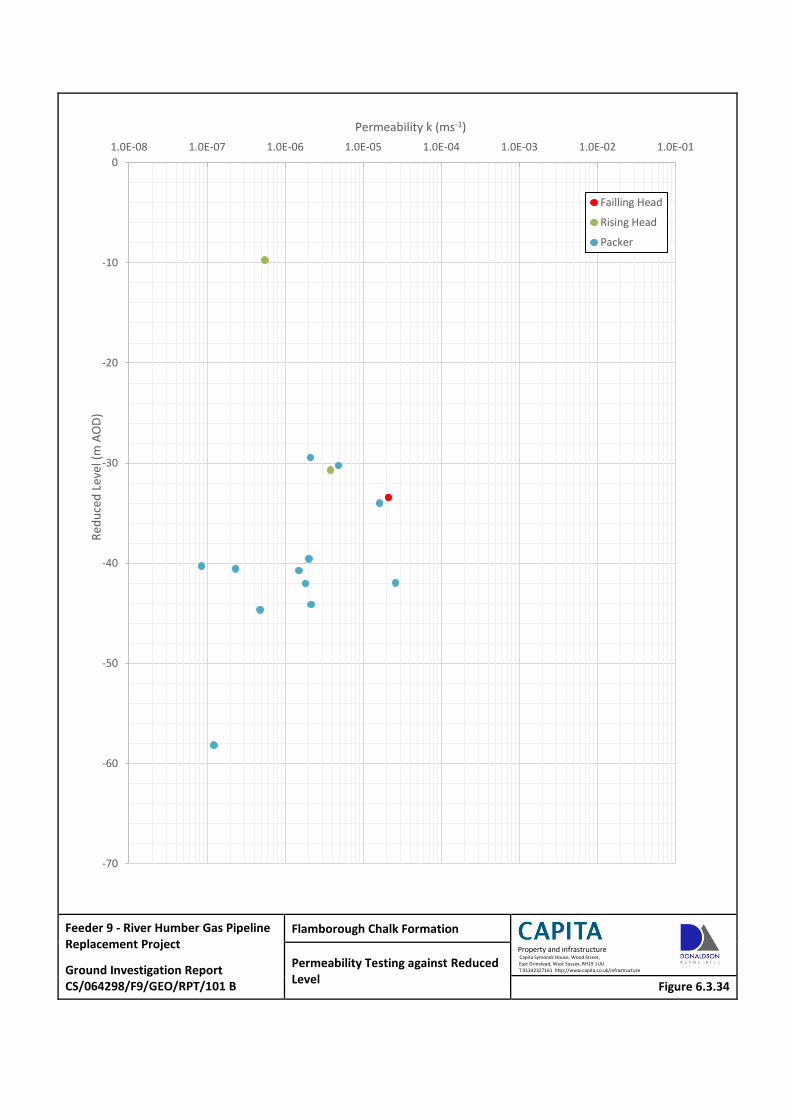
Feeder 9 - River Humber Gas Pipeline Replacement Project
Ground Investigation Report CS/064298/F9/GEO/RPT/101 B
Flamborough Chalk Formation
Property and infrastructure Capita Symonds House, Wood Street, East Grinstead, West Sussex, RH19 1UU T 01342327161 http://www.capita.co.uk/infrastructure Permeability Testing against Reduced
Level Figure 6.3.34
-70
-60
-50
-40
-30
-20
-10
0
1.0E-08 1.0E-07 1.0E-06 1.0E-05 1.0E-04 1.0E-03 1.0E-02 1.0E-01
Red
uce
d L
evel
(m
AO
D)
Permeability k (ms-1)
Failling Head
Rising Head
Packer

Feeder 9 - River Humber Gas Pipeline Replacement Project Ground Investigation Report CS/064298/F9/GEO/RPT/101 B
Flamborough Chalk Formation
Property and infrastructure Capita Symonds House, Wood Street, East Grinstead, West Sussex, RH19 1UU T 01342327161 http://www.capita.co.uk/infrastructure HPD Testing - Shear Modulus plotted against
Reduced Level. Figure 6.3.35
-60.0
-50.0
-40.0
-30.0
-20.0
-10.0
0.0
0 200 400 600 800 1000 1200 1400 1600 1800 R
edu
ced
Lev
el (
m A
OD
) Shear Modulus Gur (loop 2) (MPa)
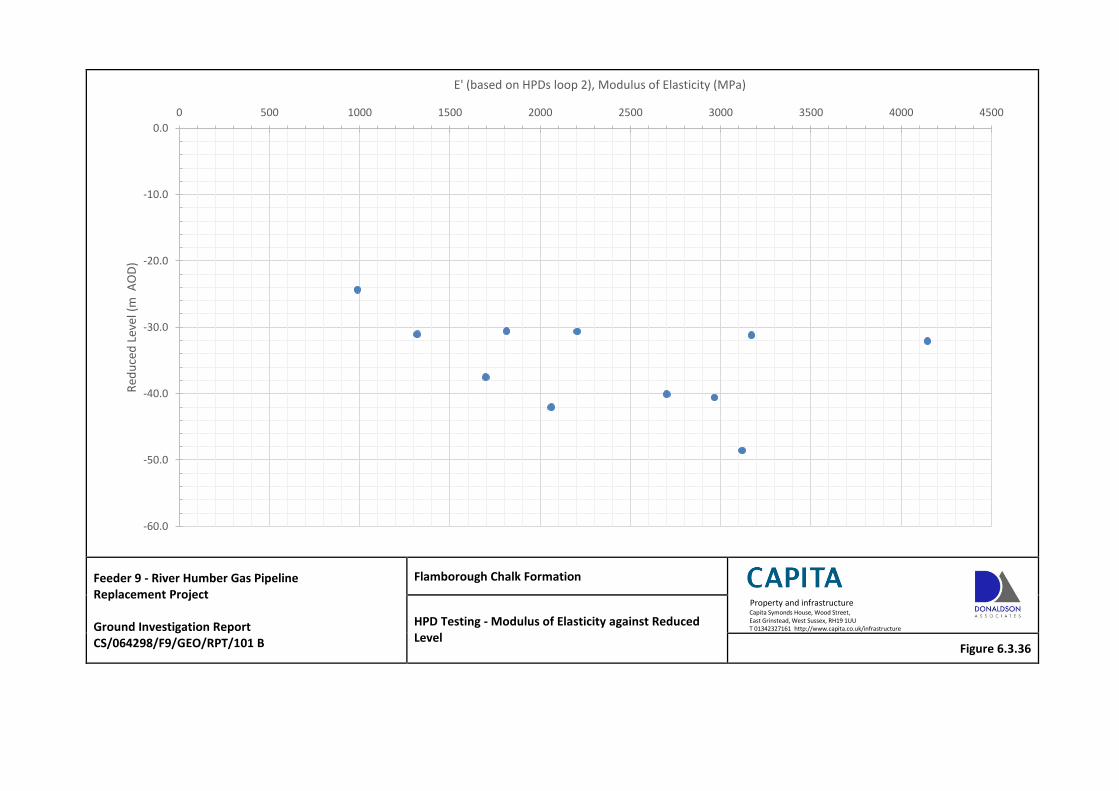
Feeder 9 - River Humber Gas Pipeline Replacement Project Ground Investigation Report CS/064298/F9/GEO/RPT/101 B
Flamborough Chalk Formation
Property and infrastructure Capita Symonds House, Wood Street, East Grinstead, West Sussex, RH19 1UU T 01342327161 http://www.capita.co.uk/infrastructure HPD Testing - Modulus of Elasticity against Reduced
Level Figure 6.3.36
-60.0
-50.0
-40.0
-30.0
-20.0
-10.0
0.0
0 500 1000 1500 2000 2500 3000 3500 4000 4500
Red
uce
d L
evel
(m
AO
D)
E' (based on HPDs loop 2), Modulus of Elasticity (MPa)
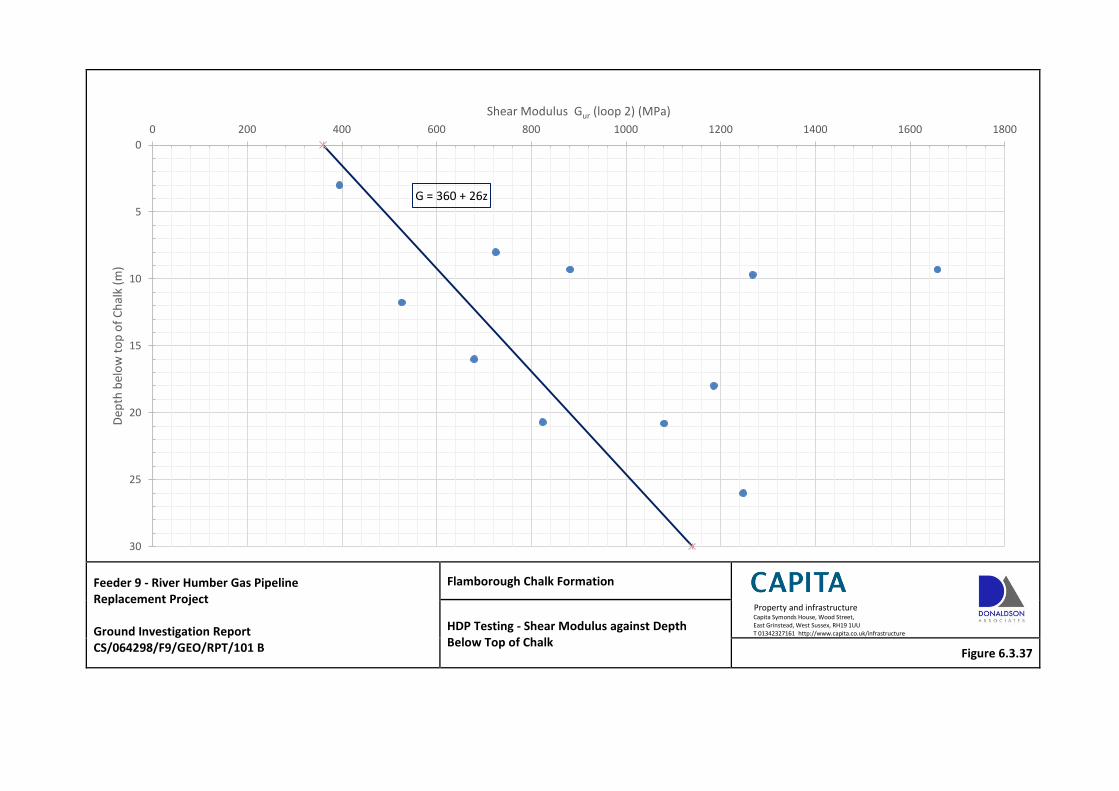
0
5
10
15
20
25
30
0 200 400 600 800 1000 1200 1400 1600 1800 D
epth
bel
ow
to
p o
f C
hal
k (m
) Shear Modulus Gur (loop 2) (MPa)
G = 360 + 26z
Feeder 9 - River Humber Gas Pipeline Replacement Project Ground Investigation Report CS/064298/F9/GEO/RPT/101 B
Flamborough Chalk Formation
Property and infrastructure Capita Symonds House, Wood Street, East Grinstead, West Sussex, RH19 1UU T 01342327161 http://www.capita.co.uk/infrastructure HDP Testing - Shear Modulus against Depth
Below Top of Chalk Figure 6.3.37
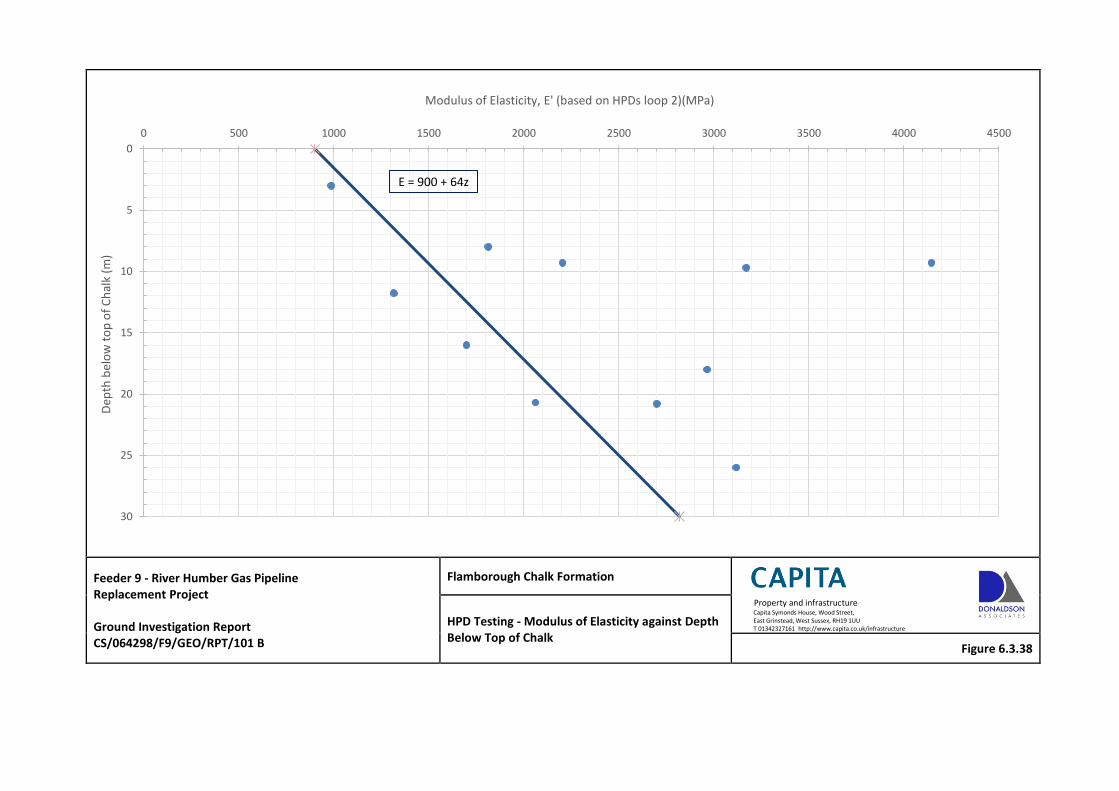
Feeder 9 - River Humber Gas Pipeline Replacement Project Ground Investigation Report CS/064298/F9/GEO/RPT/101 B
Flamborough Chalk Formation
Property and infrastructure Capita Symonds House, Wood Street, East Grinstead, West Sussex, RH19 1UU T 01342327161 http://www.capita.co.uk/infrastructure HPD Testing - Modulus of Elasticity against Depth
Below Top of Chalk Figure 6.3.38
0
5
10
15
20
25
30
0 500 1000 1500 2000 2500 3000 3500 4000 4500
Dep
th b
elo
w t
op
of
Ch
alk
(m)
Modulus of Elasticity, E' (based on HPDs loop 2)(MPa)
E = 900 + 64z
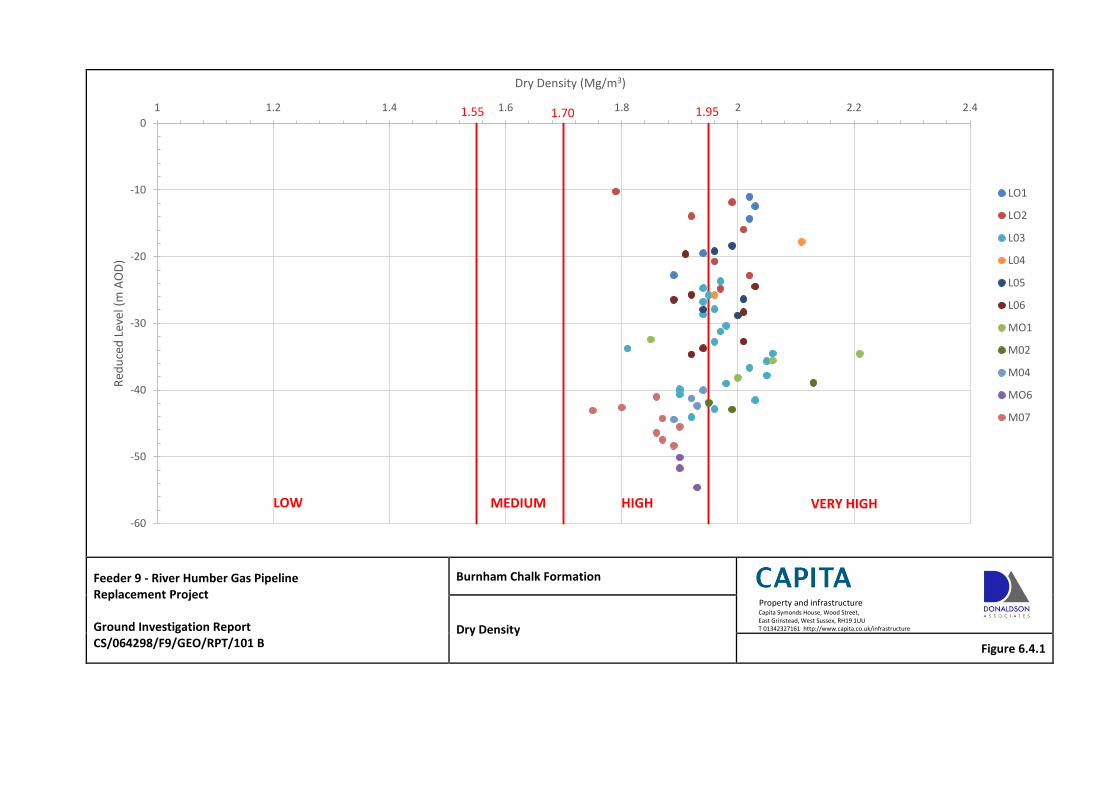
Feeder 9 - River Humber Gas Pipeline Replacement Project Ground Investigation Report CS/064298/F9/GEO/RPT/101 B
Burnham Chalk Formation
Property and infrastructure Capita Symonds House, Wood Street, East Grinstead, West Sussex, RH19 1UU T 01342327161 http://www.capita.co.uk/infrastructure Dry Density
Figure 6.4.1
-60
-50
-40
-30
-20
-10
0
1 1.2 1.4 1.6 1.8 2 2.2 2.4 R
edu
ced
Lev
el (
m A
OD
)
Dry Density (Mg/m3)
LO1
LO2
L03
L04
L05
L06
MO1
M02
M04
MO6
M07
1.55 1.95 1.70
LOW MEDIUM HIGH VERY HIGH
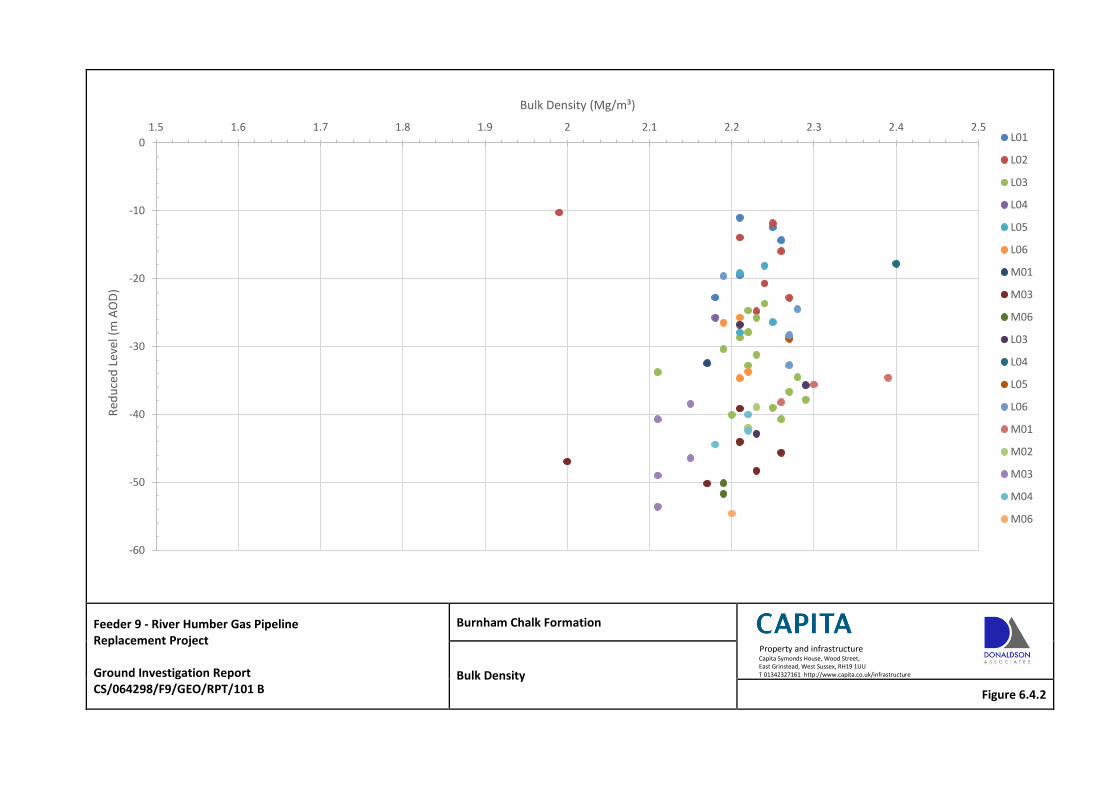
Feeder 9 - River Humber Gas Pipeline Replacement Project Ground Investigation Report CS/064298/F9/GEO/RPT/101 B
Burnham Chalk Formation
Property and infrastructure Capita Symonds House, Wood Street, East Grinstead, West Sussex, RH19 1UU T 01342327161 http://www.capita.co.uk/infrastructure Bulk Density
Figure 6.4.2
-60
-50
-40
-30
-20
-10
0
1.5 1.6 1.7 1.8 1.9 2 2.1 2.2 2.3 2.4 2.5 R
edu
ced
Lev
el (
m A
OD
) Bulk Density (Mg/m³)
L01
L02
L03
L04
L05
L06
M01
M03
M06
L03
L04
L05
L06
M01
M02
M03
M04
M06
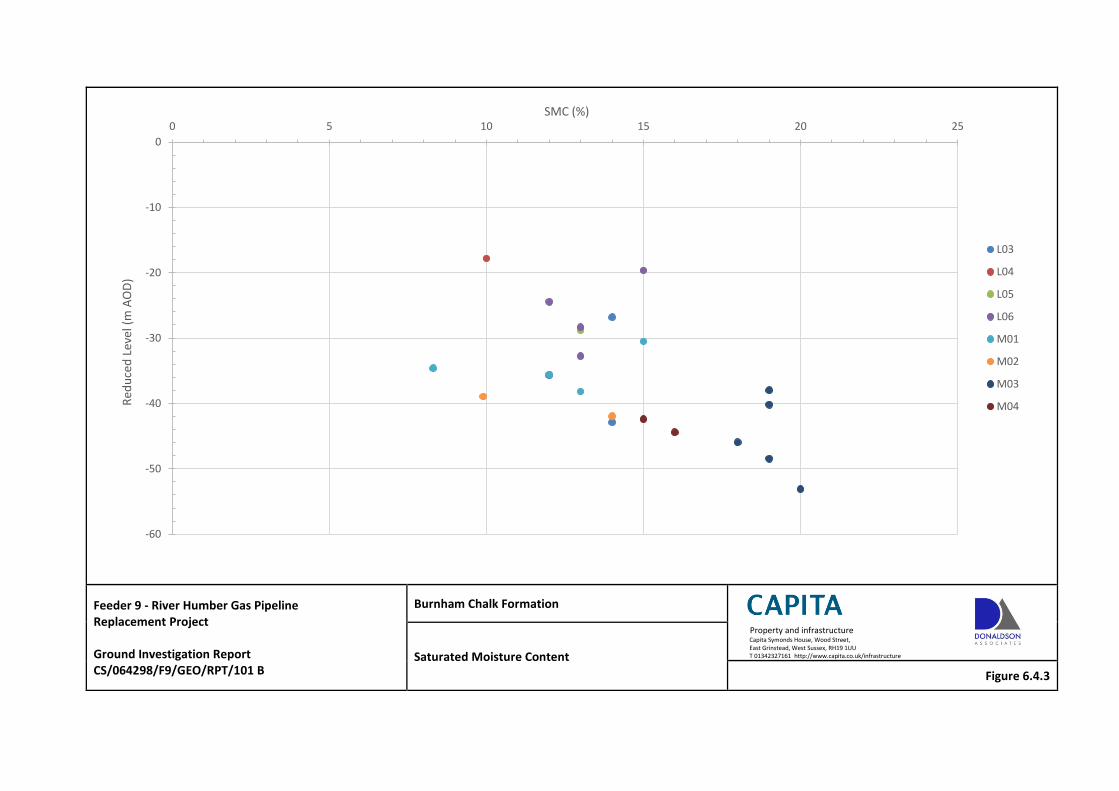
Feeder 9 - River Humber Gas Pipeline Replacement Project Ground Investigation Report CS/064298/F9/GEO/RPT/101 B
Burnham Chalk Formation
Property and infrastructure Capita Symonds House, Wood Street, East Grinstead, West Sussex, RH19 1UU T 01342327161 http://www.capita.co.uk/infrastructure Saturated Moisture Content
Figure 6.4.3
-60
-50
-40
-30
-20
-10
0
0 5 10 15 20 25 R
edu
ced
Lev
el (
m A
OD
) SMC (%)
L03
L04
L05
L06
M01
M02
M03
M04
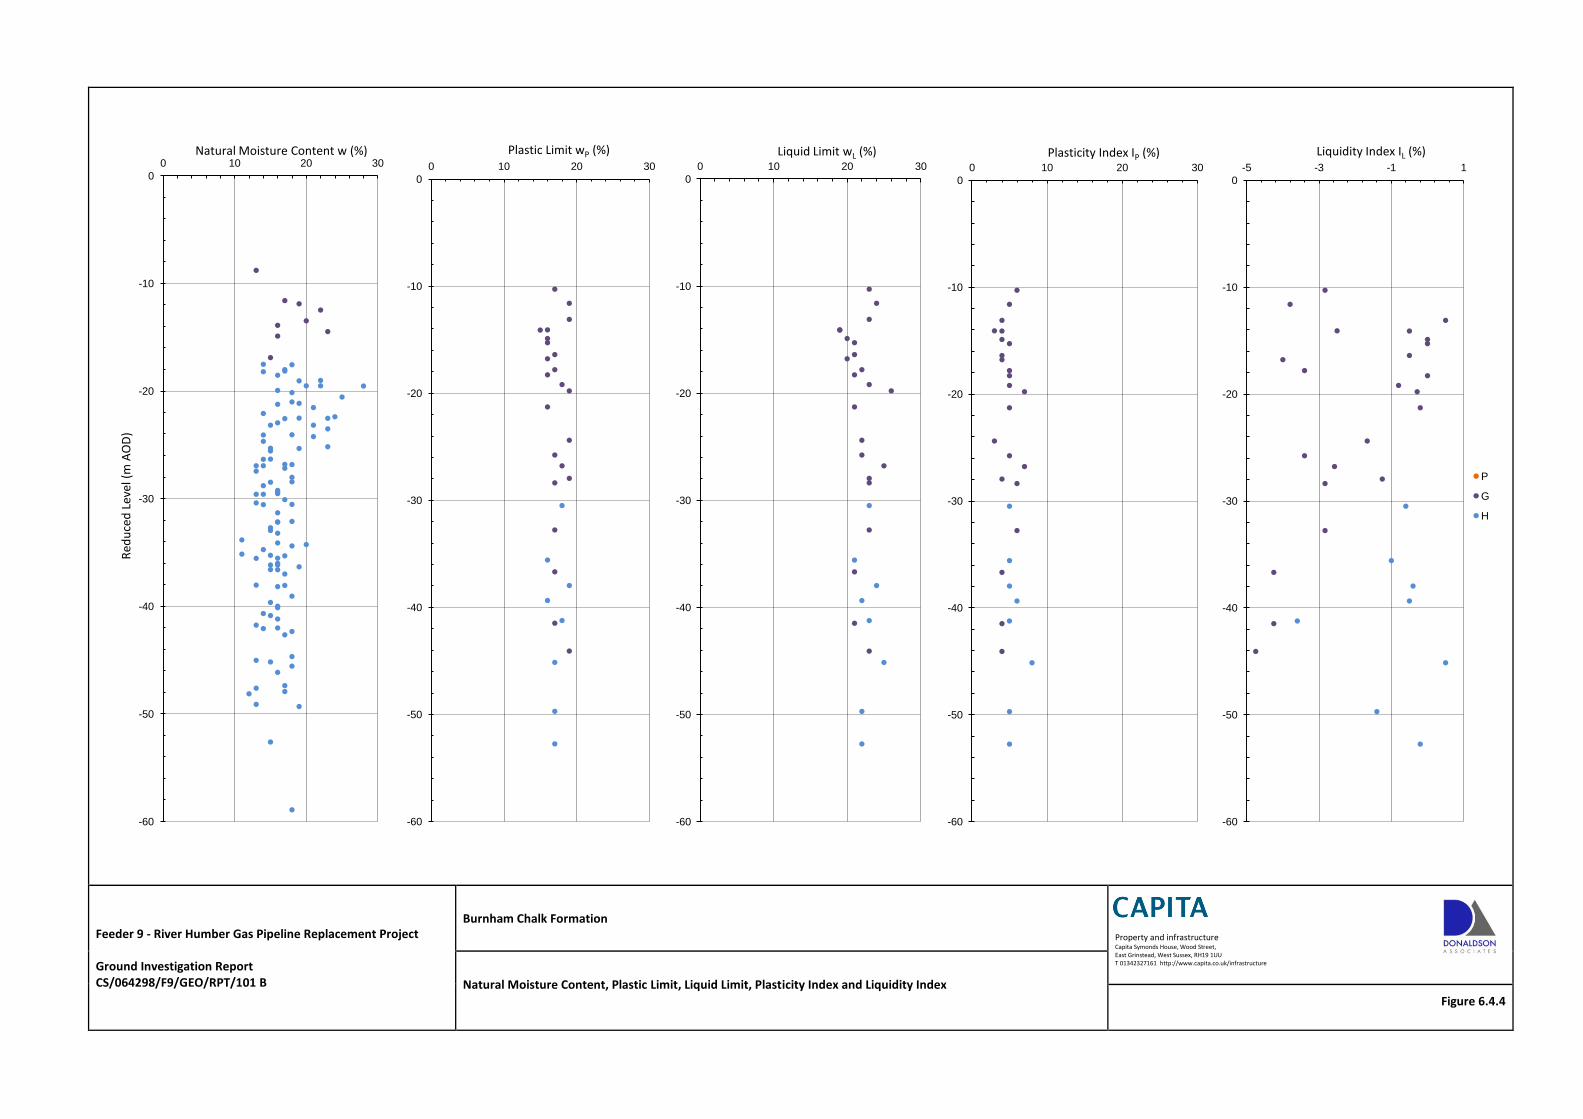
Feeder 9 - River Humber Gas Pipeline Replacement Project Ground Investigation Report CS/064298/F9/GEO/RPT/101 B
Burnham Chalk Formation
Property and infrastructure Capita Symonds House, Wood Street, East Grinstead, West Sussex, RH19 1UU T 01342327161 http://www.capita.co.uk/infrastructure
Natural Moisture Content, Plastic Limit, Liquid Limit, Plasticity Index and Liquidity Index
Figure 6.4.4
-60
-50
-40
-30
-20
-10
0
0 10 20 30
Red
uce
d L
evel
(m
AO
D)
Natural Moisture Content w (%)
-60
-50
-40
-30
-20
-10
0
0 10 20 30
Plastic Limit wP (%)
-60
-50
-40
-30
-20
-10
0
0 10 20 30
Liquid Limit wL (%)
-60
-50
-40
-30
-20
-10
0
0 10 20 30
Plasticity Index IP (%)
-60
-50
-40
-30
-20
-10
0
-5 -3 -1 1
Liquidity Index IL (%)
P
G
H
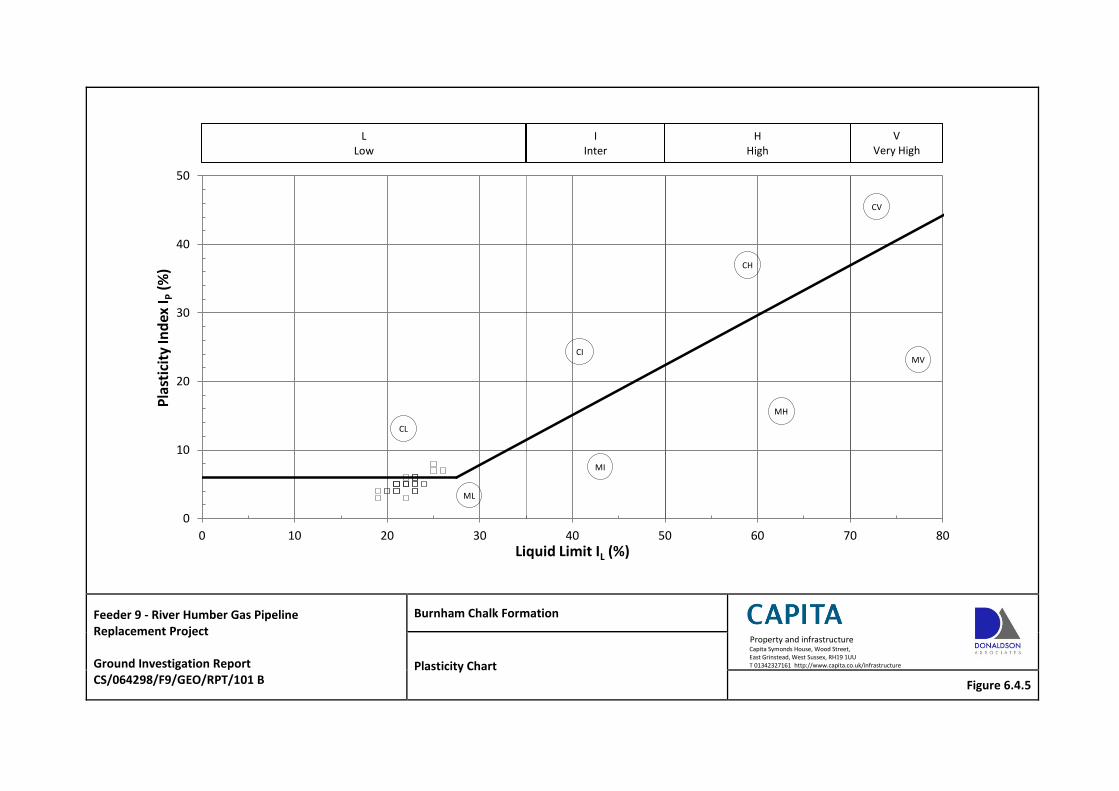
Feeder 9 - River Humber Gas Pipeline Replacement Project Ground Investigation Report CS/064298/F9/GEO/RPT/101 B
Burnham Chalk Formation
Property and infrastructure Capita Symonds House, Wood Street, East Grinstead, West Sussex, RH19 1UU T 01342327161 http://www.capita.co.uk/infrastructure Plasticity Chart
Figure 6.4.5
0
10
20
30
40
50
0 10 20 30 40 50 60 70 80
Pla
stic
ity
Ind
ex I P
(%
)
Liquid Limit IL (%)
L Low
I Inter
H High
V Very High
CL
ML
CI
MI
CH
MH
CV
MV
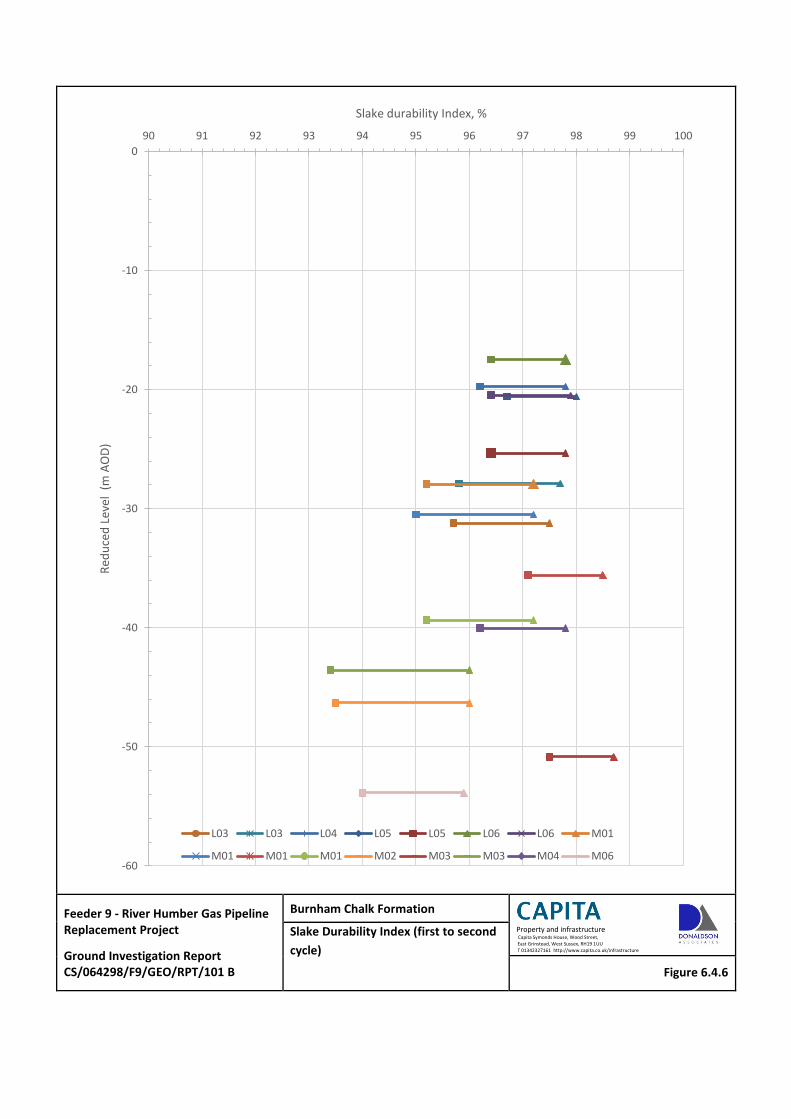
Feeder 9 - River Humber Gas Pipeline Replacement Project
Ground Investigation Report CS/064298/F9/GEO/RPT/101 B
Burnham Chalk Formation
Property and infrastructure Capita Symonds House, Wood Street, East Grinstead, West Sussex, RH19 1UU T 01342327161 http://www.capita.co.uk/infrastructure
Slake Durability Index (first to second
cycle)
Figure 6.4.6
-60
-50
-40
-30
-20
-10
0
90 91 92 93 94 95 96 97 98 99 100
Red
uce
d L
evel
(m
AO
D)
Slake durability Index, %
L03 L03 L04 L05 L05 L06 L06 M01
M01 M01 M01 M02 M03 M03 M04 M06
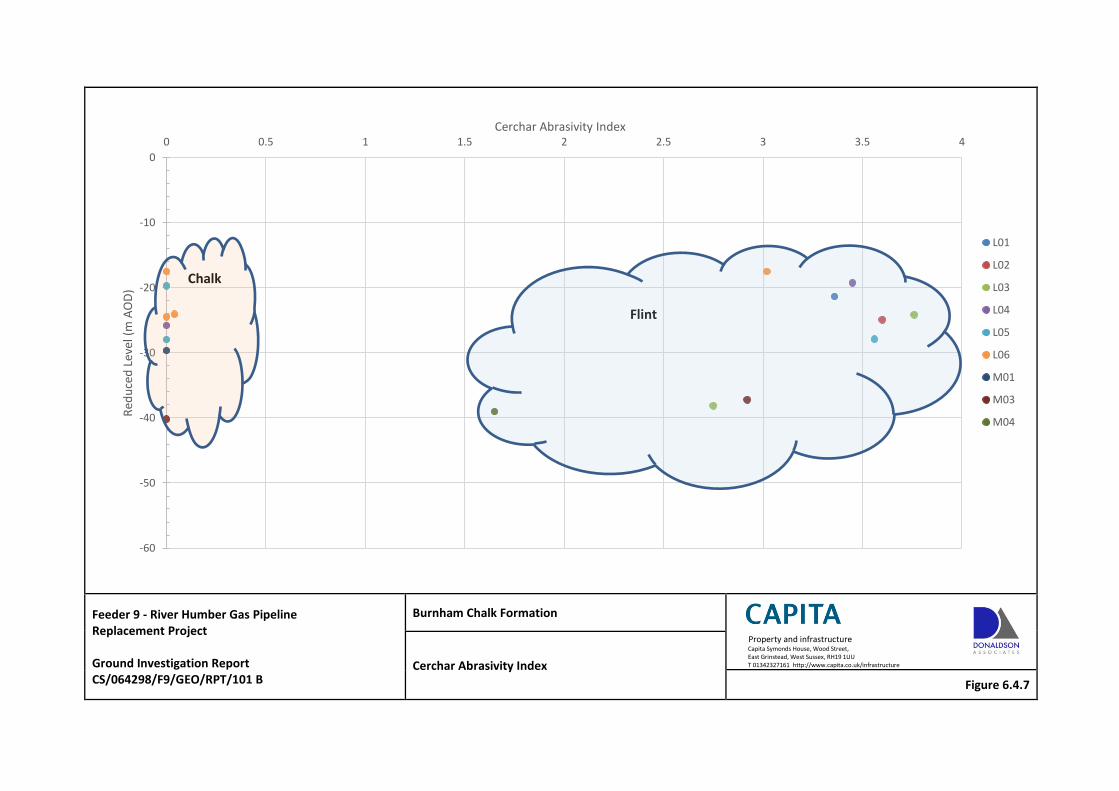
Feeder 9 - River Humber Gas Pipeline Replacement Project Ground Investigation Report CS/064298/F9/GEO/RPT/101 B
Burnham Chalk Formation
Property and infrastructure Capita Symonds House, Wood Street, East Grinstead, West Sussex, RH19 1UU T 01342327161 http://www.capita.co.uk/infrastructure Cerchar Abrasivity Index
Figure 6.4.7
-60
-50
-40
-30
-20
-10
0
0 0.5 1 1.5 2 2.5 3 3.5 4 R
edu
ced
Lev
el (
m A
OD
) Cerchar Abrasivity Index
L01
L02
L03
L04
L05
L06
M01
M03
M04
Flint
Chalk
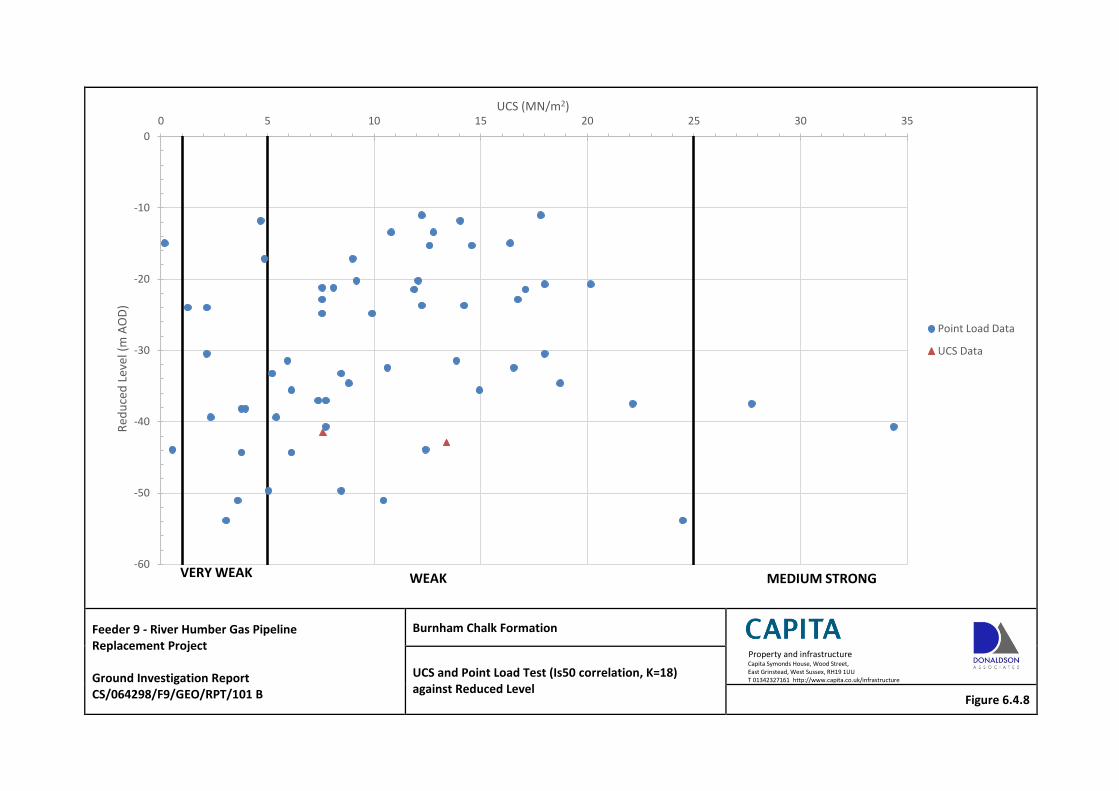
Feeder 9 - River Humber Gas Pipeline Replacement Project Ground Investigation Report CS/064298/F9/GEO/RPT/101 B
Burnham Chalk Formation
Property and infrastructure Capita Symonds House, Wood Street, East Grinstead, West Sussex, RH19 1UU T 01342327161 http://www.capita.co.uk/infrastructure UCS and Point Load Test (Is50 correlation, K=18)
against Reduced Level Figure 6.4.8
-60
-50
-40
-30
-20
-10
0
0 5 10 15 20 25 30 35 R
edu
ced
Lev
el (
m A
OD
) UCS (MN/m2)
Point Load Data
UCS Data
VERY WEAK WEAK MEDIUM STRONG
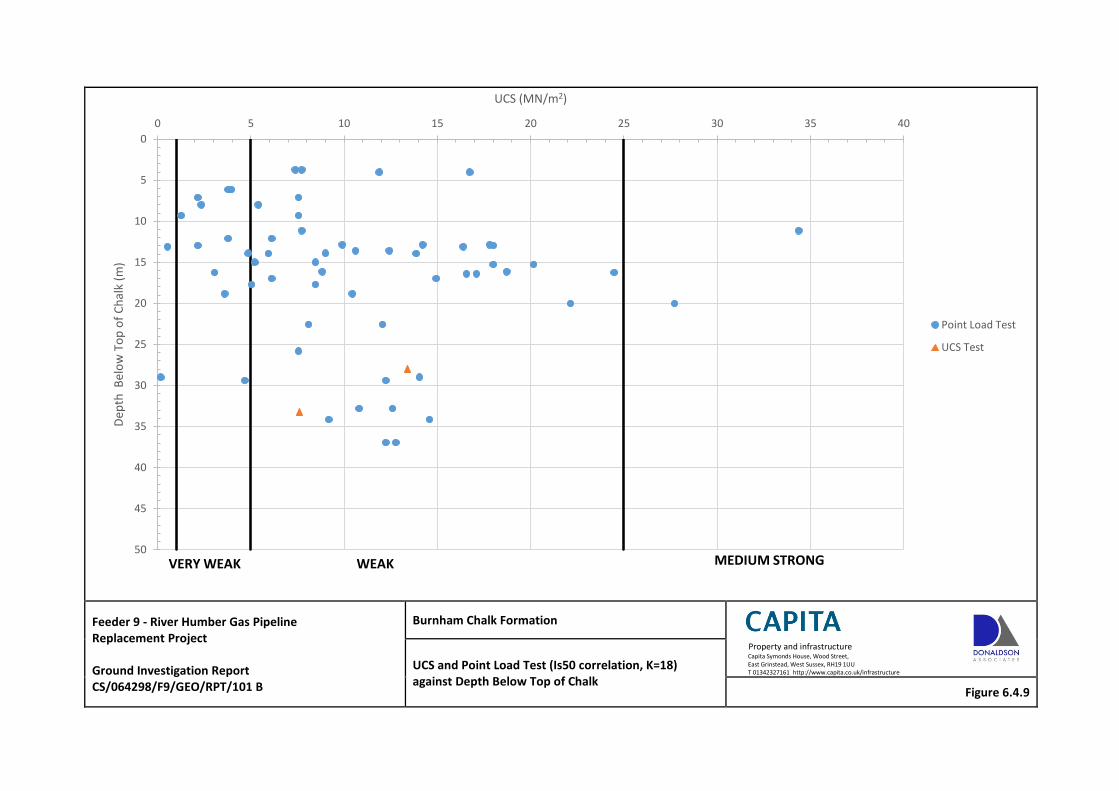
Feeder 9 - River Humber Gas Pipeline Replacement Project Ground Investigation Report CS/064298/F9/GEO/RPT/101 B
Burnham Chalk Formation
Property and infrastructure Capita Symonds House, Wood Street, East Grinstead, West Sussex, RH19 1UU T 01342327161 http://www.capita.co.uk/infrastructure UCS and Point Load Test (Is50 correlation, K=18)
against Depth Below Top of Chalk Figure 6.4.9
0
5
10
15
20
25
30
35
40
45
50
0 5 10 15 20 25 30 35 40 D
epth
Bel
ow
To
p o
f C
hal
k (m
)
UCS (MN/m2)
Point Load Test
UCS Test
VERY WEAK WEAK MEDIUM STRONG
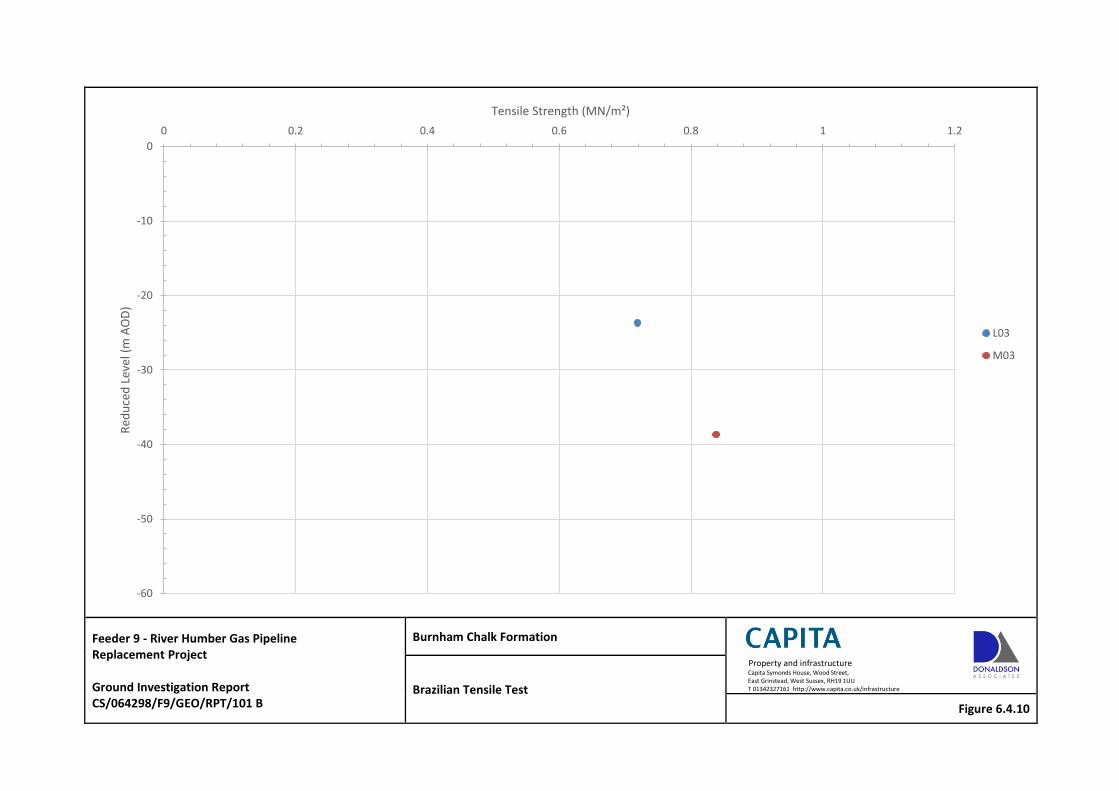
Feeder 9 - River Humber Gas Pipeline Replacement Project Ground Investigation Report CS/064298/F9/GEO/RPT/101 B
Burnham Chalk Formation
Property and infrastructure Capita Symonds House, Wood Street, East Grinstead, West Sussex, RH19 1UU T 01342327161 http://www.capita.co.uk/infrastructure Brazilian Tensile Test
Figure 6.4.10
-60
-50
-40
-30
-20
-10
0
0 0.2 0.4 0.6 0.8 1 1.2 R
edu
ced
Lev
el (
m A
OD
) Tensile Strength (MN/m²)
L03
M03
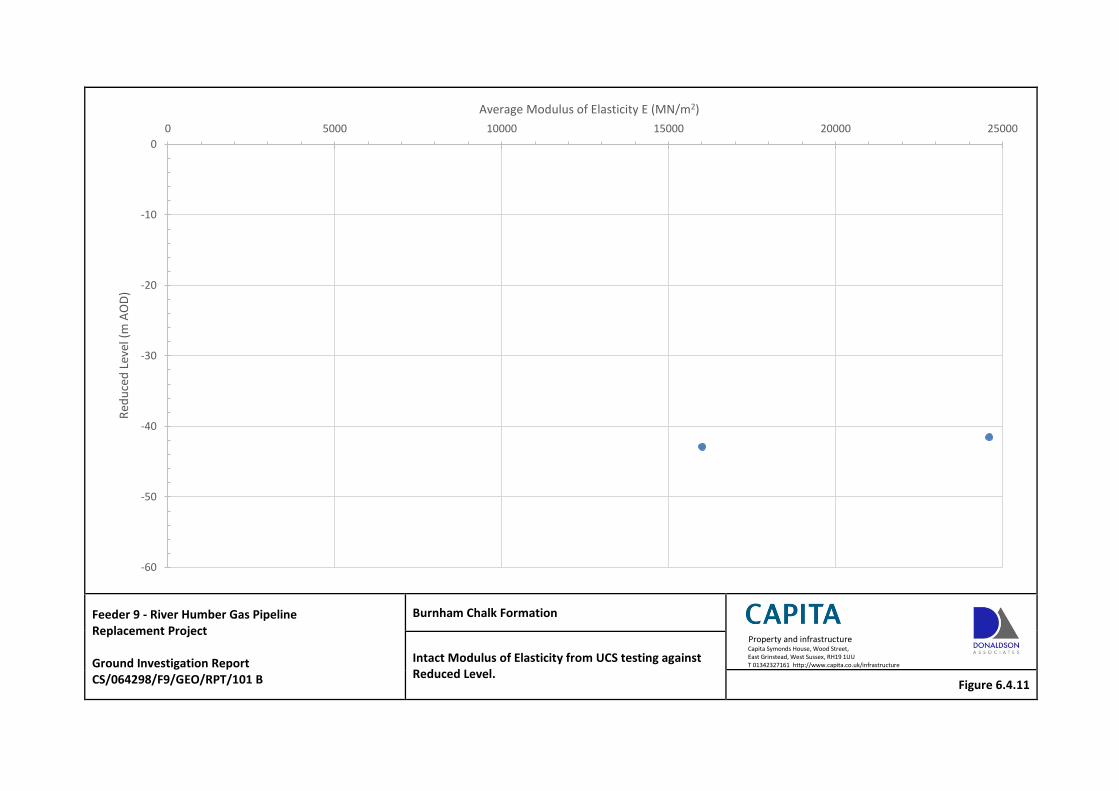
Feeder 9 - River Humber Gas Pipeline Replacement Project Ground Investigation Report CS/064298/F9/GEO/RPT/101 B
Burnham Chalk Formation
Property and infrastructure Capita Symonds House, Wood Street, East Grinstead, West Sussex, RH19 1UU T 01342327161 http://www.capita.co.uk/infrastructure Intact Modulus of Elasticity from UCS testing against
Reduced Level. Figure 6.4.11
-60
-50
-40
-30
-20
-10
0
0 5000 10000 15000 20000 25000 R
edu
ced
Lev
el (
m A
OD
) Average Modulus of Elasticity E (MN/m2)
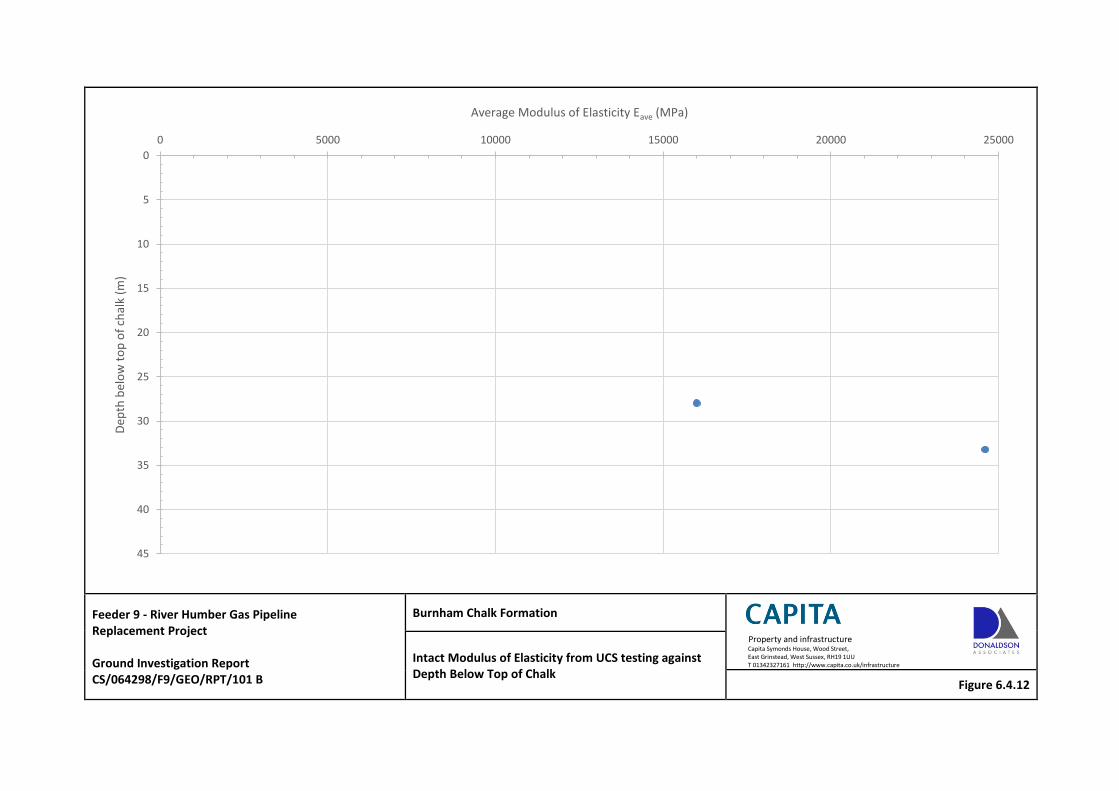
Feeder 9 - River Humber Gas Pipeline Replacement Project Ground Investigation Report CS/064298/F9/GEO/RPT/101 B
Burnham Chalk Formation
Property and infrastructure Capita Symonds House, Wood Street, East Grinstead, West Sussex, RH19 1UU T 01342327161 http://www.capita.co.uk/infrastructure Intact Modulus of Elasticity from UCS testing against
Depth Below Top of Chalk Figure 6.4.12
0
5
10
15
20
25
30
35
40
45
0 5000 10000 15000 20000 25000
Dep
th b
elo
w t
op
of
chal
k (m
) Average Modulus of Elasticity Eave (MPa)
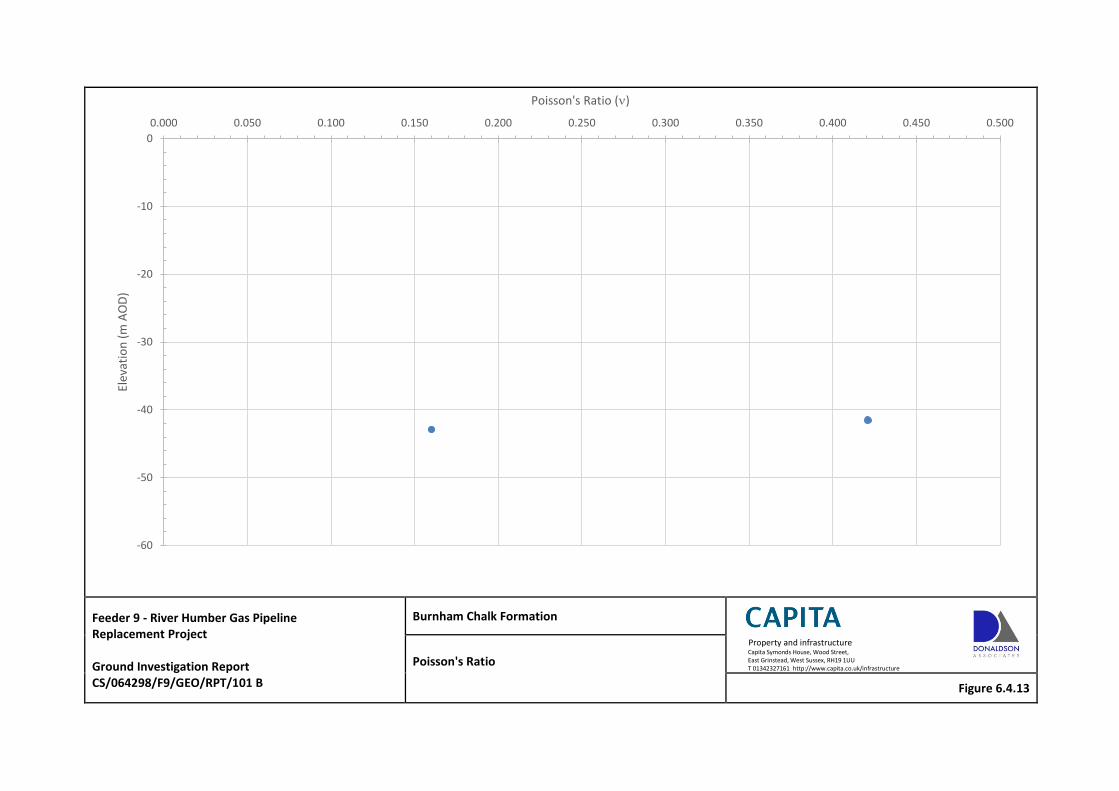
Feeder 9 - River Humber Gas Pipeline Replacement Project Ground Investigation Report CS/064298/F9/GEO/RPT/101 B
Burnham Chalk Formation
Property and infrastructure Capita Symonds House, Wood Street, East Grinstead, West Sussex, RH19 1UU T 01342327161 http://www.capita.co.uk/infrastructure Poisson's Ratio
Figure 6.4.13
-60
-50
-40
-30
-20
-10
0
0.000 0.050 0.100 0.150 0.200 0.250 0.300 0.350 0.400 0.450 0.500 El
evat
ion
(m
AO
D)
Poisson's Ratio ()
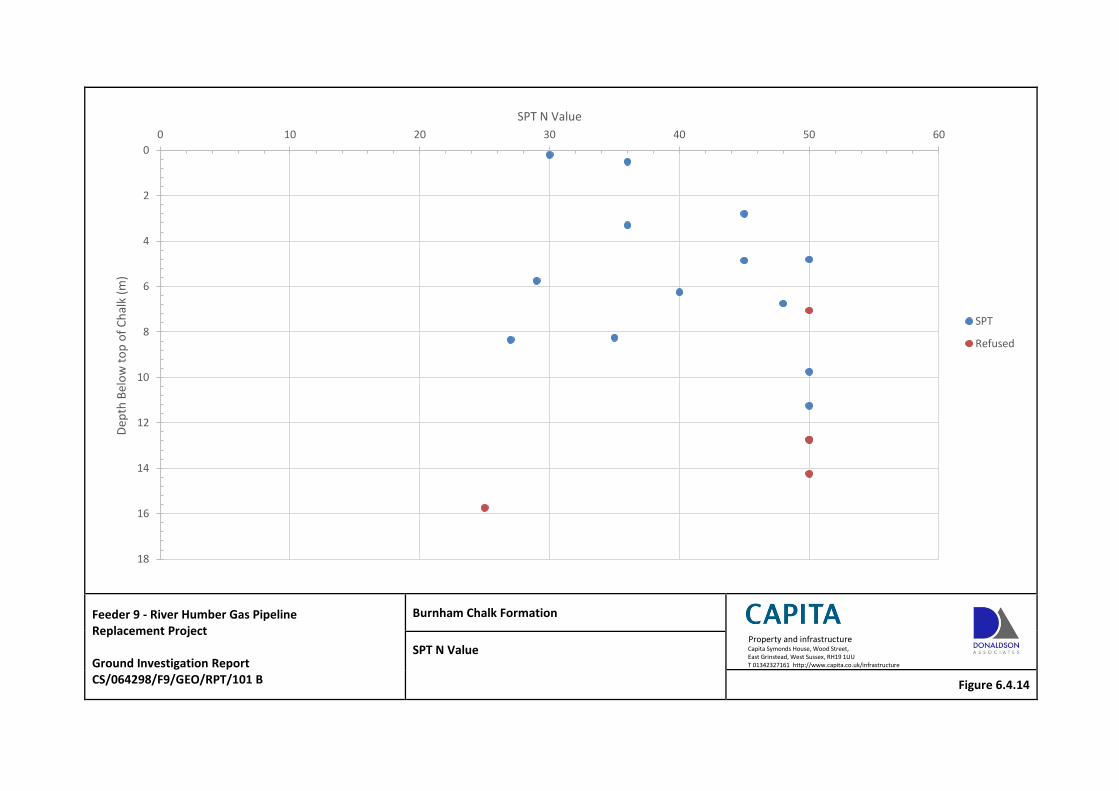
Feeder 9 - River Humber Gas Pipeline Replacement Project Ground Investigation Report CS/064298/F9/GEO/RPT/101 B
Burnham Chalk Formation
Property and infrastructure Capita Symonds House, Wood Street, East Grinstead, West Sussex, RH19 1UU T 01342327161 http://www.capita.co.uk/infrastructure
SPT N Value
Figure 6.4.14
0
2
4
6
8
10
12
14
16
18
0 10 20 30 40 50 60 D
epth
Bel
ow
to
p o
f C
hal
k (m
) SPT N Value
SPT
Refused
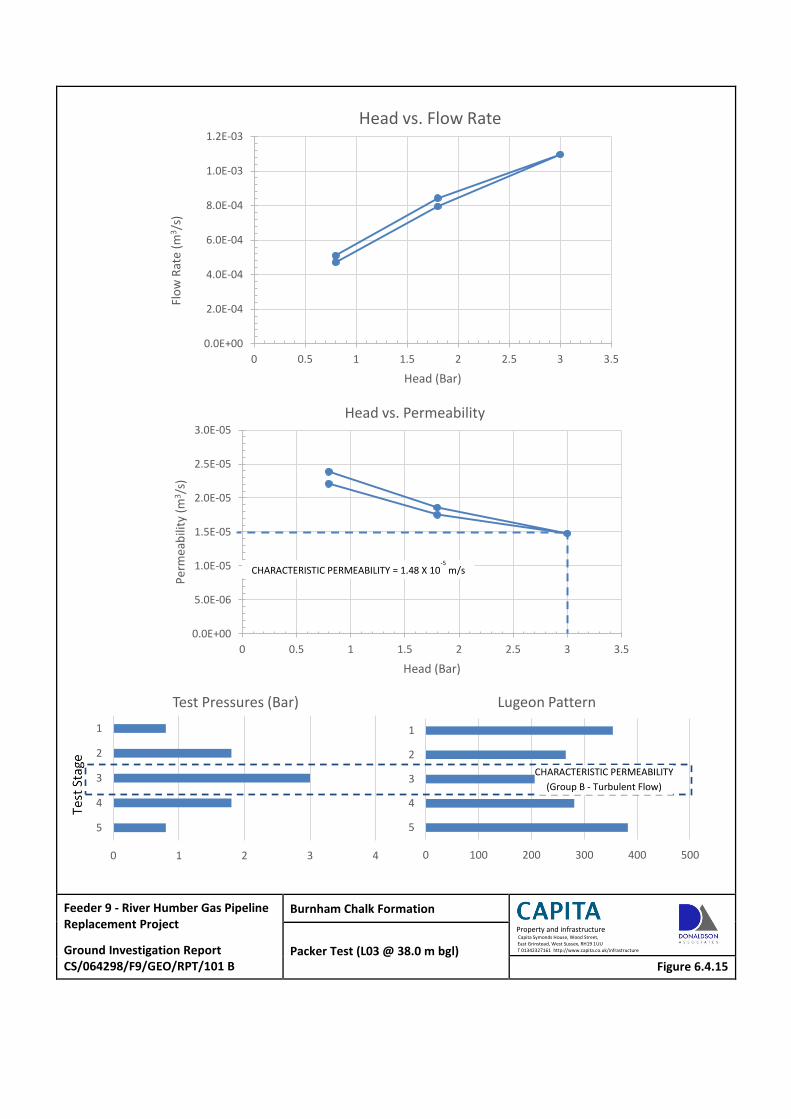
Feeder 9 - River Humber Gas Pipeline Replacement Project
Ground Investigation Report CS/064298/F9/GEO/RPT/101 B
Burnham Chalk Formation
Property and infrastructure Capita Symonds House, Wood Street, East Grinstead, West Sussex, RH19 1UU T 01342327161 http://www.capita.co.uk/infrastructure Packer Test (L03 @ 38.0 m bgl)
Figure 6.4.15
0.0E+00
2.0E-04
4.0E-04
6.0E-04
8.0E-04
1.0E-03
1.2E-03
0 0.5 1 1.5 2 2.5 3 3.5
Flo
w R
ate
(m3 /
s)
Head (Bar)
Head vs. Flow Rate
0.0E+00
5.0E-06
1.0E-05
1.5E-05
2.0E-05
2.5E-05
3.0E-05
0 0.5 1 1.5 2 2.5 3 3.5
Per
mea
bili
ty (
m3 /
s)
Head (Bar)
Head vs. Permeability
0 1 2 3 4
1
2
3
4
5
Test Pressures (Bar)
0 100 200 300 400 500
1
2
3
4
5
Lugeon Pattern
CHARACTERISTIC PERMEABILITY = 1.48 X 10⁻⁵
m/s
CHARACTERISTIC PERMEABILITY (Group B - Turbulent Flow)
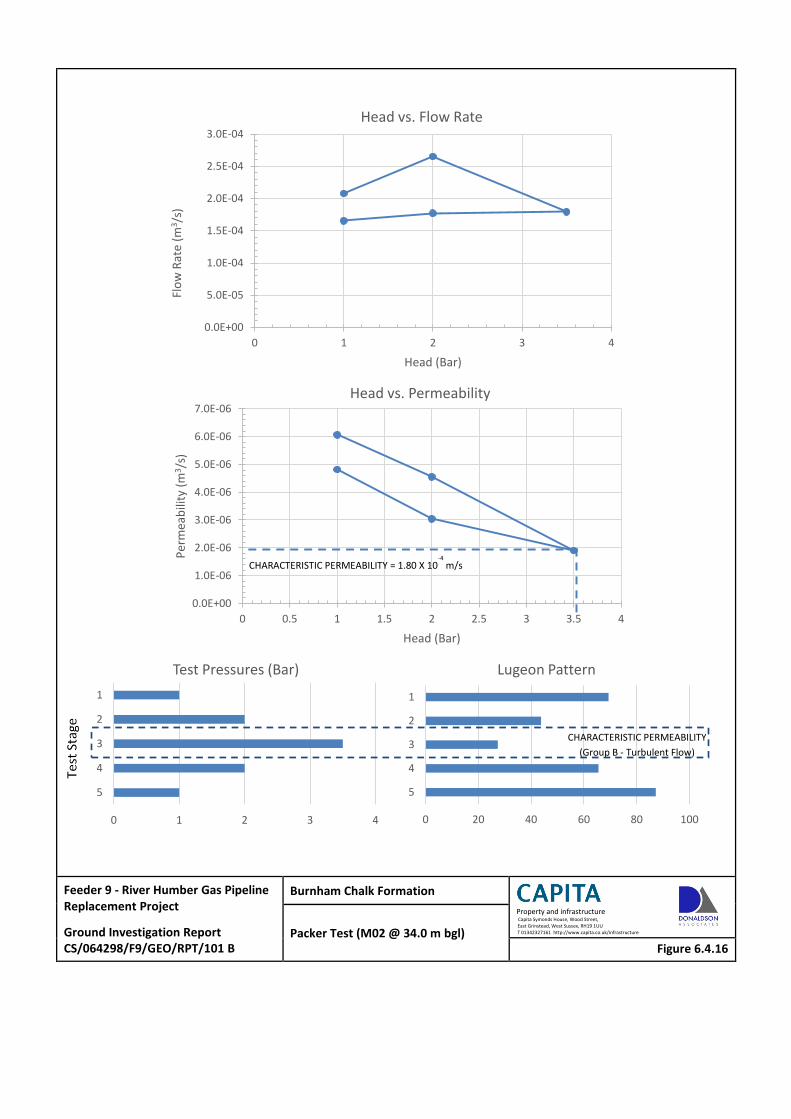
Feeder 9 - River Humber Gas Pipeline Replacement Project
Ground Investigation Report CS/064298/F9/GEO/RPT/101 B
Burnham Chalk Formation
Property and infrastructure Capita Symonds House, Wood Street, East Grinstead, West Sussex, RH19 1UU T 01342327161 http://www.capita.co.uk/infrastructure Packer Test (M02 @ 34.0 m bgl)
Figure 6.4.16
0.0E+00
5.0E-05
1.0E-04
1.5E-04
2.0E-04
2.5E-04
3.0E-04
0 1 2 3 4
Flo
w R
ate
(m3/s
)
Head (Bar)
Head vs. Flow Rate
0.0E+00
1.0E-06
2.0E-06
3.0E-06
4.0E-06
5.0E-06
6.0E-06
7.0E-06
0 0.5 1 1.5 2 2.5 3 3.5 4
Per
mea
bili
ty (
m3/s
)
Head (Bar)
Head vs. Permeability
0 1 2 3 4
1
2
3
4
5
Test Pressures (Bar)
0 20 40 60 80 100
1
2
3
4
5
Lugeon Pattern
CHARACTERISTIC PERMEABILITY (Group B - Turbulent Flow)
CHARACTERISTIC PERMEABILITY = 1.80 X 10⁻⁴
m/s
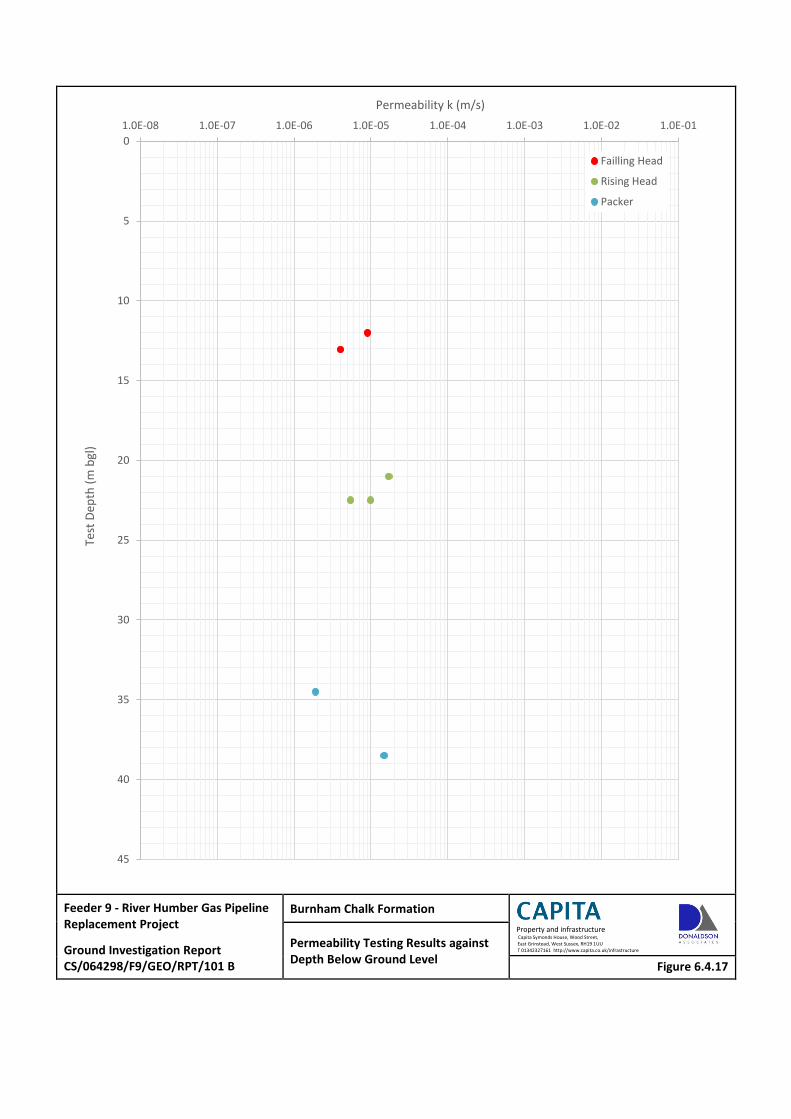
Feeder 9 - River Humber Gas Pipeline Replacement Project
Ground Investigation Report CS/064298/F9/GEO/RPT/101 B
Burnham Chalk Formation
Property and infrastructure Capita Symonds House, Wood Street, East Grinstead, West Sussex, RH19 1UU T 01342327161 http://www.capita.co.uk/infrastructure Permeability Testing Results against
Depth Below Ground Level Figure 6.4.17
0
5
10
15
20
25
30
35
40
45
1.0E-08 1.0E-07 1.0E-06 1.0E-05 1.0E-04 1.0E-03 1.0E-02 1.0E-01
Test
Dep
th (
m b
gl)
Permeability k (m/s)
Failling Head
Rising Head
Packer
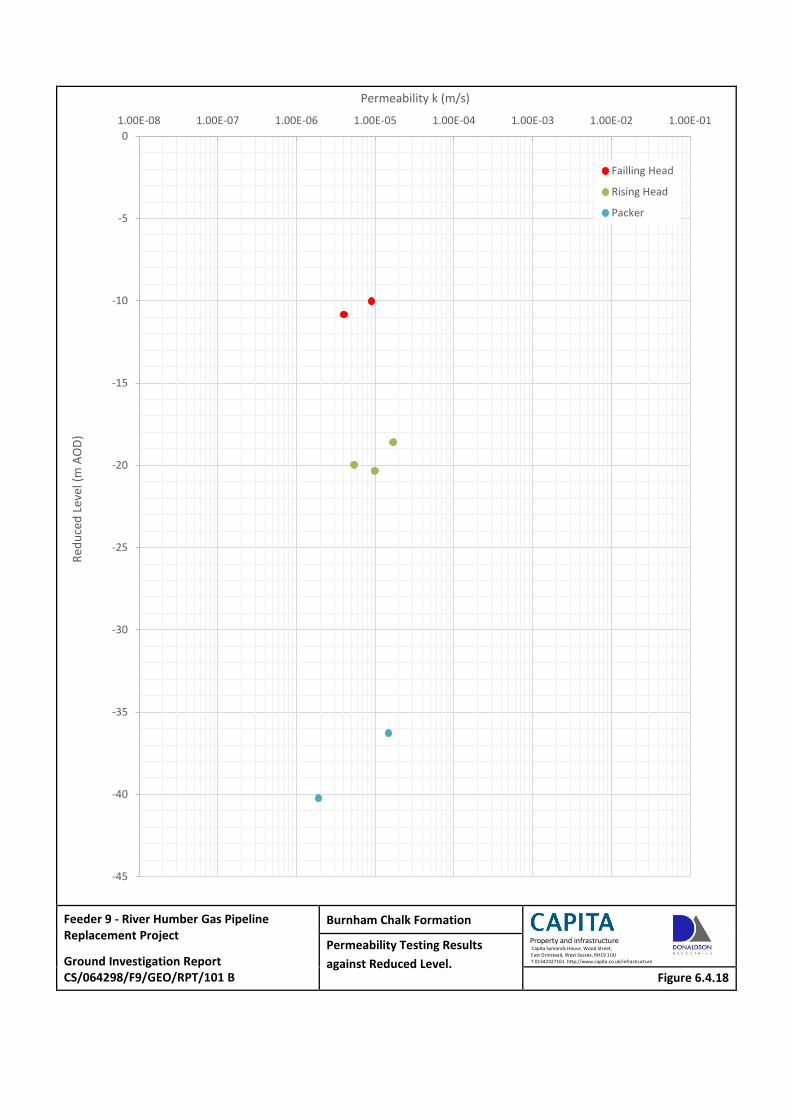
Feeder 9 - River Humber Gas Pipeline Replacement Project
Ground Investigation Report CS/064298/F9/GEO/RPT/101 B
Burnham Chalk Formation
Property and infrastructure Capita Symonds House, Wood Street, East Grinstead, West Sussex, RH19 1UU T 01342327161 http://www.capita.co.uk/infrastructure
Permeability Testing Results
against Reduced Level. Figure 6.4.18
-45
-40
-35
-30
-25
-20
-15
-10
-5
0
1.00E-08 1.00E-07 1.00E-06 1.00E-05 1.00E-04 1.00E-03 1.00E-02 1.00E-01
Red
uce
d L
evel
(m
AO
D)
Permeability k (m/s)
Failling Head
Rising Head
Packer
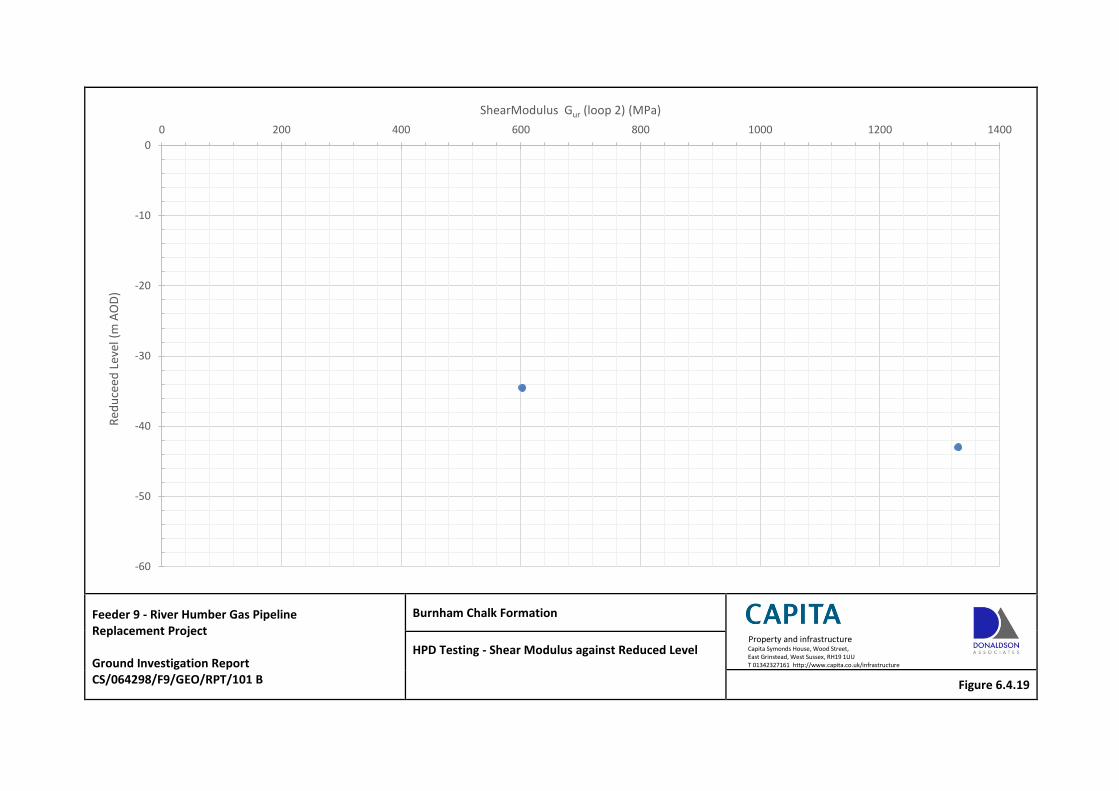
Feeder 9 - River Humber Gas Pipeline Replacement Project Ground Investigation Report CS/064298/F9/GEO/RPT/101 B
Burnham Chalk Formation
Property and infrastructure Capita Symonds House, Wood Street, East Grinstead, West Sussex, RH19 1UU T 01342327161 http://www.capita.co.uk/infrastructure
HPD Testing - Shear Modulus against Reduced Level
Figure 6.4.19
-60
-50
-40
-30
-20
-10
0
0 200 400 600 800 1000 1200 1400
Red
uce
ed L
evel
(m
AO
D)
ShearModulus Gur (loop 2) (MPa)
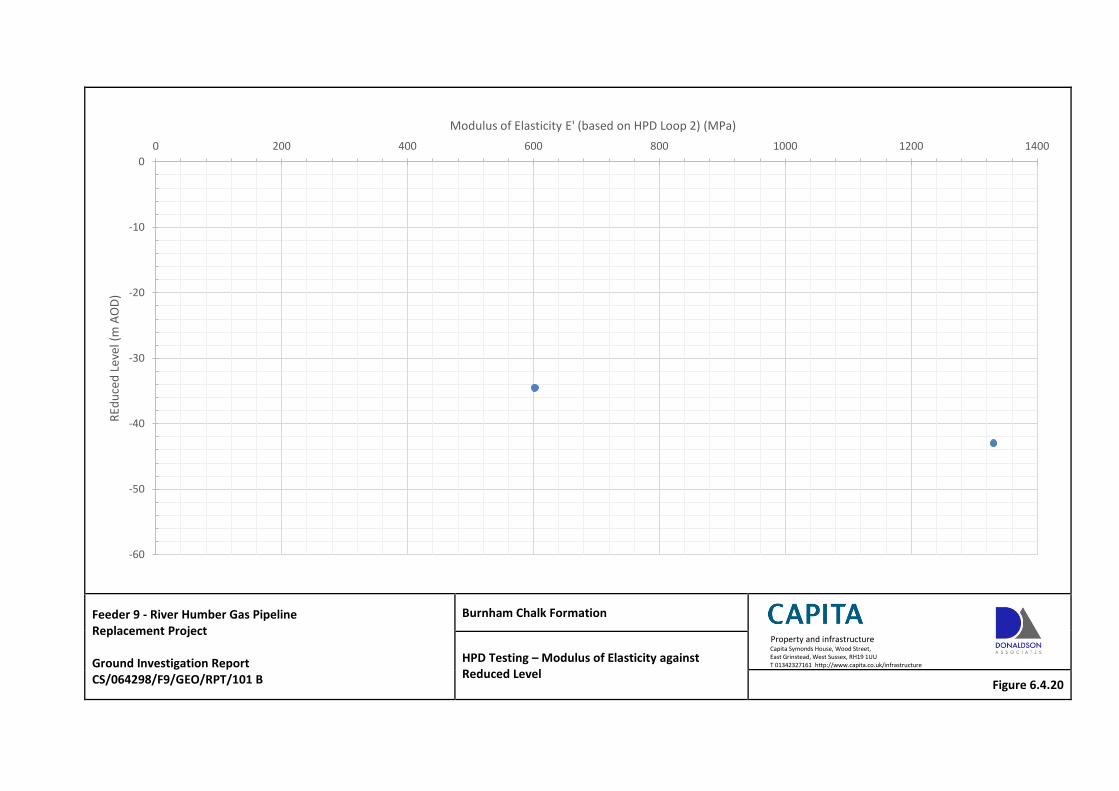
Feeder 9 - River Humber Gas Pipeline Replacement Project Ground Investigation Report CS/064298/F9/GEO/RPT/101 B
Burnham Chalk Formation
Property and infrastructure Capita Symonds House, Wood Street, East Grinstead, West Sussex, RH19 1UU T 01342327161 http://www.capita.co.uk/infrastructure HPD Testing – Modulus of Elasticity against
Reduced Level Figure 6.4.20
-60
-50
-40
-30
-20
-10
0
0 200 400 600 800 1000 1200 1400
REd
uce
d L
evel
(m
AO
D)
Modulus of Elasticity E' (based on HPD Loop 2) (MPa)
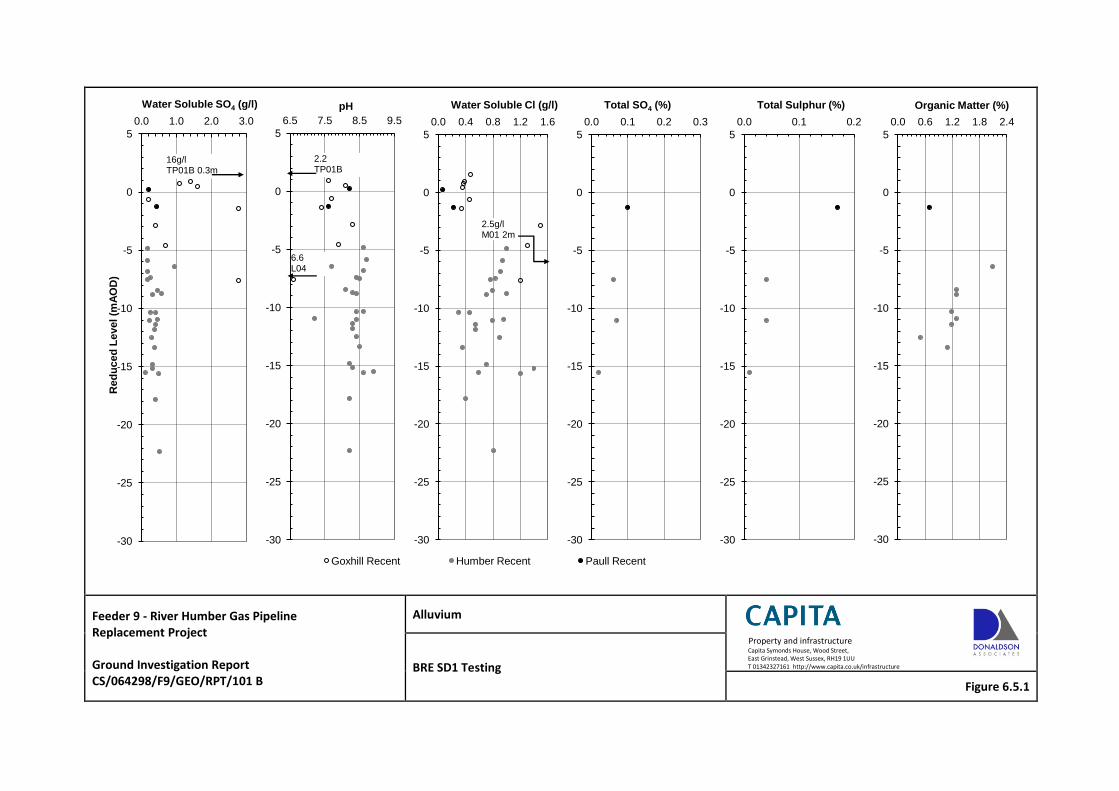
Feeder 9 - River Humber Gas Pipeline Replacement Project Ground Investigation Report CS/064298/F9/GEO/RPT/101 B
Alluvium
Property and infrastructure Capita Symonds House, Wood Street, East Grinstead, West Sussex, RH19 1UU T 01342327161 http://www.capita.co.uk/infrastructure BRE SD1 Testing
Figure 6.5.1
-30
-25
-20
-15
-10
-5
0
5
0.0 1.0 2.0 3.0 R
ed
uc
ed
Le
vel (m
AO
D)
Water Soluble SO4 (g/l)
16g/l TP01B 0.3m
-30
-25
-20
-15
-10
-5
0
5
6.5 7.5 8.5 9.5
pH
Goxhill Recent
2.2 TP01B
6.6 L04
-30
-25
-20
-15
-10
-5
0
5
0.0 0.4 0.8 1.2 1.6
Water Soluble Cl (g/l)
Humber Recent
2.5g/l M01 2m
-30
-25
-20
-15
-10
-5
0
5
0.0 0.1 0.2 0.3
Total SO4 (%)
Paull Recent
-30
-25
-20
-15
-10
-5
0
5
0.0 0.1 0.2
Total Sulphur (%)
-30
-25
-20
-15
-10
-5
0
5
0.0 0.6 1.2 1.8 2.4
Organic Matter (%)
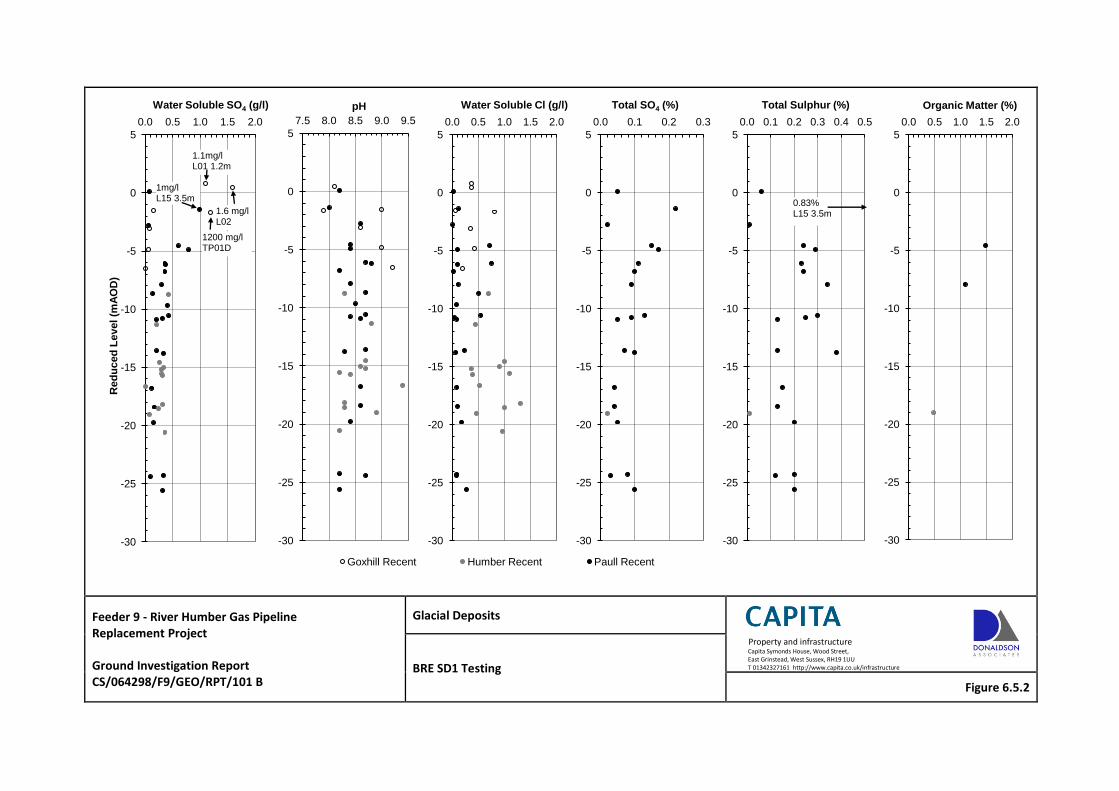
Feeder 9 - River Humber Gas Pipeline Replacement Project Ground Investigation Report CS/064298/F9/GEO/RPT/101 B
Glacial Deposits
Property and infrastructure Capita Symonds House, Wood Street, East Grinstead, West Sussex, RH19 1UU T 01342327161 http://www.capita.co.uk/infrastructure BRE SD1 Testing
Figure 6.5.2
-30
-25
-20
-15
-10
-5
0
5
0.0 0.5 1.0 1.5 2.0 R
ed
uc
ed
Le
vel (m
AO
D)
Water Soluble SO4 (g/l)
1.1mg/l L01 1.2m
1.6 mg/l L02
1mg/l L15 3.5m
1200 mg/l TP01D
-30
-25
-20
-15
-10
-5
0
5
7.5 8.0 8.5 9.0 9.5
pH
Goxhill Recent
-30
-25
-20
-15
-10
-5
0
5
0.0 0.5 1.0 1.5 2.0
Water Soluble Cl (g/l)
Humber Recent
-30
-25
-20
-15
-10
-5
0
5
0.0 0.1 0.2 0.3
Total SO4 (%)
Paull Recent
-30
-25
-20
-15
-10
-5
0
5
0.0 0.1 0.2 0.3 0.4 0.5
Total Sulphur (%)
0.83% L15 3.5m
-30
-25
-20
-15
-10
-5
0
5
0.0 0.5 1.0 1.5 2.0
Organic Matter (%)
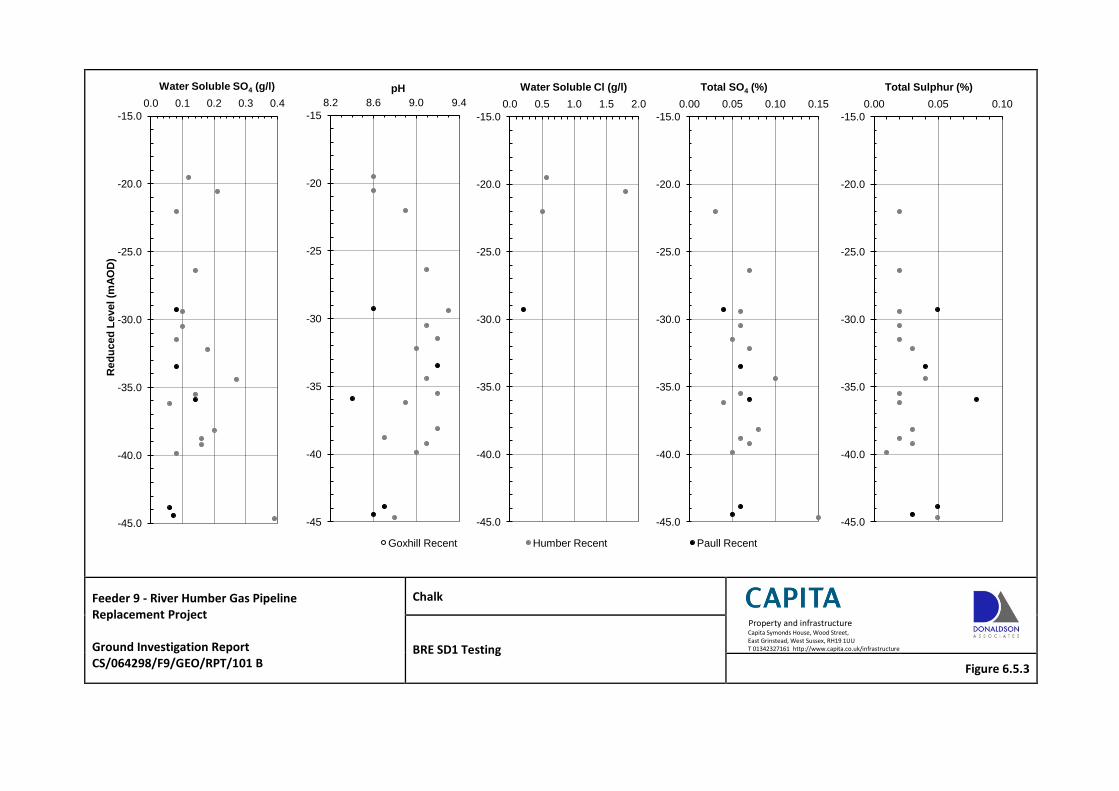
Feeder 9 - River Humber Gas Pipeline Replacement Project Ground Investigation Report CS/064298/F9/GEO/RPT/101 B
Chalk
Property and infrastructure Capita Symonds House, Wood Street, East Grinstead, West Sussex, RH19 1UU T 01342327161 http://www.capita.co.uk/infrastructure BRE SD1 Testing
Figure 6.5.3
-45.0
-40.0
-35.0
-30.0
-25.0
-20.0
-15.0
0.0 0.1 0.2 0.3 0.4 R
ed
uc
ed
Le
vel (m
AO
D)
Water Soluble SO4 (g/l)
-45
-40
-35
-30
-25
-20
-15
8.2 8.6 9.0 9.4
pH
Goxhill Recent
-45.0
-40.0
-35.0
-30.0
-25.0
-20.0
-15.0
0.0 0.5 1.0 1.5 2.0
Water Soluble Cl (g/l)
Humber Recent
-45.0
-40.0
-35.0
-30.0
-25.0
-20.0
-15.0
0.00 0.05 0.10 0.15
Total SO4 (%)
Paull Recent
-45.0
-40.0
-35.0
-30.0
-25.0
-20.0
-15.0
0.00 0.05 0.10
Total Sulphur (%)
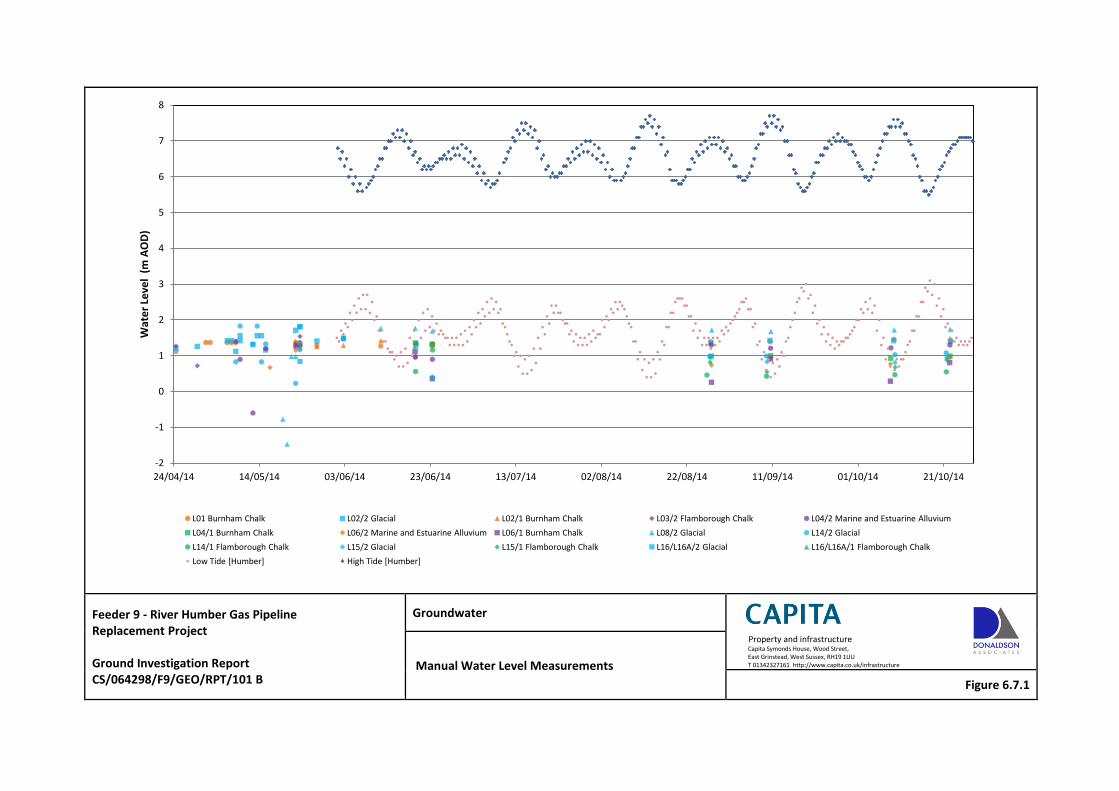
Feeder 9 - River Humber Gas Pipeline Replacement Project Ground Investigation Report CS/064298/F9/GEO/RPT/101 B
Groundwater
Property and infrastructure Capita Symonds House, Wood Street, East Grinstead, West Sussex, RH19 1UU T 01342327161 http://www.capita.co.uk/infrastructure Manual Water Level Measurements
Figure 6.7.1
-2
-1
0
1
2
3
4
5
6
7
8
24/04/14 14/05/14 03/06/14 23/06/14 13/07/14 02/08/14 22/08/14 11/09/14 01/10/14 21/10/14
Wat
er
Leve
l (m
AO
D)
L01 Burnham Chalk L02/2 Glacial L02/1 Burnham Chalk L03/2 Flamborough Chalk L04/2 Marine and Estuarine Alluvium
L04/1 Burnham Chalk L06/2 Marine and Estuarine Alluvium L06/1 Burnham Chalk L08/2 Glacial L14/2 Glacial
L14/1 Flamborough Chalk L15/2 Glacial L15/1 Flamborough Chalk L16/L16A/2 Glacial L16/L16A/1 Flamborough Chalk
Low Tide [Humber] High Tide [Humber]
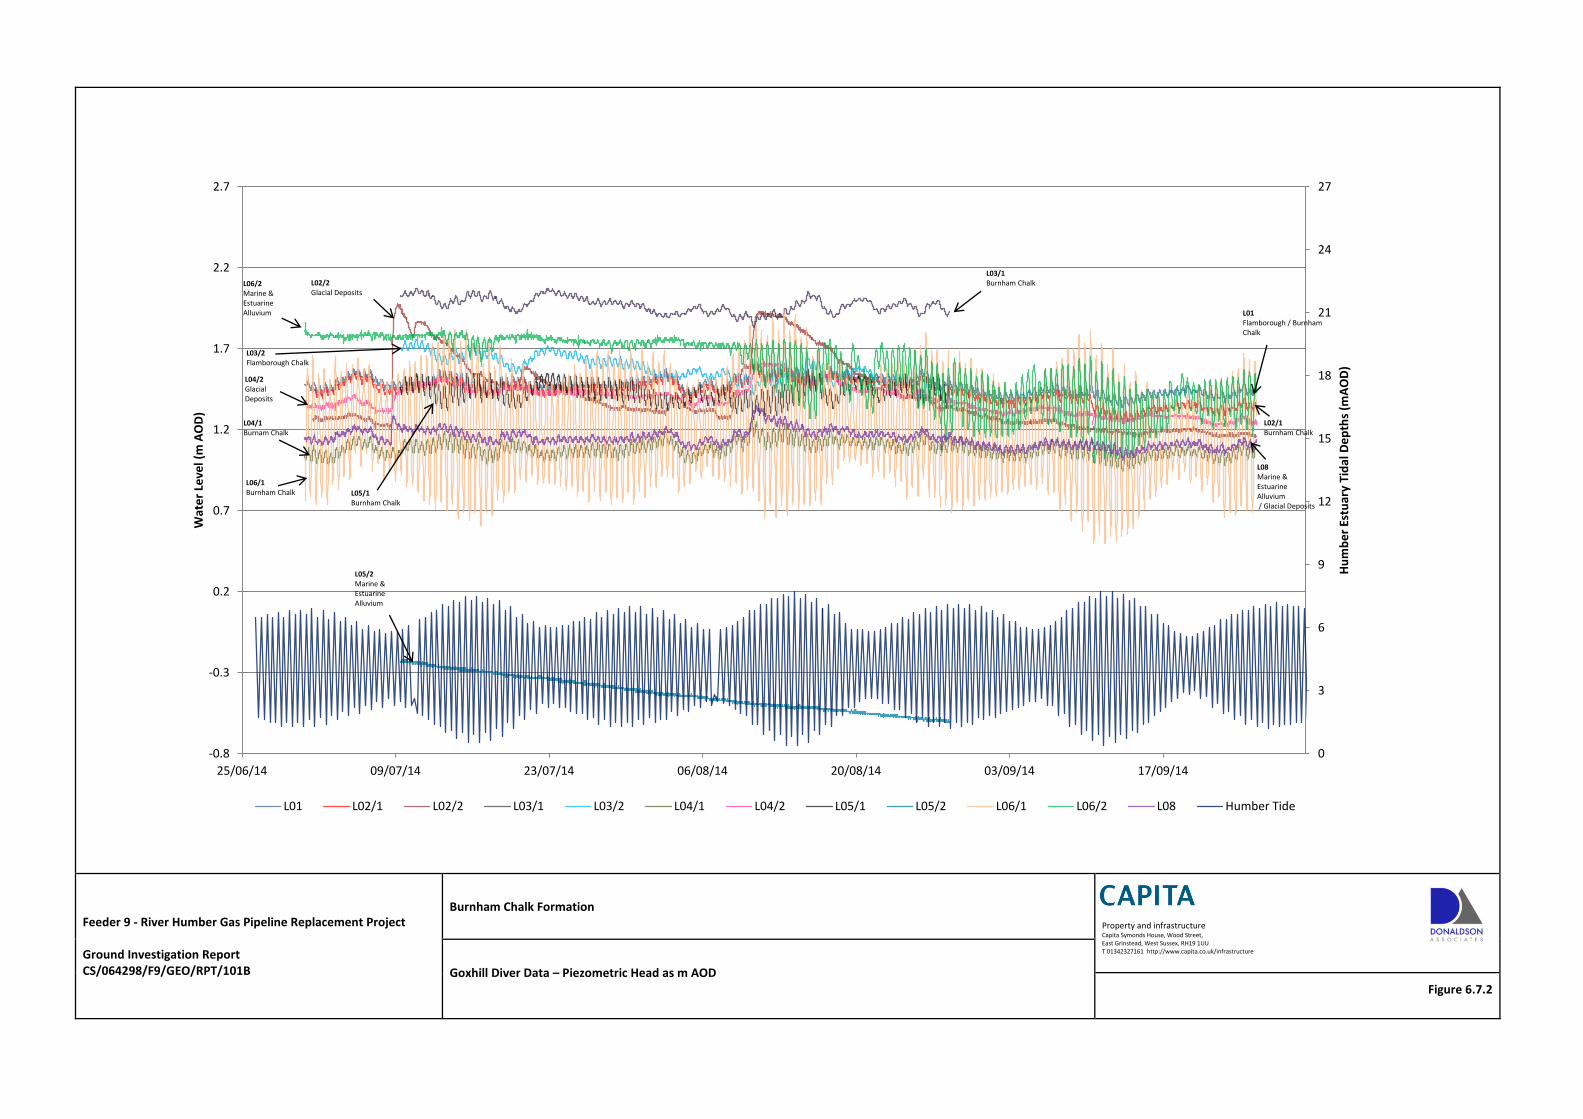
Feeder 9 - River Humber Gas Pipeline Replacement Project Ground Investigation Report CS/064298/F9/GEO/RPT/101B
Burnham Chalk Formation
Property and infrastructure Capita Symonds House, Wood Street, East Grinstead, West Sussex, RH19 1UU T 01342327161 http://www.capita.co.uk/infrastructure
Goxhill Diver Data – Piezometric Head as m AOD
Figure 6.7.2
0
3
6
9
12
15
18
21
24
27
-0.8
-0.3
0.2
0.7
1.2
1.7
2.2
2.7
25/06/14 09/07/14 23/07/14 06/08/14 20/08/14 03/09/14 17/09/14
Hu
mb
er
Estu
ary
Tid
al D
ep
ths
(mA
OD
)
Wat
er
Leve
l (m
AO
D)
L01 L02/1 L02/2 L03/1 L03/2 L04/1 L04/2 L05/1 L05/2 L06/1 L06/2 L08 Humber Tide
L03/1 Burnham Chalk
L02/1 Burnham Chalk
L04/2 Glacial Deposits
L08 Marine & Estuarine Alluvium / Glacial Deposits
L01 Flamborough / Burnham Chalk
L06/1 Burnham Chalk
L02/2 Glacial Deposits
L03/2 Flamborough Chalk
L06/2 Marine & Estuarine Alluvium
L04/1 Burnam Chalk
L05/1 Burnham Chalk
L05/2 Marine & Estuarine Alluvium
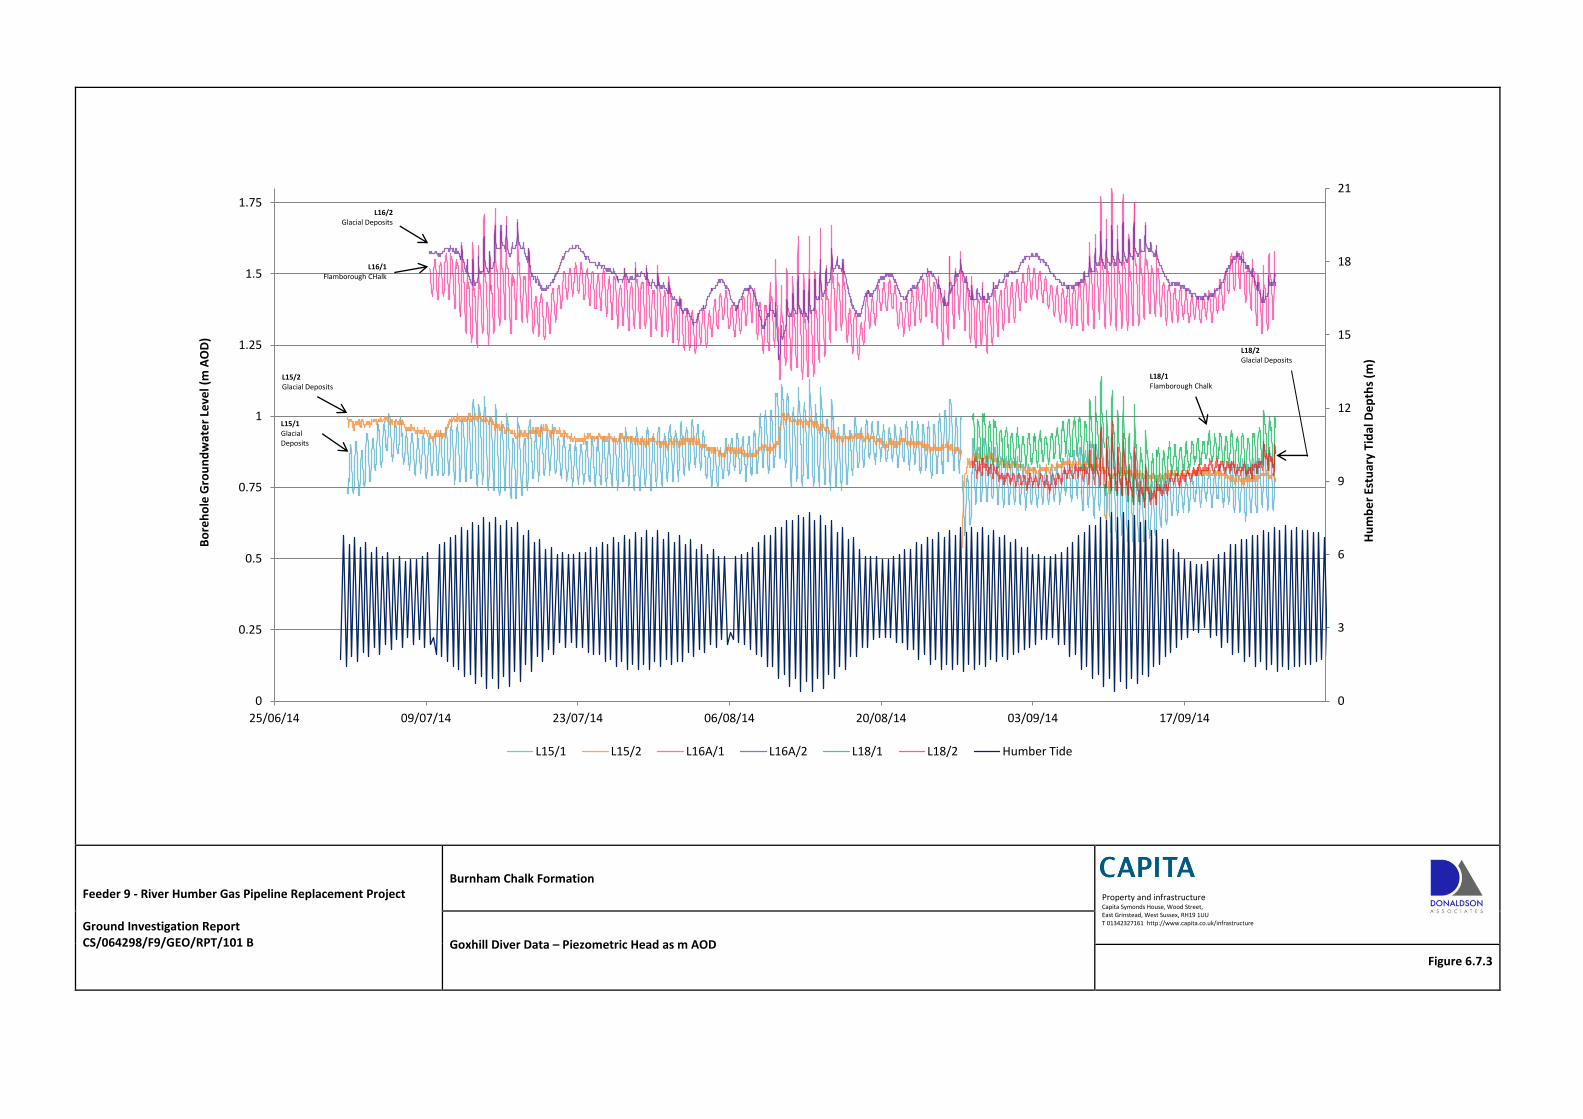
Feeder 9 - River Humber Gas Pipeline Replacement Project Ground Investigation Report CS/064298/F9/GEO/RPT/101 B
Burnham Chalk Formation
Property and infrastructure Capita Symonds House, Wood Street, East Grinstead, West Sussex, RH19 1UU T 01342327161 http://www.capita.co.uk/infrastructure
Goxhill Diver Data – Piezometric Head as m AOD
Figure 6.7.3
0
3
6
9
12
15
18
21
0
0.25
0.5
0.75
1
1.25
1.5
1.75
25/06/14 09/07/14 23/07/14 06/08/14 20/08/14 03/09/14 17/09/14
Bo
reh
ole
Gro
un
dw
ate
r Le
vel (
m A
OD
)
L15/1 L15/2 L16A/1 L16A/2 L18/1 L18/2 Humber Tide
Hu
mb
er
Estu
ary
Tid
al D
ep
ths
(m)
L16/2 Glacial Deposits
L16/1 Flamborough CHalk
L15/1 Glacial Deposits
L15/2 Glacial Deposits
L18/1 Flamborough Chalk
L18/2 Glacial Deposits

APPENDIX A – Geophysical Testing
A-1
APPENDIX A: GEOPHYSICS TESTING
A1.1 Caliper
The caliper tool was run through both the cased and uncased sections of borehole in all boreholes in
which geophysics surveys were completed. Where the tool was run through the cased section the
information is of limited use as only the internal diameter of the casing is confirmed. Where the tool
is run through the uncased section it confirms the general bore diameter and localised increases in
diameter due to washout, breakout or fissures.
The caliper logs have been compared against the optical and acoustical images of the borehole face
to determine the likely reasoning for bore diameter variation. Comparison of the log with the
borehole log and core photographs is not practical in some cases due to the poor core recovery and
uncertainty on the exact location of core loss resulting in slight variations in recorded depths. These
reasons are discussed further in Section A1.6 below on the optical and acoustical imaging.
It is clear from review of the caliper logs that the bore diameter is generally around 150 mm as
would be expected when Geobor S (barrel / core bit of 147 mm) was utilised for drilling. There was
some general variation in the bore size of typically +5 to 10 mm / -5 mm. This magnitude of variation
is likely due to general oversizing of the hole due to drill string “wobble” during coring and rock
relaxation due to stress release after removal of the casing. Where a variation in the bore diameter
was recorded by the caliper log, which was considered over and above this background variation,
the location has been recorded on the image summary in Figures APPENDIX A/01 to 03. Additionally
the information from the optical and acoustical images, borehole log and core photography at this
depth has been summarised below in Table A1 which should be read in conjunction with Figures
APPENDIX A/01 to 03.
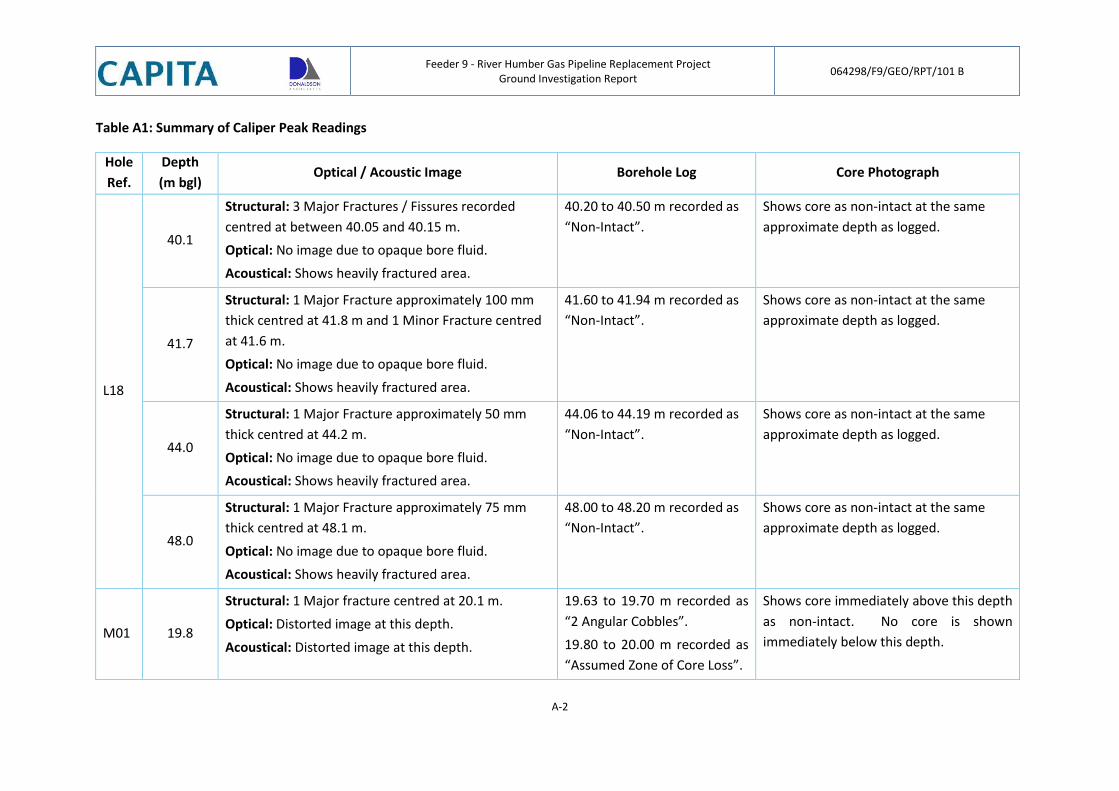
Feeder 9 - River Humber Gas Pipeline Replacement Project
Ground Investigation Report 064298/F9/GEO/RPT/101 B
A-2
Table A1: Summary of Caliper Peak Readings
Hole
Ref.
Depth
(m bgl) Optical / Acoustic Image Borehole Log Core Photograph
L18
40.1
Structural: 3 Major Fractures / Fissures recorded
centred at between 40.05 and 40.15 m.
Optical: No image due to opaque bore fluid.
Acoustical: Shows heavily fractured area.
40.20 to 40.50 m recorded as
“Non-Intact”.
Shows core as non-intact at the same
approximate depth as logged.
41.7
Structural: 1 Major Fracture approximately 100 mm
thick centred at 41.8 m and 1 Minor Fracture centred
at 41.6 m.
Optical: No image due to opaque bore fluid.
Acoustical: Shows heavily fractured area.
41.60 to 41.94 m recorded as
“Non-Intact”.
Shows core as non-intact at the same
approximate depth as logged.
44.0
Structural: 1 Major Fracture approximately 50 mm
thick centred at 44.2 m.
Optical: No image due to opaque bore fluid.
Acoustical: Shows heavily fractured area.
44.06 to 44.19 m recorded as
“Non-Intact”.
Shows core as non-intact at the same
approximate depth as logged.
48.0
Structural: 1 Major Fracture approximately 75 mm
thick centred at 48.1 m.
Optical: No image due to opaque bore fluid.
Acoustical: Shows heavily fractured area.
48.00 to 48.20 m recorded as
“Non-Intact”.
Shows core as non-intact at the same
approximate depth as logged.
M01 19.8
Structural: 1 Major fracture centred at 20.1 m.
Optical: Distorted image at this depth.
Acoustical: Distorted image at this depth.
19.63 to 19.70 m recorded as
“2 Angular Cobbles”.
19.80 to 20.00 m recorded as
“Assumed Zone of Core Loss”.
Shows core immediately above this depth
as non-intact. No core is shown
immediately below this depth.
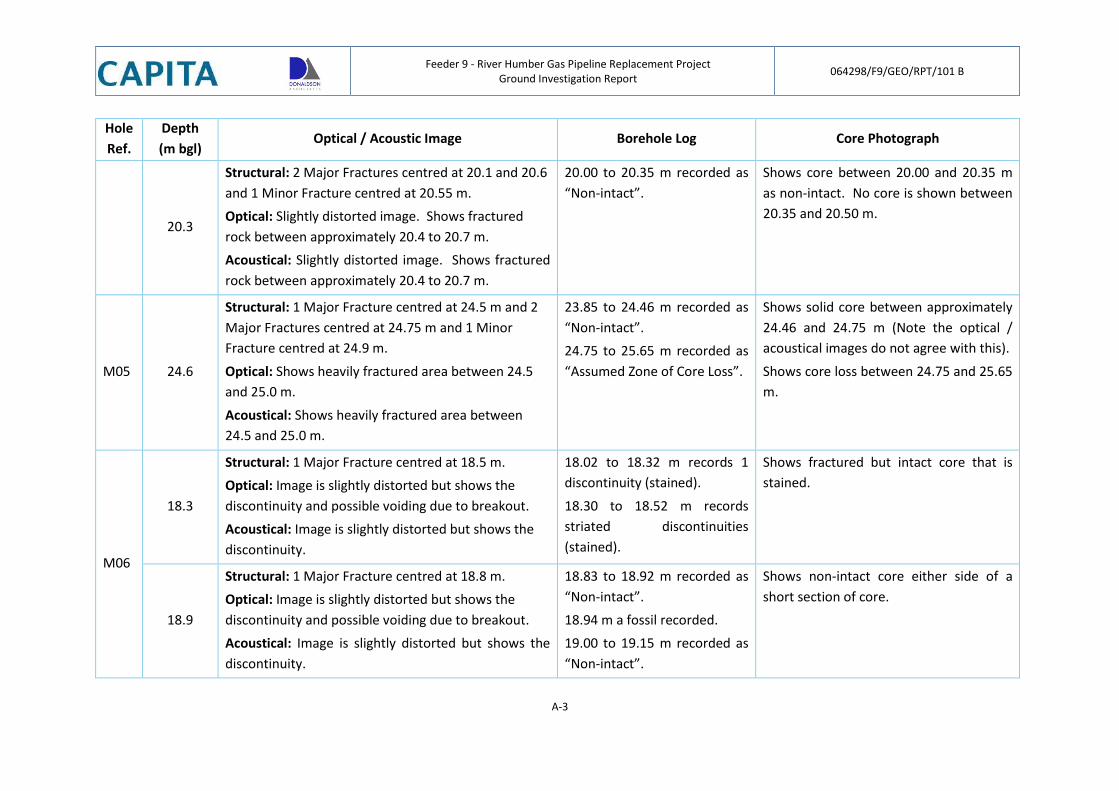
Feeder 9 - River Humber Gas Pipeline Replacement Project
Ground Investigation Report 064298/F9/GEO/RPT/101 B
A-3
Hole
Ref.
Depth
(m bgl) Optical / Acoustic Image Borehole Log Core Photograph
20.3
Structural: 2 Major Fractures centred at 20.1 and 20.6
and 1 Minor Fracture centred at 20.55 m.
Optical: Slightly distorted image. Shows fractured
rock between approximately 20.4 to 20.7 m.
Acoustical: Slightly distorted image. Shows fractured
rock between approximately 20.4 to 20.7 m.
20.00 to 20.35 m recorded as
“Non-intact”.
Shows core between 20.00 and 20.35 m
as non-intact. No core is shown between
20.35 and 20.50 m.
M05 24.6
Structural: 1 Major Fracture centred at 24.5 m and 2
Major Fractures centred at 24.75 m and 1 Minor
Fracture centred at 24.9 m.
Optical: Shows heavily fractured area between 24.5
and 25.0 m.
Acoustical: Shows heavily fractured area between
24.5 and 25.0 m.
23.85 to 24.46 m recorded as
“Non-intact”.
24.75 to 25.65 m recorded as
“Assumed Zone of Core Loss”.
Shows solid core between approximately
24.46 and 24.75 m (Note the optical /
acoustical images do not agree with this).
Shows core loss between 24.75 and 25.65
m.
M06
18.3
Structural: 1 Major Fracture centred at 18.5 m.
Optical: Image is slightly distorted but shows the
discontinuity and possible voiding due to breakout.
Acoustical: Image is slightly distorted but shows the
discontinuity.
18.02 to 18.32 m records 1
discontinuity (stained).
18.30 to 18.52 m records
striated discontinuities
(stained).
Shows fractured but intact core that is
stained.
18.9
Structural: 1 Major Fracture centred at 18.8 m.
Optical: Image is slightly distorted but shows the
discontinuity and possible voiding due to breakout.
Acoustical: Image is slightly distorted but shows the
discontinuity.
18.83 to 18.92 m recorded as
“Non-intact”.
18.94 m a fossil recorded.
19.00 to 19.15 m recorded as
“Non-intact”.
Shows non-intact core either side of a
short section of core.
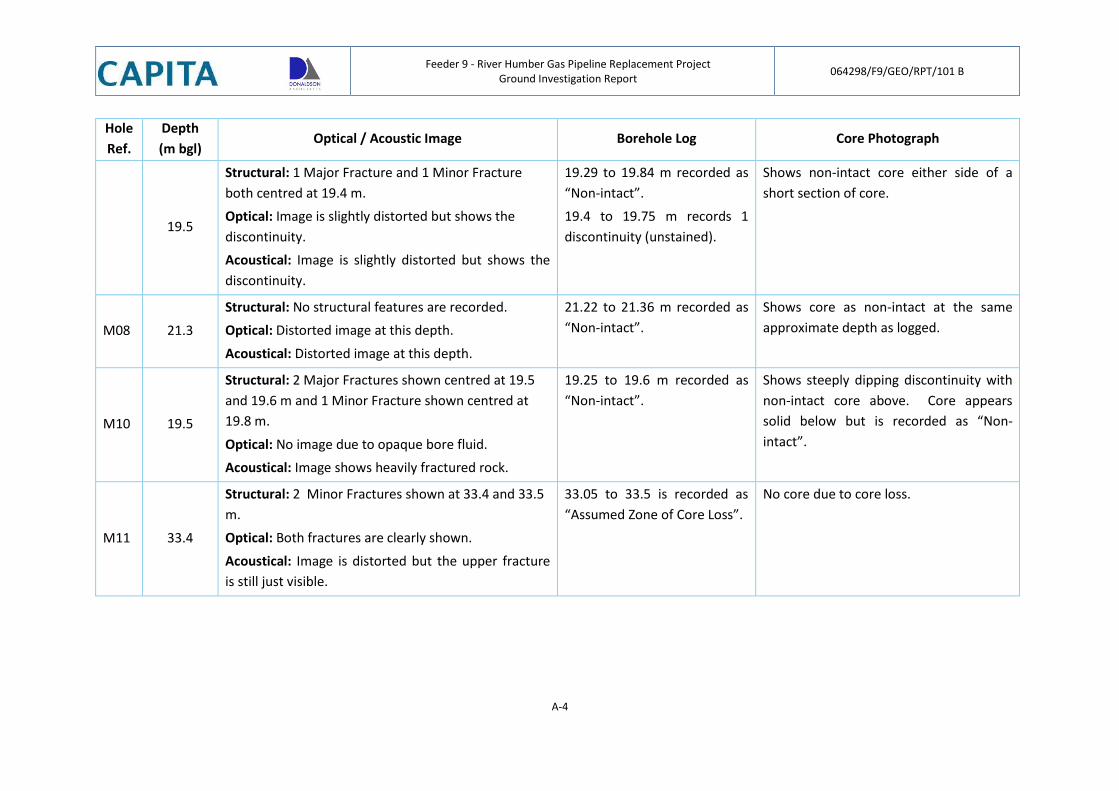
Feeder 9 - River Humber Gas Pipeline Replacement Project
Ground Investigation Report 064298/F9/GEO/RPT/101 B
A-4
Hole
Ref.
Depth
(m bgl) Optical / Acoustic Image Borehole Log Core Photograph
19.5
Structural: 1 Major Fracture and 1 Minor Fracture
both centred at 19.4 m.
Optical: Image is slightly distorted but shows the
discontinuity.
Acoustical: Image is slightly distorted but shows the
discontinuity.
19.29 to 19.84 m recorded as
“Non-intact”.
19.4 to 19.75 m records 1
discontinuity (unstained).
Shows non-intact core either side of a
short section of core.
M08 21.3
Structural: No structural features are recorded.
Optical: Distorted image at this depth.
Acoustical: Distorted image at this depth.
21.22 to 21.36 m recorded as
“Non-intact”.
Shows core as non-intact at the same
approximate depth as logged.
M10 19.5
Structural: 2 Major Fractures shown centred at 19.5
and 19.6 m and 1 Minor Fracture shown centred at
19.8 m.
Optical: No image due to opaque bore fluid.
Acoustical: Image shows heavily fractured rock.
19.25 to 19.6 m recorded as
“Non-intact”.
Shows steeply dipping discontinuity with
non-intact core above. Core appears
solid below but is recorded as “Non-
intact”.
M11 33.4
Structural: 2 Minor Fractures shown at 33.4 and 33.5
m.
Optical: Both fractures are clearly shown.
Acoustical: Image is distorted but the upper fracture
is still just visible.
33.05 to 33.5 is recorded as
“Assumed Zone of Core Loss”.
No core due to core loss.
Feeder 9 - River Humber Gas Pipeline Replacement Project
Ground Investigation Report 064298/F9/GEO/RPT/101 B
A-5
Although fractures are recorded by the geophysics throughout the boreholes surveyed they rarely
result in significant breakout of the bore which can be recorded by the caliper and is visible above
the background variation. Where the breakouts were recorded by the caliper log these are generally
where a major fracture is recorded. A review of all the major fractures within the geophysics
indicates that single horizontal / sub-horizontal fractures generally do not result in a breakout.
Breakouts recorded by the caliper are generally as a result of wide major fractures / multiple
fractures / steeply inclined fractures. In general the bore is relatively smooth which is backed up by
the optical images and, to a lesser extent, acoustic images as discussed in Section A1.6.
A1.2 Natural Gamma / Resistivity
The natural gamma tool was run through both the cased and uncased sections of borehole in all
boreholes in which geophysics surveys were completed. The resistivity was run through the uncased
sections of the borehole only. The purpose of the gamma and resistivity was to pick up marl seams
within the chalk.
Due to the relatively low CPS (Counts Per Second) values recorded by the natural gamma probe it is
very difficult to pick out any peaks that could be associated with marl bands. Additionally the
resistivity data, which assists in the recognition of marl bands with low values of resistance recorded,
shows little or no variation for the vast majority of borehole logged.
A review of literature (Barker et al. 1984) indicates that the two main marl seams within the
Burnham Chalk Formation (Ulceby and North Ormsby Marls) are towards the base of the formation
which will not have been encountered within this ground investigation. This literature also indicates
that variations of 10 CPS or more are generally associated with marl bands within this strata.
Reviewing the natural gamma logs it appears that peaks of this magnitude were not recorded within
the boreholes. Where peaks close to this value have been logged the resistivity data shows no
variation which would indicate the variation is not due to a marl band.
A1.3 Density
The density tool was run through both the cased and uncased sections of borehole in all boreholes in
which geophysics surveys were completed. The information within the cased sections has been
treated as qualitative only. A review of the apparent density data highlighted only 2 locations where
a significant drop in density was recorded. These were both in borehole L03 at approximately 9.5
and 14 to 15 m bgl. The low density area at 9.5 m bgl is possibly associated with localised loosening
of the cohesive alluvial deposits or underlying granular deposits during drilling as a water strike and
a low SPT value were recorded at this approximate depth. There is no indication from the borehole
log or core photography why there was a low density recording around the depth of 14 to 15m bgl.
The values of density returned within the uncased section have been corrected for borehole effects
and mud invasion (where applicable) to produce a density log. The density measured using this tool
was typically 2.25 g/cm3 which equates to 2.25 Mg/m3. Variation in all of the logs was noted to be
small with values generally ranging between 2.15 Mg/m3 and 2.3 Mg/m3. A density of 2.15 Mg/m3 is
shown in close proximity to the site in Figure 4.5 in CIRIA Report C574 (Lord et al 2002) although this
is believed to be Dry Density rather than bulk density. Laboratory test data recorded bulk densities
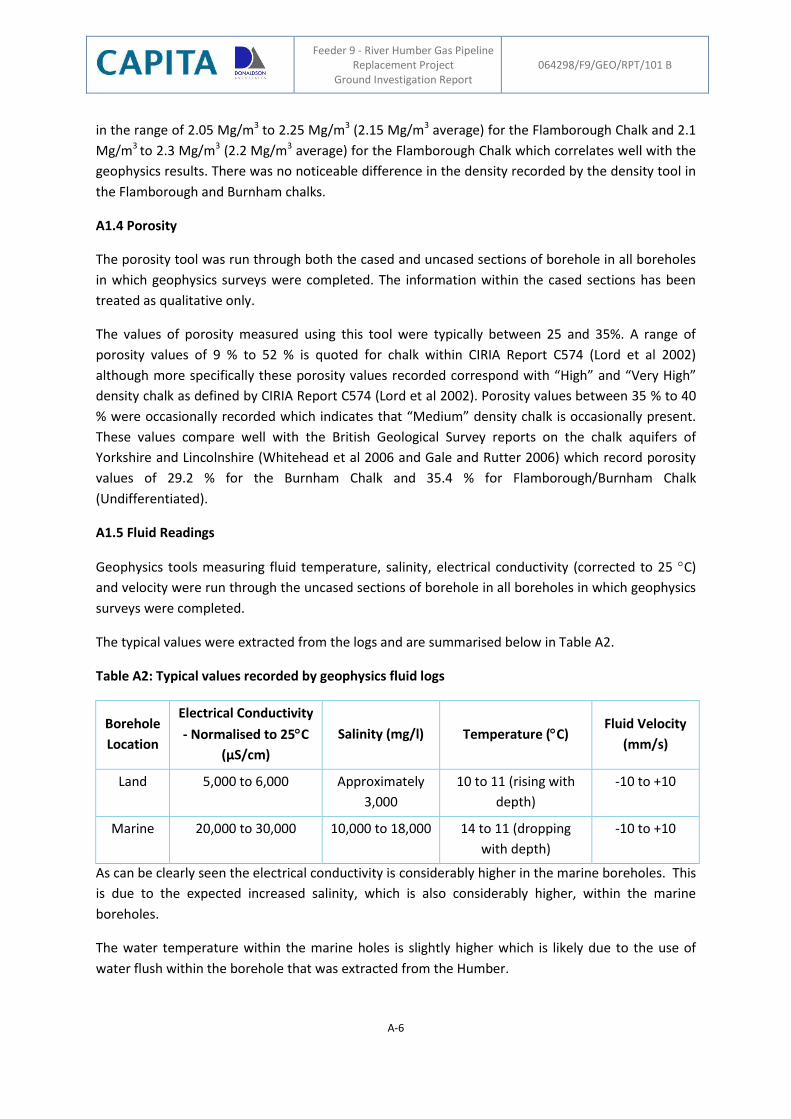
Feeder 9 - River Humber Gas Pipeline Replacement Project
Ground Investigation Report 064298/F9/GEO/RPT/101 B
A-6
in the range of 2.05 Mg/m3 to 2.25 Mg/m3 (2.15 Mg/m3 average) for the Flamborough Chalk and 2.1
Mg/m3 to 2.3 Mg/m3 (2.2 Mg/m3 average) for the Flamborough Chalk which correlates well with the
geophysics results. There was no noticeable difference in the density recorded by the density tool in
the Flamborough and Burnham chalks.
A1.4 Porosity
The porosity tool was run through both the cased and uncased sections of borehole in all boreholes
in which geophysics surveys were completed. The information within the cased sections has been
treated as qualitative only.
The values of porosity measured using this tool were typically between 25 and 35%. A range of
porosity values of 9 % to 52 % is quoted for chalk within CIRIA Report C574 (Lord et al 2002)
although more specifically these porosity values recorded correspond with “High” and “Very High”
density chalk as defined by CIRIA Report C574 (Lord et al 2002). Porosity values between 35 % to 40
% were occasionally recorded which indicates that “Medium” density chalk is occasionally present.
These values compare well with the British Geological Survey reports on the chalk aquifers of
Yorkshire and Lincolnshire (Whitehead et al 2006 and Gale and Rutter 2006) which record porosity
values of 29.2 % for the Burnham Chalk and 35.4 % for Flamborough/Burnham Chalk
(Undifferentiated).
A1.5 Fluid Readings
Geophysics tools measuring fluid temperature, salinity, electrical conductivity (corrected to 25 C)
and velocity were run through the uncased sections of borehole in all boreholes in which geophysics
surveys were completed.
The typical values were extracted from the logs and are summarised below in Table A2.
Table A2: Typical values recorded by geophysics fluid logs
Borehole
Location
Electrical Conductivity
- Normalised to 25C
(µS/cm)
Salinity (mg/l) Temperature (C) Fluid Velocity
(mm/s)
Land 5,000 to 6,000 Approximately
3,000
10 to 11 (rising with
depth)
-10 to +10
Marine 20,000 to 30,000 10,000 to 18,000 14 to 11 (dropping
with depth)
-10 to +10
As can be clearly seen the electrical conductivity is considerably higher in the marine boreholes. This
is due to the expected increased salinity, which is also considerably higher, within the marine
boreholes.
The water temperature within the marine holes is slightly higher which is likely due to the use of
water flush within the borehole that was extracted from the Humber.
Feeder 9 - River Humber Gas Pipeline Replacement Project
Ground Investigation Report 064298/F9/GEO/RPT/101 B
A-7
Fluid velocity readings indicate that there are no significant flows into or out of the boreholes. Flow
readings above the typical values recorded in Table A2 above were ignored as these were
concentrated around the base of the casing.
A1.6 Optical and Acoustical Imaging
The optical and acoustical image tools were run through both the cased and uncased sections of
borehole in all boreholes in which geophysics surveys were completed. The optical information
within the land holes is generally poorer than the marine holes which were more stable and
therefore were able to be flushed prior to completing the geophysics. Even though the land holes
were left to settle prior to the geophysics being completed the optical images from these boreholes
are of no practical use. For the marine holes some very clear images were recorded which give the
best indication of the in situ condition of the chalk. The optical and acoustic results are plotted
against logged chalk grade, logged RQD value and “Assumed Zones of Core loss” and presented in
drawings APPENDIX A/01 to 03. Several sections of core have been summarised below in Table A3 as
a comparison of what was recovered in terms of core sample and how this compares with the in situ
condition of the chalk.
Table A3: Comparison of Core Recovery against Geophysics Optical and Acoustic Results
Hole
Ref.
Depth
(m bgl)
TCR
(%)
SCR
(%)
RQD
(%)
Core Photograph Optical / Acoustic Image Comments
L03 31.5 to
33.0
100 75 60
TCR
/ S
CR
/ R
QD
val
ues
ind
icat
e go
od
rec
ove
ry a
nd
aver
age
con
dit
ion
co
re.
A
cou
stic
im
age
and
inte
rpre
ted
str
uct
ura
l in
form
atio
n s
ho
ws
on
ly a
few
min
or
feat
ure
s.
Co
mp
arin
g co
re p
ho
togr
aph
wit
h
aco
ust
ic i
mag
e in
dic
ates
rel
ativ
ely
go
od
co
re w
ith
seve
ral d
rilli
ng
ind
uce
d f
ract
ure
s.
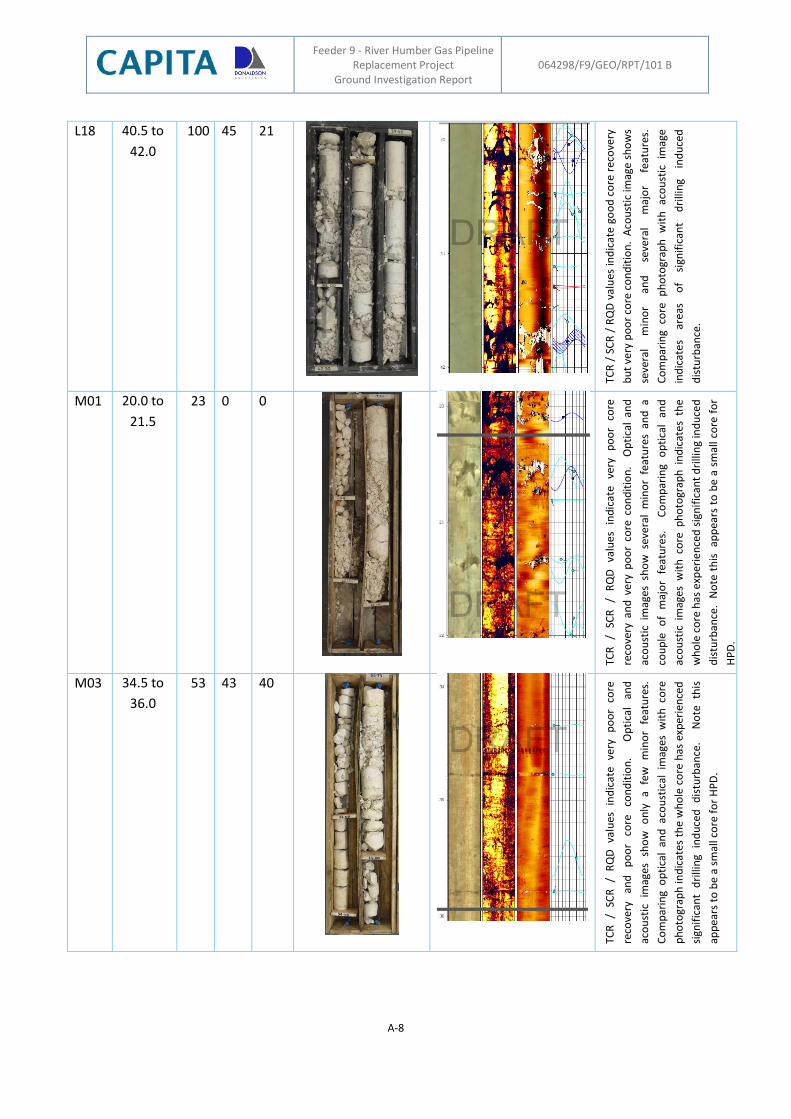
Feeder 9 - River Humber Gas Pipeline Replacement Project
Ground Investigation Report 064298/F9/GEO/RPT/101 B
A-8
L18 40.5 to
42.0
100 45 21
TCR
/ S
CR
/ R
QD
val
ues
ind
icat
e go
od
co
re r
eco
very
bu
t ve
ry p
oo
r co
re c
on
dit
ion
. A
cou
stic
imag
e sh
ow
s
seve
ral
min
or
and
se
vera
l m
ajo
r fe
atu
res.
Co
mp
arin
g co
re
ph
oto
grap
h
wit
h
aco
ust
ic
imag
e
ind
icat
es
area
s o
f si
gnif
ican
t d
rilli
ng
ind
uce
d
dis
turb
ance
.
M01 20.0 to
21.5
23 0 0
TCR
/
SCR
/
RQ
D
valu
es
ind
icat
e ve
ry
po
or
core
reco
very
an
d v
ery
po
or
core
co
nd
itio
n.
Op
tica
l an
d
aco
ust
ic i
mag
es s
ho
w s
ever
al m
ino
r fe
atu
res
and
a
cou
ple
o
f m
ajo
r fe
atu
res.
Co
mp
arin
g o
pti
cal
and
aco
ust
ic i
mag
es w
ith
co
re p
ho
togr
aph
in
dic
ate
s th
e
wh
ole
co
re h
as e
xper
ien
ced
sig
nif
ican
t d
rilli
ng
ind
uce
d
dis
turb
ance
. N
ote
th
is
app
ears
to
be
a sm
all c
ore
fo
r
HP
D.
M03 34.5 to
36.0
53 43 40
TCR
/
SCR
/
RQ
D
valu
es
ind
icat
e ve
ry
po
or
core
reco
very
an
d
po
or
core
co
nd
itio
n.
O
pti
cal
and
aco
ust
ic
imag
es
sho
w
on
ly
a fe
w
min
or
feat
ure
s.
Co
mp
arin
g o
pti
cal
and
aco
ust
ical
im
ages
wit
h c
ore
ph
oto
grap
h in
dic
ates
th
e w
ho
le c
ore
has
exp
erie
nce
d
sign
ific
ant
dri
llin
g in
du
ced
d
istu
rban
ce.
N
ote
th
is
app
ears
to
be
a sm
all c
ore
fo
r H
PD
.
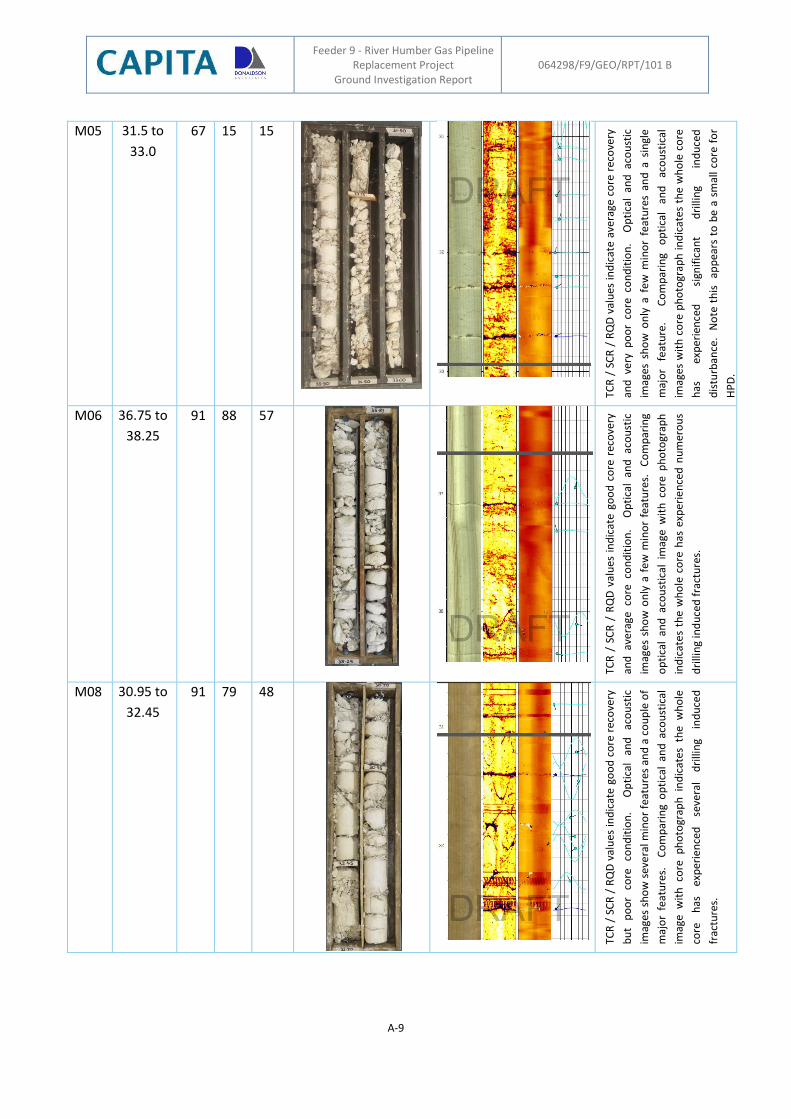
Feeder 9 - River Humber Gas Pipeline Replacement Project
Ground Investigation Report 064298/F9/GEO/RPT/101 B
A-9
M05 31.5 to
33.0
67 15 15
TCR
/ S
CR
/ R
QD
val
ues
ind
icat
e av
erag
e co
re r
eco
very
and
ver
y p
oo
r co
re c
on
dit
ion
. O
pti
cal
and
aco
ust
ic
imag
es s
ho
w o
nly
a f
ew m
ino
r fe
atu
res
and
a s
ingl
e
maj
or
feat
ure
.
Co
mp
arin
g o
pti
cal
and
ac
ou
stic
al
imag
es w
ith
co
re p
ho
togr
aph
in
dic
ates
th
e w
ho
le c
ore
has
ex
pe
rien
ced
si
gnif
ican
t d
rilli
ng
ind
uce
d
dis
turb
ance
. N
ote
th
is
app
ears
to
be
a sm
all
core
fo
r
HP
D.
M06 36.75 to
38.25
91 88 57
TCR
/ S
CR
/ R
QD
val
ues
in
dic
ate
go
od
co
re r
eco
very
and
ave
rage
co
re c
on
dit
ion
.
Op
tica
l an
d a
cou
stic
imag
es s
ho
w o
nly
a f
ew m
ino
r fe
atu
res.
C
om
par
ing
op
tica
l an
d a
cou
stic
al i
mag
e w
ith
co
re p
ho
togr
aph
ind
icat
es
the
wh
ole
co
re h
as e
xper
ien
ced
nu
mer
ou
s
dri
llin
g in
du
ced
fra
ctu
res.
M08 30.95 to
32.45
91 79 48
TCR
/ S
CR
/ R
QD
val
ues
ind
icat
e go
od
co
re r
eco
very
bu
t p
oo
r co
re
con
dit
ion
.
Op
tica
l an
d
aco
ust
ic
imag
es s
ho
w s
eve
ral m
ino
r fe
atu
res
and
a c
ou
ple
of
maj
or
feat
ure
s.
Co
mp
arin
g o
pti
cal
and
aco
ust
ical
imag
e w
ith
co
re p
ho
togr
aph
in
dic
ates
th
e w
ho
le
core
h
as
exp
erie
nce
d
seve
ral
dri
llin
g in
du
ced
frac
ture
s.
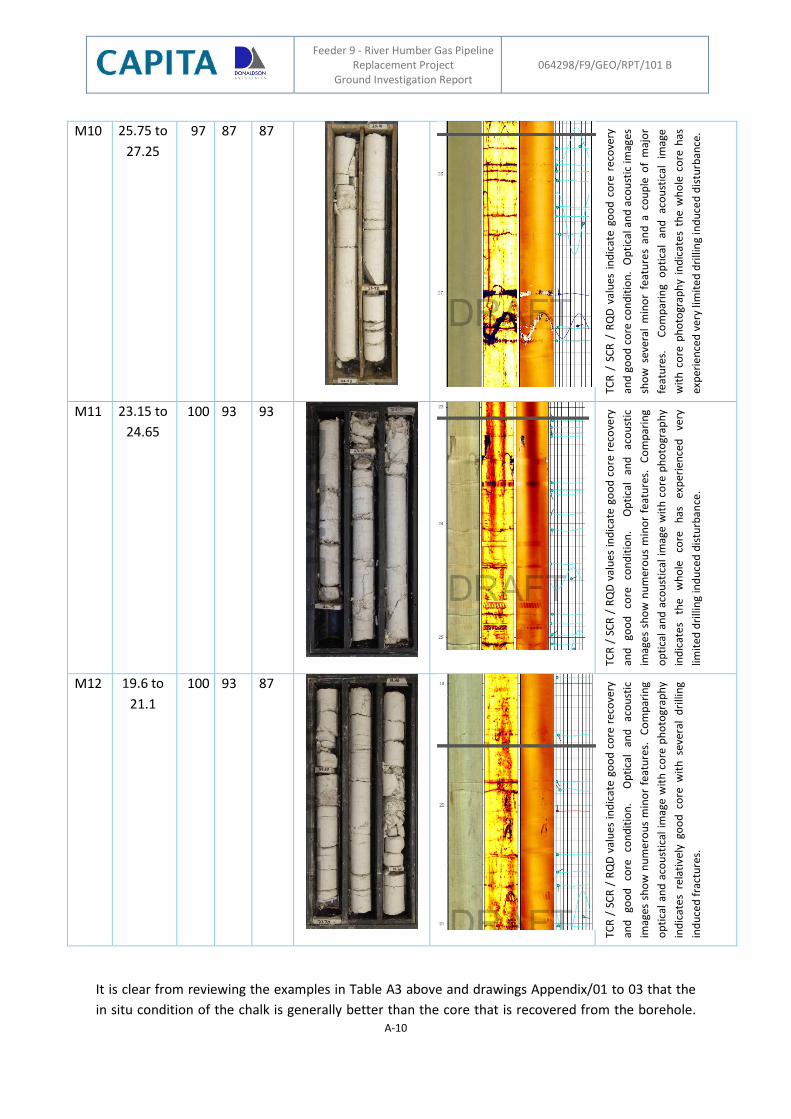
Feeder 9 - River Humber Gas Pipeline Replacement Project
Ground Investigation Report 064298/F9/GEO/RPT/101 B
A-10
M10 25.75 to
27.25
97 87 87
TCR
/ S
CR
/ R
QD
val
ues
in
dic
ate
goo
d c
ore
rec
ove
ry
and
go
od
co
re c
on
dit
ion
. O
pti
cal a
nd
aco
ust
ic im
ages
sho
w s
ever
al m
ino
r fe
atu
res
and
a c
ou
ple
of
maj
or
feat
ure
s.
C
om
par
ing
op
tica
l an
d
aco
ust
ical
im
age
wit
h c
ore
ph
oto
grap
hy
ind
icat
es
the
wh
ole
co
re h
as
exp
erie
nce
d v
ery
limit
ed
dri
llin
g in
du
ced
dis
turb
ance
.
M11 23.15 to
24.65
100 93 93
TCR
/ S
CR
/ R
QD
val
ues
in
dic
ate
goo
d c
ore
rec
ove
ry
and
go
od
co
re
con
dit
ion
.
Op
tica
l an
d
aco
ust
ic
imag
es s
ho
w n
um
ero
us
min
or
feat
ure
s.
Co
mp
arin
g
op
tica
l an
d a
cou
stic
al i
mag
e w
ith
co
re p
ho
togr
aph
y
ind
icat
es
the
wh
ole
co
re
has
ex
per
ien
ced
ve
ry
limit
ed d
rilli
ng
ind
uce
d d
istu
rban
ce.
M12 19.6 to
21.1
100 93 87
TCR
/ S
CR
/ R
QD
val
ues
in
dic
ate
goo
d c
ore
rec
ove
ry
and
go
od
co
re
con
dit
ion
.
Op
tica
l an
d
aco
ust
ic
imag
es s
ho
w n
um
ero
us
min
or
feat
ure
s.
Co
mp
arin
g
op
tica
l an
d a
cou
stic
al i
mag
e w
ith
co
re p
ho
togr
aph
y
ind
icat
es
rela
tive
ly g
oo
d c
ore
wit
h s
ever
al d
rilli
ng
ind
uce
d f
ract
ure
s.
It is clear from reviewing the examples in Table A3 above and drawings Appendix/01 to 03 that the
in situ condition of the chalk is generally better than the core that is recovered from the borehole.
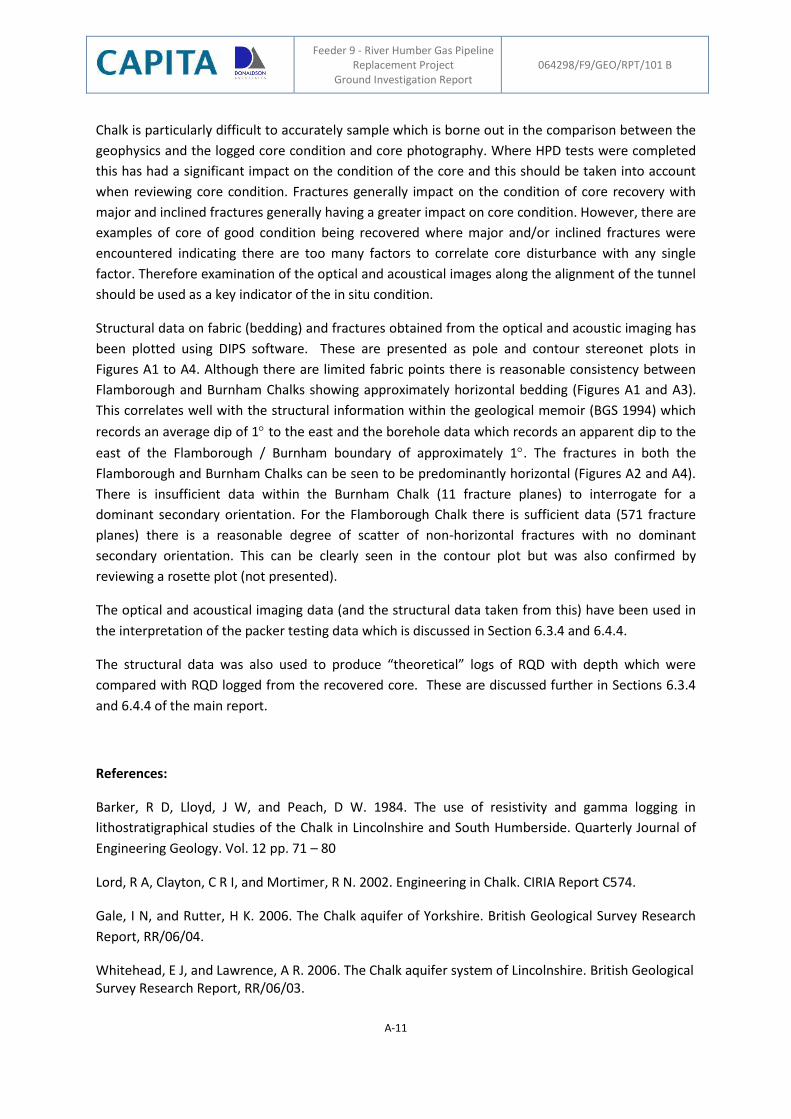
Feeder 9 - River Humber Gas Pipeline Replacement Project
Ground Investigation Report 064298/F9/GEO/RPT/101 B
A-11
Chalk is particularly difficult to accurately sample which is borne out in the comparison between the
geophysics and the logged core condition and core photography. Where HPD tests were completed
this has had a significant impact on the condition of the core and this should be taken into account
when reviewing core condition. Fractures generally impact on the condition of core recovery with
major and inclined fractures generally having a greater impact on core condition. However, there are
examples of core of good condition being recovered where major and/or inclined fractures were
encountered indicating there are too many factors to correlate core disturbance with any single
factor. Therefore examination of the optical and acoustical images along the alignment of the tunnel
should be used as a key indicator of the in situ condition.
Structural data on fabric (bedding) and fractures obtained from the optical and acoustic imaging has
been plotted using DIPS software. These are presented as pole and contour stereonet plots in
Figures A1 to A4. Although there are limited fabric points there is reasonable consistency between
Flamborough and Burnham Chalks showing approximately horizontal bedding (Figures A1 and A3).
This correlates well with the structural information within the geological memoir (BGS 1994) which
records an average dip of 1 to the east and the borehole data which records an apparent dip to the
east of the Flamborough / Burnham boundary of approximately 1. The fractures in both the
Flamborough and Burnham Chalks can be seen to be predominantly horizontal (Figures A2 and A4).
There is insufficient data within the Burnham Chalk (11 fracture planes) to interrogate for a
dominant secondary orientation. For the Flamborough Chalk there is sufficient data (571 fracture
planes) there is a reasonable degree of scatter of non-horizontal fractures with no dominant
secondary orientation. This can be clearly seen in the contour plot but was also confirmed by
reviewing a rosette plot (not presented).
The optical and acoustical imaging data (and the structural data taken from this) have been used in
the interpretation of the packer testing data which is discussed in Section 6.3.4 and 6.4.4.
The structural data was also used to produce “theoretical” logs of RQD with depth which were
compared with RQD logged from the recovered core. These are discussed further in Sections 6.3.4
and 6.4.4 of the main report.
References:
Barker, R D, Lloyd, J W, and Peach, D W. 1984. The use of resistivity and gamma logging in
lithostratigraphical studies of the Chalk in Lincolnshire and South Humberside. Quarterly Journal of
Engineering Geology. Vol. 12 pp. 71 – 80
Lord, R A, Clayton, C R I, and Mortimer, R N. 2002. Engineering in Chalk. CIRIA Report C574.
Gale, I N, and Rutter, H K. 2006. The Chalk aquifer of Yorkshire. British Geological Survey Research
Report, RR/06/04.
Whitehead, E J, and Lawrence, A R. 2006. The Chalk aquifer system of Lincolnshire. British Geological Survey Research Report, RR/06/03.
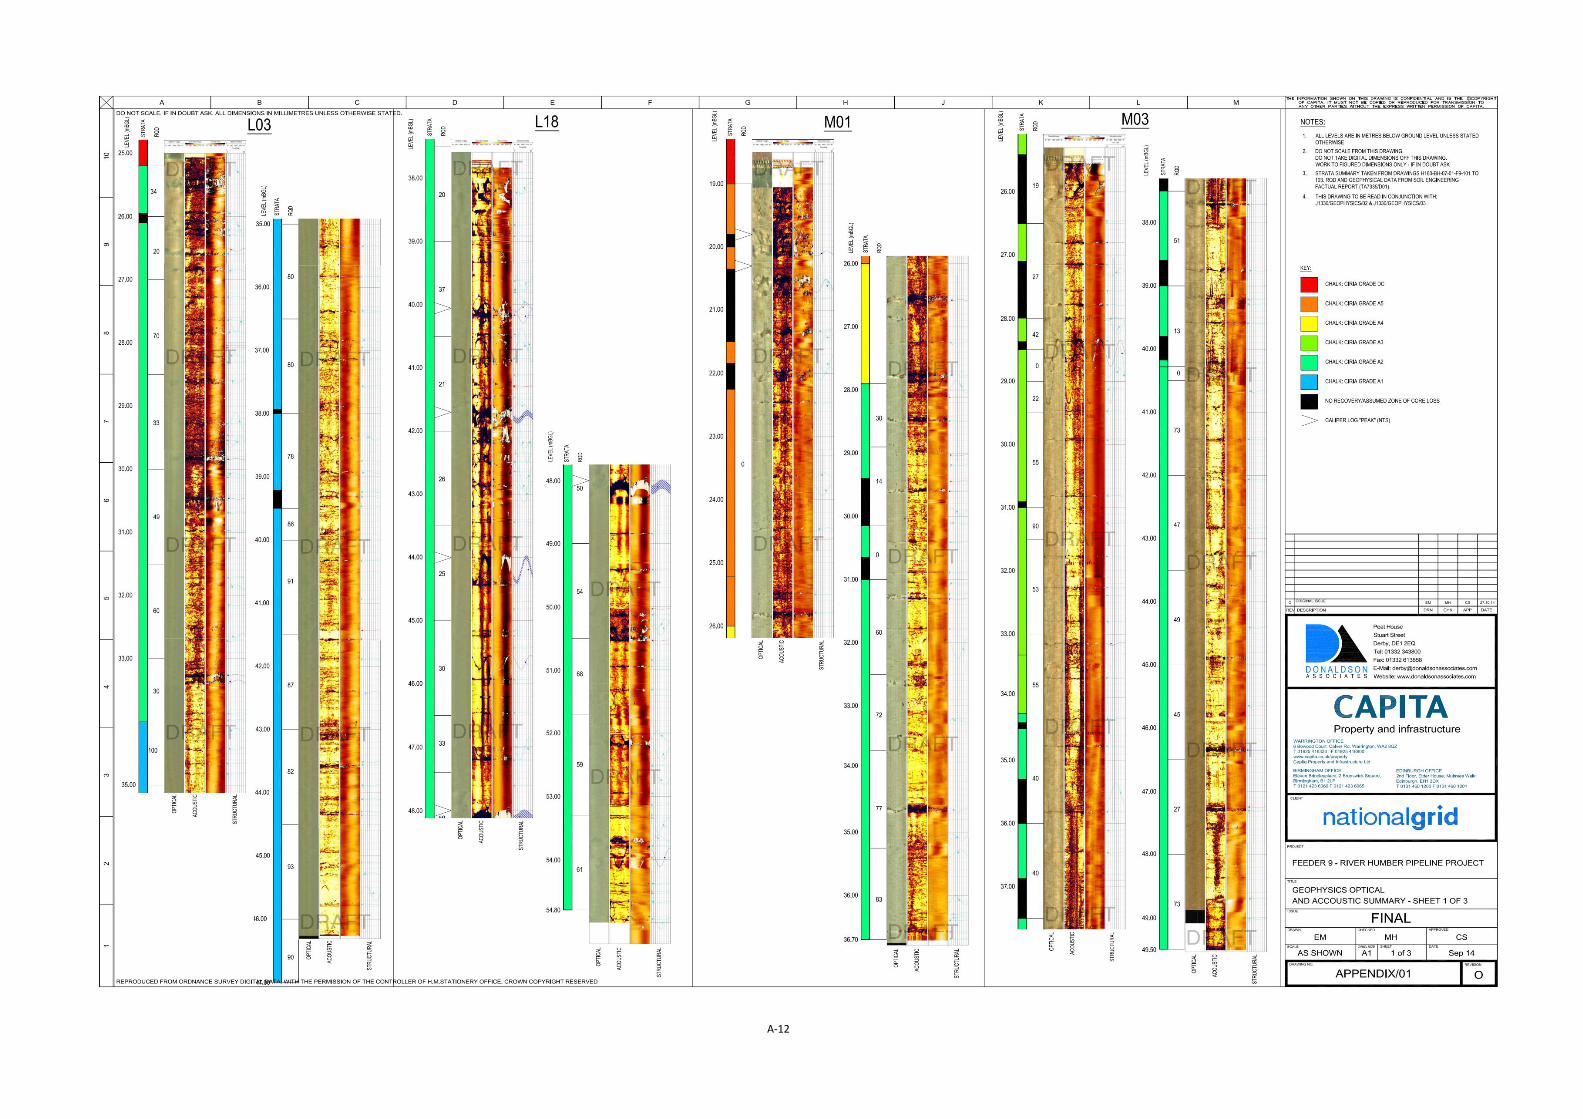
A-12
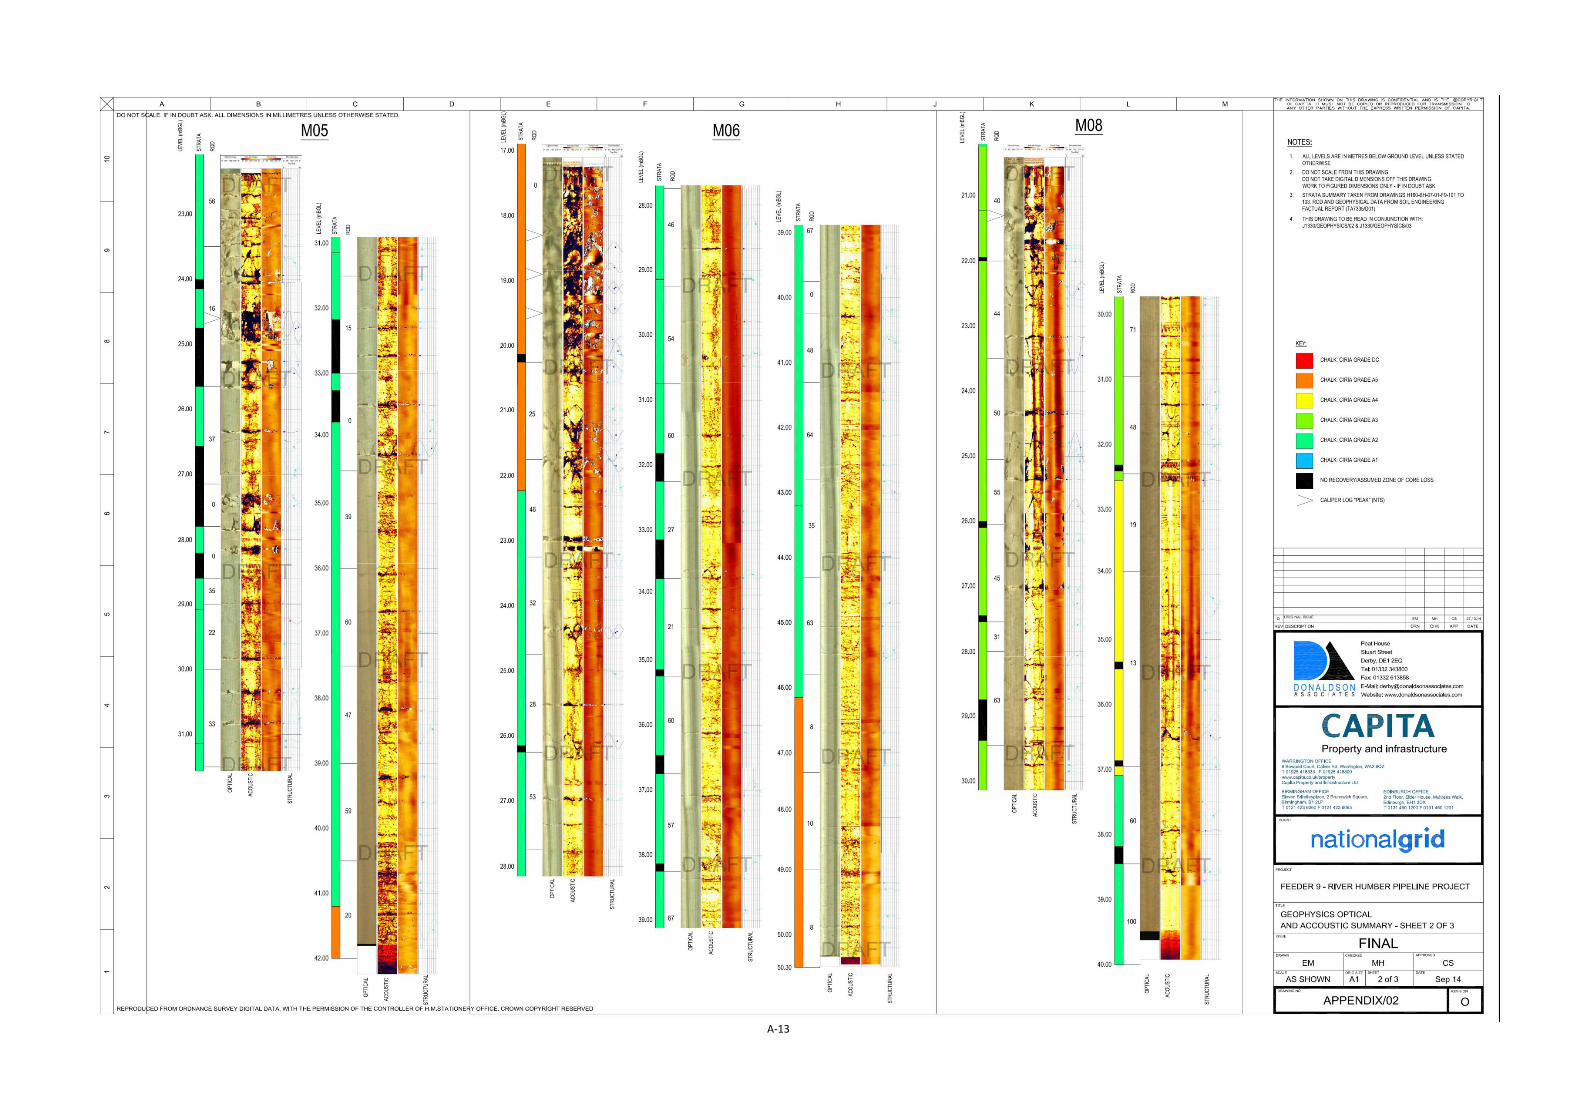
A-13
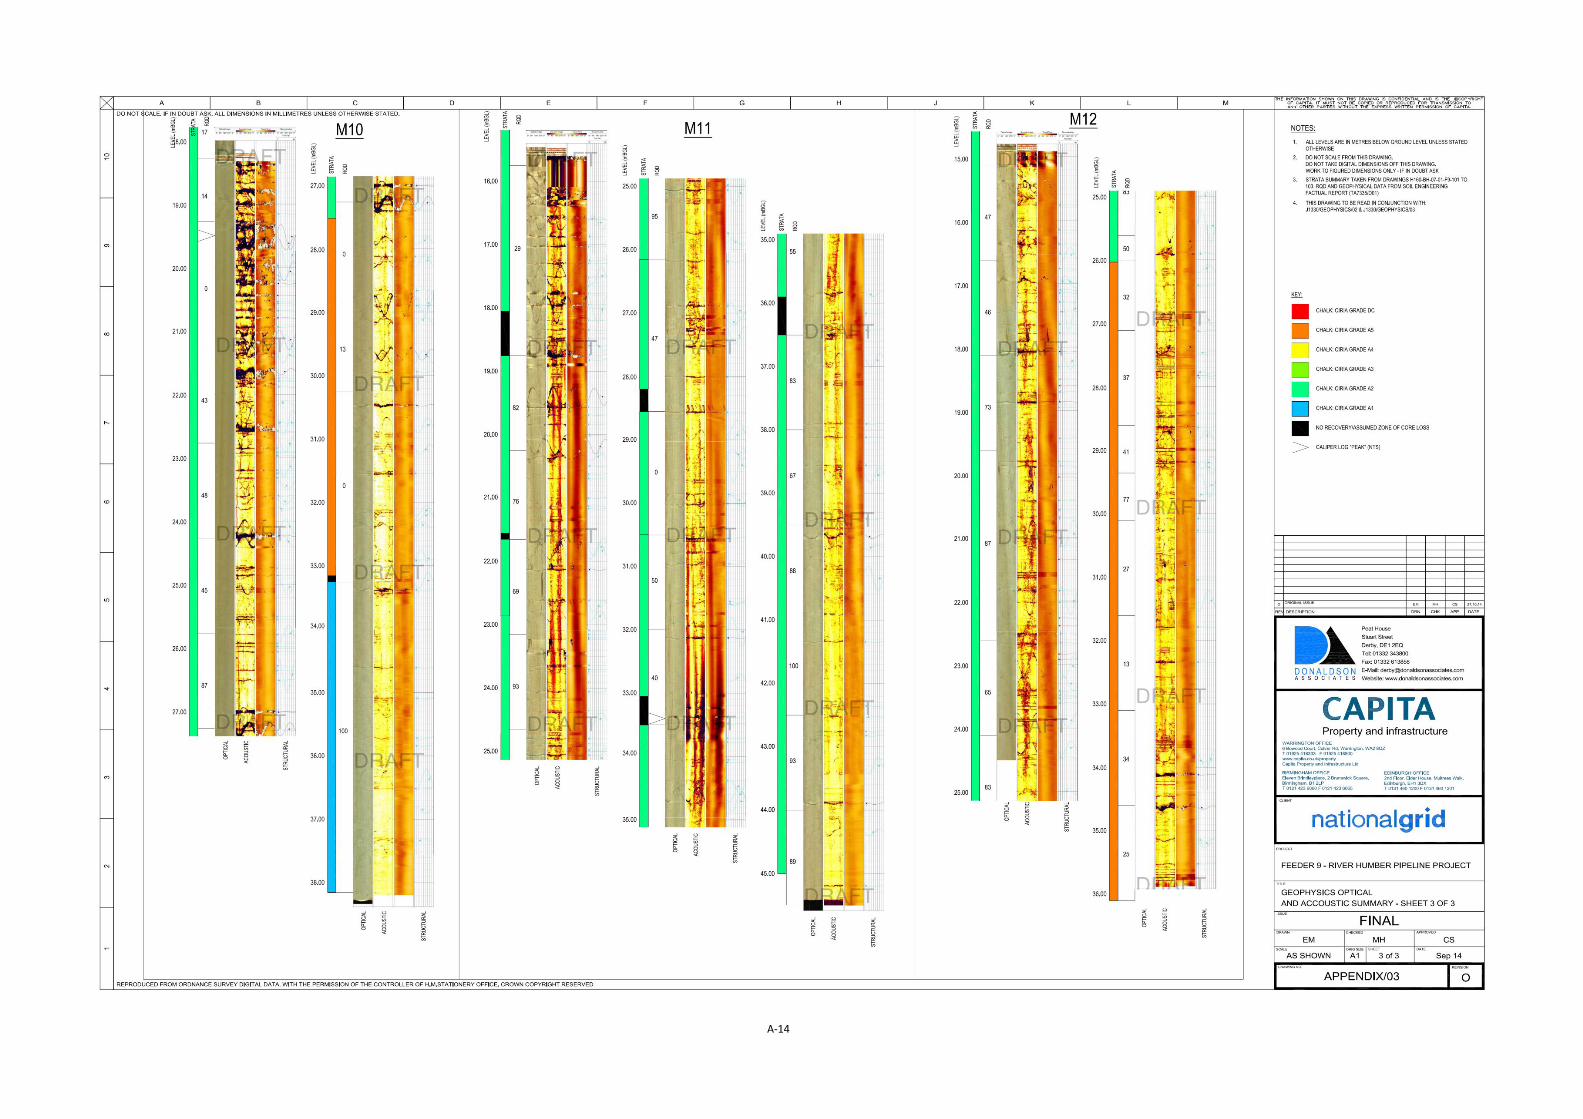
A-14

Feeder 9 - River Humber Gas Pipeline Replacement Project Ground Investigation Report
064298/F9/GEO/RPT/101 B
APPENDIX B – Generic Assessment Criteria
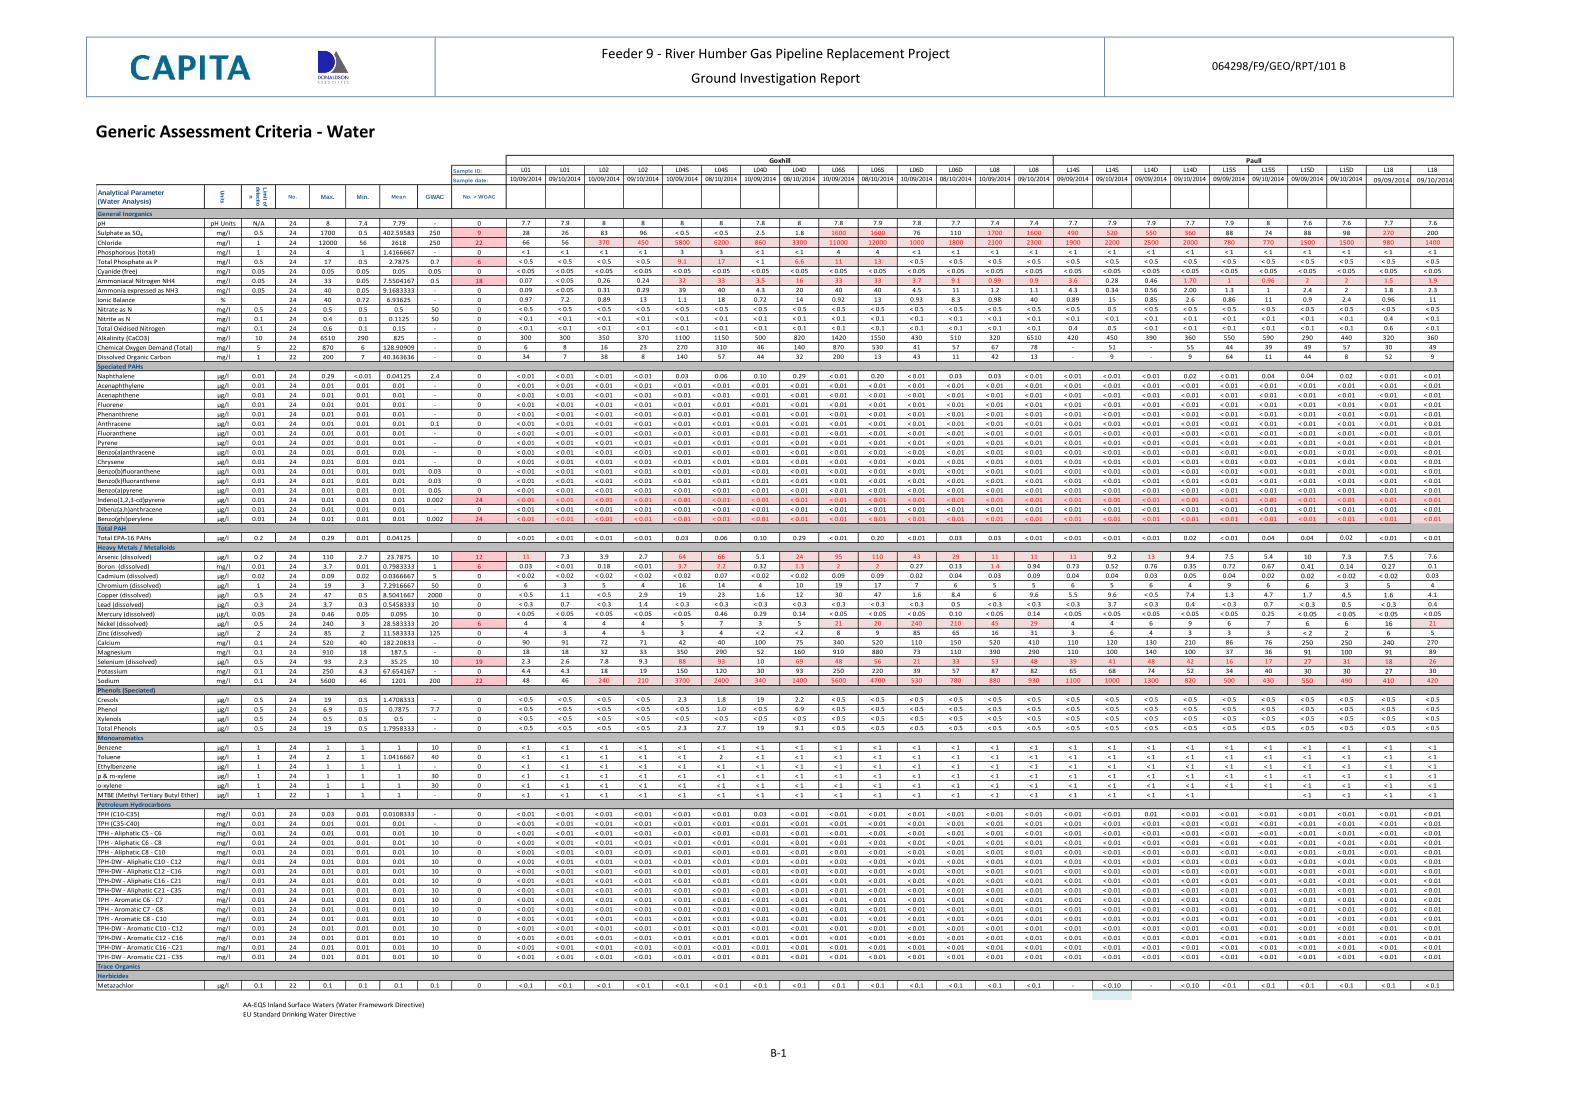
Feeder 9 - River Humber Gas Pipeline Replacement Project
Ground Investigation Report 064298/F9/GEO/RPT/101 B
B-1
Generic Assessment Criteria - Water
Sample ID: L01 L01 L02 L02 L04S L04S L04D L04D L06S L06S L06D L06D L08 L08 L14S L14S L14D L14D L15S L15S L15D L15D L18 L18
Sample date: 10/09/2014 09/10/2014 10/09/2014 09/10/2014 10/09/2014 08/10/2014 10/09/2014 08/10/2014 10/09/2014 08/10/2014 10/09/2014 08/10/2014 10/09/2014 09/10/2014 09/09/2014 09/10/2014 09/09/2014 09/10/2014 09/09/2014 09/10/2014 09/09/2014 09/10/2014 09/09/2014 09/10/2014
Analytical Parameter
(Water Analysis)
Un
its
Lim
it of
dete
ctio
n
No. Max. Min. Mean GWAC No. > WGAC
pH pH Units N/A 24 8 7.4 7.79 - 0 7.7 7.9 8 8 8 8 7.8 8 7.8 7.9 7.8 7.7 7.4 7.4 7.7 7.9 7.9 7.7 7.9 8 7.6 7.6 7.7 7.6
Sulphate as SO4 mg/l 0.5 24 1700 0.5 402.59583 250 9 28 26 83 96 < 0.5 < 0.5 2.5 1.8 1600 1600 76 110 1700 1600 490 520 550 360 88 74 88 98 270 200
Chloride mg/l 1 24 12000 56 2618 250 22 66 56 370 450 5800 6200 860 3300 11000 12000 1000 1800 2100 2300 1900 2200 2500 2000 780 770 1500 1500 980 1400
Phosphorous (total) mg/l 1 24 4 1 1.4166667 - 0 < 1 < 1 < 1 < 1 3 3 < 1 < 1 4 4 < 1 < 1 < 1 < 1 < 1 < 1 < 1 < 1 < 1 < 1 < 1 < 1 < 1 < 1
Total Phosphate as P mg/l 0.5 24 17 0.5 2.7875 0.7 6 < 0.5 < 0.5 < 0.5 < 0.5 9.1 17 < 1 6.6 11 13 < 0.5 < 0.5 < 0.5 < 0.5 < 0.5 < 0.5 < 0.5 < 0.5 < 0.5 < 0.5 < 0.5 < 0.5 < 0.5 < 0.5
Cyanide (free) mg/l 0.05 24 0.05 0.05 0.05 0.05 0 < 0.05 < 0.05 < 0.05 < 0.05 < 0.05 < 0.05 < 0.05 < 0.05 < 0.05 < 0.05 < 0.05 < 0.05 < 0.05 < 0.05 < 0.05 < 0.05 < 0.05 < 0.05 < 0.05 < 0.05 < 0.05 < 0.05 < 0.05 < 0.05
Ammoniacal Nitrogen NH4 mg/l 0.05 24 33 0.05 7.5504167 0.5 18 0.07 < 0.05 0.26 0.24 32 33 3.5 16 33 33 3.7 9.1 0.99 0.9 3.6 0.28 0.46 1.70 1 0.96 2 2 1.5 1.9
Ammonia expressed as NH3 mg/l 0.05 24 40 0.05 9.1683333 - 0 0.09 < 0.05 0.31 0.29 39 40 4.3 20 40 40 4.5 11 1.2 1.1 4.3 0.34 0.56 2.00 1.3 1 2.4 2 1.8 2.3
Ionic Balance % 24 40 0.72 6.93625 - 0 0.97 7.2 0.89 13 1.1 18 0.72 14 0.92 13 0.93 8.3 0.98 40 0.89 15 0.85 2.6 0.86 11 0.9 2.4 0.96 11
Nitrate as N mg/l 0.5 24 0.5 0.5 0.5 50 0 < 0.5 < 0.5 < 0.5 < 0.5 < 0.5 < 0.5 < 0.5 < 0.5 < 0.5 < 0.5 < 0.5 < 0.5 < 0.5 < 0.5 < 0.5 0.5 < 0.5 < 0.5 < 0.5 < 0.5 < 0.5 < 0.5 < 0.5 < 0.5
Nitrite as N mg/l 0.1 24 0.4 0.1 0.1125 50 0 < 0.1 < 0.1 < 0.1 < 0.1 < 0.1 < 0.1 < 0.1 < 0.1 < 0.1 < 0.1 < 0.1 < 0.1 < 0.1 < 0.1 < 0.1 < 0.1 < 0.1 < 0.1 < 0.1 < 0.1 < 0.1 < 0.1 0.4 < 0.1
Total Oxidised Nitrogen mg/l 0.1 24 0.6 0.1 0.15 - 0 < 0.1 < 0.1 < 0.1 < 0.1 < 0.1 < 0.1 < 0.1 < 0.1 < 0.1 < 0.1 < 0.1 < 0.1 < 0.1 < 0.1 0.4 0.5 < 0.1 < 0.1 < 0.1 < 0.1 < 0.1 < 0.1 0.6 < 0.1
Alkalinity (CaCO3) mg/l 10 24 6510 290 825 - 0 300 300 350 370 1100 1150 500 820 1420 1550 430 510 320 6510 420 450 390 360 550 590 290 440 320 360
Chemical Oxygen Demand (Total) mg/l 5 22 870 6 128.90909 - 0 6 8 16 23 270 310 46 140 870 530 41 57 67 78 - 51 - 55 44 39 49 57 30 49
Dissolved Organic Carbon mg/l 1 22 200 7 40.363636 - 0 34 7 38 8 140 57 44 32 200 13 43 11 42 13 - 9 - 9 64 11 44 8 52 9
Naphthalene µg/l 0.01 24 0.29 < 0.01 0.04125 2.4 0 < 0.01 < 0.01 < 0.01 < 0.01 0.03 0.06 0.10 0.29 < 0.01 0.20 < 0.01 0.03 0.03 < 0.01 < 0.01 < 0.01 < 0.01 0.02 < 0.01 0.04 0.04 0.02 < 0.01 < 0.01
Acenaphthylene µg/l 0.01 24 0.01 0.01 0.01 - 0 < 0.01 < 0.01 < 0.01 < 0.01 < 0.01 < 0.01 < 0.01 < 0.01 < 0.01 < 0.01 < 0.01 < 0.01 < 0.01 < 0.01 < 0.01 < 0.01 < 0.01 < 0.01 < 0.01 < 0.01 < 0.01 < 0.01 < 0.01 < 0.01
Acenaphthene µg/l 0.01 24 0.01 0.01 0.01 - 0 < 0.01 < 0.01 < 0.01 < 0.01 < 0.01 < 0.01 < 0.01 < 0.01 < 0.01 < 0.01 < 0.01 < 0.01 < 0.01 < 0.01 < 0.01 < 0.01 < 0.01 < 0.01 < 0.01 < 0.01 < 0.01 < 0.01 < 0.01 < 0.01
Fluorene µg/l 0.01 24 0.01 0.01 0.01 - 0 < 0.01 < 0.01 < 0.01 < 0.01 < 0.01 < 0.01 < 0.01 < 0.01 < 0.01 < 0.01 < 0.01 < 0.01 < 0.01 < 0.01 < 0.01 < 0.01 < 0.01 < 0.01 < 0.01 < 0.01 < 0.01 < 0.01 < 0.01 < 0.01
Phenanthrene µg/l 0.01 24 0.01 0.01 0.01 - 0 < 0.01 < 0.01 < 0.01 < 0.01 < 0.01 < 0.01 < 0.01 < 0.01 < 0.01 < 0.01 < 0.01 < 0.01 < 0.01 < 0.01 < 0.01 < 0.01 < 0.01 < 0.01 < 0.01 < 0.01 < 0.01 < 0.01 < 0.01 < 0.01
Anthracene µg/l 0.01 24 0.01 0.01 0.01 0.1 0 < 0.01 < 0.01 < 0.01 < 0.01 < 0.01 < 0.01 < 0.01 < 0.01 < 0.01 < 0.01 < 0.01 < 0.01 < 0.01 < 0.01 < 0.01 < 0.01 < 0.01 < 0.01 < 0.01 < 0.01 < 0.01 < 0.01 < 0.01 < 0.01
Fluoranthene µg/l 0.01 24 0.01 0.01 0.01 - 0 < 0.01 < 0.01 < 0.01 < 0.01 < 0.01 < 0.01 < 0.01 < 0.01 < 0.01 < 0.01 < 0.01 < 0.01 < 0.01 < 0.01 < 0.01 < 0.01 < 0.01 < 0.01 < 0.01 < 0.01 < 0.01 < 0.01 < 0.01 < 0.01
Pyrene µg/l 0.01 24 0.01 0.01 0.01 - 0 < 0.01 < 0.01 < 0.01 < 0.01 < 0.01 < 0.01 < 0.01 < 0.01 < 0.01 < 0.01 < 0.01 < 0.01 < 0.01 < 0.01 < 0.01 < 0.01 < 0.01 < 0.01 < 0.01 < 0.01 < 0.01 < 0.01 < 0.01 < 0.01
Benzo(a)anthracene µg/l 0.01 24 0.01 0.01 0.01 - 0 < 0.01 < 0.01 < 0.01 < 0.01 < 0.01 < 0.01 < 0.01 < 0.01 < 0.01 < 0.01 < 0.01 < 0.01 < 0.01 < 0.01 < 0.01 < 0.01 < 0.01 < 0.01 < 0.01 < 0.01 < 0.01 < 0.01 < 0.01 < 0.01
Chrysene µg/l 0.01 24 0.01 0.01 0.01 - 0 < 0.01 < 0.01 < 0.01 < 0.01 < 0.01 < 0.01 < 0.01 < 0.01 < 0.01 < 0.01 < 0.01 < 0.01 < 0.01 < 0.01 < 0.01 < 0.01 < 0.01 < 0.01 < 0.01 < 0.01 < 0.01 < 0.01 < 0.01 < 0.01
Benzo(b)fluoranthene µg/l 0.01 24 0.01 0.01 0.01 0.03 0 < 0.01 < 0.01 < 0.01 < 0.01 < 0.01 < 0.01 < 0.01 < 0.01 < 0.01 < 0.01 < 0.01 < 0.01 < 0.01 < 0.01 < 0.01 < 0.01 < 0.01 < 0.01 < 0.01 < 0.01 < 0.01 < 0.01 < 0.01 < 0.01
Benzo(k)fluoranthene µg/l 0.01 24 0.01 0.01 0.01 0.03 0 < 0.01 < 0.01 < 0.01 < 0.01 < 0.01 < 0.01 < 0.01 < 0.01 < 0.01 < 0.01 < 0.01 < 0.01 < 0.01 < 0.01 < 0.01 < 0.01 < 0.01 < 0.01 < 0.01 < 0.01 < 0.01 < 0.01 < 0.01 < 0.01
Benzo(a)pyrene µg/l 0.01 24 0.01 0.01 0.01 0.05 0 < 0.01 < 0.01 < 0.01 < 0.01 < 0.01 < 0.01 < 0.01 < 0.01 < 0.01 < 0.01 < 0.01 < 0.01 < 0.01 < 0.01 < 0.01 < 0.01 < 0.01 < 0.01 < 0.01 < 0.01 < 0.01 < 0.01 < 0.01 < 0.01
Indeno(1,2,3-cd)pyrene µg/l 0.01 24 0.01 0.01 0.01 0.002 24 < 0.01 < 0.01 < 0.01 < 0.01 < 0.01 < 0.01 < 0.01 < 0.01 < 0.01 < 0.01 < 0.01 < 0.01 < 0.01 < 0.01 < 0.01 < 0.01 < 0.01 < 0.01 < 0.01 < 0.01 < 0.01 < 0.01 < 0.01 < 0.01
Dibenz(a,h)anthracene µg/l 0.01 24 0.01 0.01 0.01 - 0 < 0.01 < 0.01 < 0.01 < 0.01 < 0.01 < 0.01 < 0.01 < 0.01 < 0.01 < 0.01 < 0.01 < 0.01 < 0.01 < 0.01 < 0.01 < 0.01 < 0.01 < 0.01 < 0.01 < 0.01 < 0.01 < 0.01 < 0.01 < 0.01
Benzo(ghi)perylene µg/l 0.01 24 0.01 0.01 0.01 0.002 24 < 0.01 < 0.01 < 0.01 < 0.01 < 0.01 < 0.01 < 0.01 < 0.01 < 0.01 < 0.01 < 0.01 < 0.01 < 0.01 < 0.01 < 0.01 < 0.01 < 0.01 < 0.01 < 0.01 < 0.01 < 0.01 < 0.01 < 0.01 < 0.01
Total EPA-16 PAHs µg/l 0.2 24 0.29 0.01 0.04125 0 < 0.01 < 0.01 < 0.01 < 0.01 0.03 0.06 0.10 0.29 < 0.01 0.20 < 0.01 0.03 0.03 < 0.01 < 0.01 < 0.01 < 0.01 0.02 < 0.01 0.04 0.04 0.02 < 0.01 < 0.01
Arsenic (dissolved) µg/l 0.2 24 110 2.7 23.7875 10 12 11 7.3 3.9 2.7 64 66 5.1 24 95 110 43 29 11 11 11 9.2 13 9.4 7.5 5.4 10 7.3 7.5 7.6
Boron (dissolved) mg/l 0.01 24 3.7 0.01 0.7983333 1 6 0.03 < 0.01 0.18 < 0.01 3.7 2.2 0.32 1.3 2 2 0.27 0.13 1.4 0.94 0.73 0.52 0.76 0.35 0.72 0.67 0.41 0.14 0.27 0.1
Cadmium (dissolved) µg/l 0.02 24 0.09 0.02 0.0366667 5 0 < 0.02 < 0.02 < 0.02 < 0.02 < 0.02 0.07 < 0.02 < 0.02 0.09 0.09 0.02 0.04 0.03 0.09 0.04 0.04 0.03 0.05 0.04 0.02 0.02 < 0.02 < 0.02 0.03
Chromium (dissolved) µg/l 1 24 19 3 7.2916667 50 0 6 3 5 4 16 14 4 10 19 17 7 6 5 5 6 5 6 4 9 6 6 3 5 4
Copper (dissolved) µg/l 0.5 24 47 0.5 8.5041667 2000 0 < 0.5 1.1 < 0.5 2.9 19 23 1.6 12 30 47 1.6 8.4 6 9.6 5.5 9.6 < 0.5 7.4 1.3 4.7 1.7 4.5 1.6 4.1
Lead (dissolved) µg/l 0.3 24 3.7 0.3 0.5458333 10 0 < 0.3 0.7 < 0.3 1.4 < 0.3 < 0.3 < 0.3 < 0.3 < 0.3 < 0.3 < 0.3 0.5 < 0.3 < 0.3 < 0.3 3.7 < 0.3 0.4 < 0.3 0.7 < 0.3 0.5 < 0.3 0.4
Mercury (dissolved) µg/L 0.05 24 0.46 0.05 0.095 10 0 < 0.05 < 0.05 < 0.05 < 0.05 < 0.05 0.46 0.29 0.14 < 0.05 < 0.05 < 0.05 0.10 < 0.05 0.14 < 0.05 < 0.05 < 0.05 < 0.05 < 0.05 0.25 < 0.05 < 0.05 < 0.05 < 0.05
Nickel (dissolved) µg/l 0.5 24 240 3 28.583333 20 6 4 4 4 4 5 7 3 5 21 20 240 210 45 29 4 4 6 9 6 7 6 6 16 21
Zinc (dissolved) µg/l 2 24 85 2 11.583333 125 0 4 3 4 5 3 4 < 2 < 2 8 9 85 65 16 31 3 6 4 3 3 3 < 2 2 6 5
Calcium mg/l 0.1 24 520 40 182.20833 - 0 90 91 72 71 42 40 100 75 340 520 110 150 520 410 110 120 130 210 86 76 250 250 240 270
Magnesium mg/l 0.1 24 910 18 187.5 - 0 18 18 32 33 350 290 52 160 910 880 73 110 390 290 110 100 140 100 37 36 91 100 91 89
Selenium (dissolved) µg/l 0.5 24 93 2.3 35.25 10 19 2.3 2.6 7.8 9.3 88 93 10 69 48 56 21 33 53 48 39 41 48 42 16 17 27 31 18 26
Potassium mg/l 0.1 24 250 4.3 67.654167 - 0 4.4 4.3 18 19 150 120 30 93 250 220 39 57 87 82 65 68 74 52 34 40 30 30 27 30
Sodium mg/l 0.1 24 5600 46 1201 200 22 48 46 240 210 3700 2400 340 1400 5600 4700 530 780 880 930 1100 1000 1300 820 500 430 550 490 410 420
Cresols µg/l 0.5 24 19 0.5 1.4708333 - 0 < 0.5 < 0.5 < 0.5 < 0.5 2.3 1.8 19 2.2 < 0.5 < 0.5 < 0.5 < 0.5 < 0.5 < 0.5 < 0.5 < 0.5 < 0.5 < 0.5 < 0.5 < 0.5 < 0.5 < 0.5 < 0.5 < 0.5
Phenol µg/l 0.5 24 6.9 0.5 0.7875 7.7 0 < 0.5 < 0.5 < 0.5 < 0.5 < 0.5 1.0 < 0.5 6.9 < 0.5 < 0.5 < 0.5 < 0.5 < 0.5 < 0.5 < 0.5 < 0.5 < 0.5 < 0.5 < 0.5 < 0.5 < 0.5 < 0.5 < 0.5 < 0.5
Xylenols µg/l 0.5 24 0.5 0.5 0.5 - 0 < 0.5 < 0.5 < 0.5 < 0.5 < 0.5 < 0.5 < 0.5 < 0.5 < 0.5 < 0.5 < 0.5 < 0.5 < 0.5 < 0.5 < 0.5 < 0.5 < 0.5 < 0.5 < 0.5 < 0.5 < 0.5 < 0.5 < 0.5 < 0.5
Total Phenols µg/l 0.5 24 19 0.5 1.7958333 - 0 < 0.5 < 0.5 < 0.5 < 0.5 2.3 2.7 19 9.1 < 0.5 < 0.5 < 0.5 < 0.5 < 0.5 < 0.5 < 0.5 < 0.5 < 0.5 < 0.5 < 0.5 < 0.5 < 0.5 < 0.5 < 0.5 < 0.5
Benzene µg/l 1 24 1 1 1 10 0 < 1 < 1 < 1 < 1 < 1 < 1 < 1 < 1 < 1 < 1 < 1 < 1 < 1 < 1 < 1 < 1 < 1 < 1 < 1 < 1 < 1 < 1 < 1 < 1
Toluene µg/l 1 24 2 1 1.0416667 40 0 < 1 < 1 < 1 < 1 < 1 2 < 1 < 1 < 1 < 1 < 1 < 1 < 1 < 1 < 1 < 1 < 1 < 1 < 1 < 1 < 1 < 1 < 1 < 1
Ethylbenzene µg/l 1 24 1 1 1 - 0 < 1 < 1 < 1 < 1 < 1 < 1 < 1 < 1 < 1 < 1 < 1 < 1 < 1 < 1 < 1 < 1 < 1 < 1 < 1 < 1 < 1 < 1 < 1 < 1
p & m-xylene µg/l 1 24 1 1 1 30 0 < 1 < 1 < 1 < 1 < 1 < 1 < 1 < 1 < 1 < 1 < 1 < 1 < 1 < 1 < 1 < 1 < 1 < 1 < 1 < 1 < 1 < 1 < 1 < 1
o-xylene µg/l 1 24 1 1 1 30 0 < 1 < 1 < 1 < 1 < 1 < 1 < 1 < 1 < 1 < 1 < 1 < 1 < 1 < 1 < 1 < 1 < 1 < 1 < 1 < 1 < 1 < 1 < 1 < 1
MTBE (Methyl Tertiary Butyl Ether) µg/l 1 22 1 1 1 - 0 < 1 < 1 < 1 < 1 < 1 < 1 < 1 < 1 < 1 < 1 < 1 < 1 < 1 < 1 < 1 < 1 < 1 < 1 < 1 < 1 < 1 < 1
TPH (C10-C35) mg/l 0.01 24 0.03 0.01 0.0108333 - 0 < 0.01 < 0.01 < 0.01 < 0.01 < 0.01 < 0.01 0.03 < 0.01 < 0.01 < 0.01 < 0.01 < 0.01 < 0.01 < 0.01 < 0.01 < 0.01 0.01 < 0.01 < 0.01 < 0.01 < 0.01 < 0.01 < 0.01 < 0.01
TPH (C35-C40) mg/l 0.01 24 0.01 0.01 0.01 - 0 < 0.01 < 0.01 < 0.01 < 0.01 < 0.01 < 0.01 < 0.01 < 0.01 < 0.01 < 0.01 < 0.01 < 0.01 < 0.01 < 0.01 < 0.01 < 0.01 < 0.01 < 0.01 < 0.01 < 0.01 < 0.01 < 0.01 < 0.01 < 0.01
TPH - Aliphatic C5 - C6 mg/l 0.01 24 0.01 0.01 0.01 10 0 < 0.01 < 0.01 < 0.01 < 0.01 < 0.01 < 0.01 < 0.01 < 0.01 < 0.01 < 0.01 < 0.01 < 0.01 < 0.01 < 0.01 < 0.01 < 0.01 < 0.01 < 0.01 < 0.01 < 0.01 < 0.01 < 0.01 < 0.01 < 0.01
TPH - Aliphatic C6 - C8 mg/l 0.01 24 0.01 0.01 0.01 10 0 < 0.01 < 0.01 < 0.01 < 0.01 < 0.01 < 0.01 < 0.01 < 0.01 < 0.01 < 0.01 < 0.01 < 0.01 < 0.01 < 0.01 < 0.01 < 0.01 < 0.01 < 0.01 < 0.01 < 0.01 < 0.01 < 0.01 < 0.01 < 0.01
TPH - Aliphatic C8 - C10 mg/l 0.01 24 0.01 0.01 0.01 10 0 < 0.01 < 0.01 < 0.01 < 0.01 < 0.01 < 0.01 < 0.01 < 0.01 < 0.01 < 0.01 < 0.01 < 0.01 < 0.01 < 0.01 < 0.01 < 0.01 < 0.01 < 0.01 < 0.01 < 0.01 < 0.01 < 0.01 < 0.01 < 0.01
TPH-DW - Aliphatic C10 - C12 mg/l 0.01 24 0.01 0.01 0.01 10 0 < 0.01 < 0.01 < 0.01 < 0.01 < 0.01 < 0.01 < 0.01 < 0.01 < 0.01 < 0.01 < 0.01 < 0.01 < 0.01 < 0.01 < 0.01 < 0.01 < 0.01 < 0.01 < 0.01 < 0.01 < 0.01 < 0.01 < 0.01 < 0.01
TPH-DW - Aliphatic C12 - C16 mg/l 0.01 24 0.01 0.01 0.01 10 0 < 0.01 < 0.01 < 0.01 < 0.01 < 0.01 < 0.01 < 0.01 < 0.01 < 0.01 < 0.01 < 0.01 < 0.01 < 0.01 < 0.01 < 0.01 < 0.01 < 0.01 < 0.01 < 0.01 < 0.01 < 0.01 < 0.01 < 0.01 < 0.01
TPH-DW - Aliphatic C16 - C21 mg/l 0.01 24 0.01 0.01 0.01 10 0 < 0.01 < 0.01 < 0.01 < 0.01 < 0.01 < 0.01 < 0.01 < 0.01 < 0.01 < 0.01 < 0.01 < 0.01 < 0.01 < 0.01 < 0.01 < 0.01 < 0.01 < 0.01 < 0.01 < 0.01 < 0.01 < 0.01 < 0.01 < 0.01
TPH-DW - Aliphatic C21 - C35 mg/l 0.01 24 0.01 0.01 0.01 10 0 < 0.01 < 0.01 < 0.01 < 0.01 < 0.01 < 0.01 < 0.01 < 0.01 < 0.01 < 0.01 < 0.01 < 0.01 < 0.01 < 0.01 < 0.01 < 0.01 < 0.01 < 0.01 < 0.01 < 0.01 < 0.01 < 0.01 < 0.01 < 0.01
TPH - Aromatic C6 - C7 mg/l 0.01 24 0.01 0.01 0.01 10 0 < 0.01 < 0.01 < 0.01 < 0.01 < 0.01 < 0.01 < 0.01 < 0.01 < 0.01 < 0.01 < 0.01 < 0.01 < 0.01 < 0.01 < 0.01 < 0.01 < 0.01 < 0.01 < 0.01 < 0.01 < 0.01 < 0.01 < 0.01 < 0.01
TPH - Aromatic C7 - C8 mg/l 0.01 24 0.01 0.01 0.01 10 0 < 0.01 < 0.01 < 0.01 < 0.01 < 0.01 < 0.01 < 0.01 < 0.01 < 0.01 < 0.01 < 0.01 < 0.01 < 0.01 < 0.01 < 0.01 < 0.01 < 0.01 < 0.01 < 0.01 < 0.01 < 0.01 < 0.01 < 0.01 < 0.01
TPH - Aromatic C8 - C10 mg/l 0.01 24 0.01 0.01 0.01 10 0 < 0.01 < 0.01 < 0.01 < 0.01 < 0.01 < 0.01 < 0.01 < 0.01 < 0.01 < 0.01 < 0.01 < 0.01 < 0.01 < 0.01 < 0.01 < 0.01 < 0.01 < 0.01 < 0.01 < 0.01 < 0.01 < 0.01 < 0.01 < 0.01
TPH-DW - Aromatic C10 - C12 mg/l 0.01 24 0.01 0.01 0.01 10 0 < 0.01 < 0.01 < 0.01 < 0.01 < 0.01 < 0.01 < 0.01 < 0.01 < 0.01 < 0.01 < 0.01 < 0.01 < 0.01 < 0.01 < 0.01 < 0.01 < 0.01 < 0.01 < 0.01 < 0.01 < 0.01 < 0.01 < 0.01 < 0.01
TPH-DW - Aromatic C12 - C16 mg/l 0.01 24 0.01 0.01 0.01 10 0 < 0.01 < 0.01 < 0.01 < 0.01 < 0.01 < 0.01 < 0.01 < 0.01 < 0.01 < 0.01 < 0.01 < 0.01 < 0.01 < 0.01 < 0.01 < 0.01 < 0.01 < 0.01 < 0.01 < 0.01 < 0.01 < 0.01 < 0.01 < 0.01
TPH-DW - Aromatic C16 - C21 mg/l 0.01 24 0.01 0.01 0.01 10 0 < 0.01 < 0.01 < 0.01 < 0.01 < 0.01 < 0.01 < 0.01 < 0.01 < 0.01 < 0.01 < 0.01 < 0.01 < 0.01 < 0.01 < 0.01 < 0.01 < 0.01 < 0.01 < 0.01 < 0.01 < 0.01 < 0.01 < 0.01 < 0.01
TPH-DW - Aromatic C21 - C35 mg/l 0.01 24 0.01 0.01 0.01 10 0 < 0.01 < 0.01 < 0.01 < 0.01 < 0.01 < 0.01 < 0.01 < 0.01 < 0.01 < 0.01 < 0.01 < 0.01 < 0.01 < 0.01 < 0.01 < 0.01 < 0.01 < 0.01 < 0.01 < 0.01 < 0.01 < 0.01 < 0.01 < 0.01
Metazachlor µg/l 0.1 22 0.1 0.1 0.1 0.1 0 < 0.1 < 0.1 < 0.1 < 0.1 < 0.1 < 0.1 < 0.1 < 0.1 < 0.1 < 0.1 < 0.1 < 0.1 < 0.1 < 0.1 - < 0.10 - < 0.10 < 0.1 < 0.1 < 0.1 < 0.1 < 0.1 < 0.1
AA-EQS Inland Surface Waters (Water Framework Directive)
EU Standard Drinking Water Directive
Goxhill Paull
Monoaromatics
Petroleum Hydrocarbons
Trace Organics
Herbicides
General Inorganics
Speciated PAHs
Total PAH
Heavy Metals / Metalloids
Phenols (Speciated)
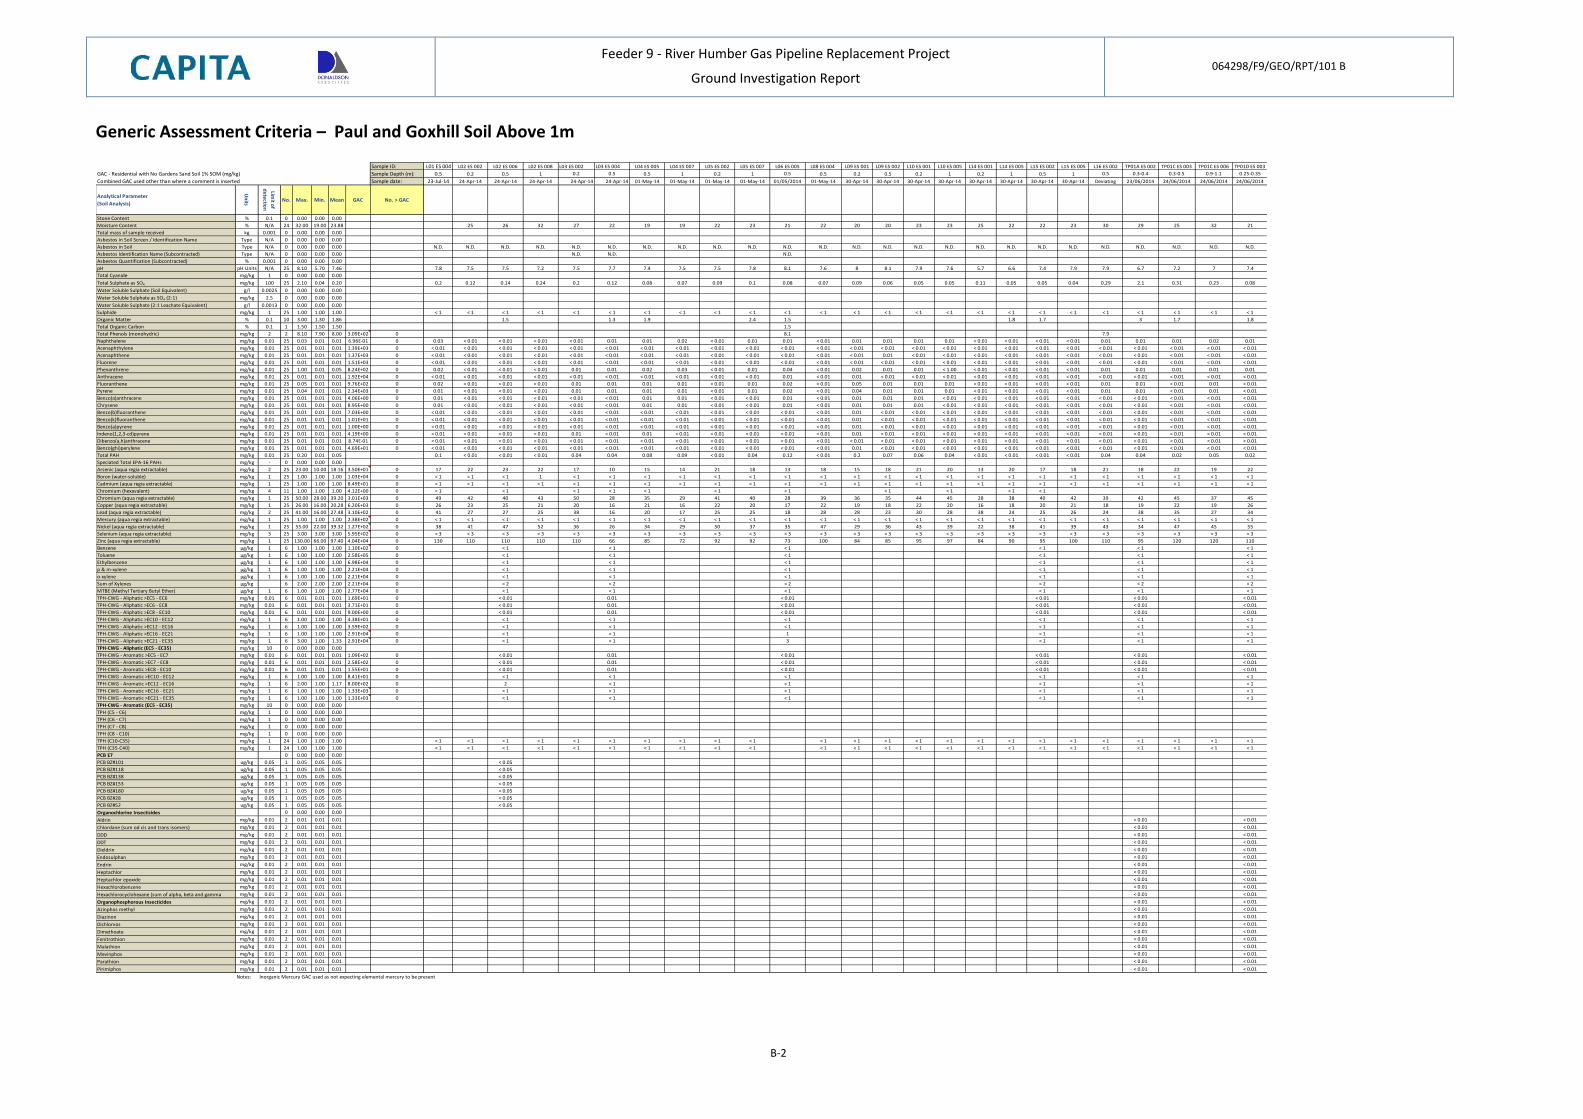
Feeder 9 - River Humber Gas Pipeline Replacement Project
Ground Investigation Report 064298/F9/GEO/RPT/101 B
B-2
Generic Assessment Criteria – Paul and Goxhill Soil Above 1m
Sample ID: L01 ES 004 L02 ES 002 L02 ES 006 L02 ES 008 L03 ES 002 L03 ES 004 L04 ES 005 L04 ES 007 L05 ES 002 L05 ES 007 L06 ES 005 L08 ES 004 L09 ES 001 L09 ES 002 L10 ES 001 L10 ES 005 L14 ES 001 L14 ES 005 L15 ES 002 L15 ES 005 L16 ES 002 TP01A ES 002 TP01C ES 003 TP01C ES 006 TP01D ES 003
Sample Depth (m): 0.5 0.2 0.5 1 0.2 0.5 0.5 1 0.2 1 0.5 0.5 0.2 0.5 0.2 1 0.2 1 0.5 1 0.5 0.3-0.4 0.3-0.5 0.9-1.1 0.25-0.35
Combined GAC used other than where a comment is inserted Sample date: 23-Jul-14 24-Apr-14 24-Apr-14 24-Apr-14 24-Apr-14 24-Apr-14 01-May-14 01-May-14 01-May-14 01-May-14 01/05/2014 01-May-14 30-Apr-14 30-Apr-14 30-Apr-14 30-Apr-14 30-Apr-14 30-Apr-14 30-Apr-14 30-Apr-14 Deviating 23/06/2014 24/06/2014 24/06/2014 24/06/2014
Analytical Parameter
(Soil Analysis)
Un
its
Limit o
f
detectio
n
No. Max. Min. Mean GAC No. > GAC
Stone Content % 0.1 0 0.00 0.00 0.00
Moisture Content % N/A 24 32.00 19.00 23.88 25 26 32 27 22 19 19 22 23 21 22 20 20 23 23 25 22 22 23 30 29 25 32 21
Total mass of sample received kg 0.001 0 0.00 0.00 0.00
Asbestos in Soil Screen / Identification Name Type N/A 0 0.00 0.00 0.00
Asbestos in Soil Type N/A 0 0.00 0.00 0.00 N.D. N.D. N.D. N.D. N.D. N.D. N.D. N.D. N.D. N.D. N.D. N.D. N.D. N.D. N.D. N.D. N.D. N.D. N.D. N.D. N.D. N.D. N.D. N.D. N.D.
Asbestos Identification Name (Subcontracted) Type N/A 0 0.00 0.00 0.00 N.D. N.D. N.D.
Asbestos Quantification (Subcontracted) % 0.001 0 0.00 0.00 0.00
pH pH Units N/A 25 8.10 5.70 7.46 7.8 7.5 7.5 7.2 7.5 7.7 7.4 7.5 7.5 7.8 8.1 7.6 8 8.1 7.9 7.6 5.7 6.6 7.4 7.9 7.9 6.7 7.2 7 7.4
Total Cyanide mg/kg 1 0 0.00 0.00 0.00
Total Sulphate as SO4 mg/kg 100 25 2.10 0.04 0.20 0.2 0.12 0.14 0.24 0.2 0.12 0.08 0.07 0.09 0.1 0.08 0.07 0.09 0.06 0.05 0.05 0.11 0.05 0.05 0.04 0.29 2.1 0.31 0.23 0.08
Water Soluble Sulphate (Soil Equivalent) g/l 0.0025 0 0.00 0.00 0.00
Water Soluble Sulphate as SO4 (2:1) mg/kg 2.5 0 0.00 0.00 0.00
Water Soluble Sulphate (2:1 Leachate Equivalent) g/l 0.0013 0 0.00 0.00 0.00
Sulphide mg/kg 1 25 1.00 1.00 1.00 < 1 < 1 < 1 < 1 < 1 < 1 < 1 < 1 < 1 < 1 < 1 < 1 < 1 < 1 < 1 < 1 < 1 < 1 < 1 < 1 < 1 < 1 < 1 < 1 < 1
Organic Matter % 0.1 10 3.00 1.30 1.86 1.5 1.3 1.9 2.4 1.5 1.8 1.7 3 1.7 1.8
Total Organic Carbon % 0.1 1 1.50 1.50 1.50 1.5
Total Phenols (monohydric) mg/kg 2 2 8.10 7.90 8.00 3.09E+02 0 8.1 7.9
Naphthalene mg/kg 0.01 25 0.03 0.01 0.01 6.96E-01 0 0.03 < 0.01 < 0.01 < 0.01 < 0.01 0.01 0.01 0.02 < 0.01 0.01 0.01 < 0.01 0.01 0.01 0.01 0.01 < 0.01 < 0.01 < 0.01 < 0.01 0.01 0.01 0.01 0.02 0.01
Acenaphthylene mg/kg 0.01 25 0.01 0.01 0.01 1.39E+03 0 < 0.01 < 0.01 < 0.01 < 0.01 < 0.01 < 0.01 < 0.01 < 0.01 < 0.01 < 0.01 < 0.01 < 0.01 < 0.01 < 0.01 < 0.01 < 0.01 < 0.01 < 0.01 < 0.01 < 0.01 < 0.01 < 0.01 < 0.01 < 0.01 < 0.01
Acenaphthene mg/kg 0.01 25 0.01 0.01 0.01 1.37E+03 0 < 0.01 < 0.01 < 0.01 < 0.01 < 0.01 < 0.01 < 0.01 < 0.01 < 0.01 < 0.01 < 0.01 < 0.01 < 0.01 0.01 < 0.01 < 0.01 < 0.01 < 0.01 < 0.01 < 0.01 < 0.01 < 0.01 < 0.01 < 0.01 < 0.01
Fluorene mg/kg 0.01 25 0.01 0.01 0.01 1.51E+03 0 < 0.01 < 0.01 < 0.01 < 0.01 < 0.01 < 0.01 < 0.01 < 0.01 < 0.01 < 0.01 < 0.01 < 0.01 < 0.01 < 0.01 < 0.01 < 0.01 < 0.01 < 0.01 < 0.01 < 0.01 < 0.01 < 0.01 < 0.01 < 0.01 < 0.01
Phenanthrene mg/kg 0.01 25 1.00 0.01 0.05 8.24E+02 0 0.02 < 0.01 < 0.01 < 0.01 0.01 0.01 0.02 0.03 < 0.01 0.01 0.04 < 0.01 0.02 0.01 0.01 < 1.00 < 0.01 < 0.01 < 0.01 < 0.01 0.01 0.01 0.01 0.01 0.01
Anthracene mg/kg 0.01 25 0.01 0.01 0.01 1.92E+04 0 < 0.01 < 0.01 < 0.01 < 0.01 < 0.01 < 0.01 < 0.01 < 0.01 < 0.01 < 0.01 0.01 < 0.01 0.01 < 0.01 < 0.01 < 0.01 < 0.01 < 0.01 < 0.01 < 0.01 < 0.01 < 0.01 < 0.01 < 0.01 < 0.01
Fluoranthene mg/kg 0.01 25 0.05 0.01 0.01 9.76E+02 0 0.02 < 0.01 < 0.01 < 0.01 0.01 0.01 0.01 0.01 < 0.01 0.01 0.02 < 0.01 0.05 0.01 0.01 0.01 < 0.01 < 0.01 < 0.01 < 0.01 0.01 0.01 < 0.01 0.01 < 0.01
Pyrene mg/kg 0.01 25 0.04 0.01 0.01 2.34E+03 0 0.01 < 0.01 < 0.01 < 0.01 0.01 0.01 0.01 0.01 < 0.01 0.01 0.02 < 0.01 0.04 0.01 0.01 0.01 < 0.01 < 0.01 < 0.01 < 0.01 0.01 0.01 < 0.01 0.01 < 0.01
Benzo(a)anthracene mg/kg 0.01 25 0.01 0.01 0.01 4.06E+00 0 0.01 < 0.01 < 0.01 < 0.01 < 0.01 < 0.01 0.01 0.01 < 0.01 < 0.01 0.01 < 0.01 0.01 0.01 0.01 < 0.01 < 0.01 < 0.01 < 0.01 < 0.01 < 0.01 < 0.01 < 0.01 < 0.01 < 0.01
Chrysene mg/kg 0.01 25 0.01 0.01 0.01 8.95E+00 0 0.01 < 0.01 < 0.01 < 0.01 < 0.01 < 0.01 0.01 0.01 < 0.01 < 0.01 0.01 < 0.01 0.01 0.01 0.01 < 0.01 < 0.01 < 0.01 < 0.01 < 0.01 < 0.01 < 0.01 < 0.01 < 0.01 < 0.01
Benzo(b)fluoranthene mg/kg 0.01 25 0.01 0.01 0.01 7.03E+00 0 < 0.01 < 0.01 < 0.01 < 0.01 < 0.01 < 0.01 < 0.01 < 0.01 < 0.01 < 0.01 < 0.01 < 0.01 0.01 < 0.01 < 0.01 < 0.01 < 0.01 < 0.01 < 0.01 < 0.01 < 0.01 < 0.01 < 0.01 < 0.01 < 0.01
Benzo(k)fluoranthene mg/kg 0.01 25 0.01 0.01 0.01 1.01E+01 0 < 0.01 < 0.01 < 0.01 < 0.01 < 0.01 < 0.01 < 0.01 < 0.01 < 0.01 < 0.01 < 0.01 < 0.01 0.01 < 0.01 < 0.01 < 0.01 < 0.01 < 0.01 < 0.01 < 0.01 < 0.01 < 0.01 < 0.01 < 0.01 < 0.01
Benzo(a)pyrene mg/kg 0.01 25 0.01 0.01 0.01 1.00E+00 0 < 0.01 < 0.01 < 0.01 < 0.01 < 0.01 < 0.01 < 0.01 < 0.01 < 0.01 < 0.01 < 0.01 < 0.01 0.01 < 0.01 < 0.01 < 0.01 < 0.01 < 0.01 < 0.01 < 0.01 < 0.01 < 0.01 < 0.01 < 0.01 < 0.01
Indeno(1,2,3-cd)pyrene mg/kg 0.01 25 0.01 0.01 0.01 4.19E+00 0 < 0.01 < 0.01 < 0.01 < 0.01 0.01 < 0.01 0.01 < 0.01 < 0.01 < 0.01 < 0.01 < 0.01 0.01 < 0.01 < 0.01 < 0.01 < 0.01 < 0.01 < 0.01 < 0.01 < 0.01 < 0.01 < 0.01 < 0.01 < 0.01
Dibenzo(a,h)anthracene mg/kg 0.01 25 0.01 0.01 0.01 8.74E-01 0 < 0.01 < 0.01 < 0.01 < 0.01 < 0.01 < 0.01 < 0.01 < 0.01 < 0.01 < 0.01 < 0.01 < 0.01 < 0.01 < 0.01 < 0.01 < 0.01 < 0.01 < 0.01 < 0.01 < 0.01 < 0.01 < 0.01 < 0.01 < 0.01 < 0.01
Benzo(ghi)perylene mg/kg 0.01 25 0.01 0.01 0.01 4.69E+01 0 < 0.01 < 0.01 < 0.01 < 0.01 < 0.01 < 0.01 < 0.01 < 0.01 < 0.01 < 0.01 < 0.01 < 0.01 0.01 < 0.01 < 0.01 < 0.01 < 0.01 < 0.01 < 0.01 < 0.01 < 0.01 < 0.01 < 0.01 < 0.01 < 0.01
Total PAH mg/kg 0.01 25 0.20 0.01 0.05 0.1 < 0.01 < 0.01 < 0.01 0.04 0.04 0.08 0.09 < 0.01 0.04 0.12 < 0.01 0.2 0.07 0.06 0.04 < 0.01 < 0.01 < 0.01 < 0.01 0.04 0.04 0.02 0.05 0.02
Speciated Total EPA-16 PAHs mg/kg - 0 0.00 0.00 0.00
Arsenic (aqua regia extractable) mg/kg 2 25 23.00 10.00 18.16 3.50E+01 0 17 22 23 22 17 10 15 14 21 18 13 18 15 18 21 20 13 20 17 18 21 18 22 19 22
Boron (water-soluble) mg/kg 1 25 1.00 1.00 1.00 1.03E+04 0 < 1 < 1 < 1 1 < 1 < 1 < 1 < 1 < 1 < 1 < 1 < 1 < 1 < 1 < 1 < 1 < 1 < 1 < 1 < 1 < 1 < 1 < 1 < 1 < 1
Cadmium (aqua regia extractable) mg/kg 1 25 1.00 1.00 1.00 8.49E+01 0 < 1 < 1 < 1 < 1 < 1 < 1 < 1 < 1 < 1 < 1 < 1 < 1 < 1 < 1 < 1 < 1 < 1 < 1 < 1 < 1 < 1 < 1 < 1 < 1 < 1
Chromium (hexavalent) mg/kg 4 11 1.00 1.00 1.00 4.12E+00 0 < 1 < 1 < 1 < 1 < 1 < 1 < 1 < 1 < 1 < 1 < 1
Chromium (aqua regia extractable) mg/kg 1 25 50.00 28.00 39.20 3.01E+03 0 49 42 40 43 50 28 35 29 41 40 28 39 36 35 44 45 28 38 40 42 39 42 45 37 45
Copper (aqua regia extractable) mg/kg 1 25 26.00 16.00 20.28 6.20E+03 0 26 23 25 21 20 16 21 16 22 20 17 22 19 18 22 20 16 18 20 21 18 19 22 19 26
Lead (aqua regia extractable) mg/kg 2 25 41.00 16.00 27.48 3.10E+02 0 41 27 27 25 38 16 20 17 25 25 18 28 28 23 30 28 38 24 25 26 24 38 35 27 34
Mercury (aqua regia extractable) mg/kg 1 25 1.00 1.00 1.00 2.38E+02 0 < 1 < 1 < 1 < 1 < 1 < 1 < 1 < 1 < 1 < 1 < 1 < 1 < 1 < 1 < 1 < 1 < 1 < 1 < 1 < 1 < 1 < 1 < 1 < 1 < 1
Nickel (aqua regia extractable) mg/kg 1 25 55.00 22.00 39.32 1.27E+02 0 38 41 47 52 36 26 34 29 50 37 35 47 29 36 43 39 22 38 41 39 43 34 47 45 55
Selenium (aqua regia extractable) mg/kg 3 25 3.00 3.00 3.00 5.95E+02 0 < 3 < 3 < 3 < 3 < 3 < 3 < 3 < 3 < 3 < 3 < 3 < 3 < 3 < 3 < 3 < 3 < 3 < 3 < 3 < 3 < 3 < 3 < 3 < 3 < 3
Zinc (aqua regia extractable) mg/kg 1 25 130.00 66.00 97.40 4.04E+04 0 130 110 110 110 110 66 85 72 92 92 73 100 84 85 95 97 84 90 95 100 110 95 120 120 110
Benzene µg/kg 1 6 1.00 1.00 1.00 1.10E+02 0 < 1 < 1 < 1 < 1 < 1 < 1
Toluene µg/kg 1 6 1.00 1.00 1.00 2.58E+05 0 < 1 < 1 < 1 < 1 < 1 < 1
Ethylbenzene µg/kg 1 6 1.00 1.00 1.00 6.98E+04 0 < 1 < 1 < 1 < 1 < 1 < 1
p & m-xylene µg/kg 1 6 1.00 1.00 1.00 2.21E+04 0 < 1 < 1 < 1 < 1 < 1 < 1
o-xylene µg/kg 1 6 1.00 1.00 1.00 2.21E+04 0 < 1 < 1 < 1 < 1 < 1 < 1
Sum of Xylenes µg/kg 6 2.00 2.00 2.00 2.21E+04 0 < 2 < 2 < 2 < 2 < 2 < 2
MTBE (Methyl Tertiary Butyl Ether) µg/kg 1 6 1.00 1.00 1.00 2.77E+04 0 < 1 < 1 < 1 < 1 < 1 < 1
TPH-CWG - Aliphatic >EC5 - EC6 mg/kg 0.01 6 0.01 0.01 0.01 1.69E+01 0 < 0.01 0.01 < 0.01 < 0.01 < 0.01 < 0.01
TPH-CWG - Aliphatic >EC6 - EC8 mg/kg 0.01 6 0.01 0.01 0.01 3.71E+01 0 < 0.01 0.01 < 0.01 < 0.01 < 0.01 < 0.01
TPH-CWG - Aliphatic >EC8 - EC10 mg/kg 0.01 6 0.01 0.01 0.01 9.00E+00 0 < 0.01 0.01 < 0.01 < 0.01 < 0.01 < 0.01
TPH-CWG - Aliphatic >EC10 - EC12 mg/kg 1 6 1.00 1.00 1.00 4.38E+01 0 < 1 < 1 < 1 < 1 < 1 < 1
TPH-CWG - Aliphatic >EC12 - EC16 mg/kg 1 6 1.00 1.00 1.00 3.59E+02 0 < 1 < 1 < 1 < 1 < 1 < 1
TPH-CWG - Aliphatic >EC16 - EC21 mg/kg 1 6 1.00 1.00 1.00 2.91E+04 0 < 1 < 1 1 < 1 < 1 < 1
TPH-CWG - Aliphatic >EC21 - EC35 mg/kg 1 6 3.00 1.00 1.33 2.91E+04 0 < 1 < 1 3 < 1 < 1 < 1
TPH-CWG - Aliphatic (EC5 - EC35) mg/kg 10 0 0.00 0.00 0.00
TPH-CWG - Aromatic >EC5 - EC7 mg/kg 0.01 6 0.01 0.01 0.01 1.09E+02 0 < 0.01 0.01 < 0.01 < 0.01 < 0.01 < 0.01
TPH-CWG - Aromatic >EC7 - EC8 mg/kg 0.01 6 0.01 0.01 0.01 2.58E+02 0 < 0.01 0.01 < 0.01 < 0.01 < 0.01 < 0.01
TPH-CWG - Aromatic >EC8 - EC10 mg/kg 0.01 6 0.01 0.01 0.01 1.55E+01 0 < 0.01 0.01 < 0.01 < 0.01 < 0.01 < 0.01
TPH-CWG - Aromatic >EC10 - EC12 mg/kg 1 6 1.00 1.00 1.00 8.41E+01 0 < 1 < 1 < 1 < 1 < 1 < 1
TPH-CWG - Aromatic >EC12 - EC16 mg/kg 1 6 2.00 1.00 1.17 8.00E+02 0 2 < 1 < 1 < 1 < 1 < 1
TPH-CWG - Aromatic >EC16 - EC21 mg/kg 1 6 1.00 1.00 1.00 1.33E+03 0 < 1 < 1 < 1 < 1 < 1 < 1
TPH-CWG - Aromatic >EC21 - EC35 mg/kg 1 6 1.00 1.00 1.00 1.33E+03 0 < 1 < 1 < 1 < 1 < 1 < 1
TPH-CWG - Aromatic (EC5 - EC35) mg/kg 10 0 0.00 0.00 0.00
TPH (C5 - C6) mg/kg 1 0 0.00 0.00 0.00
TPH (C6 - C7) mg/kg 1 0 0.00 0.00 0.00
TPH (C7 - C8) mg/kg 1 0 0.00 0.00 0.00
TPH (C8 - C10) mg/kg 1 0 0.00 0.00 0.00
TPH (C10-C35) mg/kg 1 24 1.00 1.00 1.00 < 1 < 1 < 1 < 1 < 1 < 1 < 1 < 1 < 1 < 1 < 1 < 1 < 1 < 1 < 1 < 1 < 1 < 1 < 1 < 1 < 1 < 1 < 1 < 1
TPH (C35-C40) mg/kg 1 24 1.00 1.00 1.00 < 1 < 1 < 1 < 1 < 1 < 1 < 1 < 1 < 1 < 1 < 1 < 1 < 1 < 1 < 1 < 1 < 1 < 1 < 1 < 1 < 1 < 1 < 1 < 1
PCB E7 0 0.00 0.00 0.00
PCB BZ#101 ug/kg 0.05 1 0.05 0.05 0.05 < 0.05
PCB BZ#118 ug/kg 0.05 1 0.05 0.05 0.05 < 0.05
PCB BZ#138 ug/kg 0.05 1 0.05 0.05 0.05 < 0.05
PCB BZ#153 ug/kg 0.05 1 0.05 0.05 0.05 < 0.05
PCB BZ#180 ug/kg 0.05 1 0.05 0.05 0.05 < 0.05
PCB BZ#28 ug/kg 0.05 1 0.05 0.05 0.05 < 0.05
PCB BZ#52 ug/kg 0.05 1 0.05 0.05 0.05 < 0.05
Organochlorine Insecticides 0 0.00 0.00 0.00
Aldrin mg/kg 0.01 2 0.01 0.01 0.01 < 0.01 < 0.01
Chlordane (sum od cis and trans isomers) mg/kg 0.01 2 0.01 0.01 0.01 < 0.01 < 0.01
DDD mg/kg 0.01 2 0.01 0.01 0.01 < 0.01 < 0.01
DDT mg/kg 0.01 2 0.01 0.01 0.01 < 0.01 < 0.01
Dieldrin mg/kg 0.01 2 0.01 0.01 0.01 < 0.01 < 0.01
Endosulphan mg/kg 0.01 2 0.01 0.01 0.01 < 0.01 < 0.01
Endrin mg/kg 0.01 2 0.01 0.01 0.01 < 0.01 < 0.01
Heptachlor mg/kg 0.01 2 0.01 0.01 0.01 < 0.01 < 0.01
Heptachlor epoxide mg/kg 0.01 2 0.01 0.01 0.01 < 0.01 < 0.01
Hexachlorobenzene mg/kg 0.01 2 0.01 0.01 0.01 < 0.01 < 0.01
Hexachlorocyclohexane (sum of alpha, beta and gamma mg/kg 0.01 2 0.01 0.01 0.01 < 0.01 < 0.01
Organophosphorous Insecticides mg/kg 0.01 2 0.01 0.01 0.01 < 0.01 < 0.01
Azinphos methyl mg/kg 0.01 2 0.01 0.01 0.01 < 0.01 < 0.01
Diazinon mg/kg 0.01 2 0.01 0.01 0.01 < 0.01 < 0.01
Dichlorvos mg/kg 0.01 2 0.01 0.01 0.01 < 0.01 < 0.01
Dimethoate mg/kg 0.01 2 0.01 0.01 0.01 < 0.01 < 0.01
Fenitrothion mg/kg 0.01 2 0.01 0.01 0.01 < 0.01 < 0.01
Malathion mg/kg 0.01 2 0.01 0.01 0.01 < 0.01 < 0.01
Mevinphos mg/kg 0.01 2 0.01 0.01 0.01 < 0.01 < 0.01
Parathion mg/kg 0.01 2 0.01 0.01 0.01 < 0.01 < 0.01
Pirimiphos mg/kg 0.01 2 0.01 0.01 0.01 < 0.01 < 0.01
Notes: Inorganic Mercury GAC used as not expecting elemental mercury to be present
GAC - Residential with No Gardens Sand Soil 1% SOM (mg/kg)
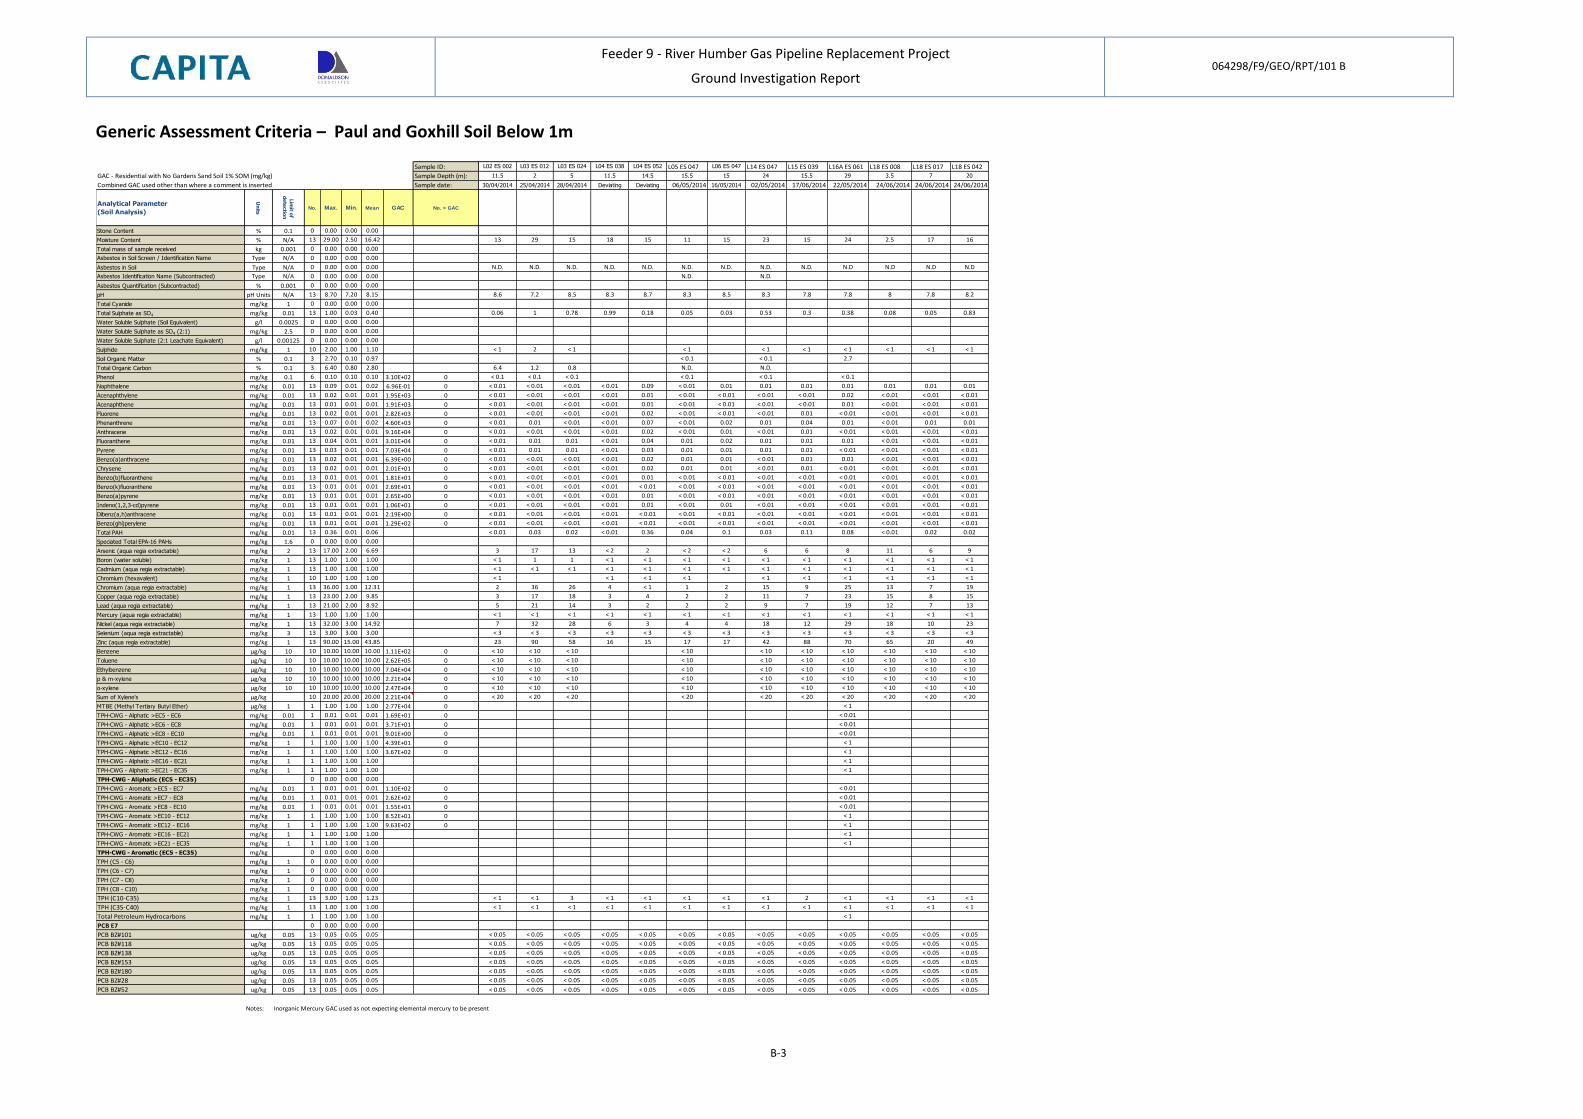
Feeder 9 - River Humber Gas Pipeline Replacement Project
Ground Investigation Report 064298/F9/GEO/RPT/101 B
B-3
Generic Assessment Criteria – Paul and Goxhill Soil Below 1m
Sample ID: L02 ES 002 L03 ES 012 L03 ES 024 L04 ES 038 L04 ES 052 L05 ES 047 L06 ES 047 L14 ES 047 L15 ES 039 L16A ES 061 L18 ES 008 L18 ES 017 L18 ES 042
GAC - Residential with No Gardens Sand Soil 1% SOM (mg/kg) Sample Depth (m): 11.5 2 5 11.5 14.5 15.5 15 24 15.5 29 3.5 7 20
Combined GAC used other than where a comment is inserted Sample date: 30/04/2014 25/04/2014 28/04/2014 Deviating Deviating 06/05/2014 16/05/2014 02/05/2014 17/06/2014 22/05/2014 24/06/2014 24/06/2014 24/06/2014
Analytical Parameter
(Soil Analysis)
Un
its
Lim
it of
de
tectio
n
No. Max. Min. Mean GAC No. > GAC
Stone Content % 0.1 0 0.00 0.00 0.00
Moisture Content % N/A 13 29.00 2.50 16.42 13 29 15 18 15 11 15 23 15 24 2.5 17 16
Total mass of sample received kg 0.001 0 0.00 0.00 0.00
Asbestos in Soil Screen / Identification Name Type N/A 0 0.00 0.00 0.00
Asbestos in Soil Type N/A 0 0.00 0.00 0.00 N.D. N.D. N.D. N.D. N.D. N.D. N.D. N.D. N.D. N.D N.D N.D N.D
Asbestos Identification Name (Subcontracted) Type N/A 0 0.00 0.00 0.00 N.D. N.D.
Asbestos Quantification (Subcontracted) % 0.001 0 0.00 0.00 0.00
pH pH Units N/A 13 8.70 7.20 8.15 8.6 7.2 8.5 8.3 8.7 8.3 8.5 8.3 7.8 7.8 8 7.8 8.2
Total Cyanide mg/kg 1 0 0.00 0.00 0.00
Total Sulphate as SO4 mg/kg 0.01 13 1.00 0.03 0.40 0.06 1 0.78 0.99 0.18 0.05 0.03 0.53 0.3 0.38 0.08 0.05 0.83
Water Soluble Sulphate (Soil Equivalent) g/l 0.0025 0 0.00 0.00 0.00
Water Soluble Sulphate as SO4 (2:1) mg/kg 2.5 0 0.00 0.00 0.00
Water Soluble Sulphate (2:1 Leachate Equivalent) g/l 0.00125 0 0.00 0.00 0.00
Sulphide mg/kg 1 10 2.00 1.00 1.10 < 1 2 < 1 < 1 < 1 < 1 < 1 < 1 < 1 < 1
Soil Organic Matter % 0.1 3 2.70 0.10 0.97 < 0.1 < 0.1 2.7
Total Organic Carbon % 0.1 3 6.40 0.80 2.80 6.4 1.2 0.8 N.D. N.D.
Phenol mg/kg 0.1 6 0.10 0.10 0.10 3.10E+02 0 < 0.1 < 0.1 < 0.1 < 0.1 < 0.1 < 0.1
Naphthalene mg/kg 0.01 13 0.09 0.01 0.02 6.96E-01 0 < 0.01 < 0.01 < 0.01 < 0.01 0.09 < 0.01 0.01 0.01 0.01 0.01 0.01 0.01 0.01
Acenaphthylene mg/kg 0.01 13 0.02 0.01 0.01 1.95E+03 0 < 0.01 < 0.01 < 0.01 < 0.01 0.01 < 0.01 < 0.01 < 0.01 < 0.01 0.02 < 0.01 < 0.01 < 0.01
Acenaphthene mg/kg 0.01 13 0.01 0.01 0.01 1.91E+03 0 < 0.01 < 0.01 < 0.01 < 0.01 0.01 < 0.01 < 0.01 < 0.01 < 0.01 0.01 < 0.01 < 0.01 < 0.01
Fluorene mg/kg 0.01 13 0.02 0.01 0.01 2.82E+03 0 < 0.01 < 0.01 < 0.01 < 0.01 0.02 < 0.01 < 0.01 < 0.01 0.01 < 0.01 < 0.01 < 0.01 < 0.01
Phenanthrene mg/kg 0.01 13 0.07 0.01 0.02 4.60E+03 0 < 0.01 0.01 < 0.01 < 0.01 0.07 < 0.01 0.02 0.01 0.04 0.01 < 0.01 0.01 0.01
Anthracene mg/kg 0.01 13 0.02 0.01 0.01 9.16E+04 0 < 0.01 < 0.01 < 0.01 < 0.01 0.02 < 0.01 0.01 < 0.01 0.01 < 0.01 < 0.01 < 0.01 < 0.01
Fluoranthene mg/kg 0.01 13 0.04 0.01 0.01 3.01E+04 0 < 0.01 0.01 0.01 < 0.01 0.04 0.01 0.02 0.01 0.01 0.01 < 0.01 < 0.01 < 0.01
Pyrene mg/kg 0.01 13 0.03 0.01 0.01 7.03E+04 0 < 0.01 0.01 0.01 < 0.01 0.03 0.01 0.01 0.01 0.01 < 0.01 < 0.01 < 0.01 < 0.01
Benzo(a)anthracene mg/kg 0.01 13 0.02 0.01 0.01 6.39E+00 0 < 0.01 < 0.01 < 0.01 < 0.01 0.02 0.01 0.01 < 0.01 0.01 0.01 < 0.01 < 0.01 < 0.01
Chrysene mg/kg 0.01 13 0.02 0.01 0.01 2.01E+01 0 < 0.01 < 0.01 < 0.01 < 0.01 0.02 0.01 0.01 < 0.01 0.01 < 0.01 < 0.01 < 0.01 < 0.01
Benzo(b)fluoranthene mg/kg 0.01 13 0.01 0.01 0.01 1.81E+01 0 < 0.01 < 0.01 < 0.01 < 0.01 0.01 < 0.01 < 0.01 < 0.01 < 0.01 < 0.01 < 0.01 < 0.01 < 0.01
Benzo(k)fluoranthene mg/kg 0.01 13 0.01 0.01 0.01 2.69E+01 0 < 0.01 < 0.01 < 0.01 < 0.01 < 0.01 < 0.01 < 0.01 < 0.01 < 0.01 < 0.01 < 0.01 < 0.01 < 0.01
Benzo(a)pyrene mg/kg 0.01 13 0.01 0.01 0.01 2.65E+00 0 < 0.01 < 0.01 < 0.01 < 0.01 0.01 < 0.01 < 0.01 < 0.01 < 0.01 < 0.01 < 0.01 < 0.01 < 0.01
Indeno(1,2,3-cd)pyrene mg/kg 0.01 13 0.01 0.01 0.01 1.06E+01 0 < 0.01 < 0.01 < 0.01 < 0.01 0.01 < 0.01 0.01 < 0.01 < 0.01 < 0.01 < 0.01 < 0.01 < 0.01
Dibenz(a,h)anthracene mg/kg 0.01 13 0.01 0.01 0.01 2.19E+00 0 < 0.01 < 0.01 < 0.01 < 0.01 < 0.01 < 0.01 < 0.01 < 0.01 < 0.01 < 0.01 < 0.01 < 0.01 < 0.01
Benzo(ghi)perylene mg/kg 0.01 13 0.01 0.01 0.01 1.29E+02 0 < 0.01 < 0.01 < 0.01 < 0.01 < 0.01 < 0.01 < 0.01 < 0.01 < 0.01 < 0.01 < 0.01 < 0.01 < 0.01
Total PAH mg/kg 0.01 13 0.36 0.01 0.06 < 0.01 0.03 0.02 < 0.01 0.36 0.04 0.1 0.03 0.11 0.08 < 0.01 0.02 0.02
Speciated Total EPA-16 PAHs mg/kg 1.6 0 0.00 0.00 0.00
Arsenic (aqua regia extractable) mg/kg 2 13 17.00 2.00 6.69 3 17 13 < 2 2 < 2 < 2 6 6 8 11 6 9
Boron (water soluble) mg/kg 1 13 1.00 1.00 1.00 < 1 1 1 < 1 < 1 < 1 < 1 < 1 < 1 < 1 < 1 < 1 < 1
Cadmium (aqua regia extractable) mg/kg 1 13 1.00 1.00 1.00 < 1 < 1 < 1 < 1 < 1 < 1 < 1 < 1 < 1 < 1 < 1 < 1 < 1
Chromium (hexavalent) mg/kg 1 10 1.00 1.00 1.00 < 1 < 1 < 1 < 1 < 1 < 1 < 1 < 1 < 1 < 1
Chromium (aqua regia extractable) mg/kg 1 13 36.00 1.00 12.31 2 36 26 4 < 1 1 2 15 9 25 13 7 19
Copper (aqua regia extractable) mg/kg 1 13 23.00 2.00 9.85 3 17 18 3 4 2 2 11 7 23 15 8 15
Lead (aqua regia extractable) mg/kg 1 13 21.00 2.00 8.92 5 21 14 3 2 2 2 9 7 19 12 7 13
Mercury (aqua regia extractable) mg/kg 1 13 1.00 1.00 1.00 < 1 < 1 < 1 < 1 < 1 < 1 < 1 < 1 < 1 < 1 < 1 < 1 < 1
Nickel (aqua regia extractable) mg/kg 1 13 32.00 3.00 14.92 7 32 28 6 3 4 4 18 12 29 18 10 23
Selenium (aqua regia extractable) mg/kg 3 13 3.00 3.00 3.00 < 3 < 3 < 3 < 3 < 3 < 3 < 3 < 3 < 3 < 3 < 3 < 3 < 3
Zinc (aqua regia extractable) mg/kg 1 13 90.00 15.00 43.85 23 90 58 16 15 17 17 42 88 70 65 20 49
Benzene µg/kg 10 10 10.00 10.00 10.00 1.11E+02 0 < 10 < 10 < 10 < 10 < 10 < 10 < 10 < 10 < 10 < 10
Toluene µg/kg 10 10 10.00 10.00 10.00 2.62E+05 0 < 10 < 10 < 10 < 10 < 10 < 10 < 10 < 10 < 10 < 10
Ethylbenzene µg/kg 10 10 10.00 10.00 10.00 7.04E+04 0 < 10 < 10 < 10 < 10 < 10 < 10 < 10 < 10 < 10 < 10
p & m-xylene µg/kg 10 10 10.00 10.00 10.00 2.21E+04 0 < 10 < 10 < 10 < 10 < 10 < 10 < 10 < 10 < 10 < 10
o-xylene µg/kg 10 10 10.00 10.00 10.00 2.47E+04 0 < 10 < 10 < 10 < 10 < 10 < 10 < 10 < 10 < 10 < 10
Sum of Xylene's µg/kg 10 20.00 20.00 20.00 2.21E+04 0 < 20 < 20 < 20 < 20 < 20 < 20 < 20 < 20 < 20 < 20
MTBE (Methyl Tertiary Butyl Ether) µg/kg 1 1 1.00 1.00 1.00 2.77E+04 0 < 1
TPH-CWG - Aliphatic >EC5 - EC6 mg/kg 0.01 1 0.01 0.01 0.01 1.69E+01 0 < 0.01
TPH-CWG - Aliphatic >EC6 - EC8 mg/kg 0.01 1 0.01 0.01 0.01 3.71E+01 0 < 0.01
TPH-CWG - Aliphatic >EC8 - EC10 mg/kg 0.01 1 0.01 0.01 0.01 9.01E+00 0 < 0.01
TPH-CWG - Aliphatic >EC10 - EC12 mg/kg 1 1 1.00 1.00 1.00 4.39E+01 0 < 1
TPH-CWG - Aliphatic >EC12 - EC16 mg/kg 1 1 1.00 1.00 1.00 3.67E+02 0 < 1
TPH-CWG - Aliphatic >EC16 - EC21 mg/kg 1 1 1.00 1.00 1.00 < 1
TPH-CWG - Aliphatic >EC21 - EC35 mg/kg 1 1 1.00 1.00 1.00 < 1
TPH-CWG - Aliphatic (EC5 - EC35) 0 0.00 0.00 0.00
TPH-CWG - Aromatic >EC5 - EC7 mg/kg 0.01 1 0.01 0.01 0.01 1.10E+02 0 < 0.01
TPH-CWG - Aromatic >EC7 - EC8 mg/kg 0.01 1 0.01 0.01 0.01 2.62E+02 0 < 0.01
TPH-CWG - Aromatic >EC8 - EC10 mg/kg 0.01 1 0.01 0.01 0.01 1.55E+01 0 < 0.01
TPH-CWG - Aromatic >EC10 - EC12 mg/kg 1 1 1.00 1.00 1.00 8.52E+01 0 < 1
TPH-CWG - Aromatic >EC12 - EC16 mg/kg 1 1 1.00 1.00 1.00 9.63E+02 0 < 1
TPH-CWG - Aromatic >EC16 - EC21 mg/kg 1 1 1.00 1.00 1.00 < 1
TPH-CWG - Aromatic >EC21 - EC35 mg/kg 1 1 1.00 1.00 1.00 < 1
TPH-CWG - Aromatic (EC5 - EC35) mg/kg 0 0.00 0.00 0.00
TPH (C5 - C6) mg/kg 1 0 0.00 0.00 0.00
TPH (C6 - C7) mg/kg 1 0 0.00 0.00 0.00
TPH (C7 - C8) mg/kg 1 0 0.00 0.00 0.00
TPH (C8 - C10) mg/kg 1 0 0.00 0.00 0.00
TPH (C10-C35) mg/kg 1 13 3.00 1.00 1.23 < 1 < 1 3 < 1 < 1 < 1 < 1 < 1 2 < 1 < 1 < 1 < 1
TPH (C35-C40) mg/kg 1 13 1.00 1.00 1.00 < 1 < 1 < 1 < 1 < 1 < 1 < 1 < 1 < 1 < 1 < 1 < 1 < 1
Total Petroleum Hydrocarbons mg/kg 1 1 1.00 1.00 1.00 < 1
PCB E7 0 0.00 0.00 0.00
PCB BZ#101 ug/kg 0.05 13 0.05 0.05 0.05 < 0.05 < 0.05 < 0.05 < 0.05 < 0.05 < 0.05 < 0.05 < 0.05 < 0.05 < 0.05 < 0.05 < 0.05 < 0.05
PCB BZ#118 ug/kg 0.05 13 0.05 0.05 0.05 < 0.05 < 0.05 < 0.05 < 0.05 < 0.05 < 0.05 < 0.05 < 0.05 < 0.05 < 0.05 < 0.05 < 0.05 < 0.05
PCB BZ#138 ug/kg 0.05 13 0.05 0.05 0.05 < 0.05 < 0.05 < 0.05 < 0.05 < 0.05 < 0.05 < 0.05 < 0.05 < 0.05 < 0.05 < 0.05 < 0.05 < 0.05
PCB BZ#153 ug/kg 0.05 13 0.05 0.05 0.05 < 0.05 < 0.05 < 0.05 < 0.05 < 0.05 < 0.05 < 0.05 < 0.05 < 0.05 < 0.05 < 0.05 < 0.05 < 0.05
PCB BZ#180 ug/kg 0.05 13 0.05 0.05 0.05 < 0.05 < 0.05 < 0.05 < 0.05 < 0.05 < 0.05 < 0.05 < 0.05 < 0.05 < 0.05 < 0.05 < 0.05 < 0.05
PCB BZ#28 ug/kg 0.05 13 0.05 0.05 0.05 < 0.05 < 0.05 < 0.05 < 0.05 < 0.05 < 0.05 < 0.05 < 0.05 < 0.05 < 0.05 < 0.05 < 0.05 < 0.05
PCB BZ#52 ug/kg 0.05 13 0.05 0.05 0.05 < 0.05 < 0.05 < 0.05 < 0.05 < 0.05 < 0.05 < 0.05 < 0.05 < 0.05 < 0.05 < 0.05 < 0.05 < 0.05
Notes: Inorganic Mercury GAC used as not expecting elemental mercury to be present
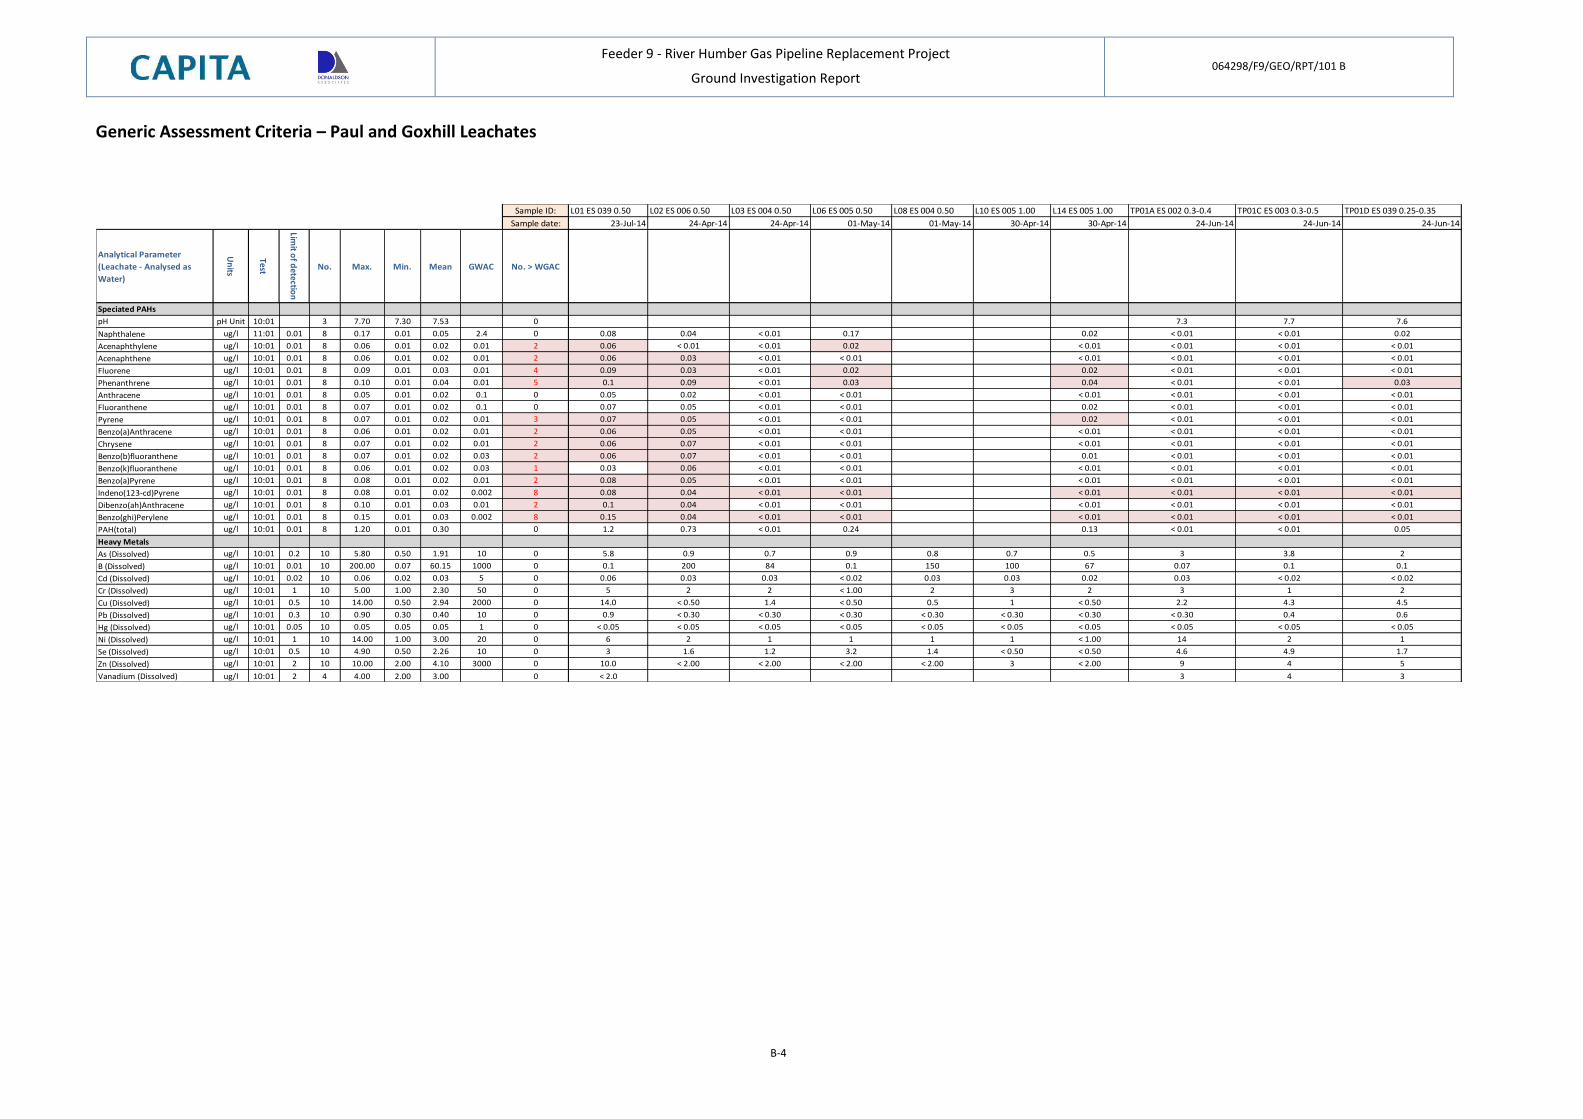
Feeder 9 - River Humber Gas Pipeline Replacement Project
Ground Investigation Report 064298/F9/GEO/RPT/101 B
B-4
Generic Assessment Criteria – Paul and Goxhill Leachates
Sample ID: L01 ES 039 0.50 L02 ES 006 0.50 L03 ES 004 0.50 L06 ES 005 0.50 L08 ES 004 0.50 L10 ES 005 1.00 L14 ES 005 1.00 TP01A ES 002 0.3-0.4 TP01C ES 003 0.3-0.5 TP01D ES 039 0.25-0.35
Sample date: 23-Jul-14 24-Apr-14 24-Apr-14 01-May-14 01-May-14 30-Apr-14 30-Apr-14 24-Jun-14 24-Jun-14 24-Jun-14
Analytical Parameter
(Leachate - Analysed as
Water)
Un
its
Test
Limit o
f detectio
n
No. Max. Min. Mean GWAC No. > WGAC
Speciated PAHs
pH pH Unit 10:01 3 7.70 7.30 7.53 0 7.3 7.7 7.6
Naphthalene ug/l 11:01 0.01 8 0.17 0.01 0.05 2.4 0 0.08 0.04 < 0.01 0.17 0.02 < 0.01 < 0.01 0.02
Acenaphthylene ug/l 10:01 0.01 8 0.06 0.01 0.02 0.01 2 0.06 < 0.01 < 0.01 0.02 < 0.01 < 0.01 < 0.01 < 0.01
Acenaphthene ug/l 10:01 0.01 8 0.06 0.01 0.02 0.01 2 0.06 0.03 < 0.01 < 0.01 < 0.01 < 0.01 < 0.01 < 0.01
Fluorene ug/l 10:01 0.01 8 0.09 0.01 0.03 0.01 4 0.09 0.03 < 0.01 0.02 0.02 < 0.01 < 0.01 < 0.01
Phenanthrene ug/l 10:01 0.01 8 0.10 0.01 0.04 0.01 5 0.1 0.09 < 0.01 0.03 0.04 < 0.01 < 0.01 0.03
Anthracene ug/l 10:01 0.01 8 0.05 0.01 0.02 0.1 0 0.05 0.02 < 0.01 < 0.01 < 0.01 < 0.01 < 0.01 < 0.01
Fluoranthene ug/l 10:01 0.01 8 0.07 0.01 0.02 0.1 0 0.07 0.05 < 0.01 < 0.01 0.02 < 0.01 < 0.01 < 0.01
Pyrene ug/l 10:01 0.01 8 0.07 0.01 0.02 0.01 3 0.07 0.05 < 0.01 < 0.01 0.02 < 0.01 < 0.01 < 0.01
Benzo(a)Anthracene ug/l 10:01 0.01 8 0.06 0.01 0.02 0.01 2 0.06 0.05 < 0.01 < 0.01 < 0.01 < 0.01 < 0.01 < 0.01
Chrysene ug/l 10:01 0.01 8 0.07 0.01 0.02 0.01 2 0.06 0.07 < 0.01 < 0.01 < 0.01 < 0.01 < 0.01 < 0.01
Benzo(b)fluoranthene ug/l 10:01 0.01 8 0.07 0.01 0.02 0.03 2 0.06 0.07 < 0.01 < 0.01 0.01 < 0.01 < 0.01 < 0.01
Benzo(k)fluoranthene ug/l 10:01 0.01 8 0.06 0.01 0.02 0.03 1 0.03 0.06 < 0.01 < 0.01 < 0.01 < 0.01 < 0.01 < 0.01
Benzo(a)Pyrene ug/l 10:01 0.01 8 0.08 0.01 0.02 0.01 2 0.08 0.05 < 0.01 < 0.01 < 0.01 < 0.01 < 0.01 < 0.01
Indeno(123-cd)Pyrene ug/l 10:01 0.01 8 0.08 0.01 0.02 0.002 8 0.08 0.04 < 0.01 < 0.01 < 0.01 < 0.01 < 0.01 < 0.01
Dibenzo(ah)Anthracene ug/l 10:01 0.01 8 0.10 0.01 0.03 0.01 2 0.1 0.04 < 0.01 < 0.01 < 0.01 < 0.01 < 0.01 < 0.01
Benzo(ghi)Perylene ug/l 10:01 0.01 8 0.15 0.01 0.03 0.002 8 0.15 0.04 < 0.01 < 0.01 < 0.01 < 0.01 < 0.01 < 0.01
PAH(total) ug/l 10:01 0.01 8 1.20 0.01 0.30 0 1.2 0.73 < 0.01 0.24 0.13 < 0.01 < 0.01 0.05
Heavy Metals
As (Dissolved) ug/l 10:01 0.2 10 5.80 0.50 1.91 10 0 5.8 0.9 0.7 0.9 0.8 0.7 0.5 3 3.8 2
B (Dissolved) ug/l 10:01 0.01 10 200.00 0.07 60.15 1000 0 0.1 200 84 0.1 150 100 67 0.07 0.1 0.1
Cd (Dissolved) ug/l 10:01 0.02 10 0.06 0.02 0.03 5 0 0.06 0.03 0.03 < 0.02 0.03 0.03 0.02 0.03 < 0.02 < 0.02
Cr (Dissolved) ug/l 10:01 1 10 5.00 1.00 2.30 50 0 5 2 2 < 1.00 2 3 2 3 1 2
Cu (Dissolved) ug/l 10:01 0.5 10 14.00 0.50 2.94 2000 0 14.0 < 0.50 1.4 < 0.50 0.5 1 < 0.50 2.2 4.3 4.5
Pb (Dissolved) ug/l 10:01 0.3 10 0.90 0.30 0.40 10 0 0.9 < 0.30 < 0.30 < 0.30 < 0.30 < 0.30 < 0.30 < 0.30 0.4 0.6
Hg (Dissolved) ug/l 10:01 0.05 10 0.05 0.05 0.05 1 0 < 0.05 < 0.05 < 0.05 < 0.05 < 0.05 < 0.05 < 0.05 < 0.05 < 0.05 < 0.05
Ni (Dissolved) ug/l 10:01 1 10 14.00 1.00 3.00 20 0 6 2 1 1 1 1 < 1.00 14 2 1
Se (Dissolved) ug/l 10:01 0.5 10 4.90 0.50 2.26 10 0 3 1.6 1.2 3.2 1.4 < 0.50 < 0.50 4.6 4.9 1.7
Zn (Dissolved) ug/l 10:01 2 10 10.00 2.00 4.10 3000 0 10.0 < 2.00 < 2.00 < 2.00 < 2.00 3 < 2.00 9 4 5
Vanadium (Dissolved) ug/l 10:01 2 4 4.00 2.00 3.00 0 < 2.0 3 4 3

Feeder 9 - River Humber Gas Pipeline Replacement Project
Ground Investigation Report
064298/F9/GEO/RPT/101 B
APPENDIX C – Groundwater/Gas Monitoring Field Data
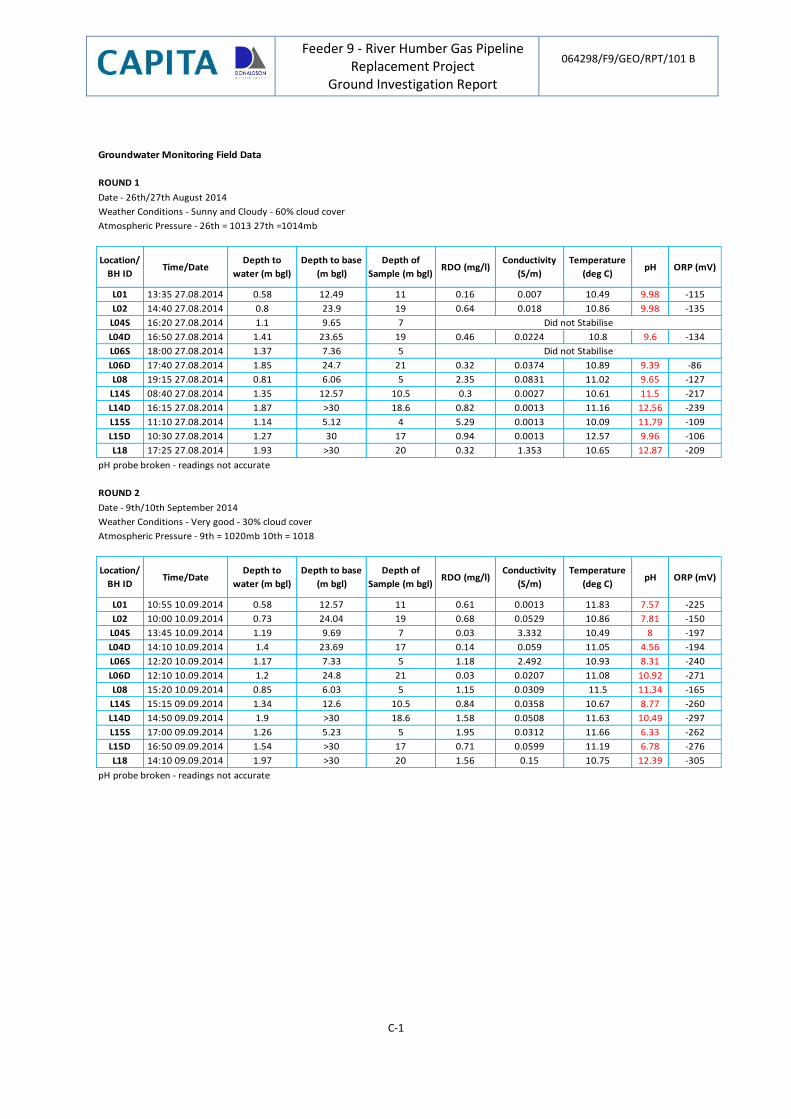
Feeder 9 - River Humber Gas Pipeline Replacement Project
Ground Investigation Report
064298/F9/GEO/RPT/101 B
C-1
Groundwater Monitoring Field Data
Date - 26th/27th August 2014
Weather Conditions - Sunny and Cloudy - 60% cloud cover
Atmospheric Pressure - 26th = 1013 27th =1014mb
Location/
BH IDTime/Date
Depth to
water (m bgl)
Depth to base
(m bgl)
Depth of
Sample (m bgl)RDO (mg/l)
Conductivity
(S/m)
Temperature
(deg C)pH ORP (mV)
L01 13:35 27.08.2014 0.58 12.49 11 0.16 0.007 10.49 9.98 -115
L02 14:40 27.08.2014 0.8 23.9 19 0.64 0.018 10.86 9.98 -135
L04S 16:20 27.08.2014 1.1 9.65 7
L04D 16:50 27.08.2014 1.41 23.65 19 0.46 0.0224 10.8 9.6 -134
L06S 18:00 27.08.2014 1.37 7.36 5
L06D 17:40 27.08.2014 1.85 24.7 21 0.32 0.0374 10.89 9.39 -86
L08 19:15 27.08.2014 0.81 6.06 5 2.35 0.0831 11.02 9.65 -127
L14S 08:40 27.08.2014 1.35 12.57 10.5 0.3 0.0027 10.61 11.5 -217
L14D 16:15 27.08.2014 1.87 >30 18.6 0.82 0.0013 11.16 12.56 -239
L15S 11:10 27.08.2014 1.14 5.12 4 5.29 0.0013 10.09 11.79 -109
L15D 10:30 27.08.2014 1.27 30 17 0.94 0.0013 12.57 9.96 -106
L18 17:25 27.08.2014 1.93 >30 20 0.32 1.353 10.65 12.87 -209
pH probe broken - readings not accurate
Date - 9th/10th September 2014
Weather Conditions - Very good - 30% cloud cover
Atmospheric Pressure - 9th = 1020mb 10th = 1018
Location/
BH IDTime/Date
Depth to
water (m bgl)
Depth to base
(m bgl)
Depth of
Sample (m bgl)RDO (mg/l)
Conductivity
(S/m)
Temperature
(deg C)pH ORP (mV)
L01 10:55 10.09.2014 0.58 12.57 11 0.61 0.0013 11.83 7.57 -225
L02 10:00 10.09.2014 0.73 24.04 19 0.68 0.0529 10.86 7.81 -150
L04S 13:45 10.09.2014 1.19 9.69 7 0.03 3.332 10.49 8 -197
L04D 14:10 10.09.2014 1.4 23.69 17 0.14 0.059 11.05 4.56 -194
L06S 12:20 10.09.2014 1.17 7.33 5 1.18 2.492 10.93 8.31 -240
L06D 12:10 10.09.2014 1.2 24.8 21 0.03 0.0207 11.08 10.92 -271
L08 15:20 10.09.2014 0.85 6.03 5 1.15 0.0309 11.5 11.34 -165
L14S 15:15 09.09.2014 1.34 12.6 10.5 0.84 0.0358 10.67 8.77 -260
L14D 14:50 09.09.2014 1.9 >30 18.6 1.58 0.0508 11.63 10.49 -297
L15S 17:00 09.09.2014 1.26 5.23 5 1.95 0.0312 11.66 6.33 -262
L15D 16:50 09.09.2014 1.54 >30 17 0.71 0.0599 11.19 6.78 -276
L18 14:10 09.09.2014 1.97 >30 20 1.56 0.15 10.75 12.39 -305
pH probe broken - readings not accurate
Did not Stabilise
Did not Stabilise
ROUND 1
ROUND 2
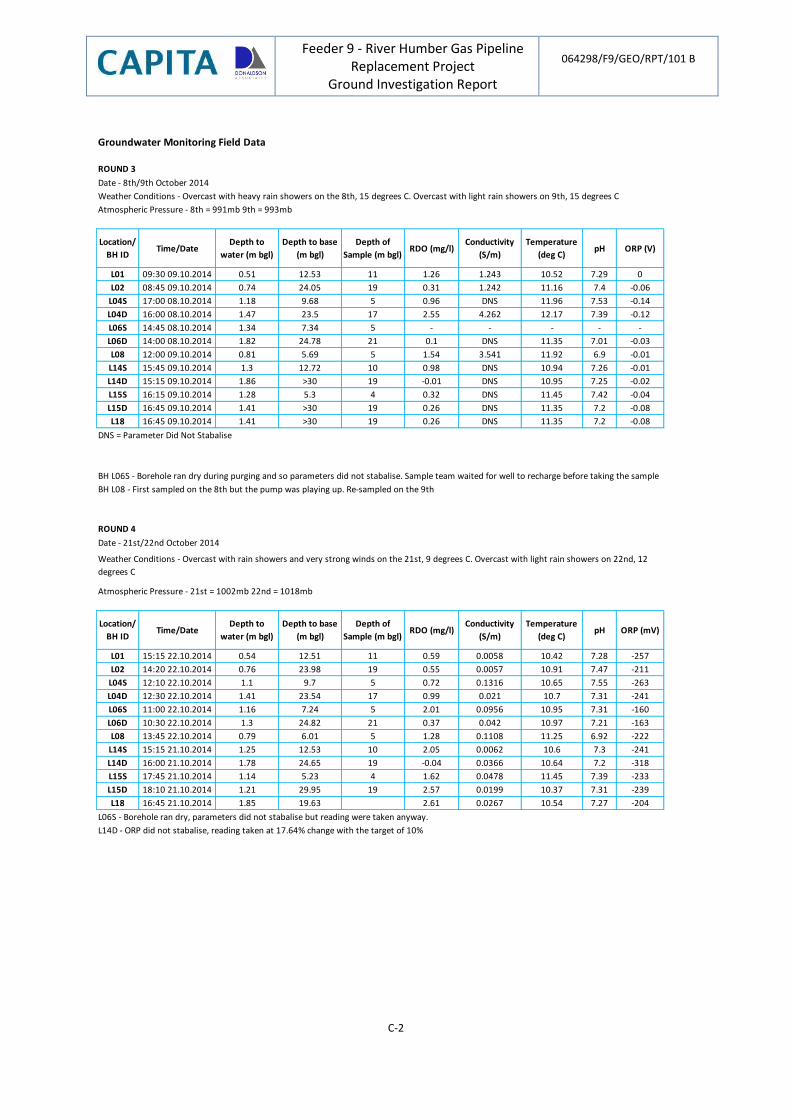
Feeder 9 - River Humber Gas Pipeline Replacement Project
Ground Investigation Report
064298/F9/GEO/RPT/101 B
C-2
Groundwater Monitoring Field Data
Date - 8th/9th October 2014
Weather Conditions - Overcast with heavy rain showers on the 8th, 15 degrees C. Overcast with light rain showers on 9th, 15 degrees C
Atmospheric Pressure - 8th = 991mb 9th = 993mb
Location/
BH IDTime/Date
Depth to
water (m bgl)
Depth to base
(m bgl)
Depth of
Sample (m bgl)RDO (mg/l)
Conductivity
(S/m)
Temperature
(deg C)pH ORP (V)
L01 09:30 09.10.2014 0.51 12.53 11 1.26 1.243 10.52 7.29 0
L02 08:45 09.10.2014 0.74 24.05 19 0.31 1.242 11.16 7.4 -0.06
L04S 17:00 08.10.2014 1.18 9.68 5 0.96 DNS 11.96 7.53 -0.14
L04D 16:00 08.10.2014 1.47 23.5 17 2.55 4.262 12.17 7.39 -0.12
L06S 14:45 08.10.2014 1.34 7.34 5 - - - - -
L06D 14:00 08.10.2014 1.82 24.78 21 0.1 DNS 11.35 7.01 -0.03
L08 12:00 09.10.2014 0.81 5.69 5 1.54 3.541 11.92 6.9 -0.01
L14S 15:45 09.10.2014 1.3 12.72 10 0.98 DNS 10.94 7.26 -0.01
L14D 15:15 09.10.2014 1.86 >30 19 -0.01 DNS 10.95 7.25 -0.02
L15S 16:15 09.10.2014 1.28 5.3 4 0.32 DNS 11.45 7.42 -0.04
L15D 16:45 09.10.2014 1.41 >30 19 0.26 DNS 11.35 7.2 -0.08
L18 16:45 09.10.2014 1.41 >30 19 0.26 DNS 11.35 7.2 -0.08
DNS = Parameter Did Not Stabalise
BH L08 - First sampled on the 8th but the pump was playing up. Re-sampled on the 9th
Date - 21st/22nd October 2014
Atmospheric Pressure - 21st = 1002mb 22nd = 1018mb
Location/
BH IDTime/Date
Depth to
water (m bgl)
Depth to base
(m bgl)
Depth of
Sample (m bgl)RDO (mg/l)
Conductivity
(S/m)
Temperature
(deg C)pH ORP (mV)
L01 15:15 22.10.2014 0.54 12.51 11 0.59 0.0058 10.42 7.28 -257
L02 14:20 22.10.2014 0.76 23.98 19 0.55 0.0057 10.91 7.47 -211
L04S 12:10 22.10.2014 1.1 9.7 5 0.72 0.1316 10.65 7.55 -263
L04D 12:30 22.10.2014 1.41 23.54 17 0.99 0.021 10.7 7.31 -241
L06S 11:00 22.10.2014 1.16 7.24 5 2.01 0.0956 10.95 7.31 -160
L06D 10:30 22.10.2014 1.3 24.82 21 0.37 0.042 10.97 7.21 -163
L08 13:45 22.10.2014 0.79 6.01 5 1.28 0.1108 11.25 6.92 -222
L14S 15:15 21.10.2014 1.25 12.53 10 2.05 0.0062 10.6 7.3 -241
L14D 16:00 21.10.2014 1.78 24.65 19 -0.04 0.0366 10.64 7.2 -318
L15S 17:45 21.10.2014 1.14 5.23 4 1.62 0.0478 11.45 7.39 -233
L15D 18:10 21.10.2014 1.21 29.95 19 2.57 0.0199 10.37 7.31 -239
L18 16:45 21.10.2014 1.85 19.63 2.61 0.0267 10.54 7.27 -204
L06S - Borehole ran dry, parameters did not stabalise but reading were taken anyway.
L14D - ORP did not stabalise, reading taken at 17.64% change with the target of 10%
ROUND 3
ROUND 4
BH L06S - Borehole ran dry during purging and so parameters did not stabalise. Sample team waited for well to recharge before taking the sample
Weather Conditions - Overcast with rain showers and very strong winds on the 21st, 9 degrees C. Overcast with light rain showers on 22nd, 12
degrees C
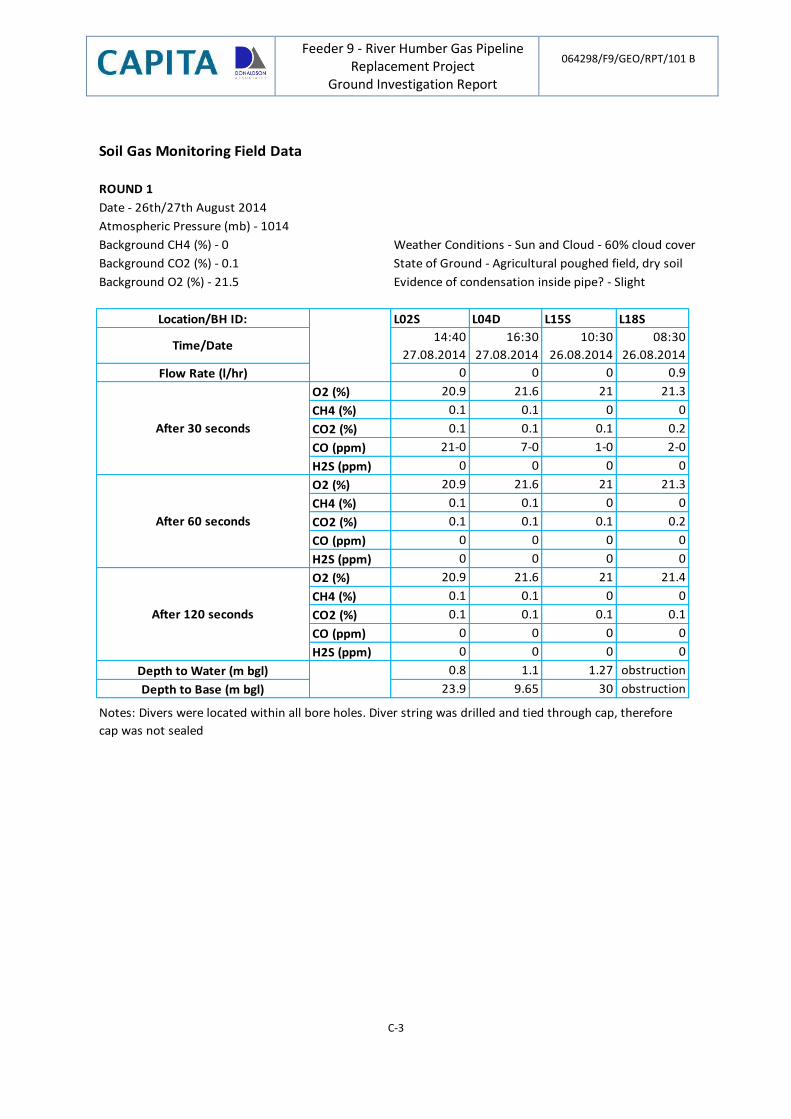
Feeder 9 - River Humber Gas Pipeline Replacement Project
Ground Investigation Report
064298/F9/GEO/RPT/101 B
C-3
ROUND 1
Date - 26th/27th August 2014
Background CH4 (%) - 0 Weather Conditions - Sun and Cloud - 60% cloud cover
Background CO2 (%) - 0.1 State of Ground - Agricultural poughed field, dry soil
Background O2 (%) - 21.5 Evidence of condensation inside pipe? - Slight
Location/BH ID: L02S L04D L15S L18S
Time/Date14:40
27.08.2014
16:30
27.08.2014
10:30
26.08.2014
08:30
26.08.2014
Flow Rate (l/hr) 0 0 0 0.9
O2 (%) 20.9 21.6 21 21.3
CH4 (%) 0.1 0.1 0 0
CO2 (%) 0.1 0.1 0.1 0.2
CO (ppm) 21-0 7-0 1-0 2-0
H2S (ppm) 0 0 0 0
O2 (%) 20.9 21.6 21 21.3
CH4 (%) 0.1 0.1 0 0
CO2 (%) 0.1 0.1 0.1 0.2
CO (ppm) 0 0 0 0
H2S (ppm) 0 0 0 0
O2 (%) 20.9 21.6 21 21.4
CH4 (%) 0.1 0.1 0 0
CO2 (%) 0.1 0.1 0.1 0.1
CO (ppm) 0 0 0 0
H2S (ppm) 0 0 0 0
Depth to Water (m bgl) 0.8 1.1 1.27 obstruction
Depth to Base (m bgl) 23.9 9.65 30 obstruction
Soil Gas Monitoring Field Data
Atmospheric Pressure (mb) - 1014
After 30 seconds
After 60 seconds
After 120 seconds
Notes: Divers were located within all bore holes. Diver string was drilled and tied through cap, therefore
cap was not sealed
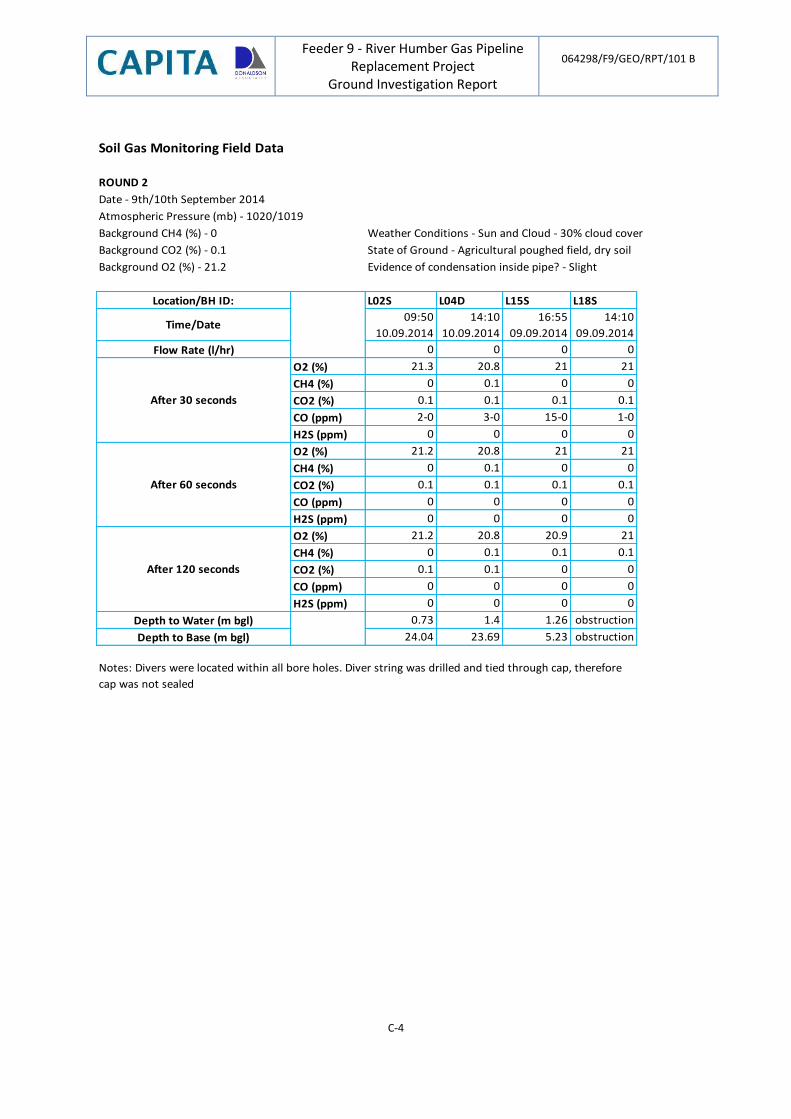
Feeder 9 - River Humber Gas Pipeline Replacement Project
Ground Investigation Report
064298/F9/GEO/RPT/101 B
C-4
ROUND 2
Date - 9th/10th September 2014
Background CH4 (%) - 0 Weather Conditions - Sun and Cloud - 30% cloud cover
Background CO2 (%) - 0.1 State of Ground - Agricultural poughed field, dry soil
Background O2 (%) - 21.2 Evidence of condensation inside pipe? - Slight
Location/BH ID: L02S L04D L15S L18S
Time/Date09:50
10.09.2014
14:10
10.09.2014
16:55
09.09.2014
14:10
09.09.2014
Flow Rate (l/hr) 0 0 0 0
O2 (%) 21.3 20.8 21 21
CH4 (%) 0 0.1 0 0
CO2 (%) 0.1 0.1 0.1 0.1
CO (ppm) 2-0 3-0 15-0 1-0
H2S (ppm) 0 0 0 0
O2 (%) 21.2 20.8 21 21
CH4 (%) 0 0.1 0 0
CO2 (%) 0.1 0.1 0.1 0.1
CO (ppm) 0 0 0 0
H2S (ppm) 0 0 0 0
O2 (%) 21.2 20.8 20.9 21
CH4 (%) 0 0.1 0.1 0.1
CO2 (%) 0.1 0.1 0 0
CO (ppm) 0 0 0 0
H2S (ppm) 0 0 0 0
Depth to Water (m bgl) 0.73 1.4 1.26 obstruction
Depth to Base (m bgl) 24.04 23.69 5.23 obstruction
Soil Gas Monitoring Field Data
Atmospheric Pressure (mb) - 1020/1019
After 30 seconds
After 60 seconds
After 120 seconds
Notes: Divers were located within all bore holes. Diver string was drilled and tied through cap, therefore
cap was not sealed
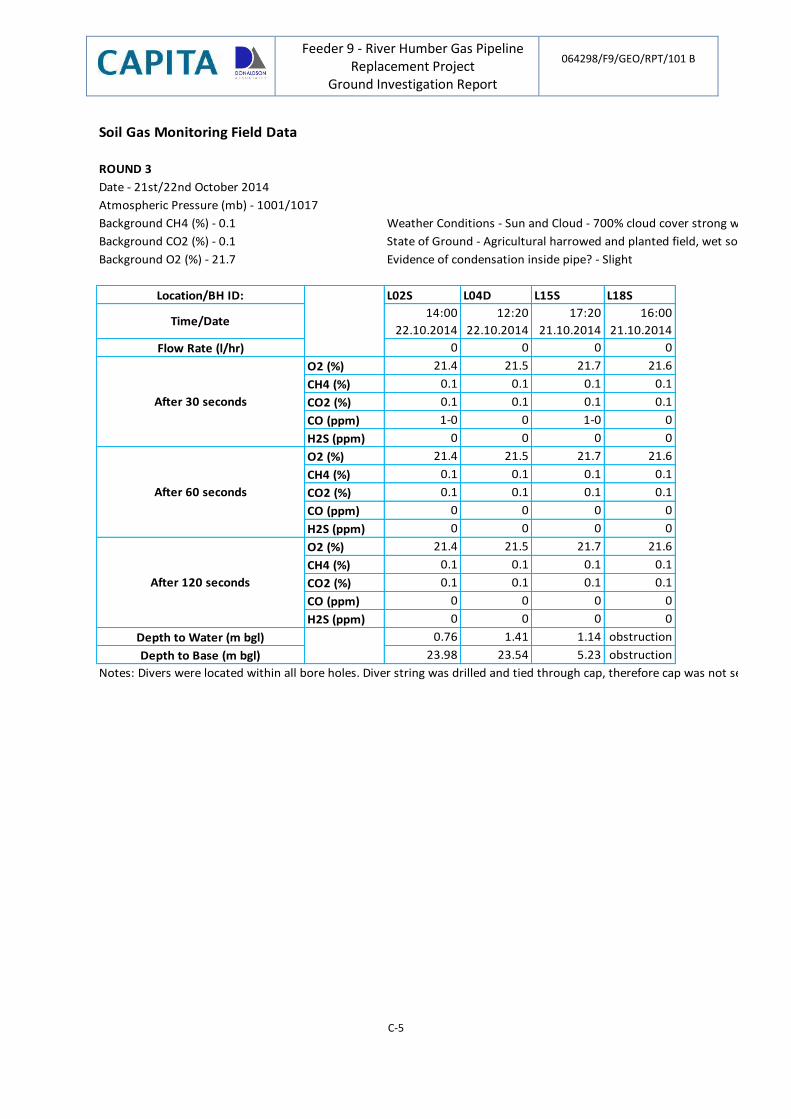
Feeder 9 - River Humber Gas Pipeline Replacement Project
Ground Investigation Report
064298/F9/GEO/RPT/101 B
C-5
ROUND 3
Date - 21st/22nd October 2014
Background CH4 (%) - 0.1 Weather Conditions - Sun and Cloud - 700% cloud cover strong winds up to 50 mph
Background CO2 (%) - 0.1 State of Ground - Agricultural harrowed and planted field, wet soil
Background O2 (%) - 21.7 Evidence of condensation inside pipe? - Slight
Location/BH ID: L02S L04D L15S L18S
Time/Date14:00
22.10.2014
12:20
22.10.2014
17:20
21.10.2014
16:00
21.10.2014
Flow Rate (l/hr) 0 0 0 0
O2 (%) 21.4 21.5 21.7 21.6
CH4 (%) 0.1 0.1 0.1 0.1
CO2 (%) 0.1 0.1 0.1 0.1
CO (ppm) 1-0 0 1-0 0
H2S (ppm) 0 0 0 0
O2 (%) 21.4 21.5 21.7 21.6
CH4 (%) 0.1 0.1 0.1 0.1
CO2 (%) 0.1 0.1 0.1 0.1
CO (ppm) 0 0 0 0
H2S (ppm) 0 0 0 0
O2 (%) 21.4 21.5 21.7 21.6
CH4 (%) 0.1 0.1 0.1 0.1
CO2 (%) 0.1 0.1 0.1 0.1
CO (ppm) 0 0 0 0
H2S (ppm) 0 0 0 0
Depth to Water (m bgl) 0.76 1.41 1.14 obstruction
Depth to Base (m bgl) 23.98 23.54 5.23 obstruction
Notes: Divers were located within all bore holes. Diver string was drilled and tied through cap, therefore cap was not sealed
After 120 seconds
Atmospheric Pressure (mb) - 1001/1017
After 30 seconds
After 60 seconds
Soil Gas Monitoring Field Data
Feeder 9 - River Humber Gas Pipeline Replacement Project
Ground Investigation Report
064298/F9/GEO/RPT/101 B
D-1
APPENDIX D – Geological Formation Identification
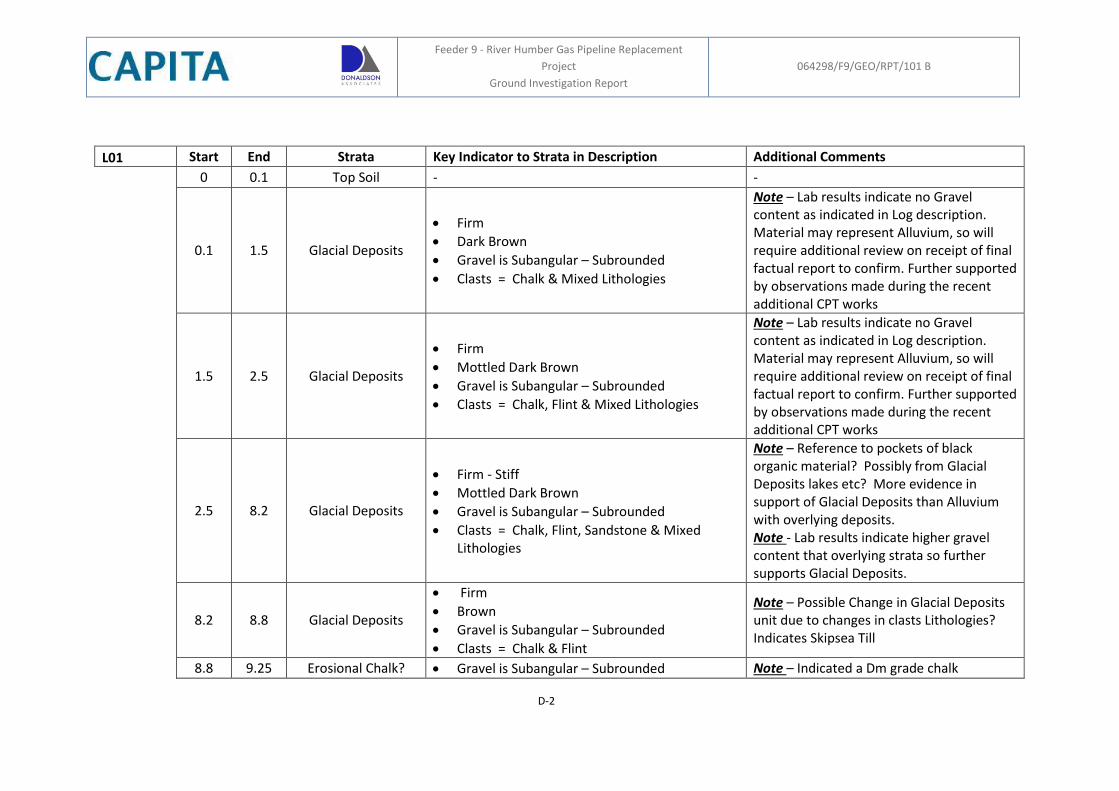
Feeder 9 - River Humber Gas Pipeline Replacement
Project
Ground Investigation Report
064298/F9/GEO/RPT/101 B
D-2
L01 Start End Strata Key Indicator to Strata in Description Additional Comments
0 0.1 Top Soil - -
0.1 1.5 Glacial Deposits
Firm
Dark Brown
Gravel is Subangular – Subrounded
Clasts = Chalk & Mixed Lithologies
Note – Lab results indicate no Gravel content as indicated in Log description. Material may represent Alluvium, so will require additional review on receipt of final factual report to confirm. Further supported by observations made during the recent additional CPT works
1.5 2.5 Glacial Deposits
Firm
Mottled Dark Brown
Gravel is Subangular – Subrounded
Clasts = Chalk, Flint & Mixed Lithologies
Note – Lab results indicate no Gravel content as indicated in Log description. Material may represent Alluvium, so will require additional review on receipt of final factual report to confirm. Further supported by observations made during the recent additional CPT works
2.5 8.2 Glacial Deposits
Firm - Stiff
Mottled Dark Brown
Gravel is Subangular – Subrounded
Clasts = Chalk, Flint, Sandstone & Mixed Lithologies
Note – Reference to pockets of black organic material? Possibly from Glacial Deposits lakes etc? More evidence in support of Glacial Deposits than Alluvium with overlying deposits. Note - Lab results indicate higher gravel content that overlying strata so further supports Glacial Deposits.
8.2 8.8 Glacial Deposits
Firm
Brown
Gravel is Subangular – Subrounded
Clasts = Chalk & Flint
Note – Possible Change in Glacial Deposits unit due to changes in clasts Lithologies? Indicates Skipsea Till
8.8 9.25 Erosional Chalk? Gravel is Subangular – Subrounded Note – Indicated a Dm grade chalk
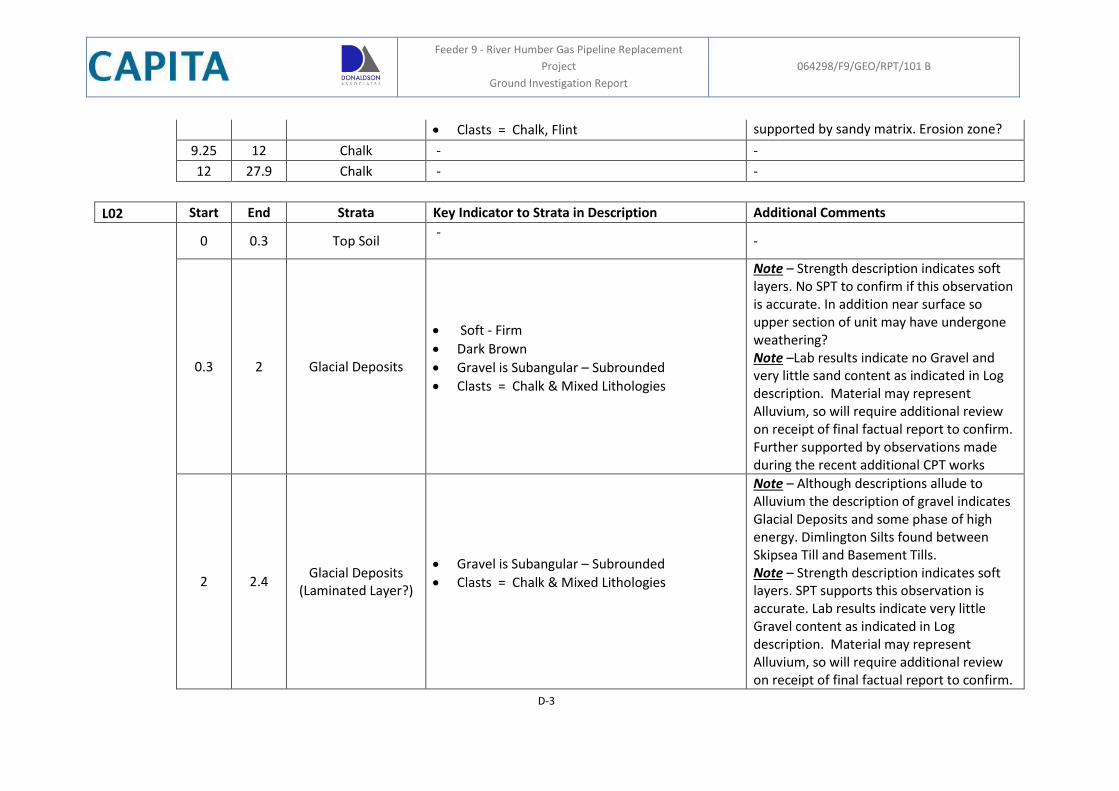
Feeder 9 - River Humber Gas Pipeline Replacement
Project
Ground Investigation Report
064298/F9/GEO/RPT/101 B
D-3
Clasts = Chalk, Flint supported by sandy matrix. Erosion zone?
9.25 12 Chalk - -
12 27.9 Chalk - -
L02 Start End Strata Key Indicator to Strata in Description Additional Comments
0 0.3 Top Soil -
-
0.3 2 Glacial Deposits
Soft - Firm
Dark Brown
Gravel is Subangular – Subrounded
Clasts = Chalk & Mixed Lithologies
Note – Strength description indicates soft layers. No SPT to confirm if this observation is accurate. In addition near surface so upper section of unit may have undergone weathering? Note –Lab results indicate no Gravel and very little sand content as indicated in Log description. Material may represent Alluvium, so will require additional review on receipt of final factual report to confirm. Further supported by observations made during the recent additional CPT works
2 2.4 Glacial Deposits
(Laminated Layer?)
Gravel is Subangular – Subrounded
Clasts = Chalk & Mixed Lithologies
Note – Although descriptions allude to Alluvium the description of gravel indicates Glacial Deposits and some phase of high energy. Dimlington Silts found between Skipsea Till and Basement Tills. Note – Strength description indicates soft layers. SPT supports this observation is accurate. Lab results indicate very little Gravel content as indicated in Log description. Material may represent Alluvium, so will require additional review on receipt of final factual report to confirm.
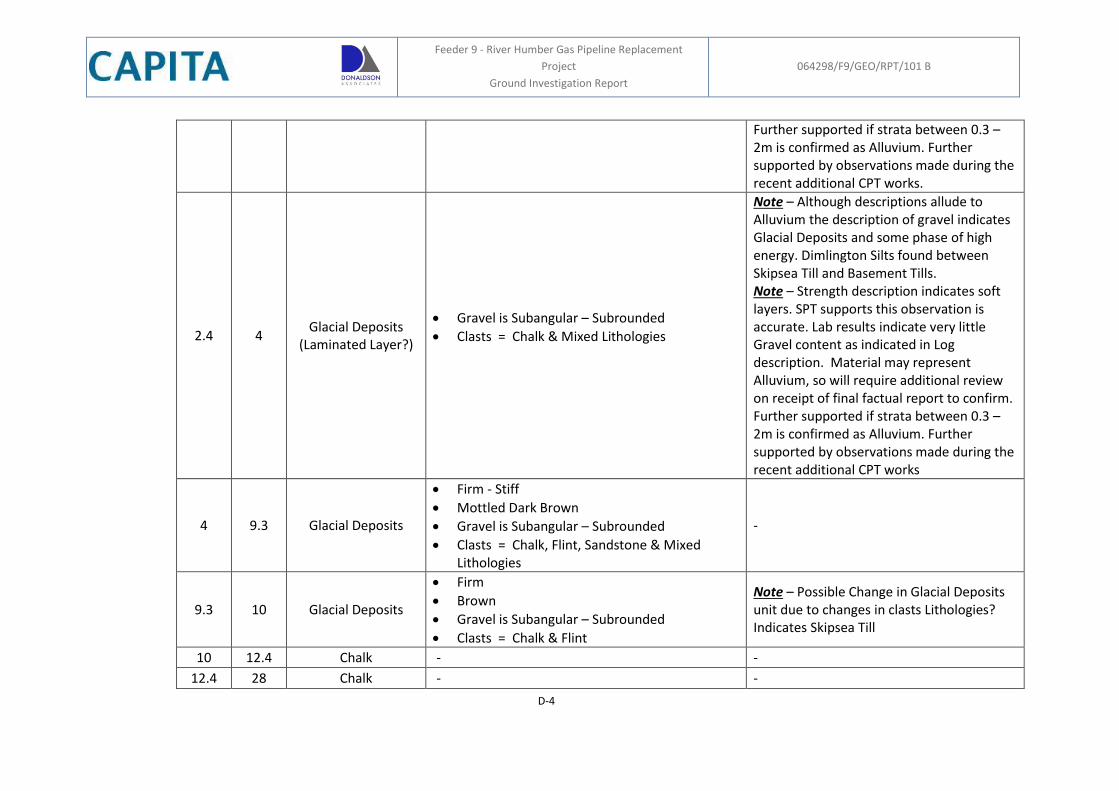
Feeder 9 - River Humber Gas Pipeline Replacement
Project
Ground Investigation Report
064298/F9/GEO/RPT/101 B
D-4
Further supported if strata between 0.3 – 2m is confirmed as Alluvium. Further supported by observations made during the recent additional CPT works.
2.4 4 Glacial Deposits
(Laminated Layer?)
Gravel is Subangular – Subrounded
Clasts = Chalk & Mixed Lithologies
Note – Although descriptions allude to Alluvium the description of gravel indicates Glacial Deposits and some phase of high energy. Dimlington Silts found between Skipsea Till and Basement Tills. Note – Strength description indicates soft layers. SPT supports this observation is accurate. Lab results indicate very little Gravel content as indicated in Log description. Material may represent Alluvium, so will require additional review on receipt of final factual report to confirm. Further supported if strata between 0.3 – 2m is confirmed as Alluvium. Further supported by observations made during the recent additional CPT works
4 9.3 Glacial Deposits
Firm - Stiff
Mottled Dark Brown
Gravel is Subangular – Subrounded
Clasts = Chalk, Flint, Sandstone & Mixed Lithologies
-
9.3 10 Glacial Deposits
Firm
Brown
Gravel is Subangular – Subrounded
Clasts = Chalk & Flint
Note – Possible Change in Glacial Deposits unit due to changes in clasts Lithologies? Indicates Skipsea Till
10 12.4 Chalk - -
12.4 28 Chalk - -
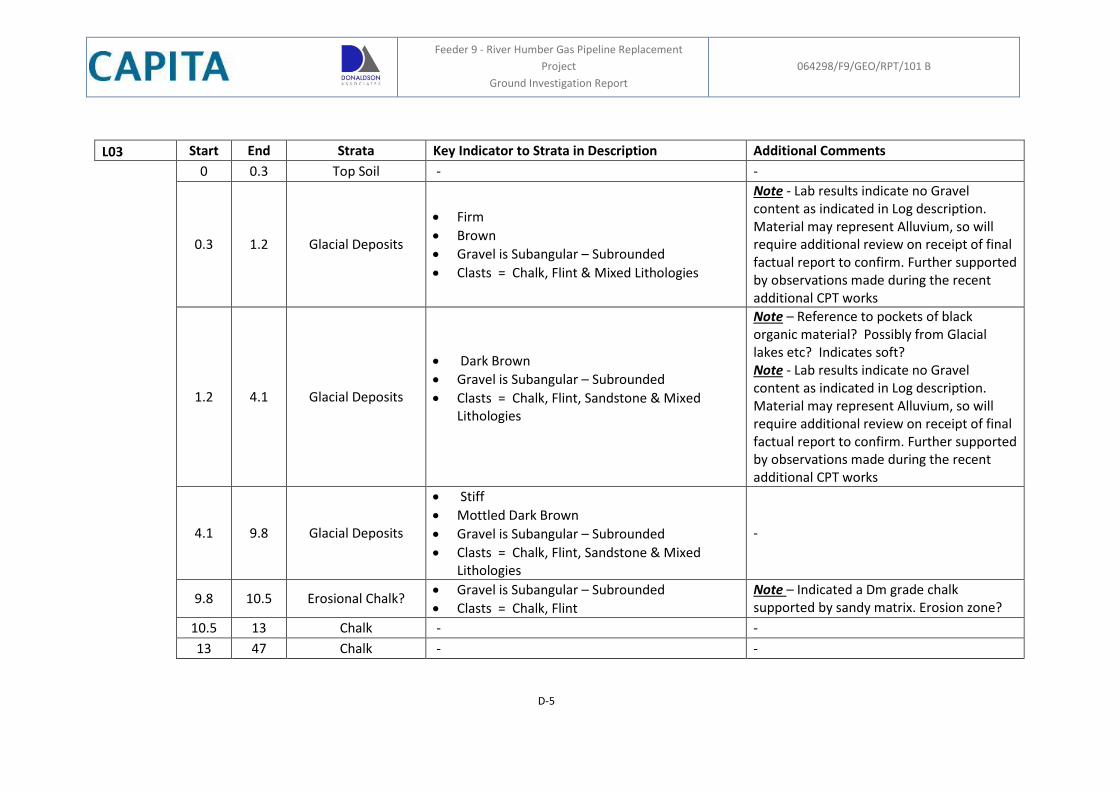
Feeder 9 - River Humber Gas Pipeline Replacement
Project
Ground Investigation Report
064298/F9/GEO/RPT/101 B
D-5
L03 Start End Strata Key Indicator to Strata in Description Additional Comments
0 0.3 Top Soil - -
0.3 1.2 Glacial Deposits
Firm
Brown
Gravel is Subangular – Subrounded
Clasts = Chalk, Flint & Mixed Lithologies
Note - Lab results indicate no Gravel content as indicated in Log description. Material may represent Alluvium, so will require additional review on receipt of final factual report to confirm. Further supported by observations made during the recent additional CPT works
1.2 4.1 Glacial Deposits
Dark Brown
Gravel is Subangular – Subrounded
Clasts = Chalk, Flint, Sandstone & Mixed Lithologies
Note – Reference to pockets of black organic material? Possibly from Glacial lakes etc? Indicates soft? Note - Lab results indicate no Gravel content as indicated in Log description. Material may represent Alluvium, so will require additional review on receipt of final factual report to confirm. Further supported by observations made during the recent additional CPT works
4.1 9.8 Glacial Deposits
Stiff
Mottled Dark Brown
Gravel is Subangular – Subrounded
Clasts = Chalk, Flint, Sandstone & Mixed Lithologies
-
9.8 10.5 Erosional Chalk? Gravel is Subangular – Subrounded
Clasts = Chalk, Flint
Note – Indicated a Dm grade chalk supported by sandy matrix. Erosion zone?
10.5 13 Chalk - -
13 47 Chalk - -
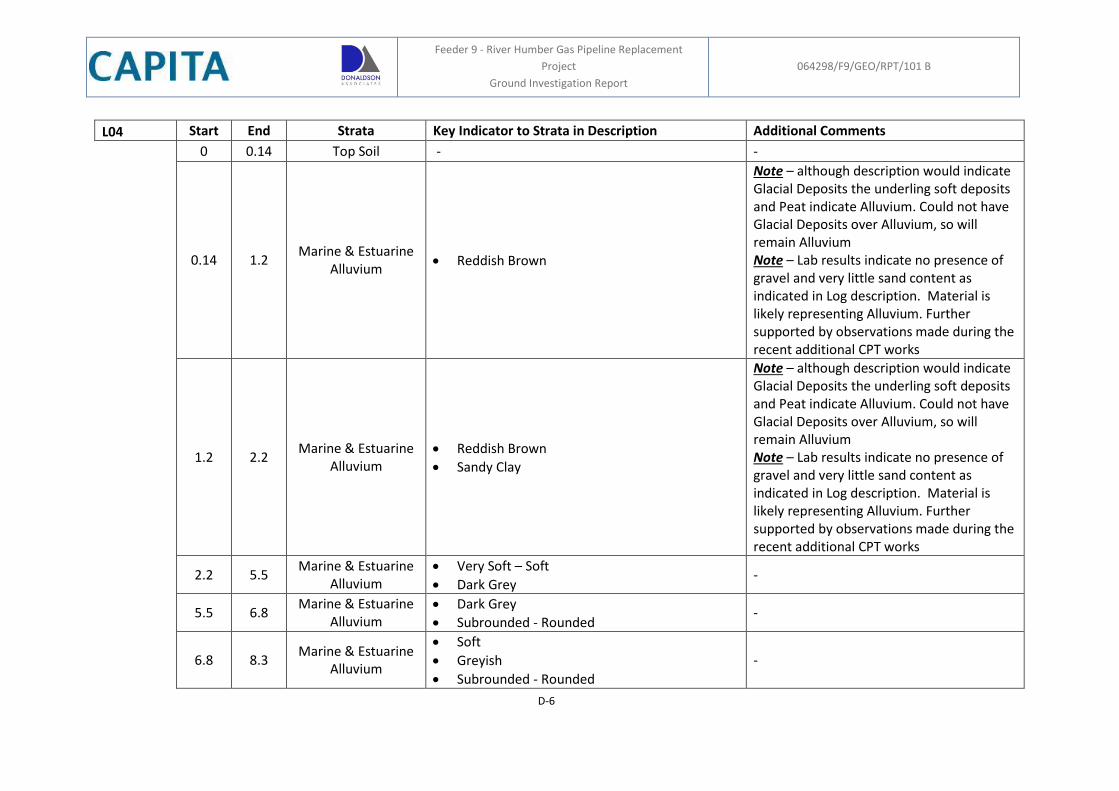
Feeder 9 - River Humber Gas Pipeline Replacement
Project
Ground Investigation Report
064298/F9/GEO/RPT/101 B
D-6
L04 Start End Strata Key Indicator to Strata in Description Additional Comments
0 0.14 Top Soil - -
0.14 1.2 Marine & Estuarine
Alluvium Reddish Brown
Note – although description would indicate Glacial Deposits the underling soft deposits and Peat indicate Alluvium. Could not have Glacial Deposits over Alluvium, so will remain Alluvium Note – Lab results indicate no presence of gravel and very little sand content as indicated in Log description. Material is likely representing Alluvium. Further supported by observations made during the recent additional CPT works
1.2 2.2 Marine & Estuarine
Alluvium Reddish Brown
Sandy Clay
Note – although description would indicate Glacial Deposits the underling soft deposits and Peat indicate Alluvium. Could not have Glacial Deposits over Alluvium, so will remain Alluvium Note – Lab results indicate no presence of gravel and very little sand content as indicated in Log description. Material is likely representing Alluvium. Further supported by observations made during the recent additional CPT works
2.2 5.5 Marine & Estuarine
Alluvium Very Soft – Soft
Dark Grey -
5.5 6.8 Marine & Estuarine
Alluvium Dark Grey
Subrounded - Rounded -
6.8 8.3 Marine & Estuarine
Alluvium
Soft
Greyish
Subrounded - Rounded
-
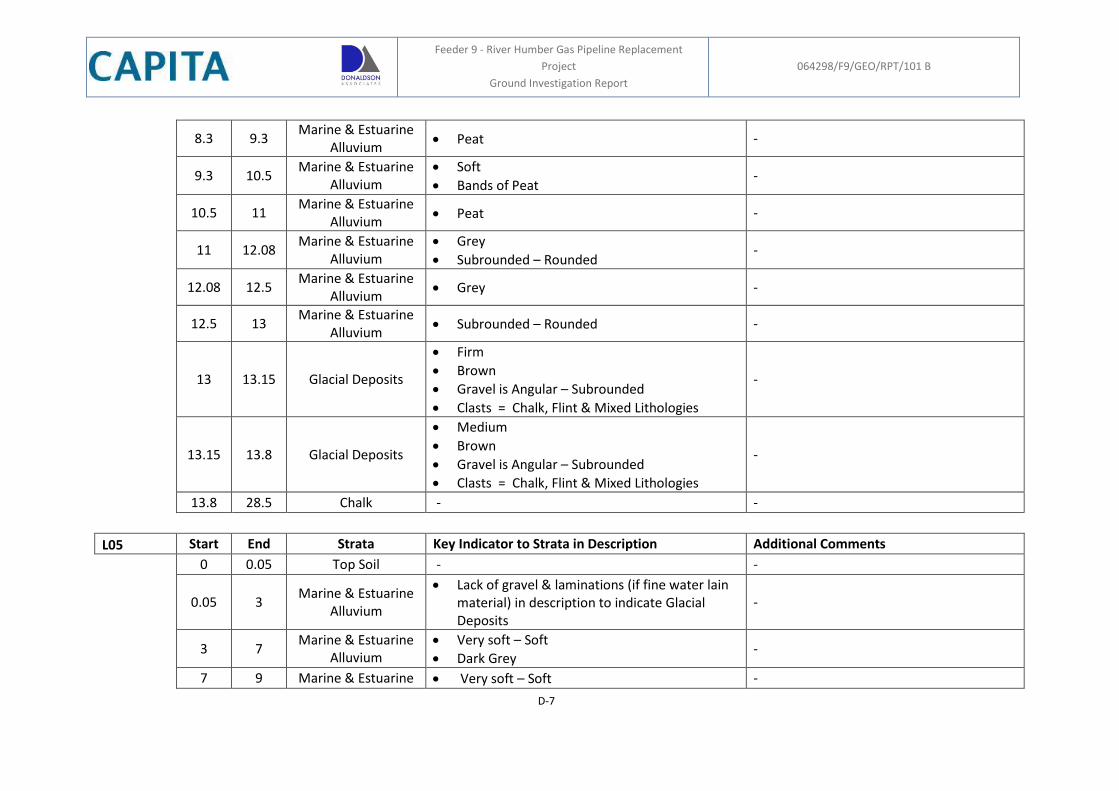
Feeder 9 - River Humber Gas Pipeline Replacement
Project
Ground Investigation Report
064298/F9/GEO/RPT/101 B
D-7
8.3 9.3 Marine & Estuarine
Alluvium Peat -
9.3 10.5 Marine & Estuarine
Alluvium Soft
Bands of Peat -
10.5 11 Marine & Estuarine
Alluvium Peat -
11 12.08 Marine & Estuarine
Alluvium Grey
Subrounded – Rounded -
12.08 12.5 Marine & Estuarine
Alluvium Grey -
12.5 13 Marine & Estuarine
Alluvium Subrounded – Rounded -
13 13.15 Glacial Deposits
Firm
Brown
Gravel is Angular – Subrounded
Clasts = Chalk, Flint & Mixed Lithologies
-
13.15 13.8 Glacial Deposits
Medium
Brown
Gravel is Angular – Subrounded
Clasts = Chalk, Flint & Mixed Lithologies
-
13.8 28.5 Chalk - -
L05 Start End Strata Key Indicator to Strata in Description Additional Comments
0 0.05 Top Soil - -
0.05 3 Marine & Estuarine
Alluvium
Lack of gravel & laminations (if fine water lain material) in description to indicate Glacial Deposits
-
3 7 Marine & Estuarine
Alluvium Very soft – Soft
Dark Grey -
7 9 Marine & Estuarine Very soft – Soft -
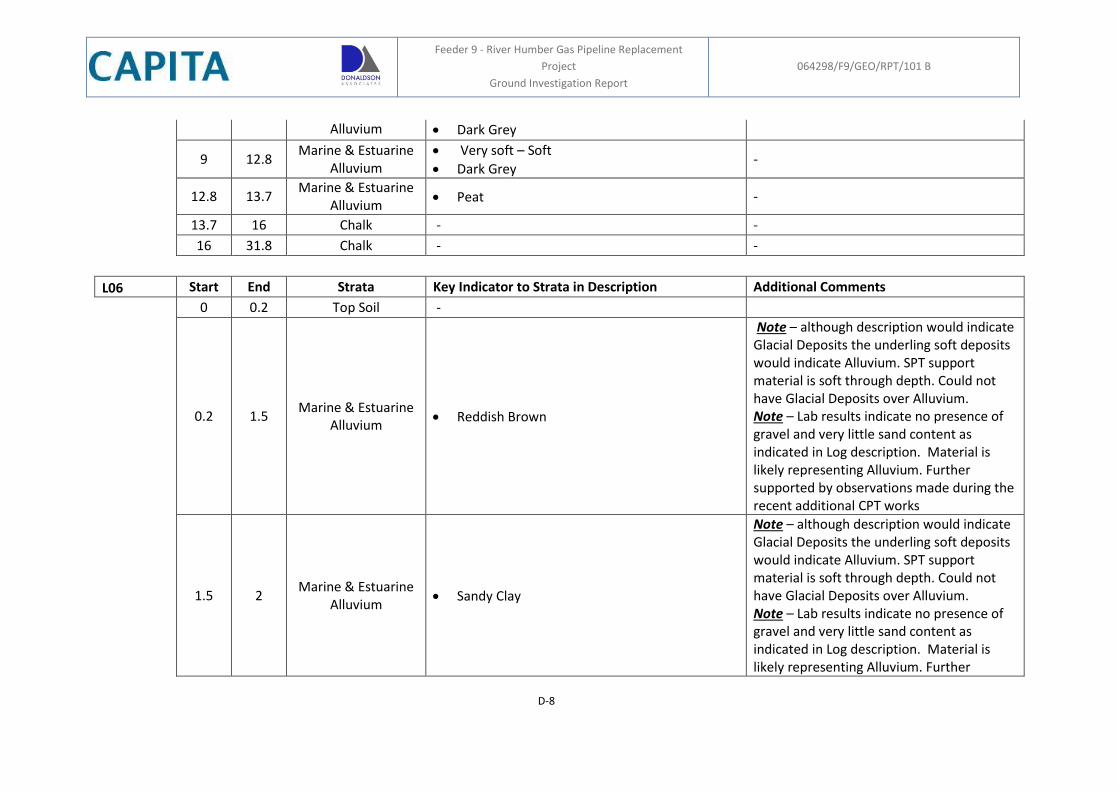
Feeder 9 - River Humber Gas Pipeline Replacement
Project
Ground Investigation Report
064298/F9/GEO/RPT/101 B
D-8
Alluvium Dark Grey
9 12.8 Marine & Estuarine
Alluvium Very soft – Soft
Dark Grey -
12.8 13.7 Marine & Estuarine
Alluvium Peat -
13.7 16 Chalk - -
16 31.8 Chalk - -
L06 Start End Strata Key Indicator to Strata in Description Additional Comments
0 0.2 Top Soil -
0.2 1.5 Marine & Estuarine
Alluvium Reddish Brown
Note – although description would indicate Glacial Deposits the underling soft deposits would indicate Alluvium. SPT support material is soft through depth. Could not have Glacial Deposits over Alluvium. Note – Lab results indicate no presence of gravel and very little sand content as indicated in Log description. Material is likely representing Alluvium. Further supported by observations made during the recent additional CPT works
1.5 2 Marine & Estuarine
Alluvium Sandy Clay
Note – although description would indicate Glacial Deposits the underling soft deposits would indicate Alluvium. SPT support material is soft through depth. Could not have Glacial Deposits over Alluvium. Note – Lab results indicate no presence of gravel and very little sand content as indicated in Log description. Material is likely representing Alluvium. Further
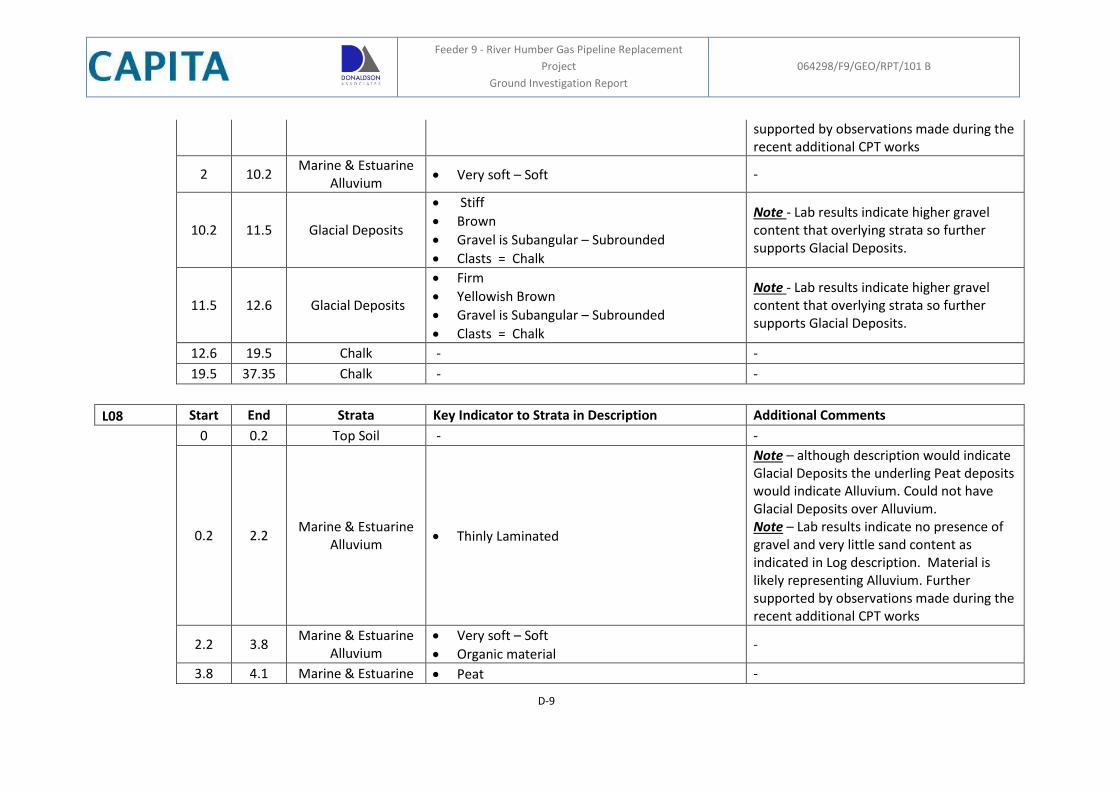
Feeder 9 - River Humber Gas Pipeline Replacement
Project
Ground Investigation Report
064298/F9/GEO/RPT/101 B
D-9
supported by observations made during the recent additional CPT works
2 10.2 Marine & Estuarine
Alluvium Very soft – Soft -
10.2 11.5 Glacial Deposits
Stiff
Brown
Gravel is Subangular – Subrounded
Clasts = Chalk
Note - Lab results indicate higher gravel content that overlying strata so further supports Glacial Deposits.
11.5 12.6 Glacial Deposits
Firm
Yellowish Brown
Gravel is Subangular – Subrounded
Clasts = Chalk
Note - Lab results indicate higher gravel content that overlying strata so further supports Glacial Deposits.
12.6 19.5 Chalk - -
19.5 37.35 Chalk - -
L08 Start End Strata Key Indicator to Strata in Description Additional Comments
0 0.2 Top Soil - -
0.2 2.2 Marine & Estuarine
Alluvium Thinly Laminated
Note – although description would indicate Glacial Deposits the underling Peat deposits would indicate Alluvium. Could not have Glacial Deposits over Alluvium. Note – Lab results indicate no presence of gravel and very little sand content as indicated in Log description. Material is likely representing Alluvium. Further supported by observations made during the recent additional CPT works
2.2 3.8 Marine & Estuarine
Alluvium Very soft – Soft
Organic material -
3.8 4.1 Marine & Estuarine Peat -
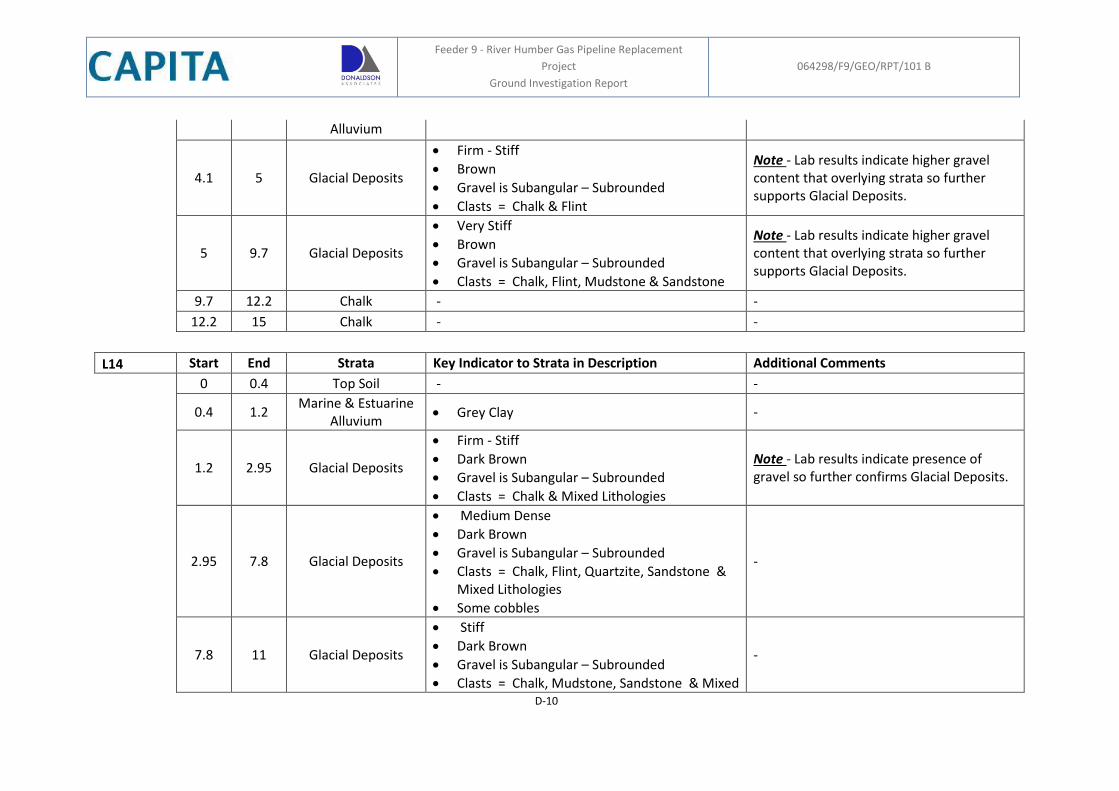
Feeder 9 - River Humber Gas Pipeline Replacement
Project
Ground Investigation Report
064298/F9/GEO/RPT/101 B
D-10
Alluvium
4.1 5 Glacial Deposits
Firm - Stiff
Brown
Gravel is Subangular – Subrounded
Clasts = Chalk & Flint
Note - Lab results indicate higher gravel content that overlying strata so further supports Glacial Deposits.
5 9.7 Glacial Deposits
Very Stiff
Brown
Gravel is Subangular – Subrounded
Clasts = Chalk, Flint, Mudstone & Sandstone
Note - Lab results indicate higher gravel content that overlying strata so further supports Glacial Deposits.
9.7 12.2 Chalk - -
12.2 15 Chalk - -
L14 Start End Strata Key Indicator to Strata in Description Additional Comments
0 0.4 Top Soil - -
0.4 1.2 Marine & Estuarine
Alluvium Grey Clay -
1.2 2.95 Glacial Deposits
Firm - Stiff
Dark Brown
Gravel is Subangular – Subrounded
Clasts = Chalk & Mixed Lithologies
Note - Lab results indicate presence of gravel so further confirms Glacial Deposits.
2.95 7.8 Glacial Deposits
Medium Dense
Dark Brown
Gravel is Subangular – Subrounded
Clasts = Chalk, Flint, Quartzite, Sandstone & Mixed Lithologies
Some cobbles
-
7.8 11 Glacial Deposits
Stiff
Dark Brown
Gravel is Subangular – Subrounded
Clasts = Chalk, Mudstone, Sandstone & Mixed
-
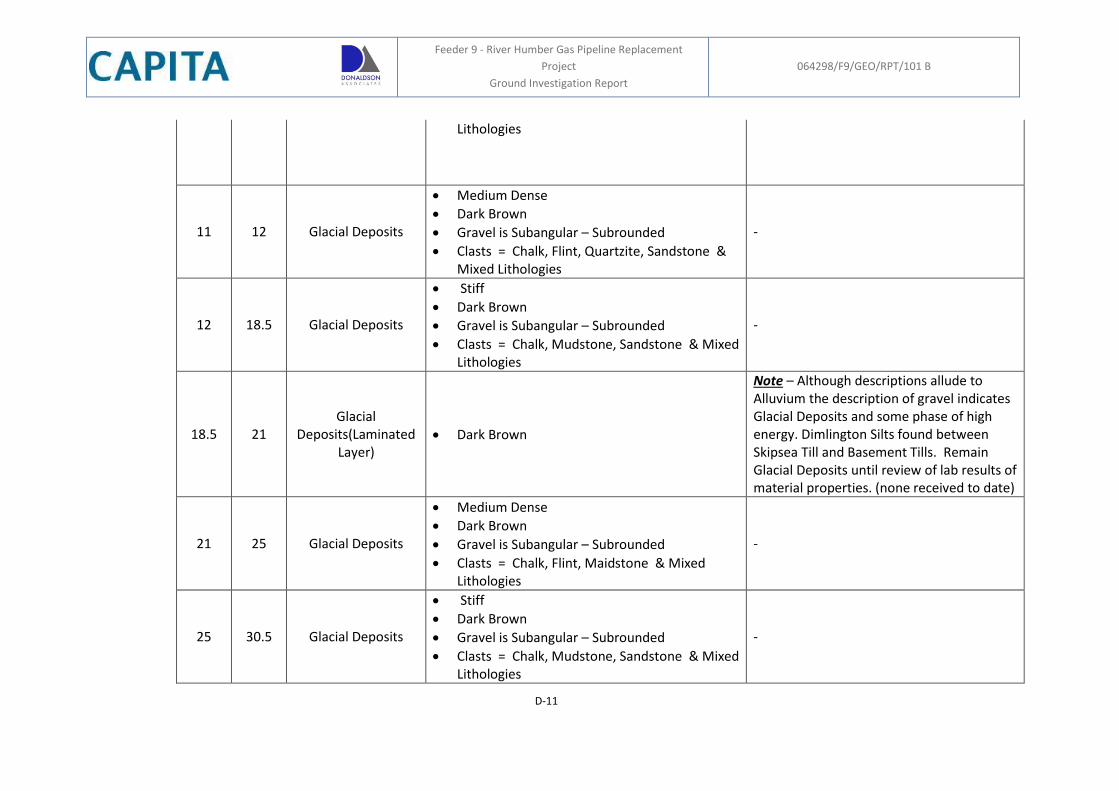
Feeder 9 - River Humber Gas Pipeline Replacement
Project
Ground Investigation Report
064298/F9/GEO/RPT/101 B
D-11
Lithologies
11 12 Glacial Deposits
Medium Dense
Dark Brown
Gravel is Subangular – Subrounded
Clasts = Chalk, Flint, Quartzite, Sandstone & Mixed Lithologies
-
12 18.5 Glacial Deposits
Stiff
Dark Brown
Gravel is Subangular – Subrounded
Clasts = Chalk, Mudstone, Sandstone & Mixed Lithologies
-
18.5 21 Glacial
Deposits(Laminated Layer)
Dark Brown
Note – Although descriptions allude to Alluvium the description of gravel indicates Glacial Deposits and some phase of high energy. Dimlington Silts found between Skipsea Till and Basement Tills. Remain Glacial Deposits until review of lab results of material properties. (none received to date)
21 25 Glacial Deposits
Medium Dense
Dark Brown
Gravel is Subangular – Subrounded
Clasts = Chalk, Flint, Maidstone & Mixed Lithologies
-
25 30.5 Glacial Deposits
Stiff
Dark Brown
Gravel is Subangular – Subrounded
Clasts = Chalk, Mudstone, Sandstone & Mixed Lithologies
-
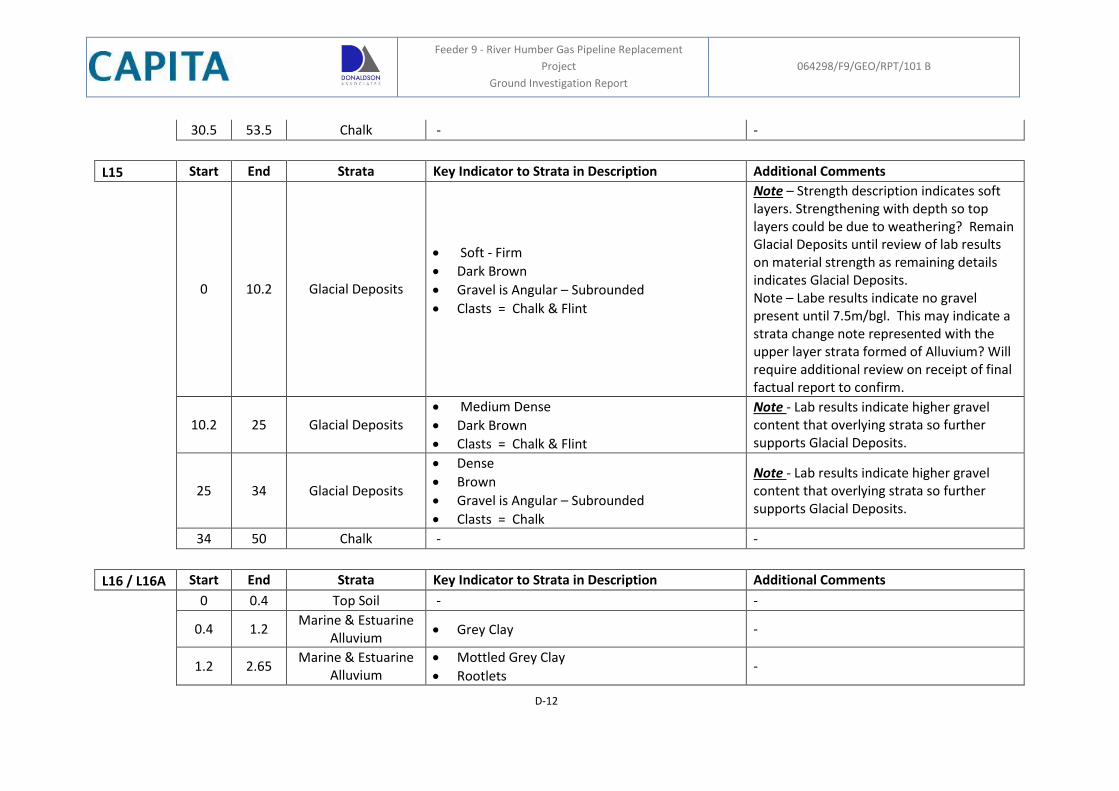
Feeder 9 - River Humber Gas Pipeline Replacement
Project
Ground Investigation Report
064298/F9/GEO/RPT/101 B
D-12
30.5 53.5 Chalk - -
L15 Start End Strata Key Indicator to Strata in Description Additional Comments
0 10.2 Glacial Deposits
Soft - Firm
Dark Brown
Gravel is Angular – Subrounded
Clasts = Chalk & Flint
Note – Strength description indicates soft layers. Strengthening with depth so top layers could be due to weathering? Remain Glacial Deposits until review of lab results on material strength as remaining details indicates Glacial Deposits. Note – Labe results indicate no gravel present until 7.5m/bgl. This may indicate a strata change note represented with the upper layer strata formed of Alluvium? Will require additional review on receipt of final factual report to confirm.
10.2 25 Glacial Deposits Medium Dense
Dark Brown
Clasts = Chalk & Flint
Note - Lab results indicate higher gravel content that overlying strata so further supports Glacial Deposits.
25 34 Glacial Deposits
Dense
Brown
Gravel is Angular – Subrounded
Clasts = Chalk
Note - Lab results indicate higher gravel content that overlying strata so further supports Glacial Deposits.
34 50 Chalk - -
L16 / L16A Start End Strata Key Indicator to Strata in Description Additional Comments
0 0.4 Top Soil - -
0.4 1.2 Marine & Estuarine
Alluvium Grey Clay -
1.2 2.65 Marine & Estuarine
Alluvium Mottled Grey Clay
Rootlets -
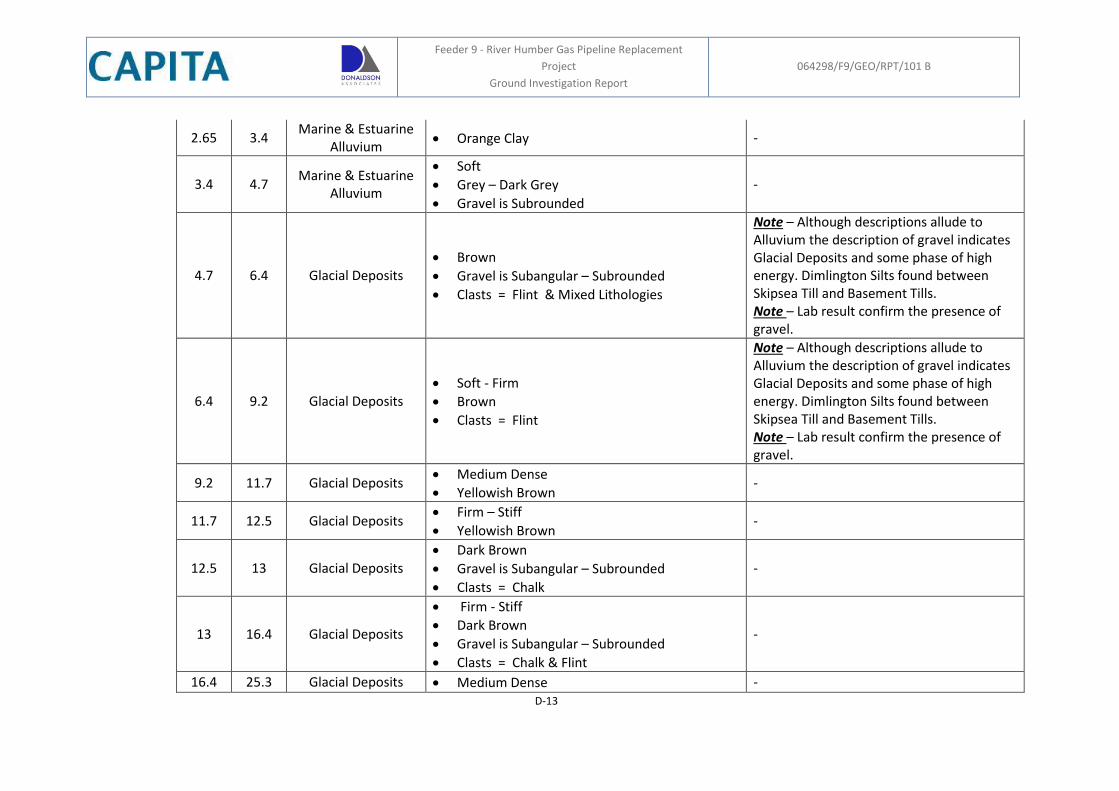
Feeder 9 - River Humber Gas Pipeline Replacement
Project
Ground Investigation Report
064298/F9/GEO/RPT/101 B
D-13
2.65 3.4 Marine & Estuarine
Alluvium Orange Clay -
3.4 4.7 Marine & Estuarine
Alluvium
Soft
Grey – Dark Grey
Gravel is Subrounded
-
4.7 6.4 Glacial Deposits Brown
Gravel is Subangular – Subrounded
Clasts = Flint & Mixed Lithologies
Note – Although descriptions allude to Alluvium the description of gravel indicates Glacial Deposits and some phase of high energy. Dimlington Silts found between Skipsea Till and Basement Tills. Note – Lab result confirm the presence of gravel.
6.4 9.2 Glacial Deposits Soft - Firm
Brown
Clasts = Flint
Note – Although descriptions allude to Alluvium the description of gravel indicates Glacial Deposits and some phase of high energy. Dimlington Silts found between Skipsea Till and Basement Tills. Note – Lab result confirm the presence of gravel.
9.2 11.7 Glacial Deposits Medium Dense
Yellowish Brown -
11.7 12.5 Glacial Deposits Firm – Stiff
Yellowish Brown -
12.5 13 Glacial Deposits Dark Brown
Gravel is Subangular – Subrounded
Clasts = Chalk
-
13 16.4 Glacial Deposits
Firm - Stiff
Dark Brown
Gravel is Subangular – Subrounded
Clasts = Chalk & Flint
-
16.4 25.3 Glacial Deposits Medium Dense -
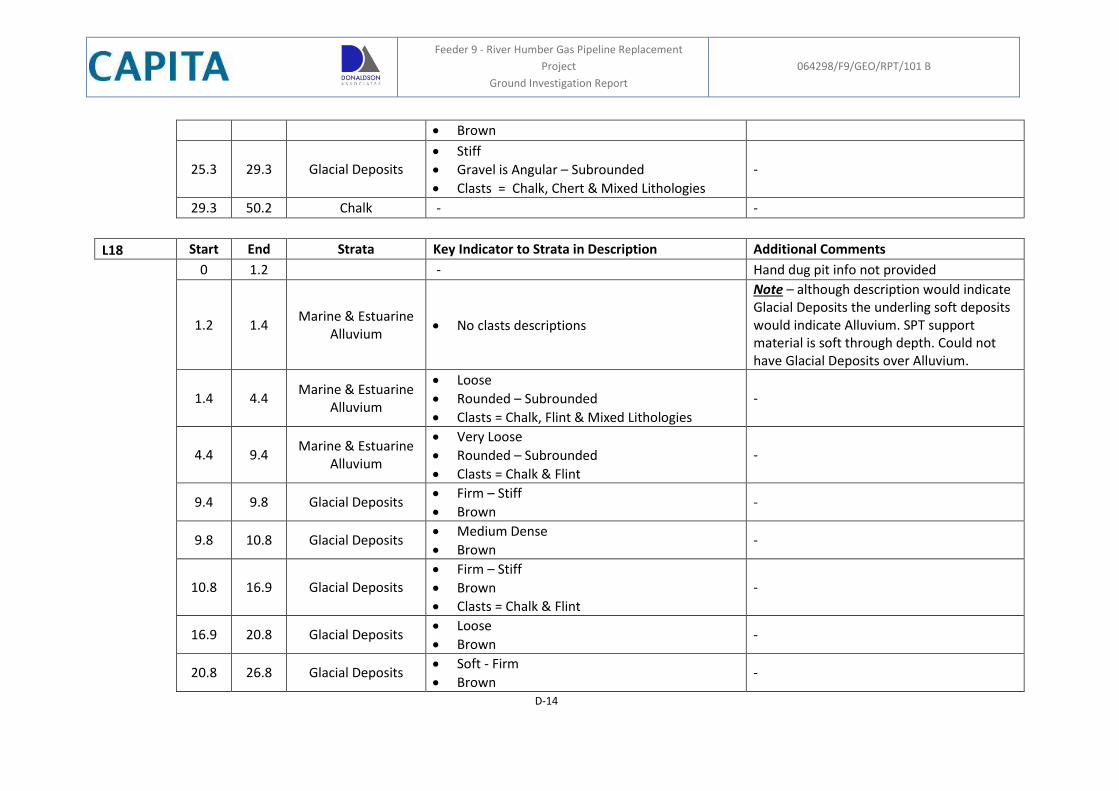
Feeder 9 - River Humber Gas Pipeline Replacement
Project
Ground Investigation Report
064298/F9/GEO/RPT/101 B
D-14
Brown
25.3 29.3 Glacial Deposits Stiff
Gravel is Angular – Subrounded
Clasts = Chalk, Chert & Mixed Lithologies
-
29.3 50.2 Chalk - -
L18 Start End Strata Key Indicator to Strata in Description Additional Comments
0 1.2
- Hand dug pit info not provided
1.2 1.4 Marine & Estuarine
Alluvium No clasts descriptions
Note – although description would indicate Glacial Deposits the underling soft deposits would indicate Alluvium. SPT support material is soft through depth. Could not have Glacial Deposits over Alluvium.
1.4 4.4 Marine & Estuarine
Alluvium
Loose
Rounded – Subrounded
Clasts = Chalk, Flint & Mixed Lithologies
-
4.4 9.4 Marine & Estuarine
Alluvium
Very Loose
Rounded – Subrounded
Clasts = Chalk & Flint
-
9.4 9.8 Glacial Deposits Firm – Stiff
Brown -
9.8 10.8 Glacial Deposits Medium Dense
Brown -
10.8 16.9 Glacial Deposits Firm – Stiff
Brown
Clasts = Chalk & Flint
-
16.9 20.8 Glacial Deposits Loose
Brown -
20.8 26.8 Glacial Deposits Soft - Firm
Brown -
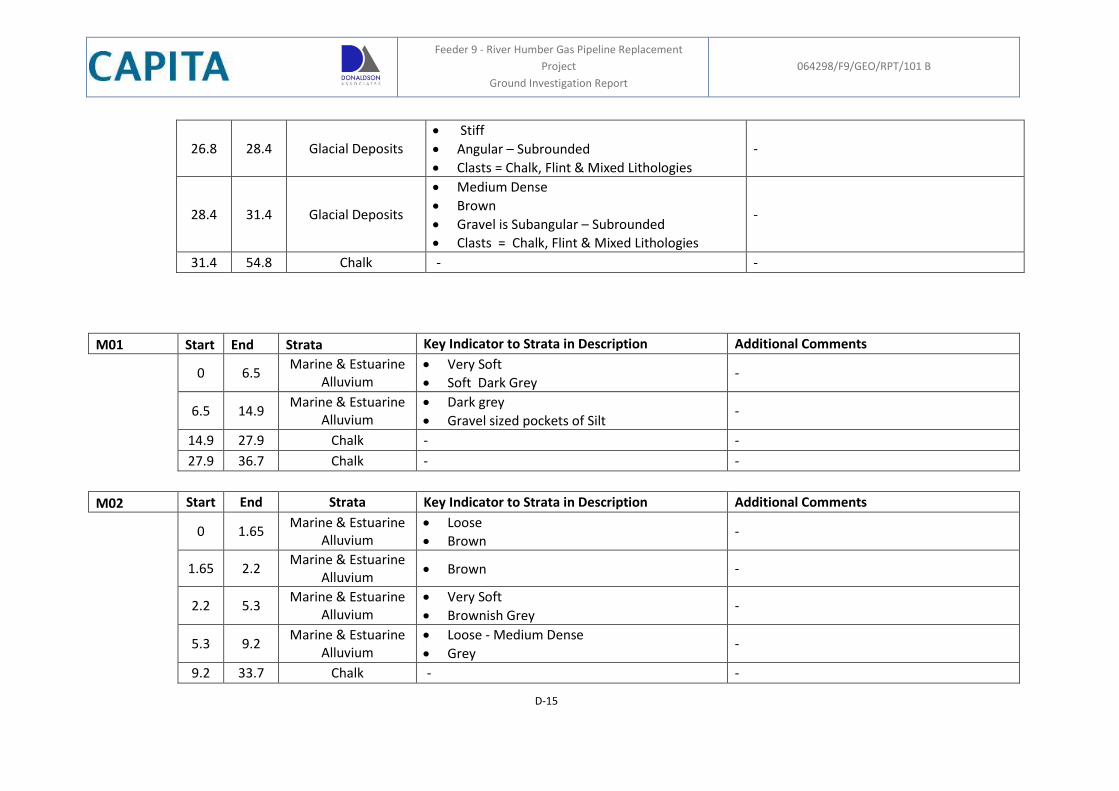
Feeder 9 - River Humber Gas Pipeline Replacement
Project
Ground Investigation Report
064298/F9/GEO/RPT/101 B
D-15
26.8 28.4 Glacial Deposits Stiff
Angular – Subrounded
Clasts = Chalk, Flint & Mixed Lithologies
-
28.4 31.4 Glacial Deposits
Medium Dense
Brown
Gravel is Subangular – Subrounded
Clasts = Chalk, Flint & Mixed Lithologies
-
31.4 54.8 Chalk - -
M01 Start End Strata Key Indicator to Strata in Description Additional Comments
0 6.5 Marine & Estuarine
Alluvium Very Soft
Soft Dark Grey -
6.5 14.9 Marine & Estuarine
Alluvium Dark grey
Gravel sized pockets of Silt -
14.9 27.9 Chalk - -
27.9 36.7 Chalk - -
M02 Start End Strata Key Indicator to Strata in Description Additional Comments
0 1.65 Marine & Estuarine
Alluvium Loose
Brown -
1.65 2.2 Marine & Estuarine
Alluvium Brown -
2.2 5.3 Marine & Estuarine
Alluvium Very Soft
Brownish Grey -
5.3 9.2 Marine & Estuarine
Alluvium Loose - Medium Dense
Grey -
9.2 33.7 Chalk - -
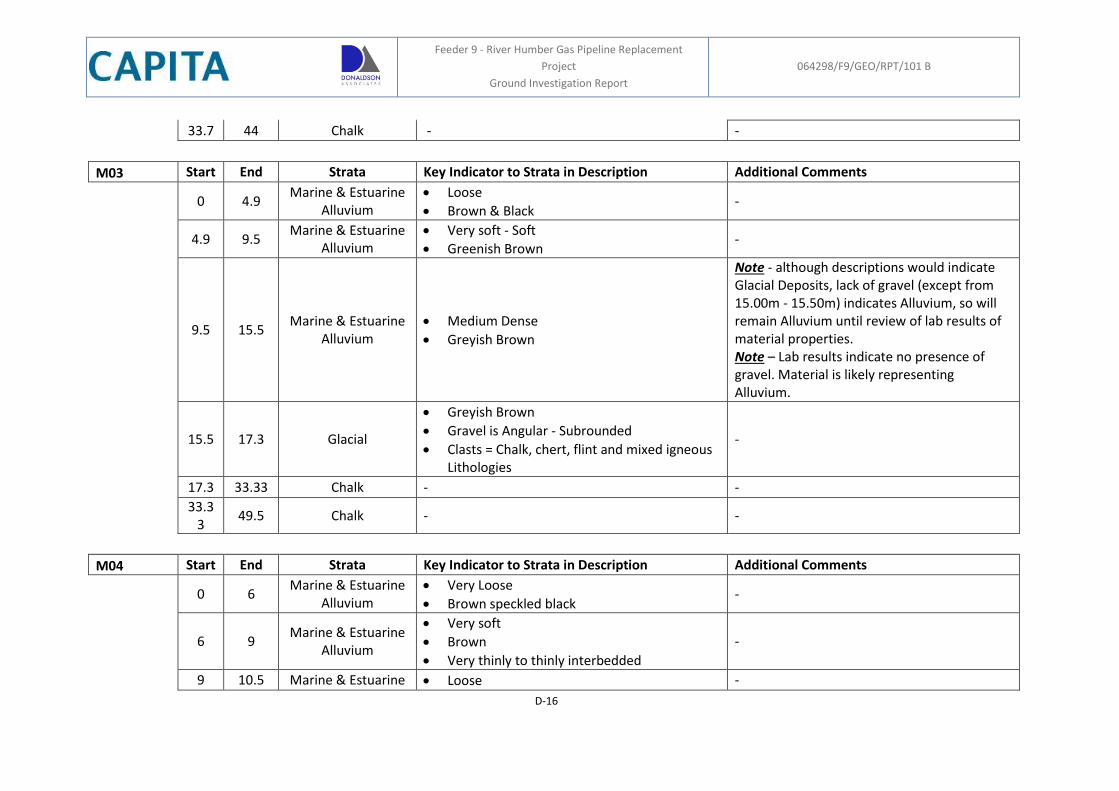
Feeder 9 - River Humber Gas Pipeline Replacement
Project
Ground Investigation Report
064298/F9/GEO/RPT/101 B
D-16
33.7 44 Chalk - -
M03 Start End Strata Key Indicator to Strata in Description Additional Comments
0 4.9 Marine & Estuarine
Alluvium Loose
Brown & Black -
4.9 9.5 Marine & Estuarine
Alluvium Very soft - Soft
Greenish Brown -
9.5 15.5 Marine & Estuarine
Alluvium Medium Dense
Greyish Brown
Note - although descriptions would indicate Glacial Deposits, lack of gravel (except from 15.00m - 15.50m) indicates Alluvium, so will remain Alluvium until review of lab results of material properties. Note – Lab results indicate no presence of gravel. Material is likely representing Alluvium.
15.5 17.3 Glacial
Greyish Brown
Gravel is Angular - Subrounded
Clasts = Chalk, chert, flint and mixed igneous Lithologies
-
17.3 33.33 Chalk - -
33.33
49.5 Chalk - -
M04 Start End Strata Key Indicator to Strata in Description Additional Comments
0 6 Marine & Estuarine
Alluvium Very Loose
Brown speckled black -
6 9 Marine & Estuarine
Alluvium
Very soft
Brown
Very thinly to thinly interbedded
-
9 10.5 Marine & Estuarine Loose -
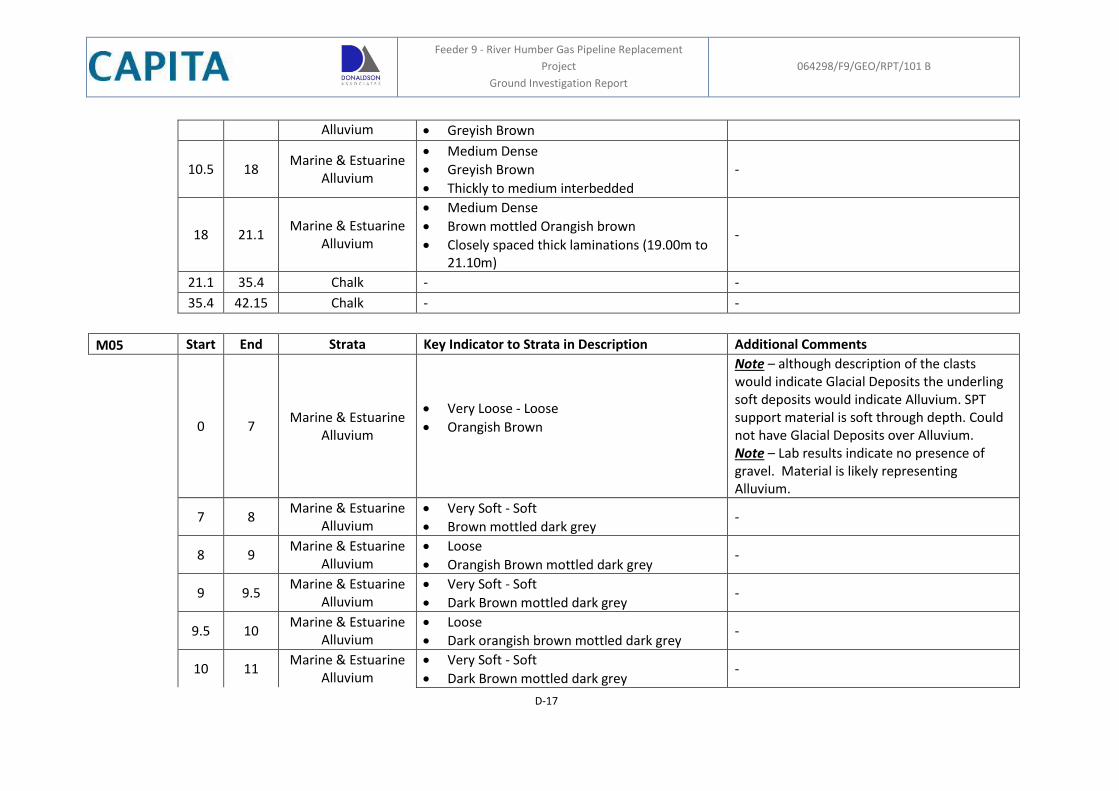
Feeder 9 - River Humber Gas Pipeline Replacement
Project
Ground Investigation Report
064298/F9/GEO/RPT/101 B
D-17
Alluvium Greyish Brown
10.5 18 Marine & Estuarine
Alluvium
Medium Dense
Greyish Brown
Thickly to medium interbedded
-
18 21.1 Marine & Estuarine
Alluvium
Medium Dense
Brown mottled Orangish brown
Closely spaced thick laminations (19.00m to 21.10m)
-
21.1 35.4 Chalk - -
35.4 42.15 Chalk - -
M05 Start End Strata Key Indicator to Strata in Description Additional Comments
0 7 Marine & Estuarine
Alluvium
Very Loose - Loose
Orangish Brown
Note – although description of the clasts would indicate Glacial Deposits the underling soft deposits would indicate Alluvium. SPT support material is soft through depth. Could not have Glacial Deposits over Alluvium. Note – Lab results indicate no presence of gravel. Material is likely representing Alluvium.
7 8 Marine & Estuarine
Alluvium Very Soft - Soft
Brown mottled dark grey -
8 9 Marine & Estuarine
Alluvium Loose
Orangish Brown mottled dark grey -
9 9.5 Marine & Estuarine
Alluvium Very Soft - Soft
Dark Brown mottled dark grey -
9.5 10 Marine & Estuarine
Alluvium Loose
Dark orangish brown mottled dark grey -
10 11 Marine & Estuarine
Alluvium Very Soft - Soft
Dark Brown mottled dark grey -
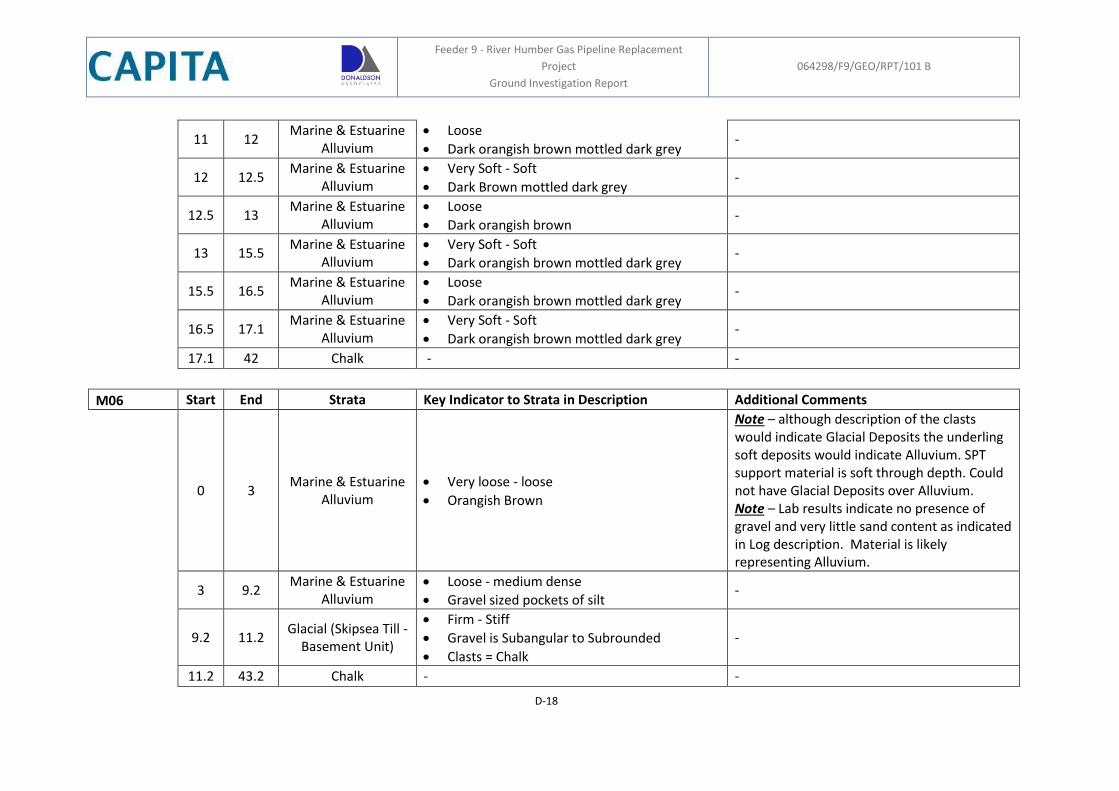
Feeder 9 - River Humber Gas Pipeline Replacement
Project
Ground Investigation Report
064298/F9/GEO/RPT/101 B
D-18
11 12 Marine & Estuarine
Alluvium Loose
Dark orangish brown mottled dark grey -
12 12.5 Marine & Estuarine
Alluvium Very Soft - Soft
Dark Brown mottled dark grey -
12.5 13 Marine & Estuarine
Alluvium Loose
Dark orangish brown -
13 15.5 Marine & Estuarine
Alluvium Very Soft - Soft
Dark orangish brown mottled dark grey -
15.5 16.5 Marine & Estuarine
Alluvium Loose
Dark orangish brown mottled dark grey -
16.5 17.1 Marine & Estuarine
Alluvium Very Soft - Soft
Dark orangish brown mottled dark grey -
17.1 42 Chalk - -
M06 Start End Strata Key Indicator to Strata in Description Additional Comments
0 3 Marine & Estuarine
Alluvium Very loose - loose
Orangish Brown
Note – although description of the clasts would indicate Glacial Deposits the underling soft deposits would indicate Alluvium. SPT support material is soft through depth. Could not have Glacial Deposits over Alluvium. Note – Lab results indicate no presence of gravel and very little sand content as indicated in Log description. Material is likely representing Alluvium.
3 9.2 Marine & Estuarine
Alluvium Loose - medium dense
Gravel sized pockets of silt -
9.2 11.2 Glacial (Skipsea Till -
Basement Unit)
Firm - Stiff
Gravel is Subangular to Subrounded
Clasts = Chalk
-
11.2 43.2 Chalk - -
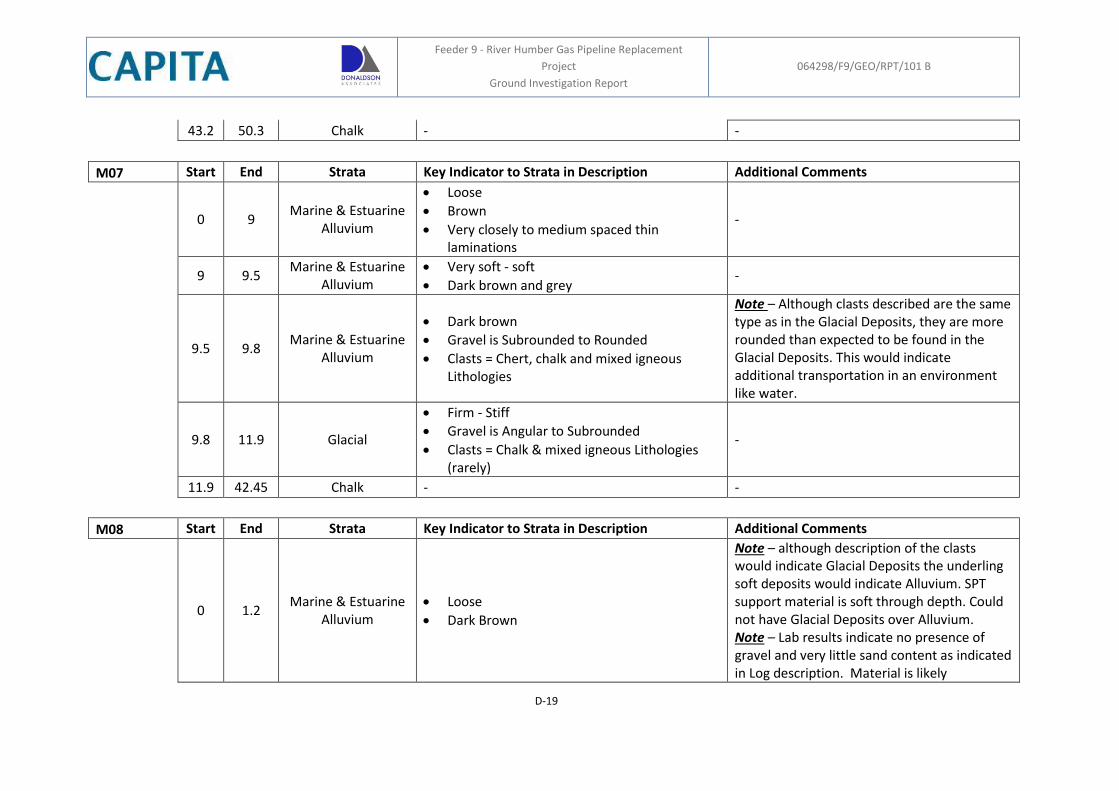
Feeder 9 - River Humber Gas Pipeline Replacement
Project
Ground Investigation Report
064298/F9/GEO/RPT/101 B
D-19
43.2 50.3 Chalk - -
M07 Start End Strata Key Indicator to Strata in Description Additional Comments
0 9 Marine & Estuarine
Alluvium
Loose
Brown
Very closely to medium spaced thin laminations
-
9 9.5 Marine & Estuarine
Alluvium Very soft - soft
Dark brown and grey -
9.5 9.8 Marine & Estuarine
Alluvium
Dark brown
Gravel is Subrounded to Rounded
Clasts = Chert, chalk and mixed igneous Lithologies
Note – Although clasts described are the same type as in the Glacial Deposits, they are more rounded than expected to be found in the Glacial Deposits. This would indicate additional transportation in an environment like water.
9.8 11.9 Glacial
Firm - Stiff
Gravel is Angular to Subrounded
Clasts = Chalk & mixed igneous Lithologies (rarely)
-
11.9 42.45 Chalk - -
M08 Start End Strata Key Indicator to Strata in Description Additional Comments
0 1.2 Marine & Estuarine
Alluvium Loose
Dark Brown
Note – although description of the clasts would indicate Glacial Deposits the underling soft deposits would indicate Alluvium. SPT support material is soft through depth. Could not have Glacial Deposits over Alluvium. Note – Lab results indicate no presence of gravel and very little sand content as indicated in Log description. Material is likely
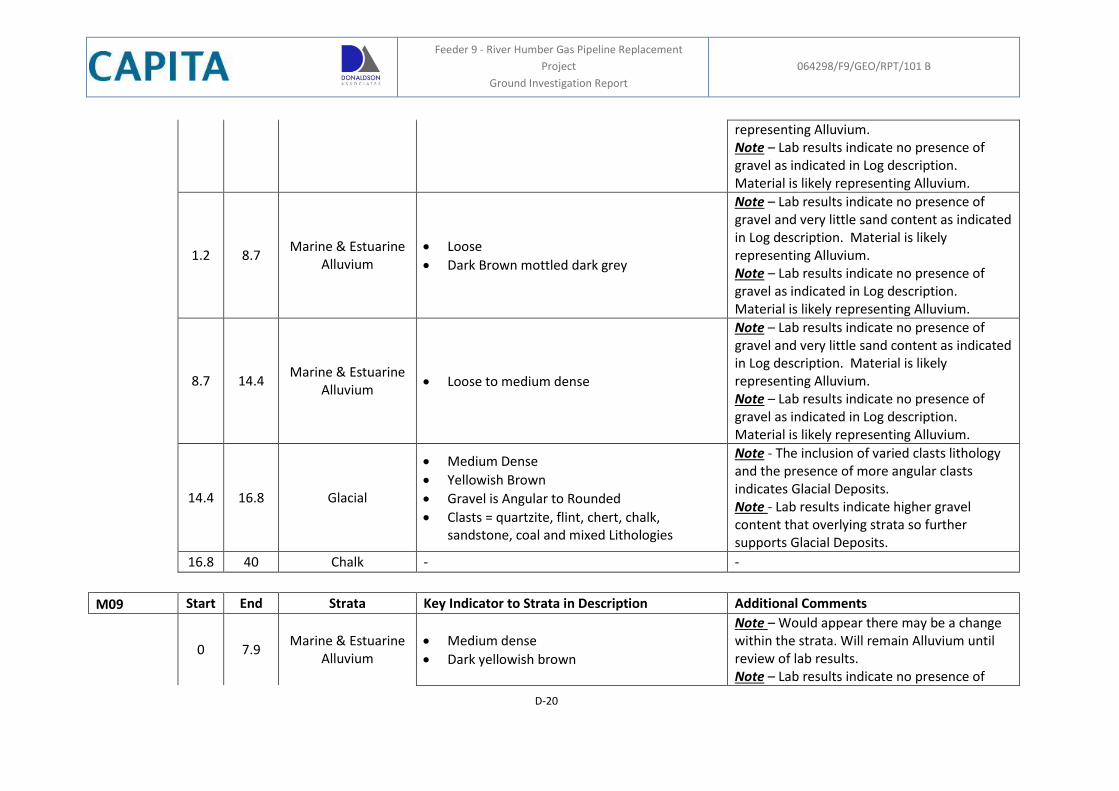
Feeder 9 - River Humber Gas Pipeline Replacement
Project
Ground Investigation Report
064298/F9/GEO/RPT/101 B
D-20
representing Alluvium. Note – Lab results indicate no presence of gravel as indicated in Log description. Material is likely representing Alluvium.
1.2 8.7 Marine & Estuarine
Alluvium Loose
Dark Brown mottled dark grey
Note – Lab results indicate no presence of gravel and very little sand content as indicated in Log description. Material is likely representing Alluvium. Note – Lab results indicate no presence of gravel as indicated in Log description. Material is likely representing Alluvium.
8.7 14.4 Marine & Estuarine
Alluvium Loose to medium dense
Note – Lab results indicate no presence of gravel and very little sand content as indicated in Log description. Material is likely representing Alluvium. Note – Lab results indicate no presence of gravel as indicated in Log description. Material is likely representing Alluvium.
14.4 16.8 Glacial
Medium Dense
Yellowish Brown
Gravel is Angular to Rounded
Clasts = quartzite, flint, chert, chalk, sandstone, coal and mixed Lithologies
Note - The inclusion of varied clasts lithology and the presence of more angular clasts indicates Glacial Deposits. Note - Lab results indicate higher gravel content that overlying strata so further supports Glacial Deposits.
16.8 40 Chalk - -
M09 Start End Strata Key Indicator to Strata in Description Additional Comments
0 7.9 Marine & Estuarine
Alluvium Medium dense
Dark yellowish brown
Note – Would appear there may be a change within the strata. Will remain Alluvium until review of lab results. Note – Lab results indicate no presence of
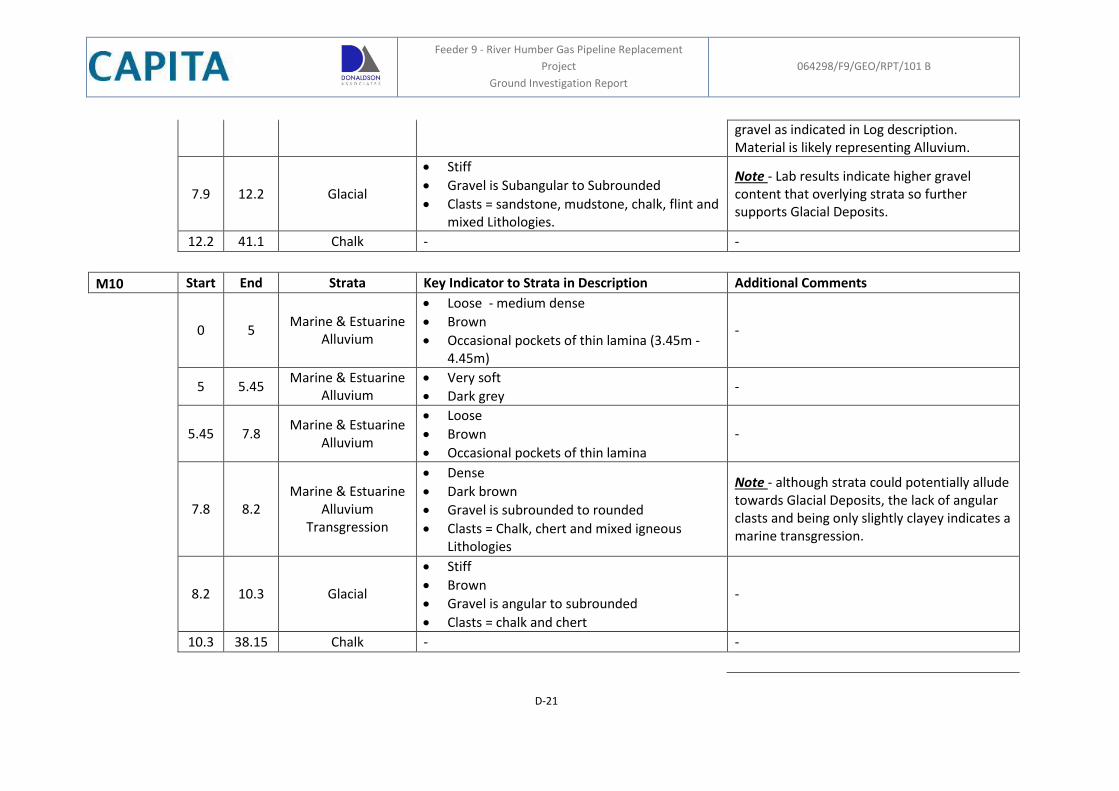
Feeder 9 - River Humber Gas Pipeline Replacement
Project
Ground Investigation Report
064298/F9/GEO/RPT/101 B
D-21
gravel as indicated in Log description. Material is likely representing Alluvium.
7.9 12.2 Glacial
Stiff
Gravel is Subangular to Subrounded
Clasts = sandstone, mudstone, chalk, flint and mixed Lithologies.
Note - Lab results indicate higher gravel content that overlying strata so further supports Glacial Deposits.
12.2 41.1 Chalk - -
M10 Start End Strata Key Indicator to Strata in Description Additional Comments
0 5 Marine & Estuarine
Alluvium
Loose - medium dense
Brown
Occasional pockets of thin lamina (3.45m - 4.45m)
-
5 5.45 Marine & Estuarine
Alluvium Very soft
Dark grey -
5.45 7.8 Marine & Estuarine
Alluvium
Loose
Brown
Occasional pockets of thin lamina
-
7.8 8.2 Marine & Estuarine
Alluvium Transgression
Dense
Dark brown
Gravel is subrounded to rounded
Clasts = Chalk, chert and mixed igneous Lithologies
Note - although strata could potentially allude towards Glacial Deposits, the lack of angular clasts and being only slightly clayey indicates a marine transgression.
8.2 10.3 Glacial
Stiff
Brown
Gravel is angular to subrounded
Clasts = chalk and chert
-
10.3 38.15 Chalk - -
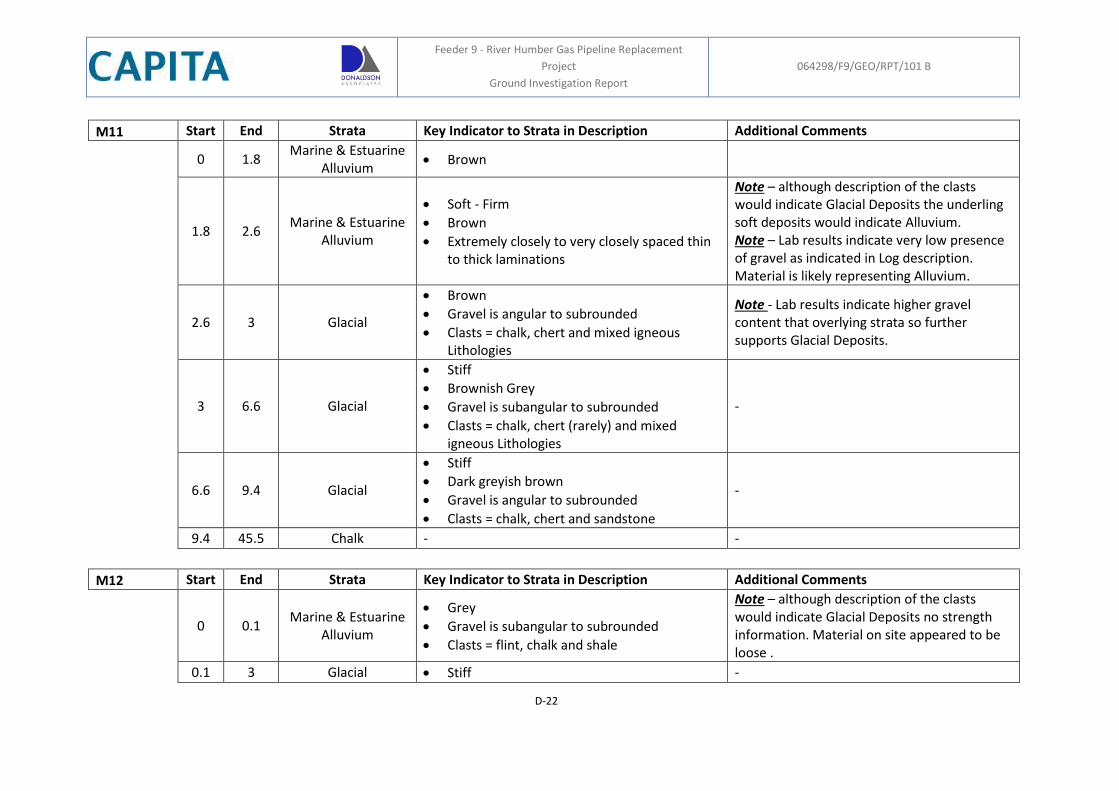
Feeder 9 - River Humber Gas Pipeline Replacement
Project
Ground Investigation Report
064298/F9/GEO/RPT/101 B
D-22
M11 Start End Strata Key Indicator to Strata in Description Additional Comments
0 1.8 Marine & Estuarine
Alluvium Brown
1.8 2.6 Marine & Estuarine
Alluvium
Soft - Firm
Brown
Extremely closely to very closely spaced thin to thick laminations
Note – although description of the clasts would indicate Glacial Deposits the underling soft deposits would indicate Alluvium. Note – Lab results indicate very low presence of gravel as indicated in Log description. Material is likely representing Alluvium.
2.6 3 Glacial
Brown
Gravel is angular to subrounded
Clasts = chalk, chert and mixed igneous Lithologies
Note - Lab results indicate higher gravel content that overlying strata so further supports Glacial Deposits.
3 6.6 Glacial
Stiff
Brownish Grey
Gravel is subangular to subrounded
Clasts = chalk, chert (rarely) and mixed igneous Lithologies
-
6.6 9.4 Glacial
Stiff
Dark greyish brown
Gravel is angular to subrounded
Clasts = chalk, chert and sandstone
-
9.4 45.5 Chalk - -
M12 Start End Strata Key Indicator to Strata in Description Additional Comments
0 0.1 Marine & Estuarine
Alluvium
Grey
Gravel is subangular to subrounded
Clasts = flint, chalk and shale
Note – although description of the clasts would indicate Glacial Deposits no strength information. Material on site appeared to be loose .
0.1 3 Glacial Stiff -
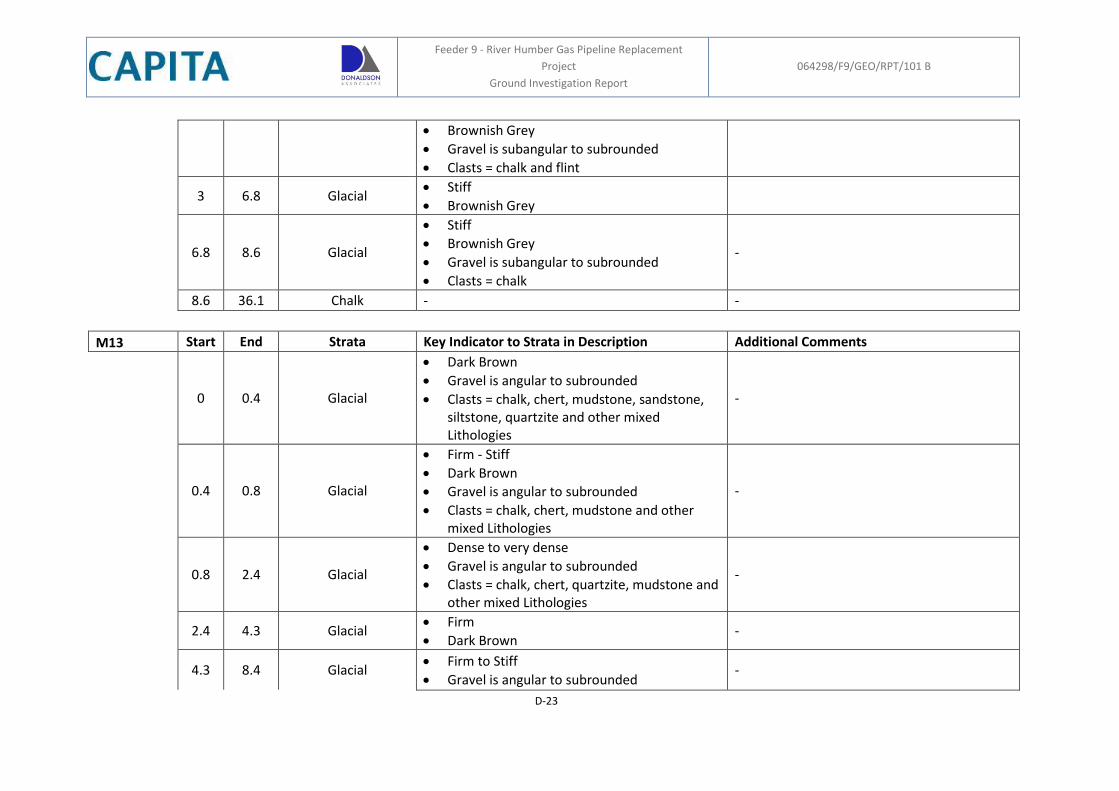
Feeder 9 - River Humber Gas Pipeline Replacement
Project
Ground Investigation Report
064298/F9/GEO/RPT/101 B
D-23
Brownish Grey
Gravel is subangular to subrounded
Clasts = chalk and flint
3 6.8 Glacial Stiff
Brownish Grey
6.8 8.6 Glacial
Stiff
Brownish Grey
Gravel is subangular to subrounded
Clasts = chalk
-
8.6 36.1 Chalk - -
M13 Start End Strata Key Indicator to Strata in Description Additional Comments
0 0.4 Glacial
Dark Brown
Gravel is angular to subrounded
Clasts = chalk, chert, mudstone, sandstone, siltstone, quartzite and other mixed Lithologies
-
0.4 0.8 Glacial
Firm - Stiff
Dark Brown
Gravel is angular to subrounded
Clasts = chalk, chert, mudstone and other mixed Lithologies
-
0.8 2.4 Glacial
Dense to very dense
Gravel is angular to subrounded
Clasts = chalk, chert, quartzite, mudstone and other mixed Lithologies
-
2.4 4.3 Glacial Firm
Dark Brown -
4.3 8.4 Glacial Firm to Stiff
Gravel is angular to subrounded -
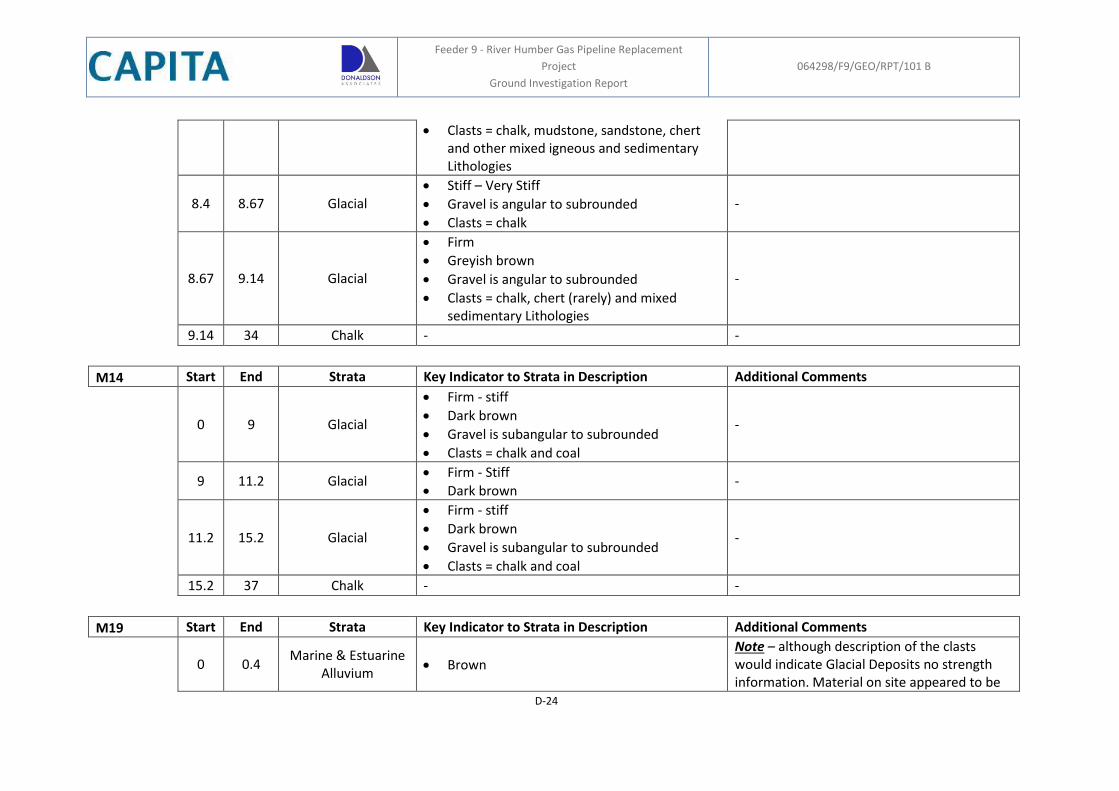
Feeder 9 - River Humber Gas Pipeline Replacement
Project
Ground Investigation Report
064298/F9/GEO/RPT/101 B
D-24
Clasts = chalk, mudstone, sandstone, chert and other mixed igneous and sedimentary Lithologies
8.4 8.67 Glacial Stiff – Very Stiff
Gravel is angular to subrounded
Clasts = chalk
-
8.67 9.14 Glacial
Firm
Greyish brown
Gravel is angular to subrounded
Clasts = chalk, chert (rarely) and mixed sedimentary Lithologies
-
9.14 34 Chalk - -
M14 Start End Strata Key Indicator to Strata in Description Additional Comments
0 9 Glacial
Firm - stiff
Dark brown
Gravel is subangular to subrounded
Clasts = chalk and coal
-
9 11.2 Glacial Firm - Stiff
Dark brown -
11.2 15.2 Glacial
Firm - stiff
Dark brown
Gravel is subangular to subrounded
Clasts = chalk and coal
-
15.2 37 Chalk - -
M19 Start End Strata Key Indicator to Strata in Description Additional Comments
0 0.4 Marine & Estuarine
Alluvium Brown
Note – although description of the clasts would indicate Glacial Deposits no strength information. Material on site appeared to be
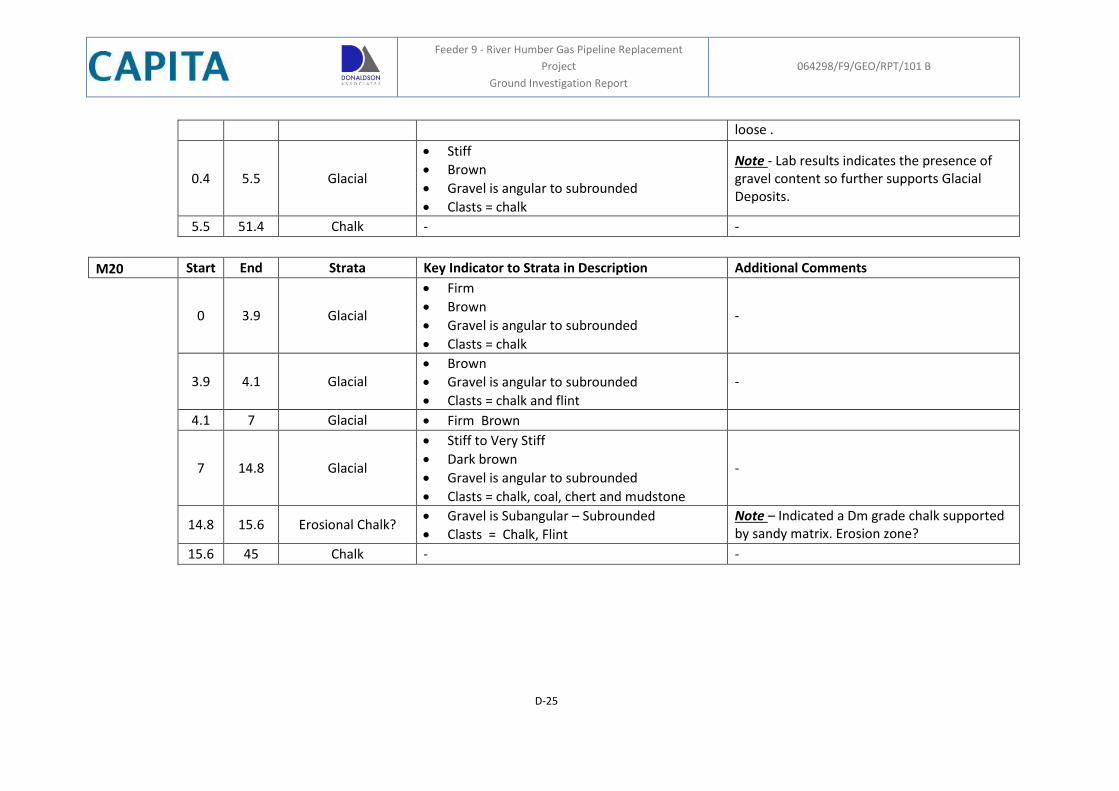
Feeder 9 - River Humber Gas Pipeline Replacement
Project
Ground Investigation Report
064298/F9/GEO/RPT/101 B
D-25
loose .
0.4 5.5 Glacial
Stiff
Brown
Gravel is angular to subrounded
Clasts = chalk
Note - Lab results indicates the presence of gravel content so further supports Glacial Deposits.
5.5 51.4 Chalk - -
M20 Start End Strata Key Indicator to Strata in Description Additional Comments
0 3.9 Glacial
Firm
Brown
Gravel is angular to subrounded
Clasts = chalk
-
3.9 4.1 Glacial Brown
Gravel is angular to subrounded
Clasts = chalk and flint
-
4.1 7 Glacial Firm Brown
7 14.8 Glacial
Stiff to Very Stiff
Dark brown
Gravel is angular to subrounded
Clasts = chalk, coal, chert and mudstone
-
14.8 15.6 Erosional Chalk? Gravel is Subangular – Subrounded
Clasts = Chalk, Flint
Note – Indicated a Dm grade chalk supported by sandy matrix. Erosion zone?
15.6 45 Chalk - -