Embed Size (px)
Citation preview
Adveritas Limited (ASX: AV1) U10, 16 Brodie Hall Drive
Bentley WA 6102 +61 8 9473 2500
APPENDIX 4E Reporting period Current period: Year ended 30 June 2020 Previous corresponding period: Year ended 30 June 2019
Results for announcement to market
Continuing Operations: Revenue from ordinary activities
up 91% To $1,227,213 from $643,579
Continuing Operations: Loss from ordinary activities after tax attributable to members
up 43% to ($9,487,359) from ($6,644,420)
Net loss for the period attributable to members
up 45% to ($9,487,359) from ($6,552,197)
Dividends
Amount per share
Franked amount per share
Final $ nil n/a
Interim $ nil n/a
Record date for determining entitlements to dividends: n/a
Brief explanation necessary to enable the figures above to be understood
Refer to the Directors’ Report included in the attached Financial Statements.
Net tangible assets 30 June 2020 Net tangible asset backing: 2.37 cents per share1 30 June 2019 Net tangible asset backing: 1.33cents per share Notes: 1. This calculation excludes right of use assets and the associated lease liabilities
Other The Company has no equity interests in any associates or joint ventures. Accounting standards used in relation to the Company’s foreign subsidiaries in compiling this financial report are the International Financial Reporting Standards (IFRS) as issued by the International Accounting Standards Board (IASB).
For
per
sona
l use
onl
y

A D V E R I T A S L I M I T E D A B N 8 8 1 5 6 3 7 7 1 4 1 FINANCIAL STATEMENTS FOR THE YEAR ENDED 30 JUNE 2020
For
per
sona
l use
onl
y

A D V E R I T A S L I M I T E D C O R P O R A T E D I R E C T O R Y
Directors Non-Executive Chairman Managing Director and Chief Executive Officer Non-Executive Directors
Mr Stephen Belben Mr Mathew Ratty Mr Renaud Besnard Mr Mark McConnell Mr Andrew Stott
Company Secretary Ms Susan Hunter Principal and Registered Office Suite 10, 16 Brodie Hall Drive Bentley WA 6102 Telephone: +61 8 9473 2500 Facsimile: +61 8 9473 2501 Share Register Computershare Investor Services Pty Limited Level 11, 172 St Georges Terrace Perth WA 6000 Telephone: +61 8 9323 2000 Facsimile: +61 8 9323 2033 Securities Exchange Listing Adveritas Limited shares are listed on the Australian Securities Exchange (ASX: AV1) Solicitors Steinepreis Paganin Level 4, The Read Building 16 Milligan Street Perth WA 6000 Bankers Commonwealth Bank of Australia Limited 150 St Georges Terrace Perth WA 6000 Auditors Ernst & Young The EY Building 11 Mounts Bay Road Perth WA 6000 F
or p
erso
nal u
se o
nly
A D V E R I T A S L I M I T E D C O N T E N T S
1
Page
Directors’ Report 2
Auditor’s Independence Declaration 26
Consolidated Statement of Profit and Loss and Other Comprehensive Income 27
Consolidated Statement of Financial Position 28
Consolidated Statement of Cash Flows 29
Consolidated Statement of Changes in Equity 30
Notes to the Consolidated Financial Statements 31
Directors’ Declaration 74
Independent Auditor’s Report 75
For
per
sona
l use
onl
y

A D V E R I T A S L I M I T E D D I R E C T O R S ’ R E P O R T
2
The directors present their report together with the consolidated financial report of Adveritas Limited (Adveritas or Company) and its controlled entities (collectively referred to as the Group) for the financial year ended 30 June 2020 and the independent auditor’s report thereon. DIRECTORS The names and details of the Company’s directors in office during the financial year and until the date of this report are set out below. Directors were in office for this entire period unless stated otherwise. Mr Stephen Belben Non-Executive Chairman
Mr Belben has over 20 years’ experience in both executive and non-executive director roles, at a number of public and private companies. This experience follows 9 years as a senior partner at Ernst & Young, specialising in corporate and assurance work in Australia. Whilst at Ernst & Young, Mr Belben was appointed the national partner in charge of one of the firm’s largest Industry Group’s where he was responsible for the development and servicing of a major client base in that sector in Australia.
During the last three years, Mr Belben has not served as a director of any other ASX listed company.
Mr Belben is a Chartered Accountant and holds a Bachelor of Accountancy degree and a Bachelor of Commerce Honours degree. Mr Mathew Ratty Managing Director and Chief Executive Officer Mr Ratty is an experienced investor focused on Australian and US equity and debt markets. He has extensive experience across capital raising advice, seed investment negotiation, corporate strategy and financial modelling. He is the co-founder of MC Management Group Pty Ltd, a venture capital firm operating in domestic and international debt and equity markets. At MC Management Group Pty Ltd, which is a substantial shareholder the Company, Mr Ratty holds the position of Head of Investment and is responsible for negotiating deal structures and asset pricing for companies in the healthcare, financial and technology space. Prior to this, Mr Ratty was a director and analyst at property development and equity company, Gladstone Bridge. During the last three years Mr Ratty has also served as a Non-Executive Director of medical technology company, Admedus Limited (ASX: AHZ). He resigned from this position on 20 May 2018. Mr Ratty holds a Bachelor of Commerce (Property and Finance) with first class honours in finance from Curtin University of Technology. Mr Renaud Besnard Non-Executive Director Mr Besnard is a senior marketing executive currently based in San Francisco. Mr Besnard’s roles have included Vice President, Growth lab at PayPal, Senior Director of Global Growth and Product Marketing at Twitter, and Director of Marketing for Asia-Pacific (excl. India) at Uber Technologies Inc. Prior to joining Uber, Mr Besnard was a long-standing Google executive, having spent almost 10 years in senior positions in Europe and Asia. Mr Besnard is very experienced at developing and executing marketing strategies and leading global growth marketing and global product marketing campaigns across consumer and advertiser audiences.
During the last three years, Mr Besnard has not served as a director of any other ASX listed company. Mr Besnard holds a Bachelor degree in Commerce from ESSCA Business School (France), a Masters in International Business from the University of Manchester (UK) and an MBA from the University of Oxford (UK).
For
per
sona
l use
onl
y

A D V E R I T A S L I M I T E D D I R E C T O R S ’ R E P O R T
3
Mr Mark McConnell Non-Executive Director Mr McConnell is a successful business developer whose skills cover the areas of business strategy, investor relations, capital raising and innovation. He has extensive experience in both listed and unlisted technology companies in Australia and abroad. He co-founded the Citadel Group Limited (ASX: CGL) in 2007, a leading software and technology company that specialises in secure enterprise information management. Mr McConnell currently serves as the Chef executive Officer of Citadel Group Limited and is a non-executive director of Viva Leisure Limited (ASX: VVA). Mr McConnell also acts as an advisor to HOF Capital, a global technology investment firm that leverages its extensive networks to help founders build successful businesses. Mr McConnell has a Bachelor of Science, a Graduate Diploma of Employment Relations, a Graduate Diploma of Logistics Management, and a Masters of Business Administration. He is also a Fellow of the Australian Institute of Company Directors (FAICD). Mr Andrew Stott Non-Executive Director Mr Stott has significant experience in global technology mergers and acquisitions for listed and unlisted companies. He is originally from the UK and worked in London and New York before moving to Singapore in 2012 to open the offices of an international tech-focussed law firm. Mr Stott became the Asia managing partner, and regional head of corporate and advised on in excess of US$20bn in transactions in Asia, Australia, Europe and the USA. Mr Stott established his own advisory firm in early 2018 and has been working as a consultant to Adveritas since August 2018, helping implement its expansion strategy through relationships with internationally based customers and partners. Until June 2018, Mr Stott was also a Board member of the Asia Video Industry Association (AVIA), an industry lobbying association representing the video industry in Asia. AVIA’s 130-member organisations include leading advertising and marketing agencies, media groups, government regulatory bodies, telecom companies, new media service providers and network enablers.
During the last three years, Mr Stott has not served as a director of any other ASX listed company. Mr Stott holds an LLB Degree in Law and is a solicitor of the courts of England and Wales. INTERESTS IN THE SECURITIES OF THE COMPANY AND RELATED BODIES CORPORATE As at 30 June 2020 and as of the date of this report, the interests of the directors in the securities of the Company were as follows:
As at 30 June 2020 As at the date of this report
Ordinary shares
Share options
Performance Rights
Ordinary shares
Share options
Performance Rights
S. Belben 720,000 840,000 - 720,000 840,000 - M. Ratty 17,780,544 3,999,092 11,250,000 17,780,544 3,999,092 11,250,000 R. Besnard - 750,000 - - 750,000 - M. McConnell 25,032,593 10,282,778 - 25,032,593 10,282,778 - A. Stott 500,000 1,350,000 - 500,000 1,350,000 -
COMPANY SECRETARY Ms Susan Hunter has over 23 years’ experience in the corporate finance industry and has extensive experience in Company Secretarial and Non-Executive Director roles on ASX, AIM and TSX listed companies. Ms Hunter holds a Bachelor of Commerce degree from the University of Western Australia majoring in Accounting and Finance, is a Member of the Australian Institute of Chartered Accountants, a Fellow of the Financial Services Institute of Australasia and a Member of the Australian Institute of Company Directors. She is also a Fellow of the Institute of Chartered Secretaries and Administrators and Chartered Secretaries Australia. DIVIDENDS The directors do not recommend the payment of a dividend and no amount has been paid or declared by way of a dividend to the date of this report.
For
per
sona
l use
onl
y

A D V E R I T A S L I M I T E D D I R E C T O R S ’ R E P O R T
4
PRINCIPAL ACTIVITIES The Company’s principal activity during the year was the provision of comprehensive digital advertising fraud prevention services through its SaaS (software as a service) product, TrafficGuard®. OPERATING AND FINANCIAL REVIEW Sales model
During the first half of the financial year, the Group deployed multiple sales strategies to drive revenue growth which resulted in a number of key clients being secured, including Go-Jek and MUV (subsidiary of global agency holding group WPP Plc). Sales and marketing initiatives also resulted in key clients, Rappi and MUV, subsequently upgrading their contracts which not only highlighted client satisfaction but also demonstrated the upsell potential across the Group’s client portfolio.
To further optimise the Group’s sales strategies and maximise revenue growth, it adopted a “three by three” sales model which was launched on 1 April 2020 and incorporates three pricing models and three routes to market.
The three pricing models are:
1. Freemium The Freemium offering was launched to create a significantly expanded sales funnel with substantial upsell potential. The offering comprises TrafficGuard’s detection only service free-of-charge. The strategy is to make this service widely available with the potential to upsell to TrafficGuard’s fraud prevention services.
2. Land and expand From the Freemium model, clients may elect to upgrade and subscribe to TrafficGuard’s fraud prevention service. They will then fall within the “land and expand” model, which involves paying a fixed monthly SaaS fee, with additional charges for excess data usage
3. Long-dated contracts Once clients fall within the “land and expand” model, there is potential to upgrade their contract to a long-dated contract model which provides benefits to the client on a per data usage cost basis.
The three routes to market include:
1. Mass market: accessed through Freemium offering.
2. Direct sales: through the direct sales force located in Asia Pacific (APAC), the United Kingdom, North America and Latin America (LATAM).
3. Third party distribution: through integrations with Campaign Management Platforms, ad agencies and marketplace services to provide even more options for businesses to find and activate TrafficGuard.
Since launching its three by three model, the Group has been gaining strong traction across all marketing channels and pricing models. In particular, a high level of interest in TrafficGuard’s Google Pay-Per-Click anti-fraud offering has been noted. By the end of the financial year, the Group had received over 540 Freemium subscribers and a number of those subscribers had converted to “land and expand” customers. Impact of COVID-19 The global COVID-19 pandemic impacted the Company’s revenue in the following ways:
• temporary suspension of services to clients at their request; • temporary reduction of monthly licence fees to assist struggling clients; • potential clients requesting to defer final contract negotiations until they have a better understanding of the
impact of COVID-19 on their businesses; and • opportunities to market TrafficGuard were curtailed due to the cancellation of trade shows and events, the
imposition of domestic and international travel restrictions, and the ceasing of face to face meetings. In response to the global COVID-19 pandemic, the Group delayed (where possible) and curtailed expenditure in a number of areas including, in particular, advertising, marketing and public relations. Most importantly, employees across the Company’s global operations voluntarily agreed to a temporary reduction in their salaries from 1 April to 31 July. In addition, Board fees were reduced to nil, the CEO salary was reduced by 50% and the salaries of other members of senior management were reduced by 30%. These reductions were made without there being any obligation on the Company to repay the forgone amounts.
For
per
sona
l use
onl
y

A D V E R I T A S L I M I T E D D I R E C T O R S ’ R E P O R T
5
Capital raised
During the year, the Group successfully raised $13.9 million (before costs) as follows: • August 2019: Placement at $0.10 per share to institutional and strategic investors, including directors Mathew
Ratty and Mark McConnell, to raise $2.87 million. The directors’ participation in this placement was $1.3 million. • December 2019: Placement at $0.17 per share to institutional and strategic investors, including directors
Mathew Ratty and Mark McConnell, to raise $3.5 million. The directors’ participation in this placement was $0.5 million.
• February 2020: 1.3 million options were exercised to raise $145k. • March 2020: In response to CODID-19 concerns, a placement at $0.055 per share to institutional and strategic
investors, including director Mathew Ratty, was completed to raise $1.87 million. Mr Ratty’s participation in this placement was $150k.
• June 2020: Placement at $0.075 per share to institutional and strategic investors, including director Mark McConnell, to raise $4.5 million. Mark McConnell’s participation in this placement is $2 million and is expected to be received by the Group in September once shareholders have approved the issue of shares to Mr McConnell.
• June 2020: A Share Purchase Plan (SPP) was offered to eligible shareholders to raise up to $2 million at $0.075 per share, the same price at which shares were placed with institutional and strategic investors. The SPP closed 50% over subscribed to raise $3.07 million.
Update on Mpire Network Transaction
On 31 July 2018, the Group disposed of 90% of its interest in the performance-marketing business, Mpire Network Inc, to ClearPier Inc. As part of the disposal process, the Group agreed to licence its nxus and TrafficGuard products to Mpire Network Inc for a minimum term of 1 year, commencing on 1 August 2018. The initial term of the licencing agreements came to an end on 31 July 2019, and under the terms of the agreements, they were automatically renewed for a further 12-months unless terminated 30 days before the end of the initial term. Mpire Network Inc did not provide a termination notice to the Group. However, after the second term commenced, Mpire Network Inc disputed the renewal mechanism.
In addition, ClearPier Inc has failed to pay the deferred component of the purchase consideration for Mpire Network Inc in accordance with the terms of the Sale and Purchase Agreement.
The Group has instructed its legal counsel to take the required action prescribed by the underlying agreements to resolve the disputes and recover the balances owing to it. For accounting purposes. the Group has adopted a highly conservative stance in relation to the balances owing and has recognised an expected credit loss of $848k, being the total of the SaaS licence fees outstanding ($280k) and the deferred consideration receivable ($568k). The Group also decided to write down its remaining investment in Mpire Network Inc to nil.
Financial summary
Note FY 2020 FY 2019 $ $ Revenue from software as a service 1 1,227,213 643,579 Grant income 2 1,287,433 955,868 Profit on disposal of performance marketing business - 594,698 JobKeeper and Cash Flow Booster stimulus income 305,000 - Foreign exchange gains - 160,854 Sundry income 21,429 66,317 Other income 1,613,862 1,777,737 Server hosting costs 3 (2,119,094) (1,364,491) Administration, marketing and occupancy costs (1,262,456) (1,156,668) Compliance and consultancy costs (883,354) (707,811) Employment costs 4 (5,506,082) (5,235,288) Expected credit loss and bad debts expense (279,343) (41,463) Finance costs (54,245) - Overheads (10,104,574) (8,505,721) Foreign exchange losses (50,325) - Depreciation (136,342) (39,191) Impairment loss (113,525) - Expected credit loss – deferred consideration (567,869) - Share based payments (refer to Note 17 to the financial statements) (1,343,842) (503,233) Other expenses (2,211,903) (318,570) Loss before tax (9,475,402) (6,628,829) Income tax expense (11,957) (17,591) Loss after tax - continuing operations (9,487,359) (6,644,420) Profit after tax - discontinued operations - 92,223 Loss after tax for the Group (9,487,359) (6,552,197)
For
per
sona
l use
onl
y

A D V E R I T A S L I M I T E D D I R E C T O R S ’ R E P O R T
6
Notes
1. During the previous financial year, the Company’s revenue stream transitioned from performance marketing to software as a service. The revenue earned from performance marketing in FY19 is included in the profit after tax from discontinued operations.
2. Grant income relates to the Group’s research and development expenditure incurred in FY19 and FY18 respectively.
3. Server hosting costs increased in FY20 as a result of the increase in enterprise-level clients. 4. As part of the Group’s sales and marketing initiatives, a number of personnel were recruited during the year to
enable the key areas of North America, Latin America, Asia Pacific and the United Kingdom to be effectively targeted.
SIGNIFICANT CHANGES IN THE STATE OF AFFAIRS There were no significant changes in the Group’s state of affairs during the course of the 2020 financial year. SIGNIFICANT EVENTS AFTER BALANCE DATE No event has arisen since 30 June 2020 that would be likely to materially affect the operations of the Group, or its state of affairs which has not otherwise been disclosed in this financial report. LIKELY DEVELOPMENTS AND EXPECTED FUTURE RESULTS The Group is focused on driving revenue in multiple ways: • by expanding its Freemium pipeline through increased digital marketing across multiple platforms and by deploying
strategic partnerships with agencies and domain name registries; • by driving Freemium subscriber conversions through content marketing, bundled offerings and the introduction of
direct sales contact; • by actively pursuing upgrades of “land and expand” customers to larger and longer-dated contracts; and • by converting targets in Enterprise-level pipeline into customers. ENVIRONMENTAL REGULATION AND PERFORMANCE The Group is not subject to any particular or specific environmental regulation in any of the jurisdictions in which it operates and therefore is not required to present further details in relation to environmental regulation. SHARE OPTIONS Unissued shares As at 30 June 2020 and the date of this report, there were 62,246,109 unissued ordinary shares under options (30 June 2019: 64,446,334). Refer to the remuneration report and Note 17 for further details of the unissued ordinary shares under options outstanding.
Expiry Date Exercise Price Number on issue 25 August 2020 $0.45 500,000 24 December 2020 $0.15 2,650,000 25 October 2021 $0.10 55,496,109 27 March 2022 $0.20 3,000,000 19 August 2021 $0.15 400,000 21 November 2021 $0.20 200,000 62,246,109
Option holders do not have any right, by virtue of the option, to participate in any share issue of the Company or any related body corporate. Shares issued as a result of the exercise of options During the financial year, 1,300,225 options were exercised to acquire ordinary shares (2019: 4,500).
For
per
sona
l use
onl
y
A D V E R I T A S L I M I T E D D I R E C T O R S ’ R E P O R T
7
PERFORMANCE RIGHTS Unissued shares As at 30 June 2020 there were 26,600,000 unissued ordinary shares under performance rights (30 June 2019: 8,250,000). Refer to the remuneration report and Note 17 for further details of the performance rights outstanding. Holders of performance rights do not have any right, by virtue of the performance right, to participate in any share issue of the Company or any related body corporate. Shares issued as a result of the conversion of performance rights During the financial year no performance rights were converted into ordinary shares (2019: 33,332). INDEMNIFICATION AND INSURANCE OF DIRECTORS AND OFFICERS The Company has agreed to indemnify all the directors of the Company for any liabilities to another person (other than the Company or related body corporate) that may arise from their position as directors of the Company and its controlled entities, except where the liability arises out of conduct involving a lack of good faith. During the financial year, the Company paid a premium in respect of a contract insuring the directors and officers of the Company against any liability incurred in the course of their duties to the extent permitted by the Corporations Act 2001. The contract of insurance prohibits disclosure of the nature of the liability and the amount of the premium. INDEMNIFICATION OF AUDITORS To the extent permitted by law, the Group has agreed to indemnify its auditors, Ernst & Young, as part of the terms of its audit engagement agreement against claims by third parties arising from the audit (for an unspecified amount). No payment has been made to indemnify Ernst & Young during or since the financial year. DIRECTORS’ MEETINGS The number of meetings of directors held by the Company during the year and the number of meetings attended by each director were as follows: Number of meetings held 11 Number of
meetings eligible to attend
Number of meetings attended
S. Belben 11 11 M. Ratty 11 11 R. Besnard 11 8 M. McConnell 11 8 A. Stott 11 11 Committee Membership Due to the Company’s relatively small size and board structure, separate Remuneration and Audit Committees have not been constituted. The full board of directors assumes responsibility for any such matters as outlined in the Company’s corporate governance plan. NON-AUDIT SERVICES The following non-audit services were provided by the Group’s auditor, Ernst & Young Australia, during the year and Ernst & Young Australia received or is due to receive the following amounts for the provision of such services:
$ Tax compliance services 39,111 The directors are satisfied that the provision of non-audit services is compatible with the general standard of independence imposed by the Corporations Act 2001. The nature and scope of each type of non-audit service provided means the auditor’s independence was not compromised. AUDITOR INDEPENDENCE Section 307C of the Corporations Act 2001 requires the Company’s auditors, Ernst & Young Australia, to provide the directors of the Company with an Independence Declaration in relation to the audit of the Financial Report. The directors received the Independence Declaration set out on page 26 for the year ended 30 June 2020.
For
per
sona
l use
onl
y

A D V E R I T A S L I M I T E D D I R E C T O R S ’ R E P O R T
8
REMUNERATION REPORT (AUDITED) This remuneration report for the year ended 30 June 2020 outlines the remuneration arrangements of the Group in accordance with the requirements of the Corporations Act 2001 (Cth), as amended (the Act) and its regulations. This information has been audited as required by section 308(3C) of the Act. The remuneration report is presented under the following sections: 1. Introduction 2. Remuneration governance 3. Remuneration outcomes 4. Executive contracts 5. Additional disclosures relating to performance rights, options and shares 6. Other transactions and balances with key management personnel and their related parties 1. Introduction The remuneration report details the remuneration arrangements for key management personnel (KMP) who are defined as those persons having authority and responsibility for planning, directing and controlling the major activities of the Group, directly or indirectly, including any director (whether executive or otherwise) of the parent entity. The list below outlines the KMP of the Group during the financial year ended 30 June 2020. Unless otherwise indicated, the individuals were KMP for the entire financial year. For the purposes of this report, the term “executive” indicates the executive directors and senior executives of the Group. Non-Executive Directors (NEDs) S. Belben Non-Executive Chairman R. Besnard Non-Executive Director M. McConnell Non-Executive Director A. Stott Non-Executive Director Executive Directors M. Ratty Managing Director and Chief Executive Officer Senior Executives L. Taylor Chief Operations Officer F. Muir Chief Financial Officer S. Hunter Company Secretary D. Cox Chief Revenue Officer E. Rosenburg Vice President of Sales North America, resigned 2 October 2019 J. Linden Vice President of Sales North America, appointed 10 January 2020 2. Remuneration governance 2(a) Remuneration Philosophy The performance of the Group depends upon the quality of the directors and executives. The philosophy of the Group in determining remuneration levels is to: - set competitive remuneration packages to attract and retain high calibre employees; - link rewards to shareholder value creation; and - establish appropriate, demanding performance hurdles for variable executive remuneration. 2(b) Remuneration Committee The current size of the Group and structure of the board of directors does not warrant a separate remuneration committee. The board of directors as a whole (Board) is currently responsible for determining and reviewing compensation arrangements for directors and executives. Directors are excluded from discussions and voting on their own remuneration arrangements. The Board assesses the appropriateness of the nature and amount of remuneration of directors and executives on a periodic basis by reference to relevant employment market conditions with the overall objective of ensuring maximum stakeholder benefit from the retention of a high quality Board and executive team.
For
per
sona
l use
onl
y
A D V E R I T A S L I M I T E D D I R E C T O R S ’ R E P O R T
9
REMUNERATION REPORT (AUDITED) (continued) 2(c) Remuneration Structure: Non-Executive Director Remuneration Fixed Remuneration In accordance with best practice corporate governance, the structure of non-executive director and executive remuneration is separate and distinct. The Board seeks to set aggregate remuneration of non-executive directors at a level that provides the Group with the ability to attract and retain high calibre directors, whilst incurring a cost that is acceptable to shareholders. The ASX Listing Rules specify that the aggregate remuneration of non-executive directors shall be determined from time to time by a general meeting. The aggregate remuneration set pursuant to Adveritas Limited’s constitution is $500,000 per year, which may be varied by shareholders in general meeting. The amount of aggregate remuneration sought to be approved by shareholders and the manner in which it is apportioned amongst directors is reviewed annually. The Board does not currently seek external remuneration advice. Each director receives a fee for being a director of the Company. Options No options were issued to directors in the current year (2019: 750,000 options to each non-executive director). 2(d) Remuneration Structure: Executive Director and Senior Executive Remuneration
(i) Objective The Group aims to reward executives with a level and mix of remuneration commensurate with their position and responsibilities so as to: • Reward executives; • Align the interests of executives with those of shareholders; • Link reward with strategic goals and performance of the Group; and • Ensure total remuneration is competitive by market standards.
(ii) Principles of Compensation
Compensation levels for employees of the Group are competitively set to attract and retain appropriately qualified and experienced senior executives. Executive remuneration and other terms of employment are reviewed annually by the Board having regard to the performance, relevant comparative information and expert advice if required.
(iii) Structure
Remuneration consists of the following key elements: • Fixed Remuneration (base salary, superannuation and non-monetary benefits); • Variable Remuneration
o Short-term incentives o Long-term incentives
The Board establishes the proportion of fixed and variable remuneration for each executive.
Fixed Remuneration The level of fixed remuneration is set so as to provide a base level of remuneration which is both appropriate to the position and is competitive in the market. The Board periodically reviews fixed remuneration when extending or otherwise amending the employment contracts of key executives. This review takes into account the overall performance of the executive and of the Group. The Board considers the executive’s performance of the specific duties and tasks set out in their employment contracts which were included based on the general nature of the executive’s role together with any specific requirements from the Board.
Executives may be given the flexibility to receive their remuneration in a variety of forms including cash and fringe benefits. It is intended that the manner of payment chosen will be optimal for the recipient without creating undue cost for the Group.
For
per
sona
l use
onl
y

A D V E R I T A S L I M I T E D D I R E C T O R S ’ R E P O R T
10
REMUNERATION REPORT (AUDITED) (continued) Variable Remuneration – short-term incentive The objective of short-term incentives is to link the achievement of the Group’s operational targets with the remuneration received by the executives charged with meeting those targets. Operational targets are set periodically by the Board and include matters such as the funding of the Company, the timing of technological developments and the implementation of sales and marketing strategies. From time to time cash bonuses (short-term incentives) are paid where an executive has met a short-term objective of the Group. Such bonuses are paid when specific criteria which are set by the Board are met. These criteria are linked to the operational targets set by the Board. In some instances, cash bonuses are paid when the Board determines that an executive has made contributions that are significant and beyond the normal expectations of their role. In making such determinations, the Board will consider a number of factors including the area of the business that has been impacted by the executive’s contributions and the alignment of these contributions to the Group’s overall strategy. Variable Remuneration – long-term incentive Long-term incentives are delivered in the form of options and performance rights. Performance rights and options are generally issued in accordance with the terms and conditions of the Adveritas Performance Rights and Options Plan (Plan) that has been approved by the Company’s shareholders. Pursuant to the listing rules of the Australian Securities Exchange (Listing Rules), the Company’s shareholders are required to re-approve the Plan and all unallocated securities issuable under it every three years. The Company’s current Plan was approved by shareholders at the 2018 AGM. The key features of the Plan are as follows:
• The Company’s board of directors (Board) may, from time to time, in its absolute discretion, make a written offer to any eligible participant to apply for options or performance rights (Awards), upon the terms set out in the Plan and upon such additional terms and conditions as the Board determines.
• An Award may be made subject to vesting conditions as determined by the Board in its discretion and as specified in the offer for the Awards.
• The Board may in its absolute discretion resolve to waive any of the vesting conditions applying to Awards due to special circumstances arising in relation to the eligible participant; or the Company passing a resolution for voluntary winding up; or an order is made for the compulsory winding up of the Company.
• Where a change of control occurs, vesting conditions are deemed to be automatically waived. • An Award will lapse upon the earlier of:
o an unauthorised dealing, or hedging of the Award; o a vesting condition in relation to the Award is not satisfied by its due date, or becomes
incapable of satisfaction, as determined by the Board in its absolute discretion; o in respect of unvested Awards, the recipient of the unvested Awards ceases to be an eligible
participant; o in respect of vested Awards, the recipient of the vested Awards ceases to be an eligible
participant and the Award granted is not exercised within a one (1) month period (or such later date as the Board determines) of the date that person ceases to be an eligible participant;
o the Board deems that an Award lapses due to fraud, dishonesty or other improper behaviour of the eligible participant;
o the Company undergoes a change of control or a winding up resolution or order is made and the Board does not exercise its discretion to vest the Award; and
o the expiry date of the Award. • The Board may, in its discretion, determine at any time up until exercise of Awards, that a restriction
period will apply to some or all of the shares issued to an eligible participant on exercise of those Awards (Restriction Period). In addition, the Board may, in its sole discretion, having regard to the circumstances at the time, waive any such Restriction Period.
• There are no participation rights or entitlements inherent in the Awards and eligible participants will not be entitled to participate in new issues of capital offered to shareholders during the currency of the Awards without exercising the Award.
In the event that an offer of an Award to an executive will result in the maximum Awards allowed under the Plan being exceeded, the offer will not be covered by ASIC Class Order 14/1000 and the Company will be required to address the secondary sale requirements of any shares issued upon exercise of the Award. This includes the Company lodging a cleansing notice under Section 708A(5) of the Corporations Act 2001 (Cth) or a prospectus under Section 708A(11) of the same Act.
For
per
sona
l use
onl
y

A D V E R I T A S L I M I T E D D I R E C T O R S ’ R E P O R T
11
REMUNERATION REPORT (AUDITED) (continued)
2(d) Remuneration Structure: Executive Director and Senior Executive Remuneration (continued)
During the current year, nil options and 6,750,000 performance rights were granted to executives (2019: 1,750,000 options and 14,850,000 performance rights).
The exercise price and vesting conditions of options awarded to executives and the vesting conditions of performance rights awarded to executives is determined so as to ensure that these options and performance rights only have value if there is an increase in shareholder wealth over time.
2(e) Remuneration Report Approval at 2019 Annual General Meeting The remuneration report of Adveritas Limited for the year ended 30 June 2019 was approved by shareholders at the 2019 AGM.
For
per
sona
l use
onl
y

A D V E R I T A S L I M I T E D D I R E C T O R S ’ R E P O R T
12
REMUNERATION REPORT (AUDITED) (continued) 3. Remuneration outcomes Remuneration of Key Management Personnel In response to the global COVID-19 pandemic, with effect from 23 March 2020, Non-Executive Director fees were reduced to nil, the salary of Mr Ratty was reduced by 50% and the salaries of senior executives employed by the Company were reduced by 30%. These reductions were made without there being any obligation on the Group to repay the forgone amounts.
Short-term benefits Post-
employment Long-term benefits Share-based payments
Salary & fees Commission
/ Bonus
Termination
benefits
Non-monetary benefits Super
Long service leave
Performance Rights Options Total
Performance related
$ $ $ $ $ $ $ $ % Non-Executive Directors
S. Belben9 2020 42,725 - - - 4,059 - - - 46,784 - 2019 60,165 - - - 5,716 - - 51,803 117,684 - R. Besnard9 2020 28,483 - - - 2,706 - - - 31,189 - 2019 40,110 - - - 3,810 - - 51,803 95,723 - M. McConnell1 9 2020 28,483 - - - 2,706 - - - 31,189 - 2019 13,824 - - - 1,313 - - 51,803 66,940 - A. Stott1, 9 2020 31,084 - - - - - - - 31,084 - 2019 14,991 - - - - - - 51,803 66,794 - Executive Directors M. Ratty2, 7, 9 2020 227,580 100,000 - - 20,691 2,733 544,645 - 895,649 72 2019 235,044 185,000 - - 22,621 828 5,303 - 448,796 42 Total Directors 2020 358,355 100,000 - - 30,162 2,733 544,645 - 1,035,895 62 2019 364,134 185,000 - - 33,460 828 5,303 207,212 795,937 50
For
per
sona
l use
onl
y

A D V E R I T A S L I M I T E D D I R E C T O R S ’ R E P O R T
13
REMUNERATION REPORT (AUDITED) (continued) 3. Remuneration outcomes (continued)
Short-term benefits Post-
employment Long-term benefits Share-based payments
Salary & fees Commission /
Bonus
Termination Non-
monetary benefits Super
Long service leave
Performance Rights Options Total
Performance related
$ $ benefits $ $ $ $ $ $ % Senior Executives L. Taylor3, 8, 9 2020 242,483 25,000 - - 20,938 8,268 393,641 - 690,151 61 2019 243,983 25,000 - - 20,728 4,671 88,316 382,698 30 L. Hunter4 2020 - - - - - - - - - - 2019 11,868 - 40,331 - 2,881 - - - 55,080 - J. Dutton5, 9 2020 - - - - - - - - - - 2019 227,783 - 73,455 - - - - 14,922 316,160 5 T. Allison6 2020 - - - - - - - - - - 2019 5,658 - - - - - - - 5,658 - F. Muir9 2020 101,970 - - - 9,687 - - 5,957 117,614 5 2019 105,642 - - - 10,036 - 14,922 130,600 11 S. Hunter10 2020 72,373 - - - - - - - 72,373 - 2019 58,838 - - - - - - - 58,838 - D. Cox9 2020 268,497 - - - 20,879 1,302 33,845 8,936 333,459 13 2019 123,978 - - - 11,778 246 - 22,383 158,385 14 E. Rosenberg11 2020 86,644 - - - - - - - 86,644 - 2019 60,842 - - - - - - - 60,842 - J. Linden12 2020 103,332 - - - - - - - 103,332 - 2019 - - - - - - - - - - Total Senior Executives
2020 875,298 25,000 - - 51,504 9,570 427,306 14,893 1,403,572
2019 838,592 25,000 113,786 - 45,423 4,917 88,316 52,227 1,168,261 14 Total 2020 1,233,654 125,000 - - 81,666 12,303 971,951 14,893 2,439,467 46 2019 1,202,726 210,000 113,786 - 78,883 5,745 93,619 259,439 1,964,198 29 F
or p
erso
nal u
se o
nly

A D V E R I T A S L I M I T E D D I R E C T O R S ’ R E P O R T
14
REMUNERATION REPORT (AUDITED) (continued) 3. Remuneration outcomes (continued) Notes 1. Mr McConnell and Mr Stott were appointed as non-executive directors on 26 February 2019. 2. Mr Ratty was appointed as permanent Chief Executive Officer on 9 November 2018. Mr Ratty had previously served as the interim Chief Executive Officer. 3. Mr Taylor was appointed as Chief Operations Officer on 20 August 2018. Mr Taylor had previously served as the Chief Technology Officer. 4. Mr Hunter resigned as Chief Operating Officer on 18 July 2018. 5. Mr Dutton’s employment ceased on 21 May 2019. 6. Mr Allison resigned on 15 June 2018. Salary and fees comprise consultancy fees charged by Mr Alison subsequent to his resignation. 7. The bonuses paid to Mr Ratty in the current year relate successfully raising capital, securing Tier 1 clients, expanding the US sales team and driving the business such that the
Company’s share price achieved targeted level. In the prior year, the bonuses paid related to the sale of the performance marketing business and the successful completion of a rights issue and placement to raise additional capital.
8. The bonuses paid to Mr Taylor in the current and prior year relate to the successful achievement of key technical milestones. 9. Refer to section 5 below and Note 17 for further information on the vesting conditions attached to the options and performance rights granted. 10. Ms Hunter provides company secretarial services through Hunter Corporate Pty Ltd, an entity controlled by her. 11. Mr Rosenberg resigned on 2 October 2019. 12. Mr Linden commenced employment on 10 January 2020.
For
per
sona
l use
onl
y

A D V E R I T A S L I M I T E D D I R E C T O R S ’ R E P O R T
15
REMUNERATION REPORT (AUDITED) (continued) 4. Executive contracts Remuneration arrangements for executives are formalised in the employment agreements. The following outlines the details of the contracts with executives: Mathew Ratty, Managing Director and Chief Executive Officer Mr Ratty’s current employment agreement commenced on 9 November 2018 (Mr Ratty held the position of Interim CEO up to this date). The term of Mr Ratty’s contract was extended from 30 June 2021 to 30 June 2023 on 3 July 2020. Details • Remuneration:
Annual base salary of $265,000 (plus statutory superannuation). With effect from 23 March 2020, Mr Ratty agreed to forego 50% of his base salary until 31 July 2020 as part of the Group’s COVID cost-cutting measures. On 3 July 2020, Mr Ratty’s contract was varied to increase the annual base salary to $290,000 (plus statutory superannuation) with effect from 1 August 2020.
• Performance related bonuses – short term incentive: At the Board’s discretion, a cash bonus may be paid to Mr Ratty in relation to the successful completion of various milestones periodically set by the Board. The cash bonus is not to exceed 50% of the annual salary in the financial year the bonus is earnt.
• Performance related bonuses – long term incentive: The following performance rights have been issued to Mr Ratty
Milestones to be achieved
Date by which
milestone is to be
achieved
Quantum of performance
rights to vest upon achievement of
milestone First 3 Tier 1 clients in USA 30 June 2021 1,000,000 First 3 Tier 1 clients in Latin America (LATAM) 30 June 2021 1,000,000 First 3 Tier 1 clients in Asia Pacific (APAC) 30 June 2021 1,000,000 First 10 clients that sign on using TrafficGuard 30 June 2021 250,000 First 3 “Tier 1” clients who the Board consider to be enterprise level i.e. > 1 billion clicks per month
30 June 2021 500,000
First achievement of revenue producing twelve-month contracts to the amount of $1m
30 June 2021 500,000
First achievement of revenue producing twelve-month contracts to the amount of $3m
30 June 2021 1,000,000
First achievement of revenue producing twelve-month contracts to the amount of $5m
30 June 2021 1,500,000
First achievement of break-even cash flow in a financial year 30 June 2021 1,000,000 First achievement of audited $1m EBITDA 30 June 2021 1,500,000 First achievement of audited $3m EBITDA 30 June 2021 2,000,000 11,250,000
• Termination:
The agreement may be terminated: o by the Company without cause by giving twelve months' notice, or immediately with payment in lieu
of notice; o by the Company giving one months' notice if Mr Ratty is unable to perform his duties due to illness,
accident or incapacitation, for six consecutive months or a period aggregating more than six months in any twelve-month period; or
o by the Company immediately without notice following material breach or in the case of misconduct; or
o by Mr Ratty without cause by giving three months' notice or immediately if the Company commits any serious or persistent breach of the agreement.
• Other: The agreement includes other general industry standard provisions for a senior executive.
For
per
sona
l use
onl
y
A D V E R I T A S L I M I T E D D I R E C T O R S ’ R E P O R T
16
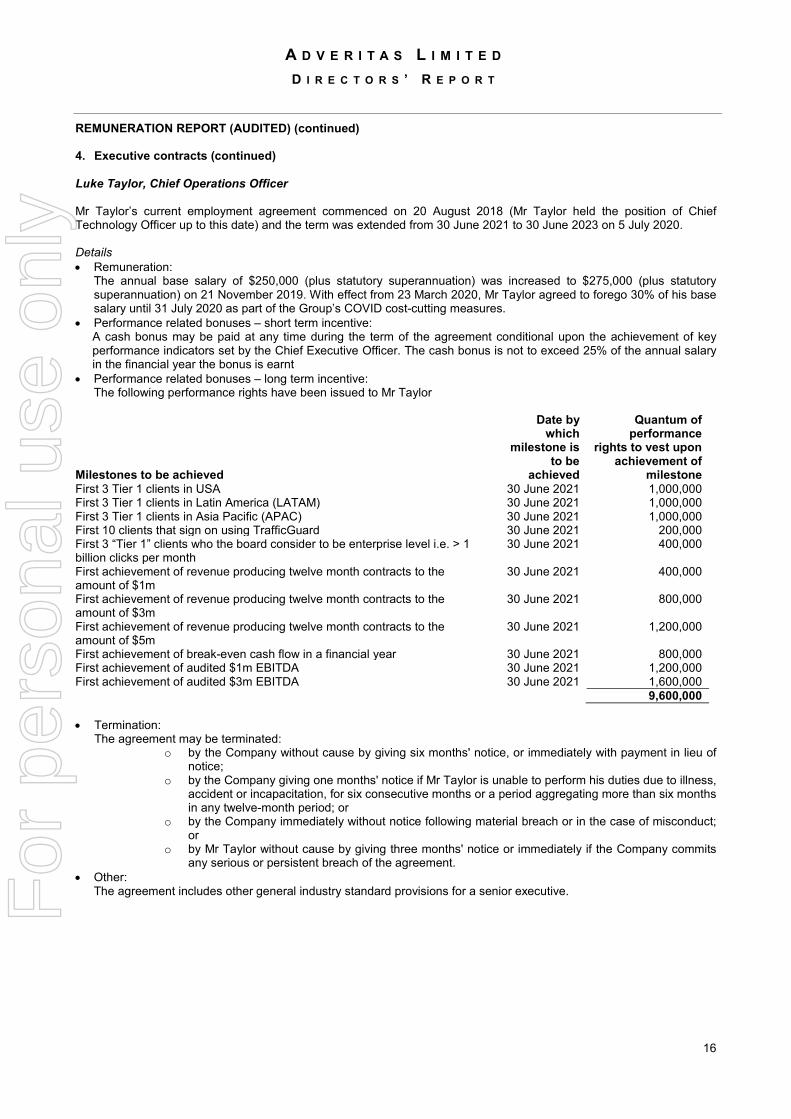
REMUNERATION REPORT (AUDITED) (continued) 4. Executive contracts (continued) Luke Taylor, Chief Operations Officer Mr Taylor’s current employment agreement commenced on 20 August 2018 (Mr Taylor held the position of Chief Technology Officer up to this date) and the term was extended from 30 June 2021 to 30 June 2023 on 5 July 2020. Details • Remuneration:
The annual base salary of $250,000 (plus statutory superannuation) was increased to $275,000 (plus statutory superannuation) on 21 November 2019. With effect from 23 March 2020, Mr Taylor agreed to forego 30% of his base salary until 31 July 2020 as part of the Group’s COVID cost-cutting measures.
• Performance related bonuses – short term incentive: A cash bonus may be paid at any time during the term of the agreement conditional upon the achievement of key performance indicators set by the Chief Executive Officer. The cash bonus is not to exceed 25% of the annual salary in the financial year the bonus is earnt
• Performance related bonuses – long term incentive: The following performance rights have been issued to Mr Taylor
Milestones to be achieved
Date by which
milestone is to be
achieved
Quantum of performance
rights to vest upon achievement of
milestone First 3 Tier 1 clients in USA 30 June 2021 1,000,000 First 3 Tier 1 clients in Latin America (LATAM) 30 June 2021 1,000,000 First 3 Tier 1 clients in Asia Pacific (APAC) 30 June 2021 1,000,000 First 10 clients that sign on using TrafficGuard 30 June 2021 200,000 First 3 “Tier 1” clients who the board consider to be enterprise level i.e. > 1 billion clicks per month
30 June 2021 400,000
First achievement of revenue producing twelve month contracts to the amount of $1m
30 June 2021 400,000
First achievement of revenue producing twelve month contracts to the amount of $3m
30 June 2021 800,000
First achievement of revenue producing twelve month contracts to the amount of $5m
30 June 2021 1,200,000
First achievement of break-even cash flow in a financial year 30 June 2021 800,000 First achievement of audited $1m EBITDA 30 June 2021 1,200,000 First achievement of audited $3m EBITDA 30 June 2021 1,600,000 9,600,000 • Termination:
The agreement may be terminated: o by the Company without cause by giving six months' notice, or immediately with payment in lieu of
notice; o by the Company giving one months' notice if Mr Taylor is unable to perform his duties due to illness,
accident or incapacitation, for six consecutive months or a period aggregating more than six months in any twelve-month period; or
o by the Company immediately without notice following material breach or in the case of misconduct; or
o by Mr Taylor without cause by giving three months' notice or immediately if the Company commits any serious or persistent breach of the agreement.
• Other: The agreement includes other general industry standard provisions for a senior executive.
For
per
sona
l use
onl
y
A D V E R I T A S L I M I T E D D I R E C T O R S ’ R E P O R T
17
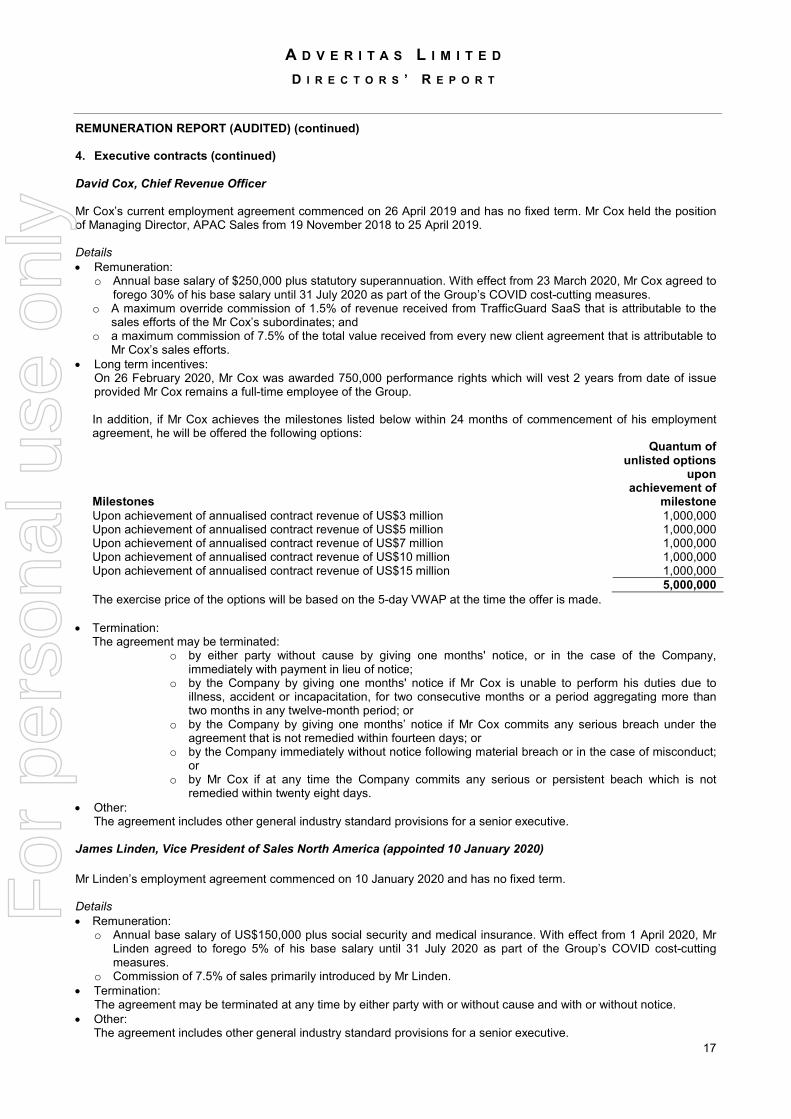
REMUNERATION REPORT (AUDITED) (continued) 4. Executive contracts (continued) David Cox, Chief Revenue Officer Mr Cox’s current employment agreement commenced on 26 April 2019 and has no fixed term. Mr Cox held the position of Managing Director, APAC Sales from 19 November 2018 to 25 April 2019. Details • Remuneration:
o Annual base salary of $250,000 plus statutory superannuation. With effect from 23 March 2020, Mr Cox agreed to forego 30% of his base salary until 31 July 2020 as part of the Group’s COVID cost-cutting measures.
o A maximum override commission of 1.5% of revenue received from TrafficGuard SaaS that is attributable to the sales efforts of the Mr Cox’s subordinates; and
o a maximum commission of 7.5% of the total value received from every new client agreement that is attributable to Mr Cox’s sales efforts.
• Long term incentives: On 26 February 2020, Mr Cox was awarded 750,000 performance rights which will vest 2 years from date of issue provided Mr Cox remains a full-time employee of the Group. In addition, if Mr Cox achieves the milestones listed below within 24 months of commencement of his employment agreement, he will be offered the following options:
Milestones
Quantum of unlisted options
upon achievement of
milestone Upon achievement of annualised contract revenue of US$3 million 1,000,000 Upon achievement of annualised contract revenue of US$5 million 1,000,000 Upon achievement of annualised contract revenue of US$7 million 1,000,000 Upon achievement of annualised contract revenue of US$10 million 1,000,000 Upon achievement of annualised contract revenue of US$15 million 1,000,000 5,000,000 The exercise price of the options will be based on the 5-day VWAP at the time the offer is made.
• Termination: The agreement may be terminated:
o by either party without cause by giving one months' notice, or in the case of the Company, immediately with payment in lieu of notice;
o by the Company by giving one months' notice if Mr Cox is unable to perform his duties due to illness, accident or incapacitation, for two consecutive months or a period aggregating more than two months in any twelve-month period; or
o by the Company by giving one months’ notice if Mr Cox commits any serious breach under the agreement that is not remedied within fourteen days; or
o by the Company immediately without notice following material breach or in the case of misconduct; or
o by Mr Cox if at any time the Company commits any serious or persistent beach which is not remedied within twenty eight days.
• Other: The agreement includes other general industry standard provisions for a senior executive. James Linden, Vice President of Sales North America (appointed 10 January 2020) Mr Linden’s employment agreement commenced on 10 January 2020 and has no fixed term. Details • Remuneration:
o Annual base salary of US$150,000 plus social security and medical insurance. With effect from 1 April 2020, Mr Linden agreed to forego 5% of his base salary until 31 July 2020 as part of the Group’s COVID cost-cutting measures.
o Commission of 7.5% of sales primarily introduced by Mr Linden. • Termination:
The agreement may be terminated at any time by either party with or without cause and with or without notice. • Other: The agreement includes other general industry standard provisions for a senior executive.
For
per
sona
l use
onl
y

A D V E R I T A S L I M I T E D D I R E C T O R S ’ R E P O R T
18
REMUNERATION REPORT (AUDITED) (continued) 4. Executive contracts (continued) Fiona Muir, Chief Financial Officer Ms Muir’s employment agreement commenced on 25 June 2018 and has no fixed term. Details o Remuneration:
Ms Muir fulfils the role of Chief Financial Officer on a part time basis and is remunerated pro-rata based on an annual base salary of $230,000 plus statutory superannuation. With effect from 1 April 2020, Ms Muir agreed to forego 30% of her base salary until 31 July 2020 as part of the Group’s COVID cost-cutting measures.
o Termination: The agreement may be terminated:
o by Ms Muir with one months’ notice, unless the Company is in breach of a material term of the agreement, in which case Ms Muir may terminate it immediately;
o by the Company with one months’ notice or payment in lieu of notice; o by the Company immediately without notice following material breach or in the case of misconduct
• Other: The agreement includes other general industry standard provisions for a senior executive. Susan Hunter, Company Secretary Ms Hunter provides company secretarial services through Hunter Corporate Pty Ltd. The agreement with Hunter Corporate Pty Ltd commenced on 24 September 2017 and has no fixed term. Details
• The Company pays a monthly fee together with any out of pocket expenses. The monthly retainer is based on
standard market rates. In the event assistance is required outside of the normal company secretarial role, the Company is charged an additional fee based on the hours worked by Ms Hunter.
• The agreement may be terminated by the Company of Hunter Corporate by giving two months’ notice. Eric Rosenberg, Vice President of Sales North America (resigned 2 October 2019) Mr Rosenburg’s employment agreement commenced on 29 April 2019 and had no fixed term. Mr Rosenberg resigned on 2 October 2019. Mr Rosenberg’s annual base salary was US$250,000 plus social security and medical insurance. In addition, Mr Rosenberg was entitled to commission of 7.5% of sales primarily introduced by him. The agreement with Mr Rosenberg was capable of being terminated at any time by either party with or without cause and with or without notice. James Dutton, Managing Director, Asia Pacific (employment ceased on 21 May 2019) Mr Dutton’s employment agreement commenced on 5 December 2017 and had no fixed term. Mr Dutton’s employment agreement was terminated on 21 May 2019. Mr Dutton’s annual base salary was SGD250,000 and he was entitled to two performance-based bonuses of up to SGD35,000 and SGD100,000 upon the achievement of pre-determined key performance indicators.
The agreement with Mr Dutton was capable of being terminated:
o by either party without cause by giving three months' notice, or in the case of the Company, immediately with payment in lieu of notice;
o by the Company by giving one months' notice if Mr Dutton was unable to perform his duties due to illness, accident or incapacitation, for two consecutive months or a period aggregating more than two months in any twelve-month period;
o by the Company by giving one months’ notice if Mr Dutton committed any serious breach under the agreement that was not remedied within fourteen days; or
o by the Company summarily without notice following material breach of the agreement or in the case of misconduct; or
o by Mr Dutton if at any time the Company committed any serious or persistent beach which was not remedied within twenty eight days.
For
per
sona
l use
onl
y
A D V E R I T A S L I M I T E D D I R E C T O R S ’ R E P O R T
19
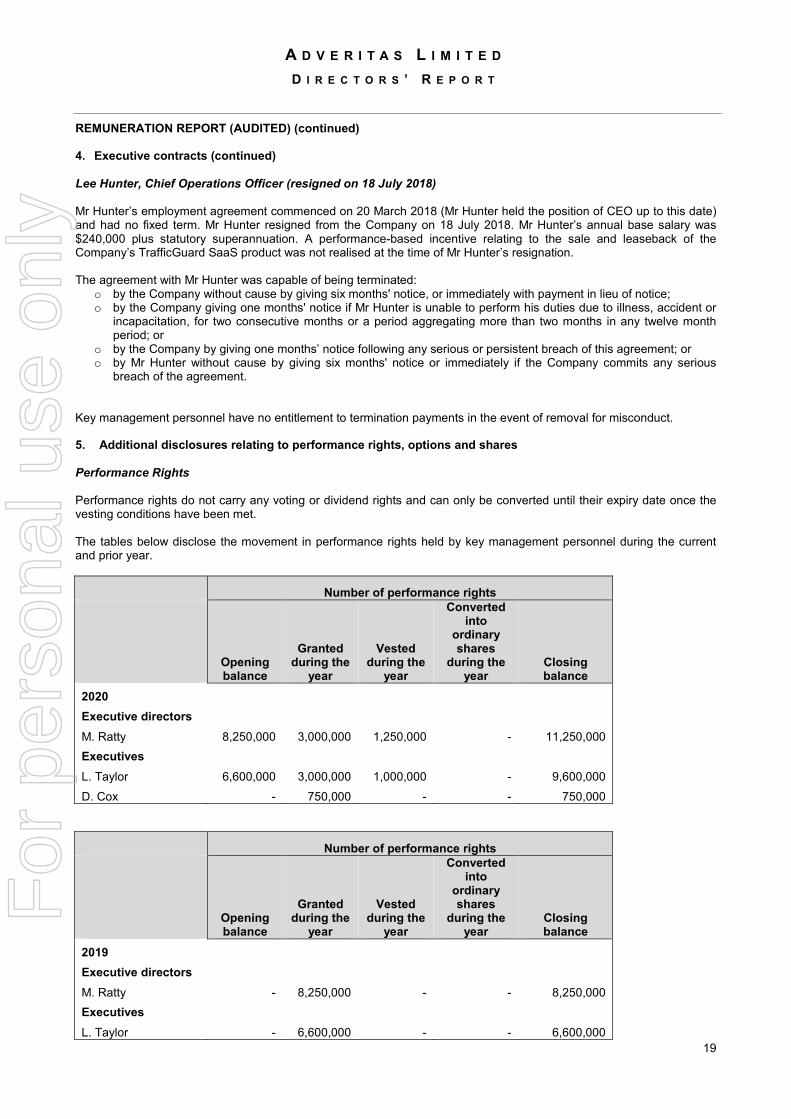
REMUNERATION REPORT (AUDITED) (continued) 4. Executive contracts (continued) Lee Hunter, Chief Operations Officer (resigned on 18 July 2018) Mr Hunter’s employment agreement commenced on 20 March 2018 (Mr Hunter held the position of CEO up to this date) and had no fixed term. Mr Hunter resigned from the Company on 18 July 2018. Mr Hunter’s annual base salary was $240,000 plus statutory superannuation. A performance-based incentive relating to the sale and leaseback of the Company’s TrafficGuard SaaS product was not realised at the time of Mr Hunter’s resignation. The agreement with Mr Hunter was capable of being terminated:
o by the Company without cause by giving six months' notice, or immediately with payment in lieu of notice; o by the Company giving one months' notice if Mr Hunter is unable to perform his duties due to illness, accident or
incapacitation, for two consecutive months or a period aggregating more than two months in any twelve month period; or
o by the Company by giving one months’ notice following any serious or persistent breach of this agreement; or o by Mr Hunter without cause by giving six months' notice or immediately if the Company commits any serious
breach of the agreement. Key management personnel have no entitlement to termination payments in the event of removal for misconduct. 5. Additional disclosures relating to performance rights, options and shares Performance Rights Performance rights do not carry any voting or dividend rights and can only be converted until their expiry date once the vesting conditions have been met. The tables below disclose the movement in performance rights held by key management personnel during the current and prior year.
Number of performance rights
Opening balance
Granted during the
year
Vested during the
year
Converted into
ordinary shares
during the year
Closing balance
2020 Executive directors M. Ratty 8,250,000 3,000,000 1,250,000 - 11,250,000 Executives L. Taylor 6,600,000 3,000,000 1,000,000 - 9,600,000 D. Cox - 750,000 - - 750,000
Number of performance rights
Opening balance
Granted during the
year
Vested during the
year
Converted into
ordinary shares
during the year
Closing balance
2019 Executive directors M. Ratty - 8,250,000 - - 8,250,000 Executives L. Taylor - 6,600,000 - - 6,600,000
For
per
sona
l use
onl
y

A D V E R I T A S L I M I T E D D I R E C T O R S ’ R E P O R T
20
REMUNERATION REPORT (AUDITED) (continued)
5. Additional disclosures relating to performance rights, options and shares (continued) Performance Rights (continued) The tables below disclose the fair values of performance rights granted to key management personnel during the current and prior year. 2020
M. Ratty L. Taylor D. Cox
Grant date Number granted
Fair value per
performance right at
grant date (cents) Grant date
Number granted
Fair value per
performance right at
grant date (cents) Grant date
Number granted
Fair value per
performance right at
grant date (cents)
Class P 13/11/2019 1,000,000 17.49 20/11/2019 1,000,000 20.99
Class Q 13/11/2019 1,000,000 17.49 20/11/2019 1,000,000 20.99
Class R 13/11/2019 1,000,000 17.49 20/11/2019 1,000,000 20.99
Class S
23/01/2020 750,000 21.99
3,000,000
3,000,000
750,000
For
per
sona
l use
onl
y

A D V E R I T A S L I M I T E D D I R E C T O R S ’ R E P O R T
21
REMUNERATION REPORT (AUDITED) (continued)
5. Additional disclosures relating to performance rights, options and shares (continued) Performance Rights (continued) 2019
M. Ratty L. Taylor
Grant date Number granted
Fair value per
performance right at
grant date (cents) Grant date
Number granted
Fair value per
performance right at
grant date (cents)
Class H 26/06/2019 250,000 12.49 25/01/2019 200,000 9.99 Class I 26/06/2019 500,000 12.49 25/01/2019 400,000 9.99 Class J 26/06/2019 500,000 12.49 25/01/2019 400,000 9.99 Class K 26/06/2019 1,000,000 12.49 25/01/2019 800,000 9.99 Class L 26/06/2019 1,500,000 12.49 25/01/2019 1,200,000 9.99
Class M 26/06/2019 1,000,000 9.37 25/01/2019 800,000 7.49 Class N 26/06/2019 1,500,000 6.25 25/01/2019 1,200,000 5.00 Class O 26/06/2019 2,000,000 6.25 25/01/2019 1,600,000 5.00
8,250,000
6,600,000
For
per
sona
l use
onl
y

A D V E R I T A S L I M I T E D D I R E C T O R S ’ R E P O R T
22
REMUNERATION REPORT (AUDITED) (continued) 5. Additional disclosures relating to performance rights, options and shares (continued) Performance Rights (continued) Details of the vesting conditions, expiry dates and status of the performance rights held by key management personnel on 30 June 2020 are set out below:
Tranche Vesting Condition Number Expiry date Status at 30 June 2020
Class H First 10 clients that sign on using TrafficGuard 450,000 30 June 2021 Vested, not yet converted into ordinary shares
Class I First 3 Tier 1 Clients who the Board consider to be enterprise level i.e. > 1 billion clicks per month 900,000 30 June 2021 Vested, not yet converted into ordinary shares
Class J First achievement of revenue producing twelve-month contracts to the amount of $1m 900,000 30 June 2021 Vested, not yet converted into ordinary shares
Class K First achievement of revenue producing twelve-month contracts to the amount of $3m 1,800,000 30 June 2021 Not yet vested
Class L First achievement of revenue producing twelve-month contracts to the amount of $5m 2,700,000 30 June 2021 Not yet vested
Class M First achievement of break-even cash flow in a financial year 1,800,000 30 June 2021 Not yet vested
Class N First achievement of audited $1m earnings before interest tax, depreciation and amortization (EBITDA) 2,700,000 30 June 2021 Not yet vested
Class O First achievement of audited $3m EBITDA 3,600,000 30 June 2021 Not yet vested
Class P First 3 Tier 1 clients in USA 2,000,000 30 June 2021 Not yet vested
Class Q First 3 Tier 1 clients in LATAM 2,000,000 30 June 2021 Not yet vested
Class R First 3 Tier 1 clients in APAC 2,000,000 30 June 2021 Not yet vested
Class S Executive continues to be a full-time employee of the Group at 26 February 2022. 750,000 25 April 2022 Not yet vested F
or p
erso
nal u
se o
nly
A D V E R I T A S L I M I T E D D I R E C T O R S ’ R E P O R T
23
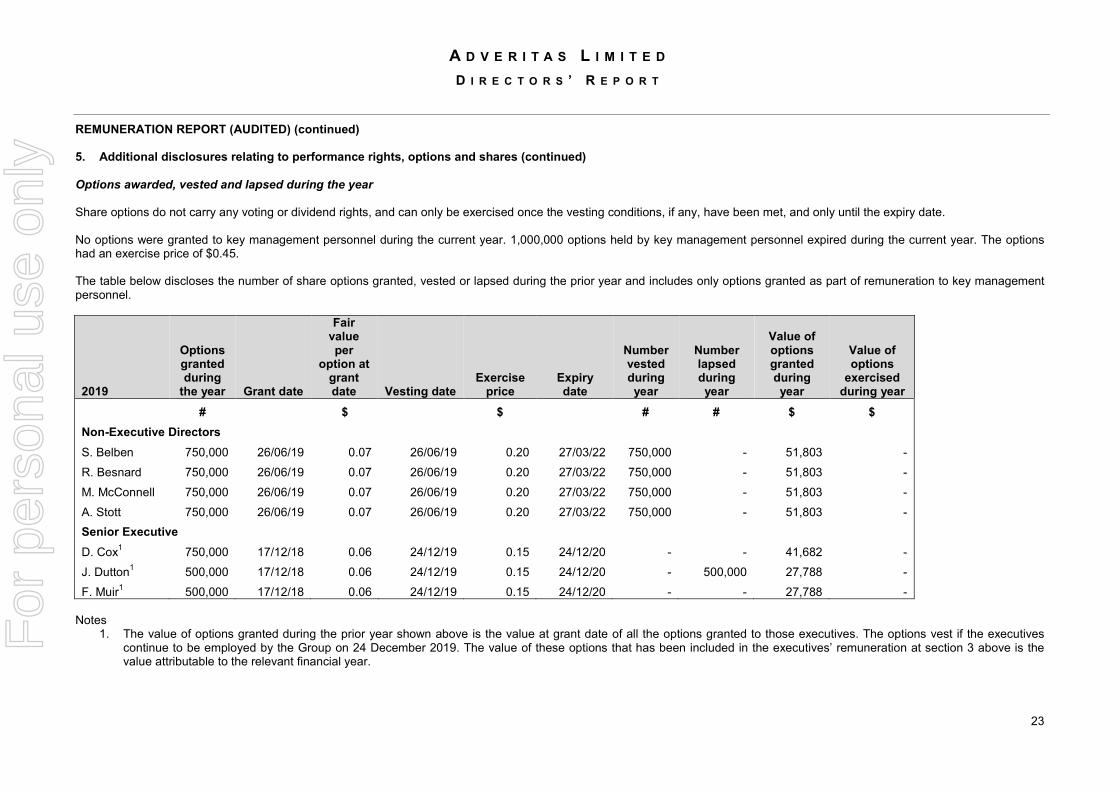
REMUNERATION REPORT (AUDITED) (continued) 5. Additional disclosures relating to performance rights, options and shares (continued) Options awarded, vested and lapsed during the year Share options do not carry any voting or dividend rights, and can only be exercised once the vesting conditions, if any, have been met, and only until the expiry date. No options were granted to key management personnel during the current year. 1,000,000 options held by key management personnel expired during the current year. The options had an exercise price of $0.45. The table below discloses the number of share options granted, vested or lapsed during the prior year and includes only options granted as part of remuneration to key management personnel.
2019
Options granted during
the year Grant date
Fair value per
option at grant date Vesting date
Exercise price
Expiry date
Number vested during year
Number lapsed during year
Value of options granted during year
Value of options
exercised during year
# $ $ # # $ $ Non-Executive Directors S. Belben 750,000 26/06/19 0.07 26/06/19 0.20 27/03/22 750,000 - 51,803 - R. Besnard 750,000 26/06/19 0.07 26/06/19 0.20 27/03/22 750,000 - 51,803 - M. McConnell 750,000 26/06/19 0.07 26/06/19 0.20 27/03/22 750,000 - 51,803 - A. Stott 750,000 26/06/19 0.07 26/06/19 0.20 27/03/22 750,000 - 51,803 - Senior Executive D. Cox1 750,000 17/12/18 0.06 24/12/19 0.15 24/12/20 - - 41,682 - J. Dutton1 500,000 17/12/18 0.06 24/12/19 0.15 24/12/20 - 500,000 27,788 - F. Muir1 500,000 17/12/18 0.06 24/12/19 0.15 24/12/20 - - 27,788 -
Notes
1. The value of options granted during the prior year shown above is the value at grant date of all the options granted to those executives. The options vest if the executives continue to be employed by the Group on 24 December 2019. The value of these options that has been included in the executives’ remuneration at section 3 above is the value attributable to the relevant financial year.
For
per
sona
l use
onl
y
A D V E R I T A S L I M I T E D D I R E C T O R S ’ R E P O R T
24
REMUNERATION REPORT (AUDITED) (continued)
5. Additional disclosures relating to performance rights, options and shares (continued)
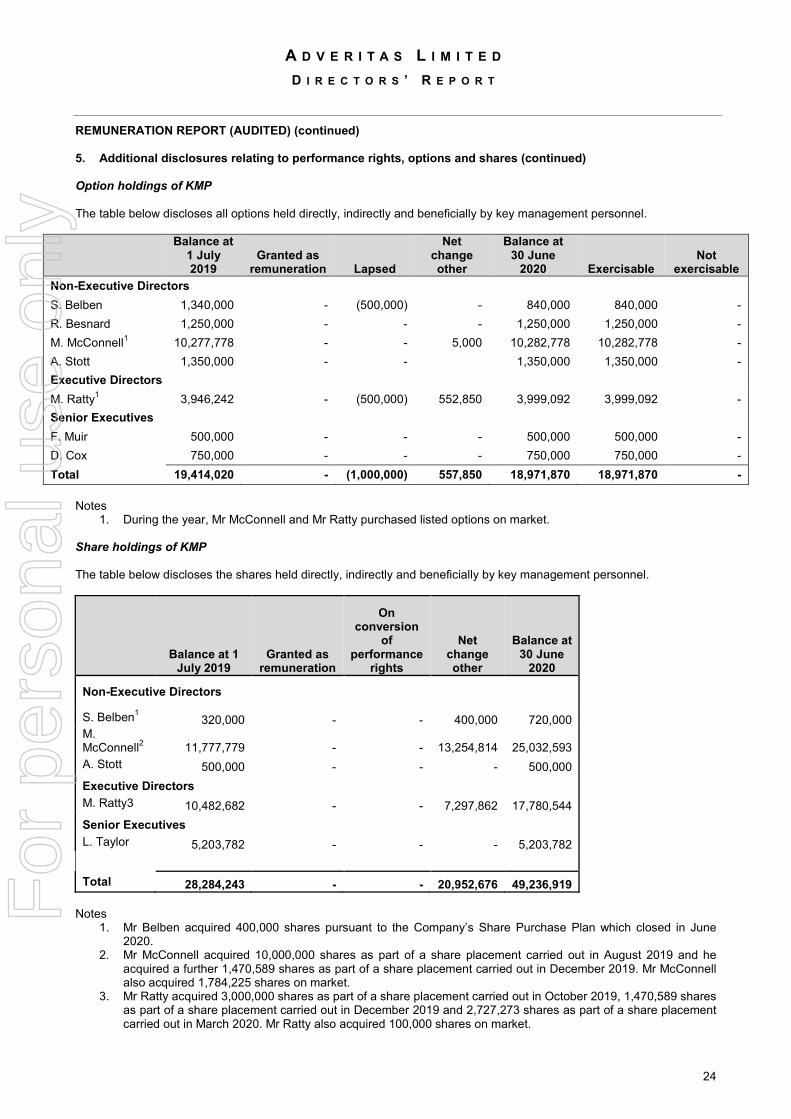
Option holdings of KMP The table below discloses all options held directly, indirectly and beneficially by key management personnel.
Balance at
1 July 2019
Granted as remuneration Lapsed
Net change other
Balance at 30 June
2020 Exercisable Not
exercisable Non-Executive Directors S. Belben 1,340,000 - (500,000) - 840,000 840,000 - R. Besnard 1,250,000 - - - 1,250,000 1,250,000 - M. McConnell1 10,277,778 - - 5,000 10,282,778 10,282,778 - A. Stott 1,350,000 - - 1,350,000 1,350,000 - Executive Directors M. Ratty1 3,946,242 - (500,000) 552,850 3,999,092 3,999,092 - Senior Executives F. Muir 500,000 - - - 500,000 500,000 - D. Cox 750,000 - - - 750,000 750,000 - Total 19,414,020 - (1,000,000) 557,850 18,971,870 18,971,870 -
Notes
1. During the year, Mr McConnell and Mr Ratty purchased listed options on market. Share holdings of KMP The table below discloses the shares held directly, indirectly and beneficially by key management personnel.
Balance at 1
July 2019 Granted as
remuneration
On conversion
of performance
rights
Net change other
Balance at 30 June
2020
Non-Executive Directors
S. Belben1 320,000 - - 400,000 720,000 M. McConnell2 11,777,779 - - 13,254,814 25,032,593 A. Stott 500,000 - - - 500,000 Executive Directors M. Ratty3 10,482,682 - - 7,297,862 17,780,544 Senior Executives L. Taylor 5,203,782 - - - 5,203,782 Total 28,284,243 - - 20,952,676 49,236,919
Notes
1. Mr Belben acquired 400,000 shares pursuant to the Company’s Share Purchase Plan which closed in June 2020.
2. Mr McConnell acquired 10,000,000 shares as part of a share placement carried out in August 2019 and he acquired a further 1,470,589 shares as part of a share placement carried out in December 2019. Mr McConnell also acquired 1,784,225 shares on market.
3. Mr Ratty acquired 3,000,000 shares as part of a share placement carried out in October 2019, 1,470,589 shares as part of a share placement carried out in December 2019 and 2,727,273 shares as part of a share placement carried out in March 2020. Mr Ratty also acquired 100,000 shares on market.
For
per
sona
l use
onl
y

A D V E R I T A S L I M I T E D D I R E C T O R S ’ R E P O R T
25
REMUNERATION REPORT (AUDITED) (continued)
6. Other transactions and balances with key management personnel and their related parties During the current year, Adveritas Limited continued its consultancy agreement with 13811 Advisory Pte Ltd, a company of which Mr Stott is the CEO and founder. The consultancy services include the provision of promotion and marketing services. Under the agreement, Mr Stott was entitled to consultancy fees of SGD 3,000 per month for the period 1 Jul 2019 to 31 December 2019, and $5,000 per month for the period 1 January 2020 to 30 June 2020.
Signed in accordance with a resolution of the directors:
Stephen Belben Non-Executive Chairman Perth, Western Australia Dated this 28th day of August 2020
For
per
sona
l use
onl
y
A member firm of Ernst & Young Global Limited Liability limited by a scheme approved under Professional Standards Legislation
MC:TGF:ADVERITAS:007
Ernst & Young 11 Mounts Bay Road Perth WA 6000 Australia GPO Box M939 Perth WA 6843
Tel: +61 8 9429 2222 Fax: +61 8 9429 2436 ey.com/au
Auditor’s independence declaration to the directors of Adveritas Limited
As lead auditor for the audit of the financial report of Adveritas Limited for the financial year ended 30
June 2020, I declare to the best of my knowledge and belief, there have been:
a. no contraventions of the auditor independence requirements of the Corporations Act 2001 in
relation to the audit; and
b. no contraventions of any applicable code of professional conduct in relation to the audit.
This declaration is in respect of Adveritas Limited and the entities it controlled during the financial year. Ernst & Young Mark P Cunningham Partner 28 August 2020
For
per
sona
l use
onl
y
A D V E R I T A S L I M I T E D C O N S O L I D A T E D S T A T E M E N T O F P R O F I T A N D L O S S A N D O T H E R
C O M P R E H E N S I V E I N C O M E F O R T H E Y E A R E N D E D 3 0 J U N E 2 0 2 0
27
The Consolidated Statement of Profit and Loss and Other Comprehensive Income is to be read in conjunction with the notes to the consolidated financial statements.
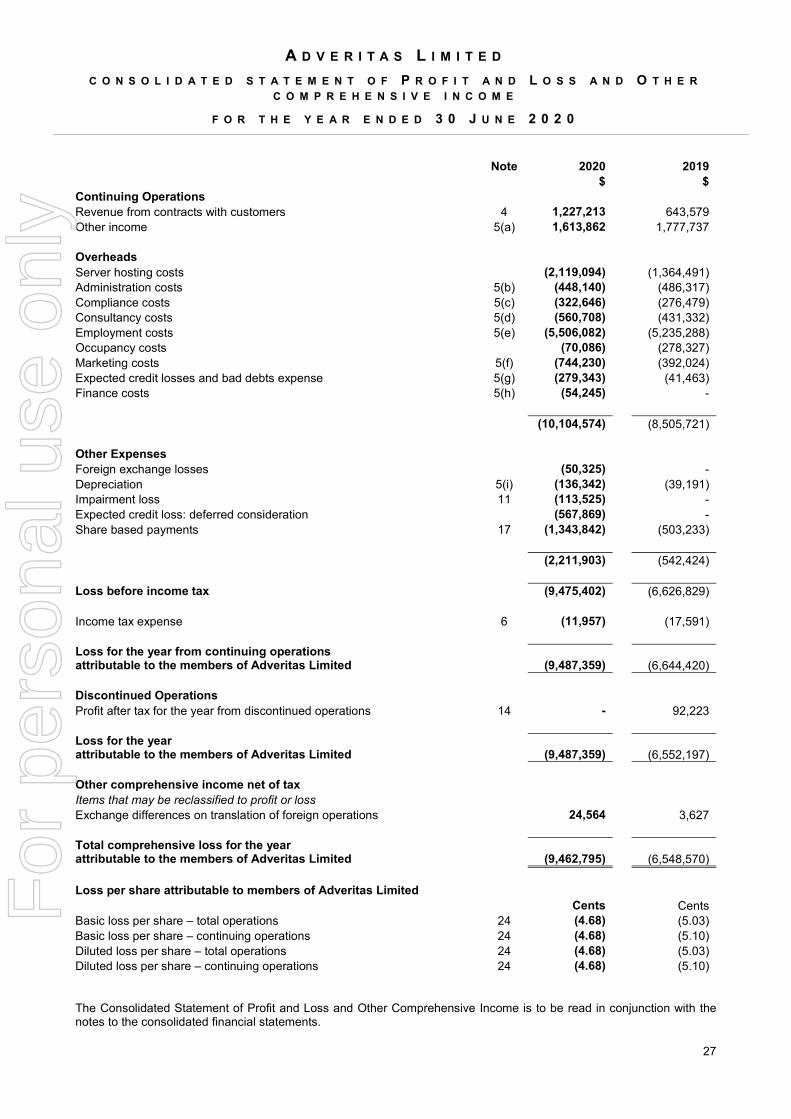
Note 2020 2019 $ $ Continuing Operations Revenue from contracts with customers 4 1,227,213 643,579 Other income 5(a) 1,613,862 1,777,737
Overheads Server hosting costs (2,119,094) (1,364,491) Administration costs 5(b) (448,140) (486,317) Compliance costs 5(c) (322,646) (276,479) Consultancy costs 5(d) (560,708) (431,332) Employment costs 5(e) (5,506,082) (5,235,288) Occupancy costs (70,086) (278,327) Marketing costs 5(f) (744,230) (392,024) Expected credit losses and bad debts expense 5(g) (279,343) (41,463) Finance costs 5(h) (54,245) - (10,104,574) (8,505,721) Other Expenses Foreign exchange losses (50,325) - Depreciation 5(i) (136,342) (39,191) Impairment loss 11 (113,525) - Expected credit loss: deferred consideration (567,869) - Share based payments 17 (1,343,842) (503,233) (2,211,903) (542,424)
Loss before income tax (9,475,402) (6,626,829)
Income tax expense 6 (11,957) (17,591)
Loss for the year from continuing operations attributable to the members of Adveritas Limited (9,487,359) (6,644,420) Discontinued Operations Profit after tax for the year from discontinued operations 14 - 92,223
Loss for the year attributable to the members of Adveritas Limited (9,487,359) (6,552,197) Other comprehensive income net of tax Items that may be reclassified to profit or loss Exchange differences on translation of foreign operations 24,564 3,627 Total comprehensive loss for the year attributable to the members of Adveritas Limited (9,462,795) (6,548,570) Loss per share attributable to members of Adveritas Limited Cents Cents Basic loss per share – total operations 24 (4.68) (5.03) Basic loss per share – continuing operations 24 (4.68) (5.10) Diluted loss per share – total operations 24 (4.68) (5.03) Diluted loss per share – continuing operations 24 (4.68) (5.10)
For
per
sona
l use
onl
y
A D V E R I T A S L I M I T E D C O N S O L I D A T E D S T A T E M E N T O F F I N A N C I A L P O S I T I O N
A S A T 3 0 J U N E 2 0 2 0
28
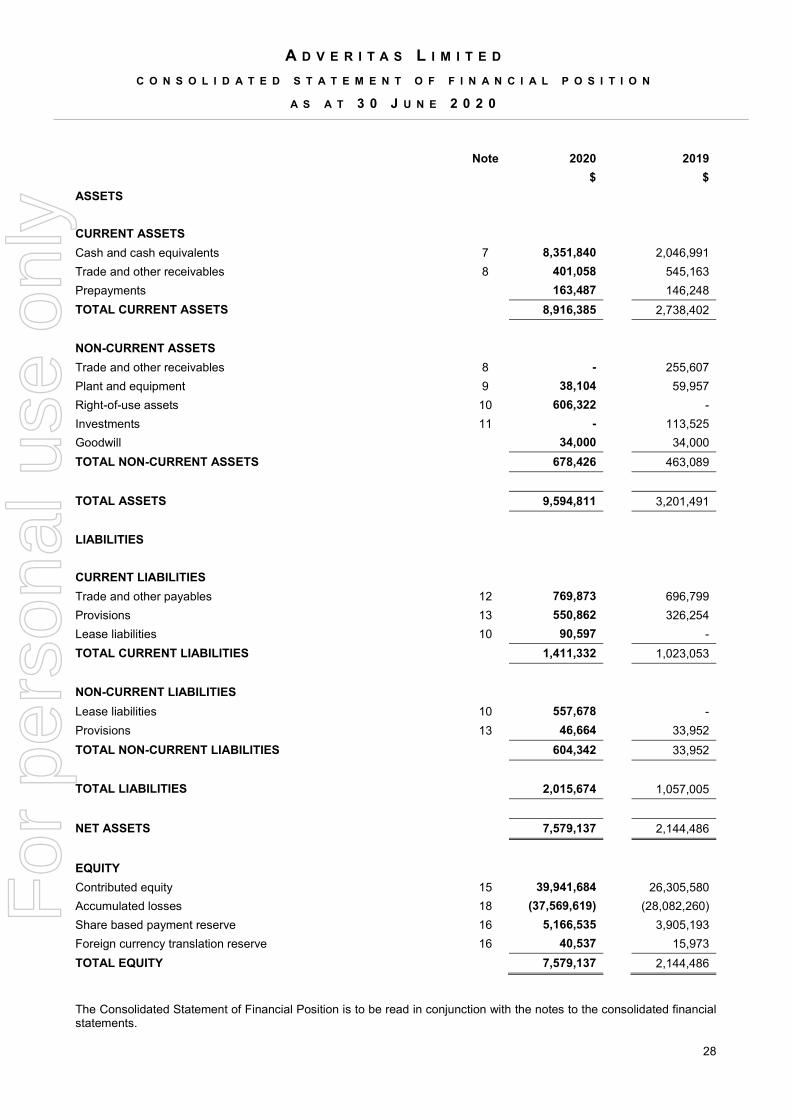
Note 2020 2019 $ $ ASSETS CURRENT ASSETS Cash and cash equivalents 7 8,351,840 2,046,991 Trade and other receivables 8 401,058 545,163 Prepayments 163,487 146,248 TOTAL CURRENT ASSETS 8,916,385 2,738,402 NON-CURRENT ASSETS Trade and other receivables 8 - 255,607 Plant and equipment 9 38,104 59,957 Right-of-use assets 10 606,322 - Investments 11 - 113,525 Goodwill 34,000 34,000 TOTAL NON-CURRENT ASSETS 678,426 463,089 TOTAL ASSETS 9,594,811 3,201,491 LIABILITIES CURRENT LIABILITIES Trade and other payables 12 769,873 696,799 Provisions 13 550,862 326,254 Lease liabilities 10 90,597 - TOTAL CURRENT LIABILITIES 1,411,332 1,023,053 NON-CURRENT LIABILITIES Lease liabilities 10 557,678 - Provisions 13 46,664 33,952 TOTAL NON-CURRENT LIABILITIES 604,342 33,952 TOTAL LIABILITIES 2,015,674 1,057,005 NET ASSETS 7,579,137 2,144,486
EQUITY Contributed equity 15 39,941,684 26,305,580 Accumulated losses 18 (37,569,619) (28,082,260) Share based payment reserve 16 5,166,535 3,905,193 Foreign currency translation reserve 16 40,537 15,973 TOTAL EQUITY 7,579,137 2,144,486 The Consolidated Statement of Financial Position is to be read in conjunction with the notes to the consolidated financial statements.
For
per
sona
l use
onl
y

A D V E R I T A S L T D C O N S O L I D A T E D S T A T E M E N T O F C A S H F L O W S
F O R T H E Y E A R E N D E D 3 0 J U N E 2 0 2 0
29
Note 2020 2019 $ $ Cash flows from operating activities Receipts from customers 877,422 1,080,608 Payments to suppliers and employees (9,536,248) (9,003,613) Research and development grant income received 5(a) 1,287,433 955,868 Other income received 177,187 41,981 Interest received 15,676 22,613 Interest expense on lease liabilities 10 (54,245) (943) Income tax refund received - 20,378 Income tax paid - (43,501) Net cash flows used in operating activities 7 (7,232,775) (6,926,609) Cash flows from investing activities Purchase of plant and equipment (14,969) (28,362) Proceeds on disposal of plant and equipment - 904 Proceeds on disposal of controlled entity 14 29,458 557,201 Payment of withholding tax - (38,669) Cash disposed of on sale of controlled entity 14 - (348,192) Net cash flows generated by / (used in) investing activities 14,489 142,882 Cash flows from financing activities Proceeds from issue of shares 13,974,428 4,725,826 Share issue costs paid (387,310) (263,247) Advances received under debtor financing facility - 61,398 Lease liability payments 10 (59,101) - Net cash flows provided by financing activities 13,528,017 4,523,977 Net increase in cash and cash equivalents 6,309,731 (2,259,750) Cash and cash equivalents at the beginning of the year 2,046,991 4,231,884 Effects of exchange rate changes on cash and cash equivalents (4,882) 74,857 Cash and cash equivalents at the end of the year 7 8,351,840 2,046,991 The Consolidated Statement of Cash Flows is to be read in conjunction with the notes to the consolidated financial statements. F
or p
erso
nal u
se o
nly

A D V E R I T A S L T D C O N S O L I D A T E D S T A T E M E N T O F C H A N G E S I N E Q U I T Y
F O R T H E Y E A R E N D E D 3 0 J U N E 2 0 2 0
30
Contributed equity
Accumulated losses
Share based
payments reserve
Foreign currency
translation reserve Total equity
$ $ $ $ $ Balance at 1 July 2019 26,305,580 (28,082,260) 3,905,193 15,973 2,144,486 Loss for the year - (9,487,359) - - (9,487,359) Other comprehensive income Foreign exchange differences arising on translation of foreign operations - - - 24,564 24,564
Total comprehensive income / (expenditure) for the year - (9,487,359) - 24,564 (9,462,795)
Transactions with equity holders in their capacity as owners
Ordinary shares issued 14,136,089 - - - 14,136,089 Share issue costs (499,985) - - - (499,985) Share based payments expense - - 1,261,342 - 1,261,342 13,636,104 - 1,261,342 - 14,897,446 Balance at 30 June 2020 39,941,684 (37,569,619) 5,166,535 40,537 7,579,137 Balance at 1 July 2018 22,586,507 (21,491,395) 2,658,453 12,346 3,765,911 Loss for the year - (6,552,197) - - (6,552,197) Other comprehensive income Foreign exchange differences arising on translation of foreign operations - - - 3,627 3,627
Total comprehensive income / (expenditure) for the year - (6,552,197) - 3,627 (6,548,570)
Transactions with equity holders in their capacity as owners
Ordinary shares issued 4,797,082 - - - 4,797,082 Share issue costs (1,091,339) - - - (1,091,339) Share based payments expense - - 1,260,070 - 1,260,070 Shares issued on vesting of performance rights 13,330 - (13,330) - - Withholding tax on dividends paid - (38,668) - - (38,669) 3,719,073 (38,668) 1,246,740 - 4,927,144 Balance at 30 June 2019 26,305,580 (28,082,260) 3,905,193 15,973 2,144,486
The Consolidated Statement of Changes in Equity is to be read in conjunction with the notes to the consolidated financial statements.
For
per
sona
l use
onl
y

A D V E R I T A S L T D N O T E S T O T H E C O N S O L I D A T E D F I N A N C I A L S T A T E M E N T S
F O R T H E Y E A R E N D E D 3 0 J U N E 2 0 2 0
31
1. CORPORATE INFORMATION
The consolidated financial report of Adveritas Limited (Adveritas or Company) and its controlled entities (collectively referred to as the Group) for the year ended 30 June 2020 was authorised for issue in accordance with a resolution of the directors on 27 August 2020. Adveritas is a for-profit company limited by shares incorporated and domiciled in Australia whose shares are publicly traded on the Australian Securities Exchange. The Group’s registered office is in Bentley, Western Australia. The nature of operations and principal activities of the Group are the creation of innovative software solutions that leverage big data to drive business performance. TrafficGuard, is the Group’s first commercially available software as a service. Information on the Group’s corporate structure and related party relationships is provided in Note 21.
2. SUMMARY OF SIGNIFICANT ACCOUNTING POLICIES
This note provides a summary of the significant accounting policies adopted in the preparation of this consolidated financial report. These policies have been consistently applied to all the years presented, unless otherwise stated. (a) Basis of Preparation
The consolidated financial report has been prepared on a historical cost basis and is presented in Australian dollars.
(b) Statement of Compliance
The consolidated financial statements have been prepared in accordance with the requirements of the Corporations Act 2001, Australian Accounting Standards and other authoritative pronouncements issued by the Australian Accounting Standards Board and comply with the International Financial Reporting Standards (IFRS) as issued by the International Accounting Standards Board (IASB).
(c) Changes in accounting policies, disclosures, standards and interpretations
i. Accounting Standards and Interpretations issued but not yet adopted
Australian Accounting Standards and Interpretations that have recently been issued or amended but are not yet effective and have not been adopted by the Group for the annual reporting period ended 30 June 2020 are outlined below.
Amendments to AASB 3: Definition of a Business In October 2018, the AASB issued amendments to the definition of a business in AASB 3 Business Combinations to help entities determine whether an acquired set of activities and assets is a business or not. They clarify the minimum requirements for a business, remove the assessment of whether market participants are capable of replacing any missing elements, add guidance to help entities assess whether an acquired process is substantive, narrow the definitions of a business and of outputs, and introduce an optional fair value concentration test. Since the amendments apply prospectively to transactions or other events that occur on or after the date of first application, the Group will not be affected by these amendments on the date of transition. Application date of standard: 1 January 2020 Application date for the Group: 1 July 2020
Impact on the Consolidated Financial Statements: The Group does not anticipate any impact on its consolidated financial statements.
For
per
sona
l use
onl
y
A D V E R I T A S L I M I T E D N O T E S T O T H E C O N S O L I D A T E D F I N A N C I A L S T A T E M E N T S
F O R T H E Y E A R E N D E D 3 0 J U N E 2 0 2 0
32
2. SUMMARY OF SIGNIFICANT ACCOUNTING POLICIES (continued)
(c) Changes in accounting policies, disclosures, standards and interpretations (continued)
i. Accounting Standards and Interpretations issued but not yet adopted (continued)
Amendments to AASB 101 and AASB 108: Definition of Material In October 2018, the AASB issued amendments to AASB 101 Presentation of Financial Statements and AASB 108 Accounting Policies, Changes in Accounting Estimates and Errors to align the definition of ‘material’ across the standards and to clarify certain aspects of the definition. The new definition states that, ’Information is material if omitting, misstating or obscuring it could reasonably be expected to influence decisions that the primary users of general purpose financial statements make on the basis of those financial statements, which provide financial information about a specific reporting entity.’ Application date of standard: 1 January 2020 Application date for the Group: 1 July 2020
Impact on the Consolidated Financial Statements: The Group does not anticipate any impact on its consolidated financial statements.
ii. New standards, interpretation and amendments adopted by the Group
The new standards, interpretations and amendments adopted by the Group in the current year are set out below. The Group has not early adopted any of the accounting standards that have been issued but are not yet effective as of balance date.
(a) AASB 16 Leases
The Group applies, for the first time, AASB16 Leases. AASB 16 supersedes AASB 117 Leases and AASB Interpretation 4 Determining whether and Arrangement contains a Lease. AASB 16 sets out the principles for the recognition, measurement, presentation and disclosure of the leases and requires leases to account for all leases under a single on-balance sheet model. The Group adopted AASB 16 using the modified retrospective method of adoption with the date of initial application of 1 July 2019. Under this method, the standard is applied retrospectively with the cumulative effect of initially applying the standard recognised at the date of initial application. The Group elected to use the transition practical expedient allowing the standard to be applied only to contracts that were previously identified as leases at the date of initial application (1 July 2019). The Group also elected to use the practical expedient for lease contracts that, at the commencement date of applying AASB 16, have a lease term of 12 months or less and do not contain a purchase option (‘short-term leases’), and lease contracts for which the underlying asset is of low value (‘low-value assets’).
For
per
sona
l use
onl
y

A D V E R I T A S L I M I T E D N O T E S T O T H E C O N S O L I D A T E D F I N A N C I A L S T A T E M E N T S
F O R T H E Y E A R E N D E D 3 0 J U N E 2 0 2 0
33
2. SUMMARY OF SIGNIFICANT ACCOUNTING POLICIES (continued) (c) Changes in accounting policies, disclosures, standards and interpretations (continued)
ii. New standards, interpretation and amendments adopted by the Group (continued)
(a) AASB 16 Leases (continued) The effect of adopting AASB 16 as at 1 July 2019 was as follows:
Increase / (Decrease) $ Assets Right-of-use assets 707,376 Total assets 707,376 Liabilities Interest bearing liabilities 707,376 Total liabilities 707,376 Total equity adjustment Retained earnings - -
Nature of the effect of adoption of AASB 16 The Group has lease contracts for office premises and various items of office equipment. Before the adoption of AASB 16, the Group, as the lessee, classified each of its leases at inception as either a finance lease or an operating lease. A lease was classified as a finance lease if it transferred substantially all of the risks and rewards incidental to ownership of the leased asset to the Group, otherwise it was classified as an operating lease. Finance leases were capitalised at the commencement of the lease at the inception date fair value of the leased property or, if lower, at the present value of the minimum lease payments. For leases classified as finance leases, lease payments were apportioned between interest (recognised as finance costs) and a reduction of the lease liability. For leases classified as operating leases, the leased property was not capitalised and the lease payments were recognised as an expense in profit or loss on a straight-line basis over the lease term. Upon adoption of AASB 16, the Group applied a single recognition and measurement approach for all leases, except for short-term leases and leases of low-value assets (assets with value less than $5,000). The standard provides specific transition requirements and practical expedients, which have been applied by the Group. Leases previously classified as finance leases As at the date of application of AASB 16, the Group did not have any leases classified as finance leases. Leases previously classified as operating leases
The Group recognised right-of-use assets and lease liabilities for those leases previously classified as operating leases, except for short-term leases and leases of low-value assets. The Group has elected to present the right of use assets separately and the lease liabilities as part of interest-bearing liabilities in the Consolidated Statement of Financial Position. The right-of-use assets were recognised based on the amount equal to the lease liabilities. Lease liabilities were recognised based on the present value of the remaining lease payments over the lease term, discounted using the incremental borrowing interest rate at the date of initial application.
For
per
sona
l use
onl
y

A D V E R I T A S L I M I T E D N O T E S T O T H E C O N S O L I D A T E D F I N A N C I A L S T A T E M E N T S
F O R T H E Y E A R E N D E D 3 0 J U N E 2 0 2 0
34
2. SUMMARY OF SIGNIFICANT ACCOUNTING POLICIES (continued)
(c) Changes in accounting policies, disclosures, standards and interpretations (continued)
(ii) New standards, interpretation and amendments adopted by the Group (continued) (a) AASB 16 Leases (continued)
Nature of the effect of adoption of AASB 16 (continued)
The Group also applied the available practical expedients wherein it: • Applied the short-term leases exemptions to leases with a lease term that ends within 12
months at the date of initial application • Excluded the initial direct costs from the measurement of the right-of-use asset at the date of
initial application • Elected not to separate non-lease components from lease components, and instead account
for the lease component and any associated non-lease components as a single lease component
The lease liabilities recognised at 1 July 2019 can be reconciled to the operating lease commitments as of 30 June 2019 as follows:
$ Operating lease commitments as at 30 June 2019 554,726 Less: Impact of discounting lease commitments at the incremental borrowing rate of 8.03% (67,582)
Commitments relating to short-term and low value leases (4,545) Add: In substance fixed lease payments 224,777 Lease liabilities as at 1 July 2019 707,376
Summary of new accounting policies upon adoption of AASB 16 Set out below are the new accounting policies of the Group upon adoption of AASB 16: • Right-of-use assets
The Group recognises right-of-use assets at the commencement date of the lease (i.e., the date the underlying asset is available for use). Right-of-use assets are measured at cost, less any accumulated depreciation and impairment losses, and adjusted for any remeasurement of lease liabilities. The cost of right-of-use assets includes the amount of lease liabilities recognised, initial direct costs incurred, estimates of costs to be incurred by the group in restoring the underlying asset to the condition required by the terms and conditions of the lease, and lease payments made at or before the commencement date less any lease incentives received. Unless the Group is reasonably certain to obtain ownership of the leased asset at the end of the lease term, the recognised right-of-use assets are depreciated on a straight-line basis over the shorter of its estimated useful life and the lease term. Right-of-use assets are subject to impairment. • Lease Liabilities
At the commencement date of the lease, the Group recognises lease liabilities measured at the present value of lease payments to be made over the lease term. The lease payments include fixed payments (including in-substance fixed payments) less any lease incentives receivable, variable lease payments that depend on an index or a rate, and amounts expected to be paid under residual value guarantees. The lease payments also include the exercise price of a purchase option reasonably certain to be exercised by the Group, and payments of penalties for terminating a lease, if the lease term reflects the Group exercising the option to terminate. The variable lease payments that do not depend on an index or a rate are recognised as an expense in the period on which the event or condition that triggers the payment occurs.
For
per
sona
l use
onl
y

A D V E R I T A S L I M I T E D N O T E S T O T H E C O N S O L I D A T E D F I N A N C I A L S T A T E M E N T S
F O R T H E Y E A R E N D E D 3 0 J U N E 2 0 2 0
35
2. SUMMARY OF SIGNIFICANT ACCOUNTING POLICIES (continued) (c) Changes in accounting policies, disclosures, standards and interpretations (continued)
(ii) New standards, interpretation and amendments adopted by the Group (continued) (a) AASB 16 Leases (continued)
Summary of new accounting policies upon adoption of AASB 16 (continued)
• Lease Liabilities (continued) In calculating the present value of lease payments, the Group its incremental borrowing rate at the lease commencement date if the interest rate implicit in the lease agreement is not readily determinable. After the commencement date, the amount of lease liabilities is increased to reflect the accretion of interest and reduced for the lease payments made. In addition, the carrying amount of lease liabilities is remeasured if there is a modification, a change in the lease term, a change in the in-substance fixed lease payments or a change in the assessment to purchase the underlying asset. • Short-term leases and leases of low-value assets The Group applies the short-term lease recognition exemption to its short-term leases of property, plant and equipment (i.e., those leases that have a lease term of 12 months or less from the commencement date and do not contain a purchase option). It also applies the lease of low-value assets recognition exemption to leases of office equipment that are considered of low value (i.e., below $5,000). Lease payments on short-term leases and leases of low-value assets are recognised as an expense on a straight-line basis over the lease term.
• Significant judgement in determining the lease term of contracts with renewal options The Group determines the lease term as the non-cancellable term of the lease, together with any periods covered by an option to extend the lease if it is reasonably certain to be exercised, or any periods covered by an option to terminate the lease, if it is reasonably certain not to be exercised. The Group has the option, under its lease to lease the assets for additional terms of five years. The Group applies judgement in evaluating whether it is reasonably certain to exercise the option to renew. That is, it considers all relevant factors that create an economic incentive for it to exercise the renewal. After the commencement date, the Group reassesses the lease term if there is a significant event or change in circumstances that is within its control and affects its ability to exercise (or not to exercise) the option to renew (e.g., a change in business strategy). The Group included the renewal period as part of the lease term for its lease of property due to the significance of this asset to its operations. The lease has a short non-cancellable period (i.e., three to five years) and there will be a significant negative effect on the Company’s operations if a replacement is not readily available. For month-by-month leases, the Group has determined it is not reasonably certain that extension options will be exercised. These have been considered short-term leases and the short-term lease exemption has been applied. Set out below, are the carrying amounts of the Group’s right-of-use assets and lease liabilities and the movements during the period: Right-of-use asset Lease Liability Property Property
$ $ As at 1 July 2019 707,376 707,376 Depreciation expense (101,054) - Interest expense - 54,245 Lease payments - (113,346) As at 30 June 2020 606,322 648,275
For
per
sona
l use
onl
y

A D V E R I T A S L I M I T E D N O T E S T O T H E C O N S O L I D A T E D F I N A N C I A L S T A T E M E N T S
F O R T H E Y E A R E N D E D 3 0 J U N E 2 0 2 0
36
2. SUMMARY OF SIGNIFICANT ACCOUNTING POLICIES (continued) (c) Changes in accounting policies, disclosures, standards and interpretations (continued)
(ii) New standards, interpretation and amendments adopted by the Group (continued) (a) AASB 16 Leases (continued)
Summary of new accounting policies upon adoption of AASB 16 (continued) Set out below, are the amounts recognised in profit and loss:
Consolidated
30 June 2020
30 June 2019
$ $ Depreciation expense of right-of-use assets 101,054 - Interest expense on lease liabilities 54,245 - Rent expense – short-term assets 34,672 - Rent expense – lease of low-value assets 1,500 -
Total amounts recognised in profit and loss 191,471 -
Set below is the impact on the Consolidated Statement of Cash Flows:
Consolidated 30 June 30 June 2020 2019 $ $
Operating lease payments – decreased (59,101) - Net cash flows from operating activities (59,101) -
Payment of lease liability - increased 59,101 - Net cash flows from financing activities 59,101 -
Net cash flow impact - - (b) AASB Interpretation 23 Uncertainty over Income Tax Treatment
The Interpretation addresses the accounting for income taxes when tax treatments involve uncertainty that affects the application of IAS 12 Income Taxes. It does not apply to taxes or levies outside the scope of IAS 12, nor does it specifically include requirements relating to interest and penalties associated with uncertain tax treatments. The Interpretation specifically addresses the following: • Whether an entity considers uncertain tax treatments separately • The assumptions an entity makes about the examination of tax treatments by taxation authorities • How an entity determines taxable profit (tax loss), tax bases, unused tax losses, unused tax
credits and tax rates • How an entity considers changes in facts and circumstances An entity has to determine whether to consider each uncertain tax treatment separately or together with one or more other uncertain tax treatments. The approach that better predicts the resolution of the uncertainty needs to be followed. The Group applies significant judgement in identifying uncertainties over income tax treatments. Since the Group operates in a multinational environment, it assessed whether the Interpretation had an impact on its consolidated financial statements. Upon adoption of the Interpretation, the Group considered whether it had any uncertain tax positions, particularly those relating to transfer pricing. The Company’s and the subsidiaries’ tax filings in different jurisdictions include deductions related to transfer pricing and the taxation authorities may challenge those tax treatments. The Group determined, based on its tax compliance and transfer pricing study that it is probable that its tax treatments (including those for the subsidiaries) will be accepted by the taxation authorities. Consequently, the interpretation did not have an impact on the consolidated financial statements of the Group.
For
per
sona
l use
onl
y

A D V E R I T A S L I M I T E D N O T E S T O T H E C O N S O L I D A T E D F I N A N C I A L S T A T E M E N T S
F O R T H E Y E A R E N D E D 3 0 J U N E 2 0 2 0
37
2. SUMMARY OF SIGNIFICANT ACCOUNTING POLICIES (continued)
(d) Basis of Consolidation
Control is achieved when the Group is exposed, or has rights, to variable returns from its involvement with the investee and has the ability to affect those returns through its power over the investee. Specifically, the Group controls an investee if and only if the Group has:
• Power over the investee (i.e. existing rights that give it the current ability to direct the relevant activities of the investee)
• Exposure, or rights, to variable returns from its involvement with the investee • The ability to use its power over the investee to affect its returns
Generally, there is a presumption that a majority of voting rights results in control. To support this presumption, and when the Group has less than a majority of the voting or similar rights of an investee, the Group considers all relevant facts and circumstances in assessing whether it has power over an investee, including:
• The contractual arrangement(s) with the other vote holders of the investee • Rights arising from other contractual arrangements • The Group’s voting rights and potential voting rights
The Group re-assesses whether or not it controls an investee if facts and circumstances indicate that there are changes to one or more of the three elements of control. Consolidation of a subsidiary begins when the Group obtains control over the subsidiary and ceases when the Group loses control of the subsidiary. Assets, liabilities, income and expenses of a subsidiary acquired or disposed of during the year are included in the consolidated financial statements from the date the Group gains control until the date the Group ceases to control the subsidiary. Profit or loss and each component of other comprehensive income (OCI) are attributed to the equity holders of the parent of the Group and to the non-controlling interests, even if this results in the non-controlling interests having a deficit balance. When necessary, adjustments are made to the financial statements of subsidiaries to bring their accounting policies into line with the Group’s accounting policies. All intra-group assets and liabilities, equity, income, expenses and cash flows relating to transactions between members of the Group are eliminated in full on consolidation.
A change in the ownership interest of a subsidiary, without a loss of control, is accounted for as an equity transaction. If the Group loses control over a subsidiary, it derecognises the related assets (including goodwill), liabilities, non-controlling interest and other components of equity while any resultant gain or loss is recognised in profit or loss. Any investment retained is recognised at fair value.
(e) Segment Reporting
An operating segment is a component of an entity that engages in business activities from which it may earn revenues and incur expenses (including revenues and expenses relating to transactions with other components of the same entity), whose operating results are regularly reviewed by the entity’s chief operating decision makers to make decisions about resources to be allocated to the segments and assess their performance and for which discrete financial information is available. This includes start-up operations which are yet to earn revenues.
Operating segments have been identified based on the information presented to the chief operating decision makers, being the executive management team.
Information about other business activities are combined and disclosed in a separate category called “other”.
(f) Foreign Currency Translation
i. Functional and presentation currency
Items included in the financial statements of each Group company are measured using the currency of the primary economic environment in which the entity operates (“the functional currency”). The consolidated financial statements are presented in Australian dollars, which is the parent’s functional and presentation currency. For each entity, the Group determines the functional currency and items included in the financial statements of each entity are measured using that functional currency.
For
per
sona
l use
onl
y

A D V E R I T A S L I M I T E D N O T E S T O T H E C O N S O L I D A T E D F I N A N C I A L S T A T E M E N T S
F O R T H E Y E A R E N D E D 3 0 J U N E 2 0 2 0
38
2. SUMMARY OF SIGNIFICANT ACCOUNTING POLICIES (continued)
(f) Foreign Currency Translation (continued)
ii. Transactions and balances
Foreign currency transactions are translated into the functional currency using the exchange rates at the dates of the transaction. Foreign exchange gains and losses resulting from the settlement of such transactions and from the translation of monetary assets and liabilities denominated in foreign currencies at year end exchange rates are recognised in profit or loss.
iii. Group companies
On consolidation, the assets and liabilities of foreign operations are translated into Australian dollars at the rate of exchange prevailing at the reporting date and their statements of profit or loss are translated at exchange rates prevailing at the dates of the transactions. The exchange differences arising on translation for consolidation purposes are recognised in other comprehensive income. On disposal of a foreign operation, the component of other comprehensive income relating to that particular foreign operation is recognised in profit or loss. Any goodwill arising on the acquisition of a foreign operation and any fair value adjustments to the carrying amounts of assets and liabilities arising on the acquisition are treated as assets and liabilities of the foreign operation and translated at the spot rate of exchange at the reporting date.
(g) Plant and Equipment
All plant and equipment is stated at historical cost less depreciation. Historical cost includes expenditure that is directly attributable to the acquisition of the items.
Subsequent costs are included in the asset’s carrying amount or recognised as a separate asset, as appropriate, only when it is probable that future economic benefits associated with the item will flow to the Group and the cost of the item can be measured reliably. The carrying amount of any component accounted for as a separate asset is derecognised when replaced. All other repairs and maintenance are charged to the profit or loss during the reporting period in which they are incurred.
Depreciation is calculated over the estimated useful life of the asset as follows:
Method Useful Lives Plant and equipment Straight Line 1.5 – 2.5 years Leasehold improvements Straight Line the term of the lease Office equipment Straight Line 2 – 10 years Computer software and hardware Straight Line 1.5 – 4 years
The assets’ residual values and useful lives are reviewed, and adjusted if appropriate, at the end of each reporting period. An asset’s carrying amount is written down immediately to its recoverable amount if the asset’s carrying amount is greater than its estimated recoverable amount.
Gains and losses on disposals are determined by comparing proceeds with carrying amount. These are included in profit or loss.
(h) Impairment of non-financial assets
Non-financial assets comprise of plant and equipment and goodwill. Non-financial assets other than goodwill are tested for impairment whenever events or changes in circumstances indicate that their carrying amount may not be recoverable. Goodwill is tested for impairment annually. An impairment loss is recognised for the amount by which the asset’s carrying amount exceeds its recoverable amount. The recoverable amount is the higher of an asset’s fair value (less costs of disposal) and value in use. For the purposes of assessing impairment, assets are grouped together at the lowest levels for which there are separately identifiable cash inflows which are largely independent of the cash inflows from other assets or groups of assets (cash-generating units). Impairment losses relating to goodwill cannot be reversed in future periods.
For
per
sona
l use
onl
y

A D V E R I T A S L I M I T E D N O T E S T O T H E C O N S O L I D A T E D F I N A N C I A L S T A T E M E N T S
F O R T H E Y E A R E N D E D 3 0 J U N E 2 0 2 0
39
2. SUMMARY OF SIGNIFICANT ACCOUNTING POLICIES (continued)
(i) Cash and Cash Equivalents
Cash and short-term deposits in the Consolidated Statement of Financial Position comprise cash at banks and on hand and short-term deposits with a maturity of three months or less. For the purpose of the Consolidated Statement of Cash Flows, cash and cash equivalents consist of cash and short-term deposits as defined above, net of outstanding bank overdrafts.
(j) Provisions
Provisions are recognised when the Group has a present obligation (legal or constructive) as a result of a past event, it is probable that an outflow of resources embodying economic benefits will be required to settle the obligation and a reliable estimate can be made of the amount of the obligation. Where the Group expects some or all of a provision to be reimbursed, the reimbursement is recognised as a separate asset but only when the reimbursement is virtually certain. The expense relating to any provision is presented in the consolidated statement of profit and loss and other comprehensive income net of any reimbursement. If the effect of the time value of money is material, provisions are determined by discounting the expected future cash flows at a pre-tax rate that reflects current market assessments of the time value of money and, where appropriate, the risks specific to the liability. Where discounting is used, the increase in the provision due to the passage of time is recognised as a finance cost.
(k) Revenue from contracts with customers
The Group has been in the business of providing its fraud mitigation software as a service to its customers. Revenue from contracts with customers is recognised over time as the service is delivered to the customer, at an amount that reflects the consideration to which the Group is entitled under the terms of the contract for that service. The Group has concluded that it is the principal in its revenue arrangements because it controls the service before delivering it to the customer.
The Group’s performance obligation is the delivery of its software as a service to the customer over the period of time that was agreed upon with the customer. The customer is required to pay the consideration agreed upon in the service contract. The normal credit term is 30 to 60 days upon delivery of the service.
Contracts with customers may include a variable consideration in addition to the fixed monthly fee. The variable consideration comprises a fee for each block of transactions that exceeds the transaction allowance included in the fixed monthly fee. The variable consideration is recognised at the point in time when it can be reliably estimated and the constraint applied. Taxes collected from customers and remitted to government authorities are excluded from revenue. Contract balances Contract assets A contract asset is the right to consideration in exchange for services transferred to the customer. If the Group performs by transferring services to a customer before the customer pays consideration or before payment is due, a contract asset is recognised for the earned consideration that is conditional.
Trade receivables A receivable represents the Group’s right to an amount of consideration that is unconditional (i.e. only the passage of time is required before payment of the consideration is due). Refer further to the accounting policy on financial assets (Note 2(t)) for details on initial recognition, subsequent measurement and impairment. Contract liabilities A contract liability is the obligation to transfer services to a customer for which the Group has received consideration (or an amount of consideration is due) from the customer. If a customer pays consideration before the Group transfers goods or services to the customer, a contract liability is recognised when the payment is made or the payment is due (whichever is earlier). Contract liabilities are recognised as revenue when the Group performs under the contract.
For
per
sona
l use
onl
y

A D V E R I T A S L I M I T E D N O T E S T O T H E C O N S O L I D A T E D F I N A N C I A L S T A T E M E N T S
F O R T H E Y E A R E N D E D 3 0 J U N E 2 0 2 0
40
2. SUMMARY OF SIGNIFICANT ACCOUNTING POLICIES (continued)
(k) Revenue from contracts with customers (continued) Cost to obtain a contract
The Group pays sales commission to its employees for pre-determined milestones in relation to sales of is software services. The Group has elected to apply the optional practical expedient for costs to obtain a contract which allows the Group to immediately expense sales commissions because the amortisation period of the asset that the Group otherwise would have used is one year or less.
(l) Government grants
Government grants are recognised as other income where there is reasonable assurance that the grant will be received and all attached conditions will be complied with.
(m) Intangible assets Intangible assets acquired separately are measured on initial recognition at cost. The cost of intangible assets acquired in a business combination is their fair value at the date of acquisition. Following initial recognition, intangible assets are carried at cost less any accumulated amortisation and accumulated impairment losses. Internally generated intangibles are not capitalised and the related expenditure is reflected in profit or loss in the period in which the expenditure is incurred. The useful lives of intangible assets are assessed as either finite or indefinite. Intangible assets with finite lives are amortised over the useful economic life and assessed for impairment whenever there is an indication that the intangible asset may be impaired. Intangible assets with indefinite useful lives are not amortised, but are tested for impairment annually, either individually or at the cash-generating unit level. The assessment of indefinite life is reviewed annually to determine whether the indefinite life continues to be supportable. If not, the change in useful life from indefinite to finite is made on a prospective basis.
(n) Non-current assets held for sale and discontinued operations
The Group classifies non-current assets and disposal groups as held for sale if their carrying amounts will be recovered principally through a sale transaction rather than through continuing use. Non-current assets and disposal groups classified as held for sale are measured at the lower of their carrying amount and fair value less costs to sell. Costs to sell are the incremental costs directly attributable to the disposal of an asset (disposal group), excluding finance costs and income tax expense. The criteria for held for sale classification is regarded as met only when the sale is highly probable and the asset or disposal group is available for immediate sale in its present condition. Actions required to complete the sale should indicate that it is unlikely that significant changes to the sale will be made or that the decision to sell will be withdrawn. Management must be committed to the plan to sell the asset and the sale expected to be completed within one year from the date of the classification. Property, plant and equipment and intangible assets are not depreciated or amortised once classified as held for sale. Assets and liabilities classified as held for sale are presented separately as current items in the consolidated statement of financial position.
A disposal group qualifies as discontinued operation if it is a component of an entity that either has been disposed of, or is classified as held for sale, and:
• represents a separate major line of business or geographical area of operations; and • is part of a single co-ordinated plan to dispose of a separate major line of business or
geographical area of operations; or • is a subsidiary acquired exclusively with a view to resale
Discontinued operations are excluded from the results of continuing operations and are presented as a single amount as profit or loss after tax from discontinued operations in the statement of profit or loss.
For
per
sona
l use
onl
y

A D V E R I T A S L I M I T E D N O T E S T O T H E C O N S O L I D A T E D F I N A N C I A L S T A T E M E N T S
F O R T H E Y E A R E N D E D 3 0 J U N E 2 0 2 0
41
2. SUMMARY OF SIGNIFICANT ACCOUNTING POLICIES (continued) (p) Employee Benefits
Short-term obligations Liabilities for wages and salaries, including non-monetary benefits and annual leave expected to be settled wholly within 12 months after the end of the period in which the employees render the related service are recognised in respect of employees services up to the end of the reporting period and are measured at the amounts expected to be paid when the liabilities are settled.
Long service leave The liability for long service leave is recognised and measured as the present value of expected future payments to be made in respect of services provided by employees up to the reporting date. Consideration is given to expected future wage and salary levels, experience of employee departures and periods of service. Expected future payments are discounted using market yields at the reporting date on high quality corporate bonds with terms to maturity and currencies that match, as closely as possible, the estimated future cash outflows.
(q) Income Tax
Current Tax Current tax is calculated by reference to the amount of income taxes payable or recoverable in respect of the taxable profit or tax loss for the period. It is calculated using tax rates and tax laws that have been enacted or substantively enacted by reporting date. Current tax for current and prior periods is recognised as a liability (or asset) to the extent that it is unpaid (or refundable).
Deferred Tax Deferred tax is accounted for using the comprehensive balance sheet liability method in respect of temporary differences arising from differences between the carrying amount of assets and liabilities in the consolidated financial statements and the corresponding tax base of those items.
In principle, deferred tax liabilities are recognised for all taxable temporary differences. Deferred tax assets are recognised to the extent that it is probable that sufficient taxable amounts will be available against which deductible temporary differences or unused tax losses and tax offsets can be utilised. However, deferred tax assets and liabilities are not recognised if the temporary differences giving rise to them arise from the initial recognition of assets and liabilities (other than as a result of a business combination) which affects neither taxable income nor accounting profit. Furthermore, a deferred tax liability is not recognised in relation to taxable temporary differences arising from goodwill. Deferred tax liabilities are recognised for taxable temporary differences arising on investments in subsidiaries, branches, associates and joint ventures except where the Group is able to control the reversal of the temporary differences and it is probable that the temporary differences will not reverse in the foreseeable future. Deferred tax assets arising from deductible temporary differences associated with these investments and interests are only recognised to the extent that it is probable that there will be sufficient taxable profits against which to utilise the benefits of the temporary differences and they are expected to reverse in the foreseeable future.
Deferred tax assets and liabilities are measured at the tax rates that are expected to apply to the period(s) when the asset and liability giving rise to them are realised or settled, based on tax rates (and tax laws) that have been enacted or substantively enacted by reporting date. The measurement of deferred tax liabilities and assets reflects the tax consequences that would follow from the manner in which the Group expects, at the reporting date, to recover or settle the carrying amount of its assets and liabilities.
Deferred tax assets and liabilities are offset when they relate to income taxes levied by the same taxation authority and the Company / Group intends to settle its current tax assets and liabilities on a net basis. Current and deferred tax for the period Current and deferred tax is recognised as an expense or income in the consolidated statement of profit and loss and other comprehensive income except when it relates to items credited or debited directly to equity, in which case the current and deferred tax is also recognised directly in equity.
For
per
sona
l use
onl
y

A D V E R I T A S L I M I T E D N O T E S T O T H E C O N S O L I D A T E D F I N A N C I A L S T A T E M E N T S
F O R T H E Y E A R E N D E D 3 0 J U N E 2 0 2 0
42
2. SUMMARY OF SIGNIFICANT ACCOUNTING POLICIES (continued) (r) Contributed Equity
Ordinary shares are classified as equity. Incremental costs directly attributable to the issue of new shares or options are shown in equity as a deduction, net of tax, from the proceeds.
(s) Goods and Services Tax (GST)
Revenues, expenses and assets are recognised net of the amount of associated GST, unless the GST incurred is not recoverable from the taxation authority. In this case it is recognised as part of the cost of acquisition of the asset or as part of the expense.
Receivables and payables are stated inclusive of the amount of GST receivable or payable. The net amount of GST recoverable from, or payable to, the taxation authority is included with other receivables or payables in the consolidated statement of financial position.
Cash flows are presented on a gross basis. The GST components of cash flows arising from investing or financing activities which are recoverable from, or payable to the taxation authority, are presented as operating cash flows.
(t) Financial Instruments
A financial instrument is any contract that gives rise to a financial asset of one entity and a financial liability or equity instrument of another entity.
(u) Financial Assets
Initial recognition and measurement
Financial assets within the scope of AASB 9 are classified, at initial recognition, as subsequently measured at amortised cost, fair value through other comprehensive income (OCI), and fair value through profit or loss. The classification depends on the nature and purpose of the financial assets and is determined at the time of initial recognition.
The classification of financial assets that are debt instruments at initial recognition depends on the financial asset’s contractual cash flow characteristics and the Group’s business model for managing them. With the exception of trade receivables that do not contain a significant financing component or for which the Group has applied the practical expedient, the Group initially measures a financial asset at its fair value plus, in the case of a financial asset not at fair value through profit or loss, transaction costs. Trade receivables that do not contain a significant financing component or for which the Group has applied the practical expedient are measured at the transaction price determined under AABS 15. Refer to the accounting policy on revenue at Note 2(k).
In order for a financial asset to be classified and measured at amortised cost or fair value through OCI, it needs to give rise to cash flows that are ‘solely payments of principal and interest (SPPI)’ on the principal amount outstanding. This assessment is referred to as the SPPI test and is performed at an instrument level.
Financial assets at amortised cost This category is the most relevant category to the Group. The Group measures financial assets at amortised cost if both of the following conditions are met:
• The financial asset is held within a business model with the objective to hold financial assets in order to collect contractual cash flows; and
• The contractual terms of the financial asset give rise on specified dates to cash flows that are solely payments of principal and interest on the principal amount outstanding
Financial assets at amortised cost are subsequently measured using the effective interest (EIR) method and are subject to impairment. Gains and losses are recognised in profit or loss when the asset is derecognised, modified or impaired.
The Group’s financial assets at amortised cost include trade and other receivables.
For
per
sona
l use
onl
y

A D V E R I T A S L I M I T E D N O T E S T O T H E C O N S O L I D A T E D F I N A N C I A L S T A T E M E N T S
F O R T H E Y E A R E N D E D 3 0 J U N E 2 0 2 0
43
2. SUMMARY OF SIGNIFICANT ACCOUNTING POLICIES (continued) (u) Financial Assets (continued)
Financial assets designated at fair value through OCI (equity instruments) Upon initial recognition, the Group can elect to classify irrevocably its equity investments as equity instruments designated at fair value through OCI when they meet the definition of equity under AASB 132 Financial Instruments: Presentation and are not held for trading. The classification is determined on an instrument-by-instrument basis. Gains and losses on these financial assets are never recycled to profit or loss. Dividends are recognised as other income in the statement of profit or loss when the right of payment has been established, except when the Group benefits from such proceeds as a recovery of part of the cost of the financial asset, in which case, such gains are recorded in OCI. Listed equity instruments that are designated at fair value through OCI are not subject to impairment assessment.
Subsequent measurement
For purposes of subsequent measurement, financial assets are classified in four categories:
• Financial assets at amortised cost (debt instruments) • Financial assets at fair value through OCI with recycling of cumulative gains and losses (debt
instruments) • Financial assets designated at fair value through OCI with no recycling of cumulative gains and
losses upon derecognition (equity instruments) • Financial assets at fair value through profit or loss
Derecognition
A financial asset (or, where applicable, a part of a financial asset or part of a group of similar financial assets) is primarily derecognised (i.e. removed from the Group’s consolidated statement of financial position) when:
• The rights to receive cash flows from the asset have expired; or • The Group has transferred its rights to receive cash flows from the asset or has assumed an
obligation to pay the received cash flows in full without material delay to a third party under a ‘pass-through’ arrangement; and either (a) the Group has transferred substantially all the risks and rewards of the asset, or (b) the Group has neither transferred nor retained substantially all the risks and rewards of the asset, but has transferred control of the asset
When the Group has transferred its rights to receive cash flows from an asset or has entered into a pass-through arrangement, it evaluates if, and to what extent, it has retained the risks and rewards of ownership. When it has neither transferred nor retained substantially all of the risks and rewards of the asset, nor transferred control of the asset, the Group continues to recognise the transferred asset to the extent of its continuing involvement. In that case, the Group also recognises an associated liability. The transferred asset and the associated liability are measured on a basis that reflects the rights and obligations that the Group has retained.
Continuing involvement that takes the form of a guarantee over the transferred asset is measured at the lower of the original carrying amount of the asset and the maximum amount of consideration that the Group could be required to repay. Impairment of financial assets
The Group recognises an allowance for expected credit losses (ECLs) for all debt instruments not held at fair value through profit or loss. ECLs are based on the difference between the contractual cash flows due in accordance with the contract and all the cash flows that the Group expects to receive, discounted at an approximation of the original effective interest rate.
ECLs are recognised in two stages. For credit exposures for which there has not been a significant increase in credit risk since initial recognition, ECLs are provided for credit losses that result from default events that are possible within the next 12-months (a 12-month ECL). For those credit exposures for which there has been a significant increase in credit risk since initial recognition, a loss allowance is required for credit losses expected over the remaining life of the exposure, irrespective of the timing of the default (a lifetime ECL).
For
per
sona
l use
onl
y

A D V E R I T A S L I M I T E D N O T E S T O T H E C O N S O L I D A T E D F I N A N C I A L S T A T E M E N T S
F O R T H E Y E A R E N D E D 3 0 J U N E 2 0 2 0
44
2. SUMMARY OF SIGNIFICANT ACCOUNTING POLICIES (continued)
(u) Financial Assets (continued)
Financial assets at amortised cost For contract assets, trade and other receivables, the Group applies a simplified approach in calculating ECLs. Therefore, the Group does not track changes in credit risk, but instead recognises a loss allowance based on lifetime ECLs at each reporting date. The Group has established a provision matrix that is based on its historical credit loss experience, adjusted for forward-looking factors specific to the debtors and the economic environment.
The Group considers a financial asset in default when contractual payments are 90 days past due. However, in certain cases, the Group may also consider a financial asset to be in default when internal or external information indicates that the Group is unlikely to receive the outstanding contractual amounts in full before taking into account any credit enhancements held by the Group. A financial asset is written off when there is no reasonable expectation of recovering the contractual cash flows.
(v) Financial liabilities
Initial recognition and measurement
Financial liabilities are classified, at initial recognition, as financial liabilities at fair value through profit or loss, or as loans and borrowings, or as payables or as derivatives designated as hedging instruments in an effective hedge, as appropriate.
All financial liabilities are recognised initially at fair value and, in the case of loans and borrowings and payables, net of directly attributable transaction costs. Subsequent measurement
The measurement of financial liabilities depends on their classification. The Group’s only financial liabilities are trade and other payables. Trade and other payables represent liabilities for goods or services provided to the Group prior to the end of the financial year which are unpaid. The amounts are unsecured and are usually paid within 30 days of recognition. Trade and other payables are subsequently measured at amortised cost using the effective interest method and are presented as current liabilities unless payment is not due within 12 months after the reporting period.
Derecognition
A financial liability is derecognised when the obligation under the liability is discharged or cancelled or expires.
When an existing financial liability is replaced by another from the same lender on substantially different terms, or the terms of an existing liability are substantially modified, such an exchange or modification is treated as the derecognition of the original liability and the recognition of a new liability. The difference in the respective carrying amounts is recognised in the consolidated statement of profit and loss and other comprehensive income.
For
per
sona
l use
onl
y

A D V E R I T A S L I M I T E D N O T E S T O T H E C O N S O L I D A T E D F I N A N C I A L S T A T E M E N T S
F O R T H E Y E A R E N D E D 3 0 J U N E 2 0 2 0
45
2. SUMMARY OF SIGNIFICANT ACCOUNTING POLICIES (continued)
(w) Share-based payments
Consultants and employees (including senior executives) of the Group receive payment or remuneration in the form of share-based payments, whereby the consultants or the employees render services as consideration for equity instruments (equity-settled transactions). The cost of equity-settled transactions is determined by the fair value at the date when the grant is made using an appropriate valuation model, further details of which are given in Note 17. The cost of is recognised in the share based payments expense (Note 17), together with a corresponding increase in equity, over the period in which the performance and / or service conditions are fulfilled.
The cumulative expense recognised for equity-settled transactions at each reporting date until the vesting date reflects the extent to which the vesting period has expired and the Group’s best estimate of the number of equity instruments that will ultimately vest. The expense or credit in the statement of profit or loss for a period represents the movement in cumulative expense recognised as at the beginning and end of that period. Service and non-market performance conditions are not taken into account when determining the grant date fair value of awards, but the likelihood of the conditions being met is assessed as part of the Group’s best estimate of the number of equity instruments that will ultimately vest. Market performance conditions are reflected within the grant date fair value. Any other conditions attached to an award, but without an associated service requirement, are considered to be non-vesting conditions. Non-vesting conditions are reflected in the fair value of an award and lead to an immediate expensing of an award unless there are also service and/or performance conditions. No expense is recognised for awards that do not ultimately vest because non-market performance and/or service conditions have not been met. Where awards include a market or non-vesting condition, the transactions are treated as vested irrespective of whether the market or non-vesting condition is satisfied, provided that all other performance and/or service conditions are satisfied.
If the terms of an equity-settled award are modified, as a minimum, an expense is recognised as if the terms had not been modified. An additional expense is recognised for any modification that increases the total fair value of the share based arrangement, or is otherwise beneficial to the recipient, as measured at the date of modification.
If an equity-settled award is cancelled, it is treated as if it had vested on the date of cancellation, and any expense not yet recognised for the award is recognised immediately. However, if a new award is substituted for the cancelled award and designated as a replacement award on the date that it is granted, the cancelled and new award are treated as if they were a modification of the original award, as described in the previous paragraph.
The dilutive effect, if any, of outstanding options is reflected as additional share dilution in the computation of diluted loss per share (further details are given in Note 24).
(x) Earnings / loss per share
Basic earnings / loss per share is calculated as net profit or loss attributable to members of the Company, adjusted to exclude any costs of servicing equity (other than dividends), divided by the weighted average number of ordinary shares of the Company, adjusted for any bonus element.
Diluted loss per share is calculated as net profit or loss attributable to members of the Company, adjusted for:
• costs of servicing equity (other than dividends); • the after tax effect of dividends and interest associated with dilutive potential ordinary shares that
have been recognised as expenses; and • other non-discretionary changes in revenues or expenses during the period that would result from
the dilution of potential ordinary shares; divided by the weighted average number of ordinary shares and dilutive potential ordinary shares, adjusted for any bonus element.
For
per
sona
l use
onl
y

A D V E R I T A S L I M I T E D N O T E S T O T H E C O N S O L I D A T E D F I N A N C I A L S T A T E M E N T S
F O R T H E Y E A R E N D E D 3 0 J U N E 2 0 2 0
46
2. SUMMARY OF SIGNIFICANT ACCOUNTING POLICIES (continued)
(y) Significant accounting judgements, estimates and assumptions
The directors made estimates and judgements during the preparation of these consolidated financial statements regarding assumptions about current and future events affecting transactions and balances.
These estimates and judgements are based on the best information available at the time of preparing the consolidated financial statements, however as additional information is known then the actual results may differ from the estimates.
The significant estimates and assumptions made have been described below:
Revenue from contracts with customers The Group applied the following judgements that significantly affect the determination of the amount and timing of revenue from contracts with customers:
• The Group determined that revenue from its fraud mitigation software service is to be recognised over time because the customer simultaneously receives and consumes the benefits provided by the Group.
• The Group has determined that it is the principal in its agreements with its customers because it has control over the service before delivering it to the customer, it is primarily responsible for fulfilling the promise to deliver the service, and it is responsible for establishing the price for the service to be delivered.
• Certain contracts with customers contain a variable consideration in relation to each block of transactions that exceeds the transaction allowance included in the fixed monthly fee. The Group is required to use either the expected value method or the most likely amount method based on which method better predicts the amount of consideration to which it will be entitled. The Group has determined that the most likely amount method is appropriate.
Share-based payments The Group measures the cost of equity-settled transactions by reference to the fair value of the equity instruments at the date at which they are granted. Estimating fair value for share-based payment transactions requires determining the most appropriate valuation model, which is dependent on the terms and conditions of the grant. The estimate also requires making assumptions about the most appropriate inputs to the valuation model, including the expected life of the share option, volatility and dividend yield. The assumptions and models used for estimating fair value for share-based payment transactions are disclosed in Note 17.
Income Taxes Judgement is required in assessing whether deferred tax assets are recognised in the consolidated statement of financial position. Deferred tax assets are recognised only when it is considered more likely than not that they will be recovered, which is dependent on the generation of sufficient future taxable profits. Assumptions about the generation of future taxable profits depend on management’s estimates of future cash flows. Judgements are also required about the application of income tax legislation. The Group estimates that it has $22,105,103 (2019: 12,755,519) of tax losses carried forward. Although these losses do not expire, they may not be capable of being used to offset taxable income elsewhere in the Group. The Group has neither taxable temporary differences nor tax planning opportunities available that could partly support the recognition of these losses as deferred tax assets. On this basis, the Group has determined that it cannot recognise deferred tax assets in respect of the tax losses carried forward.
Further details on taxes are disclosed in Note 6.
For
per
sona
l use
onl
y

A D V E R I T A S L I M I T E D N O T E S T O T H E C O N S O L I D A T E D F I N A N C I A L S T A T E M E N T S
F O R T H E Y E A R E N D E D 3 0 J U N E 2 0 2 0
47
2. SUMMARY OF SIGNIFICANT ACCOUNTING POLICIES (continued)
(y) Significant accounting judgements, estimates and assumptions (continued) Impairment of non-financial assets The Group tests annually whether goodwill has suffered any impairment, in accordance with the accounting policy stated at Note 2(h). Impairment tests for other non-financial assets are performed only when impairment indicators have been identified. Impairment exists when the carrying value of an asset or cash-generating unit exceeds its recoverable amount, which is the higher of its fair value less costs to sell and its value in use. The fair value less costs to sell calculation is based on available data from binding sales transactions, conducted at arm’s length, for similar assets or observable market prices less incremental costs for disposing of the asset. The value in use calculation is based on a discounted cash flow model. The cash flows are derived from the budget for the next two years. The assumptions used in the budget, such as growth rates, and the discount rate used are subject to judgement and estimates. The Group has assessed the goodwill recognised in relation to its FY 2016 acquisition of its Croatian subsidiary, Appenture d..o.o, has concluded that this goodwill has not suffered any impairment. The Group has also assessed the right-of-use asset it recognised as a consequence of adopting AASB 16: Leases in the current year and has concluded that the right-of-use asset has not suffered any impairment. Consequently, no impairment losses have been recognised in the current year (2019: Nil).
Provision for expected credit losses of trade receivables and contract assets The Group uses a provision matrix to calculate ECLs for trade and other receivables and contract assets. The provision rates are based on days past due and adjusted for forward looking expectations.
(z) Going Concern
The consolidated financial statements have been prepared on a going concern basis which contemplates the continuity of normal business activities and the realisation of assets and the settlement of liabilities in the ordinary course of business.
During the year ended 30 June 2020, the Group incurred a net loss after tax of $9,487,359 and a net cash outflow from operating activities of $7,232,775. The cash and cash equivalents balance at 30 June 2020 was $8,351,840. The Group’s net current asset position at 30 June 2020 was $7,505,053.
The ability of the Group to pay its trade creditors, continue its planned activities and maintain its going concern status is dependent on the Group generating sufficient revenues and raising additional funds, as required. As at the date of this report, the directors are satisfied that there are reasonable grounds to believe that the Group will be able to operate as a going concern by raising further funds as required. In forming this view, the directors have considered the ability of the Company to raise funds by way of a capital raising.
There are inherent uncertainties associated with the successful completion of a capital raising. Should the directors not be able to manage these inherent uncertainties and successfully secure funding, there would be significant uncertainty as to whether the Group would be able to meet its debts as and when they fall due and therefore continue as a going concern.
These consolidated financial statements do not include any adjustments relating to the recoverability or classification of recorded asset amounts nor to the amounts or classifications of liabilities that might be necessary should the Group not be able to continue as a going concern.
(aa) Impact of COVID-19 pandemic In preparing the consolidated financial statements, the Group has considered the impact of COVID-19 pandemic. Amounts received from the Federal Government in the form of JobKeeper and Cash Flow Booster payments have been recognised as other income in the consolidated statement of profit and loss and other comprehensive income, and have been separately disclosed in Note 5(a) to the consolidated financial statements. The impact of COVID-19 was considered and assessed as not having a material impact in determining expected credit losses, provisions for employee entitlements and other provisions, including impairment assessments.
For
per
sona
l use
onl
y

A D V E R I T A S L I M I T E D N O T E S T O T H E C O N S O L I D A T E D F I N A N C I A L S T A T E M E N T S
F O R T H E Y E A R E N D E D 3 0 J U N E 2 0 2 0
48
3. SEGMENT INFORMATION The Group disposed of its performance marketing business on 31 July 2018. Consequently, the performance marketing operations were designated as a discontinued operation in the financial information reported for the prior period. The Group’s operating segments comprise:
• Technology: responsible for the development and maintenance of the Group’s proprietary software offerings. These activities are conducted primarily at the Group’s Australian head office and at its office in Croatia; and
• Sales and marketing: responsible for deploying the Group’s sales and marketing initiatives and for providing ongoing customer service. These activities are carried out by sales and marketing personnel and consultants located in Australia, Singapore, England, Latin America and the United States,
Costs allocated to the “other” segment include: • Occupancy costs and general office administration costs for the Perth head office; and • Employment costs relating to corporate and management team located in Perth.
In the prior year, the sales and marketing segment was not presented separately, it was included in the “other” segment. Due to the increase in the Group’s sales and marketing initiatives in the current year, the sales and marketing segment has been separately presented. In addition, the prior year segment results, assets and liabilities have been restated to present the sales and marketing segment separately from the “other” segment. The board of directors review internal management reports on a monthly basis that are consistent with the information provided in the Consolidated Statement of Profit and Loss and Other Comprehensive Income, Consolidated Statement of Financial Position and Consolidated Statement of Cash Flows. As a result, no reconciliation is required because, in aggregate, the information as presented is what is used by the board to make strategic decisions. No operating segments have been aggregated.
Segment results for the year ended 30 June 2020
Technology Sales and marketing Other Consolidated
$ $ $ $ Revenue - 1,227,213 - 1,227,213 Other income 1,287,433 - 312,187 1,599,620 Overheads (5,041,781) (2,603,690) (2,404,858) (10,050,329) Other expenses - - (2,075,561) (2,075,561) EBITDA (3,754,348) (1,376,477) (4,168,232) (9,299,057) Reconciliation of reportable segment loss
EBITDA (3,754,348) (1,376,477) (4,168,232) (9,299,057) Interest income - - 14,242 14,242 Interest expense (33,115) - (21,130) (54,245) Depreciation (92,502) (1,855) (41,985) (136,342) Income tax expense (11,957) - - (11,957) Loss after income tax (3,891,922) (1,378,332) (4,217,105) (9,487,359)
For
per
sona
l use
onl
y

A D V E R I T A S L I M I T E D N O T E S T O T H E C O N S O L I D A T E D F I N A N C I A L S T A T E M E N T S
F O R T H E Y E A R E N D E D 3 0 J U N E 2 0 2 0
49
3. SEGMENT INFORMATION (continued) Segment results for the year ended 30 June 2019
Technology Sales and marketing Other Consolidated
$ $ $ $ Revenue - 643,579 - 643,579 Other income 962,617 23,121 606,809 1,592,547 Foreign exchange gains - - 160,854 160,854 Overheads (4,164,105) (1,617,756) (2,723,860) (8,505,721) Other expenses - (503,233) (503,233) EBITDA (3,201,488) (951,056) (2,459,430) (6,611,974) Reconciliation of reportable segment loss EBITDA (3,201,488) (951,056) (2,459,430) (6,611,974) Interest income - - 24,336 24,336 Interest expense - - - - Depreciation (33,452) (3,085) (2,654) (39,191) Income tax expense (17,591) - - (17,591) Loss after income tax (3,252,531) (954,141) (2,437,748) (6,644,420)
Segment assets and liabilities at 30 June 2020
Technology Sales and marketing Other Consolidated
$ $ $ $ Assets 888,392 329,573 8,376,846 9,594,811 Liabilities 1,111,046 172,592 732,035 2,015,673
Segment assets and liabilities at 30 June 2019
Technology Sales and marketing Other Consolidated
$ $ $ $ Assets 508,774 203,667 2,489,050 3,201,491 Liabilities 701,334 81,835 273,836 1,057,005
Geographic information
Consolidated 2020 2019 $ $ Revenue from external customers by customer location:
Australia 2,193 - Foreign countries (refer to note 4.1.for further details) 1,225,020 643,579
Total 1,227,213 643,579 Included in revenue from foreign countries is revenue arising from sales shown in the sales and marketing segment from one customer which amounted to $408,613 (2019: $572,560).
Consolidated 2020 2019 $ $ Non-current operating assets by location
Australia 69,387 87,695 United States 1,417 1,969 Asia Pacific 10 2,506 Other 1,290 1,787
Total 72,104 93,957 Non-current assets for this purpose consist of property, plant and equipment and goodwill.
For
per
sona
l use
onl
y

A D V E R I T A S L I M I T E D N O T E S T O T H E C O N S O L I D A T E D F I N A N C I A L S T A T E M E N T S
F O R T H E Y E A R E N D E D 3 0 J U N E 2 0 2 0
50
4. REVENUE FROM CONTRACTS WITH CUSTOMERS
4.1 Disaggregated revenue information
Set out below is the disaggregation of the Group’s revenue from contracts with customers:
Consolidated 2020 2019 $ $ Revenue by type of goods or services
Revenue from the sale of software as a service 1,227,213 643,579
Total revenue from contracts with customers 1,227,213 643,579
Revenue by timing of revenue recognition Services transferred over time 1,227,213 643,579
Total revenue from contracts with customers 1,227,213 643,579 Revenue by geographical region North America 337,352 572,560 Latin America 542,033 53,633 Asia Pacific 344,679 9,214 Middle East 344 8,171 Other 2,805 - Total revenue from contracts with customers 1,227,213 643,579
5. OTHER INCOME, OVERHEADS AND OTHER EXPENSES
This note provides a breakdown of the significant items included in ‘other income’, ‘overheads’ and ‘other expenses’ shown in the Consolidated Statement of Profit and Loss and Other Comprehensive Income.
Consolidated 2020 2019 $ $ (a) Other income Research and development grant 1 1,287,433 955,868 Profit on disposal of controlled entity (refer to Note 14) - 594,698 Interest income 14,242 24,336 JobKeeper and Cash Flow Booster stimulus income 305,000 - Foreign exchange gains - 160,854 Miscellaneous income 7,187 41,981 1,613,862 1,777,737 (b) Administration costs IT costs 223,353 247,009 Office and general administration costs 151,533 148,761 Corporate travel 73,254 90,547 448,140 486,317 (c) Compliance costs Accounting fees 10,579 11,160 ASX compliance fees 183,652 137,992 Audit and tax compliance fees 121,989 116,737 Regulatory body fees 6,426 10,590 322,646 276,479
For
per
sona
l use
onl
y

A D V E R I T A S L I M I T E D N O T E S T O T H E C O N S O L I D A T E D F I N A N C I A L S T A T E M E N T S
F O R T H E Y E A R E N D E D 3 0 J U N E 2 0 2 0
51
5. OTHER INCOME, OVERHEADS AND OTHER EXPENSES (continued)
(d) Consultancy costs Legal 426,149 184,770 Investor relations 83,926 137,167 Other 50,633 109,395 560,708 431,332 (e) Employment costs Salaries and wages2 4,537,449 4,136,461 Ancillary employment costs 914,654 797,717 Other 53,979 301,110 5,506,082 5,235,288 (f) Marketing costs Advertising and marketing materials 236,393 184,976 Travel, entertainment, trade shows and events 254,209 108,011 Public relations 253,628 99,037 744,230 392,024 (g) Expected credit losses and bad debt expense Trade receivables written off as a bad debt 35,312 5,860 Trade receivables: expected credit loss allowance recognised 279,343 35,603 Trade receivables: expected credit loss allowance reversed (35,312) - 279,343 41,463 (h) Finance costs Interest expense on lease liabilities (refer to Note 10) 54,245 - 54,245 - (i) Depreciation Depreciation of property, plant and equipment 35,288 39,191 Depreciation of right-of-use asset 101,054 - 136,342 39,191
1. The research and development grant income has been received from the Australian government as the
Group has undertaken qualifying research and development activities within Australia. Grant income is recognised when the funds are received whilst research and development expenses are recognised when incurred. The grant income recognised in the current year relates to FY19 research and development activities and was received in January 2020.
2. Refer to Note 25 for further detail on director and executive remuneration.
6. INCOME TAX EXPENSE
Consolidated 2020 2019 $ $ Major components of income tax expense for the year are: Income statement Current income tax
Current income tax charge 11,957 6,138 Adjustments in respect of previous years: - Under provision for income tax in previous years - 11,453
Deferred income tax Deferred income tax charge relating to origination and reversal of temporary differences - -
Income tax expense reported in income statement 11,957 17,591
For
per
sona
l use
onl
y

A D V E R I T A S L I M I T E D N O T E S T O T H E C O N S O L I D A T E D F I N A N C I A L S T A T E M E N T S
F O R T H E Y E A R E N D E D 3 0 J U N E 2 0 2 0
52
6. INCOME TAX EXPENSE (continued)
Reconciliation
A reconciliation of income tax expense / (benefit) applicable to accounting loss before income tax at the statutory income tax rate to income tax expense at the Company’s effective income tax rate for the year is as follows:
Consolidated 2020 2019 $ $ Accounting loss before tax from continuing operations (9,475,402) (6,626,829) Accounting profit before tax from discontinued operations - 25,970 (9,475,402) (6,600,859) Income tax benefit at the statutory income tax rate of 27.5% (2019: 27.5%) (2,605,736) (1,815,236)
Adjusted for: Under / (over) provision for income tax in previous years - (54,802) Non-deductible share-based payment expenses 369,557 138,389 Non-deductible entertainment expenses 3,324 3,088 Non-deductible impairment loss 31,219 - Non-deductible expected credit loss (deferred consideration) 156,164 - Other non-deductible expenses 13,561 10,209 Profit on disposal of controlled entity - (163,542) Non-assessable grant income (354,044) (269,222) Other non-assessable amounts (83,875) - Difference between the Australian statutory income tax rate and the statutory income tax rate applicable to foreign operations (4,824) (2,483) Tax losses and temporary differences not recognised as a deferred tax asset (Australian tax: $2,242,875 (FY19: $1,930,464, Canadian tax: Nil (FY19: $19,653), Singapore tax: $33,974 (FY19: $130,998) USA tax: $209,763 (FY19: $23,821)) 2,486,611 2,104,936
11,957 (48,663) Income tax expense reported in income statement 11,957 17,591 Income tax benefit attributable to discontinued operation - (66,254) 11,957 (48,663)
Tax Consolidation
The Company and its 100% owned Australian incorporated subsidiaries formed a tax consolidated group with effect from 1 July 2015. Unrecognised deferred tax assets
Deferred tax assets have not been recognised in respect of the following items:
Consolidated 2020 2019 $ $ Revenue losses 17,378,719 11,993,184 Capital losses 339,111 762,336 Temporary differences 4,387,273 2,157,326 22,105,103 14,912,845 Unrecognised tax losses at 27.5% (2019: 27.5%) 6,078,903 3,507,768
Tax losses do not expire under current Australian legislation. Tax losses relating to foreign jurisdictions amount to $1,881,122 (2019: $1,019,717). Deferred tax assets have not been recognised in respect of tax losses or temporary differences because it is not certain that future taxable profit will be available in the near term against which the Group can utilise the benefits.
For
per
sona
l use
onl
y

A D V E R I T A S L I M I T E D N O T E S T O T H E C O N S O L I D A T E D F I N A N C I A L S T A T E M E N T S
F O R T H E Y E A R E N D E D 3 0 J U N E 2 0 2 0
53
6. INCOME TAX EXPENSE (continued) Availability of Tax Losses
The availability of the Group’s tax losses for future periods is uncertain and will be dependent on strict requirements being satisfied with respect to continuity of ownership and the same business test imposed by income tax legislation.
The recoupment of tax losses as at 30 June 2020 is contingent upon the following:
• entities in the Group deriving future assessable income of a nature and of an amount sufficient to enable the benefit from the losses to be realised;
• the conditions for deductibility imposed by income tax legislation continuing to be complied with; and • there being no changes in income tax legislation which would adversely affect the entities from
realising the benefit from the losses.
7. CASH AND CASH EQUIVALENTS
For the purpose of the Consolidated Statement of Financial Position and the Consolidated Statement of Cash Flows, cash and cash equivalents comprise the following at 30 June:
Consolidated
2020 2019
$ $ Cash at bank and on hand 8,351,840 2,046,991 The Group’s cash is mainly held with a banking institution in Australia with a AA credit rating. Cash at bank earns interest at floating rates based on daily at call bank deposit and savings rates. Reconciliation from the loss after tax to the net cash flows from operations
Consolidated 2020 2019 $ $ Net loss (9,487,359) (6,552,197) Adjustments for non-cash items: Depreciation 136,342 39,191 Profit on disposal of controlled entity - (594,697) Loss / (profit) on disposal of plant and equipment 1,572 (904) Share based payments 1,343,842 503,233 Unrealised foreign exchange differences 29,693 (154,711) Impairment loss 113,525 - Expected credit loss: trade receivables 244,030 35,603 Expected credit loss: deferred consideration 567,869 - Changes in assets and liabilities: Increase in trade receivables1 (314,478) (133,794) (Increase) / decrease in other receivables (127,450) 1,559 Increase in prepayments (17,239) (73,513) Increase / (decrease) in trade and other payables1 39,559 (21,564) Increase in provision for employee entitlements 237,319 96,971 Decrease in provision for income tax - (71,786) Net cash generated by operating activities (7,232,775) (6,926,609)
1. Movement is stated after adjusting for the effects of movements in foreign exchange rates from the
beginning of the financial year to the end of the financial year.
For
per
sona
l use
onl
y

A D V E R I T A S L I M I T E D N O T E S T O T H E C O N S O L I D A T E D F I N A N C I A L S T A T E M E N T S
F O R T H E Y E A R E N D E D 3 0 J U N E 2 0 2 0
54
8. TRADE AND OTHER RECEIVABLES
Consolidated 2020 2019
$ $ CURRENT Trade receivables (a) 465,934 151,457 Allowance for expected credit losses (b) (279,633) (35,603) Net trade receivables 186,301 115,854 Deferred consideration receivable 567,869 341,720 Allowance for expected credit losses (b) (567,869) - Net deferred consideration receivable (refer to Note 14) - 341,720 Income tax refund receivable 21,358 33,580 JobKeeper and Cash Flow Booster funding receivable 135,000 - Sundry receivables 2,013 2,802 Deposits 35,966 35,984 GST receivables 20,420 15,223 Other receivables 214,757 87,589 401,058 545,163 NON-CURRENT Deferred consideration receivable - 255,607 - 255,607
(a) Trade receivables
Trade receivables are amounts due from customers for the sale of the Group’s software as a service. Trade receivables are generally due for settlement within 30-60 days and are therefore classified as current assets. The Group’s accounting policies for trade receivables are outlined in Notes 2(k) and 2(u).
(b) Allowance for expected credit losses
The movement in the allowance for expected credit losses is set out below:
Consolidated 2020 2019 $ $ Allowance for expected credit losses: trade receivables Balance at 1 July 35,603 - Allowance for expected credit losses recognised 279,633 35,603 Trade receivables written off as bad debts (35,603) - Balance at 30 June 279,633 35,603 Allowance for expected credit losses: deferred consideration Balance at 1 July - - Allowance for expected credit losses recognised 567,869 - Balance at 30 June 567,869 -
The current year allowance for expected credit losses on trade receivables relates to amounts owing by Mpire Network Inc, and the current year allowance for expected credit losses on the deferred consideration receivable relates to amounts owing by ClearPier Inc.
For
per
sona
l use
onl
y

A D V E R I T A S L I M I T E D N O T E S T O T H E C O N S O L I D A T E D F I N A N C I A L S T A T E M E N T S
F O R T H E Y E A R E N D E D 3 0 J U N E 2 0 2 0
55
8. TRADE AND OTHER RECEIVABLES (continued)
(b) Allowance for expected credit losses (continued) As part of the process whereby the Group disposed of 90% of Mpire Network Inc to ClearPier Inc, the Group agreed to licence its nxus and TrafficGuard products to Mpire network Inc for a minimum term of 1 year, commencing on 1 August 2018. The initial term of the licencing agreements came to an end on 31 July 2019, and under the terms of the agreements, they automatically renewed for a further 12-months unless terminated 30 days before the end of the initial term. Mpire Network Inc did not provide a termination notice to the Group. However, after the second term commenced, Mpire Network Inc disputed the renewal mechanism and failed to pay a number of invoices relating to the second term of the licencing agreements. In addition, ClearPier Inc has defaulted on settling the deferred consideration in accordance with the Sale and Purchase Agreement. The Group instructed its legal counsel to take the required action prescribed by the underlying agreements to recover the amounts owing to the Group and it has conservatively recognised expected credit losses of 100% of the balances owing to it.
(c) Fair values of trade and other receivables
The fair value of trade and other receivables is assumed to approximate their carrying amounts due to their relatively short-term in nature.
(d) Impairment and risk exposure
Information about the impairment of trade and other receivables, their credit quality and the Group’s exposure to credit risk, foreign currency risk and interest rate risk can be found in Note 19.
9. PLANT AND EQUIPMENT
Consolidated: 2020
Leasehold improvements
Computer Equipment
Office Equipment Total
$ $ $ $ Cost 80,393 127,350 84,967 292,710 Accumulated depreciation (62,033) (111,696) (80,877) (254,606)
Carrying amount at 30 June 2020 18,360 15,654 4,090 38,104 Reconciliation Carrying amount at 1 July 2019 34,439 16,446 9,072 59,957 Additions - 13,395 2,804 16,199 Disposals - - (2,842) (2,842) Impact of foreign exchange - - 78 78 Depreciation (16,079) (14,187) (5,022) (35,288) Carrying amount at 30 June 2020 18,360 15,654 4,090 38,104
F
or p
erso
nal u
se o
nly

A D V E R I T A S L I M I T E D N O T E S T O T H E C O N S O L I D A T E D F I N A N C I A L S T A T E M E N T S
F O R T H E Y E A R E N D E D 3 0 J U N E 2 0 2 0
56
9. PLANT AND EQUIPMENT (continued)
Consolidated: 2019
Leasehold improvements
Computer Equipment
Office Equipment Total
$ $ $ $ Cost 80,393 113,954 85,409 279,756 Accumulated depreciation (45,954) (97,508) (76,337) (219,799)
Carrying amount at 30 June 2019 34,439 16,446 9,072 59,957 Reconciliation Carrying amount at 1 July 2018 50,517 12,350 7,837 70,704 Additions - 19,482 8,881 28,363 Impact of foreign exchange - - 81 81 Depreciation (16,078) (15,386) (7,727) (39,191) Carrying amount at 30 June 2019 34,439 16,446 9,072 59,957
Refer to Note 2(g) for further details on the Group’s accounting policies for plant and equipment.
10. RIGHT OF USE ASSETS
The Group is the lessee in lease contracts for office premises and various items of office equipment. Leases of office premises generally have lease terms of between 1 and 10 years, while office equipment generally has a lease term between 1 and 2 years. The Group’s obligations under its leases are secured by the lessor’s title to the leased assets. Generally, the Group is restricted from assigning and subleasing the leased assets. In the case of leases of office premises and low value office equipment with lease terms of 12 months or less, the Group has applied the ‘short-term lease’ and ‘lease of low-value assets’ recognition exemptions under AAS16 on leases. In the case of leases of office premises with lease terms over 12 months, the Group has recognised a right-of-use asset and an associated lease liability. Set out below are the carrying amounts of right-of-use assets recognised on adoption of AASB 16 on 1 July 2019, and the movements during the year:
Office Premises $ As at 1 July 2019 707,376 Depreciation expense (101,054) At 30 June 2020 606,322
Set out below are the carrying amounts of lease liabilities recognised on adoption of AASB 16 on 1 July 2019, and the movements during the year: $ As at 1 July 2019 707,376 Interest expense 54,245 Lease payments (113,346) At 30 June 2020 648,275 Current lease liabilities 90,597 Non-current lease liabilities 557,678 648,275
For
per
sona
l use
onl
y

A D V E R I T A S L I M I T E D N O T E S T O T H E C O N S O L I D A T E D F I N A N C I A L S T A T E M E N T S
F O R T H E Y E A R E N D E D 3 0 J U N E 2 0 2 0
57
10. RIGHT OF USE ASSETS (continued) The following are the amounts recognised in profit or loss in relation to leased assets: Consolidated 2020 2019 $ $ Right-of-use-assets Depreciation of right-of-use-assets 101,054 - Interest expense on lease liabilities associated with right-of-use-assets 54,245 Short term or low value asset leases Included in occupancy costs Rent expense - short-term lease 34,672 - Included in administration costs Rent expense - low-value assets 1,500 Total amount recognised in profit or loss 191,471 - The Group had total cash outflows for leases of $113,346 in the current year (2019: nil). The Group has a lease contract that includes extension and termination options. These options are negotiated by management to provide flexibility in managing the leased-asset portfolio and align with the Group’s business needs. Management exercises significant judgement in determining whether these extension and termination options are reasonably certain to be exercised (Note 2(c)(ii)(a).
11. INVESTMENTS
Consolidated 2020 2019 $ $ Unlisted equity investment - 113,525 - 113,525
Pursuant to the sale of its performance marketing business on 31 July 2018, the Group retains a 10% equity interest in Mpire Network Inc. During the current year, the Group considered a number of factors relating to its investment in Mpire Network Inc which resulted in the value of this investment being estimated to be nil.
12. TRADE AND OTHER PAYABLES
Consolidated 2020 2019 $ $ Trade payables 503,735 372,637 Statutory liabilities 119,693 165,689 Other payables 146,445 158,473 769,873 696,799
Trade and other payables are non-interest bearing and are unsecured. Balances are usually settled within 30 days of recognition.
The carrying amounts of trade and other payables are assumed to be the same as their fair values, due to their short-term nature.
For
per
sona
l use
onl
y

A D V E R I T A S L I M I T E D N O T E S T O T H E C O N S O L I D A T E D F I N A N C I A L S T A T E M E N T S
F O R T H E Y E A R E N D E D 3 0 J U N E 2 0 2 0
58
13. PROVISIONS
Consolidated 2020 2019 $ $ CURRENT Employee benefits 478,229 326,254 Other provisions 72,633 - 550,862 326,254 NON-CURRENT Employee benefits 46,664 33,952
The current provision for employee benefits relates to the Group’s liability for annual leave and long service leave. The non-current provision for employee benefits relates only to the Group’s liability for long service leave.
Movement in the provisions for employee benefits for continuing operations is as follows:
Consolidated
2020 2019
Annual leave
Long service
leave Annual
leave
Long service
leave $ $ $ $ Balance at 1 July 227,838 132,368 155,365 103,873 Amounts provided for during the year 294,658 48,041 313,010 28,495 Unused leave balances paid during the year (9,331) - (57,684) - Leave taken during the year (161,541) (7,140) (182,853) - Balance at 30 June 351,624 173,269 227,838 132,368
The balance is spilt as follows: Current potion 351,624 126,605 227,838 98,416 Non-current portion - 46,664 - 33,952
14. DISCONTINUED OPERATION
On 31 July 2018, the Group disposed of 90% of its equity interest in Mpire Network Inc, to ClearPier Inc for a cash consideration of US$666,817, of which U$370,454 was received upfront and US$296,363 was deferred. The purchase consideration also included a maximum of US$4,445,442) under a 3 year profit share agreement. In addition, under the terms of the Sale and Purchase Agreement, the Group is due to receive a working capital adjustment amount of US$163,158.
A pre-tax profit of $594,698 was recognised in the FY19 consolidated statement of profit or loss and other comprehensive income.
The deferred consideration and working capital adjustment amounts owing have been classified as follows:
Consolidated 2020 2019 $ $ Current trade and other receivables (net of expected credit losses) - 341,719 Non-current trade and other receivables - 255,607 - 597,326
For
per
sona
l use
onl
y
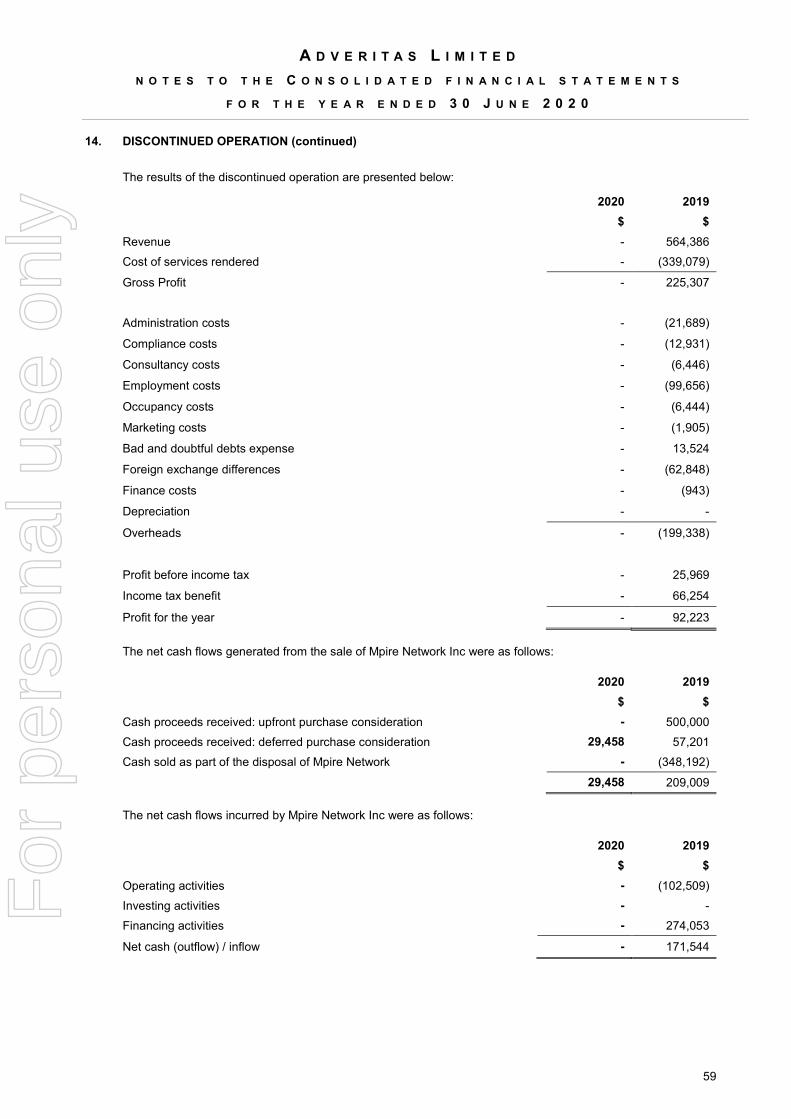
A D V E R I T A S L I M I T E D N O T E S T O T H E C O N S O L I D A T E D F I N A N C I A L S T A T E M E N T S
F O R T H E Y E A R E N D E D 3 0 J U N E 2 0 2 0
59
14. DISCONTINUED OPERATION (continued)
The results of the discontinued operation are presented below:
2020 2019
$ $ Revenue - 564,386 Cost of services rendered - (339,079)
Gross Profit - 225,307
Administration costs - (21,689)
Compliance costs - (12,931)
Consultancy costs - (6,446)
Employment costs - (99,656)
Occupancy costs - (6,444)
Marketing costs - (1,905)
Bad and doubtful debts expense - 13,524
Foreign exchange differences - (62,848)
Finance costs - (943)
Depreciation - -
Overheads - (199,338)
Profit before income tax - 25,969
Income tax benefit - 66,254
Profit for the year - 92,223
The net cash flows generated from the sale of Mpire Network Inc were as follows:
2020 2019
$ $ Cash proceeds received: upfront purchase consideration - 500,000 Cash proceeds received: deferred purchase consideration 29,458 57,201 Cash sold as part of the disposal of Mpire Network - (348,192)
29,458 209,009
The net cash flows incurred by Mpire Network Inc were as follows:
2020 2019 $ $ Operating activities - (102,509) Investing activities - - Financing activities - 274,053
Net cash (outflow) / inflow - 171,544
For
per
sona
l use
onl
y

A D V E R I T A S L I M I T E D N O T E S T O T H E C O N S O L I D A T E D F I N A N C I A L S T A T E M E N T S
F O R T H E Y E A R E N D E D 3 0 J U N E 2 0 2 0
60
15. CONTRIBUTED EQUITY
(a) Issued capital
Consolidated 2020 2019 $ $ Ordinary shares, fully paid 39,941,684 26,305,580
Ordinary shares participate in dividends and the proceeds on winding up of the Company in proportion to the number of shares held and in proportion to the amount paid up on the shares held. At shareholder meetings, each ordinary share is entitled to one vote in proportion to the paid-up amount of the share when a poll is called, otherwise each shareholder has one vote on a show of hands.
(b) Movements in share capital
2020 2019
Number $ Number $ Shares on issue at 1 July 158,898,924 26,305,580 88,797,667 22,586,507 Shares issued on conversion of Class D Performance Rights - - 33,332 13,330 Shares issued on exercise of options 1,300,225 145,023 4,500 450 Shares issued pursuant to an Entitlements Issue - - 53,278,600 2,397,537 Shares issued pursuant to a placement at $0.055 per share1 33,975,543 1,868,655 - - Shares issued pursuant to a placement at $0.075 per share1 33,333,333 2,500,000 3,333,334 250,000 Shares issued pursuant to a placement at $0.075 per share1 28,710,000 2,871,000 - - Shares issued pursuant to a placement at $0.165 per share1 - - 12,592,968 2,077,840 Shares issued pursuant to a placement at $0.17 per share1 20,706,759 3,520,149 - - Shares issued pursuant to a Share Purchase Plan 40,928,222 3,069,601 - - Shares issued as consideration for placement services 1,439,286 79,161 858,523 71,256 Shares issued as consideration for investor relations services 1,094,116 82,500 - - Share issue costs1 - (499,985) - (1,091,340) Shares on issue at 30 June 320,386,408 39,941,684 158,898,924 26,305,580
1. Placements were made to sophisticated and professional investors.
2. Share issue costs is made up as follows:
Consolidated 2020 2019 $ $ Share issue costs paid during the year (387,310) (263,247) Share issue costs included in trade and other payables at balance date (33,514) - Fair value of options issued as consideration for underwriting services - (756,837) Fair value of shares issued as consideration for placement services (79,161) (71,256) (499,985) (1,091,340)
For
per
sona
l use
onl
y
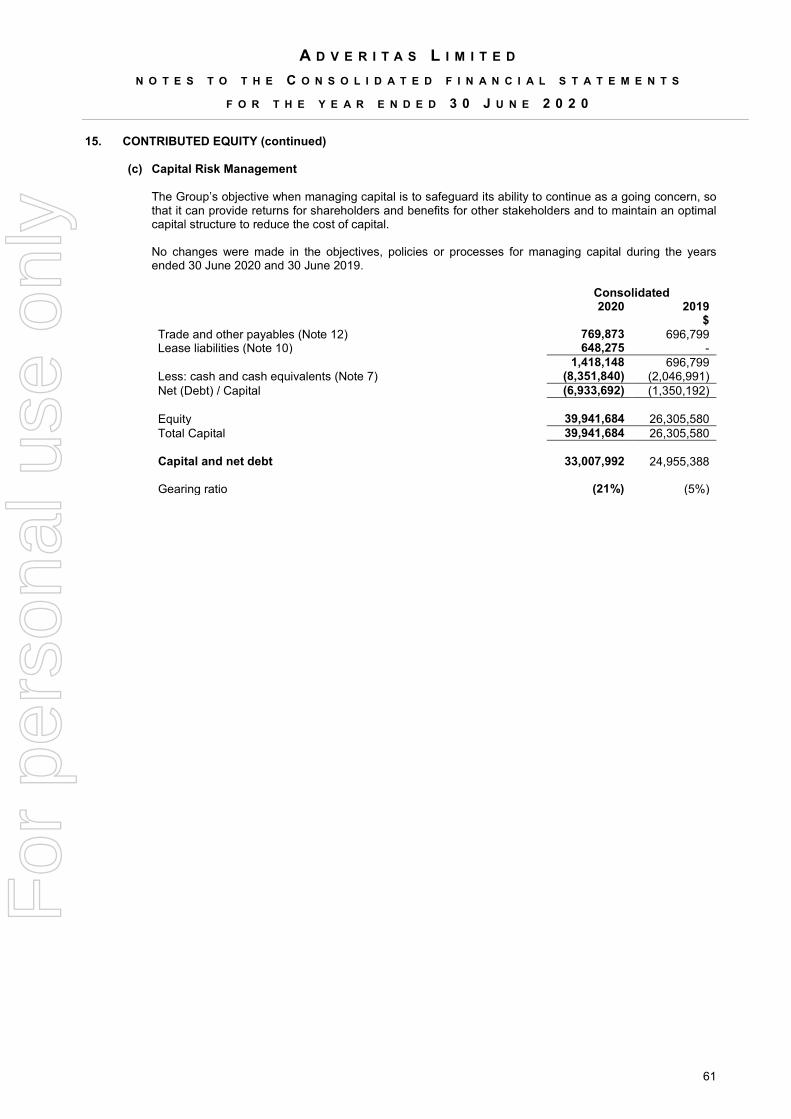
A D V E R I T A S L I M I T E D N O T E S T O T H E C O N S O L I D A T E D F I N A N C I A L S T A T E M E N T S
F O R T H E Y E A R E N D E D 3 0 J U N E 2 0 2 0
61
15. CONTRIBUTED EQUITY (continued)
(c) Capital Risk Management
The Group’s objective when managing capital is to safeguard its ability to continue as a going concern, so that it can provide returns for shareholders and benefits for other stakeholders and to maintain an optimal capital structure to reduce the cost of capital.
No changes were made in the objectives, policies or processes for managing capital during the years ended 30 June 2020 and 30 June 2019.
Consolidated 2020 2019 $ Trade and other payables (Note 12) 769,873 696,799 Lease liabilities (Note 10) 648,275 - 1,418,148 696,799 Less: cash and cash equivalents (Note 7) (8,351,840) (2,046,991) Net (Debt) / Capital (6,933,692) (1,350,192) Equity 39,941,684 26,305,580 Total Capital 39,941,684 26,305,580 Capital and net debt 33,007,992 24,955,388 Gearing ratio (21%) (5%)
For
per
sona
l use
onl
y

A D V E R I T A S L I M I T E D N O T E S T O T H E C O N S O L I D A T E D F I N A N C I A L S T A T E M E N T S
F O R T H E Y E A R E N D E D 3 0 J U N E 2 0 2 0
62
16. RESERVES
Consolidated 2020 2019 $ $ Foreign currency translation reserve 40,537 15,973 Share based payments reserve 5,166,535 3,905,193 Foreign currency translation reserve Balance at beginning of year 15,973 12,346 Foreign exchange differences arising on translation of foreign operations 24,564 3,627 Balance at end of year 40,537 15,973 Share based payments reserve Balance at beginning of year 3,905,193 2,658,453 Fair value of options issued to directors - 207,214 Fair value of options issued as consideration for underwriting services - 756,837 Fair value of options issued as consideration for investor relations services - 65,004 Fair value of options issued as consideration for consultancy services - 33,345 Fair value of options issued to staff 28,625 - Fair value of Class D Performance Rights converted into ordinary shares - (13,330) Fair value of Class H Performance Rights recognised 47,461 3,745 Fair value of Class I Performance Rights recognised 94,924 7,489 Fair value of Class J Performance Rights recognised 94,924 7,489 Fair value of Class K Performance Rights recognised 95,054 14,980 Fair value of Class L Performance Rights recognised 101,317 22,469 Fair value of Class M Performance Rights recognised 32,779 11,234 Fair value of Class N Performance Rights recognised 21,776 11,234 Fair value of Class O Performance Rights recognised 7,027 14,980 Fair value of Class P Performance Rights recognised 147,615 - Fair value of Class Q Performance Rights recognised 147,615 - Fair value of Class R Performance Rights recognised 147,615 - Fair value of Class S Performance Rights recognised 226,586 - Employee share scheme expense 7,554 18,996 Employee option scheme expense 60,470 85,054 Balance at end of year 5,166,535 3,905,193
Nature and purpose of reserves Foreign currency reserve The foreign currency translation reserve is used to recognise foreign currency exchange differences arising on translation of functional currency to presentation currency for foreign operations.
Share-based payments reserve The share-based payments reserve is used to recognise the fair value of equity-settled share-based payments provided to employees, consultants and other third parties.
For
per
sona
l use
onl
y

A D V E R I T A S L I M I T E D N O T E S T O T H E C O N S O L I D A T E D F I N A N C I A L S T A T E M E N T S
F O R T H E Y E A R E N D E D 3 0 J U N E 2 0 2 0
63
17. SHARE BASED PAYMENTS
The share-based payments expense recognised during the year is comprised as follows:
2020 2019
Number granted $
Number granted $
Options granted to non-executive directors - - 3,000,000 207,214 Options granted as consideration for investor relations services - - 1,000,000 65,004 Options granted as consideration for consultancy services - - 600,000 33,345 Options granted under employee option plan1 - 60,470 2,850,000 85,054 Options granted under employee option plan1 600,000 28,624 - - Shares issued as consideration for investor relations services 1,094,116 82,500 - - Performance rights granted (classes H – O)1 - 495,258 14,850,000 93,620 Performance rights granted (classes P - R)1 6,000,000 442,847 - - Performance rights granted (classes S)1 5,750,000 226,590 - - Shares issued under employee share plan1 - 7,553 - 18,996 1,343,842 503,233
Notes 1. There are vesting conditions attached to these securities. The fair value at grant date is recognised over
the vesting period.
(a) Options
The movement in options during the year is set out below: 2020 2019
Number
Fair value
per option
at grant date
(cents)
Number
Fair value
per option
at grant date
(cents) Opening balance 64,446,334 2,000,000
free attaching options granted with an entitlements issue1 - - 39,958,961 -
options granted via underwriting service agreement2 - - 15,541,873 4.87
options granted pursuant to investor relations agreement - - 1,000,000 6.50
options granted pursuant to consultancy agreement - - 600,000 5.56
options granted to non-executive directors - - 3,000,000 6.91
options granted under employee option plan - - 2,850,000 5.56
options granted under employee option plan 400,000 4.76 - -
options granted under employee option plan 200,000 7.78 - -
Exercised during the year (1,300,225) (4,500)
Lapsed during the year - (500,000)
Expired during the year (1,500,000) - -
Closing balance 62,246,109 64,446,334
Notes
1. These options have been allocated a nil fair value given they were free attaching options which were issued in conjunction with ordinary share as part of an entitlements issue.
2. The fair value of these options has been recognised as a share issue cost and allocated against contributed equity.
For
per
sona
l use
onl
y

A D V E R I T A S L I M I T E D N O T E S T O T H E C O N S O L I D A T E D F I N A N C I A L S T A T E M E N T S
F O R T H E Y E A R E N D E D 3 0 J U N E 2 0 2 0
64
17. SHARE BASED PAYMENTS (continued)
(a) Options (continued) The fair value of options granted during the year was $34,607 (2019: $1,220,791, excluding free attaching options). The options were valued at grant date using the Black-Scholes model and took into account the following assumptions:
Tranche 1 Tranche 2 Number granted 400,000 200,000 Exercise price $0.15 $0.20 Expiry date 19/08/2021 21/11/2021 Dividend yield 0.00% 0.00% Expected volatility 107.99% 101.02% Risk-free interest rate 0.87% 0.79%
The weighted average remaining contractual life for the share-based payment options outstanding as at 30 June 2020 was 1.23 years (30 June 2019: 2.24 years).
The exercise price for share based payment options outstanding as at the end of the period was a range of $0.10 to $0.45 (30 June 2019: $0.10 to $0.45).
Holders of options do not have any voting or dividend rights in relation to the options.
(b) Performance Rights
The following table illustrates the movement in performance rights during the year:
Opening balance at
1 July 2019
Granted during the
year
Converted into
ordinary shares
during the year
Lapsed during the
year
Closing balance at
30 June 2020
Number Number Number Number Number Class H 450,000 - - - 450,000 Class I 900,000 - - - 900,000 Class J 900,000 - - - 900,000 Class K 1,800,000 - - - 1,800,000 Class L 2,700,000 - - - 2,700,000 Class M 1,800,000 - - - 1,800,000 Class N 2,700,000 - - - 2,700,000 Class O 3,600,000 - - - 3,600,000 Class P - 2,000,000 - - 2,000,000 Class Q - 2,000,000 - - 2,000,000 Class R - 2,000,000 - - 2,000,000 Class S - 5,750,000 - - 5,750,000 14,850,000 11,750,000 - - 26,600,000
For
per
sona
l use
onl
y

A D V E R I T A S L I M I T E D N O T E S T O T H E C O N S O L I D A T E D F I N A N C I A L S T A T E M E N T S
F O R T H E Y E A R E N D E D 3 0 J U N E 2 0 2 0
65
17. SHARE BASED PAYMENTS (continued)
(b) Performance Rights (continued) The vesting conditions, performance milestones and expiry dates attached to the performance rights granted during the year are set out below:
Tranche Vesting Condition Expiry date
Class P
These performance rights vest on achievement of the first 3 Tier 1 clients in USA 30 June 2021
Class Q
These performance rights vest on achievement of the first 3 Tier 1 clients in Latin America 30 June 2021
Class R
These performance rights vest on achievement of the first 3 Tier 1 clients in APAC 30 June 2021
Class S
These performance rights vest provided the employee remains a full-time employee of the Group 2 years from date of issue 25 April 2022
Tier 1 client means any client which is considered an enterprise level client generating revenue of at least $5,000 per month over the course of a contract which has a minimum 12 month term. The fair value of performance rights granted during the year was $2,218,844 (2019: $1,280,158). The performance rights were valued at grant date using the Black-Scholes model and took into account the following assumptions:
Classes
P-R Classes
P-R Class S Cass S Cass S Cass S Cass S
Number granted 3,000,000 3,000,000 1,500,000 1,000,000 1,500,000 1,000,000 750,000
Exercise price
Nil Nil Nil Nil Nil Nil Nil
Expiry date
30/06/2021 30/06/2021 25/04/2022 25/04/2022 25/04/2022 25/04/2022 25/04/2022
Dividend yield
0.00% 0.00% 0.00% 0.00% 0.00% 0.00% 0.00%
Expected volatility
97.55% 96.24% 92.34% 92.18% 91.78% 91.26% 91.18%
Risk-free interest rate
0.75% 0.84% 0.88% 0.89% 0.80% 0.77% 0.74%
Holders of performance rights do not have any voting or dividend rights in relation to the performance rights.
(c) Employee Incentive Share Plan
Under the Employee Incentive Share Plan, eligible employees may be granted up to $1,000 of fully paid ordinary shares in the Company annually for no cash consideration. The number of shares issued to participants in the scheme is calculated at $1,000 divided by the weighted average closing price of the Company’s share price based on the closing ASX market prices over the five trading days before, but not including, the issue date, rounded down to the nearest whole number. There were no shares issued under the plan in the current year (2019: nil).
(d) Employee Incentive Option Plan
Under the Employee Incentive Option Plan, eligible employees may be granted options in the Company to recognise work undertaken by the employees and to incentivise them further. The exercise price of options issued under the plan is calculated so as to ensure that the options only have value if there is an increase in shareholder wealth over time. During the current year, 600,000 options were granted to employees under the plan (2019: 2,850,000).
For
per
sona
l use
onl
y
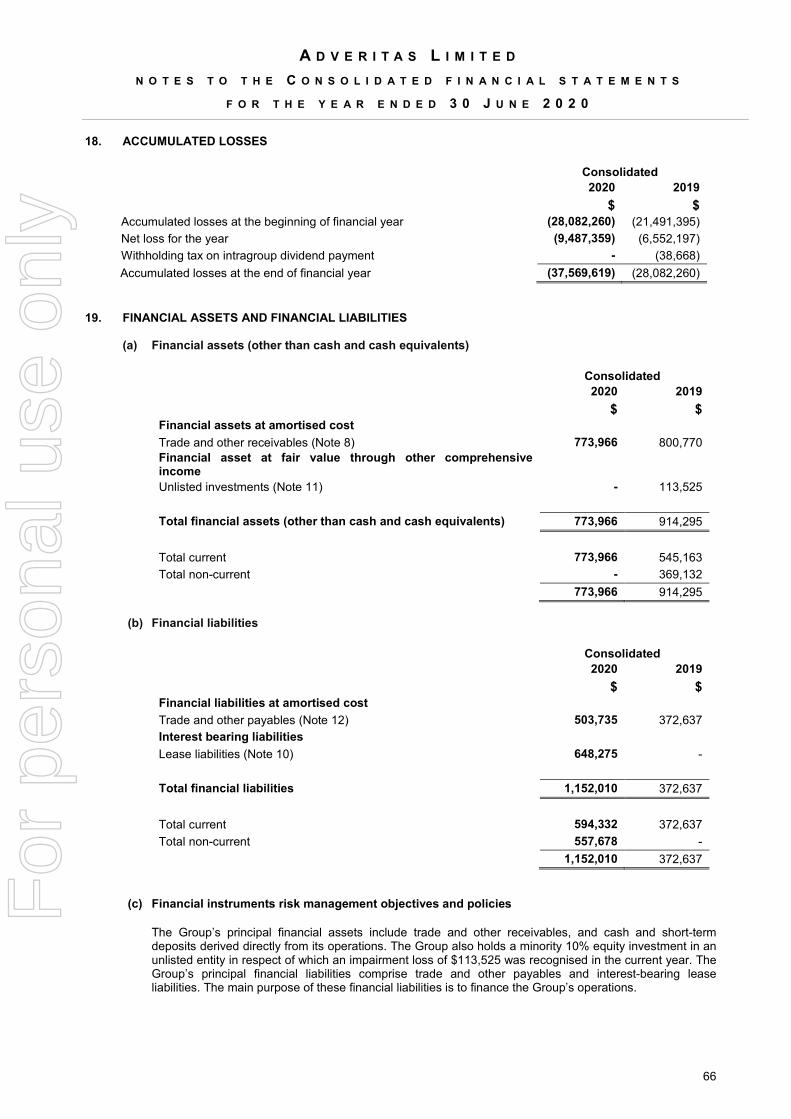
A D V E R I T A S L I M I T E D N O T E S T O T H E C O N S O L I D A T E D F I N A N C I A L S T A T E M E N T S
F O R T H E Y E A R E N D E D 3 0 J U N E 2 0 2 0
66
18. ACCUMULATED LOSSES
Consolidated 2020 2019 $ $ Accumulated losses at the beginning of financial year (28,082,260) (21,491,395) Net loss for the year (9,487,359) (6,552,197) Withholding tax on intragroup dividend payment - (38,668) Accumulated losses at the end of financial year (37,569,619) (28,082,260)
19. FINANCIAL ASSETS AND FINANCIAL LIABILITIES
(a) Financial assets (other than cash and cash equivalents)
Consolidated 2020 2019 $ $ Financial assets at amortised cost Trade and other receivables (Note 8) 773,966 800,770 Financial asset at fair value through other comprehensive income
Unlisted investments (Note 11) - 113,525 Total financial assets (other than cash and cash equivalents) 773,966 914,295 Total current 773,966 545,163 Total non-current - 369,132 773,966 914,295
(b) Financial liabilities
Consolidated 2020 2019 $ $ Financial liabilities at amortised cost Trade and other payables (Note 12) 503,735 372,637 Interest bearing liabilities Lease liabilities (Note 10) 648,275 - Total financial liabilities 1,152,010 372,637 Total current 594,332 372,637 Total non-current 557,678 - 1,152,010 372,637
(c) Financial instruments risk management objectives and policies
The Group’s principal financial assets include trade and other receivables, and cash and short-term deposits derived directly from its operations. The Group also holds a minority 10% equity investment in an unlisted entity in respect of which an impairment loss of $113,525 was recognised in the current year. The Group’s principal financial liabilities comprise trade and other payables and interest-bearing lease liabilities. The main purpose of these financial liabilities is to finance the Group’s operations.
For
per
sona
l use
onl
y

A D V E R I T A S L I M I T E D N O T E S T O T H E C O N S O L I D A T E D F I N A N C I A L S T A T E M E N T S
F O R T H E Y E A R E N D E D 3 0 J U N E 2 0 2 0
67
19. FINANCIAL ASSETS AND FINANCIAL LIABILITIES (continued)
(c) Financial instruments risk management objectives and policies (continued) The Group is exposed to market risk, credit risk and liquidity risk. The Group’s senior management oversees the management of these risks and are responsible for ensuring that financial risks are identified, measured and managed in accordance with the Group’s policies and risk objectives. The Board of Directors reviews and agrees policies for managing each of these risks, which are summarised below.
Market risk
Market risk is the risk that the fair value or future cash flows of a financial instrument will fluctuate because of changes in market prices. Market risk comprises three types of risk: interest rate risk, currency risk and other price risk, such as equity price risk. Financial instruments affected by market risk include trade and other receivables, unlisted equity investments, trade and other payables and interest-bearing lease liabilities. Interest rate risk Interest rate risk is the risk that the fair value or future cash flows of a financial instrument will fluctuate because of changes in market interest rates. The Group’s exposure to the risk of changes in market interest rates is negligible given that the terms of lease liability that has been recognised have been agreed upfront and are in place until 30 June 2021. Foreign currency risk Foreign currency risk is the risk that the fair value or future cash flows of a financial instrument will fluctuate because of changes in foreign exchange rates. The Group’s exposure to the risk of changes in foreign exchange rates relates primarily to the Group’s operating activities (when revenue or expense is denominated in a foreign currency) and the Group’s net investments in foreign subsidiaries. The only material financial instruments denominated in a foreign currency held by the Group are cash amounts denominated in United States Dollars (USD), certain trade and other receivables denominated in USD and certain trade payables denominated in USD.
A summary of the AUD equivalent of the Group’s USD denominated financial instruments at the reporting date is as follows:
The sensitivity analysis below relates to the foreign currency risk exposures in existence at the reporting date. The following table demonstrates the sensitivity to a reasonably possible change in AUD / USD exchange rates, with all other variables held constant.
Consolidated 2020 2019 $ $ Cash and cash equivalents 313,783 251,433 Trade and other receivables 184,279 713,181 Trade payables (356,200) (339,714) Net exposure 141,862 624,900
Effect on loss before
tax (Higher)/Lower
Effect on pre-tax equity
Higher/(Lower) 2020 2019 2020 2019 $ $ $ $ +11% 15,605 68,739 15,605 68,739 -11% (15,605) (68,739) (15,605) (68,739)
For
per
sona
l use
onl
y

A D V E R I T A S L I M I T E D N O T E S T O T H E C O N S O L I D A T E D F I N A N C I A L S T A T E M E N T S
F O R T H E Y E A R E N D E D 3 0 J U N E 2 0 2 0
68
19. FINANCIAL ASSETS AND LIABILITIES (continued) (c) Financial instruments risk management objectives and policies (continued)
Translation risk All USD denominated balance sheet accounts are converted to AUD at spot rate at year end. Group net assets are therefore sensitive to the exchange rate at year end. The following table demonstrates the sensitivity to a reasonably possible change in AUD / USD exchange rates, with all other variables held constant.
Effect on net group assets before Australian group tax
Effect on equity before Australian group tax
(Higher) / Lower Higher / (Lower)
2020 2019 2020 2019
$ $ $ $ +11% 833,705 235,893 833,705 235,893 -11% (833,705) (235,893) (833,705) (235,893)
Credit risk Credit risk is the risk that a counterparty will not meet its obligations under a financial instrument or customer contract, leading to a financial loss. The Group is exposed to credit risk from its operating activities (primarily in relation to trade and other receivables) and from its financing activities, including deposits with banks and financial institutions, foreign exchange transactions and other financial instruments.
i. Trade receivables and contract assets
Customer credit risk is managed by the Group’s established policy, procedures and control relating to customer credit risk management. Credit quality of the customer is assessed based on the customer’s financial position, past working experience with the customer (if any) and any other applicable factors. Individual credit limits are defined in accordance with this assessment. Outstanding customer receivables are regularly monitored and followed up accordingly. At 30 June 2020, the Group had 11 customers (2019: 6) of whom 3 owed more than $428,000 and accounted for 91% of all trade receivables outstanding.
An impairment analysis is performed at each reporting date using a provision matrix to measure expected credit losses. The provision rates are generally based on days past due after considering any other relevant forward-looking information. The maximum exposure to credit risk at the reporting date is the carrying value of each class of financial assets disclosed in Note 8. The Group does not hold collateral as security. The Group evaluates the concentration of risk with respect to trade receivables as low, as its customers are located in different jurisdictions and operate in largely independent markets. Set out below is the information about the credit risk exposure on the Group’s trade receivables using a provision matrix:
30 June 2020 Days past due
Total Current 30 days 30-60 days 61-90 days > 90 days $ $ $ $ $
Total gross carrying amount 465,934 184,122 - 2,179 - 279,633 Expected credit loss rate 0% 0% 0% 0% 100% Expected credit loss (279,633) - - - - (279,633) Net carrying amount 186,301 184,122 - 2,179 - -
For
per
sona
l use
onl
y
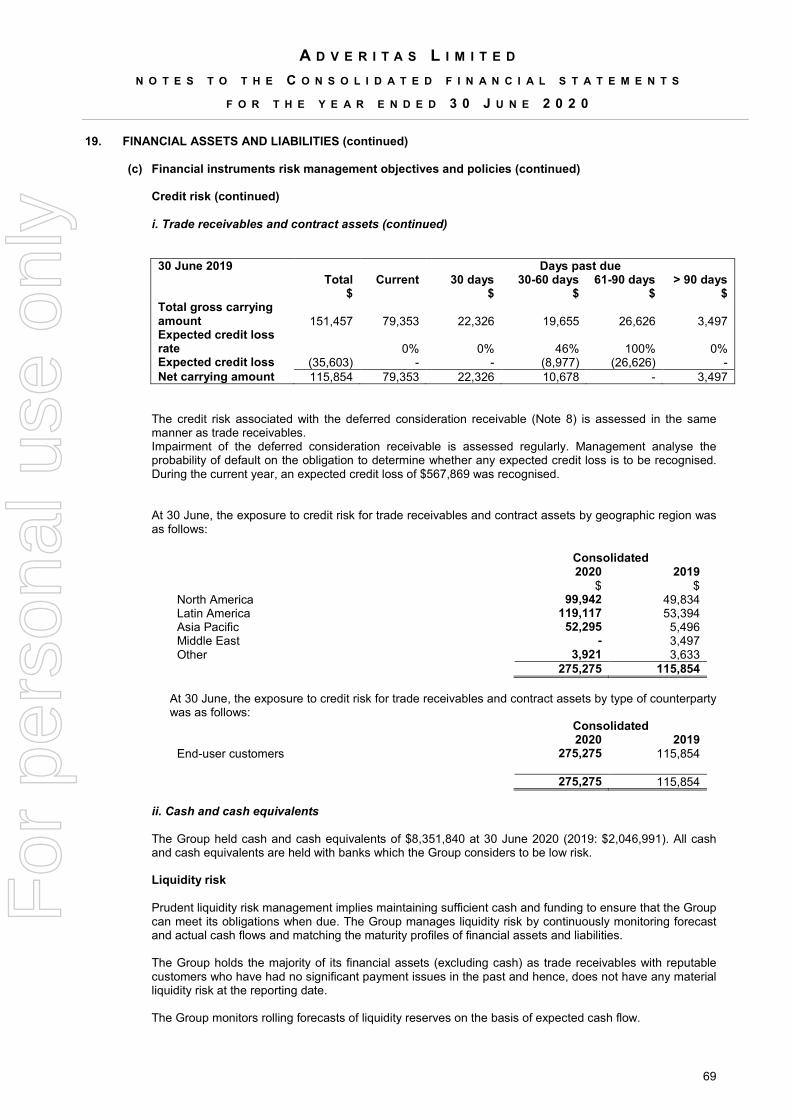
A D V E R I T A S L I M I T E D N O T E S T O T H E C O N S O L I D A T E D F I N A N C I A L S T A T E M E N T S
F O R T H E Y E A R E N D E D 3 0 J U N E 2 0 2 0
69
19. FINANCIAL ASSETS AND LIABILITIES (continued) (c) Financial instruments risk management objectives and policies (continued)
Credit risk (continued) i. Trade receivables and contract assets (continued)
30 June 2019 Days past due Total Current 30 days 30-60 days 61-90 days > 90 days $ $ $ $ $
Total gross carrying amount 151,457 79,353 22,326 19,655 26,626 3,497 Expected credit loss rate 0% 0% 46% 100% 0% Expected credit loss (35,603) - - (8,977) (26,626) - Net carrying amount 115,854 79,353 22,326 10,678 - 3,497
The credit risk associated with the deferred consideration receivable (Note 8) is assessed in the same manner as trade receivables. Impairment of the deferred consideration receivable is assessed regularly. Management analyse the probability of default on the obligation to determine whether any expected credit loss is to be recognised. During the current year, an expected credit loss of $567,869 was recognised. At 30 June, the exposure to credit risk for trade receivables and contract assets by geographic region was as follows:
Consolidated 2020 2019 $ $ North America 99,942 49,834 Latin America 119,117 53,394 Asia Pacific 52,295 5,496 Middle East - 3,497 Other 3,921 3,633 275,275 115,854
At 30 June, the exposure to credit risk for trade receivables and contract assets by type of counterparty was as follows:
Consolidated 2020 2019 End-user customers 275,275 115,854 275,275 115,854
ii. Cash and cash equivalents The Group held cash and cash equivalents of $8,351,840 at 30 June 2020 (2019: $2,046,991). All cash and cash equivalents are held with banks which the Group considers to be low risk. Liquidity risk Prudent liquidity risk management implies maintaining sufficient cash and funding to ensure that the Group can meet its obligations when due. The Group manages liquidity risk by continuously monitoring forecast and actual cash flows and matching the maturity profiles of financial assets and liabilities.
The Group holds the majority of its financial assets (excluding cash) as trade receivables with reputable customers who have had no significant payment issues in the past and hence, does not have any material liquidity risk at the reporting date.
The Group monitors rolling forecasts of liquidity reserves on the basis of expected cash flow.
For
per
sona
l use
onl
y

A D V E R I T A S L I M I T E D N O T E S T O T H E C O N S O L I D A T E D F I N A N C I A L S T A T E M E N T S
F O R T H E Y E A R E N D E D 3 0 J U N E 2 0 2 0
70
19. FINANCIAL ASSETS AND LIABILITIES (continued) (c) Financial instruments risk management objectives and policies (continued)
Liquidity (continued)
Exposure to liquidity risk
The following tables compare the carrying amounts at balance date to the remaining contractual liabilities at various maturities at balance date The contractual amounts are gross, undiscounted, include any contractual interest payments and exclude the impact of netting arrangements:
Contractual cash flows
30 June 2020 Carrying amount Total
12 months or less 1-2 years 2-5 years
5-10 years
$ $ $ $ $ $ Non-derivative financial liabilities Trade payables 503,735 503,735 503,735 - - - Lease liabilities 648,275 808,837 127,474 263,485 417,878 - 1,152,010 1,312,572 631,209 263,485 417,878 -
Contractual cash flows
30 June 2019 Carrying amount Total
12 months or less 1-2 years 2-5 years
5-10 years
$ $ $ $ $ $ Non-derivative financial liabilities Trade payables 372,637 372,637 372,637 - - - Lease liabilities - - - - - - 372,637 372,637 372,637 - - -
Fair values Fair values of financial assets and liabilities have been assessed as being equivalent to their carrying values. Fair value is the price that would be received to sell an asset or paid to transfer a liability in an orderly transaction between market participants at the measurement date. The carrying amount of financial assets and financial liabilities recorded in the financial statements approximate their fair values. The carrying amount of lease liabilities recorded in the financial statements approximate their fair values and are all classified as level 3 instruments per the below valuation methodology.
For financial instruments carried at fair value, the Group uses various methods in estimating fair value. The methods comprise:
• Level 1 – the fair value is calculated using quoted prices in an active market. • Level 2 – the fair value is estimated using inputs other than quoted prices included in the Level 1
that are observable for the asset or liability, either directly (as prices) or indirectly (derived from prices).
• Level 3 – the fair value is estimated using inputs for the asset or liability that are not based on observable market data.
For
per
sona
l use
onl
y

A D V E R I T A S L I M I T E D N O T E S T O T H E C O N S O L I D A T E D F I N A N C I A L S T A T E M E N T S
F O R T H E Y E A R E N D E D 3 0 J U N E 2 0 2 0
71
20. COMMITMENTS AND CONTINGENCIES
(a) Lease Commitments – Group as lessee
Future minimum rentals payable under non-cancellable operating leases are as follows:
Consolidated 2020 2019 $ $ Within one year 2,845 85,439 After one year but not more than five years - 315,871 More than five years - 153,416 2,845 554,726
(b) Property, Plant and Equipment Commitments
At balance date the Group had no contractual obligations to purchase plant and equipment (2019: nil). (c) Contingent Liabilities
At balance date the Group had no pending legal claims or other contingent liabilities (2019: nil).
21. GROUP STRUCTURE AND RELATED PARTY DISCLOSURES
a) Group structure The consolidated financial statements include the financial statements of Adveritas Limited (the parent entity) and the entities listed in the following table.
Country of incorporation % Equity interest 2020 2019 Livelynk Group Pty Ltd1 Australia 100 100 TrafficGuard Pty Ltd2 Australia 100 100 TrafficGuard APAC Pte Ltd2 Singapore 100 100 TrafficGuard US Inc2 United States 100 100 Mpire Network Inc.2 Canada 10 10 Appenture d.o.o2 Croatia 100 100
1 equity interest is held directly by Adveritas Limited. 2 equity interest is held directly by Livelynk Group Pty Ltd. b) Transactions with related parties During the current year, Adveritas Limited continued its consultancy agreement with 13811 Advisory Pte Ltd, a company of which Mr Stott is the CEO and founder. The consultancy services include the provision of promotion and marketing services. Under the agreement, Mr Stott was entitled to consultancy fees of SGD 3,000 per month for the period 1 Jul 2019 to 31 December 2019, and $5,000 per month for the period 1 January 2020 to 30 June 2020. At 30 June 2020, an amount of $5,000 was owing to 13811 Advisory Pte Ltd (2019: $6,807). c) Guarantees None of the entities within the Group are guarantors.
22. EVENTS AFTER BALANCE SHEET DATE
No event has arisen since 30 June 2020 that would be likely to materially affect the operations of the Group, or its state of affairs which has not otherwise been disclosed in this financial report.
For
per
sona
l use
onl
y

A D V E R I T A S L I M I T E D N O T E S T O T H E C O N S O L I D A T E D F I N A N C I A L S T A T E M E N T S
F O R T H E Y E A R E N D E D 3 0 J U N E 2 0 2 0
72
23. AUDITORS’ REMUNERATION
Remuneration of the Group’s auditor, Ernst and Young, was as follows:
Consolidated 2020 2019 $ $ Audit or review of the consolidated financial report 98,186 63,228 Tax compliance services provided 39,111 48,282 137,297 111,510
24. LOSS PER SHARE
Basic loss per share is calculated by dividing the loss for the year attributable to ordinary equity holders of the Company by the weighted average number of ordinary shares on issue during the year. Diluted loss per share is calculated by dividing the loss attributable to ordinary equity holders of the Company by the weighted average number of ordinary shares on issue during the year plus the weighted average number of ordinary shares that would be issued on conversion of all the dilutive potential ordinary shares into ordinary shares. The following table reflects the data used in the calculation of the basic and diluted loss per share:
2020 2019 Number Number Weighted average number of ordinary shares used in the calculation of basic loss per share 202,864,250 130,226,820
Weighted average number of ordinary shares used in the calculation of diluted loss per share 202,864,250 130,226,820 $ $ Profit / (loss) attributable to ordinary equity holders of Adveritas Limited Continuing operations (9,487,359) (6,644,420) Discontinued operations - 92,233 Loss attributable to ordinary equity holders of Adveritas Limited for basic and diluted loss (9,487,359) (6,552,197) Cents Cents Basic earnings loss per share (4.68) (5.03) Basic loss per share – continuing operations (4.68) (5.10) Basic earnings per share – discontinued operations - 0.07 Diluted loss per share (4.68) (5.03) Diluted loss per share – continuing operations (4.68) (5.10) Diluted earnings per share – discontinued operations - 0.07 Classification of securities as ordinary shares The Company has only one category of ordinary shares included in basic loss per share. Classification of securities as potential ordinary shares No securities have been classified as dilutive potential ordinary shares on issue in the current year because the options and performance rights on issue are considered anti-dilutive on the basis that their inclusion in the calculation would reduce the loss per share.
There have been no other transactions involving ordinary shares or potential ordinary shares between the reporting date and the date of authorisation of these consolidated financial statements.
For
per
sona
l use
onl
y

A D V E R I T A S L I M I T E D N O T E S T O T H E C O N S O L I D A T E D F I N A N C I A L S T A T E M E N T S
F O R T H E Y E A R E N D E D 3 0 J U N E 2 0 2 0
73
25. DIRECTORS AND EXECUTIVE DISCLOSURE
Compensation of Key Management Personnel
Consolidated 2020 2019 $ $ Short-term employee benefits 1,358,654 1,526,512 Post-employment benefits 81,666 78,833 Other long-term benefits 12,303 5,745 Share based payments 986,844 353,058 2,439,467 1,964,198
26. PARENT ENTITY INFORMATION
The following information relates to the legal parent entity of the Group, being Adveritas Limited. The information presented has been prepared using consistent accounting policies as presented in Note 2.
As at 30 June As at 30 June 2020 2019
$ $ Financial Position Assets Current assets 8,001,957 1,770,386 Non-current assets 2,538 10,212,756 Total assets 8,004,495 11,983,142 Liabilities Current liabilities 471,463 217,817 Non-current liabilities 5,874 56,374 Total liabilities 477,337 274,191 Net assets 7,527,158 11,708,951 Equity Contributed equity 36,709,582 23,073,478 Share based payment reserve 3,852,389 2,591,047 Accumulated losses (33,034,813) (13,955,574) Total equity 7,527,158 11,708,951 Financial Performance Loss for the year (19,079,239) (2,447,350) Other comprehensive income - - Total comprehensive loss (19,079,239) (2,447,350)
For
per
sona
l use
onl
y

A D V E R I T A S L I M I T E D D I R E C T O R S ’ D E C L A R A T I O N
74
In the directors’ opinion: (a) The consolidated financial statements and notes of Adveritas Limited set out on pages 27 to 73 are in accordance
with the Corporations Act 2001, including:
(i) complying with Accounting Standards, the Corporations Regulations 2001 and other mandatory professional reporting requirements, and
(ii) giving a true and fair view of the Group’s consolidated financial position as at 30 June 2020 and its performance for the financial year ended on that date, and
(b) Note 2(b) confirms that the consolidated financial statements also comply with the International Financial Reporting
Standards as issued by the International Accounting Standards Board.
(c) Subject to Note 2(z), there are reasonable grounds to believe that the Company will be able to pay its debts as and when they become due and payable.
This declaration has been made after receiving the declarations required to be made to the directors by the chief executive officer and chief financial officer in accordance with section 295A of the Corporations Act 2001 for the financial year ended 30 June 2020.
On behalf of the board
Stephen Belben Non-Executive Chairman Perth, Western Australia Dated this 28th day of August 2020
For
per
sona
l use
onl
y

A member firm of Ernst & Young Global Limited Liability limited by a scheme approved under Professional Standards Legislation
MC:TGF:ADVERITAS:008
Ernst & Young 11 Mounts Bay Road Perth WA 6000 Australia GPO Box M939 Perth WA 6843
Tel: +61 8 9429 2222 Fax: +61 8 9429 2436 ey.com/au
Independent auditor's report to the members of Adveritas Limited
Report on the audit of the financial report
Opinion
We have audited the financial report of Adveritas Limited (the Company) and its subsidiaries (collectively
the Group), which comprises the consolidated statement of financial position as at 30 June 2020, the
consolidated statement of profit and loss and other comprehensive income, consolidated statement of
changes in equity and consolidated statement of cash flows for the year then ended, notes to the financial
statements, including a summary of significant accounting policies, and the directors' declaration.
In our opinion, the accompanying financial report of the Group is in accordance with the Corporations Act
2001, including:
a. giving a true and fair view of the consolidated financial position of the Group as at 30 June 2020
and of its consolidated financial performance for the year ended on that date; and
b. complying with Australian Accounting Standards and the Corporations Regulations 2001.
Basis for opinion
We conducted our audit in accordance with Australian Auditing Standards. Our responsibilities under
those standards are further described in the Auditor’s Responsibilities for the Audit of the Financial
Report section of our report. We are independent of the Group in accordance with the auditor
independence requirements of the Corporations Act 2001 and the ethical requirements of the Accounting
Professional and Ethical Standards Board’s APES 110 Code of Ethics for Professional Accountants
(including Independence Standards) (the Code) that are relevant to our audit of the financial report in
Australia. We have also fulfilled our other ethical responsibilities in accordance with the Code.
We believe that the audit evidence we have obtained is sufficient and appropriate to provide a basis for
our opinion.
Material uncertainty related to going concern
We draw attention to Note 2(z) in the financial report, which describes the principal conditions that raise
doubt about the consolidated entity’s ability to continue as a going concern. These events or conditions
indicate that a material uncertainty exists that may cast significant doubt on the Group’s ability to
continue as a going concern. Our opinion is not modified in respect of this matter. For
per
sona
l use
onl
y

A member firm of Ernst & Young Global Limited Liability limited by a scheme approved under Professional Standards Legislation
Key audit matters
Key audit matters are those matters that, in our professional judgment, were of most significance in our
audit of the financial report of the current year. These matters were addressed in the context of our audit
of the financial report as a whole, and in forming our opinion thereon, but we do not provide a separate
opinion on these matters. In addition to the matter described in the Material Uncertainty Related to Going
Concern section, we have determined the matters described below to be the key audit matters to be
communicated in our report. For each matter below, our description of how our audit addressed the
matter is provided in that context.
We have fulfilled the responsibilities described in the Auditor’s Responsibilities for the Audit of the
Financial Report section of our report, including in relation to these matters. Accordingly, our audit
included the performance of procedures designed to respond to our assessment of the risks of material
misstatement of the financial report. The results of our audit procedures, including the procedures
performed to address the matters below, provide the basis for our audit opinion on the accompanying
financial report.
1. Share-based payment expense
Why significant How our audit addressed the key audit matter
As disclosed in Notes 16 and 17 to the financial report, the Group has awarded share-based payments to employees, directors and consultants during the year, contributing to a total share-based payment expense of $1,343,842.
Due to the complex and judgmental estimates such as volatility, used in determining the valuation of the share-based payments, we considered the Group’s calculation of the share-based payment expense to be a key audit matter.
As part of our audit procedures, we assessed the Group’s share based-payment expense calculations to determine whether the balances were calculated in accordance with Australian Accounting Standards.
We involved our valuation specialists to assess the Group’s calculation of the fair value of share-based payment issued during the year, including the key assumptions used.
We also assessed the adequacy of the presentation and disclosures in Notes 16 and 17 of the financial report.
For
per
sona
l use
onl
y

A member firm of Ernst & Young Global Limited Liability limited by a scheme approved under Professional Standards Legislation
2. Allowance for expected credit losses
Why significant How our audit addressed the key audit matter
As disclosed in Note 14 to the financial report, the
Group completed the sale of 90% of the shares in
Mpire Network Inc. (“MPN”) to ClearPier Inc.
(“CPI”) on 31 July 2018. As part of the disposal
process, the Group agreed to licence its nxus and
TrafficGuard products to MPN for a minimum term
of 1 year, commencing on 1 August 2018. The
contracts automatically renewed on 1 August
2019 in accordance with the terms of the
contract.
Subsequent to the commencement of the second
year of the contracts, MPN disputed the renewal
mechanism and has failed to pay a number of
invoices relating to the second year of the
contracts.
In addition, CPI has failed to pay the deferred
component of the purchase consideration for MPN
in accordance with the terms of the share sale
agreement.
As disclosed in note 8, the Group has recognised
an allowance for expected credit loss of $279,633
in respect of the trade receivable outstanding
from MPN at 30 June 2020, and an allowance for
expected credit loss of $567,869 in respect of the
deferred consideration receivable from CPI.
Due to the significant judgement required in determining the allowance for expected credit losses, we considered the allowance for expected credit loss to be a key audit matter.
As part of our audit procedures, we read the share sale agreement and the revenue agreements entered into by the Group.
We assessed whether the allowance for expected credit losses were calculated in accordance with the requirements of AASB 9 Financial Instruments.
We also assessed the adequacy of the disclosure in the financial report.
For
per
sona
l use
onl
y

A member firm of Ernst & Young Global Limited Liability limited by a scheme approved under Professional Standards Legislation
3. Revenue from contracts with customers
Why significant How our audit addressed the key audit matter
Revenue is a key metric by which the performance of the Group is assessed. Australian Accounting Standard AASB 15 Revenue from Contracts with Customers (“AASB 15”) applied to the Group for the first time from 1 July 2018.
The Group is in the business of providing its fraud mitigation software, namely TrafficGuard, as a service to its customers on monthly fee basis.
The Group’s disclosures relating to revenue recognition are included in the summary of accounting policies in Note 2(k) of the financial report.
This was considered a key audit matter given the significance of revenue to the financial report.
As part of our audit procedures, we selected a sample of revenue transactions and agreed the revenue recognised to signed agreements and cash receipts.
On a sample basis we assessed whether performance obligations were met where revenue was recognised with reference to the contract.
We assessed when those same performance obligations were met, to determine whether revenue was recognised in the correct period.
We also considered the adequacy of the associated disclosures set out in the financial report for compliance with AASB 15.
For
per
sona
l use
onl
y

A member firm of Ernst & Young Global Limited Liability limited by a scheme approved under Professional Standards Legislation
Information other than the financial report and auditor’s report thereon
The directors are responsible for the other information. The other information comprises the information
included in the Company’s 2020 Annual Report other than the financial report and our auditor’s report
thereon. We obtained the Directors’ Report that is to be included in the Annual Report, prior to the date
of this auditor’s report, and we expect to obtain the remaining sections of the Annual Report after the
date of this auditor’s report.
Our opinion on the financial report does not cover the other information and accordingly we do not
express any form of assurance conclusion thereon, with the exception of the Remuneration Report and
our related assurance opinion.
In connection with our audit of the financial report, our responsibility is to read the other information and,
in doing so, consider whether the other information is materially inconsistent with the financial report or
our knowledge obtained in the audit or otherwise appears to be materially misstated.
If, based on the work we have performed on the other information obtained prior to the date of this
auditor’s report, we conclude that there is a material misstatement of this other information, we are
required to report that fact. We have nothing to report in this regard.
Responsibilities of the directors for the financial report
The directors of the Company are responsible for the preparation of the financial report that gives a true
and fair view in accordance with Australian Accounting Standards and the Corporations Act 2001 and for
such internal control as the directors determine is necessary to enable the preparation of the financial
report that gives a true and fair view and is free from material misstatement, whether due to fraud or
error.
In preparing the financial report, the directors are responsible for assessing the Group’s ability to
continue as a going concern, disclosing, as applicable, matters relating to going concern and using the
going concern basis of accounting unless the directors either intend to liquidate the Group or to cease
operations, or have no realistic alternative but to do so.
Auditor's responsibilities for the audit of the financial report
Our objectives are to obtain reasonable assurance about whether the financial report as a whole is free
from material misstatement, whether due to fraud or error, and to issue an auditor’s report that includes
our opinion. Reasonable assurance is a high level of assurance, but is not a guarantee that an audit
conducted in accordance with the Australian Auditing Standards will always detect a material
misstatement when it exists. Misstatements can arise from fraud or error and are considered material if,
individually or in the aggregate, they could reasonably be expected to influence the economic decisions of
users taken on the basis of this financial report.
As part of an audit in accordance with the Australian Auditing Standards, we exercise professional
judgment and maintain professional scepticism throughout the audit. We also:
For
per
sona
l use
onl
y

A member firm of Ernst & Young Global Limited Liability limited by a scheme approved under Professional Standards Legislation
► Identify and assess the risks of material misstatement of the financial report, whether due to fraud
or error, design and perform audit procedures responsive to those risks, and obtain audit evidence
that is sufficient and appropriate to provide a basis for our opinion. The risk of not detecting a
material misstatement resulting from fraud is higher than for one resulting from error, as fraud
may involve collusion, forgery, intentional omissions, misrepresentations, or the override of
internal control.
► Obtain an understanding of internal control relevant to the audit in order to design audit
procedures that are appropriate in the circumstances, but not for the purpose of expressing an
opinion on the effectiveness of the Group’s internal control.
► Evaluate the appropriateness of accounting policies used and the reasonableness of accounting
estimates and related disclosures made by the directors.
► Conclude on the appropriateness of the directors’ use of the going concern basis of accounting and,
based on the audit evidence obtained, whether a material uncertainty exists related to events or
conditions that may cast significant doubt on the Group’s ability to continue as a going concern. If
we conclude that a material uncertainty exists, we are required to draw attention in our auditor’s
report to the related disclosures in the financial report or, if such disclosures are inadequate, to
modify our opinion. Our conclusions are based on the audit evidence obtained up to the date of our
auditor’s report. However, future events or conditions may cause the Group to cease to continue as
a going concern.
► Evaluate the overall presentation, structure and content of the financial report, including the
disclosures, and whether the financial report represents the underlying transactions and events in a
manner that achieves fair presentation.
We communicate with the directors regarding, among other matters, the planned scope and timing of the
audit and significant audit findings, including any significant deficiencies in internal control that we
identify during our audit.
We also provide the directors with a statement that we have complied with relevant ethical requirements
regarding independence, and to communicate with them all relationships and other matters that may
reasonably be thought to bear on our independence, and where applicable, actions taken to eliminate
threats or safeguards applied.
From the matters communicated to the directors, we determine those matters that were of most
significance in the audit of the financial report of the current year and are therefore the key audit
matters. We describe these matters in our auditor’s report unless law or regulation precludes public
disclosure about the matter or when, in extremely rare circumstances, we determine that a matter should
not be communicated in our report because the adverse consequences of doing so would reasonably be
expected to outweigh the public interest benefits of such communication.
For
per
sona
l use
onl
y

A member firm of Ernst & Young Global Limited Liability limited by a scheme approved under Professional Standards Legislation
Report on the audit of the remuneration report
Opinion on the remuneration report
We have audited the Remuneration Report included in pages 8 to 25 of the directors' report for the year ended 30 June 2020.
In our opinion, the Remuneration Report of Adveritas Limited for the year ended 30 June 2020, complies with section 300A of the Corporations Act 2001.
Responsibilities
The directors of the Company are responsible for the preparation and presentation of the Remuneration Report in accordance with section 300A of the Corporations Act 2001. Our responsibility is to express an opinion on the Remuneration Report, based on our audit conducted in accordance with Australian Auditing Standards.
Ernst & Young
Mark P Cunningham
Partner
Perth
28 August 2020
For
per
sona
l use
onl
y


![4679385 Blues [Mcconnell]](https://img.pdfslide.us/doc/110x75/577c7d2f1a28abe0549db5e8/4679385-blues-mcconnell.jpg)