Embed Size (px)
Citation preview

APPENDIX 4D (Rule 4.2A.3) EVOLUTION MINING LIMITED ACN 084 669 036
AND CONTROLLED ENTITIES HALF-YEAR FINANCIAL REPORT
For the half-year ended 31 December 2012
RESULTS FOR ANNOUNCEMENT TO THE MARKET KEY INFORMATION
31 December 2012
$’000 31 December 2011
$’000 Up/(down)
$’000 %
Movement
Revenues from ordinary activities 321,642 154,615 167,027 108%
Profit/(loss) from ordinary activities after tax attributable to members 40,687 (17,946) 58,633 327%
Net profit/(loss) attributable to members 40,687 (17,946) 58,633 327% EBITDA 135,468 54,066 81,402 151% DIVIDEND INFORMATION
Amount per share (cents)
Franked amount per
share (cents)
Tax rate for
franking
Interim dividend per share nil nil n/a NET TANGIBLE ASSETS
31 December 2012 ($)
31 December 2011 ($)
Net tangible assets per security 1.92 1.58
Additional Appendix 4D disclosure requirements can be found in the notes to this half-year financial report and in the Directors’ Report attached thereto. This report is based on the consolidated half-year financial report which has been subject to review by PricewaterhouseCoopers.

Evolution Mining Limited
ABN 74 084 669 036
Half-Year Financial Report
for the six months ended 31 December 2012
EVOLUTION MINING LIMITED HALF-YEAR FINANCIAL REPORT – 31 DECEMBER 2012
1
CORPORATE INFORMATION
ABN 74 084 669 036
Directors
Jacob Klein (Executive Chairman)
James Askew (Non-Executive Director)
Lawrie Conway (Non-Executive Director)
Graham Freestone (Lead Independent Director)
Paul Marks (Non-Executive Director)
John Rowe (Non-Executive Director)
Peter Smith (Non-Executive Director)
Company Secretary
Evan Elstein
Registered Office
Level 28, 175 Liverpool Street
SYDNEY NSW 2000
Postal Address
Level 28, 175 Liverpool Street
SYDNEY NSW 2000
Tel: (+612) 9696 2900 Fax: (+612) 9696 2901
Share Register
Link Market Services
Level 12, 680 George Street
SYDNEY NSW 2000
Tel: 1300 554 474 or (+612) 9315 2333
Fax: (+612) 9287 0303
Email: [email protected]
Auditors
PricewaterhouseCoopers 201 Sussex Street SYDNEY NSW 2000
Tel: (+612) 8266 0000
Internet Address
www.evolutionmining.com.au
Stock Exchange Listing
Evolution Mining Limited (EVN) shares are listed on the Australian Securities Exchange.

EVOLUTION MINING LIMITED HALF-YEAR FINANCIAL REPORT – 31 DECEMBER 2012
2
TABLE OF CONTENTS
Directors' Report 3
Auditor’s Independence Declaration 7
Condensed Consolidated Statement of Comprehensive Income 8
Condensed Consolidated Statement of Financial Position 9
Condensed Consolidated Statement of Cash Flows 10
Condensed Consolidated Statement of Changes in Equity 11
Notes to the Condensed Consolidated Financial Statements 12
Directors' Declaration 21
Independent Auditor’s Review Report 22
This interim financial report does not include all the notes of the type normally included in an annual financial report. Accordingly, this report is to be read in conjunction with the Annual Report for the year ended 30 June 2012 and any public announcements made by Evolution Mining Limited (formerly Catalpa Resources Limited) during the interim reporting period in accordance with the continuous disclosure requirements of the Corporations Act 2001. Comparative year results and balances reflect six months of Catalpa Resources (100% Edna May and 30% of Cracow operations), the consolidation of Conquest Mining Limited from 17 October 2011 and the consolidation of Mt Rawdon and an 70% interest in Cracow from 2 November 2011.

EVOLUTION MINING LIMITED HALF-YEAR FINANCIAL REPORT – 31 DECEMBER 2012
3
DIRECTORS’ REPORT
The Directors present their report on Evolution Mining Limited (referred to hereafter as “Evolution” or “Company”), (formerly known as Catalpa Resources Limited), consisting of Evolution Mining Limited and the entities it controlled at the end of, or during, the half-year ended 31 December 2012. Comparative year results and balances reflect six months of Catalpa Resources (100% Edna May and 30% of Cracow operations), the consolidation of Conquest Mining Limited from 17 October 2011 and the consolidation of Mt Rawdon and an 70% interest in Cracow from 2 November 2011. DIRECTORS
The following persons were Directors of the Company for the duration of the half-year and up to the date of this report:
Jacob Klein (Executive Chairman)
James Askew (Non-Executive Director)
Lawrie Conway (Non-Executive Director)
Graham Freestone (Lead Independent Director)
Paul Marks (Non-Executive Director)
John Rowe (Non-Executive Director)
Peter Smith (Non-Executive Director) REVIEW OF OPERATIONS
Evolution’s gold production for the half-year ended 31 December 2012 was 196,110 ounces (31 December 2011 attributable: 99,130 ounces) at a C1 cash operating cost of $749 per ounce (31 December 2011 attributable: $732 per ounce) and remains within the company’s full year guidance of 370,000 – 410,000 ounces at $730 - $790 per ounce. The Cracow Gold Mine, QLD (100%), produced 54,324 ounces (31 December 2011 attributable: 28,444 ounces) of gold at a cash cost of $802 per ounce (31 December 2011 attributable: $630 per ounce). Costs increased in the current half due to changes in the mine plan and increased mining contractor costs. Record underground lateral development was completed in the half-year to secure future operational flexibility and performance. The Edna May Gold Mine, WA (100%), produced 48,687 ounces of gold (31 December 2011: 37,089 ounces) at a cash cost of $792 per ounce (31 December 2011 attributable: $870 per ounce). The operation has successfully increased throughput and reliability of the processing circuit. Improved throughput and strong head grade delivered record production in the half-year. Mt Rawdon Gold Mine, QLD (100%) produced 53,107 ounces of gold (31 December 2011 attributable: 12,367 ounces) at a cash cost of $616 per ounce (31 December 2011 attributable: $893 per ounce). A strong operating performance was delivered by reliable process plant throughput and strong gold grades in the open pit. The Pajingo Gold Mine, QLD (100%), produced 39,991 ounces of gold (31 December 2011 attributable: 21,229 ounces) at a cash cost of $801 per ounce (31 December 2011 attributable: $535 per ounce). Gold production in the first half was impacted by delayed access to scheduled ore sources. Production for the second half of the year is planned to increase due to processing of higher grade underground ore. Costs increased in the current period due to reduction in head grade relative to the prior period due to the delay in accessing high grade ore sources in the current period. The Mt Carlton gold-silver-copper project, QLD (100%), is Evolution’s key organic growth asset and is planned to expand the Company’s portfolio of 100% owned, Australian producing mines from four to five during the 2013 financial year. Construction of the project has largely been completed and commissioning commenced at the end of December 2012. First concentrate production is expected to commence in the March 2013 quarter. The project is planned to deliver approximately 720,000 ounces of gold, 14.4 million ounces of silver and 25,000 tonnes of copper over a 12 year life. FINANCIAL PERFORMANCE
The Group generated net profit after tax of $40.687 million for the six months ended 31 December 2012 representing 327% increase over the corresponding half in 2011 (31 December 2011: Net loss of $17.946 million). Total sales revenue of $321.642 million was 108% higher than the prior half-year, predominantly due to significantly higher gold production. Average realised gold price was $1,630 per ounce which was the same as the 31 December 2011 period. The Group generated gold sales revenue of $316.637 million from the sale of 194,219 ounces of gold and silver sales revenue of $5.005 million from the sale of 164,490 ounces of silver.

EVOLUTION MINING LIMITED HALF-YEAR FINANCIAL REPORT – 31 DECEMBER 2012
4
Cost of sales increased by 107% to $240.688 million compared to the prior half- year, as a result of increased production in line with the higher output. Cost of sales for the half-year comprised of $154.165 million of mine operating costs, $71.452 million depreciation and amortisation and $15.071 million in royalty expenses. On a unit basis, group cash cost was $749 per ounce, a 2% increase on the prior period unit cash operating cost of $732 per ounce. Corporate and other administration costs were $11.087 million (31 December 2011: $9.920 million) and Exploration costs expensed were $5.401 million (31 December 2011: $3.024 million). Group depreciation and amortisation cost for the period was $71.868 million (31 December 2011: $30.178 million), representing a 138% increase. The increase was due to higher production and partial year ownership of assets in the prior half-year. The Group cash inflow from operating activities was $100.957 million (31 December 2011: $41.513 million), representing a 143% increase. The increase reflects strong operating performance at all four operating mines and partial year ownership of assets in the prior half-year. Group cash outflow from investing activities was $240.054 million (31 December 2011: $48.526 million), an increase of 394%. Significant investment occurred during the period on the Mt Carlton project, with commissioning commencing during December 2012. Investment in mine development activity at all sites, particularly waste stripping activity in the open pits, increased during the period. Group cash inflow from financing activities for the period was $46.535 million (31 December 2011: $144.392 million). Activity reflects the repayment of an existing project finance loan and drawdowns under the new revolving credit facility. Cash on hand at the end of the period was $49.222 million (30 June 2011: $141.784 million). At the end of the period, the Group had drawn down $81.784 under the revolving credit facility. Project debt at 30 June 2012 amounted to $31.5 million. SIGNIFICANT CHANGES IN THE STATE OF AFFAIRS
Significant changes in the state of affairs of the Company during the financial year follows in chronological order:
On 6 November 2012 the Company announced it had received a $200 million non-secured corporate loan facility. The new facility has initially been used to refinance the $31.5 million Edna May Syndicated Facility Agreement and to finance the Company’s working capital requirements. The facility matures in November 2015.
On 27 December 2012, the Company announced commencement of commissioning at its 100% owned Mt Carlton Gold-Silver-Copper mine.
Apart from the above, or as noted elsewhere in this report, no significant changes in the state of affairs of the Company occurred during the half-year. SUBSEQUENT EVENTS
Other than the matters discussed above there are no other matters or circumstances which have arisen since 31 December 2012 that have significantly affected or may significantly affect the operations of the Group, the results of those operations or the state of affairs of the Group in subsequent financial years. FUTURE DEVELOPMENTS
Other likely developments in the operations of the Company and the expected results of those operations in future financial years have not been included in this report as the inclusion of such information is likely to result in unreasonable prejudice to the Company. Accordingly this information has not been disclosed in this report. ENVIRONMENTAL REGULATIONS
The Company is subject to significant environmental regulation in respect to its exploration, mining and processing activities. The Company aims to ensure the appropriate standard of environmental care is achieved, and in doing so, that it is aware of and is in compliance with all environmental legislation. The Directors of the Company are not aware of any breach of environmental legislation for the year under review.

EVOLUTION MINING LIMITED HALF-YEAR FINANCIAL REPORT – 31 DECEMBER 2012
5
PERFORMANCE OF EVOLUTION MINING LIMITED
The table below sets out summary information about the Company’s earnings and movements in the Company’s share price for the last 3 years.
31 Dec 2012
$000
31 Dec 2011
$000
31 Dec 2010
$000
Revenue 321,642 154,615 48,060
Net profit/(loss) before tax 58,533 (1,138) 3,017
Net profit/(loss) after tax 40,687 (17,946) 1,981
Basic earnings per share (cents per share) 5.75 (5.15) 1.22

EVOLUTION MINING LIMITED HALF-YEAR FINANCIAL REPORT – 31 DECEMBER 2012
6
AUDITOR’S INDEPENDENCE DECLARATION
The Auditor’s Independence Declaration is included on page 7 of the half-year financial report. ROUNDING OFF AMOUNTS
The Company is a company of the kind referred to in ASIC Class Order 98/0100, dated 10 July 1998, and in accordance with that Class Order amounts in the directors’ report and the half-year financial report are rounded to the nearest thousand dollars unless otherwise indicated. Signed in accordance with a resolution of the directors made pursuant to s306(3) of the Corporations Act 2001.
On behalf of the Directors
Sydney
21 February 2013
PricewaterhouseCoopers, ABN 52 780 433 757Darling Park Tower 2, 201 Sussex Street, GPO BOX 2650, SYDNEY NSW 1171T: +61 2 8266 0000, F: +61 2 8266 9999, www.pwc.com.au
Liability limited by a scheme approved under Professional Standards Legislation.
7
Auditor’s Independence Declaration
As lead auditor for the review of Evolution Mining Limited for the half-year ended 31 December 2012,I declare that to the best of my knowledge and belief, there have been:
a) no contraventions of the auditor independence requirements of the Corporations Act 2001 inrelation to the review; and
b) no contraventions of any applicable code of professional conduct in relation to the review.
This declaration is in respect of Evolution Mining Limited and the entities it controlled during theperiod.
Tim Goldsmith SydneyPartner 21 February 2013PricewaterhouseCoopers

EVOLUTION MINING LIMITED HALF-YEAR FINANCIAL REPORT
8
CONDENSED CONSOLIDATED STATEMENT OF COMPREHENSIVE INCOME
FOR THE HALF-YEAR ENDED 31 DECEMBER 2012
Consolidated
Half-year ended
31 December 2012 31 December 2011
Notes $’000 $’000
Sales revenue 321,642 154,615
Cost of sales 3 (240,688) (116,125)
Gross profit 80,954 38,490
Interest income 1,432 1,759
Fair value re-measurement of previously held interest in the Cracow gold mine - 8,097
Exploration and evaluation costs expensed as incurred (5,401) (3,024)
Share-based payments expense 10 (953) (1,588)
Corporate and other administration costs (11,087) (9,920)
Costs related to business combinations - (29,427)
Change in fair value of held for trading securities - (150)
Other income 87 80
Finance costs (6,499) (5,455)
Profit/(loss) before income tax expense 58,533 (1,138)
Income tax expense 4 (17,846) (16,808)
Profit/(loss) for the year attributable to owners of the parent 40,687 (17,946)
Other comprehensive loss, net of income tax
Items that may be reclassified to profit and loss:
Change in fair value of available for sale financial assets (net of tax) (1,338) (524)
Total comprehensive income/(loss) for the half-year attributable to owners of the parent 39,349 (18,470)
Earnings per share
Basic profit/(loss) cents per share 11 5.75 (5.15)
Diluted profit/(loss) cents per share 11 5.62 (5.15)
The above Condensed Consolidated Statement of Comprehensive Income should be read in conjunction with the accompanying notes.

EVOLUTION MINING LIMITED HALF-YEAR FINANCIAL REPORT
9
CONDENSED CONSOLIDATED STATEMENT OF FINANCIAL POSITION
AS AT 31 DECEMBER 2012
Consolidated
31 December 2012 30 June 2012
Notes $’000 $’000
Current assets
Cash and cash equivalents 49,222 141,784
Trade and other receivables 31,209 27,939
Inventories 61,206 35,144
Other current assets 22,667 14,306
Total current assets 164,304 219,173
Non-current assets
Other financial assets 5 2,376 3,714
Property, plant and equipment 6 265,933 265,079
Mine development and exploration 7 909,321 758,687
Inventories 3,936 4,308
Goodwill 18,365 18,365
Other non-current assets 69 122
Total non-current assets 1,200,000 1,050,275
Total assets 1,364,304 1,269,448
Current liabilities
Trade and other payables 95,971 110,440
Interest bearing liabilities 8 4,667 18,392
Provisions 8,671 8,550
Total current liabilities 109,309 137,382
Non-current liabilities
Interest bearing liabilities 8 79,635 17,454
Deferred tax liability 28,556 10,711
Provisions 48,640 47,483
Total non-current liabilities 156,831 75,648
Total liabilities 266,140 213,030
Net assets 1,098,164 1,056,418
Equity
Issued capital 9 1,047,195 1,045,751
Reserves 9,044 9,429
Accumulated earnings 41,925 1,238
Total equity 1,098,164 1,056,418
The above Condensed Consolidated Statement of Financial Position should be read in conjunction with the accompanying notes.

EVOLUTION MINING LIMITED HALF-YEAR FINANCIAL REPORT NOTES TO THE CONDENSED CONSOLIDATED FINANCIAL STATEMENTS
10
CONDENSED CONSOLIDATED STATEMENT OF CASH FLOWS FOR THE HALF-YEAR ENDED 31 DECEMBER 2012
Consolidated
Half-year ended
31 December 2012 31 December 2011
$’000 $’000
Cash flows from operating activities
Receipts from sales 322,763 150,283
Payments to suppliers and employees (220,314) (107,693)
Interest received 1,432 1,360
Interest paid (2,924) (2,437)
Net cash inflow from operating activities 100,957 41,513
Cash flows from investing activities
Purchase of property, plant and equipment (19,400) (14,849)
Payment for mine development and exploration (199,276) (46,427)
Stamp duty paid (21,431) -
Maturity of/(investments in) term deposits 53 -
Cash acquired on acquisition of Conquest Mining Limited - 12,748
Proceeds on the disposal of investments - 2
Net cash outflow from investing activities (240,054) (48,526)
Cash flows from financing activities
Proceeds from borrowings (net of borrowing costs) 77,234 -
Repayment of interest bearing liabilities (31,308) (9,278)
Proceeds from issue of equity securities 609 158,261
Transaction costs of issuing shares - (4,591)
Net cash inflow from financing activities 46,535 144,392
Net (decrease)/increase in cash and cash equivalents (92,562) 137,379
Cash and cash equivalents at the beginning of the period 141,784 30,051
Cash and cash equivalents at the end of the period 49,222 167,430
The above Condensed Consolidated Statement of Cash Flows should be read in conjunction with the accompanying notes.

EVOLUTION MINING LIMITED HALF-YEAR FINANCIAL REPORT NOTES TO THE CONDENSED CONSOLIDATED FINANCIAL STATEMENTS
11
CONDENSED CONSOLIDATED STATEMENT OF CHANGES IN EQUITY FOR THE HALF-YEAR ENDED 31 DECEMBER 2012
Consolidated Issued
capital Share-based
payment reserve
Fair value revaluation
reserve
Accumulated earnings
Total equity
$’000 $’000 $’000 $’000 $’000
Balance at 1 July 2011 185,465 5,144 157 (30,772) 159,994
Loss for the period - - - (17,946) (17,946) Other comprehensive loss for the period: Fair value loss on available for sale financial asset - - (524) - (524)
Total comprehensive loss for the period - - (524) (17,946) (18,470)
Issue of share capital 860,292 - - - 860,292
Transaction costs on share issues (3,563) - - - (3,563)
Cost of replacement options - 7,525 - - 7,525 Recognition of share-based payments -
1,588 - -
1,588
Balance at 31 December 2011 1,042,194 14,257 (367) (48,718) 1,007,366
Consolidated Issued
capital Share-based
payment reserve
Fair value revaluation
reserve
Accumulated earnings
Total equity
$’000 $’000 $’000 $’000 $’000
Balance at 1 July 2012 1,045,751 15,042 (5,613) 1,238 1,056,418
Profit for the period - - - 40,687 40,687 Other comprehensive income for the period: Fair value loss on available for sale financial asset - - (1,338) - (1,338)
Total comprehensive income for the period - - (1,338) 40,687 39,349
Issue of share capital on exercise of options 609 - - - 609 Issue of share capital on asset acquisition 835 - - - 835 Recognition of share-based payments - 953 - -
953
Balance at 31 December 2012 1,047,195 15,995 (6,951) 41,925 1,098,164
The above Condensed Consolidated Statement of Changes in Equity should be read in conjunction with the accompanying notes.

EVOLUTION MINING LIMITED HALF-YEAR FINANCIAL REPORT NOTES TO THE CONDENSED CONSOLIDATED FINANCIAL STATEMENTS
12
1. BASIS OF PREPARATION
(a) Basis of preparation and changes to the Group’s accounting policies
This condensed consolidated interim financial report for the half-year reporting period ended 31 December 2012 has been prepared in accordance with Accounting Standard AASB 134 Interim Financial Reporting and the Corporations Act 2001.
This condensed consolidated interim financial report does not include all the notes of the type normally included in an annual financial report. Accordingly, this report is to be read in conjunction with the Annual Report for the year ended 30 June 2012 and any public announcements made by the Group during the reporting period in accordance with the continuous disclosure requirements of the Corporations Act 2001. The accounting policies adopted are consistent with those of the previous financial year and corresponding interim reporting period. Comparative year results and balances reflect six months of Catalpa Resources (100% Edna May and 30% of Cracow operations), the consolidation of Conquest Mining Limited from 17 October 2011 and the consolidation of Mt Rawdon and a 70% interest in Cracow from 2 November 2011. (b) New standards and interpretations not yet adopted
The Group did not adopt any new and/or revised Accounting Standards, Amendments and Interpretations from 1 July 2012 which had an effect on the financial position or performance of the Group. The Group has not elected to early adopt any other new standards, amendments or interpretations that are issued but are not yet effective.

EVOLUTION MINING LIMITED HALF-YEAR FINANCIAL REPORT NOTES TO THE CONDENSED CONSOLIDATED FINANCIAL STATEMENTS
13
2. SEGMENT INFORMATION
Description of segments
The Group’s operations are all conducted in the mining industry in Australia.
The Group has identified its operating segments based on the internal reports that are reviewed and used by the Executive Chairman and the senior leadership team (the chief operating decision makers) in assessing performance and in determining the allocation of resources. The presentation of segment information has changed since the previous half-year reporting period as a result of modified performance measures used for internal reporting purposes.
The Group’s four operational mine sites and Corporate are each treated as individual operating segments. Management
monitors the operating results of its business units separately for the purpose of making decisions about resource
allocation and performance assessment.
Corporate includes the Mt Carlton asset under construction. The remainder of Corporate includes share-based payment
expenses and other corporate expenditures supporting the business during the year.
Segment performance is evaluated based on earnings before interest, tax, depreciation and amortisation (EBITDA). a) Segment information
Edna May Cracow Pajingo Mt
Rawdon
Exploration Corporate/
Mt Carlton
Total
$’000 $’000 $’000 $’000 $’000 $’000 $’000
Half-year 31 December 2012
Segment revenue 81,220 88,847 66,462 85,113 - - 321,642
EBITDA 35,111 39,270 29,458 48,567 (5,401) (11,537) 135,468
Half-year 31 December 2011
(Restated)
Segment revenue 62,998 43,898 31,054 16,665 - - 154,615
EBITDA 26,727 23,817 13,322 4,824 (3,024) (11,600) 54,066
Capital Additions
31 December 2012 16,049 21,303 29,686 29,709 21,655 109,935 228,337
30 June 2012 44,582 24,396 44,510 34,172 28,288 102,286 278,234
b) Segment reconciliation
Half-year ended
31 December 2012 31 December 2011
$’000 $’000
Reconciliation of profit/(loss) before income tax
EBITDA 135,468 54,066
Depreciation and amortisation (71,868) (30,178)
Costs related to business combinations - (29,427)
Fair value re-measurement of previously held
interest in the Cracow gold mine
- 8,097
Interest income 1,432 1,759 Finance costs (6,499) (5,455)
Profit (loss) before income tax 58,533 (1,138)
EVOLUTION MINING LIMITED HALF-YEAR FINANCIAL REPORT NOTES TO THE CONDENSED CONSOLIDATED FINANCIAL STATEMENTS
14
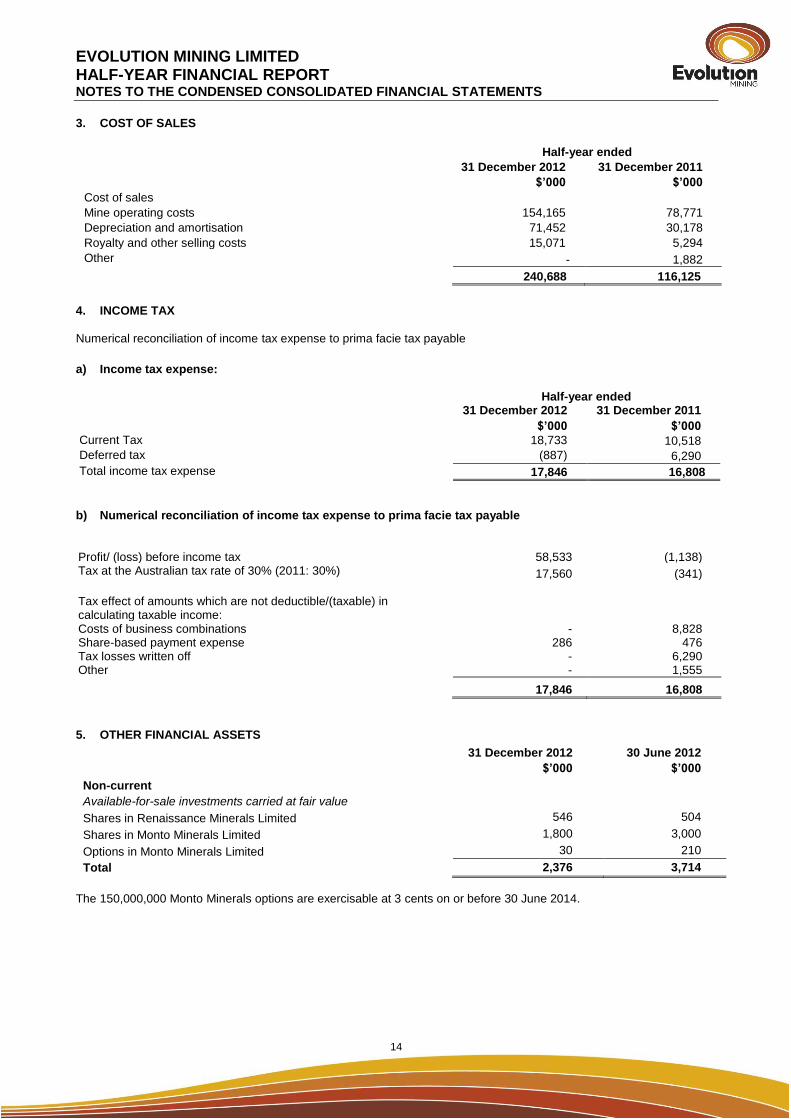
3. COST OF SALES
Half-year ended
31 December 2012 31 December 2011
$’000 $’000
Cost of sales
Mine operating costs 154,165 78,771
Depreciation and amortisation 71,452 30,178
Royalty and other selling costs 15,071 5,294
Other - 1,882
240,688 116,125
4. INCOME TAX
Numerical reconciliation of income tax expense to prima facie tax payable
a) Income tax expense:
Half-year ended 31 December 2012 31 December 2011
$’000 $’000
Current Tax 18,733 10,518
Deferred tax (887) 6,290
Total income tax expense 17,846 16,808
b) Numerical reconciliation of income tax expense to prima facie tax payable
Profit/ (loss) before income tax 58,533 (1,138) Tax at the Australian tax rate of 30% (2011: 30%) 17,560 (341) Tax effect of amounts which are not deductible/(taxable) in calculating taxable income: Costs of business combinations - 8,828 Share-based payment expense 286 476 Tax losses written off - 6,290 Other - 1,555
17,846 16,808
5. OTHER FINANCIAL ASSETS
31 December 2012 30 June 2012
$’000 $’000
Non-current
Available-for-sale investments carried at fair value
Shares in Renaissance Minerals Limited 546 504
Shares in Monto Minerals Limited 1,800 3,000
Options in Monto Minerals Limited 30 210
Total 2,376 3,714 The 150,000,000 Monto Minerals options are exercisable at 3 cents on or before 30 June 2014.

EVOLUTION MINING LIMITED HALF-YEAR FINANCIAL REPORT NOTES TO THE CONDENSED CONSOLIDATED FINANCIAL STATEMENTS
15
6. PROPERTY, PLANT AND EQUIPMENT
Freehold Land Plant and equipment
Total
$’000 $’000 $’000
30 June 2012
Cost 9,261 291,117 300,378
Accumulated depreciation - (35,299) (35,299)
Net carrying amount 9,261 255,818 265,079
Half-year ended
31 December 2012 Carrying amount at the beginning of the period 9,261 255,818 265,079
Additions 567 14,292 14,859
Reclassifications - 323 323 Disposals - (46) (46) Depreciation* - (14,282) (14,282)
Carrying amount at the end of the period 9,828 256,105 265,933
At 31 December 2012
Cost 9,828 305,686 315,514
Accumulated depreciation - (49,581) (49,581)
Net carrying amount 9,828 256,105 265,933
Carrying amount of lease assets - 7,616 7,616
Carrying amount of assets under construction - 17,080 17,080
- 24,696 24,696
*amount includes capitalised depreciation for assets used in construction activities.

EVOLUTION MINING LIMITED HALF-YEAR FINANCIAL REPORT NOTES TO THE CONDENSED CONSOLIDATED FINANCIAL STATEMENTS
16
7. MINE DEVELOPMENT AND EXPLORATION
Mines under construction
Producing mines
Exploration and evaluation
Total
$’000 $’000 $’000 $’000
30 June 2012
Cost 247,380 530,197 91,479 869,056
Accumulated depreciation - (97,459) (12,910) (110,369)
Net carrying amount 247,380 432,738 78,569 758,687
Half-year ended
31 December 2012 Carrying amount at the beginning of the period 247,380 432,738 78,569 758,687 Additions 106,638 85,185 21,655 213,478 Reclassifications 16,411 12,037 (28,771) (323)
Write-off of exploration expenditure - - (4,860) (4,860)
Depreciation and amortisation - (55,873) (1,788) (57,661)
Carrying amount at the end of the period 370,429 474,087 64,805 909,321
At 31 December 2012
Cost 370,429 627,419 79,503 1,077,351
Accumulated depreciation - (153,332) (14,698) (168,030)
Net carrying amount 370,429 474,087 64,805 909,321

EVOLUTION MINING LIMITED HALF-YEAR FINANCIAL REPORT NOTES TO THE CONDENSED CONSOLIDATED FINANCIAL STATEMENTS
17
8. INTEREST BEARING LIABILITIES
31 December 2012 30 June 2012
$’000 $’000 Current
Corporate loan facility - 16,500 Less: Borrowing costs - (1,151) Finance lease liabilities 2,936 3,043 Other borrowings 1,731 -
Total 4,667 18,392
Non-Current Corporate loan facility 81,784 15,000 Less: Borrowing costs (4,321) (1,150) Finance lease liabilities 2,172 3,604
Total 79,635 17,454
In November 2012, the Group secured a $200 million corporate loan facility. The purpose of this facility was to refinance the $31.5 million Edna May loan facility and to finance short-term working capital requirements. The facility is a senior unsecured revolving loan and will mature in November 2015. The corporate loan facility is based on a variable interest rate, calculated using the bank bill swap bid rate (BBSY) plus an applicable margin.
The lenders have placed covenants over the corporate loan facility based on the current ratio, leverage ratio, interest coverage ratio and the gearing ratio. The Group has complied with these covenants during the period. The Group’s undrawn borrowings amounted to $118.216 million at the end of the period. Maturities of financial liabilities The following are the Group’s contractual maturities of non-derivative financial liabilities, including estimated interest payments and excluding the impact of netting agreements. The amounts disclosed in the tables below have been drawn up based on the undiscounted cash flows (including both interest and principal cash flows expected) using contractual maturities and the earliest date on which the Group can be required to pay financial liabilities. Contractual maturities of financial liabilities (A$’000)
Less than 1 year
1-2 years 2-5 years Over 5 years Total contractual cash flows
Carrying amount
31 December 2012
Trade and other payables 95,971 - - - 95,971 95,971
Finance lease liabilities 3,138 2,175 - - 5,313 5,108
Corporate loan facility 4,703 4,703 85,752 - 95,158 81,784
Other borrowings 1,731 - - - 1,731 1,731
Total liabilities 105,543 6,878 85,752 - 198,173 184,594
30 June 2012
Trade and other payables 110,440 - - - 110,440 110,440
Finance lease liabilities 3,232 3,092 632 - 6,956 6,646
Corporate loan facility 18,518 13,773 2,029 - 34,320 31,500
Total liabilities 132,190 16,865 2,661 - 151,716 148,586
EVOLUTION MINING LIMITED HALF-YEAR FINANCIAL REPORT NOTES TO THE CONDENSED CONSOLIDATED FINANCIAL STATEMENTS
18
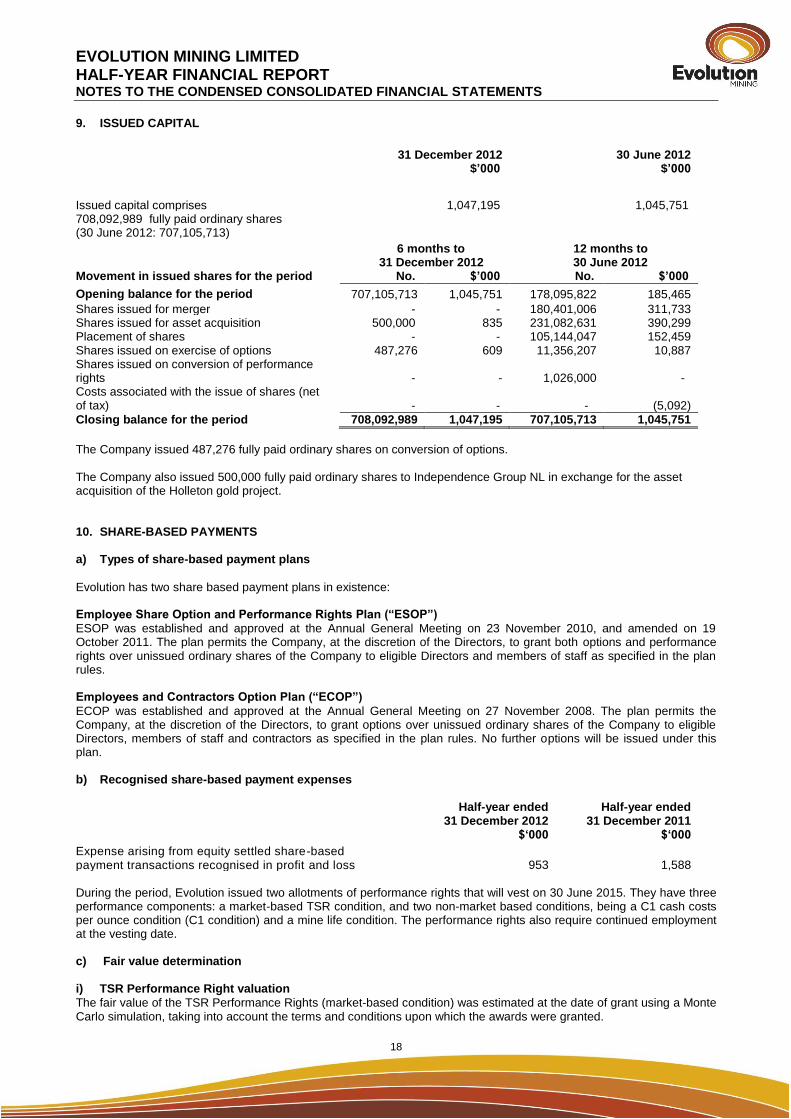
9. ISSUED CAPITAL
31 December 2012
$’000 30 June 2012
$’000
Issued capital comprises 1,047,195 1,045,751 708,092,989 fully paid ordinary shares (30 June 2012: 707,105,713)
6 months to 12 months to 31 December 2012 30 June 2012 Movement in issued shares for the period No. $’000 No. $’000
Opening balance for the period 707,105,713 1,045,751 178,095,822 185,465
Shares issued for merger - - 180,401,006 311,733 Shares issued for asset acquisition 500,000 835 231,082,631 390,299 Placement of shares - - 105,144,047 152,459 Shares issued on exercise of options 487,276 609 11,356,207 10,887 Shares issued on conversion of performance rights - - 1,026,000 - Costs associated with the issue of shares (net of tax) - - - (5,092)
Closing balance for the period 708,092,989 1,047,195 707,105,713 1,045,751
The Company issued 487,276 fully paid ordinary shares on conversion of options. The Company also issued 500,000 fully paid ordinary shares to Independence Group NL in exchange for the asset acquisition of the Holleton gold project. 10. SHARE-BASED PAYMENTS
a) Types of share-based payment plans
Evolution has two share based payment plans in existence: Employee Share Option and Performance Rights Plan (“ESOP”)
ESOP was established and approved at the Annual General Meeting on 23 November 2010, and amended on 19 October 2011. The plan permits the Company, at the discretion of the Directors, to grant both options and performance rights over unissued ordinary shares of the Company to eligible Directors and members of staff as specified in the plan rules. Employees and Contractors Option Plan (“ECOP”)
ECOP was established and approved at the Annual General Meeting on 27 November 2008. The plan permits the Company, at the discretion of the Directors, to grant options over unissued ordinary shares of the Company to eligible Directors, members of staff and contractors as specified in the plan rules. No further options will be issued under this plan.
b) Recognised share-based payment expenses
Half-year ended
31 December 2012 $‘000
Half-year ended 31 December 2011
$‘000
Expense arising from equity settled share-based payment transactions recognised in profit and loss
953 1,588
During the period, Evolution issued two allotments of performance rights that will vest on 30 June 2015. They have three performance components: a market-based TSR condition, and two non-market based conditions, being a C1 cash costs per ounce condition (C1 condition) and a mine life condition. The performance rights also require continued employment at the vesting date. c) Fair value determination i) TSR Performance Right valuation
The fair value of the TSR Performance Rights (market-based condition) was estimated at the date of grant using a Monte Carlo simulation, taking into account the terms and conditions upon which the awards were granted.

EVOLUTION MINING LIMITED HALF-YEAR FINANCIAL REPORT NOTES TO THE CONDENSED CONSOLIDATED FINANCIAL STATEMENTS
19
ii) C1 Performance Right valuation and Mine life rights valuation
The fair value of the C1 and mine life performance rights (non-market based conditions) is the share price on grant date as future dividends cannot be reliably estimated. The following tables list the inputs to the models used for the performance rights granted during the period:
Allotment 1 Allotment 2
Grant date 17 September 2012 27 November 2012 Spot price ($) 1.89 1.87 Risk-free rate (%) 2.8% 2.8% Term (years) 2.78 2.59 Volatility 45% - 50% 40 - 45%
The weighted average fair value of performance rights granted during the period was $1.418 (2011: $1.363). 11. EARNINGS PER SHARE
Half-year ended Half-year ended
31 December 2012 31 December 2011
Basic profit /(loss) per share (cents per share) 5.75 (5.15) Diluted profit /(loss) per share (cents per share) 5.62 (5.15) Weighted average number of ordinary shares on issue used in the calculation of basic earnings per share
707,655,550
348,316,566
Effect of dilution: Share options and performance rights 16,604,263 - Weighted average number of ordinary shares used in the calculation of diluted earnings per share
724,259,813
348,316,566
Basic earnings per share (‘EPS’) is calculated by dividing the net profit/(loss) after income tax attributable to members of the Company by the weighted average number of ordinary shares of the Company outstanding during the financial year. Diluted earnings per share adjusts the figures used in the determination of basic earnings per share to take into account the after income tax effect of interest and other financing costs associated with dilutive potential ordinary shares and the weighted average number of shares assumed to have been issued for no consideration in relation to dilutive potential ordinary shares.
12. RELATED PARTY TRANSACTIONS
Directors Fees were paid to Newcrest Mining Limited for the services of two Non-Executive Directors, Mr Lawrie Conway and Mr Peter Smith, in the amount of $96,250 (2011: $39,027) Newcrest also provided certain accounting, information technology and administration services to the Company. Fees paid to Newcrest in the period in this regard amounted to $38,522 (2011: $574,375)

EVOLUTION MINING LIMITED HALF-YEAR FINANCIAL REPORT NOTES TO THE CONDENSED CONSOLIDATED FINANCIAL STATEMENTS
20
13. GOLD DELIVERY COMMITMENTS
As at 31 December 2012 Gold for physical
delivery Contracted sales
price Value of committed
sales
(ounces) $ $’000
Within one year 68,669 1,573 108,016
Later than one year but not greater than five years 120,700 1,573 189,861
189,369 297,877
As at 30 June 2012 Gold for physical
delivery Contracted sales
price Value of committed
sales
(ounces) $ $’000
Within one year 66,589 1,573 104,744
Later than one year but not greater than five years 157,588 1,573
247,886
224,177 352,630
The counterparty to the physical gold delivery contract is Macquarie Bank Limited (‘Macquarie’). The contracts are settled on a quarterly basis by physical delivery of gold per Macquarie’s instructions. The contracts are accounted for as sale contracts with revenue recognised once the gold has been delivered to Macquarie or its agent. The physical gold delivery contract is considered a contract to sell a non-financial item and is therefore out of the scope of AASB 139. As a result no derivatives are required to be recognised. The Company has no other gold sale commitments with respect to its current operations. 14. CONTINGENCIES
The Group has provided bank guarantees in favour of various government authorities and service providers with respect to site restoration, contractual obligations and premises at 31 December 2012. The total of these guarantees at 31 December 2012 was $34.053 million with various financial institutions.(30 June 2012: $30.130 million). In addition to the above guarantees, Newcrest Mining Limited (‘Newcrest’) is holding $13.550 million in performance bonds relating to Cracow and Mt Rawdon operations on behalf of the Group (30 June 2012: $13.550 million). These bonding obligations will be transferred to Evolution once the asset sale agreements have been stamped by the Queensland Office of State Revenue.
15. EVENTS AFTER THE BALANCE SHEET DATE
No other matter or circumstance has arisen since 31 December 2012 that has significantly affected, or may significantly affect, the operations of the Group, or the state of affairs of the Group and its controlled entities in subsequent periods.

EVOLUTION MINING LIMITED HALF-YEAR FINANCIAL REPORT NOTES TO THE CONDENSED CONSOLIDATED FINANCIAL STATEMENTS
21
DIRECTORS’ DECLARATION
In the directors’ opinion:
a) The financial statements and notes set out on pages 8 to 20 are in accordance with the Corporations Act 2001, including:
i. Complying with Accounting Standards, the Corporations Regulations 2001 and other mandatory professional reporting requirements, and
ii. Giving a true and fair view of the consolidated entities financial position as at 31 December 2012 and of its performance for the half-year ended on that date, and
b) There are reasonable grounds to believe that Evolution Mining Limited will be able to pay its debts as and when they become due and payable.
This declaration is made in accordance with a resolution of the directors. On behalf of the Directors
Sydney
21 February 2013

PricewaterhouseCoopers, ABN 52 780 433 757Darling Park Tower 2, 201 Sussex Street, GPO BOX 2650, SYDNEY NSW 1171T: +61 2 8266 0000, F: +61 2 8266 9999, www.pwc.com.au
Liability limited by a scheme approved under Professional Standards Legislation.
22
Independent auditor’s review report to the members ofEvolution Mining Limited
Report on the Half-Year Financial Report
We have reviewed the accompanying half-year financial report of Evolution Mining Limited, whichcomprises the statement of financial position as at 31 December 2012, and the statement ofcomprehensive income, statement of changes in equity and statement of cash flows for the half-yearended on that date, selected explanatory notes and the directors’ declaration for the Evolution MiningLimited (the consolidated entity). The consolidated entity comprises both Evolution Mining Limited(the company) and the entities it controlled during that half-year.
Directors’ responsibility for the half-year financial report
The directors of the company are responsible for the preparation of the half-year financial report thatgives a true and fair view in accordance with Australian Accounting Standards (including theAustralian Accounting Interpretations) and the Corporations Act 2001 and for such internal control asthe directors determine is necessary to enable the preparation of the half-year financial report that isfree from material misstatement whether due to fraud or error.
Auditor’s responsibility
Our responsibility is to express a conclusion on the half-year financial report based on our review. Weconducted our review in accordance with Auditing Standard on Review Engagements ASRE 2410Review of a Financial Report Performed by the Independent Auditor of the Entity, in order to statewhether, on the basis of the procedures described, we have become aware of any matter that makes usbelieve that the financial report is not in accordance with the Corporations Act 2001 including: givinga true and fair view of the consolidated entity’s financial position as at 31 December 2012 and itsperformance for the half-year ended on that date; and complying with Accounting Standard AASB 134Interim Financial Reporting and the Corporations Regulations 2001. As the auditor of EvolutionMining Limited, ASRE 2410 requires that we comply with the ethical requirements relevant to theaudit of the annual financial report.
A review of a half-year financial report consists of making enquiries, primarily of persons responsiblefor financial and accounting matters, and applying analytical and other review procedures. A review issubstantially less in scope than an audit conducted in accordance with Australian Auditing Standardsand consequently does not enable us to obtain assurance that we would become aware of all significantmatters that might be identified in an audit. Accordingly, we do not express an audit opinion.
Independence
In conducting our review, we have complied with the independence requirements of the CorporationsAct 2001.
PricewaterhouseCoopers, ABN 52 780 433 757Darling Park Tower 2, 201 Sussex Street, GPO BOX 2650, SYDNEY NSW 1171T: +61 2 8266 0000, F: +61 2 8266 9999, www.pwc.com.au
Liability limited by a scheme approved under Professional Standards Legislation.
23
Conclusion
Based on our review, which is not an audit, we have not become aware of any matter that makes usbelieve that the half-year financial report of Evolution Mining Limited is not in accordance with theCorporations Act 2001 including:
(a) giving a true and fair view of the consolidated entity’s financial position as at 31 December 2012and of its performance for the half-year ended on that date; and
(b) complying with Accounting Standard AASB 134 Interim Financial Reporting and theCorporations Regulations 2001.
PricewaterhouseCoopers
Tim Goldsmith SydneyPartner 21 February 2013