Embed Size (px)
Citation preview
QANTAS AIRWAYS LIMITED AND CONTROLLED ENTITIES
APPENDIX 4D AND
CONSOLIDATED INTERIM FINANCIAL REPORT
FOR THE HALF-YEAR ENDED
31 DECEMBER 2017
ABN 16 009 661 901
ASX CODE: QAN
QANTAS AIRWAYS LIMITED
ABN 16 009 661 901
Page 1
Table of Contents
ASX APPENDIX 4D Results for Announcement to the Market 2
Other Information 2
DIRECTORS’ REPORT
Directors 4
Review of Operations 5
CONSOLIDATED INTERIM FINANCIAL REPORT
Consolidated Income Statement 16
Consolidated Statement of Comprehensive Income 17
Consolidated Balance Sheet 18
Consolidated Statement of Changes in Equity 19
Consolidated Cash Flow Statement 21
Condensed Notes to the Consolidated Interim Financial Report 22
Lead Auditor’s Independence Declaration 31
Directors’ Declaration 32
Independent Auditor’s Review Report to the Members of Qantas Airways Limited 33
ADDITIONAL INFORMATION
Operational Statistics 34
QANTAS AIRWAYS LIMITED ASX APPENDIX 4D ABN 16 009 661 901 HALF-YEAR ENDED 31 DECEMBER 2017
Page 2
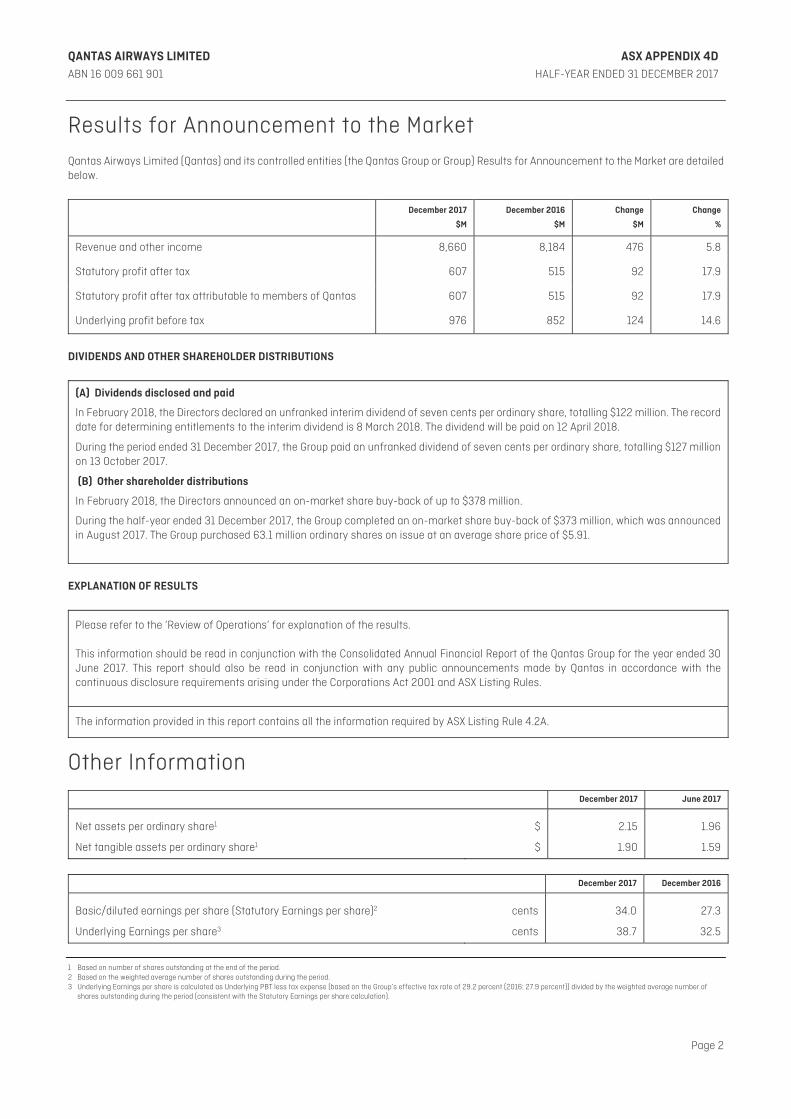
Results for Announcement to the Market Qantas Airways Limited (Qantas) and its controlled entities (the Qantas Group or Group) Results for Announcement to the Market are detailed below.
December 2017
$M
December 2016
$M
Change
$M
Change
%
Revenue and other income 8,660 8,184 476 5.8
Statutory profit after tax 607 515 92 17.9
Statutory profit after tax attributable to members of Qantas 607 515 92 17.9
Underlying profit before tax 976 852 124 14.6
DIVIDENDS AND OTHER SHAREHOLDER DISTRIBUTIONS
(A) Dividends disclosed and paid
In February 2018, the Directors declared an unfranked interim dividend of seven cents per ordinary share, totalling $122 million. The record date for determining entitlements to the interim dividend is 8 March 2018. The dividend will be paid on 12 April 2018.
During the period ended 31 December 2017, the Group paid an unfranked dividend of seven cents per ordinary share, totalling $127 million on 13 October 2017.
(B) Other shareholder distributions
In February 2018, the Directors announced an on-market share buy-back of up to $378 million.
During the half-year ended 31 December 2017, the Group completed an on-market share buy-back of $373 million, which was announced in August 2017. The Group purchased 63.1 million ordinary shares on issue at an average share price of $5.91.
EXPLANATION OF RESULTS
Please refer to the ‘Review of Operations’ for explanation of the results. This information should be read in conjunction with the Consolidated Annual Financial Report of the Qantas Group for the year ended 30 June 2017. This report should also be read in conjunction with any public announcements made by Qantas in accordance with the continuous disclosure requirements arising under the Corporations Act 2001 and ASX Listing Rules.
The information provided in this report contains all the information required by ASX Listing Rule 4.2A.
Other Information
December 2017 June 2017
Net assets per ordinary share1 $ 2.15 1.96
Net tangible assets per ordinary share1 $ 1.90 1.59
December 2017 December 2016
Basic/diluted earnings per share (Statutory Earnings per share)2 cents 34.0 27.3
Underlying Earnings per share3 cents 38.7 32.5
1 Based on number of shares outstanding at the end of the period. 2 Based on the weighted average number of shares outstanding during the period. 3 Underlying Earnings per share is calculated as Underlying PBT less tax expense (based on the Group’s effective tax rate of 29.2 percent (2016: 27.9 percent)) divided by the weighted average number of
shares outstanding during the period (consistent with the Statutory Earnings per share calculation).
QANTAS AIRWAYS LIMITED ASX APPENDIX 4D ABN 16 009 661 901 HALF-YEAR ENDED 31 DECEMBER 2017
Page 3
Other Information continued
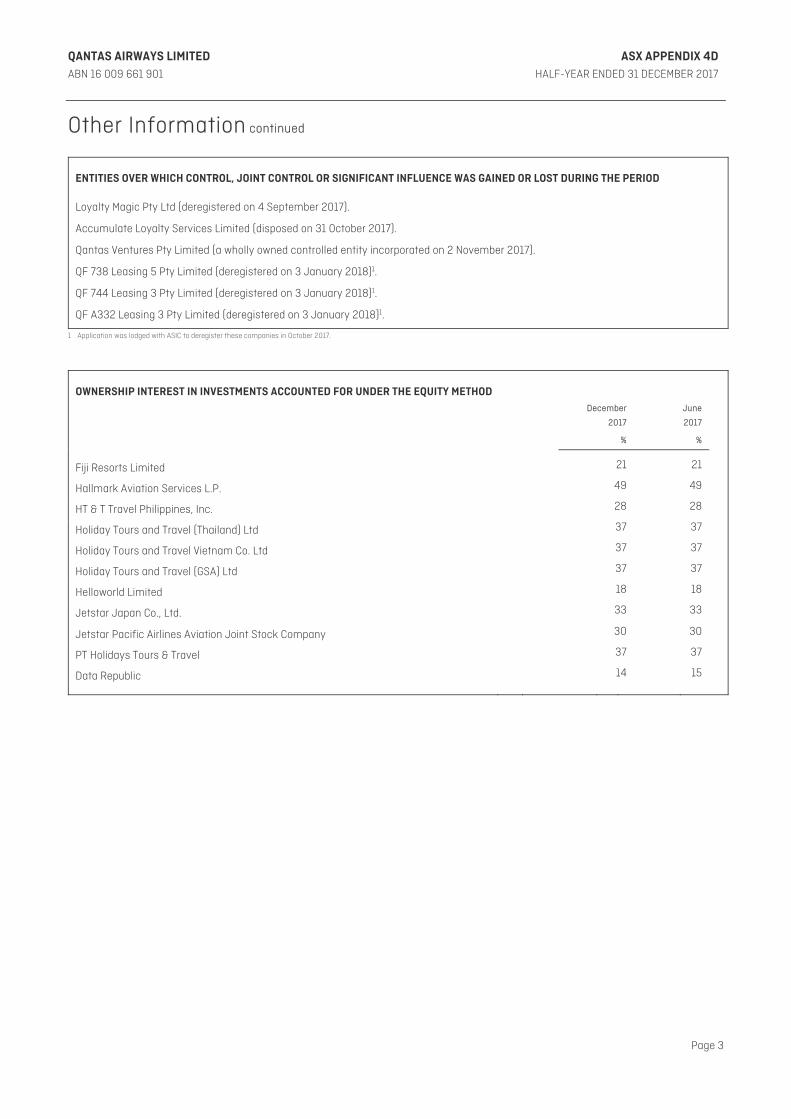
ENTITIES OVER WHICH CONTROL, JOINT CONTROL OR SIGNIFICANT INFLUENCE WAS GAINED OR LOST DURING THE PERIOD Loyalty Magic Pty Ltd (deregistered on 4 September 2017).
Accumulate Loyalty Services Limited (disposed on 31 October 2017).
Qantas Ventures Pty Limited (a wholly owned controlled entity incorporated on 2 November 2017).
QF 738 Leasing 5 Pty Limited (deregistered on 3 January 2018)1.
QF 744 Leasing 3 Pty Limited (deregistered on 3 January 2018)1.
QF A332 Leasing 3 Pty Limited (deregistered on 3 January 2018)1.
1 Application was lodged with ASIC to deregister these companies in October 2017.
OWNERSHIP INTEREST IN INVESTMENTS ACCOUNTED FOR UNDER THE EQUITY METHOD
December
2017
June
2017
% %
Fiji Resorts Limited 21 21
Hallmark Aviation Services L.P. 49 49
HT & T Travel Philippines, Inc. 28 28
Holiday Tours and Travel (Thailand) Ltd 37 37
Holiday Tours and Travel Vietnam Co. Ltd 37 37
Holiday Tours and Travel (GSA) Ltd 37 37
Helloworld Limited 18 18
Jetstar Japan Co., Ltd. 33 33
Jetstar Pacific Airlines Aviation Joint Stock Company 30 30
PT Holidays Tours & Travel 37 37
Data Republic 14 15
QANTAS AIRWAYS LIMITED DIRECTORS’ REPORT ABN 16 009 661 901 HALF-YEAR ENDED 31 DECEMBER 2017
Page 4
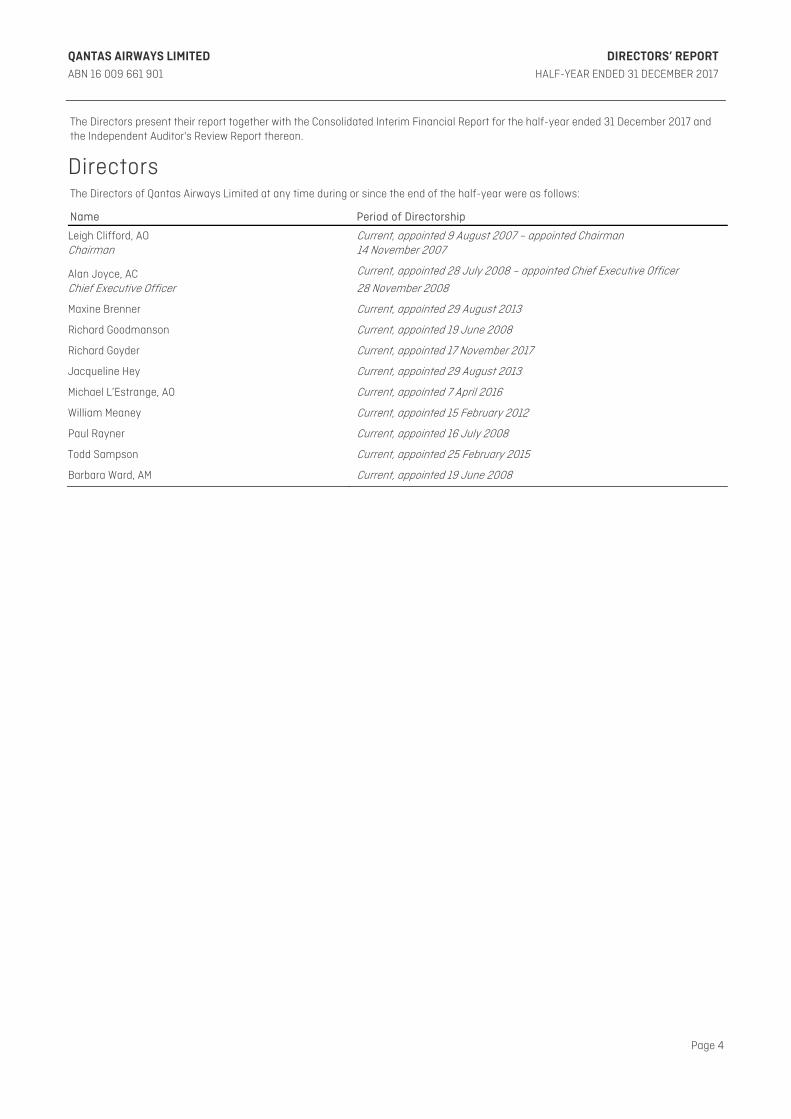
The Directors present their report together with the Consolidated Interim Financial Report for the half-year ended 31 December 2017 and the Independent Auditor's Review Report thereon.
Directors
The Directors of Qantas Airways Limited at any time during or since the end of the half-year were as follows:
Name Period of Directorship
Leigh Clifford, AO Chairman
Current, appointed 9 August 2007 – appointed Chairman 14 November 2007
Alan Joyce, AC Chief Executive Officer
Current, appointed 28 July 2008 – appointed Chief Executive Officer
28 November 2008
Maxine Brenner Current, appointed 29 August 2013
Richard Goodmanson Current, appointed 19 June 2008
Richard Goyder Current, appointed 17 November 2017
Jacqueline Hey Current, appointed 29 August 2013
Michael L’Estrange, AO Current, appointed 7 April 2016
William Meaney Current, appointed 15 February 2012
Paul Rayner Current, appointed 16 July 2008
Todd Sampson Current, appointed 25 February 2015
Barbara Ward, AM Current, appointed 19 June 2008
QANTAS AIRWAYS LIMITED DIRECTORS’ REPORT ABN 16 009 661 901 HALF-YEAR ENDED 31 DECEMBER 2017
Page 5
Review of Operations For the half-year ended 31 December 2017
RESULT HIGHLIGHTS
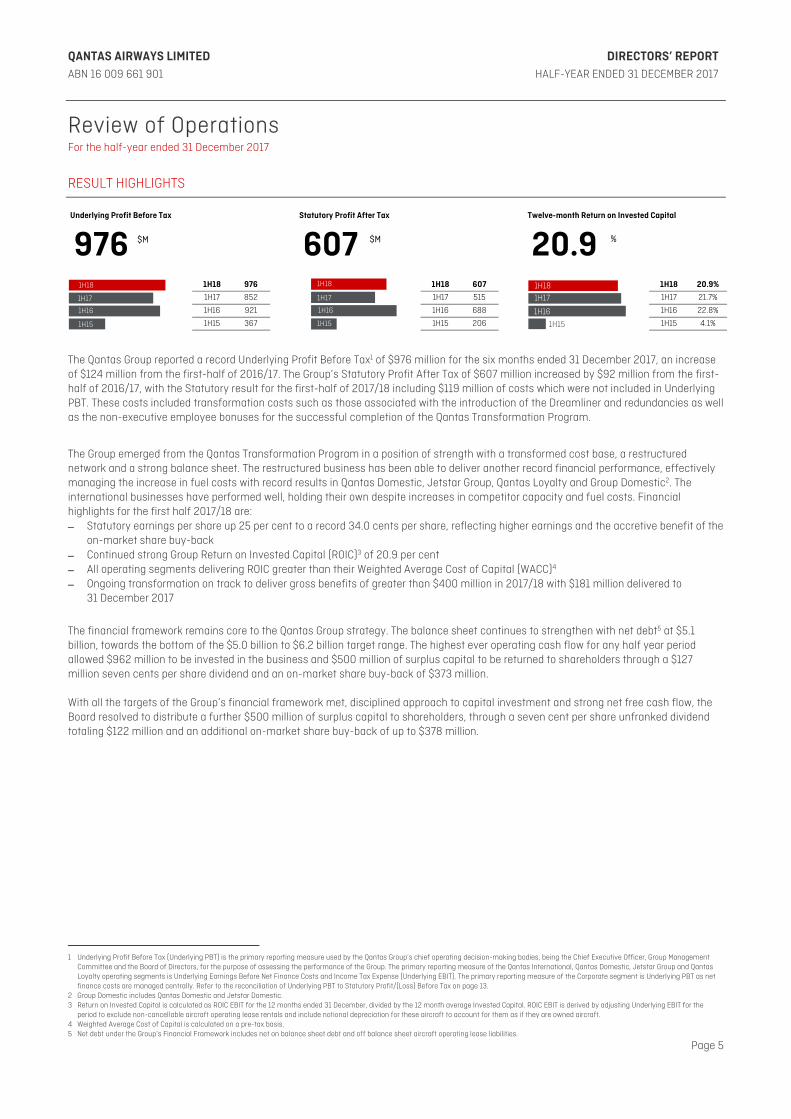
The Qantas Group reported a record Underlying Profit Before Tax1 of $976 million for the six months ended 31 December 2017, an increase of $124 million from the first-half of 2016/17. The Group’s Statutory Profit After Tax of $607 million increased by $92 million from the first-half of 2016/17, with the Statutory result for the first-half of 2017/18 including $119 million of costs which were not included in Underlying PBT. These costs included transformation costs such as those associated with the introduction of the Dreamliner and redundancies as well as the non-executive employee bonuses for the successful completion of the Qantas Transformation Program.
The Group emerged from the Qantas Transformation Program in a position of strength with a transformed cost base, a restructured network and a strong balance sheet. The restructured business has been able to deliver another record financial performance, effectively managing the increase in fuel costs with record results in Qantas Domestic, Jetstar Group, Qantas Loyalty and Group Domestic2. The international businesses have performed well, holding their own despite increases in competitor capacity and fuel costs. Financial highlights for the first half 2017/18 are: – Statutory earnings per share up 25 per cent to a record 34.0 cents per share, reflecting higher earnings and the accretive benefit of the
on-market share buy-back – Continued strong Group Return on Invested Capital (ROIC)3 of 20.9 per cent – All operating segments delivering ROIC greater than their Weighted Average Cost of Capital (WACC)4 – Ongoing transformation on track to deliver gross benefits of greater than $400 million in 2017/18 with $181 million delivered to
31 December 2017
The financial framework remains core to the Qantas Group strategy. The balance sheet continues to strengthen with net debt5 at $5.1 billion, towards the bottom of the $5.0 billion to $6.2 billion target range. The highest ever operating cash flow for any half year period allowed $962 million to be invested in the business and $500 million of surplus capital to be returned to shareholders through a $127 million seven cents per share dividend and an on-market share buy-back of $373 million. With all the targets of the Group’s financial framework met, disciplined approach to capital investment and strong net free cash flow, the Board resolved to distribute a further $500 million of surplus capital to shareholders, through a seven cent per share unfranked dividend totaling $122 million and an additional on-market share buy-back of up to $378 million.
1 Underlying Profit Before Tax (Underlying PBT) is the primary reporting measure used by the Qantas Group’s chief operating decision-making bodies, being the Chief Executive Officer, Group Management
Committee and the Board of Directors, for the purpose of assessing the performance of the Group. The primary reporting measure of the Qantas International, Qantas Domestic, Jetstar Group and Qantas Loyalty operating segments is Underlying Earnings Before Net Finance Costs and Income Tax Expense (Underlying EBIT). The primary reporting measure of the Corporate segment is Underlying PBT as net finance costs are managed centrally. Refer to the reconciliation of Underlying PBT to Statutory Profit/(Loss) Before Tax on page 13.
2 Group Domestic includes Qantas Domestic and Jetstar Domestic. 3 Return on Invested Capital is calculated as ROIC EBIT for the 12 months ended 31 December, divided by the 12 month average Invested Capital. ROIC EBIT is derived by adjusting Underlying EBIT for the
period to exclude non-cancellable aircraft operating lease rentals and include notional depreciation for these aircraft to account for them as if they are owned aircraft. 4 Weighted Average Cost of Capital is calculated on a pre-tax basis. 5 Net debt under the Group’s Financial Framework includes net on balance sheet debt and off balance sheet aircraft operating lease liabilities.
Underlying Profit Before Tax Statutory Profit After Tax Twelve-month Return on Invested Capital
1H18 976 1H18 607 1H18 20.9%
1H17 852 1H17 515 1H17 21.7%
1H16 921 1H16 688 1H16 22.8%
1H15 367 1H15 206 1H15 4.1%
607976 20.91H18
1H17
1H16
1H15
$M
1H18
1H17
1H16
1H15
%
1H18
1H17
1H16
1H15
$M
QANTAS AIRWAYS LIMITED DIRECTORS’ REPORT ABN 16 009 661 901 HALF-YEAR ENDED 31 DECEMBER 2017
Page 6
Review of Operations continued
For the half-year ended 31 December 2017
FINANCIAL FRAMEWORK ALIGNED WITH SHAREHOLDER OBJECTIVES
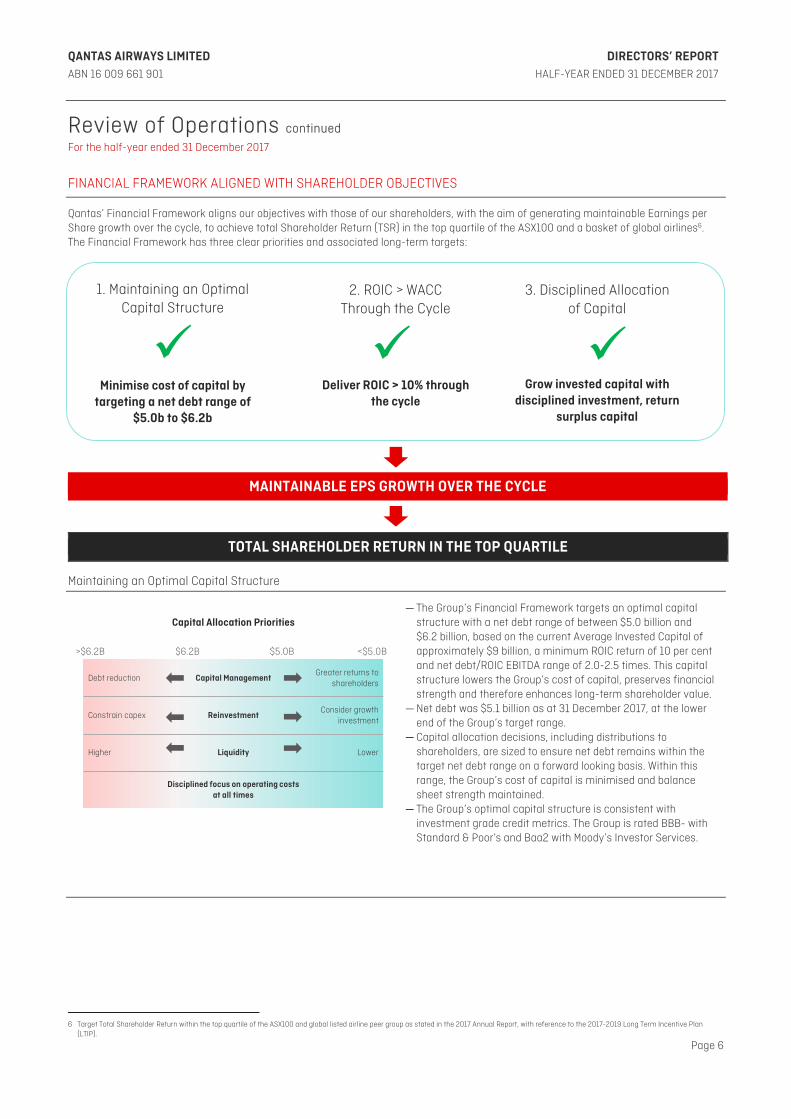
Qantas’ Financial Framework aligns our objectives with those of our shareholders, with the aim of generating maintainable Earnings per Share growth over the cycle, to achieve total Shareholder Return (TSR) in the top quartile of the ASX100 and a basket of global airlines6. The Financial Framework has three clear priorities and associated long-term targets:
MAINTAINABLE EPS GROWTH OVER THE CYCLE
TOTAL SHAREHOLDER RETURN IN THE TOP QUARTILE
Maintaining an Optimal Capital Structure
— The Group’s Financial Framework targets an optimal capital structure with a net debt range of between $5.0 billion and $6.2 billion, based on the current Average Invested Capital of approximately $9 billion, a minimum ROIC return of 10 per cent and net debt/ROIC EBITDA range of 2.0-2.5 times. This capital structure lowers the Group’s cost of capital, preserves financial strength and therefore enhances long-term shareholder value.
— Net debt was $5.1 billion as at 31 December 2017, at the lower end of the Group’s target range.
— Capital allocation decisions, including distributions to shareholders, are sized to ensure net debt remains within the target net debt range on a forward looking basis. Within this range, the Group’s cost of capital is minimised and balance sheet strength maintained.
— The Group’s optimal capital structure is consistent with investment grade credit metrics. The Group is rated BBB- with Standard & Poor’s and Baa2 with Moody’s Investor Services.
6 Target Total Shareholder Return within the top quartile of the ASX100 and global listed airline peer group as stated in the 2017 Annual Report, with reference to the 2017-2019 Long Term Incentive Plan
(LTIP).
1. Maintaining an Optimal Capital Structure
2. ROIC > WACC Through the Cycle
3. Disciplined Allocation of Capital
Minimise cost of capital by targeting a net debt range of
$5.0b to $6.2b
Deliver ROIC > 10% through the cycle
Grow invested capital with disciplined investment, return
surplus capital
Debt reduction Capital ManagementGreater returns to
shareholders
Constrain capex ReinvestmentConsider growth
investment
Higher Liquidity Lower
Disciplined focus on operating costsat all times
>$6.2B <$5.0B$5.0B$6.2B
Capital Allocation Priorities
QANTAS AIRWAYS LIMITED DIRECTORS’ REPORT ABN 16 009 661 901 HALF-YEAR ENDED 31 DECEMBER 2017
Page 7
Review of Operations continued
For the half-year ended 31 December 2017
ROIC > WACC Through the Cycle
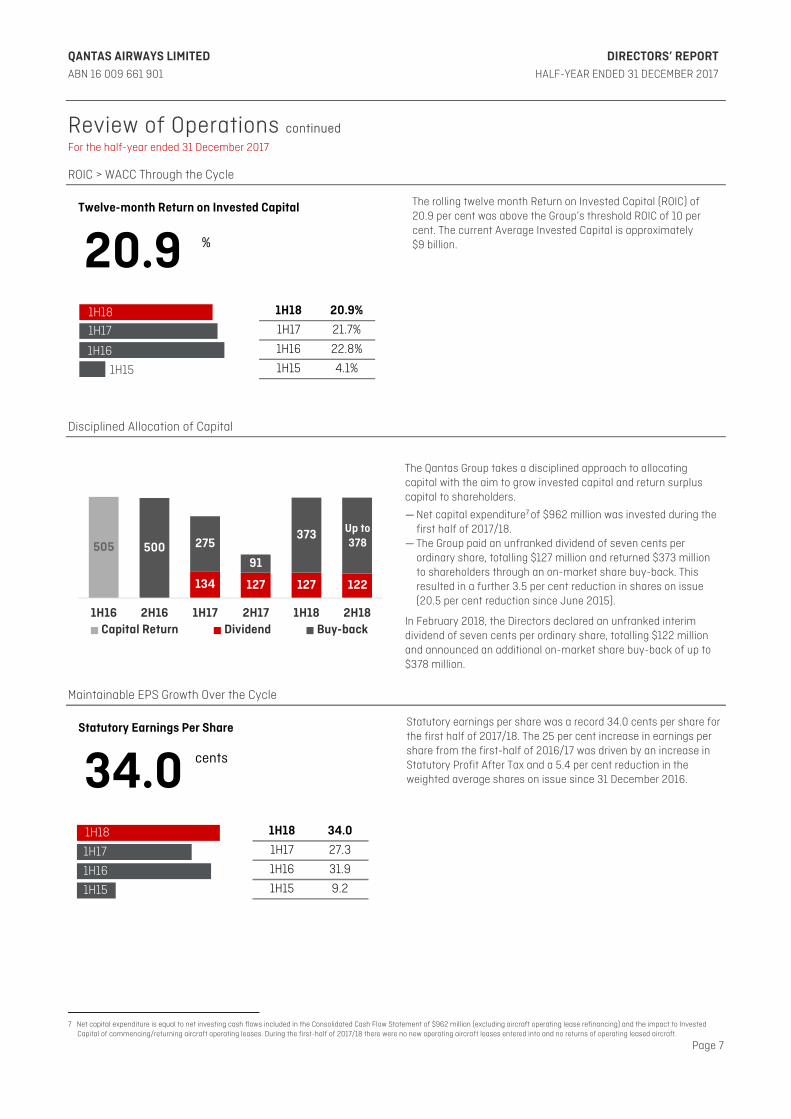
The rolling twelve month Return on Invested Capital (ROIC) of 20.9 per cent was above the Group’s threshold ROIC of 10 per cent. The current Average Invested Capital is approximately $9 billion.
Disciplined Allocation of Capital
The Qantas Group takes a disciplined approach to allocating capital with the aim to grow invested capital and return surplus capital to shareholders.
— Net capital expenditure7 of $962 million was invested during the first half of 2017/18.
— The Group paid an unfranked dividend of seven cents per ordinary share, totalling $127 million and returned $373 million to shareholders through an on-market share buy-back. This resulted in a further 3.5 per cent reduction in shares on issue (20.5 per cent reduction since June 2015).
In February 2018, the Directors declared an unfranked interim dividend of seven cents per ordinary share, totalling $122 million and announced an additional on-market share buy-back of up to $378 million.
Maintainable EPS Growth Over the Cycle
Statutory earnings per share was a record 34.0 cents per share for the first half of 2017/18. The 25 per cent increase in earnings per share from the first-half of 2016/17 was driven by an increase in Statutory Profit After Tax and a 5.4 per cent reduction in the weighted average shares on issue since 31 December 2016.
7 Net capital expenditure is equal to net investing cash flows included in the Consolidated Cash Flow Statement of $962 million (excluding aircraft operating lease refinancing) and the impact to Invested
Capital of commencing/returning aircraft operating leases. During the first-half of 2017/18 there were no new operating aircraft leases entered into and no returns of operating leased aircraft.
Twelve-month Return on Invested Capital
1H18 20.9%
1H17 21.7%
1H16 22.8%
1H15 4.1%
20.91H18
1H17
1H16
1H15
%
Statutory Earnings Per Share
1H18 34.0
1H17 27.3
1H16 31.9
1H15 9.2
34.01H18
1H17
1H16
1H15
cents
505
134 127 127
500 275
91
373
1H16 2H16 1H17 2H17 1H18 2H18Capital Return Dividend Buy-back
122
Up to 378
QANTAS AIRWAYS LIMITED DIRECTORS’ REPORT ABN 16 009 661 901 HALF-YEAR ENDED 31 DECEMBER 2017
Page 8
Review of Operations continued
For the half-year ended 31 December 2017
Underlying PBT
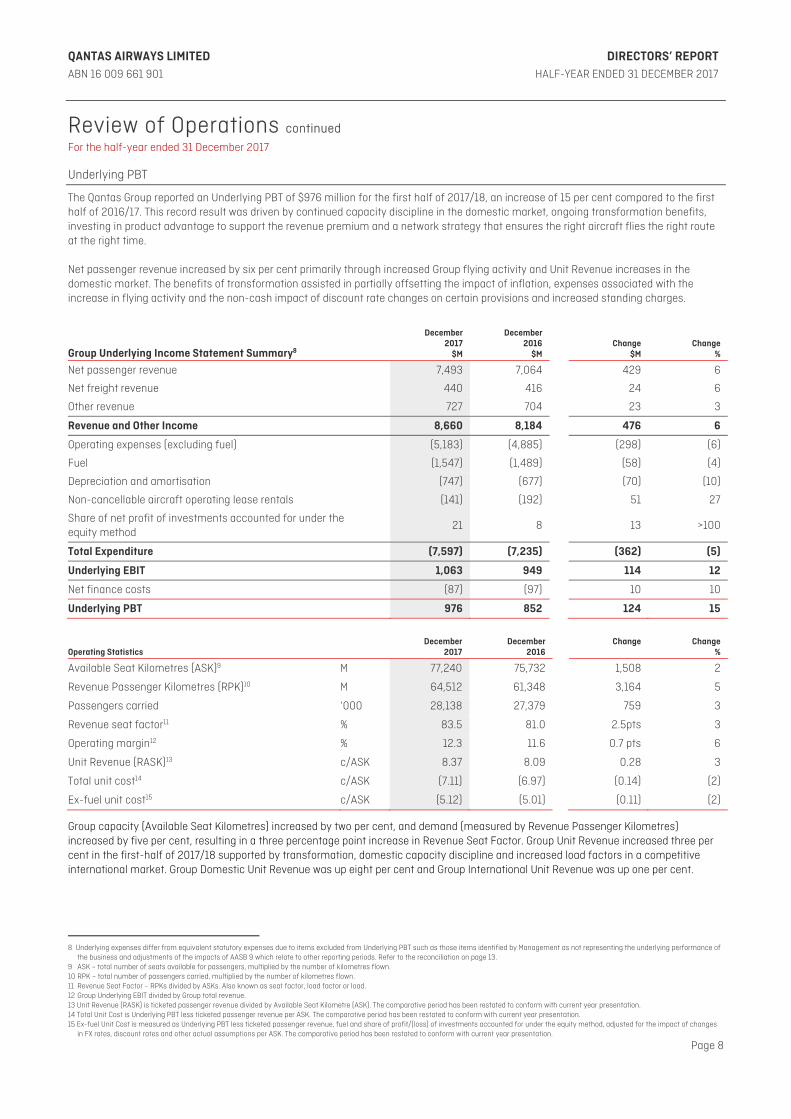
The Qantas Group reported an Underlying PBT of $976 million for the first half of 2017/18, an increase of 15 per cent compared to the first half of 2016/17. This record result was driven by continued capacity discipline in the domestic market, ongoing transformation benefits, investing in product advantage to support the revenue premium and a network strategy that ensures the right aircraft flies the right route at the right time. Net passenger revenue increased by six per cent primarily through increased Group flying activity and Unit Revenue increases in the domestic market. The benefits of transformation assisted in partially offsetting the impact of inflation, expenses associated with the increase in flying activity and the non-cash impact of discount rate changes on certain provisions and increased standing charges.
Group Underlying Income Statement Summary8
December2017
$M
December2016
$M Change
$M Change
%
Net passenger revenue 7,493 7,064 429 6
Net freight revenue 440 416 24 6
Other revenue 727 704 23 3
Revenue and Other Income 8,660 8,184 476 6
Operating expenses (excluding fuel) (5,183) (4,885) (298) (6)
Fuel (1,547) (1,489) (58) (4)
Depreciation and amortisation (747) (677) (70) (10)
Non-cancellable aircraft operating lease rentals (141) (192) 51 27
Share of net profit of investments accounted for under the equity method
21 8 13 >100
Total Expenditure (7,597) (7,235) (362) (5)
Underlying EBIT 1,063 949 114 12
Net finance costs (87) (97) 10 10
Underlying PBT 976 852 124 15
Operating Statistics December
2017 December
2016 Change
Change
%
Available Seat Kilometres (ASK)9 M 77,240 75,732 1,508 2
Revenue Passenger Kilometres (RPK)10 M 64,512 61,348 3,164 5
Passengers carried ‘000 28,138 27,379 759 3
Revenue seat factor11 % 83.5 81.0 2.5pts 3
Operating margin12 % 12.3 11.6 0.7 pts 6
Unit Revenue (RASK)13 c/ASK 8.37 8.09 0.28 3
Total unit cost14 c/ASK (7.11) (6.97) (0.14) (2)
Ex-fuel unit cost15 c/ASK (5.12) (5.01) (0.11) (2)
Group capacity (Available Seat Kilometres) increased by two per cent, and demand (measured by Revenue Passenger Kilometres) increased by five per cent, resulting in a three percentage point increase in Revenue Seat Factor. Group Unit Revenue increased three per cent in the first-half of 2017/18 supported by transformation, domestic capacity discipline and increased load factors in a competitive international market. Group Domestic Unit Revenue was up eight per cent and Group International Unit Revenue was up one per cent.
8 Underlying expenses differ from equivalent statutory expenses due to items excluded from Underlying PBT such as those items identified by Management as not representing the underlying performance of
the business and adjustments of the impacts of AASB 9 which relate to other reporting periods. Refer to the reconciliation on page 13. 9 ASK – total number of seats available for passengers, multiplied by the number of kilometres flown. 10 RPK – total number of passengers carried, multiplied by the number of kilometres flown. 11 Revenue Seat Factor – RPKs divided by ASKs. Also known as seat factor, load factor or load. 12 Group Underlying EBIT divided by Group total revenue. 13 Unit Revenue (RASK) is ticketed passenger revenue divided by Available Seat Kilometre (ASK). The comparative period has been restated to conform with current year presentation. 14 Total Unit Cost is Underlying PBT less ticketed passenger revenue per ASK. The comparative period has been restated to conform with current year presentation. 15 Ex-fuel Unit Cost is measured as Underlying PBT less ticketed passenger revenue, fuel and share of profit/(loss) of investments accounted for under the equity method, adjusted for the impact of changes
in FX rates, discount rates and other actual assumptions per ASK. The comparative period has been restated to conform with current year presentation.
QANTAS AIRWAYS LIMITED DIRECTORS’ REPORT ABN 16 009 661 901 HALF-YEAR ENDED 31 DECEMBER 2017
Page 9
Review of Operations continued
For the half-year ended 31 December 2017
CASH GENERATION
Cash Flow Summary
December 2017
$M
December 2016
$M Change
$M Change
%
Operating cash flows 1,734 1,173 561 48
Investing cash flows (excluding aircraft operating lease refinancing)
(962) (885) (77) (9)
Net free cash flow 772 288 484 >100
Aircraft operating lease refinancing (153) (327) 174 53
Financing cash flows (606) (271) (335) (>100)
Cash at beginning of year 1,775 1,980 (205) (10)
Effect of foreign exchange on cash (1) (2) 1 50
Cash at end of year 1,787 1,668 119 7
Debt Analysis
December 2017
$M
June 2017
$M Change
$M Change
%
Net on balance sheet debt16 3,094 3,062 32 1
Capitalised operating lease liabilities17 1,970 2,150 (180) (8)
Net debt18 5,064 5,212 (148) (3)
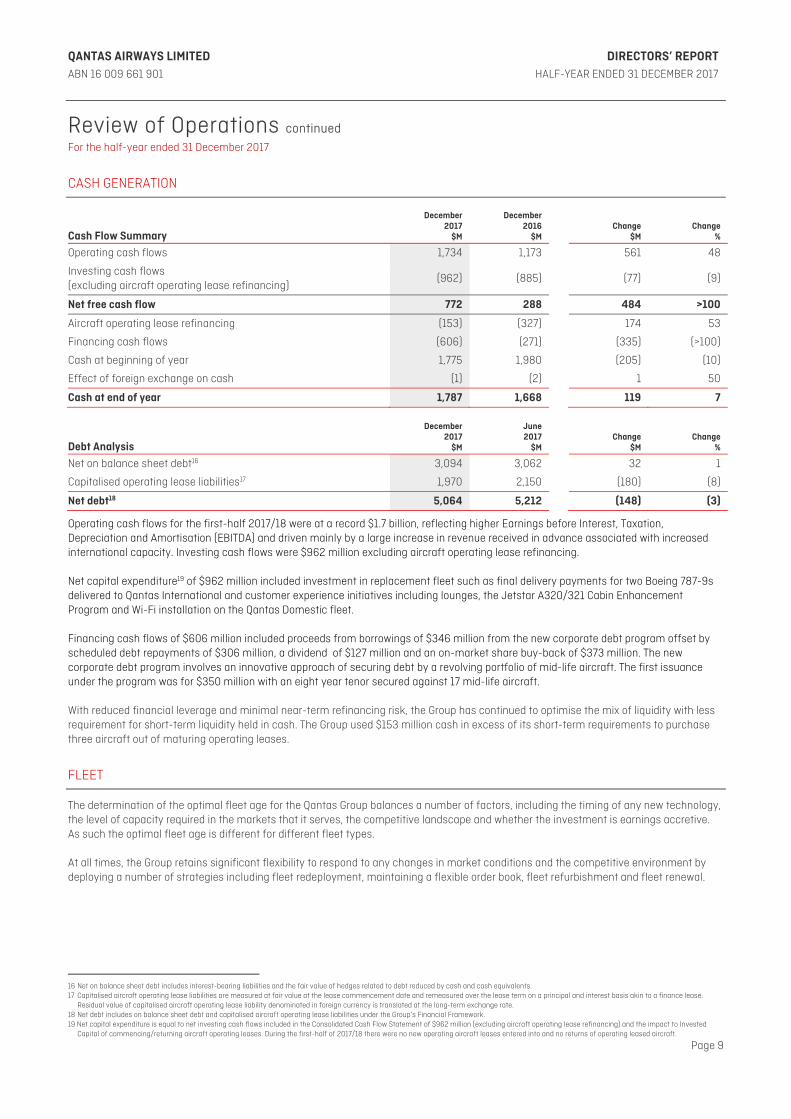
Operating cash flows for the first-half 2017/18 were at a record $1.7 billion, reflecting higher Earnings before Interest, Taxation, Depreciation and Amortisation (EBITDA) and driven mainly by a large increase in revenue received in advance associated with increased international capacity. Investing cash flows were $962 million excluding aircraft operating lease refinancing. Net capital expenditure19 of $962 million included investment in replacement fleet such as final delivery payments for two Boeing 787-9s delivered to Qantas International and customer experience initiatives including lounges, the Jetstar A320/321 Cabin Enhancement Program and Wi-Fi installation on the Qantas Domestic fleet. Financing cash flows of $606 million included proceeds from borrowings of $346 million from the new corporate debt program offset by scheduled debt repayments of $306 million, a dividend of $127 million and an on-market share buy-back of $373 million. The new corporate debt program involves an innovative approach of securing debt by a revolving portfolio of mid-life aircraft. The first issuance under the program was for $350 million with an eight year tenor secured against 17 mid-life aircraft. With reduced financial leverage and minimal near-term refinancing risk, the Group has continued to optimise the mix of liquidity with less requirement for short-term liquidity held in cash. The Group used $153 million cash in excess of its short-term requirements to purchase three aircraft out of maturing operating leases.
FLEET
The determination of the optimal fleet age for the Qantas Group balances a number of factors, including the timing of any new technology, the level of capacity required in the markets that it serves, the competitive landscape and whether the investment is earnings accretive. As such the optimal fleet age is different for different fleet types. At all times, the Group retains significant flexibility to respond to any changes in market conditions and the competitive environment by deploying a number of strategies including fleet redeployment, maintaining a flexible order book, fleet refurbishment and fleet renewal.
16 Net on balance sheet debt includes interest-bearing liabilities and the fair value of hedges related to debt reduced by cash and cash equivalents. 17 Capitalised aircraft operating lease liabilities are measured at fair value at the lease commencement date and remeasured over the lease term on a principal and interest basis akin to a finance lease.
Residual value of capitalised aircraft operating lease liability denominated in foreign currency is translated at the long-term exchange rate. 18 Net debt includes on balance sheet debt and capitalised aircraft operating lease liabilities under the Group’s Financial Framework. 19 Net capital expenditure is equal to net investing cash flows included in the Consolidated Cash Flow Statement of $962 million (excluding aircraft operating lease refinancing) and the impact to Invested
Capital of commencing/returning aircraft operating leases. During the first-half of 2017/18 there were no new operating aircraft leases entered into and no returns of operating leased aircraft.
QANTAS AIRWAYS LIMITED DIRECTORS’ REPORT ABN 16 009 661 901 HALF-YEAR ENDED 31 DECEMBER 2017
Page 10
Review of Operations continued
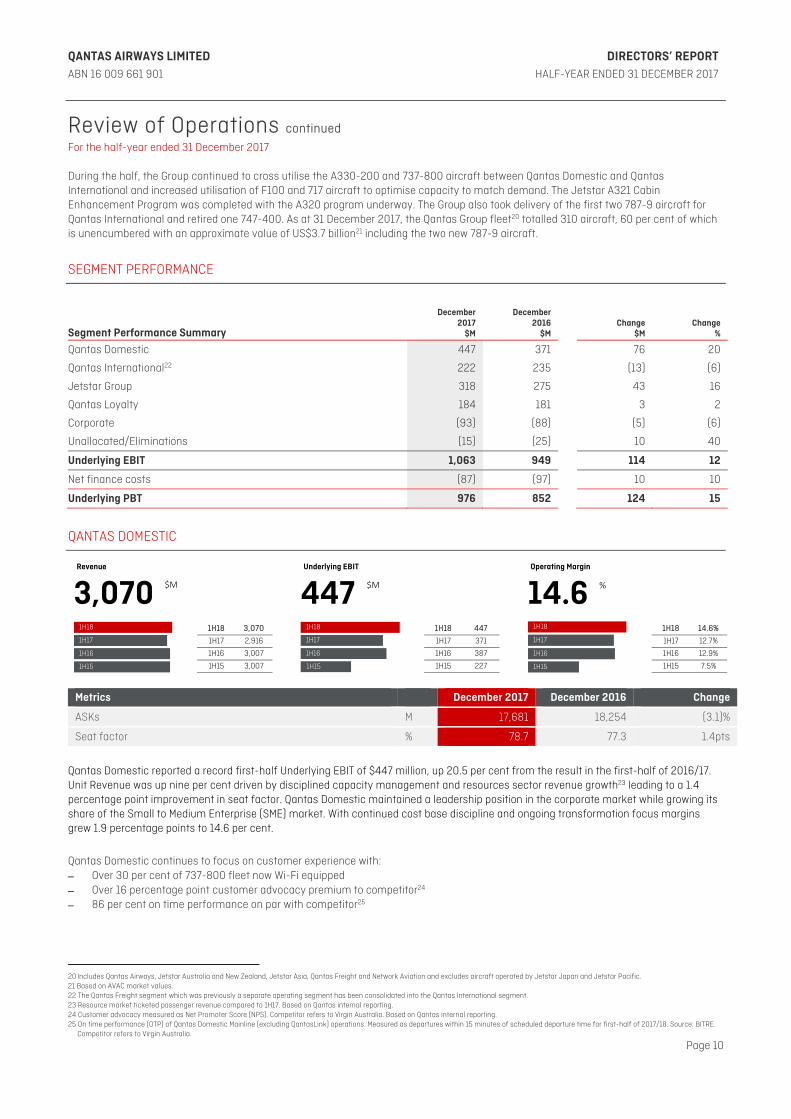
For the half-year ended 31 December 2017 During the half, the Group continued to cross utilise the A330-200 and 737-800 aircraft between Qantas Domestic and Qantas International and increased utilisation of F100 and 717 aircraft to optimise capacity to match demand. The Jetstar A321 Cabin Enhancement Program was completed with the A320 program underway. The Group also took delivery of the first two 787-9 aircraft for Qantas International and retired one 747-400. As at 31 December 2017, the Qantas Group fleet20 totalled 310 aircraft, 60 per cent of which is unencumbered with an approximate value of US$3.7 billion21 including the two new 787-9 aircraft.
SEGMENT PERFORMANCE
Segment Performance Summary
December 2017
$M
December 2016
$M
Change $M
Change%
Qantas Domestic 447 371 76 20
Qantas International22 222 235 (13) (6)
Jetstar Group 318 275 43 16
Qantas Loyalty 184 181 3 2
Corporate (93) (88) (5) (6)
Unallocated/Eliminations (15) (25) 10 40
Underlying EBIT 1,063 949 114 12
Net finance costs (87) (97) 10 10
Underlying PBT 976 852 124 15
QANTAS DOMESTIC
Metrics December 2017 December 2016 Change
ASKs M 17,681 18,254 (3.1)%
Seat factor % 78.7 77.3 1.4pts
Qantas Domestic reported a record first-half Underlying EBIT of $447 million, up 20.5 per cent from the result in the first-half of 2016/17. Unit Revenue was up nine per cent driven by disciplined capacity management and resources sector revenue growth23 leading to a 1.4 percentage point improvement in seat factor. Qantas Domestic maintained a leadership position in the corporate market while growing its share of the Small to Medium Enterprise (SME) market. With continued cost base discipline and ongoing transformation focus margins grew 1.9 percentage points to 14.6 per cent.
Qantas Domestic continues to focus on customer experience with: – Over 30 per cent of 737-800 fleet now Wi-Fi equipped – Over 16 percentage point customer advocacy premium to competitor24 – 86 per cent on time performance on par with competitor25
20 Includes Qantas Airways, Jetstar Australia and New Zealand, Jetstar Asia, Qantas Freight and Network Aviation and excludes aircraft operated by Jetstar Japan and Jetstar Pacific. 21 Based on AVAC market values. 22 The Qantas Freight segment which was previously a separate operating segment has been consolidated into the Qantas International segment. 23 Resource market ticketed passenger revenue compared to 1H17. Based on Qantas internal reporting. 24 Customer advocacy measured as Net Promoter Score (NPS). Competitor refers to Virgin Australia. Based on Qantas internal reporting. 25 On time performance (OTP) of Qantas Domestic Mainline (excluding QantasLink) operations. Measured as departures within 15 minutes of scheduled departure time for first-half of 2017/18. Source: BITRE.
Competitor refers to Virgin Australia.
Revenue Underlying EBIT Operating Margin
1H18 3,070 1H18 447 1H18 14.6%
1H17 2,916 1H17 371 1H17 12.7%
1H16 3,007 1H16 387 1H16 12.9%
1H15 3,007 1H15 227 1H15 7.5%
447 14.63,070 $M $M
1H18
1H17
1H16
1H15
1H18
1H17
1H16
1H15
1H18
1H17
1H16
1H15
%
QANTAS AIRWAYS LIMITED DIRECTORS’ REPORT ABN 16 009 661 901 HALF-YEAR ENDED 31 DECEMBER 2017
Page 11
Review of Operations continued
For the half-year ended 31 December 2017
QANTAS INTERNATIONAL
Metrics December 2017 December 2016 Change
ASKs M 34,714 32,756 6.0%
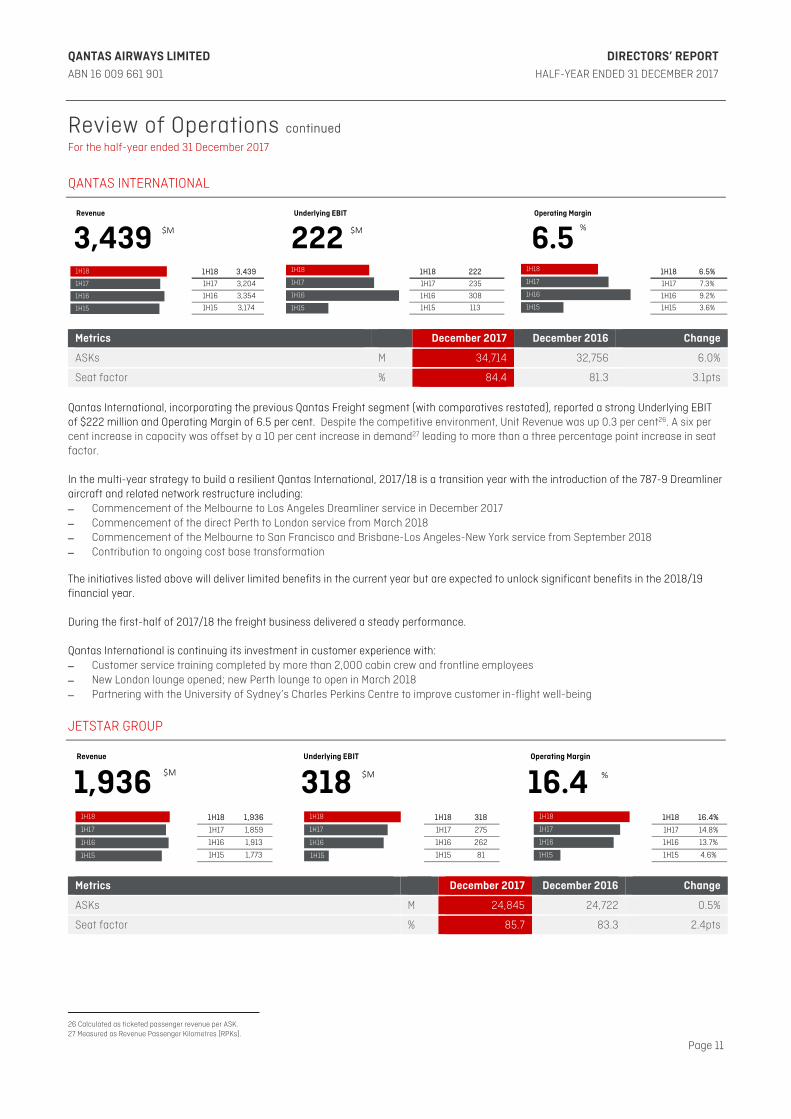
Seat factor % 84.4 81.3 3.1pts Qantas International, incorporating the previous Qantas Freight segment (with comparatives restated), reported a strong Underlying EBIT of $222 million and Operating Margin of 6.5 per cent. Despite the competitive environment, Unit Revenue was up 0.3 per cent26. A six per cent increase in capacity was offset by a 10 per cent increase in demand27 leading to more than a three percentage point increase in seat factor. In the multi-year strategy to build a resilient Qantas International, 2017/18 is a transition year with the introduction of the 787-9 Dreamliner aircraft and related network restructure including: – Commencement of the Melbourne to Los Angeles Dreamliner service in December 2017 – Commencement of the direct Perth to London service from March 2018 – Commencement of the Melbourne to San Francisco and Brisbane-Los Angeles-New York service from September 2018 – Contribution to ongoing cost base transformation The initiatives listed above will deliver limited benefits in the current year but are expected to unlock significant benefits in the 2018/19 financial year. During the first-half of 2017/18 the freight business delivered a steady performance. Qantas International is continuing its investment in customer experience with: – Customer service training completed by more than 2,000 cabin crew and frontline employees – New London lounge opened; new Perth lounge to open in March 2018 – Partnering with the University of Sydney’s Charles Perkins Centre to improve customer in-flight well-being
JETSTAR GROUP
Metrics December 2017 December 2016 Change
ASKs M 24,845 24,722 0.5%
Seat factor % 85.7 83.3 2.4pts
26 Calculated as ticketed passenger revenue per ASK. 27 Measured as Revenue Passenger Kilometres (RPKs).
Revenue Underlying EBIT Operating Margin
1H18 3,439 1H18 222 1H18 6.5%
1H17 3,204 1H17 235 1H17 7.3%
1H16 3,354 1H16 308 1H16 9.2%
1H15 3,174 1H15 113 1H15 3.6%
3,439 222 6.51H18
1H17
1H16
1H15
$M $M
1H18
1H17
1H16
1H15
1H18
1H17
1H16
1H15
%
Revenue Underlying EBIT Operating Margin
1H18 1,936 1H18 318 1H18 16.4%
1H17 1,859 1H17 275 1H17 14.8%
1H16 1,913 1H16 262 1H16 13.7%
1H15 1,773 1H15 81 1H15 4.6%
16.41,936 318$M $M
1H18
1H17
1H16
1H15
1H18
1H17
1H16
1H15
1H18
1H17
1H16
1H15
%
QANTAS AIRWAYS LIMITED DIRECTORS’ REPORT ABN 16 009 661 901 HALF-YEAR ENDED 31 DECEMBER 2017
Page 12
Review of Operations continued
For the half-year ended 31 December 2017 Jetstar Group reported a record half-year Underlying EBIT of $318 million, up 15.6 per cent from the result in first-half of 2016/17. Jetstar Domestic achieved a record Underlying EBIT result driven primarily by a seven per cent increase in Unit Revenue, as improved demand and disciplined capacity management in the domestic market led to an improvement in Revenue Seat Factor. Jetstar’s international operations delivered strong earnings despite the impact of the Bali volcanic eruption. In the half, Jetstar’s Asian airline portfolio was profitable. Jetstar Japan maintained its leadership position28 in the low cost carrier market. As part of the strategy to align Jetstar’s growth with Asia, the network continues to grow with nearly 100 services per week29 into China and its territories as well as growth into Bali and Vietnam. Jetstar continues to invest in digital transformation, operational improvements and customer experience. Key highlights are: – Roll out of the next phase of service training for more than 3,000 team members – Completion of the cabin enhancement program for the A321 aircraft with the A320 aircraft retrofit currently underway – Club Jetstar continued to grow with more than 195,000 members30 – Launch of new and innovative payment options
QANTAS LOYALTY
Metrics December 2017 December 2016 Change
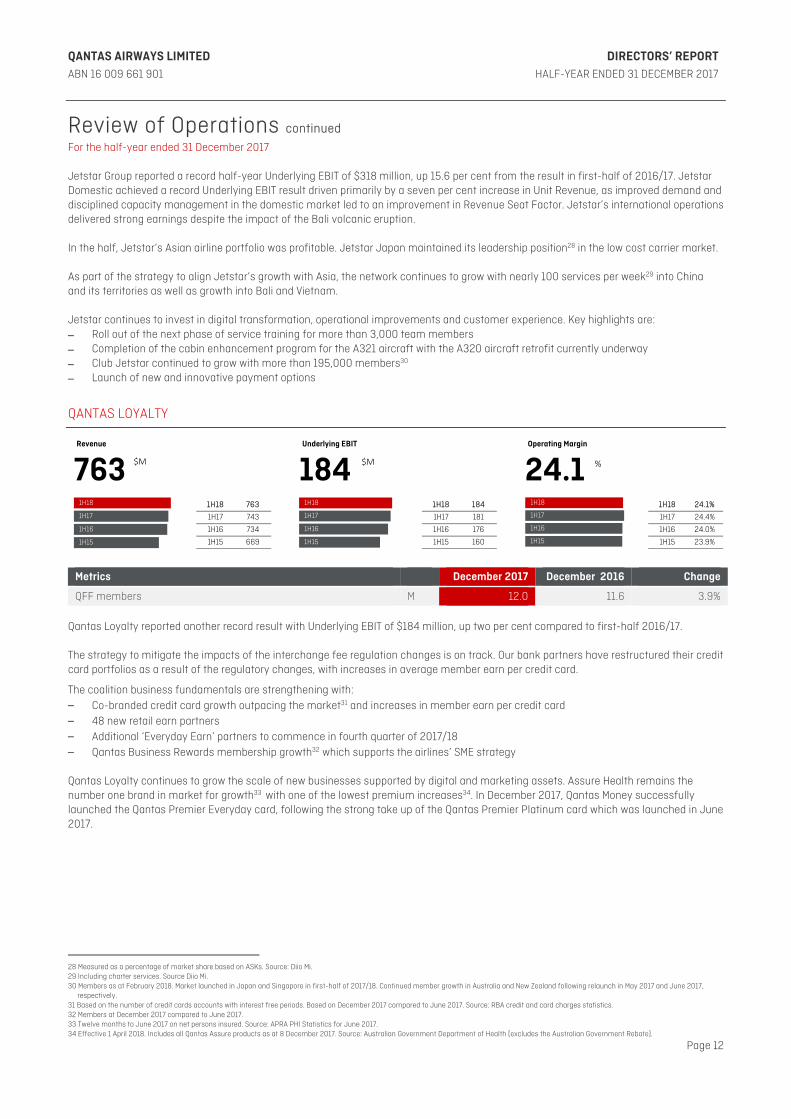
QFF members M 12.0 11.6 3.9% Qantas Loyalty reported another record result with Underlying EBIT of $184 million, up two per cent compared to first-half 2016/17. The strategy to mitigate the impacts of the interchange fee regulation changes is on track. Our bank partners have restructured their credit card portfolios as a result of the regulatory changes, with increases in average member earn per credit card.
The coalition business fundamentals are strengthening with: – Co-branded credit card growth outpacing the market31 and increases in member earn per credit card – 48 new retail earn partners – Additional ‘Everyday Earn’ partners to commence in fourth quarter of 2017/18 – Qantas Business Rewards membership growth32 which supports the airlines’ SME strategy Qantas Loyalty continues to grow the scale of new businesses supported by digital and marketing assets. Assure Health remains the number one brand in market for growth33 with one of the lowest premium increases34. In December 2017, Qantas Money successfully launched the Qantas Premier Everyday card, following the strong take up of the Qantas Premier Platinum card which was launched in June 2017.
28 Measured as a percentage of market share based on ASKs. Source: Diio Mi. 29 Including charter services. Source Diio Mi. 30 Members as at February 2018. Market launched in Japan and Singapore in first-half of 2017/18. Continued member growth in Australia and New Zealand following relaunch in May 2017 and June 2017,
respectively. 31 Based on the number of credit cards accounts with interest free periods. Based on December 2017 compared to June 2017. Source: RBA credit and card charges statistics. 32 Members at December 2017 compared to June 2017. 33 Twelve months to June 2017 on net persons insured. Source: APRA PHI Statistics for June 2017. 34 Effective 1 April 2018. Includes all Qantas Assure products as at 8 December 2017. Source: Australian Government Department of Health (excludes the Australian Government Rebate).
Revenue Underlying EBIT Operating Margin
1H18 763 1H18 184 1H18 24.1%
1H17 743 1H17 181 1H17 24.4%
1H16 734 1H16 176 1H16 24.0%
1H15 669 1H15 160 1H15 23.9%
24.1763 184$M $M
1H18
1H17
1H16
1H15
1H18
1H17
1H16
1H15
1H18
1H17
1H16
1H15
%
QANTAS AIRWAYS LIMITED DIRECTORS’ REPORT ABN 16 009 661 901 HALF-YEAR ENDED 31 DECEMBER 2017
Page 13
Review of Operations continued
For the half-year ended 31 December 2017
RECONCILIATION OF UNDERLYING PBT TO STATUTORY PROFIT BEFORE TAX
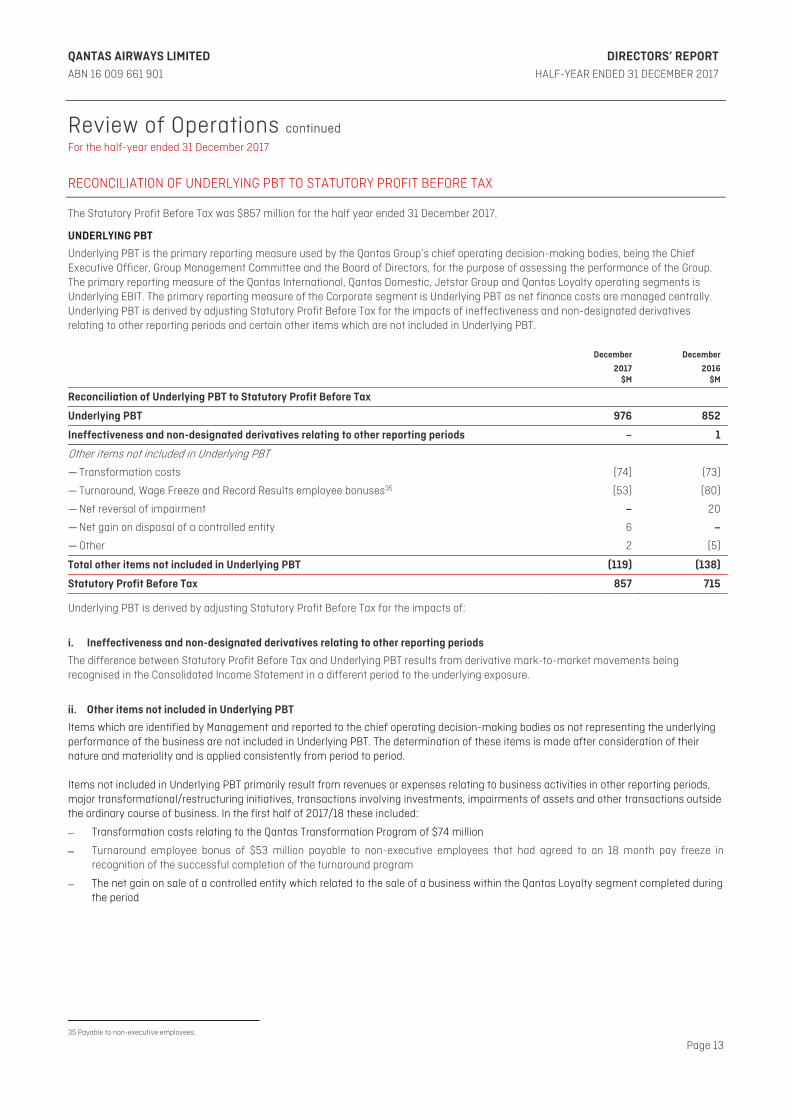
The Statutory Profit Before Tax was $857 million for the half year ended 31 December 2017.
UNDERLYING PBT
Underlying PBT is the primary reporting measure used by the Qantas Group’s chief operating decision-making bodies, being the Chief Executive Officer, Group Management Committee and the Board of Directors, for the purpose of assessing the performance of the Group. The primary reporting measure of the Qantas International, Qantas Domestic, Jetstar Group and Qantas Loyalty operating segments is Underlying EBIT. The primary reporting measure of the Corporate segment is Underlying PBT as net finance costs are managed centrally. Underlying PBT is derived by adjusting Statutory Profit Before Tax for the impacts of ineffectiveness and non-designated derivatives relating to other reporting periods and certain other items which are not included in Underlying PBT.
December
2017 $M
December
2016$M
Reconciliation of Underlying PBT to Statutory Profit Before Tax
Underlying PBT 976 852
Ineffectiveness and non-designated derivatives relating to other reporting periods – 1
Other items not included in Underlying PBT
— Transformation costs (74) (73)
— Turnaround, Wage Freeze and Record Results employee bonuses35 (53) (80)
— Net reversal of impairment – 20
— Net gain on disposal of a controlled entity 6 –
— Other 2 (5)
Total other items not included in Underlying PBT (119) (138)
Statutory Profit Before Tax 857 715
Underlying PBT is derived by adjusting Statutory Profit Before Tax for the impacts of:
i. Ineffectiveness and non-designated derivatives relating to other reporting periods
The difference between Statutory Profit Before Tax and Underlying PBT results from derivative mark-to-market movements being recognised in the Consolidated Income Statement in a different period to the underlying exposure.
ii. Other items not included in Underlying PBT
Items which are identified by Management and reported to the chief operating decision-making bodies as not representing the underlying performance of the business are not included in Underlying PBT. The determination of these items is made after consideration of their nature and materiality and is applied consistently from period to period. Items not included in Underlying PBT primarily result from revenues or expenses relating to business activities in other reporting periods, major transformational/restructuring initiatives, transactions involving investments, impairments of assets and other transactions outside the ordinary course of business. In the first half of 2017/18 these included:
– Transformation costs relating to the Qantas Transformation Program of $74 million
– Turnaround employee bonus of $53 million payable to non-executive employees that had agreed to an 18 month pay freeze in recognition of the successful completion of the turnaround program
– The net gain on sale of a controlled entity which related to the sale of a business within the Qantas Loyalty segment completed during the period
35 Payable to non-executive employees.
QANTAS AIRWAYS LIMITED DIRECTORS’ REPORT ABN 16 009 661 901 HALF-YEAR ENDED 31 DECEMBER 2017
Page 14
Review of Operations continued
For the half-year ended 31 December 2017
MATERIAL BUSINESS RISKS
The aviation industry is subject to a number of inherent risks. These include, but are not limited to, exposure to changes in economic conditions, changes in government regulations, fuel and foreign exchange volatility and other exogenous events such as aviation incidents, natural disasters, conflict or an epidemic. Qantas is subject to a number of specific business risks which may impact the achievement of the Group's strategy and financial prospects. The Group’s focus is on continuously improving the controls to manage or mitigate these risks.
— Competitive intensity: Market capacity growth ahead of underlying demand impacts industry profitability.
• Australia's liberal aviation policy settings coupled with the strength of the Australian economy relative to global economic weakness in recent years has attracted more offshore competitors to the Australian international aviation market, predominantly state-sponsored airlines. Qantas remains focused on building a resilient and sustainable business through transformation, key strategic airline partnerships with strong global partners and optimising its network through the right aircraft on the right routes. Qantas brings domestic strength and the unrivalled customer offering of Qantas Loyalty.
• The Australian domestic aviation market is highly competitive. The Qantas Group's market leading domestic position and dual brand strategy allow Qantas to effectively mitigate the impact of any market changes. This strategy leverages Qantas Domestic (including QantasLink) to serve business and premium leisure customers and Jetstar to serve price-sensitive customers. Qantas Domestic continues to focus on managing its cost base through sustainable transformation initiatives as well as maintaining a revenue premium through investing in customer experience and network. Jetstar is working to maintain its lowest seat cost and yield advantage. These priorities result in Qantas Domestic and Jetstar Domestic delivering their highest Underlying EBITs in their respective markets as well as operating margin improvement.
— Fuel and foreign exchange volatility: The Qantas Group is subject to fuel and foreign exchange risks. These risks are an inherent part of the operations of an airline. The Qantas Group manages these risks through a comprehensive hedging program. For 2017/18, the Group's hedging profile is positioned such that the expected total fuel cost is $3.24 billion36 with a 20 per cent participation rate37 to lower fuel prices. Together with the hedging program, an increased focus on forecasting and operational agility of our aviation operations supports the Group to manage the residual uncertainty.
— Cyber security and privacy regulation: The cyber security and privacy regulatory environment is continuing to evolve. Qantas remains
focused on further strengthening its governance, processes and technology controls to continue to protect the integrity and privacy of data, and maintain compliance with regulatory requirements. The Qantas Group's ongoing investment in cyber transformation initiatives, together with its extensive Control and Risk Framework38 operate to reduce the impact of cyber security incidents, ensuring early detection and effective mitigating activities.
— Key business partners and alliances: The Qantas Group has relationships with a number of key business partners. Strong and
established governance structures mitigate any potential exposures as a result of these partnerships. — Climate change: The Qantas Group is subject to short and long-term climate-related physical, regulatory and transition risks. These
risks are an inherent part of the operations of an airline and are managed by strengthening governance, technology, operational and market-based controls, including proactive consideration of how changing factors (including global climate policies and physical trends) impact the proximity of climate-related risks.
36 As at 15 February 2018, the expected fuel cost for the remainder of financial year 2017/18 assume that the long-term correlation between oil prices and the AUD/USD exchanges rates hold. Actual fuel
costs for 2017/18 could be impacted by a breakdown in this assumed correlation or by increases in refiner margins. 37 As at 15 February 2018, participation from current market Brent prices down to A$76/bbl for remainder of 2017/18. 38 An overview of the Group Risk Management Framework is contained in the Qantas Group Business Practices Document available on www.qantas.com.au.
QANTAS AIRWAYS LIMITED DIRECTORS’ REPORT ABN 16 009 661 901 HALF-YEAR ENDED 31 DECEMBER 2017
Page 15
LEAD AUDITOR'S INDEPENDENCE DECLARATION UNDER SECTION 307C OF THE CORPORATIONS ACT 2001 The Directors have received the Lead Auditor's Independence Declaration under section 307C of the Corporations Act 2001. The Lead Auditor's Independence Declaration is set out on page 31 and forms part of the Directors' Report for the half-year ended 31 December 2017. ROUNDING Qantas is a company of the kind referred to in ASIC Corporations (Rounding in Financial/Directors’ Reports) Instrument 2016/191. In accordance with that Instrument, all financial information presented has been rounded to the nearest million dollars, unless otherwise stated. ASIC GUIDANCE In December 2011 ASIC issued Regulatory Guide 230. To comply with this Guide, Qantas is required to make a clear statement about whether information disclosed in documents other than the financial report has been audited or reviewed in accordance with Australian Auditing Standards. In line with previous years and in accordance with the Corporations Act 2001, the Directors’ Report is unaudited. Notwithstanding this, the Directors’ Report (including the Review of Operations) contains disclosures which are extracted or derived from the Consolidated Interim Financial Report for the half-year ended 31 December 2017 which has been reviewed by the Group’s Independent Auditor. Signed pursuant to a Resolution of the Directors:
LEIGH CLIFFORD, AO Chairman
ALAN JOYCE, AC Chief Executive Officer Sydney 22 February 2018
QANTAS AIRWAYS LIMITED CONSOLIDATED INTERIM FINANCIAL REPORT ABN 16 009 661 901 HALF-YEAR ENDED 31 DECEMBER 2017
Page 16
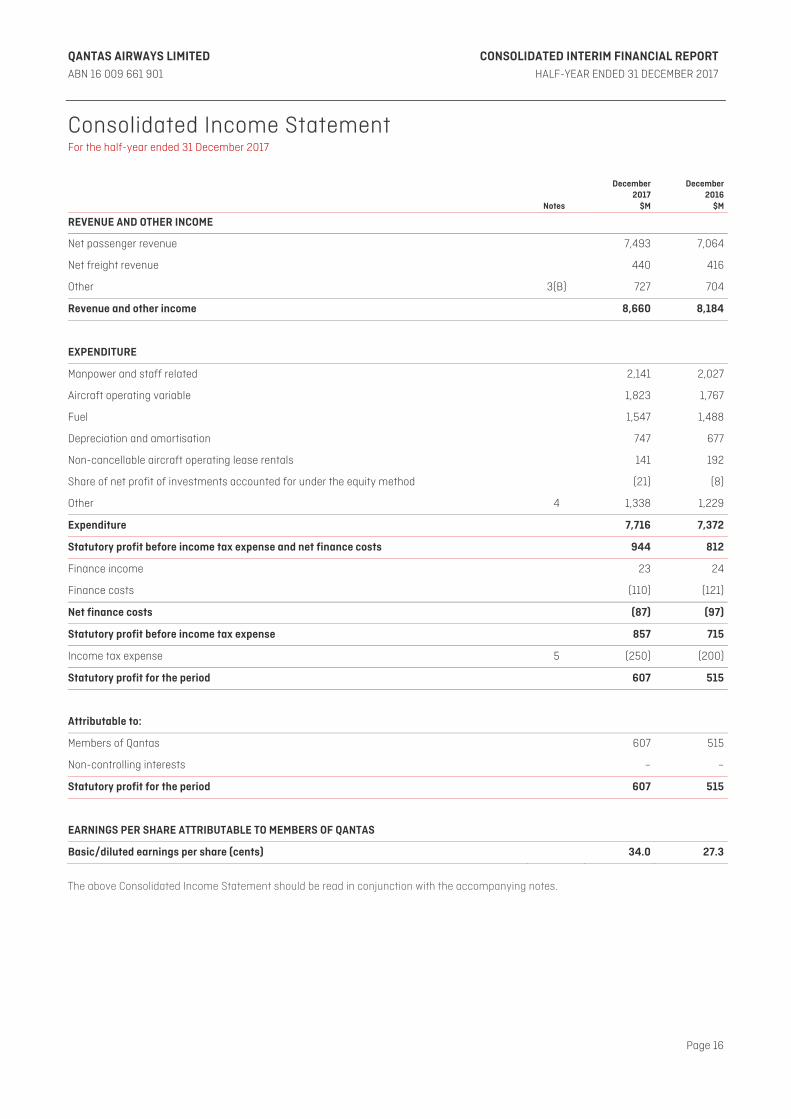
Consolidated Income Statement For the half-year ended 31 December 2017
Notes
December 2017
$M
December 2016
$M
REVENUE AND OTHER INCOME
Net passenger revenue 7,493 7,064
Net freight revenue 440 416
Other 3(B) 727 704
Revenue and other income 8,660 8,184
EXPENDITURE
Manpower and staff related 2,141 2,027
Aircraft operating variable 1,823 1,767
Fuel 1,547 1,488
Depreciation and amortisation 747 677
Non-cancellable aircraft operating lease rentals 141 192
Share of net profit of investments accounted for under the equity method (21) (8)
Other 4 1,338 1,229
Expenditure 7,716 7,372
Statutory profit before income tax expense and net finance costs 944 812
Finance income 23 24
Finance costs (110) (121)
Net finance costs (87) (97)
Statutory profit before income tax expense 857 715
Income tax expense 5 (250) (200)
Statutory profit for the period 607 515
Attributable to:
Members of Qantas 607 515
Non-controlling interests – –
Statutory profit for the period 607 515
EARNINGS PER SHARE ATTRIBUTABLE TO MEMBERS OF QANTAS
Basic/diluted earnings per share (cents) 34.0 27.3
The above Consolidated Income Statement should be read in conjunction with the accompanying notes.
QANTAS AIRWAYS LIMITED CONSOLIDATED INTERIM FINANCIAL REPORT ABN 16 009 661 901 HALF-YEAR ENDED 31 DECEMBER 2017
Page 17
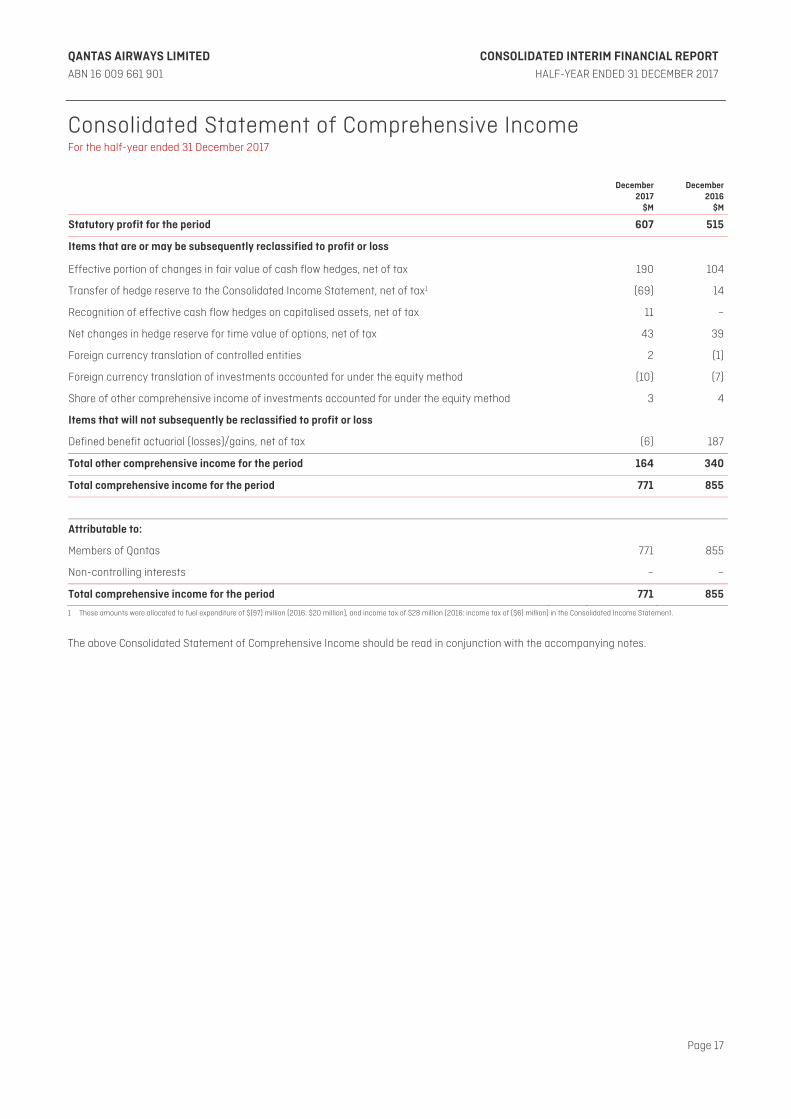
Consolidated Statement of Comprehensive Income For the half-year ended 31 December 2017
December 2017
$M
December 2016
$M
Statutory profit for the period 607 515
Items that are or may be subsequently reclassified to profit or loss
Effective portion of changes in fair value of cash flow hedges, net of tax 190 104
Transfer of hedge reserve to the Consolidated Income Statement, net of tax1 (69) 14
Recognition of effective cash flow hedges on capitalised assets, net of tax 11 –
Net changes in hedge reserve for time value of options, net of tax 43 39
Foreign currency translation of controlled entities 2 (1)
Foreign currency translation of investments accounted for under the equity method (10) (7)
Share of other comprehensive income of investments accounted for under the equity method 3 4
Items that will not subsequently be reclassified to profit or loss
Defined benefit actuarial (losses)/gains, net of tax (6) 187
Total other comprehensive income for the period 164 340
Total comprehensive income for the period 771 855
Attributable to:
Members of Qantas 771 855
Non-controlling interests – –
Total comprehensive income for the period 771 855
1 These amounts were allocated to fuel expenditure of $(97) million (2016: $20 million), and income tax of $28 million (2016: income tax of ($6) million) in the Consolidated Income Statement.
The above Consolidated Statement of Comprehensive Income should be read in conjunction with the accompanying notes.
QANTAS AIRWAYS LIMITED CONSOLIDATED INTERIM FINANCIAL REPORT ABN 16 009 661 901 HALF-YEAR ENDED 31 DECEMBER 2017
Page 18
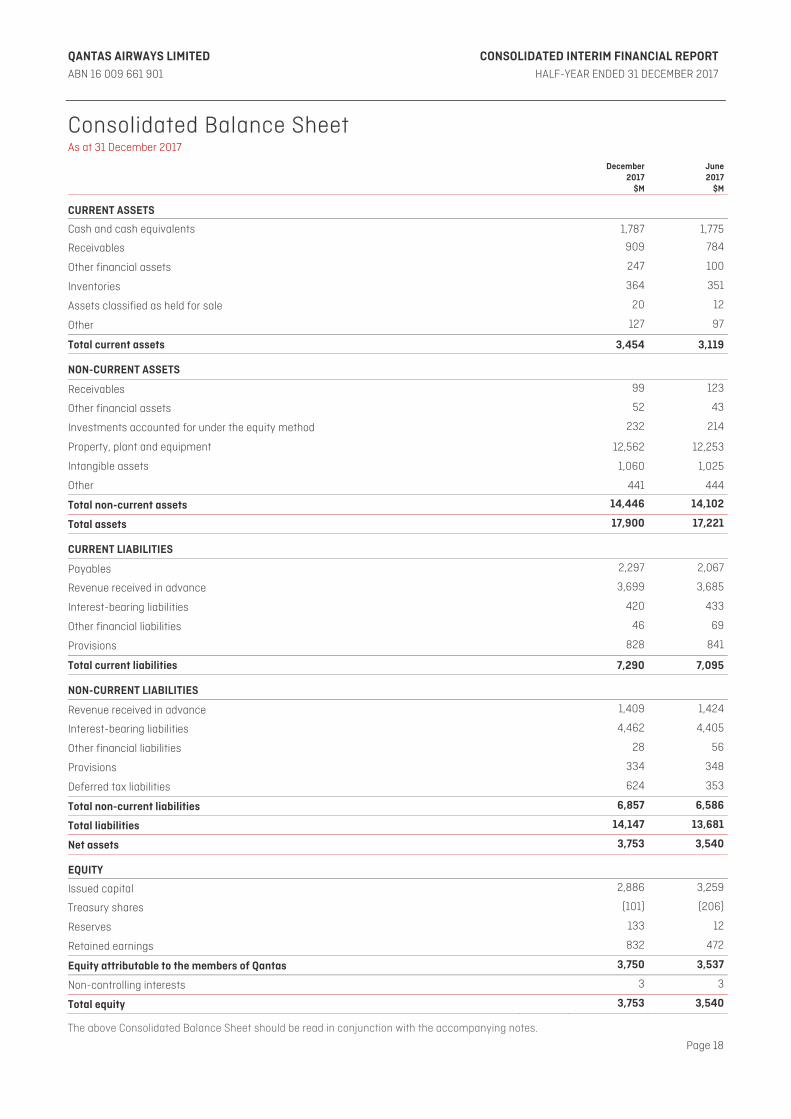
Consolidated Balance Sheet As at 31 December 2017
December 2017
$M
June2017
$M
CURRENT ASSETS
Cash and cash equivalents 1,787 1,775
Receivables 909 784
Other financial assets 247 100
Inventories 364 351
Assets classified as held for sale 20 12
Other 127 97
Total current assets 3,454 3,119
NON-CURRENT ASSETS Receivables 99 123
Other financial assets 52 43
Investments accounted for under the equity method 232 214
Property, plant and equipment 12,562 12,253
Intangible assets 1,060 1,025
Other 441 444
Total non-current assets 14,446 14,102
Total assets 17,900 17,221
CURRENT LIABILITIES Payables 2,297 2,067
Revenue received in advance 3,699 3,685
Interest-bearing liabilities 420 433
Other financial liabilities 46 69
Provisions 828 841
Total current liabilities 7,290 7,095
NON-CURRENT LIABILITIES Revenue received in advance 1,409 1,424
Interest-bearing liabilities 4,462 4,405
Other financial liabilities 28 56
Provisions 334 348
Deferred tax liabilities 624 353
Total non-current liabilities 6,857 6,586
Total liabilities 14,147 13,681
Net assets 3,753 3,540
EQUITY Issued capital 2,886 3,259
Treasury shares (101) (206)
Reserves 133 12
Retained earnings 832 472
Equity attributable to the members of Qantas 3,750 3,537
Non-controlling interests 3 3
Total equity 3,753 3,540
The above Consolidated Balance Sheet should be read in conjunction with the accompanying notes.
QANTAS AIRWAYS LIMITED CONSOLIDATED INTERIM FINANCIAL REPORT ABN 16 009 661 901 HALF-YEAR ENDED 31 DECEMBER 2017
Page 19
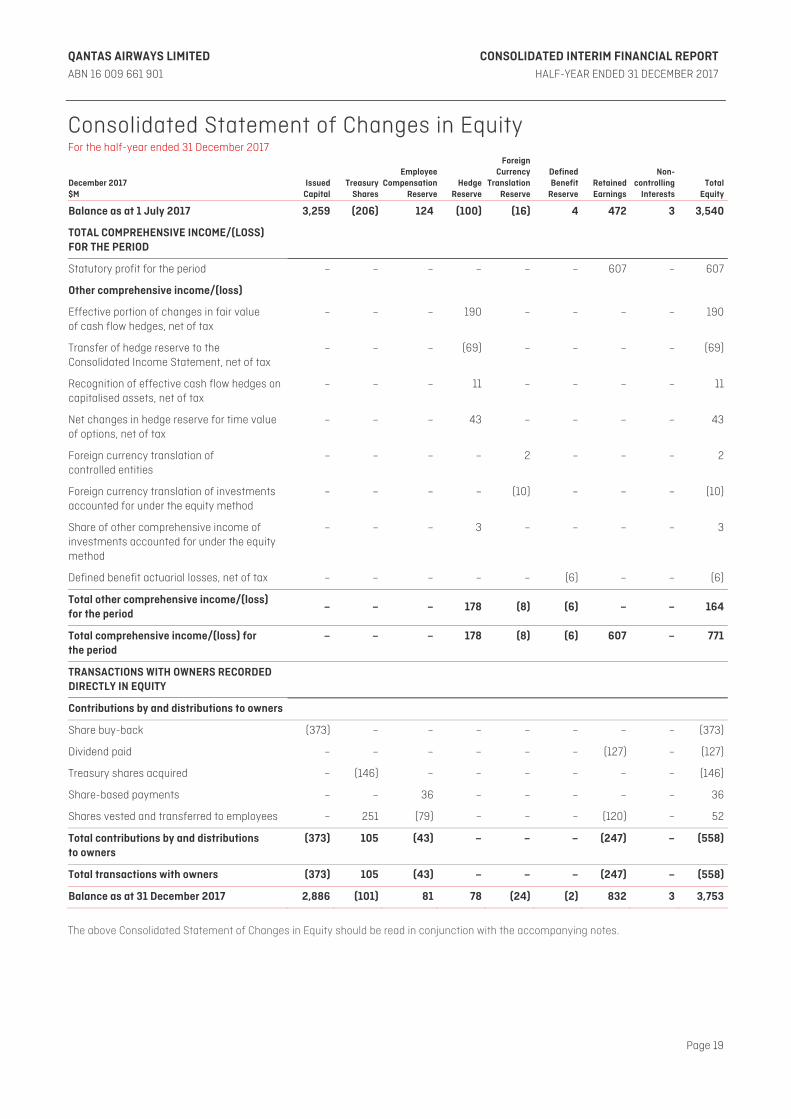
Consolidated Statement of Changes in Equity For the half-year ended 31 December 2017
December 2017 $M
IssuedCapital
TreasuryShares
EmployeeCompensation
ReserveHedge
Reserve
ForeignCurrency
TranslationReserve
Defined Benefit
Reserve Retained Earnings
Non- controlling
InterestsTotal
Equity
Balance as at 1 July 2017 3,259 (206) 124 (100) (16) 4 472 3 3,540
TOTAL COMPREHENSIVE INCOME/(LOSS) FOR THE PERIOD
Statutory profit for the period – – – – – – 607 – 607
Other comprehensive income/(loss)
Effective portion of changes in fair value of cash flow hedges, net of tax
– – – 190 – – – – 190
Transfer of hedge reserve to the Consolidated Income Statement, net of tax
– – – (69) – – – – (69)
Recognition of effective cash flow hedges on capitalised assets, net of tax
– – – 11 – – – – 11
Net changes in hedge reserve for time value of options, net of tax
– – – 43 – – – – 43
Foreign currency translation of controlled entities
– – – – 2 – – – 2
Foreign currency translation of investments accounted for under the equity method
– – – – (10) – – – (10)
Share of other comprehensive income of investments accounted for under the equity method
– – – 3 – – – – 3
Defined benefit actuarial losses, net of tax – – – – – (6) – – (6)
Total other comprehensive income/(loss) for the period
– – – 178 (8) (6) – – 164
Total comprehensive income/(loss) for the period
– – – 178 (8) (6) 607 – 771
TRANSACTIONS WITH OWNERS RECORDED DIRECTLY IN EQUITY
Contributions by and distributions to owners
Share buy-back (373) – – – – – – – (373)
Dividend paid – – – – – – (127) – (127)
Treasury shares acquired – (146) – – – – – – (146)
Share-based payments – – 36 – – – – – 36
Shares vested and transferred to employees – 251 (79) – – – (120) – 52
Total contributions by and distributions to owners
(373) 105 (43) – – – (247) – (558)
Total transactions with owners (373) 105 (43) – – – (247) – (558)
Balance as at 31 December 2017 2,886 (101) 81 78 (24) (2) 832 3 3,753
The above Consolidated Statement of Changes in Equity should be read in conjunction with the accompanying notes.
QANTAS AIRWAYS LIMITED CONSOLIDATED INTERIM FINANCIAL REPORT ABN 16 009 661 901 HALF-YEAR ENDED 31 DECEMBER 2017
Page 20
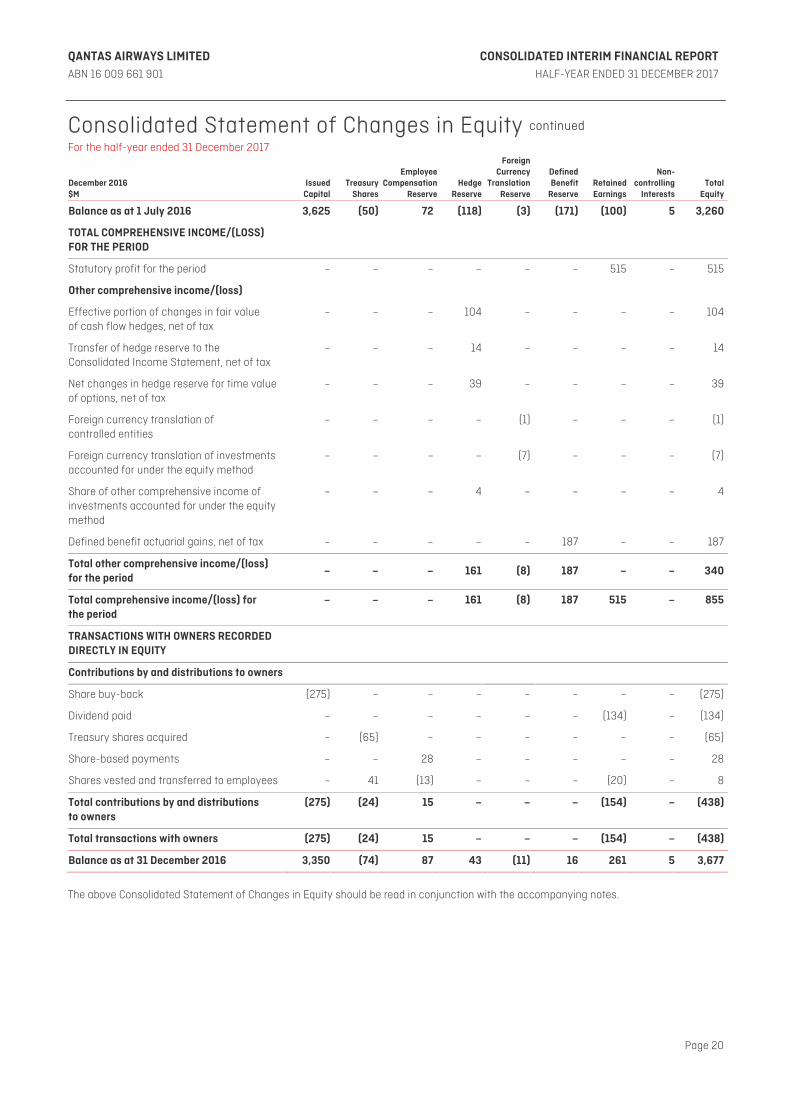
Consolidated Statement of Changes in Equity continued For the half-year ended 31 December 2017
December 2016 $M
IssuedCapital
TreasuryShares
EmployeeCompensation
ReserveHedge
Reserve
ForeignCurrency
TranslationReserve
Defined Benefit
Reserve Retained Earnings
Non- controlling
InterestsTotal
Equity
Balance as at 1 July 2016 3,625 (50) 72 (118) (3) (171) (100) 5 3,260
TOTAL COMPREHENSIVE INCOME/(LOSS) FOR THE PERIOD
Statutory profit for the period – – – – – – 515 – 515
Other comprehensive income/(loss)
Effective portion of changes in fair value of cash flow hedges, net of tax
– – – 104 – – – – 104
Transfer of hedge reserve to the Consolidated Income Statement, net of tax
– – – 14 – – – – 14
Net changes in hedge reserve for time value of options, net of tax
– – – 39 – – – – 39
Foreign currency translation of controlled entities
– – – – (1) – – – (1)
Foreign currency translation of investments accounted for under the equity method
– – – – (7) – – – (7)
Share of other comprehensive income of investments accounted for under the equity method
– – – 4 – – – – 4
Defined benefit actuarial gains, net of tax – – – – – 187 – – 187
Total other comprehensive income/(loss) for the period
– – – 161 (8) 187 – – 340
Total comprehensive income/(loss) for the period
– – – 161 (8) 187 515 – 855
TRANSACTIONS WITH OWNERS RECORDED DIRECTLY IN EQUITY
Contributions by and distributions to owners
Share buy-back (275) – – – – – – – (275)
Dividend paid – – – – – – (134) – (134)
Treasury shares acquired – (65) – – – – – – (65)
Share-based payments – – 28 – – – – – 28
Shares vested and transferred to employees – 41 (13) – – – (20) – 8
Total contributions by and distributions to owners
(275) (24) 15 – – – (154) – (438)
Total transactions with owners (275) (24) 15 – – – (154) – (438)
Balance as at 31 December 2016 3,350 (74) 87 43 (11) 16 261 5 3,677
The above Consolidated Statement of Changes in Equity should be read in conjunction with the accompanying notes.
QANTAS AIRWAYS LIMITED CONSOLIDATED INTERIM FINANCIAL REPORT ABN 16 009 661 901 HALF-YEAR ENDED 31 DECEMBER 2017
Page 21
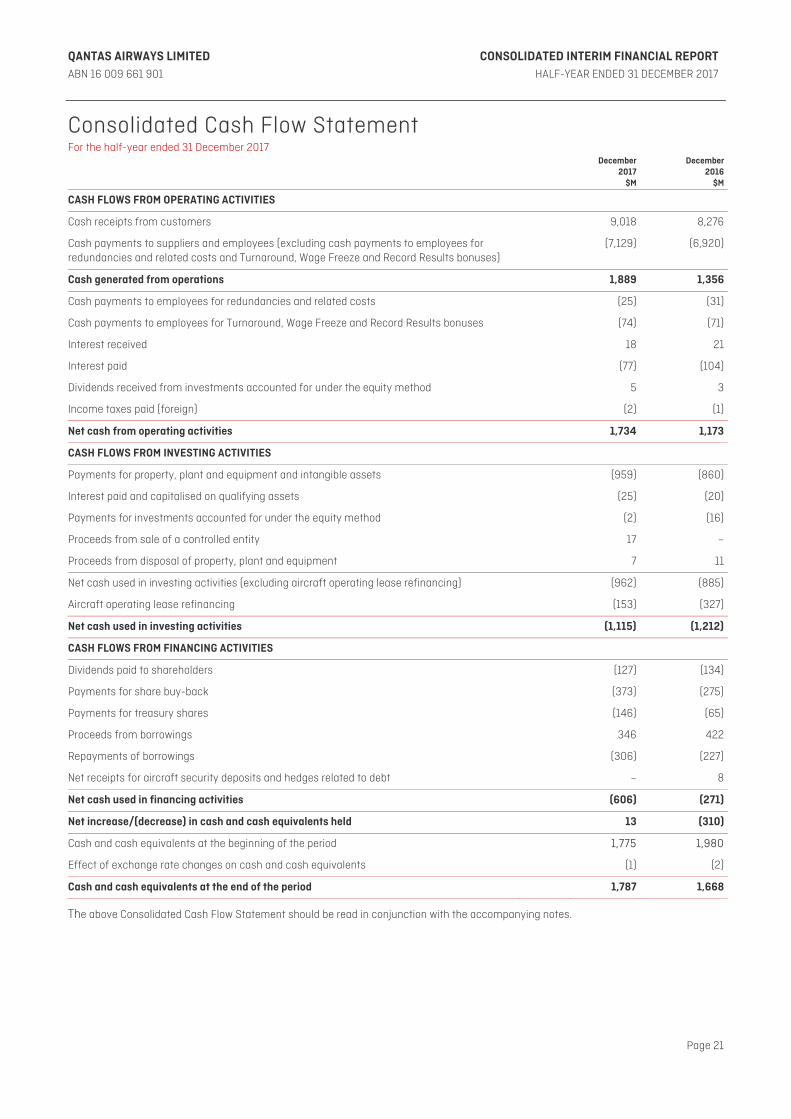
Consolidated Cash Flow Statement For the half-year ended 31 December 2017
December 2017
$M
December2016
$M
CASH FLOWS FROM OPERATING ACTIVITIES
Cash receipts from customers 9,018 8,276
Cash payments to suppliers and employees (excluding cash payments to employees for redundancies and related costs and Turnaround, Wage Freeze and Record Results bonuses)
(7,129) (6,920)
Cash generated from operations 1,889 1,356
Cash payments to employees for redundancies and related costs (25) (31)
Cash payments to employees for Turnaround, Wage Freeze and Record Results bonuses (74) (71)
Interest received 18 21
Interest paid (77) (104)
Dividends received from investments accounted for under the equity method 5 3
Income taxes paid (foreign) (2) (1)
Net cash from operating activities 1,734 1,173
CASH FLOWS FROM INVESTING ACTIVITIES
Payments for property, plant and equipment and intangible assets (959) (860)
Interest paid and capitalised on qualifying assets (25) (20)
Payments for investments accounted for under the equity method (2) (16)
Proceeds from sale of a controlled entity 17 –
Proceeds from disposal of property, plant and equipment 7 11
Net cash used in investing activities (excluding aircraft operating lease refinancing) (962) (885)
Aircraft operating lease refinancing (153) (327)
Net cash used in investing activities (1,115) (1,212)
CASH FLOWS FROM FINANCING ACTIVITIES
Dividends paid to shareholders (127) (134)
Payments for share buy-back (373) (275)
Payments for treasury shares (146) (65)
Proceeds from borrowings 346 422
Repayments of borrowings (306) (227)
Net receipts for aircraft security deposits and hedges related to debt – 8
Net cash used in financing activities (606) (271)
Net increase/(decrease) in cash and cash equivalents held 13 (310)
Cash and cash equivalents at the beginning of the period 1,775 1,980
Effect of exchange rate changes on cash and cash equivalents (1) (2)
Cash and cash equivalents at the end of the period 1,787 1,668
The above Consolidated Cash Flow Statement should be read in conjunction with the accompanying notes.
QANTAS AIRWAYS LIMITED CONSOLIDATED INTERIM FINANCIAL REPORT ABN 16 009 661 901 HALF-YEAR ENDED 31 DECEMBER 2017
Page 22
Condensed Notes to the Consolidated Interim Financial Report For the half-year ended 31 December 2017 1 STATEMENT OF SIGNIFICANT ACCOUNTING POLICIES
(A) REPORTING ENTITY Qantas Airways Limited (Qantas) is a for-profit company limited by shares, incorporated in Australia, whose shares are publicly traded on the Australian Securities Exchange (ASX) and which is subject to the operation of the Qantas Sale Act. The Consolidated Interim Financial Report of Qantas for the half-year ended 31 December 2017 comprises Qantas and its controlled entities (together referred to as the Qantas Group) and the Qantas Group's interest in investments accounted for using the equity method. The Consolidated Annual Financial Report of the Qantas Group as at and for the year ended 30 June 2017 is available at www.qantas.com.au or upon request from the registered office of Qantas at 10 Bourke Road, Mascot NSW 2020, Australia. This Consolidated Interim Financial Report for the half-year ended 31 December 2017 was authorised for issue in accordance with a resolution of the Directors on 22 February 2018. (B) STATEMENT OF COMPLIANCE The Consolidated Interim Financial Report has been prepared in accordance with AASB 134: Interim Financial Reporting and the Corporations Act 2001. International Financial Reporting Standards (IFRS) form the basis of Australian Accounting Standards (AASB) adopted by the Australian Accounting Standards Board (AASB). The Financial Report of the Qantas Group also complies with International Accounting Standard IAS 34: Interim Financial Reporting. The Consolidated Interim Financial Report does not include all of the information required for an Annual Financial Report and should be read in conjunction with the Consolidated Annual Financial Report of the Qantas Group for the year ended 30 June 2017. This report should also be read in conjunction with any public announcements made by Qantas in accordance with the continuous disclosure requirements arising under the Corporations Act 2001 and ASX Listing Rules. The Consolidated Interim Financial Report is presented in Australian dollars, which is the functional currency of the Qantas Group, and has been prepared on the basis of historical cost except in accordance with relevant accounting policies where assets and liabilities are stated at their fair values. Qantas is a company of the kind referred to in ASIC Corporations (Rounding in Financial/Directors’ Reports) Instrument 2016/191. In accordance with that Instrument, all financial information presented has been rounded to the nearest million dollars, unless otherwise stated. (C) SIGNIFICANT ACCOUNTING POLICIES The significant accounting policies applied by the Qantas Group in this Consolidated Interim Financial Report are the same as those applied by the Qantas Group in the Consolidated Annual Financial Report for the year ended 30 June 2017. (D) COMPARATIVES Where applicable, comparative balances have been reclassified to align with current period presentation.
(E) CRITICAL ACCOUNTING ESTIMATES AND JUDGEMENTS The preparation of the Consolidated Financial Statements requires management to make judgements, estimates and assumptions that affect the application of accounting policies and reported amounts of assets, liabilities, income and expenses. The estimates and associated assumptions are based on historical experience and various other factors that are believed to be reasonable under the circumstances, the results of which form the basis for making the judgements about carrying values of assets and liabilities that are not readily apparent from other sources. Actual results may differ from these estimates. Estimates and underlying assumptions are reviewed on an ongoing basis. Revisions to accounting estimates are recognised in the period in which the estimate is revised and in any future periods affected. In preparing this Report, judgements made by Management in the application of Australian Accounting Standards that have a significant effect on the Consolidated Financial Statements and estimates with a significant risk of material adjustment in future periods were the same as those applied to the Qantas Annual Report for the year ended 30 June 2017.
QANTAS AIRWAYS LIMITED CONSOLIDATED INTERIM FINANCIAL REPORT ABN 16 009 661 901 HALF-YEAR ENDED 31 DECEMBER 2017
Page 23
Condensed Notes to the Consolidated Interim Financial Report continued For the half-year ended 31 December 2017 2 UNDERLYING PROFIT BEFORE TAX, OPERATING SEGMENTS AND RETURN ON INVESTED CAPITAL
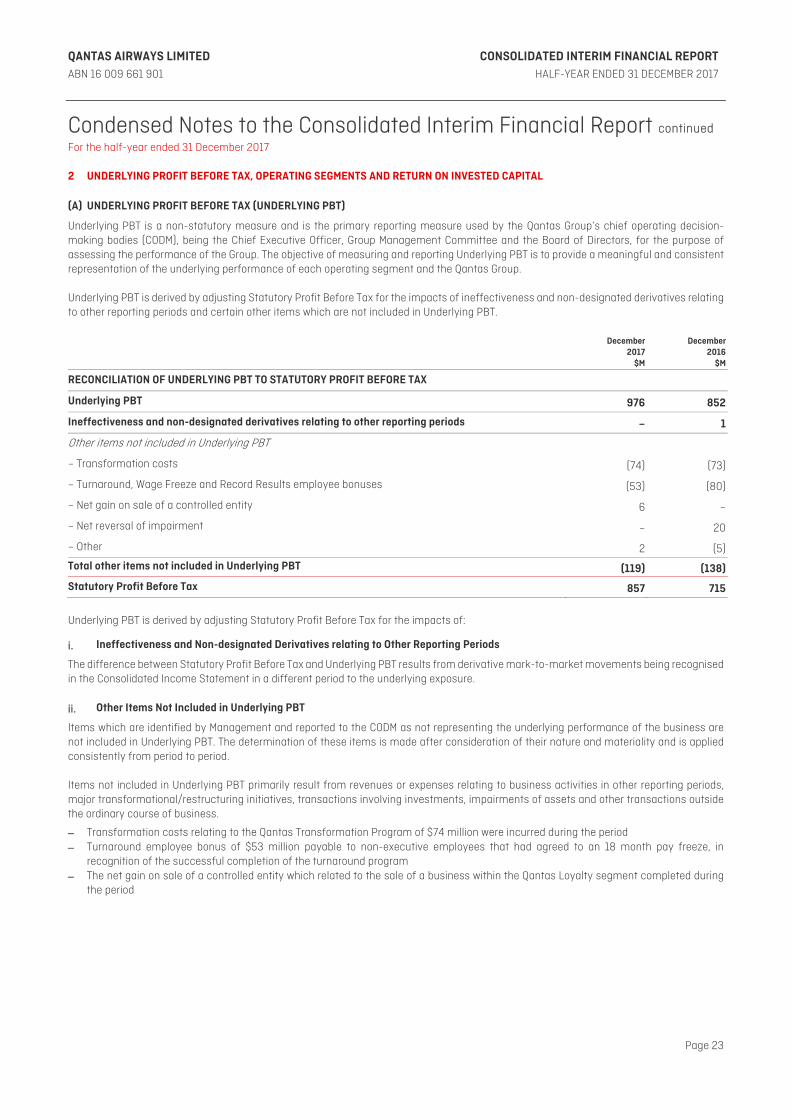
(A) UNDERLYING PROFIT BEFORE TAX (UNDERLYING PBT)
Underlying PBT is a non-statutory measure and is the primary reporting measure used by the Qantas Group’s chief operating decision-making bodies (CODM), being the Chief Executive Officer, Group Management Committee and the Board of Directors, for the purpose of assessing the performance of the Group. The objective of measuring and reporting Underlying PBT is to provide a meaningful and consistent representation of the underlying performance of each operating segment and the Qantas Group. Underlying PBT is derived by adjusting Statutory Profit Before Tax for the impacts of ineffectiveness and non-designated derivatives relating to other reporting periods and certain other items which are not included in Underlying PBT.
December 2017
$M
December2016
$M
RECONCILIATION OF UNDERLYING PBT TO STATUTORY PROFIT BEFORE TAX
Underlying PBT 976 852
Ineffectiveness and non-designated derivatives relating to other reporting periods – 1
Other items not included in Underlying PBT
– Transformation costs (74) (73)
– Turnaround, Wage Freeze and Record Results employee bonuses (53) (80)
– Net gain on sale of a controlled entity 6 –
– Net reversal of impairment – 20
– Other 2 (5)
Total other items not included in Underlying PBT (119) (138)
Statutory Profit Before Tax 857 715
Underlying PBT is derived by adjusting Statutory Profit Before Tax for the impacts of:
i. Ineffectiveness and Non-designated Derivatives relating to Other Reporting Periods
The difference between Statutory Profit Before Tax and Underlying PBT results from derivative mark-to-market movements being recognised in the Consolidated Income Statement in a different period to the underlying exposure. ii. Other Items Not Included in Underlying PBT
Items which are identified by Management and reported to the CODM as not representing the underlying performance of the business are not included in Underlying PBT. The determination of these items is made after consideration of their nature and materiality and is applied consistently from period to period. Items not included in Underlying PBT primarily result from revenues or expenses relating to business activities in other reporting periods, major transformational/restructuring initiatives, transactions involving investments, impairments of assets and other transactions outside the ordinary course of business.
– Transformation costs relating to the Qantas Transformation Program of $74 million were incurred during the period – Turnaround employee bonus of $53 million payable to non-executive employees that had agreed to an 18 month pay freeze, in
recognition of the successful completion of the turnaround program – The net gain on sale of a controlled entity which related to the sale of a business within the Qantas Loyalty segment completed during
the period
QANTAS AIRWAYS LIMITED CONSOLIDATED INTERIM FINANCIAL REPORT ABN 16 009 661 901 HALF-YEAR ENDED 31 DECEMBER 2017
Page 24
Condensed Notes to the Consolidated Interim Financial Report continued For the half-year ended 31 December 2017 2 UNDERLYING PROFIT BEFORE TAX, OPERATING SEGMENTS AND RETURN ON INVESTED CAPITAL (CONTINUED)
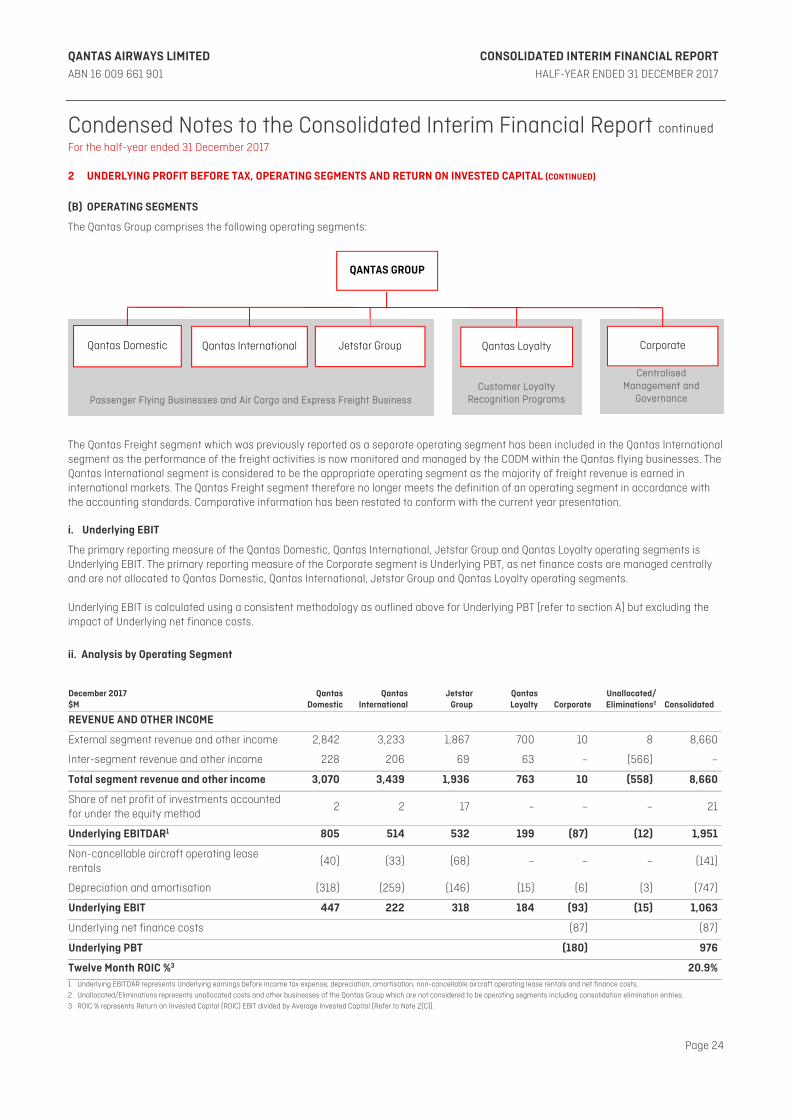
(B) OPERATING SEGMENTS
The Qantas Group comprises the following operating segments:
The Qantas Freight segment which was previously reported as a separate operating segment has been included in the Qantas International segment as the performance of the freight activities is now monitored and managed by the CODM within the Qantas flying businesses. The Qantas International segment is considered to be the appropriate operating segment as the majority of freight revenue is earned in international markets. The Qantas Freight segment therefore no longer meets the definition of an operating segment in accordance with the accounting standards. Comparative information has been restated to conform with the current year presentation.
i. Underlying EBIT
The primary reporting measure of the Qantas Domestic, Qantas International, Jetstar Group and Qantas Loyalty operating segments is Underlying EBIT. The primary reporting measure of the Corporate segment is Underlying PBT, as net finance costs are managed centrally and are not allocated to Qantas Domestic, Qantas International, Jetstar Group and Qantas Loyalty operating segments. Underlying EBIT is calculated using a consistent methodology as outlined above for Underlying PBT (refer to section A) but excluding the impact of Underlying net finance costs.
ii. Analysis by Operating Segment
December 2017 $M
Qantas Domestic
QantasInternational
JetstarGroup
Qantas Loyalty Corporate
Unallocated/Eliminations2
Consolidated
REVENUE AND OTHER INCOME
External segment revenue and other income 2,842 3,233 1,867 700 10 8 8,660
Inter-segment revenue and other income 228 206 69 63 – (566) –
Total segment revenue and other income 3,070 3,439 1,936 763 10 (558) 8,660
Share of net profit of investments accounted for under the equity method
2 2 17 – – – 21
Underlying EBITDAR1 805 514 532 199 (87) (12) 1,951
Non-cancellable aircraft operating lease rentals
(40) (33) (68) – – – (141)
Depreciation and amortisation (318) (259) (146) (15) (6) (3) (747)
Underlying EBIT 447 222 318 184 (93) (15) 1,063
Underlying net finance costs (87) (87)
Underlying PBT (180) 976
Twelve Month ROIC %3 20.9%1 Underlying EBITDAR represents Underlying earnings before income tax expense, depreciation, amortisation, non-cancellable aircraft operating lease rentals and net finance costs.
2 Unallocated/Eliminations represents unallocated costs and other businesses of the Qantas Group which are not considered to be operating segments including consolidation elimination entries.
3 ROIC % represents Return on Invested Capital (ROIC) EBIT divided by Average Invested Capital (Refer to Note 2(C)).
Customer Loyalty Recognition Programs
Centralised Management and
Governance
Corporate
Passenger Flying Businesses and Air Cargo and Express Freight Business
Qantas Loyalty Jetstar Group Qantas International Qantas Domestic
QANTAS GROUP
QANTAS AIRWAYS LIMITED CONSOLIDATED INTERIM FINANCIAL REPORT ABN 16 009 661 901 HALF-YEAR ENDED 31 DECEMBER 2017
Page 25
Condensed Notes to the Consolidated Interim Financial Report continued For the half-year ended 31 December 2017 2 UNDERLYING PROFIT BEFORE TAX, OPERATING SEGMENTS AND RETURN ON INVESTED CAPITAL (CONTINUED)
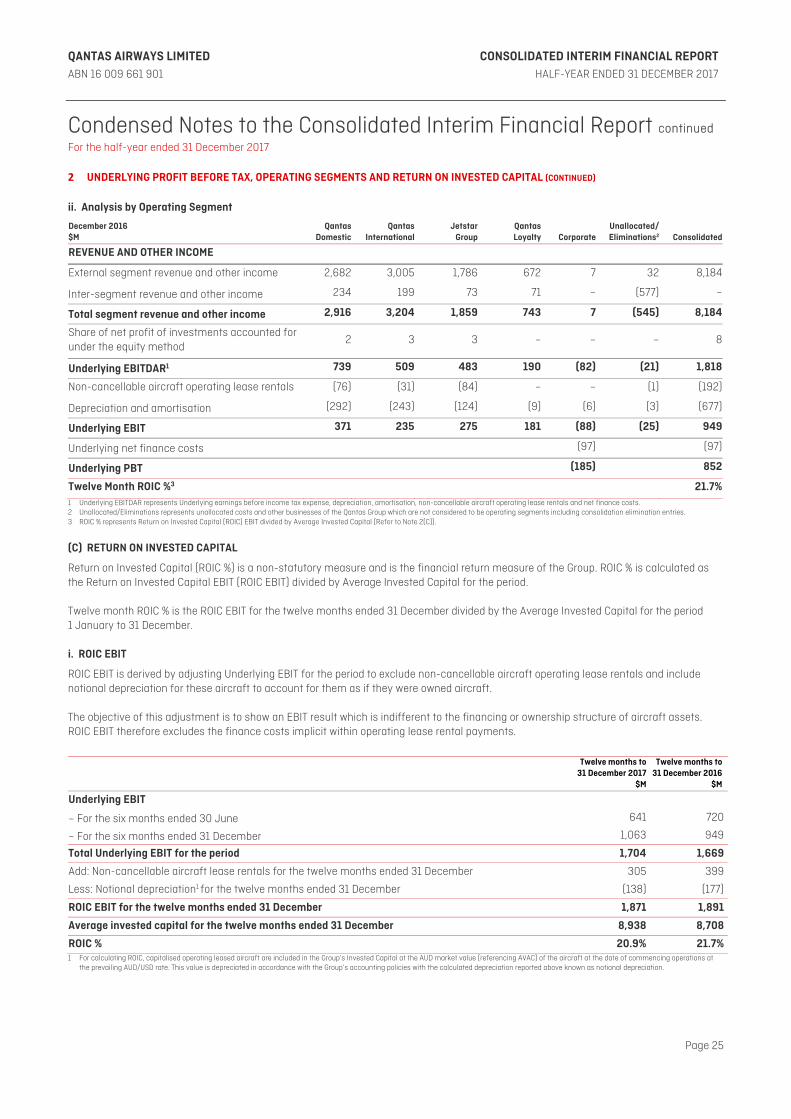
ii. Analysis by Operating Segment
December 2016 $M
Qantas Domestic
QantasInternational
JetstarGroup
QantasLoyalty Corporate
Unallocated/Eliminations2 Consolidated
REVENUE AND OTHER INCOME
External segment revenue and other income 2,682 3,005 1,786 672 7 32 8,184
Inter-segment revenue and other income 234 199 73 71 – (577) –
Total segment revenue and other income 2,916 3,204 1,859 743 7 (545) 8,184
Share of net profit of investments accounted for under the equity method
2 3 3 – – – 8
Underlying EBITDAR1 739 509 483 190 (82) (21) 1,818
Non-cancellable aircraft operating lease rentals (76) (31) (84) – – (1) (192)
Depreciation and amortisation (292) (243) (124) (9) (6) (3) (677)
Underlying EBIT 371 235 275 181 (88) (25) 949
Underlying net finance costs (97) (97)
Underlying PBT (185) 852
Twelve Month ROIC %3 21.7%1 Underlying EBITDAR represents Underlying earnings before income tax expense, depreciation, amortisation, non-cancellable aircraft operating lease rentals and net finance costs. 2 Unallocated/Eliminations represents unallocated costs and other businesses of the Qantas Group which are not considered to be operating segments including consolidation elimination entries. 3 ROIC % represents Return on Invested Capital (ROIC) EBIT divided by Average Invested Capital (Refer to Note 2(C)).
(C) RETURN ON INVESTED CAPITAL
Return on Invested Capital (ROIC %) is a non-statutory measure and is the financial return measure of the Group. ROIC % is calculated as the Return on Invested Capital EBIT (ROIC EBIT) divided by Average Invested Capital for the period. Twelve month ROIC % is the ROIC EBIT for the twelve months ended 31 December divided by the Average Invested Capital for the period 1 January to 31 December. i. ROIC EBIT
ROIC EBIT is derived by adjusting Underlying EBIT for the period to exclude non-cancellable aircraft operating lease rentals and include notional depreciation for these aircraft to account for them as if they were owned aircraft. The objective of this adjustment is to show an EBIT result which is indifferent to the financing or ownership structure of aircraft assets. ROIC EBIT therefore excludes the finance costs implicit within operating lease rental payments.
Twelve months to 31 December 2017
$M
Twelve months to 31 December 2016
$M
Underlying EBIT
– For the six months ended 30 June 641 720
– For the six months ended 31 December 1,063 949
Total Underlying EBIT for the period 1,704 1,669
Add: Non-cancellable aircraft lease rentals for the twelve months ended 31 December 305 399
Less: Notional depreciation1 for the twelve months ended 31 December (138) (177)
ROIC EBIT for the twelve months ended 31 December 1,871 1,891
Average invested capital for the twelve months ended 31 December 8,938 8,708
ROIC % 20.9% 21.7%1 For calculating ROIC, capitalised operating leased aircraft are included in the Group’s Invested Capital at the AUD market value (referencing AVAC) of the aircraft at the date of commencing operations at
the prevailing AUD/USD rate. This value is depreciated in accordance with the Group’s accounting policies with the calculated depreciation reported above known as notional depreciation.
QANTAS AIRWAYS LIMITED CONSOLIDATED INTERIM FINANCIAL REPORT ABN 16 009 661 901 HALF-YEAR ENDED 31 DECEMBER 2017
Page 26
Condensed Notes to the Consolidated Interim Financial Report continued For the half-year ended 31 December 2017 2 UNDERLYING PROFIT BEFORE TAX, OPERATING SEGMENTS AND RETURN ON INVESTED CAPITAL (CONTINUED)
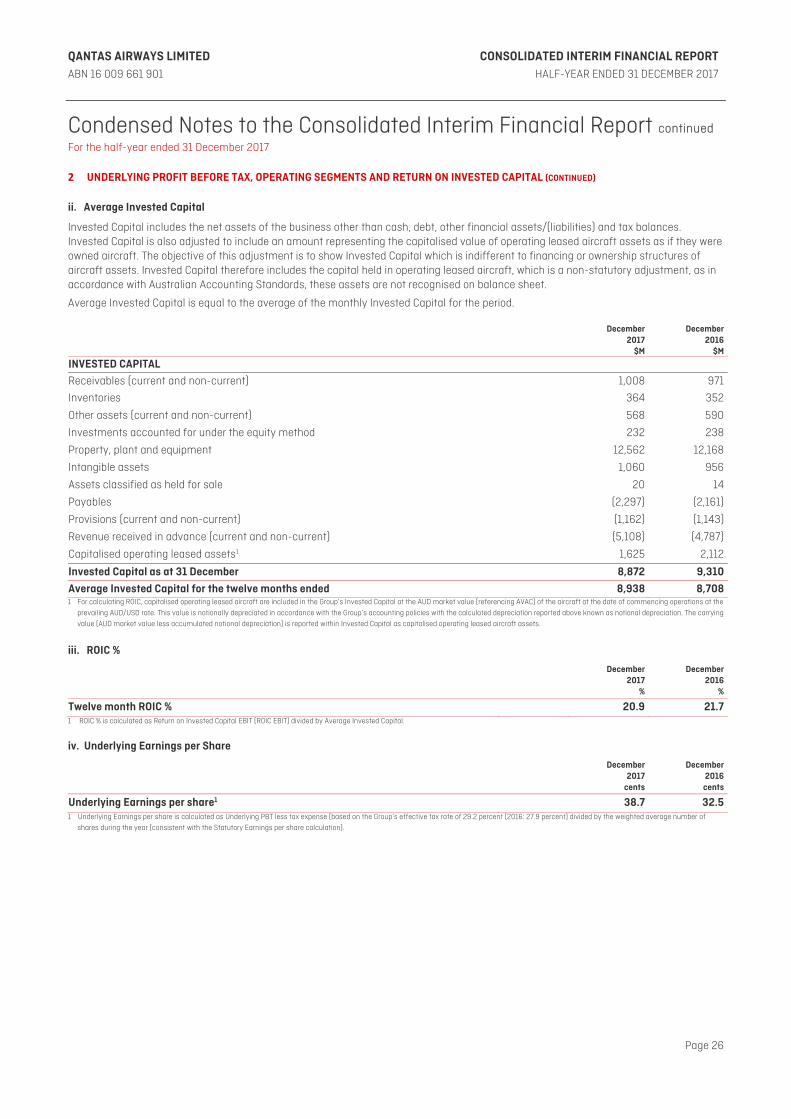
ii. Average Invested Capital
Invested Capital includes the net assets of the business other than cash, debt, other financial assets/(liabilities) and tax balances. Invested Capital is also adjusted to include an amount representing the capitalised value of operating leased aircraft assets as if they were owned aircraft. The objective of this adjustment is to show Invested Capital which is indifferent to financing or ownership structures of aircraft assets. Invested Capital therefore includes the capital held in operating leased aircraft, which is a non-statutory adjustment, as in accordance with Australian Accounting Standards, these assets are not recognised on balance sheet.
Average Invested Capital is equal to the average of the monthly Invested Capital for the period.
December 2017
$M
December 2016
$M
INVESTED CAPITAL Receivables (current and non-current) 1,008 971
Inventories 364 352
Other assets (current and non-current) 568 590
Investments accounted for under the equity method 232 238
Property, plant and equipment 12,562 12,168
Intangible assets 1,060 956
Assets classified as held for sale 20 14
Payables (2,297) (2,161)
Provisions (current and non-current) (1,162) (1,143)
Revenue received in advance (current and non-current) (5,108) (4,787)
Capitalised operating leased assets1 1,625 2,112
Invested Capital as at 31 December 8,872 9,310
Average Invested Capital for the twelve months ended 8,938 8,7081 For calculating ROIC, capitalised operating leased aircraft are included in the Group’s Invested Capital at the AUD market value (referencing AVAC) of the aircraft at the date of commencing operations at the
prevailing AUD/USD rate. This value is notionally depreciated in accordance with the Group’s accounting policies with the calculated depreciation reported above known as notional depreciation. The carrying
value (AUD market value less accumulated notional depreciation) is reported within Invested Capital as capitalised operating leased aircraft assets.
iii. ROIC %
December 2017
%
December 2016
%
Twelve month ROIC % 20.9 21.71 ROIC % is calculated as Return on Invested Capital EBIT (ROIC EBIT) divided by Average Invested Capital.
iv. Underlying Earnings per Share
December 2017
cents
December 2016cents
Underlying Earnings per share1 38.7 32.51 Underlying Earnings per share is calculated as Underlying PBT less tax expense (based on the Group’s effective tax rate of 29.2 percent (2016: 27.9 percent) divided by the weighted average number of
shares during the year (consistent with the Statutory Earnings per share calculation).
QANTAS AIRWAYS LIMITED CONSOLIDATED INTERIM FINANCIAL REPORT ABN 16 009 661 901 HALF-YEAR ENDED 31 DECEMBER 2017
Page 27
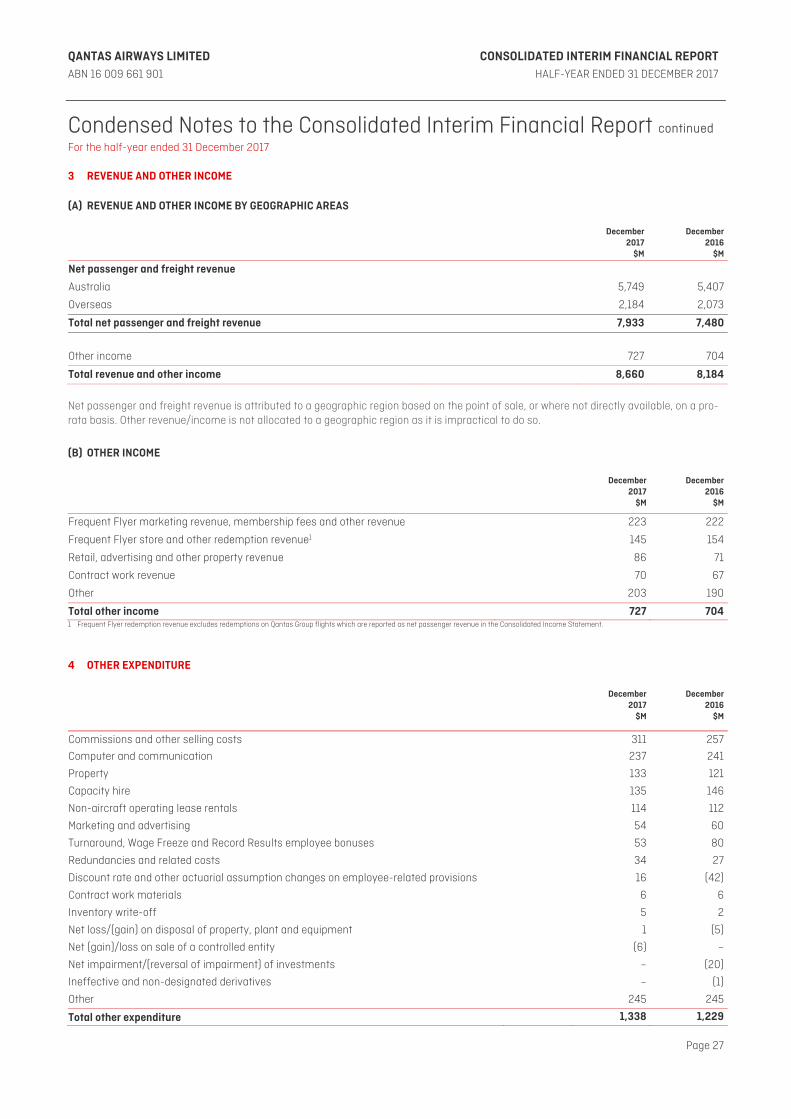
Condensed Notes to the Consolidated Interim Financial Report continued For the half-year ended 31 December 2017 3 REVENUE AND OTHER INCOME
(A) REVENUE AND OTHER INCOME BY GEOGRAPHIC AREAS
December 2017
$M
December 2016
$M
Net passenger and freight revenue
Australia 5,749 5,407
Overseas 2,184 2,073
Total net passenger and freight revenue 7,933 7,480
Other income 727 704
Total revenue and other income 8,660 8,184
Net passenger and freight revenue is attributed to a geographic region based on the point of sale, or where not directly available, on a pro-rata basis. Other revenue/income is not allocated to a geographic region as it is impractical to do so.
(B) OTHER INCOME
December 2017
$M
December 2016
$M
Frequent Flyer marketing revenue, membership fees and other revenue 223 222
Frequent Flyer store and other redemption revenue1 145 154
Retail, advertising and other property revenue 86 71
Contract work revenue 70 67
Other 203 190
Total other income 727 7041 Frequent Flyer redemption revenue excludes redemptions on Qantas Group flights which are reported as net passenger revenue in the Consolidated Income Statement.
4 OTHER EXPENDITURE
December 2017
$M
December 2016
$M
Commissions and other selling costs 311 257
Computer and communication 237 241
Property 133 121
Capacity hire 135 146
Non-aircraft operating lease rentals 114 112
Marketing and advertising 54 60
Turnaround, Wage Freeze and Record Results employee bonuses 53 80
Redundancies and related costs 34 27
Discount rate and other actuarial assumption changes on employee-related provisions 16 (42)
Contract work materials 6 6
Inventory write-off 5 2
Net loss/(gain) on disposal of property, plant and equipment 1 (5)
Net (gain)/loss on sale of a controlled entity (6) –
Net impairment/(reversal of impairment) of investments – (20)
Ineffective and non-designated derivatives – (1)
Other 245 245
Total other expenditure 1,338 1,229
QANTAS AIRWAYS LIMITED CONSOLIDATED INTERIM FINANCIAL REPORT ABN 16 009 661 901 HALF-YEAR ENDED 31 DECEMBER 2017
Page 28
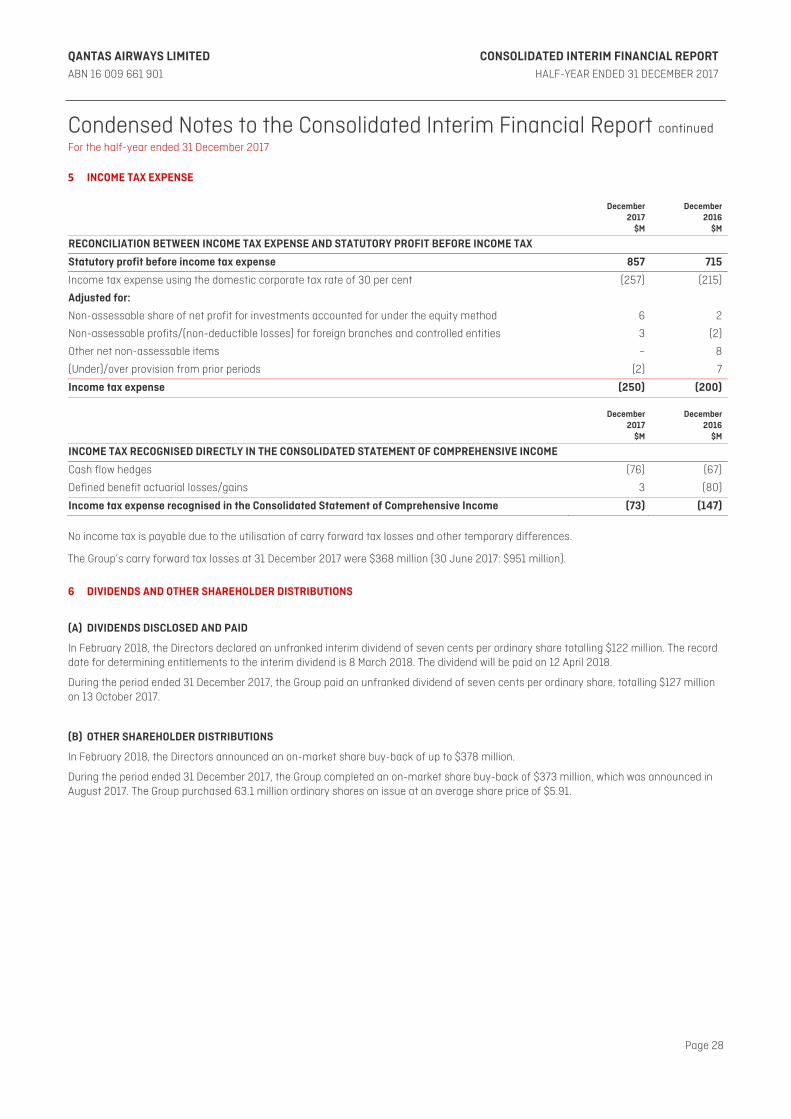
Condensed Notes to the Consolidated Interim Financial Report continued For the half-year ended 31 December 2017 5 INCOME TAX EXPENSE
December 2017
$M
December2016
$M
RECONCILIATION BETWEEN INCOME TAX EXPENSE AND STATUTORY PROFIT BEFORE INCOME TAX
Statutory profit before income tax expense 857 715
Income tax expense using the domestic corporate tax rate of 30 per cent (257) (215)
Adjusted for:
Non-assessable share of net profit for investments accounted for under the equity method 6 2
Non-assessable profits/(non-deductible losses) for foreign branches and controlled entities 3 (2)
Other net non-assessable items – 8
(Under)/over provision from prior periods (2) 7
Income tax expense (250) (200)
December 2017
$M
December2016
$M
INCOME TAX RECOGNISED DIRECTLY IN THE CONSOLIDATED STATEMENT OF COMPREHENSIVE INCOME
Cash flow hedges (76) (67)
Defined benefit actuarial losses/gains 3 (80)
Income tax expense recognised in the Consolidated Statement of Comprehensive Income (73) (147) No income tax is payable due to the utilisation of carry forward tax losses and other temporary differences.
The Group’s carry forward tax losses at 31 December 2017 were $368 million (30 June 2017: $951 million).
6 DIVIDENDS AND OTHER SHAREHOLDER DISTRIBUTIONS
(A) DIVIDENDS DISCLOSED AND PAID
In February 2018, the Directors declared an unfranked interim dividend of seven cents per ordinary share totalling $122 million. The record date for determining entitlements to the interim dividend is 8 March 2018. The dividend will be paid on 12 April 2018.
During the period ended 31 December 2017, the Group paid an unfranked dividend of seven cents per ordinary share, totalling $127 million on 13 October 2017.
(B) OTHER SHAREHOLDER DISTRIBUTIONS
In February 2018, the Directors announced an on-market share buy-back of up to $378 million.
During the period ended 31 December 2017, the Group completed an on-market share buy-back of $373 million, which was announced in August 2017. The Group purchased 63.1 million ordinary shares on issue at an average share price of $5.91.
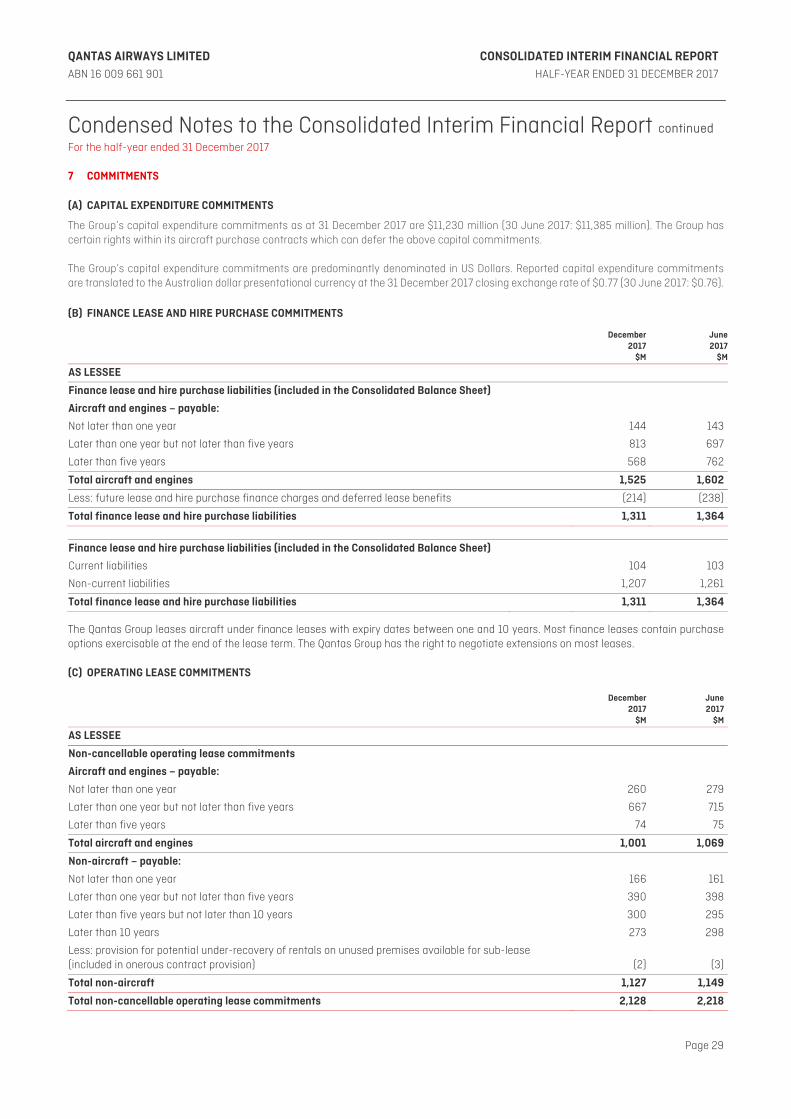
QANTAS AIRWAYS LIMITED CONSOLIDATED INTERIM FINANCIAL REPORT ABN 16 009 661 901 HALF-YEAR ENDED 31 DECEMBER 2017
Page 29
Condensed Notes to the Consolidated Interim Financial Report continued For the half-year ended 31 December 2017 7 COMMITMENTS
(A) CAPITAL EXPENDITURE COMMITMENTS
The Group’s capital expenditure commitments as at 31 December 2017 are $11,230 million (30 June 2017: $11,385 million). The Group has certain rights within its aircraft purchase contracts which can defer the above capital commitments. The Group’s capital expenditure commitments are predominantly denominated in US Dollars. Reported capital expenditure commitments are translated to the Australian dollar presentational currency at the 31 December 2017 closing exchange rate of $0.77 (30 June 2017: $0.76).
(B) FINANCE LEASE AND HIRE PURCHASE COMMITMENTS
December 2017
$M
June 2017
$M
AS LESSEE
Finance lease and hire purchase liabilities (included in the Consolidated Balance Sheet)
Aircraft and engines – payable:
Not later than one year 144 143
Later than one year but not later than five years 813 697
Later than five years 568 762
Total aircraft and engines 1,525 1,602
Less: future lease and hire purchase finance charges and deferred lease benefits (214) (238)
Total finance lease and hire purchase liabilities 1,311 1,364
Finance lease and hire purchase liabilities (included in the Consolidated Balance Sheet)
Current liabilities 104 103
Non-current liabilities 1,207 1,261
Total finance lease and hire purchase liabilities 1,311 1,364
The Qantas Group leases aircraft under finance leases with expiry dates between one and 10 years. Most finance leases contain purchase options exercisable at the end of the lease term. The Qantas Group has the right to negotiate extensions on most leases. (C) OPERATING LEASE COMMITMENTS
December 2017
$M
June2017
$M
AS LESSEE
Non-cancellable operating lease commitments
Aircraft and engines – payable:
Not later than one year 260 279
Later than one year but not later than five years 667 715
Later than five years 74 75
Total aircraft and engines 1,001 1,069
Non-aircraft – payable:
Not later than one year 166 161
Later than one year but not later than five years 390 398
Later than five years but not later than 10 years 300 295
Later than 10 years 273 298
Less: provision for potential under-recovery of rentals on unused premises available for sub-lease (included in onerous contract provision) (2) (3)
Total non-aircraft 1,127 1,149
Total non-cancellable operating lease commitments 2,128 2,218
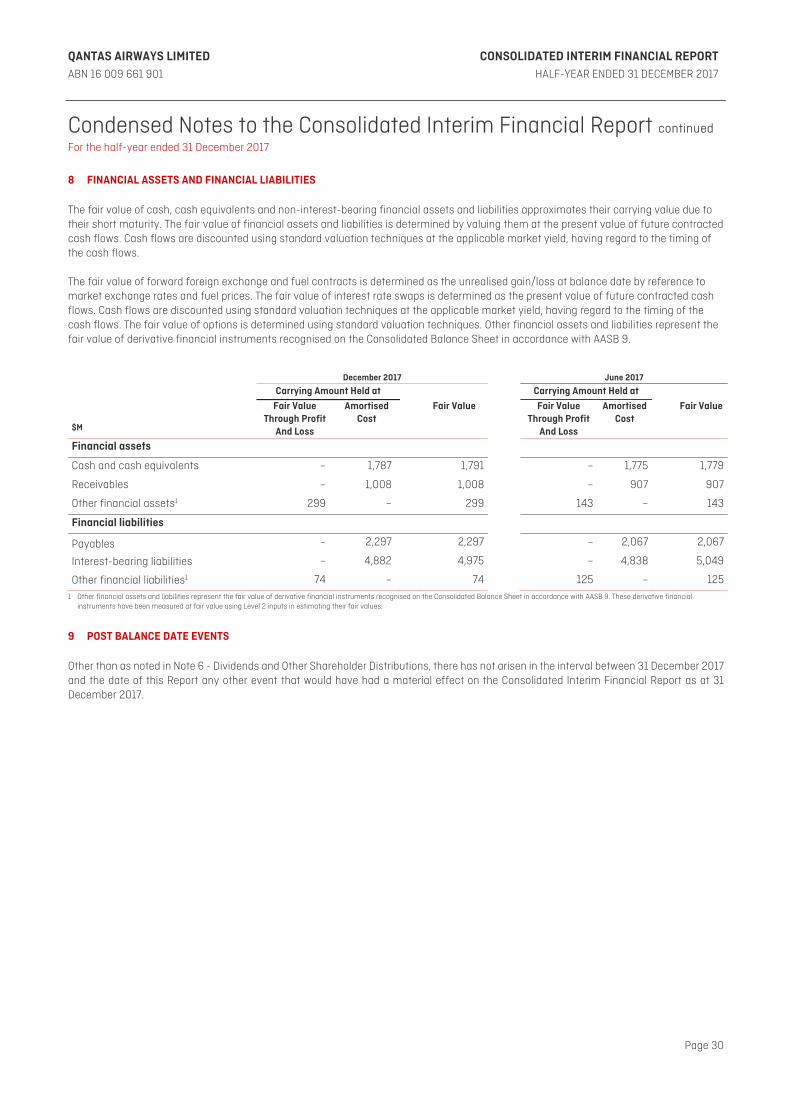
QANTAS AIRWAYS LIMITED CONSOLIDATED INTERIM FINANCIAL REPORT ABN 16 009 661 901 HALF-YEAR ENDED 31 DECEMBER 2017
Page 30
Condensed Notes to the Consolidated Interim Financial Report continued For the half-year ended 31 December 2017
8 FINANCIAL ASSETS AND FINANCIAL LIABILITIES
The fair value of cash, cash equivalents and non-interest-bearing financial assets and liabilities approximates their carrying value due to their short maturity. The fair value of financial assets and liabilities is determined by valuing them at the present value of future contracted cash flows. Cash flows are discounted using standard valuation techniques at the applicable market yield, having regard to the timing of the cash flows. The fair value of forward foreign exchange and fuel contracts is determined as the unrealised gain/loss at balance date by reference to market exchange rates and fuel prices. The fair value of interest rate swaps is determined as the present value of future contracted cash flows. Cash flows are discounted using standard valuation techniques at the applicable market yield, having regard to the timing of the cash flows. The fair value of options is determined using standard valuation techniques. Other financial assets and liabilities represent the fair value of derivative financial instruments recognised on the Consolidated Balance Sheet in accordance with AASB 9.
December 2017
June 2017
Carrying Amount Held at Carrying Amount Held at
$M
Fair Value Through Profit
And Loss
Amortised Cost
Fair Value Fair Value Through Profit
And Loss
Amortised Cost
Fair Value
Financial assets Cash and cash equivalents – 1,787 1,791 – 1,775 1,779
Receivables – 1,008 1,008 – 907 907
Other financial assets1 299 – 299 143 – 143
Financial liabilities
Payables – 2,297 2,297 – 2,067 2,067
Interest-bearing liabilities – 4,882 4,975 – 4,838 5,049
Other financial liabilities1 74 – 74 125 – 1251 Other financial assets and liabilities represent the fair value of derivative financial instruments recognised on the Consolidated Balance Sheet in accordance with AASB 9. These derivative financial
instruments have been measured at fair value using Level 2 inputs in estimating their fair values.
9 POST BALANCE DATE EVENTS
Other than as noted in Note 6 - Dividends and Other Shareholder Distributions, there has not arisen in the interval between 31 December 2017 and the date of this Report any other event that would have had a material effect on the Consolidated Interim Financial Report as at 31 December 2017.
Page 31
KPMG, an Australian partnership and a member firm of the KPMG network of independent member firms affiliated with KPMG International Cooperative (“KPMG International”), a Swiss entity. Liability limited by a scheme approved under Profession Standards Legislation.
Lead Auditor’s Independence Declaration under Section 307C of the Corporations Act 2001 To: the Directors of Qantas Airways Limited
I declare that, to the best of my knowledge and belief, in relation to the review for the half-year ended 31 December 2017 there have been:
i. no contraventions of the auditor independence requirements as set out in the Corporations Act 2001 in relation to the review; and
ii. no contraventions of any applicable code of professional conduct in relation to the review.
KPMG Sydney 22 February 2018
Andrew Yates Partner
QANTAS AIRWAYS LIMITED CONSOLIDATED INTERIM FINANCIAL REPORT ABN 16 009 661 901 HALF-YEAR ENDED 31 DECEMBER 2017
Page 32
DIRECTORS' DECLARATION In the opinion of the Directors of Qantas Airways Limited: (a) the Consolidated Interim Financial Report and notes set out on pages 16 to 30 are in accordance with the Corporations Act 2001,
including: i. giving a true and fair view of the financial position of the Qantas Group as at 31 December 2017 and of its performance, as
represented by the results of its operations and cash flows for the half-year ended on that date; and ii. complying with Australian Accounting Standard AASB 134: Interim Financial Reporting and the Corporations Regulations 2001; and
(b) there are reasonable grounds to believe that Qantas Airways Limited and its controlled entities will be able to pay its debts as and when
they become due and payable. Signed pursuant to a Resolution of the Directors:
LEIGH CLIFFORD, AO Chairman
ALAN JOYCE, AC Chief Executive Officer Sydney 22 February 2018
Page 33
KPMG, an Australian partnership and a member firm of the KPMG network of independent member firms affiliated with KPMG International Cooperative (“KPMG International”), a Swiss entity. Liability limited by a scheme approved under Profession Standards Legislation.
Independent Auditor’s Review Report
To the members of Qantas Airways Limited
Conclusion
We have reviewed the accompanying Consolidated Interim Financial Report of Qantas Airways Limited (Interim Financial Report).
Based on our review, which is not an audit, we have not become aware of any matter that makes us believe that the Interim Financial Report is not in accordance with the Corporations Act 2001, including:
i) giving a true and fair view of the Group’s financial position as at 31 December 2017 and of its performance for the Interim Period ended on that date; and
ii) complying with Australian Accounting Standard AASB 134 Interim Financial Reporting and the Corporations Regulations 2001.
The Interim Financial Report comprises:
the Consolidated Balance Sheet as at 31 December 2017;
the Consolidated Income Statement, Consolidated Statement of Comprehensive Income, Consolidated Statement of Changes in Equity and Consolidated Cash Flow Statement for the Interim Period ended on that date;
notes 1 to 9 comprising a summary of significant accounting policies and other explanatory information; and
the Directors’ declaration.
The Group comprises Qantas Airways Limited (the Company) and the entities it controlled at the Interim Period’s end or from time to time during the Interim Period.
The Interim Period is the six months ending on 31 December 2017.
Responsibilities of the Directors for the Interim Financial Report
The Directors of the Company are responsible for:
• the preparation of the Interim Financial Report that gives a true and fair view in accordance with Australian Accounting Standards and the Corporations Act 2001; and
• for such internal control as the Directors determine is necessary to enable the preparation of the Interim Financial Report that is free from material misstatement, whether due to fraud or error.
Auditor’s responsibility for the review of the Interim Financial Report
Our responsibility is to express a conclusion on the Interim Financial Report based on our review. We conducted our review in accordance with Auditing Standard on Review Engagements ASRE 2410 Review of a Financial Report Performed by the Independent Auditor of the Entity, in order to state whether, on the basis of the procedures described, we have become aware of any matter that makes us believe that the Interim Financial Report is not in accordance with the Corporations Act 2001 including: giving a true and fair view of the Group’s financial position as at 31 December 2017 and its performance for the Interim Period ended on that date; and complying with Australian Accounting Standard AASB 134 Interim Financial Reporting and the Corporations Regulations 2001. As auditor of Qantas Airways Limited, ASRE 2410 requires that we comply with the ethical requirements relevant to the audit of the annual financial report. A review of an interim period consists of making enquiries, primarily of persons responsible for financial and accounting matters, and applying analytical and other review procedures. A review is substantially less in scope than an audit conducted in accordance with Australian Auditing Standards and consequently does not enable us to obtain assurance that we would become aware of all significant matters that might be identified in an audit. Accordingly, we do not express an audit opinion.
Independence
In conducting our review, we have complied with the independence requirements of the Corporations Act 2001.
KPMG Sydney 22 February 2018
Andrew Yates Partner
Julian McPherson Partner
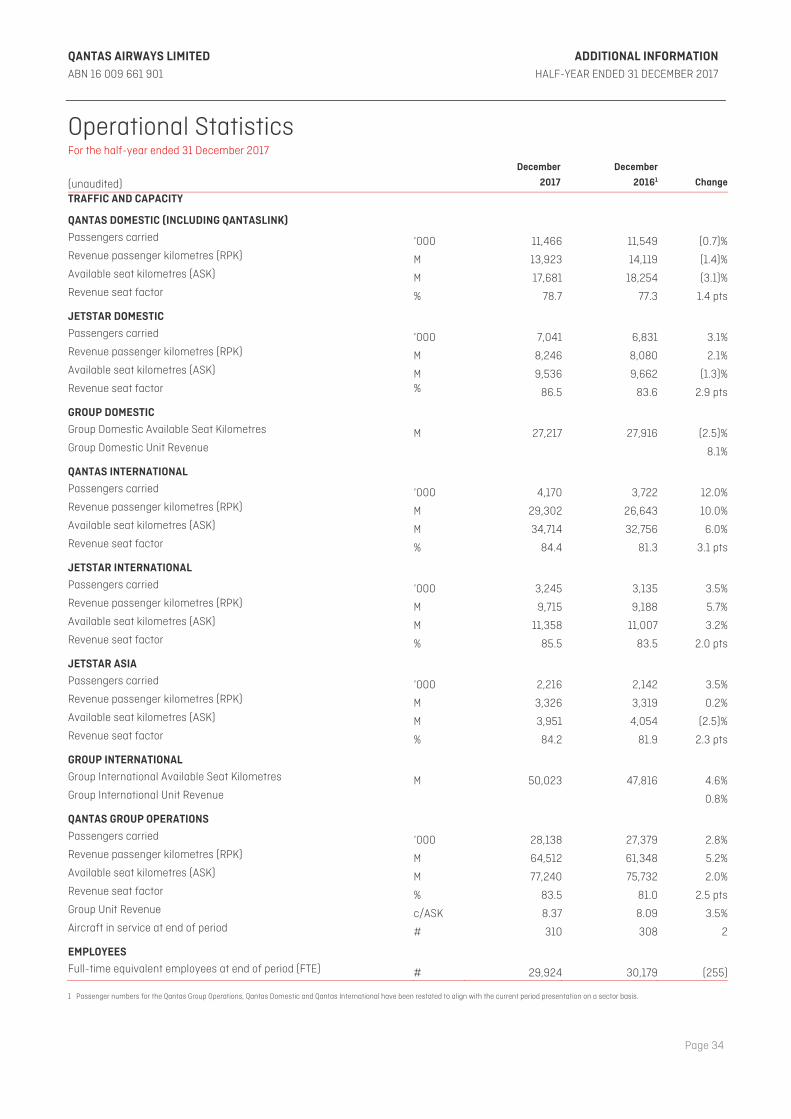
QANTAS AIRWAYS LIMITED ADDITIONAL INFORMATION ABN 16 009 661 901 HALF-YEAR ENDED 31 DECEMBER 2017
Page 34
Operational Statistics For the half-year ended 31 December 2017
(unaudited)
December
2017
December
20161 Change
TRAFFIC AND CAPACITY
QANTAS DOMESTIC (INCLUDING QANTASLINK)
Passengers carried ‘000 11,466 11,549 (0.7)%Revenue passenger kilometres (RPK) M 13,923 14,119 (1.4)%Available seat kilometres (ASK) M 17,681 18,254 (3.1)%Revenue seat factor % 78.7 77.3 1.4 pts
JETSTAR DOMESTIC
Passengers carried ‘000 7,041 6,831 3.1%Revenue passenger kilometres (RPK) M 8,246 8,080 2.1%Available seat kilometres (ASK) M 9,536 9,662 (1.3)%Revenue seat factor % 86.5 83.6 2.9 pts
GROUP DOMESTIC
Group Domestic Available Seat Kilometres M 27,217 27,916 (2.5)%Group Domestic Unit Revenue 8.1%
QANTAS INTERNATIONAL
Passengers carried ‘000 4,170 3,722 12.0%Revenue passenger kilometres (RPK) M 29,302 26,643 10.0%Available seat kilometres (ASK) M 34,714 32,756 6.0%Revenue seat factor % 84.4 81.3 3.1 pts
JETSTAR INTERNATIONAL
Passengers carried ‘000 3,245 3,135 3.5%Revenue passenger kilometres (RPK) M 9,715 9,188 5.7%Available seat kilometres (ASK) M 11,358 11,007 3.2%Revenue seat factor % 85.5 83.5 2.0 pts
JETSTAR ASIA
Passengers carried ‘000 2,216 2,142 3.5%Revenue passenger kilometres (RPK) M 3,326 3,319 0.2%Available seat kilometres (ASK) M 3,951 4,054 (2.5)%Revenue seat factor % 84.2 81.9 2.3 pts
GROUP INTERNATIONAL
Group International Available Seat Kilometres M 50,023 47,816 4.6%Group International Unit Revenue 0.8%
QANTAS GROUP OPERATIONS
Passengers carried ‘000 28,138 27,379 2.8%Revenue passenger kilometres (RPK) M 64,512 61,348 5.2%Available seat kilometres (ASK) M 77,240 75,732 2.0%Revenue seat factor % 83.5 81.0 2.5 ptsGroup Unit Revenue c/ASK 8.37 8.09 3.5%Aircraft in service at end of period # 310 308 2
EMPLOYEES
Full-time equivalent employees at end of period (FTE) # 29,924 30,179 (255)
1 Passenger numbers for the Qantas Group Operations, Qantas Domestic and Qantas International have been restated to align with the current period presentation on a sector basis.


![INVESTOR FACT SHEET - Denver Gold Group Resources Fact...Shareholding [1] (shares in millions) Public Float 161.7 Silver Standard Shares 17.0 Total Issued & Outstanding Shares 178.8](https://img.pdfslide.us/doc/110x75/5e7178c6fb707741215015b0/investor-fact-sheet-denver-gold-group-resources-fact-shareholding-1-shares.jpg)