Embed Size (px)
Citation preview
1 Date: 2014-08-11
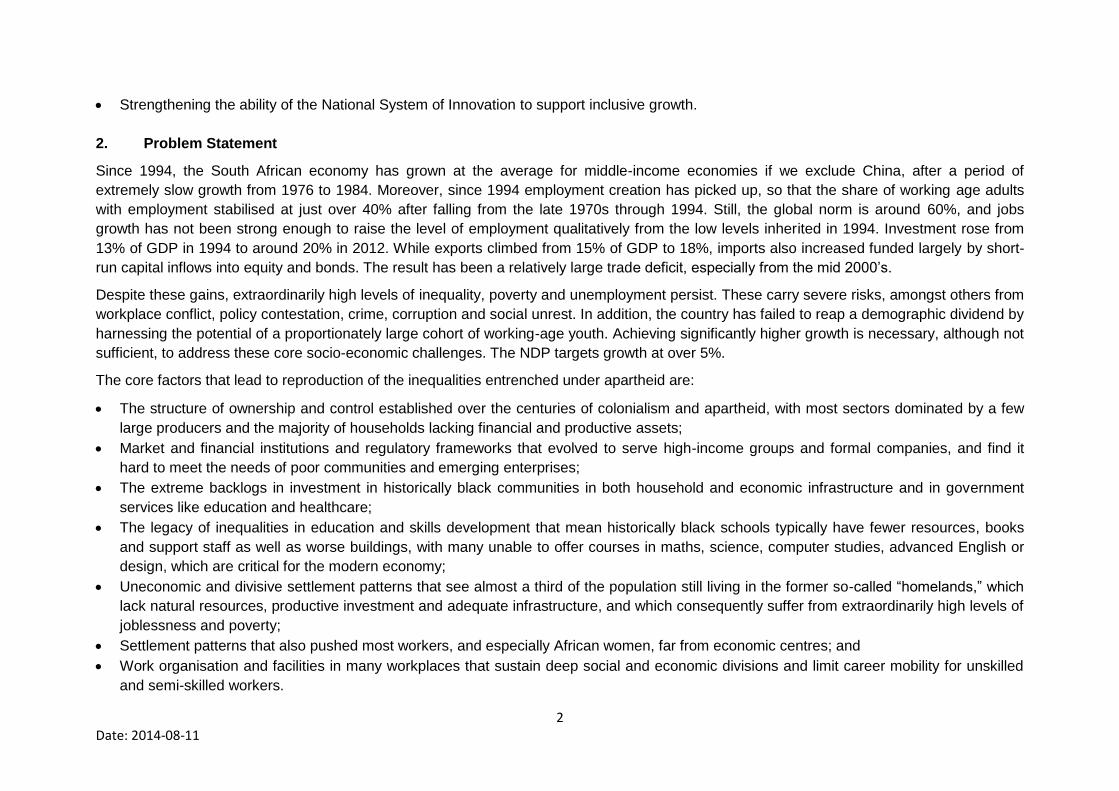
Appendix 4
Outcome 4: Decent employment through inclusive economic growth
1. NDP 2030 vision and trajectory
The NDP provides a long term vision through 2030 for accelerating GDP growth so that unemployment and inequality can be reduced and for
creating a more inclusive society. This will be achieved through diligent implementation of implementation plans and programmes, in particular
the New Growth Path (NGP) the Industrial Policy Action Plan (IPAP) and the National Infrastructure Plan.
The next five years will require a balance between creating a stable and supportive environment for growth and investment while at the same
time addressing the many structural challenges our economy and society faces. In addition to long-standing regulatory, infrastructure and skills
weaknesses, inequality in itself has become a core obstacle to investment and growth. By extension, efforts to support growth must
simultaneously ensure more equitable distribution of ownership and income.
Specific measures to support growth include:
- Building enough energy generation capacity to power the economy
- Taking steps to ensure address the skills shortage including allowing importation in the immediate term
- Ensuring that the regulatory framework avoids unnecessary costs to producers and supports sustainable investment while continuing to
encourage employment creation and economic inclusion.
Employment intensive programmes and initiatives will receive top priority, especially those that target the youth and women. Investment in new
sources of growth will be encouraged and incentivised. Achieving this aim will depend crucially on:
Implementation of the National Infrastructure Plan in ways that crowd in productive investment both by users of the infrastructure and by
suppliers of inputs;
Driving growth in the productive sectors and the other priority Jobs Drivers identified in the New Growth Path, through the implementation of
IPAP and similar sector-based action plans for agriculture and mining;
Supporting exports and African regional development;
Maintaining a fiscal stance that promotes sustainable growth, investment and job creation;
Improving the ability of the education and skills systems to meet the needs of the economy;
Expanding public employment schemes, including the proposed youth brigades, as far as possible in ways that empower communities and
support the involvement of youth in serving them;
Supporting rural development and stimulating agricultural production and employment; and
2 Date: 2014-08-11
Strengthening the ability of the National System of Innovation to support inclusive growth.
2. Problem Statement
Since 1994, the South African economy has grown at the average for middle-income economies if we exclude China, after a period of
extremely slow growth from 1976 to 1984. Moreover, since 1994 employment creation has picked up, so that the share of working age adults
with employment stabilised at just over 40% after falling from the late 1970s through 1994. Still, the global norm is around 60%, and jobs
growth has not been strong enough to raise the level of employment qualitatively from the low levels inherited in 1994. Investment rose from
13% of GDP in 1994 to around 20% in 2012. While exports climbed from 15% of GDP to 18%, imports also increased funded largely by short-
run capital inflows into equity and bonds. The result has been a relatively large trade deficit, especially from the mid 2000’s.
Despite these gains, extraordinarily high levels of inequality, poverty and unemployment persist. These carry severe risks, amongst others from
workplace conflict, policy contestation, crime, corruption and social unrest. In addition, the country has failed to reap a demographic dividend by
harnessing the potential of a proportionately large cohort of working-age youth. Achieving significantly higher growth is necessary, although not
sufficient, to address these core socio-economic challenges. The NDP targets growth at over 5%.
The core factors that lead to reproduction of the inequalities entrenched under apartheid are:
The structure of ownership and control established over the centuries of colonialism and apartheid, with most sectors dominated by a few
large producers and the majority of households lacking financial and productive assets;
Market and financial institutions and regulatory frameworks that evolved to serve high-income groups and formal companies, and find it
hard to meet the needs of poor communities and emerging enterprises;
The extreme backlogs in investment in historically black communities in both household and economic infrastructure and in government
services like education and healthcare;
The legacy of inequalities in education and skills development that mean historically black schools typically have fewer resources, books
and support staff as well as worse buildings, with many unable to offer courses in maths, science, computer studies, advanced English or
design, which are critical for the modern economy;
Uneconomic and divisive settlement patterns that see almost a third of the population still living in the former so-called “homelands,” which
lack natural resources, productive investment and adequate infrastructure, and which consequently suffer from extraordinarily high levels of
joblessness and poverty;
Settlement patterns that also pushed most workers, and especially African women, far from economic centres; and
Work organisation and facilities in many workplaces that sustain deep social and economic divisions and limit career mobility for unskilled
and semi-skilled workers.
3 Date: 2014-08-11
Government has made progress in addressing these deep-seated systemic blockages to more equitable growth. Still, much more needs to be
done. The kind of far-reaching change required poses challenges, because:
1. The host of new regulations required must not impose unnecessary compliance burdens, costs that exceed the hoped-for benefits, or
excessive risks of failure;
2. The complex of regulatory and systemic changes add to the capacity required of the state as well as other stakeholders; and
3. The risk of unintended consequences is high.
It is therefore important that the coming period include a stock-take of regulations that aims to reduce unnecessary delays, compliance burdens
and costs. That does not mean the developmental state will not take vigorous action to drive transformation, but rather that it will seek to
achieve its aims as efficiently as possible, in ways that support growing productivity, competitiveness and investment.
3. MTSF sub-outcomes and actions to achieve the vision
To pave the way for accelerated economic progress over the next 20 years, South Africa needs to make tough decisions that will involve both
compromises and trade-offs. These decisions are captured broadly in the NDP, with more specific proposals included in the NGP, IPAP and
the National Infrastructure Plan. That said, many economic factors lie outside the control of the government and indeed may originate outside
the country altogether. Nonetheless, it is important to develop consistent, efficient and effective strategies to support growth with job creation
and equity.
Radical change must bring real benefits to working people and the poor across South Africa. At the same time, Government will engage with
business through the Presidential Business Working Group and the related bilateral on key areas of interest to identify blockages to production
and employment and to encourage local and foreign investors to do more to support inclusive growth.
Driving inclusive growth requires that economic agencies increase their capacity in terms of institutional structure and skills to address promptly
blockages to investment and job creation in their areas of responsibility, as well as to identify and facilitate sustainable programmes that can act
as catalysts for long-term economic development.
Key sub-outcomes and the actions to achieve them are the following.
4 Date: 2014-08-11
Sub Outcome One: Productive investment is effectively crowded in through the infrastructure build programme
The National Infrastructure Plan is intended to crowd in productive investment through developing the economic infrastructure required for
growth of both existing and emerging producers, with appropriate pricing, regulatory, procurement and other supports. Public investment should
rise to around 10% of GDP over the period.
The provision of infrastructure falls under Outcome 6, but the departments in Outcome 4 can maximise the economic multipliers of the build
programme by:
Establishing complementary measures to support new investment based on the improved provision of logistics, energy and water
Increasing the levels of local procurement by supporting local production of infrastructure inputs
Assisting in assessing both the macro and micro economic costs and benefits of infrastructure projects, and recommending appropriate
financing strategies and tariffs for producers on that basis.
Sub Outcome Two: The productive sectors account for a growing share of production and employment
The Industrial Policy Action Plan (IPAP) provides well-defined, sector-based plans for manufacturing, with specific deliverables and timeframes.
It will be supplemented by similar plans for agriculture, mining and emerging industries as well as the other Jobs Drivers in the New Growth
Path. These plans will be supported by all state agencies, with regular reports to the Productive Sectors Forum, the Economic Sector and
Employment Sectors Cluster as well as the relevant MinMECs. They will:
Address the specific constraints on key sectors and clusters for growth and job creation;
Support more diversified exports, especially to Africa, as well as increasingly affordable and quality production of necessities and
intermediate inputs;
Promote local procurement to increase domestic production and monitor compliance with Preferential Procurement Policy Framework Act;
Support African regional development through development of regional value chains;
Help manage the transition to a greener economy in ways that minimise the costs, especially to working people and poor communities, and
maximise the benefits; and
Improve the regulation of the economy through the use of more rigorous impact assessments for both prospective and existing regulations
as well as consistent consultation with stakeholders.
5 Date: 2014-08-11
Sub Outcome Three: The elimination of unnecessary regulatory burdens and lower price increases for key inputs and wage goods
fosters business confidence, reduces costs for working people and producers, and sustains investment and economic growth
The state will improve overall competitiveness by ensuring a more efficient regulatory framework and by reviewing both administered prices
(especially for electricity, freight, telecommunications, education and water), and prices for intermediate inputs and necessities such as food,
health, steel and heavy chemicals. Specifically, the Outcome 4 Coordinating Departments will:
Improve engagement and trust with economic stakeholders through the Presidential Business and Labour Working Groups and related
bilaterals on key areas of interest to identify blockages to production and employment.
Work with Cabinet Office and other departments to improve the systems and capacity for assessing the impact on growth, investment and
employment of proposed and existing regulations, with a view to improving them.
Work with the relevant departments and metros to measure and as far as possible reduce delays and unnecessary red tape around
authorisations needed for investments.
Monitor administered prices to producers as well as prices for wage goods and, where they are rising above inflation, identify realistic
options for slowing their increase to the rate of inflation or below.
Monitor prices for intermediate inputs and, where they include monopoly rents of any kind, identify ways to reduce them.
Improve and streamline regulation to reduce the burden of importing core and critical skills needed for the economy.
Sub Outcome Four: Workers’ education and skills increasingly meet economic needs
The engagement of economic stakeholders and policymakers in demand-side planning for education and skills development will be improved,
so that investment in these areas more effectively meets economic needs and does more to support employment creation, growth and
constructive workplace relations.
This sub-outcome supplements Outcome 5 by projecting the key skills and qualifications required for economic growth, with more detail
provided on infrastructure.
Sub Outcome Five: Spatial imbalances in economic opportunities are addressed through expanded employment in agriculture, the
build programme and densification in the metros
Agricultural employment is critical for improving incomes and inclusion of rural people. The relevant departments, provinces and municipalities
will work together to improve district-based planning as the basis for a holistic approach to achieve the targets for new smallholders and
6 Date: 2014-08-11
commercial agricultural employment set in the New Growth Path. Technologies to support expanded employment and smallholders in
agriculture and agro-processing will be prioritised. These efforts will build on the systematic push under the National Infrastructure Plan to
overcome the backlogs in infrastructure left in the former “homeland” regions.
This sub-outcome supplements Outcome 7 by focusing on employment creation in particular through smallholders, which is the core concern
for inclusive growth in this regard.
In the metro areas, whose efficiency is crucial for national economic growth and job creation, programmes will be intensified to support more
productive and integrated township economies, the densification of housing along transport corridors, and continued improvement in public
transport as well as, where appropriate, bicycles, motorcycles and “put puts”. The aim is to facilitate job searches by the unemployed, and to
improve attendance at work and reduce the cost of living, bolstering productivity and facilitating continuous production.
Sub Outcome Six: Macroeconomic conditions support employment-creating growth
Government will continue to pursue fiscal policy that supports sustainable growth, employment creation and investment.
In addition, Government will implement measures to ensure the financial sector serves the real economy and people. This will necessitate the
assessment of measures to increase the availability of industrial finance at competitive costs and for appropriate periods of time given that
industrial projects are long-term investments; measures to lower the cost of financial services such as banking costs and retirement fund costs
for especially for poor people; and steps to improve the stability of the exchange rate at a competitive level accompanied by measures to
reduce the impact of currency volatility on the productive sectors.
Sub Outcome Seven: Workplace conflict is reduced and collaboration between government, organised business and organised
labour improves
Identifying effective interventions to reduce workplace conflict and facilitate constructive labour relations, in particular by engaging with
business and labour on ways to enhance career mobility linked to skills development, improve communication in the workplace, and reduce
unfair inequalities; and support the improvement of social partner engagement with a greater emphasis on industry and workplace level
cooperation. Labour regulation in this regard will play an important role to protect and extend worker rights, support more equitable pay, and
improve efficiencies in the labour market.
7 Date: 2014-08-11
Sub Outcome Eight: Economic opportunities for historically excluded and vulnerable groups are expanded and the growth and
development in small business and cooperatives is improved markedly
While all economic policies and programmes should provide specific support for historically excluded and vulnerable groups (in particular black
women and youth as well as people with disabilities), it is important to develop targeted measures to improve their engagement with and
benefits from economic activity.
Government will continue to implement the Youth Employment Strategy and review and strengthen strategies to improve the position of black
women, in the formal economy in particular. The new Small Business Ministry will work with sectoral departments and development finance
institutions to ensure that opportunities for small business expand, in particular through expanded access to incubators, marketing agencies
and co-ops, industrial and retail sites, and finance amongst others. Growth in small business and cooperatives will help reduce in the current
high levels of market concentration and monopolies in key sectors of the economy.
Sub Outcome Nine: Public employment schemes provide relief for the unemployed and build community solidarity and agency
Employment in public employment schemes will grow to 6 million work opportunities by 2019, with most of the growth by 2015 (we can only say
this of it is in line with the current MTEF), in the Youth Brigades and the Community Work Programme.
Sub Outcome Ten: Investment in research, development and innovation supports inclusive growth by enhancing productivity of
existing and emerging enterprises and supporting the development of new industries.
Technological advance should support increased productivity in both the formal sector and in emerging and smaller enterprises, as well as
raising the living standards of poor people. Government will explore ways to incentivise increased and more effective research, development,
innovation and diffusion of technologies to achieve these aims. Partnerships and funding arrangements will be strengthened to effectively
translate advances in publicly-funded capabilities and competencies in Science, Technology and Innovation into new industrial development
and employment opportunities. Finally, local technological solutions will be included in IPAP and in the delivery of large-scale infrastructure
projects.
8 Date: 2014-08-11
4. Management of Implementation
Implementing the targets related to outcome 4 will be led by the Minister of Trade and Industry and require a coordinated effort by the Ministers
of Trade and Industry, Economic Development, Finance, Public Enterprises, Small Business Development, Rural Development and Land
Reform, Science and Technology, Mineral Resources, Agriculture, Food and Fisheries, and Public Works.
The core departments will monitor outcomes for the jobs drivers as well as cross-cutting interventions and develop an early-warning system to
ensure a faster response to threats and opportunities. They will report on the findings in a narrative form in the Outcome 4 reports. These
reports will include a dashboard indicating where decisions and actions are required to achieve the overall outcome.
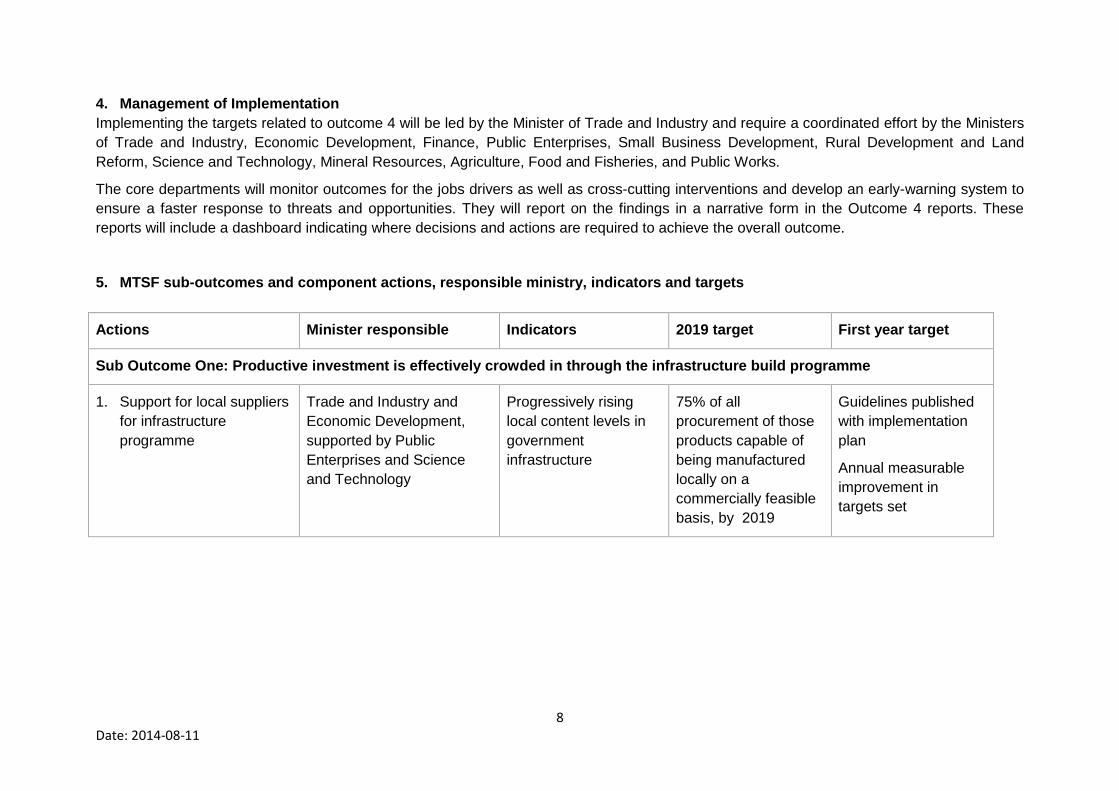
5. MTSF sub-outcomes and component actions, responsible ministry, indicators and targets
Actions Minister responsible Indicators 2019 target First year target
Sub Outcome One: Productive investment is effectively crowded in through the infrastructure build programme
1. Support for local suppliers
for infrastructure
programme
Trade and Industry and
Economic Development,
supported by Public
Enterprises and Science
and Technology
Progressively rising
local content levels in
government
infrastructure
75% of all
procurement of those
products capable of
being manufactured
locally on a
commercially feasible
basis, by 2019
Guidelines published
with implementation
plan
Annual measurable
improvement in
targets set
9 Date: 2014-08-11
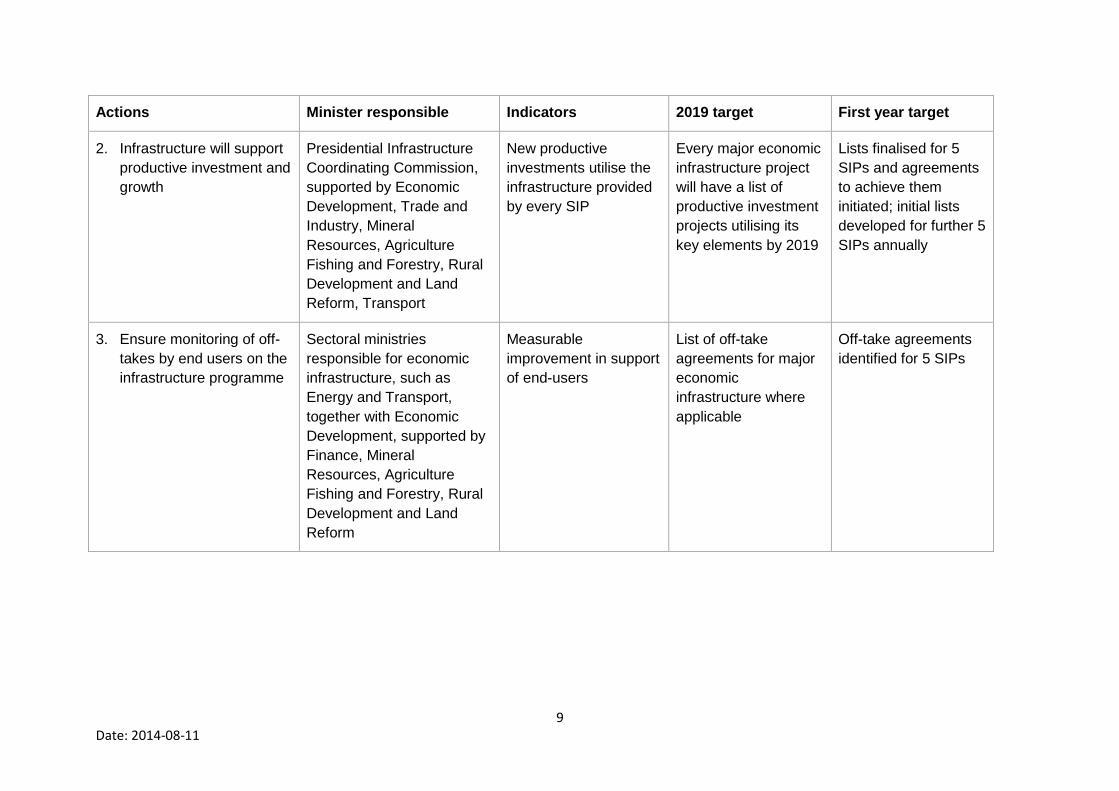
Actions Minister responsible Indicators 2019 target First year target
2. Infrastructure will support
productive investment and
growth
Presidential Infrastructure
Coordinating Commission,
supported by Economic
Development, Trade and
Industry, Mineral
Resources, Agriculture
Fishing and Forestry, Rural
Development and Land
Reform, Transport
New productive
investments utilise the
infrastructure provided
by every SIP
Every major economic
infrastructure project
will have a list of
productive investment
projects utilising its
key elements by 2019
Lists finalised for 5
SIPs and agreements
to achieve them
initiated; initial lists
developed for further 5
SIPs annually
3. Ensure monitoring of off-
takes by end users on the
infrastructure programme
Sectoral ministries
responsible for economic
infrastructure, such as
Energy and Transport,
together with Economic
Development, supported by
Finance, Mineral
Resources, Agriculture
Fishing and Forestry, Rural
Development and Land
Reform
Measurable
improvement in support
of end-users
List of off-take
agreements for major
economic
infrastructure where
applicable
Off-take agreements
identified for 5 SIPs
10 Date: 2014-08-11
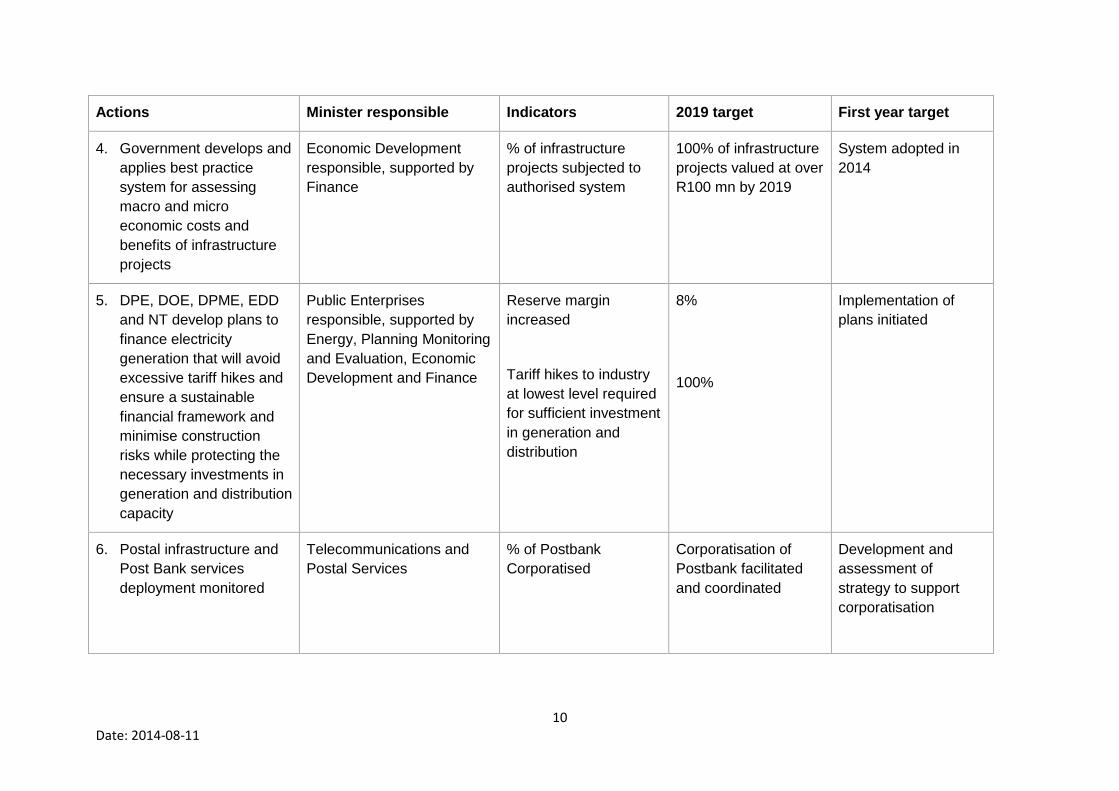
Actions Minister responsible Indicators 2019 target First year target
4. Government develops and
applies best practice
system for assessing
macro and micro
economic costs and
benefits of infrastructure
projects
Economic Development
responsible, supported by
Finance
% of infrastructure
projects subjected to
authorised system
100% of infrastructure
projects valued at over
R100 mn by 2019
System adopted in
2014
5. DPE, DOE, DPME, EDD
and NT develop plans to
finance electricity
generation that will avoid
excessive tariff hikes and
ensure a sustainable
financial framework and
minimise construction
risks while protecting the
necessary investments in
generation and distribution
capacity
Public Enterprises
responsible, supported by
Energy, Planning Monitoring
and Evaluation, Economic
Development and Finance
Reserve margin
increased
Tariff hikes to industry
at lowest level required
for sufficient investment
in generation and
distribution
8%
100%
Implementation of
plans initiated
6. Postal infrastructure and
Post Bank services
deployment monitored
Telecommunications and
Postal Services
% of Postbank
Corporatised
Corporatisation of
Postbank facilitated
and coordinated
Development and
assessment of
strategy to support
corporatisation
11 Date: 2014-08-11
Actions Minister responsible Indicators 2019 target First year target
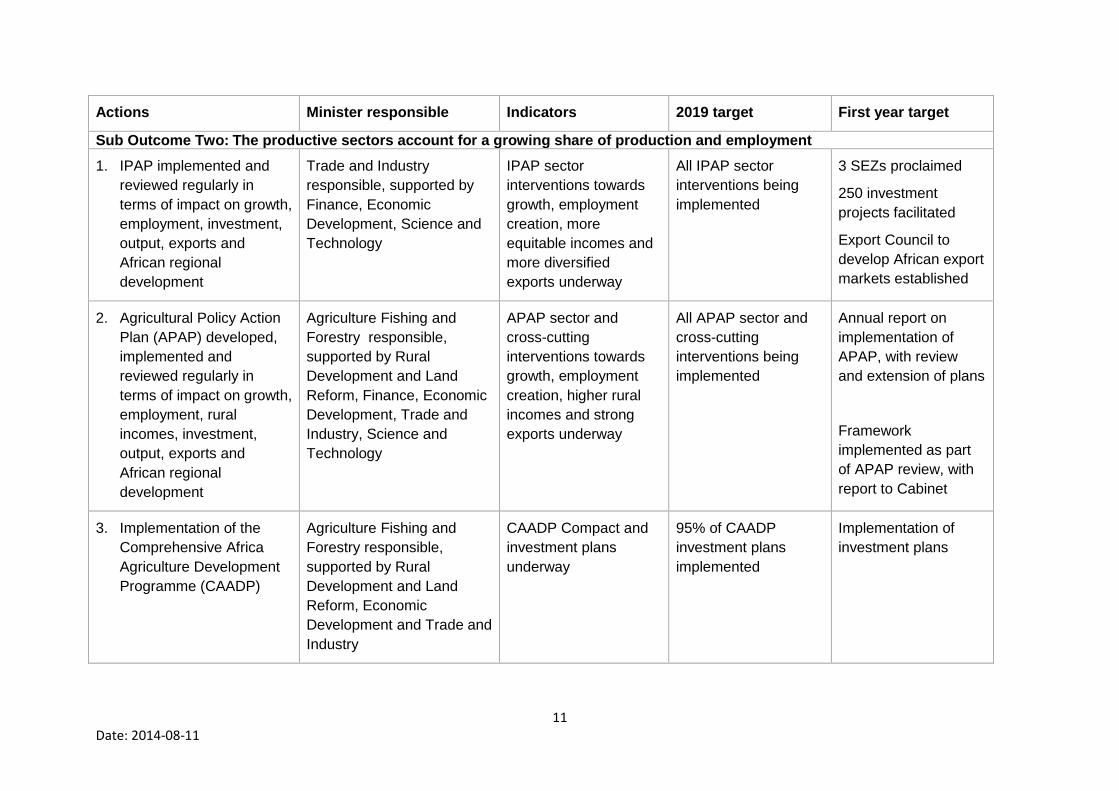
Sub Outcome Two: The productive sectors account for a growing share of production and employment
1. IPAP implemented and
reviewed regularly in
terms of impact on growth,
employment, investment,
output, exports and
African regional
development
Trade and Industry
responsible, supported by
Finance, Economic
Development, Science and
Technology
IPAP sector
interventions towards
growth, employment
creation, more
equitable incomes and
more diversified
exports underway
All IPAP sector
interventions being
implemented
3 SEZs proclaimed
250 investment
projects facilitated
Export Council to
develop African export
markets established
2. Agricultural Policy Action
Plan (APAP) developed,
implemented and
reviewed regularly in
terms of impact on growth,
employment, rural
incomes, investment,
output, exports and
African regional
development
Agriculture Fishing and
Forestry responsible,
supported by Rural
Development and Land
Reform, Finance, Economic
Development, Trade and
Industry, Science and
Technology
APAP sector and
cross-cutting
interventions towards
growth, employment
creation, higher rural
incomes and strong
exports underway
All APAP sector and
cross-cutting
interventions being
implemented
Annual report on
implementation of
APAP, with review
and extension of plans
Framework
implemented as part
of APAP review, with
report to Cabinet
3. Implementation of the
Comprehensive Africa
Agriculture Development
Programme (CAADP)
Agriculture Fishing and
Forestry responsible,
supported by Rural
Development and Land
Reform, Economic
Development and Trade and
Industry
CAADP Compact and
investment plans
underway
95% of CAADP
investment plans
implemented
Implementation of
investment plans
12 Date: 2014-08-11
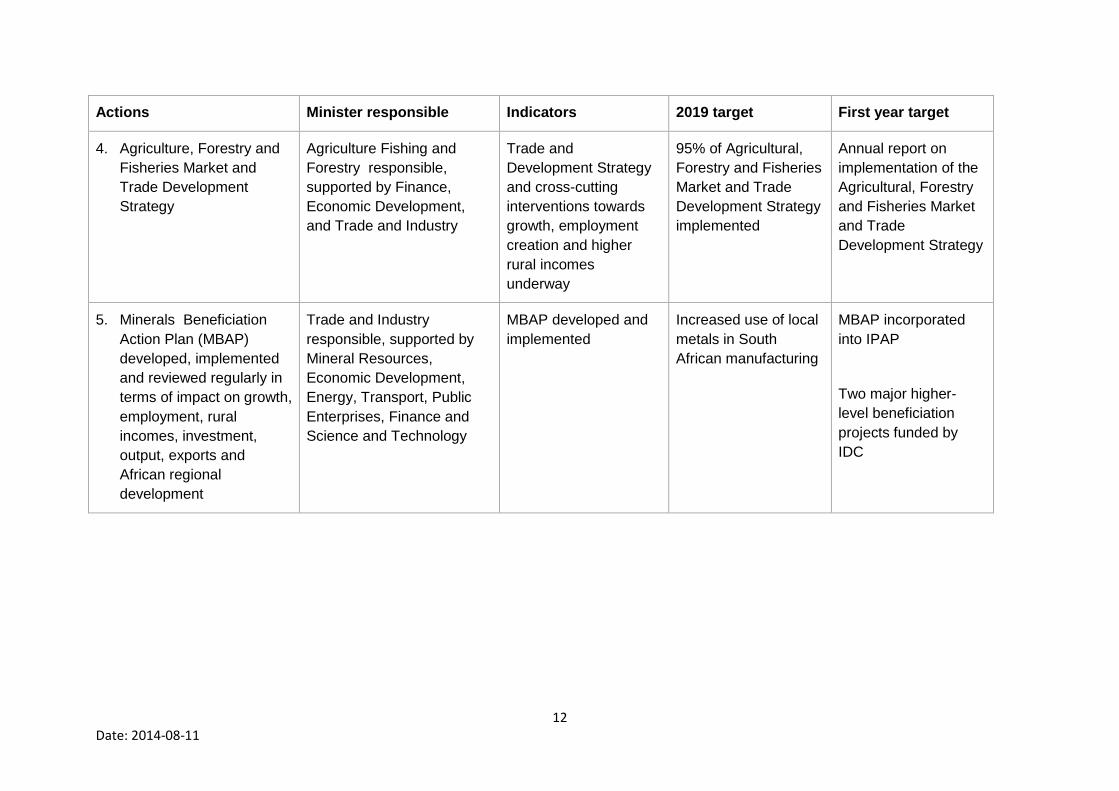
Actions Minister responsible Indicators 2019 target First year target
4. Agriculture, Forestry and
Fisheries Market and
Trade Development
Strategy
Agriculture Fishing and
Forestry responsible,
supported by Finance,
Economic Development,
and Trade and Industry
Trade and
Development Strategy
and cross-cutting
interventions towards
growth, employment
creation and higher
rural incomes
underway
95% of Agricultural,
Forestry and Fisheries
Market and Trade
Development Strategy
implemented
Annual report on
implementation of the
Agricultural, Forestry
and Fisheries Market
and Trade
Development Strategy
5. Minerals Beneficiation
Action Plan (MBAP)
developed, implemented
and reviewed regularly in
terms of impact on growth,
employment, rural
incomes, investment,
output, exports and
African regional
development
Trade and Industry
responsible, supported by
Mineral Resources,
Economic Development,
Energy, Transport, Public
Enterprises, Finance and
Science and Technology
MBAP developed and
implemented
Increased use of local
metals in South
African manufacturing
MBAP incorporated
into IPAP
Two major higher-
level beneficiation
projects funded by
IDC
13 Date: 2014-08-11
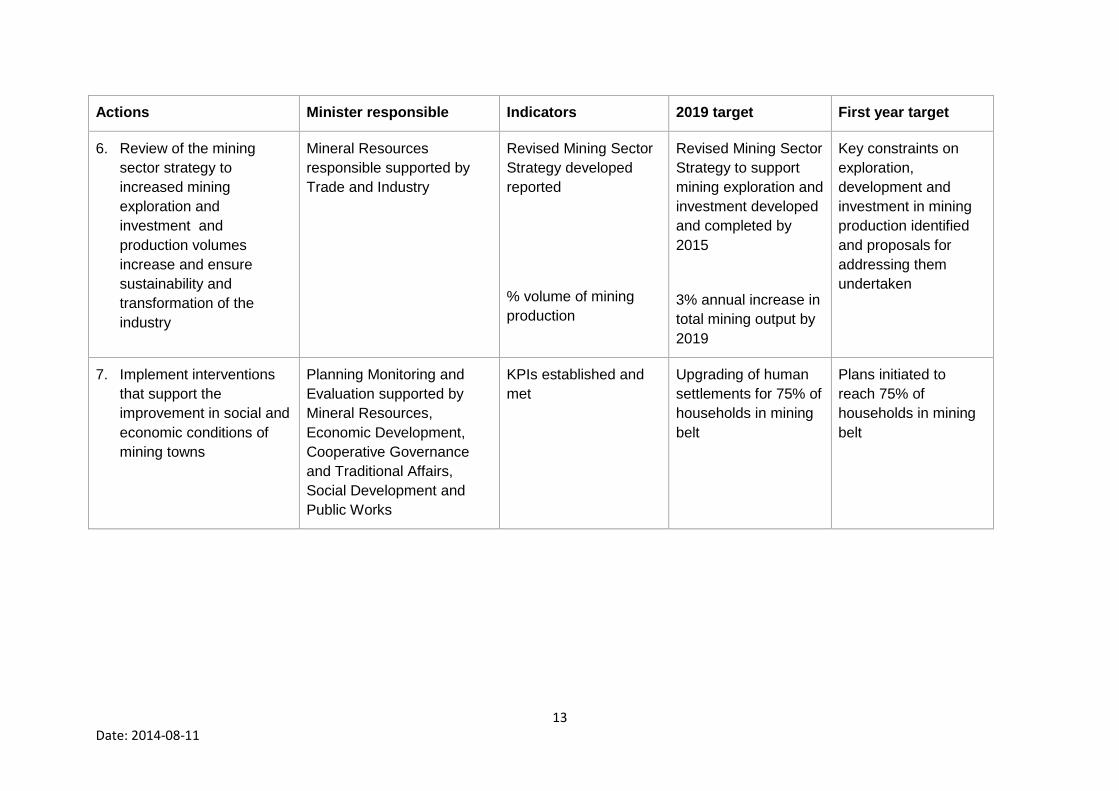
Actions Minister responsible Indicators 2019 target First year target
6. Review of the mining
sector strategy to
increased mining
exploration and
investment and
production volumes
increase and ensure
sustainability and
transformation of the
industry
Mineral Resources
responsible supported by
Trade and Industry
Revised Mining Sector
Strategy developed
reported
% volume of mining
production
Revised Mining Sector
Strategy to support
mining exploration and
investment developed
and completed by
2015
3% annual increase in
total mining output by
2019
Key constraints on
exploration,
development and
investment in mining
production identified
and proposals for
addressing them
undertaken
7. Implement interventions
that support the
improvement in social and
economic conditions of
mining towns
Planning Monitoring and
Evaluation supported by
Mineral Resources,
Economic Development,
Cooperative Governance
and Traditional Affairs,
Social Development and
Public Works
KPIs established and
met
Upgrading of human
settlements for 75% of
households in mining
belt
Plans initiated to
reach 75% of
households in mining
belt
14 Date: 2014-08-11
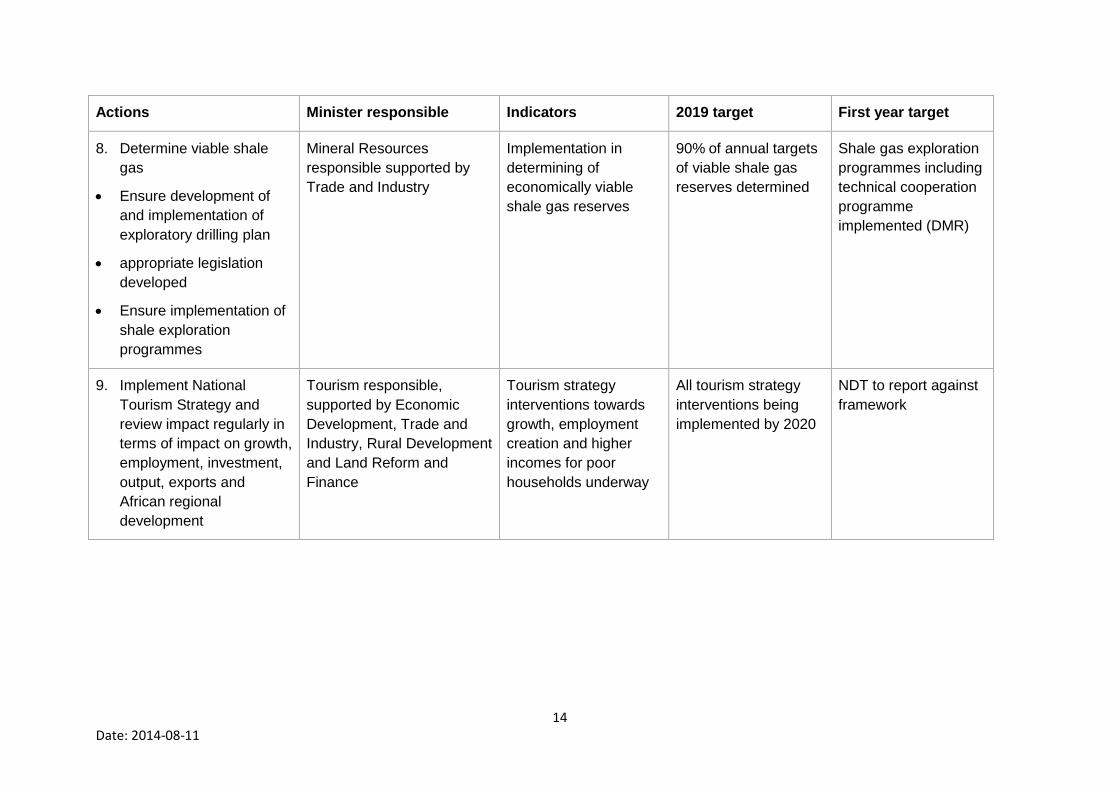
Actions Minister responsible Indicators 2019 target First year target
8. Determine viable shale
gas
Ensure development of
and implementation of
exploratory drilling plan
appropriate legislation
developed
Ensure implementation of
shale exploration
programmes
Mineral Resources
responsible supported by
Trade and Industry
Implementation in
determining of
economically viable
shale gas reserves
90% of annual targets
of viable shale gas
reserves determined
Shale gas exploration
programmes including
technical cooperation
programme
implemented (DMR)
9. Implement National
Tourism Strategy and
review impact regularly in
terms of impact on growth,
employment, investment,
output, exports and
African regional
development
Tourism responsible,
supported by Economic
Development, Trade and
Industry, Rural Development
and Land Reform and
Finance
Tourism strategy
interventions towards
growth, employment
creation and higher
incomes for poor
households underway
All tourism strategy
interventions being
implemented by 2020
NDT to report against
framework
15 Date: 2014-08-11
Actions Minister responsible Indicators 2019 target First year target
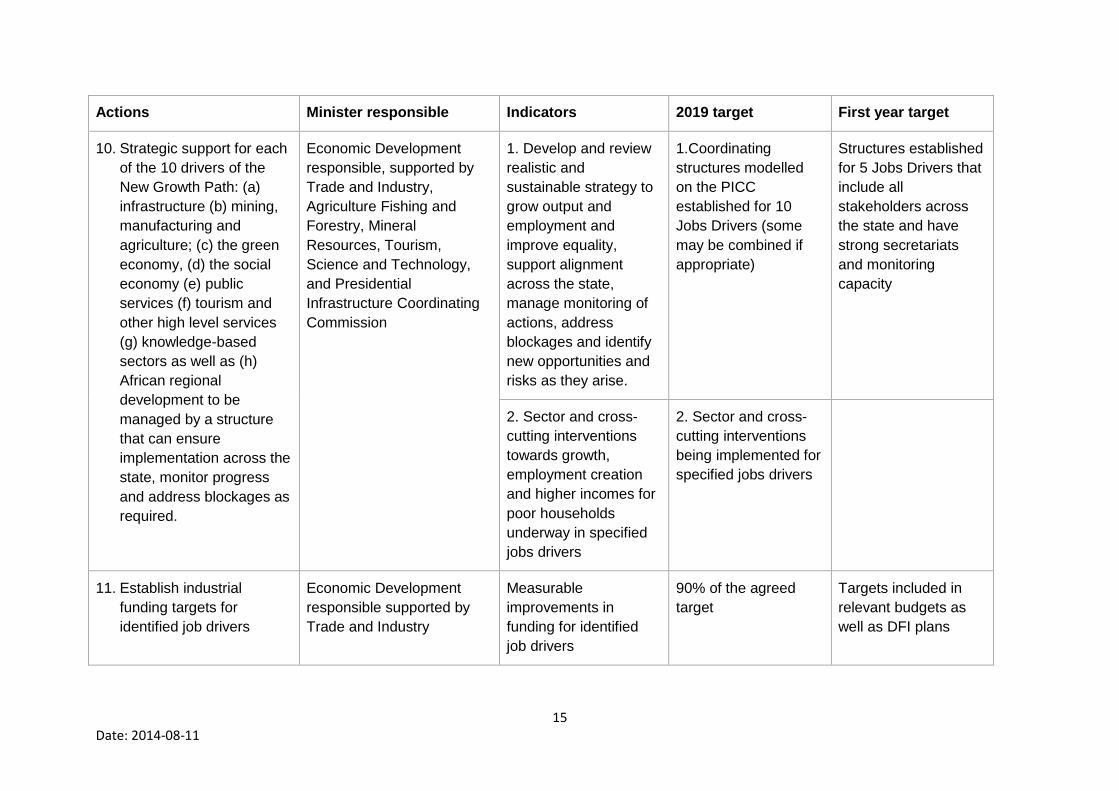
10. Strategic support for each
of the 10 drivers of the
New Growth Path: (a)
infrastructure (b) mining,
manufacturing and
agriculture; (c) the green
economy, (d) the social
economy (e) public
services (f) tourism and
other high level services
(g) knowledge-based
sectors as well as (h)
African regional
development to be
managed by a structure
that can ensure
implementation across the
state, monitor progress
and address blockages as
required.
Economic Development
responsible, supported by
Trade and Industry,
Agriculture Fishing and
Forestry, Mineral
Resources, Tourism,
Science and Technology,
and Presidential
Infrastructure Coordinating
Commission
1. Develop and review
realistic and
sustainable strategy to
grow output and
employment and
improve equality,
support alignment
across the state,
manage monitoring of
actions, address
blockages and identify
new opportunities and
risks as they arise.
1.Coordinating
structures modelled
on the PICC
established for 10
Jobs Drivers (some
may be combined if
appropriate)
Structures established
for 5 Jobs Drivers that
include all
stakeholders across
the state and have
strong secretariats
and monitoring
capacity
2. Sector and cross-
cutting interventions
towards growth,
employment creation
and higher incomes for
poor households
underway in specified
jobs drivers
2. Sector and cross-
cutting interventions
being implemented for
specified jobs drivers
11. Establish industrial
funding targets for
identified job drivers
Economic Development
responsible supported by
Trade and Industry
Measurable
improvements in
funding for identified
job drivers
90% of the agreed
target
Targets included in
relevant budgets as
well as DFI plans
16 Date: 2014-08-11
Actions Minister responsible Indicators 2019 target First year target
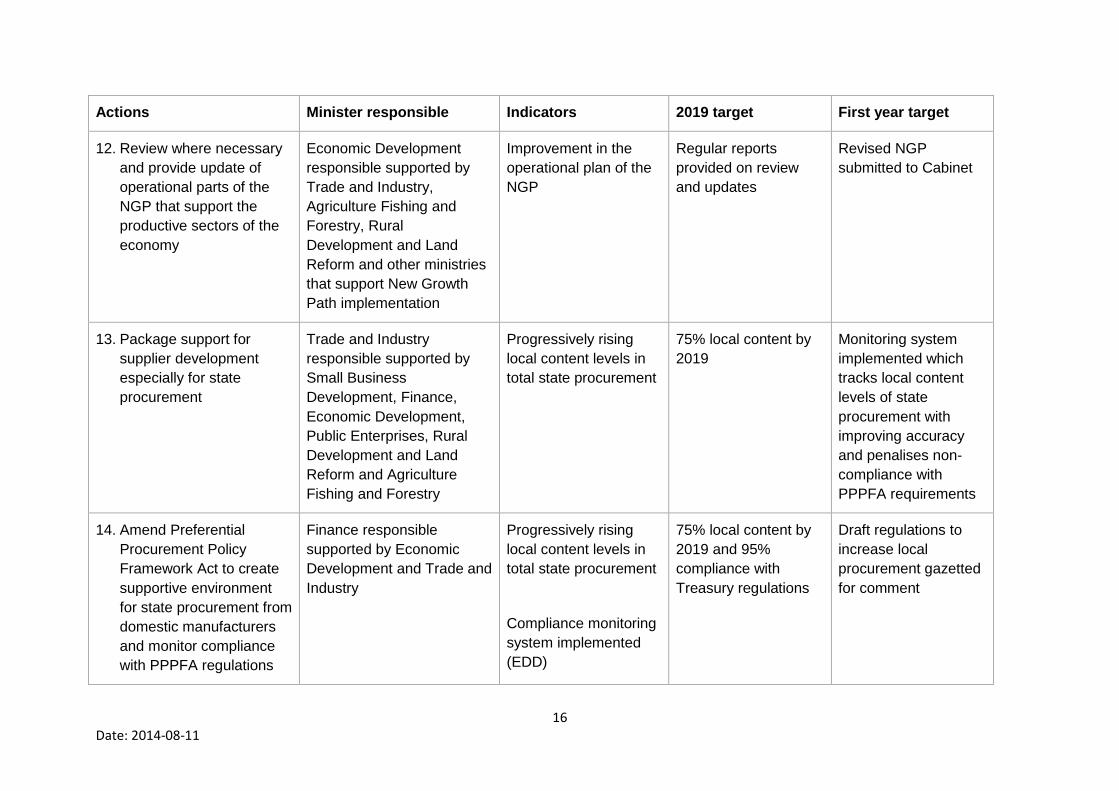
12. Review where necessary
and provide update of
operational parts of the
NGP that support the
productive sectors of the
economy
Economic Development
responsible supported by
Trade and Industry,
Agriculture Fishing and
Forestry, Rural
Development and Land
Reform and other ministries
that support New Growth
Path implementation
Improvement in the
operational plan of the
NGP
Regular reports
provided on review
and updates
Revised NGP
submitted to Cabinet
13. Package support for
supplier development
especially for state
procurement
Trade and Industry
responsible supported by
Small Business
Development, Finance,
Economic Development,
Public Enterprises, Rural
Development and Land
Reform and Agriculture
Fishing and Forestry
Progressively rising
local content levels in
total state procurement
75% local content by
2019
Monitoring system
implemented which
tracks local content
levels of state
procurement with
improving accuracy
and penalises non-
compliance with
PPPFA requirements
14. Amend Preferential
Procurement Policy
Framework Act to create
supportive environment
for state procurement from
domestic manufacturers
and monitor compliance
with PPPFA regulations
Finance responsible
supported by Economic
Development and Trade and
Industry
Progressively rising
local content levels in
total state procurement
Compliance monitoring
system implemented
(EDD)
75% local content by
2019 and 95%
compliance with
Treasury regulations
Draft regulations to
increase local
procurement gazetted
for comment
17 Date: 2014-08-11
Actions Minister responsible Indicators 2019 target First year target
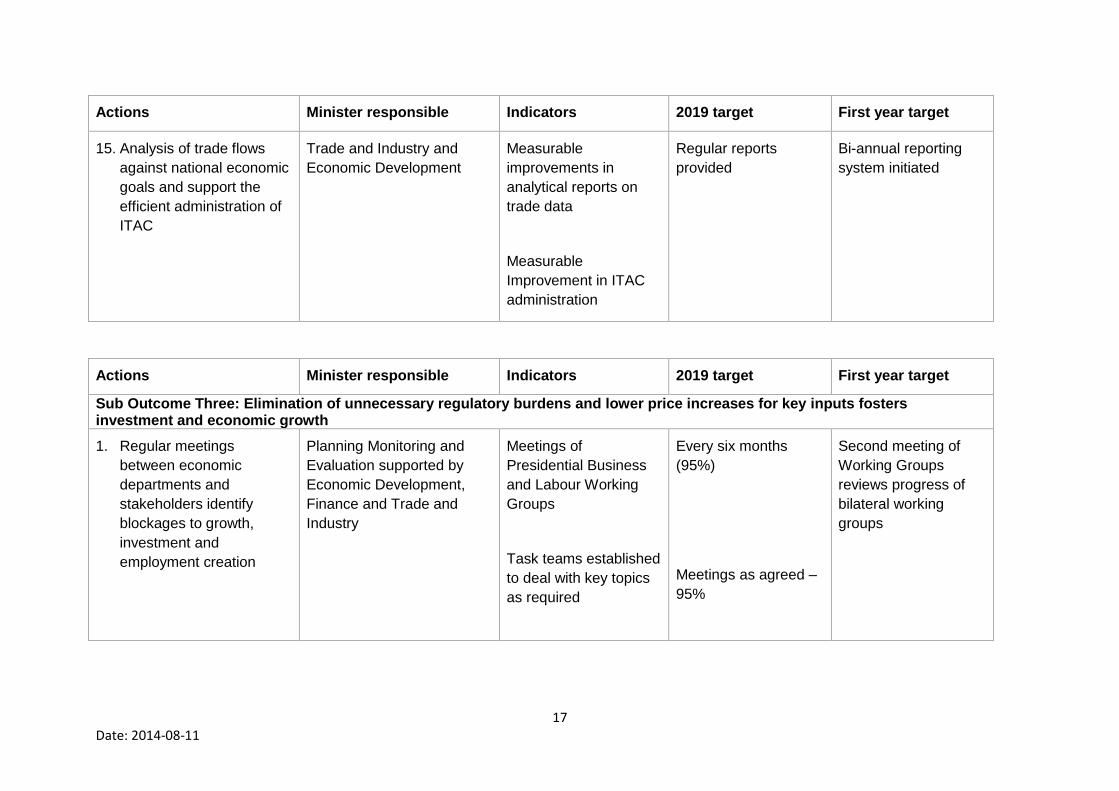
15. Analysis of trade flows
against national economic
goals and support the
efficient administration of
ITAC
Trade and Industry and
Economic Development
Measurable
improvements in
analytical reports on
trade data
Measurable
Improvement in ITAC
administration
Regular reports
provided
Bi-annual reporting
system initiated
Actions Minister responsible Indicators 2019 target First year target
Sub Outcome Three: Elimination of unnecessary regulatory burdens and lower price increases for key inputs fosters investment and economic growth
1. Regular meetings
between economic
departments and
stakeholders identify
blockages to growth,
investment and
employment creation
Planning Monitoring and
Evaluation supported by
Economic Development,
Finance and Trade and
Industry
Meetings of
Presidential Business
and Labour Working
Groups
Task teams established
to deal with key topics
as required
Every six months
(95%)
Meetings as agreed –
95%
Second meeting of
Working Groups
reviews progress of
bilateral working
groups
18 Date: 2014-08-11
Actions Minister responsible Indicators 2019 target First year target
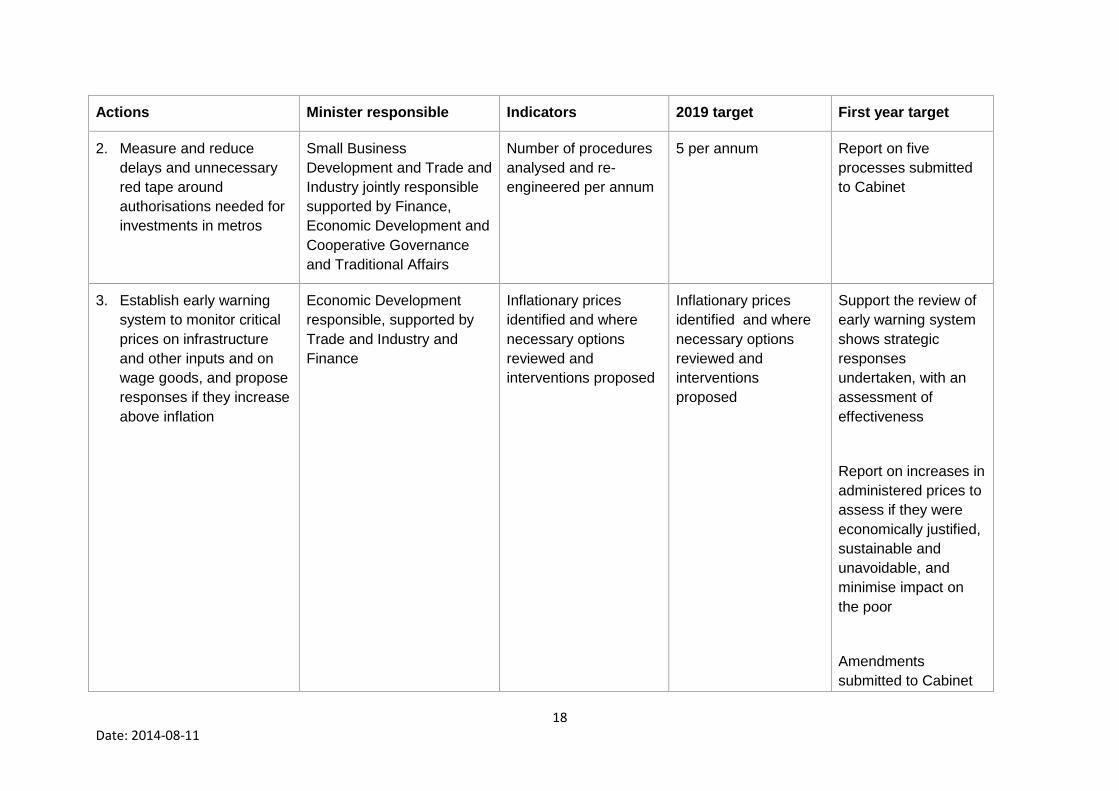
2. Measure and reduce
delays and unnecessary
red tape around
authorisations needed for
investments in metros
Small Business
Development and Trade and
Industry jointly responsible
supported by Finance,
Economic Development and
Cooperative Governance
and Traditional Affairs
Number of procedures
analysed and re-
engineered per annum
5 per annum Report on five
processes submitted
to Cabinet
3. Establish early warning
system to monitor critical
prices on infrastructure
and other inputs and on
wage goods, and propose
responses if they increase
above inflation
Economic Development
responsible, supported by
Trade and Industry and
Finance
Inflationary prices
identified and where
necessary options
reviewed and
interventions proposed
Inflationary prices
identified and where
necessary options
reviewed and
interventions
proposed
Support the review of
early warning system
shows strategic
responses
undertaken, with an
assessment of
effectiveness
Report on increases in
administered prices to
assess if they were
economically justified,
sustainable and
unavoidable, and
minimise impact on
the poor
Amendments
submitted to Cabinet
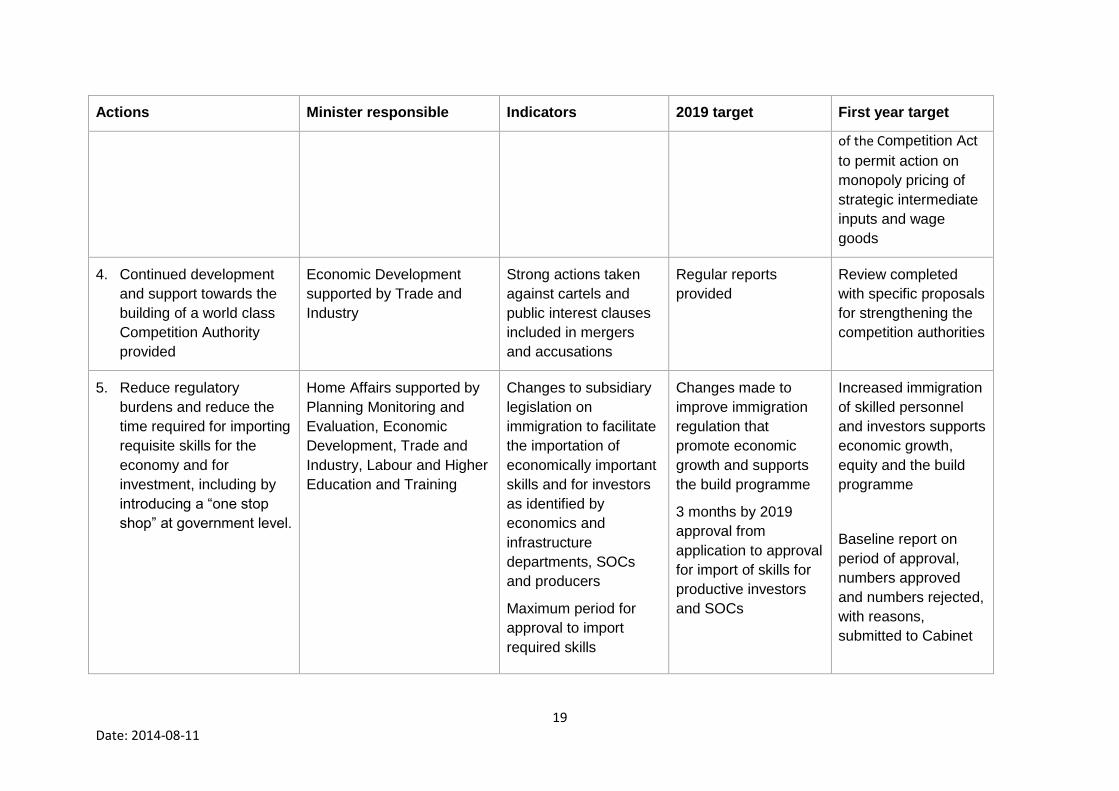
19 Date: 2014-08-11
Actions Minister responsible Indicators 2019 target First year target
of the Competition Act
to permit action on
monopoly pricing of
strategic intermediate
inputs and wage
goods
4. Continued development
and support towards the
building of a world class
Competition Authority
provided
Economic Development
supported by Trade and
Industry
Strong actions taken
against cartels and
public interest clauses
included in mergers
and accusations
Regular reports
provided
Review completed
with specific proposals
for strengthening the
competition authorities
5. Reduce regulatory
burdens and reduce the
time required for importing
requisite skills for the
economy and for
investment, including by
introducing a “one stop
shop” at government level.
Home Affairs supported by
Planning Monitoring and
Evaluation, Economic
Development, Trade and
Industry, Labour and Higher
Education and Training
Changes to subsidiary
legislation on
immigration to facilitate
the importation of
economically important
skills and for investors
as identified by
economics and
infrastructure
departments, SOCs
and producers
Maximum period for
approval to import
required skills
Changes made to
improve immigration
regulation that
promote economic
growth and supports
the build programme
3 months by 2019
approval from
application to approval
for import of skills for
productive investors
and SOCs
Increased immigration
of skilled personnel
and investors supports
economic growth,
equity and the build
programme
Baseline report on
period of approval,
numbers approved
and numbers rejected,
with reasons,
submitted to Cabinet
20 Date: 2014-08-11
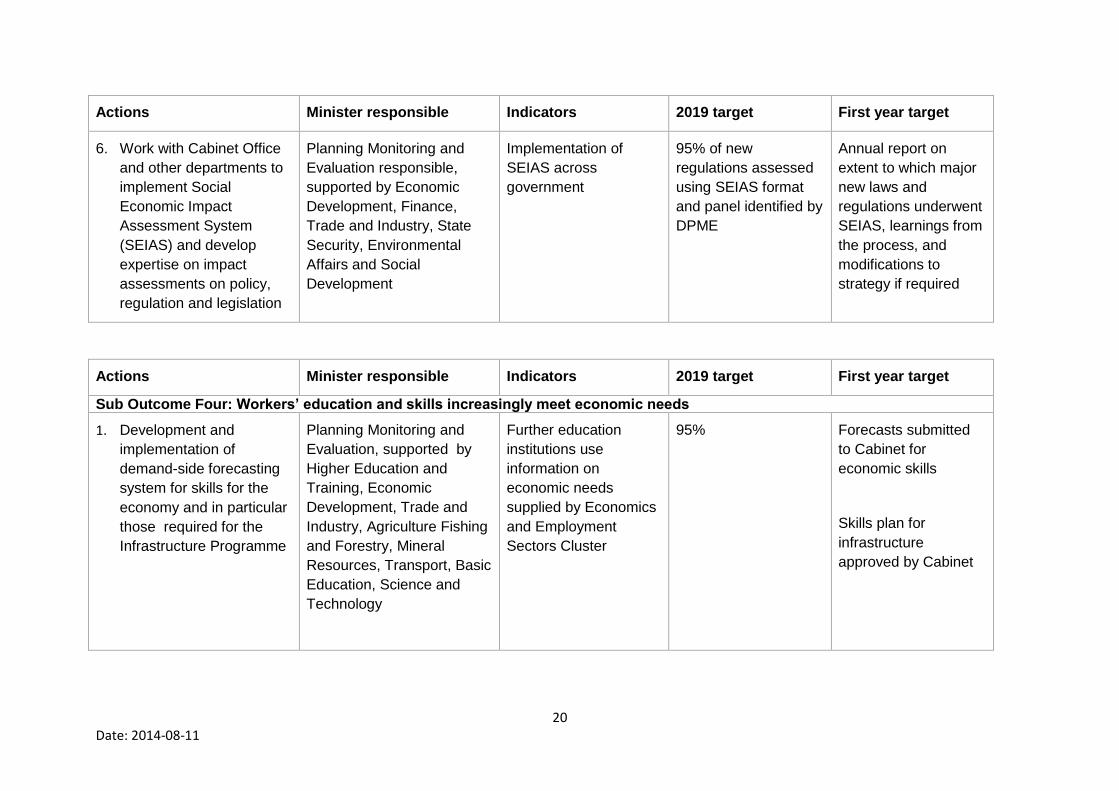
Actions Minister responsible Indicators 2019 target First year target
6. Work with Cabinet Office
and other departments to
implement Social
Economic Impact
Assessment System
(SEIAS) and develop
expertise on impact
assessments on policy,
regulation and legislation
Planning Monitoring and
Evaluation responsible,
supported by Economic
Development, Finance,
Trade and Industry, State
Security, Environmental
Affairs and Social
Development
Implementation of
SEIAS across
government
95% of new
regulations assessed
using SEIAS format
and panel identified by
DPME
Annual report on
extent to which major
new laws and
regulations underwent
SEIAS, learnings from
the process, and
modifications to
strategy if required
Actions Minister responsible Indicators 2019 target First year target
Sub Outcome Four: Workers’ education and skills increasingly meet economic needs
1. Development and
implementation of
demand-side forecasting
system for skills for the
economy and in particular
those required for the
Infrastructure Programme
Planning Monitoring and
Evaluation, supported by
Higher Education and
Training, Economic
Development, Trade and
Industry, Agriculture Fishing
and Forestry, Mineral
Resources, Transport, Basic
Education, Science and
Technology
Further education
institutions use
information on
economic needs
supplied by Economics
and Employment
Sectors Cluster
95% Forecasts submitted
to Cabinet for
economic skills
Skills plan for
infrastructure
approved by Cabinet
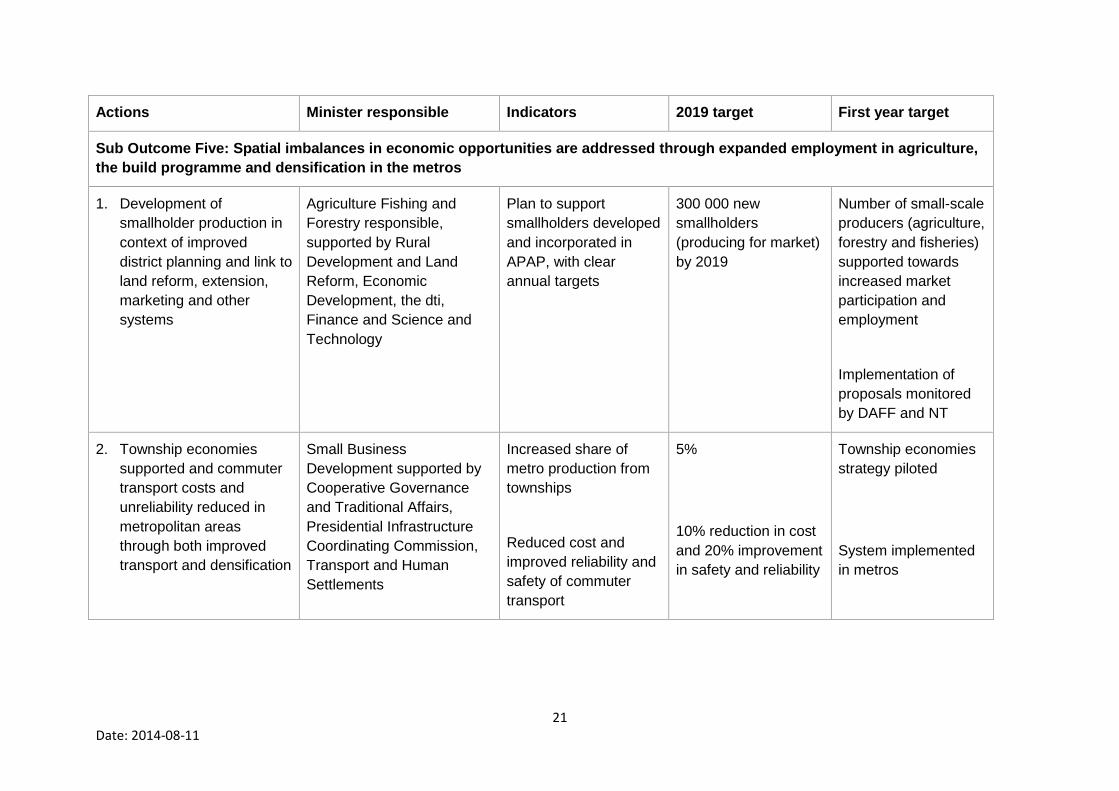
21 Date: 2014-08-11
Actions Minister responsible Indicators 2019 target First year target
Sub Outcome Five: Spatial imbalances in economic opportunities are addressed through expanded employment in agriculture,
the build programme and densification in the metros
1. Development of
smallholder production in
context of improved
district planning and link to
land reform, extension,
marketing and other
systems
Agriculture Fishing and
Forestry responsible,
supported by Rural
Development and Land
Reform, Economic
Development, the dti,
Finance and Science and
Technology
Plan to support
smallholders developed
and incorporated in
APAP, with clear
annual targets
300 000 new
smallholders
(producing for market)
by 2019
Number of small-scale
producers (agriculture,
forestry and fisheries)
supported towards
increased market
participation and
employment
Implementation of
proposals monitored
by DAFF and NT
2. Township economies
supported and commuter
transport costs and
unreliability reduced in
metropolitan areas
through both improved
transport and densification
Small Business
Development supported by
Cooperative Governance
and Traditional Affairs,
Presidential Infrastructure
Coordinating Commission,
Transport and Human
Settlements
Increased share of
metro production from
townships
Reduced cost and
improved reliability and
safety of commuter
transport
5%
10% reduction in cost
and 20% improvement
in safety and reliability
Township economies
strategy piloted
System implemented
in metros
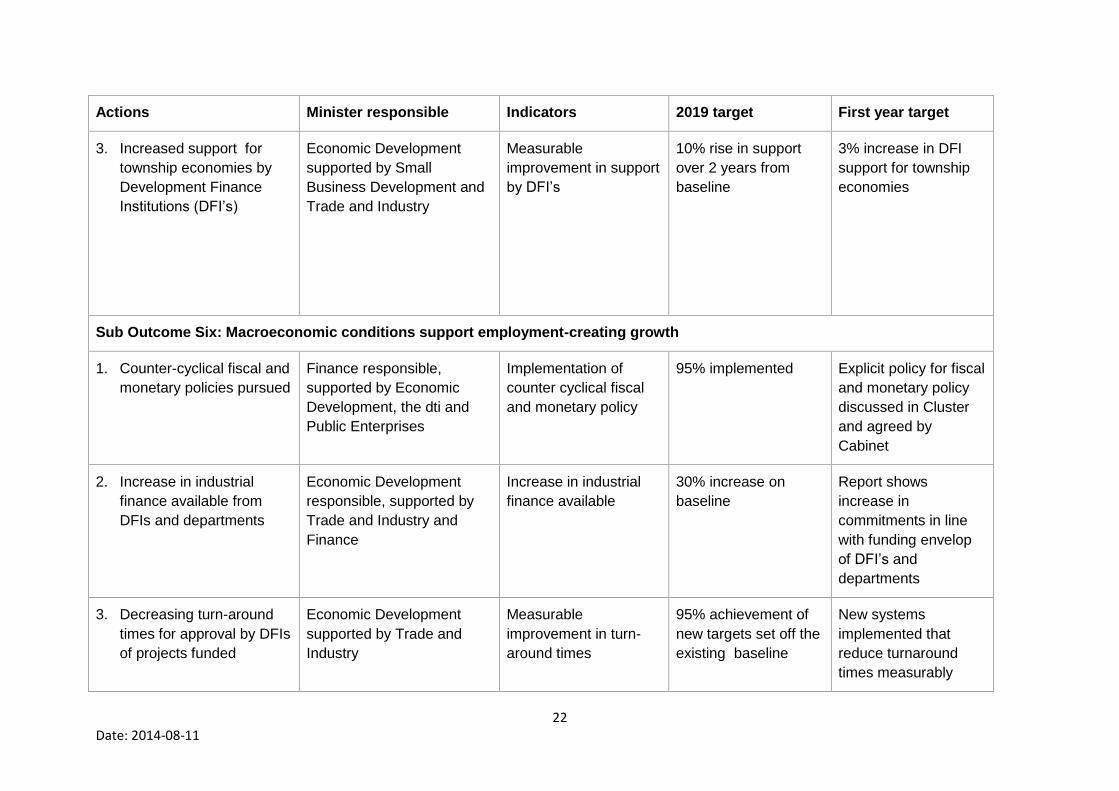
22 Date: 2014-08-11
Actions Minister responsible Indicators 2019 target First year target
3. Increased support for
township economies by
Development Finance
Institutions (DFI’s)
Economic Development
supported by Small
Business Development and
Trade and Industry
Measurable
improvement in support
by DFI’s
10% rise in support
over 2 years from
baseline
3% increase in DFI
support for township
economies
Sub Outcome Six: Macroeconomic conditions support employment-creating growth
1. Counter-cyclical fiscal and
monetary policies pursued
Finance responsible,
supported by Economic
Development, the dti and
Public Enterprises
Implementation of
counter cyclical fiscal
and monetary policy
95% implemented Explicit policy for fiscal
and monetary policy
discussed in Cluster
and agreed by
Cabinet
2. Increase in industrial
finance available from
DFIs and departments
Economic Development
responsible, supported by
Trade and Industry and
Finance
Increase in industrial
finance available
30% increase on
baseline
Report shows
increase in
commitments in line
with funding envelop
of DFI’s and
departments
3. Decreasing turn-around
times for approval by DFIs
of projects funded
Economic Development
supported by Trade and
Industry
Measurable
improvement in turn-
around times
95% achievement of
new targets set off the
existing baseline
New systems
implemented that
reduce turnaround
times measurably
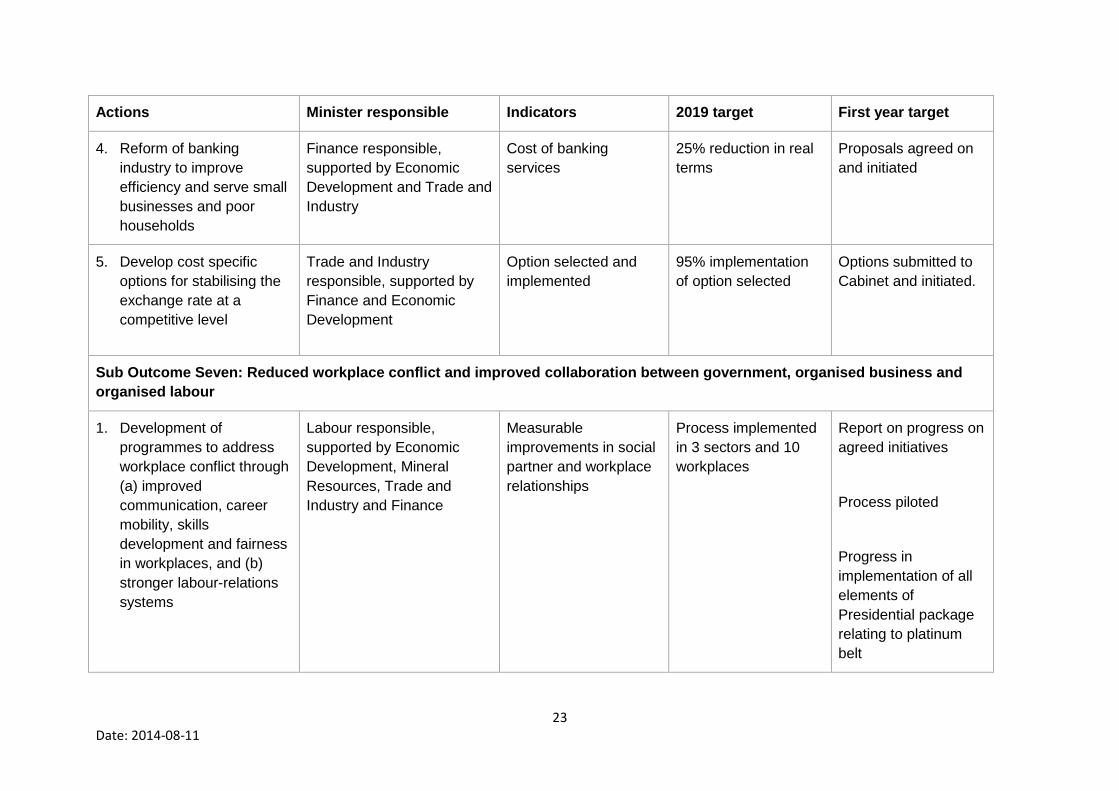
23 Date: 2014-08-11
Actions Minister responsible Indicators 2019 target First year target
4. Reform of banking
industry to improve
efficiency and serve small
businesses and poor
households
Finance responsible,
supported by Economic
Development and Trade and
Industry
Cost of banking
services
25% reduction in real
terms
Proposals agreed on
and initiated
5. Develop cost specific
options for stabilising the
exchange rate at a
competitive level
Trade and Industry
responsible, supported by
Finance and Economic
Development
Option selected and
implemented
95% implementation
of option selected
Options submitted to
Cabinet and initiated.
Sub Outcome Seven: Reduced workplace conflict and improved collaboration between government, organised business and
organised labour
1. Development of
programmes to address
workplace conflict through
(a) improved
communication, career
mobility, skills
development and fairness
in workplaces, and (b)
stronger labour-relations
systems
Labour responsible,
supported by Economic
Development, Mineral
Resources, Trade and
Industry and Finance
Measurable
improvements in social
partner and workplace
relationships
Process implemented
in 3 sectors and 10
workplaces
Report on progress on
agreed initiatives
Process piloted
Progress in
implementation of all
elements of
Presidential package
relating to platinum
belt
24 Date: 2014-08-11
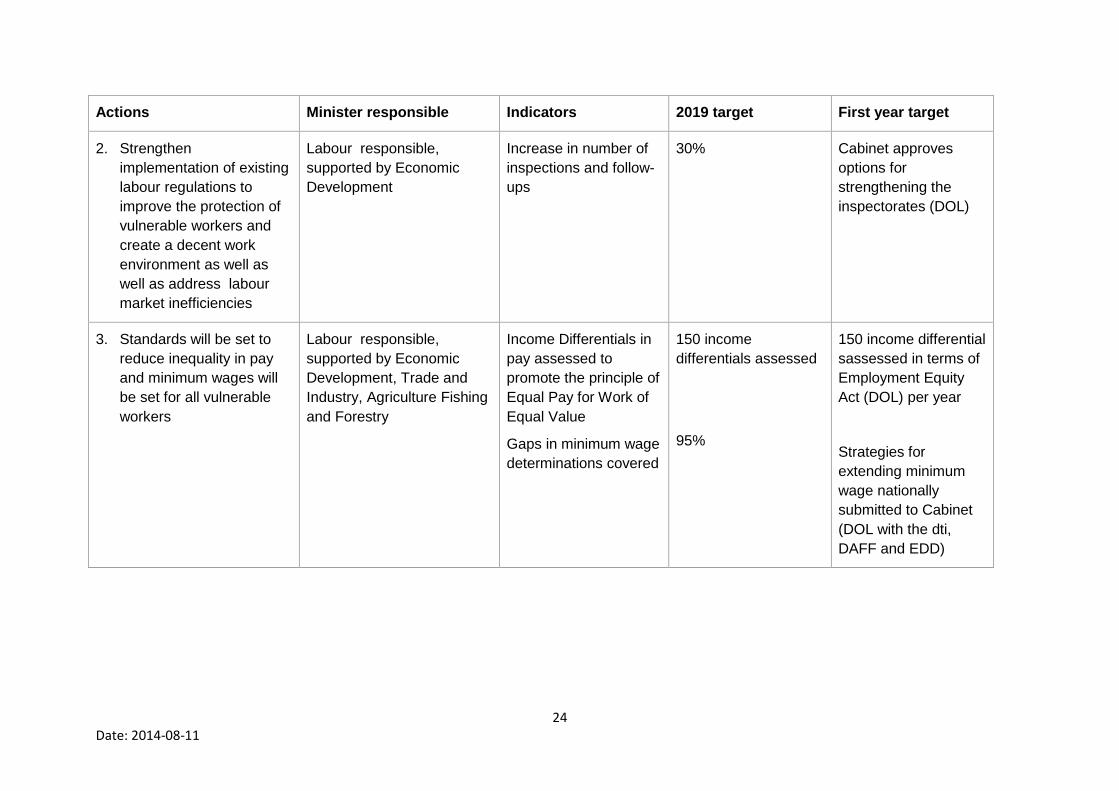
Actions Minister responsible Indicators 2019 target First year target
2. Strengthen
implementation of existing
labour regulations to
improve the protection of
vulnerable workers and
create a decent work
environment as well as
well as address labour
market inefficiencies
Labour responsible,
supported by Economic
Development
Increase in number of
inspections and follow-
ups
30% Cabinet approves
options for
strengthening the
inspectorates (DOL)
3. Standards will be set to
reduce inequality in pay
and minimum wages will
be set for all vulnerable
workers
Labour responsible,
supported by Economic
Development, Trade and
Industry, Agriculture Fishing
and Forestry
Income Differentials in
pay assessed to
promote the principle of
Equal Pay for Work of
Equal Value
Gaps in minimum wage
determinations covered
150 income
differentials assessed
95%
150 income differential
sassessed in terms of
Employment Equity
Act (DOL) per year
Strategies for
extending minimum
wage nationally
submitted to Cabinet
(DOL with the dti,
DAFF and EDD)
25 Date: 2014-08-11
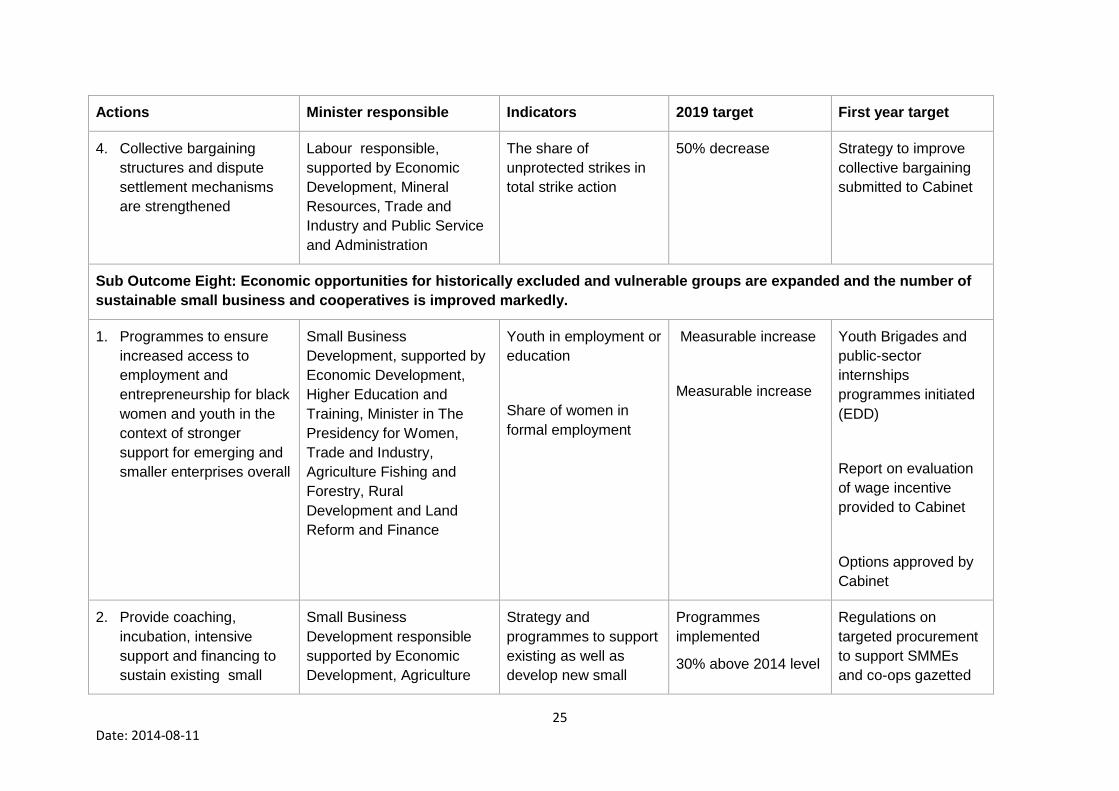
Actions Minister responsible Indicators 2019 target First year target
4. Collective bargaining
structures and dispute
settlement mechanisms
are strengthened
Labour responsible,
supported by Economic
Development, Mineral
Resources, Trade and
Industry and Public Service
and Administration
The share of
unprotected strikes in
total strike action
50% decrease Strategy to improve
collective bargaining
submitted to Cabinet
Sub Outcome Eight: Economic opportunities for historically excluded and vulnerable groups are expanded and the number of
sustainable small business and cooperatives is improved markedly.
1. Programmes to ensure
increased access to
employment and
entrepreneurship for black
women and youth in the
context of stronger
support for emerging and
smaller enterprises overall
Small Business
Development, supported by
Economic Development,
Higher Education and
Training, Minister in The
Presidency for Women,
Trade and Industry,
Agriculture Fishing and
Forestry, Rural
Development and Land
Reform and Finance
Youth in employment or
education
Share of women in
formal employment
Measurable increase
Measurable increase
Youth Brigades and
public-sector
internships
programmes initiated
(EDD)
Report on evaluation
of wage incentive
provided to Cabinet
Options approved by
Cabinet
2. Provide coaching,
incubation, intensive
support and financing to
sustain existing small
Small Business
Development responsible
supported by Economic
Development, Agriculture
Strategy and
programmes to support
existing as well as
develop new small
Programmes
implemented
30% above 2014 level
Regulations on
targeted procurement
to support SMMEs
and co-ops gazetted
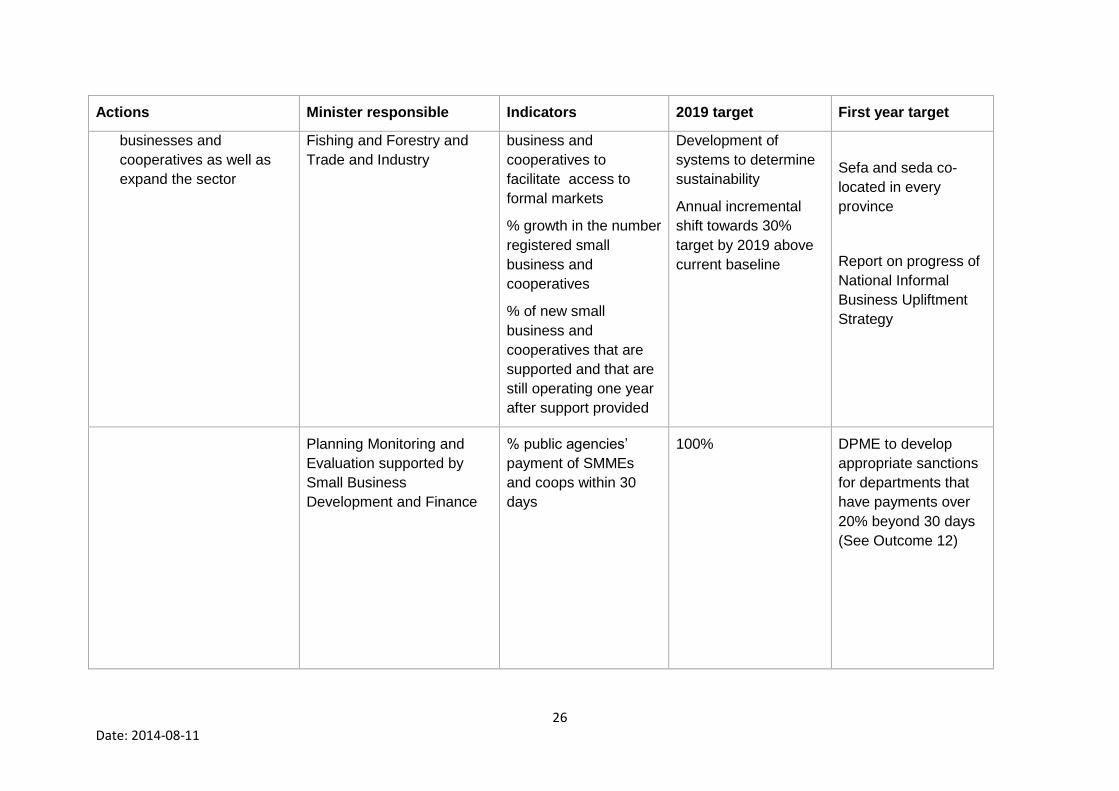
26 Date: 2014-08-11
Actions Minister responsible Indicators 2019 target First year target
businesses and
cooperatives as well as
expand the sector
Fishing and Forestry and
Trade and Industry
business and
cooperatives to
facilitate access to
formal markets
% growth in the number
registered small
business and
cooperatives
% of new small
business and
cooperatives that are
supported and that are
still operating one year
after support provided
Development of
systems to determine
sustainability
Annual incremental
shift towards 30%
target by 2019 above
current baseline
Sefa and seda co-
located in every
province
Report on progress of
National Informal
Business Upliftment
Strategy
Planning Monitoring and
Evaluation supported by
Small Business
Development and Finance
% public agencies’
payment of SMMEs
and coops within 30
days
100% DPME to develop
appropriate sanctions
for departments that
have payments over
20% beyond 30 days
(See Outcome 12)
27 Date: 2014-08-11
Actions Minister responsible Indicators 2019 target First year target
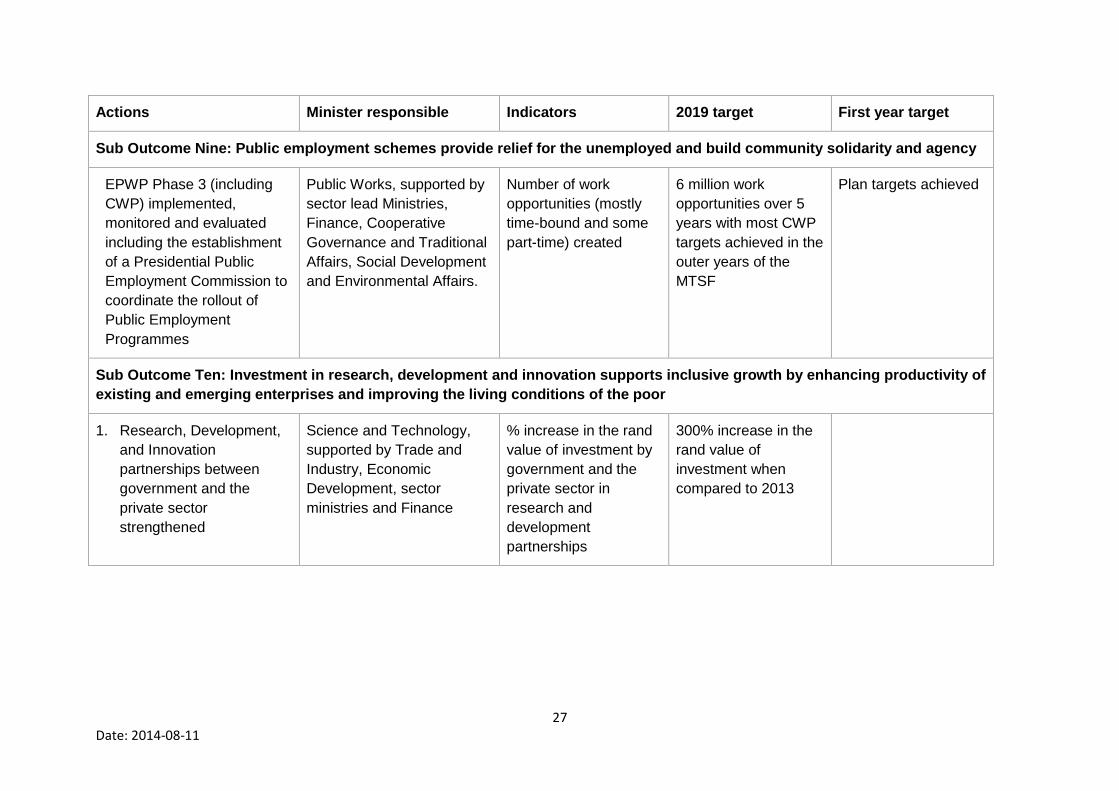
Sub Outcome Nine: Public employment schemes provide relief for the unemployed and build community solidarity and agency
EPWP Phase 3 (including
CWP) implemented,
monitored and evaluated
including the establishment
of a Presidential Public
Employment Commission to
coordinate the rollout of
Public Employment
Programmes
Public Works, supported by
sector lead Ministries,
Finance, Cooperative
Governance and Traditional
Affairs, Social Development
and Environmental Affairs.
Number of work
opportunities (mostly
time-bound and some
part-time) created
6 million work
opportunities over 5
years with most CWP
targets achieved in the
outer years of the
MTSF
Plan targets achieved
Sub Outcome Ten: Investment in research, development and innovation supports inclusive growth by enhancing productivity of
existing and emerging enterprises and improving the living conditions of the poor
1. Research, Development,
and Innovation
partnerships between
government and the
private sector
strengthened
Science and Technology,
supported by Trade and
Industry, Economic
Development, sector
ministries and Finance
% increase in the rand
value of investment by
government and the
private sector in
research and
development
partnerships
300% increase in the
rand value of
investment when
compared to 2013
28 Date: 2014-08-11
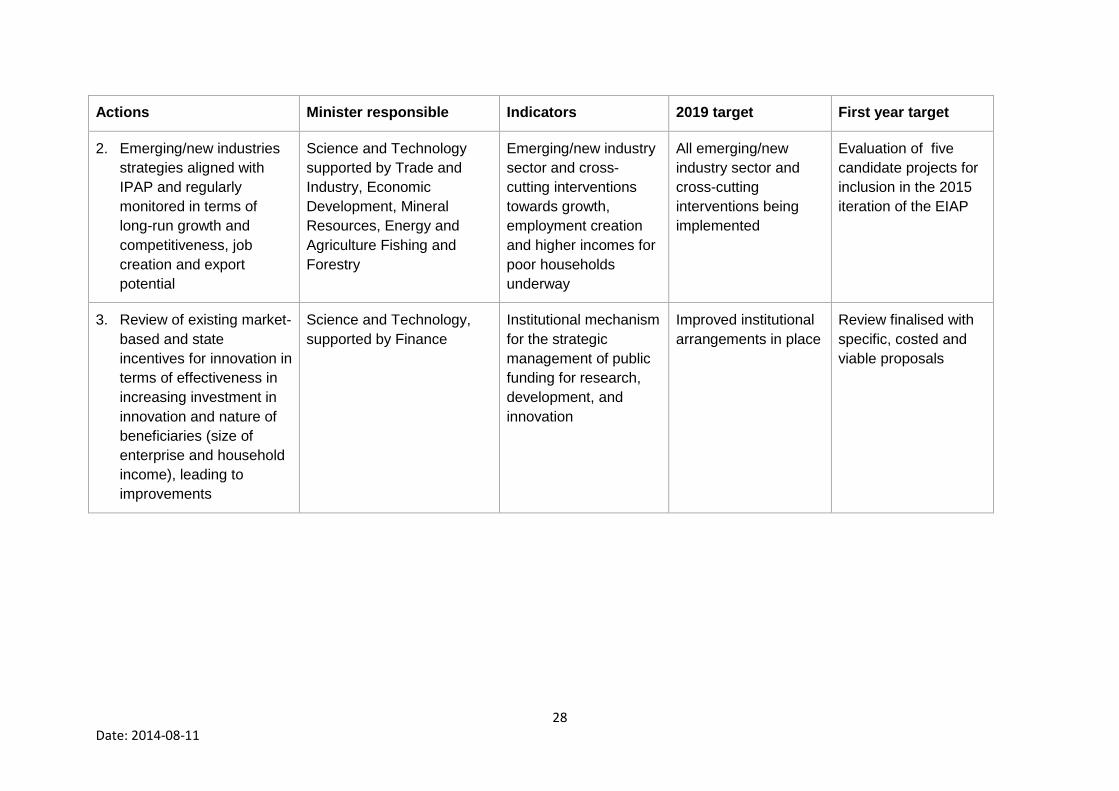
Actions Minister responsible Indicators 2019 target First year target
2. Emerging/new industries
strategies aligned with
IPAP and regularly
monitored in terms of
long-run growth and
competitiveness, job
creation and export
potential
Science and Technology
supported by Trade and
Industry, Economic
Development, Mineral
Resources, Energy and
Agriculture Fishing and
Forestry
Emerging/new industry
sector and cross-
cutting interventions
towards growth,
employment creation
and higher incomes for
poor households
underway
All emerging/new
industry sector and
cross-cutting
interventions being
implemented
Evaluation of five
candidate projects for
inclusion in the 2015
iteration of the EIAP
3. Review of existing market-
based and state
incentives for innovation in
terms of effectiveness in
increasing investment in
innovation and nature of
beneficiaries (size of
enterprise and household
income), leading to
improvements
Science and Technology,
supported by Finance
Institutional mechanism
for the strategic
management of public
funding for research,
development, and
innovation
Improved institutional
arrangements in place
Review finalised with
specific, costed and
viable proposals
29 Date: 2014-08-11
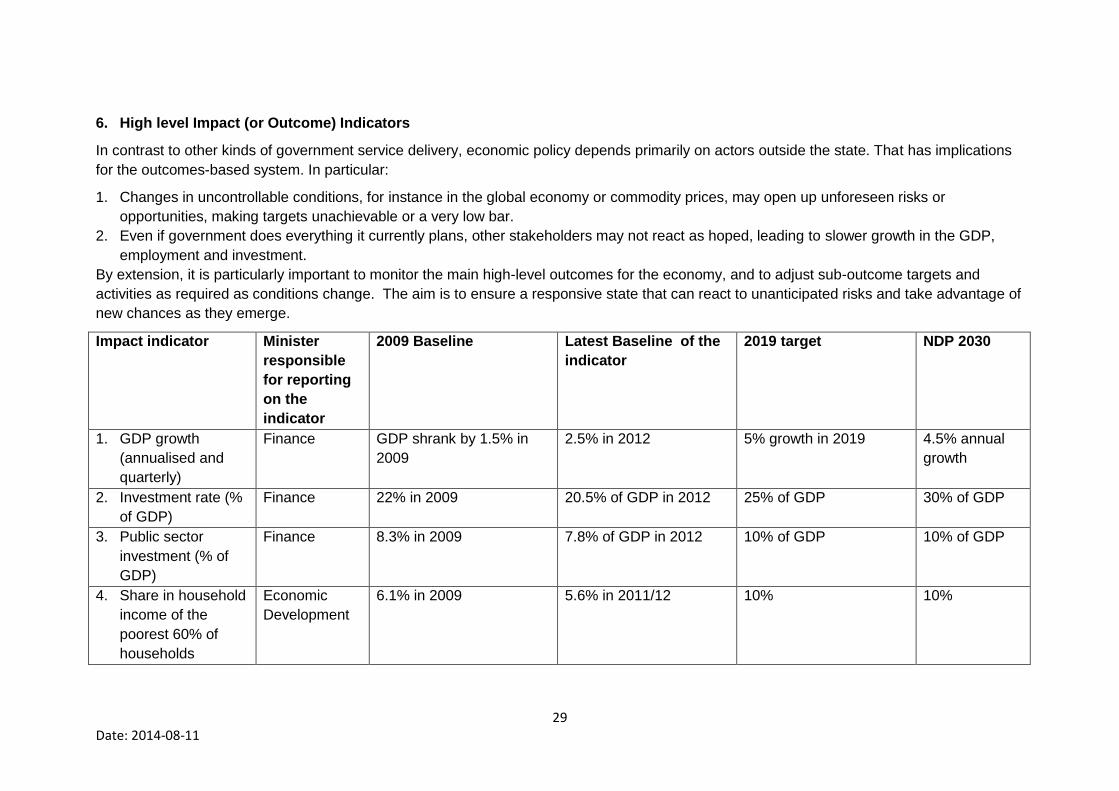
6. High level Impact (or Outcome) Indicators
In contrast to other kinds of government service delivery, economic policy depends primarily on actors outside the state. That has implications
for the outcomes-based system. In particular:
1. Changes in uncontrollable conditions, for instance in the global economy or commodity prices, may open up unforeseen risks or
opportunities, making targets unachievable or a very low bar.
2. Even if government does everything it currently plans, other stakeholders may not react as hoped, leading to slower growth in the GDP,
employment and investment.
By extension, it is particularly important to monitor the main high-level outcomes for the economy, and to adjust sub-outcome targets and
activities as required as conditions change. The aim is to ensure a responsive state that can react to unanticipated risks and take advantage of
new chances as they emerge.
Impact indicator Minister
responsible
for reporting
on the
indicator
2009 Baseline Latest Baseline of the
indicator
2019 target NDP 2030
1. GDP growth
(annualised and
quarterly)
Finance GDP shrank by 1.5% in
2009
2.5% in 2012 5% growth in 2019
4.5% annual
growth
2. Investment rate (%
of GDP)
Finance 22% in 2009 20.5% of GDP in 2012 25% of GDP 30% of GDP
3. Public sector
investment (% of
GDP)
Finance 8.3% in 2009 7.8% of GDP in 2012 10% of GDP 10% of GDP
4. Share in household
income of the
poorest 60% of
households
Economic
Development
6.1% in 2009 5.6% in 2011/12 10% 10%
30 Date: 2014-08-11
Impact indicator Minister
responsible
for reporting
on the
indicator
2009 Baseline Latest Baseline of the
indicator
2019 target NDP 2030
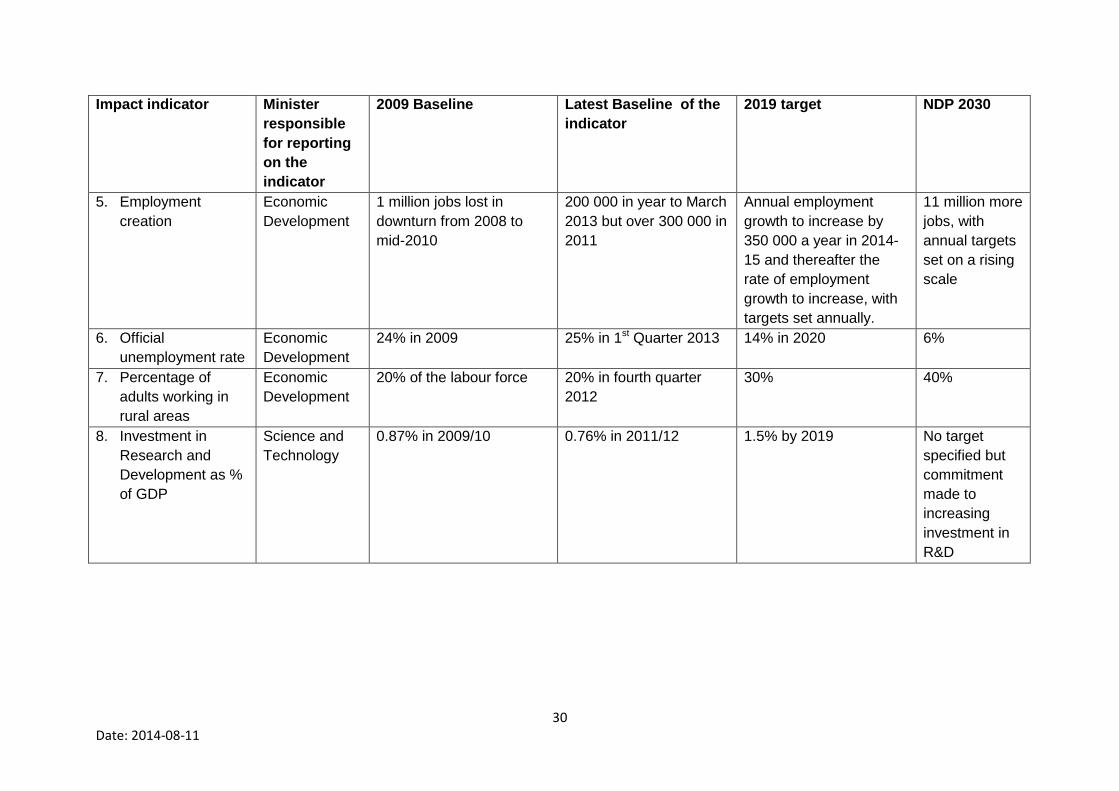
5. Employment
creation
Economic
Development
1 million jobs lost in
downturn from 2008 to
mid-2010
200 000 in year to March
2013 but over 300 000 in
2011
Annual employment
growth to increase by
350 000 a year in 2014-
15 and thereafter the
rate of employment
growth to increase, with
targets set annually.
11 million more
jobs, with
annual targets
set on a rising
scale
6. Official
unemployment rate
Economic
Development
24% in 2009 25% in 1st Quarter 2013 14% in 2020 6%
7. Percentage of
adults working in
rural areas
Economic
Development
20% of the labour force 20% in fourth quarter
2012
30% 40%
8. Investment in
Research and
Development as %
of GDP
Science and
Technology
0.87% in 2009/10 0.76% in 2011/12 1.5% by 2019 No target
specified but
commitment
made to
increasing
investment in
R&D