Embed Size (px)
Citation preview

Dennis List: PhD thesis 407 Appendix 4
Appendix 4: Details of the case studies
This appendix supplements chapter 8, providing detail on each case study in a volume that
would impede the flow of the argument had it been included in that chapter. For each case
study, the information presented is
1. Information about the entity of the case.
2. Classification of the case, in terms of the sample design in chapter 7.
3. The procedures used: recruitment method, the environment for the study, the activities
used.
4. Samples of the output produced, with emphasis on how this output changed since the
previous case study
Each case study in chapter 8 draws on this information, but the emphasis there is on the
development of the Process, while the emphasis here is on the substantive case studies.
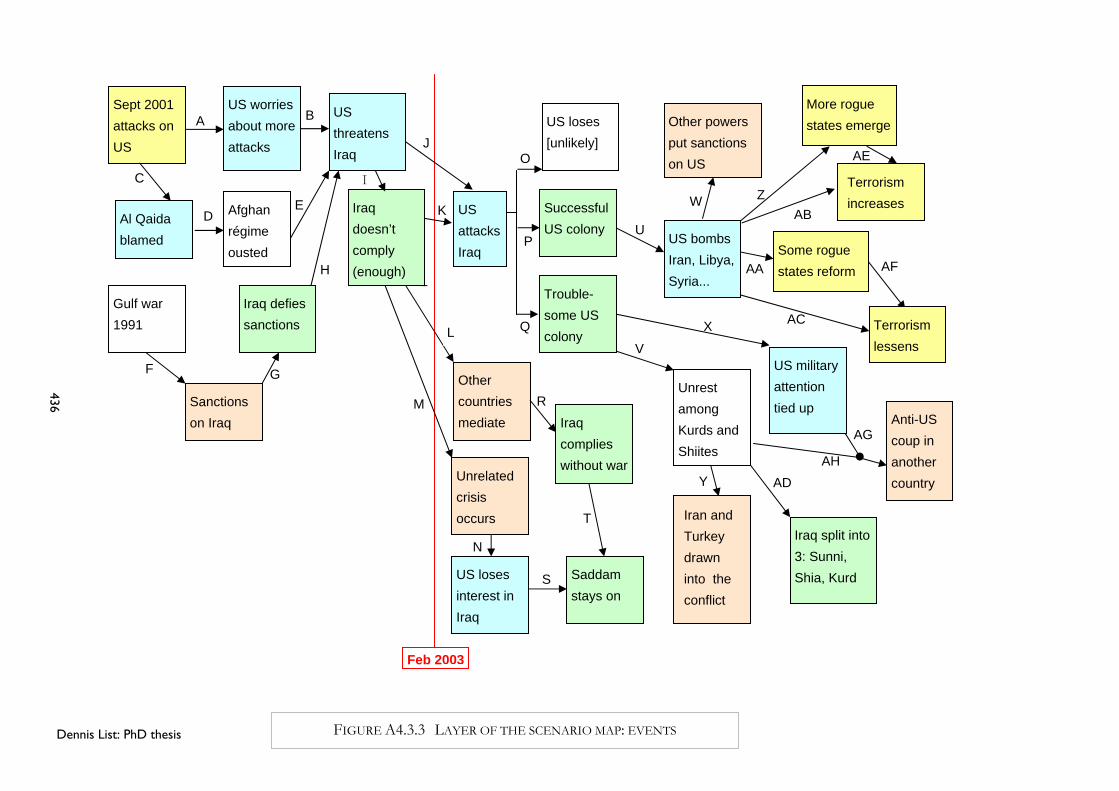
Case 1: A radio network in Indonesia (RN)
The entity
History. Before 2000, RN had been part of the central government’s Departemen Perhubun-
gan (Department of Communications), whose head office adjoined that of RN in Jakarta. RN’s
mission had been to provide an informational and cultural radio service to all 29 provinces of
Indonesia. The government clearly saw RN as a unifying force in a country troubled by
secessionist impulses on its fringes, in trouble spots such as Aceh, the South Moluccas, East
Timor, and Irian Jaya. With the end of the Suharto era in 1998, Indonesia returned to democ-
racy. In 2000, its Parliament passed a Media Law authorizing many new commercial radio
stations. This ended RN’s monopoly of radio in Indonesia, but also released RN from direct
government control.
RN remains fully owned by the national government. RN receives nearly all its funding from
the national government. When it became independent from the Department of Communica-
tions, its budget was effectively reduced, and it was expected to find more funding through

Dennis List: PhD thesis 408 Appendix 4
the sale of airtime for commercials. It is governed by a national board, appointed by the
government.
RN’s sole output is radio broadcasting, including news-gathering, and producing entertain-
ment programs. Programming policy is determined by network heads in Jakarta. In each
province, locally made programs, generally following those principles, are broadcast during
most daylight hours, with networked programs outside peak listening times.
Riau province is in central Sumatra, some 1500 km west of Indonesia’s capital city, Jakarta.
The capital of Riau is Pekanbaru, an inland city with a population around 600,000. Riau’s oil
industry makes it the richest province of Indonesia. Another unusual factor is Riau’s proximity
to wealthy Singapore and Malaysia. With Indonesian being very similar to Malay, coastal
dwellers in Riau can receive and understand radio and TV programs from Malaysia. RN Riau
had three offices, with around 150 staff (of RN’s total of 8,000). Two offices were in Pekan-
baru, and there was a small branch office in the city of Tanjung Pinang, on an island very
close to Singapore and therefore somewhat subject to the wealth and influence of that city-
state.
Classification
To first consider the type of social entity involved, in terms of the taxonomy in chapter 8, this
case met the following criteria:
Category 2.7 A government agency
Category 3.3 Located in a province
Category 4 A time scale of around 10 years
In terms of the specific entity types sought for this study, it fulfilled the following additional
characteristics:
A4 Entity undergoing major organizational change
A7 Entity forming part of a larger organization, with its own sub-entities
A21 Services sector
Procedure Recruitment
The participants had been selected by the head of RN in Riau to take part in a course on
audience research. They were mostly journalists and middle managers, and formed a high

Dennis List: PhD thesis 409 Appendix 4
proportion of all such staff members: probably more than half of all those working in such
positions. To that extent, therefore, the participants formed a representative sample of the
more senior staff of RN in Riau province. Several junior staff (mostly young, well-educated
reporters) were also included.
Environment
This workshop was one small part of a two-week course on audience research, for which I
was the instructor. It was conducted mostly in Indonesian, a language of which I had only a
rudimentary knowledge. However, a skilled interpreter was present, and many of the partici-
pants knew a little English, more in written than spoken form. I thus made much use of a
whiteboard, writing on one side in a mixture of English and Indonesian, while the interpreter
translated the notes (on the other side of the board) into Indonesian.
The workshop took place in a long, narrow room, around 6 metres wide and 15 long, The
long wall facing the inside corridor was all glass, which caused some acoustic problems, but
was also ideal for displaying findings on large sheets of paper. Another factor brought about
by the long glass wall was that any local RN employee walking past could see what was
happening in this training room, and could drop in. Though there were only 14 official
participants, the provincial manager encouraged others to attend when they could, and at
times up to 35 people were present. During the futures session, the average was around 20 to
25, though with a lot of coming and going.
Activities
Since less than one working day was able to be allocated for this process, I realized it would
not be possible to develop a full scenario network – particularly given the slowness of com-
munication through an interpreter. Accordingly, I planned this sequence of activities:
1. Identify the systems impinging on RN, to tease out the various stakeholders, their roles,
and their likely reactions to RN.
2. Create a set of generic scenario paths, using a morphological process.
3. Working in three small groups, one group would create a futures wheel, another would
backcast some of the scenario paths, and the third group would attempt midcasting.
This was the first time I had tried the latter process.
4. Finally, the paths would be fleshed out in more detail, using data collected in the previ-
ous activity.

Dennis List: PhD thesis 410 Appendix 4
1. System Impingement
Participants first listed all the stakeholder systems connected to RN in Riau, as shown in Table
A4.1.1. RN in Riau turned out to have a tangled set of enveloping systems, subsystems, and
linked systems. All stakeholders on this long list had some bearing on the future of RN in
Riau. Having established all the stakeholders, participants were then divided into small groups,
with the task of considering each stakeholder group and the pressures it was perceived to put
on RN. Though all participants were RN staff members, and therefore might have been
expected to have narrow views, most of them were working journalists, and thus familiar
enough with local powerbrokers to be able to produce a detailed list of stakeholders’ motiva-
tions toward RN Riau.
The data in Table 9.2.1 formed the basis of the System Impingement Diagram in Figure
A4.1.1. The diagram displays the nine main systems that participants decided were affecting
RN in Riau, both directly and indirectly. Arrows denote the directions of influence.
Thus five major systems were seen as directly impinging on RN Riau, and three systems
impinged indirectly. One of the latter (the IMF) was two systems removed from RN Riau,
thus of less direct significance. All other systems listed in Table A4.1.1 were not regarded by
participants as significantly important to the future of RN, so they were not considered in the
diagram.
Interestingly, their list of major systems excluded some of those listed in Table A4.1.1: media
competitors, as well as subsystems of RN Riau, and the Swedish project (which was the main
system impinging on the participants during this two-week course, and was to have major
influence over the next six months). I queried the omission of these systems, but the partici-
pants agreed that they were relatively unimportant. As an outsider, and one who understood
little Indonesian (most of the above work was done through an interpreter) I was not in a
strong position to disagree. However, my assessment was that since the participants were
running a partly-commercial radio station, RN’s media competitors were in a clear position to
influence at least its commercial income, and eventually, to some extent, its programming. So
perhaps these should have been added to Figure A4.1.1, with a mutual link to Advertisers.
2. Morphological analysis
Before creating a scenario network map it was necessary to create some major paths, for
which the obvious method was morphological fault-tree analysis. The participants did not
understand what I meant by this - perhaps because of linguistic problems. Given the ensuing

Dennis List: PhD thesis 411 Appendix 4
confusion between a time hierarchy and a conceptual hierarchy, I produced the hierarchy
mostly by myself. However, when participants when began to understand the diagram I was
creating on a whiteboard, they were able to offer useful amendments. The hierarchy is shown
in Figure A4.1.2. It has 13 numbered endpoints, representing the scenario paths from which
the backcasting could begin.
3. Developing a scenario network
Having defined the impinging systems and the morphology, we moved onto developing a
network of scenarios, by considering (for each link in Figure A4.1.2) the influences created by
the forces listed above. Working in three small groups, the participants were asked to imagine
some possible futures:
One group worked forward from 1998, using a futures wheel;
A second group worked back from the endpoint of 2008, backcasting from some points
in the morphological analysis. (As this was only a one-day session, there was insufficient
time to backcast all 13 scenario paths. This group thus focused on one set of options
which worried the participants: that RN (or at least one of its Riau networks) would be
sold to a private organization. This was effectively options 6, 7 and 8 combined in Figure
A4.1.2.)
The third group was asked to midcast around intermediate point, not specified in time.
The combined network covered six large sheets of paper, and had around 100 nodes. How-
ever, it was not finished, because we ran out of time, with this session taking much longer
than I had expected.
Output
The three most relevant outputs (for the present discussion) from this project are:
Table A4.1.1 A table of all the impinging stakeholder systems
Figure A4.1.1 A system impingement diagram
Figure A4.1.2 A diagram of the morphological hierarchy
These are displayed on the following two pages.

Dennis List: PhD thesis 412 Appendix 4
TABLE A4.1.1 STAKEHOLDER SYSTEMS OF RN IN RIAU
whole of RN (headquarters in Jakarta) Indonesian central government Department of Information Indonesian language / culture / ethos province of Riau
Enveloping systems
island of Sumatra Production staff*
Staff of RN Riau Administrative staff
RN Pro-1: radio station for whole of Riau RN Pro-2: radio station at Pekanbaru
Subsystems
RN station at Tanjung Pinang Colleagues RN offices in other provinces (28 of them)
RN national news and current affairs Riau provincial government Major political parties
Authorities
ABRI (Indonesian military) Other radio stations 12 in Pekan Baru TVRI (national TV station) Private TV stations 3 in Pekan Baru Satellite TV stations ~2% of households have Press national, local, international /
daily and weekly
Competitors / substitutes
Worldwide Web esp. in Bahasa native to Riau, & immigrants from elsewhere in Indonesia able / unable to speak Bahasa Indonesia
Audience to RN
(other audience variables may also be relevant)
Advertisers on RN Suppliers to RN Sveriges Radio (coordinating this project)
Linked systems
Other stake-holders
Sida (funding the project) *The production staff and the administrative staff work in separate buildings and communicate infrequently; thus there are two separate subsystems of local staff.

Dennis List: PhD thesis 413 Appendix 4
FIGURE A4.1.1 SYSTEMS IMPINGING ON RN RIAU
If still existing: Ownership: central government (as now): one entity (as now) [1] one entity, combined with television [2] each network as a separate entity [3] provincial or local government: mini-RN for Riau (all networks) [4] One local network owned by province [5] O privatized: RN nationally [6] RN Riau, part of a larger private network [7] RN Riau, independently owned [8] Local network/s sold to local owners [9] listener-owned: Local network owned by listener co-operative [10] If not existing: Functions (i.e. radio production) continue in some way As program source for other outlets [11] Other [not further defined] [12] Functions do not continue; RN is simply shut down [13]
FIGURE A4.1.2 MORPHOLOGICAL HIERARCHY FOR FUTURES OF RN IN RIAU
IMF
RN Riau
Provincial government
program sources
audience
advertisers
RN head office Indonesian government
Indonesian economy

Dennis List: PhD thesis 414 Appendix 4
Development of the morphological hierarchy
To illustrate the output from the morphological hierarchy, one path in Figure 9.2.2 (option 6)
was that RN nationally would be sold to a private media organization – either an international
media group, or an Indonesian conglomerate. The participants involved then developed this
possibility, to produce a set of “whys” and “hows.” They concluded that this sale would only
occur if all the following inputs occurred:
i1. The IMF kept pushing the Indonesian government to reduce its budget deficit,
i2. ...and also to privatize those state-owned enterprises which already (like RN) had private
competition
i3. The radio audience continued at a high level: i.e. radio listening did not decline much
with the growth in ownership of TV sets.
i4. A keen buyer (possibly an overseas-based owner of many radio stations) pressed the
government to sell.
i5. The likely revenue from the sale was high enough to tempt the government.
i6. The anticipated volume of public objections was low.
i7. A number of other state-owned enterprises were also sold.
i8. The Media Law of 2000 would have to be changed, which would require a majority of
Members of Parliament to agree.
I had expected a more chain-like sequence of events, but the above structure, if shown as a
diagram, would take the shape of eight inputs producing one output. Though individually the
probability of any one of the above events occurring was seen as “very low,” it does not
follow that the joint probability of all of them occurring was a simple product of the eight
individual probabilities: almost infinitesimally low. If a mood for privatization were to sweep
the country, all of the above could happen together – though it would take several years for all
of those preconditions to occur.
The consequences of selling one or more RN radio networks were seen as three major
outputs, labelled o1 to o3:
o1. The network’s less profitable stations (those serving the smallest populations) would be
closed down, or used only as repeaters, or resold to act as vehicles for networked advertis-
ing.
o2. Because news is expensive to gather, and commercial radio operators want to maximize
their profits, many staff would be laid off - particularly those producing labour-intensive
spoken-word programs, and thus:

Dennis List: PhD thesis 415 Appendix 4
o3. radio would lose its perceived role as major news and information provider, ceding this
to newspapers, TV, and the internet.
The following diagram expresses the structure of the above statements in the form of an
event tree:
FIGURE A4.1.3 EXPANSION OF PATH 6 INTO AN EVENT TREE
Output from the midcasting
In the midcasting, some events were linked with “and” logic: all the preconditions had to be
true before a change would happen. Other events were linked with “or” logic, in which just
one of several preconditions would by itself bring about change. It follows that the more
“ands” (ceteris paribus) in a chain, the less likely an event would be to occur. But the more
“ors,” the more likely it would be to occur - hence the growth in news sources following the
1998 decentralization, which for the first time allowed news media to be set up without going
through a long sequence of government permissions.
Some of the midcast possibilities, though radical in political terms, were not expected to have
major likely effects on RN. These included:
1. Singapore, following a dispute over water rights with Malaysia, buys some almost unin-
habited parts of Riau province. Singapore is rich, and short of water; Indonesia is poorer,
and some Riau islands near Singapore are almost empty, partly because of an excess of
water. Singapore would build reservoirs on these islands and water mains under the Straits
of Malacca. This was seen as not unlikely, but would make little difference to the situation
of RN in Riau.
i1i2
i3
i4
i5i6
i7i8
o1
o2
o3
RN privatized

Dennis List: PhD thesis 416 Appendix 4
2. Following the example of East Timor has done, and under international pressure, Aceh
province becomes independent from Indonesia. Any ensuing war should not spill over into
Riau, separated from Aceh by one other province. RN Riau would not be greatly affected.
This was seen as highly unlikely.
Another possibility, seen as not unlikely, would have a much stronger effect on RN:
3. Democracy in Indonesia turns out to be too messy for the powerful TNI (military estab-
lishment). Fearing that TNI corruption is about to be exposed, a general persuades the
president (female, and seen as compliant) to hand over de facto power to him. The country
gradually returns to the pre-1998 status quo, with RN again taken over by the Department
of Information. However, many social forces would deter such an outcome, including the
need to suspend the recent Media Law, and international condemnation from wealthy
backers such as the USA.
Each of the above possibilities is a mini-scenario: a holon that could be developed further.
For example, the third scenario could branch into several ways for the government to deal
with RN to reduce public scrutiny, including closing it down, selling it, centralizing control
over news and information programs, and gutting the RN news service. Each of these could
become a separate linked mini-scenario.

Dennis List: PhD thesis 417 Appendix 4
Case 2: An engineering manufacturer (EM)
Background
The entity
Though this case began as a study of a single entity, it later became evident that two different
entities applied: the company, and its electric motor. Each of these is discussed separately.
Entity 1: the company
EM is a light engineering manufacturer, based in an Australian state capital city. It considers
itself to be in the business of “repetition engineering.” The company’s main business involves
using lathes to manufacture small metal components. It uses lathes and robots to make small
metal objects by machining: cutting away metal from a large, rough piece to make a smaller,
precise piece.
Though this was a factory, the general manager stated that “we’re not a manufacturer but a
service company.” EM saw itself as servicing its customers by providing metal objects for
them.
Business model. This company seemed at first to use a very simple value-chain model. It
bought raw metal and machinery from manufacturing suppliers, used the machinery to
transform that metal into small objects, and sold those objects to industrial suppliers. During
the study, more complexity became evident: for example, in some cases the supplier/customer
role was arbitrary.
Scale. At the time of this study, the company had a turnover of 8.6 million Australian dollars a
year, and a staff of 42, almost all of whom were full-time employees. All but about 10 of the
staff worked on the factory floor, which operated on three shifts, 24 hours a day. In terms of
futures studies, this was a small business – much smaller than had been anticipated for the
sample.
History. EM was founded in the 1920s by the father of the present chairman. For decades it
continued as a small enterprise, with a staff of around 8 people. The late 1990s saw the
beginning of major change. EM grew dramatically, with a compound annual growth rate of
38% from 1997 to 2002. Over that period, EM’s annual turnover rose from 1.2 million dollars
to 8.6 million, and the staff grew fivefold, to 42. This growth occurred for three main reasons:

Dennis List: PhD thesis 418 Appendix 4
(a) with the privatization of water supplies in the state where EM operated, it had bought
the workshop of the former water supply authority, which made components for water
meters.
(b) the purchase of an electroplating plant from a customer.
(c) one of Australia’s largest manufacturers of lawnmowers had closed its antiquated engine
factory, and chose EM as a major subcontractor for new engine components.
Additions (a) and (c) to the business were in the form of long-term contracts: 10 years, in the
case of (c). Both the chairman and the general manager were concerned about “putting all
their eggs in one basket” and had set out to make the company recession-proof, as far as
possible. They had no plans to enlarge the company further in the next 2 to 3 years, and
wanted to consolidate before any further substantial growth.
The chairman and general manager stated that the company’s recent growth was unplanned,
and that they had done no “marketing”. The chairman told me, “our success hasn’t happened
through anything that we’ve initiated. We were just in the right place at the right time.”
Nevertheless, if the company had not taken the risk of improving its infrastructure, and if this
had not become known among potential suppliers, the growth could not have occurred. In
discussion, it became clear that the company had poured considerable resources into improv-
ing its infrastructure, by buying advanced computer-controlled metalworking machinery, and
by instituting an unusually thorough program for the development of staff skills – such as
sending final-year apprentices to work in Switzerland for 6 months with the company’s
supplier of horizontal machining centres. EM also took a lot of trouble to “look after” its
suppliers – unlike (it said) other customers of those suppliers. This was done by giving long-
term contracts to suppliers, and notifying them in advance when the pattern of orders was
about to change. This helped to maintain regular supplies (all imported), and product quality,
which EM took very seriously.
Ownership and governance. This was a family company, two thirds owned by the chairman
and his family, and one third by the general manager. The management style was quite
informal – in contrast to the highly formalized accounting system.
Objectives. The long-term goal of the chairman and general manager was to reach a $1
million net profit level, and to sell the company in about 10 years’ time and retire – hence the
10-year timescale for the study.

Dennis List: PhD thesis 419 Appendix 4
Having outgrown its current factory, EM was now looking for new premises; this was the
main preoccupation at the time of the study. Its focus was on long-term contracts. The
managers did not want small jobs; in fact the electroplating division was deliberately not listed
in the Yellow Pages, in order to discourage one-off requests, such as car enthusiasts who
wanted their engines electroplated.
Time horizons. The general manager said that he looked about one year ahead: the current
financial year, and a little into the next year. His job involved making the company profitable
over this time horizon. As a verification of Jaques’ (1982) theory of the time horizons of
managers, the chairman had a much longer view – and was thus particularly interested in my
study. His time horizon was generally about 5 years into the future. The following table shows
time horizons for various aspects of EM.
TABLE A4.2.1 TIME HORIZONS FOR EM
Activity Time horizon Cash flow on a daily basis 60 days a Planned contract for lease of new factory 4.5 years Completion of training for a new apprentice 5 years Contract with lawnmower manufacturer 10 years
a. Though 60 days may not seem a long time for cash flow planning, the cash flow for each individ-ual day was planned that far ahead: e.g. the accountant could supply on 27 February the estimated payments and receipts expected on 26 April. This was feasible only because of EM’s long-term contracts with its customers and suppliers, and because it discouraged small jobs.
Staff. The most significant staff within EM were:
the chairman
the general manager
the factory manager
the QA manager, who also looked after OH&S issues (a new position, established only 6
weeks before my first interview with the company)
the accounts manager
the inventor: a semi-retired engineer who was developing a new type of electric motor
with EM.
Most of the 42 staff worked on the factory floor, with three shifts operating around the clock.

Dennis List: PhD thesis 420 Appendix 4
Entity 2: the electric motor
For several years, EM had been slowly developing a new type of electric motor. Technical
details are not relevant here, and if published may result in the refusal of a patent, but the
comparative advantage of this type of motor is that it has a much higher efficiency than
normal: around 95%, compared with a typical figure for other medium-power motors of less
than 75%. Though efficiency is not a significant factor in many situations, it is important (a)
when the motive power comes from batteries, (b) for higher-powered motors, (c) for motors
that run for many hours per day, and (d) in enclosed situations where heat load must be
minimized.
According to a marketing consultant I interviewed as part of this study, EM had made some
“half hearted attempts” at marketing the motor but marketing development was hampered by
several factors:
insufficient spending on development (because insufficient funds were available);
the fact that a major component of the motor could not be patented;
lack of initial customers (and insufficient management time devoted to finding them);
EM’s inability (because of its small scale) to fund development of the motor in its own
right, and its consequent need to depend on licensing other manufacturers.
Thus one of EM’s interests in going ahead with the futures work was to find a profitable way
forward for its motor.
Classification
In terms of the taxonomy of types of futures listed in chapter 8, this case met the following
criteria:
Category 1 The general future (not specific) of...
Category 2.5 A business
Category 3.3 Geographical scale: a country (Australia)
Category 4 Time horizon: specified as 10 years
In terms of the additional entity types sought for this study, it fulfilled four criteria fully, and
one partly:
A8 Self-contained entity, not part of any other, nor with any parts
A14 High level of innovation
A16 A growing entity, highly successful in recent years
A20 Manufacturing industry

Dennis List: PhD thesis 421 Appendix 4
A3 (partly) Cluster of manufacturers. (Though not a member of a formal cluster,
this company worked so closely with other actors in its supply chain that
it was effectively in a cluster.)
In holonic terms (fulfilling A8) EM consisted of a single entity: it was not part of anything
else, nor did it, in practice, have components. (It did have several business names and activi-
ties, but they all took place in the same factory.) Though the electric motor could not be
regarded as a separate holon, its future was potentially quite different from the future of EM.
The chairman told me that if the company was sold, it was quite possible that the rights to the
motor would not be sold with it: in that case, the electric motor would become a separate
entity.
Procedure Recruitment
Participants in this study were the managerial staff of the company. I interviewed six of them
in detail: the chairman, the general manager, the factory manager, the quality assurance
manager, the accounts manager, and the inventor. The participants were chosen by the
chairman, with occasional prompting from me.
Environment
Though the Process was designed to use participative workshops, it was not feasible to run
such workshops at EM. They did not want external people involved in this study (except for
one marketing consultant), but in such a small organization, all the staff members were very
busy, and could not spend much time with me. The exception was the chairman, whose work
did not involve day-to-day matters, and was highly interested in the future of his company.
Therefore, instead of using workshops, the development of futures for EM was done as a
series of 11 interviews, mostly involving the chairman, with others present at times. As most
of these interviews lasted from 2 to 3 hours, the total interaction time (27 hours) was longer
than the 14 or so hours that would have been spent in the “standard” workshop process.
The interviews were relatively unstructured, in that a broad list of issues (but not questions)
was drawn up for each interview, and often continued from one interview to the next. The
atmosphere at interviews was kept informal. Often, for example, a staff member would come
into the chairman’s office for another reason, and stay for a while to join the futures discus-
sion. My role, as interviewer, was to maintain a low profile, trying above all to listen and

Dennis List: PhD thesis 422 Appendix 4
understand. To handle these requirements, I developed a technique of increasingly-structured
interviewing – as noted in chapter 8.
Activities
Given this shortage of management resources, the scenario network was developed largely by
myself, using input from the staff involved. The following aspects of the Process were used
Stakeholder map
Morphological scenario paths
Futures wheel
Midcasting.
Elements of the Process that were not used included (a) the analysis of multiple presents and
multiple pasts - I found no evidence of these, and (b) backcasting - largely replaced by the
detailed midcasting.
The Stakeholder Star
Following the slow process of discovering stakeholders in the RN study, I devised a system
for mapping stakeholders into seven broad groups, labelled the Stakeholder Star, (as described
in chapter 5, section 5.3.1). By considering each group in turn, omission of any stakeholder
type becomes less likely. Having identified a provisional set of stakeholders, it was then
possible to ask, for each stakeholder, “are there any other organizations or people that both
you and this stakeholder also deal with, or have some influence on both of you?” Using this
process, additional stakeholders, who were not initially obvious, could be identified.
Applying the Stakeholder Star to EM, all stakeholders (gradually discovered over several
meetings) were listed, and placed into the seven categories:
1. suppliers, direct and indirect
2. customers, direct and indirect
3. peers (including competitors)
4. regulators, governments, etc.
5. neighbours
6. news media
7. dependents, including staff.
Though EM had far fewer stakeholders than RN, it had a more complex value chain, because
some of its suppliers were also customers. Its largest and most powerful “customer” was not

Dennis List: PhD thesis 423 Appendix 4
actually a customer at all, but the customer of another customer. This complexity is addressed
in more detail in List (2003c).
Futures wheel
We developed a first-level set of 8 morphological possibilities intended to be comprehensive
and mutually exclusive, following the principles of Zwicky (1969). Normally a futures wheel
(as in Glenn, 1972) takes a more passive approach: “What might happen that could affect us?”
as opposed to “What might we do?” For SNM, the former is handled by the midcasting
phase.
TABLE A4.2.2 FIRST-ORDER FUTURES WHEEL FOR EM
Scenario path Issues for second-order futures wheel 1 Consolidate recent expansion How can this best be done? 2 Sell the company Who to? All or part? Advertise or wait? 3 Seek more work of current type Through which avenues? 4 Drop some current activities What basis for decision? Which activities? 5 Add new activities What basis for decision? Which activities? 6 Add a new industry What basis for decision? Which industry? 7 Drop an existing industry Machining: outsource all manufacturing
Electroplating: sell plant Electric motor: sell or abandon
8 Any other possibilities (None were identified)
At the time of the study, EM was operating in Path 1: consolidation mode. They were not
seeking new customers, having acquired a very large customer 9 months previously, and were
still trying to come to grips with their ensuing expansion. For example, on the day my study
began, they hired a QA manager to improve the quality control. Their other preoccupation at
the time of the study was a planned move to new premises, which occurred largely due to the
major new customer. A consequence of this move was to sell older equipment that was no
longer needed. Part way through this study, EM decided to postpone the move.
Midcasting
For an indeterminate point in the mid-future, we postulated some surprises – developed
jointly by myself and several senior managers. For EM, these surprises (extending over a range
of time horizons) were:

Dennis List: PhD thesis 424 Appendix 4
TABLE A4.2.3 SOME MIDCAST POSSIBILITIES FOR EM
Item Possibility Warning 1 Major customer overreaches in its export attempts, and is declared
insolvent without warning, leaving EM with a now-worthless stock of engine parts
1 week
2 Attempt by major customer to buy EM 2 months 3 Several major competitors merge in a large, low-cost, aggressive
operation 6 months
4 Sustained 30% increase in value of Australian dollar 1 year 5 The lawnmower motor wins an enormous contract overseas, and EM
is asked to set up a factory there 18 months
6 Unsuccessful diversification by EM into a non-manufacturing industry. Almost all invested funds lost.
2 years
7 Advances in metal casting technology eliminate the need for machin-ing (EM’s expertise)
3 years
8 Decline in industrial relations, resulting in strikes and sabotage 3 years 9 Successful marketing of the new electric motor in a role to which it is
well suited, such as propulsion of small electric vehicle, refrigeration, or as a portable generator
3 years
10 Engineering plastics replace many of the small metal parts that EM produces
5 years
11 A 3D copier comes onto the market and is bought by many of EM’s customers
10 years
For each of the above surprises, the Process weaved back and forth between the present, the
future, and the surprise, by asking this series of questions:
1. What would be the factors influencing this surprise?
2. What sequences of events would precede the surprise: the leading indicators (if any)
that it was about to occur?
3. What would be the likely warning period?
4. What sequences of events would follow from the surprise?
5. What previous analogies or models exist for such a surprise?
6. What is the likelihood of such a surprise occurring?
7. What steps could EM take to make the outcome more favourable for itself?
By applying this weaving process to many surprises, the ensuing “fabric” may eventually
become complete enough that no matter which surprises were used as inputs, the scenario
network would be similar. Even with the 11 surprises explored here, few new causes and
effects had to be added for the last few surprises. The following example considers these
factors for one midcast surprises that was considered highly likely:

Dennis List: PhD thesis 425 Appendix 4
Surprise 4: Revaluation of Australian dollar Sustained 30% increase in value of Australian dollar against major trading currencies – US
dollar, Euro, Yen, Yuan. 1. Influencing factors: (a) international interest rates, (b) the widely perceived undervaluation
of the Australian dollar - e.g. occasional references in The Economist over the last few years.
2. Leading indicators: The Australian dollar moving steadily upwards over many months, par-
ticularly against the trade-weighted index, not only against the US dollar. A relative increase in Australian interest rates (which might involve no change in domestic interest rates, but a decline in interest rates among trading partners) may bring about a fairly sudden change. A key currency to monitor is the Yen: long-term problems in the Japanese economy, together with some unpredictable precipitating factor, may cause a rush by Japanese investors to-ward the Australian dollar.
3. Warning period: around 1 year - for practical implications of the revaluation. 4. Consequent events: (a) Imported materials become 30% cheaper (lowering EM’s input
costs), but (b) so do imported goods (increasing the attractiveness of imports to EM’s cus-tomers). Thus (c) goods exported from Australia also become 30% more expensive at their destination. If the currency realignment persists, this could have strong effects on EM – and every other Australian manufacturer, with a consequent decline in Australian manufacturing. The chairman stated that this wouldn’t affect EM much, because they don’t export, and im-port costs are a small component of their inputs. However, some EM customers may be ex-porters, and they would be under pressure to reduce costs to remain competitive. A warning sign was that EM recently missed out on a valuable contract: an Italian company won the job, at a much lower cost than EM could match. This was thought to be because the Italian company had more advanced machining equipment, with much greater economies of scale.
5. Previous analogies: The cut in Australian tariffs in 1974, which had a strong negative effect
on Australian manufacturing for at least 5 years afterwards. 6. Likelihood: This has a strong possibility of happening, and thus would hardly be a surprise
at all. For example, from August 2002 to February 2003, the Australian dollar rose from 48 cents US to 61 cents: a rise of 27% in six months (though the trade-weighted index rose less). The US dollar is acknowledged by many economists to be over-priced, while in terms of purchasing-power parity, the Australian dollar is clearly under-priced.
7. Steps EM could take: Outsource manufacturing to a low-cost country in Asia. With EM’s
strong focus on quality control, this might involve EM’s QA staff permanently working in the supplier’s factory. In Australia, EM’s focus would change from production to design and qual-ity management.

Dennis List: PhD thesis 426 Appendix 4
Output Multiple pasts
Though the method as designed includes an analysis of multiple pasts influencing multiple
futures, I could find no clear evidence of multiple pasts in discussions with EM. Part of its
growth had occurred through the purchase of a water-meter manufacturing business in 1998,
and they had acquired only the shopfloor staff with the purchase of the business. Though few
of those staff had left, the work they were now doing was essentially the same as they had
been doing up till 1998, and there were too few of them (about five) to have a noticeable
effect on EM.
The only indication of a “multiple past” I encountered was from the general manager, who
before joining EM in 1998 had worked in the management of supermarkets and distribution.
His ideas for EM’s future growth included a diversification into these two industries, and the
gradual replacement of skilled staff by unskilled staff operating more mechanized equipment.
The chairman, who had inherited EM from his father, tended to favour retaining the more
skilled staff as a potential competitive advantage for the company. He too was interested in
diversification into other industries, but expressed doubts about supermarkets and distribution
as likely possibilities.
Multiple presents
No clear evidence emerged of the existence of multiple presents. All the people I spoke to
shared essentially the same vision of EM’s present operations. This probably arose (or so it
seemed at the time, without any other sites for comparison) because of the small number of
staff: only 42 in total, all but about 8 of whom worked on the shopfloor, on 3 rotating shifts
for 5 days per week.
One obvious reason for the lack of multiple presents and multiple pasts was the homogeneity
of participants: all but one (the marketing consultant) worked for EM. Had some of its other
stakeholders taken part in this study, such multiple perspectives may have emerged.
Morphological scenario paths
With EM, I explored a different approach to the morphological analysis, which had not been
highly successful with RN. In RN’s case, the morphological endpoints had consisted of events
outside the control of the part of RN (the Riau provincial office) that was effectively the client.

Dennis List: PhD thesis 427 Appendix 4
Though this was realistic, it had also meant that the staff did not feel involved with the
process, or empowered by it.
Since EM was a more independent entity than was RN in Riau, I experimented by setting up
the morphology in a different sequence. Though the first split was still exis-
tence/nonexistence, the second and third splits involved choice-based criteria. The focus here
was what the entity was trying to do, not what might happen to it, and the morphological
options were consequently purposive and endogenous.
Morphology for EM’s electric motor
The problem with that set of paths was how the electric motor might fit in to that. After
considering several options I realized that it was best to treat the electric motor project as
being a separate entity: a subsystem of EM. After all it had its own staff (the inventor and his
assistant), a separate line of funding, and a potentially very different future to the rest of EM.
Also, the chairman indicated to me that if EM were sold, the electric motor project might well
not form part of that sale. Thus we created a separate morphological set for the electric
motor, with ten final outcomes. In the corresponding diagram for RN (Figure 9.2.2) final
outcomes were simply numbered from 1 to 13, but I now realized that this was not conducive
to extending the morphological hierarchy. Therefore the following figure uses an easily
extensible (though more cumbersome) notation, alternating numbers and letters.
Abandon, and cut losses [1A] Give away [1B]
Advertise by tender [1C1] Approach international manufac-turer of motors [1C2]
No [1]
What is best way to finish?
Sell IP [1C]
To whom?
Approach local contacts [1C3] Current or smaller [2A] Internally funded [2A1]
Internally funded [2B1] Loan from financial institution [2B2] Sell shares to investors [2B3]
Continue develop-ment of motor?
Yes [2]
What scale?
Larger [2B]
How funded?
Joint venture with motor manufac-turer [2B4]
FIGURE A4.2.1 MORPHOLOGICAL FUTURES FOR EM’S NEW ELECTRIC MOTOR
Option 2B1 (increased funding from internal source) depended on significant growth in EM’s
earnings – a strong possibility, given its performance over the past 5 years, but by no means

Dennis List: PhD thesis 428 Appendix 4
certain. Options 2A1 and 2B1 to 2B3, given their funding restrictions, would imply develop-
ing the motor for a local niche market, for which the motor’s characteristics were particularly
suited. These included three obvious applications: electric wheelchairs, miniature wind-
powered generators, and brewery pumps. However, extending the above diagram to include
them would upset the morphological hierarchy. To maintain the hierarchical structure, each of
the three candidate applications would have to be included in each of those four funding cells,
creating 12 new cells: not a useful solution. The morphological hierarchy would thus need to
be replaced by a faceted morphological box (as described by Zwicky, 1969)
At the end of this study, the option of brewery pumps was being explored in detail. This was a
reconstruction of option 2A1, which had originally been seen as from internal funding
through other sales by EM. Now it could be split into two: the initial concept (2A1A), and an
addition of self-funding through sales of the motor in its current prototype form (2A1B). The
motor’s larger-than-desirable size at the current stage of development was not a problem for
brewery pumps, and servicing would be easier in situ than in a mobile device.
Midcasting for the electric motor
The midcasting process revealed two major potential surprises for the electric motor:
1. A large organization, probably an existing manufacturer of electric motors, releases a
motor with similar properties (in particular, high efficiency) and markets it widely, at a
lower cost than EM could produce it for. (The longer EM took to bring its motor to
market, the more likely this would be to occur.)
2. EM tries to get funding for the motor, and releases details to a potential joint venture
partner on a confidential basis, since one essential part of the motor is not patentable.
That partner later markets a motor closely based on EM’s design, but with minor varia-
tions, sidestepping EM’s intellectual property. There are several variants on this possibil-
ity, in all of which EM has no recourse except to mount a protracted international legal
case, the costs of which may outweigh the benefits.
Several other possibilities were identified, but these were considered to be part of the cause-
and-effect weaving, not surprises. For example, the death or serious illness of the inventor
(who was about 70 years old) might cause development to be abandoned. But this is simply an
input to option 1, abandonment. Perhaps because of the limited number of people involved
who knew enough about the motor to provide useful input, and/or because of the specialized
nature of this particular set of futures, it would not be possible to generate a large enough set
of midcast possibilities that they could form a network by being connected to each other.
Dennis List: PhD thesis 429 Appendix 4
Case 3: The 2003 war in Iraq
The entity
A continuing challenge of this case was to define the entity. The framework set out in chapter
7 characterizes any futures project as studying “the futures of [specified concern] among [specified
social group] in [specified location] during [specified time range].” The category of concern covered both
activities and concepts. Every other case in this project was a social entity: either an organiza-
tion or a geographical area. In this case, the initial entity was the possible war in Iraq. Because
this was becoming a worldwide political issue, other entities could also have been identified,
such as the effect of a war in Iraq on other countries’ relationships with the USA. By specify-
ing the entity too broadly, the scope of the study would become large and unmanageable. On
the other hand, by specifying the entity too narrowly as events unfolded, there was a danger of
ignoring important effects (just as the Europe 2000 study discussed in Appendix 1 overlooked
the potential for change in Eastern Europe). Unlike every other case in this project, the scope
was not specified by the entity’s needs, because there was no client.
The solution adopted was not to seek an exact definition, but a focus. Thus the final defini-
tion of the entity was “the conflict between the USA and Iraq, centred on the war in 2003.”
The term “conflict” covered threats of war, possible war, and possible guerilla resistance
during a US occupation of Iraq. The second half of the sentence allowed related issues to be
included.
In terms of scale: compared with the other cases in this project, this was by far the largest-
scale entity, in terms of number of people involved, number of people aware of it, and in
financial terms.
Classification
In terms of the taxonomy in chapter 8, the Iraq case met the following criteria:
Category 1.1 An action
Category 2 No specific social entity – but see below
Category 3.3 Scale of location: a country
Category 4 Time scale: around 3 years

Dennis List: PhD thesis 430 Appendix 4
In terms of the additional entity types sought for this study, it was a member of the following
groups:
A4 Entity undergoing major organizational change
A9 Complex set of large-scale events with many unknown factors
A13 International entity
A15 Situation with a high level of conflict
A26 Situation driven mainly by the intentions of the actors involved.
Procedure
As this study used secondary data, there was no recruitment of participants. The scenario map
was prepared mainly by myself, with occasional contributions and suggestions from several
colleagues who had closely followed the development of this issue. Most of these were
doctoral students in management-related disciplines; none was a student of history or political
science. Their contributions were more like peer reviews than participation in the sense of the
other case studies
The initial scenario map was created in February 2003, and presented at a seminar on qualita-
tive research methods. Following feedback from other participants, I revised the network map
and presented it again at another seminar a month later, a few days before the invasion of Iraq
began. At that time, it was still uncertain whether or not the war would go ahead. The first
version had included only the events (top) layer of the hemisphere (as described in chapter 4,
section 4.7), while the revised version added the second layer, of intentions. The third layer
was added later, by which time the war had officially finished.
The main data sources used for this case included news media (mainly online), peer-reviewed
articles (few, because of the delays inherent such publishing), articles in news and current
affairs magazines (fact-checked rather than peer-reviewed), web sites, and several books. The
sources most frequently used were as follows. All website references were rechecked on 21
March 2005.
News media:
BBC News Archive (www.bbc.co.uk)
Online English-language newspapers and news services in Islamic countries, listed on the
web site of the Brookings Institution’s Saban Centre for Middle East Policy:: Major English-
language Media Sources Within the Islamic World, at
www.brookings.edu/fp/research/projects/islam/resources.htm

Dennis List: PhD thesis 431 Appendix 4
US newspapers, particularly the International Herald-Tribune and the Christian Science Monitor
Public Broadcasting Corporation, USA (accessed through www.pbs.org)
Journals and current affairs magazines:
Aspects of India’s Economy, special issue on the US-Iraq war, nos. 33-34, December 2002
The Atlantic Monthly: a series of detailed articles, including Langewiesche (2004), Pollack
(2004), and Fallows (2004).
Books:
Cerf and Sifry (2003) - a wide-ranging anthology on the war
Marr (2004) Modern History of Iraq
Kapitan and Schulte (2002) and Primoratz (2004) on issues relating to terrorism
Pelletiere (2001), on oil as a factor in the 1991 Gulf war.
Reports and official documents:
US Energy Information Administration (2004) Iraq Energy Chronology, 1980-2004
Glenn and Gordon (2003) on peace scenarios for the Middle East
US Defense Science Board (2004) Transition to and from Hostilities
Pew Research Center (2003) Views of a changing world: June 2003
Open Society Institute (2003) Reconstructing Iraq: a Guide to the Issues.
Websites other than news:
www.aeronautics.ru (a Russian military viewpoint)
www.regiments.org (a British military viewpoint)
Papers from a series of 2003 workshops from the Wharton Business School, University of
Pennsylvania (knowledge.wharton.upenn.org), on the rebuilding of Iraq
www.newamericancentury.org (a US Republican agenda for the 21st century).
The main uses of these sources were to determine the course of events, the relevance of these
events as seen by various stakeholders, and the perceived motives of the actors involved.

Dennis List: PhD thesis 432 Appendix 4
Output
To assist with compiling the scenario map, two preparatory documents were created:
a system impingement diagram – including only the major actors, because so many
different groups were involved. (To some extent, most of the world’s population were
stakeholders in this issue.)
a Leaf of Goals, for the USA’s intentions. Leaves of goals for other actors were not
attempted, because insufficient information was available.
Impinging systems
Figure A4.3.1 below shows the expected post-war state, with US occupying forces dominating
the Iraq government (or what would be left of it) and also the Iraqi population. To keep the
diagram legible, only the key actors are represented. Directions of arrows show influence:
solid arrowheads show power, open ones, advice. (How could guerilla groups have power
over the US cabinet? In that they could make it react.) Lines with question marks instead of
arrows suggest that influence probably exist, but the direction is uncertain.
Note that the systems can be amalgamated into larger holons in several ways - such as (a) a
Western Powers group on the left and a Middle Eastern group on the right, and (b) a US
government group at upper left centre and an Iraqi group at upper right. Conversely each of
the units in the diagram could be subdivided further - such as dividing the “Iraq Population”
group into Sunni, Shia, and Kurdish components.
FIGURE A4.3.1 SYSTEMS IMPINGING ON THE WAR IN IRAQ
? ?
US president & cabinet
State Dept
PentagonUS armed
forces
US public
US industry
Foreign governments
Iraq government (post-Hussein)
Iraq’s Islamic neighbours
Iraqi public
Guerilla groups
Oil compa-nies

Dennis List: PhD thesis 433 Appendix 4
Leaf of Goals
Figure A4.3.2 (below) was the first Leaf of Goals to be constructed. This shows various
objectives of the USA in its “War on Terrorism.” The goals progress from left to right (the
direction of kairos) but the diagram is more easily read from right to left, beginning with the
ultimate goal of “survive well” at the far right of the leaf, with round-tailed arrows indicating
that there are other ways of surviving well. The leaf is incomplete at lower left in the “Remove
threat” strategy group: partly because it was not feasible for the USA to present a low profile,
and partly because dealing with the terrorist threat at the root cause level does not seem to
have been explored (Kapitan, 2002; Primoratz, 2004). The upward arrow from “Régime
change” signifies side-effects arising from that action - which may either reinforce or work
against accomplishment of the major objectives. Higher-level objectives, not involving specific
action, do not have specific side-effects.
The diagram could be indefinitely expanded, using the holonic principle. For example, the
“Régime change” box could be split first into different countries, then into different modes of
régime change, including direct military attack, removal of key leaders, and fomenting opposi-
tion. To present a detailed Leaf of Goals, a succession of diagrams would be needed.
FIGURE A4.3.2 LEAF OF GOALS FOR THE USA IN ITS “WAR AGAINST TERRORISM”
Note the use of some mutually exclusive pairs to ensure completeness at the higher (right-
most) levels: Deal with Threat vs Obviate Threat, and Offensive vs Defensive. To that extent,
the right hand part of the Leaf of Goals is a morphological hierarchy.
start Feel safer
Régime change in Afghani-stan, Iraq
Attack “rogue states”
Offensive: “War against terrorism”
Deal with threat
Obviate threat
Remove reasons for threat
Present a lower profile
Defensive: protect targets
Set up warning systems
Restrict access to targets
Survive well

Dennis List: PhD thesis 434 Appendix 4
With this first Leaf of Goals using a real case, some practical questions emerged. Chief among
these was the issue of whether to present the goals as seen by the focal entity, or a potentially
larger set of goals including some seemingly not considered by that entity. The solution
(embodied in Figure A4.3.2) was to show as many high-level goals as could be identified, but
to provide detail (toward the left) only for goals known to be considered by that actor.
It would also be useful to create a Leaf of Goals for the other major party in this conflict, the
Iraqi government led by Saddam Hussein, but from the information available (such as Cerf
and Sifry, 2003, and Fallows, 2004) it was not possible to create a coherent goal structure.
Scenario map
Having delineated the Impinging Systems and the Leaf of Goals, it became possible to create
a scenario map. As this case was the first in which the hemispherical model was applied, each
of the four layers is dealt with separately.
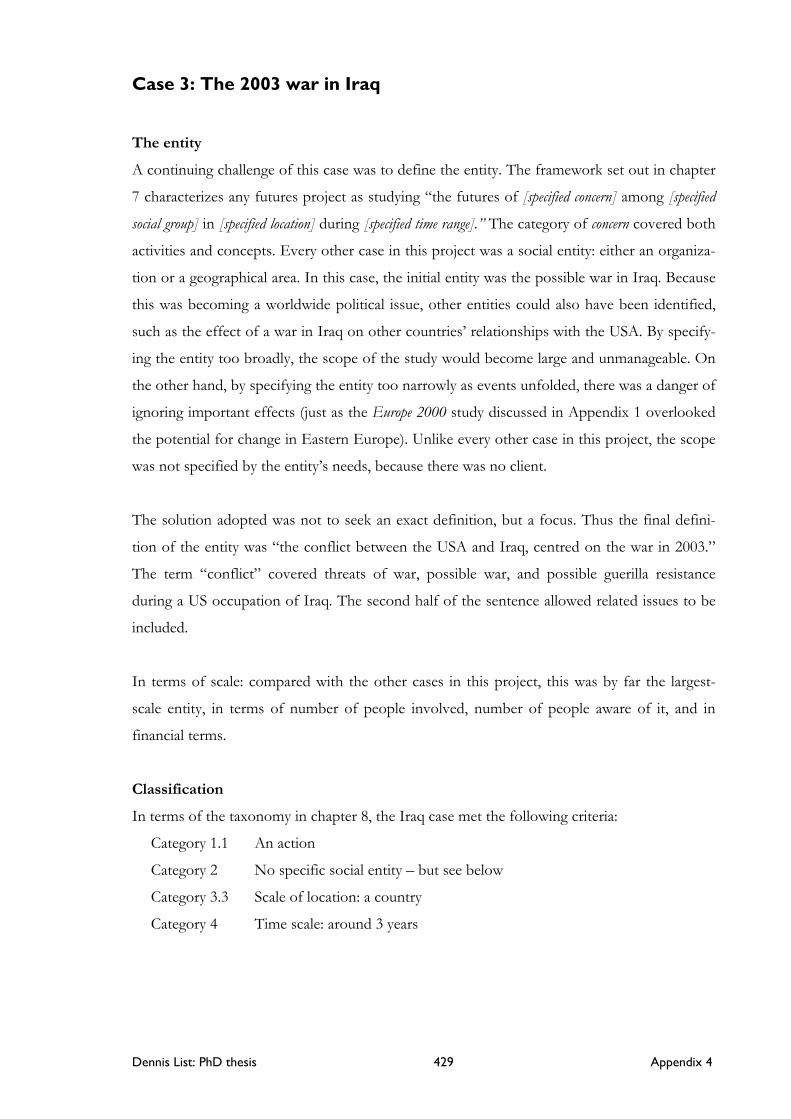
Layer 1: events
Figure A4.3.3 (overleaf) shows the top level, with events as holons. A key issue was how
much detail should be included on the scenario map. Each of the holons could have been
divided indefinitely: the challenge was to present few enough that the map could be clearly
understood as a whole, but many enough that no major possibility was excluded. Accordingly,
a practical decision was made to restrict the map to a single page: A3 size when displayed on a
wall, and A4 when included in a report. This accommodated an upper limit of about 30
holons. Figure A4.3.3 has 29 holons, of which 9 are in the past and 20 in the then-future.
Given the constraint of fitting the diagram onto a single page, the Past section of the map was
much abbreviated. This enabled more focus on the future (at the time of preparation, in
February 2003),
Layer 2: motives
As noted in chapter 5, the focus in a scenario map is more on the links between events than
on the events themselves. Thus the second layer of the hemisphere shows the underlying
motives for each transition between two events. The 29 events in Layer 1 were connected by
34 links between pairs of events: hypotheses that the occurrence of the first event in the pair
would lead to, “cause,” or increase the probability of the occurrence of the second event. The
corresponding question to ask for each link is “For what reasons would the first event lead to
the second?” Because this is a study of human futures, those reasons would entail human
agency, labelled here as “motives” in the broadest sense.

Dennis List: PhD thesis 435 Appendix 4
Figure 4.3 in chapter 4 implies that each layer would include less detail than the previous level.
In this first application of multiple layers it became obvious that that assumption was mis-
taken. This was partly because there were more links than nodes in Figure A4.3.3 (almost
necessarily: otherwise the scenario map could only be a single chain, with no branching), and
partly because (in accordance with the multiple-cause axiom) most links between events had
multiple and distinct reasons.
Dennis List: PhD thesis 436 Appendix 4
AH
AG
AF
X
K Z
AA
AC
AD
AE
AB
G
P
Q
R
T
N
S
U
V
W
X
Y
O
L
B
C
D E
F
M
H
J
I
A Sept 2001 attacks on US
Gulf war 1991
US threatens Iraq
Afghan régime ousted
US worries about more attacks
US loses interest in Iraq
US attacks Iraq
Iraq doesn’t comply (enough)
Iraq complies without war
Unrest among Kurds and Shiites
Other countries mediate
Trouble-some US colony
Successful US colony
US loses [unlikely]
Saddam stays on
Anti-US coup in another country
US military attention tied up
US bombs Iran, Libya, Syria...
Other powers put sanctions on US
Iraq split into 3: Sunni, Shia, Kurd
More rogue states emerge
Feb 2003
Iran and Turkey drawn into the conflict
Al Qaida blamed
Iraq defies sanctions
Unrelated crisis occurs
Sanctions on Iraq
Terrorism lessens
Terrorism increases
Some rogue states reform
L
FIGURE A4.3.3 LAYER OF THE SCENARIO MAP: EVENTS
436

Dennis List: PhD thesis 437 Appendix 4
As an example of a key transition, the following are possible explanations for question 1 on
transition B in Figure A4.3.3. A question frequently asked at the time was “Why is the USA
picking on Iraq?” when there was little evidence that Iraq had supported anti-US terrorism.
One answer is that the multi-cause axiom applies: though there was no one overwhelming
reason (unless the US government genuinely believed that Iraq possessed and was ready to use
weapons of mass destruction), there are many minor reasons:
TABLE A4.3.1 LINKAGES FOR TRANSITION B IN FIGURE A4.3.3
B. US worries about more terrorist attacks US threatens Iraq (i) Internationally oriented reasons 1 Iraq is rumoured to have weapons of mass destruction, including rockets capable of attacking
(US client state) Israel. 2 Iraq government is no longer co-operating with weapons inspectors. 3 Hussein/Baathist regime is tyrannical, probably unpopular with most Iraqis. 4 As régime is territorially aggressive (having attacked Iran and Kuwait), its removal should please
neighbouring countries. 5 A more moderate régime in Iraq might help resolve the Israel/Palestine question. 6 Educated/moderate population compared with others in region, so Iraq could quickly become a
modern developed state, an example to others such as Saudi Arabia. 7 Outstanding UN resolution from 1991 can be used to justify intervention. 8 Of all six “rogue states” identified by US, Iraq would be the most acceptable target to the UN, for
the above reasons. (ii) US domestic reasons 9 Proposals for Iraq régime change had circulated within the US government since at least 1991. 10 US desire to preserve flow of oil from Middle East (with US oil supplies running out). 11 Unfinished “son’s business” (President Bush Sr allowed Hussein régime to stay). 12 Iraq trading oil in euros, not US dollars, threatening stability of the US currency. 13 Divert US public from ailing US economy. 14 If US wanted to dominate world oil, Iraq is an ideal country to control.
All the above reasons could be combined to form a scenario map just as complex as the main
map in Figure A4.4.3. Note that not all components can be described as strictly “motives”:
that term is simply a label covering the reasons why human events occur. However, hindsight
is perhaps more fruitful than foresight in supplying such motives. Turning now to a sample
transition between future events, consider link Q, four which only four motives were identi-
fied:

Dennis List: PhD thesis 438 Appendix 4
TABLE A4.3.2 LINKAGES FOR TRANSITION Q IN FIGURE A4.3.3
Q. US attacks Iraq Iraq becomes a troublesome US colony 1 US occupation is not welcomed, with Iraqi perceptions that US (and its occupying army) does not
respect Islamic values.
2 USA and UN fail to deliver on promises, such as quickly ending sanctions. This creates hostility
to the new government and US occupying forces.
3 Widespread destruction of infrastructure during US attacks creates public hostility.
4 Internal conflict, previously suppressed by Hussein government, flares up, with inter-ethnic
fighting in Iraq between Sunni, Shia, and Kurdish groups.
Having found so many motives (95 in total, for the 34 links), it proved not feasible to show
them all on one diagram; some method of data reduction became necessary. Because each
major actor’s more tactical motives (toward the left of the Leaf of Goals) hardy varied
through this period, the obvious solution was to group motives by actors. The result was this
table of motives:
TABLE A4.3.3 MOTIVES OF ACTORS UNDERLYING EVENTS IN FIGURE A4.3.3
Actor Ascribed motives Relevant links Be re-elected I J K O P Q U W Z
aa-ac ae-ah Reduce risk of terrorism in US Z aa-ac ae-ah Increase US power in the world (political, military, and corporate)
O P Q N S T W X ag ah
US president and cabinet
Make Iraq more like USA P Q No foreign terrorist attacks in US a - US public Continued supply of oil a - Maintain influence on US cabinet J K O P Q U X Increase fighting skills K U X Increase equipment levels K U X
US military
Avoid casualties K U V X Continued supply of cheap oil a - US industry
Corporate growth a - Exert influence over Middle East L P W Y Keep US power in check K-N R S U X Reduce Islamic terrorist threat locally Z aa-ac ae af
European powers (Germany, France, Russia)
Continued supply of cheap oil from Iraq L P R S Appear to be strong, so enforce resolutions G K UN Reduce conflict within Security Council K P Q U Be source of all power in Iraq I K Escape UN sanctions, no-fly zones, etc. G I R S
Iraqi government (1) Baathist
Dominate region by military threat K-N R S

Dennis List: PhD thesis 439 Appendix 4
Actor Ascribed motives Relevant links Do not offend USA P Q V X ad Rebuild Iraq’s economy following sanctions P Q V ad
Iraqi government (2) under US occupation
Resist partition of Iraq V Y Recover lost standard of living a P Q V Freedom from arbitrary power a P
Iraqi public
Not to be affected by violent conflict a P V ad Retain privileges from Baathist regime Q Iraqi resistance Guard Islamic heritage PQ Keep US power in check L N R S Guard Islamic heritage L N P Q R S Good relations with new Iraq government P Q V Y ad
Iraq’s Islamic neighbours
No independence for Kurdistan [on the part of Turkey, Iran, Syria]
V Y ad
a. For the various publics, stakeholders rather than actors, these are wishes rather than intentions..
Though the above table is concise, unfortunately it is difficult to relate the motives to the links
in Figure A4.3.3. However, after experimenting with several graphical methods of connecting
motives to events, all were a tangled mess of lines, just as difficult to interpret as the above
table, but more prone to error. One solution would be to use software that displayed a
scenario map at the events level, which would display motives whenever the mouse was
moved over one event. However this would not be simple to produce, and no existing
software was found that could do this. On the positive side, the use of a table such as the
above simplified the construction of the next (values) layer of the hemisphere.
Layer 3: Values - first classification
Following the model outlined in chapter 4 (section 4.7) and the data reduction implicit in
figure 4.3, the third layer was initially based on a set of values derived from the research
carried out in this field originally by Rokeach (summarized in his 1973 book) and continued by
Schwartz and colleagues (most comprehensively summarized by S. Schwartz, 1994). The issue
to be tested in this case study - to confirm the usefulness of the hemispherical model - was
that a set of values could be drawn from the data that would plausibly link the frequently
changing motives in Layer 2 with the imperceptibly changing worldviews in Layer 4. The
following table derives two primary values underlying each motives listed in Table A4.3.3
(sourced mainly from attributions in news reports of the conflict).

Dennis List: PhD thesis 440 Appendix 4
TABLE A4.3.4 VALUES ASCRIBED TO MOTIVES OF DOMINANT ACTORS Actor Relevant motives, stated and deduced Primary values
Get president re-elected power, achievement Reduce risk of terrorism in US security, tradition Increase US power in the world (political, military, and corporate)
power, achievement
US president and cabinet
Make Iraq more like USA security, prosocial a No foreign terrorists in US security, tradition US public Continued supply of oil comfort, tradition Maintain influence on US cabinet power, achievement Increase fighting skills self-direction, achievement Increase equipment levels stimulation, power
US military
Avoid casualties benevolence, conformity Continued supply of cheap oil comfort, tradition US industry
Corporate growth achievement, comfort Exert influence over Middle East power, security Keep US power in check power, prosocial Reduce Islamic terrorist threat locally security, tradition
European powers (Germany, France, Russia)
Continued supply of cheap oil from Iraq comfort, tradition Do not appear weak, so enforce resolutions power, conformity UN Reduce conflict within Security Council harmony, achievement Be source of all power in Iraq power, tradition Escape UN sanctions comfort, self-direction
Iraqi government (1) Baathist
Dominate region power, achievement Do not offend USA conformity, security Rebuild Iraq’s economy following sanctions comfort, achievement
Iraqi government (2) under US occupation Resist partition of Iraq power, self-direction
Recover lost standard of living comfort, benevolence Freedom from arbitrary power self-direction, benevolence
Iraqi public
Peaceful life security, comfort Retain privileges from Baathist regime comfort, tradition Iraqi resistance Guard Islamic heritage tradition, power Keep US power in check power, tradition Guard Islamic heritage tradition, power Good relations with new Iraq government harmony, comfort
Iraq’s Islamic neighbours
No independence for Kurdistan [on the part of Turkey, Iran, Syria]
security, tradition
a. Disagreed with by some reviewers of this case, but supported by evidence in Langewiesche (2004).
The most widespread values in the above table are power, security, and comfort: perhaps to
be expected, when actors are political entities. Of course, the table is an over-simplification: it
can be presumed that for any intention, many values apply, to varying extents. The central
issue here is to what extent changes in values determine changes in the motives in Layer 2 -
and vice versa. Because the above classification did not seem particularly helpful to anybody
who reviewed it, other categorizations of values were applied to the same set of intentions.

Dennis List: PhD thesis 441 Appendix 4
Layer 3: values - second classification
For the second working of the data, values were based on two other taxonomies: the four
mindscapes of Maruyama (1980, 1982, 1994), and the eight VMemes of spiral dynamics (Beck
and Cowan, 1996; Cowan and Todorovic, 2000). These are not so much individual values, as
clusters of values.
The following table attempts to assess predominant values among the eleven dominant actor
groups in this case, using both Beck’s and Maruyama’s categorizations. The VMemes in the
table are from Wilber’s (2003) paper on the war in Iraq, hence the addition of two actor
groups not included in the previous tables, but to which Wilber specfically referred. As an aid
to memory, the colours are followed by number (in the range 1 to 8) illustrating the VMeme
spiral of development. The mindscapes are my own interpretation, after relating the descrip-
tions by Maruyama (1980 and 1982) to my knowledge of events, drawn mainly from a wide
range of online news sources based in the US, UK, Australia, and Middle East.
TABLE A4.3.5 VALUES ASCRIBED TO DOMINANT ACTORS
Main value clusters Actor group VMemes Mindscapes
US cabinet & president blue (4) a Individualist US public blue (4) to orange (4) a Individualist US industry orange (5) Hierarchical US military orange (5) Hierarchical European powers (Germany, France, Russia) green (6) Hierarchical, Stable UN green (6) Stable Iraqi government (1) Baathist red (3) a Hierarchical Iraqi government (2) under US occupation blue (4) ? Hierarchical Iraqi public blue (4) Hierarchical, Stable Iraqi resistance red (3) to orange (5) ? Hierarchical, Stable Iraq’s Islamic neighbours red (3) to blue (4) Hierarchical, Stable UK government (esp. Blair) yellow (7) a .. Western media (esp. print, non-populist) green (6) to orange (5) a .. a. As stated by Wilber (2003)
The intended use of the above table was to help foresee changes in values (Layer 3) which in
turn influence changes in motives (Layer 2), which in turn would influence changes in events
(Layer 1). However, after three layers of the hemisphere had been completed, the usefulness
of the values layer was not evident. Dividing values using the above taxonomies seemed of
questionable value; further development was clearly needed.

Dennis List: PhD thesis 442 Appendix 4
Case 4: A community legal service (LS)
The entity
LS was founded in the early 1970s, to advance indigenous legal rights in South Australia. It
had two main divisions: one dealing with land rights, and the other providing legal advice to
people charged with crimes, as well as for civil and family law. The two divisions work
autonomously, and only the latter was directly involved with this project – though, since it
involved constitutional change, it had implications for the whole organization.
As a dispossessed people who had difficulty coming to terms with Western society, Aboriginal
people had low social status in Australia. Compared with the Australian population as a whole,
Aboriginal people have higher birth rates, lower life expectancy (and therefore a much
younger population, on average), higher unemployment rates, less education, lower average
income, and higher crime rates. A frequently cited statistic is that Aboriginal people are 10
times as likely to be imprisoned as other Australians. There was thus a clear need for a service
such as LS.
The Aboriginal population is relatively small. In South Australia, with a population of some
1,510,000 at the 2001 Census, 25,544 people identified themselves as Aboriginal: 1 person in
every 60. LS handles the majority of South Australian criminal cases involving Aboriginal
people: 10,060 in 1999-2000 (the most recent figures available at the time). As this is one case
for every 2.5 people, or about one case per household per year, LS is familiar to most of the
Aboriginal population.
At the time of the study, it had a staff of 88, including 18 legal officers, with around half the
total staff being Aboriginal. Its board had 21 members. Each of these represented a regional
area averaging only about 1,000 adults, with some of these areas being several hundred
kilometres broad. The method of triennial election of board members was decided locally in
each region, but most regions conducted their elections at public meetings. LS constitution
stated that every adult member of the Aboriginal population had a right to vote in these
elections. Because of the distances involved in some cases, and the relatively small popula-
tions, attendance at these meetings was often small – as little as 6 people, and rarely more than
30. Committees were supposed to elect members on their merits and find the best person for
the job; however it had been noticed over many years that a family, by organizing transport
for its members to the place of meeting, could stack the election and elect a candidate of the
family’s choice. Other things being equal (I was told), the largest and best-organized family

Dennis List: PhD thesis 443 Appendix 4
won. Though it could be argued that this was a classic case of grassroots democracy in action,
there was also a contrary view that the quality of the Board was not always as high as it should
have been, in terms of achieving disinterested community control and the best possible
management.
The above situation is reported as described to me by LS managers with whom I was dealing;
others may have had different viewpoints. Whether or not such election-stacking occurred,
the outcome was that many board members were reported to be “only doing it for the
money.” Apparently, daily attendance fees and travel allowances for meetings, paid on the
standard government scale, were very attractive for board members subsisting on an employ-
ment benefit – hence the push by families to have their own people elected. On the other
hand, the 1999-2000 Annual Report showed that most council members were paid less than
$2000 in that year: only about 10% of the unemployment benefit for an average family.
The core problem with many board members was their lack of experience in the conventions
of government administration: how to be a competent board member, and make well-
informed decisions in the best interests of the organization. Being well-intentioned and
supportive of the organization was no longer regarded as sufficient. Since the 1990s, boards
around Australia, under the pressure of more stringent legislation on accountability, have
become more professionalized, seeking specific skills of their potential members. Another
problem, not considered seemly in a boardroom setting, was the occasional physical threats
and even personal violence between members. Following such threats, one board member
had had a restraining order taken against him by a senior staff member.
In summary, the view of the senior staff of LS was that the Board was dysfunctional. This had
been the case for some years, and LS’s reputation among some educated Aboriginal people
(and others who had dealt with it) was low. Several people whom I spoke to about this case
study advised me to have nothing to do with LS, because of the intense conflict between
board members. However, my sample design included a high-conflict situation, and with 20
years’ experience in facilitation, I was reasonably confident of my ability to defuse most
conflict. However, as I had no experience at dealing with intra-Aboriginal conflict, I took the
precaution of engaging a co-facilitation team: a husband and wife who had lived among
Aboriginal people for many years, and were also highly experienced mediators. They would
facilitate the workshops, while I would be an observer.

Dennis List: PhD thesis 444 Appendix 4
Classification
In terms of the taxonomy in chapter 7, this case met the following criteria:
Category 1 Specific activity or concept: governance
Category 2.6 A non-government organization
Category 3.3 Scale of location: one state of a country (South Australia)
Category 4 Time scale for scenarios: very short (estimated as 6 months)
In terms of the additional entity characteristics sought for the study, this case fulfilled the
following criteria:
A4 Entity undergoing major organizational change
A8 Self-contained entity, not part of any other, with no subsidiaries
A15 Situation with a high level of conflict
A21 Service sector
A23 Very complex network of stakeholders
A25 No major change for decades
In holonic terms (as noted by the presence of A8) this organization was independent: it was
not a part of any other organization. It did have tiny regional offices, but because these were
in constant contact with the main office, were very small (averaging 4 to 5 staff), and had a
very high turnover, they were outposts rather than subsidiaries, and thus not separate holons
for the purposes of this study. (But if the study had been on the future of LS’s office accom-
modation, they would have been separate holons, and criterion A8 would not have applied.)
Though structurally LS was independent, this independence did not extend into all aspects of
its operation. When the commonwealth government agency that supplied 81% of its 1999-
2000 funding1 revised the funding formula that had been used for 30 years, LS realized it was
not so independent after all.
Procedure
Recruitment
The actors involved included senior staff, board members, and community representatives.
Because I was unacquainted with the possible participants, I left it to a working group of
senior staff to make the invitations. My request was simply for around 20 participants for the
1. More recent figures could not be obtained, but there was no reason to believe that the percentage was substantially
different at the time of the study in late 2003.

Dennis List: PhD thesis 445 Appendix 4
workshops (anticipating that a minimum of around 12 would turn up), to include as wide as
possible a range of people involved with the organization in some way relevant to this study.
Many of the people associated with LS had known each other for decades, and had evolved
various animosities, such that if Person A knew that Person B was to attend, A would be likely
not to – but if both A and B attended there might be violent consequences. I hoped that at
least one representative of GA, the government agency that funded LS, would turn up, but
GA decided that their attendance in a process likely to result in a reorganization of LS’s
governance structure would be a conflict of interest. In the end, because of extensive vetting
of the list of potential participants (so I gathered), invitations were sent out only a few days
before the first workshop, to a narrower range of people than I would have hoped.
Environment
The selection of a room for the workshop was an important factor here. I wanted a room that
was larger than necessary, so that disputants could be physically separated from each other –
but not too much larger, so that they would have to shout. I wanted the room to be acousti-
cally dead, so that it would absorb sound, and act as a calming influence. It needed to have at
least two separate entrances, so that disputing participants would not have to be in proximity
when entering or leaving. The room also needed to have ample wall space – either on one
long blank wall, or two adjoining blank walls. On this wall space would go the “recorded
memory” as in Future Search (Weisbord and Janoff, 1995), and seats would be arranged so
that the words written large on that wall would become the focus of discussion, rather than
personalities (as recommended by Doyle and Straus, 1993). Participants (many of whom
would know each other) would sit at small tables of about 6 chairs, so that they could feel
supported by those at their table.
As there was no such room in LS building, a space was hired at the office of a local indige-
nous health organization. Apart from the fact that it had several large meeting rooms, this
organization was admired by LS management, because of its reportedly harmonious operation
and its smaller and more professional board, the structure of which LS managers were hoping
to emulate in their own organization.
Activities
The initial plan (later modified) was for the workshops to follow this standard sequence:
Workshop 1: The past. The recent history of the organization that was still relevant for its
future.

Dennis List: PhD thesis 446 Appendix 4
Workshop 2: The present: Discovering the current forces influencing LS, terms of stake-
holders and their goals that could affect LS.
Workshop 3: Futures (1): components of possible futures. Building up elements of scenar-
ios, using futures wheels, backcasting, and midcasting. Several broad morphological
paths would be set up, so that the backcasting could work back along these.
Workshop 4: Futures (2): assembling the components developed in workshop 3 into sce-
nario paths, and probing the lower levels of the hemisphere.
As it turned out, each workshop was preceded and followed by a planning meeting. The
follow-up meetings proved useful for joint reflections.
The first workshop was held in a room that mostly met the specifications listed above, but
with one clear difference: it had a wooden floor, and a long wall of windows, and therefore
was acoustically live. 14 participants were present, plus the two facilitators, and myself as
observer. Around half the participants were staff and board members, while the other half
were community members. The workshop began dramatically, when a man leapt to his feet
and demanded “Why are we here?” Not satisfied by the answers given by the facilitators and
LS managers, he began to verbally attack the CEO. Several others at his table joined the
attack. (After an hour or so of peace-making attempts by the facilitators, one senior manager
quietly left. He told me later that he’d experienced this type of thing before, and he expected
the conflict to continue for the whole morning). After repeatedly announcing imminent
departure, the man attacking the CEO finally did so, along with others from his table. I later
found that he was a former CEO of LS, disappointed at what he saw as its decline; those who
had left with him had come with him to provide support.
Accordingly, very little of the program was accomplished during the first workshop. At the
reflective meeting of the organizing subcommittee the agenda for the second workshop was
reorganized.
The later workshops had a very different (and much more productive) ambience, for four
reasons:
1. The CEO stayed away, saying that his presence could jeopardize the success of the pro-
ject. (He was an outsider to South Australia, and recognized that as such he may have
been unpopular with many local Aboriginal people, believing that a local should have
been appointed.) He was particularly concerned at the presence of the former CEO.

Dennis List: PhD thesis 447 Appendix 4
2. The former CEO, however, also stayed away, having made his point, and having re-
ceived little support from others present.
3. We managed to change to another room (which had been occupied by another group
during our first workshop). This was carpeted, which provided a quieter working envi-
ronment. Shouting is much less effective when a room is not acoustically live - though,
as it turned out, no conflict at all was vented in the later workshops.
4. This room also had more wall space, enabling better focus on the wall-mounted “shared
memory,” written in large letters on large sheets of paper.
Because so much time had been lost during the first workshop, and because of the tight
deadline it was not feasible to add a further workshop to make up for it. Thus the second
workshop (which was to have studied the present situation of LS) had the “past” element
combined with the present, so that the last two workshops would be able to focus on the
future. 16 participants were present for the second workshop, 14 for the third, and 12 for the
fourth, final workshop. There was some turnover, with several new people appearing at each
workshop (even the final one), and some others who did not turn up for the following
workshop.
New elements
Because this was consultancy rather than purely academic work, and because the client had an
overriding need for change, the final workshop involved not only laying out scenario paths,
but also for participants making a choice between them. The senior counsel of LS (the main
person with whom I dealt) had formed the opinion that of the five scenario paths we had
identified, only one would ensure the survival of the organization. The final session, despite a
push by me to treat all five internal paths in an even-handed way (as in criterion E7 in chapter
4, section 4.5), did not achieve this as well as I had hoped, with some participants actively
trying to persuade others that one scenario path was the best. This was a new factor.
Output
Internal and external scenario paths
Two sets of issues were relevant here:
(1) How LS could change to satisfy GA’s conditions and win the contract. Possibilities
ranged between minimal change ((minimal changes to the constitution) and comprehen-
sive change (also changing LS’s management practices).
(2) The context into which LS fits: whether the tender goes ahead, and if so, its outcome.

Dennis List: PhD thesis 448 Appendix 4
To cover both sets of issues, two sets of scenarios were created - though other writers (such
as Simpson, 1992) would maintain that because the first set is based on LS’s own decisions,
these are not scenarios at all. However, because SNM tries to anticipate the interplay between
internal decisions and external forces, both were included in this study.
The internal scenario paths were derived from a futures wheel exercise. Initially four paths
were delineated that were internal: changes could be made wholly within the organization. 10
participants (most of those present) voted on a preference. Nine of the 10 chose path 2
(board reform), and one chose path 4 (becoming a state government agency). Nobody chose
the status quo or the model drafted by the Legal Services Commission. In the third workshop,
a fifth path was added: the same as path 2 (board reform) plus extensive administrative
reform. Most of those present at the time were staff members, as opposed to board members
or senior management, and there was overwhelming support for path 5, though no formal
vote was taken.
Four external paths were added at the next planning meeting, as none of the five paths listed
by participants took account of circumstances external to LS.
TABLE A4.4.1 INTERNAL AND EXTERNAL SCENARIO PATHS FOR LS
Path Description 1 Internal Continue as at present (and since 1970s) 2 Internal Modify current situation by changing constitution and selection of Board
members 3 Internal Adopt model suggested by Legal Services Commission 4 Internal Become state government agency 5 Internal As for path 2, but adding extensive administrative reform 6 External LS folded into general legal aid system 7 External LS wins the contract, but for a very short term (e.g. 6 months) 8 External LS does not win the contract 9 External GA tender is split into many regions, all to be tendered for separately, and LS
wins some
At first it seemed impossible to display all nine scenario paths in diagrammatic form. But by
reducing the components to a minimum, it became possible to express all the above scenarios
in one diagram, by focusing the diagram on the external scenarios. All five internal scenarios
were contained in a single holon in that diagram, entitled “LS attempts reform.” All shared the
same input (the need to solve the current problem) and one of two outputs: either the reform
would be completed on time and in a form acceptable to GA, or else it would not. The
following diagram is a network map for the external scenarios.

Dennis List: PhD thesis 449 Appendix 4
FIGURE A4.4.1 EXTERNAL SCENARIO MAP FOR LS
This was the simplest meaningful but comprehensive scenario diagram that could be created
for LS, with just 20 nodes and 28 arcs. It looks more complex than it really is, because it was
not possible to draw it in such a way as to avoid some lines crossing. The O at centre left is
the origin, representing the pre-existing situation. Note that several holons in the above figure
have a single output line, later branching. As explained in the Notation section in chapter 5,
section 5.4.2, this indicates that only one of the branches can eventuate).
The above map focused on the context of the problem at hand for LS, by collapsing some
possibilities in the chain - for example, whether private law firms might successfully bid for
some ex-LS work, find it difficult and unprofitable, and then if unsuccessful in lobbying GA
for more funding in the next round, they might not reapply, and LS might be able to re-
emerge. All of this is shown above as “New contractors have difficulties.” Because this issue
had been discussed several times in the meetings, those four words had a clear meaning to
participants. To eliminate clutter from the map a little, several very remote possibilities have
been omitted, such as LS being able to bid, but not doing so.
The above diagram covers only the Events layer of the hemisphere. This was largely due to
the time constraints applying to the completion date of the study. Though the meanings of
some arrows in Figure 9.5.2 (corresponding to the second layer: motives) were discussed at
various points, no network diagram was created for the Motives level. Note that many of the
arrows, even though they link events, do not correspond to motives. For example, the
transition between “LS unable to bid” and “no more funding” is a simple cause-and-effect
LS mostly wins
Recreate LS with
differences
LS closes
LS bids for contract
LS unable to bid
LS has not reformed in
time
LS has reformed in time
GA tender goes ahead as planned
GA tender postponed or
cancelled
LS mostly loses
LS must make major
cuts
LS loses completely
No more funding
Abandon LS
LS continues
as now
New contractors have difficulties
LS attempts reform
Some fudging
GA tender has unex-
pected conditions
LS must reconsider

Dennis List: PhD thesis 450 Appendix 4
chain, so the meaning of the linking arrow is simply “therefore.” This was unlike the Iraq war
scenario map, in which almost every link contained a potentially detailed narrative. This could
be because LS scenario map was on a much smaller scale, and covered a very short period:
expected to be less than six months between the beginning and end of the scenario map. Also,
the Iraq map formed almost a conversational narrative: actor A does something, B responds
to A, C responds to B, and so on. Thus each new event in the Iraq war was preceded by its
actor’s motives. Also, the Iraq war was a very large-scale operation, extensively discussed by
the press, while the restructuring of LS was on a much smaller scale and intrinsically less
detailed.
Dennis List: PhD thesis 451 Appendix 4
Case 5: A credit union (CU)
The entity
Until around 1990, CU’s membership had been restricted by Australian laws on credit unions
to employees of organizations in the telecommunications industry in South Australia and the
Northern Territory. Many CU members worked for Telecom Australia, one of Australia’s
largest employers. Like all Australian credit unions until the law changed, it was originally
state-based. Since the 1980s, it had gradually absorbed some other small credit unions,
growing by accretion. In the early 1990s, when the Australian government decided to stop
paying social security beneficiaries in cash and required them to have an account with a
financial institution, many beneficiaries had opened bank accounts for the first time. These
accounts were not profitable for the banks, which began to impose fees on services that had
previously been free. There was thus a steady drift of less-wealthy people, particularly the
young, toward credit unions. Being not-for-profit, these charged lower fees than banks. As
credit unions became larger, they were able to offer mortgages, which attracted more account-
holders. All of these factors contributed to the growth of CU – along with several other credit
unions in South Australia. At the time of this study in mid-2003, CU had become one of the
largest credit unions in Australia.
While most other credit unions in South Australia had remained focused on their core
business, and grown relatively slowly, the board of CU around 1990 decided to embark on an
ambitious plan for growth. This was done with great success, with a growth in members from
to more than 200,000 in 2003. Over that period, CU was one of Australia’s fastest-growing
financial institutions. However in recent years, CU’s growth had slowed, and the board
decided it was time for a review of the post-1990 policies. The current strategy at the time of
the study was influenced by Treacy and Wiersema (1997), a book that CU management took
very seriously. It recommends focusing on one of three main business strategies: product
innovation, low cost, or customer service. CU’s position was that only the third could apply,
because innovative banking products (lacking IP protection) would be copied by competitors,
with its relatively small size it could not compete on costs, and it had a very high level of
customer satisfaction.
Activities. CU’s main functions were to accept deposits from its members, invest these, and
make loans. Some of these loans, made through subsidiaries (e.g. for buying new cars) were
not restricted to members. For communication with members, CU had 22 branches, a call
centre with around 100 staff, and a transaction-enabled website.

Dennis List: PhD thesis 452 Appendix 4
Scale. Despite being large by credit union standards, compared with banks CU was small. At
the time of the study it had a total of around 420 staff. It had 205,000 shareholder-members,
and managed members’ assets valued at over $A1.5 billion. However, to place this informa-
tion in context, the smallest local bank, though it had fewer customers than CU, managed
$A6.7 billion in assets (June 2002)2. CU had considerably less than a 1% share of all Australian
deposits in retail financial institutions.
Funding. As a credit union, CU is in principle not-for-profit. However at the time of the
study it had accumulated net assets of $A93 million, with a $13 million surplus in 2002-03
(KPMG, 2003). These were available for mergers and other business ventures.
Governance. CU is governed by a board elected by shareholders. In standard business
fashion, the board appoints a CEO, who controls the staff. Legally, CU is owned by its
members, with each member buying an initial $2 share on joining. When members leave, this
money is refunded. Thus all shareholders have an equal share, and there are some 200,000 of
them. With no factions among shareholders, they have no effective power.
Classification
In terms of the taxonomy in chapter 8, this case met the following criteria:
Category 2.6 A non-government organization (officially, at least)
Category 3.3 Scale of location: a country (Australia)
Category 4 Time scale: 10 to 15 years (deliberately non-specific)
In terms of the specific entity types sought for this study, this case fulfilled two of the addi-
tional criteria:
A6 Entity which had previously carried out scenario planning
A21 Service sector of the economy
In holonic terms this organization was independent (not under the direct control of a larger
holon) and had a number of separate components that were directly under its control.
2. KPMG Australia, Financial Institutions Performance Survey 2003, www.kpmg.com.au, accessed 30 January 2005.
Dennis List: PhD thesis 453 Appendix 4
Procedure
Recruitment
The procedure for this case followed the workshop format that I originally planned. The
planning manager (the main person with whom I dealt) was highly interested in the project, as
were the CEO and the chairman of the board. They arranged for a total of about 25 staff to
attend, but because of difficulties with scheduling the time of these senior people, they
suggested two separate sets of workshops, each with a group of about 12 people. I agreed to
this readily, because it would be a useful chance to compare two slightly different approaches
in the same organization. Even better, there was no clear difference between the types of
people involved in the two groups – except that one group contained both the chairman and
the CEO. As it turned out, the first group had only 8 participants and the second group 11.
Environment
The venue was the credit union’s boardroom. Physically, this was near-ideal. It contained a
long, narrow table, with seating for about 20, a long blank wall for posting documents, and
several nearby rooms for small group work. However, some middle-management staff who
had not visited the boardroom before seemed a little over-awed at being allowed into the
presence. My perception was that this discouraged them somewhat from disagreeing with
statements made by more senior staff. In some ways a more independent venue, “untainted”
by the scent of the board, might have been preferable.
The two sets of workshops were held in September and October 2003, a time when the RFS
industry was not much in the news. The main relevant mainstream media interests at the time
were news stories about overly high housing prices and possible small interest rate increases.
Specialist media, read by many participants, included the daily Australian Financial Review and
the weekly Australian Banking and Finance. Though these publications were highly relevant to
their jobs, a focus on these would also have coloured their worldviews.
Activities
The standard SNM plan has four half-day workshops, a week apart. The intentions of that
schedule are:
(a) to make it easier for people to attend (they could do their normal work in the other
half of the day)
(b) to give them time between workshops to think about the issues from the previous
workshops.

Dennis List: PhD thesis 454 Appendix 4
However, CU wanted full-day workshops, because some participants would have to fly from
interstate, and to change to half-day workshops would have cost much more, in either air fares
or accommodation expenses for participants. My co-discovery conferences with RN each
occupied a full day, and with so much food for thought, participants were becoming tired in
mid-afternoon: less motivated to pursue the workshop to its conclusion. The problem was
solved in Indonesia by changing the full-day workshops to two consecutive half-days: an
afternoon and the following morning. As this alternative was not feasible in the present case,
one potential problem was a loss in concentration in the late afternoon of each workshop.
Output
As with most of the other cases, a separate report was completed for the entity’s management.
It summarized the two scenario network maps and offered some observations and recom-
mendations arising from the Process. The major finding was that the CU had no clear route
(at the time) to further growth. No suitably sized takeover targets existed, and the CU’s best
option seemed to be to better serve its existing shareholder-members. As this fitted closely
with current policy, the entire exercise perhaps added nothing to the CU’s strategic direction.
The following photograph shows part of the scenario map for the second group, with each
A3 sheet representing a separate holon. Later, arrows of coloured tape were used to connect
the holons.
FIGURE A4.5.1 PART OF SECOND SCENARIO MAP (BEFORE LINKING)

Dennis List: PhD thesis 455 Appendix 4
Each set of workshops produced a set of scenario holons, divided into three main groups:
1. looking ahead from the present (produced by the futures wheel method)
2. foreseeing possible external changes (from the midcasting)
3. possible outcomes (from the morphological exercise).
The holons were linked together by the futures wheel and backcasting exercises. Most of the
holons in the first group that arose from the CU’s past turned out to be conditions or situa-
tions, rather than events. This had not been found in previous cases, but would obviously
recur in other cases where the entity was subject to many legal and other restrictions.
Both sets of workshops produced similar scenario maps, though with many small differences.
The following table shows the degree of overlap.
TABLE A4.5.1 OVERLAP IN SCENARIO HOLONS BETWEEN TWO SETS OF WORKSHOPS
Set 1 Set 2 Unduplicated totalIdentical 8 8 9 Broadly similar 9 19 20 * Completely different 20 22 42 Total 37 49 71
* To some extent a matter of judgement; others might find a few more or less than 20.
Several attempts were made to produce a scenario map covering both workshops. Though it
was possible to fit all 71 distinct holons onto a single page, the result was uninterpretable:
there were too many links. I therefore combined groups of similar holons, losing detail on the
master map, but greatly increasing legibility. The resulting map, with 27 holons, is shown in
Figure A4.5.2, on the following page
We attempted to produce maps of the layers of the hemisphere (at that stage, there was a
fourth, lowest, “worldview” layer), but again found it not possible to produce maps that were
readily interpretable. Several attempts, some involving a single map and others a separate map
for each layer, all produced illegible jumbles of boxes and lines. Thus the practical problem of
how best to express the levels still remained to be solved.

Dennis List: PhD thesis 456 Appendix 4
Change in laws regulating FIs
Financial environment becomes global
World financial environment becomes volatile
Adoption of global FI standards, e.g. Basle II
Growing movement against consumerism
Asian Economic Community founded
CU continues to grow, with interstate M&A
All CUs grow Rising economies of scale
Move from plain banking to wealth management
CU aims to increase member satisfaction (MRM policy)
Growth of micro-business
CU demutualized
ICT development enables more efficiency
Consumers become more financially sophisticated
MRM policy moderately successful
CU taken over or merged
Public demand higher business standards
Consumers feel less involved with their FIs
Economies of scale begin to vary
CU has less incentive to expand
Nothing changes for CU
Giant FIs become cheaper for customers than CU
Many tiny FIs occupy former CU positioning
CU steadily shrinks
CUs set up holonic system of services and branding
Whole CU system grows - component size irrelevant
FIGURE A4.5.2 SIMPLIFIED, COMBINED SCENARIO MAP FOR CU
456

Dennis List: PhD thesis 457 Appendix 4
Case 6: A group of community service clubs (SC)
The entity
SC is a network of service clubs, which originated in the USA in the early twentieth century.
The principle is that each club is based on a small area, such as a suburb in a major city.
Membership is by invitation; prospective members must be “leading members of their
profession,” and their probity should be beyond question. SC is a highly decentralized organi-
zation. It has a constitution, which all members must observe, but the fundamental unit of
organization is the individual club. These clubs are grouped into districts, of which there are
529 in the world, typically with between 20 and 100 clubs in one district. As most countries
have several districts, there is little coordination at national level. This study was commis-
sioned by two districts of SC, covering most of South Australia, with 106 clubs.
Governance. The international coordinating body organizes major projects with world
organizations such as UNICEF, holds annual conferences, publishes magazines for members,
and other head-office functions. However it is not a head office in the business sense, and has
little jurisdiction over individual clubs. The district is even less an institution; districts generally
have no separate offices: they do not control the clubs, but serve them. At all levels of SC:
international level, district level, and club level, a new leader is chosen every year, with the
difficulties of succession eased by the preselection of new leaders two years in advance.
Purpose. The main purpose of SC is philanthropic: to serve others by doing good works –
which can range from small local initiatives such as planting trees in parks, to long-term
worldwide projects such as public health initiatives, in which SC has worked with UNICEF
and the World Health Organization on a sustained project to eliminate poliomyelitis. This
project has continued since 1985, has cost several billion dollars, and is now almost complete.
Thus SC internationally has been looking for a new large-scale project to succeed Polio Plus,
probably relating to world peace. Another aspect of SC is its support of a high level of ethics
in the businesses of its members; it has developed a brief set of ethical questions which can be
used when making business decisions. A less publicized purpose of SC, but clearly an impor-
tant one for members, is business networking; this is facilitated by the standard rule that each
club may only have one representative from each occupation.
History. Membership of SC in South Australia peaked in the 1980s, and has slowly declined
since then. For the northern district (which commissioned this study), the membership peaked
in 1985, at 2,100 people. In mid-2004, when the study took place, membership was down to

Dennis List: PhD thesis 458 Appendix 4
1,500, though the figure had been stable for the past few years. In recent decades the age of
members had increased, to the point where the average member was around 60 years old.
Many members were retired, and were less active than previously. Through retirement they
had lost some contact with the business world, and the direct and indirect support provided
by that world for the district covering the southern part of South Australia, had declined at
much the same rate, with much the same outcomes. (It was reported to me that this rate of
decline had also been occurring in other developed countries, though SC’s world membership
(some 1.2 million) was still growing, particularly in former Communist countries.
SC has sometimes been slow to respond to social change. In the USA, until the 1920s, only
whites were allowed to be members (Forward, 2003). Until the late 1980s, it was a men-only
organization. It was only when SC exerted pressure to admit women members, and a court
case disallowed another men-only club in Australia, that women were permitted to join in
South Australia. Though there are no now rules preventing female members, a few clubs still
have only men.
Scale. Combining the two districts taking part in this case, the total number of members was
some 3,500 (of whom 30 - known to be among the most progressive) participated in the
workshops). The typical club had around 50 members, though this varied from 12 to 200.
Though there is some pressure on small clubs to combined, I was told by a district governor
that the smallest clubs tend to raise the most funds per member.
Activities. Apart from the activities described above, as fulfilling the purpose of SC, there is
also a strong tradition of “fellowship” among members. In fact, SC was originally founded
because its founder was a newcomer to Chicago in the early 20th century, and found himself
socially isolated in his small business. The philanthropic aspect of SC did not arise till later
(Forward, 2003). The most frequent activity is the weekly club meeting, typically involving a
restaurant meal with a guest speaker. This takes place in a jovial environment, with small fines
levied for trivial reasons, such as having a birthday.
Ownership. As a voluntary organization, SC clubs are “owned” by their members, and SC is
“owned” by the clubs. In fact, the concept of ownership is misleading in this case. SC’s main
asset is cash in the bank, but that cash is destined to be given away. In the anthropological
sense, SC is a gift culture (Mauss, 1967; Firth, 1972).

Dennis List: PhD thesis 459 Appendix 4
Funding. SC clubs’ funding is generated mostly from members and their fundraising activi-
ties, supplement by the sponsorship that members find (often from their own employers).
This is not a cheap organization to belong to, with total costs of membership around 1000
dollars per year. Members are expected to spend substantial time with the organization,
attending the majority of club meetings, and taking part in working bees and committees.
Classification
In terms of the taxonomy in chapter 8, this case met the following criteria:
Category 2.6 A non-government organization
Category 3.3 Scale of location: a region of a country
Category 4 Time scale: specified as 20 years
In terms of the specific entity types sought for this study, this case fulfilled two of the addi-
tional criteria:
A17 An entity in decline
A21 Service sector
It partly fulfilled one other additional criterion:
A2 An ad hoc or temporary organization. (Because of the annual change-over
of management at every level, SC is continually beginning again.)
In holonic terms, this organization was part of an international organization, which exerted
only very loose control. In fact, the organization (one district, at first) commissioning the
scenario work was not an officially formed entity. The SC system divides the world into
districts, each of which exists only to group a number of clubs. With rare exceptions, a district
has no offices, no budget, and no staff.
Procedure Recruitment
The newly appointed district governor, assisted by the governor of the adjoining district,
selected potential participants and issued invitations to them. As with most other cases in this
study, I was unable to participate effectively because I did not know the people involved. My
role was to ask for as wide a range as possible of stakeholders who would be expected to have
different perspectives. The governor, who was keen to change the organization, mainly invited
people who she knew to agree with her wish for substantial change in the organization, and
key figures who needed to be convinced of the need for change.

Dennis List: PhD thesis 460 Appendix 4
As with most other cases in this project, most participants were members of the organization
whose future was being studied. Despite a range of other stakeholders being invited, few of
them were involved enough to give up four Saturday mornings to benefit an organization that
they did not belong to.
Activities and environment
Because the environment and activities were closely intertwined in this case study, the two
subheadings are combined here.
The original design for the SC case was for the standard set of four workshops – but, as with
other cases, it took as many meetings to plan those workshops: for me to explain the concept
to the organizing committee in enough detail that they understood it well, and for the partici-
pants to be chosen. The workshops were intended to follow the now-standard pattern, except
that the workshop focusing on the present was to come first, preceding the workshop on the
past.
The first workshop was well attended, with 25 people present. As usual with this organization,
the atmosphere was jovial, with much laughter. Compared with the previous two cases,
though, there was not as strong a task focus. Because participants had been invited for their
open-minded approach to change, they had a lot in common, and spent much time discussing
issues of mutual concern. After several workshops, I began to realize that participants had
come as much for the social experience as for the scenario work. As the communication was
clearly useful for them, I did not insist on strict timekeeping, but let some sessions run longer
when they seemed useful to participants. This approach worked well enough in the first two
workshops, but caused problems in the third workshop, because of environmental factors.
Most workshops were held in one large room – the staff cafeteria in an old mansion which
had become the local headquarters of an international charity. The room was about 10 metres
by 15, with seating for around 30 people at small tables. These small tables could be moved
for the small-group sessions into what were effectively four or five larger tables. Thus the
break-out sessions were all held in the same room. In the third week, the cafeteria was booked
for another purpose, and the meeting was held in a smaller room: about half the size. It was
not feasible to have break-out groups in such a small room, so several offices elsewhere in the
building were used for that purpose. From past experience in large groups, both as a facilitator
and a participant, I suspected this would cause problems - and it did.

Dennis List: PhD thesis 461 Appendix 4
When given futures-related topics to discuss, the groups in the smaller rooms discussed them
only superficially, and talked mainly about other topics, not directly related to the current
exercise. Another unexpected event, in a plenary session, was an impromptu address given by
a young woman who was not a member of SC, but whom others seemed to have been hoping
was about to join. She declared emphatically that she would not join, and spend 25 minutes
giving detailed reasons for this3. The other participants, most of whom were older members
of SC, then discussed her reasons in some detail, putting this session even further behind
schedule. As this was highly relevant to the purpose for which the workshops had been
convened, I was reluctant to cut off the discussion. However, with these delays, the futures
wheels and backcasts scheduled to be completed in this session were hardly begun. With those
delays, little of the plan for the third session was accomplished.
Thus in the fourth session, when the futures wheels and backcasts from the previous session
would have been used to create the scenario network, these materials were not available. The
participants did complete the futures wheels, but they seemed unable to come to grips with
the backcasting, producing potential outcomes so vague and general that they were not useful
in building a scenario network. After the previous three case studies, in which the creation of
scenario networks had been working better and better, I was surprised at this backward step.
Five simultaneous factors jointly created this effect:
1. The environments were not entirely suitable. Specifically, the rooms (even the largest)
were too small, and did not have enough usable wall space for assembling the scenario
networks.
2. Many of the participants seemed more interested in discussing other matters than in
considering the organization’s future in detail. In retrospect, however, given that they
had so much in common, and had rarely met before, this behaviour was not so surpris-
ing.
3. Had I expected this, I could have prepared for it by issuing more explicit instructions –
e.g. in writing for each small group. However, because the first two workshops ran ac-
cording to plan, I was unprepared for the lack of accomplishment during the third
workshop. I assumed that this was an anomaly, but it happened again in the fourth
workshop.
4. The workshops were held on Saturday mornings, and something of a holiday atmos-
phere prevailed. Participants had come for pleasure as much as for work.
3. A few months later, it was thus surprising to find that, despite her strongly argued reasons for not joining an SC club, she
had recently done so. Her participation in these workshops probably had some bearing on her joining.

Dennis List: PhD thesis 462 Appendix 4
5. The organization was not bound by the restraints that applied with most of the previous
cases. As it had few financial constraints (no loans to repay, for example), and a wide
range of possible outputs, it would be able to adapt to almost any situation – except its
own gradual loss of members. This lack of limitations meant that there were a near-
infinite number of ways to work back from any conceivable future to the present. Any-
thing could be done, in any way, if only suitable people could be found to do it. Thus
there were no clear paths for backcasting. Metaphorically, this was like trying to create a
roadmap on a smooth plain which was effectively one huge road.
A combination of the above factors seems to have resulted in the participants’ inability to
frame clear future alternatives for the organization. Given the same tasks that the CU partici-
pants had performed thoroughly a few months earlier, the SC members did not produce much
detail at all. Some of the outputs from their small-group work were so scrappy that there was
no point in transcribing them for recirculation.
I had found in some earlier case studies that participants sometimes inadvertently took away
the papers they had created in small group work, instead of leaving them for me to record.
Accordingly, with the later cases I distributed extra-large sheets of paper (A3 size), so that
these would stand out from other notes that participants were taking. Despite that precaution,
some key documents from the SC workshops disappeared - though several of those were later
forwarded to me.
In planning for these workshops, I did not foresee the high level of interest that participants
would find in meeting like-minded people from other clubs, as well as meeting potential
members, beneficiaries, and sponsors. This was obviously a valuable experience for them, and
much useful material was covered – particularly in the third week, when the young woman
explained at length why she would not become a SC member. I had not expected this. In the
previous case studies, the participants generally knew each other already – or if not, they did
not have a lot in common. SC members, though, were obviously different; thus when 25
people from different clubs came together, with a common interest in the future of SC, it was
not surprising that they would spend a lot of time discussing their ideas and experiences. As
facilitator, I could have suppressed this, insisting that everybody should follow the schedule
exactly – but such an approach seemed inappropriate in the circumstances. With all that
sharing of ideas, the workshops fell behind schedule.

Dennis List: PhD thesis 463 Appendix 4
It was clear during the fourth session that the scenarios were far from complete, and some
participants voiced their dissatisfaction with stopping at the end of that workshop. We
therefore scheduled a fifth workshop, to round off the process. The commissioning governor
requested that this final workshop should focus on developing some specific visions for SC’s
future.
Normally, in the fourth workshop, the participants would have completed a detailed scenario
map, from which their preferred paths could have been traced. These paths would outline the
requested visions. As the map was far from complete at the end of workshop 4, I reviewed
everything that had been done so far, and created a simple three-path model for SC. Creating
scenario paths was not intended to be my role, but as no participants did so (despite my
requests, and several suggestions), I tried to simply reflect what had been said in the work-
shops; as far as possible, generating scenario paths that participants would have created
themselves, if only they had got around to it. These three paths – arranged in order of the
degree of change - became the input for the final workshop.
Path 1. Stability - minimal change: trying to keep the old values above all else.
Path 2. Adaptation - pragmatic change - whatever it takes to survive.
Path 3. Transformation - redesigning the system according to its original principles.
During the fifth workshop, a group of participants devised a fourth path, falling between the
second and the third in terms of degree of change. Reflecting its position in that sequence,
they labelled it “Model 2.75.”
In the final phase of the fifth workshop, participants were divided into four groups, on the
basis of their preferences for one of the four main paths. Each group was then assigned an
incasting task (Schultz, 2003). “Imagine that you have won a prize of a holiday in Adelaide in
2025. You visit some SC clubs that are using the path you prefer. On your return to the
present, you give a brief talk to your current club, describing what you found.” The four talks
were given, discussed, transcribed, and published in a report on this study that was to be
widely distributed among SC members in South Australia. The intention was that the annual
conference in April 2005 would be used to discuss the ramifications of the futures work, and
create an action plan for the multiple-futures model.

Dennis List: PhD thesis 464 Appendix 4
Output
While devising a way of making the three broad paths as distinct as possible, I had the idea of
producing a text table comparing each path in terms of a number of characteristics relevant to
SC. Based on discussions in the four previous workshops, I produced a preliminary list of
variables, checked it with some participants, and brought it to the fifth workshop, where it
was modified again. The final version listed 28 characteristics on which paths might differ, as
follows.
TABLE A4.6.1 CHARACTERISTICS ON WHICH SC CLUBS COULD DIFFER
1 Membership criteria 2 Main difference between members and population 3 Attendance levels 4 Involvement of members’ friends and family 5 Involvement of members with other activities 6 Related organizations 7 Level of conflict between SC groups in South Australia 8 Main international activity, to succeed Polio Plus
[anti-polio campaign, nearing completion in 2004] 9 Main local activities 10 Recruitment of new members 11 Format of club meetings 12 Relationship with SC International [the US-based coordinating body] 13 Relationship with similar organizations 14 Local project work 15 Hierarchy of authority 16 Continuity of governance 17 International links 18 Fund-raising 19 Sponsorship 20 Membership basis 21 Inter-club projects 22 Demands on members’ time 23 Financial demands on members 24 Communication between clubs and members 25 Members’ accounts of their activities 26 Ceremony at regular meetings 27 The upside 28 The downside
Describing all 28 aspects for each model produced clear visions of how SC would operate in
each of the four models, forming a basis for participants to create a vivid description of how
each path would operate.

Dennis List: PhD thesis 465 Appendix 4
Case 7: The Barossa Valley landscape
The entity
The Barossa Valley is a region of South Australia, famed for its wines since around 1860. It is
little more than one hour’s drive north of Adelaide, the capital city of South Australia, with a
population of more than a million. The Barossa Valley, approximately 40 kilometres square,
had a population of around 29,000 at the 2001 census, with an annual growth rate of 1.5%.
Most of these people lived in 10 small towns scattered around the valleys: despite the title,
there are two valleys: the Barossa itself (closer to Adelaide, lower-lying, more populous) and
the Eden Valley (more distant, higher in altitude, and thinly populated).
History. The Barossa was settled in the early 19th century by Lutherans from central Ger-
many, and developed a distinctive local German culture. In recent years, Adelaide has grown
to the point where its northernmost suburb, Gawler, is only around 10 km from the Barossa
Valley. Since the 1980s, the valley’s international reputation has grown, and most of its wine is
now exported. The Barossa is the centre of operations for four of Australia’s largest winemak-
ers: Orlando, Penfolds, Hardy’s, and Yalumba. As the Barossa lies between the port of
Adelaide and several other major wine regions of South Australia, these major producers have
been building large new plants in the Barossa. Because the relatively flat land on the valley
floor has soil particularly suitable for grape-growing, and because of the pressure from
potential residents of the attractive Barossa towns (also on the valley floor), strong competi-
tion for land has arisen.
Activities. The dominant industry is winemaking, with more than half the valley’s arable land
devoted to grapegrowing. Tourism is the second largest industry, in terms of financial ex-
change between the Barossa and elsewhere. With its winemaking concentration (at least 84
wineries, many of which have visitor facilities), its attractive semi-rural landscapes, its German
heritage, and its proximity to Adelaide, the Barossa Valley is very popular with visitors: from
Adelaide, from elsewhere in Australia, and from overseas.
The Barossa is covered by a patchwork of government areas. The Barossa Council is the local
authority covering most of the larger valley, but the Light Council covers a significant minor-
ity. Some aspects of the Barossa (such as public education and hospitals) are administered
directly by the South Australian state government, while other authorities exist for other
aspects, such as the Catchment and Water Management Board.

Dennis List: PhD thesis 466 Appendix 4
Classification In terms of the taxonomy in chapter 8, this case met the following criteria:
Category 1.5 The use of part of the natural world
Category 2 None of these social entities applied
Category 3.3 Scale of location: a region of a country
Category 4 Time scale: specified as 20 years
In terms of the additional entity types sought for this study, this case full met two of the
criteria:
A16 A growing entity, highly successful in recent years. Since the 1980s, the Barossa
had grown in population, wealth, and international fame. Australia’s
most famous wine, Grange Hermitage, is made there.
A18 A small geographical area. Though it was not as small as hoped for on this
criterion (it had a population of around 30,000 and an area of some
2,000 square kilometres) it had the advantage of being a self-contained
entity.
These criteria partly applied:
A12 Local government agency (in that some of participants worked in local gov-
ernment, and the issues studied related to local government).
A19 Primary industry (in that the main industry of the area was winemaking,
and most participants were connected with that industry in some way)
In holonic terms this organization, like most geographical areas, was not independent of its
surroundings. It formed a small part of the Outer Adelaide statistical division (as defined by
the Australian Bureau of Statistics) and it had several components, including two local gov-
ernment authorities. In topographical terms, it is really two valleys, not one: the Barossa Valley
(for some purposes) includes the Eden Valley. However condition A7 (in the centre of a
hierarchy) did not apply, because the valley itself is not a formal social entity.
Procedure
Recruitment
The Barossa Winemakers Association (BWA), mainly through the technical manager men-
tioned above, recruited participants for the study. My role, as in previous cases (not knowing
the individuals involved) was limited to suggesting that the widest possible range of stake-
holders should be included. Because this workshop was being done for the BWA, many of

Dennis List: PhD thesis 467 Appendix 4
those invited were members of that association. The workshop was organized for a Friday, in
the hope that people who might not otherwise be able to attend could do so on the last
working day of the week, when pressure of work might not be as great. Around 30 people
were invited, of whom 22 agreed to attend, and 19 did so. Most of these had strong links with
the wine industry; the second largest group was of administrators and public servants. No-
body present could be regarded as an ordinary resident of the valley.
Environment
The workshop was held in the conference room at the Yalumba winery near Angaston. The
room was some 13 metres square, and had suitable space on three walls for displaying written
materials. Tables were arranged in a large square U shape, leaving an open space in the centre
of the room. Participants sat on the outside of the U, about 8 of them on each of the three
arms. The U shape was the normal layout of the room. I did not consider it ideal, and would
have preferred participants to sit at 4 tables, each of about 6 people. However as I had no
solid supporting evidence for this preference, I decided to leave the room layout as it was, and
see how it would affect the proceedings.
The Yalumba winery is on the edge of Angaston, within a 10-minute drive of the two largest
towns in the Barossa, Tanunda and Nuriootpa, but about a 30-minute drive from the south-
ernmost towns, Lyndoch and Williamstown. This was probably related to the fact that nobody
from the latter areas was present at the workshop. Some potential participants – either general
members of the public or rival winemakers – may have been deterred by the fact that the
workshop was held in the somewhat baronial atmosphere of the Yalumba winery. If the
workshop had been held in the centre of Tanunda (the largest and most central town in the
Barossa) the participants and therefore the outcome might have been a little different. Specifi-
cally, one might have expected (1) more ordinary citizens, with therefore less focus on
winemaking; (2) a more urban and less rural focus; and (3) more people from the southern
Barossa, which is becoming a dormitory area of Adelaide, with hobby farms and the like.
Combining these factors, such an environment for the study would have been expected to
produce a less industrially oriented vision.
Preparation
Before the workshop, each participant was contacted and invited to bring along some images
illustrating desirable and undesirable aspects of the Barossa. Not knowing how many partici-
pants would bring images, I brought 164 images (mainly photographs of the Barossa, framed
in a documentary rather than an artistic style) to display at the workshop. The other partici-

Dennis List: PhD thesis 468 Appendix 4
pants collectively supplied 98 more images, half of them from one person. I arranged for a
cartoonist to be present, to draw on the spot any images that participants had been unable to
photograph or find an existing picture.
Activities
Because the workshop was to focus on the landscape values of the Barossa, such a vision
would be largely visual - which might seem tautological, were it not that much corporate
“visioning” focuses on abstract concepts that are not inherently visible. (Problems with
conventional visioning methods are noted in the review of the literature on visioning in
chapter 2) Thus rather than trying to “craft” the wording of a vision statement, it was consid-
ered more useful to capture participants’ preferred images of the Barossa. Because the focus
was on landscape, and because landscape changes very slowly, it was likely that most elements
of preferred landscapes already existed, either in the Barossa or elsewhere. We thus explored
visions in four different ways: pictorial, oral, map-based, and conceptual. Because different
forms of vision were more relevant for different senses, and some participants would be more
comfortable using one form than another, it was therefore considered that a combination of
the four forms should yield more comprehensive results than a single approach. The expecta-
tion was that by spending a day considering the future of the Barossa in four different sensory
modes, common threads would emerge, and it would be possible to find out to what extent
the different types of stakeholder agreed.
1. To build pictorial visions, participants were asked to bring photos of what they most
liked and most disliked about the Barossa. These images were mounted on the walls, num-
bered, and participants then voted, assigning them into the categories of Table 9.8.1 below.
2. For the oral visions, participants were asked to recount brief narrative vignettes, no more
than about a minute, recalling their experiences of what was best and worst about the
Barossa. The objective here was to uncover experiences that comprised “moments of
truth” (Carlzon, 1987) or epiphanies (“a sudden spiritual manifestation...an extreme quality
of beauty” - Joyce, 1944, p216; Shumar, 1959). Because such experiences are highly memo-
rable, participants should have had no problems in recalling them.
3. The mapping exercise flowed from the pictorial and oral examples. We mounted a large-
scale map of the Barossa on the wall, and asked participants to locate on the map the pho-
tos and experiences they’d mentioned. The purpose was to help make their visions more
concrete and vivid, forestalling vague generalization.

Dennis List: PhD thesis 469 Appendix 4
4. Finally, in the afternoon, to bring more structure after the morning’s creativity, five
groups of participants worked through a checklist of ten sectors (two per group): housing,
employment, community services, shopping, public space, infrastructure and energy, roads,
transport, health services, and education. For each sector, they were asked to describe their
hopes for the Barossa, as specifically as possible. So that the output would qualify as a vi-
sion, they were asked to describe not necessarily what they expected, nor even what they
thought was a realistic goal, but a kind of “heart’s desire” (in the sense of Yeats, 1894):
what characteristics of the Barossa valley could make visitors want to abandon their roots,
and go and live in the Barossa? Of course, it was the participants’ own reactions that were
sought; the imagined reactions of visitors were merely a proxy.
In each of the four activities, participants were asked to change roles, to see that type of vision
from the aspect of a different stakeholder group, including residents, business owners,
managers, employees, and visitors. Most of those present had at least three such roles. To
guide participants’ creativity in each the four sessions, following principles outlined by
Santanen, Briggs, and de Vreede (2004), I developed a 2 x 2 contingency table of preference
by current presence (similar to the SWOT method of Andrews, 1980) thus:
TABLE A4.7.1 CONTINGENCY TABLE OF PREFERENCE BY PRESENCE
Current presence Desirable futures Undesirable futures Now present in the Barossa Keep this Eliminate this Not now present Introduce this Do not introduce this
All images, narratives, locations, and sectors considered in the four sessions were grouped into
the above four categories.

Dennis List: PhD thesis 470 Appendix 4
FIGURE A4.7.1 PARTICIPANTS VOTING ON THE IMAGES
Output A condition of the grant awarded to this project was that its findings should be widely dis-
seminated among the stakeholder organizations involved. The report on this project4 at-
tempted to convey the visions as a thick description (quâ Geertz, 1973), rather than summariz-
ing them into a “vision statement.” The major finding was that there was an extremely high
level of agreement among participant actor groups about preferred Barossa landscapes. Strong
preferences were expressed...
for a semi-rural landscape, mixing urban, vineyard, and natural land use.
for many small towns rather than a few large ones.
for the regeneration of traditional vegetation.
for the traditional “relaxed hospitality” values of the Barossa...
...but for these to be extended from private homes to public venues.
against the Barossa becoming effectively an outer suburb of Adelaide.
against the Barossa becoming a “tourist trap,” as perceived in other
outer Adelaide areas such as Hahndorf.
Note the conservative nature of these preferences: the only improvement sought was a better
attitude to service quality among hospitality workers. The remaining preferences were to keep
what the Barossa had (or used to have), and not to introduce undesirable urban elements. This
was not so much a vision for change, as a vision for no change. The implication is that the
4. The report will be available online at www.gwrdc.com.au, as Project RT 04/05-1.

Dennis List: PhD thesis 471 Appendix 4
Barossa was almost perfect until recently. It raises the issue as to whether the views collected
in the workshop were really a vision for the future – or were they merely an expression of
nostalgia? With the continuing growth of the area’s population, the winemaking industry and
its less picturesque concomitants such as large trucks and “tank farms,” the agreed vision
seems unlikely to be achieved unless the local government authorities take a very strong
regulatory line, and are not overridden by statewide authorities.
Perhaps the inclusion of less-advantaged stakeholders might have made the vision less
harmonious. Before the workshop, to gather background information, I interviewed a young
mother who lived in the Barossa. Though opposed to city-scale development, her vision
centred around better availability of services for young families, such as child-care, shopping,
and schools. Her views may or may not have been typical, but they were quite different from
those expressed at the workshop.
The following two pages show the 18 most preferred and the 18 least preferred images
(ranked in reading sequence, with the most preferred at top left), followed by tables showing
numbers of votes and locations. The “not now present” categories, poorly represented in the
images, are not reproduced.

Dennis List: PhD thesis 472 Appendix 4
180 2 165
167 178 23
28 32 70
99 101 170
171 175 214
216 281 95
FIGURE A4.7.2 THE 18 MOST PREFERRED IMAGES OF THE BAROSSA VALLEY LANDSCAPE

Dennis List: PhD thesis 473 Appendix 4
6 228 61
247 248 231
249 234 235
241 136 229
232 240 245
233 183 118
FIGURE A4.7.3 THE 18 LEAST PREFERRED IMAGES OF THE BAROSSA VALLEY LANDSCAPE

Dennis List: PhD thesis 474 Appendix 4
TABLE A4.7.2 THE 18 MOST PREFERRED IMAGES OF THE BAROSSA VALLEY LANDSCAPE
Image Votes Description Location (if known) 180 8 Rural scene with vineyard and church Keyneton 2 7 Victorian mansion Fullarton, Adelaide 165 7 Traditional stone buildings Rockford winery 167 7 Urban street scene Murray St, central Tanunda 178 6 Native vegetation on hilltop Central Eden Valley 23 5 Looking down across Angaston from hill above Angaston 28 5 Cyclists on bike trail Mt Crawford reserve 32 5 old homestead, with ivy-covered wall Collingrove 70 5 Traditional stone wall Angaston 99 5+ Rocky outcrop Trig Point Rd 101 5 Stand of peppermint gums Gravel Pit Rd 170 5 Gum trees arching over road Eden Valley 171 5 Native vegetation at roadside 175 5 Tanunda Creek – no.1 asset near source 214 5 Wheat, vines, grassed hills 216 5 View over Barossa from Mengler’s Hill 281 5 Revegetating non-arable land [cartoon] 95 4+ Gum trees lining dirt road Trig Point Rd
TABLE A4.7.3 THE 18 LEAST PREFERRED IMAGES OF THE BAROSSA VALLEY LANDSCAPE
Image Votes Description Location 6 10 Amcor bottle factory Sturt Highway 228 9 High-voltage electricity pylons 61 8 Inappropriate building design Post Office, Murray St, Tanunda 247 8 Car wrecks on farm Gomersal Rd, 2 km west of Tanunda248 8 Industrial machinery dump 2km east of Tanunda 231 7 Bare hillside 249 7 Creek erosion 234 7 Overgrazing 235 7 Large tank farm Chateau Dorrien 241 6+ Hillside monoculture 136 6 Polluted water coming from pipe near Chateau Yaldara 229 6 Sick palm trees Gomersal Rd 232 6 “Moss rocks” in car sales yard Tanunda 240 6 Dirt and wheel tracks in vineyard 245 6 Poor roadside edges 233 5 Cream brick house 183 5 Creek erosion 118 4+ Penfolds factory South of Nuriootpa
A + sign after the number of votes shows that there was another image, very similar to that one, but which received fewer votes.