Embed Size (px)
Citation preview

65
Appendix 1. Recommended Dietary Allowance of Energy, Protein, Fat, Carbohydrate, and Water for Women 13-49 years, Pregnant Women, and Lactating Women
Fat (g) Age Group
BW (kg)
BH (cm)
Energy (kcal)
Protein (g) Total n-6 n-3
Carbohydrate (g)
Dietary Fiber (g)
Water (mL)
Women
13-15 yrs 46 155 2125 69 71 11 1.1 292 30 2000
16-18 yrs 50 158 2125 59 71 11 1.1 292 30 2100
19-29 yrs 54 159 2250 56 75 12 1.1 309 32 2300
30-49 yrs 55 159 2150 57 60 12 1.1 323 30 2300
Pregnant
Trimester 1 +180 +20 +6 +2 +0.3 +25 +3 +300
Trimester 2 +300 +20 +10 +2 +0.3 +40 +4 +300
Trimester 3 +300 +20 +10 +2 +0.3 +40 +4 +300
Lactating
First 6 months +330 +20 +11 +2 +0.2 +45 +5 +800
Second 6 months +400 +20 +13 +2 +0.2 +55 +6 +650
66
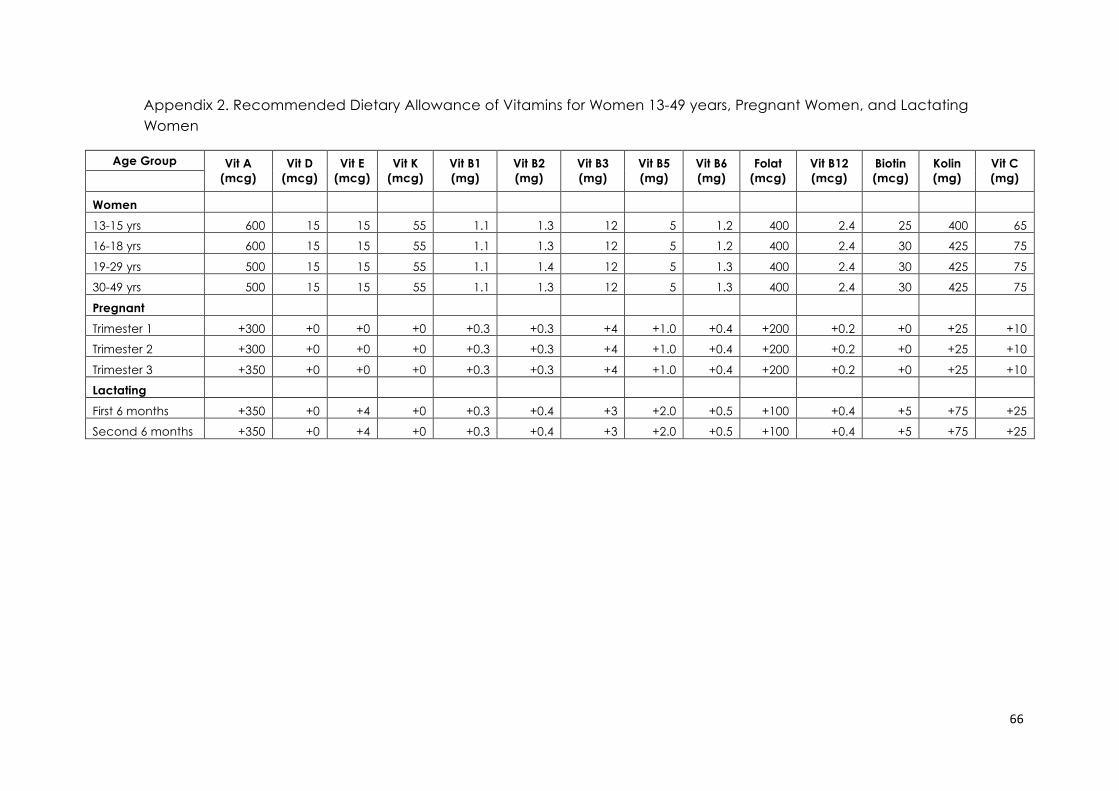
Appendix 2. Recommended Dietary Allowance of Vitamins for Women 13-49 years, Pregnant Women, and Lactating Women
Age Group
Vit A (mcg)
Vit D (mcg)
Vit E (mcg)
Vit K (mcg)
Vit B1 (mg)
Vit B2 (mg)
Vit B3 (mg)
Vit B5 (mg)
Vit B6 (mg)
Folat (mcg)
Vit B12 (mcg)
Biotin (mcg)
Kolin (mg)
Vit C (mg)
Women
13-15 yrs 600 15 15 55 1.1 1.3 12 5 1.2 400 2.4 25 400 65
16-18 yrs 600 15 15 55 1.1 1.3 12 5 1.2 400 2.4 30 425 75
19-29 yrs 500 15 15 55 1.1 1.4 12 5 1.3 400 2.4 30 425 75
30-49 yrs 500 15 15 55 1.1 1.3 12 5 1.3 400 2.4 30 425 75
Pregnant
Trimester 1 +300 +0 +0 +0 +0.3 +0.3 +4 +1.0 +0.4 +200 +0.2 +0 +25 +10
Trimester 2 +300 +0 +0 +0 +0.3 +0.3 +4 +1.0 +0.4 +200 +0.2 +0 +25 +10
Trimester 3 +350 +0 +0 +0 +0.3 +0.3 +4 +1.0 +0.4 +200 +0.2 +0 +25 +10
Lactating
First 6 months +350 +0 +4 +0 +0.3 +0.4 +3 +2.0 +0.5 +100 +0.4 +5 +75 +25
Second 6 months +350 +0 +4 +0 +0.3 +0.4 +3 +2.0 +0.5 +100 +0.4 +5 +75 +25

67
Appendix 3. Recommended Dietary Allowance of Minerals for Women 13-49 years, Pregnant Women, and Lactating Women
Age Group Calcium
(mg) Phosphor
(mg) Magnesium
(mg) Sodium
(mg) Potassium
(mg) Manganese
(mg) Copper (mcg)
Chromium (mcg)
Iron (mg)
Iodine (mcg)
Zinc (mg)
Selenium (mcg)
Fluoride (mg)
Women
13-15 yrs 1200 1200 200 1500 4500 1.6 800 22 26 150 16 30 2.4
16-18 yrs 1200 1200 220 1500 4700 1.6 890 24 26 150 14 30 2.5
19-29 yrs 1100 700 310 1500 4700 1.8 900 25 26 150 10 30 2.5
30-49 yrs 1000 700 320 1500 4700 1.8 900 25 26 150 10 30 2.7
Pregnant
Trimester 1 +200 +0 +40 +0 +0 +0.2 +100 +5 +0 +70 +2 +5 +0
Trimester 2 +200 +0 +40 +0 +0 +0.2 +100 +5 +9 +70 +4 +5 +0
Trimester 3 +200 +0 +40 +0 +0 +0.2 +100 +5 +13 +70 +10 +5 +0
Lactating
First 6 months +200 +0 +0 +0 +400 +0.8 +400 +20 +6 +100 +5 +10 +0 Second 6 months +200 +0 +0 +0 +400 +0.8 +400 +20 +8 +100 +5 +10 +0

68
Appendix 4. Sample menu for workers’ lunch (600 kcal)
Sample menu for the women workers is made with assumption that proportion of energy for breakfast, morning snack, lunch, afternoon snack and dinner are 20%, 10%, 30%, 10% and 30%, respectively. Therefore, with energy RDA of WRA ranging from 2125 to 2250 kcal per day, 30% of that would be approximately 600 kcal for lunch. The sample menu below is a common menu in Indonesia and the ingredients are easily found and relatively affordable.
Meals:
• White rice • Fried chicken with galangal • Tempeh stir-fry with soy sauce • Healthy vegetable stir-fry with meatball • Papaya
No. Food
ingredients Portion Weight
(gram) Energy (kcal)
Protein (gram)
Fat (gram)
Carbo-hydrate (gram)
Vit. C (mg)
Vit. A (�g)
Fe (mg)
Na (mg)
1. White rice 1.5 150 195 3.6 0.30 42.90 0.00 0.00 0.30 0.00 2. Fried
chicken with galangal
1.5
60
137
9.7
10.27
1.49
0.82
197.07
1.25
189.56
3. Tempeh stir-fry with soy sauce
0.7 35 110 7.3 6.30 7.84 10.57 198.66 1.12 402.12
4. Healthy vegetable stir-fry with meatball
0.5 50 86 3.3 5.80 6.05 7.40 385.75 1.00 308.10
5. Papaya 1.5 150 58 0.9 0.20 14.70 93.00 202.50 0.20 4.50 Total 586 24.8 22.87 72.98 111.79 983.98 3.87 904.28

69
Figure 2. Clockwise: Fried chicken with galangal, healthy vegetable stir-‐fry with meatball, white rice, papaya, and tempeh stir-‐fry with soy sauce
Nutrisurvey (Erhardt 2007, Ministry of Health of the Republic of Indonesia 2007) was used to calculate energy and nutrients in the sample menu. The analysis of each meals are presented below. a. Fried Chicken with Galangal (7.5 portions)
Ingredients Quantity Chicken 500 g Shallot 40 g Garlic 15 g Galangal 10 g Lime leaves 5 g Indonesian bay leaves 5 g Lemongrass 10 g Salt 6 g Coriander seeds 10 g Cooking oil (Palm oil) 50 g
The energy and nutrients analysis for 500 g of chicken with edible part 58%.

70
Energy (kcal)
Protein (gram)
Fat (gram)
Carbo-hydrate (gram)
Vit. C (mg)
Vit. A (�g)
Fe (mg)
Na (mg)
1965.1 139.1 147.6 21.4 11.8 2831.5 18 2723.5 The menu is for 1 recipe producing 7.5 portions. b. Tempeh Stir-Fry with Soy Sauce (2 portions)
Ingredients Quantity Tempeh 100 g Green chili 10 g Shallot 10 g Garlic 10 g Red chili 10 g Sweet soy sauce 10 g Salt 1.5 g Pepper 1.5 g Cooking oil (Palm oil) 10 g
The energy and nutrients analysis for 2 portions of tempeh stir-fry with soy sauce.
Energy (kcal)
Protein (gram)
Fat (gram)
Carbo-hydrate (gram)
Vit. C (mg)
Vit. A (�g)
Fe (mg)
Na (mg)
314.1 20.9 18 22.4 30.2 567.6 3.2 1148.9 c. Healthy Vegetable Stir-Fry with Meatball (1 portion)
Ingredients Quantity Carrot 30 g French Beans 30 g Baby corn 30 g Beef meatballs 20 g Onion 10 g Garlic 5 g Red chili 5 g
71
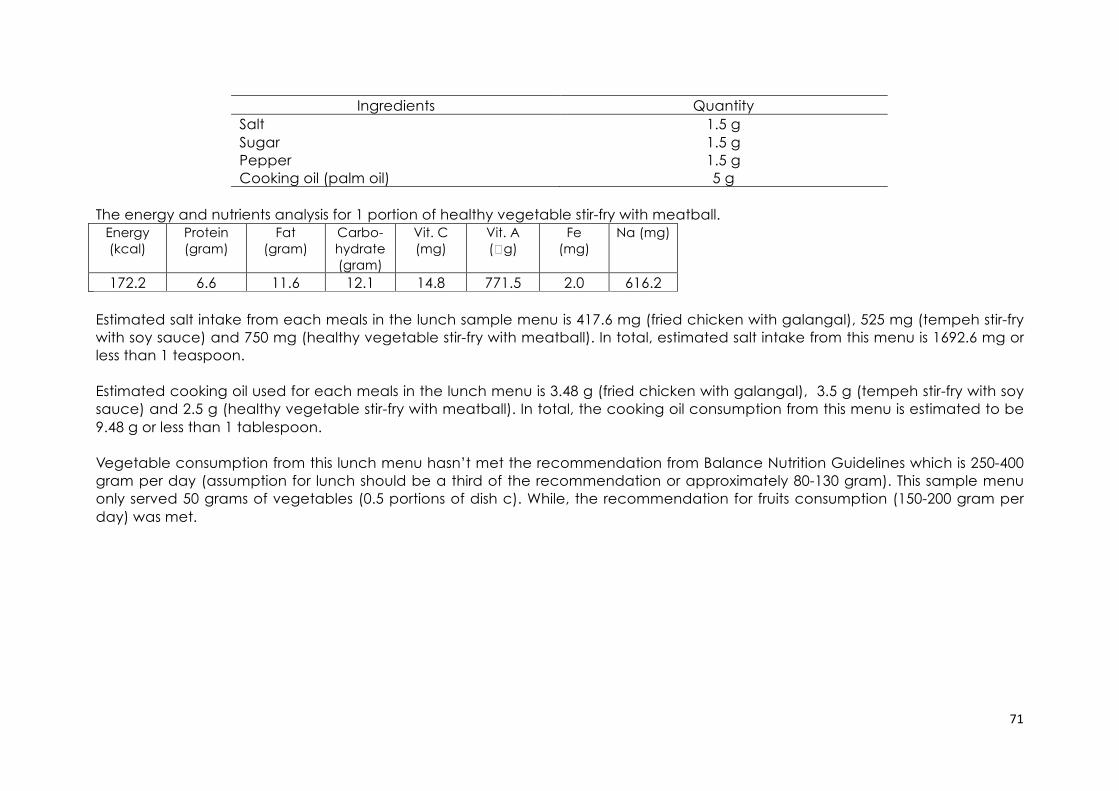
Ingredients Quantity Salt 1.5 g Sugar 1.5 g Pepper 1.5 g Cooking oil (palm oil) 5 g
The energy and nutrients analysis for 1 portion of healthy vegetable stir-fry with meatball.
Energy (kcal)
Protein (gram)
Fat (gram)
Carbo-hydrate (gram)
Vit. C (mg)
Vit. A (�g)
Fe (mg)
Na (mg)
172.2 6.6 11.6 12.1 14.8 771.5 2.0 616.2 Estimated salt intake from each meals in the lunch sample menu is 417.6 mg (fried chicken with galangal), 525 mg (tempeh stir-fry with soy sauce) and 750 mg (healthy vegetable stir-fry with meatball). In total, estimated salt intake from this menu is 1692.6 mg or less than 1 teaspoon. Estimated cooking oil used for each meals in the lunch menu is 3.48 g (fried chicken with galangal), 3.5 g (tempeh stir-fry with soy sauce) and 2.5 g (healthy vegetable stir-fry with meatball). In total, the cooking oil consumption from this menu is estimated to be 9.48 g or less than 1 tablespoon. Vegetable consumption from this lunch menu hasn’t met the recommendation from Balance Nutrition Guidelines which is 250-400 gram per day (assumption for lunch should be a third of the recommendation or approximately 80-130 gram). This sample menu only served 50 grams of vegetables (0.5 portions of dish c). While, the recommendation for fruits consumption (150-200 gram per day) was met.