Embed Size (px)
Citation preview

Appendix 1: Materials used by Ms. Johnson and Mr. Gagnon
June 29-30, 2004 156 of 203
STRICTLY CONFIDENTIAL (FR) CLASS II FOMC
Material for the FOMC presentation on
U.S. External Adjustment
Karen Johnson and Joseph Gagnon Exhibits by James Chavez June 29, 2004
June 29-30, 2004 157 of 203
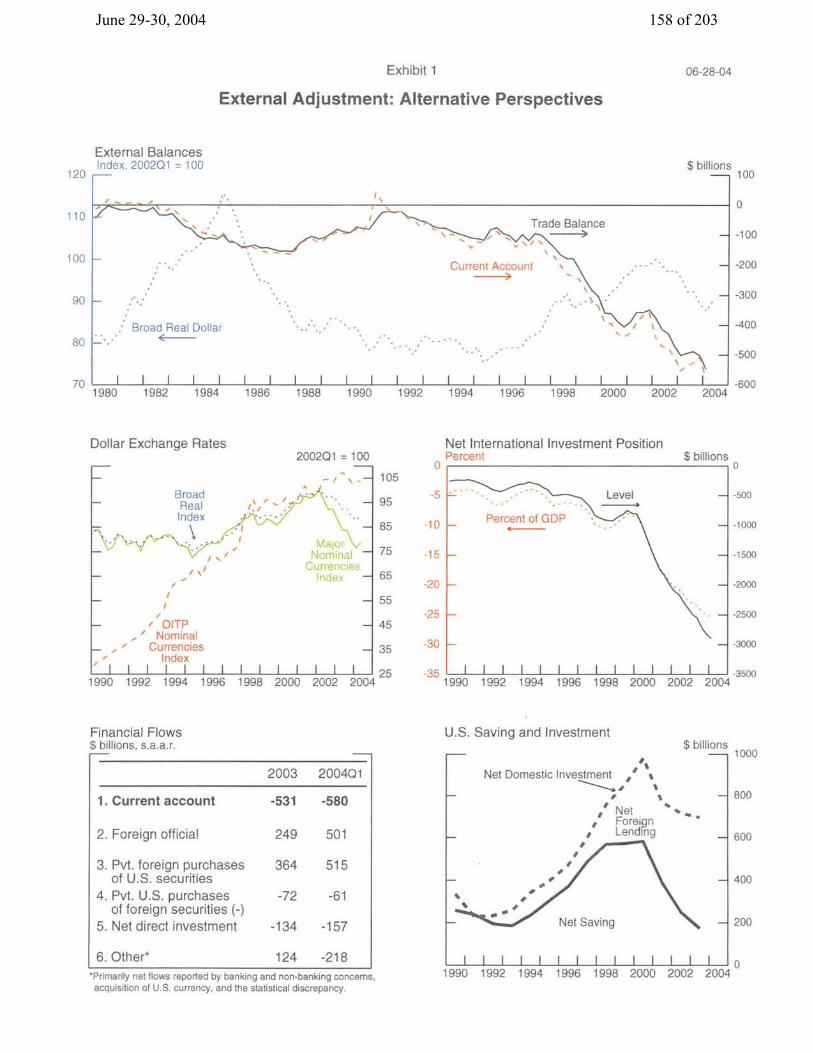
Exhibit 1
External Adjustment: Alternative Perspectives
External Balances Index, 200201 = 100
120 --
Current Account
, Broad Real Dollar
I I I I I I I I I I I I I I I I I1982 1984 1986 1988 1990 1992 1994
I I I I1996 1998 2000 2002
$ billions 100
0
-100
-200
-300
-400
-500
-600 2004
Dollar Exchange Rates 2002Q1 = 100
- ,. - 105
Broad , Real ,, 95 Index 5't ;.
S '7 - 85
S,/- 75
- 65
-- 55
/ OITP - 45 ,' Nominal
Currencies - 35 Index
I I I I l ll l I I I 25 1990 1992 1994 1996 1998 2000 2002 2004
Financial Flows $ billions, s.a.a.r.
2003 200401
1. Current account -531 -580
2. Foreign official 249 501
3. Pvt. foreign purchases 364 515 of U.S. securities
4. Pvt. U.S. purchases -72 -61 of foreign securities (-)
5. Net direct investment -134 -157
6.Other* 124 -218 *Primarily net flows reported by banking and non-banking concerns,
acquisition of U.S. currency, and the statistical discrepancy.
Net International Investment Position Percent
0
-5 Level Percent of GDP
-15
-20
-25
-30
-35I I I
U.S. Saving and Investment
$ billions
$ billions
Net Domestic Investment / s
, Net , , s Foreign
, Lending
Net Saving
-500
-1000
-1500
-2000
-2500
-3000
-3500
1000
800soo
600
400
200
I I I I I I I I I I I II I I 1990 1992 1994 1996 1998 2000 2002 2004
06-28-04
100
90
80 V
I
,, I
June 29-30, 2004 158 of 203
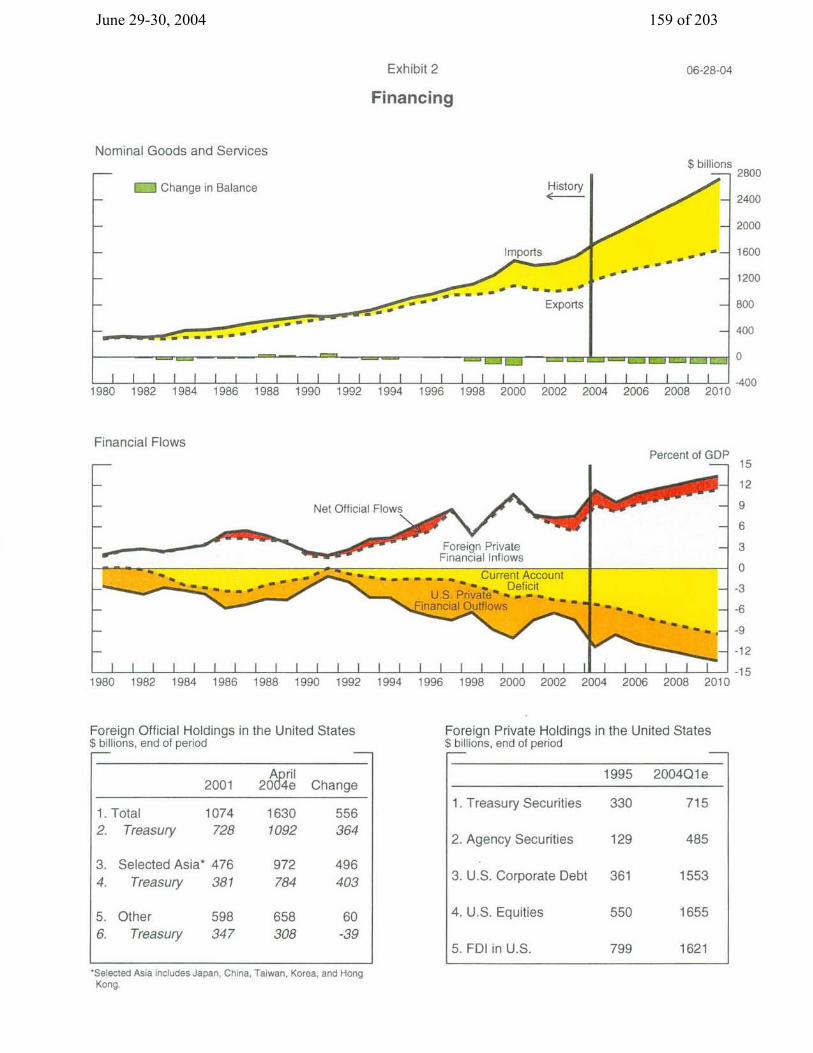
Exhibit 2
Financing
Nominal Goods and Services
K Change in Balance History 4-
Il__[1 111111 11 I11 l II I I Ill980 1982 1984 1986 1988 1990 1992 1994 1996 1998 2000 2002 20
Financial Flows
$ billions 2800
2400
2000
S, * - 1600
- 1200
800
400
04 ~ 200.8 0
I I I -400 04 2006 2008 2010
Percent of GDP
1980 1982 1984 1986 1988 1990 1992 1994 1996 1998 2000 2002 2004 2006 2008 2010
Foreign Official Holdings in the United States $ billions, end of period
April 2001 2004e Change
1. Total 1074 1630 556 2. Treasury 728 1092 364
3. Selected Asia* 476 972 496 4. Treasury 381 784 403
5. Other 598 658 60 6. Treasury 347 308 -39
'Selected Asia includes Japan, China, Taiwan, Korea, and Hong Kong.
Foreign Private Holdings in the United States $ billions, end of period
1995 200401e
1. Treasury Securities 330 715
2. Agency Securities 129 485
3. U.S. Corporate Debt 361 1553
4. U.S. Equities 550 1655
5. FDI in U.S. 799 1621
06-28-04
- Imports
. "' _ . - .. Exports
- ;
June 29-30, 2004 159 of 203
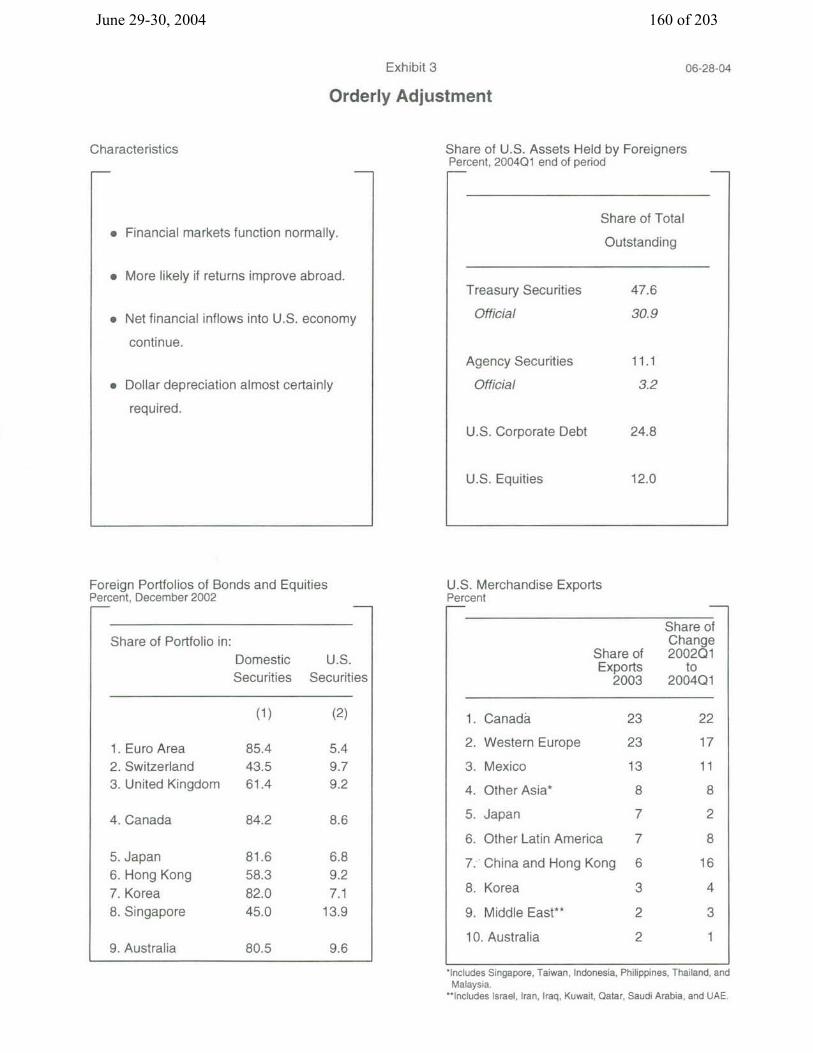
Exhibit 3
Orderly Adjustment
Characteristics
* Financial markets function normally.
* More likely if returns improve abroad.
* Net financial inflows into U.S. economy
continue.
* Dollar depreciation almost certainly
required.
Foreign Portfolios of Bonds and Equities Percent, December 2002
Share of Portfolio in: Domestic U.S. Securities Securities
(1) (2)
1. Euro Area 85.4 5.4 2. Switzerland 43.5 9.7 3. United Kingdom 61.4 9.2
4. Canada 84.2 8.6
5. Japan 81.6 6.8 6. Hong Kong 58.3 9.2 7. Korea 82.0 7.1 8. Singapore 45.0 13.9
9. Australia 80.5 9.6
Share of U.S. Assets Held by Foreigners Percent, 2004Q1 end of period
Share of Total
Outstanding
Treasury Securities 47.6
Official 30.9
Agency Securities 11.1
Official 3.2
U.S. Corporate Debt 24.8
U.S. Equities 12.0
U.S. Merchandise Exports Percent
Share of Change
Share of 200201 Exports to
2003 200401
*Includes Singapore, Taiwan, Indonesia, Philippines, Thailand, and Malaysia.
"Includes Israel, Iran, Iraq, Kuwait, Qatar, Saudi Arabia, and UAE.
06-28-04
1. Canada
2. Western Europe
3. Mexico
4. Other Asia*
5. Japan
6. Other Latin America
7. China and Hong Kong
8. Korea
9. Middle East**
10. Australia
June 29-30, 2004 160 of 203
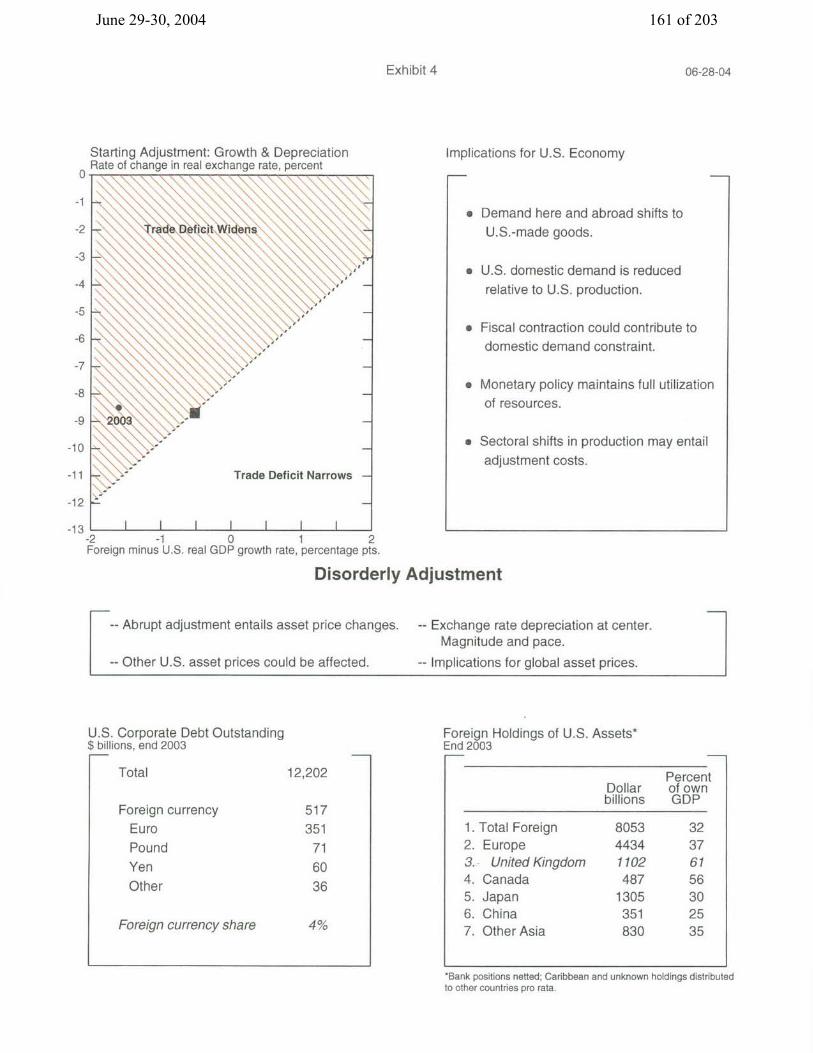
Exhibit 4
Starting Adjustment: Growth & Depreciation Rate of change in real exchange rate, percent
Implications for U.S. Economy
* Demand here and abroad shifts to U.S.-made goods.
* U.S. domestic demand is reduced relative to U.S. production.
* Fiscal contraction could contribute to domestic demand constraint.
* Monetary policy maintains full utilization of resources.
* Sectoral shifts in production may entail adjustment costs.
-2 -1 0 1 2 Foreign minus U.S. real GDP growth rate, percentage pts.
Disorderly Adjustment
-- Abrupt adjustment entails asset price changes.
-- Other U.S. asset prices could be affected.
-- Exchange rate depreciation at center. Magnitude and pace.
-- Implications for global asset prices.
U.S. Corporate Debt Outstanding $ billions, end 2003
K Total 12,202
Foreign currency Euro Pound
Yen
Other
Foreign currency share
Foreign Holdings of U.S. Assets* End 2003
Percent Dollar of own billions GDP
1. Total Foreign 8053 32 2. Europe 4434 37 3. United Kingdom 1102 61 4. Canada 487 56 5. Japan 1305 30 6. China 351 25 7. Other Asia 830 35
*Bank positions netted; Caribbean and unknown holdings distributed to other countries pro rata.
06-28-04
June 29-30, 2004 161 of 203
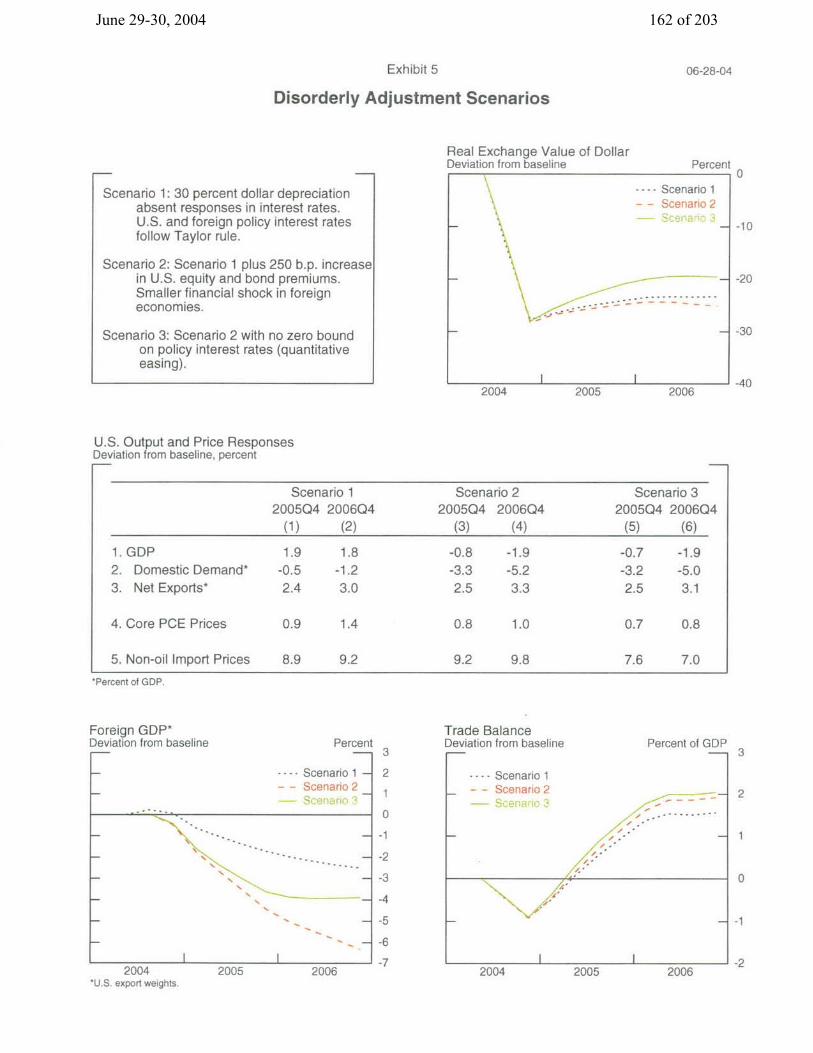
Exhibit 5
Disorderly Adjustment Scenarios
Scenario 1: 30 percent dollar depreciation absent responses in interest rates. U.S. and foreign policy interest rates follow Taylor rule.
Scenario 2: Scenario 1 plus 250 b.p. increase in U.S. equity and bond premiums. Smaller financial shock in foreign economies.
Scenario 3: Scenario 2 with no zero bound on policy interest rates (quantitative easing).
Real Exchange Value of Dollar Deviation from baseline
2004 2005
U.S. Output and Price Responses Deviation from baseline, percent
Scenario 1 200504 2006Q4 (1) (2)
Scenario 2 200504 2006Q4
(3) (4)
Scenario 3 2005Q4 2006Q4
(5) (6)
1. GDP 2. Domestic Demand* 3. Net Exports*
4. Core PCE Prices
5. Non-oil Import Prices
*Percent of GDP.
-1.9
-5.0
3.1
0.8 1.0
9.2 9.8 7.6 7.0
Foreign GDP* Deviation from baseline Percent
.... Scenario 1 - - Scenario 2
-- % --. _ N .
Nz
N . \'
\
Trade Balance Deviation from baseline
---- Scenario 1 - - Scenario 2
Percent of GDP
..
I
II
I 12004
*U.S. export weights.
06-28-04
Percent 0
- -.... Scenario 1 - - Scenario 2
.- -- -
-- -30
2006
2006
i
2005 2006 2004 2005
June 29-30, 2004 162 of 203
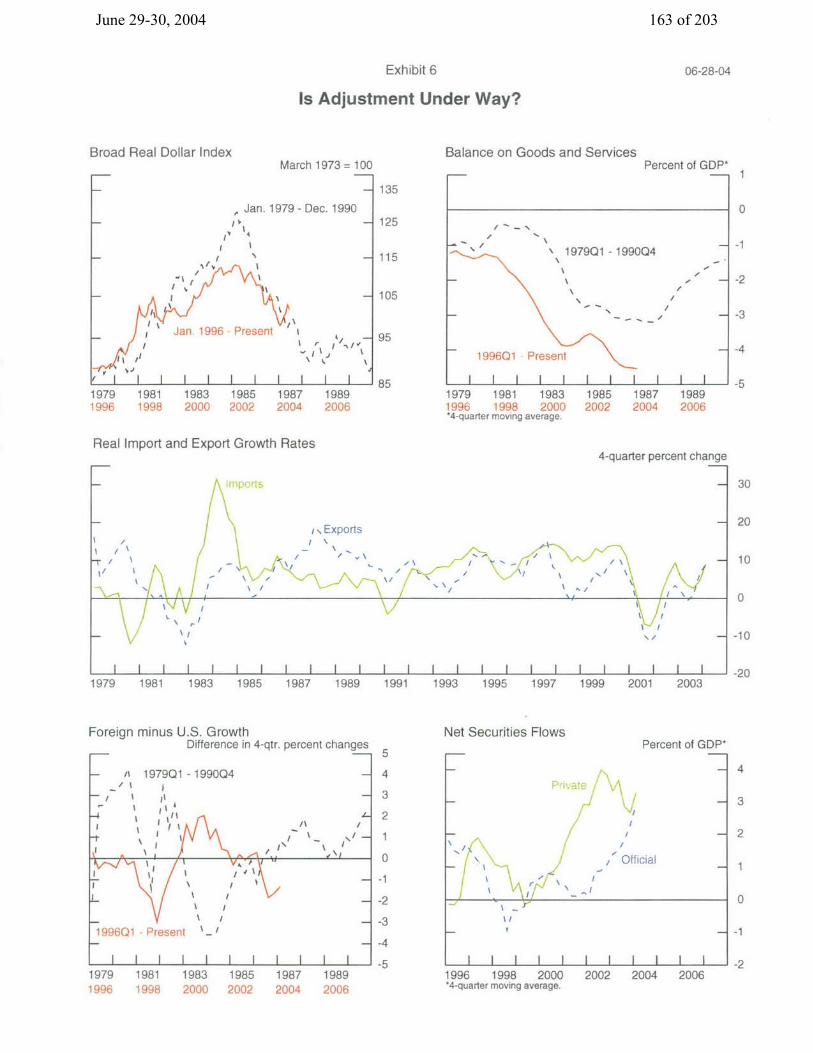
Exhibit 6
Is Adjustment Under Way?
Broad Real Dollar IndexMarch 1973 = 100
Balance on Goods and ServicesPercent of GDP*
-- 1
1979 1981 1983 1985 1987 1989 1996 1998 2000 2002 2004 2006
Real Import and Export Growth Rates
/ I ,
T \ / 1
- l \
//
- \ i
/ Exports
I\
' I _ ..
1979Q1-1990Q4
/ -- 2
199601 Present-4
1 I I t1 I I I -5 1979 1981 1983 1985 1987 1989 1996 1998 2000 2002 2004 2006 *4-quarter moving average.
4-quarter percent change
\I 'I.
N\ N
1
^ I 1
I
IIII I I I I I I I I I I I I
- r 1 1
1 1 1 1 1 1 1 1 1 1 1 1 1 1 1 1 1 1 1 1
1979 1981 1983 1985 1987 1989 1991 1993 1995 1997 1999 2001
Foreign minus U.S. Growth Difference in 4-qtr.
Net Securities FlowsPercent of GDP*
1979 1981 1983 1985 1987 1989 1996 1998 2000 2002 2004 2006
, Official
,.
I ,I
I I I I I I I I I I I 1996 1998 2000 2002 2004 2006 *4-quarter moving average.
06-28-04
2003
June 29-30, 2004 163 of 203
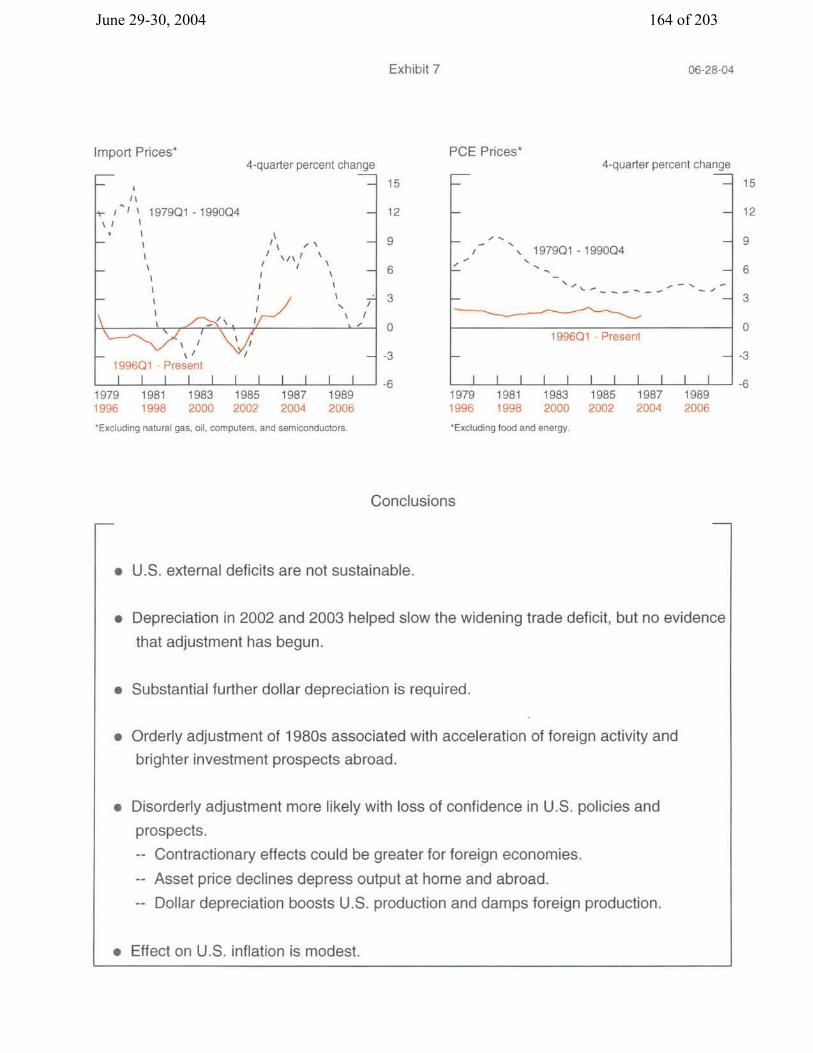
Exhibit 7
Import Prices*
it
I ' 1979(
- I _ \
1996Q1 Pr -1i i
4-quarter percent change
1 -1990Q4
/
t 1
/ /
esent I I I I I I I I
1979 1981 1983 1985 1987 1989 1996 1998 2000 2002 2004 2006
*Excluding natural gas, oil, computers, and semiconductors.
PCE Prices*4-quarter percent change
I/ \ 1979Q1 - 1990Q4
1996Q1 Present
I I I I I I 11979 1981 1983 1996 1998 2000
*Excluding food and energy.
1985 1987 1989 2002 2004 2006
Conclusions
* U.S. external deficits are not sustainable.
* Depreciation in 2002 and 2003 helped slow the widening trade deficit, but no evidence
that adjustment has begun.
* Substantial further dollar depreciation is required.
* Orderly adjustment of 1980s associated with acceleration of foreign activity and
brighter investment prospects abroad.
* Disorderly adjustment more likely with loss of confidence in U.S. policies and
prospects.
-- Contractionary effects could be greater for foreign economies.
-- Asset price declines depress output at home and abroad.
-- Dollar depreciation boosts U.S. production and damps foreign production.
* Effect on U.S. inflation is modest.
06-28-04
June 29-30, 2004 164 of 203
Appendix 2: Materials used by Ms. Goldberg
June 29-30, 2004 165 of 203
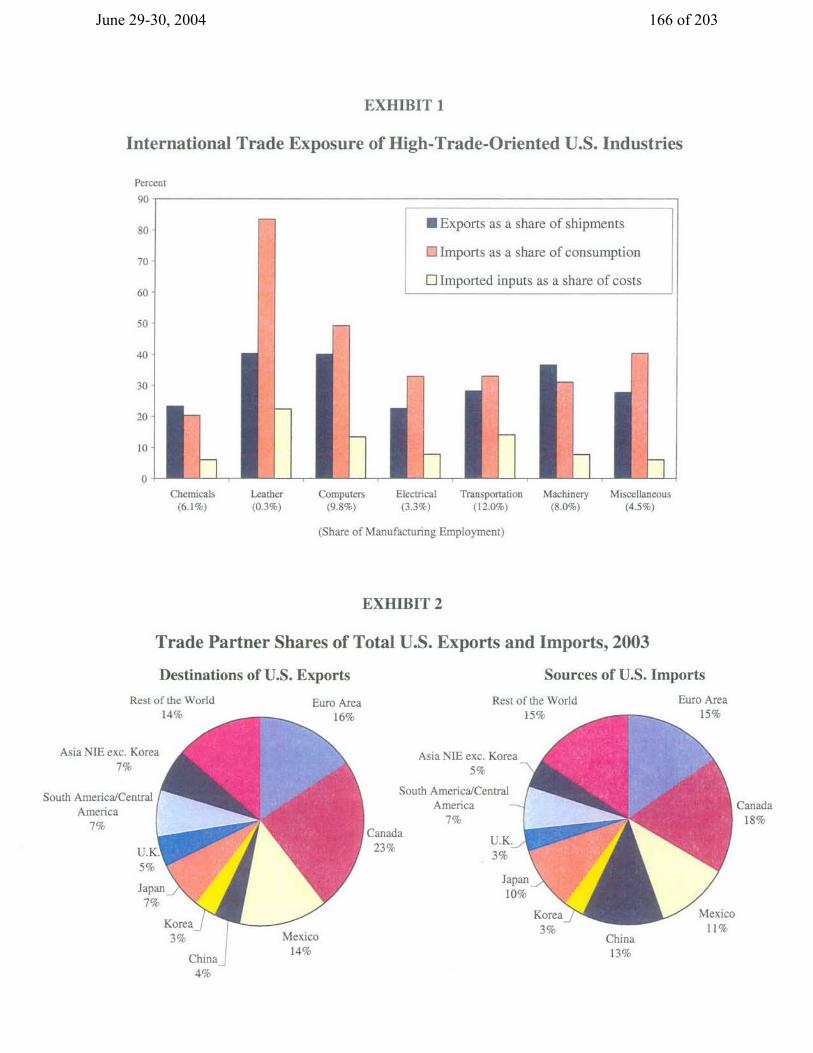
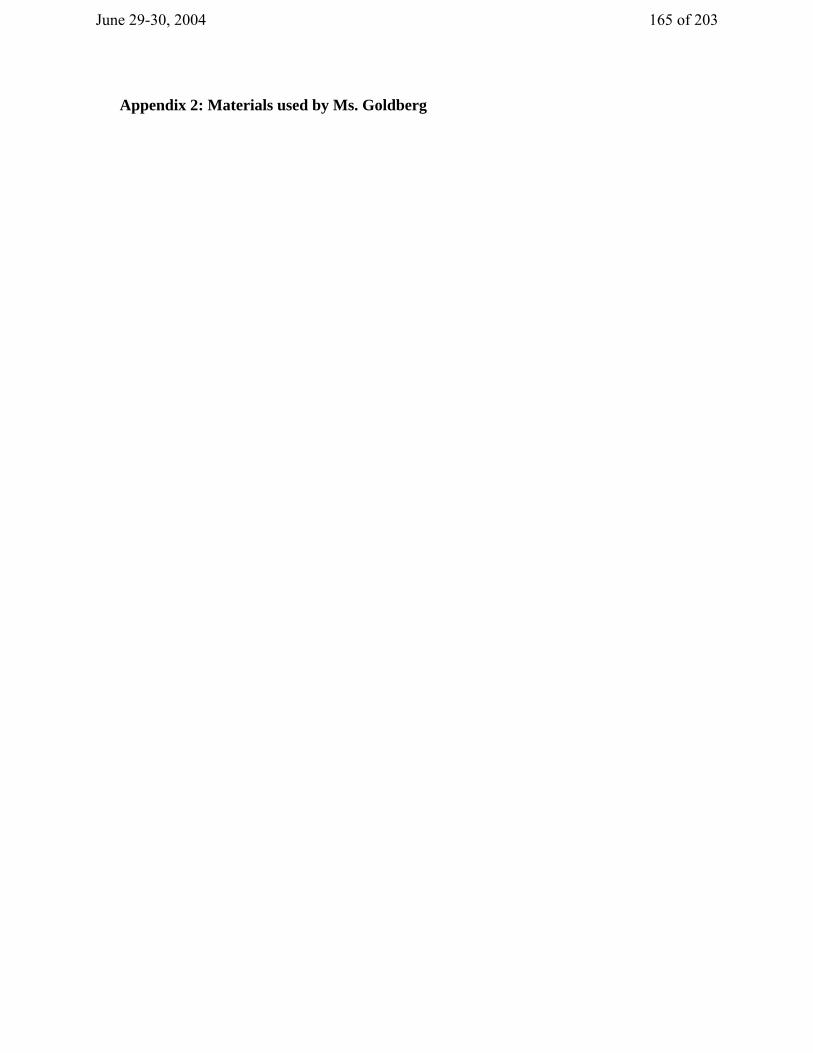
EXHIBIT 1
International Trade Exposure of High-Trade-Oriented U.S. Industries
Percent o0
Exports as a share of shipments
* Imports as a share of consumption
Q Imported inputs as a share of costs
Computers Electrical Transportation
(9.8%) (3.3%) (12.0%)
(Share of Manufacturing Employment)
Machinery (8.0%)
EXHIBIT 2
Trade Partner Shares of Total U.S. Exports and Imports, 2003
Destinations of U.S. Exports Sources of U.S. Imports
Rest of the World Euro Area Rest of the World Euro Area 14% ___ 16% 15% 15%
Asia NIE exc. Korea 7%
South America/Central America 7%
U.K . 5%
Japan 7%
Korea_ 3%
China) 4%
Canada 23%
Asia NIE exc. Korea 5%
South America/Central America
7%
U.K_ 3%
Japan 10%
Mexico 14%
Chemicals (6.1%)
Leather (0.3%)
Miscellaneous (4.5%)
Canada 18%
China 13%
June 29-30, 2004 166 of 203
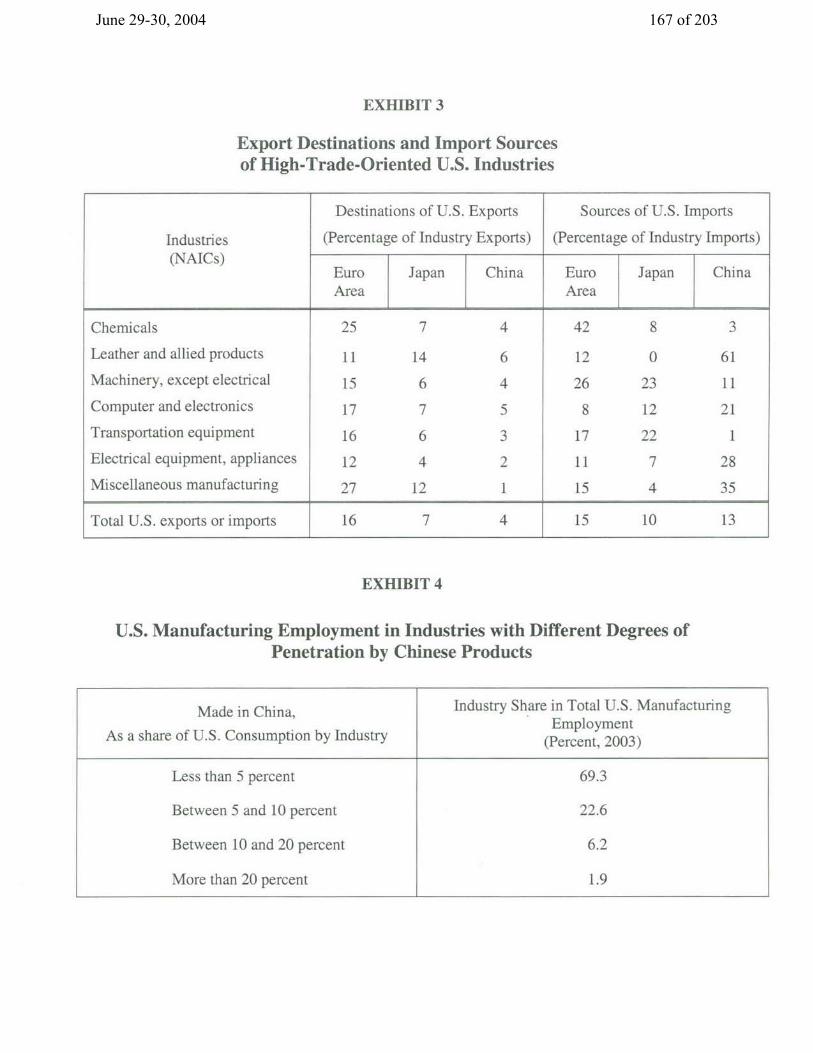
EXHIBIT 3
Export Destinations and Import Sources of High-Trade-Oriented U.S. Industries
Destinations of U.S. Exports Sources of U.S. Imports
Industries (Percentage of Industry Exports) (Percentage of Industry Imports) (NAICs)
Euro Japan China Euro Japan China Area Area
Chemicals 25 7 4 42 8 3
Leather and allied products 11 14 6 12 0 61
Machinery, except electrical 15 6 4 26 23 11
Computer and electronics 17 7 5 8 12 21
Transportation equipment 16 6 3 17 22 1
Electrical equipment, appliances 12 4 2 11 7 28
Miscellaneous manufacturing 27 12 1 15 4 35
Total U.S. exports or imports 16 7 4 15 10 13
EXHIBIT 4
U.S. Manufacturing Employment in Industries with Different Degrees of Penetration by Chinese Products
Made in China,
As a share of U.S. Consumption by Industry
Industry Share in Total U.S. Manufacturing Employment
(Percent, 2003)
Less than 5 percent 69.3
Between 5 and 10 percent 22.6
Between 10 and 20 percent 6.2
More than 20 percent 1.9
June 29-30, 2004 167 of 203
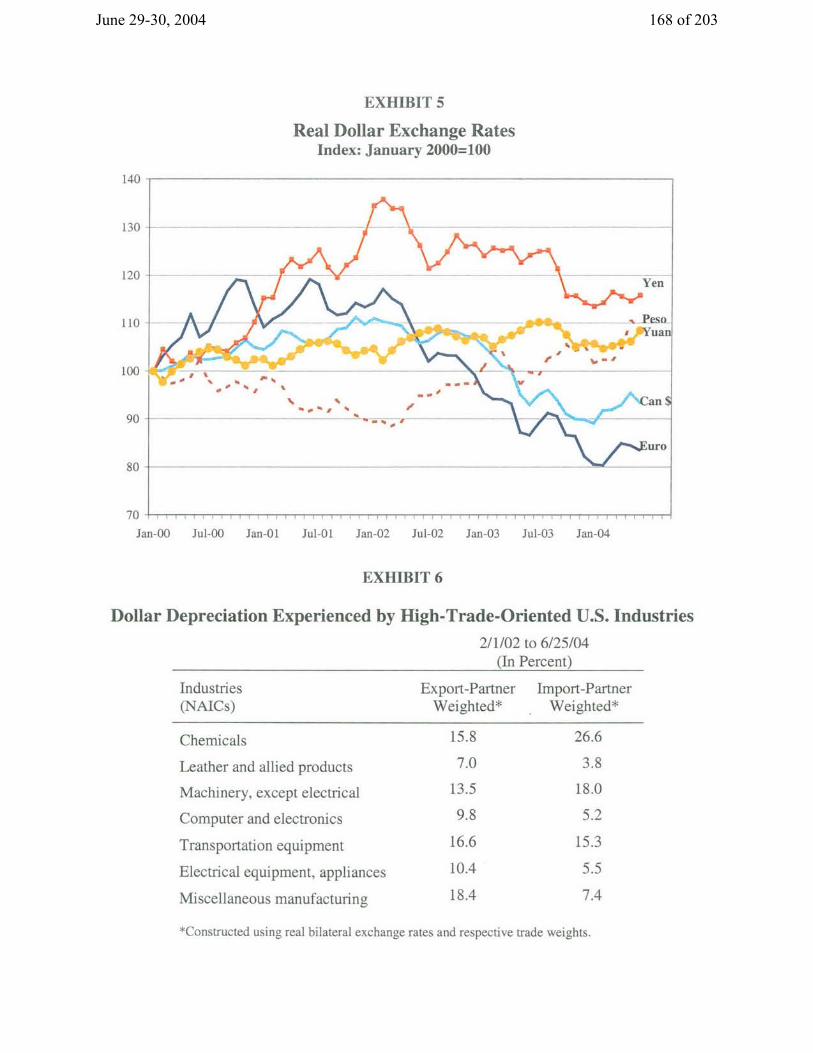
EXHIBIT 5
Real Dollar Exchange Rates Index: January 2000=100
140
130
120
110
100
90 -
80
Yen
_ _ Peso ' Yuan
'I.f
%-- ~-----
- ,_ I) I,
--~--I. i
70
Jan-00 Jul-00 Jan-01 Jul-01 Jan-02 Jul-02 Jan-03 Jul-03 Jan-04
EXHIBIT 6
Dollar Depreciation Experienced by High-Trade-Oriented U.S. Industries
2/1/02 to 6/25/04 (In Percent)
Industries Export-Partner Import-Partner (NAICs) Weighted* Weighted*
Chemicals
Leather and allied products
Machinery, except electrical
Computer and electronics
Transportation equipment
Electrical equipment, appliances
Miscellaneous manufacturing
15.8
7.0
13.5
9.8
16.6
10.4
18.4
26.6
3.8
18.0
5.2
15.3
5.5
7.4
*Constructed using real bilateral exchange rates and respective trade weights.
Can 9,,r
June 29-30, 2004 168 of 203
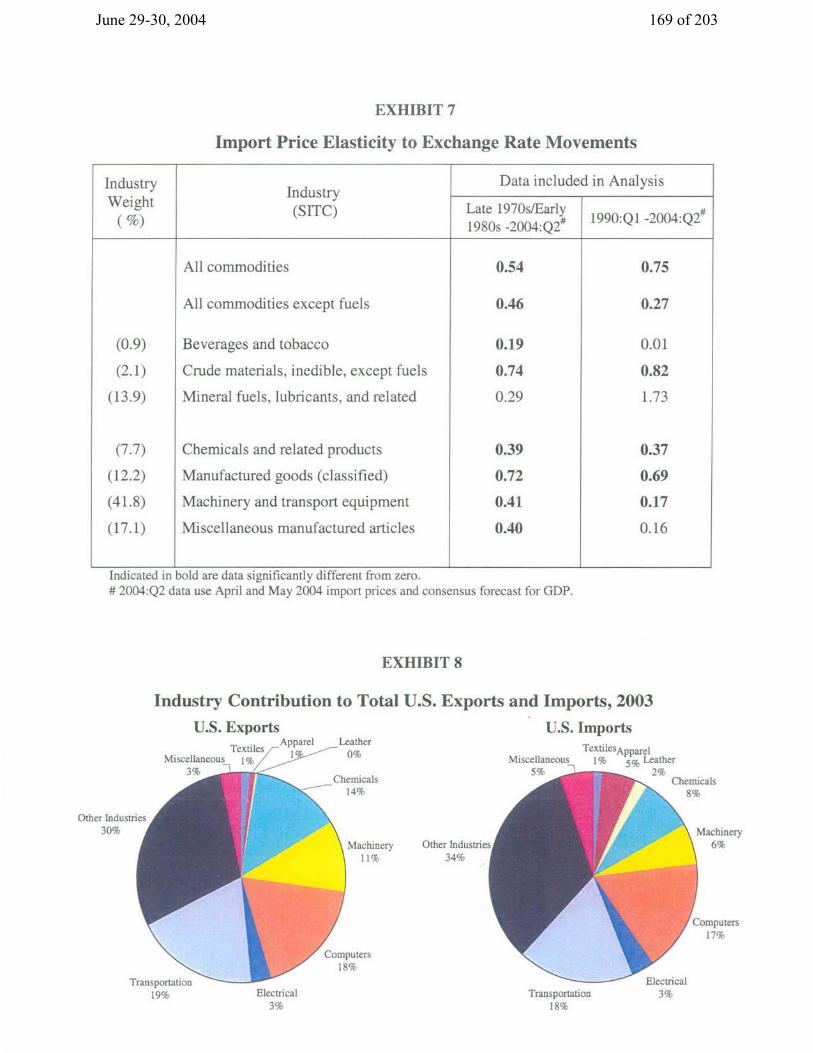
EXHIBIT 7
Import Price Elasticity to Exchange Rate Movements
Industry Data included in Analysis Industry
Weight (SITC) Late 1970s/Early # (%) 1980s -2004:Q2# 1990:Q1 -2004:Q2
All commodities 0.54 0.75
All commodities except fuels 0.46 0.27
(0.9) Beverages and tobacco 0.19 0.01
(2.1) Crude materials, inedible, except fuels 0.74 0.82
(13.9) Mineral fuels, lubricants, and related 0.29 1.73
(7.7) Chemicals and related products 0.39 0.37
(12.2) Manufactured goods (classified) 0.72 0.69
(41.8) Machinery and transport equipment 0.41 0.17
(17.1) Miscellaneous manufactured articles 0.40 0.16
Indicated in bold are data significantly different from zero. # 2004:Q2 data use April and May 2004 import prices and consensus forecast for GDP.
EXHIBIT 8
Industry Contribution to Total U.S. Exports and Imports, 2003
U.S. Exports U.S. Imports Apparel Leather
Textiles App Leather TextilesApparel Miscellaneous 1% Miscellaneous 1% 5% Leather
C m l59 h 2l Chemicals Chemicals 14% 14% 8%
Other Industries 30%
Machinery 11%
Other Industrie: 34%
Machinery 6%
Computers 17%
Computers 18%
Electrical 3%
Transportation 18%
Electrical 3%
June 29-30, 2004 169 of 203
Appendix 3: Materials used by Mr. Kos
June 29-30, 2004 170 of 203
1.00
1.50
2.00
2.50
3.00
3.50
3/15 3/30 4/14 4/29 5/14 5/29 6/13 6/281.00
1.50
2.00
2.50
3.00
3.50
180
190
200
210
220
230
240
3/15 3/30 4/14 4/29 5/14 5/29 6/13 6/28180
190
200
210
220
230
240
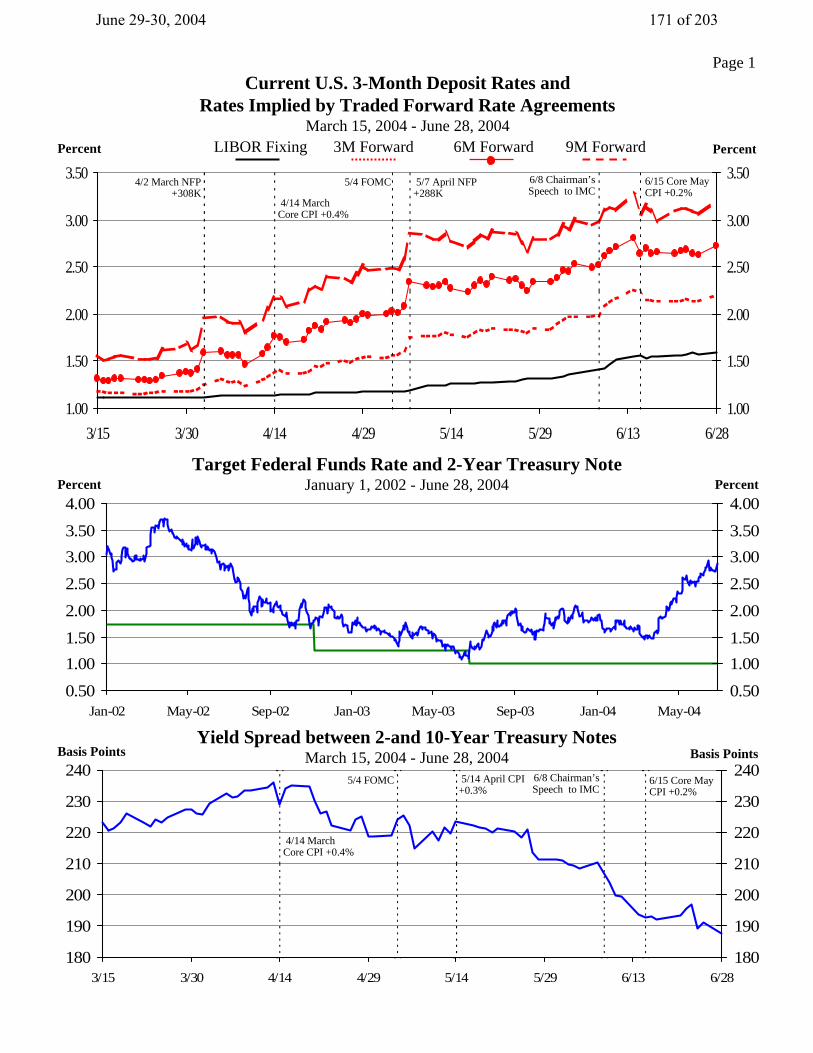
Page 1Current U.S. 3-Month Deposit Rates and
Rates Implied by Traded Forward Rate AgreementsMarch 15, 2004 - June 28, 2004
LIBOR Fixing 3M Forward 6M Forward 9M Forward PercentPercent
0.501.001.502.002.503.003.504.00
Jan-02 May-02 Sep-02 Jan-03 May-03 Sep-03 Jan-04 May-040.501.001.502.002.503.003.504.00
Target Federal Funds Rate and 2-Year Treasury NoteJanuary 1, 2002 - June 28, 2004Percent Percent
Yield Spread between 2-and 10-Year Treasury NotesMarch 15, 2004 - June 28, 2004Basis Points Basis Points
6/15 Core MayCPI +0.2%
6/8 Chairman’sSpeech to IMC
5/7 April NFP+288K
5/4 FOMC
4/14 MarchCore CPI +0.4%
4/2 March NFP+308K
6/15 Core MayCPI +0.2%
6/8 Chairman’sSpeech to IMC
5/14 April CPI+0.3%
5/4 FOMC
4/14 MarchCore CPI +0.4%
June 29-30, 2004 171 of 203
180
200
220
240
260
280
2/1 2/19 3/8 3/26 4/13 5/1 5/19 6/6 6/24180
200
220
240
260
280
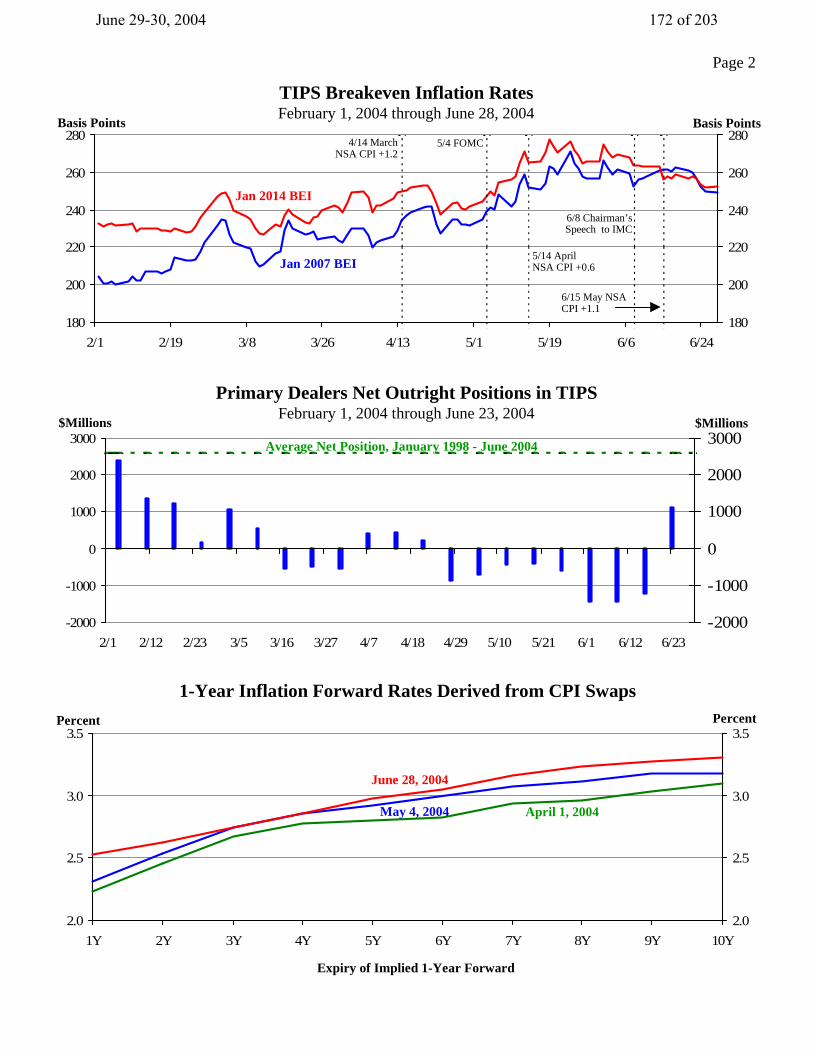
TIPS Breakeven Inflation RatesFebruary 1, 2004 through June 28, 2004
-2000
-1000
0
1000
2000
3000
2/1 2/12 2/23 3/5 3/16 3/27 4/7 4/18 4/29 5/10 5/21 6/1 6/12 6/23-2000
-1000
0
1000
2000
3000
Primary Dealers Net Outright Positions in TIPSFebruary 1, 2004 through June 23, 2004
2.0
2.5
3.0
3.5
1Y 2Y 3Y 4Y 5Y 6Y 7Y 8Y 9Y 10Y2.0
2.5
3.0
3.5
1-Year Inflation Forward Rates Derived from CPI Swaps
Basis PointsBasis Points
$Millions$Millions
PercentPercent
Jan 2007 BEI
Jan 2014 BEI
May 4, 2004
June 28, 2004
6/15 May NSACPI +1.1
6/8 Chairman’sSpeech to IMC
5/14 AprilNSA CPI +0.6
5/4 FOMC 4/14 MarchNSA CPI +1.2
Average Net Position, January 1998 - June 2004
April 1, 2004
Page 2
Expiry of Implied 1-Year Forward
June 29-30, 2004 172 of 203
20
40
60
80
100
120
Jan-04 Feb-04 Mar-04 Apr-04 May-04 Jun-0420
40
60
80
100
120
Page 3
350
400
450
500
550
600
Jan-04 Feb-04 Mar-04 Apr-04 May-04 Jun-04350
400
450
500
550
600Basis Points Basis PointsBasis Points
Source: Merrill Lynch, JP Morgan
Merrill Lynch HighYield Bond IndexOAS
EMBI+
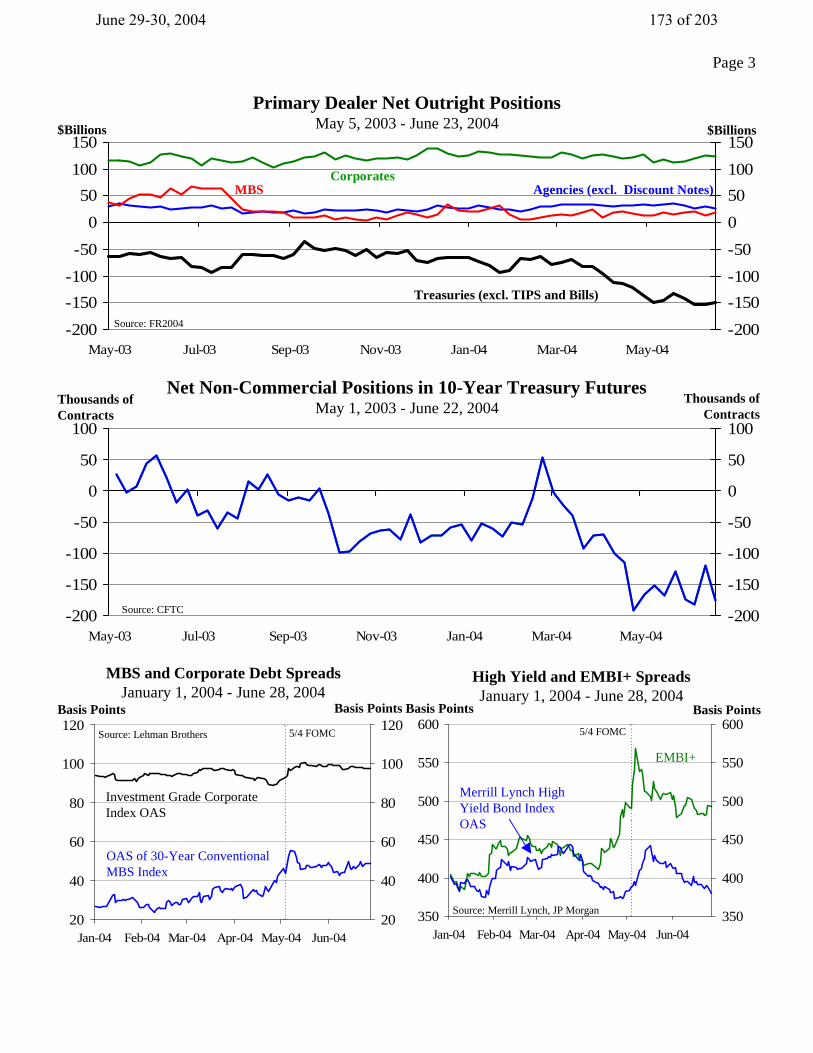
High Yield and EMBI+ SpreadsJanuary 1, 2004 - June 28, 2004
MBS and Corporate Debt SpreadsJanuary 1, 2004 - June 28, 2004
Investment Grade CorporateIndex OAS
Basis Points
Source: Lehman Brothers
-200-150-100-50
050
100150
May-03 Jul-03 Sep-03 Nov-03 Jan-04 Mar-04 May-04-200-150-100-50050100150
Primary Dealer Net Outright PositionsMay 5, 2003 - June 23, 2004
-200
-150
-100
-50
0
50
100
May-03 Jul-03 Sep-03 Nov-03 Jan-04 Mar-04 May-04-200
-150
-100
-50
0
50
100
Net Non-Commercial Positions in 10-Year Treasury FuturesMay 1, 2003 - June 22, 2004
Source: FR2004
Treasuries (excl. TIPS and Bills)
CorporatesAgencies (excl. Discount Notes)MBS
$Billions$Billions
Thousands ofContracts
OAS of 30-Year ConventionalMBS Index
Thousands ofContracts
5/4 FOMC 5/4 FOMC
Source: CFTC
June 29-30, 2004 173 of 203
1.0
1.5
2.0
2.5
3.0
3/15 3/30 4/14 4/29 5/14 5/29 6/13 6/281.0
1.5
2.0
2.5
3.0
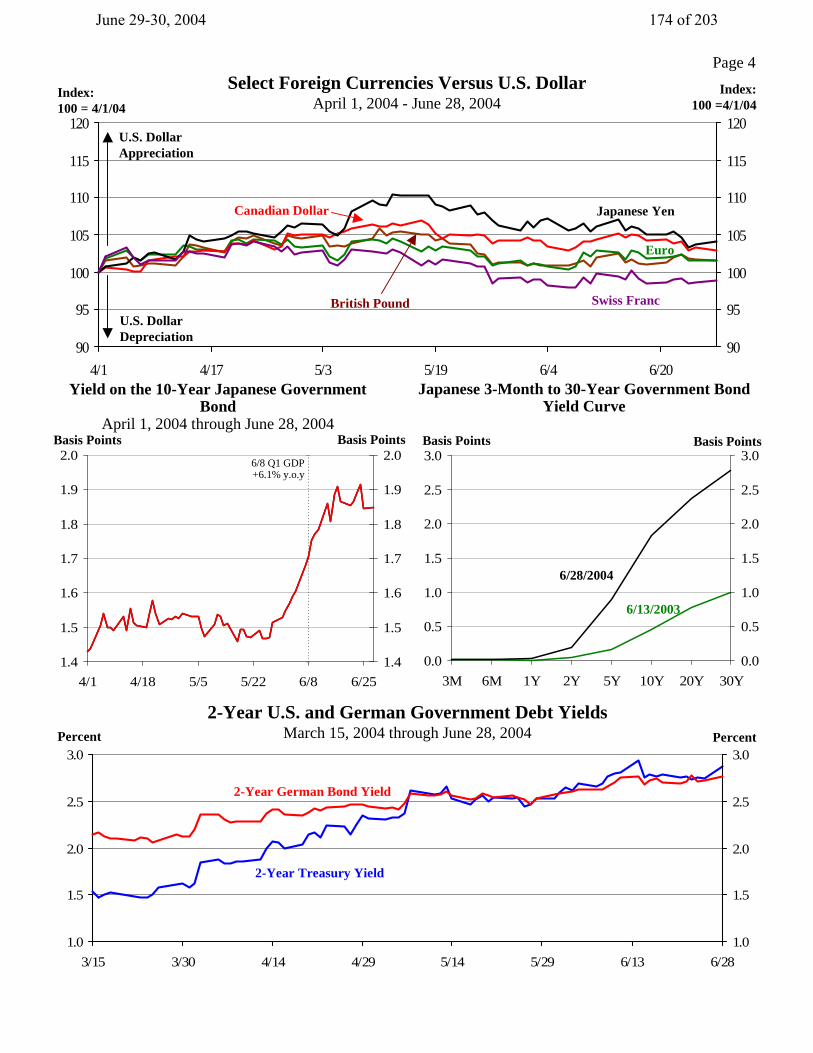
Page 4
Yield on the 10-Year Japanese GovernmentBond
April 1, 2004 through June 28, 2004
0.0
0.5
1.0
1.5
2.0
2.5
3.0
3M 6M 1Y 2Y 5Y 10Y 20Y 30Y0.0
0.5
1.0
1.5
2.0
2.5
3.0
1.4
1.5
1.6
1.7
1.8
1.9
2.0
4/1 4/18 5/5 5/22 6/8 6/251.4
1.5
1.6
1.7
1.8
1.9
2.0
6/28/2004
6/13/2003
Basis PointsBasis PointsBasis PointsBasis Points
2-Year U.S. and German Government Debt YieldsMarch 15, 2004 through June 28, 2004
2-Year Treasury Yield
2-Year German Bond Yield
PercentPercent
Japanese 3-Month to 30-Year Government BondYield Curve
6/8 Q1 GDP+6.1% y.o.y
Select Foreign Currencies Versus U.S. DollarApril 1, 2004 - June 28, 2004
90
95
100
105
110
115
120
4/1 4/17 5/3 5/19 6/4 6/2090
95
100
105
110
115
120
Euro
British Pound
U.S. DollarAppreciation
U.S. DollarDepreciation
Canadian Dollar Japanese Yen
Swiss Franc
Index:100 =4/1/04
Index:100 = 4/1/04
June 29-30, 2004 174 of 203
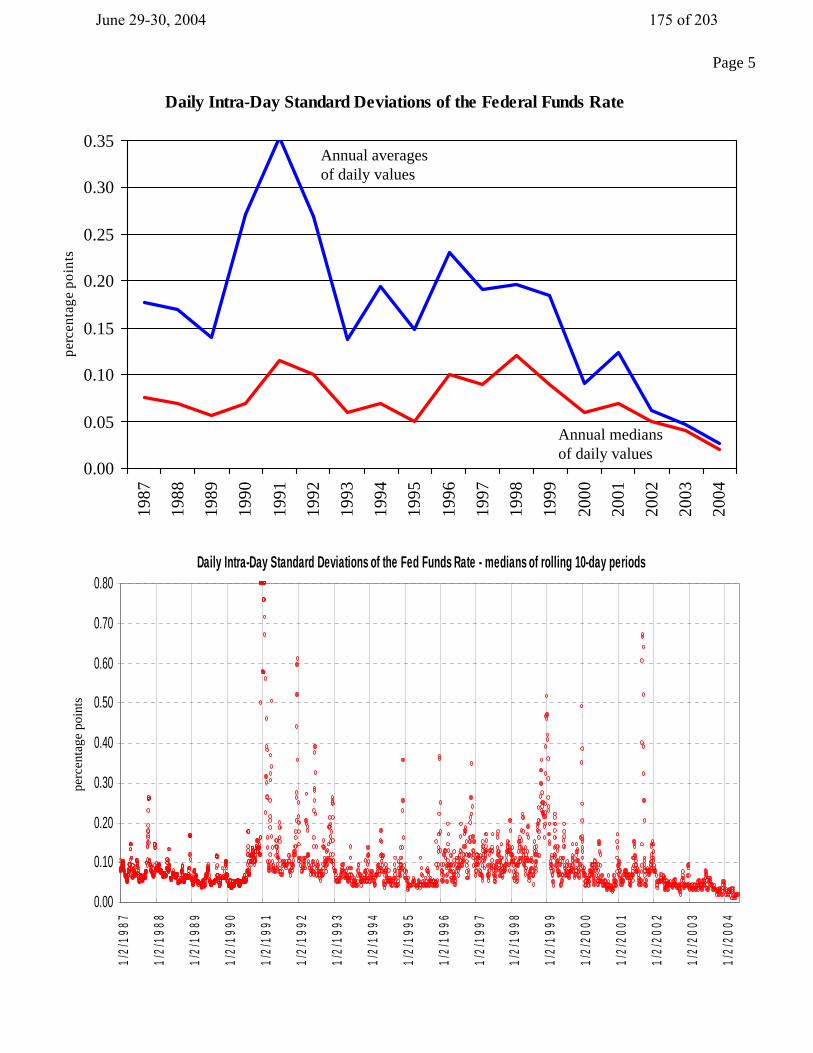
Daily Intra-Day Standard Deviations of the Federal Funds Rate
0.00
0.05
0.10
0.15
0.20
0.25
0.30
0.3519
87
1988
1989
1990
1991
1992
1993
1994
1995
1996
1997
1998
1999
2000
2001
2002
2003
2004
perc
enta
ge p
oint
s
Annual averagesof daily values
Annual mediansof daily values
Daily Intra-Day Standard Deviations of the Fed Funds Rate - medians of rolling 10-day periods
0.00
0.10
0.20
0.30
0.40
0.50
0.60
0.70
0.80
1/2/
1987
1/2/
1988
1/2/
1989
1/2/
1990
1/2/
1991
1/2/
1992
1/2/
1993
1/2/
1994
1/2/
1995
1/2/
1996
1/2/
1997
1/2/
1998
1/2/
1999
1/2/
2000
1/2/
2001
1/2/
2002
1/2/
2003
1/2/
2004
perc
enta
ge p
oint
sPage 5
June 29-30, 2004 175 of 203
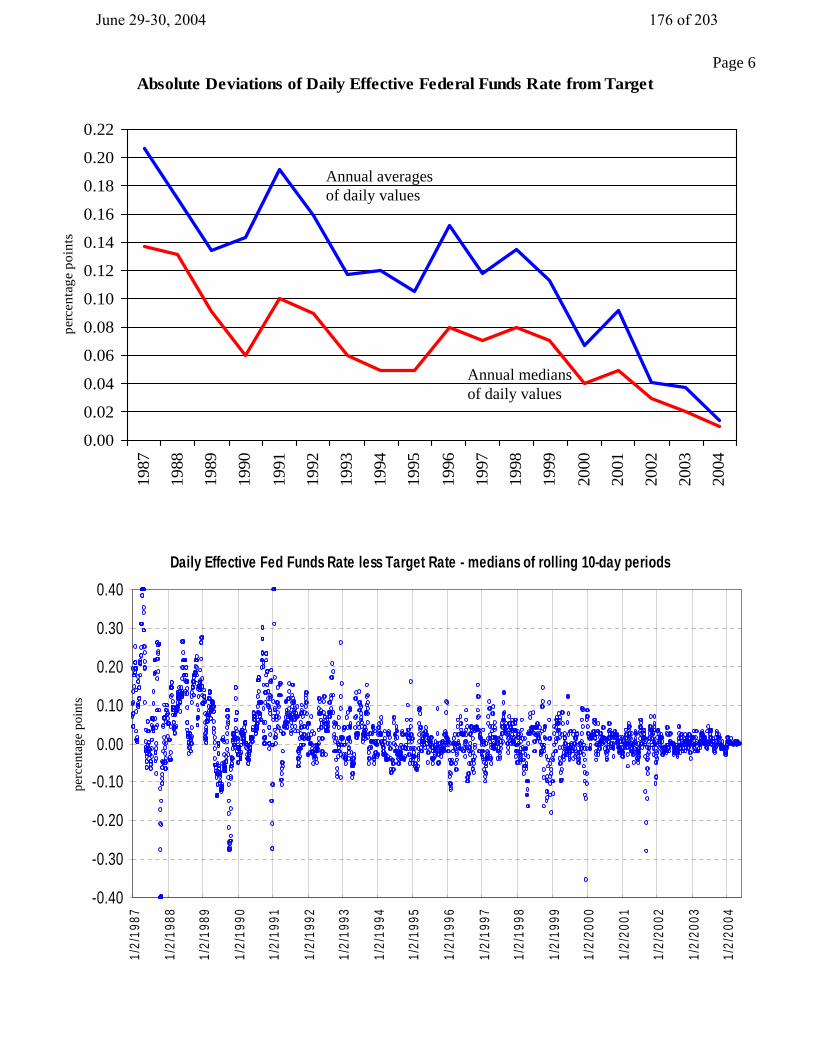
Absolute Deviations of Daily Effective Federal Funds Rate from Target
0.00
0.02
0.04
0.06
0.08
0.10
0.12
0.14
0.16
0.18
0.20
0.2219
87
1988
1989
1990
1991
1992
1993
1994
1995
1996
1997
1998
1999
2000
2001
2002
2003
2004
perc
enta
ge p
oint
s
Annual mediansof daily values
Daily Effective Fed Funds Rate less Target Rate - medians of rolling 10-day periods
-0.40
-0.30
-0.20
-0.10
0.00
0.10
0.20
0.30
0.40
1/2/
1987
1/2/
1988
1/2/
1989
1/2/
1990
1/2/
1991
1/2/
1992
1/2/
1993
1/2/
1994
1/2/
1995
1/2/
1996
1/2/
1997
1/2/
1998
1/2/
1999
1/2/
2000
1/2/
2001
1/2/
2002
1/2/
2003
1/2/
2004
Annual averagesof daily values
perc
enta
ge p
oint
sPage 6
June 29-30, 2004 176 of 203
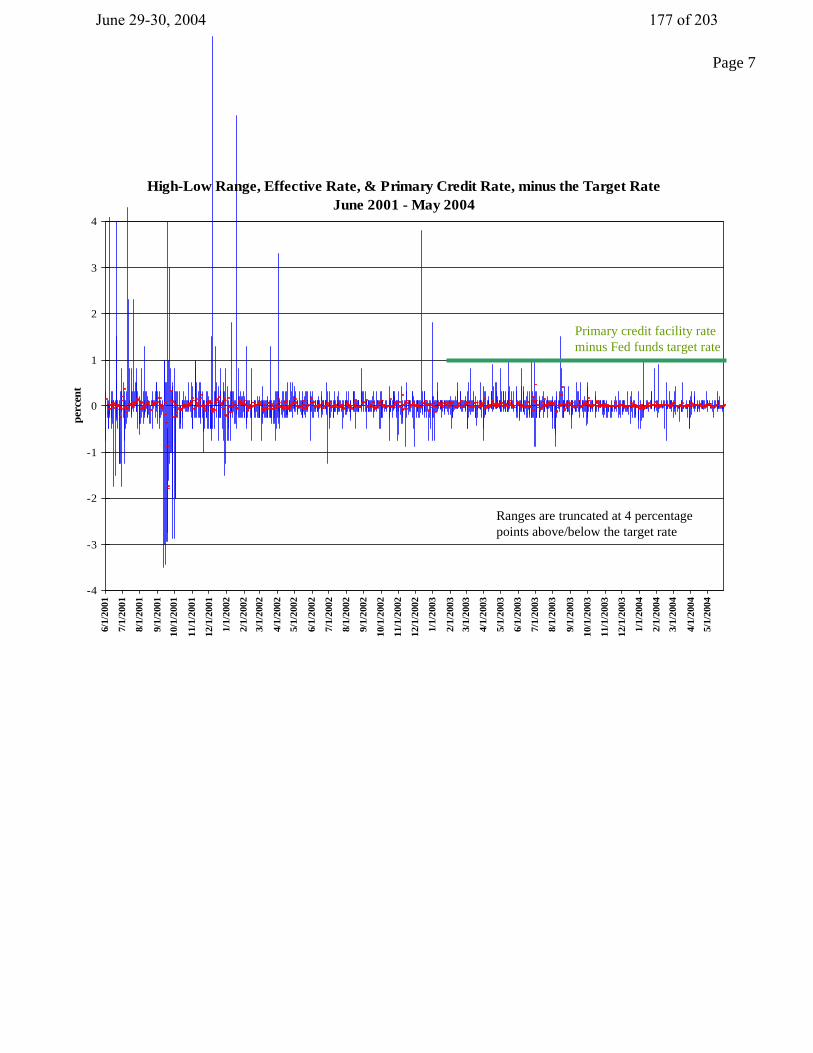
High-Low Range, Effective Rate, & Primary Credit Rate, minus the Target RateJune 2001 - May 2004
-4
-3
-2
-1
0
1
2
3
4
6/1/
2001
7/1/
2001
8/1/
2001
9/1/
2001
10/1
/200
1
11/1
/200
1
12/1
/200
1
1/1/
2002
2/1/
2002
3/1/
2002
4/1/
2002
5/1/
2002
6/1/
2002
7/1/
2002
8/1/
2002
9/1/
2002
10/1
/200
2
11/1
/200
2
12/1
/200
2
1/1/
2003
2/1/
2003
3/1/
2003
4/1/
2003
5/1/
2003
6/1/
2003
7/1/
2003
8/1/
2003
9/1/
2003
10/1
/200
3
11/1
/200
3
12/1
/200
3
1/1/
2004
2/1/
2004
3/1/
2004
4/1/
2004
5/1/
2004
perc
ent
Primary credit facility rateminus Fed funds target rate
Ranges are truncated at 4 percentagepoints above/below the target rate
Page 7
June 29-30, 2004 177 of 203
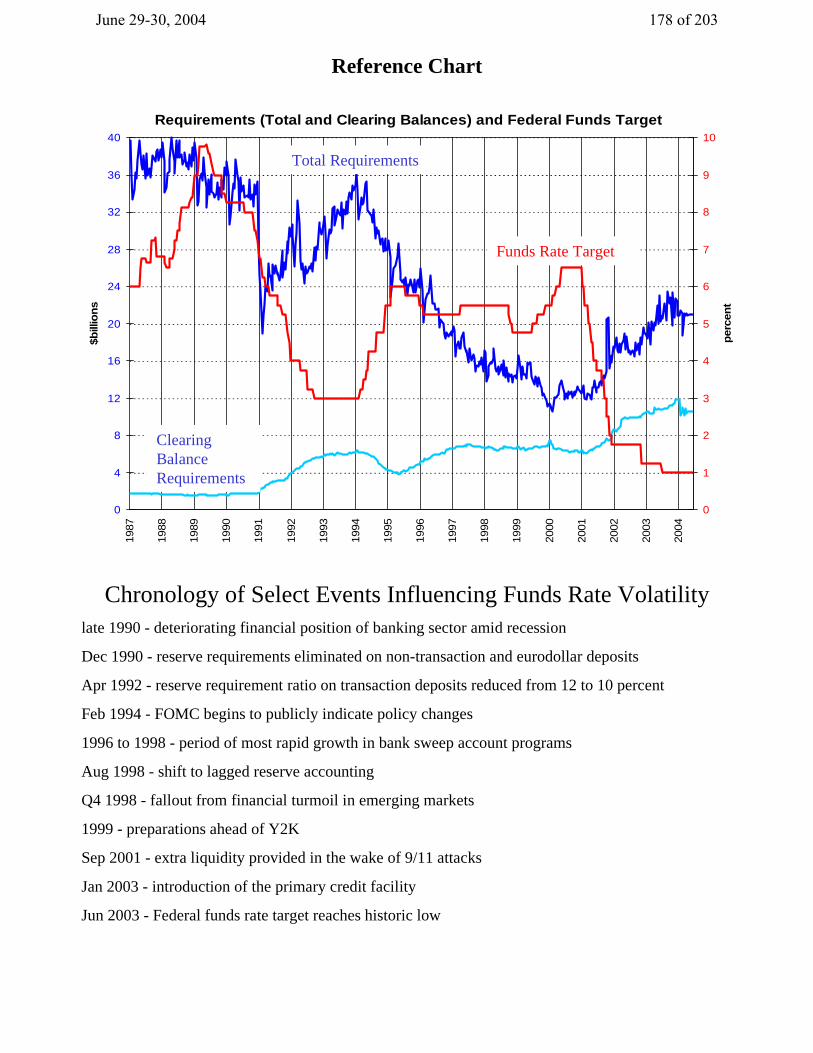
Requirements (Total and Clearing Balances) and Federal Funds Target
0
4
8
12
16
20
24
28
32
36
4019
87
1988
1989
1990
1991
1992
1993
1994
1995
1996
1997
1998
1999
2000
2001
2002
2003
2004
$bill
ions
0
1
2
3
4
5
6
7
8
9
10
perc
ent
Total Requirements
ClearingBalanceRequirements
Funds Rate Target
Chronology of Select Events Influencing Funds Rate Volatilitylate 1990 - deteriorating financial position of banking sector amid recession
Dec 1990 - reserve requirements eliminated on non-transaction and eurodollar deposits
Apr 1992 - reserve requirement ratio on transaction deposits reduced from 12 to 10 percent
Feb 1994 - FOMC begins to publicly indicate policy changes
1996 to 1998 - period of most rapid growth in bank sweep account programs
Aug 1998 - shift to lagged reserve accounting
Q4 1998 - fallout from financial turmoil in emerging markets
1999 - preparations ahead of Y2K
Sep 2001 - extra liquidity provided in the wake of 9/11 attacks
Jan 2003 - introduction of the primary credit facility
Jun 2003 - Federal funds rate target reaches historic low
Reference Chart
June 29-30, 2004 178 of 203

Appendix 4: Materials used by Messrs. Oliner, Wilcox, and Sheets
June 29-30, 2004 179 of 203
STRICTLY CONFIDENTIAL (FR) CLASS I-FOMC*
Material for
Staff Presentation on the Economic Outlook
June 30, 2004
*Downgraded to Class II upon release of the July 2004 Monetary Policy Report.
June 29-30, 2004 180 of 203
June 29-30, 2004 181 of 203
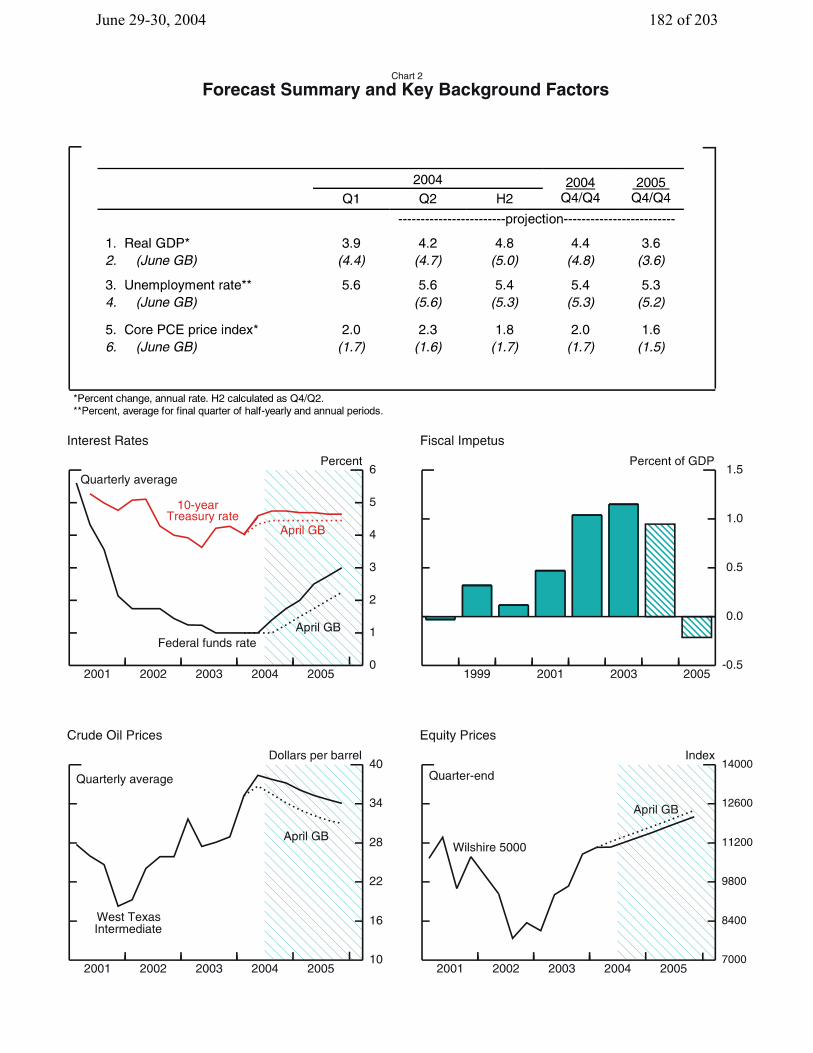
June 29-30, 2004 182 of 203
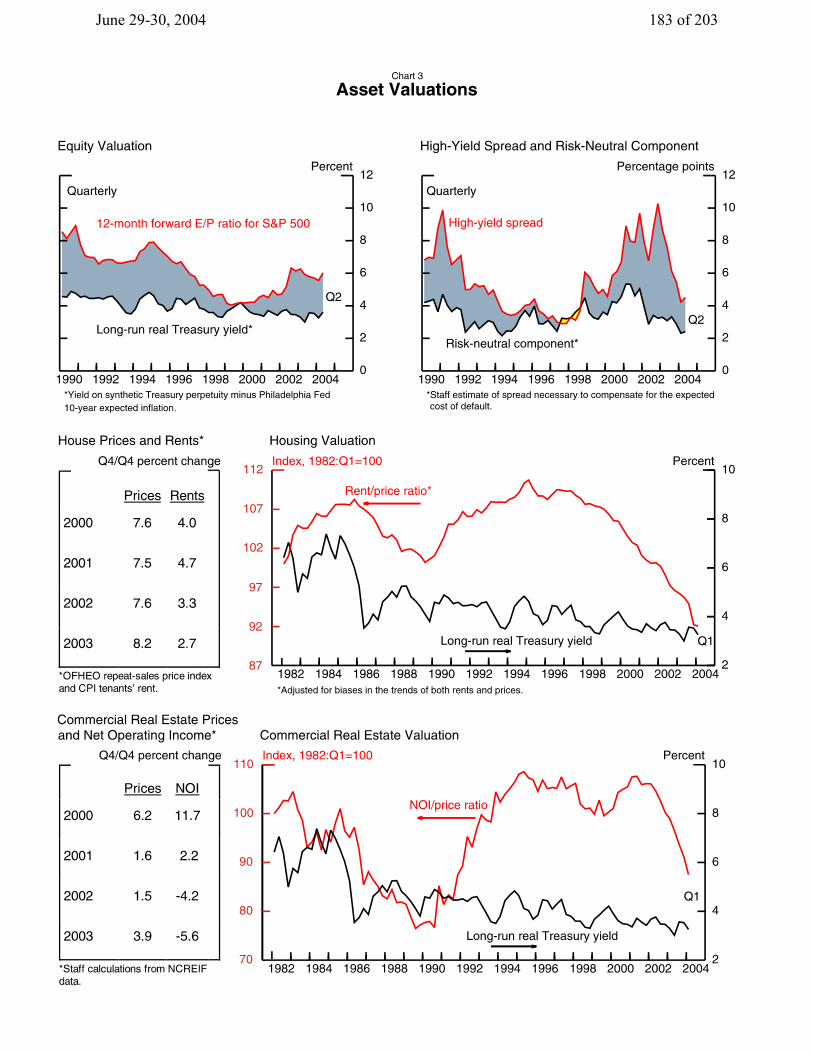
June 29-30, 2004 183 of 203
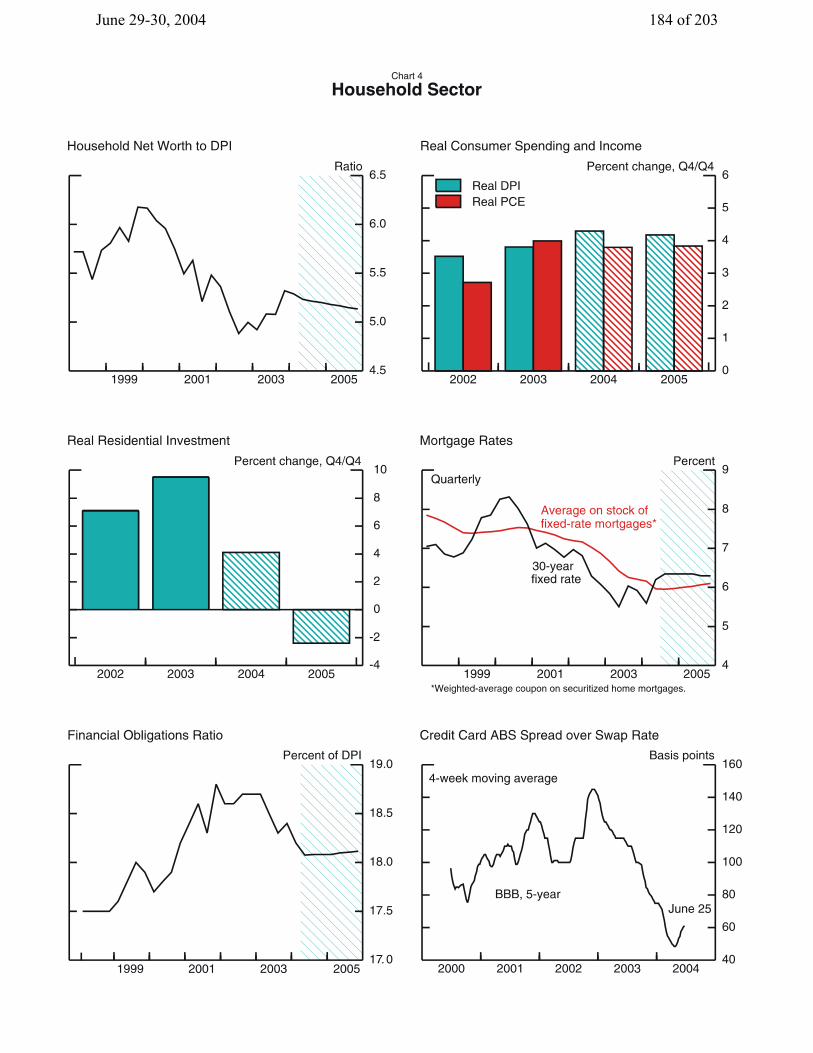
June 29-30, 2004 184 of 203
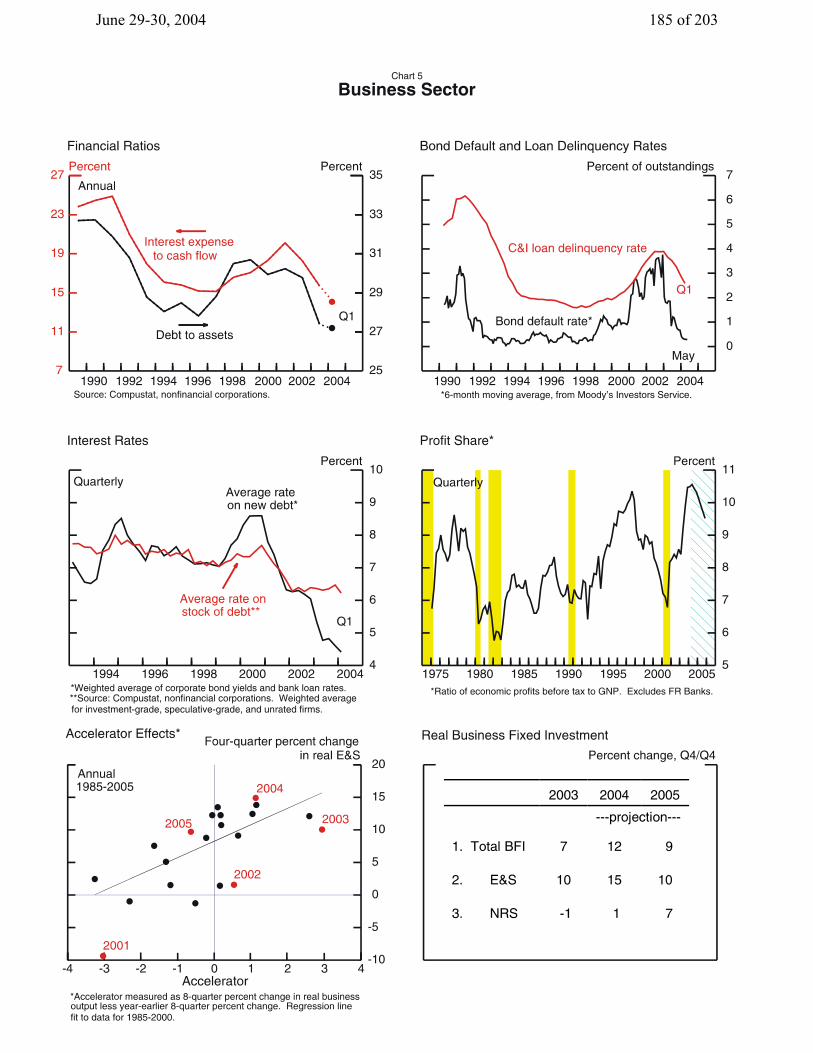
June 29-30, 2004 185 of 203
June 29-30, 2004 186 of 203
June 29-30, 2004 187 of 203
June 29-30, 2004 188 of 203
June 29-30, 2004 189 of 203
June 29-30, 2004 190 of 203
June 29-30, 2004 191 of 203
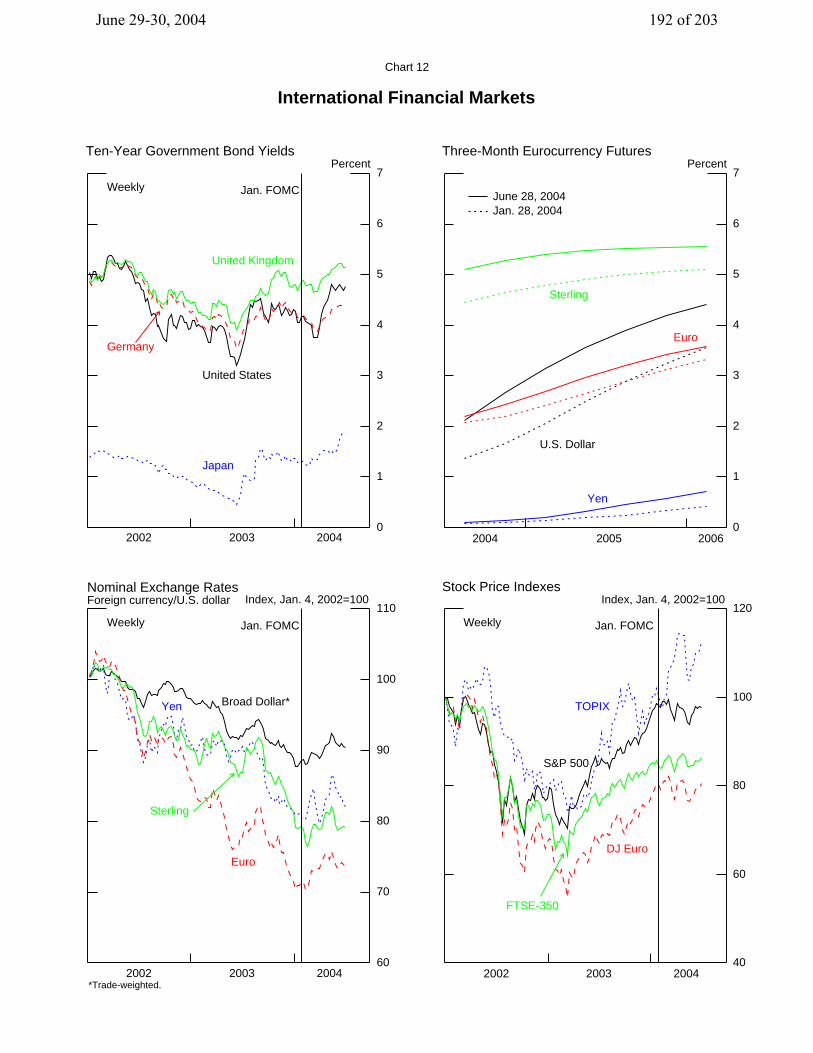
Chart 12
International Financial Markets
0
1
2
3
4
5
6
7
United States
Germany
Japan
United Kingdom
2002 2003 2004
Jan. FOMCWeekly
Ten-Year Government Bond YieldsPercent
0
1
2
3
4
5
6
7
2004 2005 2006
U.S. Dollar
Euro
Sterling
Yen
June 28, 2004Jan. 28, 2004
Three-Month Eurocurrency FuturesPercent
60
70
80
90
100
110
Nominal Exchange RatesForeign currency/U.S. dollar
2002 2003 2004
Broad Dollar*Yen
Euro
Sterling
Jan. FOMC
*Trade-weighted.
Weekly
Index, Jan. 4, 2002=100
40
60
80
100
120
S&P 500
DJ Euro
TOPIX
FTSE-350
2002 2003 2004
Jan. FOMCWeekly
Stock Price IndexesIndex, Jan. 4, 2002=100
June 29-30, 2004 192 of 203
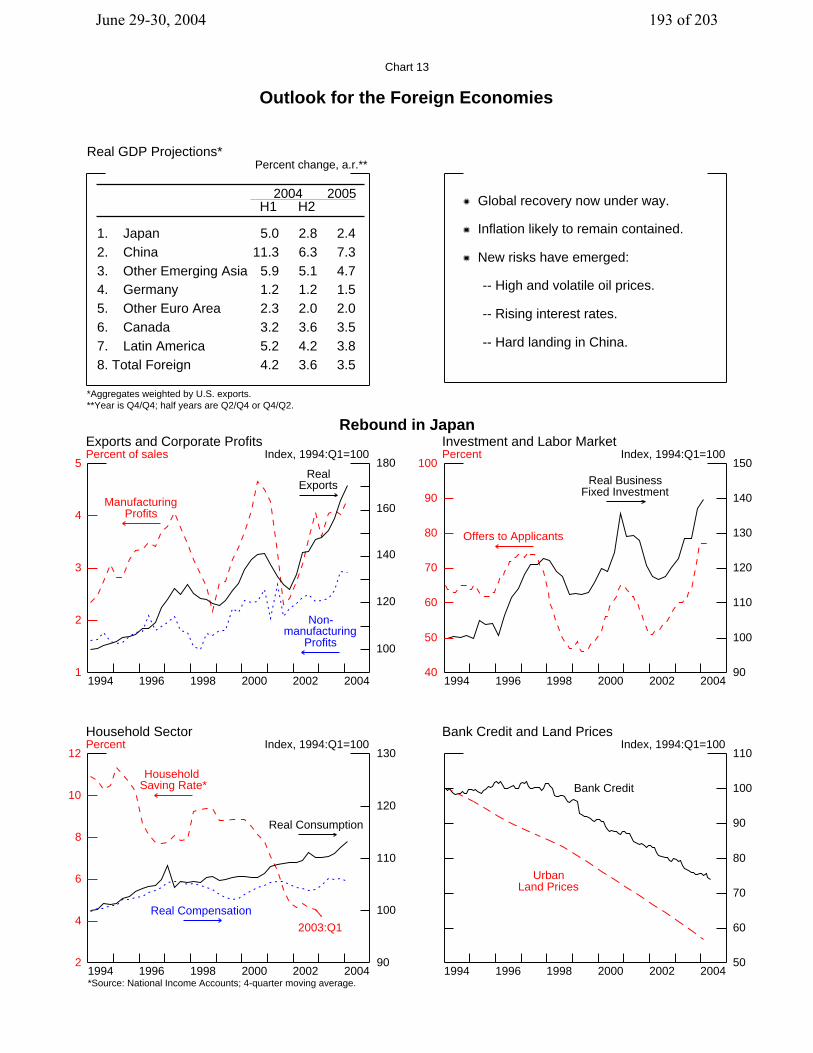
Chart 13
Outlook for the Foreign Economies
Global recovery now under way.
Inflation likely to remain contained.
New risks have emerged:
-- High and volatile oil prices.
-- Rising interest rates.
-- Hard landing in China.
1994 1996 1998 2000 2002 20041
2
3
4
5Real
Exports
ManufacturingProfits
Non-manufacturing
Profits 100
120
140
160
180
Rebound in Japan Exports and Corporate Profits Percent of sales Index, 1994:Q1=100
1994 1996 1998 2000 2002 200440
50
60
70
80
90
100
90
100
110
120
130
140
150
Real BusinessFixed Investment
Offers to Applicants
Investment and Labor Market Percent Index, 1994:Q1=100
1994 1996 1998 2000 2002 20042
4
6
8
10
12
90
100
110
120
130
*Source: National Income Accounts; 4-quarter moving average.
Real Consumption
Real Compensation
Household Saving Rate*
2003:Q1
Household Sector Percent Index, 1994:Q1=100
1994 1996 1998 2000 2002 200450
60
70
80
90
100
110
Bank Credit
UrbanLand Prices
Bank Credit and Land PricesIndex, 1994:Q1=100
Real GDP Projections* Percent change, a.r.**
*Aggregates weighted by U.S. exports.**Year is Q4/Q4; half years are Q2/Q4 or Q4/Q2.
H1 H2
1. Japan 5.0 2.8 2.42. China 11.3 6.3 7.33. Other Emerging Asia 5.9 5.1 4.74. Germany 1.2 1.2 1.55. Other Euro Area 2.3 2.0 2.06. Canada 3.2 3.6 3.57. Latin America 5.2 4.2 3.88. Total Foreign 4.2 3.6 3.5
2004 2005
June 29-30, 2004 193 of 203
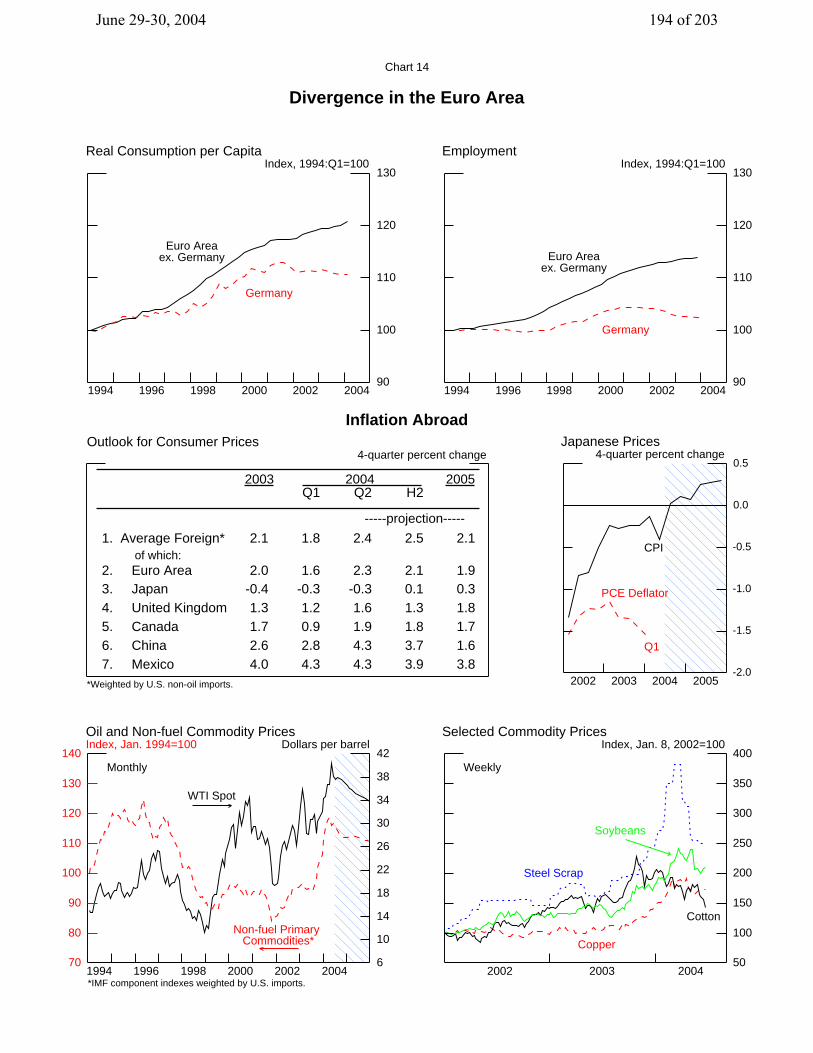
Chart 14
Divergence in the Euro Area
1994 1996 1998 2000 2002 200490
100
110
120
130
Euro Areaex. Germany
Germany
Real Consumption per CapitaIndex, 1994:Q1=100
1994 1996 1998 2000 2002 200490
100
110
120
130
Euro Areaex. Germany
Germany
EmploymentIndex, 1994:Q1=100
2002 2003 2004 2005-2.0
-1.5
-1.0
-0.5
0.0
0.5
CPI
PCE Deflator
Q1
Japanese Prices4-quarter percent change
1994 1996 1998 2000 2002 200470
80
90
100
110
120
130
140
6
10
14
18
22
26
30
34
38
42
*IMF component indexes weighted by U.S. imports.
WTI Spot
Non-fuel Primary Commodities*
Monthly
Oil and Non-fuel Commodity Prices Index, Jan. 1994=100 Dollars per barrel
50
100
150
200
250
300
350
400
Steel Scrap
Soybeans
Copper
Cotton
2002 2003 2004
Weekly
Selected Commodity PricesIndex, Jan. 8, 2002=100
Outlook for Consumer Prices4-quarter percent change
*Weighted by U.S. non-oil imports.
Q1 Q2 H2
1. Average Foreign* 2.1 1.8 2.4 2.5 2.1
2. Euro Area 2.0 1.6 2.3 2.1 1.93. Japan -0.4 -0.3 -0.3 0.1 0.34. United Kingdom 1.3 1.2 1.6 1.3 1.85. Canada 1.7 0.9 1.9 1.8 1.76. China 2.6 2.8 4.3 3.7 1.67. Mexico 4.0 4.3 4.3 3.9 3.8
Inflation Abroad
2003 2005
of which:
2004
-----projection-----
June 29-30, 2004 194 of 203

Chart 15
Debt Burdens
2000 2001 2002 2003 200470
80
90
100
110
120
130
140
*Bank loans and securities; percent of GDP.
Euro Area
Japan
UnitedKingdom
Corporate Sector Debt*Index, 2000:Q1=100
2000 2001 2002 2003 200470
80
90
100
110
120
130
140
*Percent of GDP.
UnitedKingdom
Japan
Euro Area
Household Debt*Index, 2000:Q1=100
1999 2000 2001 2002 2003 20040
500
1000
1500
2000
2500
0
300
600
900
1200
1500
Brazil
Mexico
EMBI+
Weekly
Vulnerabilities in Latin America EMBI+ Spreads Basis points Basis points
1994 1996 1998 2000 2002 2004-5
0
5
10
15
20
25
30
*12-month moving average. **4-quarter moving average.
Gross*
Net ofRepayments**
May
Q1
Latin American Debt IssuanceBillions of dollars
*End of period.
Current Account(% of GDP)
Gross External Debt*(% of GDP)
Reserves*($ billions)
Short-term External Debt*(% of reserves)
1993 2003 1993 2003 1993 2003 1993 2003
1. Mexico -5.8 -1.5 33.9 20.8 22.6 59.0 116.8 64.7
2. Chile -5.7 -0.8 34.0 48.1 9.6 16.0 50.9 64.7
3. Brazil -0.0 0.8 32.3 48.8 32.2 50.5 106.6 81.8
4. Argentina -3.2 6.1 31.0 114.1 13.8 14.6 101.2 177.9
Vulnerability Indicators
June 29-30, 2004 195 of 203
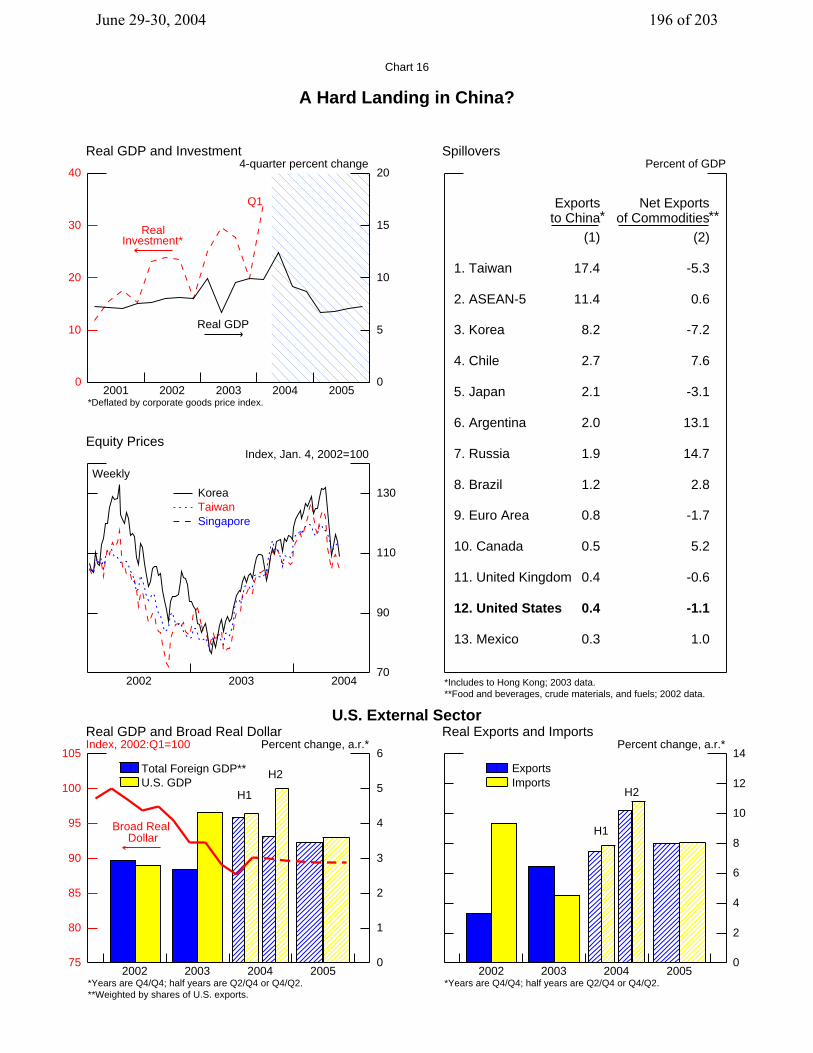
Chart 16
A Hard Landing in China?
2001 2002 2003 2004 20050
10
20
30
40
0
5
10
15
20
*Deflated by corporate goods price index.
RealInvestment*
Real GDP
Q1
Real GDP and Investment4-quarter percent change
*Includes to Hong Kong; 2003 data.**Food and beverages, crude materials, and fuels; 2002 data.
* **Exports Net Exports
to China of Commodities(1) (2)
1. Taiwan 17.4 -5.3
2. ASEAN-5 11.4 0.6
3. Korea 8.2 -7.2
4. Chile 2.7 7.6
5. Japan 2.1 -3.1
6. Argentina 2.0 13.1
7. Russia 1.9 14.7
8. Brazil 1.2 2.8
9. Euro Area 0.8 -1.7
10. Canada 0.5 5.2
11. United Kingdom 0.4 -0.6
12. United States 0.4 -1.1
13. Mexico 0.3 1.0
SpilloversPercent of GDP
2002 2003 200470
90
110
130
Weekly
KoreaTaiwanSingapore
Equity PricesIndex, Jan. 4, 2002=100
2002 2003 2004 200575
80
85
90
95
100
105
0
1
2
3
4
5
6
*Years are Q4/Q4; half years are Q2/Q4 or Q4/Q2.**Weighted by shares of U.S. exports.
Total Foreign GDP**U.S. GDP
H1
H2
Broad Real Dollar
U.S. External Sector Real GDP and Broad Real Dollar Index, 2002:Q1=100 Percent change, a.r.*
2002 2003 2004 20050
2
4
6
8
10
12
14
*Years are Q4/Q4; half years are Q2/Q4 or Q4/Q2.
H1
H2
ExportsImports
Real Exports and ImportsPercent change, a.r.*
June 29-30, 2004 196 of 203
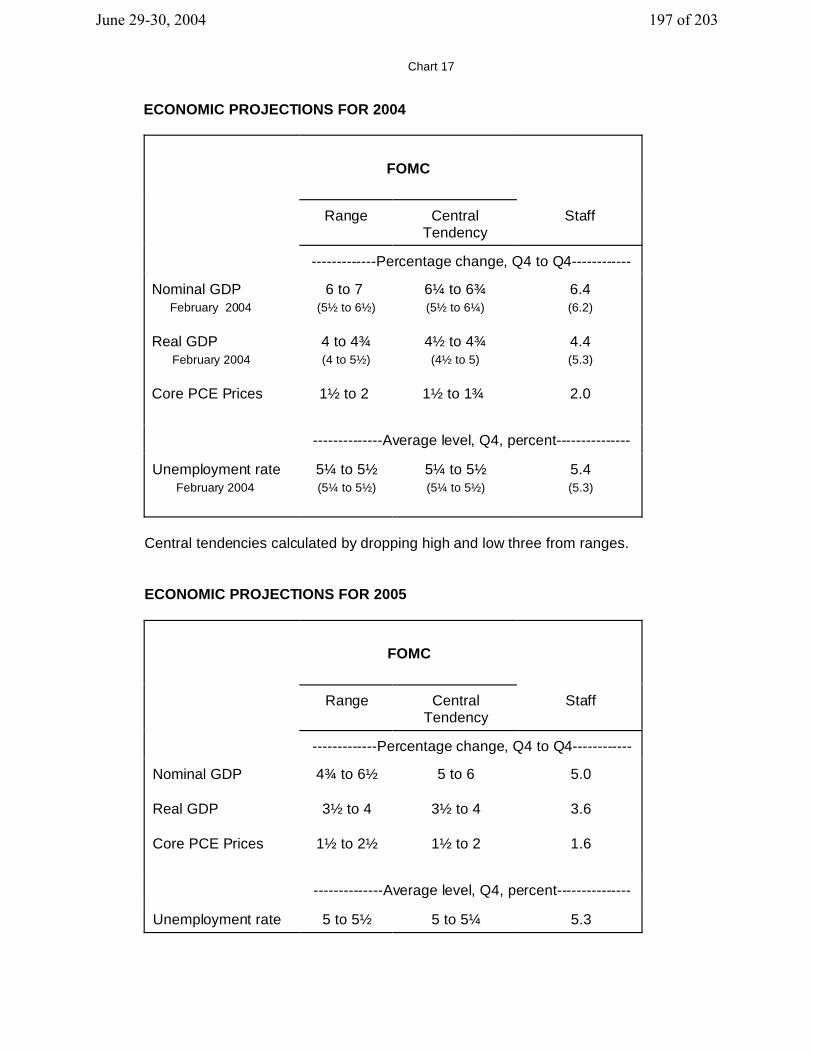
Chart 17
ECONOMIC PROJECTIONS FOR 2004
FOMC
Range CentralTendency
Staff
-------------Percentage change, Q4 to Q4------------
Nominal GDP February 2004
Real GDP February 2004
Core PCE Prices
6 to 7 (5½ to 6½)
4 to 4¾(4 to 5½)
1½ to 2
6¼ to 6¾(5½ to 6¼)
4½ to 4¾(4½ to 5)
1½ to 1¾
6.4(6.2)
4.4(5.3)
2.0
--------------Average level, Q4, percent---------------
Unemployment rate February 2004
5¼ to 5½(5¼ to 5½)
5¼ to 5½(5¼ to 5½)
5.4(5.3)
Central tendencies calculated by dropping high and low three from ranges.
ECONOMIC PROJECTIONS FOR 2005
FOMC
Range CentralTendency
Staff
-------------Percentage change, Q4 to Q4------------
Nominal GDP Real GDP
Core PCE Prices
4¾ to 6½
3½ to 4
1½ to 2½
5 to 6
3½ to 4
1½ to 2
5.0
3.6
1.6
--------------Average level, Q4, percent---------------
Unemployment rate 5 to 5½ 5 to 5¼ 5.3
June 29-30, 2004 197 of 203

Appendix 5: Materials used by Mr. Reinhart
June 29-30, 2004 198 of 203
June 29-30, 2004 199 of 203
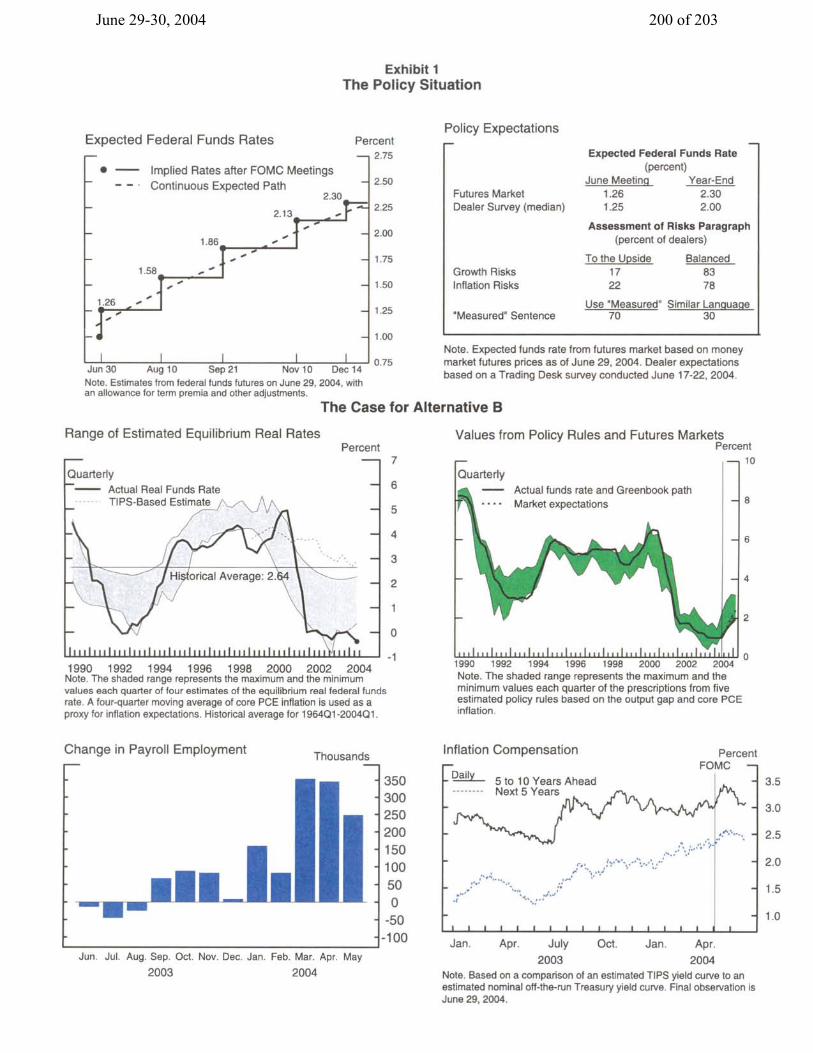
June 29-30, 2004 200 of 203
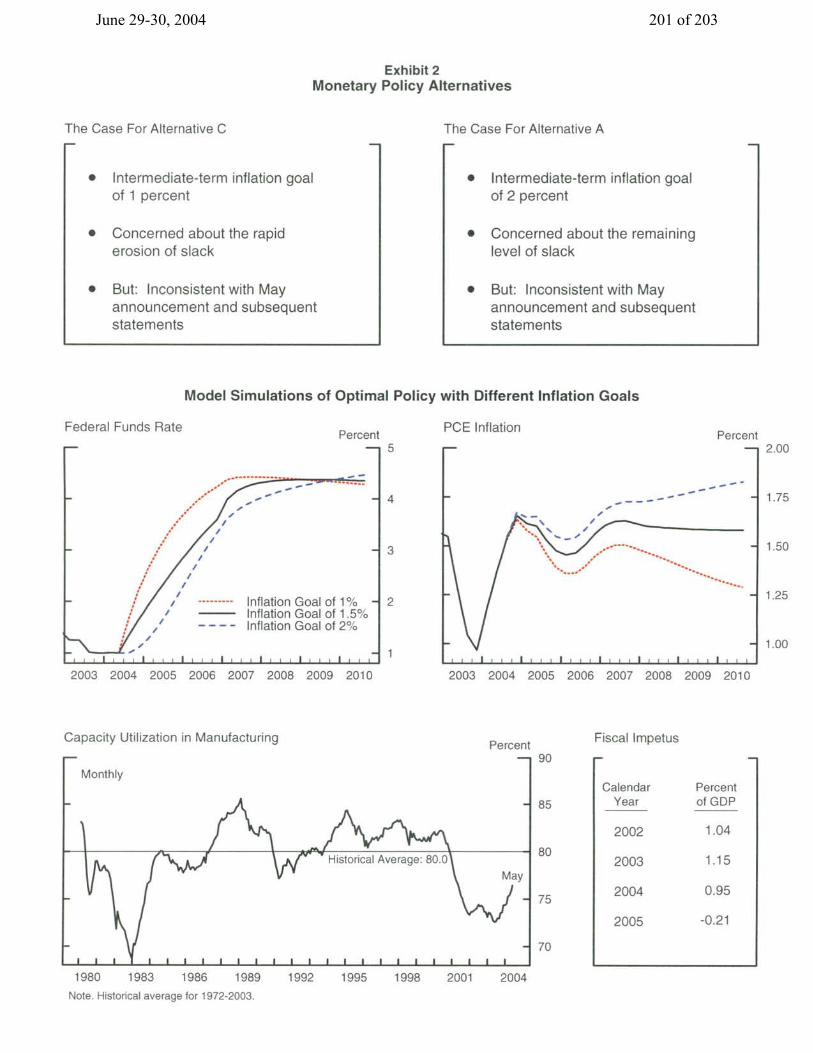
June 29-30, 2004 201 of 203
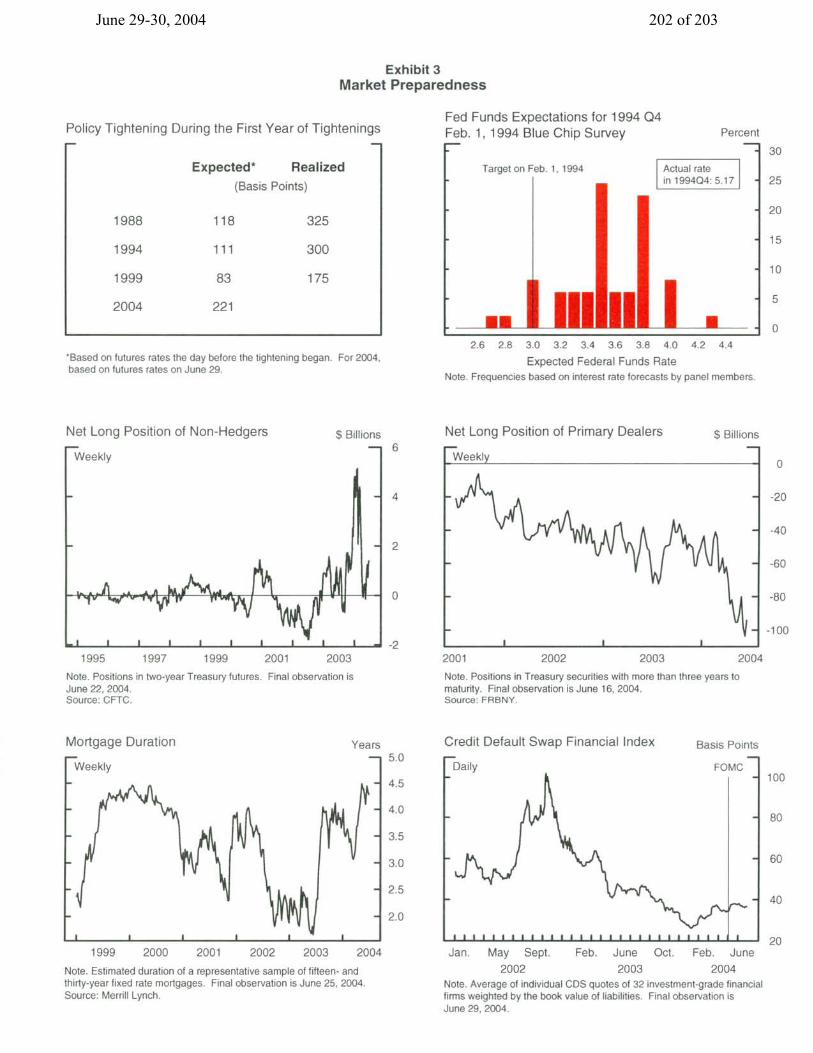
June 29-30, 2004 202 of 203
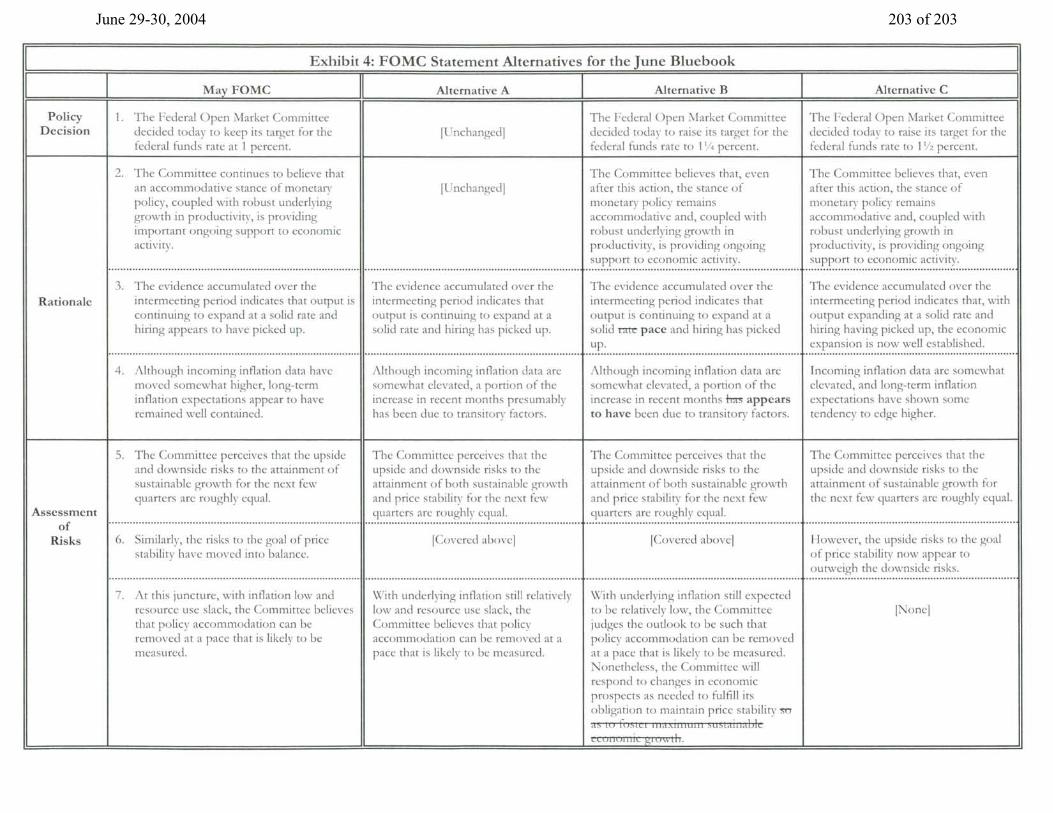
June 29-30, 2004 203 of 203