Embed Size (px)
Citation preview

1
Appendix 1: Economic and Social Capacity Analysis of the Working Lands Watershed Restoration Program
Survey Findings
Prepared for the Minnesota Board of Soil and Water Resources
January 3, 2018
Amit K Pradhananga
Center for Changing Landscapes
Lucia Levers
Jeffrey Peterson
Water Resources Center
University of Minnesota

2
Study design and methods The study was conducted through a self-administered mail survey of a stratified, random sample of agricultural landowners in six Minnesota watersheds: Buffalo River, Chippewa River, LeSueur River, Minnesota River- Mankato, Root River, and Sauk River watersheds. Lists of property owners who live in the six watersheds were obtained from the counties within the watersheds. The lists were based on publicly available county tax records. The list contained landowner names, addresses, and tax classification codes. The tax classification codes, when available, were used to identify agricultural landowners. A random sample of 500 agricultural landowners from each watershed was selected, for a total of 3000 agricultural landowners. The survey was administered from August through December 2017. Survey instruments were designed based on extensive literature review and feedback from project partners. The survey questionnaire included a variety of fixed-choice and scale questions. Several questions were adapted from survey instruments used in previous studies of attitudes, beliefs and values of conservation behaviors (Pradhananga and Davenport, 2017; Pradhananga, Perry, & Davenport, 2014; Davenport, Pradhananga, & Olson, 2014; Davenport & Pradhananga, 2012). Each questionnaire was labeled with a unique identification number to track responses for subsequent mailings. An adapted Dillman's (2014) Tailored Design Method was used to increase response rates. The survey was administered in three waves. Each wave of mailing included the questionnaire, a cover letter, a fact sheet about perennial and cover crops, and a self-addressed, business reply envelope. Returned questionnaires were logged into the respondent database. Response data were numerically coded and entered into a database using Microsoft Excel 2010. Statistical analyses were conducted using Statistical Package for Social Sciences (SPSS release 21.0). Basic descriptive statistics were conducted to determine frequency distributions of individual variables. Inferential statistics were conducted to test for significant differences between respondent subgroups. Subgroup comparisons were conducted by age groups (28 – 63, vs. over 64 years of age), percent income dependent on agriculture (less than 50% vs. 50% or more), land tenure (property owners vs. renters), and land size (small, including respondents who farmed fewer than 200 acres vs. large, including respondents who farmed 200 acres or more in 2016). Respondent subgroups were compared for differences in their familiarity with perennial or cover crops (survey question 14), current use of perennial or cover crops (survey question 15), and likelihood of planting perennial or cover crops on their farm in the next five years (survey question 17). Appropriate inferential statistical tests (t-tests for familiarity and likelihood of future use, and chi-square test for past use of perennial or cover crops) were conducted.

3
Summary of findings Overall, 430 respondents completed and returned the questionnaire for a response rate of 17.4%. The findings are organized into four sub-sections. Complete statistics for all survey questions in aggregate are presented in tabular form in Appendix A. Summary statistics for key survey questions (familiarity with, past use, and likelihood of future use of perennial and cover crops) by watershed are presented in tabular form in Appendix B. Findings from subgroup comparisons are presented in tabular form in Appendix C.
1. Respondent profile
• Most respondents were male (91%), and white (100%) with a median age of 63 (Appendix A, Table 2).
• About half of the respondents have at least an associate or vocational degree (56%), and a majority (56%) reported total household income of over $75,000 (Appendix A, Table 2).
• Farming experience, in years of farming, ranged between 0 and 100, with a median of 33 years (Appendix A, Table 2).
• Almost two-thirds of respondents (64%) make their own decisions on their farm, and 43% of respondents reported that over 50% of their income is dependent on agricultural production (Appendix A, Table 3).
• Median acres farmed in 2016 was 185 acres (Appendix A, Table 4).
2. Familiarity with perennial or cover crops
On average, respondents are most familiar with alfalfa (Mean = 1.46), followed by annual cover crops and small grains (Mean = 1.05). Over three-fourths of respondents reported that they are moderately to very familiar with alfalfa (75%). In contrast, a majority of respondents reported that they are not at all familiar with kernza (67%) and winter-hardy oilseeds such as camelina and field pennycress (73%) (Appendix A, Table 12, Figure 1).
• A majority of respondents in
each watershed reported that they are somewhat to very familiar with alfalfa
0% 20% 40% 60% 80% 100%
Alfalfa
Annual cover crops and smallgrains for soil health or…
Mixed grazing and foragecrops
Perennial grasses
Kernza
Winter-hardy oilseeds ascover or relay crop
Very Moderately Slightly Not at all
Figure 1. Respondents' familiarity with perennial or cover crops (n ≥ 407)

4
(68% in Buffalo River, 83% in Sauk River and Minnesota River-Mankato watersheds) (Appendix B, Table 1). Most respondents were not at all familiar with winter-hardy oilseeds in all watersheds (66% in Buffalo River, 85% in Sauk River) (Appendix B, Table 2).
• Some notable differences emerged between respondents who depend on agricultural production for less than 50% of their income and 50% or more of their income in their familiarity with perennial or cover crops. On average, respondents who depend on agricultural production for 50% or more of their income are more familiar with alfalfa (Mean, 50% or more of income = 2.34, Less than 50% income = 2.04) and annual cover crops and small grains (Mean, 50% or more of income = 1.60, Less than 50% income = 1.36) than respondents who depend on agricultural production for less than 50% of their income (Appendix C, Table 5).
• Differences also emerged between farm owners and renters in their familiarity with perennial or cover crops. Renters were more familiar with mixed grazing and forage crops (Renters mean = 1.33, Owners mean = 1.12) and annual cover crops and small grains (Renters mean = 1.64, Owners mean = 1.37) than farm owners (Appendix C, Table 8).
• There were statistically significant differences between small and large landowners (small = fewer than 200 acres farmed, large = 200 acres or more farmed). Large landowners are more familiar with mixed grazing and forage crops (Large mean = 1.38, Small mean = 0.98), annual cover crops and small grains (Large mean = 1.62, Small mean = 1.31), and winter-hardy oilseeds (Large mean = 0.44, Small mean = 0.27) than small landowners (Appendix C, Table 11, Figure 2).
Figure 2. Mean ratings of respondents' familiarity with perennial and cover crops by land size Responses on a four-point scale from not at all familiar (0) to very familiar (3)
Leve
l of f
amili
arity
(n = 202) (n = 191)
0
1
2
3
Mixed grazing andforage crops
Annual covercrops and small
grains
Winter-hardyoilseeds
Small landowners Large landowners

5
3. Past use of perennial or cover crops
• A majority of respondents reported that they have not planted any of the six perennial or cover crops on their farm in the past 10 years (Appendix A, Table 13).
• A majority of respondents in Chippewa River (51%), Root River (68%), and Sauk River (63%) watersheds reported that they have planted alfalfa on their farm in the past 10 years. Between 0% (Buffalo River, Minnesota River-Mankato, and Sauk River watersheds) and 10% (Chippewa River watershed) reported that they have planted Kernza on their farm in the past 10 years. Similarly, very few respondents (between 0% to 5%) of respondents across the watersheds reported that they have planted winter-hardy oilseeds on their farm in the past 10 years (Appendix B, Table 3, Figure 3).
• Important differences were identified among respondents by age group (i.e., 28-63 vs. 64 or more) in their use of perennial or cover crops in the past 10 years. A greater proportion of respondents between the ages of 28 to 63 reported planting mixed grazing and forage crops (32%) , and annual cover crops and small grains (36%) than respondents who are 64 years or older (Appendix C, Table 3).
• There were statistical differences between respondents who depend on agricultural production for less than 50% of their income and 50% or more of their income in their use of perennial or cover crops. A greater proportion of respondents who depend on agricultural production for 50% or more of their income (35%) reported planting annual cover crops and small grains on their farm than respondents who depend on agricultural production for less than 50% of their income (22%) (Appendix C, Table 6).
• Statistical differences also emerged between respondents who own and rent their land. A greater proportion of respondents who rented their land for farming (34%) reported planting annual cover crops and small grains than respondents who own the land they farmed (24%) (Appendix C, Table 9).
• Similarly, there was a statistically significant difference between small and large landowners in their use of perennial or cover crops. A greater proportion of large landowners (35%) reported planting annual cover crops and small grains than small landowners (22%) (Appendix C, Table 12).

6
0% 50% 100%
Buffalo River
Chippewa River
LeSueur River
MN River- Mankato
Root River
Sauk River
Alfalfa
0% 50% 100%
Buffalo River
Chippewa River
LeSueur River
MN River- Mankato
Root River
Sauk River
Kernza
0% 50% 100%
Buffalo River
Chippewa River
LeSueur River
MN River- Mankato
Root River
Sauk River
Annual cover crops and small grains
0% 50% 100%
Buffalo River
Chippewa River
LeSueur River
MN River- Mankato
Root River
Sauk River
Perennial grasses
0% 50% 100%
Buffalo River
Chippewa River
LeSueur River
MN River- Mankato
Root River
Sauk River
Mixed grazing and forage crops
0% 50% 100%
Buffalo River
Chippewa River
LeSueur River
MN River- Mankato
Root River
Sauk River
Winter-hardy oilseeds
Figure 3. Percent of respondents who have planted perennial or cover crops on their farm in the past 10 years

7
4. Likelihood of future use of perennial or cover crops
Over one-third of respondents (39%) are somewhat to very likely to plant alfalfa on their farm in the next five years. Most respondents reported that they are somewhat to very unlikely to plant perennial or cover crops such as winter-hardy oilseeds (70%), kernza (70%), and perennial grasses (63%) (Appendix A, Table 16, Figure 4).
• While a majority of respondents in Root River (59%) and Sauk River (57%) reported that they are somewhat to very likely to plant alfalfa on their farm in the next five years, between 20% (LeSueur River) and 42% (Chippewa River) reported that they are somewhat to very likely to plant alfalfa on their farm (Appendix B, Table 4). Most respondents across all watersheds reported that they are somewhat to very unlikely to plant crops such as winter-hardy oilseeds, and kernza (Appendix B, Tables 4 and 5).
• Statistical differences emerged among respondents by age group. Respondents who are 64 years or older (Mean = -0.74) on average reported that they are less likely to plant annual cover crops and small grains than respondents between the ages of 28 and 63 (Mean = -0.34) (Appendix C, Table 2).
• Respondents who depend on agricultural production for 50% or more of their income (Mean = -1.01) were less likely to plant perennial grasses than respondents who depend on agricultural production for less than 50% of their income (Mean = -0.71) (Appendix C, Table 5).
• Respondents who own their farm (Mean = -0.70), on average, were less likely to plant annual cover crops and small grains in the next five years than respondents who rent their farm (Mean = -0.36) (Appendix C, Table 8).
• Small landowners (Mean = -0.69), on average, reported that they are less likely to plant annual cover crops and small grains in the next five years than large landowners (Mean = -0.36) (Appendix C, Table 11).
0% 20% 40% 60% 80% 100%
Alfalfa
Annual cover crops and smallgrains for soil health or
grazing
Mixed grazing and foragecrops
Perennial grasses
Kernza
Winter-hardy oilseeds ascover or relay crop
Likely Neither likely nor unlikely Unlikely
Figure 4. Respondents’ likelihood of planting perennial or cover crops on their farm in the next five years (n ≥ 399)

8
5. Barriers to conservation program participation
On average, the “red tape” involved in conservation programs, long term commitment required for conservation programs, and payments that are not high enough to account for the risk of changing their system were the top three barriers for respondents’ participation in conservation programs. A majority of respondents (61%) somewhat to strongly agreed that there is too much “red tape” involved in conservation programs. Most respondents somewhat to strongly agreed that conservation programs require long term commitment (51%) and that payments are not high enough to account for the risk of changing their system (51%) (Appendix A, Table 10, Figure 5).
Figure 5. Respondents’ perceived barriers to conservation program participation (n ≥ 385)
6. Factors influencing perennial/cover crop adoption
On average, financial incentives appear to be the most important motivation for future use of perennial or cover crops. A majority of respondents reported that they are somewhat to very likely to plant perennial or cover crops if they could get higher payments (61%) and tax benefits (61%) for planting the crops, and if they were compensated for lost crop production (58%). Most respondents were also more likely to plant perennial or cover crops if there were markets available to sell the crops (52%). Reducing complexity and increasing flexibility of conservation programs also appear to be important motivators for respondents. Most respondents were somewhat to very likely to plant perennial or cover crops in the next five years if conservation program requirements were less complex (51%). About half of the respondents (50%) were more likely to plant perennial or cover crops if conservation programs were more flexible (Appendix A, Table 21, Figure 6).
0%
20%
40%
60%
80%
100%
There is too much "red tape"involved in conservation
programs
Conservation programsrequire long term
commitment
Payments are not highenough to account for therisk of changing my system
Agree Neither agree nor disagree Disagree

9
Figure 6. Respondents' motivations for planting perennial or cover crops on their farm in the next five years (n ≥ 371)
Summary of Preliminary Statistical Analysis The survey provided information on potential crop subsidy programs and collected data on whether survey takers would be willing to participate in programs of varying subsidy amount, contract length, and species. Overall, the results indicate that farmers would be willing to accept a substantially lower payment to grow cover crops, than they would be to grow an alternative crop.
For Question 22, the survey collected data on participating in a five year contract for winter cover crops. Survey-takers were asked which crops they would consider, and how much land they would enroll for a net gain of a certain amount.
For Question 23, the survey collected data on perennial crop alternatives programs. Survey-takers were asked three questions comparing two different programs. For example, one question that some survey takers received asked if they would choose a program for $50/acre with a 5 year contract length, a program for $150/acre with a 15 year contract length, or none. We also collected data on which alternative crop(s) survey takers would be likely to grow on their unproductive land. We have produced the following preliminary results:
0%
20%
40%
60%
80%
100%
I could gethigher
payments forplanting the
crops
I could get taxbenefits forplanting the
crops
I wascompensatedfor lost cropproduction
There weremarkets
available to sellthe crops
Conservationprogram
requirementswere lesscomplex.
Conservationprograms weremore flexible.
Likely Neither likely nor unlikely Unlikely

10
7. Question 22: Winter Cover Crops
Participation in a program to grow winter cover crops was dependent on the additional net benefit the survey-taker would receive, as well as the crop they would consider. Oilseeds required a higher payment than annual cover crops or other crops. See Figure 7.
• $20 per acre would not result in significant program participation. • $35 would result in between 53 and 97 acres per farm. • $50 would result in between 128 and 225 acres per farm. See Figure 1.
Figure 7. Acres per farm that a farmer would enroll in a winter cover crop program dependent on crop considered (Annual cover crops and small grains, Winter-hardy oilseeds, or other) and additional net value received ($20, $35, or $50).
0
50
100
150
200
250
Annuals Oilseeds Other
Acre
s per
Far
m
20 35 50

11
8. Question 23: Alternative Perennial Crops
Participation in a program to grow alternative crops was dependent on the crop considered, as well as contract length and program price. Those who considered Kernza were most likely to participate in a program when compared to survey takers who stated they would consider growing alfalfa, perennial grasses, or mixed forbs. However, 95% confidence intervals are quite large (Mixed: [3.9, 14.8], Kernza: [4.3,308.3], Perennial:[4.5, 14.7], Alfalfa: [3.7,10.9]). See Figure 8. These results were obtained with a logistical regression, predicting the likelihood of any contract acceptance dependent on crop considered (Question 23D).
When survey-takers would consider growing perennial grasses vs. not, they were more likely to choose longer contract lengths. Shorter contracts were preferred when survey-takers considered growing mixed forages or Kernza (these results were only for those who would choose to participate in specific subsidy programs). See Figure 9. These results were obtained with a logistical regression performed on subsets of specific crops (Question 23D), predicting the likelihood of contract acceptance dependent on contract length.
The predicted payment survey-takers would accept to grow alternative crops (willingness to accept) was larger when the contract length was longer, if the considered crop was alfalfa or mixed forages. This was not true for perennial grasses. Rates ranged from about $100 to $137 for 5-year contracts, to about $159 to $170 for 15-year contracts. See Figure 10. These results were obtained with a logistical regression performed on subsets of specific crops (Question 23D), predicting the willingness to accept, and dependent on contract length. There were not enough Kernza data points to generate results.
Figure 8. Likelihood ratio of participation vs non-participation given indicated crop choice
0 5 10 15 20 25 30 35 40
Alfalfa Perennial Kernza Mixed

12
Figure 9. Likelihood ratio of choosing short contract lengths (5 yrs) or long contract lengths (15 yrs) when survey-takers would consider specific crops
Table 1: 95% Confidence Intervals for Figure 9
Alfalfa Perennial Kernza Mixed
Short 0.55 1.92 0.32 1.14 0.34 5.64 0.71 3.20 Long 0.49 1.65 0.91 3.39 0.16 1.58 0.36 1.37
Figure 10: Willingness to accept (WTA) contract price as a function of contract length and species considered
0 0.5 1 1.5 2
Short
Long
Alfalfa Perennial Kernza Mixed
020406080
100120140160180
Alfalfa Perennial Mixed
WTA
5 yr 10 yr 15 yr

13
References Davenport, M.A., Pradhananga, A. & Olson, B. (2014). Cannon River watershed: Landowner survey on
water resources and conservation action. Interim Report. 72pp. Davenport, M.A., & Pradhananga, A. (2012). Perspectives on Minnesota water resources: A survey of
Sand Creek and Vermillion River watershed landowners. 84 pp. Dillman, D. A., Smyth, J.D. & Christian, L.M. (2014). Internet, phone, mail, and mixed-mode surveys: the
tailored design method. John Wiley & Sons: Hoboken, NJ. Pradhananga, A. & Davenport, M.A. (2017). An assessment of landowner conservation behavior in
Nicollet County, Minnesota. A final technical report submitted to Nicollet County. 89pp. Pradhananga, A., Perry, V. & Davenport, M.A. (2014). A social science assessment of conservation
practices in the Red River Basin of Minnesota. A final technical report prepared for the Northwest Regional Sustainable Development Partnership. 113pp.

Appendix A: Summary Statistics

Table 1. Response rate by watershed No. of
completed surveys
Response rate
Buffalo River 73 17.0% Chippewa River 81 19.5% LeSueur River 78 18.4% Minnesota River-Mankato 74 16.8% Root River 66 15.6% Sauk River 58 17.1% Total 430 17.4% Table 2. Respondents' sociodemographic characteristics Socio-Demographic Characteristics N Percent Gender Male 367 90.6
Female 38 9.4 Race White 404 100.0
Non-white 0 0.0 Age Median 63.0 -
Minimum 28.0 - Maximum 96.0 -
Years farming Median 33.0 - Minimum 0.0 - Maximum 100.0 -
Formal education Did not finish high school 10 2.5 Completed high school 111 27.5 Some college but no degree 56 13.9 Associate or vocational degree 91 22.5 College bachelor’s degree 78 19.3 Some college graduate work 20 5.0 Completed graduate degree (MS or PhD) 38 9.4
Household income Under $20,000 16 4.5 $20,000-$49,999 62 17.5 $50,000-$74,999 77 21.8 $75,000-$99,999 54 15.3 $100,000-$149,999 64 18.1 $150,000-$199,999 31 8.8 $200,000-$249,999 13 3.7 $250,000-$299,999 7 2.0 $300,000 or more 30 8.5
Source: A study of farming practices in Minnesota, Questions 5, 29, 30, 31, 32, and 33

Table 3. Respondents' property characteristics Property Characteristics N Percent Percent income dependent on agricultural production
0% - 25% 170 41.3 26% - 50% 64 15.5
51% - 75% 36 8.7 76% - 100% 142 34.5 Management decisions on farm I make my own decisions 270 63.5
I leave it up to the landlord 7 1.6 I leave it up to my renter 93 21.9 I hired a land manager 7 1.6 I work together with the renter/landlord to make decisions
48 11.3
Willing to bring livestock on land for grazing
Yes 157 37.6 No 260 62.4
Source: A study of farming practices in Minnesota, Questions 4, 6, and 7 *Respondents could select multiple options Table 4. Respondents' property size and land tenure N Percent Mean Median Total acres farmed in 2016 393 100.0 504.4 185.0 Land tenure*
Acres I farm that I own 277 66.3 414.7 200.0 Acres I farm that I rent 169 40.4 496.5 290.0 Acres I farm that I lease to someone else to farm 171 40.9 217.5 147.0 Acres I own that I don’t farm 105 25.1 243.9 45.0 Other (e.g., buildings, pasture) 24 5.7 134.0 57.5
Source: A study of farming practices in Minnesota, Questions 1 and 2 *Respondents could select multiple options
Table 5. Respondents' acres owned or leased by crop type
Total acres owned
Total acres leased
Total acres owned or
leased Percent of total acres
Corn 53,405.8 34,359.6 87,765.4 41.7 Soybeans 42,061.1 33,345.8 75,406.9 35.9 Wheat 6,018.3 3652.0 9,670.3 4.6 Alfalfa 4,867.3 1459.0 6,326.3 3.0 Forage or grazing crops 3,615.0 1290.0 4,905.0 2.3 Corn silage 2,022.0 671.0 2,693.0 1.3 Sugarbeets 2,924.0 1990.0 4,914.0 2.3 Vegetables 1,045.0 200.0 1,245.0 0.6 Fruits/nuts 97.0 1.0 98.0 0.0 Perennial or cover crops 4,331.0 1465.0 5,796.0 2.8 Conservation programs 6,498.1 1054.0 7,552.1 3.6 Other (e.g., buffer, wetlands, pasture) 3,152.3 695.0 3,847.3 1.8 Total acres 130,036.9 80,182.4 210,219.3 100.0 Source: A study of farming practices in Minnesota, Question 3 Table 6. Respondents' experience with programs that offer financial incentives to farmers for conservation practices N Percent Not relevant for my farm 54 12.7 Never heard of any 29 6.8 Familiar but not enrolled 120 28.2 Enrolled in the past, but not currently enrolled 62 14.6
Currently enrolled 161 37.8 Total 426 100.0 Source: A study of farming practices in Minnesota, Question 8 Table 7. Respondents' conservation expenses in the past 10 years N Percent No conservation expenditure 138 33.2 Less than $5000 138 33.2 $5,000 to $9,999 56 13.5 $10,000 to $19,999 30 7.2 $20,000 to $29,999 16 3.8 $30,000 to $49,999 12 2.9 $50,000 to $74,999 10 2.4 $75,000 to $99,999 5 1.2 $100,000 to $199,999 5 1.2 $200,000 or more 6 1.4 Total 416 100.0 Source: A study of farming practices in Minnesota, Question 9

Table 8. Respondents' participation in conservation programs in the past 10 years Yes No
N % N % Conservation Reserve Program (CRP) 187 46.9 212 53.1 Environmental Quality Incentive Program (EQIP) 57 17.3 273 82.7 State cost-share funds 39 12.2 280 87.8 Conservation Reserve Enhancement Program (CREP) 32 9.8 294 90.2 Conservation Stewardship Program (CSP) 36 8.4 288 67.0 Reinvest in Minnesota (RIM) Reserve Program 26 7.9 32 92.1 Other State conservation programs (e.g., buffer strip, terracing) 11 3.7 286 96.3 Other federal conservation programs (e.g., prairie restoration, erosion control) 8 2.6 300 97.4
Wildlife Habitat Incentive Program (WHIP) 8 2.5 306 97.5 Other local conservation programs (e.g., county buffer, land stewardship) 6 2.0 287 98.0 Source: A study of farming practices in Minnesota, Question 10 Table 9. Respondents' satisfaction with conservation programs
N Meana SD Very
dis
satis
fiedb
Som
ewha
t di
ssat
isfie
d
Nei
ther
satis
fied
nor d
issa
tisfie
d
Som
ewha
t sa
tisfie
d
Very
satis
fied
Conservation Reserve Program (CRP) 212 0.82 1.12 4.2 9.0 21.2 32.1 33.5 Environmental Quality Incentive Program (EQIP) 100 0.55 1.04 5.0 2.0 50.0 19.0 24.0
Conservation Stewardship Program (CSP) 84 0.45 0.88 2.4 2.4 59.5 19.0 16.7 State cost-share funds 87 0.33 1.06 8.0 2.3 56.3 14.9 18.4 Conservation Reserve Enhancement Program (CREP) 75 0.12 0.87 5.3 5.3 72.0 6.7 10.7
Other federal conservation programs (e.g., prairie restoration, erosion control) 58 0.03 0.59 1.7 5.2 86.2 1.7 5.2
Wildlife Habitat Incentive Program (WHIP) 61 0.03 0.71 4.9 3.3 80.3 6.6 4.9 Other State conservation programs (e.g., buffer strip) 63 0.02 0.68 4.8 3.2 82.5 4.8 4.8
Other local conservation programs (e.g., county buffer, land stewardship) 63 0.00 0.78 7.9 0.0 82.5 3.2 6.3
Reinvest in Minnesota (RIM) Reserve Program 80 -0.11 0.98 13.8 5.0 67.5 6.3 7.5 aResponses on a five-point scale from very dissatisfied (-2) to very satisfied (2) bPercent Source: A study of farming practices in Minnesota, Question 11; SD = Standard Deviation

Table 10. Respondents' reported constraints to participation in conservation programs
N Meana SD Stro
ngly
di
sagr
eeb
Som
ewha
t di
sagr
ee
Nei
ther
agr
ee
nor d
isag
ree
Som
ewha
t ag
ree
Stro
ngly
ag
ree
There is too much "red tape" involved in conservation programs 386 0.68 1.14 6.0 8.8 24.1 33.7 27.5
Conservation programs require long term commitment 388 0.49 1.01 4.6 8.5 36.1 34.5 16.2 Payments are not high enough to account for the risk of changing my system 385 0.49 1.08 4.9 11.4 32.7 31.4 19.5
The application process is too complicated 383 0.38 1.01 5.0 11.2 37.9 32.6 13.3 Market prices encourage growing conventional crops (i.e., corn, soybeans) instead of participating in conservation programs
387 0.36 1.15 8.0 11.4 36.2 25.3 19.1
Documenting compliance would be too complicated and time consuming 382 0.36 1.04 5.5 11.8 37.4 31.7 13.6
Conservation programs have penalties for early termination 382 0.34 0.95 3.4 9.9 50.0 23.0 13.6
Conservation programs have a maximum income limitation for enrollment 377 0.16 0.91 6.1 8.0 58.9 18.3 8.8
Crop insurance makes it worth planting on more marginal land instead of placing it in conservation programs 385 0.12 1.09 8.3 16.1 44.7 17.4 13.5
Conservation program do not fit with my business plans 378 0.06 1.00 7.7 15.3 48.1 20.6 8.2 Conservation programs require me to get tenant's permission before enrollment 378 0.03 0.92 9.8 5.3 62.7 16.1 6.1
I don't want to work with a government agency on a conservation program 385 0.00 1.24 16.9 13.8 34.5 22.3 12.5
Conservation programs do not provide help with maintaining the conservation practice/crops 383 -0.10 1.03 11.7 16.7 48.3 16.4 6.8
Conservation practices installed decreases the overall productivity of my farm 384 -0.13 1.12 15.1 16.1 44.0 16.4 8.3
I don't have sufficient natural resource concerns on my farm to warrant participating in a conservation program 388 -0.13 1.28 20.9 15.2 32.2 19.8 11.9
Agency/organization staff are not responsive to my needs and interests 381 -0.15 1.07 13.4 17.1 48.6 12.9 8.1
Conservation programs often require me to allow hunting or other recreational use of my land by the public 385 -0.17 1.18 17.9 15.3 42.6 14.3 9.9
My farm is not eligible for enrollment 383 -0.30 1.06 18.3 14.9 50.1 11.5 5.2 I don't have sufficient control over conservation decisions 382 -0.32 1.31 25.9 17.8 30.1 15.2 11.0 Conservation programs often have negative environmental impacts on my farm 379 -0.56 1.09 26.6 17.9 44.9 5.5 5.0
I am not aware of any conservation programs 382 -0.61 1.24 34.0 18.1 27.7 14.9 5.2 aResponses on a five-point scale from strongly disagree (-2) to strongly agree (2) bPercent Source: A study of farming practices in Minnesota, Question 12; SD = Standard Deviation

Table 11. Percent of respondents who have converted any portion of their farm from single annual row crops to perennial crops or added cover crops to their row crop acreage in the past 10 years
N Yesa No Acres in crop
Percent of property in crop
Total Mean Mean Perennial crops 388 22.4 77.6 6754.0 75.9 36.9 Cover crops 371 18.9 81.1 9075.0 131.5 35.2 aPercent Source: A study of farming practices in Minnesota, Question 13
Table 12. Respondents' familiarity with perennial or cover crops N Meana SD
Not
at a
ll fa
mili
arb
Slig
htly
fa
mili
ar
Mod
erat
ely
fam
iliar
Very
fa
mili
ar
Alfalfa 421 2.20 1.05 11.2 14.0 18.8 56.1 Annual cover crops and small grains (e.g., winter rye, oats, winter wheat) for soil health or grazing 413 1.49 1.10 23.5 28.3 23.7 24.5
Mixed grazing and forage crops (e.g., grasses, brassicas, legumes) 412 1.21 1.07 32.5 29.6 22.1 15.8
Perennial grasses (e.g., switchgrass, miscanthus, mixed species prairie) 411 1.17 1.09 35.8 27.3 20.9 16.1
Kernza (perennial, “intermediate wheatgrass”) 407 0.53 0.86 67.1 17.7 10.6 4.7 Winter-hardy oilseeds as cover or relay crop (e.g., camelina, field pennycress) 412 0.36 0.67 72.8 20.6 4.4 2.2 aResponses on a four-point scale from not at all familiar (0) to very familiar (4) bPercent Source: A study of farming practices in Minnesota, Question 14; SD = Standard Deviation Table 13. Percent of respondents who have planted perennial or cover crops on their farm in the past 10 years
N Yesa No
Not familiar with the
crop Alfalfa 419 43.2 55.8 1.0 Annual cover crops and small grains (e.g., winter rye, oats, winter wheat) for soil health or grazing 415 27.2 67.0 5.8
Mixed grazing and forage crops (e.g., grasses, brassicas, legumes) 410 22.9 69.3 7.8 Perennial grasses (e.g., switchgrass, miscanthus, mixed species prairie) 415 21.4 69.2 9.4
Kernza (perennial, “intermediate wheatgrass”) 403 2.2 77.2 20.6 Winter-hardy oilseeds as cover or relay crop (e.g., camelina, field pennycress) 411 1.0 78.3 20.7 aPercent Source: A study of farming practices in Minnesota, Question 15
Table 14. Respondents' reported suitability of perennial and cover crops on their land
N Meana SD Not
at a
ll b
Slig
htly
Mod
erat
ely
Very
Alfalfa 403 2.20 1.06 12.9 8.9 23.3 54.8 Annual cover crops and small grains (e.g., winter rye, oats, winter wheat) for soil health or grazing 380 1.68 1.14 23.2 17.1 28.4 31.3
Perennial grasses (e.g., switchgrass, miscanthus, mixed species prairie) 380 1.55 1.16 27.6 16.6 28.9 26.8
Mixed grazing and forage crops (e.g., grasses, brassicas, legumes) 374 1.54 1.16 27.8 17.1 28.3 26.7
Kernza (perennial, “intermediate wheatgrass”) 356 1.09 1.09 41.6 21.9 22.5 14.0 Winter-hardy oilseeds as cover or relay crop (e.g., camelina, field pennycress) 361 0.95 1.07 47.9 21.6 18.3 12.2 aResponses on a four-point scale from not at all (0) to very (4) bPercent Source: A study of farming practices in Minnesota, Question 16(i); SD = Standard Deviation Table 15. Respondents' reported suitability of perennial and cover crops with their current farming practices
N Meana SD Not
at a
ll b
Slig
htly
Mod
erat
ely
Very
Alfalfa 363 1.46 1.28 35.8 16.5 13.8 33.9 Annual cover crops and small grains (e.g., winter rye, oats, winter wheat) for soil health or grazing 348 1.05 1.12 44.8 19.8 20.4 14.9
Mixed grazing and forage crops (e.g., grasses, brassicas, legumes) 338 0.87 1.10 54.7 17.5 14.2 13.6
Perennial grasses (e.g., switchgrass, miscanthus, mixed species prairie) 345 0.87 1.07 52.2 21.4 13.9 12.5
Kernza (perennial, “intermediate wheatgrass”) 326 0.47 0.80 69.6 17.5 9.5 3.4 Winter-hardy oilseeds as cover or relay crop (e.g., camelina, field pennycress) 332 0.44 0.78 71.1 17.8 7.5 3.6 aResponses on a four-point scale from not at all (0) to very (4) bPercent Source: A study of farming practices in Minnesota, Question 16(ii); SD = Standard Deviation
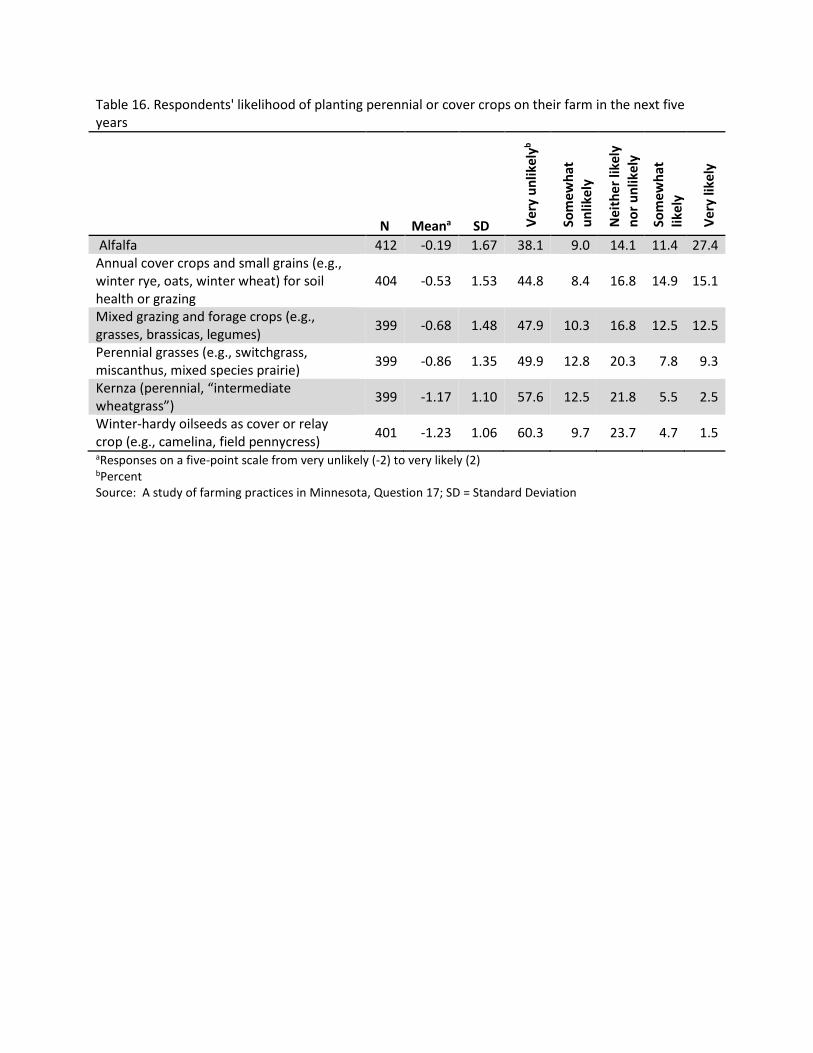
Table 16. Respondents' likelihood of planting perennial or cover crops on their farm in the next five years
N Meana SD Very
unl
ikel
yb
Som
ewha
t un
likel
y
Nei
ther
like
ly
nor u
nlik
ely
Som
ewha
t lik
ely
Very
like
ly
Alfalfa 412 -0.19 1.67 38.1 9.0 14.1 11.4 27.4 Annual cover crops and small grains (e.g., winter rye, oats, winter wheat) for soil health or grazing
404 -0.53 1.53 44.8 8.4 16.8 14.9 15.1
Mixed grazing and forage crops (e.g., grasses, brassicas, legumes) 399 -0.68 1.48 47.9 10.3 16.8 12.5 12.5
Perennial grasses (e.g., switchgrass, miscanthus, mixed species prairie) 399 -0.86 1.35 49.9 12.8 20.3 7.8 9.3
Kernza (perennial, “intermediate wheatgrass”) 399 -1.17 1.10 57.6 12.5 21.8 5.5 2.5
Winter-hardy oilseeds as cover or relay crop (e.g., camelina, field pennycress) 401 -1.23 1.06 60.3 9.7 23.7 4.7 1.5 aResponses on a five-point scale from very unlikely (-2) to very likely (2) bPercent Source: A study of farming practices in Minnesota, Question 17; SD = Standard Deviation

Table 17. Respondents' perceived importance of factors that influence their decision making about planting perennial or cover crops on their land
N Meana SD Not
at a
ll im
port
antb
Slig
htly
im
port
ant
Som
ewha
t im
port
ant
Very
im
port
ant
Extr
emel
y im
port
ant
Controlling erosion 405 2.90 1.12 5.2 7.2 15.6 36.8 35.3 Protecting groundwater 402 2.85 1.13 5.2 7.7 17.9 35.3 33.8 Maintaining or improving soil health 403 2.84 1.11 5.2 6.9 18.1 38.0 31.8 Increasing long-term profitability of my farm 401 2.83 1.19 6.5 8.2 16.5 33.4 35.4 Reducing nutrient loss from my farm 403 2.82 1.14 6.5 7.2 15.4 40.2 30.8 Keeping chemicals and nutrients on the farm 401 2.68 1.17 7.0 8.7 20.9 36.2 27.2
Protecting my investment in the land 401 2.67 1.15 6.7 8.7 21.7 36.4 26.4 Increasing yield 402 2.66 1.22 8.2 8.7 22.1 31.1 29.9 Protecting my land for the next generation 403 2.59 1.16 7.2 9.2 25.8 33.3 24.6 Protecting or improving water resources 402 2.59 1.19 7.5 10.2 24.1 31.8 26.4 Doing the right thing 400 2.51 1.17 7.5 12.0 23.8 35.3 21.5 Resilience to extreme weather events (e.g., drought, heavy rainfalls) 402 2.51 1.23 9.5 10.4 23.6 32.1 24.4
Maintaining or improving my way of life 401 2.45 1.20 8.7 13.0 23.7 34.2 20.4 Protecting or improving wildlife habitat 402 2.36 1.30 10.9 16.2 22.6 26.1 24.1 Reducing costs by reducing inputs 402 2.33 1.24 11.7 12.4 25.6 32.1 18.2 My emotional connection to the land 402 2.28 1.30 13.2 14.2 24.9 27.4 20.4 Conservation is a part of who I am 400 2.26 1.23 10.0 16.8 29.0 25.5 18.8 Improving quality of life in my community 400 2.21 1.21 11.8 15.0 28.2 30.3 14.8 Contributing to the collective good 399 2.15 1.26 13.3 17.3 26.6 27.3 15.5 Availability of financial assistance/cost share to plant perennial/cover crops 401 2.14 1.32 16.0 14.7 27.4 23.4 18.5
Providing another source of income 400 1.99 1.27 16.3 18.8 29.5 21.3 14.2 Preparing for programs that require the use of conservation practices 399 1.88 1.24 17.0 22.3 27.1 23.1 10.5
Exploring new market opportunities 400 1.87 1.25 19.0 17.8 31.0 21.5 10.8 Encouragement of family members 400 1.79 1.29 20.8 22.0 26.5 19.5 11.3 Expectations of other farmers 402 1.48 1.27 30.3 21.6 24.9 15.7 7.5 aResponses on a five-point scale from not at all important (0) to extremely important (4) bPercent Source: A study of farming practices in Minnesota, Question 18; SD = Standard Deviation

Table 18. Respondents' perceived effectiveness of perennial or cover crops
N Meana SD Not
at a
ll ef
fect
iveb
Slig
htly
in
effe
ctiv
e
Som
ewha
t ef
fect
ive
Very
ef
fect
ive
Extr
emel
y ef
fect
ive
Controlling erosion 391 2.76 1.08 3.6 9.7 22.5 35.3 28.9 Protecting groundwater 393 2.66 1.12 4.8 10.4 24.9 33.3 26.5 Maintaining or improving soil health 395 2.57 1.11 5.3 11.1 27.1 34.2 22.3 Protecting or improving water resources 395 2.48 1.10 5.6 11.9 31.1 31.9 19.5 Protecting my investment in the land 394 2.42 1.18 7.9 14.0 26.9 31.2 20.1 Protecting my land for the next generation 395 2.40 1.12 5.3 16.2 29.9 30.1 18.5 Protecting or improving wildlife habitat 393 2.40 1.20 8.4 14.0 27.5 29.5 20.6 Keeping chemicals and nutrients on the farm 393 2.38 1.19 8.1 14.8 27.0 31.0 19.1
Reducing nutrient loss from my farm 393 2.35 1.20 8.1 16.8 25.7 30.5 18.8 Resilience to extreme weather events (e.g., drought, heavy rainfalls) 391 2.29 1.21 9.5 15.6 29.7 26.6 18.7
Maintaining or enhancing productivity 393 2.28 1.20 9.2 17.6 26.7 29.5 17.0 Increasing long-term profitability of my farm 395 2.26 1.25 9.9 20.3 22.8 28.6 18.5
Increasing yield 392 2.18 1.23 10.2 20.4 27.0 25.8 16.6 Reducing costs by reducing inputs 394 2.09 1.21 9.9 23.6 29.2 22.1 15.2 Removing excess nitrogen from my farm 392 2.01 1.22 13.8 19.9 30.1 24.2 12.0 Maintaining or improving my way of life 393 1.97 1.27 15.5 21.1 28.2 20.9 14.2 Improving quality of life in my community 388 1.85 1.28 19.1 20.4 29.4 18.8 12.4 Providing another source of income 393 1.72 1.28 20.9 25.2 26.0 16.8 11.2 aResponses on a five-point scale from not at all effective (0) to extremely effective (4) bPercent Source: A study of farming practices in Minnesota, Question 19; SD = Standard Deviation

Table 19. Respondents' perceptions about their capability to establish and maintain perennial and cover crops on their farm
N Meana SD Not
at a
ll ca
pabl
eb
Slig
htly
ca
pabl
e
Som
ewha
t ca
pabl
e
Very
ca
pabl
e
Alfalfa 397 2.05 1.13 15.9 13.6 20.7 49.9 Annual cover crops and small grains (e.g., winter rye, oats, winter wheat) for soil health or grazing
382 1.73 1.14 20.9 19.4 25.1 34.6
Mixed grazing and forage crops (e.g., grasses, brassicas, legumes) 380 1.58 1.16 26.1 18.4 26.6 28.9
Perennial grasses (e.g., switchgrass, miscanthus, mixed species prairie) 373 1.53 1.10 24.4 22.5 29.2 23.9
Kernza (perennial, “intermediate wheatgrass”) 361 1.16 1.08 37.1 23.8 24.7 14.4
Winter-hardy oilseeds as cover or relay crop (e.g., camelina, field pennycress) 367 1.11 1.08 39.5 24.5 21.8 14.2 aResponses on a four-point scale from not at all capable (0) to very capable (4) bPercent Source: A study of farming practices in Minnesota, Question 20 (i); SD= Standard Deviation Table 20. Respondents' perceptions about the ease or difficulty of establishing and maintaining perennial or cover crops on their farm
N Meana SD Very
diff
icul
tb
Som
ewha
t di
fficu
lt
Nei
ther
diff
icul
t no
r eas
y
Som
ewha
t eas
y
Very
eas
y
Alfalfa 363 0.64 1.27 6.3 15.2 20.9 23.4 34.2 Annual cover crops and small grains (e.g., winter rye, oats, winter wheat) for soil health or grazing
346 0.37 1.27 10.1 15.0 26.3 25.1 23.4
Mixed grazing and forage crops (e.g., grasses, brassicas, legumes) 341 0.20 1.25 11.7 16.1 31.4 21.7 19.1
Perennial grasses (e.g., switchgrass, miscanthus, mixed species prairie) 337 0.02 1.21 12.5 20.5 32.6 21.1 13.4
Kernza (perennial, “intermediate wheatgrass”) 324 -0.23 1.15 17.0 20.4 39.2 15.1 8.3
Winter-hardy oilseeds as cover or relay crop (e.g., camelina, field pennycress) 326 -0.29 1.15 17.2 24.5 37.4 12.0 8.9 aResponses on a four-point scale from very difficult (-2) to very easy (2) bPercent Source: A study of farming practices in Minnesota, Question 20 (ii); SD= Standard Deviation

Table 21. Respondents' likelihood of planting perennial or cover crops under various conditions
N Meana SD Very
unl
ikel
yb
Som
ewha
t un
likel
y
Nei
ther
like
ly
nor u
nlik
ely
Som
ewha
t lik
ely
Very
lik
ely
I could get higher payments for planting the crops 377 0.58 1.34 13.3 6.6 18.8 31.0 30.2
I could get tax benefits for planting the crops 378 0.57 1.33 13.8 6.1 18.8 32.5 28.8 I was compensated for lost crop production 375 0.54 1.31 12.5 7.2 21.9 30.4 28.0 There were markets available to sell the crops 373 0.39 1.26 13.1 7.0 27.6 31.9 20.4 Conservation program requirements were less complex. 371 0.37 1.24 12.4 8.4 28.3 31.5 19.4
Conservation programs were more flexible. 376 0.35 1.21 12.5 6.9 31.1 31.9 17.6 I had evidence that planting the crops improved water resources. 375 0.32 1.22 13.1 7.2 31.7 30.9 17.1
Equipment was made available to plant the crops 378 0.29 1.29 15.1 7.9 28.3 29.9 18.8
I had financial assistance to plant and maintain the crops. 375 0.27 1.34 17.1 9.1 23.5 30.9 19.5
I could enroll in a government program providing technical or financial assistance 375 0.21 1.29 16.0 10.1 27.2 30.1 16.5
I could learn how to maintain the crops for soil conservation 374 0.19 1.22 15.8 8.0 28.6 36.6 11.0
I had evidence that the perennial/cover crops did not reduce yield of conventional crops (i.e., corn and soybeans).
374 0.19 1.21 13.9 9.1 35.6 27.3 14.2
I could learn how to maintain the crops for erosion control 374 0.17 1.23 15.8 9.6 27.8 35.3 11.5
There was local infrastructure to store crops 371 0.17 1.21 14.6 8.9 35.0 27.8 13.7 Trusted agricultural advisers helped me with crop management 374 0.13 1.20 15.5 8.0 36.6 28.1 11.8
I could talk to other landowners or farmers who have planted the crops 375 0.03 1.25 18.4 9.9 32.8 28.0 10.9
I had help with the physical labor of planting and maintaining the crops 372 -0.04 1.25 19.4 10.2 36.3 23.1 11.0
I could attend a workshop or field day about perennial/cover crops 374 -0.08 1.18 18.4 11.5 36.6 26.2 7.2
I knew more about how to plant and maintain the crops 375 -0.10 1.29 22.1 12.5 27.7 28.3 9.3
I knew more about the wildlife benefits of the crops 375 -0.17 1.26 22.9 11.5 33.6 23.2 8.8
I could be enrolled in a registry program that recognizes local conservation stewards. 374 -0.27 1.18 23.3 11.2 41.2 18.2 6.1
aResponses on a five-point scale from very unlikely (-2) to very likely (2); bPercent Source: A study of farming practices in Minnesota, Question 21; SD = Standard Deviation
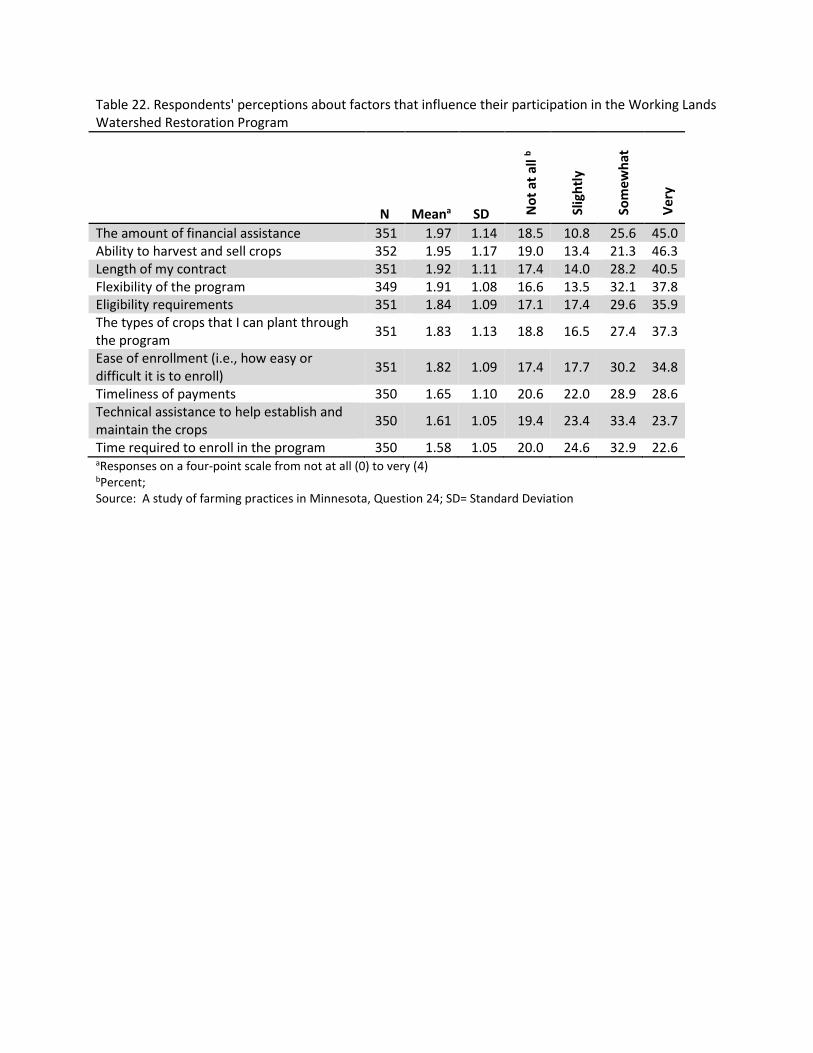
Table 22. Respondents' perceptions about factors that influence their participation in the Working Lands Watershed Restoration Program
N Meana SD Not
at a
ll b
Slig
htly
Som
ewha
t
Very
The amount of financial assistance 351 1.97 1.14 18.5 10.8 25.6 45.0 Ability to harvest and sell crops 352 1.95 1.17 19.0 13.4 21.3 46.3 Length of my contract 351 1.92 1.11 17.4 14.0 28.2 40.5 Flexibility of the program 349 1.91 1.08 16.6 13.5 32.1 37.8 Eligibility requirements 351 1.84 1.09 17.1 17.4 29.6 35.9 The types of crops that I can plant through the program 351 1.83 1.13 18.8 16.5 27.4 37.3
Ease of enrollment (i.e., how easy or difficult it is to enroll) 351 1.82 1.09 17.4 17.7 30.2 34.8
Timeliness of payments 350 1.65 1.10 20.6 22.0 28.9 28.6 Technical assistance to help establish and maintain the crops 350 1.61 1.05 19.4 23.4 33.4 23.7
Time required to enroll in the program 350 1.58 1.05 20.0 24.6 32.9 22.6 aResponses on a four-point scale from not at all (0) to very (4) bPercent; Source: A study of farming practices in Minnesota, Question 24; SD= Standard Deviation

Table 23. Respondents' reported level of influence of various individuals or groups on their decisions about soil and water conservation
N Meana SD Not
at a
llb
Slig
htly
Mod
erat
ely
Very
My family 374 1.54 1.06 20.1 28.6 28.3 23.0 My County's Soil and Water Conservation District 379 1.47 0.95 18.5 29.8 38.0 13.7
Agronomist/crop advisor 373 1.26 1.00 29.2 26.3 33.8 10.7 University researchers and extension staff 372 1.18 0.93 27.7 34.9 29.3 8.1 Other farmers 376 1.16 0.87 25.5 38.8 29.8 5.9 Local watershed district/watershed management organization 378 1.14 0.93 29.4 34.1 29.4 7.1
The Farm Service Agency 375 1.12 0.96 32.8 29.9 29.6 7.7 My neighbors 372 1.05 0.91 32.3 36.6 25.0 6.2 The MN Department of Agriculture 372 1.05 0.91 33.6 33.6 27.2 5.6 MN Board of Water and Soil Resources 375 0.99 0.95 38.4 32.0 22.1 7.5 Environmental organizations 373 0.94 0.90 38.3 34.0 22.8 4.8 Seed/input dealer 373 0.92 0.90 39.4 34.9 20.4 5.4 The MN Department of Natural Resources 373 0.87 0.93 44.5 29.8 20.1 5.6 My local co-op 372 0.87 0.90 45.2 26.3 25.3 3.2 The MN Pollution Control Agency 376 0.79 0.90 48.1 29.3 18.1 4.5 Financial institutions (e.g., ag banker, lender, financial advisor) 378 0.77 0.85 47.9 30.2 19.3 2.6
Agricultural commodity associations 366 0.76 0.81 45.4 35.8 16.4 2.5 My county’s Farm Bureau 374 0.68 0.83 52.1 29.9 15.2 2.7 Farmer’s Union 372 0.56 0.77 59.7 26.3 12.4 1.6 Other agricultural groups (e.g., corn and soybean growers, fertilizer suppliers) 167 0.49 0.81 68.9 16.8 11.4 3.0
Other (e.g., NRCS, Pheasants Forever) 120 0.43 0.82 73.3 14.2 8.3 4.2 aResponses on a four-point scale from not at all (0) to very (4) bPercent; Source: A study of farming practices in Minnesota, Question 25 (i); SD = Standard Deviation

Table 24. Respondents' level of trust in various individuals or groups in helping them make decisions about soil and water conservation
N Meana SD Stro
ngly
di
stru
stb
Som
ewha
t di
stru
st
Nei
ther
trus
t no
r dis
trus
t
Som
ewha
t tr
ust
Stro
ngly
tr
ust
My family 314 0.98 0.95 1.0 1.9 34.4 23.2 39.5 Agronomist/crop advisor 311 0.62 0.96 3.9 3.2 39.2 34.4 19.3 Other farmers 312 0.54 0.86 1.9 5.8 42.3 36.9 13.1 My County's Soil and Water Conservation District 314 0.50 1.02 5.7 6.4 36.0 35.7 16.2 University researchers and extension staff 307 0.47 0.98 5.2 6.5 37.1 38.1 13.0 My neighbors 311 0.42 0.89 2.9 6.4 47.9 30.9 11.9 Local watershed district/watershed management organization 313 0.27 1.01 8.3 8.0 41.2 33.9 8.6 The Farm Service Agency 310 0.25 1.00 7.7 8.1 45.8 28.7 9.7 My local co-op 307 0.24 0.91 6.5 5.2 53.4 27.7 7.2 Seed/input dealer 308 0.17 0.87 5.2 8.1 57.5 22.7 6.5 The MN Department of Agriculture 308 0.12 1.05 9.7 11.4 44.8 25.3 8.8 Financial institutions (e.g., ag banker, lender, financial advisor) 314 0.06 0.93 8.0 10.5 55.1 20.4 6.1 MN Board of Water and Soil Resources 310 0.03 1.08 13.2 9.4 46.8 22.9 7.7 Agricultural commodity associations 308 -0.01 0.86 7.5 11.4 59.1 18.5 3.6 My county’s Farm Bureau 311 -0.06 0.94 10.6 9.6 59.8 14.8 5.1 Other (e.g., NRCS, Pheasants Forever) 102 -0.12 0.78 9.8 4.9 74.5 8.8 2.0 Farmer’s Union 305 -0.13 0.87 11.5 8.5 63.3 14.8 2.0 Other agricultural groups (e.g., corn and soybean growers, fertilizer suppliers) 142 -0.16 0.84 11.3 8.5 67.6 10.6 2.1 Environmental organizations 314 -0.19 1.15 17.5 17.2 39.2 19.1 7.0 The MN Department of Natural Resources 312 -0.22 1.19 20.8 13.5 39.7 18.6 7.4 The MN Pollution Control Agency 312 -0.37 1.20 25.6 13.5 39.7 14.4 6.7 aResponses on a five-point scale from strongly distrust (-2) to strongly trust (2) bPercent; Source: A study of farming practices in Minnesota, Question 25 (ii); SD = Standard Deviation
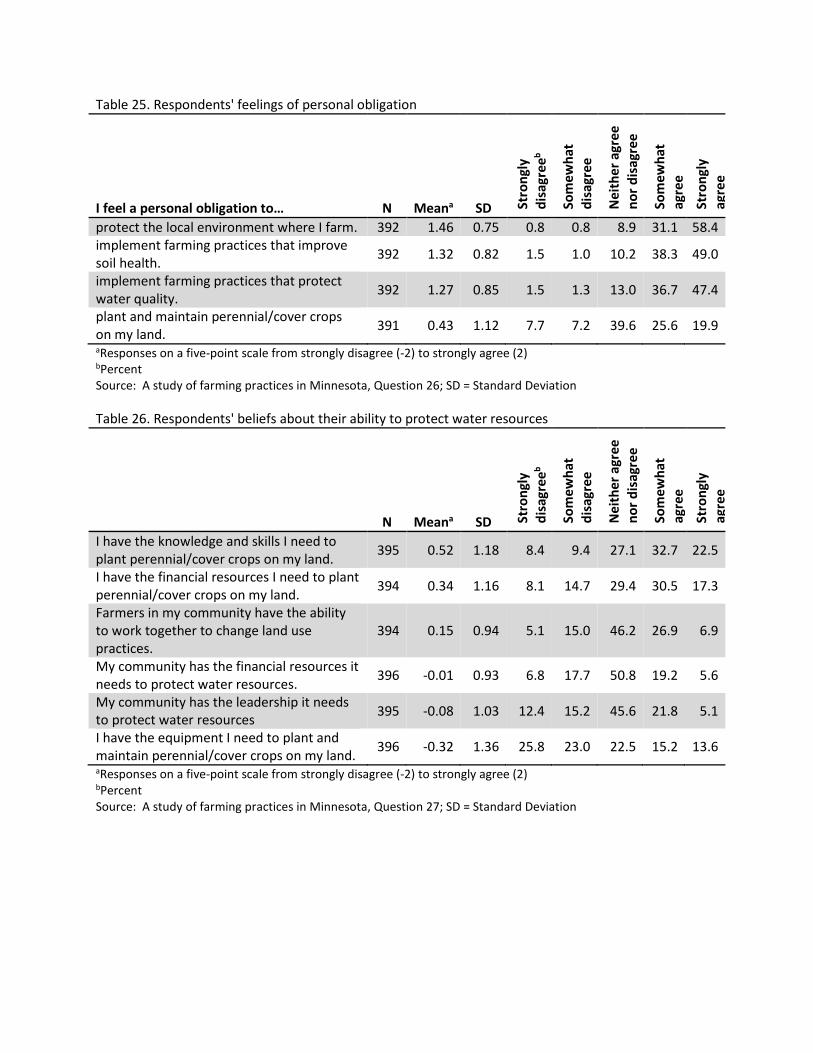
Table 25. Respondents' feelings of personal obligation
I feel a personal obligation to… N Meana SD Stro
ngly
di
sagr
eeb
Som
ewha
t di
sagr
ee
Nei
ther
agr
ee
nor d
isag
ree
Som
ewha
t ag
ree
Stro
ngly
ag
ree
protect the local environment where I farm. 392 1.46 0.75 0.8 0.8 8.9 31.1 58.4 implement farming practices that improve soil health. 392 1.32 0.82 1.5 1.0 10.2 38.3 49.0
implement farming practices that protect water quality. 392 1.27 0.85 1.5 1.3 13.0 36.7 47.4
plant and maintain perennial/cover crops on my land. 391 0.43 1.12 7.7 7.2 39.6 25.6 19.9 aResponses on a five-point scale from strongly disagree (-2) to strongly agree (2) bPercent Source: A study of farming practices in Minnesota, Question 26; SD = Standard Deviation Table 26. Respondents' beliefs about their ability to protect water resources
N Meana SD Stro
ngly
di
sagr
eeb
Som
ewha
t di
sagr
ee
Nei
ther
agr
ee
nor d
isag
ree
Som
ewha
t ag
ree
Stro
ngly
ag
ree
I have the knowledge and skills I need to plant perennial/cover crops on my land. 395 0.52 1.18 8.4 9.4 27.1 32.7 22.5
I have the financial resources I need to plant perennial/cover crops on my land. 394 0.34 1.16 8.1 14.7 29.4 30.5 17.3
Farmers in my community have the ability to work together to change land use practices.
394 0.15 0.94 5.1 15.0 46.2 26.9 6.9
My community has the financial resources it needs to protect water resources. 396 -0.01 0.93 6.8 17.7 50.8 19.2 5.6
My community has the leadership it needs to protect water resources 395 -0.08 1.03 12.4 15.2 45.6 21.8 5.1
I have the equipment I need to plant and maintain perennial/cover crops on my land. 396 -0.32 1.36 25.8 23.0 22.5 15.2 13.6 aResponses on a five-point scale from strongly disagree (-2) to strongly agree (2) bPercent Source: A study of farming practices in Minnesota, Question 27; SD = Standard Deviation

Table 27. Respondents' beliefs about water resources and farming practices
N Meana SD Stro
ngly
di
sagr
eeb
Som
ewha
t di
sagr
ee
Nei
ther
agr
ee
nor d
isag
ree
Som
ewha
t ag
ree
Stro
ngly
ag
ree
Healthy soils can increase yields 397 1.61 0.61 0.0 0.3 6.0 26.4 67.3 Healthy soils can increase resilience to extreme weather including droughts and heavy rainfalls.
396 1.40 0.76 0.5 0.8 11.9 32.3 54.5
Excessive water runoff causes soil and nutrient loss. 395 1.32 0.87 1.8 2.0 10.1 34.7 51.4
Water pollution affects human health. 394 1.26 0.81 0.9 0.9 13.0 35.0 41.5 It is my personal responsibility to implement farming practices that protect the local environment where I farm
397 1.25 0.74 0.3 0.8 13.9 44.1 41.1
It is my personal responsibility to implement farming practices that improve soil health 397 1.25 0.75 0.3 0.8 14.9 42.3 41.8
It is my personal responsibility to implement farming practices that protect water quality 396 1.23 0.77 0.5 0.8 15.4 41.9 41.4
People who are important to me expect me to implement farming practices that protect the local environment where I farm
396 0.63 0.97 3.5 5.8 33.8 37.9 18.9
Water resources in Minnesota need better protection. 394 0.57 1.04 3.8 10.7 30.5 35.0 20.1
People who are important to me expect me to implement farming practices that protect water quality
397 0.57 0.99 3.8 6.5 37.0 33.8 18.9
Water resources in my community are adequately protected. 396 0.20 1.07 8.1 16.2 31.6 35.6 8.6
People who are important to me expect me to plant perennial/cover crops on my farm 396 -0.05 1.06 12.9 11.4 51.5 16.2 8.1 aResponses on a five-point scale from strongly disagree (-2) to strongly agree (2) bPercent Source: A study of farming practices in Minnesota, Question 28; SD = Standard Deviation

Appendix B: Summary Statistics by Watershed

Table 1. Respondents' familiarity with perennial or cover crops by watershed (Alfalfa, Perennial grasses, and Kernza)
Watershed
Alfalfa Perennial grasses Kernza
N Not
at a
lla
Slig
htly
Som
ewha
t
Very
N Not
at a
ll
Slig
htly
Som
ewha
t
Very
N Not
at a
ll
Slig
htly
Som
ewha
t
Very
Buffalo River 71 14.1 18.3 18.3 49.3 69 36.2 34.8 14.5 14.5 69 62.3 24.6 8.7 4.3 Chippewa River 79 13.9 15.2 13.9 57.0 80 25.0 26.3 23.8 25.0 76 64.5 21.1 9.2 5.3 LeSueur River 78 11.5 19.2 29.5 39.7 76 32.9 26.3 27.6 13.2 76 71.1 13.2 9.2 6.6 MN River-Mankato 70 7.1 10.0 24.3 58.6 69 37.7 17.4 21.7 23.2 69 60.9 17.4 18.8 2.9 Root River 65 9.2 12.3 13.8 64.6 59 44.1 33.9 13.6 8.5 59 69.5 18.6 8.5 3.4 Sauk River 58 10.3 6.9 10.3 72.4 58 43.1 25.9 22.4 8.6 58 75.9 10.3 8.6 5.2 aPercent Source: A study of farming practices in Minnesota, Question 14
Table 2. Respondents' familiarity with perennial or cover crops by watershed (Mixed grazing and forage crops, Annual cover crops and small grains, and winter-hardy oilseeds)
Watershed
Mixed grazing and forage crops
Annual cover crops and small grains for soil health or grazing
Winter-hardy oilseeds as cover or relay crop
N Not
at a
lla
Slig
htly
Som
ewha
t
Very
N N
ot a
t all
Slig
htly
Som
ewha
t
Very
N Not
at a
ll
Slig
htly
Som
ewha
t
Very
Buffalo River 68 33.8 27.9 20.6 17.6 71 21.1 29.6 25.4 23.9 70 65.7 25.7 8.6 0.0 Chippewa River 76 34.2 27.6 25.0 13.2 78 24.4 32.1 23.1 20.5 78 74.4 21.8 3.8 0.0 LeSueur River 77 35.1 31.2 20.8 13.0 76 26.3 27.6 23.7 22.4 76 69.7 22.4 2.6 5.3 MN River-Mankato 71 26.8 29.6 28.2 15.5 70 17.1 20.0 25.7 37.1 70 65.7 21.4 7.1 5.7 Root River 63 28.6 27.0 15.9 28.6 60 23.3 28.3 23.3 25.0 60 80.0 16.7 1.7 1.7 Sauk River 57 36.8 35.1 21.1 7.0 58 29.3 32.8 20.7 17.2 58 84.5 13.8 1.7 0.0 aPercent Source: A study of farming practices in Minnesota, Question 14

Table 3. Percent of respondents who have planted perennial or cover crops on their farm in the past 10 years
Watershed
Alfalfa Perennial grasses
Kernza Mixed grazing and forage crops
Annual cover crops and small grains for soil
health or grazing
Winter-hardy oilseeds as
cover or relay crop
N Percent N Percent N Percent N Percent N Percent N Percent Buffalo River 70 32.9 57 12.3 55 0.0 62 21.0 65 30.8 56 0.0 Chippewa River 78 51.3 73 39.7 58 10.3 72 36.1 74 28.4 58 0.0 LeSueur River 76 28.9 73 21.9 61 3.3 70 12.9 75 22.7 66 4.5 MN River-Mankato 71 23.9 70 24.3 60 0.0 69 15.9 69 24.6 62 0.0 Root River 63 68.3 52 13.5 47 2.1 58 37.9 59 40.7 47 2.1 Sauk River 57 63.2 51 25.5 39 0.0 47 27.7 49 28.6 37 0.0 Source: A study of farming practices in Minnesota, Question 15
Table 4. Respondents' likelihood of planting perennial or cover crops in the next 5 years (Alfalfa, perennial grasses, and kernza)
Watershed
Alfalfa Perennial grasses Kernza
N Unl
ikel
ya
Nei
ther
like
ly
nor u
nlik
ely
Like
ly
N Unl
ikel
y
Nei
ther
like
ly
nor u
nlik
ely
Like
ly
N Unl
ikel
y
Nei
ther
like
ly
nor u
nlik
ely
Like
ly
Buffalo River 67 46.3 16.4 37.3 64 65.6 23.4 10.9 64 68.8 26.6 4.7 Chippewa River 78 46.2 11.5 42.3 75 56.0 17.3 26.7 75 68.0 22.7 9.3 LeSueur River 75 62.7 17.3 20.0 75 65.3 21.3 13.3 75 72.0 16.0 12.0 MN River-Mankato 72 63.9 12.5 23.6 72 63.9 16.7 19.4 72 76.4 15.3 8.3 Root River 64 25.0 15.6 59.4 59 61.0 23.7 15.3 58 67.2 31.0 1.7 Sauk River 56 32.1 10.7 57.1 54 64.8 20.4 14.8 55 67.3 21.8 10.9 aPercent Source: A study of farming practices in Minnesota, Question 17

Table 5. Respondents' likelihood of planting perennial or cover crops in the next 5 years (Mixed grazing and forage crops, annual cover crops and small grains, and winter-hardy oilseeds)
Watershed
Mixed grazing and forage crops
Annual cover crops and small grains for soil health or
grazing
Winter-hardy oilseeds as cover or relay crop
N Unl
ikel
ya
Nei
ther
like
ly
nor u
nlik
ely
Like
ly
N Unl
ikel
y
Nei
ther
like
ly
nor u
nlik
ely
Like
ly
N Unl
ikel
y
Nei
ther
like
ly
nor u
nlik
ely
Like
ly
Buffalo River 65 61.5 15.4 23.1 67 55.2 20.9 23.9 64 67.2 25.0 7.8 Chippewa River 72 54.2 13.9 31.9 75 52.0 12.0 36.0 75 72.0 21.3 6.7 LeSueur River 75 70.7 14.7 14.7 75 61.3 16.0 22.7 75 72.0 16.0 12.0 MN River-Mankato 71 64.8 14.1 21.1 72 59.7 12.5 27.8 72 73.6 20.8 5.6 Root River 60 36.7 26.7 36.7 59 37.3 23.7 39.0 59 66.1 33.9 0.0 Sauk River 56 57.1 17.9 25.0 56 50.0 17.9 32.1 56 67.9 28.6 3.6 aPercent Source: A study of farming practices in Minnesota, Question 17

Appendix C: Subgroup Comparisons

Subgroup comparisons: Age Table 1. Number of respondents by age group Age group N Percent 28 – 63 194 50.4 64+ 191 49.6 Total 385 100.0 Source: A study of farming practices in Minnesota, Question 6
Table 2. Differences between respondents by age group in their likelihood of planting perennial or cover crops in the next 5 years Survey item Age group N Mean SD tb Likelihood of planting perennial or cover crops in the next 5 yearsa
Annual cover crops and small grains 28-63 187 -0.34 1.53 2.484* 64+ 172 -0.74 1.49
aItem measured on a five-point scale from very unlikely (-2) to very likely (+2) bT-test statistic for testing differences in means. Only items with statistical differences at a significance level of p ≤ 0.05 reported here; *p < 0.05 SD = Standard deviation Source: A study of farming practices in Minnesota, Question 17
Table 3. Difference between respondents by age group in their use of perennial or cover crops in the past 10 years
Age group Planted perennial or cover
crops in the past 10 years (%) χ2 Mixed grazing and forage crops 28-63 32.4% 10.024** 64+ 17.4% Annual cover crops and small grains 28-63 36.1% 12.813** 64+ 18.9% χ2 Chi-square statistic for testing differences in proportions; **p ≤ 0.01 Source: A study of farming practices in Minnesota, Question 15

Subgroup comparisons: Percent income dependent on agriculture Table 4. Number of respondents by percent income dependent on agriculture Percent income dependent on agriculture
N Percent
Less than 50% 200 48.5 50% or more 212 51.5 Total 412 100.0 Source: A study of farming practices in Minnesota, Question 6
Table 5. Differences between respondents with varying levels of percent income dependent on agricultural production in their familiarity with and likelihood of growing perennial or cover crops Survey item Percent income
dependent on agriculture N Mean SD tc
Familiarity with perennial or cover cropsa
Alfalfa Less than 50% 194 2.04 1.11 -2.912** 50% or more 210 2.34 0.97
Annual cover crops and small grains Less than 50% 192 1.36 1.08 -2.144* 50% or more 205 1.60 1.11 Likelihood of planting perennial or cover crops in the next 5 yearsb
Perennial grasses Less than 50% 187 -0.71 1.41 2.165* 50% or more 197 -1.01 1.30 aItems measured on a four-point scale from not at all familiar (0) to very familiar (4) bItem measured on a five-point scale from very unlikely (-2) to very likely (+2) cT-test statistic for testing differences in means. Only items with statistical differences at a significance level of p ≤ 0.05 reported here; **p < 0.01; *p < 0.05 SD = Standard deviation Source: A study of farming practices in Minnesota, Questions 14 and 17
Table 6. Difference between respondents with varying levels of percent income dependent on agricultural production in their use of perennial or cover crops in the past 10 years Percent income dependent on agriculture
Planted perennial or cover crops in the past 10 years (%) χ2
Annual cover crops and small grains Less than 50% 21.6 7.839** 50% or more 34.7 χ2 Chi-square statistic for testing differences in proportions; **p ≤ 0.01 Source: A study of farming practices in Minnesota, Question 15

Subgroup comparisons: Land tenure Table 7. Number of respondents by land tenure Land tenurea N Percent Own 244 59.1 Rent 169 40.9 Total 413 100.0 aOwn = Own and lease property to others but do not rent; Rent = rent any portion of their property (may also own or lease portions of their property to others) Source: A study of farming practices in Minnesota, Question 6 Table 8. Differences between property owners and renters in their familiarity with and likelihood of growing perennial or cover crops Survey item Land tenurec N Mean SD td Familiarity with perennial or cover cropsa
Mixed grazing and forage crops Own 233 1.12 1.05 -1.992* Rent 163 1.33 1.07
Annual cover crops and small grains Own 232 1.37 1.10 -2.386* Rent 165 1.64 1.08 Likelihood of planting perennial or cover crops in the next 5 yearsb
Annual cover crops and small grains Own 223 -0.70 1.49 -2.153* Rent 165 -0.36 1.56
aItems measured on a four-point scale from not at all familiar (0) to very familiar (4) bItem measured on a five-point scale from very unlikely (-2) to very likely (+2) cOwn = Own and lease property to others but do not rent; Rent = rent any portion of their property (may also own or lease portions of their property to others) dT-test statistic for testing differences in means. Only items with statistical differences at a significance level of p ≤ 0.05 reported here; *p < 0.05 SD = Standard deviation Source: A study of farming practices in Minnesota, Questions 14 and 17
Table 9. Difference between property owners and renters in their use of perennial or cover crops in the past 10 years
Land tenurea Planted perennial or cover
crops in the past 10 years (%) χ2 Annual cover crops and small grains Own 23.7 4.783* Rent 34.0 aOwn = Own and lease property to others but do not rent; Rent = rent any portion of their property (may also own or lease portions of their property to others) χ2 Chi-square statistic for testing differences in proportions; **p ≤ 0.01 Source: A study of farming practices in Minnesota, Question 15

Subgroup comparisons: Land size
Table 10. Number of respondents by acres farmed in 2016 Farm sizea N Percent Small 202 51.4 Large 191 48.6 Total 393 100.0 aSmall < 200 acres farmed; Large = 200 acres or more farmed Source: A study of farming practices in Minnesota, Question 6 Table 11. Differences between small and large landowners in their familiarity with and likelihood of growing perennial or cover crops Survey item Farm sizec N Mean SD td Familiarity with perennial or cover cropsa
Mixed grazing and forage crops Small 191 0.98 0.99 -3.703** Large 187 1.38 1.09
Annual cover crops and small grains Small 194 1.31 1.08 -2.815** Large 189 1.62 1.08
Winter-hardy oilseeds Small 194 0.27 0.60 -2.452* Large 188 0.44 0.74
Likelihood of planting perennial or cover crops in the next 5 yearsb
Annual cover crops and small grains Small 186 -0.69 1.47 -2.119* Large 184 -0.36 1.57 aItems measured on a four-point scale from not at all familiar (0) to very familiar (4) bItem measured on a five-point scale from very unlikely (-2) to very likely (+2) cSmall < 200 acres farmed; Large = 200 acres or more farmed dT-test statistic for testing differences in means. Only items with statistical differences at a significance level of p ≤ 0.05 reported here; **p < 0.01; *p < 0.05 SD = Standard deviation Source: A study of farming practices in Minnesota, Questions 14 and 17
Table 12. Difference between small and large landowners in their use of perennial or cover crops in the past 10 years
Farm sizea Planted perennial or cover crops in
the past 10 years (%) χ2 Annual cover crops and small grains Small 21.7 7.909** Large 35.2 aSmall < 200 acres farmed; Large = 200 acres or more farmed χ2 Chi-square statistic for testing differences in proportions; **p ≤ 0.01 Source: A study of farming practices in Minnesota, Question 15