Embed Size (px)
Citation preview

Appendix 1
Solubility enhancement of BCS Class II/IV drugs 270
Chapter 1.Introduction
Table 1.1. BCS Classification
Table 1.2. Lipid formulation classification system
Table 1.3. Physical properties and molecular dimension of Cyclodextrins
Table 1.4. Bond work index
Chapter 2.Preformulation studies
Section 2.1
Table 2.1.1.Evaluation of TEL
Table 2.1.2.Evaluation of CP
Table 2.1.3.Evaluation of Vitamin E TPGS
Table 2.1.4.Evaluation of PEG 6000
Table.2.1.5.Evaluation of PVPK 30
Table 2.1.6.Evalaution of Poloxamer 188
Table 2.1.7.Evalaution of β- cyclodextrin
Table 2.1.8. Evaluation of DPC
Table 2.1.9. Evaluation of NaHCO3
Table. 2.1.10.Evaluation of Capmul MCM
Table 2.1.11.Evaluation of tween 80
Chapter 3.Methodology
Part I:Analytical method development
Part II: Experimental for TEL
Table 3.1. Formulae for FaSSIF and FeSSIF
Table 3.2: Different ratios of β-CD:cross-linker used for synthesizing NSs
Table 3.3: Coding for different inclusion complexes
Table 3.4. Formulae for nanosuspensions of TEL
Table 3.5.Protocol for animal testing for pharmacokinetic parameters of TEL nanosuspension
Table 3.6.Actual values of independent variables for Box-Behnken design for TEL
Part III: Experimental for CP
Table 3.7. Formula for nanosuspensions of CP
Table 3.8. Formulations containing T80: PG (4:1) and Capmul MCM
Table 3.9. Formulations containing T80: TPGS (1:0.5) and Capmul MCM
Table 3.10. Protocol for animal testing for pharmacokinetic parameters of CP SNEDDS
Table 3.11. Formula for enriched nutrient broth
Table 3.12. Dilution series for microbiological test of CP SNEDDS
Table 3.13 Formula for tryptic soy broth
Table 3.14. Levels of two variables for 2 component mixture design for CP-SNEDDS
Table 3.15.Trials with various levels of the variables for CP SNEDDS
Chapter 4.Results and Discussion
Part I: Analytical method development
Section 4.1.TEL
Table 4.1.1.Calibration data of TEL in D.W.
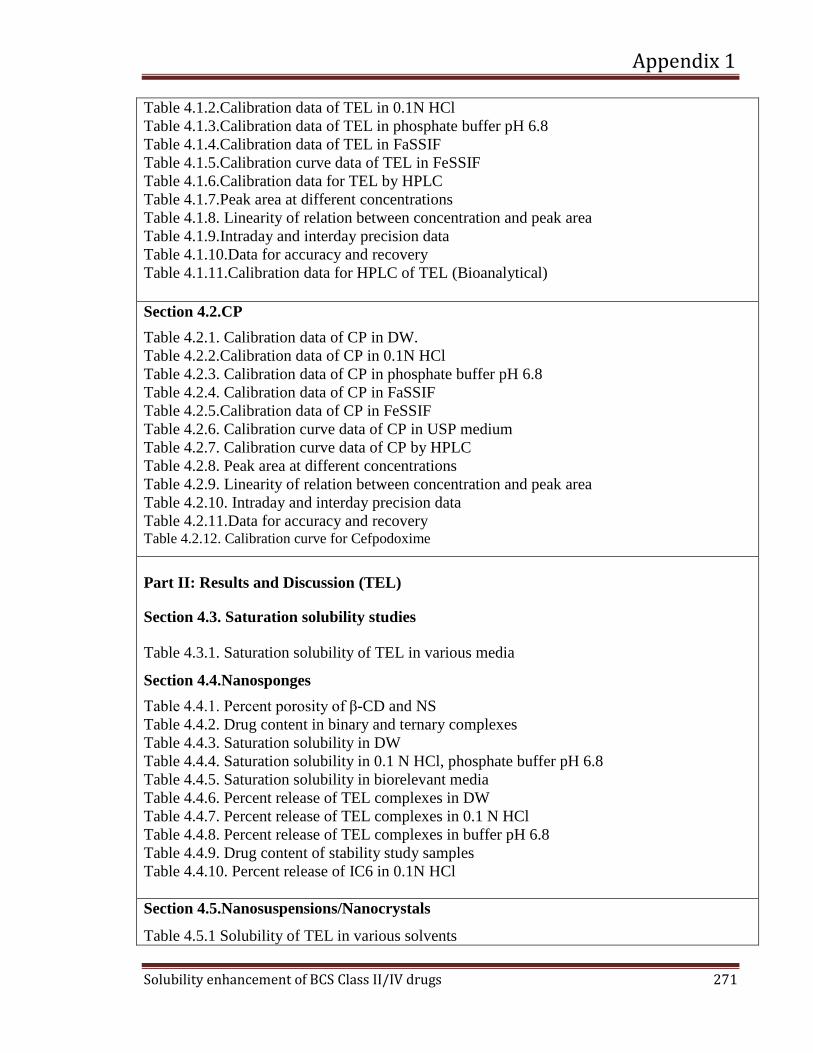
Appendix 1
Solubility enhancement of BCS Class II/IV drugs 271
Table 4.1.2.Calibration data of TEL in 0.1N HCl
Table 4.1.3.Calibration data of TEL in phosphate buffer pH 6.8
Table 4.1.4.Calibration data of TEL in FaSSIF
Table 4.1.5.Calibration curve data of TEL in FeSSIF
Table 4.1.6.Calibration data for TEL by HPLC
Table 4.1.7.Peak area at different concentrations
Table 4.1.8. Linearity of relation between concentration and peak area
Table 4.1.9.Intraday and interday precision data
Table 4.1.10.Data for accuracy and recovery
Table 4.1.11.Calibration data for HPLC of TEL (Bioanalytical)
Section 4.2.CP
Table 4.2.1. Calibration data of CP in DW.
Table 4.2.2.Calibration data of CP in 0.1N HCl
Table 4.2.3. Calibration data of CP in phosphate buffer pH 6.8
Table 4.2.4. Calibration data of CP in FaSSIF
Table 4.2.5.Calibration data of CP in FeSSIF
Table 4.2.6. Calibration curve data of CP in USP medium
Table 4.2.7. Calibration curve data of CP by HPLC
Table 4.2.8. Peak area at different concentrations
Table 4.2.9. Linearity of relation between concentration and peak area
Table 4.2.10. Intraday and interday precision data
Table 4.2.11.Data for accuracy and recovery Table 4.2.12. Calibration curve for Cefpodoxime
Part II: Results and Discussion (TEL)
Section 4.3. Saturation solubility studies
Table 4.3.1. Saturation solubility of TEL in various media
Section 4.4.Nanosponges
Table 4.4.1. Percent porosity of β-CD and NS
Table 4.4.2. Drug content in binary and ternary complexes
Table 4.4.3. Saturation solubility in DW
Table 4.4.4. Saturation solubility in 0.1 N HCl, phosphate buffer pH 6.8
Table 4.4.5. Saturation solubility in biorelevant media
Table 4.4.6. Percent release of TEL complexes in DW
Table 4.4.7. Percent release of TEL complexes in 0.1 N HCl
Table 4.4.8. Percent release of TEL complexes in buffer pH 6.8
Table 4.4.9. Drug content of stability study samples
Table 4.4.10. Percent release of IC6 in 0.1N HCl
Section 4.5.Nanosuspensions/Nanocrystals
Table 4.5.1 Solubility of TEL in various solvents
Appendix 1
Solubility enhancement of BCS Class II/IV drugs 272
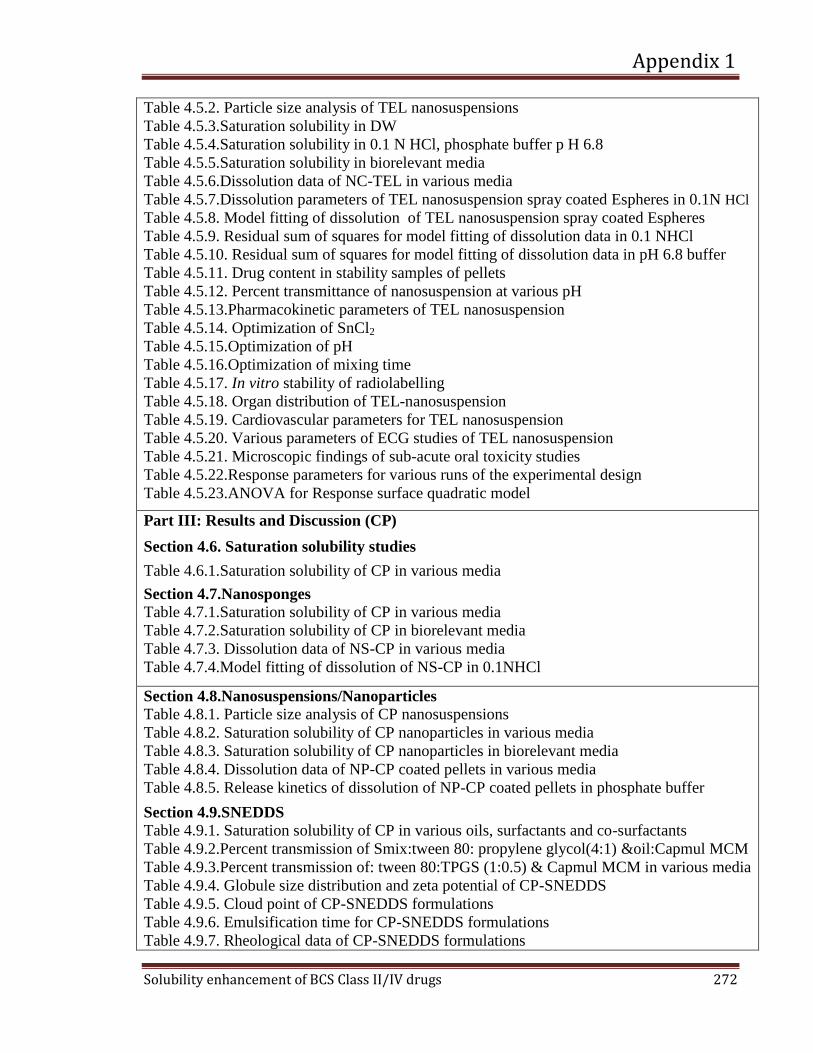
Table 4.5.2. Particle size analysis of TEL nanosuspensions
Table 4.5.3.Saturation solubility in DW Table 4.5.4.Saturation solubility in 0.1 N HCl, phosphate buffer p H 6.8 Table 4.5.5.Saturation solubility in biorelevant media Table 4.5.6.Dissolution data of NC-TEL in various media
Table 4.5.7.Dissolution parameters of TEL nanosuspension spray coated Espheres in 0.1N HCl
Table 4.5.8. Model fitting of dissolution of TEL nanosuspension spray coated Espheres Table 4.5.9. Residual sum of squares for model fitting of dissolution data in 0.1 NHCl
Table 4.5.10. Residual sum of squares for model fitting of dissolution data in pH 6.8 buffer
Table 4.5.11. Drug content in stability samples of pellets
Table 4.5.12. Percent transmittance of nanosuspension at various pH
Table 4.5.13.Pharmacokinetic parameters of TEL nanosuspension
Table 4.5.14. Optimization of SnCl2
Table 4.5.15.Optimization of pH Table 4.5.16.Optimization of mixing time
Table 4.5.17. In vitro stability of radiolabelling
Table 4.5.18. Organ distribution of TEL-nanosuspension
Table 4.5.19. Cardiovascular parameters for TEL nanosuspension
Table 4.5.20. Various parameters of ECG studies of TEL nanosuspension
Table 4.5.21. Microscopic findings of sub-acute oral toxicity studies
Table 4.5.22.Response parameters for various runs of the experimental design
Table 4.5.23.ANOVA for Response surface quadratic model
Part III: Results and Discussion (CP)
Section 4.6. Saturation solubility studies
Table 4.6.1.Saturation solubility of CP in various media
Section 4.7.Nanosponges
Table 4.7.1.Saturation solubility of CP in various media Table 4.7.2.Saturation solubility of CP in biorelevant media Table 4.7.3. Dissolution data of NS-CP in various media
Table 4.7.4.Model fitting of dissolution of NS-CP in 0.1NHCl
Section 4.8.Nanosuspensions/Nanoparticles Table 4.8.1. Particle size analysis of CP nanosuspensions
Table 4.8.2. Saturation solubility of CP nanoparticles in various media
Table 4.8.3. Saturation solubility of CP nanoparticles in biorelevant media Table 4.8.4. Dissolution data of NP-CP coated pellets in various media
Table 4.8.5. Release kinetics of dissolution of NP-CP coated pellets in phosphate buffer
Section 4.9.SNEDDS
Table 4.9.1. Saturation solubility of CP in various oils, surfactants and co-surfactants
Table 4.9.2.Percent transmission of Smix:tween 80: propylene glycol(4:1) &oil:Capmul MCM Table 4.9.3.Percent transmission of: tween 80:TPGS (1:0.5) & Capmul MCM in various media
Table 4.9.4. Globule size distribution and zeta potential of CP-SNEDDS
Table 4.9.5. Cloud point of CP-SNEDDS formulations
Table 4.9.6. Emulsification time for CP-SNEDDS formulations
Table 4.9.7. Rheological data of CP-SNEDDS formulations
Appendix 1
Solubility enhancement of BCS Class II/IV drugs 273
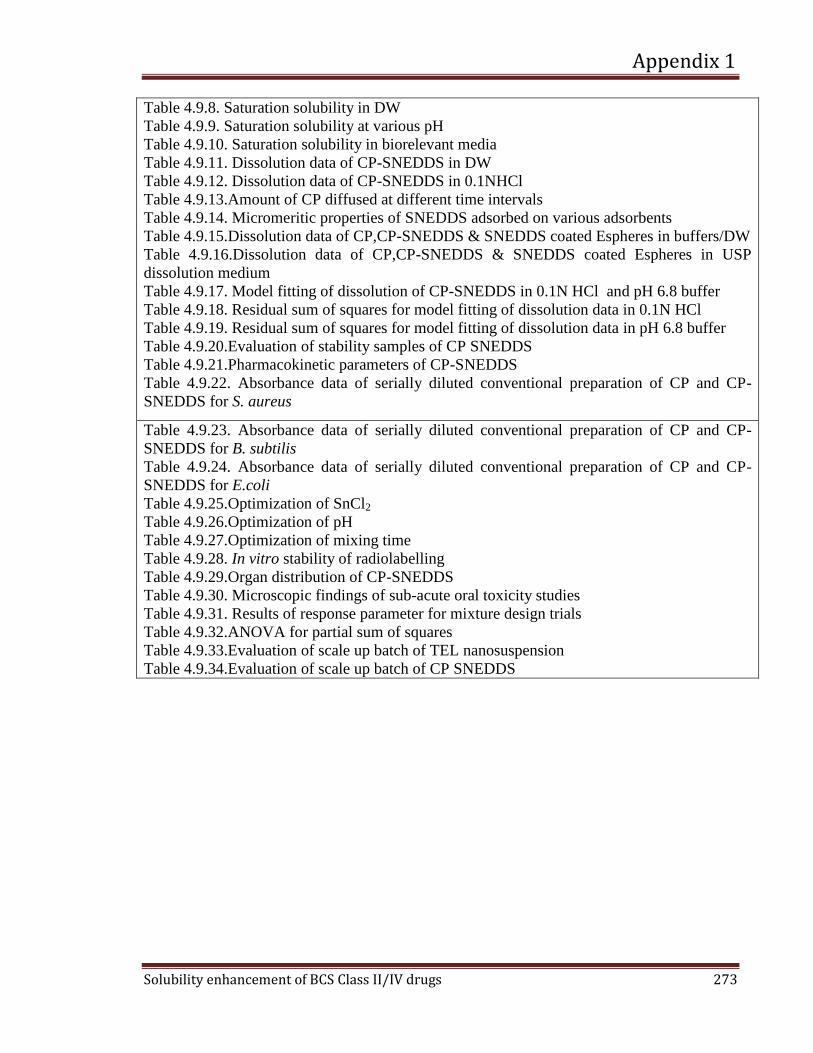
Table 4.9.8. Saturation solubility in DW Table 4.9.9. Saturation solubility at various pH Table 4.9.10. Saturation solubility in biorelevant media
Table 4.9.11. Dissolution data of CP-SNEDDS in DW
Table 4.9.12. Dissolution data of CP-SNEDDS in 0.1NHCl
Table 4.9.13.Amount of CP diffused at different time intervals
Table 4.9.14. Micromeritic properties of SNEDDS adsorbed on various adsorbents
Table 4.9.15.Dissolution data of CP,CP-SNEDDS & SNEDDS coated Espheres in buffers/DW
Table 4.9.16.Dissolution data of CP,CP-SNEDDS & SNEDDS coated Espheres in USP
dissolution medium
Table 4.9.17. Model fitting of dissolution of CP-SNEDDS in 0.1N HCl and pH 6.8 buffer
Table 4.9.18. Residual sum of squares for model fitting of dissolution data in 0.1N HCl
Table 4.9.19. Residual sum of squares for model fitting of dissolution data in pH 6.8 buffer
Table 4.9.20.Evaluation of stability samples of CP SNEDDS
Table 4.9.21.Pharmacokinetic parameters of CP-SNEDDS
Table 4.9.22. Absorbance data of serially diluted conventional preparation of CP and CP-
SNEDDS for S. aureus
Table 4.9.23. Absorbance data of serially diluted conventional preparation of CP and CP-
SNEDDS for B. subtilis
Table 4.9.24. Absorbance data of serially diluted conventional preparation of CP and CP-
SNEDDS for E.coli
Table 4.9.25.Optimization of SnCl2
Table 4.9.26.Optimization of pH
Table 4.9.27.Optimization of mixing time
Table 4.9.28. In vitro stability of radiolabelling
Table 4.9.29.Organ distribution of CP-SNEDDS
Table 4.9.30. Microscopic findings of sub-acute oral toxicity studies
Table 4.9.31. Results of response parameter for mixture design trials
Table 4.9.32.ANOVA for partial sum of squares
Table 4.9.33.Evaluation of scale up batch of TEL nanosuspension
Table 4.9.34.Evaluation of scale up batch of CP SNEDDS

Appendix 2
Solubility enhancement of BCS Class II/IV drugs 274
LIST OF FIGURES
Chapter 1:Introduction
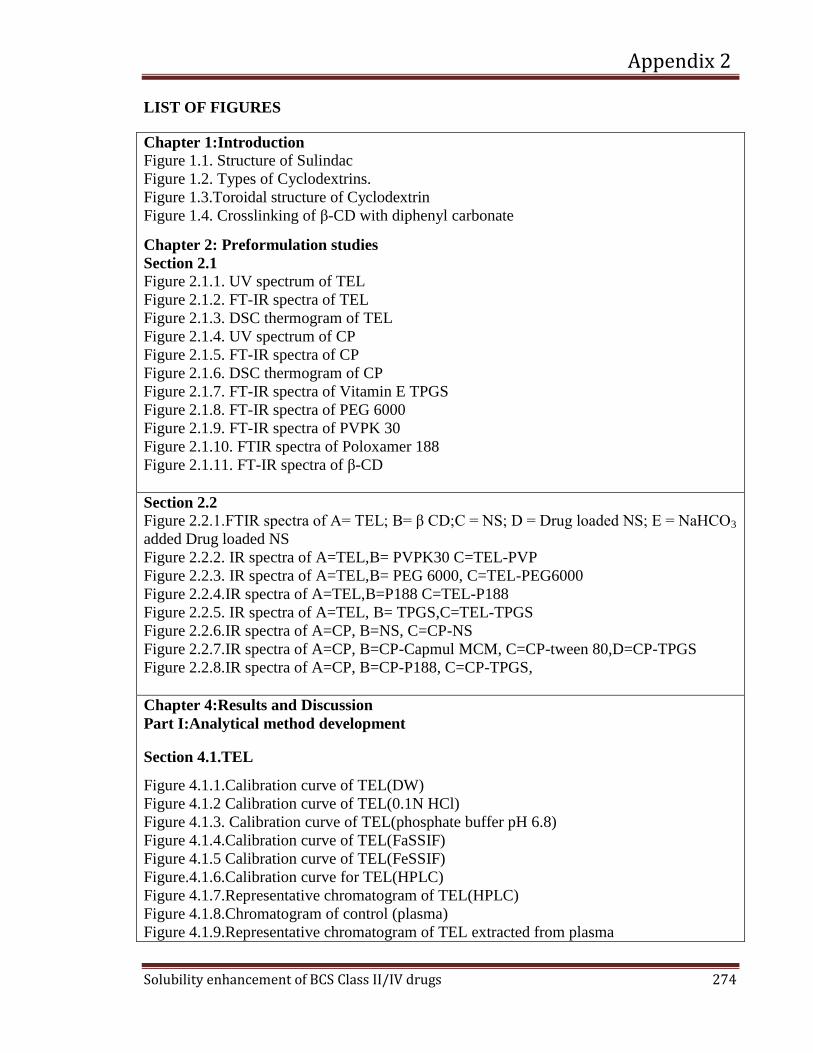
Figure 1.1. Structure of Sulindac
Figure 1.2. Types of Cyclodextrins.
Figure 1.3.Toroidal structure of Cyclodextrin
Figure 1.4. Crosslinking of β-CD with diphenyl carbonate
Chapter 2: Preformulation studies
Section 2.1
Figure 2.1.1. UV spectrum of TEL
Figure 2.1.2. FT-IR spectra of TEL
Figure 2.1.3. DSC thermogram of TEL Figure 2.1.4. UV spectrum of CP
Figure 2.1.5. FT-IR spectra of CP
Figure 2.1.6. DSC thermogram of CP
Figure 2.1.7. FT-IR spectra of Vitamin E TPGS
Figure 2.1.8. FT-IR spectra of PEG 6000
Figure 2.1.9. FT-IR spectra of PVPK 30
Figure 2.1.10. FTIR spectra of Poloxamer 188
Figure 2.1.11. FT-IR spectra of β-CD
Section 2.2
Figure 2.2.1.FTIR spectra of A= TEL; B= β CD;C = NS; D = Drug loaded NS; E = NaHCO3
added Drug loaded NS
Figure 2.2.2. IR spectra of A=TEL,B= PVPK30 C=TEL-PVP
Figure 2.2.3. IR spectra of A=TEL,B= PEG 6000, C=TEL-PEG6000
Figure 2.2.4.IR spectra of A=TEL,B=P188 C=TEL-P188
Figure 2.2.5. IR spectra of A=TEL, B= TPGS,C=TEL-TPGS
Figure 2.2.6.IR spectra of A=CP, B=NS, C=CP-NS
Figure 2.2.7.IR spectra of A=CP, B=CP-Capmul MCM, C=CP-tween 80,D=CP-TPGS
Figure 2.2.8.IR spectra of A=CP, B=CP-P188, C=CP-TPGS,
Chapter 4:Results and Discussion
Part I:Analytical method development
Section 4.1.TEL
Figure 4.1.1.Calibration curve of TEL(DW)
Figure 4.1.2 Calibration curve of TEL(0.1N HCl)
Figure 4.1.3. Calibration curve of TEL(phosphate buffer pH 6.8)
Figure 4.1.4.Calibration curve of TEL(FaSSIF)
Figure 4.1.5 Calibration curve of TEL(FeSSIF)
Figure.4.1.6.Calibration curve for TEL(HPLC)
Figure 4.1.7.Representative chromatogram of TEL(HPLC)
Figure 4.1.8.Chromatogram of control (plasma)
Figure 4.1.9.Representative chromatogram of TEL extracted from plasma

Appendix 2
Solubility enhancement of BCS Class II/IV drugs 275
Figure 4.1.10. Calibration curve of TEL by HPLC (Bioanalytical)
Section 4.2.CP
Figure 4.2.1. Calibration curve of CP in DW
Figure 4.2.2. Calibration curve of CP in 0.1N HCl
Figure 4.2.3. Calibration curve of CP in phosphate buffer pH 6.8.
Figure 4.2.4. Calibration curve of CP in FaSSIF
Figure 4.2.5. Calibration curve of CP in FeSSIF
Figure 4.2.6. Calibration curve of CP in USP medium
Figure 4.2.7.Calibration curve of CP by HPLC
Figure 4.2.8. Representative chromatogram of CP by HPLC
Figure 4.2.9. Chromatogram of Control (plasma)
Figure 4.2.10. Representative Chromatogram of Cefpodoxime from rat plasma
Figure 4.2.11. Calibration curve for Cefpodoxime
Part II: Results and Discussion (TEL)
Section 4.4.Nanosponges
Figure 4.4.1. Schematic representation of chemical reaction between β-CD and DPC.
Figure 4.4.2. NMR spectra of (A) β-CD; (B) NS2.
Figure 4.4.3. Phase-solubility profiles
Figure 4.4.4. Phase solubility diagram in water.
Figure 4.4.5. Solution state interaction studies of TEL
Figure 4.4.6. 3D image of depicting dimensions of TEL molecule
Figure 4.4.7. 3D image showing possible mode of entrapment of TEL in β CD structure
Figure 4.4.8. 3D image showing possible mode of entrapment of TEL in NS structure
Figure 4.4.9. Inclusion complex of β-CD and TEL
Figure 4.4.10.Saturation solubility in various media
Figure 4.4.11. FTIR spectra of A= TEL; B= β- CD; C = NS; D = Drug loaded NS; E =
NaHCO3 added Drug loaded NS.
Figure 4.4.12. DSC spectra of A= TEL, B= β – CD, C=NS, D= Drug loaded NS; E =
NaHCO3added Drug loaded NS.
Figure 4.4.13. PXRD spectra of A= TEL , B= β – CD,C=NS , D= Drug loaded NS.
Figure 4.4.14. SEM of (A) TEL; (B) β- CD; (C) NS; (D) Drug loaded NS.
Figure 4.4.15.Dissolution profiles of TEL complexes in DW
Figure 4.4.16.Dissolution profiles of TEL complexes in 0.1 N HCl
Figure 4.4.17. Dissolution profiles of TEL complexes in buffer pH 6.8.
Section 4.5:Nanosuspensions/Nanocrystals
Figure 4.5.1. Particle size distribution of TEL nanosuspension(T0)
Figure 4.5.2. Particle size distribution of TEL nanosuspension(T1)
Figure 4.5.3. Particle size distribution of TEL nanosuspension(T2)
Figure 4.5.4. Particle size distribution of TEL nanosuspension(T3)
Figure 4.5.5. Particle size distribution of TEL nanosuspension(T4)
Figure 4.5.6. Particle size distribution of TEL nanosuspension(T5)
Figure 4.5.7. Particle size distribution of TEL nanosuspension(T6)
Figure 4.5.8. Particle size distribution of TEL nanosuspension(T7)

Appendix 2
Solubility enhancement of BCS Class II/IV drugs 276
Figure 4.5.9. Particle size distribution of TEL nanosuspension(T8)
Figure 4.5.10. Particle size distribution of TEL nanosuspension(T9)
Figure 4.5.11. Average particle size of TEL nanosuspensions
Figure 4.5.12.Stern model showing the course of the potential in the electrical double layers
Figure 4.5.13.Adsorbed polymer layer shift the plane of shear from particle surface
Figure 4.5.14.Saturation solubility of TEL and NC in different media
Figure 4.5.15.IR spectra of A)TEL,B)PVPK30, C)TEL-PVPK30
Figure 4.5.16. IR spectra of A)TEL,B)PEG6000,C)TEL-PEG6000
Figure 4.5.17. IR spectra of A)TEL, B) P188,C)TEL-P188
Figure 4.5.18. IR spectra of A)TEL, B)TPGS,C)TEL-TPGS
Figure 4.5.19. DSC thermograms of A) TEL B) NC-TEL
Figure 4.5.20. PXRD spectra of A] TEL, B] NC-TEL
Figure 4.5.21. Specific surface area A] Plain TEL B] NC-TEL
Figure 4.5.22. Contact angle of A] Plain TEL B] NC-TEL
Figure 4.5.23. SEM of A) TEL B) NC-TEL
Figure 4.5.24. Gas chromatogram of A) DCM B) NC- TEL
Figure 4.5.25.SEM of A] Plain Espheres B] Nanosuspension coated Espheres
Figure 4.5.26. Qt30min for TEL, NC-TEL and pellets Figure 4.5.27. Dissolution profile of TEL nanosuspension spray coated Espheres in 0.1NHCl
Figure 4.5.28. Particle size distribution of nanosuspension (T8) kept at room temperature Figure 4.5.29. Particle size distribution of nanosuspension (T8) kept at 40 ºC /75% RH
Figure 4..5.30. Particle size distribution of nanosuspension (T8) kept under refrigeration Figure 4.5.31. Plasma concentration-time profile for A] TEL and B] TEL-Nanosuspension
Figure 4.5.32. Effect of TEL-NS and plain TEL on 1] Systolic blood pressure,2] Diastolic
blood pressure,3] Mean arterial blood pressure (MABP)
Figure 4.5.33. Histopathology of heart A] Control, B] Plain TEL, C] TEL-NS Figure 4.5.34. Histopathology of kidney A] Control, B] Plain TEL, C] TEL-NS Figure 4.5.35. Histopathology of liver A] Control, B] Plain TEL, C] TEL-NS
Figure 4.5.36. Contour plot of effect of TPGS concentration & rotation speed on particle size
Figure 4.5.37. Contour plot of effect of TPGS concentration & stirring time on particle size
Figure 4.5.38. Contour plot of effect of speed of rotation & time of stirring on particle size
Figure 4.5.39. Predicted vs Actual values of responses
Figure 4.5.40. Plot of residuals
Part II: Results and Discussion (CP)
Section 4.7.Nanosponge
Figure 4.7.1. Phase solubility plot for NS-CP
Figure 4.7.2. Solution state interaction studies of NS-CP
Figure 4.7.3 Saturation solubility in various media
Figure 4.7.4 Comparative dissolution profile of CP and NS-CP in various media
Figure 4.7.5. IR spectra of A=CP, B=NS C=NS-CP
Figure 4.7.6. DSC thermograms of A=CP, B=NS, C=NS-CP
Figure 4.7.7. PXRD spectra of A] CP, B] β-CD,C] NS,D] NS-CP
Figure 4.7.8. 3D image showing dimensions of CP molecule
Section 4.8.Nanosuspensions/Nanoparticles
Figure 4.8.1. Particle size distribution of CP nanosuspension (C0)
Figure 4.8.2. Particle size distribution of CP nanosuspension (C1)
Appendix 2
Solubility enhancement of BCS Class II/IV drugs 277
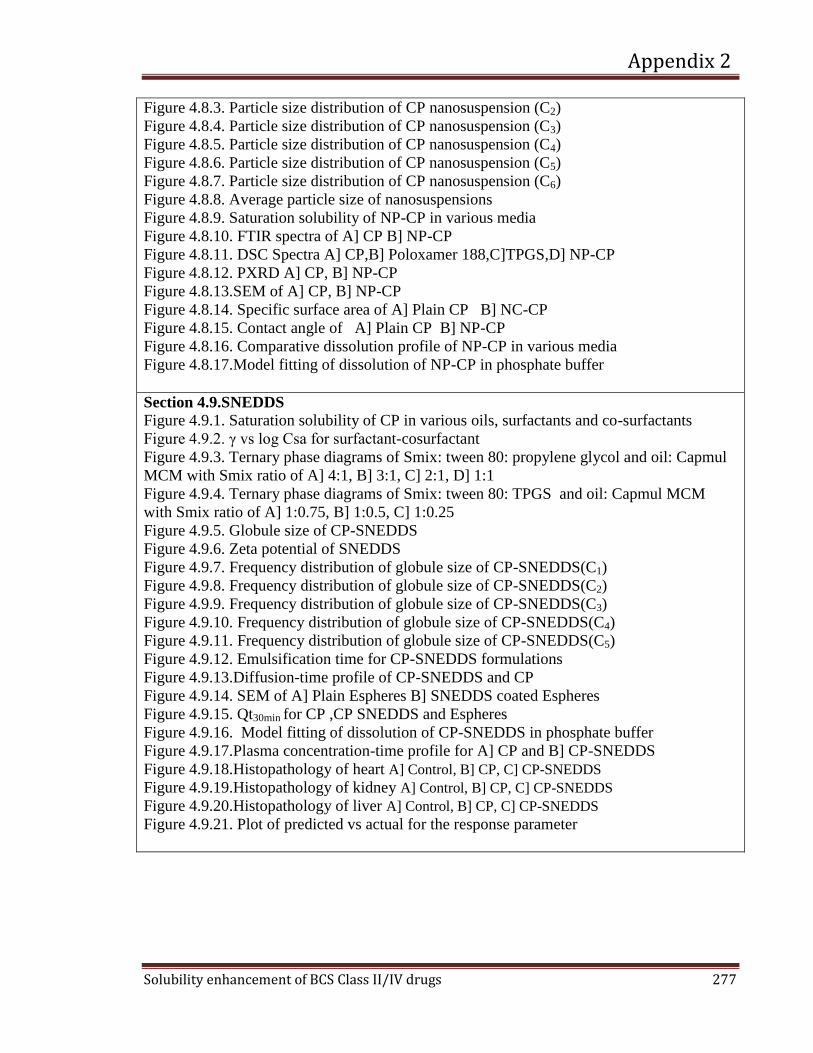
Figure 4.8.3. Particle size distribution of CP nanosuspension (C2)
Figure 4.8.4. Particle size distribution of CP nanosuspension (C3)
Figure 4.8.5. Particle size distribution of CP nanosuspension (C4)
Figure 4.8.6. Particle size distribution of CP nanosuspension (C5)
Figure 4.8.7. Particle size distribution of CP nanosuspension (C6)
Figure 4.8.8. Average particle size of nanosuspensions
Figure 4.8.9. Saturation solubility of NP-CP in various media
Figure 4.8.10. FTIR spectra of A] CP B] NP-CP
Figure 4.8.11. DSC Spectra A] CP,B] Poloxamer 188,C]TPGS,D] NP-CP
Figure 4.8.12. PXRD A] CP, B] NP-CP
Figure 4.8.13.SEM of A] CP, B] NP-CP
Figure 4.8.14. Specific surface area of A] Plain CP B] NC-CP Figure 4.8.15. Contact angle of A] Plain CP B] NP-CP
Figure 4.8.16. Comparative dissolution profile of NP-CP in various media
Figure 4.8.17.Model fitting of dissolution of NP-CP in phosphate buffer
Section 4.9.SNEDDS
Figure 4.9.1. Saturation solubility of CP in various oils, surfactants and co-surfactants
Figure 4.9.2. γ vs log Csa for surfactant-cosurfactant
Figure 4.9.3. Ternary phase diagrams of Smix: tween 80: propylene glycol and oil: Capmul
MCM with Smix ratio of A] 4:1, B] 3:1, C] 2:1, D] 1:1
Figure 4.9.4. Ternary phase diagrams of Smix: tween 80: TPGS and oil: Capmul MCM
with Smix ratio of A] 1:0.75, B] 1:0.5, C] 1:0.25
Figure 4.9.5. Globule size of CP-SNEDDS
Figure 4.9.6. Zeta potential of SNEDDS
Figure 4.9.7. Frequency distribution of globule size of CP-SNEDDS(C1)
Figure 4.9.8. Frequency distribution of globule size of CP-SNEDDS(C2)
Figure 4.9.9. Frequency distribution of globule size of CP-SNEDDS(C3)
Figure 4.9.10. Frequency distribution of globule size of CP-SNEDDS(C4)
Figure 4.9.11. Frequency distribution of globule size of CP-SNEDDS(C5)
Figure 4.9.12. Emulsification time for CP-SNEDDS formulations
Figure 4.9.13.Diffusion-time profile of CP-SNEDDS and CP
Figure 4.9.14. SEM of A] Plain Espheres B] SNEDDS coated Espheres
Figure 4.9.15. Qt30min for CP ,CP SNEDDS and Espheres
Figure 4.9.16. Model fitting of dissolution of CP-SNEDDS in phosphate buffer
Figure 4.9.17.Plasma concentration-time profile for A] CP and B] CP-SNEDDS
Figure 4.9.18.Histopathology of heart A] Control, B] CP, C] CP-SNEDDS
Figure 4.9.19.Histopathology of kidney A] Control, B] CP, C] CP-SNEDDS
Figure 4.9.20.Histopathology of liver A] Control, B] CP, C] CP-SNEDDS
Figure 4.9.21. Plot of predicted vs actual for the response parameter
Appendix 2
Solubility enhancement of BCS Class II/IV drugs 274
LIST OF FIGURES
Chapter 1:Introduction
Figure 1.1. Structure of Sulindac
Figure 1.2. Types of Cyclodextrins.
Figure 1.3.Toroidal structure of Cyclodextrin
Figure 1.4. Crosslinking of β-CD with diphenyl carbonate
Chapter 2: Preformulation studies
Section 2.1
Figure 2.1.1. UV spectrum of TEL
Figure 2.1.2. FT-IR spectra of TEL
Figure 2.1.3. DSC thermogram of TEL Figure 2.1.4. UV spectrum of CP
Figure 2.1.5. FT-IR spectra of CP
Figure 2.1.6. DSC thermogram of CP
Figure 2.1.7. FT-IR spectra of Vitamin E TPGS
Figure 2.1.8. FT-IR spectra of PEG 6000
Figure 2.1.9. FT-IR spectra of PVPK 30
Figure 2.1.10. FTIR spectra of Poloxamer 188
Figure 2.1.11. FT-IR spectra of β-CD
Section 2.2
Figure 2.2.1.FTIR spectra of A= TEL; B= β CD;C = NS; D = Drug loaded NS; E = NaHCO3
added Drug loaded NS
Figure 2.2.2. IR spectra of A=TEL,B= PVPK30 C=TEL-PVP
Figure 2.2.3. IR spectra of A=TEL,B= PEG 6000, C=TEL-PEG6000
Figure 2.2.4.IR spectra of A=TEL,B=P188 C=TEL-P188
Figure 2.2.5. IR spectra of A=TEL, B= TPGS,C=TEL-TPGS
Figure 2.2.6.IR spectra of A=CP, B=NS, C=CP-NS
Figure 2.2.7.IR spectra of A=CP, B=CP-Capmul MCM, C=CP-tween 80,D=CP-TPGS
Figure 2.2.8.IR spectra of A=CP, B=CP-P188, C=CP-TPGS,
Chapter 4:Results and Discussion
Part I:Analytical method development
Section 4.1.TEL
Figure 4.1.1.Calibration curve of TEL(DW)
Figure 4.1.2 Calibration curve of TEL(0.1N HCl)
Figure 4.1.3. Calibration curve of TEL(phosphate buffer pH 6.8)
Figure 4.1.4.Calibration curve of TEL(FaSSIF)
Figure 4.1.5 Calibration curve of TEL(FeSSIF)
Figure.4.1.6.Calibration curve for TEL(HPLC)
Figure 4.1.7.Representative chromatogram of TEL(HPLC)
Figure 4.1.8.Chromatogram of control (plasma)
Figure 4.1.9.Representative chromatogram of TEL extracted from plasma
Appendix 2
Solubility enhancement of BCS Class II/IV drugs 275
Figure 4.1.10. Calibration curve of TEL by HPLC (Bioanalytical)
Section 4.2.CP
Figure 4.2.1. Calibration curve of CP in DW
Figure 4.2.2. Calibration curve of CP in 0.1N HCl
Figure 4.2.3. Calibration curve of CP in phosphate buffer pH 6.8.
Figure 4.2.4. Calibration curve of CP in FaSSIF
Figure 4.2.5. Calibration curve of CP in FeSSIF
Figure 4.2.6. Calibration curve of CP in USP medium
Figure 4.2.7.Calibration curve of CP by HPLC
Figure 4.2.8. Representative chromatogram of CP by HPLC
Figure 4.2.9. Chromatogram of Control (plasma)
Figure 4.2.10. Representative Chromatogram of Cefpodoxime from rat plasma
Figure 4.2.11. Calibration curve for Cefpodoxime
Part II: Results and Discussion (TEL)
Section 4.4.Nanosponges
Figure 4.4.1. Schematic representation of chemical reaction between β-CD and DPC.
Figure 4.4.2. NMR spectra of (A) β-CD; (B) NS2.
Figure 4.4.3. Phase-solubility profiles
Figure 4.4.4. Phase solubility diagram in water.
Figure 4.4.5. Solution state interaction studies of TEL
Figure 4.4.6. 3D image of depicting dimensions of TEL molecule
Figure 4.4.7. 3D image showing possible mode of entrapment of TEL in β CD structure
Figure 4.4.8. 3D image showing possible mode of entrapment of TEL in NS structure
Figure 4.4.9. Inclusion complex of β-CD and TEL
Figure 4.4.10.Saturation solubility in various media
Figure 4.4.11. FTIR spectra of A= TEL; B= β- CD; C = NS; D = Drug loaded NS; E =
NaHCO3 added Drug loaded NS.
Figure 4.4.12. DSC spectra of A= TEL, B= β – CD, C=NS, D= Drug loaded NS; E =
NaHCO3added Drug loaded NS.
Figure 4.4.13. PXRD spectra of A= TEL , B= β – CD,C=NS , D= Drug loaded NS.
Figure 4.4.14. SEM of (A) TEL; (B) β- CD; (C) NS; (D) Drug loaded NS.
Figure 4.4.15.Dissolution profiles of TEL complexes in DW
Figure 4.4.16.Dissolution profiles of TEL complexes in 0.1 N HCl
Figure 4.4.17. Dissolution profiles of TEL complexes in buffer pH 6.8.
Section 4.5:Nanosuspensions/Nanocrystals
Figure 4.5.1. Particle size distribution of TEL nanosuspension(T0)
Figure 4.5.2. Particle size distribution of TEL nanosuspension(T1)
Figure 4.5.3. Particle size distribution of TEL nanosuspension(T2)
Figure 4.5.4. Particle size distribution of TEL nanosuspension(T3)
Figure 4.5.5. Particle size distribution of TEL nanosuspension(T4)
Figure 4.5.6. Particle size distribution of TEL nanosuspension(T5)
Figure 4.5.7. Particle size distribution of TEL nanosuspension(T6)
Figure 4.5.8. Particle size distribution of TEL nanosuspension(T7)
Appendix 2
Solubility enhancement of BCS Class II/IV drugs 276
Figure 4.5.9. Particle size distribution of TEL nanosuspension(T8)
Figure 4.5.10. Particle size distribution of TEL nanosuspension(T9)
Figure 4.5.11. Average particle size of TEL nanosuspensions
Figure 4.5.12.Stern model showing the course of the potential in the electrical double layers
Figure 4.5.13.Adsorbed polymer layer shift the plane of shear from particle surface
Figure 4.5.14.Saturation solubility of TEL and NC in different media
Figure 4.5.15.IR spectra of A)TEL,B)PVPK30, C)TEL-PVPK30
Figure 4.5.16. IR spectra of A)TEL,B)PEG6000,C)TEL-PEG6000
Figure 4.5.17. IR spectra of A)TEL, B) P188,C)TEL-P188
Figure 4.5.18. IR spectra of A)TEL, B)TPGS,C)TEL-TPGS
Figure 4.5.19. DSC thermograms of A) TEL B) NC-TEL
Figure 4.5.20. PXRD spectra of A] TEL, B] NC-TEL
Figure 4.5.21. Specific surface area A] Plain TEL B] NC-TEL
Figure 4.5.22. Contact angle of A] Plain TEL B] NC-TEL
Figure 4.5.23. SEM of A) TEL B) NC-TEL
Figure 4.5.24. Gas chromatogram of A) DCM B) NC- TEL
Figure 4.5.25.SEM of A] Plain Espheres B] Nanosuspension coated Espheres
Figure 4.5.26. Qt30min for TEL, NC-TEL and pellets Figure 4.5.27. Dissolution profile of TEL nanosuspension spray coated Espheres in 0.1NHCl
Figure 4.5.28. Particle size distribution of nanosuspension (T8) kept at room temperature Figure 4.5.29. Particle size distribution of nanosuspension (T8) kept at 40 ºC /75% RH
Figure 4..5.30. Particle size distribution of nanosuspension (T8) kept under refrigeration Figure 4.5.31. Plasma concentration-time profile for A] TEL and B] TEL-Nanosuspension
Figure 4.5.32. Effect of TEL-NS and plain TEL on 1] Systolic blood pressure,2] Diastolic
blood pressure,3] Mean arterial blood pressure (MABP)
Figure 4.5.33. Histopathology of heart A] Control, B] Plain TEL, C] TEL-NS Figure 4.5.34. Histopathology of kidney A] Control, B] Plain TEL, C] TEL-NS Figure 4.5.35. Histopathology of liver A] Control, B] Plain TEL, C] TEL-NS
Figure 4.5.36. Contour plot of effect of TPGS concentration & rotation speed on particle size
Figure 4.5.37. Contour plot of effect of TPGS concentration & stirring time on particle size
Figure 4.5.38. Contour plot of effect of speed of rotation & time of stirring on particle size
Figure 4.5.39. Predicted vs Actual values of responses
Figure 4.5.40. Plot of residuals
Part II: Results and Discussion (CP)
Section 4.7.Nanosponge
Figure 4.7.1. Phase solubility plot for NS-CP
Figure 4.7.2. Solution state interaction studies of NS-CP
Figure 4.7.3 Saturation solubility in various media
Figure 4.7.4 Comparative dissolution profile of CP and NS-CP in various media
Figure 4.7.5. IR spectra of A=CP, B=NS C=NS-CP
Figure 4.7.6. DSC thermograms of A=CP, B=NS, C=NS-CP
Figure 4.7.7. PXRD spectra of A] CP, B] β-CD,C] NS,D] NS-CP
Figure 4.7.8. 3D image showing dimensions of CP molecule
Section 4.8.Nanosuspensions/Nanoparticles
Figure 4.8.1. Particle size distribution of CP nanosuspension (C0)
Figure 4.8.2. Particle size distribution of CP nanosuspension (C1)

Appendix 2
Solubility enhancement of BCS Class II/IV drugs 277
Figure 4.8.3. Particle size distribution of CP nanosuspension (C2)
Figure 4.8.4. Particle size distribution of CP nanosuspension (C3)
Figure 4.8.5. Particle size distribution of CP nanosuspension (C4)
Figure 4.8.6. Particle size distribution of CP nanosuspension (C5)
Figure 4.8.7. Particle size distribution of CP nanosuspension (C6)
Figure 4.8.8. Average particle size of nanosuspensions
Figure 4.8.9. Saturation solubility of NP-CP in various media
Figure 4.8.10. FTIR spectra of A] CP B] NP-CP
Figure 4.8.11. DSC Spectra A] CP,B] Poloxamer 188,C]TPGS,D] NP-CP
Figure 4.8.12. PXRD A] CP, B] NP-CP
Figure 4.8.13.SEM of A] CP, B] NP-CP
Figure 4.8.14. Specific surface area of A] Plain CP B] NC-CP Figure 4.8.15. Contact angle of A] Plain CP B] NP-CP
Figure 4.8.16. Comparative dissolution profile of NP-CP in various media
Figure 4.8.17.Model fitting of dissolution of NP-CP in phosphate buffer
Section 4.9.SNEDDS
Figure 4.9.1. Saturation solubility of CP in various oils, surfactants and co-surfactants
Figure 4.9.2. γ vs log Csa for surfactant-cosurfactant
Figure 4.9.3. Ternary phase diagrams of Smix: tween 80: propylene glycol and oil: Capmul
MCM with Smix ratio of A] 4:1, B] 3:1, C] 2:1, D] 1:1
Figure 4.9.4. Ternary phase diagrams of Smix: tween 80: TPGS and oil: Capmul MCM
with Smix ratio of A] 1:0.75, B] 1:0.5, C] 1:0.25
Figure 4.9.5. Globule size of CP-SNEDDS
Figure 4.9.6. Zeta potential of SNEDDS
Figure 4.9.7. Frequency distribution of globule size of CP-SNEDDS(C1)
Figure 4.9.8. Frequency distribution of globule size of CP-SNEDDS(C2)
Figure 4.9.9. Frequency distribution of globule size of CP-SNEDDS(C3)
Figure 4.9.10. Frequency distribution of globule size of CP-SNEDDS(C4)
Figure 4.9.11. Frequency distribution of globule size of CP-SNEDDS(C5)
Figure 4.9.12. Emulsification time for CP-SNEDDS formulations
Figure 4.9.13.Diffusion-time profile of CP-SNEDDS and CP
Figure 4.9.14. SEM of A] Plain Espheres B] SNEDDS coated Espheres
Figure 4.9.15. Qt30min for CP ,CP SNEDDS and Espheres
Figure 4.9.16. Model fitting of dissolution of CP-SNEDDS in phosphate buffer
Figure 4.9.17.Plasma concentration-time profile for A] CP and B] CP-SNEDDS
Figure 4.9.18.Histopathology of heart A] Control, B] CP, C] CP-SNEDDS
Figure 4.9.19.Histopathology of kidney A] Control, B] CP, C] CP-SNEDDS
Figure 4.9.20.Histopathology of liver A] Control, B] CP, C] CP-SNEDDS
Figure 4.9.21. Plot of predicted vs actual for the response parameter
Appendix 3
Solubility enhancement of some BCS Class II/IV 278
Abbreviations
An: Absorption number NMP: N-methyl pyrrolidone
AUC: Area under curve NP-CP: Nanoparticles of cefpodoxime proxetil
AUMC: Area under first moment curve PDI: Polydispersity index
BCS: Biopharmaceutical classification system PEG: polyethylene glycol
CD: Cyclodextrin PG: Propylene glycol
Cmax: Peak plasma concentration PM: Physical mixture
CMC: Critical micelle concentration PVP: polyvinylpyrrolidone
CP: Cefpodoxime proxetil SEDDS: Self emulsifying drug delivery system
CP-NS: Nanosponges of cefpodoxime proxetil SMEDDS: Self microemulsifying drug delivery system
CP-NP: Nanoparticles of cefpodoxime proxetil SNEDDS: Self nanoemulsifying drug delivery system
CP-SNEDDS:SNEDDS of cefpodoxime proxetil TEL: Telmisartan
DCM: Dichloromethane TEL-NC: Telmisartan nanocrystals
DMSO: Dimethyl sulfoxide TEL-NS: Telmisartan nanosuspension
DPC: Diphenyl carbonate TPGS: Tocopherol polyethylene glycol succinate
Dn: Dissolution number T80: Tween 80
Do: Dose number Tmax: Time to reach peak plasma concentration
DW: Distilled water
FaSSIF: Fasting state simulated intestinal fluid
FeSSIF: Fed state simulated intestinal fluid
HLB: Hydrophilic lipophilic balance
Kel: Elimination rate constant
MRT: Mean residence time
NC-TEL: Nanocrystals of telmisartan
NS : Nanosponges
NS-CP: Cefpodoxime nanosponge
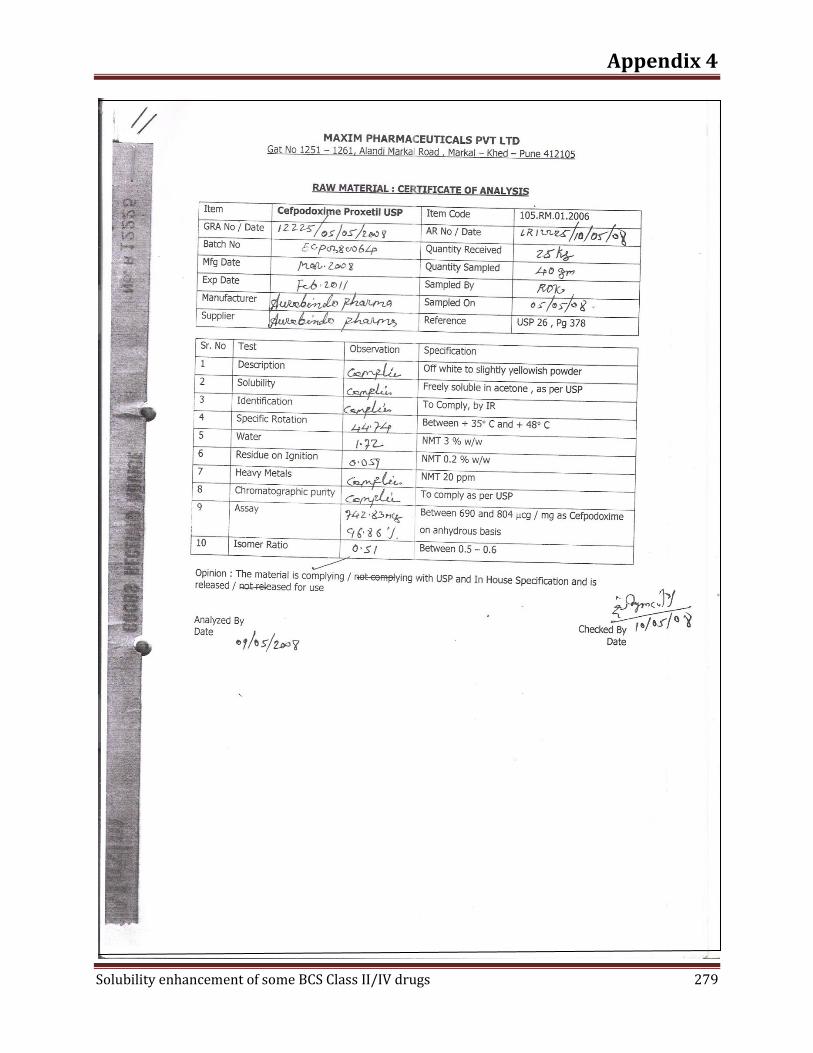
Appendix 4
Solubility enhancement of some BCS Class II/IV drugs 279

Appendix 4
Solubility enhancement of some BCS Class II/IV drugs 280

Appendix 4
Solubility enhancement of some BCS Class II/IV drugs 281
Appendix 4
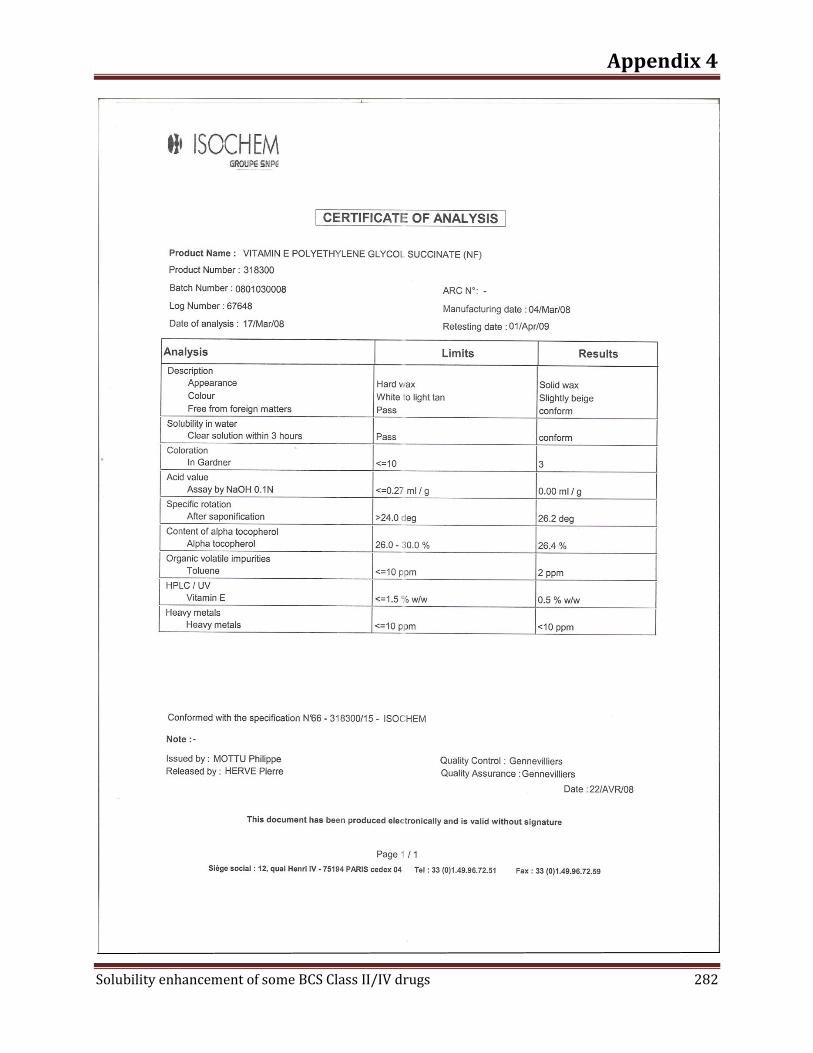
Solubility enhancement of some BCS Class II/IV drugs 282


![SOLUBILITY AND SOLUBILITY PRODUCT - Instruct · SOLUBILITY AND SOLUBILITY PRODUCT [MH 5; 16.1 & 16.2] • In this section we are going to consider the solubility of ionic solids in](https://img.pdfslide.us/doc/110x75/5ae1efb27f8b9a90138bbc8f/solubility-and-solubility-product-instruct-and-solubility-product-mh-5-161.jpg)