Embed Size (px)
Citation preview
!289
APPENDIX 1
A new algorithm for identification of Stress responsive
TranscrIption Factor binding sites (STIF) and a database of
abiotic stress responsive transcription factors in Arabidopsis
thaliana (STIFDB)
Publications from this chapter:
• K. Shameer, S. Ambika, S. M. Varghese, N. Karaba, M. Udayakumar and R. Sowdhamini: STIFDB – Arabidopsis Stress responsive TranscrIption Factor DataBase, (2009) et.al; Int. Journal of Plant Genomics: 583429
• Sundar AS, Varghese SM, K. Shameer, Karaba N, Udayakumar M, R. Sowdhamini: STIF: Identification of stress-upregulated transcription factor binding sites in Arabidopsis thaliana. (2008) Bioinformation. 30; 2(10).

!290
A: 1.1 Introduction
Transcription factors play a pivotal role in the cell by regulating differential expression of
genes required for a particular molecular function of biological process in the complex
cellular environment. The expressions of proteins in the cell are carefully regulated by
transcription factors that interact with their downstream targets in specific signal transduction
cascades. Our understanding of the regulation of functional genes responsive to a plant
abiotic stress signals is still nascent [638]. Understanding the molecular mechanisms that
underlie stress tolerance would be the first step in the generation of abiotic stress tolerant
crops. To understand plant abiotic stress responses, unraveling the mechanisms of regulation
of abiotic stress responsive genes assumes paramount importance. Gene regulation by
Transcription Factors (TFs) is an important facet of stress responsive signal transduction
cascades. Transcription factors are regulatory proteins that implement their functions by
binding directly to the promoters of target genes in a sequence-specific manner to either
activate or repress the transcription of downstream target genes. Arabidopsis thaliana is a
convenient plant model system to study fundamental questions related to regulation of the
stress transcriptome. Microarray experiments of the A. thaliana transcriptome indicate that
several genes could be up regulated during multiple stresses, such as cold, salinity, drought
etc. Experimental biochemical validations have proved the involvement of several
transcription factors could be involved in the up regulation of these stress responsive genes
[3, 639]. Bioinformatics approaches are widely employed in multiple domains of plant
biology to understand various aspects in the context of fundamental, cellular or biochemical
level [640]. In order to follow the intricate and complicated networks of transcription factors
and genes that respond to plant abiotic stress situations in plants, a new algorithm for the
identification of key transcription factor binding sites that are present in the upstream of
genes of interest was developed. Hidden Markov models of the transcription factor binding
sites enable the identification of predicted sites upstream of abiotic stress genes in A.
thaliana. The search algorithm named as ‘STIF’ was assessed for its performance using a set
of genes reported to be up regulated during abiotic stress response in A. thaliana [636]. The
algorithm performed well, with more than 90% sensitivity, when tested on experimentally
validated positions of transcription factor binding sites on a dataset of 29 plant abiotic stress
up regulated genes. Further, the algorithm is applied on a larger dataset of 2, 629 genes from
A. thaliana genome. The genes are extracted from various public microarray datasets related
to abiotic stress response experiments in A. thaliana. 2, 629 genes are scanned using the
algorithm for potential abiotic stress responsive transcription factor binding sites. A new

!291
database called “STIFDB [Stress responsive TranscrIption Factor DataBase]” is compiled,
developed and provided in the public domain [637, 641]. STIFDB is developed a database of
plant abiotic stress responsive genes and their predicted abiotic transcription factor binding
sites in A. thaliana. STIFDB will be a useful resource for researchers to understand the
abiotic stress regulome and transcriptome of this important model plant system. This Chapter
details various aspects of the new HMM based algorithm for the identification of plant abiotic
stress responsive transcription factor binding sites, database and also discusses about the
generic trends of the genes and transcription factors available in STIFDB.
A: 1.2 STIF Algorithm
The interactions between regulatory proteins and DNA control many important processes and
responses to abiotic stresses, and defects in these interactions can contribute to inefficient
stress responses. Numerous studies have shown that transcription factors are important in
regulating plant responses to stress. One important step in the control of stress responses is
the transcriptional activation or repression (regulation) of genes. Databases, such as
ATHAMAP, offer information about the chromosomal positions of genes of interest and
possible location of their transcription factors and binding sites [642]. Multiple signaling
pathways regulate the stress responses of plants and there is significant overlap between the
patterns of gene expression that are induced in plants in response to different stresses [643].
Many genes induced by stress challenges, including those encoding transcription factors,
have been identified and some of them have been shown to be essential for stress tolerance
[644]. Many studies have also revealed some of the complexity and overlap in the responses
to different stresses, and are likely to lead to new ways to enhance crop tolerance to disease
and environmental stress. The binding specificities of only a small number of transcription
factors (TFs) are well characterized. Transcription-factor binding sites (TFBSs) are usually
short in length (around 5-15 base-pairs (bp)) and they frequently contain degenerate sequence
motifs. The sequence degeneracy of TFBSs has been selected through evolution and is
beneficial, because it confers different levels of activity upon different promoters. Much of
the information on TF binding specificity has been determined using traditional
methodologies, such as foot-printing methods, (that identify the region of DNA protected by
a bound protein), nitrocellulose binding assays, South-western blotting (of both DNA and
protein) or reporter constructs. These methods are generally quite time-consuming and are
not readily scalable to a whole genome [645]. One of the promising approaches is to identify
the transcription factors by computational techniques at a whole genome level so as to choose
!292
promising targets for detailed experimental investigation. Well-known eukaryotic
transcription factors and their binding sites are recorded in TRANSFAC database [646].
Computational tools are available to facilitate the retrieval of transcription factor binding site
information from TRANSFAC database, but for the human genome [647]. Several existing
algorithms use position-specific profiles [648, 649] based scoring schemes or probabilistic
models to recognize putative binding sites. Even though various bioinformatics tools are
available in the public domain for transcription factor binding site prediction, most of the
servers and algorithms are largely for eukaryotic general-purpose transcription factors and
not specific for plant genomes or plant abiotic stress responsive genes. There are other
computational algorithms to search for possible genes that are downstream of classical
transcription factor binding sites, where the binding site data are encoded as HMMs and
searched all around the genome of interest. These methods are called as ‘targeted gene
finding’ since they begin from known transcription factor binding sites [648]. However, this
approach is complicated for plant stress genes since stress TF-binding site signatures could
potentially be upstream of constitutive genes as well and there could also be overlap in
various transcription factor binding sites. Data of a set of 10 well-known plant abiotic stress
specific transcription factors were curated from literature and generated Hidden Markov
Models (HMM) of known transcription factor binding sites. This knowledge-based approach,
by building HMM models through well-known abiotic stress cis-elements, has been tested
extensively to standardize thresholds for scores. ‘STIF’ is basically an HMM based algorithm
developed to predict transcription factor binding sites in the upstream and 5'UTR regions of
genes extracted from TAIR. Program based on STIF algorithm accepts a DNA sequence
(Upstream region + 5'UTR) in FASTA format as the input. Extensive experimental results
show that abiotic stress responsive transcription factors fall into ten transcription factor
families [650, 651]. These are ABI3/VP1, AP2/EREBP, ARF, bHLH, bZIP, HB, HSF, Myb,
NAC and WRKY families, which have a total of 22 subfamilies. Abiotic stress responsive
transcription factors largely belong to one of these 22 TF subfamilies (Table A3). Input
sequence is scanned using library of these 22 pre-constructed stress responsive transcription
factor HMMs obtained from literature. Input sequences are scanned for matches to the HMM
models. Subsequent to the HMM search, scores of all possible matches in forward and
reverse orientations in the upstream regions of stress genes are calculated along with standard
deviation and average. Based on STIF search results, hits are scored using significant scoring
method. In the final step Standard deviation, average and significant score base on hits are
used to calculate the Z-score and normalization. Hidden Markov Model (HMM) is used for

!293
transcription factor binding site detection in STIF algorithm. The consensus (S) of length (L)
was taken from the literature and the probabilistic score (P(S)) and log-odd score were
calculated.
P(S) = F * T
Where P(S) – Probability of consensus
F – Frequency (i.e. No:. of particular nucleotide/ Total no in column)
T – Transition probability
The log odd-score for consensus
(S) = log P(S) – L (AT) log 0.375 + L(GC) log 0.125
As plant sequences are rich in GC content, higher weight is assigned to AT than GC in log-
odd score. Schematic representation of the STIF algorithm is provided in Figure A1.
A: 1.3 Implementation of STIF Algorithm
STIF algorithm and associated scripts for HMM related computation, searching, calculation
of statistics and input - output parsing and other calculations like Z-Score and normalization
were coded in Perl. Flowchart of the algorithm is provided in Figure A2.
A:1.4 Statistical Validation of STIF Algorithm
A new transcription factor binding site prediction algorithm ‘STIF’ was been developed to
identify potential TFBS of stress-specific transcription factors, using the Hidden Markov
Models. The HMM models of cis-elements, based on abiotic stress transcription factor
families, were validated using Jackknifing method. HMM-based search algorithm STIF is
used to search 100 base pairs upstream of the gene with its 5’UTR. A set of 29 abiotic stress
genes from public microarray databases based on the high stress-induced expression profiles
were selected for the candidate genes for validation [652] . To evaluate the method further,
sequence searches are performed against 1000 base pairs with its 5’UTR. In the validation
data set, at a Z-score of 2.0 when searched 100 base pairs with 5’UTR, the sensitivity of the
method is found to be very high and the method identified 18 out of 20 hits (95% coverage)
with only two false negatives. Based on the statistical observations, a Z-score of 2.0 or more
could be defined as effective to search and predict transcription factor binding sites 100 base
pairs with 5’UTR. In several instances, more than one transcription factor has been recorded
for a stress gene of interest (for instance, COR15a has both DREB_AP2_EREBP and
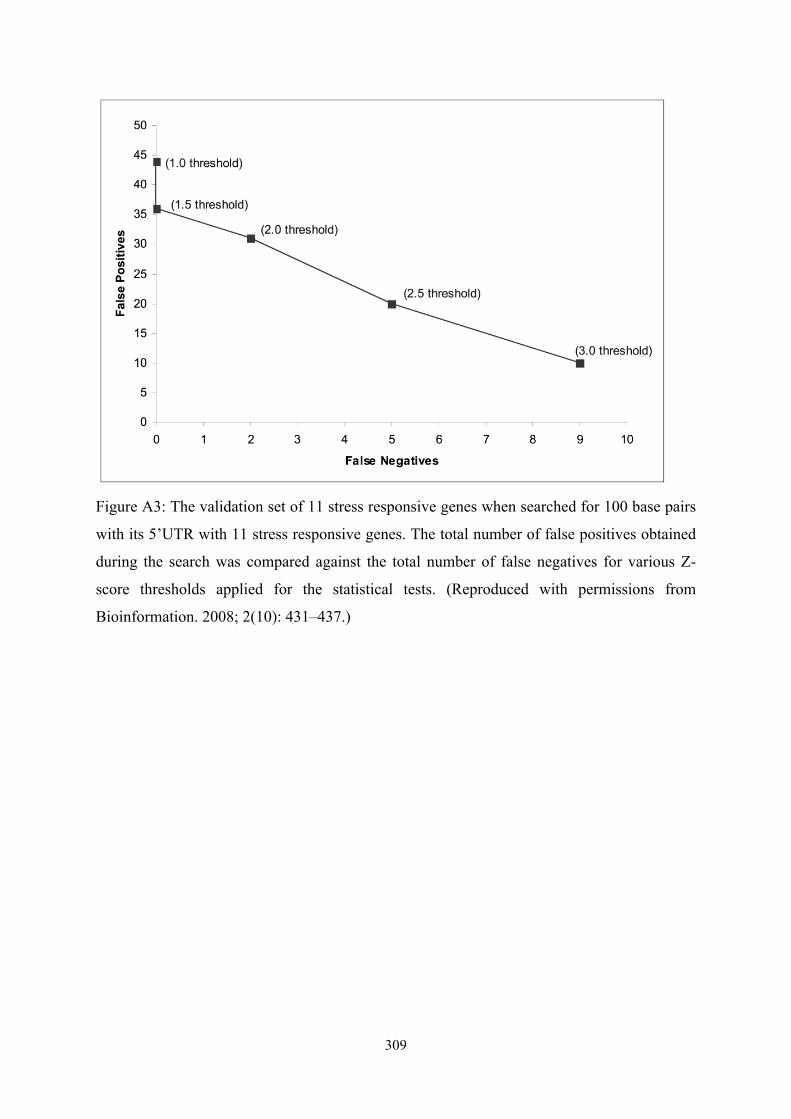
G_ABRE_bZIP (Figure A3, Table A1). The 29 stress genes considered for validation is
known to be upregulated during different types of stress – such as cold, dehydration, salinity
!294
etc. It is possible that, during a particular type of abiotic stress, any one of these transcription
factors would selectively respond by binding upstream of the gene of interest. Due to few
‘validated’ transcription factor binding sites mapped in the 100 base pairs upstream of stress
genes, validation searches where extended to 1000 base pairs upstream of the gene and
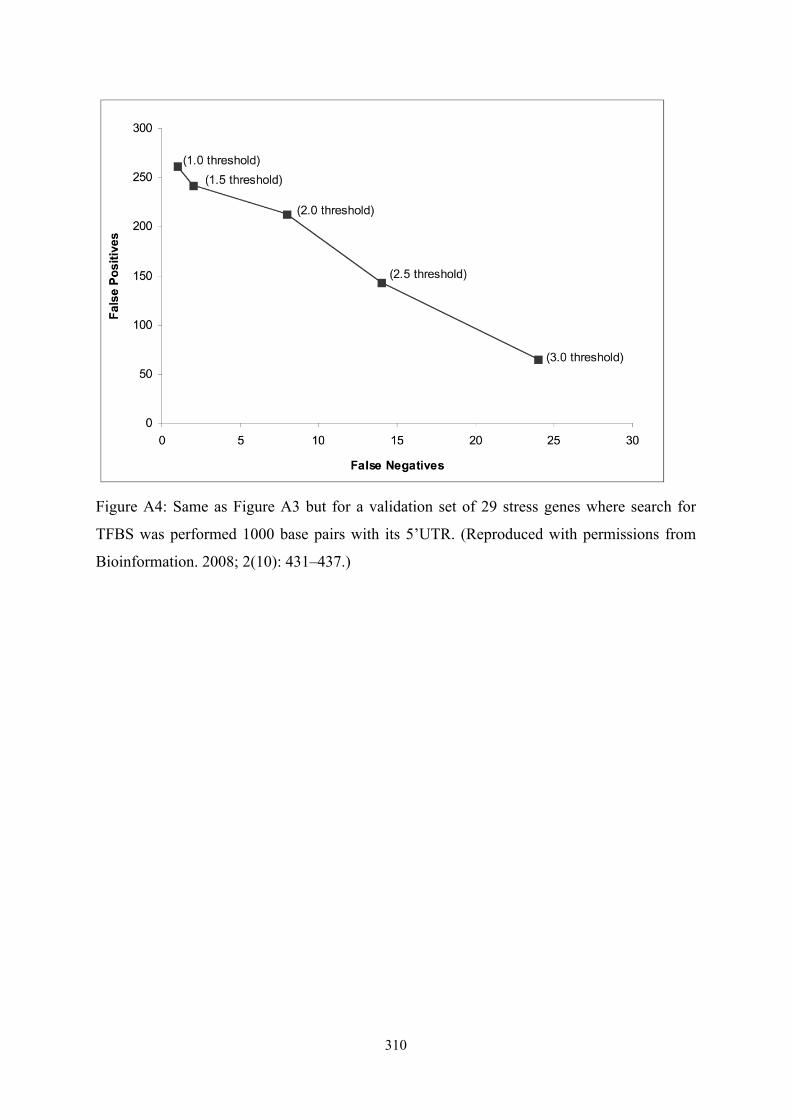
likewise a Z-score threshold of 1.5 is appropriate for 1000 base pairs with 5’UTR (Figure A4,
Table A2). 90% sensitivity is achieved in STIF, where 71 out of 78 hits could be correctly
identified with Z-scores above the threshold. As with most other algorithms, method is not
highly specific and can generate false positives. The specificities for searches in the
validation set, by searching 100 base pairs and 1000 base pairs, is 57 and 18.6 (for Z-score
threshold of 1.5) and 54 and 20.4 (for Z-score threshold of 2.0), respectively. The difficulty in
obtaining high specificities has been due to simple and short nucleotide patterns that describe
some of the transcription factors like bHLH. Such TFs would respond frequently and that too
with very good match with HMM and are reflected as high scores. An alternate normalized
score were proposed for these frequently responding TFs in Arabidopsis genome. STIF
employs Hidden Markov Models of binding site information of well-known plant
transcription factors in abiotic stress. Microarray results of key stress up regulated genes in
plants have shown that a large number of these genes are up regulated in response to a variety
of genes generating redundancy in the dataset of stress up regulated plant genes. Further, the
experimentally ‘validated’ results also indicate that more than one transcription factor can
induce the expression of the stress genes in archived in STIFDB. The scoring schemes and
thresholds established should be useful for dealing with redundancy and occurrence of
multiple true positives.
A: 1.5 STIFDB [Arabidopsis Stress responsive Transcription Factor Database]
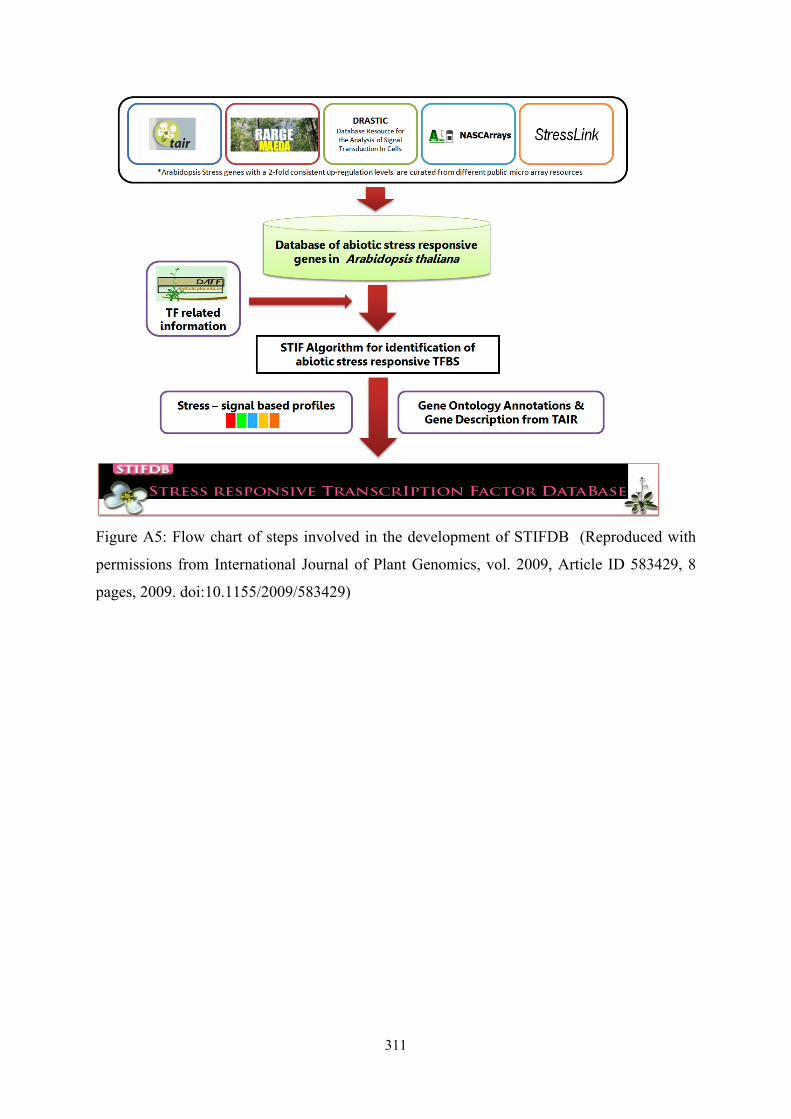
The list of 2,629 genes in STIFDB was compiled from various abiotic stress-related
microarray experiments. Genes were obtained from gene expression databases like the
Nottingham Arabidopsis Stock Centre (NASC) [653], Database Resource for Analysis of
Signal Transduction in Cells (DRASTIC) [654], Microarray Expression Data Search of the
Riken Arabidopsis Genome Encyclopedia (RARGE-MAEDA) [655], and the StressLink
Database [656]. Genes that are consistently upregulated in at least 3 replicates) of microarray
experiments in response to various stress treatments like dehydration, drought, osmotic stress,
salinity stress, ABA, cold, high light, and oxidative stress across various microarray
experiments have been considered as stress responsive and included in the database. In cases
where fold increases in expression levels were available, genes with a 4-fold expression
!295
change was used to consider the gene as a probable candidate for STIFDB. Sequence
segments (1000 bp, 100 bp, and 5*UTR) of genes were obtained from TAIR. The collected
sequences were scanned further to identify potential abiotic stress responsive TFBS using the
STIF algorithm [636]. 22 HMM-based models of the 10 specific families including
subfamilies are used in the STIF algorithm to scan for binding sites using STIF algorithm
(see Table A3 and Table A4). Literature is consulted to validate the transcription factor
binding sites predicted by the STIF algorithm for 29 genes. STIFDB provides the 1000+bp
promoter regions, along with their 5*UTR sequences, extracted from TAIR, and identifies
known transcription factor binding sites/cis-elements bound by abiotic stress responsive
transcription factors. Flow chart of the data integration steps involved in the development of
STIFDB is provided in Figure A5.
A: 1.5 Features of STIFDB
STIFDB offers several unique features as well as integrated data from public resources that
will be useful for the better understanding of the TFBS and function of the downstream
genes.
A: 1.5.1 TFmap
TFmap [657] is a graphical representation of the upstream regions of the stress genes in
Arabidopsis thaliana with the predicted and the validated transcription factor binding sites
marked along with their Z-Scores. TFmaps are generated using Bio::Graphics module from
Bioperl [267]. TFmap with the validated and predicted transcription factors marked on the
1000bp upstream of the gene AT1G02920 is given in Figure A6.
A: 1.5.2 TAIR ID
The Arabidopsis Information Resource (TAIR) [658, 659] maintains a database of genetic
and molecular biology data for the plant model system A. thaliana. TAIR ID is used in
STIFDB to access the gene-based contents. Users can query the database using TAIR ID.
A: 1.5.3 Gene Ontology
GO annotations [6, 660] of the genes in STIFDB are obtained from TAIR. GO annotations
will help the users to understand the known functional associations of genes in STIFDB.
A: 1.5.4 Gene Description
!296
Gene description provides a short description of genes along with predicted domain
associations from InterPro database [164, 661]. Gene descriptions for genes reported in
STIFDB are obtained from TAIR [658, 659].
A: 1.5.5 Gene Names [Including Aliases]
Users can access STIFDB using standard gene names or its aliases reported in TAIR
database. For Example: TAIR ID - AT4G23600 refers to the single entry in the database with
different aliases CORI3, CORONATINE INDUCED 1, JASMONIC ACID RESPONSIVE 2
and JR2.
A: 1.5.6 Chromosome Position
Chromosome Position refers to the exact location of the given stress gene among the 5 A.
thaliana chromosomes.
A: 1.5.7 References to Publication and Related Resources
References to publications and related resources are provided along with individual gene
related information.
A: 1.5.8 Transcription Factor Family Name
This refers to the Transcription Factor Family whose binding site sequence has been
located/predicted on a given promoter sequence. This database identifies binding sites of the
ten stress responsive transcription factor families and their subfamilies.
A: 1.5.9 Binding Site Information
Binding site refers to the core binding sequence to which a transcription factor binds. The
binding site sequences have been characterized in literature reports and the accompanying
references are provided.
A: 1.5.10 Orientation of Binding Sites
Orientation of Binding Sites refers to the DNA strand on which the transcription factor-
binding site has been located. It can be either on the forward strand or on the reverse DNA
strand.
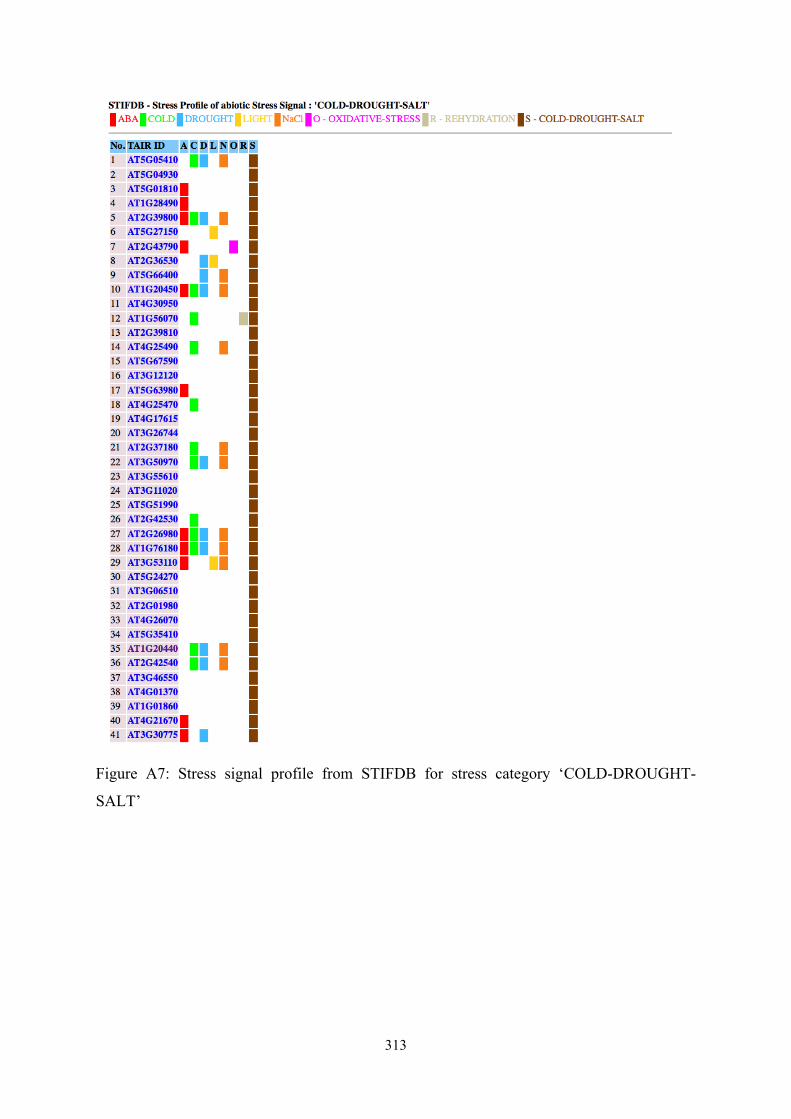
A: 1.5.11 Stress Signals
!297
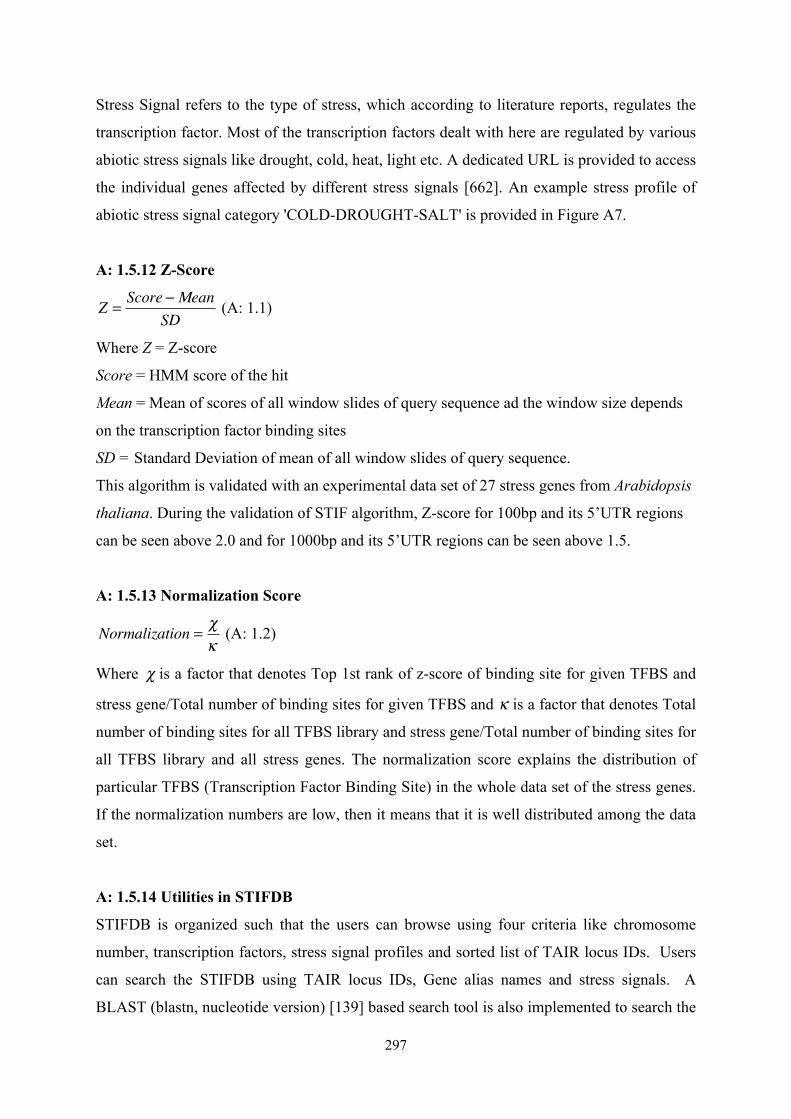
Stress Signal refers to the type of stress, which according to literature reports, regulates the
transcription factor. Most of the transcription factors dealt with here are regulated by various
abiotic stress signals like drought, cold, heat, light etc. A dedicated URL is provided to access
the individual genes affected by different stress signals [662]. An example stress profile of
abiotic stress signal category 'COLD-DROUGHT-SALT' is provided in Figure A7.
A: 1.5.12 Z-Score
Z =Score ! Mean
SD!(A: 1.1)
Where Z = Z-score
Score = HMM score of the hit
Mean = Mean of scores of all window slides of query sequence ad the window size depends
on the transcription factor binding sites
SD = Standard Deviation of mean of all window slides of query sequence.
This algorithm is validated with an experimental data set of 27 stress genes from Arabidopsis
thaliana. During the validation of STIF algorithm, Z-score for 100bp and its 5’UTR regions
can be seen above 2.0 and for 1000bp and its 5’UTR regions can be seen above 1.5.
A: 1.5.13 Normalization Score
Normalization =!"
!(A: 1.2)
Where ! is a factor that denotes Top 1st rank of z-score of binding site for given TFBS and
stress gene/Total number of binding sites for given TFBS and ! is a factor that denotes Total
number of binding sites for all TFBS library and stress gene/Total number of binding sites for
all TFBS library and all stress genes. The normalization score explains the distribution of
particular TFBS (Transcription Factor Binding Site) in the whole data set of the stress genes.
If the normalization numbers are low, then it means that it is well distributed among the data
set.
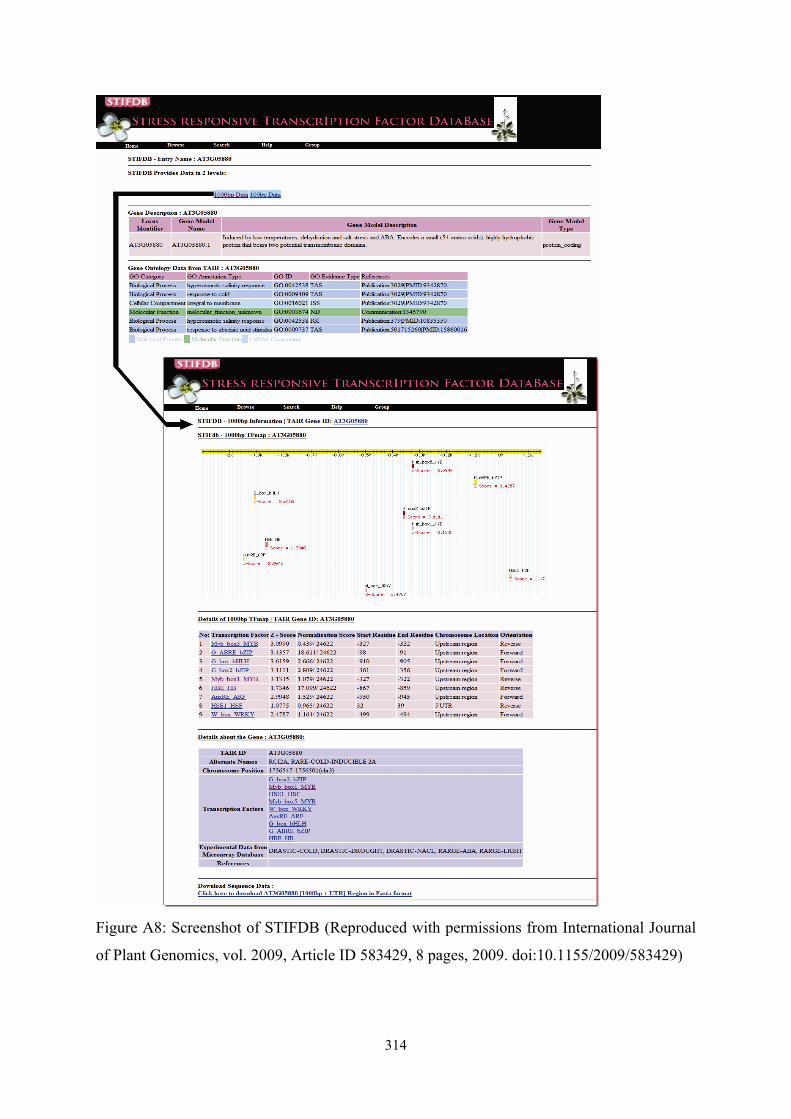
A: 1.5.14 Utilities in STIFDB
STIFDB is organized such that the users can browse using four criteria like chromosome
number, transcription factors, stress signal profiles and sorted list of TAIR locus IDs. Users
can search the STIFDB using TAIR locus IDs, Gene alias names and stress signals. A
BLAST (blastn, nucleotide version) [139] based search tool is also implemented to search the

!298
database of 1000bp promoter sequences of 2629 genes in STIFDB. A detailed screenshot of
STIFDB with various features are provided in Figure A8.
A: 1.5.15 Technical Details
STIFDB is developed on a MySQL backend [326]. Web interface of STIFDB is developed
using HTML, and JavaScript. Perl-CGI programs are used for the development of search,
query and retrieval system.
A: 1.6 Discussion
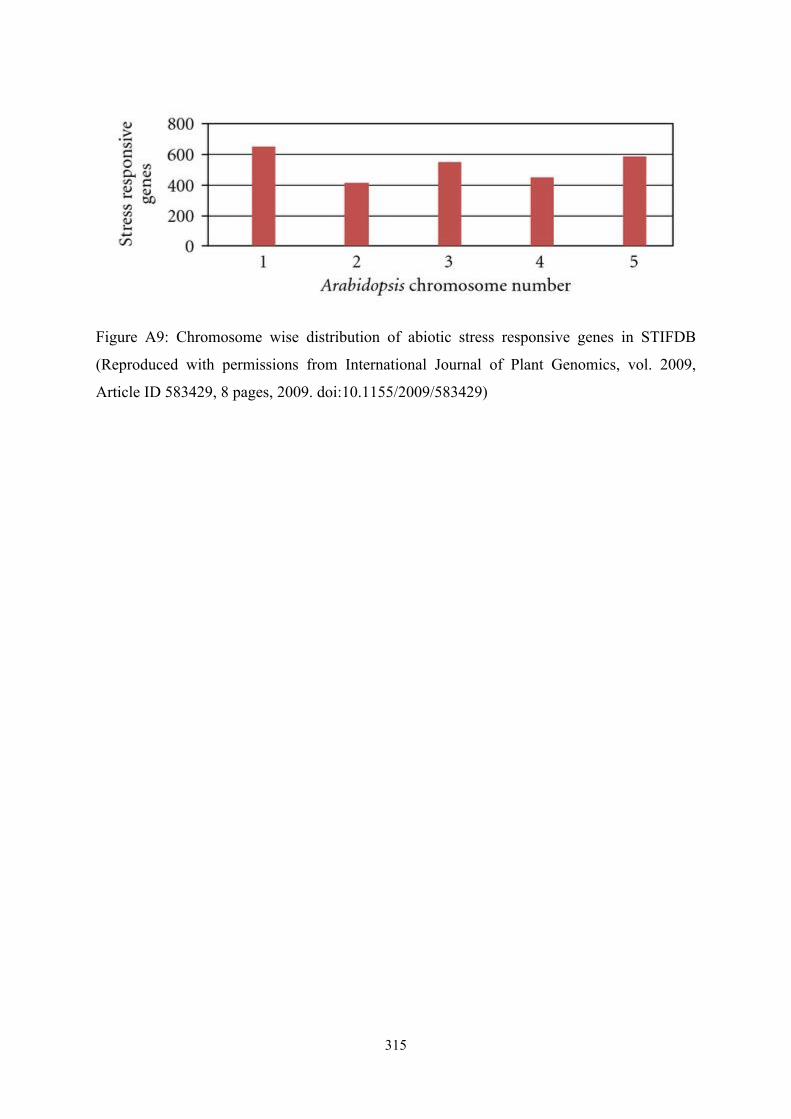
Chromosome wise distribution of genes compiled in STIFDB indicates that abiotic stress
responsive genes seem to be roughly the same numbers on all chromosomes. Chromosome
wise distribution of abiotic stress responsive genes in STIFDB is provided in Figure A9.
Distribution of genes responsive to specific abiotic stress signals indicates that numerous
genes are regulated in response to cold, drought, salinity, light and external ABA, and a lesser
subset of genes that respond to oxidative stress and rehydration. Distribution of stress signals
that affect various genes in STIFDB is provided in Figure A10. There are also 41 genes that
are expressed in response to multiple abiotic signals, cold, drought and salinity. Analyzing
these genes as subsets or individually, would offer clues to understanding the individual
stress transciptomes better, and analyzing the promoters of these genes could provide insights
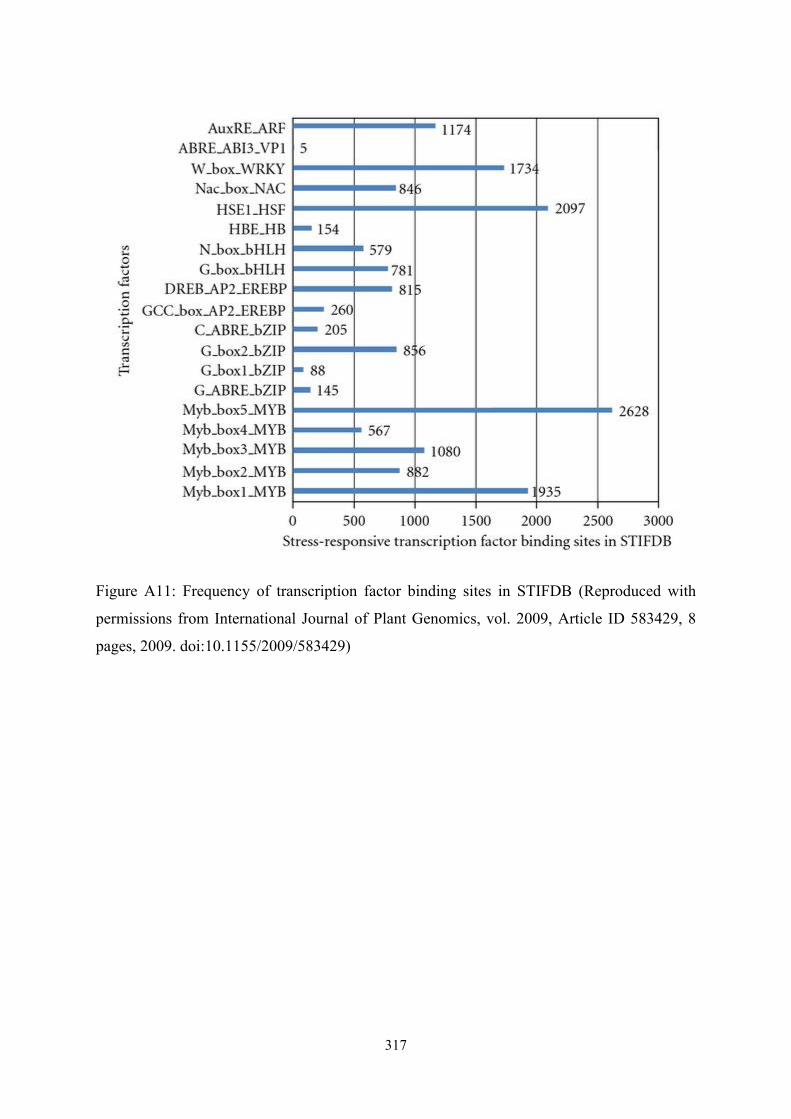
into the regulation of these genes in response to their specific stress signal. Analysis of the
frequency of transcription factor binding sites on the promoters of the abiotic stress
responsive genes provides varying numbers of stress specific transcription factor binding
sites. There seem to be greater numbers of certain transcription factor binding sites than
others. This could partly be due to the differences in the length of these cis elements.
Frequency of individual transcription factor binding sites on 2,629 genes in STIFDB is
provided in Figure A11. STIFDB would be a very useful tool to understand abiotic
transcriptome and the regulatory events of abiotic stress genes in A.thaliana genome.
Experimental validation and evidence about how many of these transcription factor binding
sites actually bind a TF to bring about regulation of their downstream gene in vivo, is still
lacking suggesting that further analysis using annotations may required to the seeming false
positives. It also needs to be determined if a greater number of stress specific transcription
factor binding sites on the promoter a particular gene, means a greater role of that particular
TF in its regulation. It is also worthwhile to analyze the promoters of subsets of genes that are
regulated by specific stresses, to identify patterns of transcription factor binding sites, which
!299
would have potential roles in the regulation of downstream genes responsive to a particular
stress. Therefore, STIFDB provides a platform to understand the stress-regulome of abiotic
stress responsive genes in plants. STIFDB will be a highly useful resource for a researcher
working on abiotic stress responses in plants.
A: 1.7 Conclusion
The challenge of maintaining a balance between a swelling population and the capacity to
produce food is increasing day by day. Consequently, food security has become a burning
issue for agricultural scientists and economists alike. Increasing crop productivity in view of
the escalating population and diminishing cultivable land and natural resources has become
vital. However, environmental stresses like drought, salinity, high and low temperatures, high
light, etc., along with biotic agents like pests and diseases, reduce agricultural yields
significantly, and consequently affect food security [638]. Developing crops that tolerate
environmental stresses, while maintaining productivity, will become a critical requirement for
enhancing agriculture in the twenty first century. Understanding the molecular mechanisms
that underlie the stress regulome would be the first step in the generation of abiotic stress
tolerant crops. To understand plant stress responses, unraveling the mechanisms of regulation
of stress responsive genes assumes paramount importance. Gene regulation by Transcription
Factors (TFs) is an important facet of stress responsive signal transduction cascades.
Computational transcription factor binding site prediction is a mature domain in the field of
Bioinformatics. Various algorithms, stand-alone software and web servers are available for
the effective prediction of transcription start from sequence information using knowledge
based and motif based methods [645, 663]. A wide array of TFBS prediction programs are
available based on different biological contexts. For example a novel method for prokaryotic
promoter prediction based on DNA stability that utilizes structural properties of DNA is
developed and analyzed across different prokaryotic organisms [664], time-delay neural
network based method (NNPP), is available specifically for the analysis of Drosophila
melanogaster promoter regions [665]. STIF algorithm explained in this Chapter is developed
using HMM models of known Abiotic stress factors will be useful for further analysis and
understanding of stress gene regulation in the plant model system Arabidopsis thaliana. Since
no bioinformatics tool provides a complete solution for the transcription factor identification
problem, it is always better to analyze the promoter regions with more than one algorithm or
program that based on the biological context. The new algorithm STIF [636] developed for
the identification of stress responsive transcription factor binding sites and the associated

!300
database STIFDB [637] with information about 2, 629 genes from A. thaliana genome will be
an valuable resources for the better understanding of the abiotic stress regulome in plants.
!301
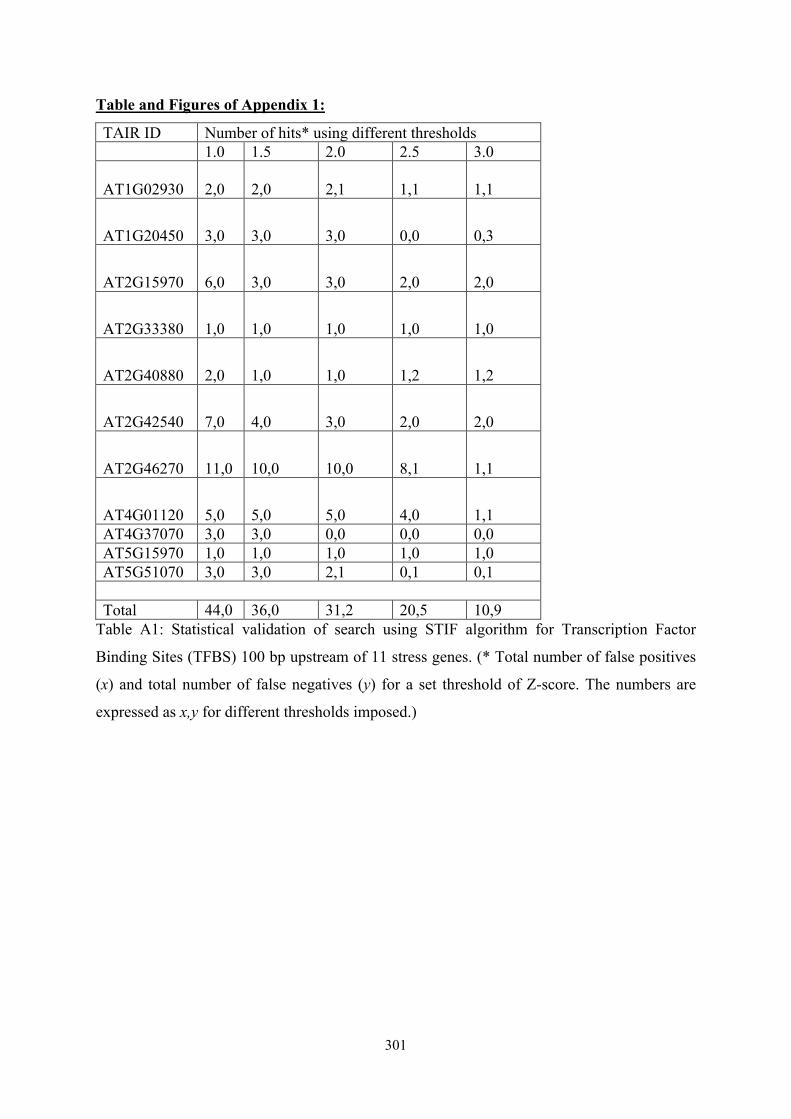
Table and Figures of Appendix 1:
TAIR ID Number of hits* using different thresholds 1.0 1.5 2.0 2.5 3.0
AT1G02930 2,0 2,0
2,1
1,1
1,1
AT1G20450 3,0 3,0 3,0 0,0 0,3
AT2G15970 6,0 3,0 3,0 2,0 2,0
AT2G33380 1,0 1,0 1,0 1,0 1,0
AT2G40880 2,0 1,0 1,0 1,2 1,2
AT2G42540 7,0 4,0 3,0 2,0 2,0
AT2G46270 11,0 10,0 10,0 8,1 1,1
AT4G01120 5,0 5,0 5,0 4,0 1,1 AT4G37070 3,0 3,0 0,0 0,0 0,0 AT5G15970 1,0 1,0 1,0 1,0 1,0 AT5G51070 3,0 3,0 2,1 0,1 0,1 Total 44,0 36,0 31,2 20,5 10,9
Table A1: Statistical validation of search using STIF algorithm for Transcription Factor
Binding Sites (TFBS) 100 bp upstream of 11 stress genes. (* Total number of false positives
(x) and total number of false negatives (y) for a set threshold of Z-score. The numbers are
expressed as x,y for different thresholds imposed.)

!302
TAIR ID Number of hits* using different thresholds
1.0 1.5 2.0 2.5 3.0
AT1G02920 8,0 8,0 5,0 1,1 1,1
AT1G02930 9,0 9,0 7,0 6,1 3,1
AT1G05680 7,0 7,0 7,0 2,0 1,0
AT1G07890 17,1 14,1 8,1 8,1 0,1
AT1G20440 4,0 4,0 4,0 2,0 1,0
AT1G20450 6,0 6,0 5,0 4,0 2,0
AT1G52400 6,0 6,0 3,0 3,0 0,0
AT1G67090 12,0 12,0 12,0 12,0 3,0
AT1G77120 9,0 9,0 9,0 3,0 2,0
AT2G14610 4,0 4,0 4,3 4,3 4,3
AT2G14960 8,0 6,0 6,0 1,0 0,2
AT2G15970 13,0 13,0 12,0 4,0 3,0
AT2G21330 4,0 4,0 4,0 4,0 4,0
AT2G33380 11,0 11,0 9,0 7,0 2,0
AT2G40880 9,0 8,0 7,0 6,0 1,3
AT2G42540 16,0 6,0 5,0 4,0 4,0
AT2G46270 17,0 16,0 16,0 14,2 4,2
AT3G02480 7,0 5,0 4,0 3,0 3,1
AT3G04720 11,0 11,0 11,0 5,1 1,1
AT3G15500 10,0 10,0 10,0 4,0 3,1
AT4G00340 5,0 5,1 5,1 5,1 3,1
AT4G01120 12,0 12,0 12,0 10,1 2,1
AT4G02380 7,0 7,0 7,1 5,1 5,1
AT4G23130 9,0 9,0 9,2 2,2 0,2
AT4G37070 7,0 7,0 7,0 4,0 3,1
AT5G15970 11,0 11,0 5,0 3,0 1,2
!303
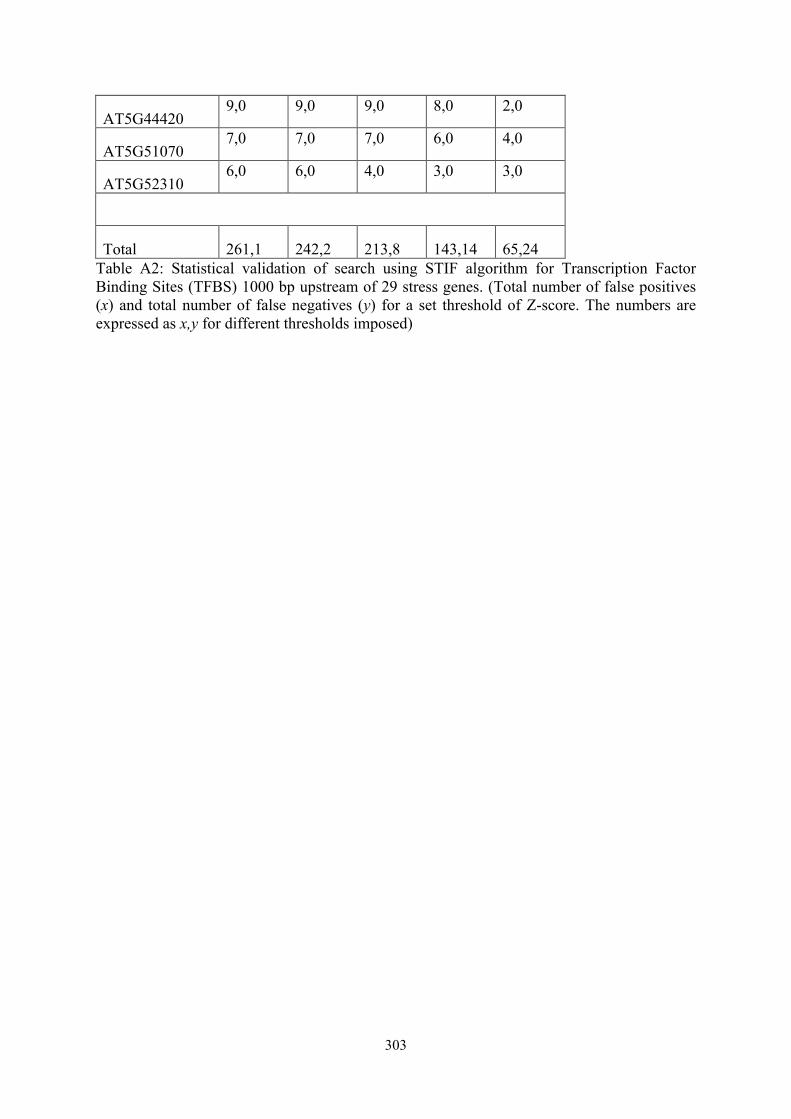
AT5G44420 9,0 9,0 9,0 8,0 2,0
AT5G51070 7,0 7,0 7,0 6,0 4,0
AT5G52310 6,0 6,0 4,0 3,0 3,0
Total 261,1 242,2 213,8 143,14 65,24 Table A2: Statistical validation of search using STIF algorithm for Transcription Factor Binding Sites (TFBS) 1000 bp upstream of 29 stress genes. (Total number of false positives (x) and total number of false negatives (y) for a set threshold of Z-score. The numbers are expressed as x,y for different thresholds imposed)
!304
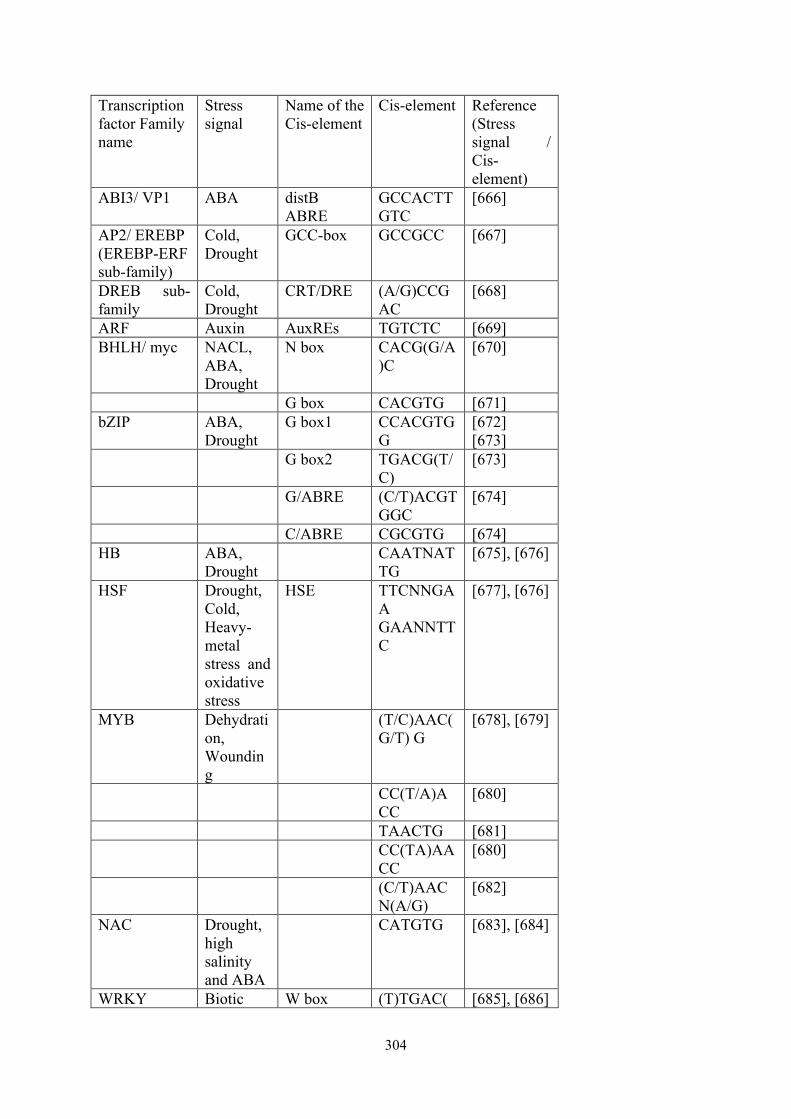
Transcription factor Family name
Stress signal
Name of the Cis-element
Cis-element Reference (Stress signal / Cis-element)
ABI3/ VP1 ABA distB ABRE
GCCACTTGTC
[666]
AP2/ EREBP (EREBP-ERF sub-family)
Cold, Drought
GCC-box GCCGCC [667]
DREB sub-family
Cold, Drought
CRT/DRE (A/G)CCGAC
[668]
ARF Auxin AuxREs TGTCTC [669] BHLH/ myc NACL,
ABA, Drought
N box CACG(G/A)C
[670]
G box CACGTG [671] bZIP ABA,
Drought G box1
CCACGTGG
[672] [673]
G box2 TGACG(T/C)
[673]
G/ABRE (C/T)ACGTGGC
[674]
C/ABRE CGCGTG [674] HB ABA,
Drought CAATNAT
TG [675], [676]
HSF Drought, Cold, Heavy-metal stress and oxidative stress
HSE TTCNNGAA GAANNTTC
[677], [676]
MYB Dehydration, Wounding
(T/C)AAC(G/T) G
[678], [679]
CC(T/A)ACC
[680]
TAACTG [681] CC(TA)AA
CC [680]
(C/T)AACN(A/G)
[682]
NAC Drought, high salinity and ABA
CATGTG [683], [684]
WRKY Biotic W box (T)TGAC( [685], [686]

!305
stress (pathogen attack) Abiotic Stress (wind, rain, hail)
C/T)
Table A3: Transcription factors used in the study
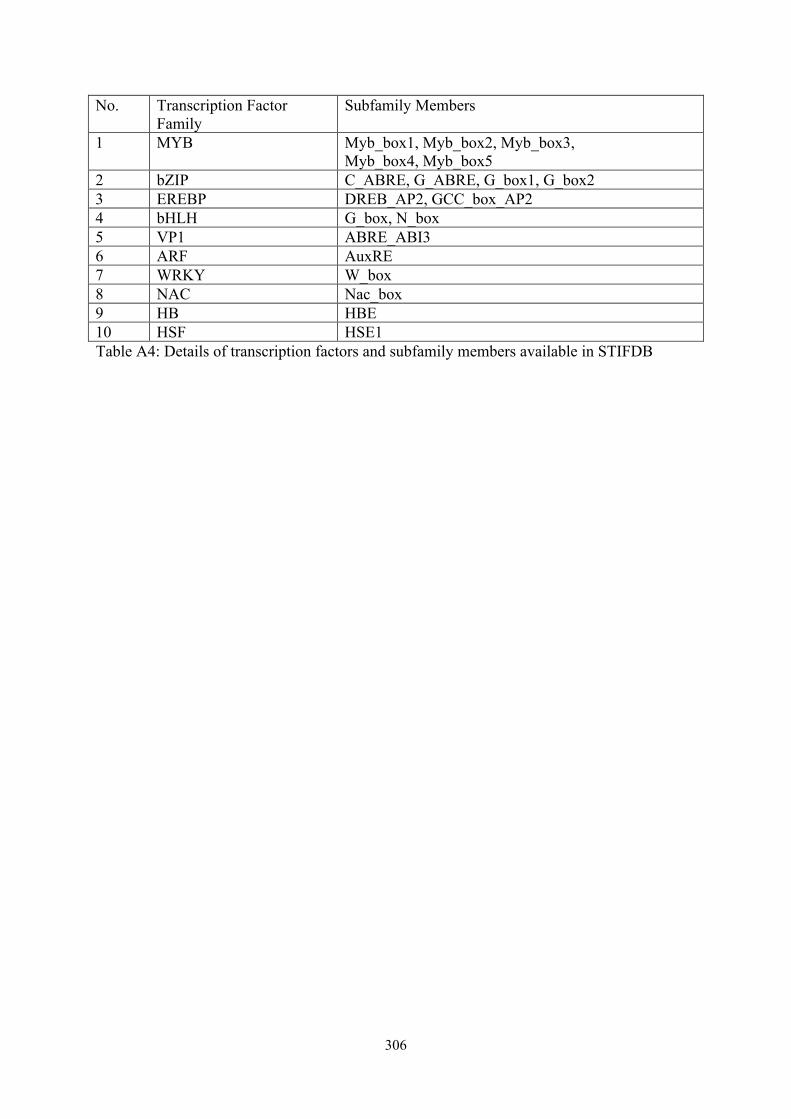
!306
No. Transcription Factor Family
Subfamily Members
1 MYB Myb_box1, Myb_box2, Myb_box3, Myb_box4, Myb_box5
2 bZIP C_ABRE, G_ABRE, G_box1, G_box2 3 EREBP DREB_AP2, GCC_box_AP2 4 bHLH G_box, N_box 5 VP1 ABRE_ABI3 6 ARF AuxRE 7 WRKY W_box 8 NAC Nac_box 9 HB HBE 10 HSF HSE1 Table A4: Details of transcription factors and subfamily members available in STIFDB

!307
Figure A1: Flow chart diagram of STIF search Algorithm (Reproduced with permissions
from Bioinformation. 2008; 2(10): 431–437.)

!308
Figure A2: Schematic representation of STIF approach for construction of a Hidden Markov
Model of transcription factor binding sites given the experimentally observed nucleotide
patterns (Reproduced with permissions from Bioinformation. 2008; 2(10): 431–437.)
!309
Figure A3: The validation set of 11 stress responsive genes when searched for 100 base pairs
with its 5’UTR with 11 stress responsive genes. The total number of false positives obtained
during the search was compared against the total number of false negatives for various Z-
score thresholds applied for the statistical tests. (Reproduced with permissions from
Bioinformation. 2008; 2(10): 431–437.)
!310
Figure A4: Same as Figure A3 but for a validation set of 29 stress genes where search for
TFBS was performed 1000 base pairs with its 5’UTR. (Reproduced with permissions from
Bioinformation. 2008; 2(10): 431–437.)
!311
Figure A5: Flow chart of steps involved in the development of STIFDB (Reproduced with
permissions from International Journal of Plant Genomics, vol. 2009, Article ID 583429, 8
pages, 2009. doi:10.1155/2009/583429)

!312
Figure A6: TFmap with the validated and predicted transcription factors marked on the
1000bp upstream of the gene AT1G02920 (Reproduced with permissions from International
Journal of Plant Genomics, vol. 2009, Article ID 583429, 8 pages, 2009.
doi:10.1155/2009/583429)
!313
Figure A7: Stress signal profile from STIFDB for stress category ‘COLD-DROUGHT-
SALT’
!314
Figure A8: Screenshot of STIFDB (Reproduced with permissions from International Journal
of Plant Genomics, vol. 2009, Article ID 583429, 8 pages, 2009. doi:10.1155/2009/583429)
!315
Figure A9: Chromosome wise distribution of abiotic stress responsive genes in STIFDB
(Reproduced with permissions from International Journal of Plant Genomics, vol. 2009,
Article ID 583429, 8 pages, 2009. doi:10.1155/2009/583429)

!316
Figure A10: Distribution of individual stress signal that affect genes in STIFDB (Reproduced
with permissions from International Journal of Plant Genomics, vol. 2009, Article ID 583429,
8 pages, 2009. doi:10.1155/2009/583429)
!317
Figure A11: Frequency of transcription factor binding sites in STIFDB (Reproduced with
permissions from International Journal of Plant Genomics, vol. 2009, Article ID 583429, 8
pages, 2009. doi:10.1155/2009/583429)