Embed Size (px)
Citation preview
GPE Results Report 2018
88
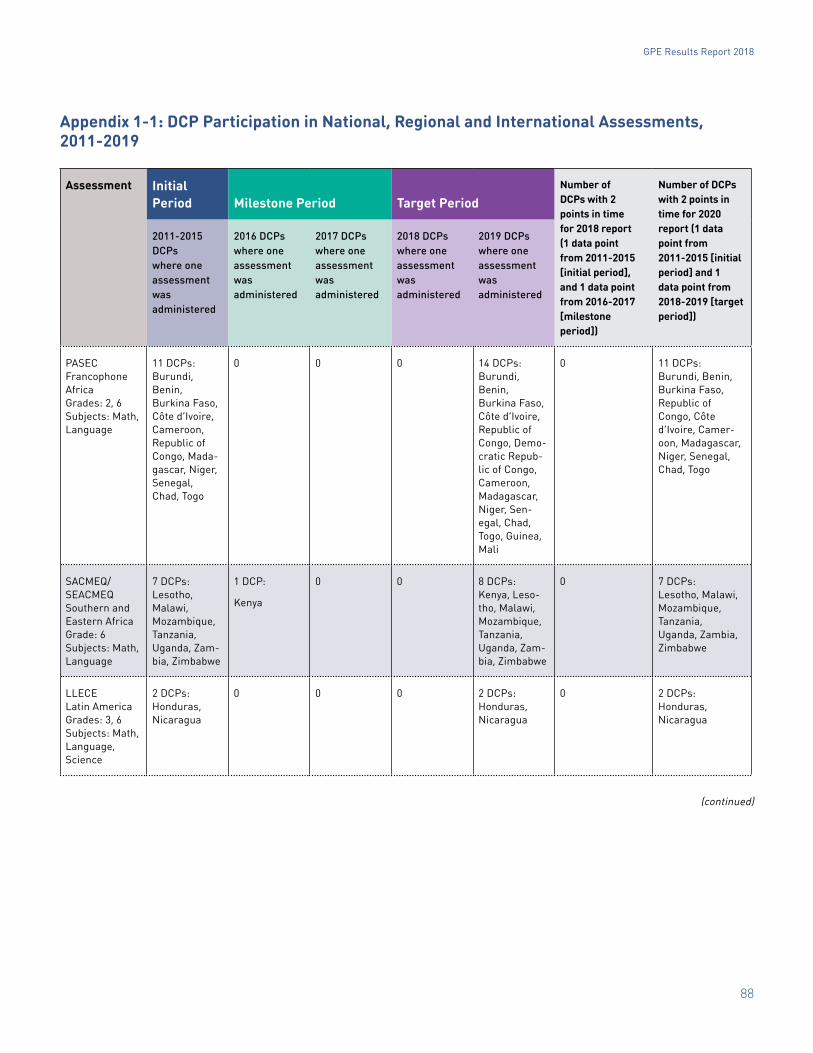
Appendix 1-1: DCP Participation in National, Regional and International Assessments, 2011-2019
Assessment Initial Period Milestone Period Target Period
Number of DCPs with 2 points in time for 2018 report (1 data point from 2011-2015 [initial period], and 1 data point from 2016-2017 [milestone period])
Number of DCPs with 2 points in time for 2020 report (1 data point from 2011-2015 [initial period] and 1 data point from 2018-2019 [target period])
2011-2015 DCPs where one assessment was administered
2016 DCPs where one assessment was administered
2017 DCPs where one assessment was administered
2018 DCPs where one assessment was administered
2019 DCPs where one assessment was administered
PASEC Francophone Africa Grades: 2, 6 Subjects: Math, Language
11 DCPs: Burundi, Benin, Burkina Faso, Côte d’Ivoire, Cameroon, Republic of Congo, Mada-gascar, Niger, Senegal, Chad, Togo
0 0 0 14 DCPs: Burundi, Benin, Burkina Faso, Côte d’Ivoire, Republic of Congo, Demo-cratic Repub-lic of Congo, Cameroon, Madagascar, Niger, Sen-egal, Chad, Togo, Guinea, Mali
0 11 DCPs: Burundi, Benin, Burkina Faso, Republic of Congo, Côte d’Ivoire, Camer-oon, Madagascar, Niger, Senegal, Chad, Togo
SACMEQ/SEACMEQ Southern and Eastern Africa Grade: 6 Subjects: Math, Language
7 DCPs: Lesotho, Malawi, Mozambique, Tanzania, Uganda, Zam-bia, Zimbabwe
1 DCP:
Kenya
0 0 8 DCPs: Kenya, Leso-tho, Malawi, Mozambique, Tanzania, Uganda, Zam-bia, Zimbabwe
0 7 DCPs: Lesotho, Malawi, Mozambique, Tanzania, Uganda, Zambia, Zimbabwe
LLECE Latin America Grades: 3, 6 Subjects: Math, Language, Science
2 DCPs: Honduras, Nicaragua
0 0 0 2 DCPs: Honduras, Nicaragua
0 2 DCPs: Honduras, Nicaragua
(continued)
GPE Results Report 2018
89
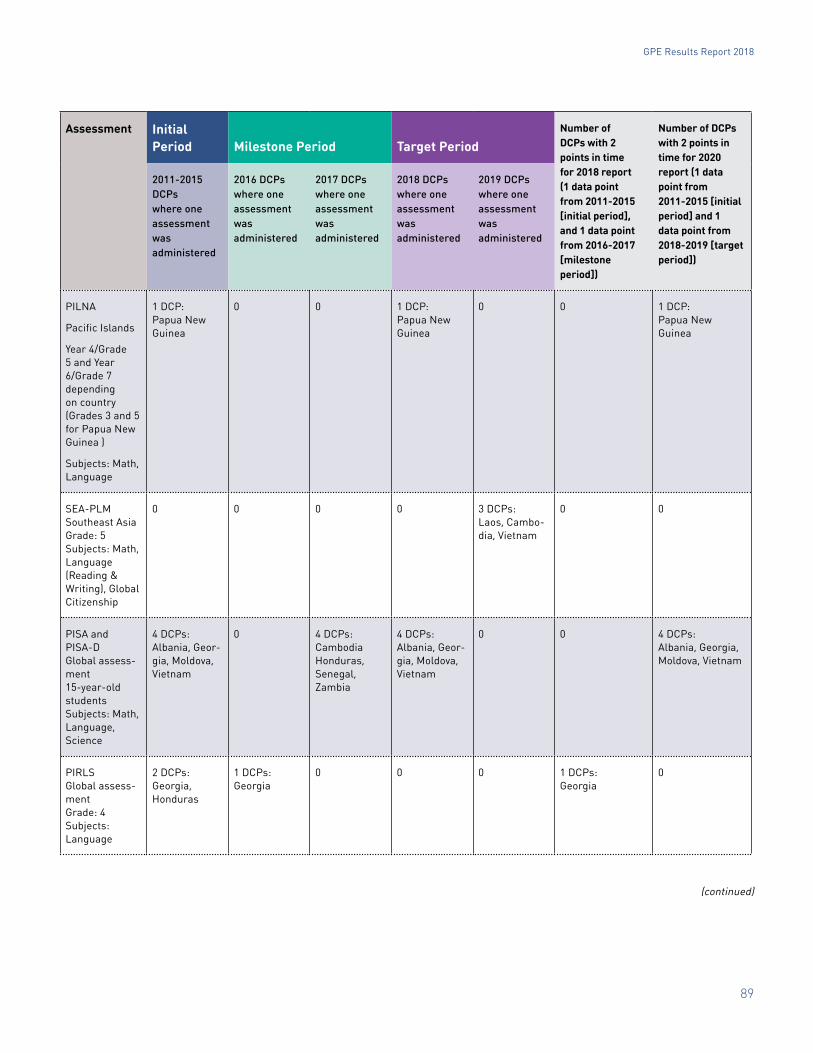
Assessment Initial Period Milestone Period Target Period
Number of DCPs with 2 points in time for 2018 report (1 data point from 2011-2015 [initial period], and 1 data point from 2016-2017 [milestone period])
Number of DCPs with 2 points in time for 2020 report (1 data point from 2011-2015 [initial period] and 1 data point from 2018-2019 [target period])
2011-2015 DCPs where one assessment was administered
2016 DCPs where one assessment was administered
2017 DCPs where one assessment was administered
2018 DCPs where one assessment was administered
2019 DCPs where one assessment was administered
PILNA
Pacific Islands
Year 4/Grade 5 and Year 6/Grade 7 depending on country (Grades 3 and 5 for Papua New Guinea )
Subjects: Math, Language
1 DCP: Papua New Guinea
0 0 1 DCP: Papua New Guinea
0 0 1 DCP: Papua New Guinea
SEA-PLM Southeast Asia Grade: 5 Subjects: Math, Language (Reading & Writing), Global Citizenship
0 0 0 0 3 DCPs: Laos, Cambo-dia, Vietnam
0 0
PISA and PISA-D Global assess-ment 15-year-old students Subjects: Math, Language, Science
4 DCPs: Albania, Geor-gia, Moldova, Vietnam
0 4 DCPs: Cambodia Honduras, Senegal, Zambia
4 DCPs: Albania, Geor-gia, Moldova, Vietnam
0 0 4 DCPs: Albania, Georgia, Moldova, Vietnam
PIRLS Global assess-ment Grade: 4 Subjects: Language
2 DCPs: Georgia, Honduras
1 DCPs: Georgia
0 0 0 1 DCPs: Georgia
0
(continued)
GPE Results Report 2018
90
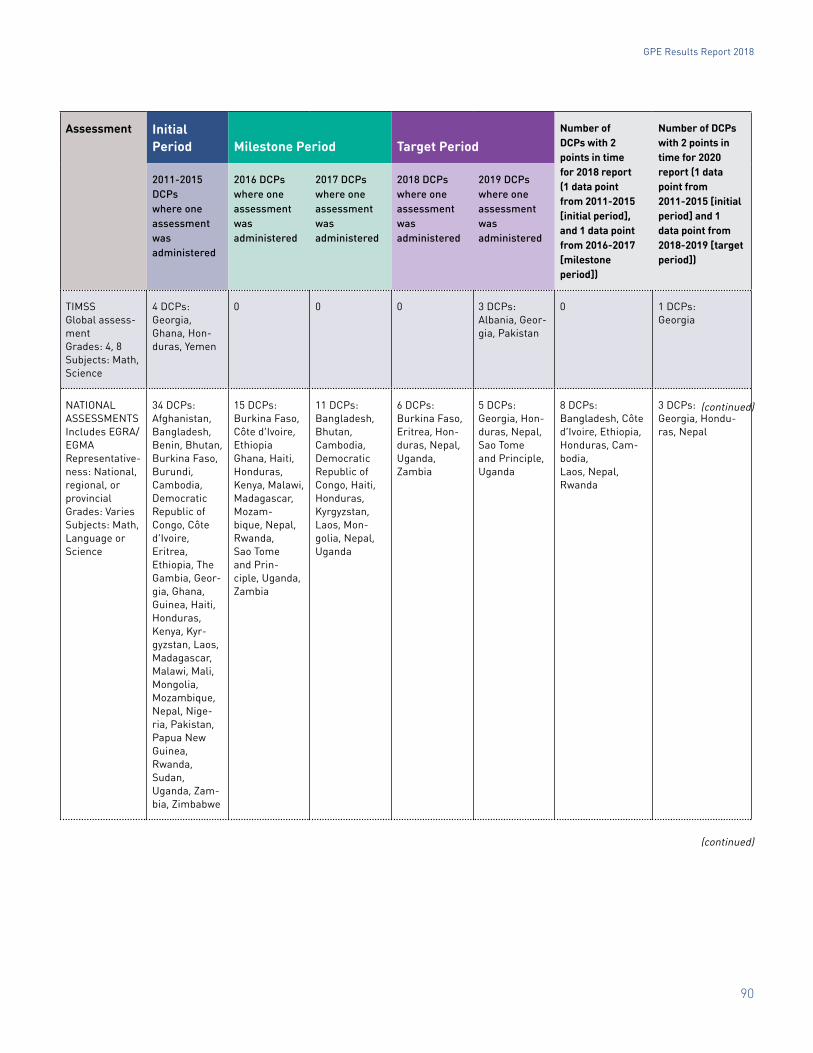
Assessment Initial Period Milestone Period Target Period
Number of DCPs with 2 points in time for 2018 report (1 data point from 2011-2015 [initial period], and 1 data point from 2016-2017 [milestone period])
Number of DCPs with 2 points in time for 2020 report (1 data point from 2011-2015 [initial period] and 1 data point from 2018-2019 [target period])
2011-2015 DCPs where one assessment was administered
2016 DCPs where one assessment was administered
2017 DCPs where one assessment was administered
2018 DCPs where one assessment was administered
2019 DCPs where one assessment was administered
TIMSS Global assess-ment Grades: 4, 8 Subjects: Math, Science
4 DCPs: Georgia, Ghana, Hon-duras, Yemen
0 0 0 3 DCPs: Albania, Geor-gia, Pakistan
0 1 DCPs: Georgia
NATIONAL ASSESSMENTS Includes EGRA/EGMA Representative-ness: National, regional, or provincial Grades: Varies Subjects: Math, Language or Science
34 DCPs: Afghanistan, Bangladesh, Benin, Bhutan, Burkina Faso, Burundi, Cambodia, Democratic Republic of Congo, Côte d’Ivoire, Eritrea, Ethiopia, The Gambia, Geor-gia, Ghana, Guinea, Haiti, Honduras, Kenya, Kyr-gyzstan, Laos, Madagascar, Malawi, Mali, Mongolia, Mozambique, Nepal, Nige-ria, Pakistan, Papua New Guinea, Rwanda, Sudan, Uganda, Zam-bia, Zimbabwe
15 DCPs: Burkina Faso, Côte d’Ivoire, Ethiopia Ghana, Haiti, Honduras, Kenya, Malawi, Madagascar, Mozam-bique, Nepal, Rwanda, Sao Tome and Prin-ciple, Uganda, Zambia
11 DCPs: Bangladesh, Bhutan, Cambodia, Democratic Republic of Congo, Haiti, Honduras, Kyrgyzstan, Laos, Mon-golia, Nepal, Uganda
6 DCPs: Burkina Faso, Eritrea, Hon-duras, Nepal, Uganda, Zambia
5 DCPs: Georgia, Hon-duras, Nepal, Sao Tome and Principle, Uganda
8 DCPs: Bangladesh, Côte d’Ivoire, Ethiopia, Honduras, Cam-bodia, Laos, Nepal, Rwanda
3 DCPs: Georgia, Hondu-ras, Nepal
(continued)
(continued)
GPE Results Report 2018
91
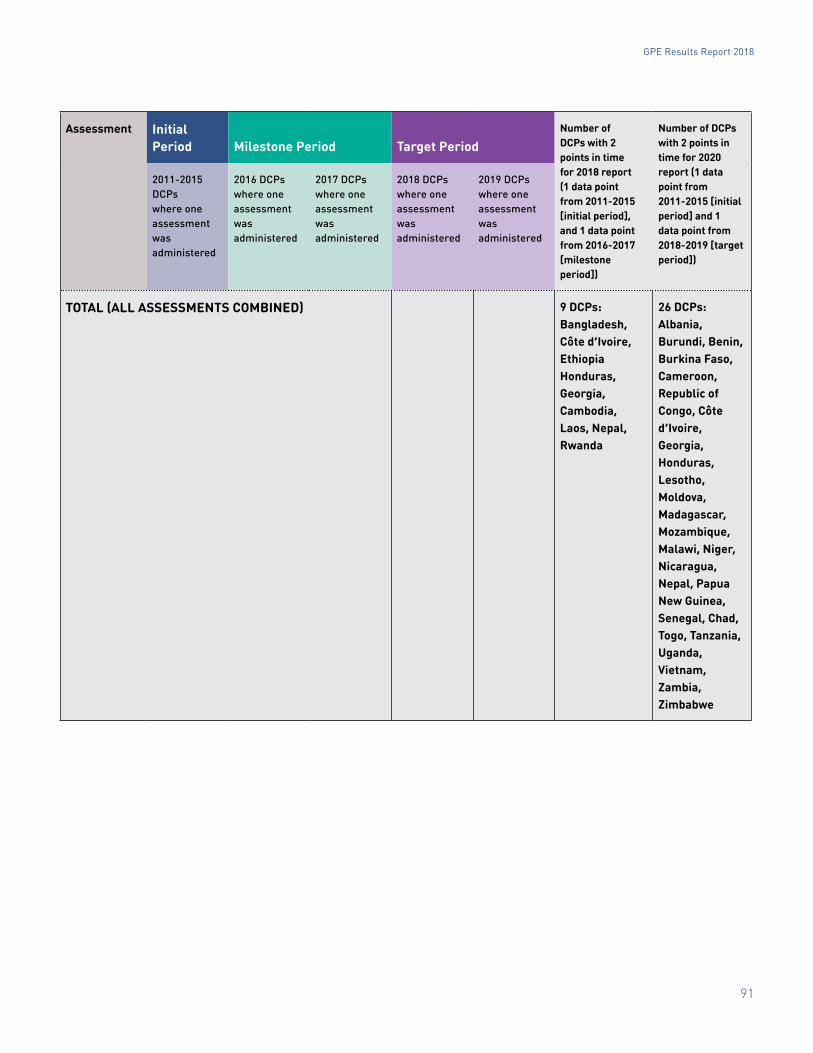
Assessment Initial Period Milestone Period Target Period
Number of DCPs with 2 points in time for 2018 report (1 data point from 2011-2015 [initial period], and 1 data point from 2016-2017 [milestone period])
Number of DCPs with 2 points in time for 2020 report (1 data point from 2011-2015 [initial period] and 1 data point from 2018-2019 [target period])
2011-2015 DCPs where one assessment was administered
2016 DCPs where one assessment was administered
2017 DCPs where one assessment was administered
2018 DCPs where one assessment was administered
2019 DCPs where one assessment was administered
TOTAL (ALL ASSESSMENTS COMBINED) 9 DCPs: Bangladesh, Côte d’Ivoire, Ethiopia Honduras, Georgia, Cambodia, Laos, Nepal, Rwanda
26 DCPs: Albania, Burundi, Benin, Burkina Faso, Cameroon, Republic of Congo, Côte d’Ivoire, Georgia, Honduras, Lesotho, Moldova, Madagascar, Mozambique, Malawi, Niger, Nicaragua, Nepal, Papua New Guinea, Senegal, Chad, Togo, Tanzania, Uganda, Vietnam, Zambia, Zimbabwe
GPE Results Report 2018
92
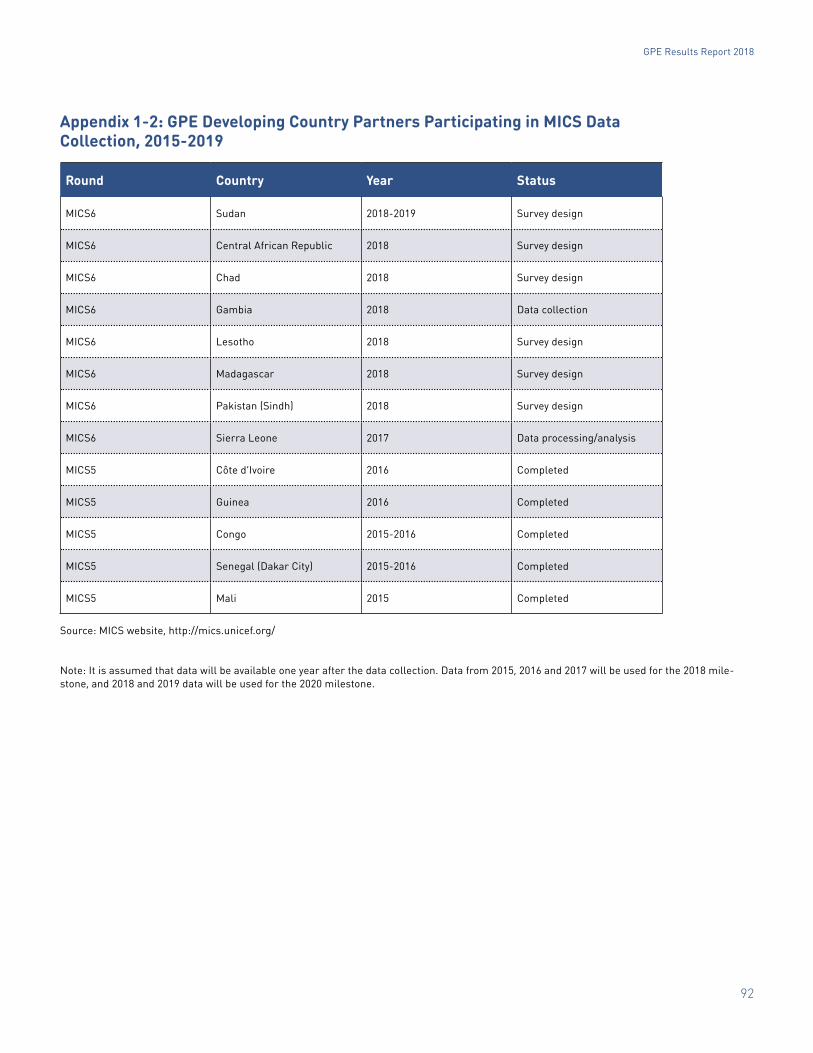
Appendix 1-2: GPE Developing Country Partners Participating in MICS Data Collection, 2015-2019
Round Country Year Status
MICS6 Sudan 2018-2019 Survey design
MICS6 Central African Republic 2018 Survey design
MICS6 Chad 2018 Survey design
MICS6 Gambia 2018 Data collection
MICS6 Lesotho 2018 Survey design
MICS6 Madagascar 2018 Survey design
MICS6 Pakistan (Sindh) 2018 Survey design
MICS6 Sierra Leone 2017 Data processing/analysis
MICS5 Côte d’Ivoire 2016 Completed
MICS5 Guinea 2016 Completed
MICS5 Congo 2015-2016 Completed
MICS5 Senegal (Dakar City) 2015-2016 Completed
MICS5 Mali 2015 Completed
Source: MICS website, http://mics.unicef.org/
Note: It is assumed that data will be available one year after the data collection. Data from 2015, 2016 and 2017 will be used for the 2018 mile-stone, and 2018 and 2019 data will be used for the 2020 milestone.
GPE Results Report 2018
93
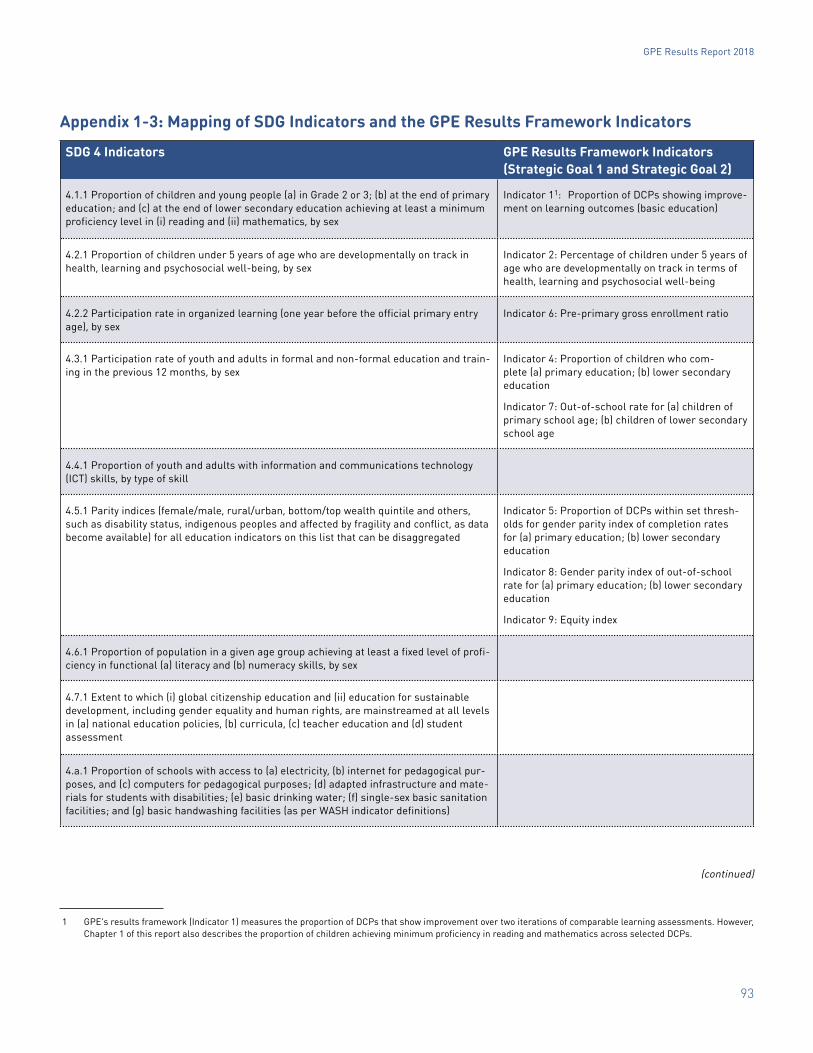
Appendix 1-3: Mapping of SDG Indicators and the GPE Results Framework Indicators
SDG 4 Indicators GPE Results Framework Indicators (Strategic Goal 1 and Strategic Goal 2)
4.1.1 Proportion of children and young people (a) in Grade 2 or 3; (b) at the end of primary education; and (c) at the end of lower secondary education achieving at least a minimum proficiency level in (i) reading and (ii) mathematics, by sex
Indicator 11: Proportion of DCPs showing improve-ment on learning outcomes (basic education)
4.2.1 Proportion of children under 5 years of age who are developmentally on track in health, learning and psychosocial well-being, by sex
Indicator 2: Percentage of children under 5 years of age who are developmentally on track in terms of health, learning and psychosocial well-being
4.2.2 Participation rate in organized learning (one year before the official primary entry age), by sex
Indicator 6: Pre-primary gross enrollment ratio
4.3.1 Participation rate of youth and adults in formal and non-formal education and train-ing in the previous 12 months, by sex
Indicator 4: Proportion of children who com-plete (a) primary education; (b) lower secondary education
Indicator 7: Out-of-school rate for (a) children of primary school age; (b) children of lower secondary school age
4.4.1 Proportion of youth and adults with information and communications technology (ICT) skills, by type of skill
4.5.1 Parity indices (female/male, rural/urban, bottom/top wealth quintile and others, such as disability status, indigenous peoples and affected by fragility and conflict, as data become available) for all education indicators on this list that can be disaggregated
Indicator 5: Proportion of DCPs within set thresh-olds for gender parity index of completion rates for (a) primary education; (b) lower secondary education
Indicator 8: Gender parity index of out-of-school rate for (a) primary education; (b) lower secondary education
Indicator 9: Equity index
4.6.1 Proportion of population in a given age group achieving at least a fixed level of profi-ciency in functional (a) literacy and (b) numeracy skills, by sex
4.7.1 Extent to which (i) global citizenship education and (ii) education for sustainable development, including gender equality and human rights, are mainstreamed at all levels in (a) national education policies, (b) curricula, (c) teacher education and (d) student assessment
4.a.1 Proportion of schools with access to (a) electricity, (b) internet for pedagogical pur-poses, and (c) computers for pedagogical purposes; (d) adapted infrastructure and mate-rials for students with disabilities; (e) basic drinking water; (f) single-sex basic sanitation facilities; and (g) basic handwashing facilities (as per WASH indicator definitions)
1 GPE’s results framework (Indicator 1) measures the proportion of DCPs that show improvement over two iterations of comparable learning assessments. However, Chapter 1 of this report also describes the proportion of children achieving minimum proficiency in reading and mathematics across selected DCPs.
(continued)
GPE Results Report 2018
94
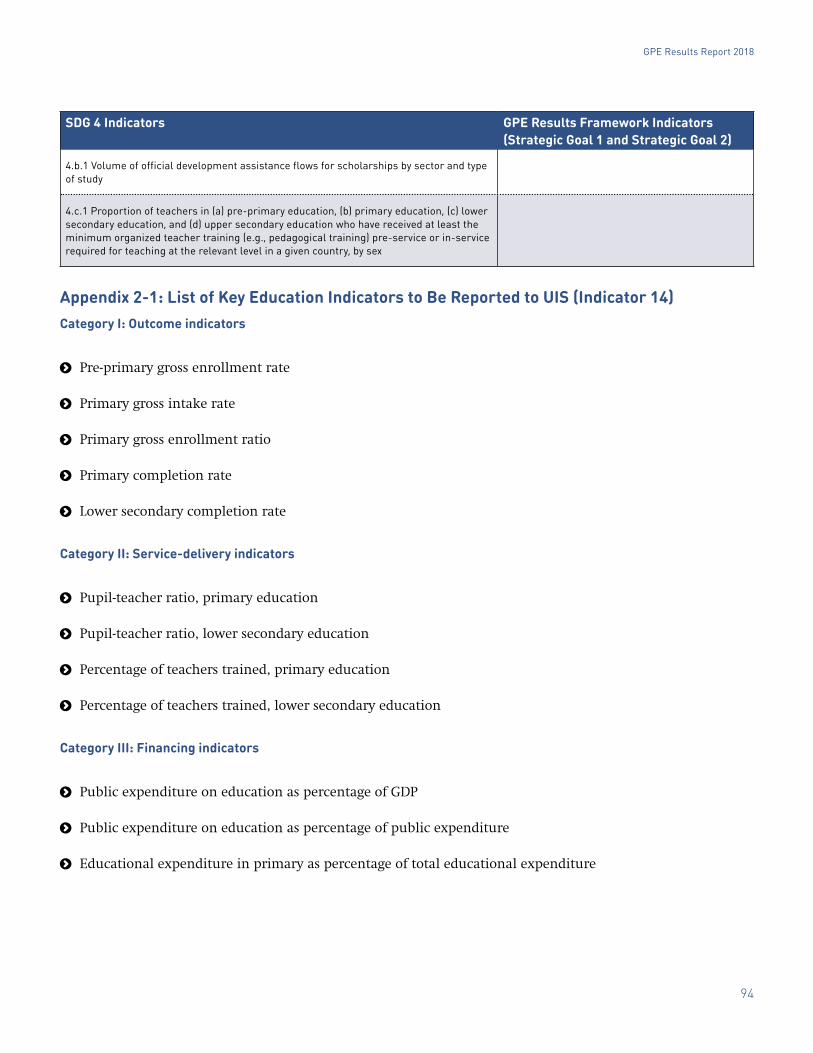
SDG 4 Indicators GPE Results Framework Indicators (Strategic Goal 1 and Strategic Goal 2)
4.b.1 Volume of official development assistance flows for scholarships by sector and type of study
4.c.1 Proportion of teachers in (a) pre-primary education, (b) primary education, (c) lower secondary education, and (d) upper secondary education who have received at least the minimum organized teacher training (e.g., pedagogical training) pre-service or in-service required for teaching at the relevant level in a given country, by sex
Appendix 2-1: List of Key Education Indicators to Be Reported to UIS (Indicator 14)Category I: Outcome indicators
Pre-primary gross enrollment rate
Primary gross intake rate
Primary gross enrollment ratio
Primary completion rate
Lower secondary completion rate
Category II: Service-delivery indicators
Pupil-teacher ratio, primary education
Pupil-teacher ratio, lower secondary education
Percentage of teachers trained, primary education
Percentage of teachers trained, lower secondary education
Category III: Financing indicators
Public expenditure on education as percentage of GDP
Public expenditure on education as percentage of public expenditure
Educational expenditure in primary as percentage of total educational expenditure
GPE Results Report 2018
95
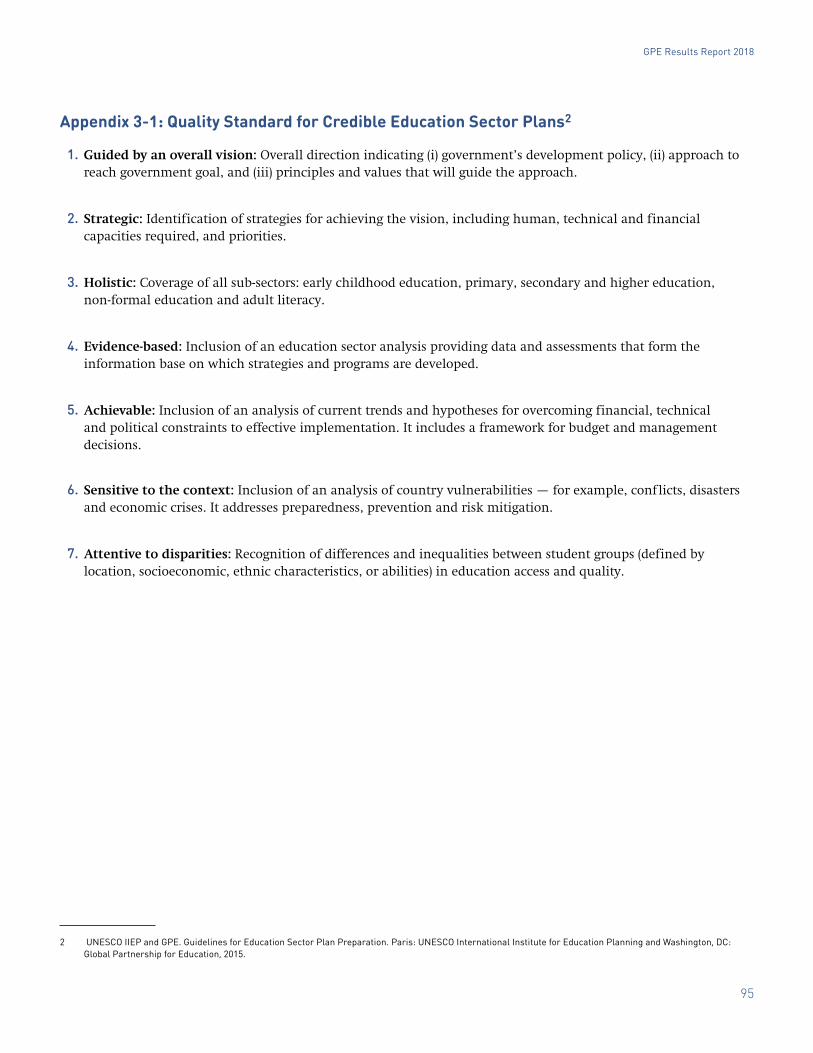
Appendix 3-1: Quality Standard for Credible Education Sector Plans2
1. Guided by an overall vision: Overall direction indicating (i) government’s development policy, (ii) approach to reach government goal, and (iii) principles and values that will guide the approach.
2. Strategic: Identification of strategies for achieving the vision, including human, technical and financial capacities required, and priorities.
3. Holistic: Coverage of all sub-sectors: early childhood education, primary, secondary and higher education, non-formal education and adult literacy.
4. Evidence-based: Inclusion of an education sector analysis providing data and assessments that form the information base on which strategies and programs are developed.
5. Achievable: Inclusion of an analysis of current trends and hypotheses for overcoming financial, technical and political constraints to effective implementation. It includes a framework for budget and management decisions.
6. Sensitive to the context: Inclusion of an analysis of country vulnerabilities — for example, conflicts, disasters and economic crises. It addresses preparedness, prevention and risk mitigation.
7. Attentive to disparities: Recognition of differences and inequalities between student groups (defined by location, socioeconomic, ethnic characteristics, or abilities) in education access and quality.
2 UNESCO IIEP and GPE. Guidelines for Education Sector Plan Preparation. Paris: UNESCO International Institute for Education Planning and Washington, DC: Global Partnership for Education, 2015.
GPE Results Report 2018
96
Appendix 3-2: Quality Standard for Transitional Education Plans3
1. Evidence-based: Identification of key challenges through an evidence-based analysis of the education system (education sector analysis, or the best available data).
2. Sensitive to context and attentive to disparities: Inclusion of analysis of the country vulnerabilities — for example, conflicts, disasters, or political or economic crises on education, as well as the potential for tensions through the education system.
3. Strategic: Inclusion of strategies for immediate needs and building the foundation for realizing the system’s long-term vision, including arguments for the choice of these strategies.
4. Targeted: Focus on critical education needs in the short and medium terms, and on system capacity develop-ment, including the preparation of the next ESP.
5. Operational: Inclusion of a feasible, multiyear plan with implementation and financial hypotheses for meet-ing priorities and developing strategies to overcome financial, data, technical and political constraints.
Appendix 3-3: Quality Standards for Strategies in Teaching and Learning, Response to Marginalized Groups, and Efficiency
1. Evidence-based:4 Including the identification of the underlying causes of the challenges.
2. Relevant: Addressing the underlying causes of the challenges.
3. Coherent: Aligning the action plan to the strategies.
4. Measurable: Including indicators with targets.
5. Implementable: Identifying cost, funding source, responsible entity and time frames for operationalization.
3 UNESCO IIEP and GPE. Guidelines for Transitional Education Plan Preparation. Paris: UNESCO International Institute for Education Planning and Washington, DC: Global Partnership for Education, 2016.
4 This standard examines whether the underlying causes of the issues have been correctly identified. On the other hand, the standard 4 for 16a, which is identical, only looks at education sector analysis, i.e., whether an ESA was produced.
GPE Results Report 2018
97
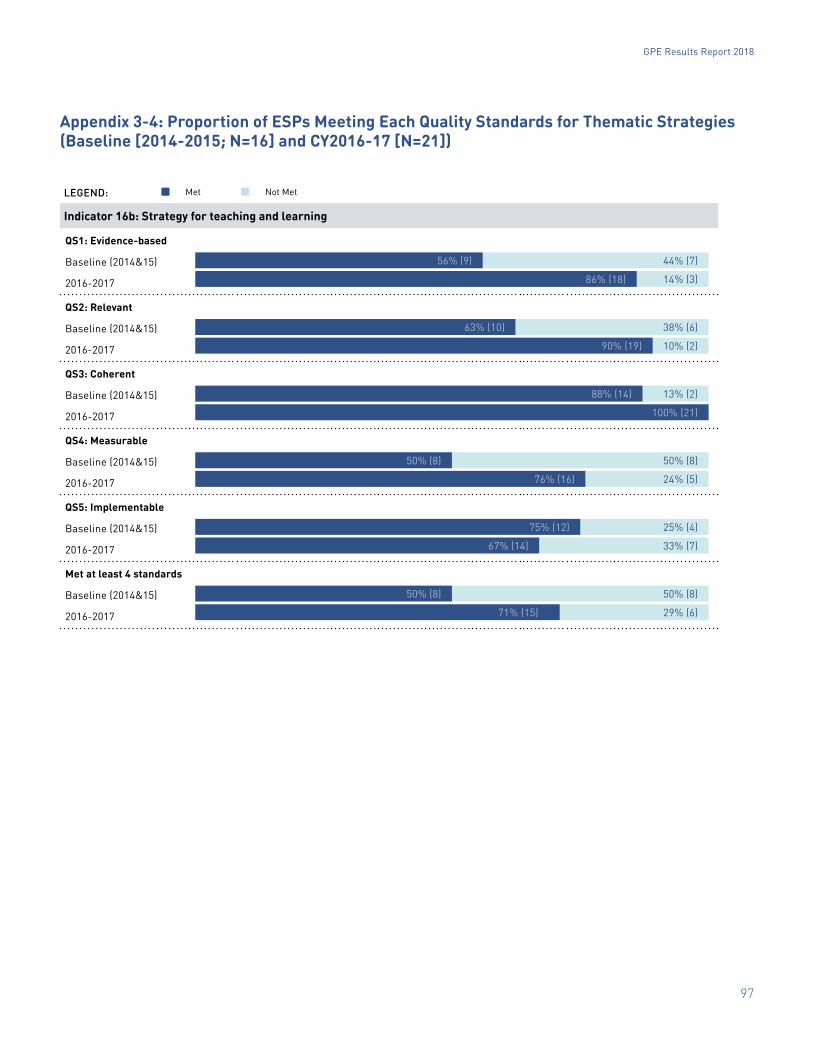
Appendix 3-4: Proportion of ESPs Meeting Each Quality Standards for Thematic Strategies (Baseline [2014-2015; N=16] and CY2016-17 [N=21])
LEGEND: � Met � Not Met
Indicator 16b: Strategy for teaching and learning
QS1: Evidence-based
Baseline (2014&15)
2016-2017
44% (7)56% (9)
14% (3)86% (18)
QS2: Relevant
Baseline (2014&15)
2016-2017
38% (6)63% (10)
10% (2)90% (19)
QS3: Coherent
Baseline (2014&15)
2016-2017
13% (2)88% (14)
100% (21)
QS4: Measurable
Baseline (2014&15)
2016-2017
50% (8)50% (8)
24% (5)76% (16)
QS5: Implementable
Baseline (2014&15)
2016-2017
25% (4)75% (12)
33% (7)67% (14)
Met at least 4 standards
Baseline (2014&15)
2016-2017
50% (8)50% (8)
29% (6)71% (15)
GPE Results Report 2018
98
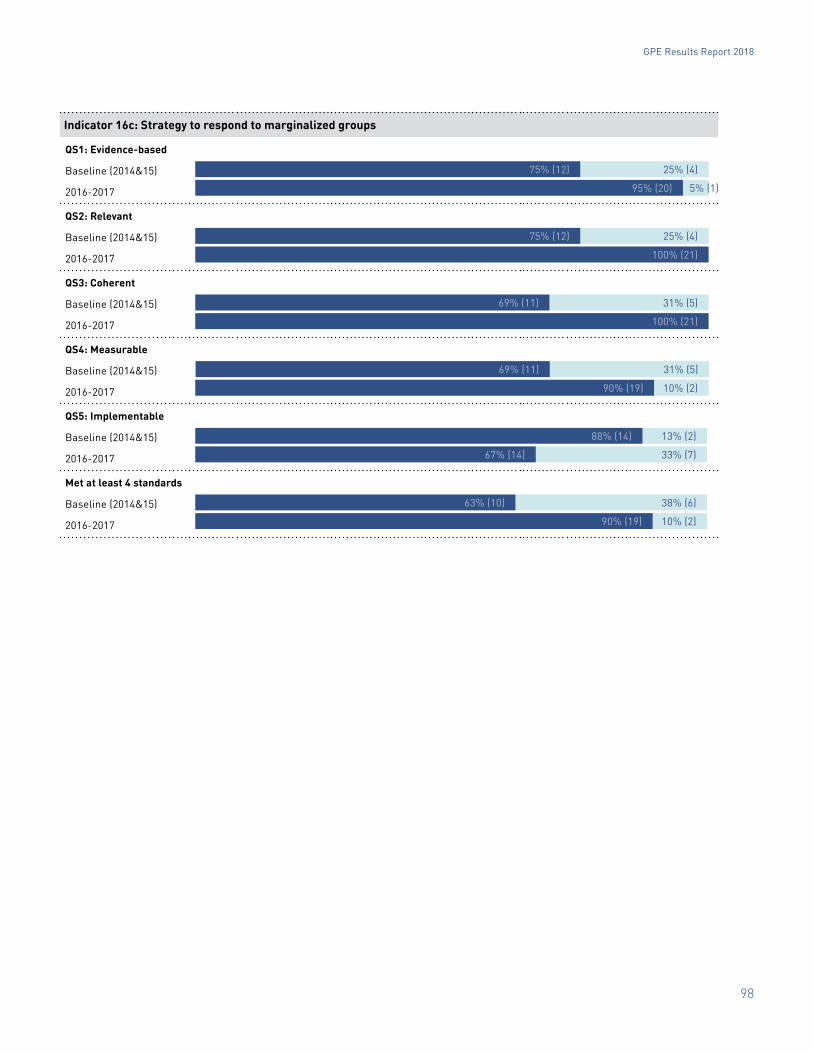
Indicator 16c: Strategy to respond to marginalized groups
QS1: Evidence-based
Baseline (2014&15)
2016-2017
25% (4)75% (12)
95% (20) 5% (1)
QS2: Relevant
Baseline (2014&15)
2016-2017
25% (4)75% (12)
100% (21)
QS3: Coherent
Baseline (2014&15)
2016-2017
31% (5)69% (11)
100% (21)
QS4: Measurable
Baseline (2014&15)
2016-2017 10% (2)90% (19)
31% (5)69% (11)
QS5: Implementable
Baseline (2014&15)
2016-2017
13% (2)88% (14)
33% (7)67% (14)
Met at least 4 standards
Baseline (2014&15)
2016-2017
38% (6)63% (10)
10% (2)90% (19)
GPE Results Report 2018
99
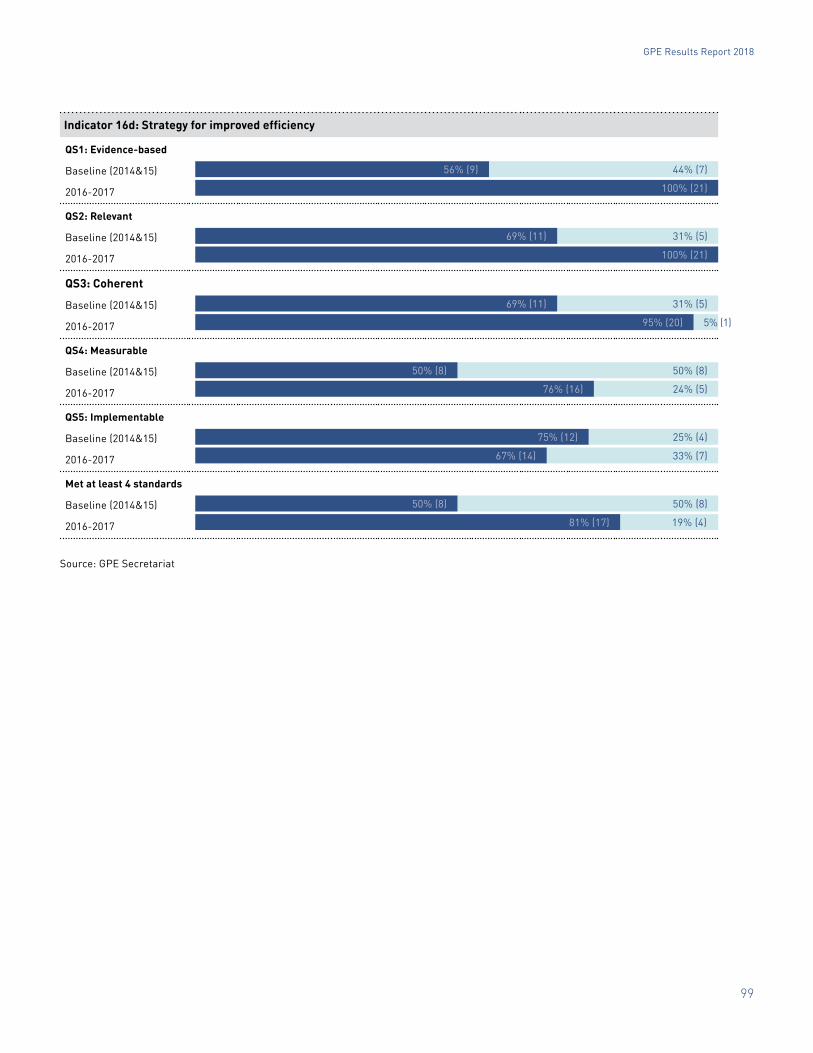
Indicator 16d: Strategy for improved efficiency
QS1: Evidence-based
Baseline (2014&15)
2016-2017
44% (7)56% (9)
100% (21)
QS2: Relevant
Baseline (2014&15)
2016-2017
31% (5)69% (11)
100% (21)
QS3: Coherent
Baseline (2014&15)
2016-2017
31% (5)69% (11)
95% (20) 5% (1)
QS4: Measurable
Baseline (2014&15)
2016-2017
50% (8)50% (8)
24% (5)76% (16)
QS5: Implementable
Baseline (2014&15)
2016-2017
25% (4)75% (12)
33% (7)67% (14)
Met at least 4 standards
Baseline (2014&15)
2016-2017
50% (8)50% (8)
19% (4)81% (17)
Source: GPE Secretariat
GPE Results Report 2018
100
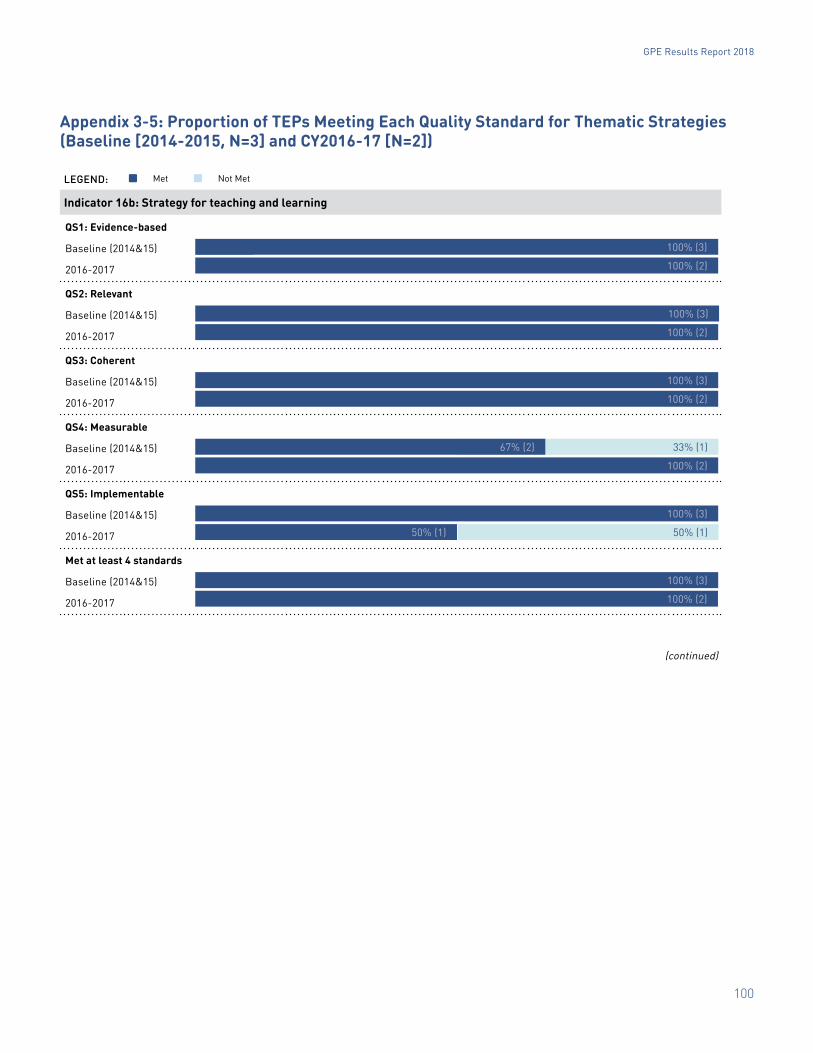
Appendix 3-5: Proportion of TEPs Meeting Each Quality Standard for Thematic Strategies (Baseline [2014-2015, N=3] and CY2016-17 [N=2])
LEGEND: � Met � Not Met
Indicator 16b: Strategy for teaching and learning
QS1: Evidence-based
Baseline (2014&15)
2016-2017
100% (3)
100% (2)
QS2: Relevant
Baseline (2014&15)
2016-2017
100% (3)
100% (2)
QS3: Coherent
Baseline (2014&15)
2016-2017
100% (3)
100% (2)
QS4: Measurable
Baseline (2014&15)
2016-2017
33% (1)67% (2)
100% (2)
QS5: Implementable
Baseline (2014&15)
2016-2017
100% (3)
50% (1)50% (1)
Met at least 4 standards
Baseline (2014&15)
2016-2017
100% (3)
100% (2)
(continued)
GPE Results Report 2018
101
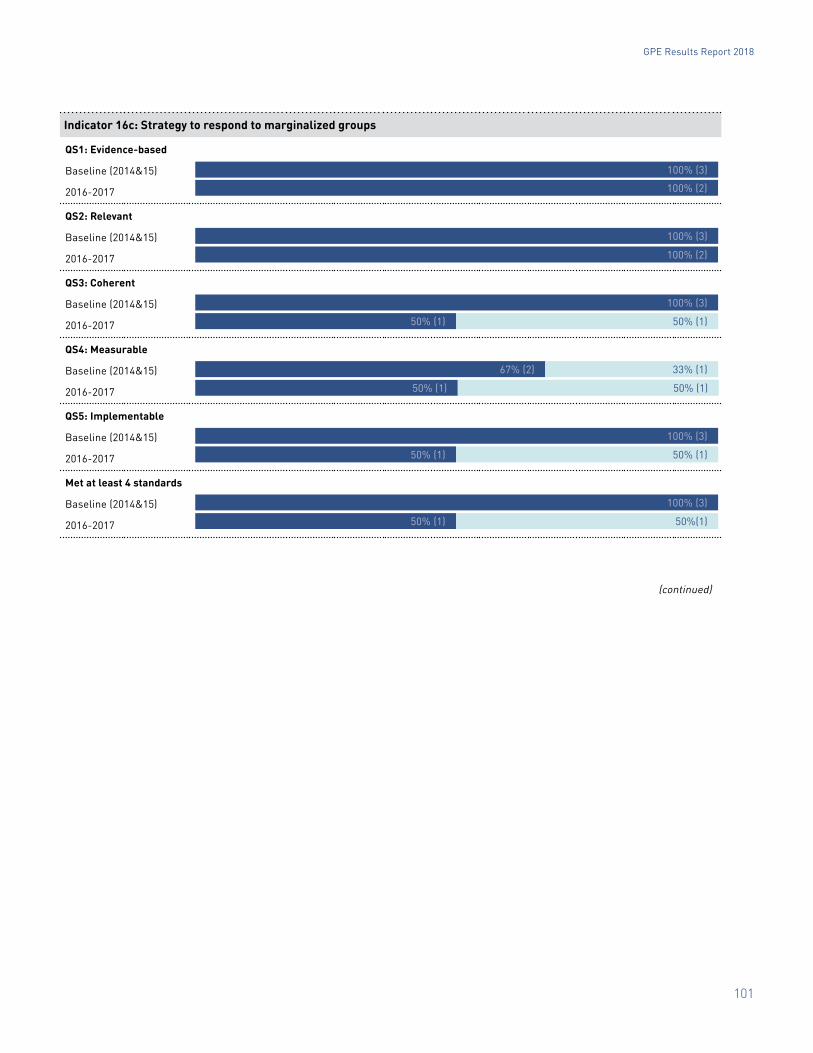
Indicator 16c: Strategy to respond to marginalized groups
QS1: Evidence-based
Baseline (2014&15)
2016-2017
100% (3)
100% (2)
QS2: Relevant
Baseline (2014&15)
2016-2017
100% (3)
100% (2)
QS3: Coherent
Baseline (2014&15)
2016-2017 50% (1) 50% (1)
100% (3)
QS4: Measurable
Baseline (2014&15)
2016-2017 50% (1) 50% (1)
67% (2) 33% (1)
QS5: Implementable
Baseline (2014&15)
2016-2017 50% (1) 50% (1)
100% (3)
Met at least 4 standards
Baseline (2014&15)
2016-2017 50% (1) 50%(1)
(continued)
100% (3)
GPE Results Report 2018
102
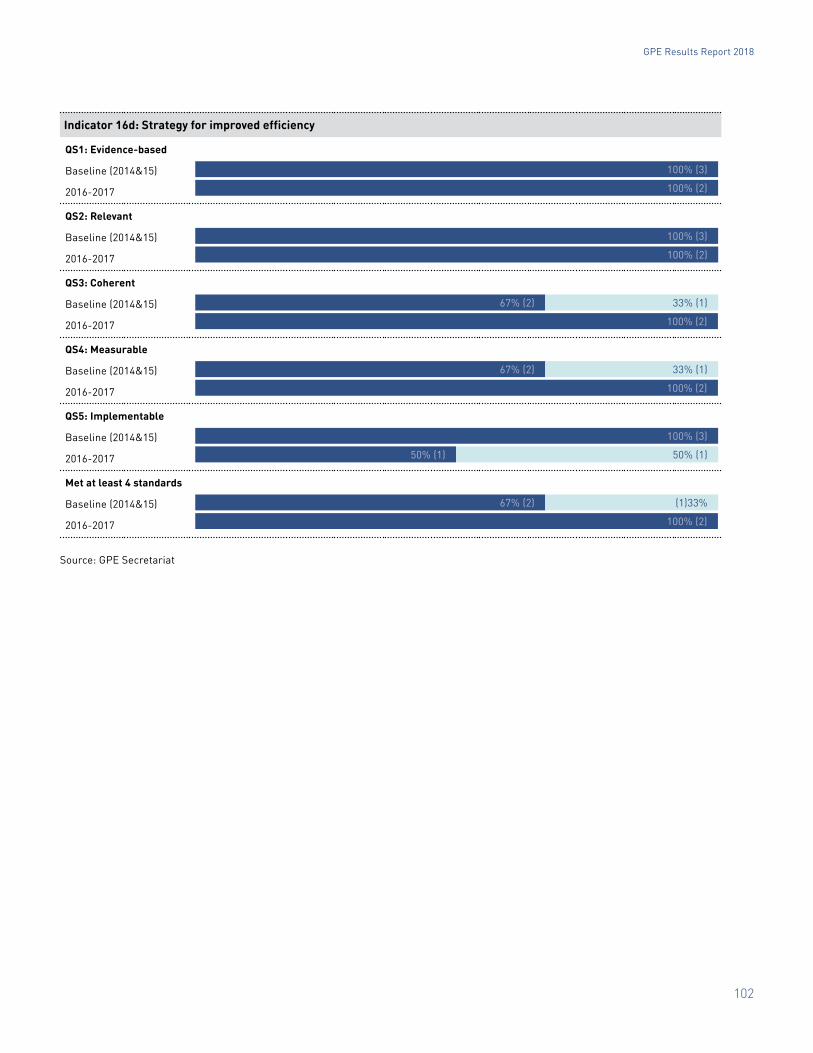
Indicator 16d: Strategy for improved efficiency
QS1: Evidence-based
Baseline (2014&15)
2016-2017 100% (2)
100% (3)
QS2: Relevant
Baseline (2014&15)
2016-2017 100% (2)
100% (3)
QS3: Coherent
Baseline (2014&15)
2016-2017 100% (2)
67% (2) 33% (1)
QS4: Measurable
Baseline (2014&15)
2016-2017 100% (2)
67% (2) 33% (1)
QS5: Implementable
Baseline (2014&15)
2016-2017 50% (1) 50% (1)
100% (3)
Met at least 4 standards
Baseline (2014&15)
2016-2017 100% (2)
67% (2) (1)33%
Source: GPE Secretariat
GPE Results Report 2018
103
Appendix 3-6: Quality Standards for Joint Sector Review
1. Participatory and inclusive: The JSR includes effective and transparent participation from all education sector stakeholders. This dimension represents inclusion (who is at the table) and participation (engagement and contribution to the proceedings).
2. Evidence-based: The JSR is informed by evidence as a measure of technical credibility in monitoring. This includes education and financial data from the year under review.
3. Aligned to shared policy frameworks: A JSR is aligned to a policy framework, shared with stakeholders, against which results are monitored and remedial actions are agreed upon.
4. A monitoring tool: The JSR monitors sector performance and key indicators of the ESP/TEP and overall sector progress. Monitoring should be viewed as more than education stocktaking or accounting for outputs; it should also encompass a learning function, where shortcomings in implementation and how to improve implementation are discussed.
5. Instrument for change effectively embedded into a policy cycle: Robust and actionable recommendations from the JSR feed the next policy cycle, ensuring a JSR is used as an instrument of change, inf luencing future policy planning and budget preparation and execution.
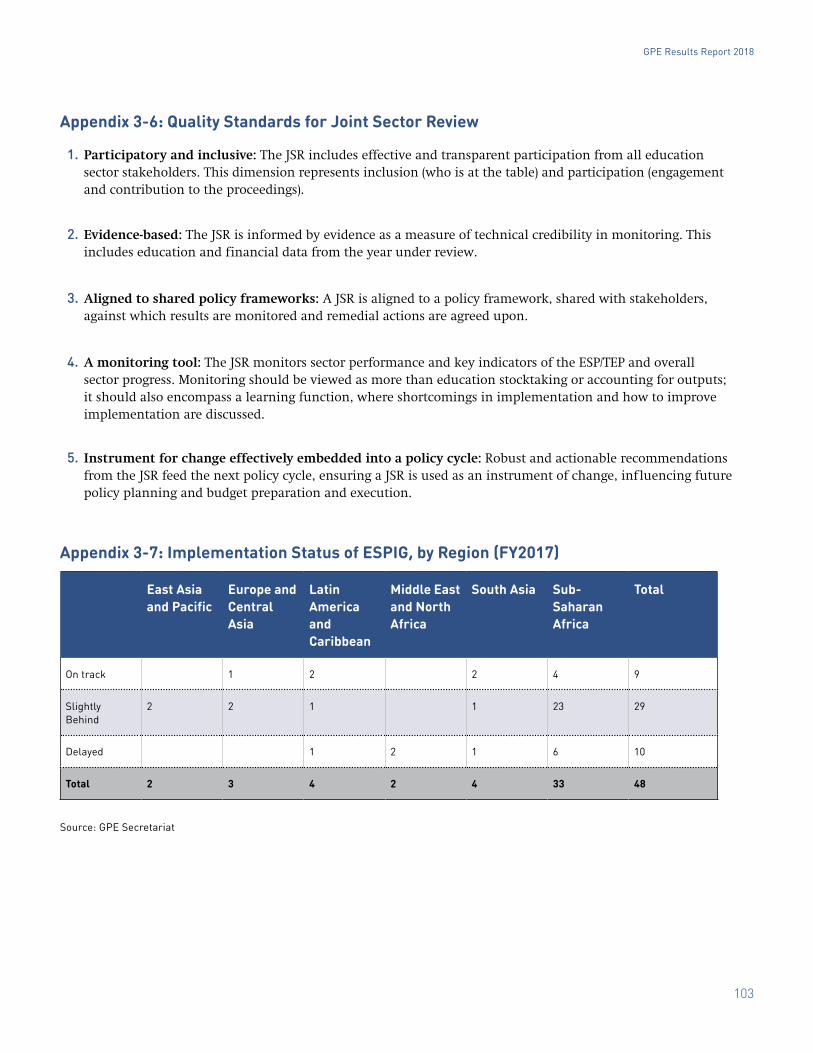
Appendix 3-7: Implementation Status of ESPIG, by Region (FY2017)
East Asia and Pacific
Europe and Central Asia
Latin America and Caribbean
Middle East and North Africa
South Asia Sub-Saharan Africa
Total
On track 1 2 2 4 9
Slightly Behind
2 2 1 1 23 29
Delayed 1 2 1 6 10
Total 2 3 4 2 4 33 48
Source: GPE Secretariat
GPE Results Report 2018
104
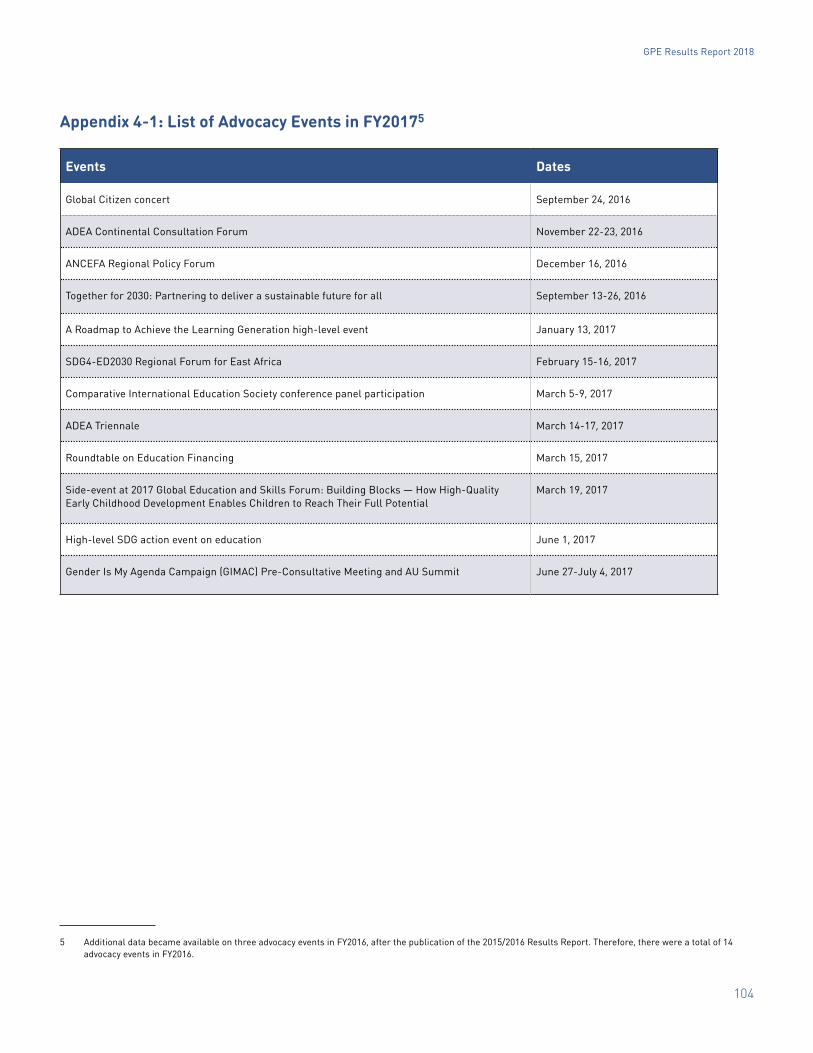
Appendix 4-1: List of Advocacy Events in FY20175
Events Dates
Global Citizen concert September 24, 2016
ADEA Continental Consultation Forum November 22-23, 2016
ANCEFA Regional Policy Forum December 16, 2016
Together for 2030: Partnering to deliver a sustainable future for all September 13-26, 2016
A Roadmap to Achieve the Learning Generation high-level event January 13, 2017
SDG4-ED2030 Regional Forum for East Africa February 15-16, 2017
Comparative International Education Society conference panel participation March 5-9, 2017
ADEA Triennale March 14-17, 2017
Roundtable on Education Financing March 15, 2017
Side-event at 2017 Global Education and Skills Forum: Building Blocks — How High-Quality Early Childhood Development Enables Children to Reach Their Full Potential
March 19, 2017
High-level SDG action event on education June 1, 2017
Gender Is My Agenda Campaign (GIMAC) Pre-Consultative Meeting and AU Summit June 27-July 4, 2017
5 Additional data became available on three advocacy events in FY2016, after the publication of the 2015/2016 Results Report. Therefore, there were a total of 14 advocacy events in FY2016.
GPE Results Report 2018
105
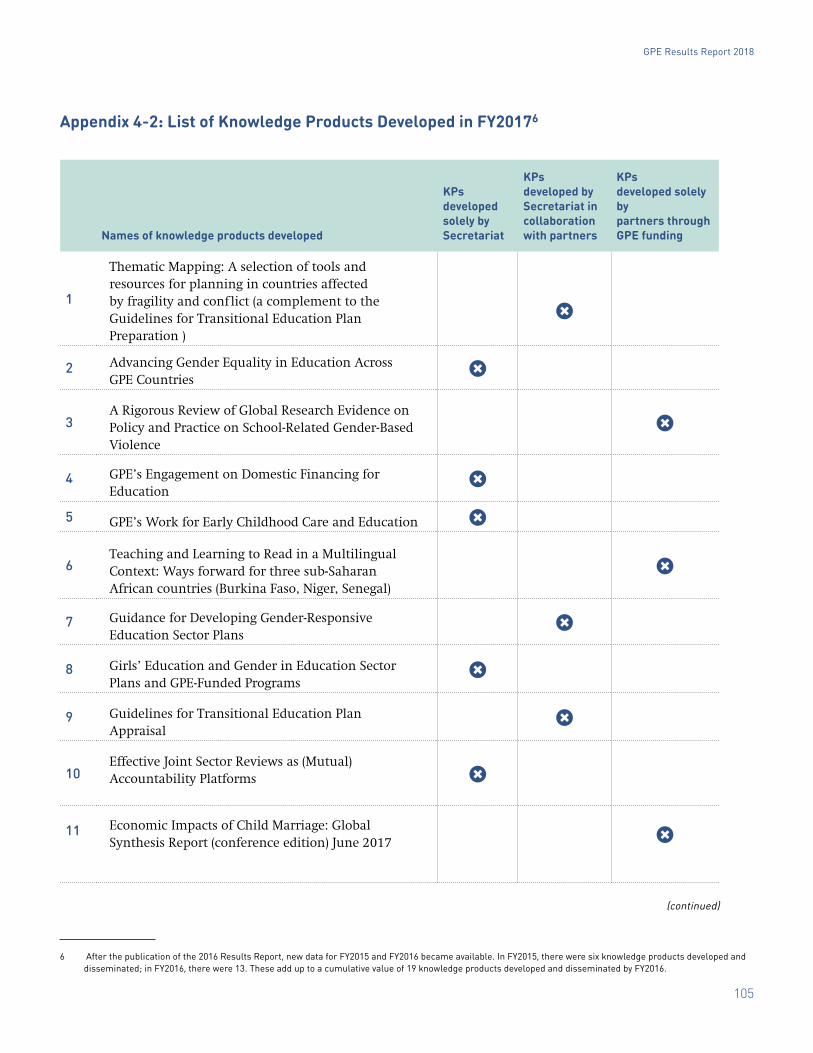
Appendix 4-2: List of Knowledge Products Developed in FY20176
Names of knowledge products developed
KPs developed solely by Secretariat
KPs developed by Secretariat in collaboration with partners
KPs developed solely by partners through GPE funding
1
Thematic Mapping: A selection of tools and resources for planning in countries affected by fragility and conflict (a complement to the Guidelines for Transitional Education Plan Preparation )
�
2 Advancing Gender Equality in Education Across GPE Countries
�
3A Rigorous Review of Global Research Evidence on Policy and Practice on School-Related Gender-Based Violence
�
4 GPE’s Engagement on Domestic Financing for Education
�
5 GPE’s Work for Early Childhood Care and Education �
6Teaching and Learning to Read in a Multilingual Context: Ways forward for three sub-Saharan African countries (Burkina Faso, Niger, Senegal)
�
7 Guidance for Developing Gender-Responsive Education Sector Plans
�
8 Girls’ Education and Gender in Education Sector Plans and GPE-Funded Programs
�
9 Guidelines for Transitional Education Plan Appraisal
�
10Effective Joint Sector Reviews as (Mutual) Accountability Platforms �
11 Economic Impacts of Child Marriage: Global Synthesis Report (conference edition) June 2017 �
6 After the publication of the 2016 Results Report, new data for FY2015 and FY2016 became available. In FY2015, there were six knowledge products developed and disseminated; in FY2016, there were 13. These add up to a cumulative value of 19 knowledge products developed and disseminated by FY2016.
(continued)
GPE Results Report 2018
106
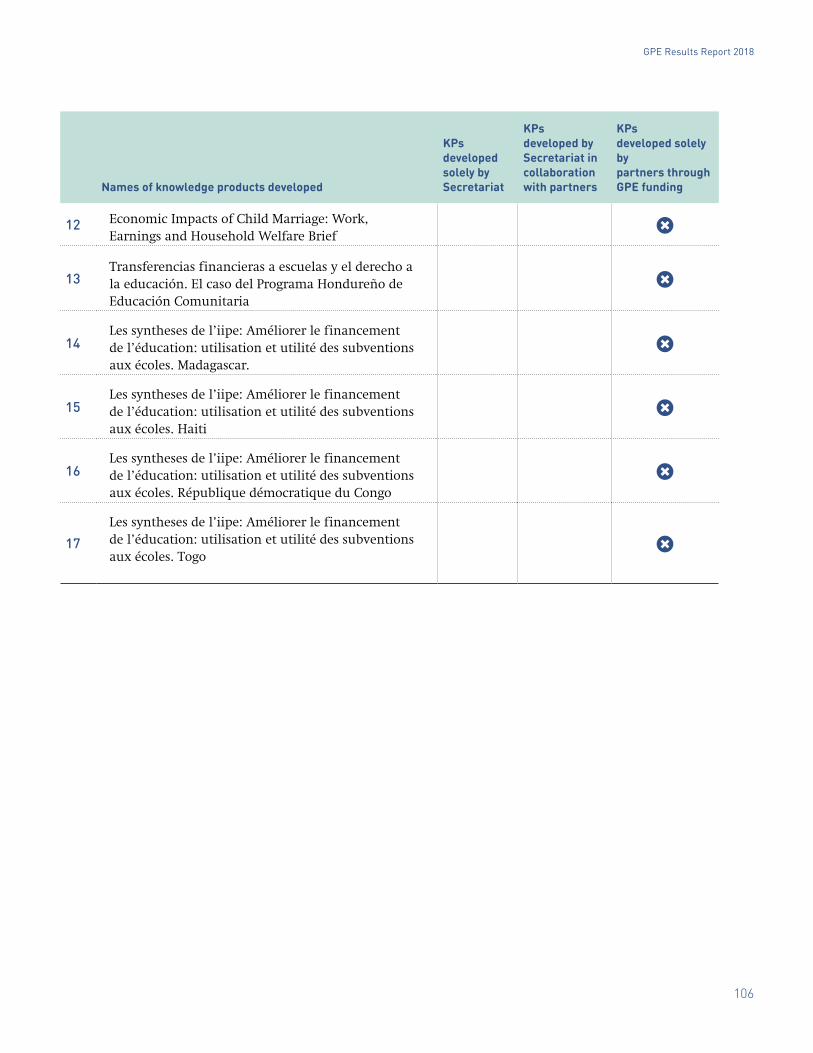
Names of knowledge products developed
KPs developed solely by Secretariat
KPs developed by Secretariat in collaboration with partners
KPs developed solely by partners through GPE funding
12 Economic Impacts of Child Marriage: Work, Earnings and Household Welfare Brief
�
13Transferencias financieras a escuelas y el derecho a la educación. El caso del Programa Hondureño de Educación Comunitaria
�
14Les syntheses de l’iipe: Améliorer le financement de l’éducation: utilisation et utilité des subventions aux écoles. Madagascar.
�
15Les syntheses de l’iipe: Améliorer le financement de l’éducation: utilisation et utilité des subventions aux écoles. Haiti
�
16Les syntheses de l’iipe: Améliorer le financement de l’éducation: utilisation et utilité des subventions aux écoles. République démocratique du Congo
�
17Les syntheses de l’iipe: Améliorer le financement de l’éducation: utilisation et utilité des subventions aux écoles. Togo
�
GPE Results Report 2018
107
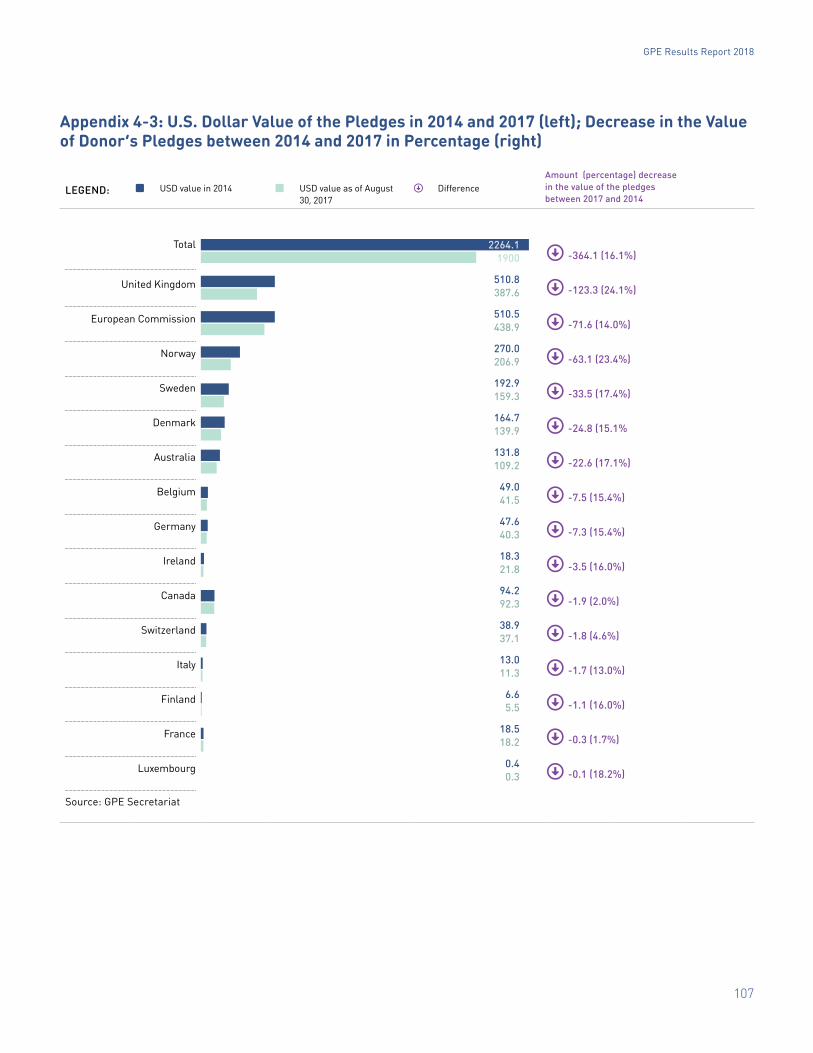
Appendix 4-3: U.S. Dollar Value of the Pledges in 2014 and 2017 (left); Decrease in the Value of Donor’s Pledges between 2014 and 2017 in Percentage (right)
LEGEND: � USD value in 2014 � USD value as of August 30, 2017
� Difference
Total
United Kingdom
European Commission
Norway
Sweden
Denmark
Australia
Belgium
Germany
Ireland
Canada
Switzerland
Italy
Finland
France
Luxembourg
Source: GPE Secretariat
Amount (percentage) decrease in the value of the pledges between 2017 and 2014
� -364.1 (16.1%)
� -123.3 (24.1%)
� -71.6 (14.0%)
� -63.1 (23.4%)
� -33.5 (17.4%)
� -24.8 (15.1%
� -22.6 (17.1%)
� -7.5 (15.4%)
� -7.3 (15.4%)
� -3.5 (16.0%)
� -1.9 (2.0%)
� -1.8 (4.6%)
� -1.7 (13.0%)
� -1.1 (16.0%)
� -0.3 (1.7%)
� -0.1 (18.2%)
2264.1 1900
510.8 387.6
510.5 438.9
270.0 206.9
192.9 159.3
164.7 139.9
131.8 109.2
49.0 41.5
47.6 40.3
18.3 21.8
94.2 92.3
38.9 37.1
13.0 11.3
6.6 5.5
18.5 18.2
0.4 0.3
GPE Results Report 2018
108
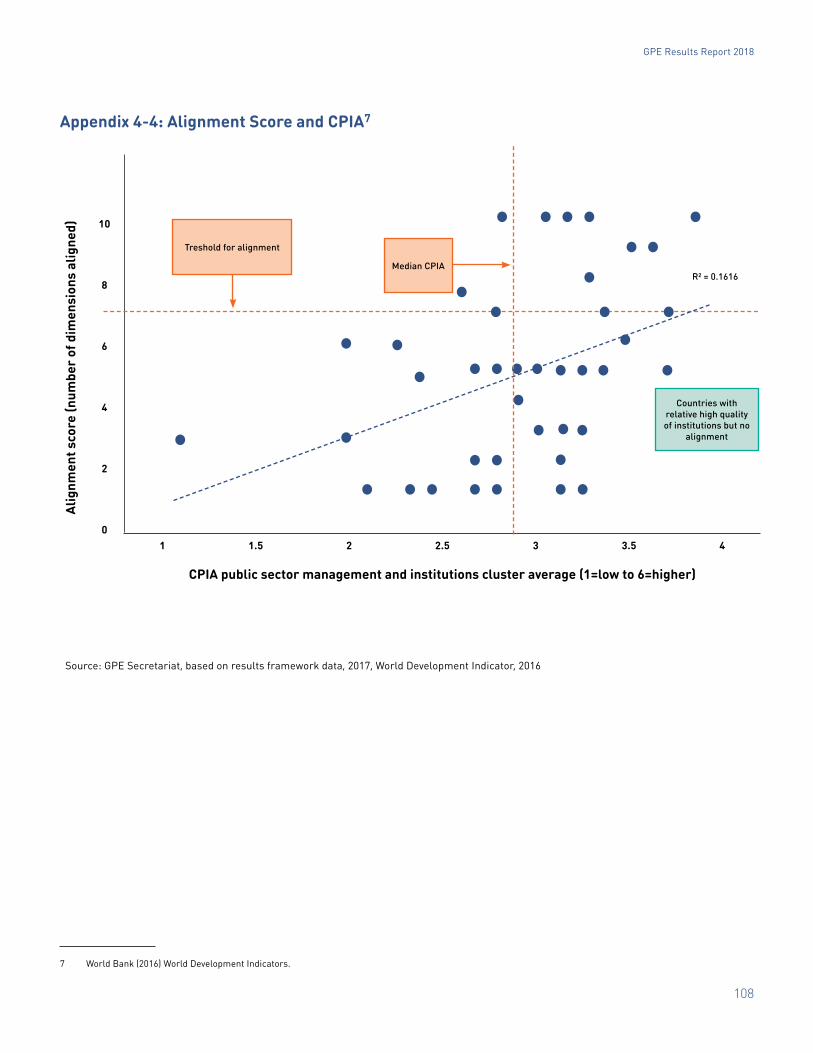
Appendix 4-4: Alignment Score and CPIA7
1 1.5 2 2.5 3 3.5 4
Median CPIA
10
8
6
4
2
0
Alig
nmen
t sco
re (n
umbe
r of
dim
ensi
ons
alig
ned)
CPIA public sector management and institutions cluster average (1=low to 6=higher)
Countries with relative high quality of institutions but no
alignment
R² = 0.1616
Treshold for alignment
Source: GPE Secretariat, based on results framework data, 2017, World Development Indicator, 2016
7 World Bank (2016) World Development Indicators.
GPE Results Report 2018
109
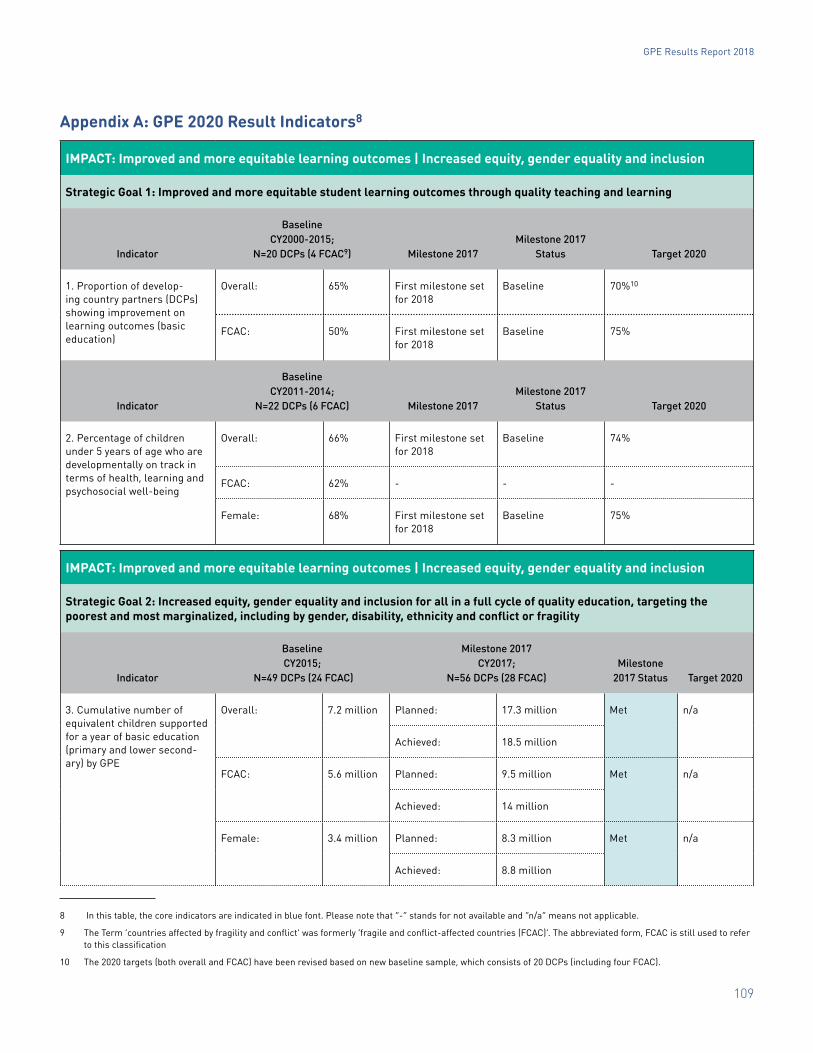
Appendix A: GPE 2020 Result Indicators8
IMPACT: Improved and more equitable learning outcomes | Increased equity, gender equality and inclusion
Strategic Goal 1: Improved and more equitable student learning outcomes through quality teaching and learning
Indicator
Baseline CY2000-2015;
N=20 DCPs (4 FCAC9) Milestone 2017Milestone 2017
Status Target 2020
1. Proportion of develop-ing country partners (DCPs) showing improvement on learning outcomes (basic education)
Overall: 65% First milestone set for 2018
Baseline 70%10
FCAC: 50% First milestone set for 2018
Baseline 75%
Indicator
BaselineCY2011-2014;
N=22 DCPs (6 FCAC) Milestone 2017Milestone 2017
Status Target 2020
2. Percentage of children under 5 years of age who are developmentally on track in terms of health, learning and psychosocial well-being
Overall: 66% First milestone set for 2018
Baseline 74%
FCAC: 62% - - -
Female: 68% First milestone set for 2018
Baseline 75%
IMPACT: Improved and more equitable learning outcomes | Increased equity, gender equality and inclusion
Strategic Goal 2: Increased equity, gender equality and inclusion for all in a full cycle of quality education, targeting the poorest and most marginalized, including by gender, disability, ethnicity and conflict or fragility
Indicator
BaselineCY2015;
N=49 DCPs (24 FCAC)
Milestone 2017CY2017;
N=56 DCPs (28 FCAC)Milestone
2017 Status Target 2020
3. Cumulative number of equivalent children supported for a year of basic education (primary and lower second-ary) by GPE
Overall: 7.2 million Planned: 17.3 million Met n/a
Achieved: 18.5 million
FCAC: 5.6 million Planned: 9.5 million Met n/a
Achieved: 14 million
Female: 3.4 million Planned: 8.3 million Met n/a
Achieved: 8.8 million
8 In this table, the core indicators are indicated in blue font. Please note that “-” stands for not available and “n/a” means not applicable.
9 The Term ‘countries affected by fragility and conflict’ was formerly ‘fragile and conflict-affected countries (FCAC)’. The abbreviated form, FCAC is still used to refer to this classification
10 The 2020 targets (both overall and FCAC) have been revised based on new baseline sample, which consists of 20 DCPs (including four FCAC).
GPE Results Report 2018
110
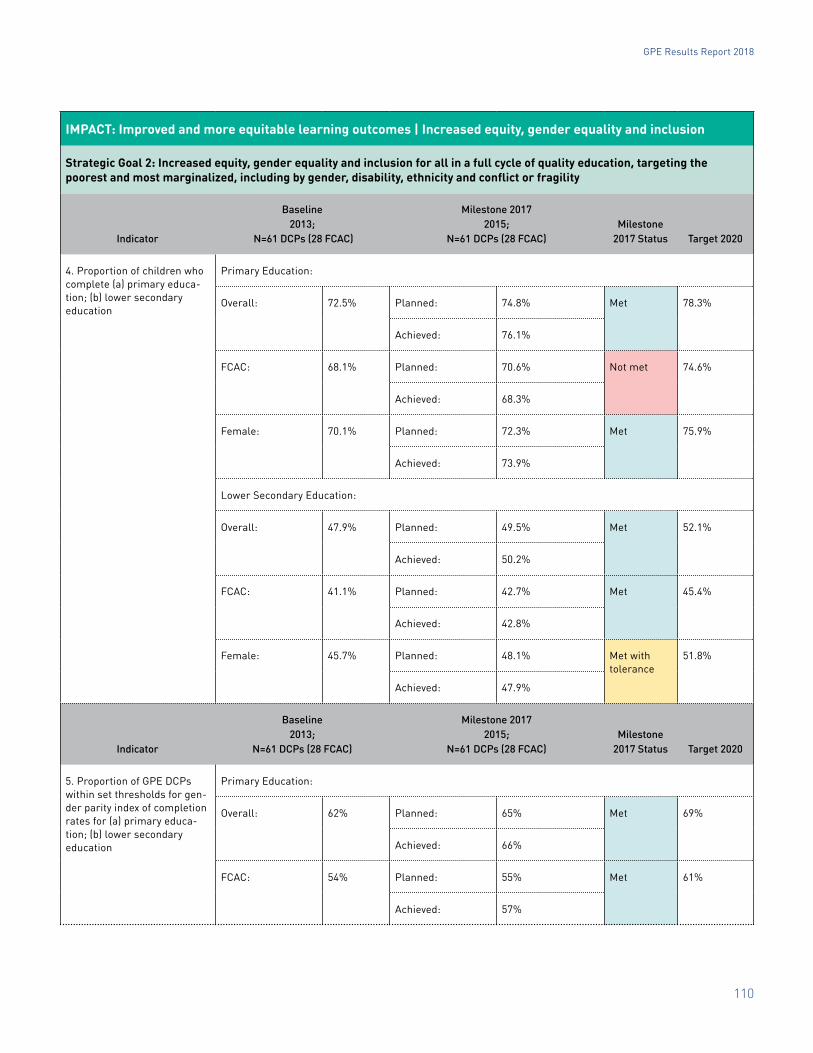
IMPACT: Improved and more equitable learning outcomes | Increased equity, gender equality and inclusion
Strategic Goal 2: Increased equity, gender equality and inclusion for all in a full cycle of quality education, targeting the poorest and most marginalized, including by gender, disability, ethnicity and conflict or fragility
Indicator
Baseline2013;
N=61 DCPs (28 FCAC)
Milestone 20172015;
N=61 DCPs (28 FCAC) Milestone
2017 Status Target 2020
4. Proportion of children who complete (a) primary educa-tion; (b) lower secondary education
Primary Education:
Overall: 72.5% Planned: 74.8% Met 78.3%
Achieved: 76.1%
FCAC: 68.1% Planned: 70.6% Not met 74.6%
Achieved: 68.3%
Female: 70.1% Planned: 72.3% Met 75.9%
Achieved: 73.9%
Lower Secondary Education:
Overall: 47.9% Planned: 49.5% Met 52.1%
Achieved: 50.2%
FCAC: 41.1% Planned: 42.7% Met 45.4%
Achieved: 42.8%
Female: 45.7% Planned: 48.1% Met with tolerance
51.8%
Achieved: 47.9%
Indicator
Baseline2013;
N=61 DCPs (28 FCAC)
Milestone 20172015;
N=61 DCPs (28 FCAC)Milestone
2017 Status Target 2020
5. Proportion of GPE DCPs within set thresholds for gen-der parity index of completion rates for (a) primary educa-tion; (b) lower secondary education
Primary Education:
Overall: 62% Planned: 65% Met 69%
Achieved: 66%
FCAC: 54% Planned: 55% Met 61%
Achieved: 57%
GPE Results Report 2018
111
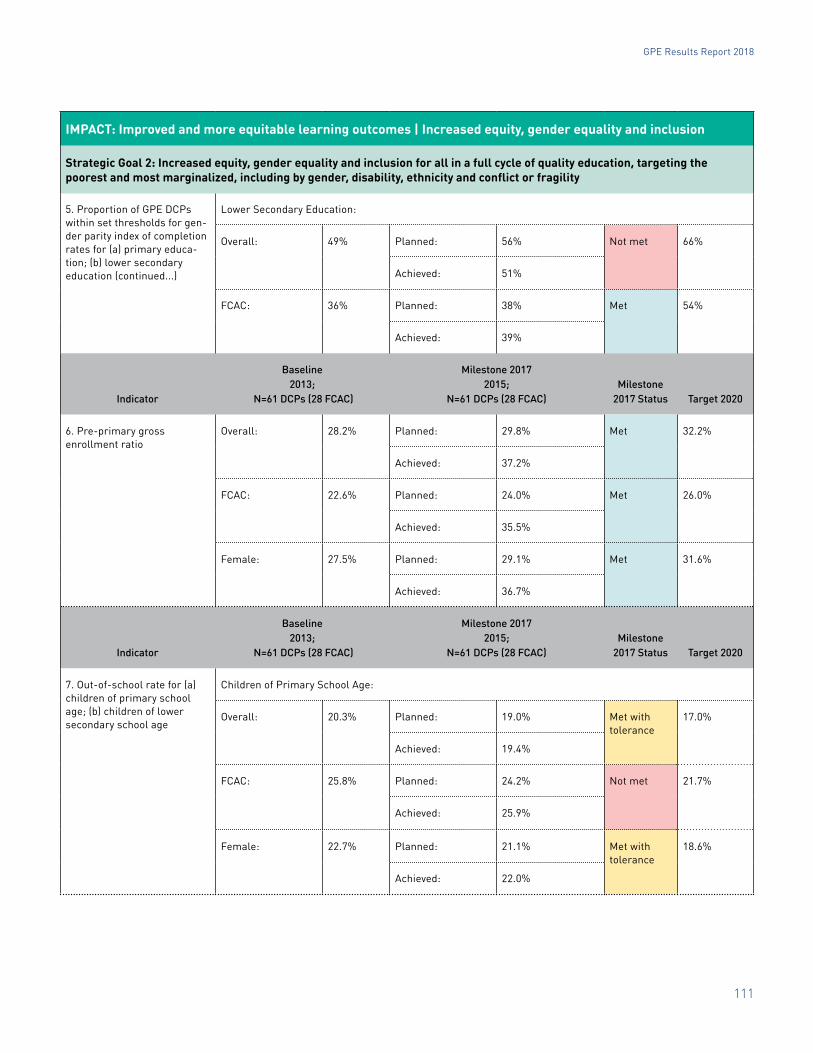
IMPACT: Improved and more equitable learning outcomes | Increased equity, gender equality and inclusion
Strategic Goal 2: Increased equity, gender equality and inclusion for all in a full cycle of quality education, targeting the poorest and most marginalized, including by gender, disability, ethnicity and conflict or fragility
5. Proportion of GPE DCPs within set thresholds for gen-der parity index of completion rates for (a) primary educa-tion; (b) lower secondary education (continued...)
Lower Secondary Education:
Overall: 49% Planned: 56% Not met 66%
Achieved: 51%
FCAC: 36% Planned: 38% Met 54%
Achieved: 39%
Indicator
Baseline2013;
N=61 DCPs (28 FCAC)
Milestone 20172015;
N=61 DCPs (28 FCAC)Milestone
2017 Status Target 2020
6. Pre-primary gross enrollment ratio
Overall: 28.2% Planned: 29.8% Met 32.2%
Achieved: 37.2%
FCAC: 22.6% Planned: 24.0% Met 26.0%
Achieved: 35.5%
Female: 27.5% Planned: 29.1% Met 31.6%
Achieved: 36.7%
Indicator
Baseline2013;
N=61 DCPs (28 FCAC)
Milestone 2017 2015;
N=61 DCPs (28 FCAC)Milestone
2017 Status Target 2020
7. Out-of-school rate for (a) children of primary school age; (b) children of lower secondary school age
Children of Primary School Age:
Overall: 20.3% Planned: 19.0% Met with tolerance
17.0%
Achieved: 19.4%
FCAC: 25.8% Planned: 24.2% Not met 21.7%
Achieved: 25.9%
Female: 22.7% Planned: 21.1% Met with tolerance
18.6%
Achieved: 22.0%
GPE Results Report 2018
112
IMPACT: Improved and more equitable learning outcomes | Increased equity, gender equality and inclusion
Strategic Goal 2: Increased equity, gender equality and inclusion for all in a full cycle of quality education, targeting the poorest and most marginalized, including by gender, disability, ethnicity and conflict or fragility
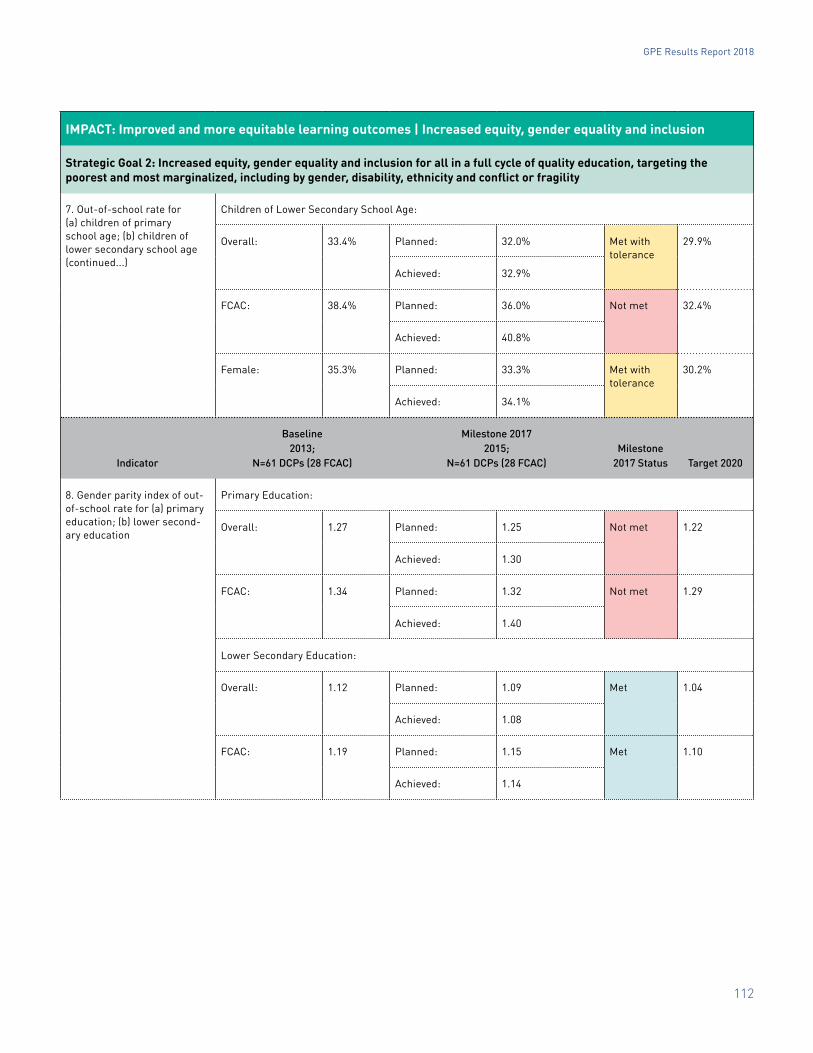
7. Out-of-school rate for (a) children of primary school age; (b) children of lower secondary school age (continued...)
Children of Lower Secondary School Age:
Overall: 33.4% Planned: 32.0% Met with tolerance
29.9%
Achieved: 32.9%
FCAC: 38.4% Planned: 36.0% Not met 32.4%
Achieved: 40.8%
Female: 35.3% Planned: 33.3% Met with tolerance
30.2%
Achieved: 34.1%
Indicator
Baseline2013;
N=61 DCPs (28 FCAC)
Milestone 2017 2015;
N=61 DCPs (28 FCAC)Milestone
2017 Status Target 2020
8. Gender parity index of out-of-school rate for (a) primary education; (b) lower second-ary education
Primary Education:
Overall: 1.27 Planned: 1.25 Not met 1.22
Achieved: 1.30
FCAC: 1.34 Planned: 1.32 Not met 1.29
Achieved: 1.40
Lower Secondary Education:
Overall: 1.12 Planned: 1.09 Met 1.04
Achieved: 1.08
FCAC: 1.19 Planned: 1.15 Met 1.10
Achieved: 1.14
GPE Results Report 2018
113
IMPACT: Improved and more equitable learning outcomes | Increased equity, gender equality and inclusion
Strategic Goal 2: Increased equity, gender equality and inclusion for all in a full cycle of quality education, targeting the poorest and most marginalized, including by gender, disability, ethnicity and conflict or fragility
Indicator
BaselineCY2010-2014;
N=59 DCPs (27 FCAC)
Milestone 2017 CY2010-2016;
N=59 DCPs (27 FCAC)Milestone
2017 Status Target 2020
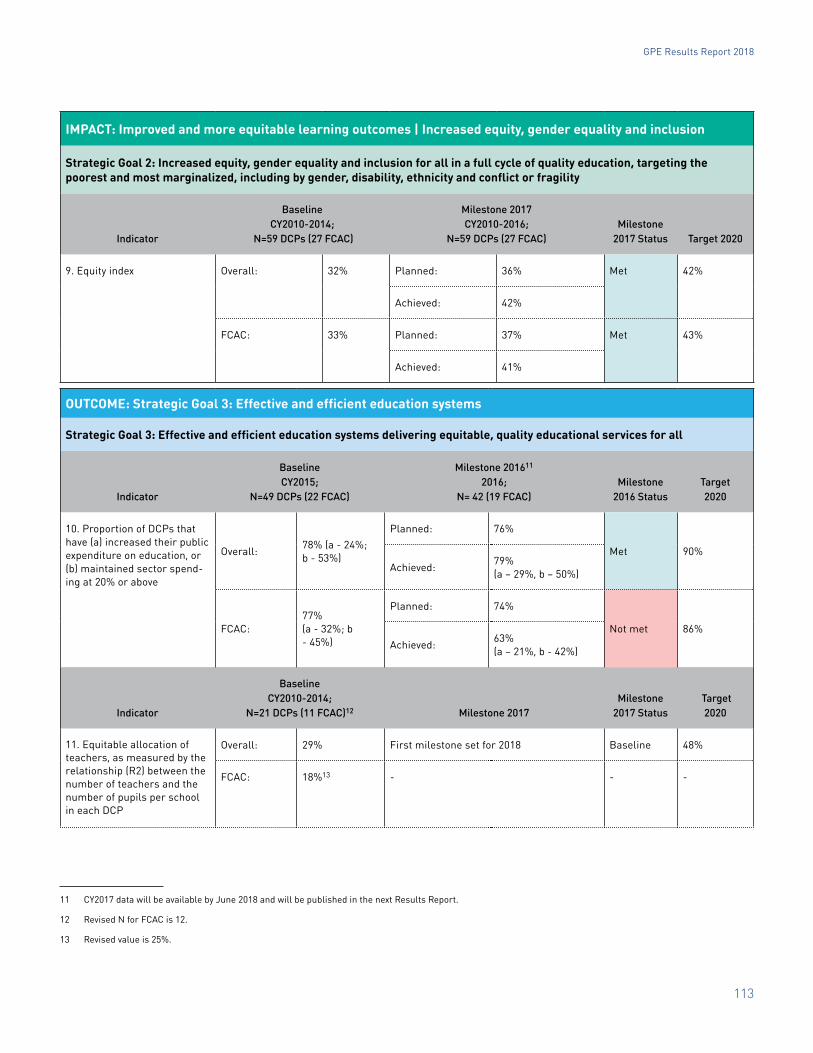
9. Equity index Overall: 32% Planned: 36% Met 42%
Achieved: 42%
FCAC: 33% Planned: 37% Met 43%
Achieved: 41%
OUTCOME: Strategic Goal 3: Effective and efficient education systems
Strategic Goal 3: Effective and efficient education systems delivering equitable, quality educational services for all
Indicator
BaselineCY2015;
N=49 DCPs (22 FCAC)
Milestone 201611
2016;N= 42 (19 FCAC)
Milestone 2016 Status
Target2020
10. Proportion of DCPs thathave (a) increased their publicexpenditure on education, or(b) maintained sector spend-ing at 20% or above
Overall: 78% (a - 24%; b - 53%)
Planned: 76%
Met 90%Achieved: 79%
(a – 29%, b – 50%)
FCAC:77% (a - 32%; b - 45%)
Planned: 74%
Not met 86%Achieved: 63%
(a – 21%, b - 42%)
Indicator
BaselineCY2010-2014;
N=21 DCPs (11 FCAC)12 Milestone 2017Milestone
2017 Status Target2020
11. Equitable allocation of teachers, as measured by the relationship (R2) between the number of teachers and the number of pupils per school in each DCP
Overall: 29% First milestone set for 2018 Baseline 48%
FCAC: 18%13 - - -
11 CY2017 data will be available by June 2018 and will be published in the next Results Report.
12 Revised N for FCAC is 12.
13 Revised value is 25%.
GPE Results Report 2018
114
OUTCOME: Strategic Goal 3: Effective and efficient education systems
Strategic Goal 3: Effective and efficient education systems delivering equitable, quality educational services for all
Indicator
Baseline2013;
N=55 DCPs (24 FCAC)
Milestone 2017 2015;
N=49 DCPs (20 FCAC)Milestone
2017 Status Target2020
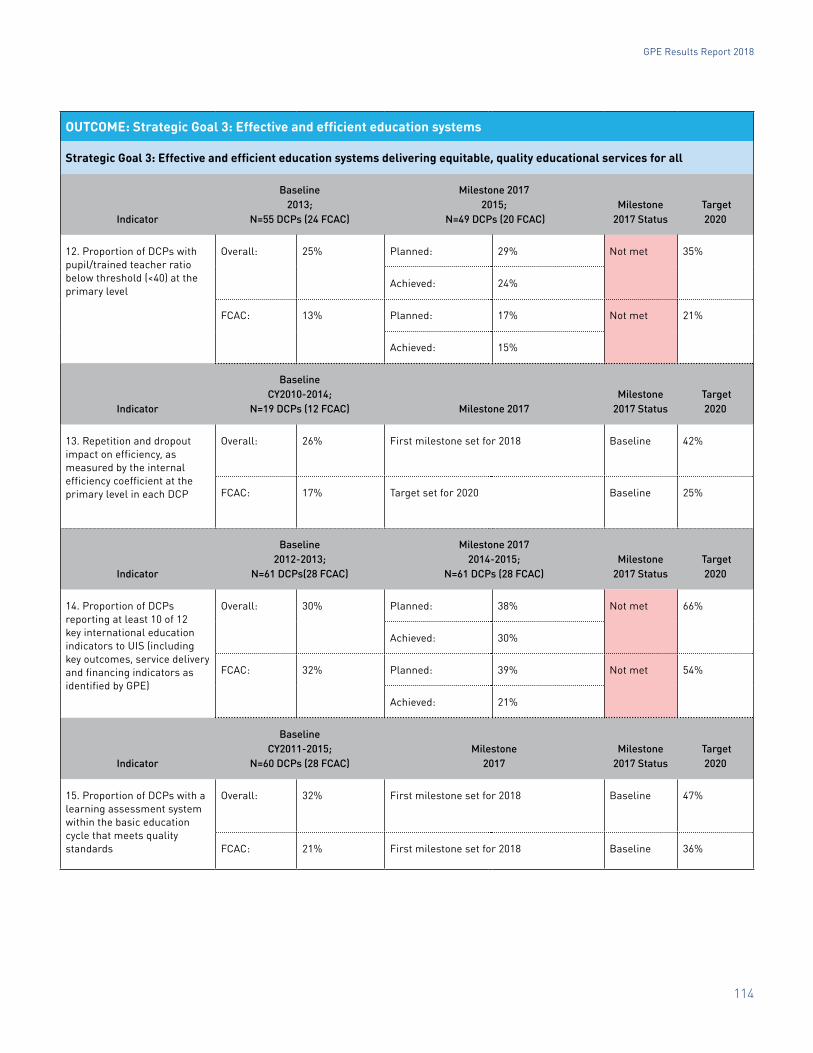
12. Proportion of DCPs with pupil/trained teacher ratio below threshold (<40) at the primary level
Overall: 25% Planned: 29% Not met 35%
Achieved: 24%
FCAC: 13% Planned: 17% Not met 21%
Achieved: 15%
Indicator
BaselineCY2010-2014;
N=19 DCPs (12 FCAC) Milestone 2017Milestone
2017 Status Target2020
13. Repetition and dropout impact on efficiency, as measured by the internal efficiency coefficient at the primary level in each DCP
Overall: 26% First milestone set for 2018 Baseline 42%
FCAC: 17% Target set for 2020 Baseline 25%
Indicator
Baseline2012-2013;
N=61 DCPs(28 FCAC)
Milestone 20172014-2015;
N=61 DCPs (28 FCAC)Milestone
2017 Status Target2020
14. Proportion of DCPs reporting at least 10 of 12 key international education indicators to UIS (including key outcomes, service delivery and financing indicators as identified by GPE)
Overall: 30% Planned: 38% Not met 66%
Achieved: 30%
FCAC: 32% Planned: 39% Not met 54%
Achieved: 21%
Indicator
Baseline CY2011-2015;
N=60 DCPs (28 FCAC)Milestone
2017Milestone
2017 Status Target2020
15. Proportion of DCPs with a learning assessment system within the basic education cycle that meets quality standards
Overall: 32% First milestone set for 2018 Baseline 47%
FCAC: 21% First milestone set for 2018 Baseline 36%
GPE Results Report 2018
115
COUNTRY-LEVEL OBJECTIVES: Strategic Objective 1: Strengthen education sector planning and policy implementation
Support evidence-based, nationally owned sector plans focused on equity, efficiency and learning
Indicator
Baseline CY2014-2015; N=19 sector plans
(16 ESPs and 3 TEPs) Milestone 2017Milestone
2017 StatusTarget2020
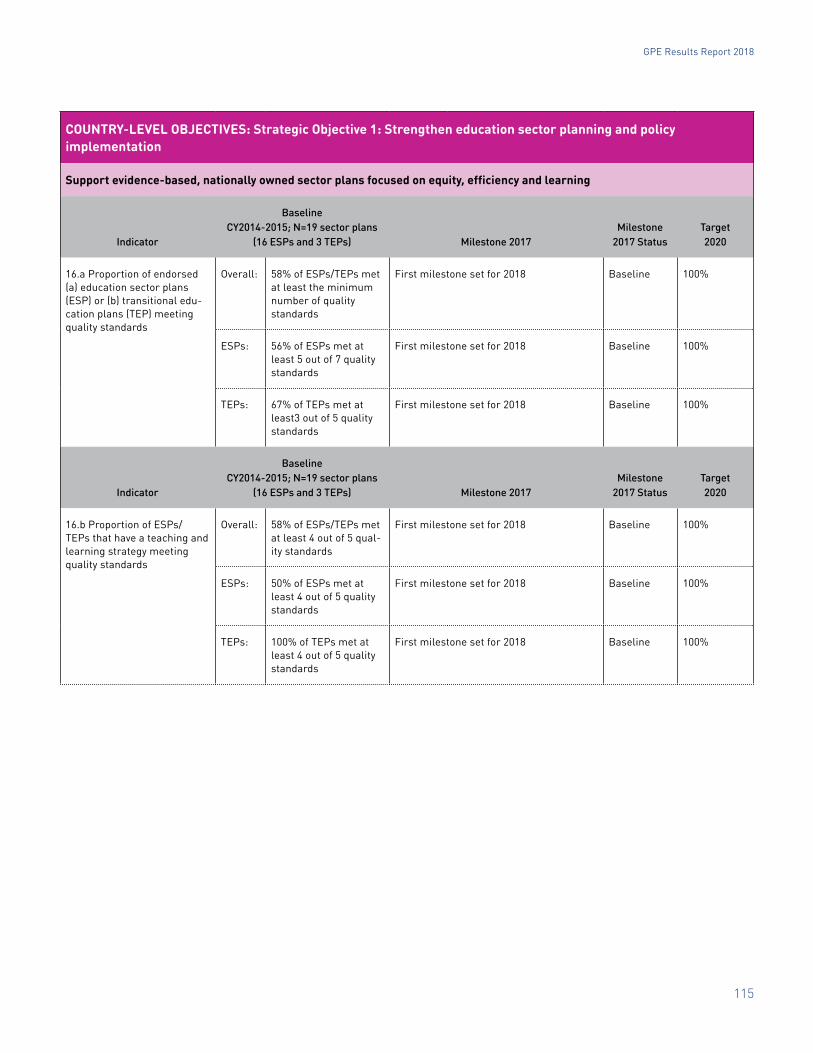
16.a Proportion of endorsed (a) education sector plans (ESP) or (b) transitional edu-cation plans (TEP) meeting quality standards
Overall: 58% of ESPs/TEPs met at least the minimum number of quality standards
First milestone set for 2018 Baseline 100%
ESPs: 56% of ESPs met at least 5 out of 7 quality standards
First milestone set for 2018 Baseline 100%
TEPs: 67% of TEPs met at least3 out of 5 quality standards
First milestone set for 2018 Baseline 100%
Indicator
Baseline CY2014-2015; N=19 sector plans
(16 ESPs and 3 TEPs) Milestone 2017Milestone
2017 StatusTarget2020
16.b Proportion of ESPs/TEPs that have a teaching and learning strategy meeting quality standards
Overall: 58% of ESPs/TEPs met at least 4 out of 5 qual-ity standards
First milestone set for 2018 Baseline 100%
ESPs: 50% of ESPs met at least 4 out of 5 quality standards
First milestone set for 2018 Baseline 100%
TEPs: 100% of TEPs met at least 4 out of 5 quality standards
First milestone set for 2018 Baseline 100%
GPE Results Report 2018
116
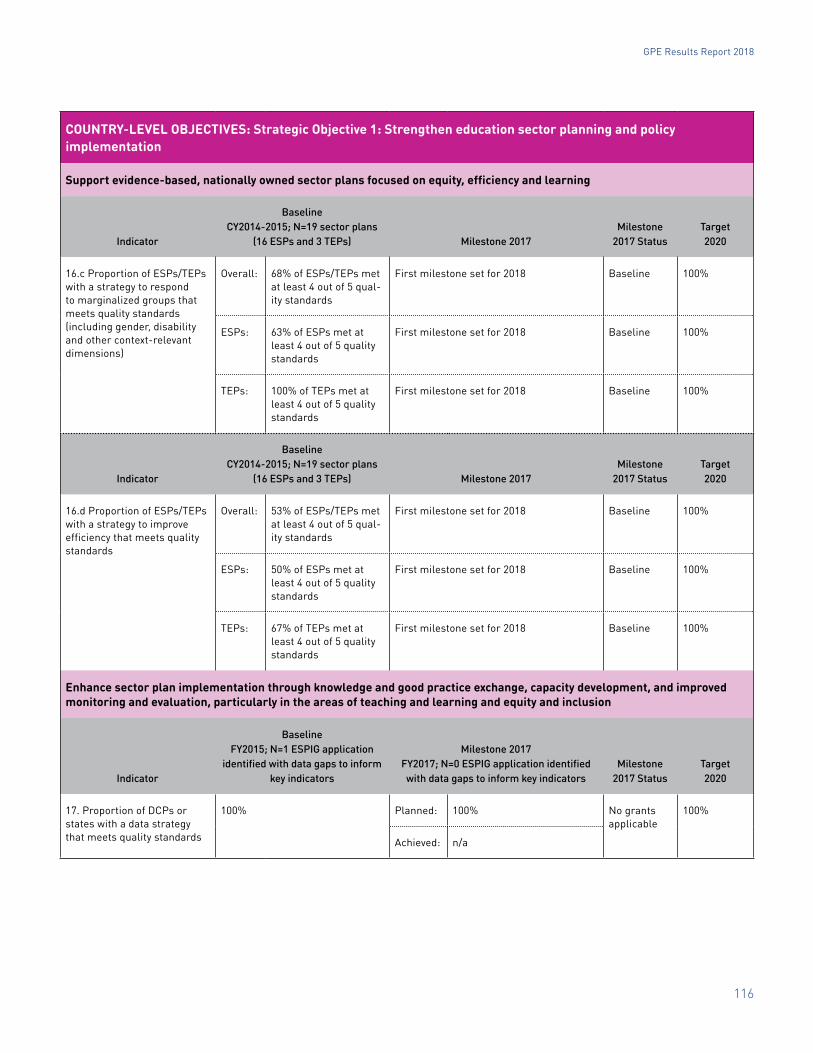
COUNTRY-LEVEL OBJECTIVES: Strategic Objective 1: Strengthen education sector planning and policy implementation
Support evidence-based, nationally owned sector plans focused on equity, efficiency and learning
Indicator
Baseline CY2014-2015; N=19 sector plans
(16 ESPs and 3 TEPs) Milestone 2017Milestone
2017 StatusTarget2020
16.c Proportion of ESPs/TEPs with a strategy to respond to marginalized groups that meets quality standards (including gender, disability and other context-relevant dimensions)
Overall: 68% of ESPs/TEPs met at least 4 out of 5 qual-ity standards
First milestone set for 2018 Baseline 100%
ESPs: 63% of ESPs met at least 4 out of 5 quality standards
First milestone set for 2018 Baseline 100%
TEPs: 100% of TEPs met at least 4 out of 5 quality standards
First milestone set for 2018 Baseline 100%
Indicator
Baseline CY2014-2015; N=19 sector plans
(16 ESPs and 3 TEPs) Milestone 2017Milestone
2017 StatusTarget2020
16.d Proportion of ESPs/TEPs with a strategy to improve efficiency that meets quality standards
Overall: 53% of ESPs/TEPs met at least 4 out of 5 qual-ity standards
First milestone set for 2018 Baseline 100%
ESPs: 50% of ESPs met at least 4 out of 5 quality standards
First milestone set for 2018 Baseline 100%
TEPs: 67% of TEPs met at least 4 out of 5 quality standards
First milestone set for 2018 Baseline 100%
Enhance sector plan implementation through knowledge and good practice exchange, capacity development, and improved monitoring and evaluation, particularly in the areas of teaching and learning and equity and inclusion
Indicator
Baseline FY2015; N=1 ESPIG application
identified with data gaps to inform key indicators
Milestone 2017FY2017; N=0 ESPIG application identified with data gaps to inform key indicators
Milestone 2017 Status
Target2020
17. Proportion of DCPs or states with a data strategy that meets quality standards
100% Planned: 100% No grants applicable
100%
Achieved: n/a
GPE Results Report 2018
117
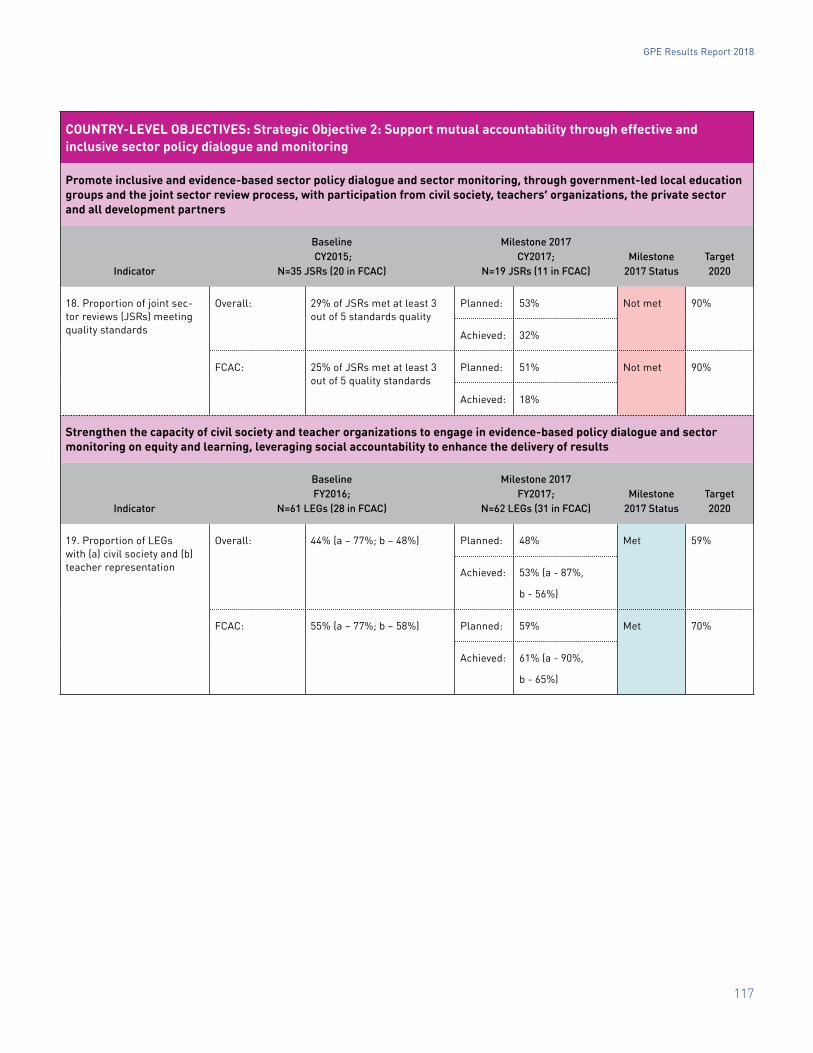
COUNTRY-LEVEL OBJECTIVES: Strategic Objective 2: Support mutual accountability through effective and inclusive sector policy dialogue and monitoring
Promote inclusive and evidence-based sector policy dialogue and sector monitoring, through government-led local education groups and the joint sector review process, with participation from civil society, teachers’ organizations, the private sector and all development partners
Indicator
Baseline CY2015;
N=35 JSRs (20 in FCAC)
Milestone 2017CY2017;
N=19 JSRs (11 in FCAC)Milestone
2017 StatusTarget2020
18. Proportion of joint sec-tor reviews (JSRs) meeting quality standards
Overall: 29% of JSRs met at least 3 out of 5 standards quality
Planned: 53% Not met 90%
Achieved: 32%
FCAC: 25% of JSRs met at least 3 out of 5 quality standards
Planned: 51% Not met 90%
Achieved: 18%
Strengthen the capacity of civil society and teacher organizations to engage in evidence-based policy dialogue and sector monitoring on equity and learning, leveraging social accountability to enhance the delivery of results
Indicator
BaselineFY2016;
N=61 LEGs (28 in FCAC)
Milestone 2017FY2017;
N=62 LEGs (31 in FCAC)Milestone
2017 StatusTarget2020
19. Proportion of LEGs with (a) civil society and (b) teacher representation
Overall: 44% (a – 77%; b – 48%) Planned: 48% Met 59%
Achieved: 53% (a - 87%,
b - 56%)
FCAC: 55% (a – 77%; b – 58%) Planned: 59% Met 70%
Achieved: 61% (a - 90%,
b - 65%)
GPE Results Report 2018
118
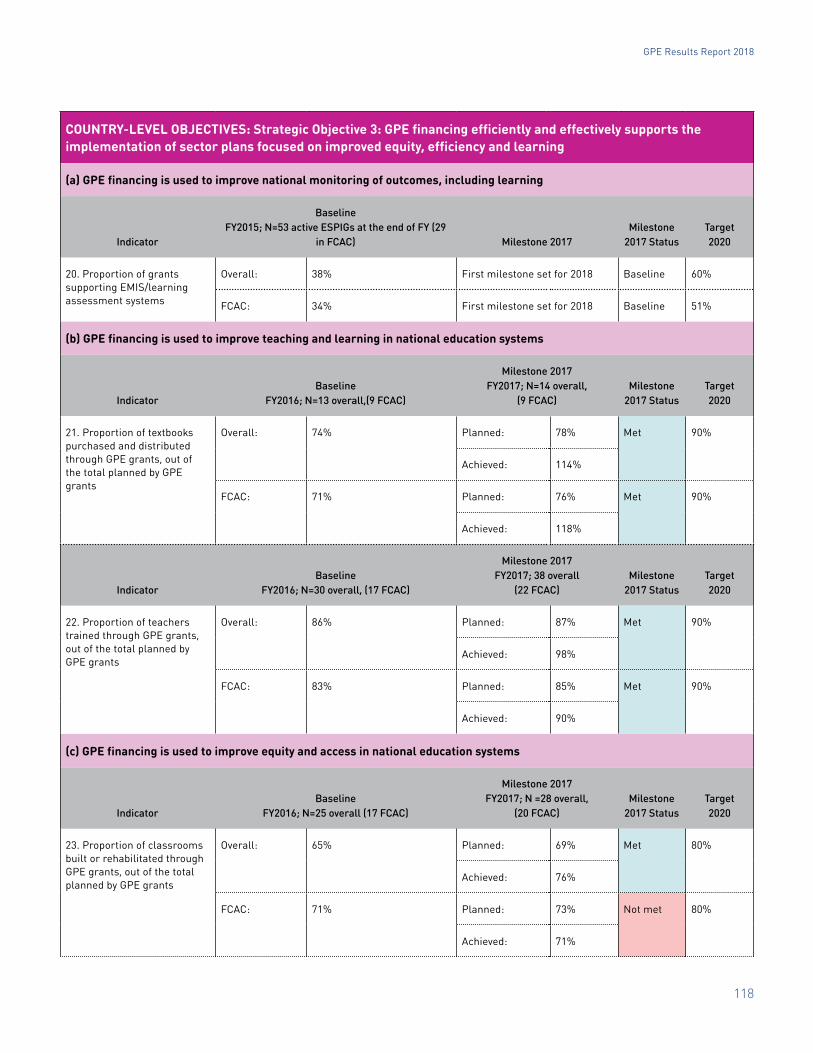
COUNTRY-LEVEL OBJECTIVES: Strategic Objective 3: GPE financing efficiently and effectively supports the implementation of sector plans focused on improved equity, efficiency and learning
(a) GPE financing is used to improve national monitoring of outcomes, including learning
Indicator
BaselineFY2015; N=53 active ESPIGs at the end of FY (29
in FCAC) Milestone 2017Milestone
2017 StatusTarget2020
20. Proportion of grants supporting EMIS/learning assessment systems
Overall: 38% First milestone set for 2018 Baseline 60%
FCAC: 34% First milestone set for 2018 Baseline 51%
(b) GPE financing is used to improve teaching and learning in national education systems
IndicatorBaseline
FY2016; N=13 overall,(9 FCAC)
Milestone 2017FY2017; N=14 overall,
(9 FCAC)Milestone
2017 StatusTarget2020
21. Proportion of textbooks purchased and distributed through GPE grants, out of the total planned by GPE grants
Overall: 74% Planned: 78% Met 90%
Achieved: 114%
FCAC: 71% Planned: 76% Met 90%
Achieved: 118%
IndicatorBaseline
FY2016; N=30 overall, (17 FCAC)
Milestone 2017FY2017; 38 overall
(22 FCAC)Milestone
2017 StatusTarget2020
22. Proportion of teachers trained through GPE grants, out of the total planned by GPE grants
Overall: 86% Planned: 87% Met 90%
Achieved: 98%
FCAC: 83% Planned: 85% Met 90%
Achieved: 90%
(c) GPE financing is used to improve equity and access in national education systems
IndicatorBaseline
FY2016; N=25 overall (17 FCAC)
Milestone 2017FY2017; N =28 overall,
(20 FCAC)Milestone
2017 StatusTarget2020
23. Proportion of classrooms built or rehabilitated through GPE grants, out of the total planned by GPE grants
Overall: 65% Planned: 69% Met 80%
Achieved: 76%
FCAC: 71% Planned: 73% Not met 80%
Achieved: 71%
GPE Results Report 2018
119
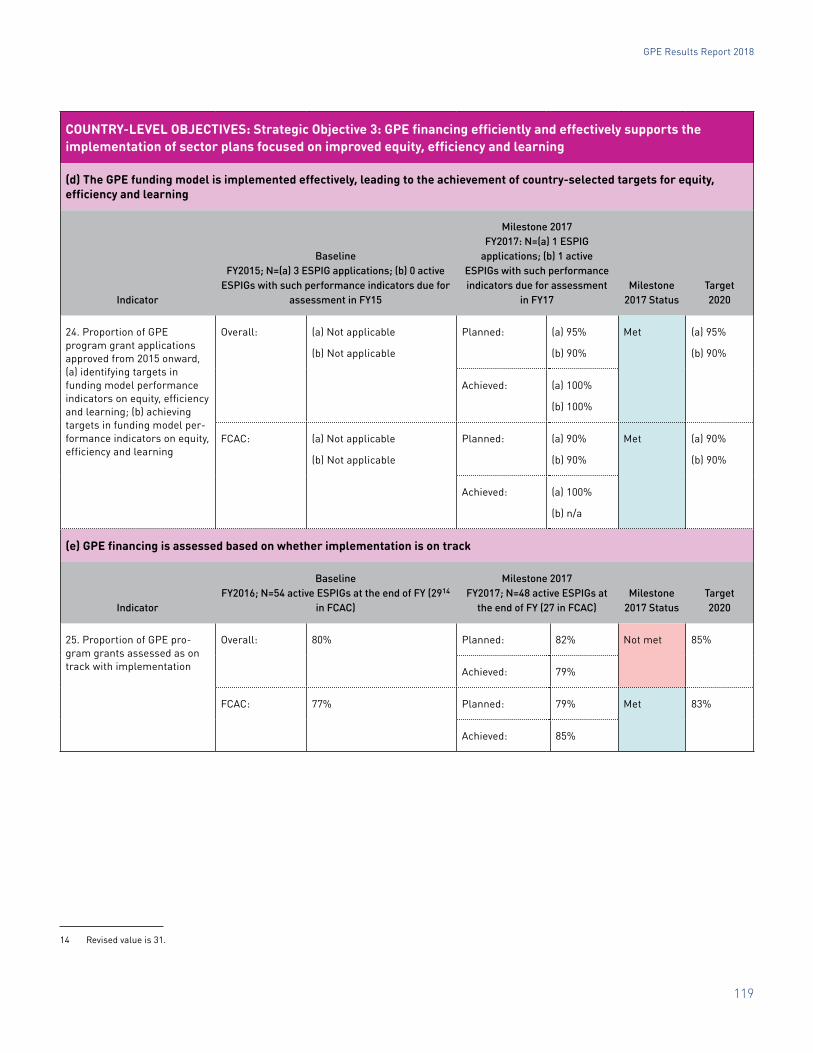
COUNTRY-LEVEL OBJECTIVES: Strategic Objective 3: GPE financing efficiently and effectively supports the implementation of sector plans focused on improved equity, efficiency and learning
(d) The GPE funding model is implemented effectively, leading to the achievement of country-selected targets for equity, efficiency and learning
Indicator
BaselineFY2015; N=(a) 3 ESPIG applications; (b) 0 active
ESPIGs with such performance indicators due for assessment in FY15
Milestone 2017FY2017: N=(a) 1 ESPIG
applications; (b) 1 active ESPIGs with such performance indicators due for assessment
in FY17Milestone
2017 StatusTarget2020
24. Proportion of GPE program grant applications approved from 2015 onward, (a) identifying targets in funding model performance indicators on equity, efficiency and learning; (b) achieving targets in funding model per-formance indicators on equity, efficiency and learning
Overall: (a) Not applicable
(b) Not applicable
Planned: (a) 95%
(b) 90%
Met (a) 95%
(b) 90%
Achieved: (a) 100%
(b) 100%
FCAC: (a) Not applicable
(b) Not applicable
Planned: (a) 90%
(b) 90%
Met (a) 90%
(b) 90%
Achieved: (a) 100%
(b) n/a
(e) GPE financing is assessed based on whether implementation is on track
Indicator
BaselineFY2016; N=54 active ESPIGs at the end of FY (2914
in FCAC)
Milestone 2017FY2017; N=48 active ESPIGs at
the end of FY (27 in FCAC)Milestone
2017 StatusTarget2020
25. Proportion of GPE pro-gram grants assessed as on track with implementation
Overall: 80% Planned: 82% Not met 85%
Achieved: 79%
FCAC: 77% Planned: 79% Met 83%
Achieved: 85%
14 Revised value is 31.
GPE Results Report 2018
120
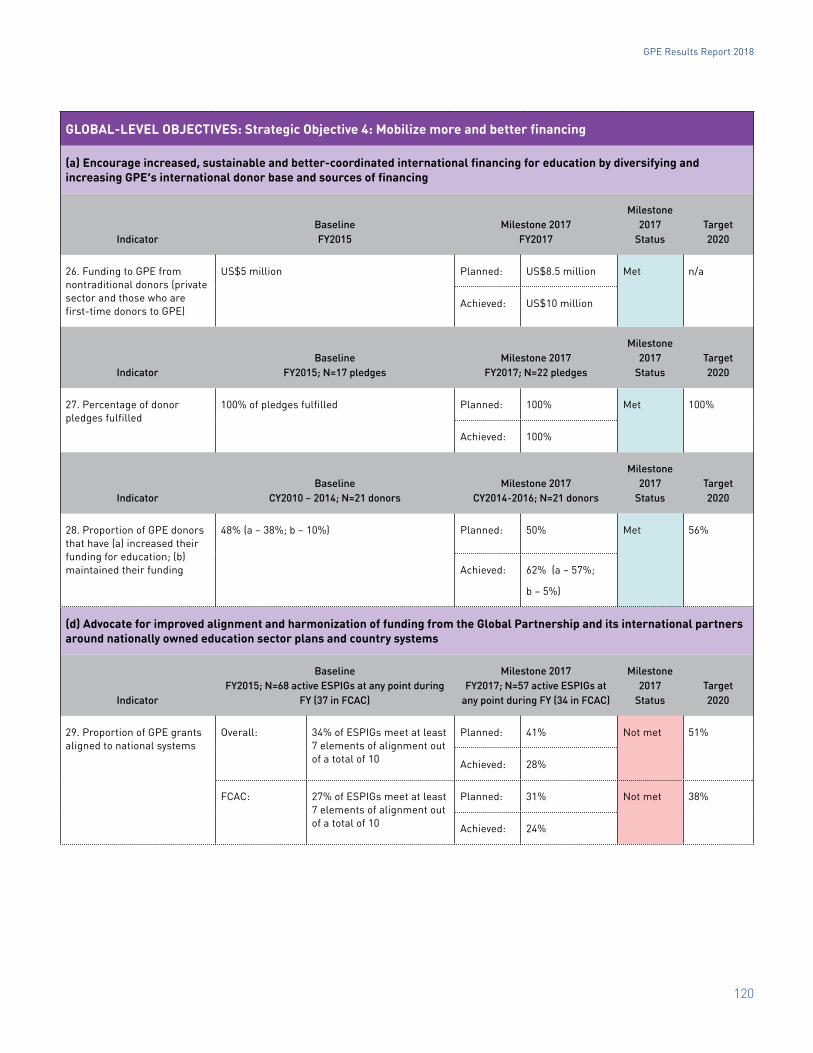
GLOBAL-LEVEL OBJECTIVES: Strategic Objective 4: Mobilize more and better financing
(a) Encourage increased, sustainable and better-coordinated international financing for education by diversifying and increasing GPE’s international donor base and sources of financing
Indicator BaselineFY2015
Milestone 2017FY2017
Milestone 2017
StatusTarget2020
26. Funding to GPE from nontraditional donors (private sector and those who are first-time donors to GPE)
US$5 million Planned: US$8.5 million Met n/a
Achieved: US$10 million
Indicator Baseline
FY2015; N=17 pledgesMilestone 2017
FY2017; N=22 pledges
Milestone 2017
StatusTarget2020
27. Percentage of donor pledges fulfilled
100% of pledges fulfilled Planned: 100% Met 100%
Achieved: 100%
Indicator Baseline
CY2010 – 2014; N=21 donorsMilestone 2017
CY2014-2016; N=21 donors
Milestone 2017
StatusTarget2020
28. Proportion of GPE donors that have (a) increased their funding for education; (b) maintained their funding
48% (a – 38%; b – 10%) Planned: 50% Met 56%
Achieved: 62% (a – 57%;
b – 5%)
(d) Advocate for improved alignment and harmonization of funding from the Global Partnership and its international partners around nationally owned education sector plans and country systems
Indicator
BaselineFY2015; N=68 active ESPIGs at any point during
FY (37 in FCAC)
Milestone 2017 FY2017; N=57 active ESPIGs at
any point during FY (34 in FCAC)
Milestone 2017
StatusTarget2020
29. Proportion of GPE grants aligned to national systems
Overall: 34% of ESPIGs meet at least 7 elements of alignment out of a total of 10
Planned: 41% Not met 51%
Achieved: 28%
FCAC: 27% of ESPIGs meet at least 7 elements of alignment out of a total of 10
Planned: 31% Not met 38%
Achieved: 24%
GPE Results Report 2018
121
Indicator
BaselineFY2015; N=68 active ESPIGs at any point during
FY (37 in FCAC)
Milestone 2017FY2017; N=57 active ESPIGs at
any point during FY (34 in FCAC)
Milestone 2017
StatusTarget2020
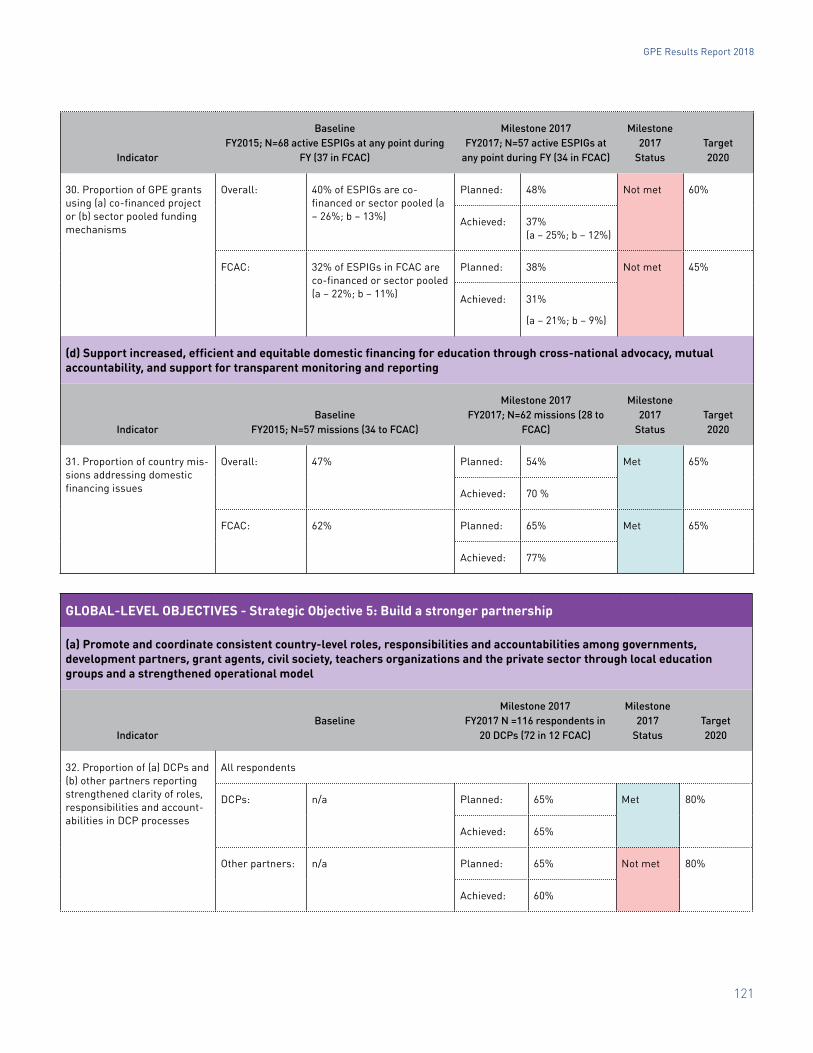
30. Proportion of GPE grants using (a) co-financed project or (b) sector pooled funding mechanisms
Overall: 40% of ESPIGs are co-financed or sector pooled (a – 26%; b – 13%)
Planned: 48% Not met 60%
Achieved: 37% (a – 25%; b – 12%)
FCAC: 32% of ESPIGs in FCAC are co-financed or sector pooled (a – 22%; b – 11%)
Planned: 38% Not met 45%
Achieved: 31%
(a – 21%; b – 9%)
(d) Support increased, efficient and equitable domestic financing for education through cross-national advocacy, mutual accountability, and support for transparent monitoring and reporting
Indicator Baseline
FY2015; N=57 missions (34 to FCAC)
Milestone 2017FY2017; N=62 missions (28 to
FCAC)
Milestone 2017
StatusTarget2020
31. Proportion of country mis-sions addressing domestic financing issues
Overall: 47% Planned: 54% Met 65%
Achieved: 70 %
FCAC: 62% Planned: 65% Met 65%
Achieved: 77%
GLOBAL-LEVEL OBJECTIVES - Strategic Objective 5: Build a stronger partnership
(a) Promote and coordinate consistent country-level roles, responsibilities and accountabilities among governments, development partners, grant agents, civil society, teachers organizations and the private sector through local education groups and a strengthened operational model
IndicatorBaseline
Milestone 2017FY2017 N =116 respondents in
20 DCPs (72 in 12 FCAC)
Milestone 2017
StatusTarget2020
32. Proportion of (a) DCPs and (b) other partners reporting strengthened clarity of roles, responsibilities and account-abilities in DCP processes
All respondents
DCPs: n/a Planned: 65% Met 80%
Achieved: 65%
Other partners: n/a Planned: 65% Not met 80%
Achieved: 60%
GPE Results Report 2018
122
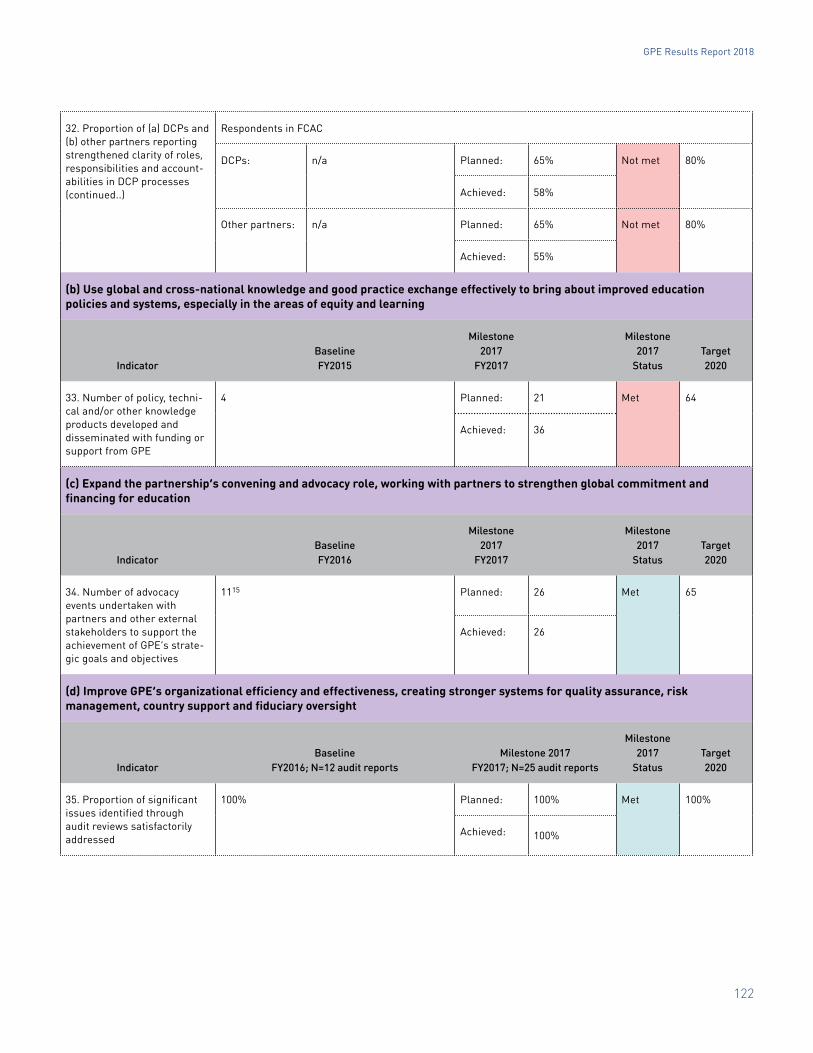
32. Proportion of (a) DCPs and (b) other partners reporting strengthened clarity of roles, responsibilities and account-abilities in DCP processes (continued..)
Respondents in FCAC
DCPs: n/a Planned: 65% Not met 80%
Achieved: 58%
Other partners: n/a Planned: 65% Not met 80%
Achieved: 55%
(b) Use global and cross-national knowledge and good practice exchange effectively to bring about improved education policies and systems, especially in the areas of equity and learning
IndicatorBaseline FY2015
Milestone 2017
FY2017
Milestone 2017
StatusTarget2020
33. Number of policy, techni-cal and/or other knowledge products developed and disseminated with funding or support from GPE
4 Planned: 21 Met 64
Achieved: 36
(c) Expand the partnership’s convening and advocacy role, working with partners to strengthen global commitment and financing for education
IndicatorBaseline FY2016
Milestone 2017
FY2017
Milestone 2017
StatusTarget2020
34. Number of advocacy events undertaken with partners and other external stakeholders to support the achievement of GPE’s strate-gic goals and objectives
1115 Planned: 26 Met 65
Achieved: 26
(d) Improve GPE’s organizational efficiency and effectiveness, creating stronger systems for quality assurance, risk management, country support and fiduciary oversight
IndicatorBaseline
FY2016; N=12 audit reportsMilestone 2017
FY2017; N=25 audit reports
Milestone 2017
StatusTarget2020
35. Proportion of significant issues identified through audit reviews satisfactorily addressed
100% Planned: 100% Met 100%
Achieved: 100%
GPE Results Report 2018
123
IndicatorBaseline
FY2015; N=2,254.74 total work weeks
Milestone 2017FY2017; N=3,297 total work
weeks
Milestone 2017
StatusTarget2020
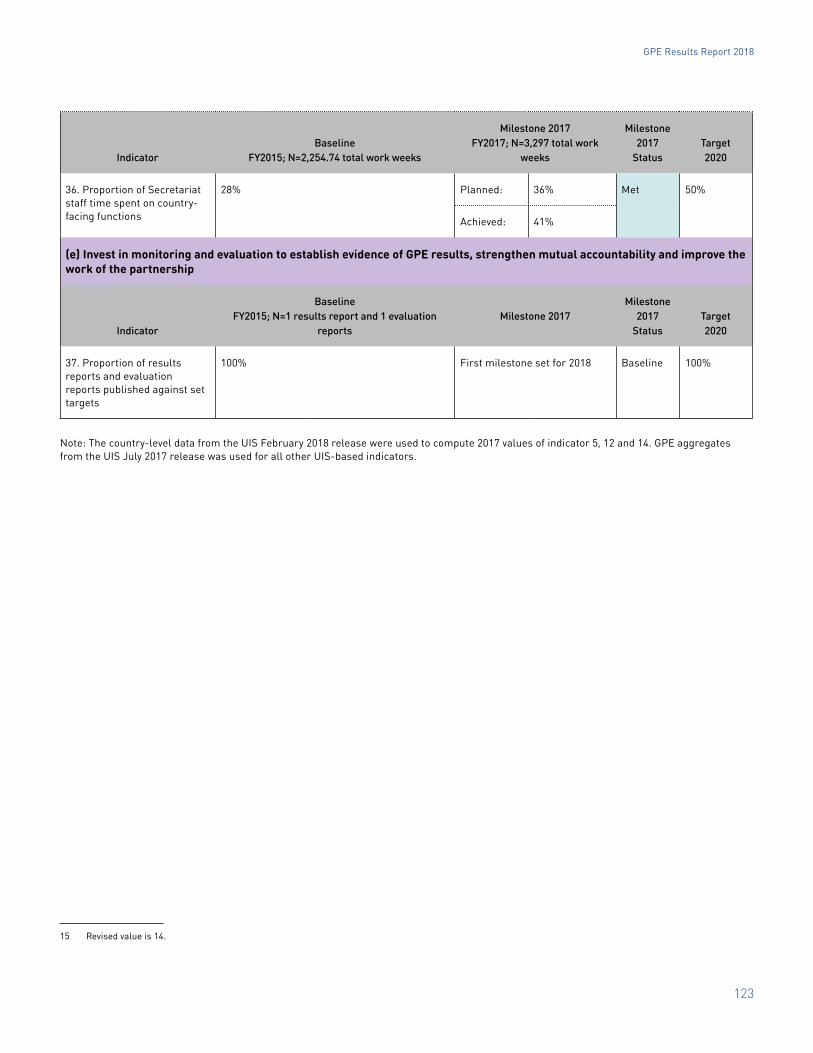
36. Proportion of Secretariat staff time spent on country-facing functions
28% Planned: 36% Met 50%
Achieved: 41%
(e) Invest in monitoring and evaluation to establish evidence of GPE results, strengthen mutual accountability and improve the work of the partnership
Indicator
Baseline FY2015; N=1 results report and 1 evaluation
reportsMilestone 2017
Milestone 2017
StatusTarget2020
37. Proportion of results reports and evaluation reports published against set targets
100% First milestone set for 2018 Baseline 100%
Note: The country-level data from the UIS February 2018 release were used to compute 2017 values of indicator 5, 12 and 14. GPE aggregates from the UIS July 2017 release was used for all other UIS-based indicators.
15 Revised value is 14.
GPE Results Report 2018
124
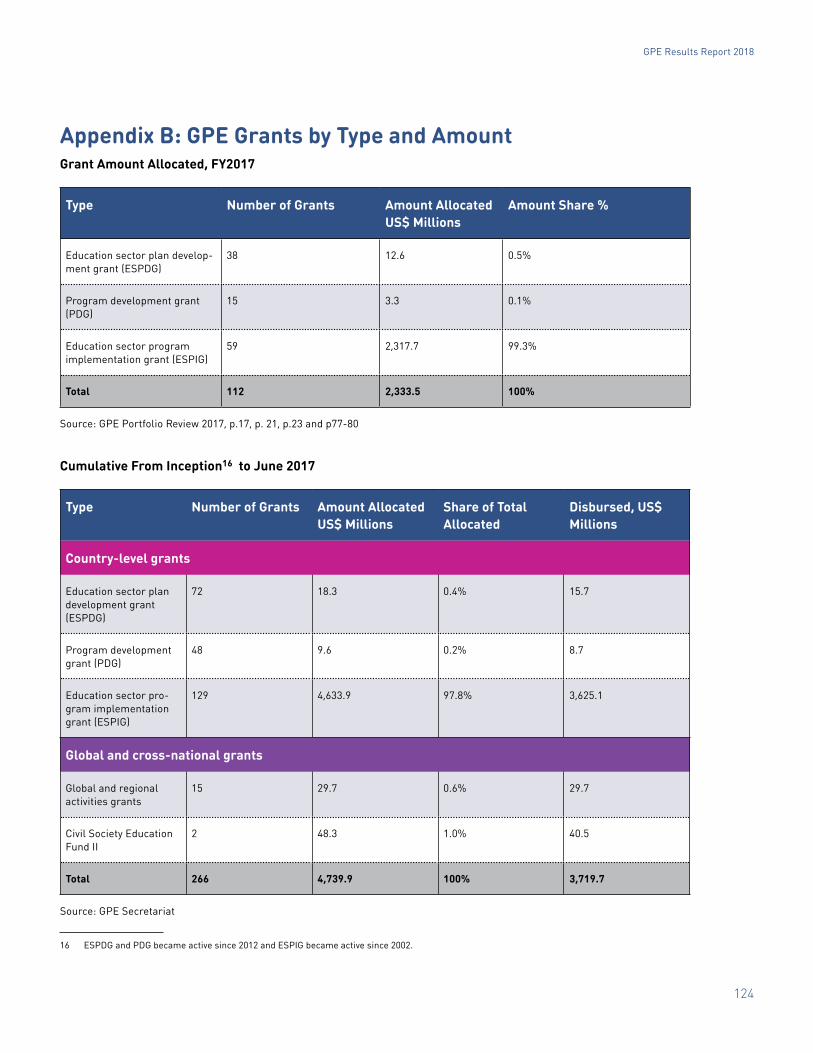
Appendix B: GPE Grants by Type and AmountGrant Amount Allocated, FY2017
Type Number of Grants Amount Allocated US$ Millions
Amount Share %
Education sector plan develop-ment grant (ESPDG)
38 12.6 0.5%
Program development grant (PDG)
15 3.3 0.1%
Education sector program implementation grant (ESPIG)
59 2,317.7 99.3%
Total 112 2,333.5 100%
Source: GPE Portfolio Review 2017, p.17, p. 21, p.23 and p77-80
Cumulative From Inception16 to June 2017
Type Number of Grants Amount Allocated US$ Millions
Share of Total Allocated
Disbursed, US$ Millions
Country-level grants
Education sector plan development grant (ESPDG)
72 18.3 0.4% 15.7
Program development grant (PDG)
48 9.6 0.2% 8.7
Education sector pro-gram implementation grant (ESPIG)
129 4,633.9 97.8% 3,625.1
Global and cross-national grants
Global and regional activities grants
15 29.7 0.6% 29.7
Civil Society Education Fund II
2 48.3 1.0% 40.5
Total 266 4,739.9 100% 3,719.7
Source: GPE Secretariat
16 ESPDG and PDG became active since 2012 and ESPIG became active since 2002.
GPE Results Report 2018
125
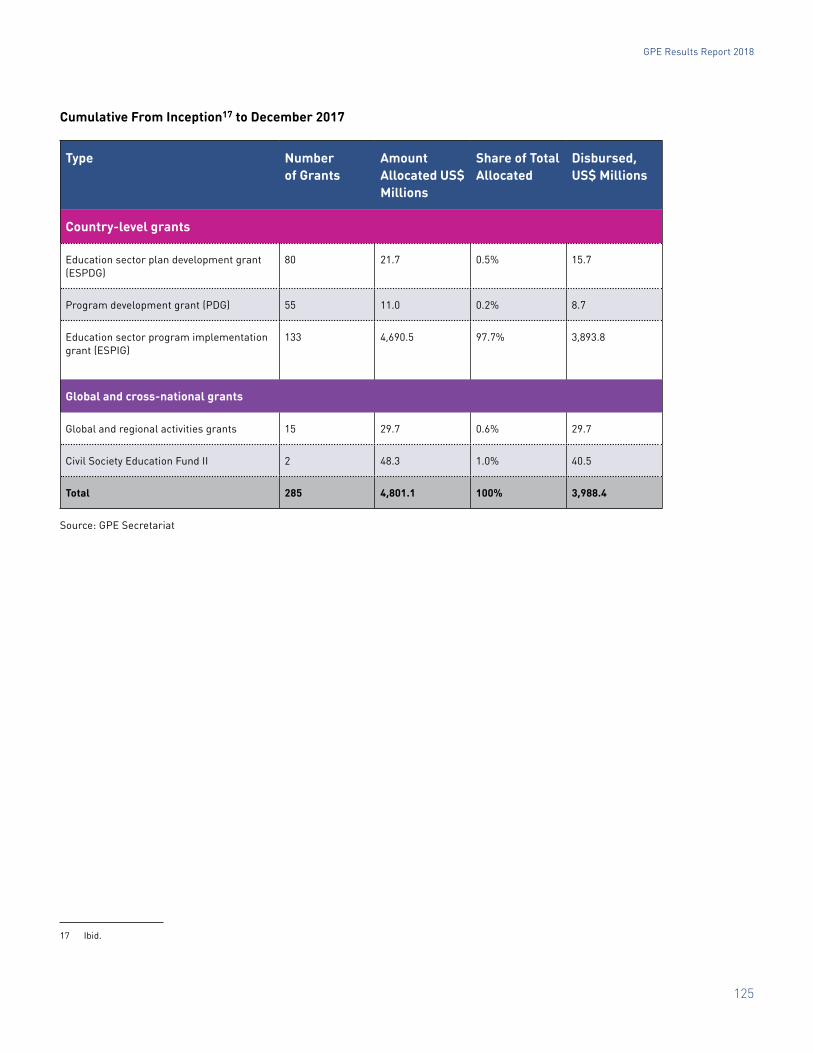
Cumulative From Inception17 to December 2017
Type Number of Grants
Amount Allocated US$ Millions
Share of Total Allocated
Disbursed, US$ Millions
Country-level grants
Education sector plan development grant (ESPDG)
80 21.7 0.5% 15.7
Program development grant (PDG) 55 11.0 0.2% 8.7
Education sector program implementation grant (ESPIG)
133 4,690.5 97.7% 3,893.8
Global and cross-national grants
Global and regional activities grants 15 29.7 0.6% 29.7
Civil Society Education Fund II 2 48.3 1.0% 40.5
Total 285 4,801.1 100% 3,988.4
Source: GPE Secretariat
17 Ibid.
GPE Results Report 2018
126
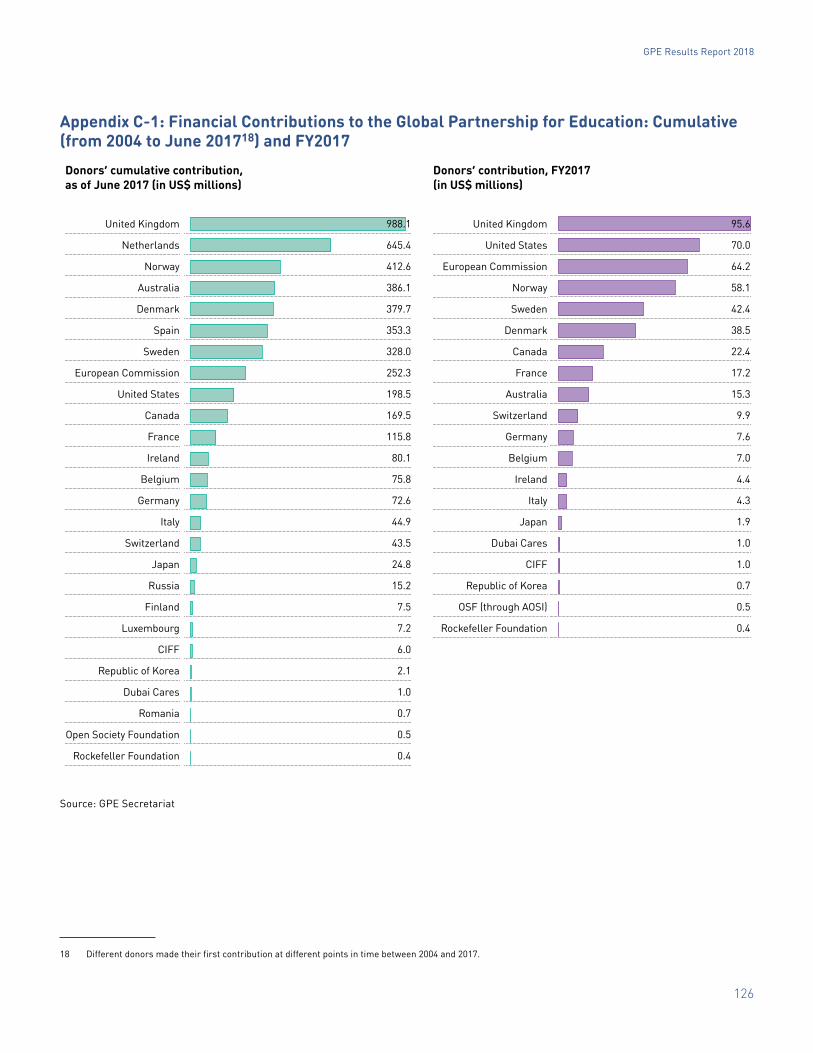
Appendix C-1: Financial Contributions to the Global Partnership for Education: Cumulative (from 2004 to June 201718) and FY2017
Donors’ cumulative contribution, as of June 2017 (in US$ millions)
Donors’ contribution, FY2017 (in US$ millions)
United Kingdom
Netherlands
Norway
Australia
Denmark
Spain
Sweden
European Commission
United States
Canada
France
Ireland
Belgium
Germany
Italy
Switzerland
Japan
Russia
Finland
Luxembourg
CIFF
Republic of Korea
Dubai Cares
Romania
Open Society Foundation
Rockefeller Foundation
United Kingdom
United States
European Commission
Norway
Sweden
Denmark
Canada
France
Australia
Switzerland
Germany
Belgium
Ireland
Italy
Japan
Dubai Cares
CIFF
Republic of Korea
OSF (through AOSI)
Rockefeller Foundation
Source: GPE Secretariat
18 Different donors made their first contribution at different points in time between 2004 and 2017.
988.1
645.4
412.6
386.1
379.7
353.3
328.0
252.3
198.5
169.5
115.8
80.1
75.8
72.6
44.9
43.5
24.8
15.2
7.5
7.2
6.0
2.1
1.0
0.7
0.5
0.4
95.6
70.0
64.2
58.1
42.4
38.5
22.4
17.2
15.3
9.9
7.6
7.0
4.4
4.3
1.9
1.0
1.0
0.7
0.5
0.4
GPE Results Report 2018
127
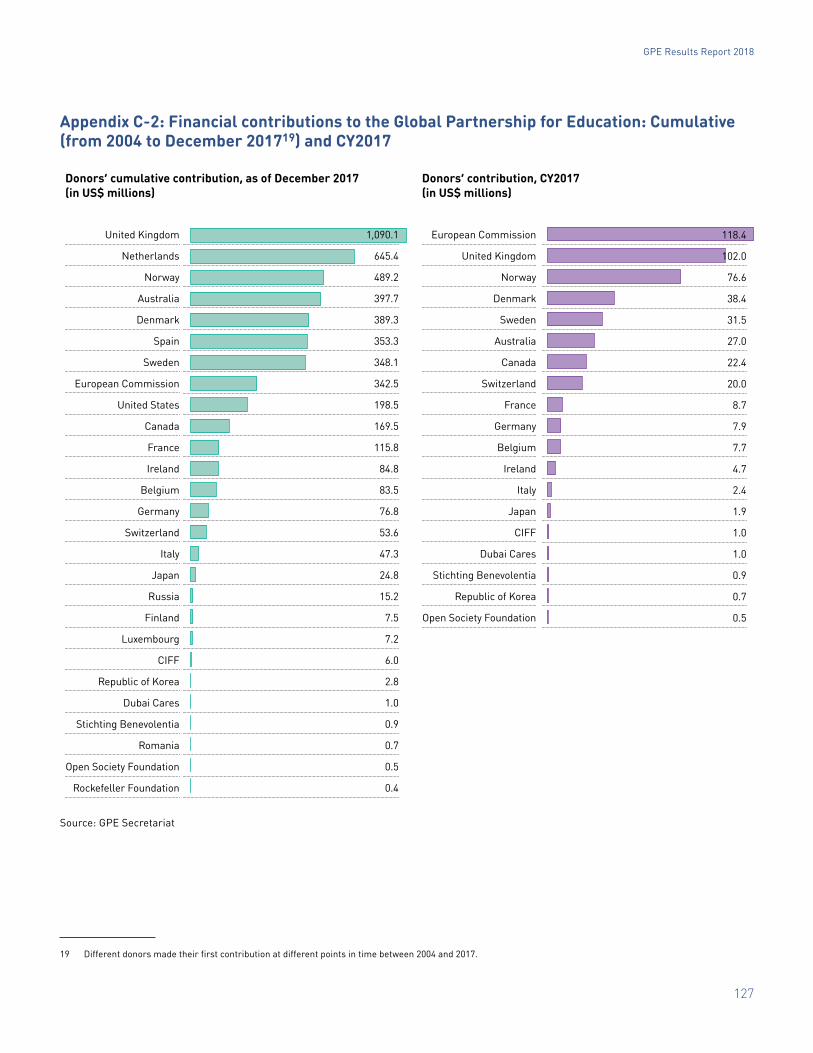
Appendix C-2: Financial contributions to the Global Partnership for Education: Cumulative (from 2004 to December 201719) and CY2017
Donors’ cumulative contribution, as of December 2017 (in US$ millions)
Donors’ contribution, CY2017 (in US$ millions)
United Kingdom
Netherlands
Norway
Australia
Denmark
Spain
Sweden
European Commission
United States
Canada
France
Ireland
Belgium
Germany
Switzerland
Italy
Japan
Russia
Finland
Luxembourg
CIFF
Republic of Korea
Dubai Cares
Stichting Benevolentia
Romania
Open Society Foundation
Rockefeller Foundation
European Commission
United Kingdom
Norway
Denmark
Sweden
Australia
Canada
Switzerland
France
Germany
Belgium
Ireland
Italy
Japan
CIFF
Dubai Cares
Stichting Benevolentia
Republic of Korea
Open Society Foundation
Source: GPE Secretariat
19 Different donors made their first contribution at different points in time between 2004 and 2017.
1,090.1
645.4
489.2
397.7
389.3
353.3
348.1
342.5
198.5
169.5
115.8
84.8
83.5
76.8
53.6
47.3
24.8
15.2
7.5
7.2
6.0
2.8
1.0
0.9
0.7
0.5
0.4
118.4
102.0
76.6
38.4
31.5
27.0
22.4
20.0
8.7
7.9
7.7
4.7
2.4
1.9
1.0
1.0
0.9
0.7
0.5
GPE Results Report 2018
128
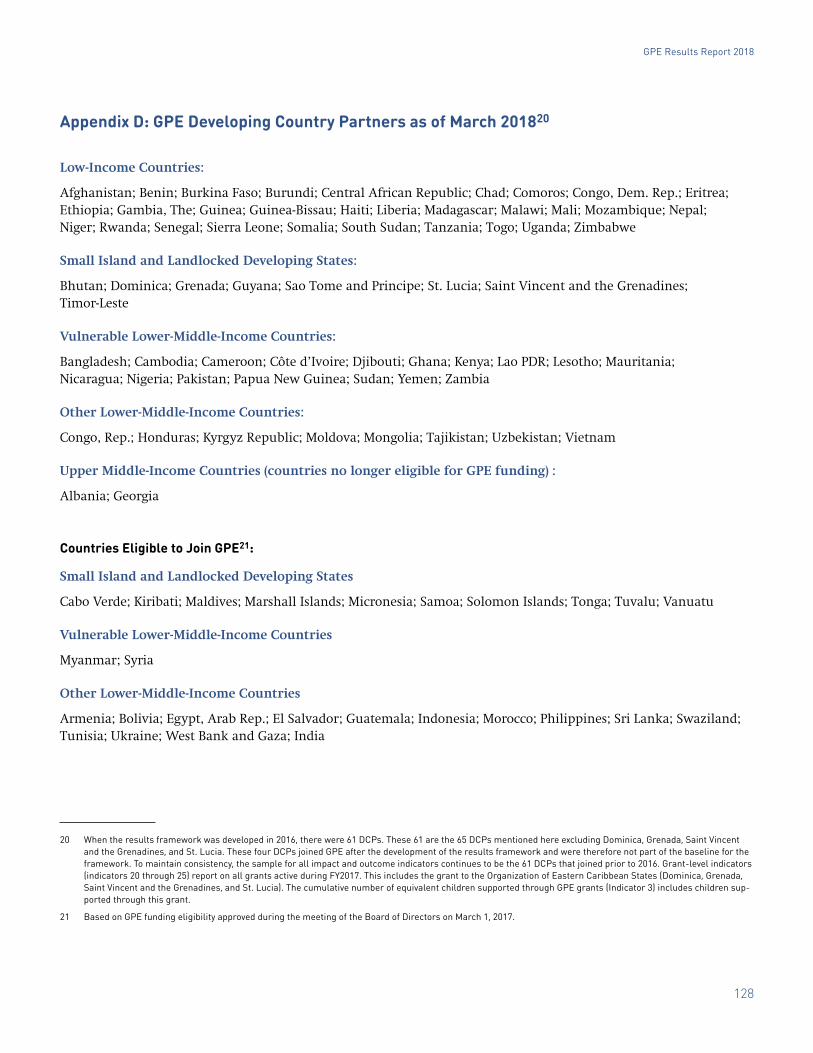
Appendix D: GPE Developing Country Partners as of March 201820
Low-Income Countries:
Afghanistan; Benin; Burkina Faso; Burundi; Central African Republic; Chad; Comoros; Congo, Dem. Rep.; Eritrea; Ethiopia; Gambia, The; Guinea; Guinea-Bissau; Haiti; Liberia; Madagascar; Malawi; Mali; Mozambique; Nepal; Niger; Rwanda; Senegal; Sierra Leone; Somalia; South Sudan; Tanzania; Togo; Uganda; Zimbabwe
Small Island and Landlocked Developing States:
Bhutan; Dominica; Grenada; Guyana; Sao Tome and Principe; St. Lucia; Saint Vincent and the Grenadines; Timor-Leste
Vulnerable Lower-Middle-Income Countries:
Bangladesh; Cambodia; Cameroon; Côte d’Ivoire; Djibouti; Ghana; Kenya; Lao PDR; Lesotho; Mauritania; Nicaragua; Nigeria; Pakistan; Papua New Guinea; Sudan; Yemen; Zambia
Other Lower-Middle-Income Countries:
Congo, Rep.; Honduras; Kyrgyz Republic; Moldova; Mongolia; Tajikistan; Uzbekistan; Vietnam
Upper Middle-Income Countries (countries no longer eligible for GPE funding) :
Albania; Georgia
Countries Eligible to Join GPE21:
Small Island and Landlocked Developing States
Cabo Verde; Kiribati; Maldives; Marshall Islands; Micronesia; Samoa; Solomon Islands; Tonga; Tuvalu; Vanuatu
Vulnerable Lower-Middle-Income Countries
Myanmar; Syria
Other Lower-Middle-Income Countries
Armenia; Bolivia; Egypt, Arab Rep.; El Salvador; Guatemala; Indonesia; Morocco; Philippines; Sri Lanka; Swaziland; Tunisia; Ukraine; West Bank and Gaza; India
20 When the results framework was developed in 2016, there were 61 DCPs. These 61 are the 65 DCPs mentioned here excluding Dominica, Grenada, Saint Vincent and the Grenadines, and St. Lucia. These four DCPs joined GPE after the development of the results framework and were therefore not part of the baseline for the framework. To maintain consistency, the sample for all impact and outcome indicators continues to be the 61 DCPs that joined prior to 2016. Grant-level indicators (indicators 20 through 25) report on all grants active during FY2017. This includes the grant to the Organization of Eastern Caribbean States (Dominica, Grenada, Saint Vincent and the Grenadines, and St. Lucia). The cumulative number of equivalent children supported through GPE grants (Indicator 3) includes children sup-ported through this grant.
21 Based on GPE funding eligibility approved during the meeting of the Board of Directors on March 1, 2017.
GPE Results Report 2018
129
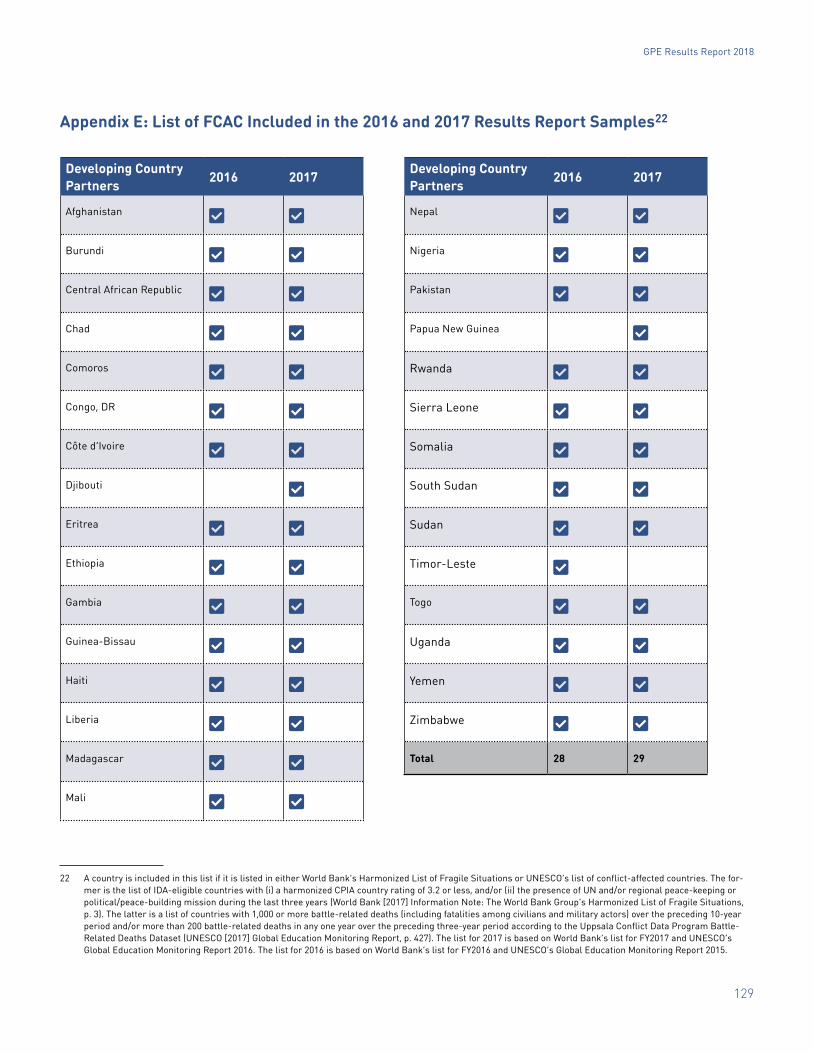
Appendix E: List of FCAC Included in the 2016 and 2017 Results Report Samples22
Developing Country Partners 2016 2017
Afghanistan � �
Burundi � �
Central African Republic � �
Chad � �
Comoros � �
Congo, DR � �
Côte d’Ivoire � �
Djibouti �
Eritrea � �
Ethiopia � �
Gambia � �
Guinea-Bissau � �
Haiti � �
Liberia � �
Madagascar � �
Mali � �
Developing Country Partners 2016 2017
Nepal � �
Nigeria � �
Pakistan � �
Papua New Guinea �
Rwanda � �
Sierra Leone � �
Somalia � �
South Sudan � �
Sudan � �
Timor-Leste �
Togo � �
Uganda � �
Yemen � �
Zimbabwe � �
Total 28 29
22 A country is included in this list if it is listed in either World Bank’s Harmonized List of Fragile Situations or UNESCO’s list of conflict-affected countries. The for-mer is the list of IDA-eligible countries with (i) a harmonized CPIA country rating of 3.2 or less, and/or (ii) the presence of UN and/or regional peace-keeping or political/peace-building mission during the last three years (World Bank [2017] Information Note: The World Bank Group’s Harmonized List of Fragile Situations, p. 3). The latter is a list of countries with 1,000 or more battle-related deaths (including fatalities among civilians and military actors) over the preceding 10-year period and/or more than 200 battle-related deaths in any one year over the preceding three-year period according to the Uppsala Conflict Data Program Battle-Related Deaths Dataset (UNESCO [2017] Global Education Monitoring Report, p. 427). The list for 2017 is based on World Bank’s list for FY2017 and UNESCO’s Global Education Monitoring Report 2016. The list for 2016 is based on World Bank’s list for FY2016 and UNESCO’s Global Education Monitoring Report 2015.
GPE Results Report 2018
130
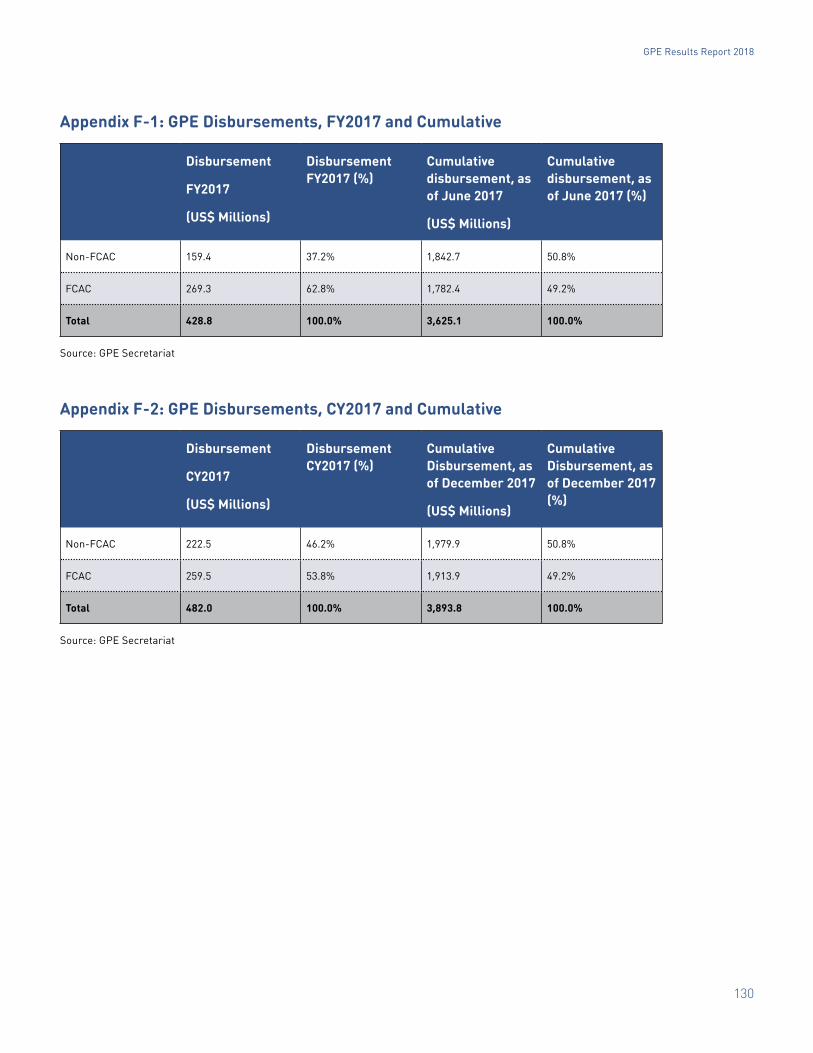
Appendix F-1: GPE Disbursements, FY2017 and Cumulative
Disbursement
FY2017
(US$ Millions)
Disbursement FY2017 (%)
Cumulative disbursement, as of June 2017
(US$ Millions)
Cumulative disbursement, as of June 2017 (%)
Non-FCAC 159.4 37.2% 1,842.7 50.8%
FCAC 269.3 62.8% 1,782.4 49.2%
Total 428.8 100.0% 3,625.1 100.0%
Source: GPE Secretariat
Appendix F-2: GPE Disbursements, CY2017 and Cumulative
Disbursement
CY2017
(US$ Millions)
Disbursement CY2017 (%)
Cumulative Disbursement, as of December 2017
(US$ Millions)
Cumulative Disbursement, as of December 2017 (%)
Non-FCAC 222.5 46.2% 1,979.9 50.8%
FCAC 259.5 53.8% 1,913.9 49.2%
Total 482.0 100.0% 3,893.8 100.0%
Source: GPE Secretariat
GPE Results Report 2018
131
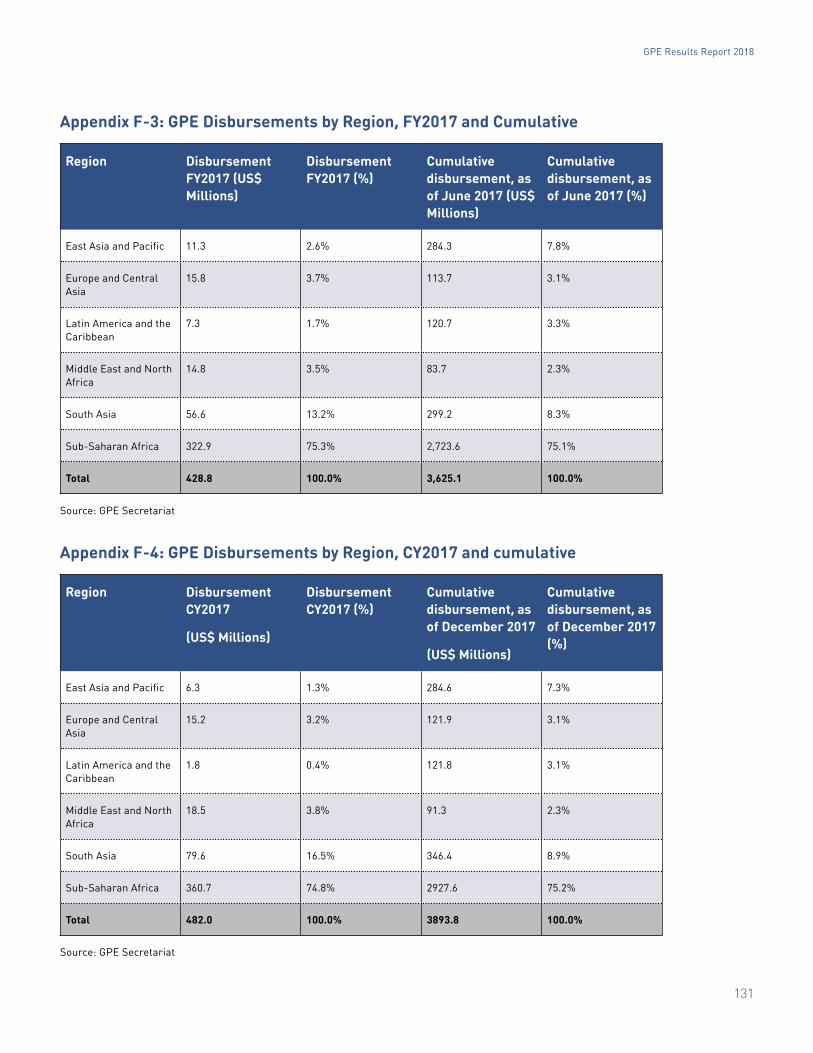
Appendix F-3: GPE Disbursements by Region, FY2017 and Cumulative
Region Disbursement FY2017 (US$ Millions)
Disbursement FY2017 (%)
Cumulative disbursement, as of June 2017 (US$ Millions)
Cumulative disbursement, as of June 2017 (%)
East Asia and Pacific 11.3 2.6% 284.3 7.8%
Europe and Central Asia
15.8 3.7% 113.7 3.1%
Latin America and the Caribbean
7.3 1.7% 120.7 3.3%
Middle East and North Africa
14.8 3.5% 83.7 2.3%
South Asia 56.6 13.2% 299.2 8.3%
Sub-Saharan Africa 322.9 75.3% 2,723.6 75.1%
Total 428.8 100.0% 3,625.1 100.0%
Source: GPE Secretariat
Appendix F-4: GPE Disbursements by Region, CY2017 and cumulative
Region Disbursement CY2017
(US$ Millions)
Disbursement CY2017 (%)
Cumulative disbursement, as of December 2017
(US$ Millions)
Cumulative disbursement, as of December 2017 (%)
East Asia and Pacific 6.3 1.3% 284.6 7.3%
Europe and Central Asia
15.2 3.2% 121.9 3.1%
Latin America and the Caribbean
1.8 0.4% 121.8 3.1%
Middle East and North Africa
18.5 3.8% 91.3 2.3%
South Asia 79.6 16.5% 346.4 8.9%
Sub-Saharan Africa 360.7 74.8% 2927.6 75.2%
Total 482.0 100.0% 3893.8 100.0%
Source: GPE Secretariat
GPE Results Report 2018
132
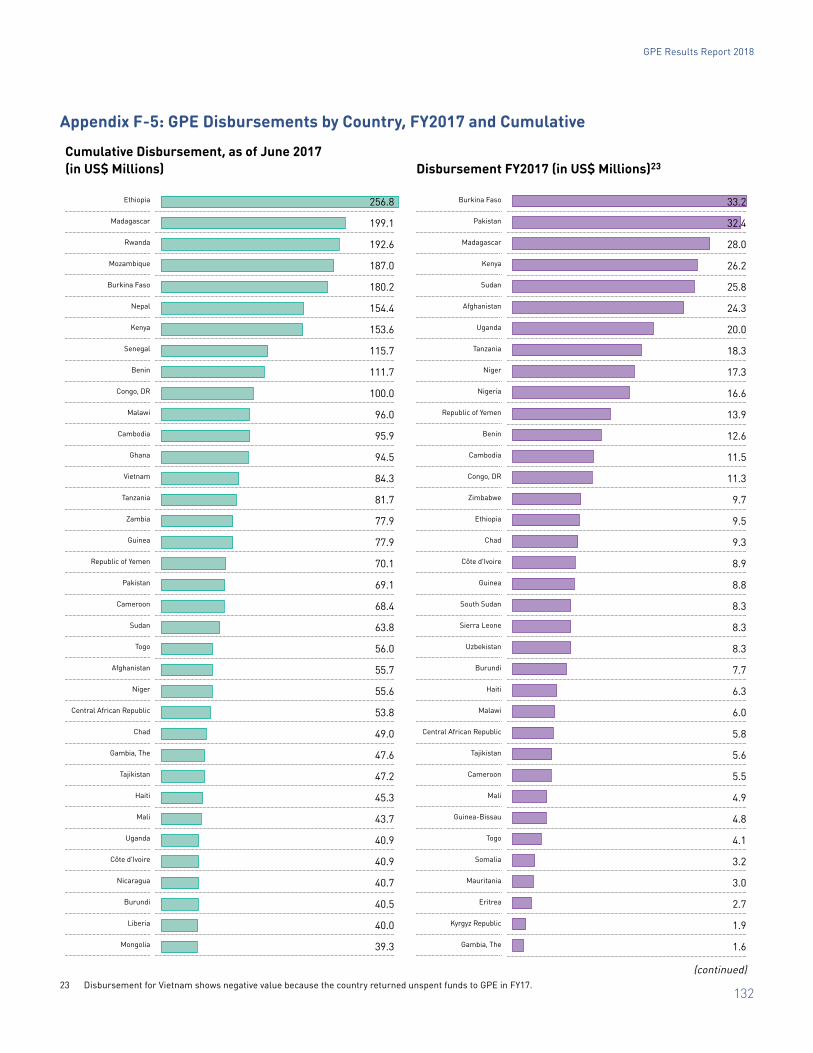
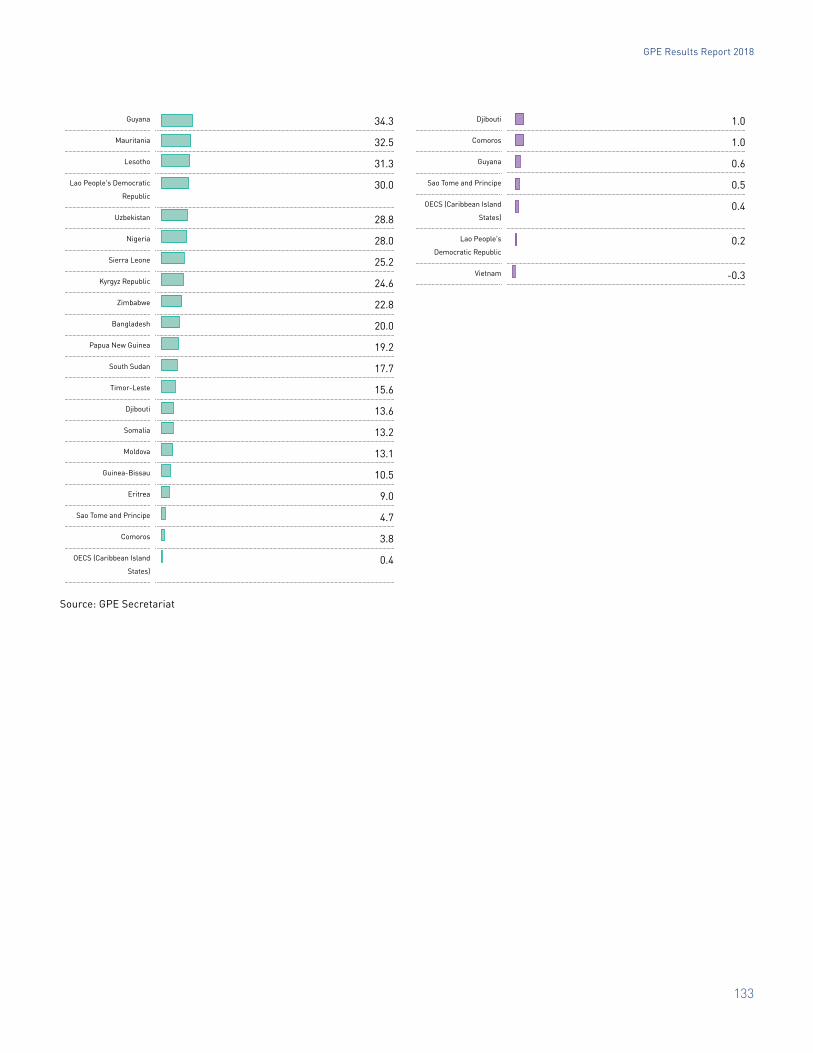
Appendix F-5: GPE Disbursements by Country, FY2017 and Cumulative
Cumulative Disbursement, as of June 2017 (in US$ Millions) Disbursement FY2017 (in US$ Millions)23
Ethiopia
Madagascar
Rwanda
Mozambique
Burkina Faso
Nepal
Kenya
Senegal
Benin
Congo, DR
Malawi
Cambodia
Ghana
Vietnam
Tanzania
Zambia
Guinea
Republic of Yemen
Pakistan
Cameroon
Sudan
Togo
Afghanistan
Niger
Central African Republic
Chad
Gambia, The
Tajikistan
Haiti
Mali
Uganda
Côte d’Ivoire
Nicaragua
Burundi
Liberia
Mongolia
Burkina Faso
Pakistan
Madagascar
Kenya
Sudan
Afghanistan
Uganda
Tanzania
Niger
Nigeria
Republic of Yemen
Benin
Cambodia
Congo, DR
Zimbabwe
Ethiopia
Chad
Côte d’Ivoire
Guinea
South Sudan
Sierra Leone
Uzbekistan
Burundi
Haiti
Malawi
Central African Republic
Tajikistan
Cameroon
Mali
Guinea-Bissau
Togo
Somalia
Mauritania
Eritrea
Kyrgyz Republic
Gambia, The
256.8
199.1
192.6
187.0
180.2
154.4
153.6
115.7
111.7
100.0
96.0
95.9
94.5
84.3
81.7
77.9
77.9
70.1
69.1
68.4
63.8
56.0
55.7
55.6
53.8
49.0
47.6
47.2
45.3
43.7
40.9
40.9
40.7
40.5
40.0
39.3
33.2
32.4
28.0
26.2
25.8
24.3
20.0
18.3
17.3
16.6
13.9
12.6
11.5
11.3
9.7
9.5
9.3
8.9
8.8
8.3
8.3
8.3
7.7
6.3
6.0
5.8
5.6
5.5
4.9
4.8
4.1
3.2
3.0
2.7
1.9
1.6
23 Disbursement for Vietnam shows negative value because the country returned unspent funds to GPE in FY17.
(continued)
GPE Results Report 2018
133
Guyana
Mauritania
Lesotho
Lao People’s Democratic
Republic
Uzbekistan
Nigeria
Sierra Leone
Kyrgyz Republic
Zimbabwe
Bangladesh
Papua New Guinea
South Sudan
Timor-Leste
Djibouti
Somalia
Moldova
Guinea-Bissau
Eritrea
Sao Tome and Principe
Comoros
OECS (Caribbean Island
States)
Djibouti
Comoros
Guyana
Sao Tome and Principe
OECS (Caribbean Island
States)
Lao People’s
Democratic Republic
Vietnam
Source: GPE Secretariat
34.3
32.5
31.3
30.0
28.8
28.0
25.2
24.6
22.8
20.0
19.2
17.7
15.6
13.6
13.2
13.1
10.5
9.0
4.7
3.8
0.4
1.0
1.0
0.6
0.5
0.4
0.2
-0.3
GPE Results Report 2018
134
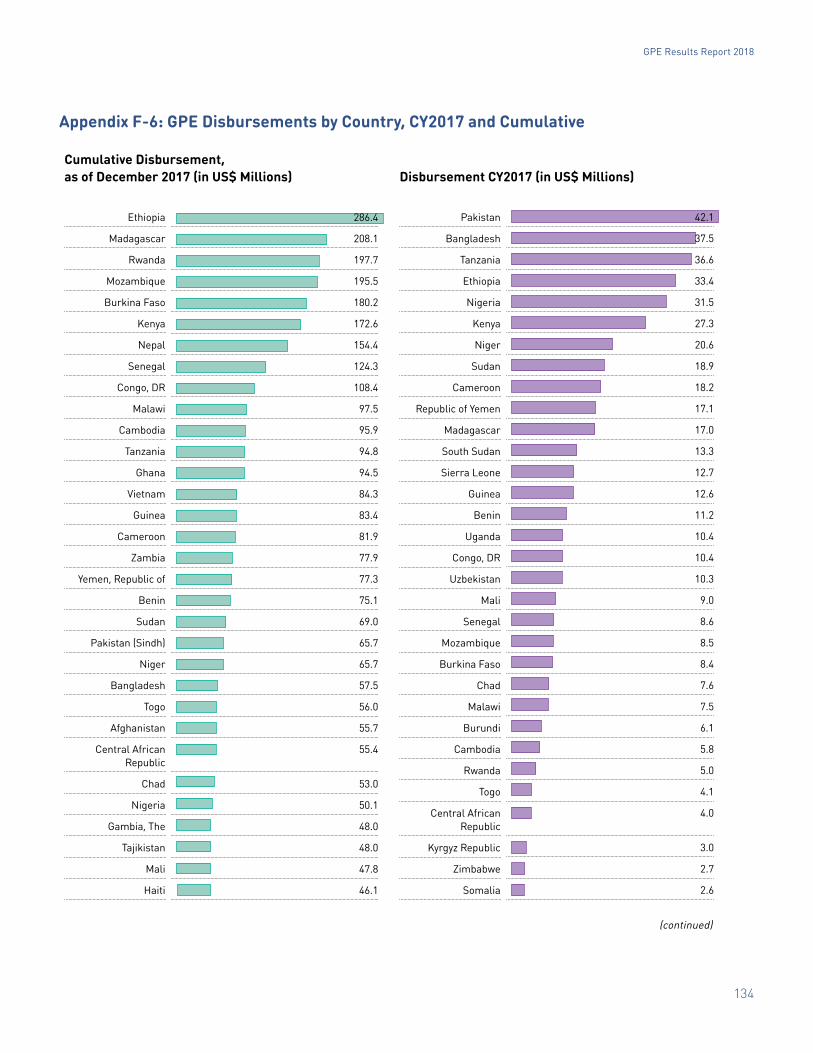
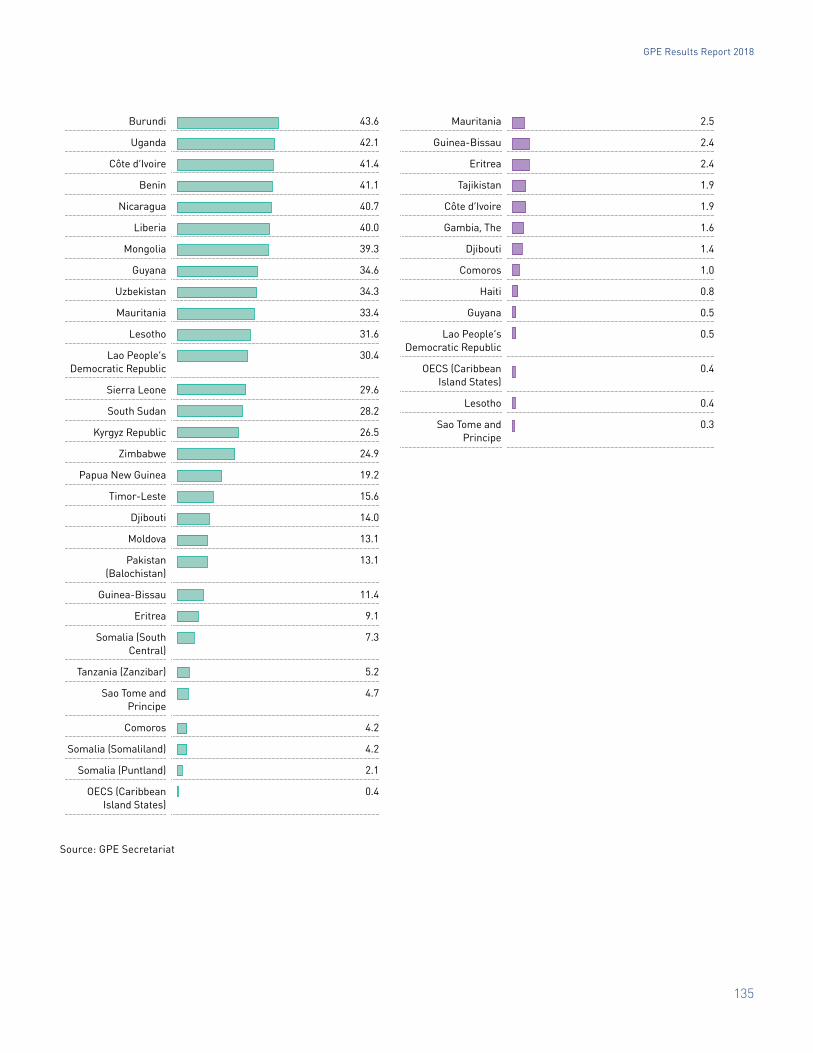
Appendix F-6: GPE Disbursements by Country, CY2017 and Cumulative
Cumulative Disbursement, as of December 2017 (in US$ Millions) Disbursement CY2017 (in US$ Millions)
Ethiopia
Madagascar
Rwanda
Mozambique
Burkina Faso
Kenya
Nepal
Senegal
Congo, DR
Malawi
Cambodia
Tanzania
Ghana
Vietnam
Guinea
Cameroon
Zambia
Yemen, Republic of
Benin
Sudan
Pakistan (Sindh)
Niger
Bangladesh
Togo
Afghanistan
Central African Republic
Chad
Nigeria
Gambia, The
Tajikistan
Mali
Haiti
Pakistan
Bangladesh
Tanzania
Ethiopia
Nigeria
Kenya
Niger
Sudan
Cameroon
Republic of Yemen
Madagascar
South Sudan
Sierra Leone
Guinea
Benin
Uganda
Congo, DR
Uzbekistan
Mali
Senegal
Mozambique
Burkina Faso
Chad
Malawi
Burundi
Cambodia
Rwanda
Togo
Central African Republic
Kyrgyz Republic
Zimbabwe
Somalia
286.4
208.1
197.7
195.5
180.2
172.6
154.4
124.3
108.4
97.5
95.9
94.8
94.5
84.3
83.4
81.9
77.9
77.3
75.1
69.0
65.7
65.7
57.5
56.0
55.7
55.4
53.0
50.1
48.0
48.0
47.8
46.1
42.1
37.5
36.6
33.4
31.5
27.3
20.6
18.9
18.2
17.1
17.0
13.3
12.7
12.6
11.2
10.4
10.4
10.3
9.0
8.6
8.5
8.4
7.6
7.5
6.1
5.8
5.0
4.1
4.0
3.0
2.7
2.6
(continued)
GPE Results Report 2018
135
Burundi
Uganda
Côte d’Ivoire
Benin
Nicaragua
Liberia
Mongolia
Guyana
Uzbekistan
Mauritania
Lesotho
Lao People’s Democratic Republic
Sierra Leone
South Sudan
Kyrgyz Republic
Zimbabwe
Papua New Guinea
Timor-Leste
Djibouti
Moldova
Pakistan (Balochistan)
Guinea-Bissau
Eritrea
Somalia (South Central)
Tanzania (Zanzibar)
Sao Tome and Principe
Comoros
Somalia (Somaliland)
Somalia (Puntland)
OECS (Caribbean Island States)
Mauritania
Guinea-Bissau
Eritrea
Tajikistan
Côte d’Ivoire
Gambia, The
Djibouti
Comoros
Haiti
Guyana
Lao People’s Democratic Republic
OECS (Caribbean Island States)
Lesotho
Sao Tome and Principe
Source: GPE Secretariat
43.6
42.1
41.4
41.1
40.7
40.0
39.3
34.6
34.3
33.4
31.6
30.4
29.6
28.2
26.5
24.9
19.2
15.6
14.0
13.1
13.1
11.4
9.1
7.3
5.2
4.7
4.2
4.2
2.1
0.4
2.5
2.4
2.4
1.9
1.9
1.6
1.4
1.0
0.8
0.5
0.5
0.4
0.4
0.3
GPE Results Report 2018
136
Appendix G: Technical Notes on Indicator Data
1. Baselines: The year 2015 is the overall baseline year for the results framework, which will report on the achievement of the goals and objectives of GPE’s strategic plan GPE 2020, covering the period 2016 to 2020. In some cases, due to data availability, the baseline was set at 2016. Ten indicators were revised baseline values in the 2015/16 Results Report because of improved availability of data.
2. Milestones and targets: For each indicator, 2020 end targets and milestones in intervening years were devel-oped to assess whether GPE is on track to reach them.
3. Periodicity: In accordance with the nature of the data underpinning each indicator, source data can be based on the calendar year or on the Secretariat’s fiscal year (July to June).
4. Data sources: Data sources vary; the results framework uses data from UNESCO Institute of Statistics (UIS), UNICEF and other partners, in addition to data generated by the Secretariat.
5. Units of analysis: Indicators have different units of analysis — e.g., children, developing country partners, grants, donors, technical reports, etc.
6. Sample: If the unit of analysis is a developing country partner, the sample consists of those countries that were developing country partners at baseline, in 2015 (i.e.,61 countries). If the unit of analysis is grant (indica-tors 20, 21, 22, 23, 24, 25, 29 and 30), all active grants in the reference fiscal year are included in the sample.
7. Reporting cycle: While some indicators are reported on every year, others are reported on only once every other year.
8. Tolerance: In the case of UIS-based, impact-level indicators that are reported in percentages, a 1 percentage point “tolerance” is applied to assessing achievement of milestones and targets (see point 10 below). Therefore, if GPE achievement is within 1 percentage point of its milestone or target, this will be considered to have been met within tolerance.
9. Disaggregation: Depending on the nature of the indicator, different types of disaggregation are applied. Typically, where the unit of analysis is a developing country partner, data are disaggregated by FCAC. Where the unit of analysis is children, data are disaggregated by gender.
10. FCAC: Though GPE revises the list of FCAC every year, the list from 2016 is used for the disaggregation of indi-cators, as the baseline and milestones and target set for 2020 are based on the FCAC list from 2016. However, the list of FCAC from 2017 is used for the disaggregation of grant-level indicators (indicator 20, 21, 22, 23, 24, 25, 29 and 30), to be consistent with other GPE publications (e.g., portfolio review).
GPE Results Report 2018
137
11. Core indicators: Within the GPE results framework, a subset of 12 “core indicators” highlights the key results the partnership aims to achieve. These core indicators are shown in blue font in the results framework data tables presented in Appendix F.
12. Achievement: Overall results for each indicator are represented as green (fully met); yellow (met with toler-ance); or red (not met) in Appendix A. Indicator milestones are ref lected as met if the overall milestone is met, even though the milestone for disaggregated group(s) (i.e., FCAC and/or gender) is not met, or if the indicator milestone is met for one educational level (e.g., primary) but not met for the other educational level (e.g., lower secondary). In the latter cases, [not met] is indicated against the level of education for which the mile-stone was missed and the term ‘partially met’ is used in text to indicate such cases.
13. Updated data: Some indicator values for 2016 (as reported in the 2015/16 Results Report) have been revised as more updated data have become available. These updated data have been used in the figures and main texts in this report.
14. Methodological notes: Methodological notes for each indicator are available on GPE website. http://www.globalpartnership.org/content/results-framework-methodology
GPE Results Report 2018
138
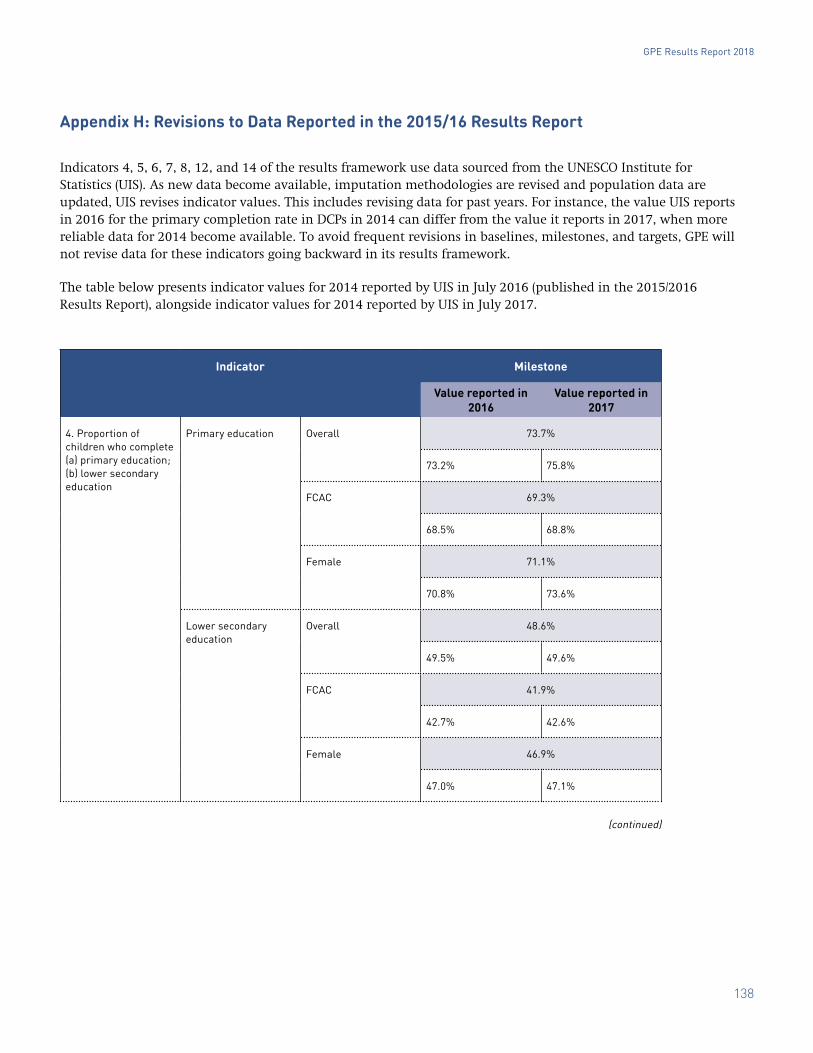
Appendix H: Revisions to Data Reported in the 2015/16 Results Report
Indicators 4, 5, 6, 7, 8, 12, and 14 of the results framework use data sourced from the UNESCO Institute for Statistics (UIS). As new data become available, imputation methodologies are revised and population data are updated, UIS revises indicator values. This includes revising data for past years. For instance, the value UIS reports in 2016 for the primary completion rate in DCPs in 2014 can differ from the value it reports in 2017, when more reliable data for 2014 become available. To avoid frequent revisions in baselines, milestones, and targets, GPE will not revise data for these indicators going backward in its results framework.
The table below presents indicator values for 2014 reported by UIS in July 2016 (published in the 2015/2016 Results Report), alongside indicator values for 2014 reported by UIS in July 2017.
Indicator Milestone
Value reported in 2016
Value reported in 2017
4. Proportion of children who complete (a) primary education; (b) lower secondary education
Primary education Overall 73.7%
73.2% 75.8%
FCAC 69.3%
68.5% 68.8%
Female 71.1%
70.8% 73.6%
Lower secondary education
Overall 48.6%
49.5% 49.6%
FCAC 41.9%
42.7% 42.6%
Female 46.9%
47.0% 47.1%
(continued)

GPE Results Report 2018
139
Indicator Milestone
Value reported in 2016
Value reported in 2017
5. Proportion of GPE DCPs within set thresholds for gender parity index of completion rates for (a) primary education; (b) lower secondary education
Primary education Overall 64%
64% 62%
FCAC 54%
57% 54%
Lower secondary education
Overall 52%
54% 49%
FCAC 32%
34% 39%
6. Pre-primary gross enrollment ratio Overall 29.0%
28.1% 36.1%
FCAC 23.3%
22.1% 34.2%
Female 28.3%
27.5% 35.6%
7. Out-of-school rate for (a) children of primary school age; (b) children of lower secondary school age
Primary education Overall 19.6%
19.8% 19.5%
FCAC 25.0%
25.0% 26.0%
Female 21.9%
22.3% 22.1%
(continued)
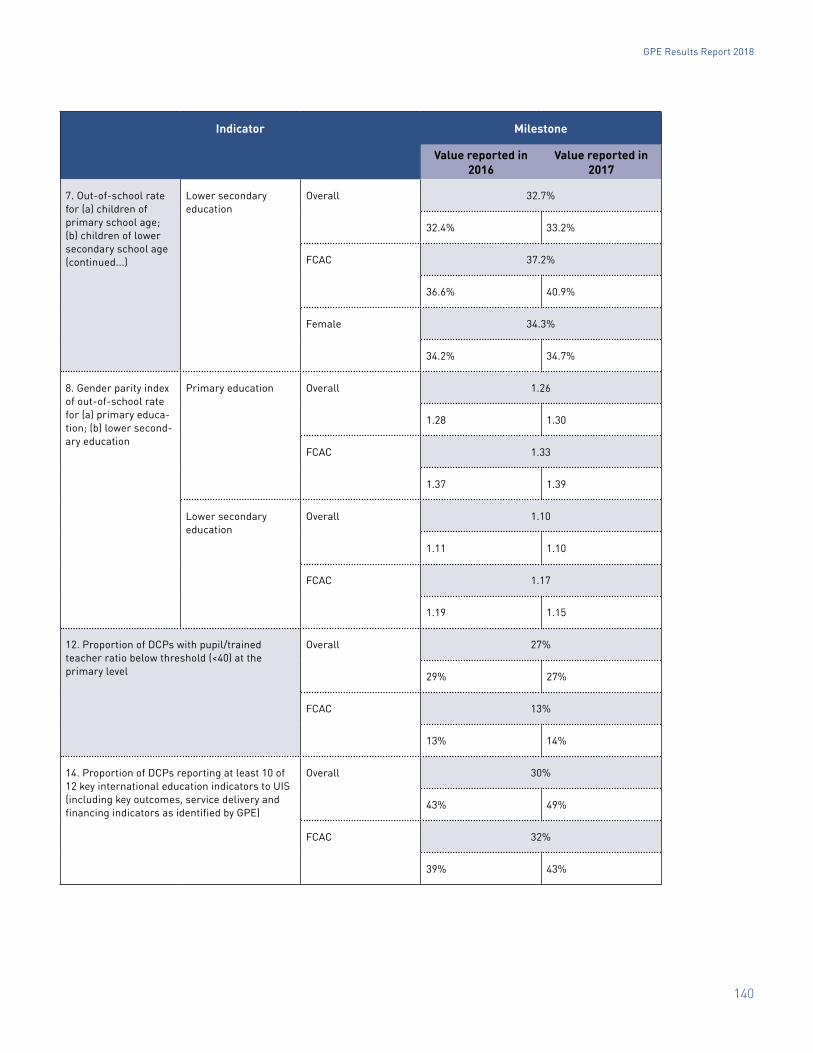
GPE Results Report 2018
140
Indicator Milestone
Value reported in 2016
Value reported in 2017
7. Out-of-school rate for (a) children of primary school age; (b) children of lower secondary school age (continued...)
Lower secondary education
Overall 32.7%
32.4% 33.2%
FCAC 37.2%
36.6% 40.9%
Female 34.3%
34.2% 34.7%
8. Gender parity index of out-of-school rate for (a) primary educa-tion; (b) lower second-ary education
Primary education Overall 1.26
1.28 1.30
FCAC 1.33
1.37 1.39
Lower secondary education
Overall 1.10
1.11 1.10
FCAC 1.17
1.19 1.15
12. Proportion of DCPs with pupil/trained teacher ratio below threshold (<40) at the primary level
Overall 27%
29% 27%
FCAC 13%
13% 14%
14. Proportion of DCPs reporting at least 10 of 12 key international education indicators to UIS (including key outcomes, service delivery and financing indicators as identified by GPE)
Overall 30%
43% 49%
FCAC 32%
39% 43%
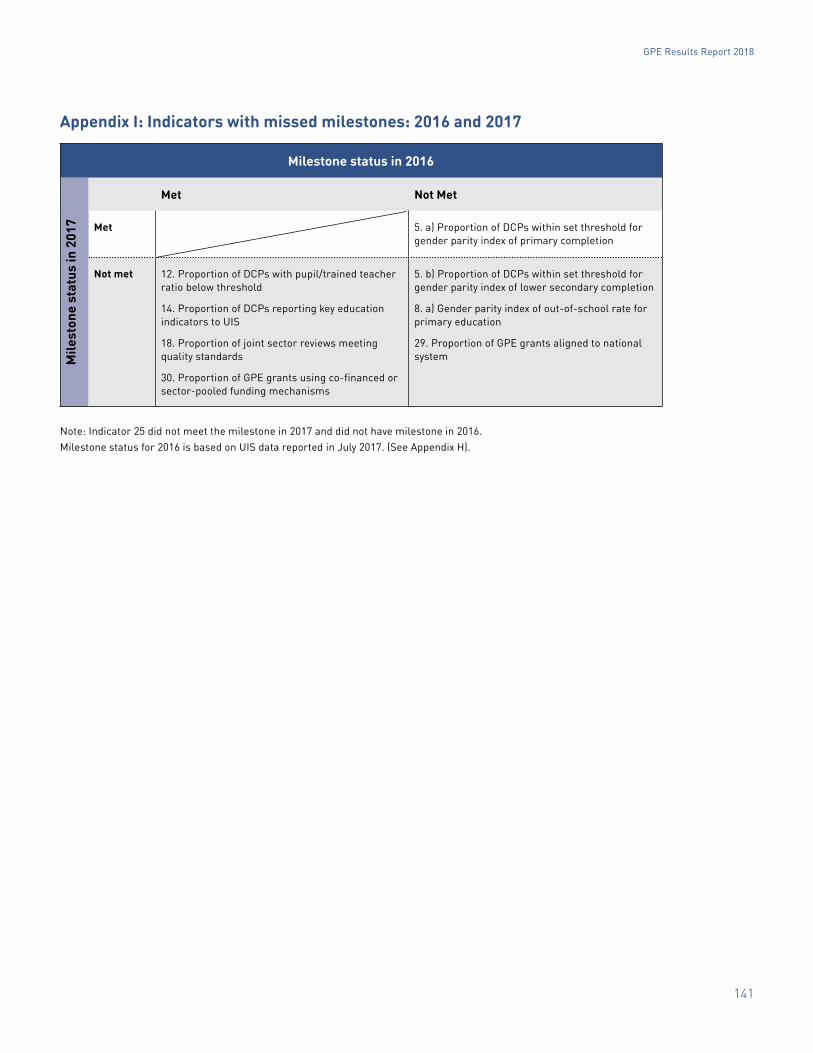
GPE Results Report 2018
141
Appendix I: Indicators with missed milestones: 2016 and 2017
Milestone status in 2016
Mile
ston
e st
atus
in 2
017
Met Not Met
Met 5. a) Proportion of DCPs within set threshold for gender parity index of primary completion
Not met 12. Proportion of DCPs with pupil/trained teacher ratio below threshold
14. Proportion of DCPs reporting key education indicators to UIS
18. Proportion of joint sector reviews meeting quality standards
30. Proportion of GPE grants using co-financed or sector-pooled funding mechanisms
5. b) Proportion of DCPs within set threshold for gender parity index of lower secondary completion
8. a) Gender parity index of out-of-school rate for primary education
29. Proportion of GPE grants aligned to national system
Note: Indicator 25 did not meet the milestone in 2017 and did not have milestone in 2016.Milestone status for 2016 is based on UIS data reported in July 2017. (See Appendix H).