Embed Size (px)
Citation preview

APPENDICES
TITLE V MONITORING TECHNICAL REFERENCE DOCUMENT
Examples04/01 1
Title V monitoring EXAMPLES
The following appendices contain examples of title V monitoring for several different types of
emission sources. The majority of the examples focus on uncontrolled sources; for more information on
monitoring approaches for sources with active control devices (e.g., scrubbers, baghouses, thermal or
catalytic oxidizers, or electrostatic precipitators), please refer to the Compliance Assurance Monitoring
(CAM) technical guidance document. The CAM document is located on our web site at
www.epa.gov/ttn/emc/cam.html.
The examples were developed based on actual operating permits. In some cases, modifications
were made to the monitoring contained in the permits; such changes are noted in each example. The
examples are intended to provide illustrations of monitoring that meet title V monitoring criteria, but they
do not represent all of the types of sources that will be required to implement title V monitoring or all
applicable requirement formats. These examples present only one possible monitoring approach for
each situation and are not intended to be prescriptive. Depending on source-specific factors (e.g., size,
unit type, fuel, margin of compliance, and variability of emissions) other monitoring approaches may be
appropriate for these and similar emissions units. Chapters 4, 5, and 6 provide information to assist you
with developing case-specific monitoring approaches.
The examples provide the following information:
1. Source type;
2. Applicable requirements;
3. Monitoring approach; and
4. Basis for selecting the monitoring approach.
The following Table of Contents provides a list of the examples included in Appendices A through E.
We will periodically update these appendices with new examples as they are developed, and post the
updates on the Emissions Measurement Center (EMC) web site (www.epa.gov/ttn/emc). Appendix F
contains definitions of acronyms and abbreviations used throughout the document. Appendix G
contains information on various Regional, State, and local agency permitting web sites.
This document provides guidance to EPA Regional and State permitting authorities, as well as
to industry and the general public, on how EPA intends to exercise its discretion in implementing the
statutory and regulatory provisions regarding monitoring emissions from Title V sources.
The statutory provisions and EPA regulations described in this document contain legally binding
requirements. This document does not substitute for those provisions or regulations, nor is it a
TITLE V MONITORING TECHNICAL REFERENCE DOCUMENT
Examples2 04/01
regulation itself. Thus, it does not impose legally binding requirements on EPA, States, or the regulated
community, and may not apply to a particular situation based upon the circumstances. We and State
decision makers retain the discretion to adopt approaches on a case-by-case basis that differ from this
guidance where appropriate. Any decisions regarding a particular facility will be made based on the
statute and regulations. Therefore, interested parties are free to raise questions and objections about
the substance of this guidance and the appropriateness of the application of this guidance to a particular
situation. We will, and States should, consider whether or not the recommendations or interpretations
in the guidance are appropriate in that situation. This guidance is a living document and may be revised
periodically without public notice. EPA welcomes public comments on this document at any time and
will consider those comments in any future revision of this guidance document.
TITLE V MONITORING TECHNICAL REFERENCE DOCUMENT
Examples04/01 3
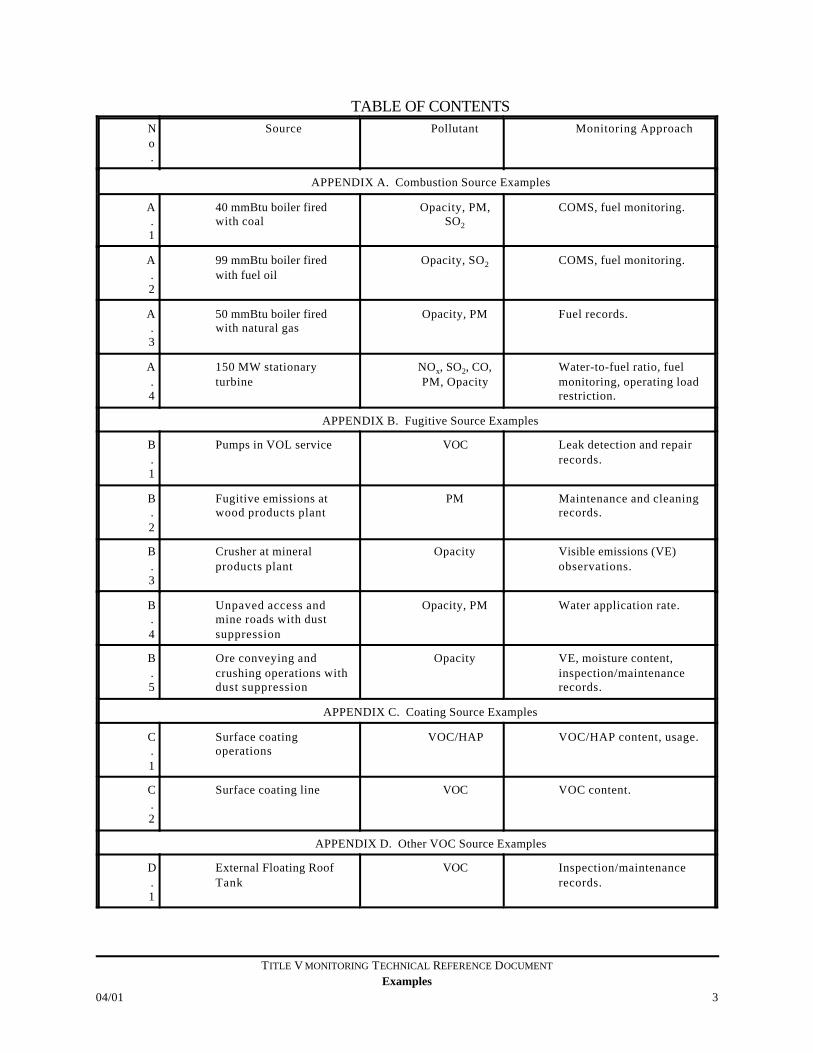
TABLE OF CONTENTSNo.
Source Pollutant Monitoring Approach
APPENDIX A. Combustion Source Examples
A.1
40 mmBtu boiler firedwith coal
Opacity, PM,SO2
COMS, fuel monitoring.
A.2
99 mmBtu boiler firedwith fuel oil
Opacity, SO2 COMS, fuel monitoring.
A.3
50 mmBtu boiler firedwith natural gas
Opacity, PM Fuel records.
A.4
150 MW stationaryturbine
NOx, SO2, CO,PM, Opacity
Water-to-fuel ratio, fuelmonitoring, operating loadrestriction.
APPENDIX B. Fugitive Source Examples
B.1
Pumps in VOL service VOC Leak detection and repairrecords.
B.2
Fugitive emissions atwood products plant
PM Maintenance and cleaningrecords.
B.3
Crusher at mineralproducts plant
Opacity Visible emissions (VE)observations.
B.4
Unpaved access andmine roads with dustsuppression
Opacity, PM Water application rate.
B.5
Ore conveying andcrushing operations withdust suppression
Opacity VE, moisture content,inspection/maintenancerecords.
APPENDIX C. Coating Source Examples
C.1
Surface coatingoperations
VOC/HAP VOC/HAP content, usage.
C.2
Surface coating line VOC VOC content.
APPENDIX D. Other VOC Source Examples
D.1
External Floating RoofTank
VOC Inspection/maintenancerecords.
TITLE V MONITORING TECHNICAL REFERENCE DOCUMENT
Examples4 04/01
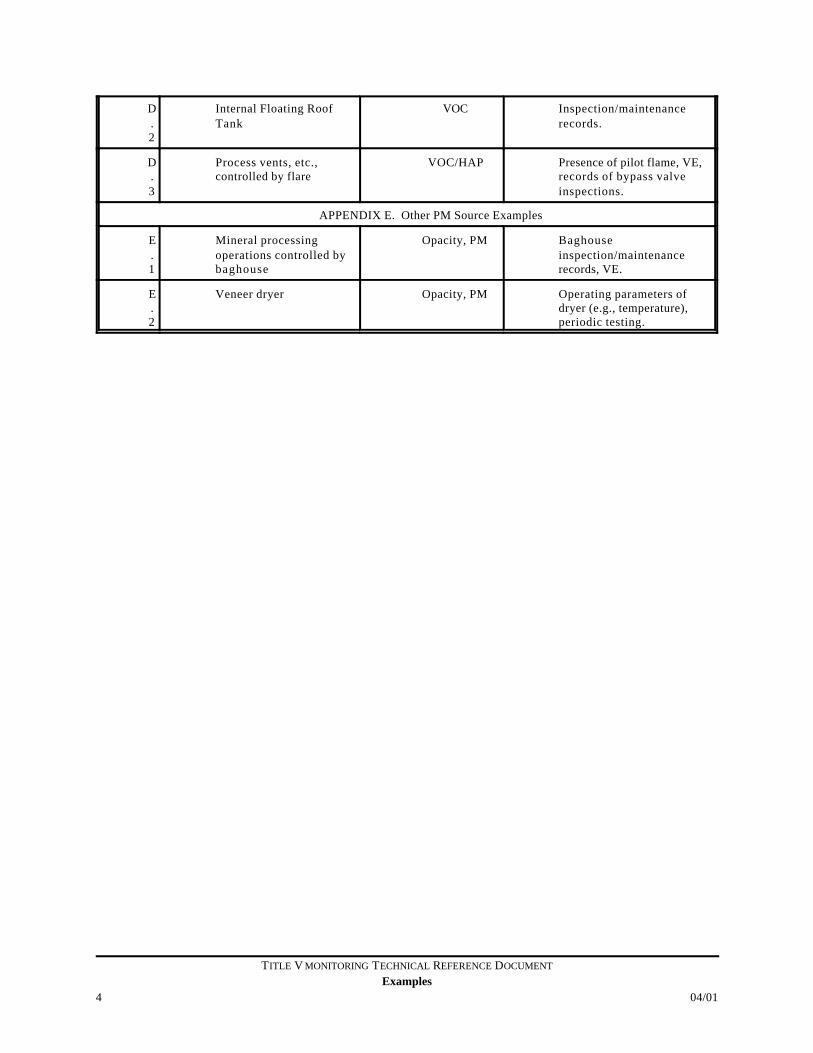
D.2
Internal Floating RoofTank
VOC Inspection/maintenancerecords.
D.3
Process vents, etc.,controlled by flare
VOC/HAP Presence of pilot flame, VE,records of bypass valveinspections.
APPENDIX E. Other PM Source Examples
E.1
Mineral processingoperations controlled bybaghouse
Opacity, PM Baghouseinspection/maintenancerecords, VE.
E.2
Veneer dryer Opacity, PM Operating parameters ofdryer (e.g., temperature),periodic testing.
APPENDIX A. COMBUSTION SOURCE EXAMPLES
TITLE V MONITORING TECHNICAL REFERENCE DOCUMENT
Appendix A. Combustion Source Examples04/01 A.1-1
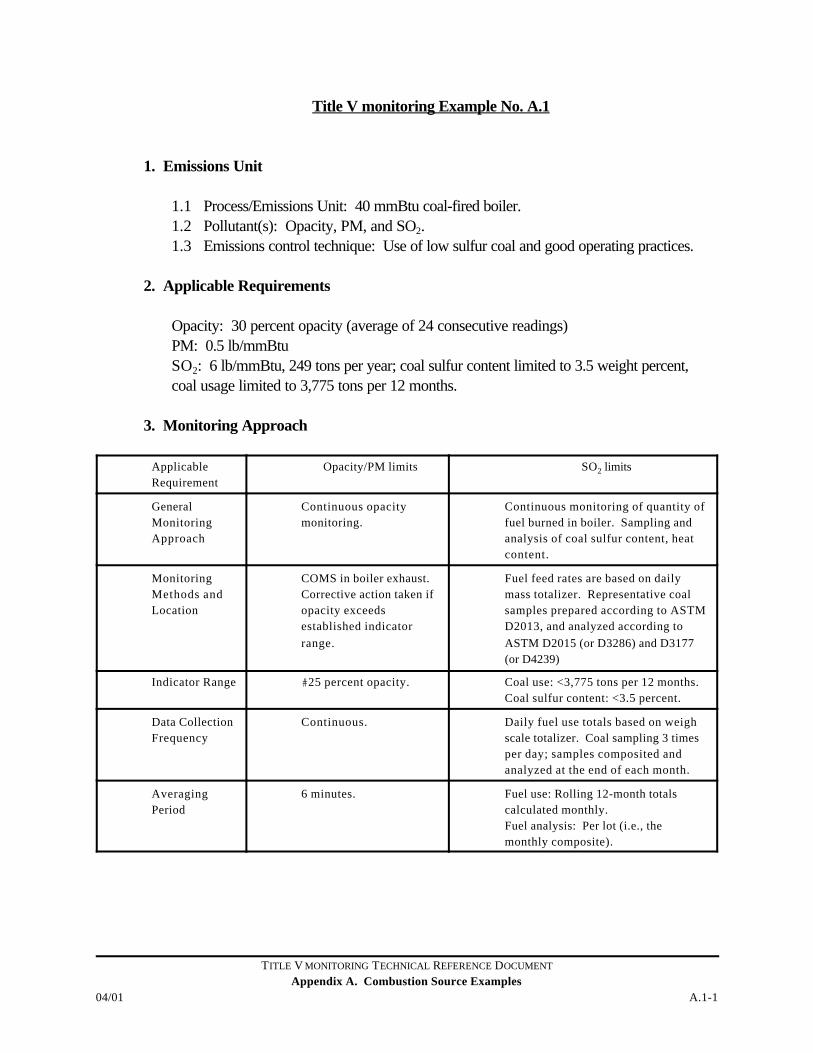
Title V monitoring Example No. A.1
1. Emissions Unit
1.1 Process/Emissions Unit: 40 mmBtu coal-fired boiler.1.2 Pollutant(s): Opacity, PM, and SO2.1.3 Emissions control technique: Use of low sulfur coal and good operating practices.
2. Applicable Requirements
Opacity: 30 percent opacity (average of 24 consecutive readings)PM: 0.5 lb/mmBtuSO2: 6 lb/mmBtu, 249 tons per year; coal sulfur content limited to 3.5 weight percent,coal usage limited to 3,775 tons per 12 months.
3. Monitoring Approach
ApplicableRequirement
Opacity/PM limits SO2 limits
GeneralMonitoringApproach
Continuous opacitymonitoring.
Continuous monitoring of quantity offuel burned in boiler. Sampling andanalysis of coal sulfur content, heatcontent.
MonitoringMethods andLocation
COMS in boiler exhaust. Corrective action taken ifopacity exceedsestablished indicatorrange.
Fuel feed rates are based on dailymass totalizer. Representative coalsamples prepared according to ASTMD2013, and analyzed according toASTM D2015 (or D3286) and D3177(or D4239)
Indicator Range #25 percent opacity. Coal use: <3,775 tons per 12 months.Coal sulfur content: <3.5 percent.
Data CollectionFrequency
Continuous. Daily fuel use totals based on weighscale totalizer. Coal sampling 3 timesper day; samples composited andanalyzed at the end of each month.
AveragingPeriod
6 minutes. Fuel use: Rolling 12-month totalscalculated monthly. Fuel analysis: Per lot (i.e., themonthly composite).
TITLE V MONITORING TECHNICAL REFERENCE DOCUMENT
Appendix A. Combustion Source ExamplesA.1-2 04/01
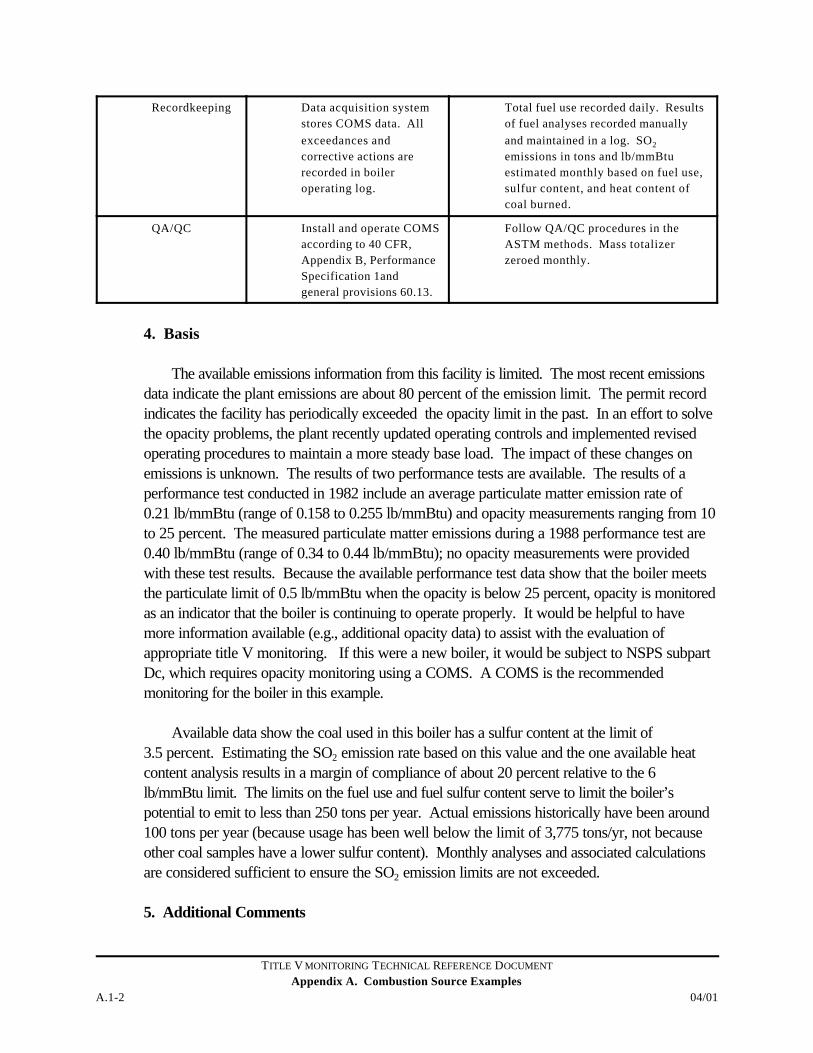
Recordkeeping Data acquisition systemstores COMS data. Allexceedances andcorrective actions arerecorded in boileroperating log.
Total fuel use recorded daily. Resultsof fuel analyses recorded manuallyand maintained in a log. SO2
emissions in tons and lb/mmBtuestimated monthly based on fuel use,sulfur content, and heat content ofcoal burned.
QA/QC Install and operate COMSaccording to 40 CFR,Appendix B, PerformanceSpecification 1andgeneral provisions 60.13.
Follow QA/QC procedures in theASTM methods. Mass totalizerzeroed monthly.
4. Basis
The available emissions information from this facility is limited. The most recent emissionsdata indicate the plant emissions are about 80 percent of the emission limit. The permit recordindicates the facility has periodically exceeded the opacity limit in the past. In an effort to solvethe opacity problems, the plant recently updated operating controls and implemented revisedoperating procedures to maintain a more steady base load. The impact of these changes onemissions is unknown. The results of two performance tests are available. The results of aperformance test conducted in 1982 include an average particulate matter emission rate of0.21 lb/mmBtu (range of 0.158 to 0.255 lb/mmBtu) and opacity measurements ranging from 10to 25 percent. The measured particulate matter emissions during a 1988 performance test are0.40 lb/mmBtu (range of 0.34 to 0.44 lb/mmBtu); no opacity measurements were providedwith these test results. Because the available performance test data show that the boiler meetsthe particulate limit of 0.5 lb/mmBtu when the opacity is below 25 percent, opacity is monitoredas an indicator that the boiler is continuing to operate properly. It would be helpful to havemore information available (e.g., additional opacity data) to assist with the evaluation ofappropriate title V monitoring. If this were a new boiler, it would be subject to NSPS subpartDc, which requires opacity monitoring using a COMS. A COMS is the recommendedmonitoring for the boiler in this example.
Available data show the coal used in this boiler has a sulfur content at the limit of3.5 percent. Estimating the SO2 emission rate based on this value and the one available heatcontent analysis results in a margin of compliance of about 20 percent relative to the 6lb/mmBtu limit. The limits on the fuel use and fuel sulfur content serve to limit the boiler’spotential to emit to less than 250 tons per year. Actual emissions historically have been around100 tons per year (because usage has been well below the limit of 3,775 tons/yr, not becauseother coal samples have a lower sulfur content). Monthly analyses and associated calculationsare considered sufficient to ensure the SO2 emission limits are not exceeded.
5. Additional Comments
TITLE V MONITORING TECHNICAL REFERENCE DOCUMENT
Appendix A. Combustion Source Examples04/01 A.1-3
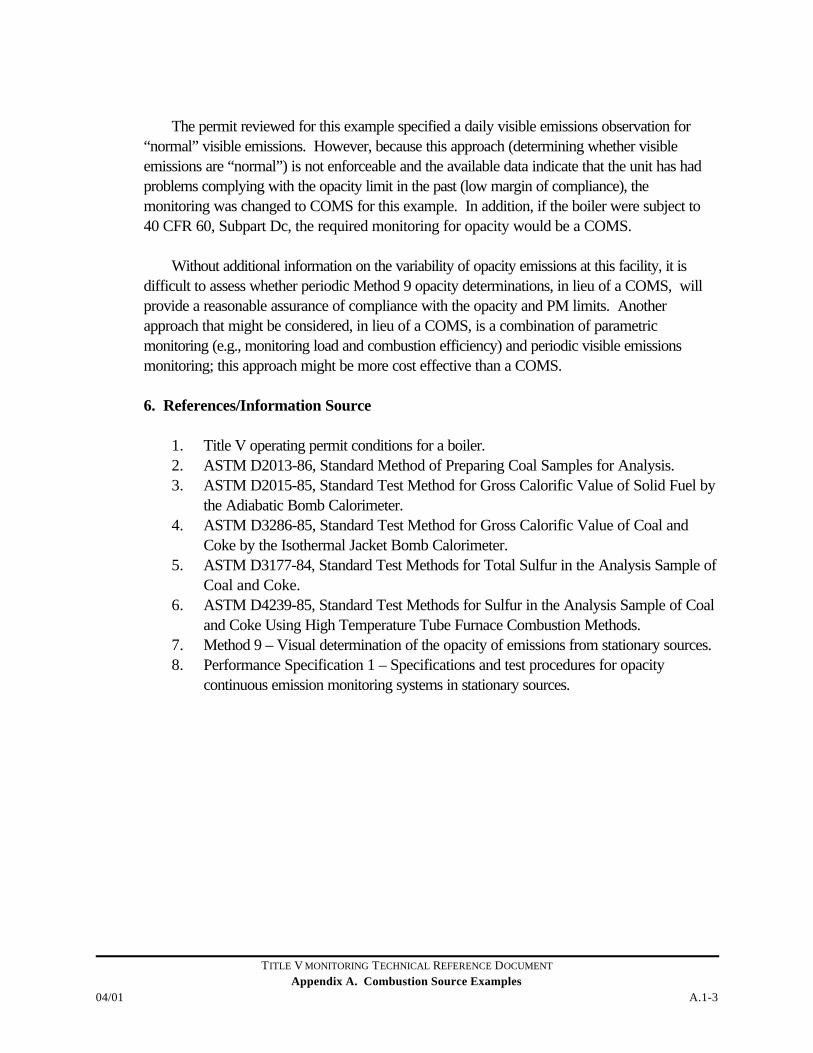
The permit reviewed for this example specified a daily visible emissions observation for“normal” visible emissions. However, because this approach (determining whether visibleemissions are “normal”) is not enforceable and the available data indicate that the unit has hadproblems complying with the opacity limit in the past (low margin of compliance), themonitoring was changed to COMS for this example. In addition, if the boiler were subject to40 CFR 60, Subpart Dc, the required monitoring for opacity would be a COMS.
Without additional information on the variability of opacity emissions at this facility, it isdifficult to assess whether periodic Method 9 opacity determinations, in lieu of a COMS, willprovide a reasonable assurance of compliance with the opacity and PM limits. Anotherapproach that might be considered, in lieu of a COMS, is a combination of parametricmonitoring (e.g., monitoring load and combustion efficiency) and periodic visible emissionsmonitoring; this approach might be more cost effective than a COMS.
6. References/Information Source
1. Title V operating permit conditions for a boiler.2. ASTM D2013-86, Standard Method of Preparing Coal Samples for Analysis.3. ASTM D2015-85, Standard Test Method for Gross Calorific Value of Solid Fuel by
the Adiabatic Bomb Calorimeter.4. ASTM D3286-85, Standard Test Method for Gross Calorific Value of Coal and
Coke by the Isothermal Jacket Bomb Calorimeter.5. ASTM D3177-84, Standard Test Methods for Total Sulfur in the Analysis Sample of
Coal and Coke.6. ASTM D4239-85, Standard Test Methods for Sulfur in the Analysis Sample of Coal
and Coke Using High Temperature Tube Furnace Combustion Methods.7. Method 9 – Visual determination of the opacity of emissions from stationary sources.8. Performance Specification 1 – Specifications and test procedures for opacity
continuous emission monitoring systems in stationary sources.
TITLE V MONITORING TECHNICAL REFERENCE DOCUMENT
Appendix A. Combustion Source Examples04/01 A.2-1
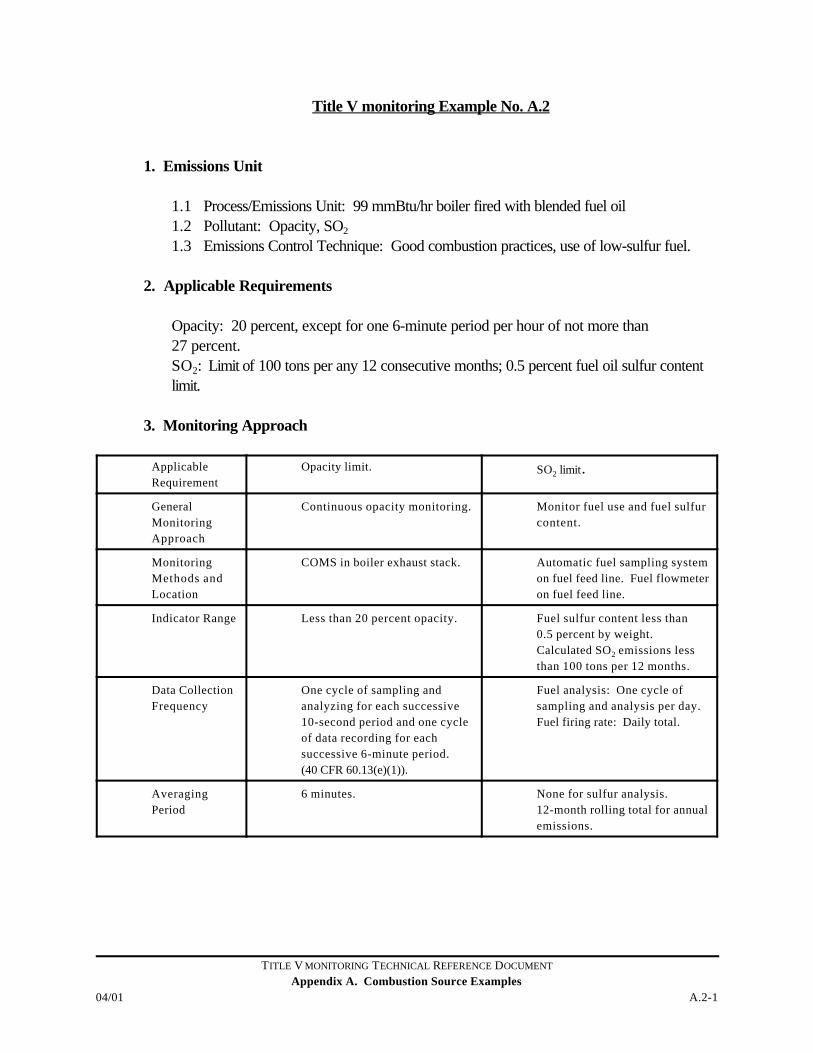
Title V monitoring Example No. A.2
1. Emissions Unit
1.1 Process/Emissions Unit: 99 mmBtu/hr boiler fired with blended fuel oil1.2 Pollutant: Opacity, SO2
1.3 Emissions Control Technique: Good combustion practices, use of low-sulfur fuel.
2. Applicable Requirements
Opacity: 20 percent, except for one 6-minute period per hour of not more than27 percent.SO2: Limit of 100 tons per any 12 consecutive months; 0.5 percent fuel oil sulfur contentlimit.
3. Monitoring Approach
ApplicableRequirement
Opacity limit. SO2 limit.
GeneralMonitoringApproach
Continuous opacity monitoring. Monitor fuel use and fuel sulfurcontent.
MonitoringMethods andLocation
COMS in boiler exhaust stack. Automatic fuel sampling systemon fuel feed line. Fuel flowmeteron fuel feed line.
Indicator Range Less than 20 percent opacity. Fuel sulfur content less than0.5 percent by weight. Calculated SO2 emissions lessthan 100 tons per 12 months.
Data CollectionFrequency
One cycle of sampling andanalyzing for each successive10-second period and one cycleof data recording for eachsuccessive 6-minute period.(40 CFR 60.13(e)(1)).
Fuel analysis: One cycle ofsampling and analysis per day.Fuel firing rate: Daily total.
AveragingPeriod
6 minutes. None for sulfur analysis.12-month rolling total for annualemissions.
TITLE V MONITORING TECHNICAL REFERENCE DOCUMENT
Appendix A. Combustion Source ExamplesA.2-2 04/01
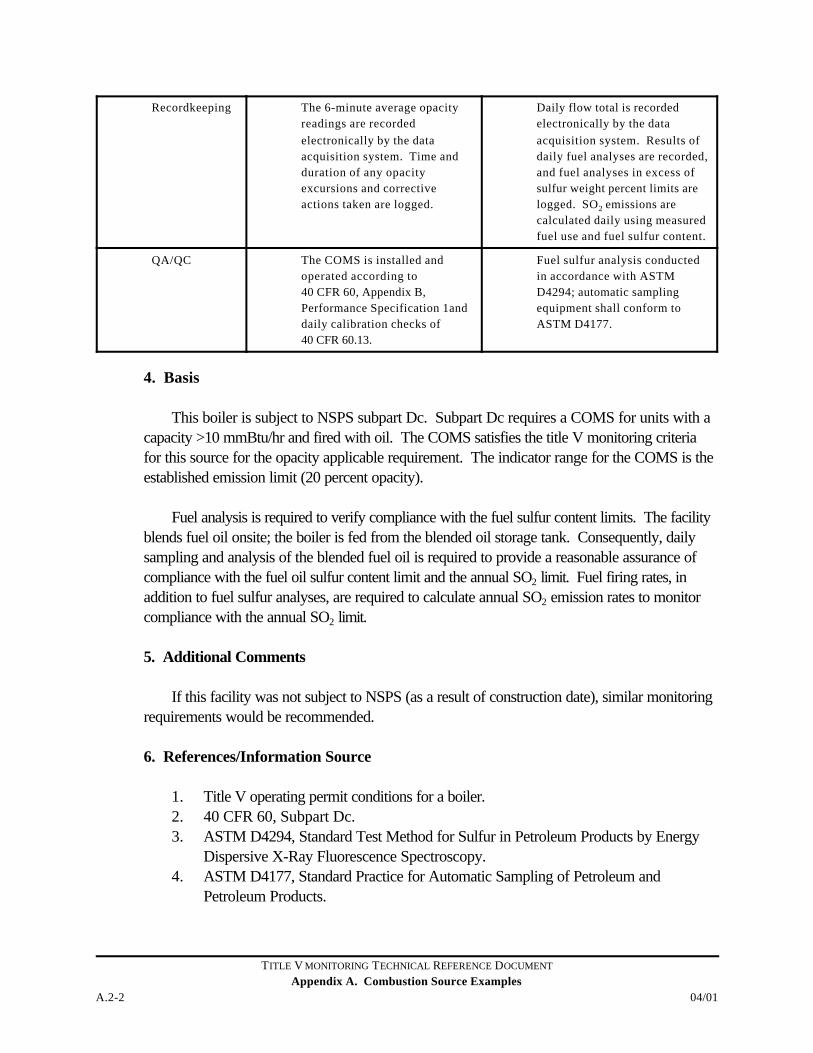
Recordkeeping The 6-minute average opacityreadings are recordedelectronically by the dataacquisition system. Time andduration of any opacityexcursions and correctiveactions taken are logged.
Daily flow total is recordedelectronically by the dataacquisition system. Results ofdaily fuel analyses are recorded,and fuel analyses in excess ofsulfur weight percent limits arelogged. SO2 emissions arecalculated daily using measuredfuel use and fuel sulfur content.
QA/QC The COMS is installed andoperated according to40 CFR 60, Appendix B,Performance Specification 1anddaily calibration checks of40 CFR 60.13.
Fuel sulfur analysis conductedin accordance with ASTMD4294; automatic samplingequipment shall conform toASTM D4177.
4. Basis
This boiler is subject to NSPS subpart Dc. Subpart Dc requires a COMS for units with acapacity >10 mmBtu/hr and fired with oil. The COMS satisfies the title V monitoring criteriafor this source for the opacity applicable requirement. The indicator range for the COMS is theestablished emission limit (20 percent opacity).
Fuel analysis is required to verify compliance with the fuel sulfur content limits. The facilityblends fuel oil onsite; the boiler is fed from the blended oil storage tank. Consequently, dailysampling and analysis of the blended fuel oil is required to provide a reasonable assurance ofcompliance with the fuel oil sulfur content limit and the annual SO2 limit. Fuel firing rates, inaddition to fuel sulfur analyses, are required to calculate annual SO2 emission rates to monitorcompliance with the annual SO2 limit.
5. Additional Comments
If this facility was not subject to NSPS (as a result of construction date), similar monitoringrequirements would be recommended.
6. References/Information Source
1. Title V operating permit conditions for a boiler.2. 40 CFR 60, Subpart Dc.3. ASTM D4294, Standard Test Method for Sulfur in Petroleum Products by Energy
Dispersive X-Ray Fluorescence Spectroscopy.4. ASTM D4177, Standard Practice for Automatic Sampling of Petroleum and
Petroleum Products.
TITLE V MONITORING TECHNICAL REFERENCE DOCUMENT
Appendix A. Combustion Source Examples04/01 A.2-3
5. Performance Specification 1 – Specifications and test procedures for opacitycontinuous emission monitoring systems in stationary sources.
TITLE V MONITORING TECHNICAL REFERENCE DOCUMENT
Appendix A. Combustion Source Examples04/01 A.3-1
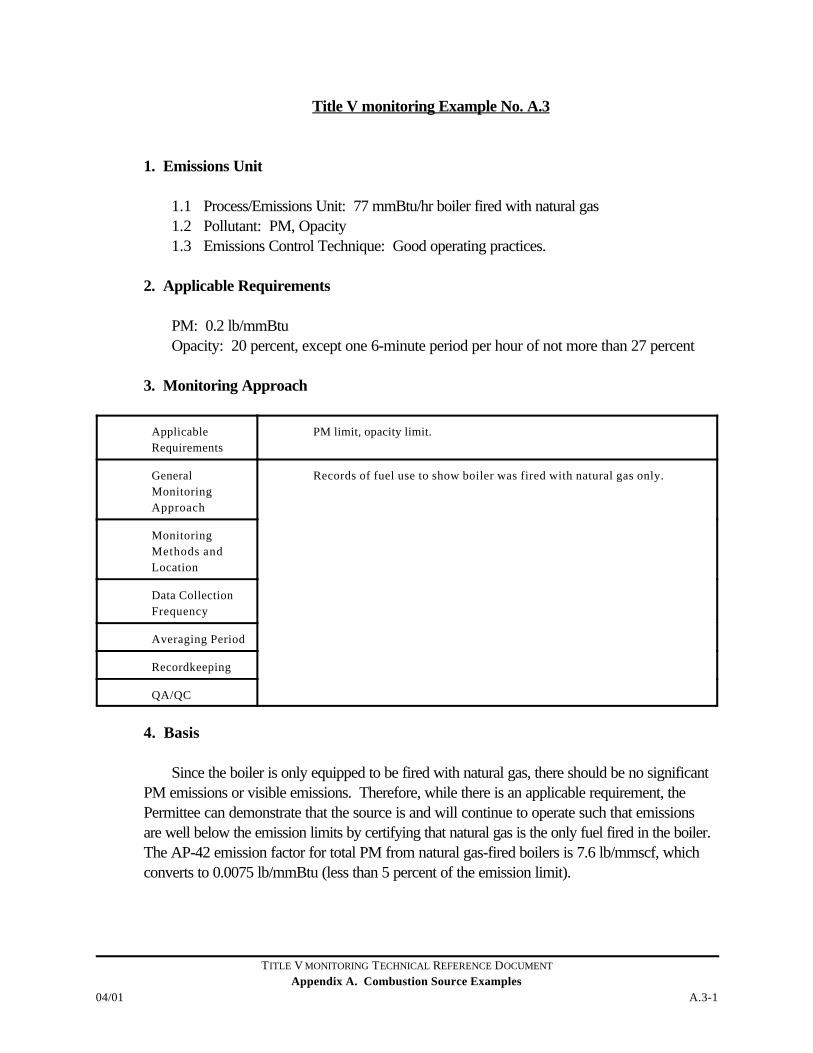
Title V monitoring Example No. A.3
1. Emissions Unit
1.1 Process/Emissions Unit: 77 mmBtu/hr boiler fired with natural gas1.2 Pollutant: PM, Opacity1.3 Emissions Control Technique: Good operating practices.
2. Applicable Requirements
PM: 0.2 lb/mmBtuOpacity: 20 percent, except one 6-minute period per hour of not more than 27 percent
3. Monitoring Approach
ApplicableRequirements
PM limit, opacity limit.
GeneralMonitoringApproach
Records of fuel use to show boiler was fired with natural gas only.
MonitoringMethods andLocation
Data CollectionFrequency
Averaging Period
Recordkeeping
QA/QC
4. Basis
Since the boiler is only equipped to be fired with natural gas, there should be no significantPM emissions or visible emissions. Therefore, while there is an applicable requirement, thePermittee can demonstrate that the source is and will continue to operate such that emissionsare well below the emission limits by certifying that natural gas is the only fuel fired in the boiler. The AP-42 emission factor for total PM from natural gas-fired boilers is 7.6 lb/mmscf, whichconverts to 0.0075 lb/mmBtu (less than 5 percent of the emission limit).
TITLE V MONITORING TECHNICAL REFERENCE DOCUMENT
Appendix A. Combustion Source ExamplesA.3-2 04/01
5. Additional Comments
None.
6. References/Information Source
1. Title V operating permit conditions for a natural gas-fired boiler.
TITLE V MONITORING TECHNICAL REFERENCE DOCUMENT
Appendix A. Combustion Source Examples04/01 A.4-1
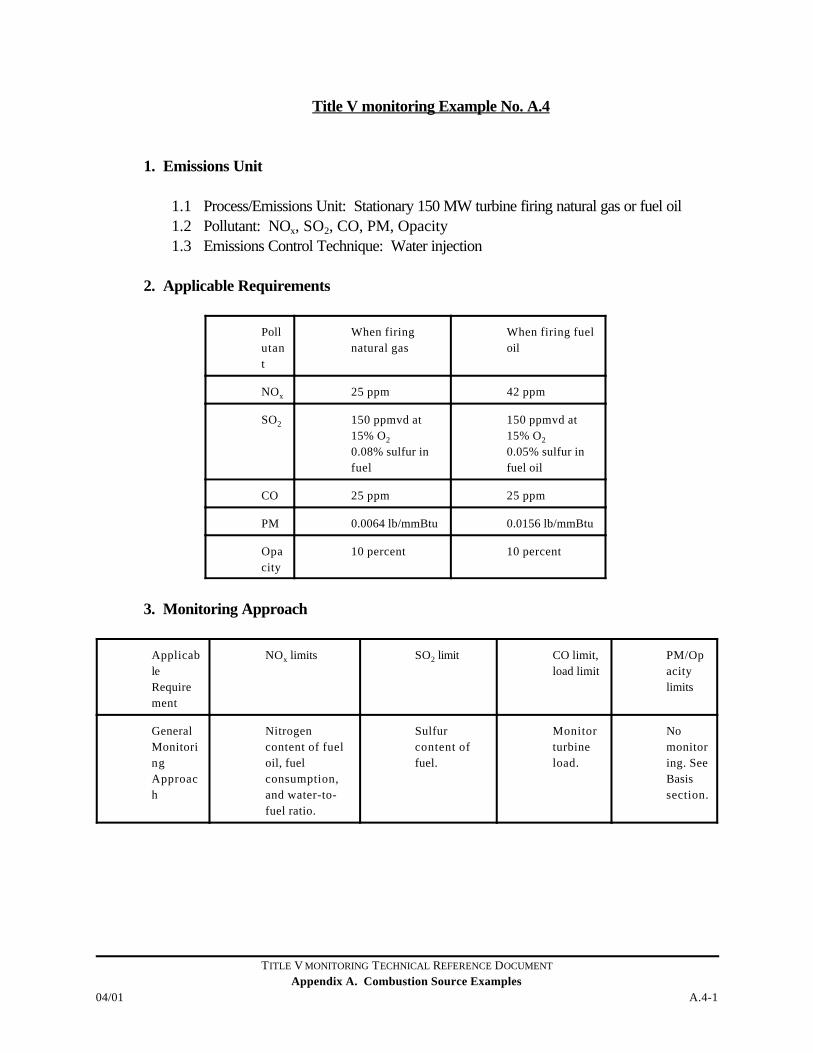
Title V monitoring Example No. A.4
1. Emissions Unit
1.1 Process/Emissions Unit: Stationary 150 MW turbine firing natural gas or fuel oil1.2 Pollutant: NOx, SO2, CO, PM, Opacity1.3 Emissions Control Technique: Water injection
2. Applicable Requirements
Pollutant
When firingnatural gas
When firing fueloil
NOx 25 ppm 42 ppm
SO2 150 ppmvd at15% O2
0.08% sulfur infuel
150 ppmvd at15% O2
0.05% sulfur infuel oil
CO 25 ppm 25 ppm
PM 0.0064 lb/mmBtu 0.0156 lb/mmBtu
Opacity
10 percent 10 percent
3. Monitoring Approach
ApplicableRequirement
NOx limits SO2 limit CO limit,load limit
PM/Opacitylimits
GeneralMonitoringApproach
Nitrogencontent of fueloil, fuelconsumption,and water-to-fuel ratio.
Sulfurcontent offuel.
Monitorturbineload.
Nomonitoring. SeeBasissection.
TITLE V MONITORING TECHNICAL REFERENCE DOCUMENT
Appendix A. Combustion Source ExamplesA.4-2 04/01
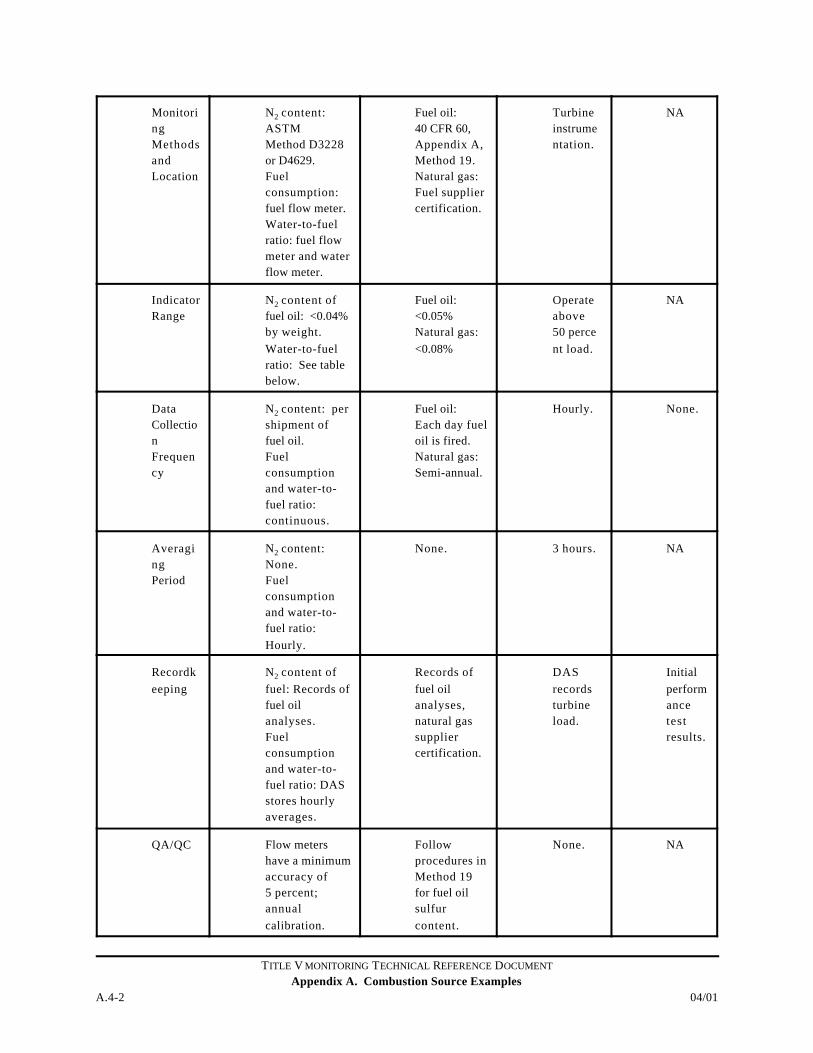
MonitoringMethodsandLocation
N2 content:ASTMMethod D3228or D4629.Fuelconsumption:fuel flow meter.Water-to-fuelratio: fuel flowmeter and waterflow meter.
Fuel oil: 40 CFR 60,Appendix A,Method 19.Natural gas: Fuel suppliercertification.
Turbineinstrumentation.
NA
IndicatorRange
N2 content offuel oil: <0.04%by weight.Water-to-fuelratio: See tablebelow.
Fuel oil: <0.05%Natural gas: <0.08%
Operateabove50 percent load.
NA
DataCollectionFrequency
N2 content: pershipment offuel oil.Fuelconsumptionand water-to-fuel ratio:continuous.
Fuel oil: Each day fueloil is fired.Natural gas: Semi-annual.
Hourly. None.
AveragingPeriod
N2 content: None.Fuelconsumptionand water-to-fuel ratio:Hourly.
None. 3 hours. NA
Recordkeeping
N2 content offuel: Records offuel oilanalyses.Fuelconsumptionand water-to-fuel ratio: DASstores hourlyaverages.
Records offuel oilanalyses,natural gassuppliercertification.
DASrecordsturbineload.
Initialperformancetestresults.
QA/QC Flow metershave a minimumaccuracy of5 percent;annualcalibration.
Followprocedures inMethod 19for fuel oilsulfurcontent.
None. NA
TITLE V MONITORING TECHNICAL REFERENCE DOCUMENT
Appendix A. Combustion Source Examples04/01 A.4-3
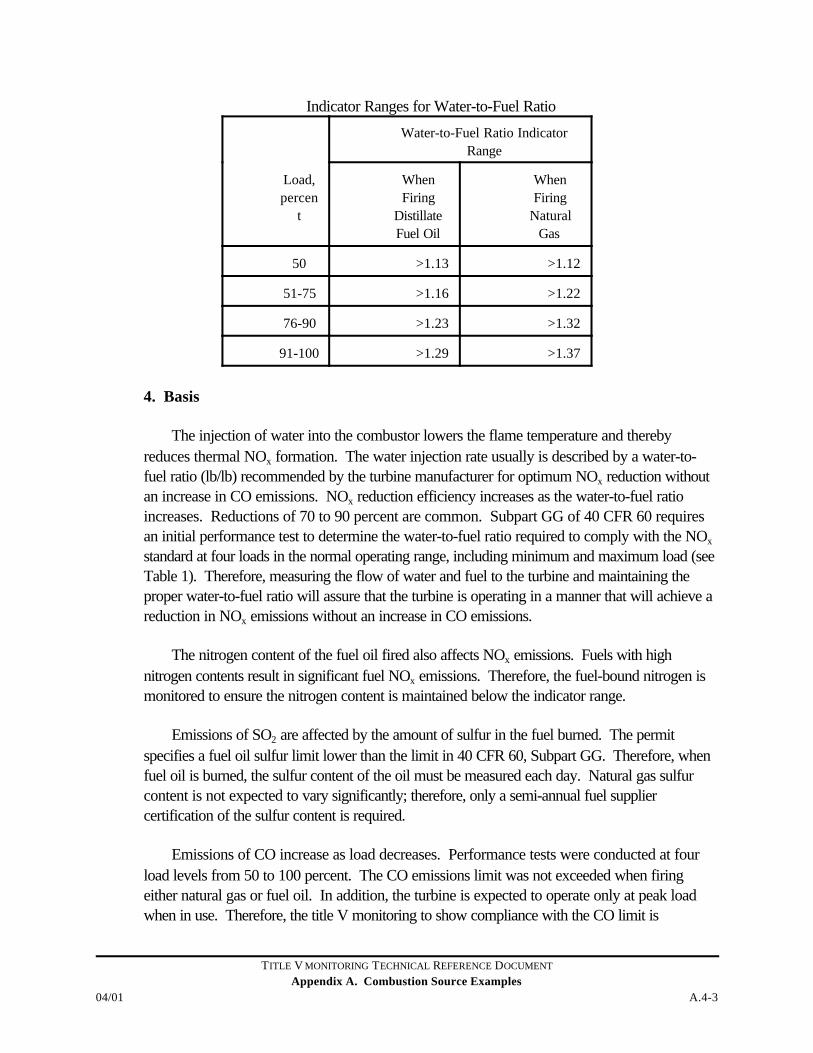
Indicator Ranges for Water-to-Fuel Ratio
Water-to-Fuel Ratio IndicatorRange
Load,percen
t
WhenFiring
DistillateFuel Oil
WhenFiring
NaturalGas
50 >1.13 >1.12
51-75 >1.16 >1.22
76-90 >1.23 >1.32
91-100 >1.29 >1.37
4. Basis
The injection of water into the combustor lowers the flame temperature and therebyreduces thermal NOx formation. The water injection rate usually is described by a water-to-fuel ratio (lb/lb) recommended by the turbine manufacturer for optimum NOx reduction withoutan increase in CO emissions. NOx reduction efficiency increases as the water-to-fuel ratioincreases. Reductions of 70 to 90 percent are common. Subpart GG of 40 CFR 60 requiresan initial performance test to determine the water-to-fuel ratio required to comply with the NOx
standard at four loads in the normal operating range, including minimum and maximum load (seeTable 1). Therefore, measuring the flow of water and fuel to the turbine and maintaining theproper water-to-fuel ratio will assure that the turbine is operating in a manner that will achieve areduction in NOx emissions without an increase in CO emissions.
The nitrogen content of the fuel oil fired also affects NOx emissions. Fuels with highnitrogen contents result in significant fuel NOx emissions. Therefore, the fuel-bound nitrogen ismonitored to ensure the nitrogen content is maintained below the indicator range.
Emissions of SO2 are affected by the amount of sulfur in the fuel burned. The permitspecifies a fuel oil sulfur limit lower than the limit in 40 CFR 60, Subpart GG. Therefore, whenfuel oil is burned, the sulfur content of the oil must be measured each day. Natural gas sulfurcontent is not expected to vary significantly; therefore, only a semi-annual fuel suppliercertification of the sulfur content is required.
Emissions of CO increase as load decreases. Performance tests were conducted at fourload levels from 50 to 100 percent. The CO emissions limit was not exceeded when firingeither natural gas or fuel oil. In addition, the turbine is expected to operate only at peak loadwhen in use. Therefore, the title V monitoring to show compliance with the CO limit is
TITLE V MONITORING TECHNICAL REFERENCE DOCUMENT
Appendix A. Combustion Source ExamplesA.4-4 04/01
maintained is to document the turbine operates above 50 percent of full load. During theseperformance tests, the turbine also showed compliance with the particulate limit for both fuels. Tests conducted while the turbine was firing fuel oil showed particulate emission rates less than20 percent of the limit. In addition, opacity during all tests for all fuels was zero. Therefore, nomonitoring is conducted to comply with the PM and opacity limits since the turbine is restrictedto the operating range of 50 to 100 percent load to comply with the CO limit.
5. Additional Comments
This example was based on a title V permit and supporting information for a stationaryturbine. The only change made to the monitoring contained in the permit was the addition ofQA/QC criteria for the water and fuel flow monitors.
6. References/Information Source
1. 40 CFR 60, Subpart GG.2. Alternative Control Techniques Document – NOx Emissions from Stationary
Gas Turbines, EPA-453/R-93-007, January 1993.3. Title V permit, review documentation, and emissions test results for a turbine.4. ASTM D3228, Standard Test Method for Total Nitrogen in Lubricating Oils and
Fuel Oils by Modified Kjeldahl Method.5. ASTM D4629, Standard Test Method for Trace Nitrogen in Liquid Petroleum
Hydrocarbons by Syringe/Inlet Oxidative Combustion and ChemiluminescenceDetection.
6. Method 19 – Determination of sulfur dioxide removal efficiency and particulate, sulfurdioxide, and nitrogen oxides emission rates.
APPENDIX B. FUGITIVE SOURCE EXAMPLES
TITLE V MONITORING TECHNICAL REFERENCE DOCUMENT
Appendix B. Fugitive Source Examples04/01 B.1-1
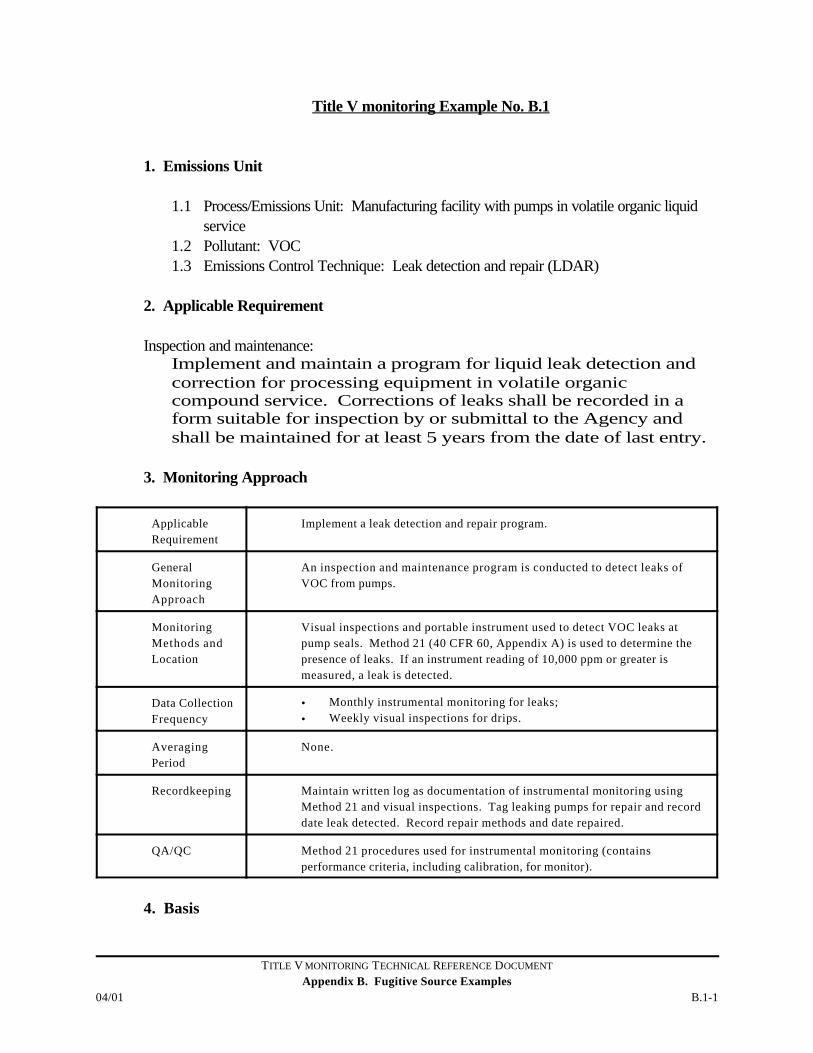
Title V monitoring Example No. B.1
1. Emissions Unit
1.1 Process/Emissions Unit: Manufacturing facility with pumps in volatile organic liquidservice
1.2 Pollutant: VOC1.3 Emissions Control Technique: Leak detection and repair (LDAR)
2. Applicable Requirement
Inspection and maintenance:Implement and maintain a program for liquid leak detection andcorrection for processing equipment in volatile organiccompound service. Corrections of leaks shall be recorded in aform suitable for inspection by or submittal to the Agency andshall be maintained for at least 5 years from the date of last entry.
3. Monitoring Approach
ApplicableRequirement
Implement a leak detection and repair program.
GeneralMonitoringApproach
An inspection and maintenance program is conducted to detect leaks ofVOC from pumps.
MonitoringMethods andLocation
Visual inspections and portable instrument used to detect VOC leaks atpump seals. Method 21 (40 CFR 60, Appendix A) is used to determine thepresence of leaks. If an instrument reading of 10,000 ppm or greater ismeasured, a leak is detected.
Data CollectionFrequency
• Monthly instrumental monitoring for leaks;• Weekly visual inspections for drips.
AveragingPeriod
None.
Recordkeeping Maintain written log as documentation of instrumental monitoring usingMethod 21 and visual inspections. Tag leaking pumps for repair and recorddate leak detected. Record repair methods and date repaired.
QA/QC Method 21 procedures used for instrumental monitoring (containsperformance criteria, including calibration, for monitor).
4. Basis
TITLE V MONITORING TECHNICAL REFERENCE DOCUMENT
Appendix B. Fugitive Source ExamplesB.1-2 04/01
Recordkeeping is the appropriate monitoring for an LDAR program. The monitoring andrecordkeeping procedures established in 40 CFR 60, Subpart VV, are adequate title Vmonitoring for this source. Weekly visual inspections for observable drips from pump seals willidentify excessive leakage. Monthly checks using a portable VOC monitoring instrument willprovide a more sensitive means of identifying small leaks and will prompt repair of those leaksbefore they become excessive.
5. Additional Comments
Subpart VV also allows for use of pump with dual mechanical seal with leak detection byvisual inspection, seal sensor system, and barrier fluid failure criteria.
6. References/Information Source
1. 40 CFR 60, Subpart VV.2. Title V operating permits.3. 40 CFR 60, Appendix A, Method 21, “Determination of Volatile Organic
Compounds Leaks.”
TITLE V MONITORING TECHNICAL REFERENCE DOCUMENT
Appendix B. Fugitive Source Examples04/01 B.2-1
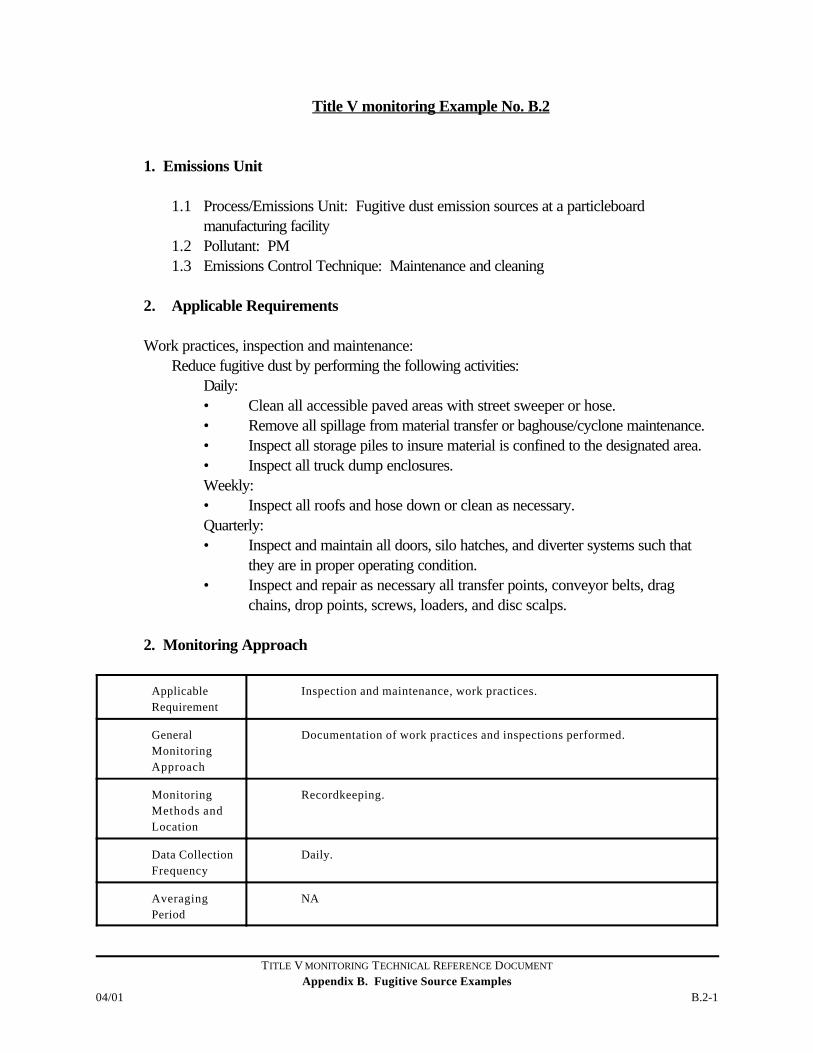
Title V monitoring Example No. B.2
1. Emissions Unit
1.1 Process/Emissions Unit: Fugitive dust emission sources at a particleboardmanufacturing facility
1.2 Pollutant: PM1.3 Emissions Control Technique: Maintenance and cleaning
2. Applicable Requirements
Work practices, inspection and maintenance:Reduce fugitive dust by performing the following activities:
Daily: • Clean all accessible paved areas with street sweeper or hose.• Remove all spillage from material transfer or baghouse/cyclone maintenance.• Inspect all storage piles to insure material is confined to the designated area.• Inspect all truck dump enclosures.Weekly:• Inspect all roofs and hose down or clean as necessary.Quarterly:• Inspect and maintain all doors, silo hatches, and diverter systems such that
they are in proper operating condition.• Inspect and repair as necessary all transfer points, conveyor belts, drag
chains, drop points, screws, loaders, and disc scalps.
2. Monitoring Approach
ApplicableRequirement
Inspection and maintenance, work practices.
GeneralMonitoringApproach
Documentation of work practices and inspections performed.
MonitoringMethods andLocation
Recordkeeping.
Data CollectionFrequency
Daily.
AveragingPeriod
NA
TITLE V MONITORING TECHNICAL REFERENCE DOCUMENT
Appendix B. Fugitive Source ExamplesB.2-2 04/01
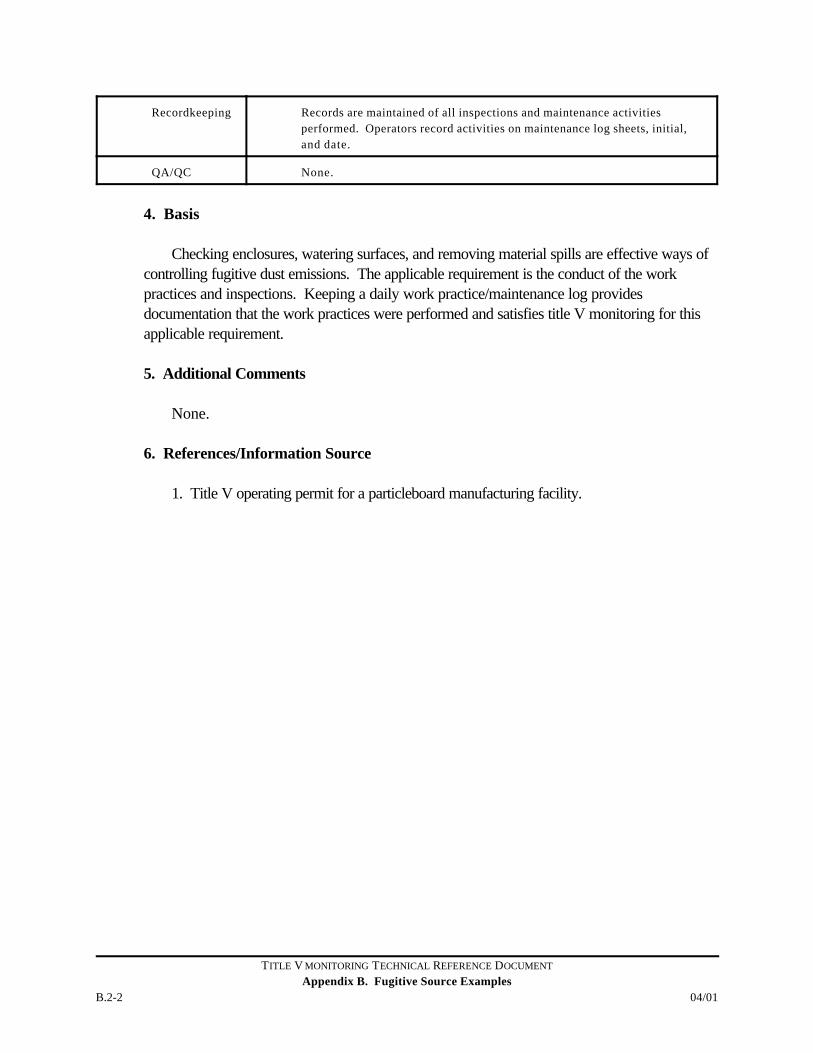
Recordkeeping Records are maintained of all inspections and maintenance activitiesperformed. Operators record activities on maintenance log sheets, initial,and date.
QA/QC None.
4. Basis
Checking enclosures, watering surfaces, and removing material spills are effective ways ofcontrolling fugitive dust emissions. The applicable requirement is the conduct of the workpractices and inspections. Keeping a daily work practice/maintenance log providesdocumentation that the work practices were performed and satisfies title V monitoring for thisapplicable requirement.
5. Additional Comments
None.
6. References/Information Source
1. Title V operating permit for a particleboard manufacturing facility.
TITLE V MONITORING TECHNICAL REFERENCE DOCUMENT
Appendix B. Fugitive Source Examples04/01 B.3-1
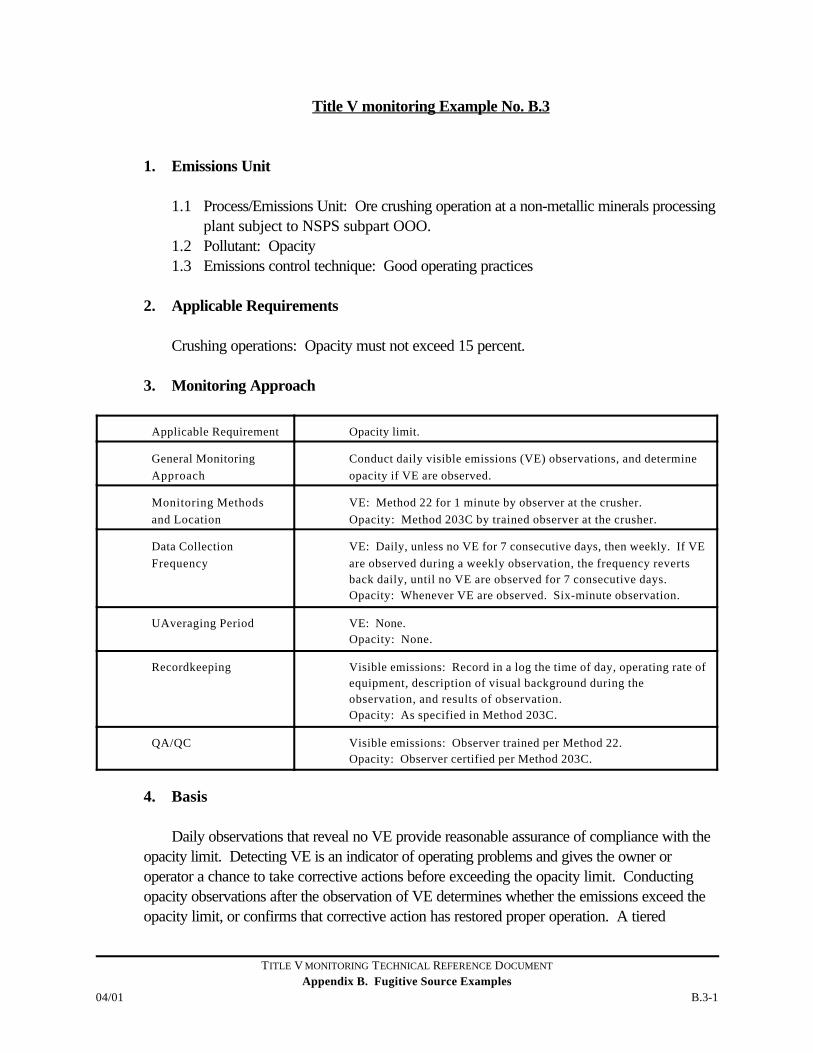
Title V monitoring Example No. B.3
1. Emissions Unit
1.1 Process/Emissions Unit: Ore crushing operation at a non-metallic minerals processingplant subject to NSPS subpart OOO.
1.2 Pollutant: Opacity1.3 Emissions control technique: Good operating practices
2. Applicable Requirements
Crushing operations: Opacity must not exceed 15 percent.
3. Monitoring Approach
Applicable Requirement Opacity limit.
General MonitoringApproach
Conduct daily visible emissions (VE) observations, and determineopacity if VE are observed.
Monitoring Methodsand Location
VE: Method 22 for 1 minute by observer at the crusher.Opacity: Method 203C by trained observer at the crusher.
Data CollectionFrequency
VE: Daily, unless no VE for 7 consecutive days, then weekly. If VEare observed during a weekly observation, the frequency revertsback daily, until no VE are observed for 7 consecutive days.Opacity: Whenever VE are observed. Six-minute observation.
UAveraging Period VE: None.Opacity: None.
Recordkeeping Visible emissions: Record in a log the time of day, operating rate ofequipment, description of visual background during theobservation, and results of observation.Opacity: As specified in Method 203C.
QA/QC Visible emissions: Observer trained per Method 22.Opacity: Observer certified per Method 203C.
4. Basis
Daily observations that reveal no VE provide reasonable assurance of compliance with theopacity limit. Detecting VE is an indicator of operating problems and gives the owner oroperator a chance to take corrective actions before exceeding the opacity limit. Conductingopacity observations after the observation of VE determines whether the emissions exceed theopacity limit, or confirms that corrective action has restored proper operation. A tiered
TITLE V MONITORING TECHNICAL REFERENCE DOCUMENT
Appendix B. Fugitive Source ExamplesB.3-2 04/01
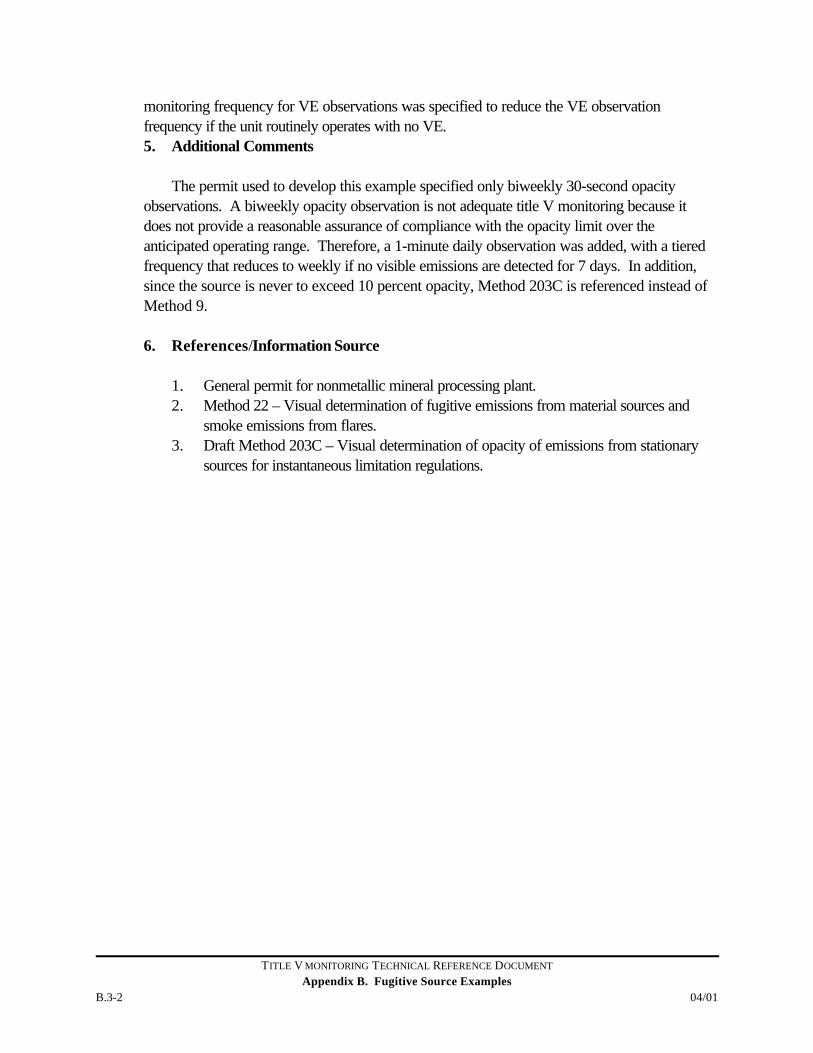
monitoring frequency for VE observations was specified to reduce the VE observationfrequency if the unit routinely operates with no VE.5. Additional Comments
The permit used to develop this example specified only biweekly 30-second opacityobservations. A biweekly opacity observation is not adequate title V monitoring because itdoes not provide a reasonable assurance of compliance with the opacity limit over theanticipated operating range. Therefore, a 1-minute daily observation was added, with a tieredfrequency that reduces to weekly if no visible emissions are detected for 7 days. In addition,since the source is never to exceed 10 percent opacity, Method 203C is referenced instead ofMethod 9.
6. References/Information Source
1. General permit for nonmetallic mineral processing plant.2. Method 22 – Visual determination of fugitive emissions from material sources and
smoke emissions from flares.3. Draft Method 203C – Visual determination of opacity of emissions from stationary
sources for instantaneous limitation regulations.
TITLE V MONITORING TECHNICAL REFERENCE DOCUMENT
Appendix B. Fugitive Source Examples04/01 B.4-1
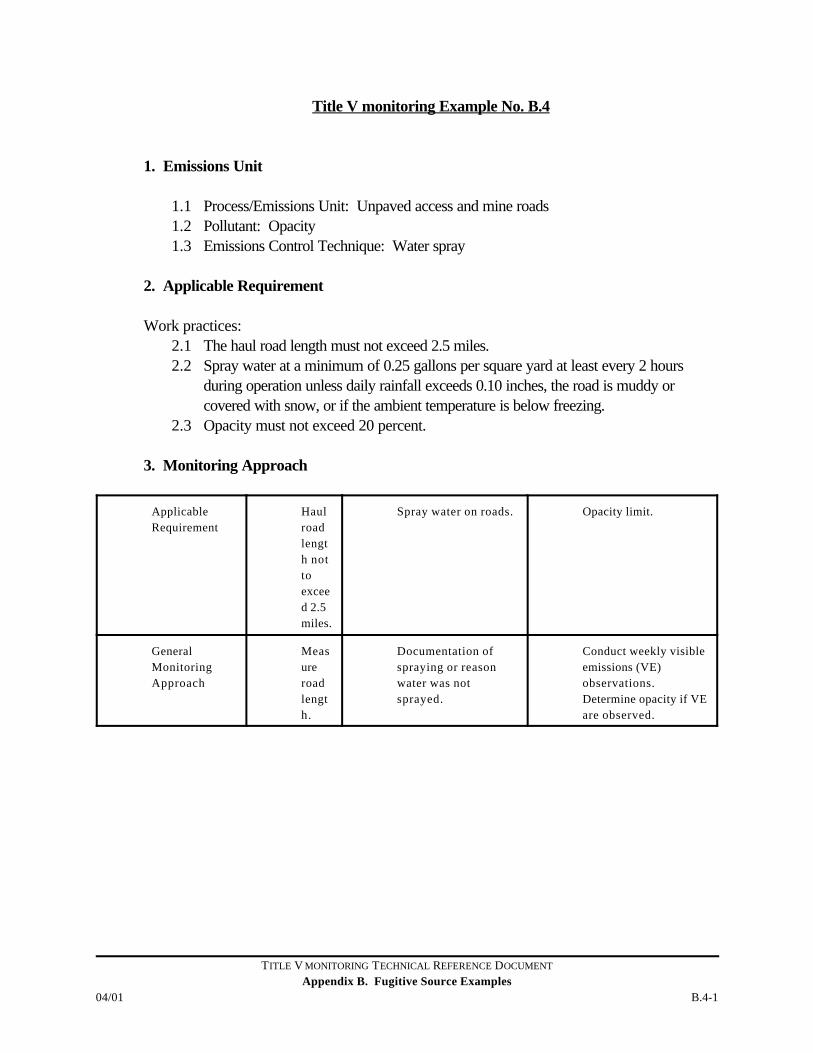
Title V monitoring Example No. B.4
1. Emissions Unit
1.1 Process/Emissions Unit: Unpaved access and mine roads1.2 Pollutant: Opacity1.3 Emissions Control Technique: Water spray
2. Applicable Requirement
Work practices:2.1 The haul road length must not exceed 2.5 miles.2.2 Spray water at a minimum of 0.25 gallons per square yard at least every 2 hours
during operation unless daily rainfall exceeds 0.10 inches, the road is muddy orcovered with snow, or if the ambient temperature is below freezing.
2.3 Opacity must not exceed 20 percent.
3. Monitoring Approach
ApplicableRequirement
Haulroadlength nottoexceed 2.5miles.
Spray water on roads. Opacity limit.
GeneralMonitoringApproach
Measureroadlength.
Documentation ofspraying or reasonwater was notsprayed.
Conduct weekly visibleemissions (VE)observations. Determine opacity if VEare observed.
TITLE V MONITORING TECHNICAL REFERENCE DOCUMENT
Appendix B. Fugitive Source ExamplesB.4-2 04/01
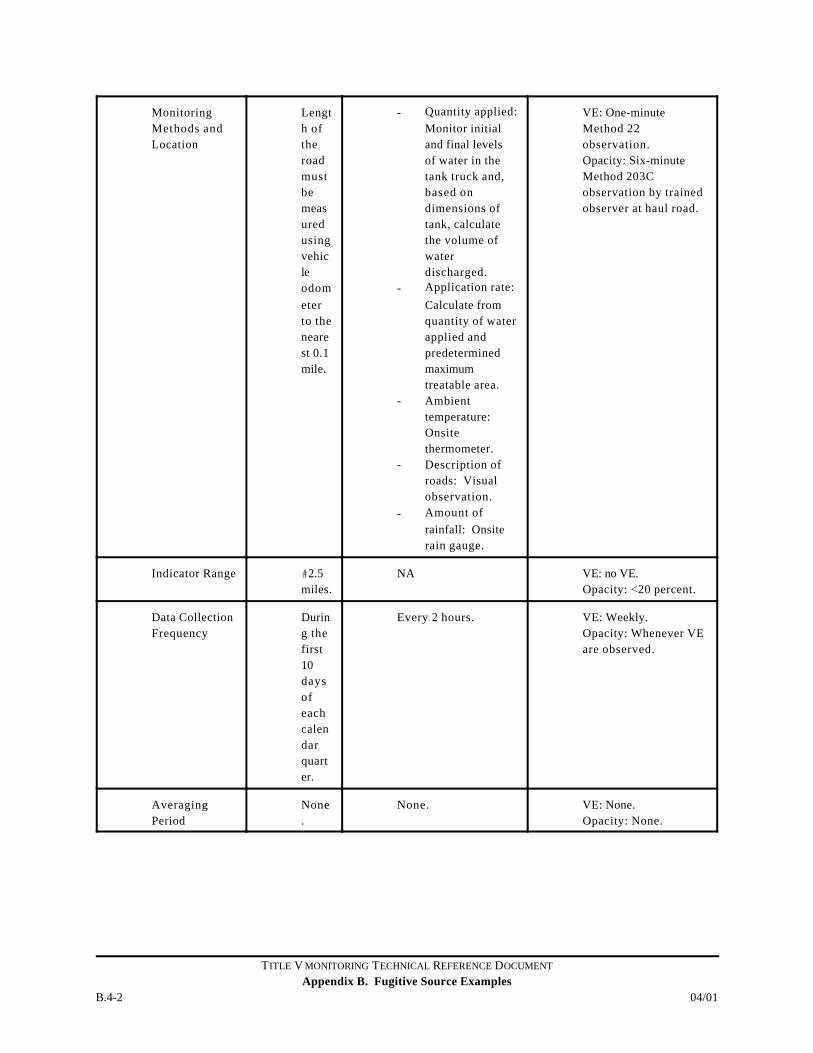
MonitoringMethods andLocation
Length oftheroadmustbemeasuredusingvehicleodometerto thenearest 0.1mile.
- Quantity applied:Monitor initialand final levelsof water in thetank truck and,based ondimensions oftank, calculatethe volume ofwaterdischarged.
- Application rate:
Calculate fromquantity of waterapplied andpredeterminedmaximumtreatable area.
- Ambienttemperature: Onsitethermometer.
- Description ofroads: Visualobservation.
- Amount ofrainfall: Onsiterain gauge.
VE: One-minuteMethod 22observation.Opacity: Six-minuteMethod 203Cobservation by trainedobserver at haul road.
Indicator Range #2.5miles.
NA VE: no VE.Opacity: <20 percent.
Data CollectionFrequency
During thefirst10daysofeachcalendarquarter.
Every 2 hours. VE: Weekly.Opacity: Whenever VEare observed.
AveragingPeriod
None.
None. VE: None. Opacity: None.
TITLE V MONITORING TECHNICAL REFERENCE DOCUMENT
Appendix B. Fugitive Source Examples04/01 B.4-3
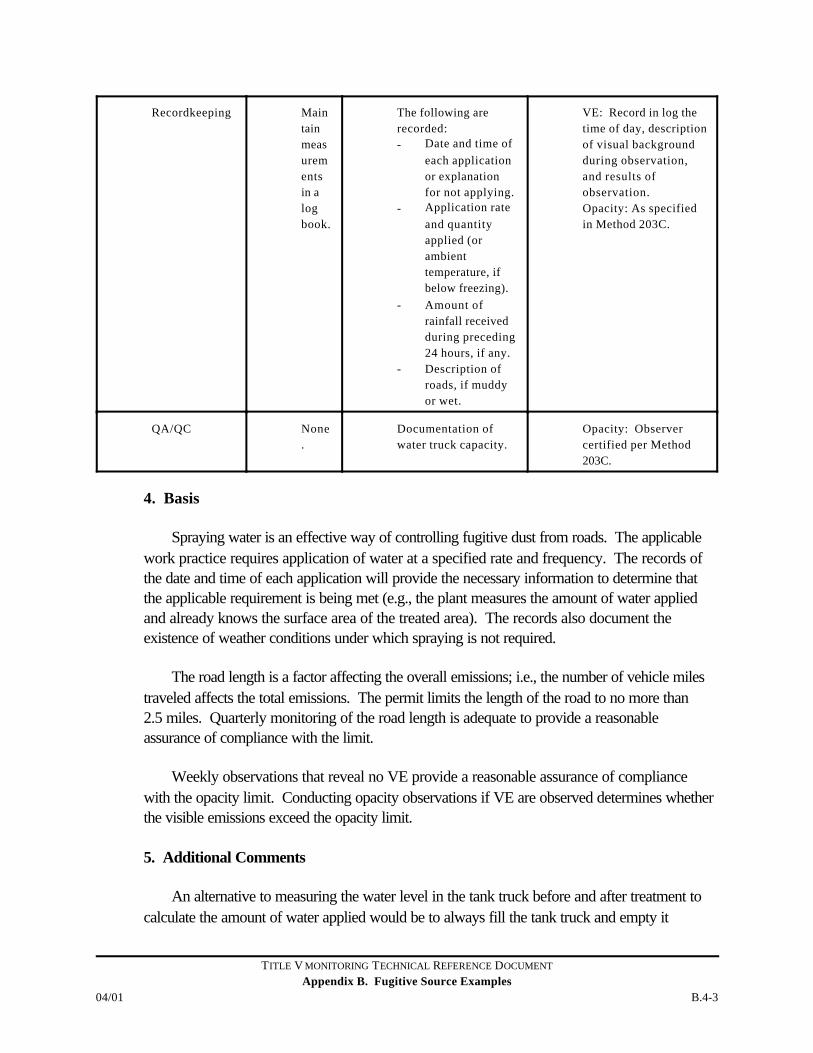
Recordkeeping Maintainmeasurementsin alogbook.
The following arerecorded:- Date and time of
each applicationor explanationfor not applying.
- Application rateand quantityapplied (orambienttemperature, ifbelow freezing).
- Amount ofrainfall receivedduring preceding24 hours, if any.
- Description ofroads, if muddyor wet.
VE: Record in log thetime of day, descriptionof visual backgroundduring observation,and results ofobservation.Opacity: As specifiedin Method 203C.
QA/QC None.
Documentation ofwater truck capacity.
Opacity: Observercertified per Method203C.
4. Basis
Spraying water is an effective way of controlling fugitive dust from roads. The applicablework practice requires application of water at a specified rate and frequency. The records ofthe date and time of each application will provide the necessary information to determine thatthe applicable requirement is being met (e.g., the plant measures the amount of water appliedand already knows the surface area of the treated area). The records also document theexistence of weather conditions under which spraying is not required.
The road length is a factor affecting the overall emissions; i.e., the number of vehicle milestraveled affects the total emissions. The permit limits the length of the road to no more than2.5 miles. Quarterly monitoring of the road length is adequate to provide a reasonableassurance of compliance with the limit.
Weekly observations that reveal no VE provide a reasonable assurance of compliancewith the opacity limit. Conducting opacity observations if VE are observed determines whetherthe visible emissions exceed the opacity limit.
5. Additional Comments
An alternative to measuring the water level in the tank truck before and after treatment tocalculate the amount of water applied would be to always fill the tank truck and empty it
TITLE V MONITORING TECHNICAL REFERENCE DOCUMENT
Appendix B. Fugitive Source ExamplesB.4-4 04/01
completely during treatment so the quantity applied is always the same (i.e., equal to the volumeof the tank truck, which the facility is required to document).
The operating permit reviewed for this example also contains an applicable requirementstating that the speed of heavy vehicles and haul trucks must not exceed 25 miles per hour. Thespeed of light trucks must not exceed 40 miles per hour provided the opacity readings arebelow 20 percent; otherwise, light vehicles must not exceed 25 miles per hour. The monitoringrequires the facility to post speed limit signs at the entrance to the haul road and shiftsupervisors are to observe the speed of the vehicles and to correct any violations. At leastonce each quarter, the presence of speed limit signs must be verified. The facility is required tolog the results of the quarterly inspections of the speed limit signs. The speed limit applicablerequirement was not included in the example because the monitoring is not practical (e.g., thesupervisor cannot monitor the speed limit of every truck that travels down the road).
6. References/Information Source
1. Operating permit for mineral products facility.
TITLE V MONITORING TECHNICAL REFERENCE DOCUMENT
Appendix B. Fugitive Source Examples04/01 B.5-1
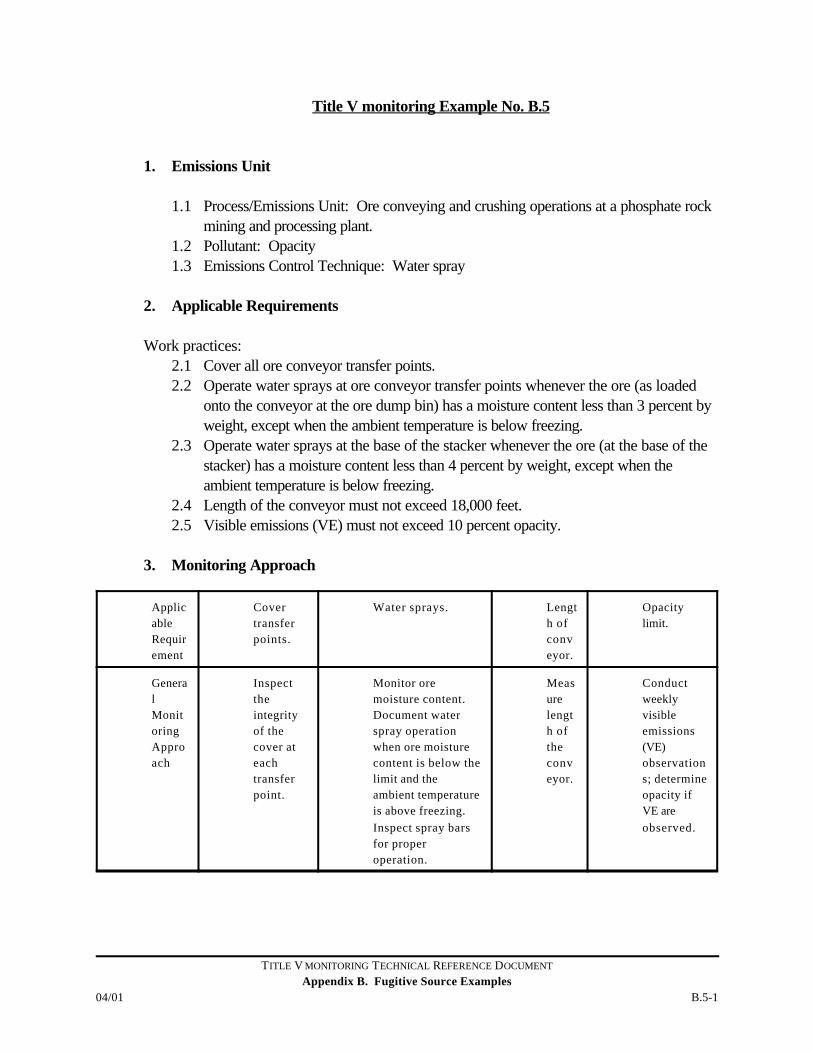
Title V monitoring Example No. B.5
1. Emissions Unit
1.1 Process/Emissions Unit: Ore conveying and crushing operations at a phosphate rockmining and processing plant.
1.2 Pollutant: Opacity1.3 Emissions Control Technique: Water spray
2. Applicable Requirements
Work practices:2.1 Cover all ore conveyor transfer points.2.2 Operate water sprays at ore conveyor transfer points whenever the ore (as loaded
onto the conveyor at the ore dump bin) has a moisture content less than 3 percent byweight, except when the ambient temperature is below freezing.
2.3 Operate water sprays at the base of the stacker whenever the ore (at the base of thestacker) has a moisture content less than 4 percent by weight, except when theambient temperature is below freezing.
2.4 Length of the conveyor must not exceed 18,000 feet.2.5 Visible emissions (VE) must not exceed 10 percent opacity.
3. Monitoring Approach
ApplicableRequirement
Covertransferpoints.
Water sprays. Length ofconveyor.
Opacitylimit.
GeneralMonitoringApproach
Inspecttheintegrityof thecover ateachtransferpoint.
Monitor oremoisture content. Document waterspray operationwhen ore moisturecontent is below thelimit and theambient temperatureis above freezing. Inspect spray barsfor properoperation.
Measurelength oftheconveyor.
Conductweeklyvisibleemissions(VE)observations; determineopacity ifVE areobserved.
TITLE V MONITORING TECHNICAL REFERENCE DOCUMENT
Appendix B. Fugitive Source ExamplesB.5-2 04/01
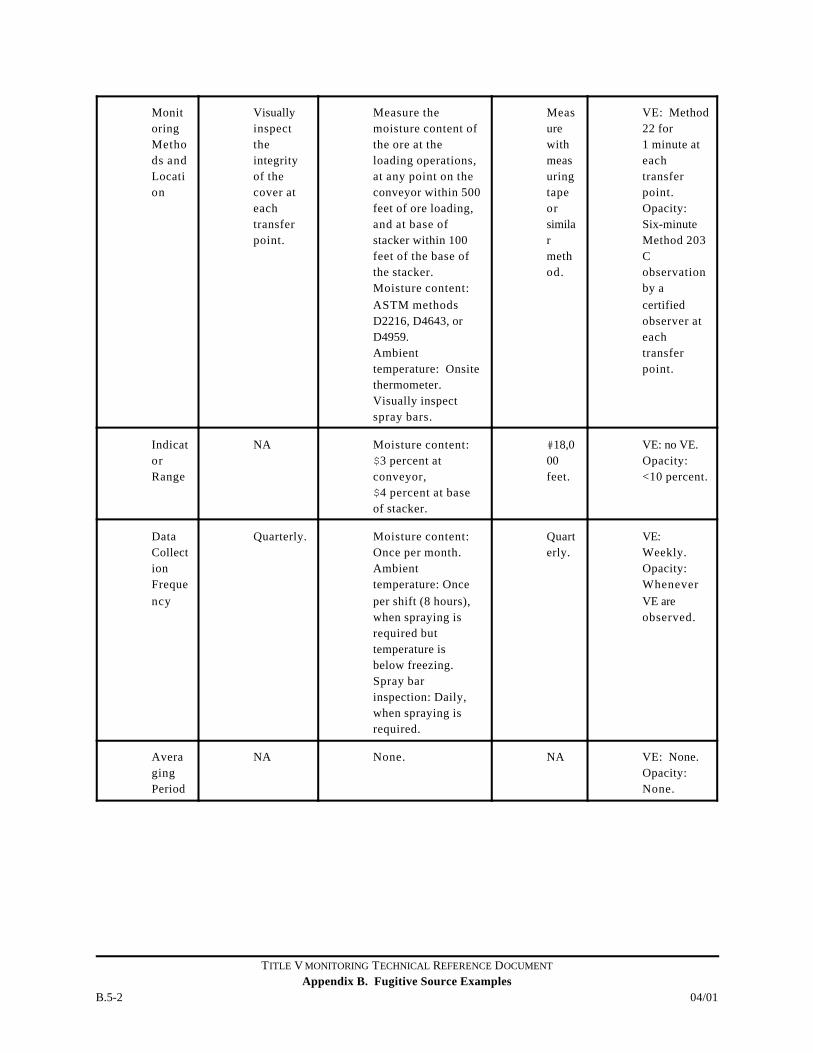
MonitoringMethods andLocation
Visuallyinspecttheintegrityof thecover ateachtransferpoint.
Measure themoisture content ofthe ore at theloading operations,at any point on theconveyor within 500feet of ore loading,and at base ofstacker within 100feet of the base ofthe stacker.Moisture content:ASTM methodsD2216, D4643, orD4959.Ambienttemperature: Onsitethermometer.Visually inspectspray bars.
Measurewithmeasuringtapeorsimilarmethod.
VE: Method22 for1 minute ateachtransferpoint.Opacity: Six-minuteMethod 203Cobservationby acertifiedobserver ateachtransferpoint.
IndicatorRange
NA Moisture content:$3 percent atconveyor,$4 percent at baseof stacker.
#18,000feet.
VE: no VE.Opacity:<10 percent.
DataCollectionFrequency
Quarterly. Moisture content:Once per month.Ambienttemperature: Onceper shift (8 hours),when spraying isrequired buttemperature isbelow freezing.Spray barinspection: Daily,when spraying isrequired.
Quarterly.
VE: Weekly.Opacity: WheneverVE areobserved.
AveragingPeriod
NA None. NA VE: None.Opacity: None.
TITLE V MONITORING TECHNICAL REFERENCE DOCUMENT
Appendix B. Fugitive Source Examples04/01 B.5-3
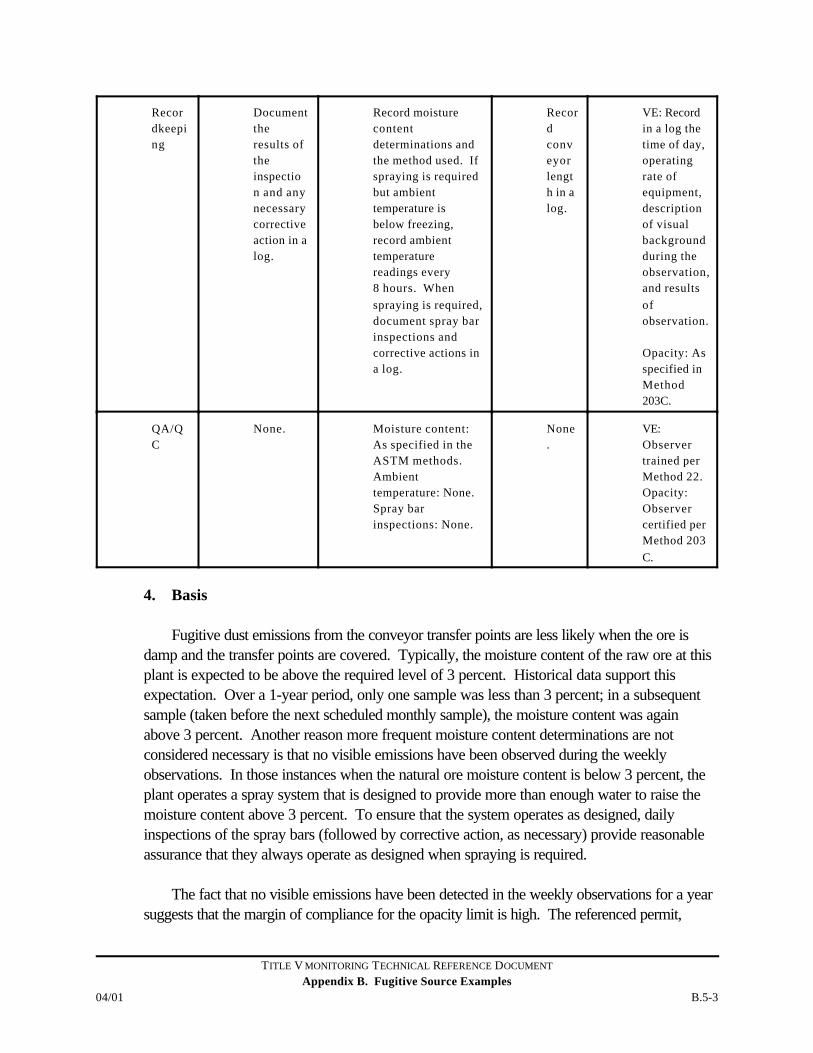
Recordkeeping
Documenttheresults oftheinspection and anynecessarycorrectiveaction in alog.
Record moisturecontentdeterminations andthe method used. Ifspraying is requiredbut ambienttemperature isbelow freezing,record ambienttemperaturereadings every8 hours. Whenspraying is required,document spray barinspections andcorrective actions ina log.
Recordconveyorlength in alog.
VE: Recordin a log thetime of day,operatingrate ofequipment,descriptionof visualbackgroundduring theobservation,and resultsofobservation.
Opacity: Asspecified inMethod203C.
QA/QC
None. Moisture content:As specified in theASTM methods.Ambienttemperature: None.Spray barinspections: None.
None.
VE:Observertrained perMethod 22.Opacity:Observercertified perMethod 203C.
4. Basis
Fugitive dust emissions from the conveyor transfer points are less likely when the ore isdamp and the transfer points are covered. Typically, the moisture content of the raw ore at thisplant is expected to be above the required level of 3 percent. Historical data support thisexpectation. Over a 1-year period, only one sample was less than 3 percent; in a subsequentsample (taken before the next scheduled monthly sample), the moisture content was againabove 3 percent. Another reason more frequent moisture content determinations are notconsidered necessary is that no visible emissions have been observed during the weeklyobservations. In those instances when the natural ore moisture content is below 3 percent, theplant operates a spray system that is designed to provide more than enough water to raise themoisture content above 3 percent. To ensure that the system operates as designed, dailyinspections of the spray bars (followed by corrective action, as necessary) provide reasonableassurance that they always operate as designed when spraying is required.
The fact that no visible emissions have been detected in the weekly observations for a yearsuggests that the margin of compliance for the opacity limit is high. The referenced permit,
TITLE V MONITORING TECHNICAL REFERENCE DOCUMENT
Appendix B. Fugitive Source ExamplesB.5-4 04/01
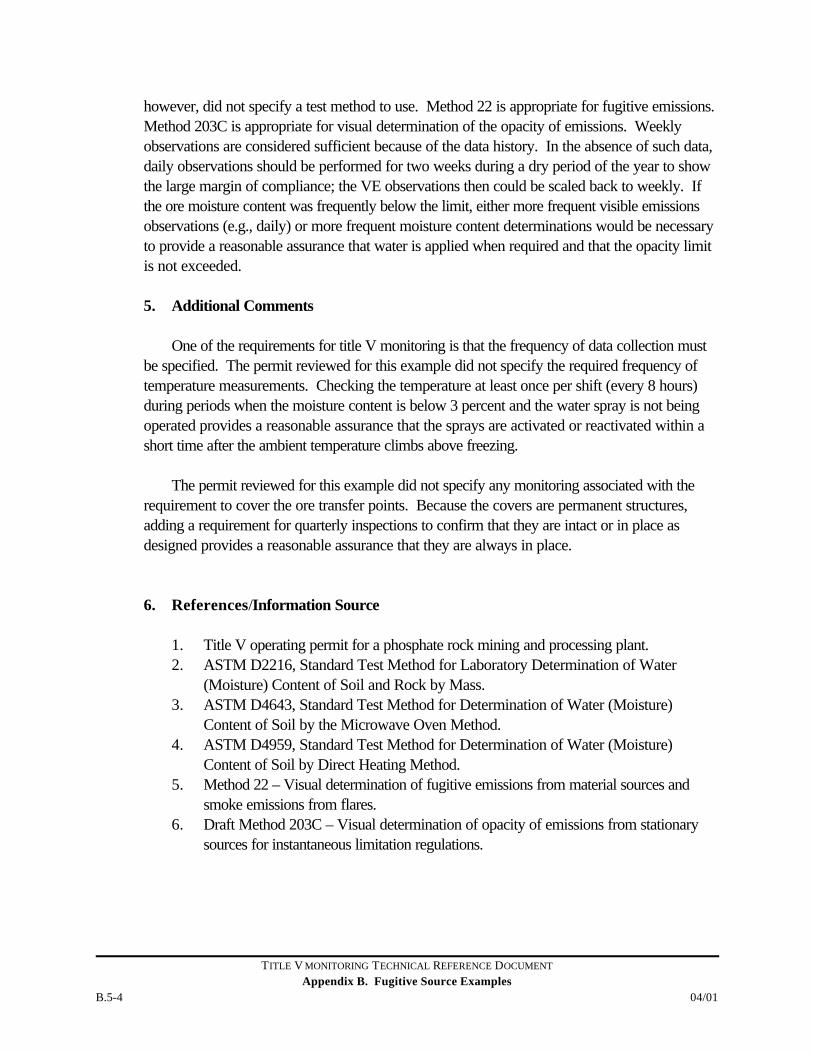
however, did not specify a test method to use. Method 22 is appropriate for fugitive emissions. Method 203C is appropriate for visual determination of the opacity of emissions. Weeklyobservations are considered sufficient because of the data history. In the absence of such data,daily observations should be performed for two weeks during a dry period of the year to showthe large margin of compliance; the VE observations then could be scaled back to weekly. Ifthe ore moisture content was frequently below the limit, either more frequent visible emissionsobservations (e.g., daily) or more frequent moisture content determinations would be necessaryto provide a reasonable assurance that water is applied when required and that the opacity limitis not exceeded.
5. Additional Comments
One of the requirements for title V monitoring is that the frequency of data collection mustbe specified. The permit reviewed for this example did not specify the required frequency oftemperature measurements. Checking the temperature at least once per shift (every 8 hours)during periods when the moisture content is below 3 percent and the water spray is not beingoperated provides a reasonable assurance that the sprays are activated or reactivated within ashort time after the ambient temperature climbs above freezing.
The permit reviewed for this example did not specify any monitoring associated with therequirement to cover the ore transfer points. Because the covers are permanent structures,adding a requirement for quarterly inspections to confirm that they are intact or in place asdesigned provides a reasonable assurance that they are always in place.
6. References/Information Source
1. Title V operating permit for a phosphate rock mining and processing plant.2. ASTM D2216, Standard Test Method for Laboratory Determination of Water
(Moisture) Content of Soil and Rock by Mass.3. ASTM D4643, Standard Test Method for Determination of Water (Moisture)
Content of Soil by the Microwave Oven Method.4. ASTM D4959, Standard Test Method for Determination of Water (Moisture)
Content of Soil by Direct Heating Method.5. Method 22 – Visual determination of fugitive emissions from material sources and
smoke emissions from flares.6. Draft Method 203C – Visual determination of opacity of emissions from stationary
sources for instantaneous limitation regulations.
APPENDIX C. COATING SOURCE EXAMPLES
TITLE V MONITORING TECHNICAL REFERENCE DOCUMENT
Appendix C. Coating Source Examples04/01 C.1-1
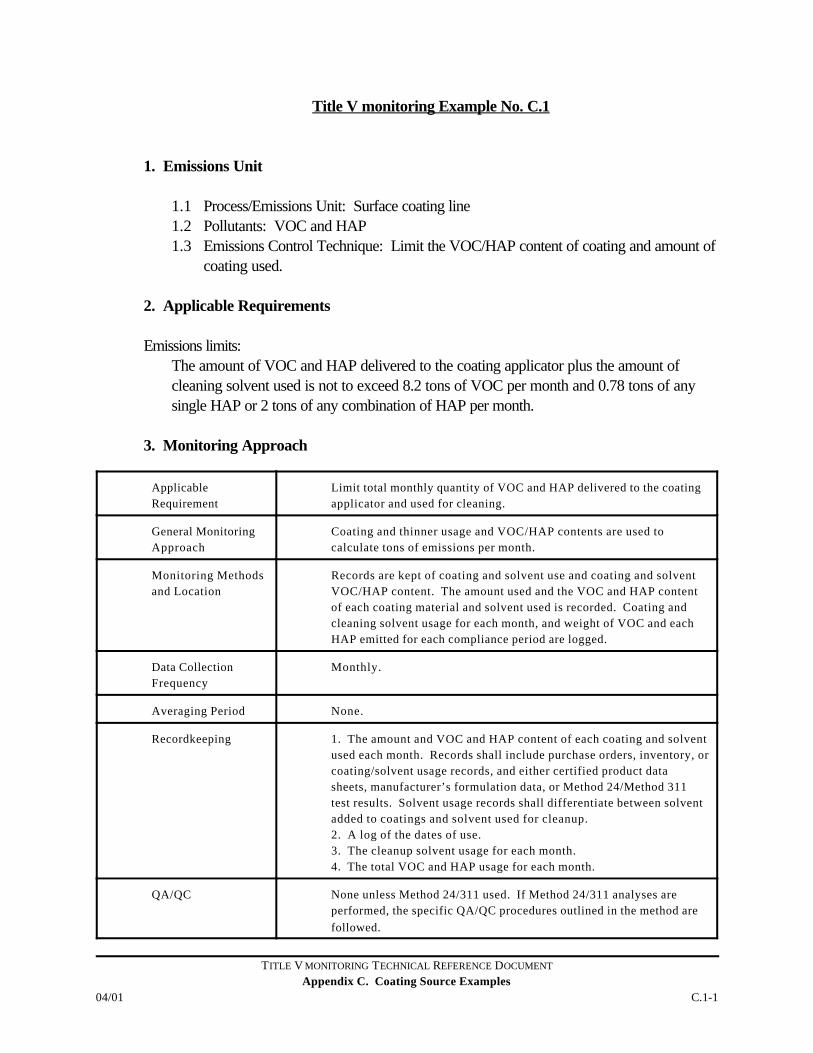
Title V monitoring Example No. C.1
1. Emissions Unit
1.1 Process/Emissions Unit: Surface coating line1.2 Pollutants: VOC and HAP1.3 Emissions Control Technique: Limit the VOC/HAP content of coating and amount of
coating used.
2. Applicable Requirements
Emissions limits:The amount of VOC and HAP delivered to the coating applicator plus the amount ofcleaning solvent used is not to exceed 8.2 tons of VOC per month and 0.78 tons of anysingle HAP or 2 tons of any combination of HAP per month.
3. Monitoring Approach
ApplicableRequirement
Limit total monthly quantity of VOC and HAP delivered to the coatingapplicator and used for cleaning.
General MonitoringApproach
Coating and thinner usage and VOC/HAP contents are used tocalculate tons of emissions per month.
Monitoring Methodsand Location
Records are kept of coating and solvent use and coating and solventVOC/HAP content. The amount used and the VOC and HAP contentof each coating material and solvent used is recorded. Coating andcleaning solvent usage for each month, and weight of VOC and eachHAP emitted for each compliance period are logged.
Data CollectionFrequency
Monthly.
Averaging Period None.
Recordkeeping 1. The amount and VOC and HAP content of each coating and solventused each month. Records shall include purchase orders, inventory, orcoating/solvent usage records, and either certified product datasheets, manufacturer’s formulation data, or Method 24/Method 311test results. Solvent usage records shall differentiate between solventadded to coatings and solvent used for cleanup.2. A log of the dates of use.3. The cleanup solvent usage for each month.4. The total VOC and HAP usage for each month.
QA/QC None unless Method 24/311 used. If Method 24/311 analyses areperformed, the specific QA/QC procedures outlined in the method arefollowed.
TITLE V MONITORING TECHNICAL REFERENCE DOCUMENT
Appendix C. Coating Source ExamplesC.1-2 04/01
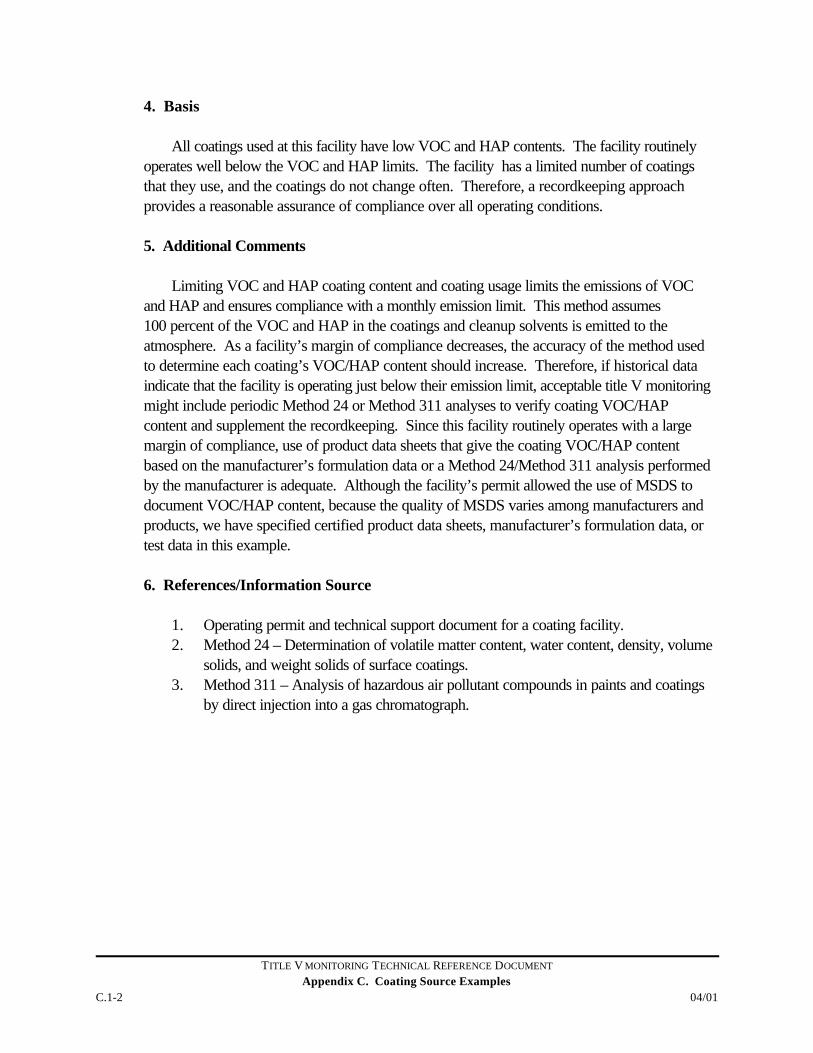
4. Basis
All coatings used at this facility have low VOC and HAP contents. The facility routinelyoperates well below the VOC and HAP limits. The facility has a limited number of coatingsthat they use, and the coatings do not change often. Therefore, a recordkeeping approachprovides a reasonable assurance of compliance over all operating conditions.
5. Additional Comments
Limiting VOC and HAP coating content and coating usage limits the emissions of VOCand HAP and ensures compliance with a monthly emission limit. This method assumes100 percent of the VOC and HAP in the coatings and cleanup solvents is emitted to theatmosphere. As a facility’s margin of compliance decreases, the accuracy of the method usedto determine each coating’s VOC/HAP content should increase. Therefore, if historical dataindicate that the facility is operating just below their emission limit, acceptable title V monitoringmight include periodic Method 24 or Method 311 analyses to verify coating VOC/HAPcontent and supplement the recordkeeping. Since this facility routinely operates with a largemargin of compliance, use of product data sheets that give the coating VOC/HAP contentbased on the manufacturer’s formulation data or a Method 24/Method 311 analysis performedby the manufacturer is adequate. Although the facility’s permit allowed the use of MSDS todocument VOC/HAP content, because the quality of MSDS varies among manufacturers andproducts, we have specified certified product data sheets, manufacturer’s formulation data, ortest data in this example.
6. References/Information Source
1. Operating permit and technical support document for a coating facility.2. Method 24 – Determination of volatile matter content, water content, density, volume
solids, and weight solids of surface coatings.3. Method 311 – Analysis of hazardous air pollutant compounds in paints and coatings
by direct injection into a gas chromatograph.
TITLE V MONITORING TECHNICAL REFERENCE DOCUMENT
Appendix C. Coating Source Examples04/01 C.2-1
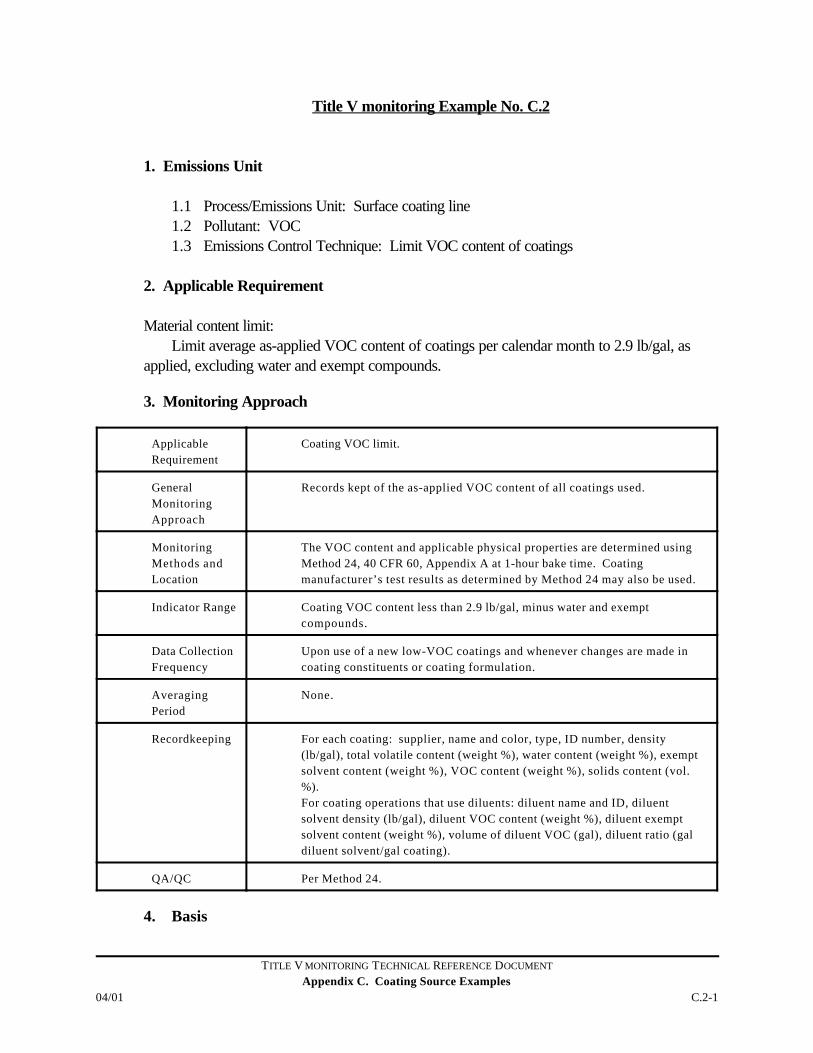
Title V monitoring Example No. C.2
1. Emissions Unit
1.1 Process/Emissions Unit: Surface coating line1.2 Pollutant: VOC1.3 Emissions Control Technique: Limit VOC content of coatings
2. Applicable Requirement
Material content limit:Limit average as-applied VOC content of coatings per calendar month to 2.9 lb/gal, as
applied, excluding water and exempt compounds.
3. Monitoring Approach
ApplicableRequirement
Coating VOC limit.
GeneralMonitoringApproach
Records kept of the as-applied VOC content of all coatings used.
MonitoringMethods andLocation
The VOC content and applicable physical properties are determined usingMethod 24, 40 CFR 60, Appendix A at 1-hour bake time. Coatingmanufacturer’s test results as determined by Method 24 may also be used.
Indicator Range Coating VOC content less than 2.9 lb/gal, minus water and exemptcompounds.
Data CollectionFrequency
Upon use of a new low-VOC coatings and whenever changes are made incoating constituents or coating formulation.
AveragingPeriod
None.
Recordkeeping For each coating: supplier, name and color, type, ID number, density(lb/gal), total volatile content (weight %), water content (weight %), exemptsolvent content (weight %), VOC content (weight %), solids content (vol.%).For coating operations that use diluents: diluent name and ID, diluentsolvent density (lb/gal), diluent VOC content (weight %), diluent exemptsolvent content (weight %), volume of diluent VOC (gal), diluent ratio (galdiluent solvent/gal coating).
QA/QC Per Method 24.
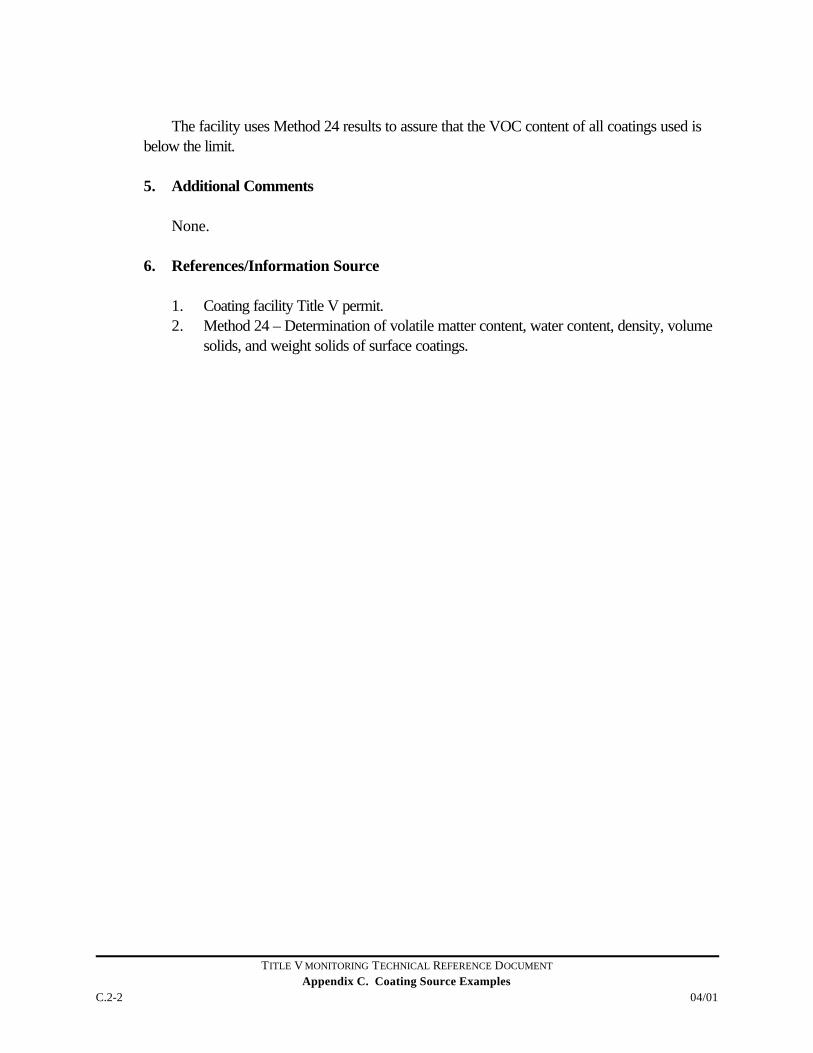
4. Basis
TITLE V MONITORING TECHNICAL REFERENCE DOCUMENT
Appendix C. Coating Source ExamplesC.2-2 04/01
The facility uses Method 24 results to assure that the VOC content of all coatings used isbelow the limit.
5. Additional Comments
None.
6. References/Information Source
1. Coating facility Title V permit.2. Method 24 – Determination of volatile matter content, water content, density, volume
solids, and weight solids of surface coatings.

APPENDIX D. OTHER VOC SOURCE EXAMPLES
TITLE V MONITORING TECHNICAL REFERENCE DOCUMENT
Appendix D. Other VOC Source Examples04/01 D.1-1
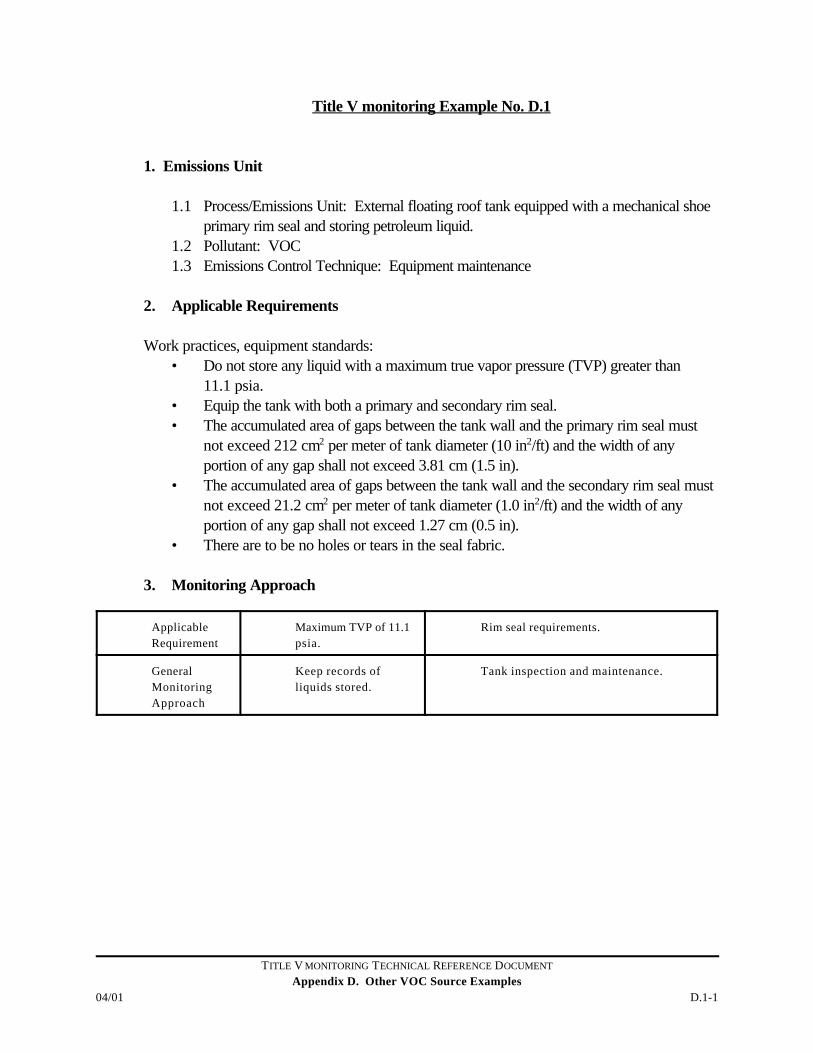
Title V monitoring Example No. D.1
1. Emissions Unit
1.1 Process/Emissions Unit: External floating roof tank equipped with a mechanical shoeprimary rim seal and storing petroleum liquid.
1.2 Pollutant: VOC1.3 Emissions Control Technique: Equipment maintenance
2. Applicable Requirements
Work practices, equipment standards:• Do not store any liquid with a maximum true vapor pressure (TVP) greater than
11.1 psia. • Equip the tank with both a primary and secondary rim seal. • The accumulated area of gaps between the tank wall and the primary rim seal must
not exceed 212 cm2 per meter of tank diameter (10 in2/ft) and the width of anyportion of any gap shall not exceed 3.81 cm (1.5 in).
• The accumulated area of gaps between the tank wall and the secondary rim seal mustnot exceed 21.2 cm2 per meter of tank diameter (1.0 in2/ft) and the width of anyportion of any gap shall not exceed 1.27 cm (0.5 in).
• There are to be no holes or tears in the seal fabric.
3. Monitoring Approach
ApplicableRequirement
Maximum TVP of 11.1psia.
Rim seal requirements.
GeneralMonitoringApproach
Keep records ofliquids stored.
Tank inspection and maintenance.
TITLE V MONITORING TECHNICAL REFERENCE DOCUMENT
Appendix D. Other VOC Source ExamplesD.1-2 04/01
MonitoringMethods andLocation
Determined maximumTVP using standardreference texts orASTM MethodD2879-83.
Measure the seal gaps per 40 CFR60.113(a) and inspect the roof and seal forthe following defects:• The floating roof is not resting on the
surface of the liquid;• There is petroleum liquid
accumulated on the surface of thefloating roof;
• The seal is detached from the floatingroof; or
• There are tears or holes in the sealfabric.
Repair within 45 days or remove tank fromservice.
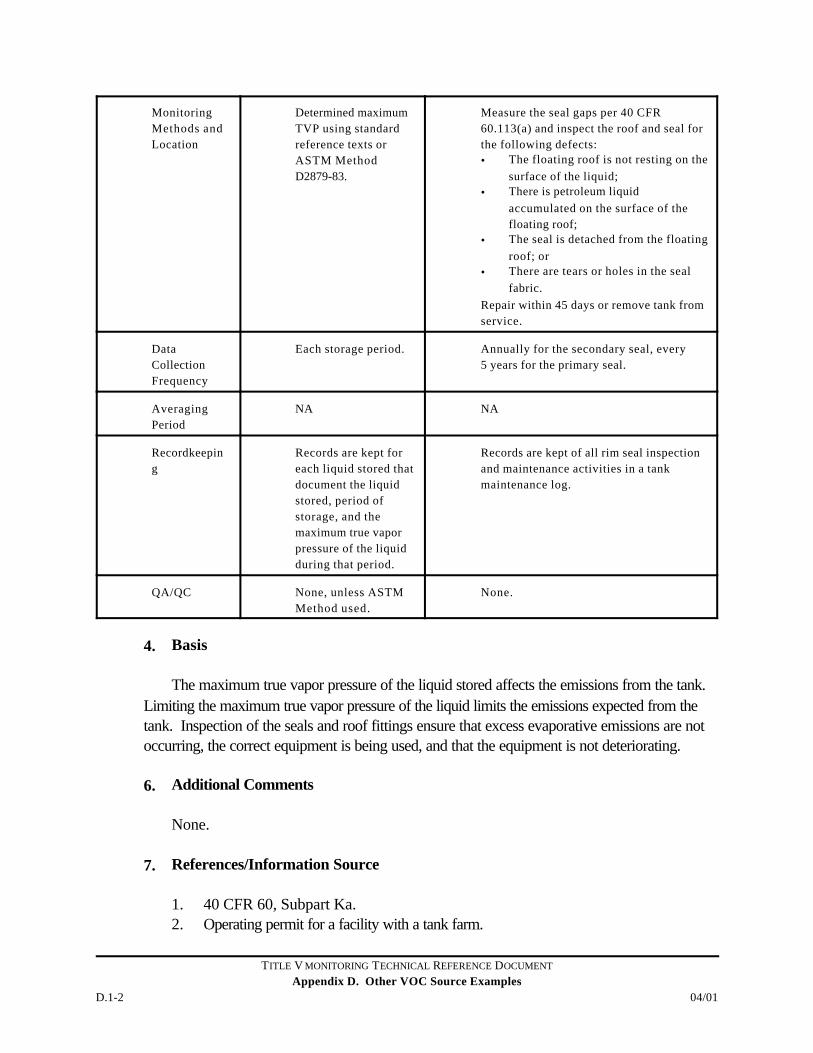
DataCollectionFrequency
Each storage period. Annually for the secondary seal, every5 years for the primary seal.
AveragingPeriod
NA NA
Recordkeeping
Records are kept foreach liquid stored thatdocument the liquidstored, period ofstorage, and themaximum true vaporpressure of the liquidduring that period.
Records are kept of all rim seal inspectionand maintenance activities in a tankmaintenance log.
QA/QC None, unless ASTMMethod used.
None.
4. Basis
The maximum true vapor pressure of the liquid stored affects the emissions from the tank. Limiting the maximum true vapor pressure of the liquid limits the emissions expected from the tank. Inspection of the seals and roof fittings ensure that excess evaporative emissions are notoccurring, the correct equipment is being used, and that the equipment is not deteriorating.
6. Additional Comments
None.
7. References/Information Source
1. 40 CFR 60, Subpart Ka.2. Operating permit for a facility with a tank farm.
TITLE V MONITORING TECHNICAL REFERENCE DOCUMENT
Appendix D. Other VOC Source Examples04/01 D.1-3
3. ASTM D2879, Standard Test Method for Vapor Pressure-TemperatureRelationship and Initial Decomposition Temperature of Liquids by Isoteniscope.
TITLE V MONITORING TECHNICAL REFERENCE DOCUMENT
Appendix D. Other VOC Source Examples04/01 D.2-1
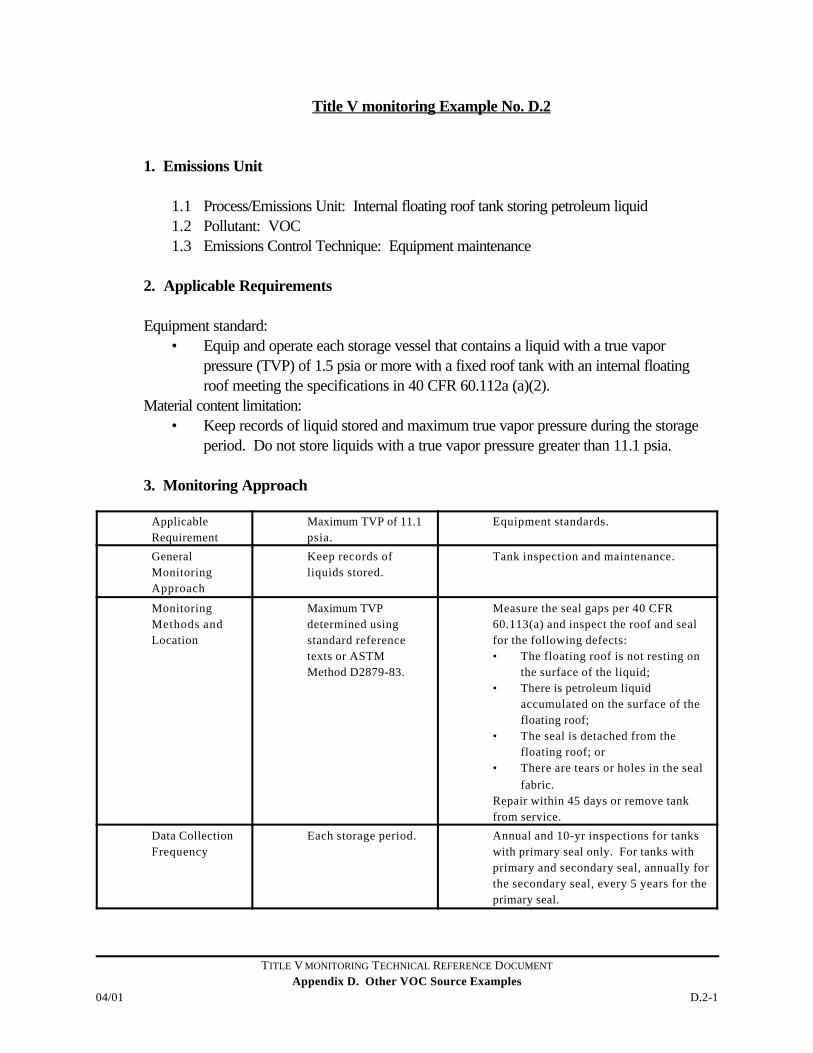
Title V monitoring Example No. D.2
1. Emissions Unit
1.1 Process/Emissions Unit: Internal floating roof tank storing petroleum liquid1.2 Pollutant: VOC1.3 Emissions Control Technique: Equipment maintenance
2. Applicable Requirements
Equipment standard:• Equip and operate each storage vessel that contains a liquid with a true vapor
pressure (TVP) of 1.5 psia or more with a fixed roof tank with an internal floatingroof meeting the specifications in 40 CFR 60.112a (a)(2).
Material content limitation:• Keep records of liquid stored and maximum true vapor pressure during the storage
period. Do not store liquids with a true vapor pressure greater than 11.1 psia.
3. Monitoring Approach
ApplicableRequirement
Maximum TVP of 11.1psia.
Equipment standards.
GeneralMonitoringApproach
Keep records ofliquids stored.
Tank inspection and maintenance.
MonitoringMethods andLocation
Maximum TVPdetermined usingstandard referencetexts or ASTMMethod D2879-83.
Measure the seal gaps per 40 CFR60.113(a) and inspect the roof and sealfor the following defects:• The floating roof is not resting on
the surface of the liquid;• There is petroleum liquid
accumulated on the surface of thefloating roof;
• The seal is detached from thefloating roof; or
• There are tears or holes in the sealfabric.
Repair within 45 days or remove tankfrom service.
Data CollectionFrequency
Each storage period. Annual and 10-yr inspections for tankswith primary seal only. For tanks withprimary and secondary seal, annually forthe secondary seal, every 5 years for theprimary seal.
TITLE V MONITORING TECHNICAL REFERENCE DOCUMENT
Appendix D. Other VOC Source ExamplesD.2-2 04/01
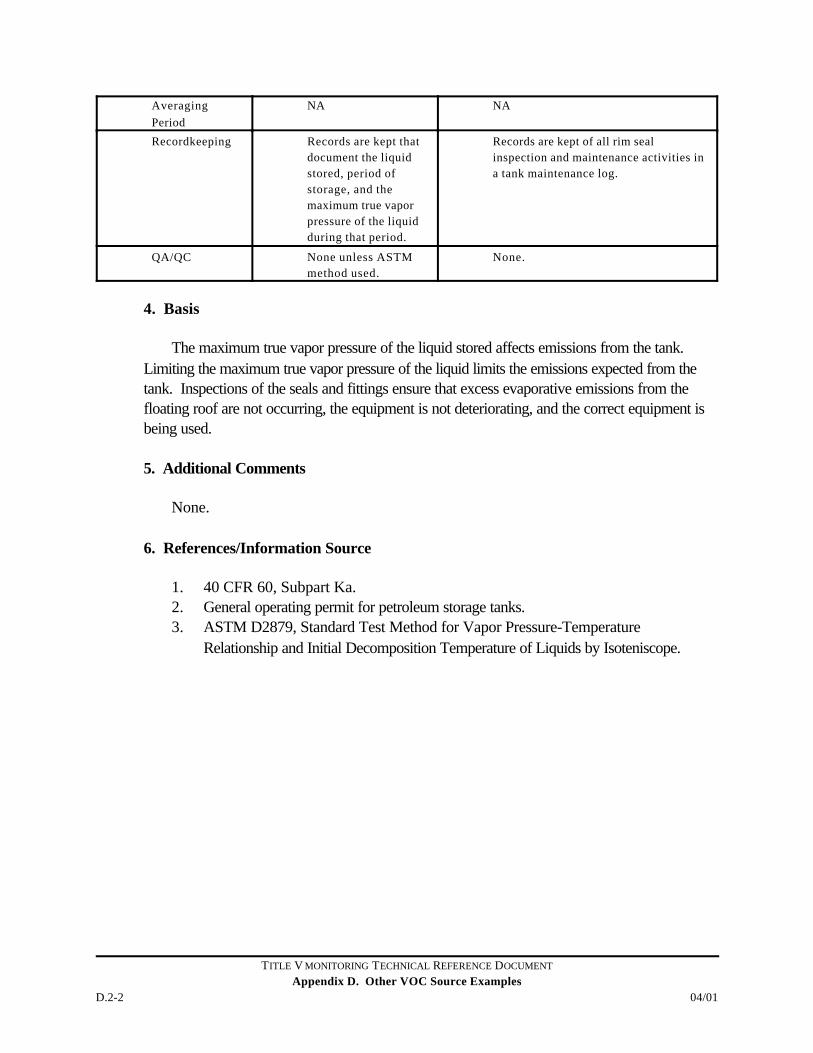
AveragingPeriod
NA NA
Recordkeeping Records are kept thatdocument the liquidstored, period ofstorage, and themaximum true vaporpressure of the liquidduring that period.
Records are kept of all rim sealinspection and maintenance activities ina tank maintenance log.
QA/QC None unless ASTMmethod used.
None.
4. Basis
The maximum true vapor pressure of the liquid stored affects emissions from the tank. Limiting the maximum true vapor pressure of the liquid limits the emissions expected from thetank. Inspections of the seals and fittings ensure that excess evaporative emissions from thefloating roof are not occurring, the equipment is not deteriorating, and the correct equipment isbeing used.
5. Additional Comments
None.
6. References/Information Source
1. 40 CFR 60, Subpart Ka.2. General operating permit for petroleum storage tanks.3. ASTM D2879, Standard Test Method for Vapor Pressure-Temperature
Relationship and Initial Decomposition Temperature of Liquids by Isoteniscope.
TITLE V MONITORING TECHNICAL REFERENCE DOCUMENT
Appendix D. Other VOC Source Examples04/01 D.3-1
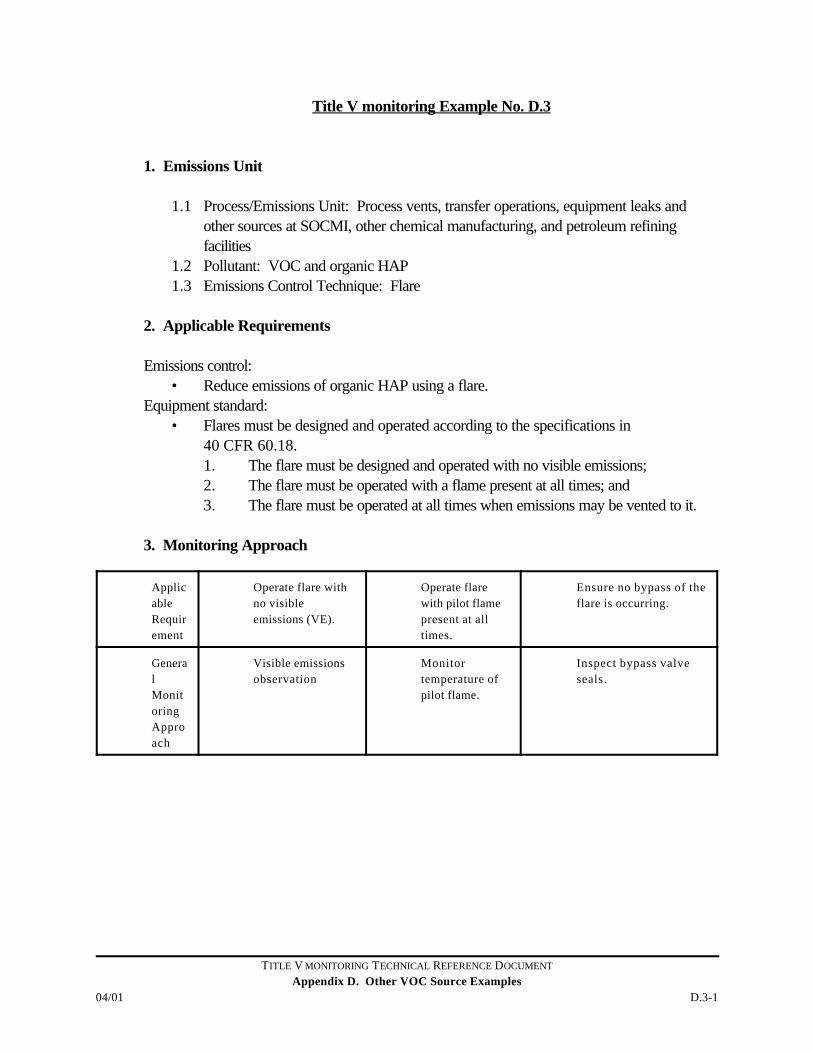
Title V monitoring Example No. D.3
1. Emissions Unit
1.1 Process/Emissions Unit: Process vents, transfer operations, equipment leaks andother sources at SOCMI, other chemical manufacturing, and petroleum refiningfacilities
1.2 Pollutant: VOC and organic HAP 1.3 Emissions Control Technique: Flare
2. Applicable Requirements
Emissions control:• Reduce emissions of organic HAP using a flare.
Equipment standard:• Flares must be designed and operated according to the specifications in
40 CFR 60.18.1. The flare must be designed and operated with no visible emissions;2. The flare must be operated with a flame present at all times; and3. The flare must be operated at all times when emissions may be vented to it.
3. Monitoring Approach
ApplicableRequirement
Operate flare withno visibleemissions (VE).
Operate flarewith pilot flamepresent at alltimes.
Ensure no bypass of theflare is occurring.
GeneralMonitoringApproach
Visible emissionsobservation
Monitortemperature ofpilot flame.
Inspect bypass valveseals.
TITLE V MONITORING TECHNICAL REFERENCE DOCUMENT
Appendix D. Other VOC Source ExamplesD.3-2 04/01
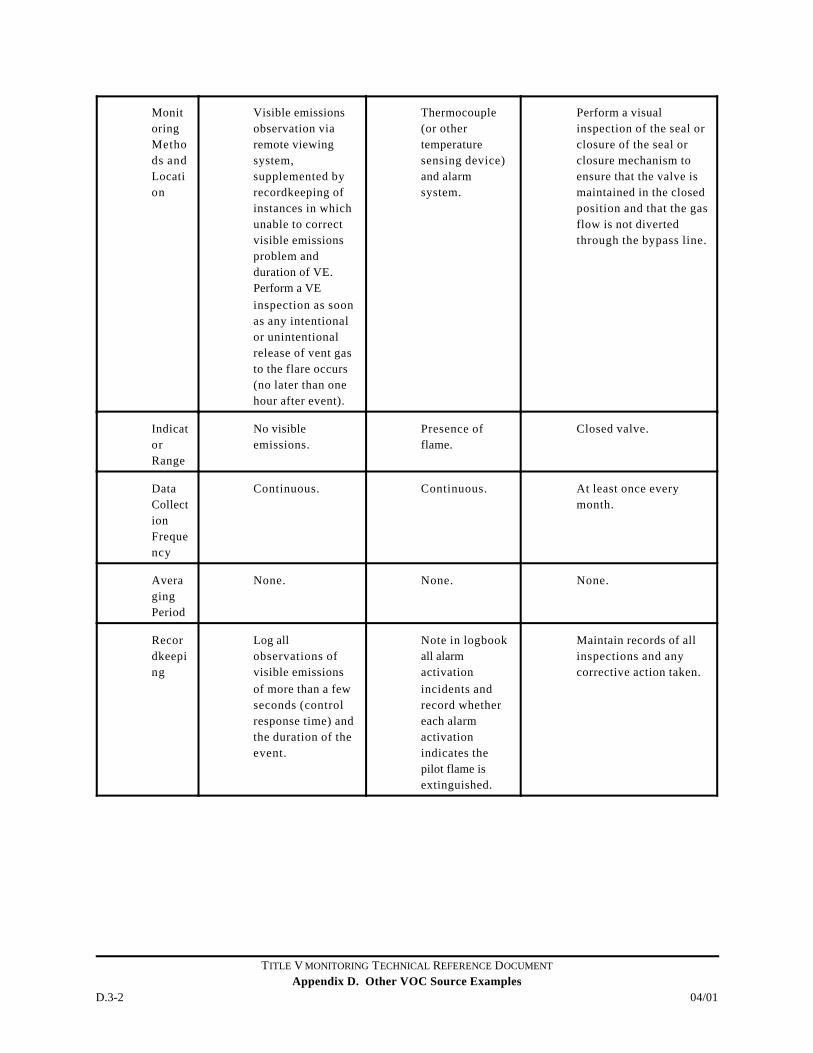
MonitoringMethods andLocation
Visible emissionsobservation viaremote viewingsystem,supplemented byrecordkeeping ofinstances in whichunable to correctvisible emissionsproblem andduration of VE. Perform a VEinspection as soonas any intentionalor unintentionalrelease of vent gasto the flare occurs(no later than onehour after event).
Thermocouple(or othertemperaturesensing device)and alarmsystem.
Perform a visualinspection of the seal orclosure of the seal orclosure mechanism toensure that the valve ismaintained in the closedposition and that the gasflow is not divertedthrough the bypass line.
IndicatorRange
No visibleemissions.
Presence offlame.
Closed valve.
DataCollectionFrequency
Continuous. Continuous. At least once everymonth.
AveragingPeriod
None. None. None.
Recordkeeping
Log allobservations ofvisible emissionsof more than a fewseconds (controlresponse time) andthe duration of theevent.
Note in logbookall alarmactivationincidents andrecord whethereach alarmactivationindicates thepilot flame isextinguished.
Maintain records of allinspections and anycorrective action taken.
TITLE V MONITORING TECHNICAL REFERENCE DOCUMENT
Appendix D. Other VOC Source Examples04/01 D.3-3
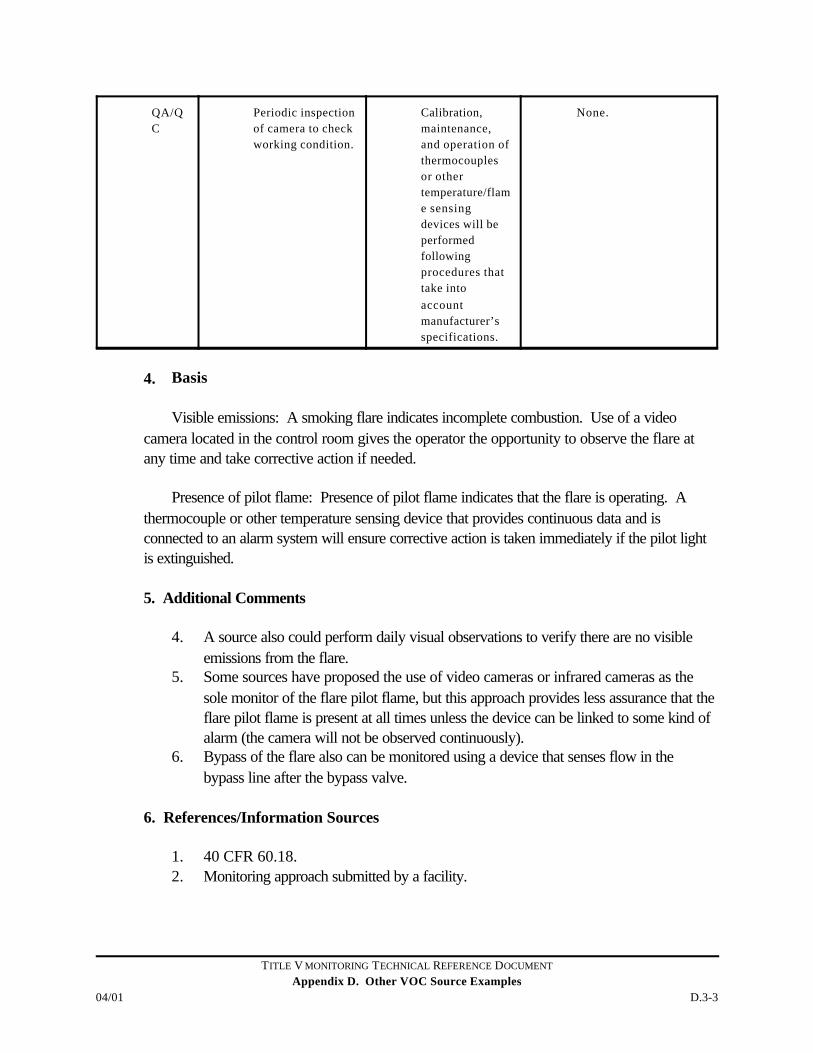
QA/QC
Periodic inspectionof camera to checkworking condition.
Calibration,maintenance,and operation ofthermocouplesor othertemperature/flame sensingdevices will beperformedfollowingprocedures thattake intoaccountmanufacturer’sspecifications.
None.
4. Basis
Visible emissions: A smoking flare indicates incomplete combustion. Use of a videocamera located in the control room gives the operator the opportunity to observe the flare atany time and take corrective action if needed.
Presence of pilot flame: Presence of pilot flame indicates that the flare is operating. Athermocouple or other temperature sensing device that provides continuous data and isconnected to an alarm system will ensure corrective action is taken immediately if the pilot lightis extinguished.
5. Additional Comments
4. A source also could perform daily visual observations to verify there are no visibleemissions from the flare.
5. Some sources have proposed the use of video cameras or infrared cameras as thesole monitor of the flare pilot flame, but this approach provides less assurance that theflare pilot flame is present at all times unless the device can be linked to some kind ofalarm (the camera will not be observed continuously).
6. Bypass of the flare also can be monitored using a device that senses flow in thebypass line after the bypass valve.
6. References/Information Sources
1. 40 CFR 60.18.2. Monitoring approach submitted by a facility.

TITLE V MONITORING TECHNICAL REFERENCE DOCUMENT
Appendix D. Other VOC Source Examples04/01 D.3-5
APPENDIX E. OTHER PM SOURCE EXAMPLES
TITLE V MONITORING TECHNICAL REFERENCE DOCUMENT
Appendix E. Other PM Source Examples04/01 E.1-1
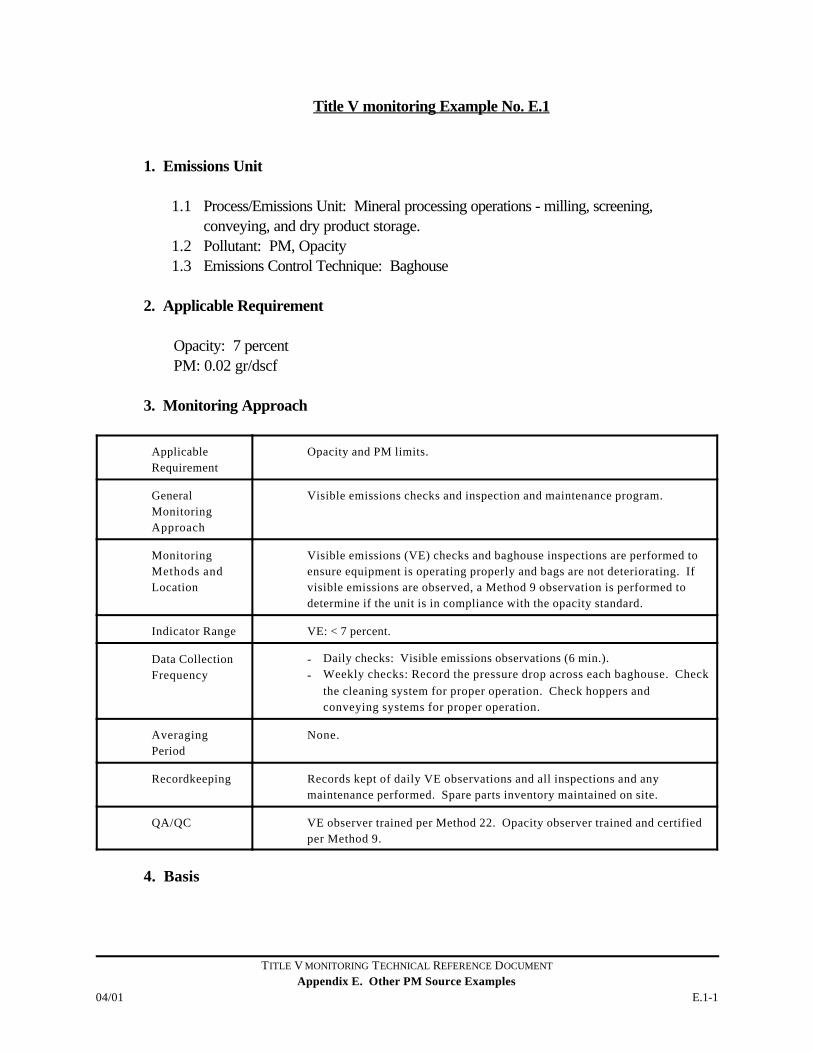
Title V monitoring Example No. E.1
1. Emissions Unit
1.1 Process/Emissions Unit: Mineral processing operations - milling, screening,conveying, and dry product storage.
1.2 Pollutant: PM, Opacity1.3 Emissions Control Technique: Baghouse
2. Applicable Requirement
Opacity: 7 percentPM: 0.02 gr/dscf
3. Monitoring Approach
ApplicableRequirement
Opacity and PM limits.
GeneralMonitoringApproach
Visible emissions checks and inspection and maintenance program.
MonitoringMethods andLocation
Visible emissions (VE) checks and baghouse inspections are performed toensure equipment is operating properly and bags are not deteriorating. Ifvisible emissions are observed, a Method 9 observation is performed todetermine if the unit is in compliance with the opacity standard.
Indicator Range VE: < 7 percent.
Data CollectionFrequency
- Daily checks: Visible emissions observations (6 min.).- Weekly checks: Record the pressure drop across each baghouse. Check
the cleaning system for proper operation. Check hoppers andconveying systems for proper operation.
AveragingPeriod
None.
Recordkeeping Records kept of daily VE observations and all inspections and anymaintenance performed. Spare parts inventory maintained on site.
QA/QC VE observer trained per Method 22. Opacity observer trained and certifiedper Method 9.
4. Basis
TITLE V MONITORING TECHNICAL REFERENCE DOCUMENT
Appendix E. Other PM Source ExamplesE.1-2 04/01
A frequent inspection of a baghouse and its components will insure that it continues tooperate properly and achieve the desired PM control efficiency. The absence of visibleemissions also is a good indicator of low emissions. If visible emissions are observed, aMethod 9 observation will ensure compliance with the opacity standard.
5. Additional Comments
Note that the pre-control emissions from this unit are less than 100 tons per year, so CAMdoes not apply.
6. References/Information Source
1. Operating permit for a clay processing facility.2. Method 9 – Visual determination of the opacity of emissions from stationary sources.3. Method 22 – Visual determination of fugitive emissions from material sources and
smoke emissions from flares.
TITLE V MONITORING TECHNICAL REFERENCE DOCUMENT
Appendix E. Other PM Source Examples04/01 E.2-1
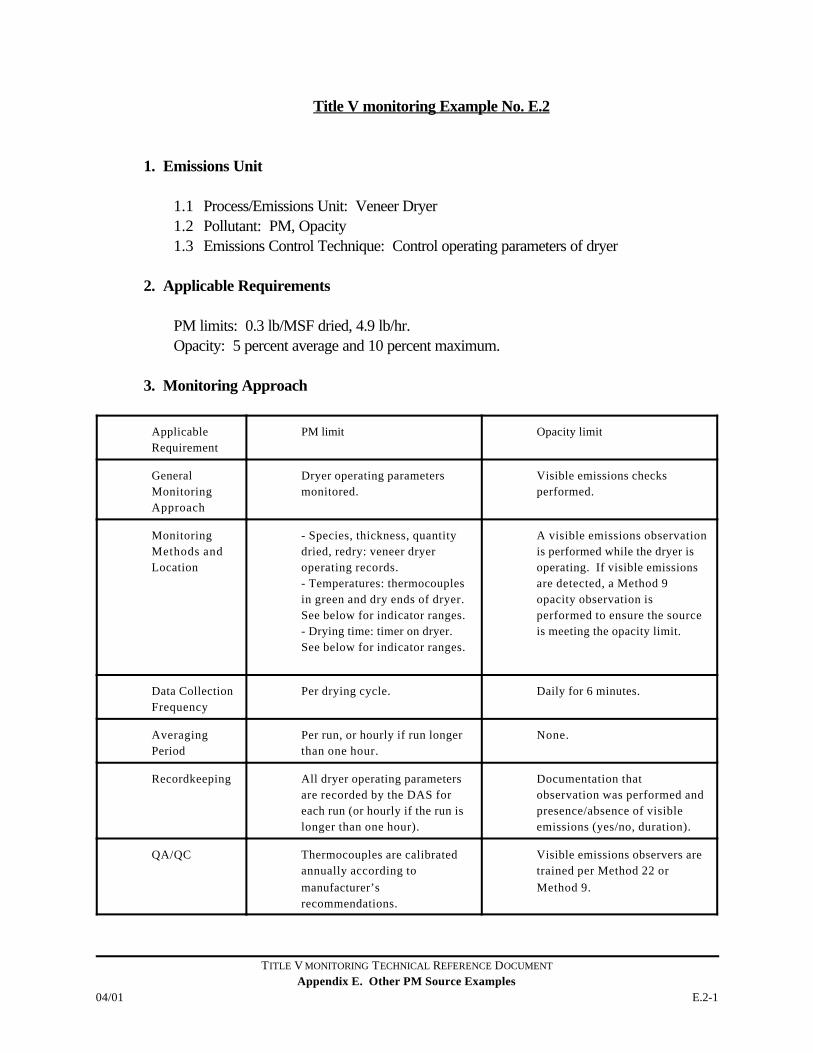
Title V monitoring Example No. E.2
1. Emissions Unit
1.1 Process/Emissions Unit: Veneer Dryer1.2 Pollutant: PM, Opacity1.3 Emissions Control Technique: Control operating parameters of dryer
2. Applicable Requirements
PM limits: 0.3 lb/MSF dried, 4.9 lb/hr.Opacity: 5 percent average and 10 percent maximum.
3. Monitoring Approach
ApplicableRequirement
PM limit Opacity limit
GeneralMonitoringApproach
Dryer operating parametersmonitored.
Visible emissions checksperformed.
MonitoringMethods andLocation
- Species, thickness, quantitydried, redry: veneer dryeroperating records.- Temperatures: thermocouplesin green and dry ends of dryer. See below for indicator ranges.- Drying time: timer on dryer. See below for indicator ranges.
A visible emissions observationis performed while the dryer isoperating. If visible emissionsare detected, a Method 9opacity observation isperformed to ensure the sourceis meeting the opacity limit.
Data CollectionFrequency
Per drying cycle. Daily for 6 minutes.
AveragingPeriod
Per run, or hourly if run longerthan one hour.
None.
Recordkeeping All dryer operating parametersare recorded by the DAS foreach run (or hourly if the run islonger than one hour).
Documentation thatobservation was performed andpresence/absence of visibleemissions (yes/no, duration).
QA/QC Thermocouples are calibratedannually according tomanufacturer’srecommendations.
Visible emissions observers aretrained per Method 22 orMethod 9.
TITLE V MONITORING TECHNICAL REFERENCE DOCUMENT
Appendix E. Other PM Source ExamplesE.2-2 04/01
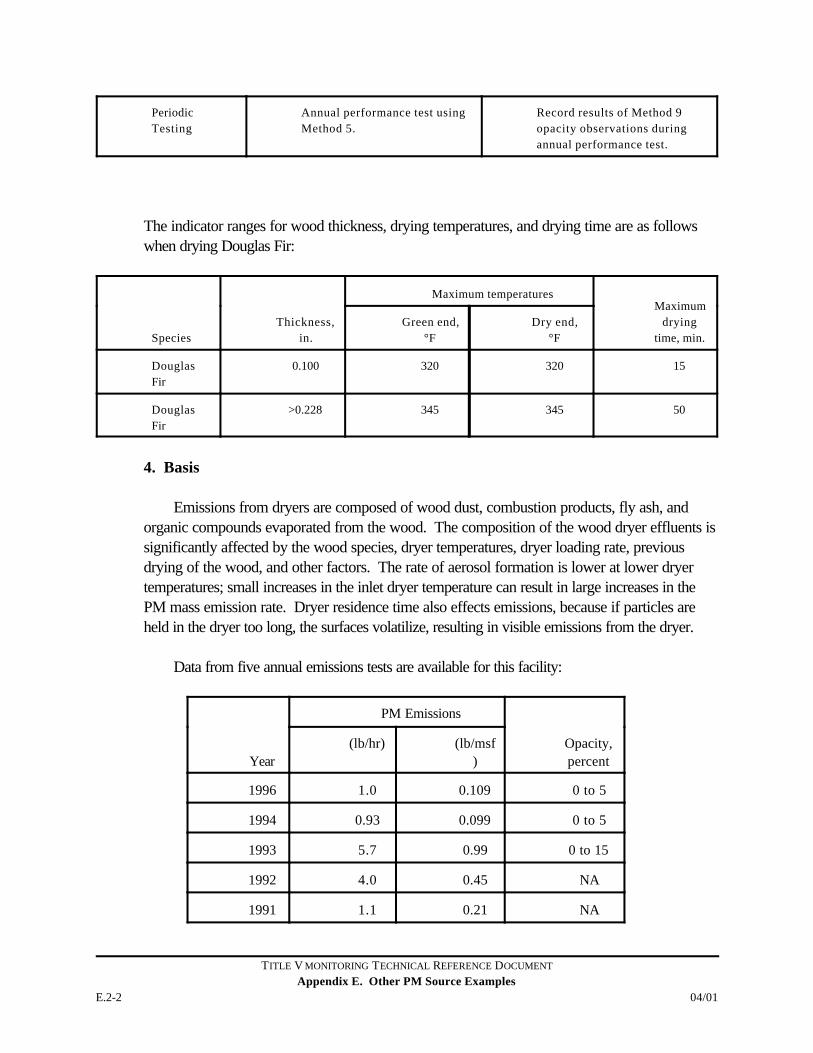
PeriodicTesting
Annual performance test usingMethod 5.
Record results of Method 9opacity observations duringannual performance test.
The indicator ranges for wood thickness, drying temperatures, and drying time are as followswhen drying Douglas Fir:
SpeciesThickness,
in.
Maximum temperaturesMaximum
dryingtime, min.
Green end,°F
Dry end,°F
DouglasFir
0.100 320 320 15
DouglasFir
>0.228 345 345 50
4. Basis
Emissions from dryers are composed of wood dust, combustion products, fly ash, andorganic compounds evaporated from the wood. The composition of the wood dryer effluents issignificantly affected by the wood species, dryer temperatures, dryer loading rate, previousdrying of the wood, and other factors. The rate of aerosol formation is lower at lower dryertemperatures; small increases in the inlet dryer temperature can result in large increases in thePM mass emission rate. Dryer residence time also effects emissions, because if particles areheld in the dryer too long, the surfaces volatilize, resulting in visible emissions from the dryer.
Data from five annual emissions tests are available for this facility:
Year
PM Emissions
Opacity,percent
(lb/hr) (lb/msf)
1996 1.0 0.109 0 to 5
1994 0.93 0.099 0 to 5
1993 5.7 0.99 0 to 15
1992 4.0 0.45 NA
1991 1.1 0.21 NA
TITLE V MONITORING TECHNICAL REFERENCE DOCUMENT
Appendix E. Other PM Source Examples04/01 E.2-3
Three of the five emissions tests (including the two most recent tests) indicate the facilityoperates well within the emissions limits. One test indicates the facility meets the lb/hr limit, butexceeds the lb/msf limit. The 1993 test indicates the source was not in compliance with the limiton either basis. However, the results of this test are suspect. The measured PM concentrationsfor this test were consistent with the reported values for all the other tests, but the measuredflow rates were significantly higher. The opacity measurements taken during the performancetests indicate the unit is in compliance with the opacity limit (except for one 15-secondobservation that exceeded the maximum limit during the 1993 test). Based on this information(and disregarding the anomalous 1993 results), maintaining dryer operating parameters withinthe established ranges provides a reasonable assurance of compliance. A daily visibleemissions observation is included in the title V monitoring as an evaluation of performance ofthe dryer and to monitor compliance with the opacity limit. Because the parametric relationshipbetween emissions and dryer operating parameters is not well known, an annual source testalso is included in the monitoring approach to verify that the relationship has not changed andthe parametric monitoring remains valid.
5. Additional Comments
In some cases, a tiered source testing frequency can be incorporated into the title Vmonitoring approach. For example, if consecutive source tests continue to show operation atless than 50 percent of the PM emissions limit, the test frequency could be reduced to biannual(or once per permit term). If the biannual source test showed operation at greater than 50percent of the PM emissions limit, the frequency would revert to yearly.
6. References/Information Source
1. Title V permit for a plywood manufacturing facility.2 Method 5 – Determination of particulate emissions from stationary sources.3. Method 9 – Visual determination of the opacity of emissions from stationary sources.4. Method 22 – Visual determination of fugitive emissions from material sources and
smoke emissions from flares.