Embed Size (px)
Citation preview

Appendices: National- and State-Level Estimates of WIC Eligibility and
WIC Program Reach in 2017
Final Report: Volume II
Contract: GS-10F-0136X Order: AG-3198-D-16-0095/0002
December 2019
Authors
Kelsey Gray, Carole Trippe, Chrystine Tadler, and Clay Perry (Insight Policy Research) Paul Johnson (Urban Institute)
David Betson (University of Notre Dame)
Submitted to
USDA Food and Nutrition Service Contracts Management Division 3101 Park Center Drive Alexandria, VA 22302
Project Officer
Grant Lovellette
Submitted by
Insight Policy Research, Inc. 1901 North Moore Street Suite 1100 Arlington, VA 22209
Project Director
Carole Trippe
Insight ▪ Volume II: National- and State-Level Estimates of WIC Eligibility and WIC Program Reach in 2017:
Final Report
Acknowledgements
Many Insight Policy Research (Insight) colleagues made key contributions to this report. In particular, we thank Jeff Marr and Sarah Hong, whose work preparing and reviewing the tables and figures was invaluable. We also thank Betsy Thorn and Sidra Montgomery for their careful review and comments on the report. Dar Haddix edited the report, and Kim Kerson provided graphics and final production.
USDA is an equal opportunity provider, employer, and lender.
Th e authors gratefully acknowledge the guidance provided by numerous individuals at the Food and Nutrition Service (FNS) and other organizations. Grant Lovellette, the FNS Project Officer, provided leadership and
guidance throughout the project. We also thank the FNS and WIC staff who provided insight and review throughout the project. Staff members of the Centers for Disease Control and Prevention supplied tabulations of national- and State-level breastfeeding rates from the National Immunization Survey.
Insight ▪ Volume II: National- and State-Level Estimates of WIC Eligibility and WIC Program Reach in 2017:
Final Report
Contents
Appendix A. Detailed Tables for National WIC Estimates: CY 2017 ...................................................................... A-1
Table A.1. Steps, Data Sources, Methods, and Adjustment Factors Used for 2017 Estimates of WIC
Eligibility ...................................................................................................................................................... A-4
Table A.2. Estimated Average Monthly Number of Individuals Eligible for WIC by Participant Category:
CY 2017 ....................................................................................................................................................... A-7
Table A.3a. Four-Year Accumulations of U.S. Census Bureau Estimates and CPS-ASEC Estimates for
Infants and Children by Year of Age, Race, and Gender: March 2015–March 2018 ....................................... A-8
Table A.3b. U.S. Census Bureau Estimates and CPS-ASEC Estimates for Infants and Children by Year of
Age, Race, and Gender: CY 2017 ................................................................................................................ A-11
Table A.3c. Effects of Applying Population Adjustment Factors to Population Counts for Infants and
Children in the 2018 CPS-ASEC by Year of Age, Race, and Gender .............................................................. A-13
Table A.4. Breastfeeding Adjustment Factor Calculations for Postpartum Women Eligible for WIC:
CY 2005–CY 2017 ....................................................................................................................................... A-15
Table A.5. Step-by-Step Adjustments Applied to CPS-ASEC Data to Derive the Average Monthly Number
of Individuals Eligible for WIC by Participant Category: CY 2017 ................................................................. A-17
Table A.6a1. Estimated Average Monthly Numbers of Infants, and Children by Year of Age, Eligible
for WIC by Demographic and Income Characteristics and Adjunctive Eligibility: CY 2017 (Unadjusted
Weights, Counts) ....................................................................................................................................... A-19
Table A.6a1 (continued). Estimated Average Monthly Numbers of Infants, and Children by Year of Age,
Eligible for WIC by Demographic and Income Characteristics and Adjunctive Eligibility: CY 2017
(Unadjusted Weights, Counts) ................................................................................................................... A-21
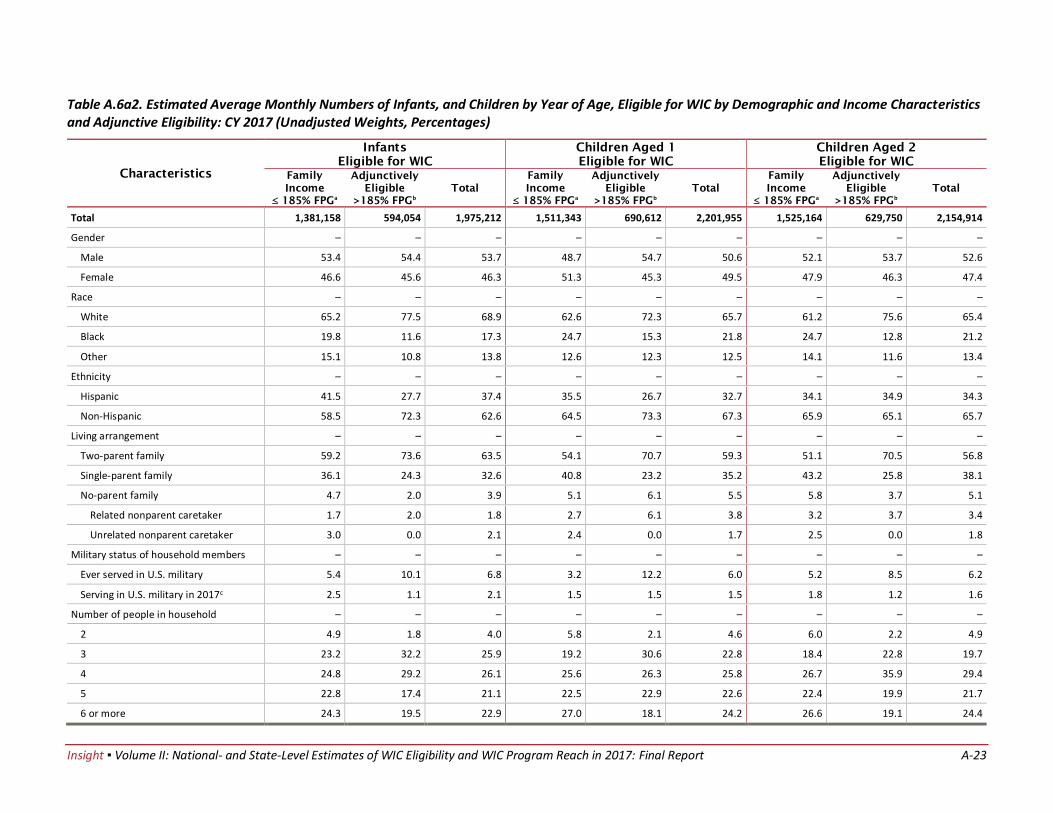
Table A.6a2. Estimated Average Monthly Numbers of Infants, and Children by Year of Age, Eligible
for WIC by Demographic and Income Characteristics and Adjunctive Eligibility: CY 2017 (Unadjusted
Weights, Percentages) ............................................................................................................................... A-23
Table A.6a2 (continued). Estimated Average Monthly Numbers of Infants, and Children by Year of Age,
Eligible for WIC by Demographic and Income Characteristics and Adjunctive Eligibility: CY 2017
(Unadjusted Weights, Percentages) ........................................................................................................... A-25
Table A.6b1. Estimated Average Monthly Numbers of Infants, and Children by Year of Age, Eligible for
WIC by Demographic and Income Characteristics and Adjunctive Eligibility: CY 2017 (Fully Adjusted
Weights, Counts) ....................................................................................................................................... A-27
Table A.6b1 (continued). Estimated Average Monthly Numbers of Infants, and Children by Year of Age,
Eligible for WIC by Demographic and Income Characteristics and Adjunctive Eligibility: CY 2017 (Fully
Adjusted Weights, Counts)......................................................................................................................... A-29
Insight ▪ Volume II: National- and State-Level Estimates of WIC Eligibility and WIC Program Reach in 2017:
Final Report
Table A.6b2. Estimated Average Monthly Numbers of Infants, and Children by Year of Age, Eligible for
WIC by Demographic and Income Characteristics and Adjunctive Eligibility: CY 2017 (Fully Adjusted
Weights, Percentages) ............................................................................................................................... A-31
Table A.6b2 (continued). Estimated Average Monthly Numbers of Infants, and Children by Year of
Age, Eligible for WIC by Demographic and Income Characteristics and Adjunctive Eligibility: CY 2017
(Fully Adjusted Weights, Percentages) ....................................................................................................... A-33
Table A.7. Changes in the Total Population, Total WIC Eligibility, and WIC Eligibility Rates by Participant
Category: CY 2015–CY 2017 ....................................................................................................................... A-35
Table A.8. Stepwise Comparison of Changes in Average Monthly Numbers of Infants and Children
Eligible for WIC as Estimated in the March CPS-ASEC: CY 2015–CY 2017 .................................................... A-36
Table A.9. Standard Error and Coefficient of Variation for Estimates by Participant Category: CY 2017 ...... A-38
Appendix B. Detailed Tables for State and Regional WIC Estimates: CY 2017 ...................................................... B-1
FNS Regions and the States Within Each Region ........................................................................................... B-1
Table B.1. WIC Eligibility, Participants, and Coverage Rates by State and FNS Region: CY 2017 ..................... B-3
Table B.2. WIC Eligibility, Participants, and Coverage Rates by FNS Region and States in Each Region:
CY 2017 ....................................................................................................................................................... B-5
Table B.3. WIC Eligibility, Participants, and Coverage Rates by FNS Region and Participant Category:
CY 2017 ....................................................................................................................................................... B-7
Table B.4. WIC Eligibility Standard Errors by State and FNS Region: CY 2017 ................................................ B-8
Table B.5. WIC Eligibility Standard Errors by FNS Region and States in Each Region: CY 2017 ......................B-10
Table B.6. Standard Errors for WIC Eligibility by FNS Region and Participant Category: CY 2017 ..................B-12
Table B.7a. Adjustments for Calculating the Average Monthly Number of Individuals Eligible for WIC in
Puerto Rico by Participant Category: CY 2017 .............................................................................................B-13
Table B.7b. Adjustments for Calculating the Average Monthly Number of Individuals Eligible for WIC in
the U.S. Territories Other Than Puerto Rico by Participant Category: CY 2017 .............................................B-14
Table B.8. Regional Estimates of the Average Monthly Numbers of Infants and Children Eligible for WIC
by Demographic and Income Characteristics: CY 2017 (Fully Adjusted Weights, Percentages) .....................B-15
Table B.8 (continued). Regional Estimates of the Average Monthly Numbers of Infants and Children
Eligible for WIC by Demographic and Income Characteristics: CY 2017 (Fully Adjusted Weights,
Percentages) ...............................................................................................................................................B-17
Table B.9. WIC Coverage Rates by State: CY 2005–CY 2017 .........................................................................B-19
Table B.10. WIC Coverage Rates by State and Participant Category With Margins of Error for 95-Percent
Confidence Intervals: CY 2017 .....................................................................................................................B-21
Table B.11. State-Level WIC Coverage Rates by Race and Ethnicity With Margins of Error for 95-Percent
Confidence Intervals: CY 2017 .....................................................................................................................B-24
Insight ▪ Volume II: National- and State-Level Estimates of WIC Eligibility and WIC Program Reach in 2017:
Final Report
Appendix C. Coverage Rate Maps: CY 2017 ........................................................................................................ C-1
Figure C.1. WIC Coverage Rate for Total Eligible Individuals by FNS Region: CY 2017 .................................... C-2
Figure C.2. WIC Coverage Rate for Infants by FNS Region: CY 2017 .............................................................. C-3
Figure C.3. WIC Coverage Rate for Children Aged 1–4 by FNS Region: CY 2017 ............................................. C-4
Figure C.4. WIC Coverage Rate for Pregnant Women by FNS Region: CY 2017 .............................................. C-5
Figure C.5. WIC Coverage Rate for Postpartum Women by FNS Region: CY 2017 .......................................... C-6
Figure C.6. WIC Coverage Rate for Total Eligible Individuals by State: CY 2017 ............................................. C-7
Figure C.7. WIC Coverage Rate for Infants by State: CY 2017 ........................................................................ C-8
Figure C.8. WIC Coverage Rate for Children by State: CY 2017...................................................................... C-9
Figure C.9. WIC Coverage Rate for Pregnant Women by State: CY 2017 ......................................................C-10
Figure C.10. WIC Coverage Rate for Postpartum Women by State: CY 2017 ................................................C-11
Figure C.11. WIC Coverage Rate for White-Only Non-Hispanic Individuals by State: CY 2017 .......................C-12
Figure C.12. WIC Coverage Rate for Black-Only and Other Non-Hispanic Individuals by State: CY 2017........C-13
Figure C.13. WIC Coverage Rate for Hispanic Individuals by State: CY 2017 .................................................C-14
Appendix D. Method for Calculating the Annual-to-Monthly Adjustment Factors Applied to Children for
CY 2017.............................................................................................................................................................. D-1
Procedures for the CY 2017 Estimates.......................................................................................................... D-1
Table D.1. Annual-to-Monthly Adjustment Factors Based on Month of Adoption of 12-Month
Certification ................................................................................................................................................. D-2
Table D.2. State-Level Annual-to-Monthly Adjustment Factors Used for the 2017 Estimates of Children
Eligible for WIC ............................................................................................................................................ D-3
Table D.3. Calculation of the National-Level Annual-to-Monthly Adjustment Factor Used for the National
2017 Estimates of Children Eligible for WIC .................................................................................................. D-5
Appendix E. Method for Calculating Multiple Births and Infant Deaths Factor for CY 2017 .................................. E-1
Table E.1. Adjustment Factors for Estimates of Pregnant and Postpartum Women Eligible for WIC............... E-1
Table E.2. Multiple Births and Infant Deaths Factor Adjustments for CY 2013–CY 2017 ................................. E-2
Table E.3. Change in Estimates of Pregnant and Postpartum Women Eligible for WIC Based on Updated
and Expanded Multiple Births and Infant Deaths Factor by Race and Ethnicity: CY 2017 ............................... E-2
Appendix F. Data for Figures in Volumes I and II .................................................................................................. F-1
Table F.1. Trends in WIC Eligibility by Participant Category: CY 2005–CY 2017 ............................................... F-2
Table F.2. Regional-Level WIC Eligibility by Participant Category: CY 2005–CY 2017 ...................................... F-3
Insight ▪ Volume II: National- and State-Level Estimates of WIC Eligibility and WIC Program Reach in 2017:
Final Report
Table F.3. WIC Coverage Rates by State and Participant Category: CY 2017 ................................................... F-5
Table F.4. WIC Coverage Rates by Participant Category: CY 2005–CY 2017 .................................................... F-8
Table F.5. Coverage Rates by FNS Region and Participant Category: CY 2005–CY 2017 .................................. F-9
Table F.6. WIC Eligibility, Participants, and Coverage Rates by Participant Category and by Race and
Ethnicity: CY 2017 ....................................................................................................................................... F-11
Table F.7. State-Level WIC Coverage Rates by Race and Ethnicity: CY 2017 ................................................. F-12
Table F.8. WIC Eligibility, Participants, and Coverage Rates by FNS Region and Participant Category:
CY 2017 ...................................................................................................................................................... F-14
Insight ▪ Volume II: National- and State-Level Estimates of WIC Eligibility and WIC Program Reach in 2017: A-1
Final Report
Appendix A. Detailed Tables for National WIC Estimates: CY 2017
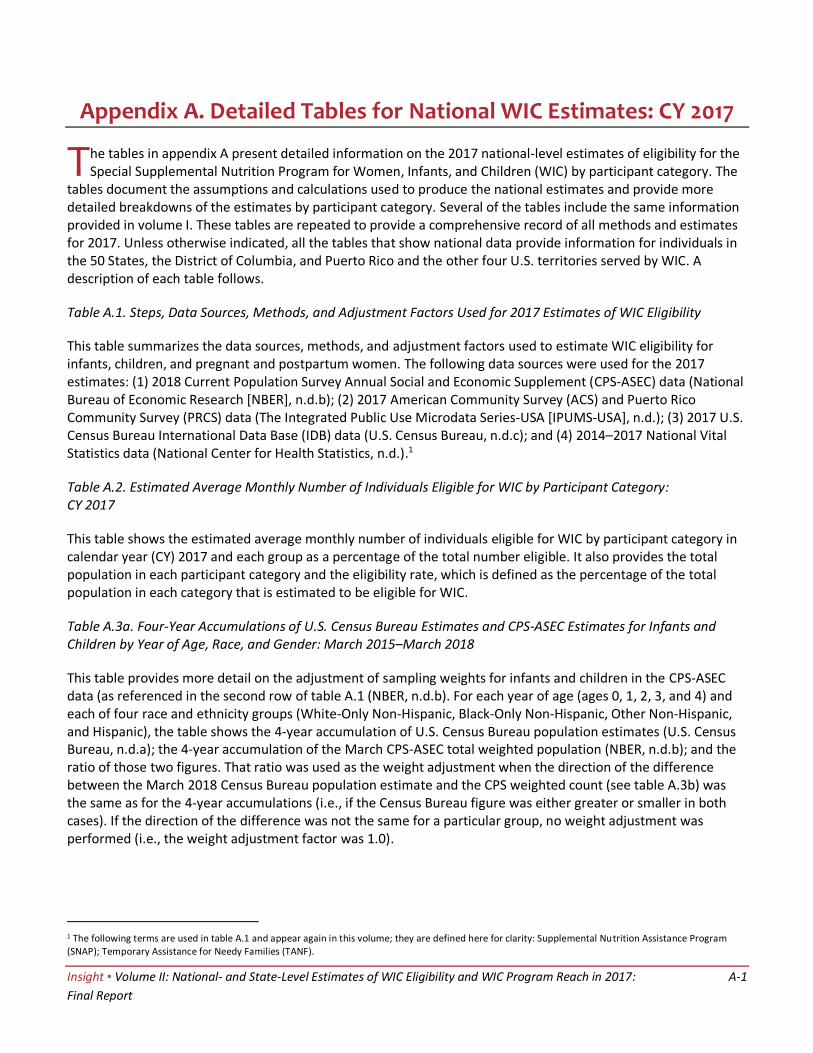
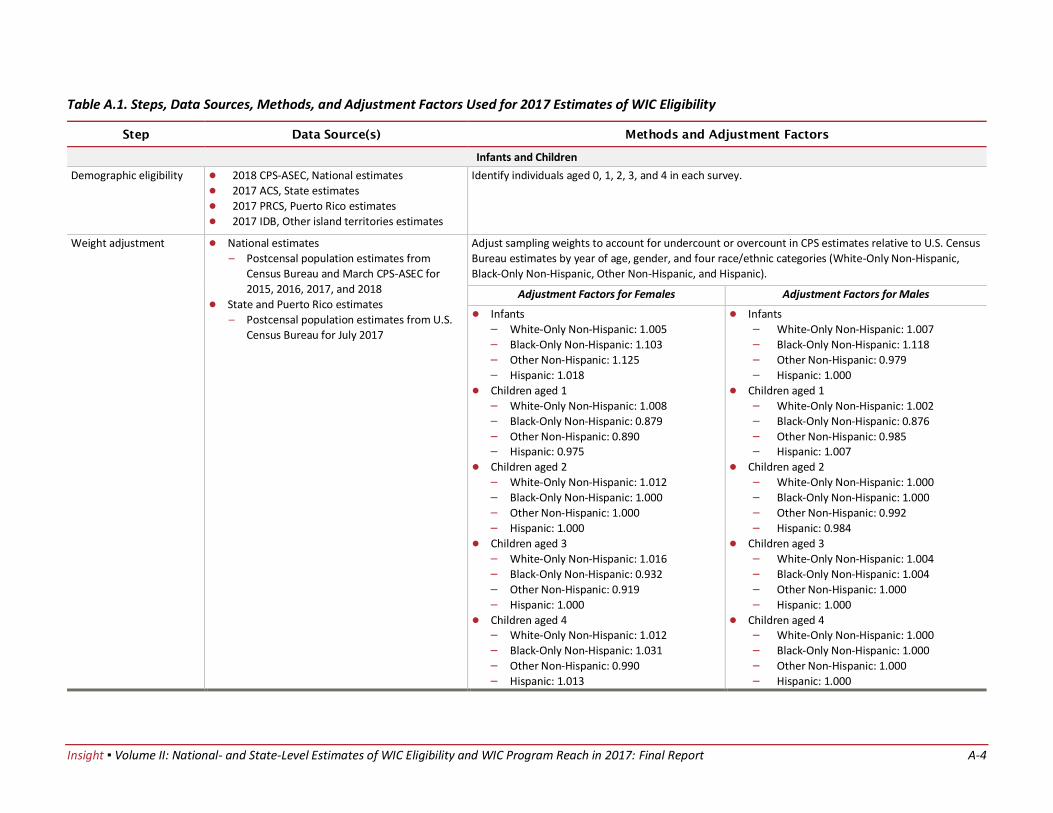
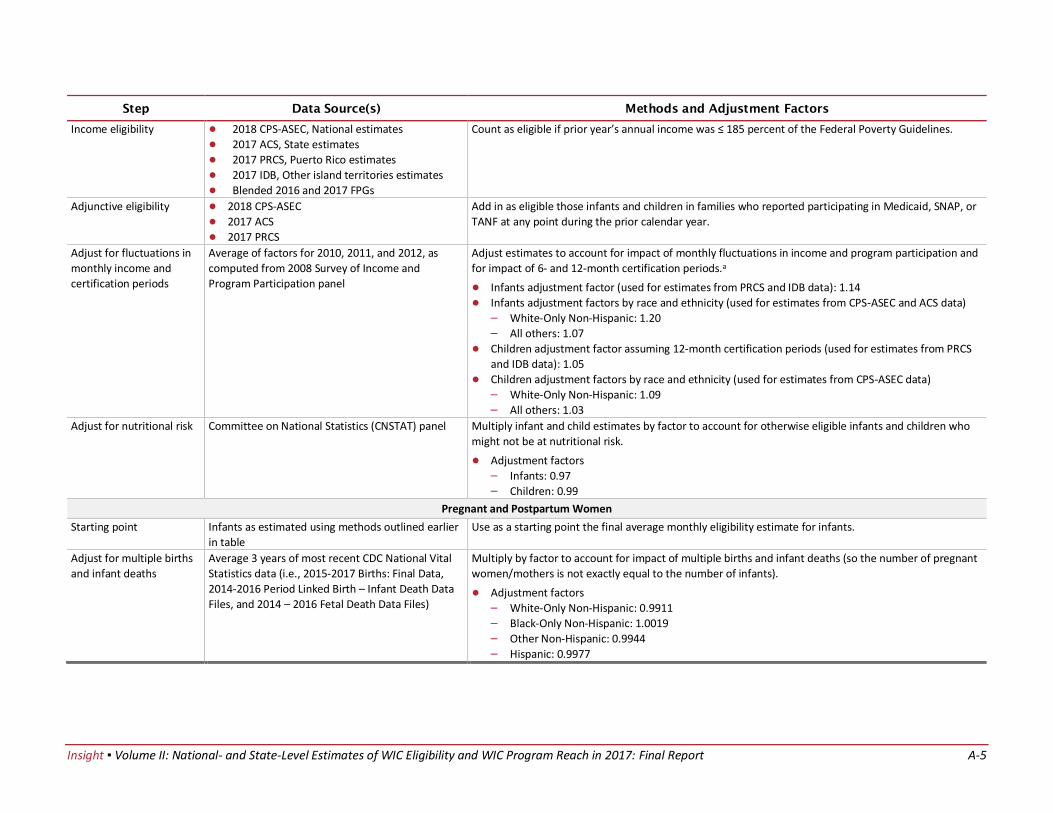
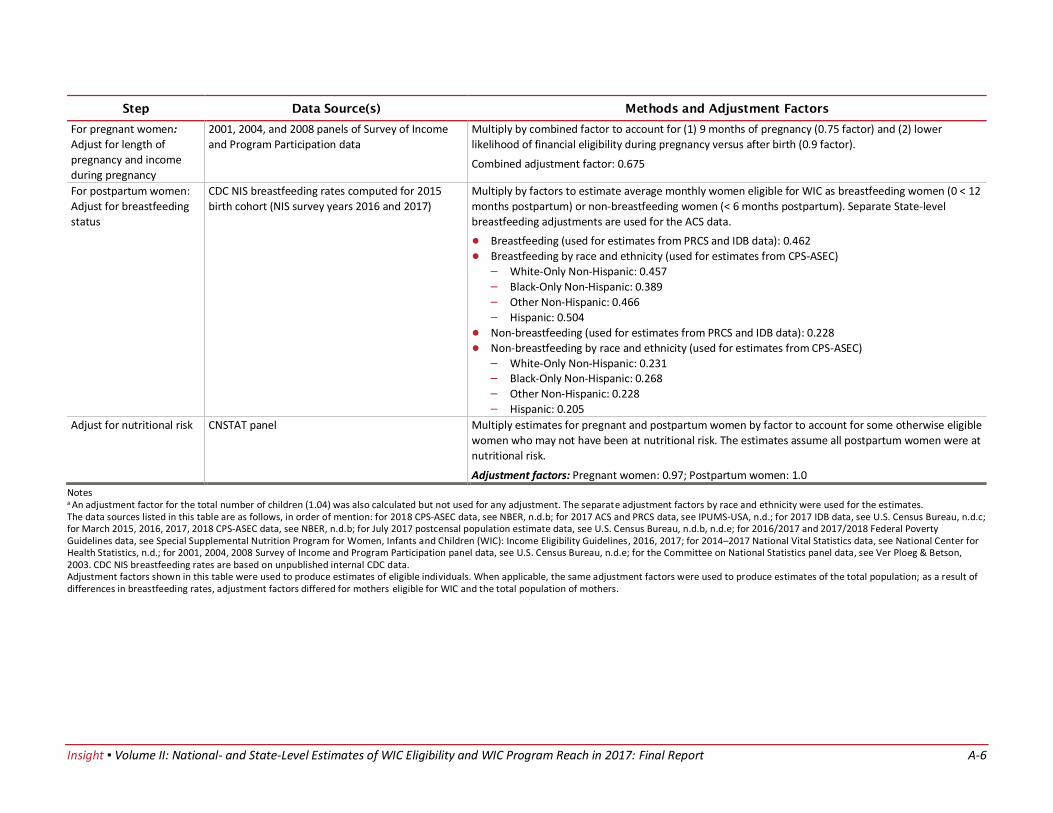
Table A.1. Steps, Data Sources, Methods, and Adjustment Factors Used for 2017 Estimates of WIC Eligibility
This table summarizes the data sources, methods, and adjustment factors used to estimate WIC eligibility for infants, children, and pregnant and postpartum women. The following data sources were used for the 2017 estimates: (1) 2018 Current Population Survey Annual Social and Economic Supplement (CPS-ASEC) data (National Bureau of Economic Research [NBER], n.d.b); (2) 2017 American Community Survey (ACS) and Puerto Rico Community Survey (PRCS) data (The Integrated Public Use Microdata Series-USA [IPUMS-USA], n.d.); (3) 2017 U.S. Census Bureau International Data Base (IDB) data (U.S. Census Bureau, n.d.c); and (4) 2014–2017 National Vital Statistics data (National Center for Health Statistics, n.d.).1
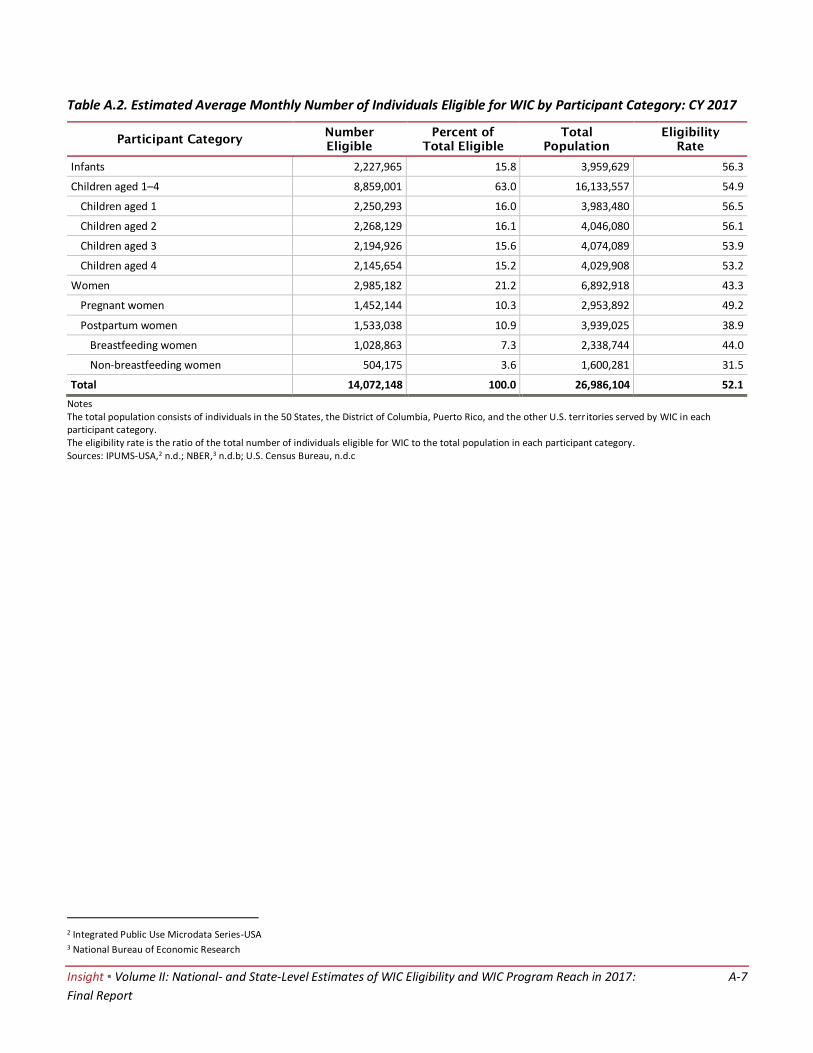
Table A.2. Estimated Average Monthly Number of Individuals Eligible for WIC by Participant Category: CY 2017
This table shows the estimated average monthly number of individuals eligible for WIC by participant category in calendar year (CY) 2017 and each group as a percentage of the total number eligible. It also provides the total population in each participant category and the eligibility rate, which is defined as the percentage of the total population in each category that is estimated to be eligible for WIC.
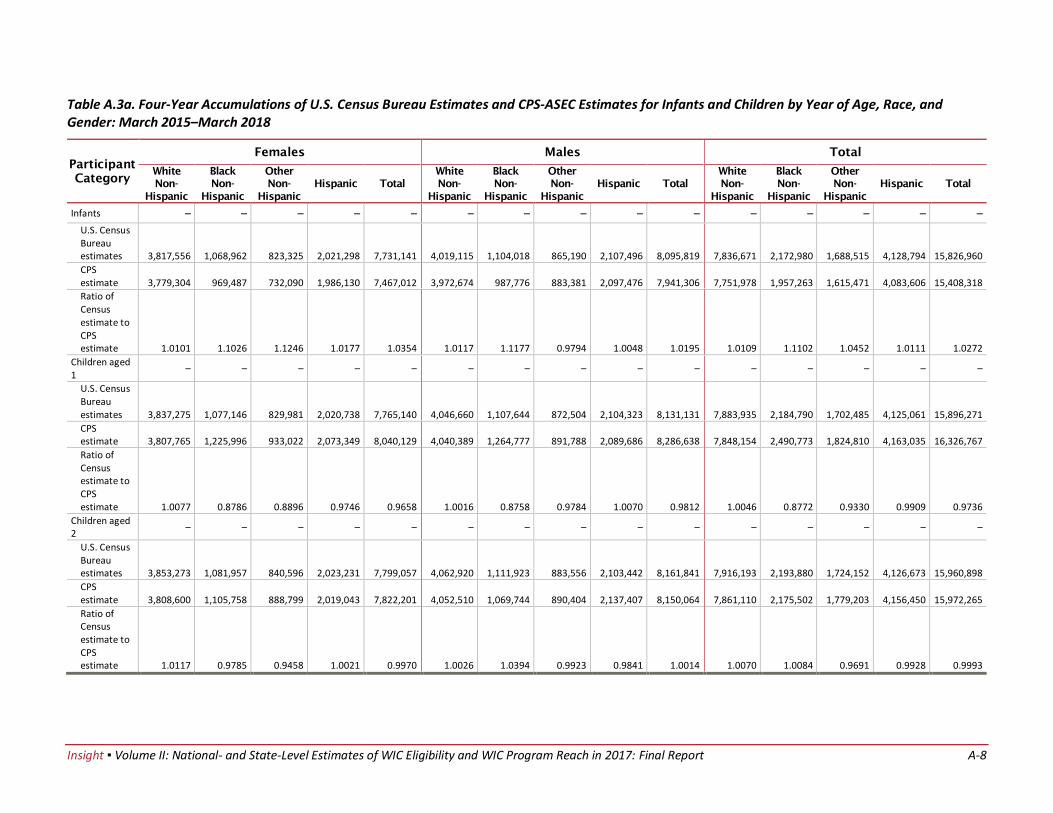
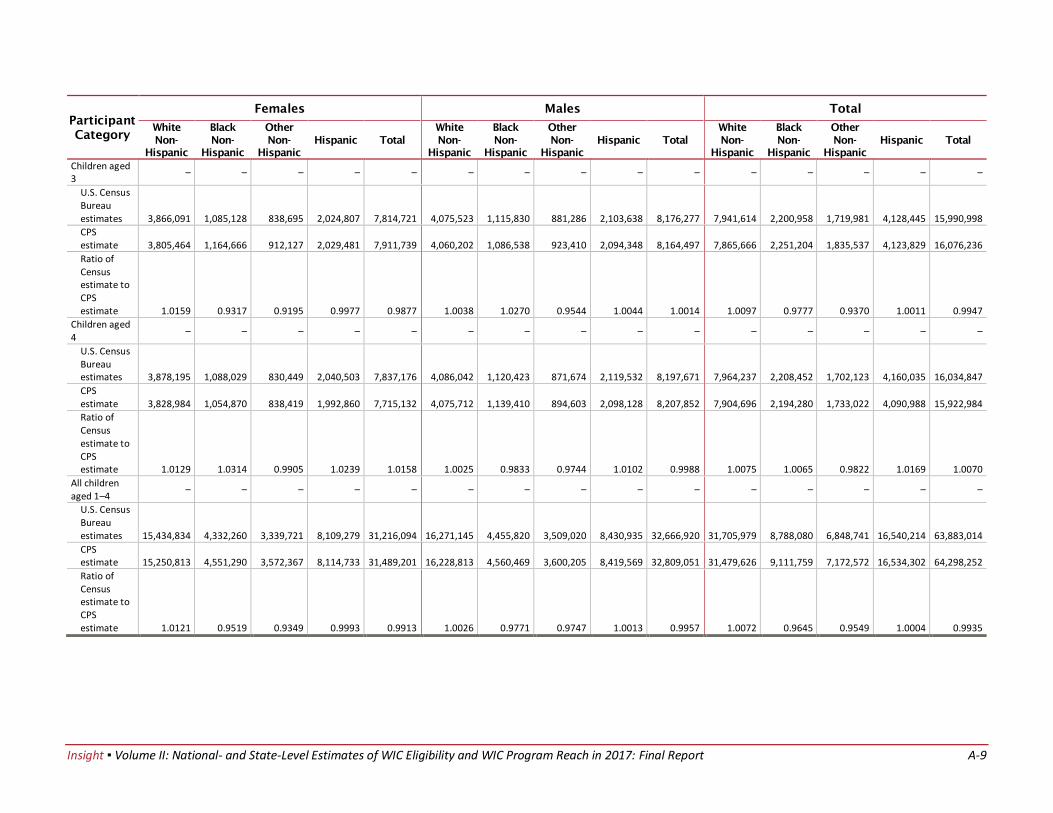
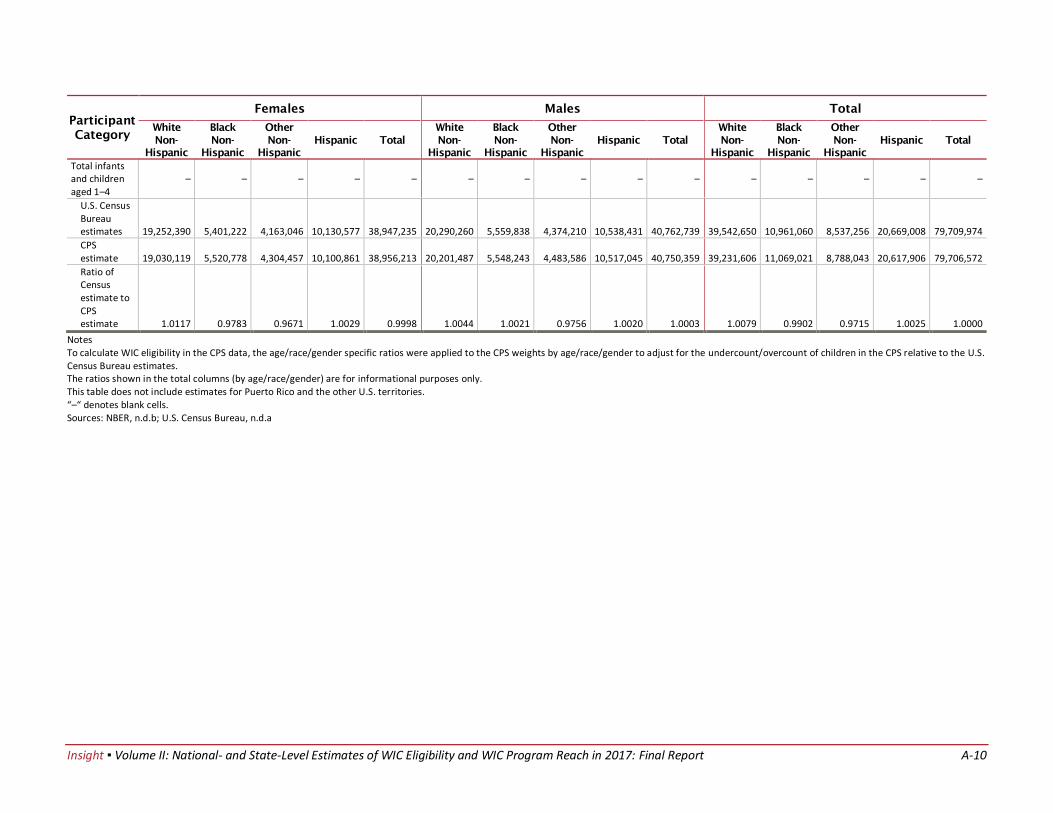
Table A.3a. Four-Year Accumulations of U.S. Census Bureau Estimates and CPS-ASEC Estimates for Infants and Children by Year of Age, Race, and Gender: March 2015–March 2018
This table provides more detail on the adjustment of sampling weights for infants and children in the CPS-ASEC data (as referenced in the second row of table A.1 (NBER, n.d.b). For each year of age (ages 0, 1, 2, 3, and 4) and each of four race and ethnicity groups (White-Only Non-Hispanic, Black-Only Non-Hispanic, Other Non-Hispanic, and Hispanic), the table shows the 4-year accumulation of U.S. Census Bureau population estimates (U.S. Census Bureau, n.d.a); the 4-year accumulation of the March CPS-ASEC total weighted population (NBER, n.d.b); and the ratio of those two figures. That ratio was used as the weight adjustment when the direction of the difference between the March 2018 Census Bureau population estimate and the CPS weighted count (see table A.3b) was the same as for the 4-year accumulations (i.e., if the Census Bureau figure was either greater or smaller in both cases). If the direction of the difference was not the same for a particular group, no weight adjustment was performed (i.e., the weight adjustment factor was 1.0).
1 The following terms are used in table A.1 and appear again in this volume; they are defined here for clarity: Supplemental Nutrition Assistance Program (SNAP); Temporary Assistance for Needy Families (TANF).
Th e tables in appendix A present detailed information on the 2017 national-level estimates of eligibility for the Special Supplemental Nutrition Program for Women, Infants, and Children (WIC) by participant category. The
tables document the assumptions and calculations used to produce the national estimates and provide more detailed breakdowns of the estimates by participant category. Several of the tables include the same information provided in volume I. These tables are repeated to provide a comprehensive record of all methods and estimates for 2017. Unless otherwise indicated, all the tables that show national data provide information for individuals in the 50 States, the District of Columbia, and Puerto Rico and the other four U.S. territories served by WIC. A description of each table follows.
Insight ▪ Volume II: National- and State-Level Estimates of WIC Eligibility and WIC Program Reach in 2017: A-2
Final Report
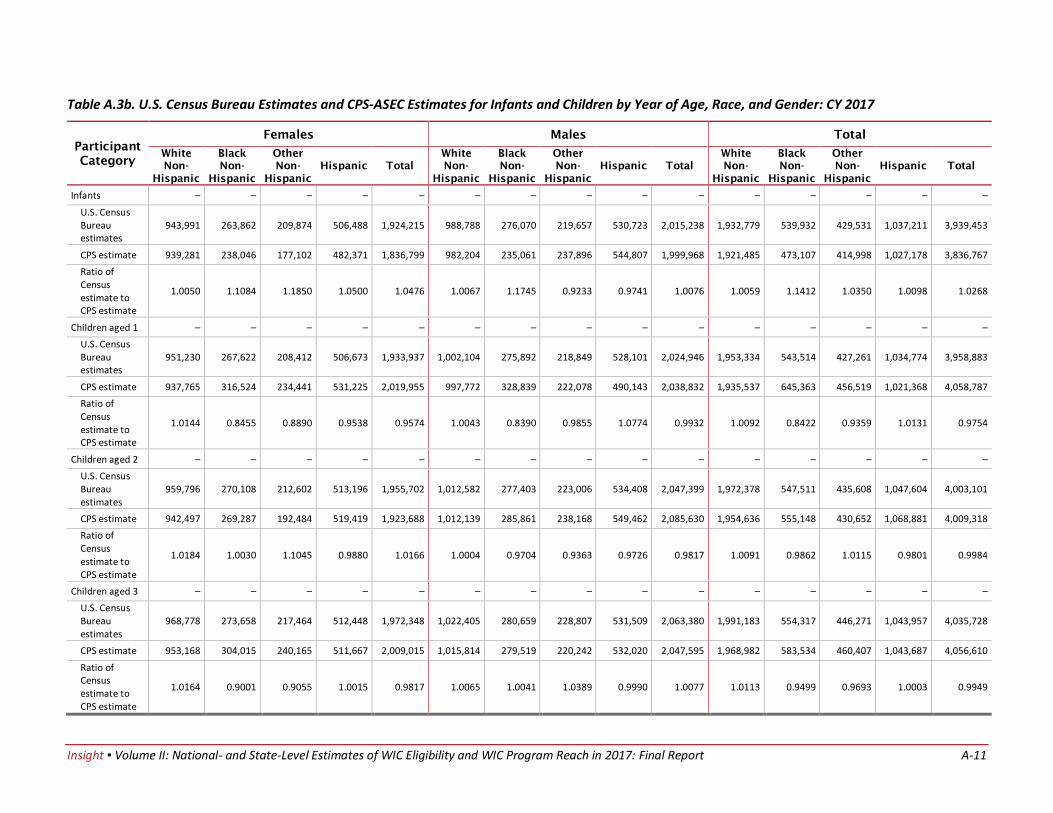
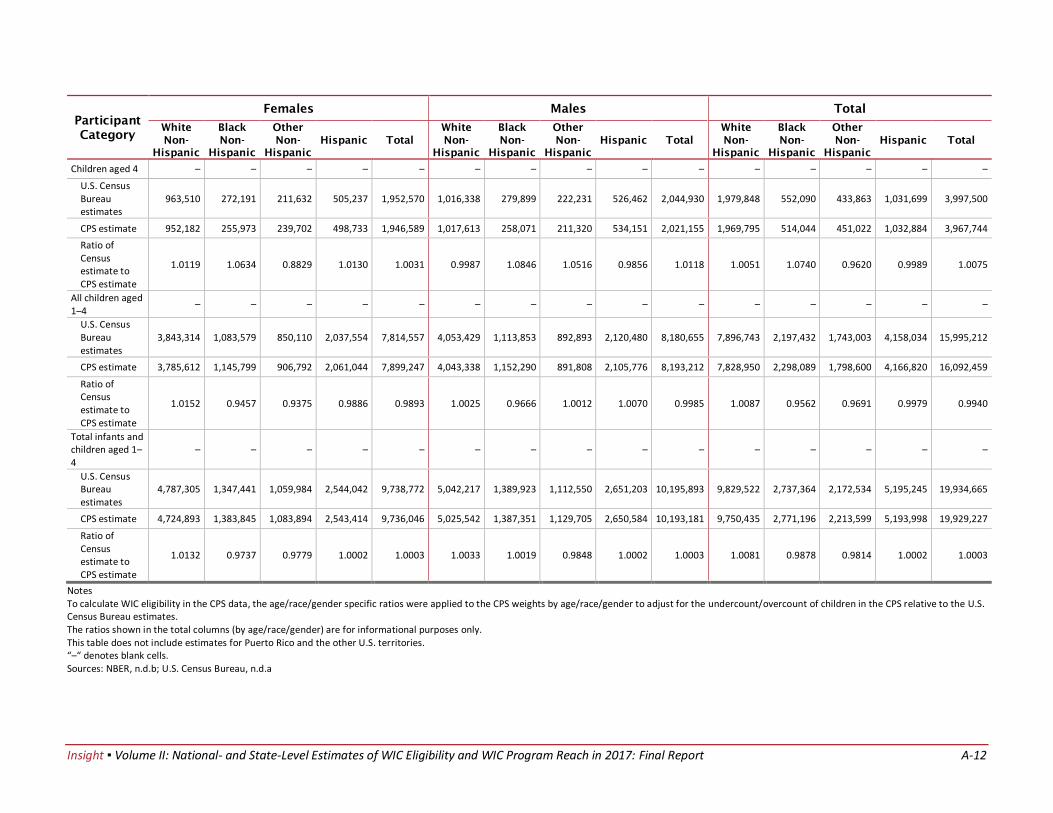
Table A.3b. U.S. Census Bureau Estimates and CPS-ASEC Estimates for Infants and Children by Year of Age, Race, and Gender: March 2018
This table shows the Census Bureau population estimates and CPS weighted population figures by year of age, race, and gender, and the ratio of Census Bureau estimates to CPS figures, for March 2018 (U.S. Census Bureau, n.d.a; NBER, n.d.b; see the description of table A.3a for an explanation of how this information was used in the weight-adjustment process.)
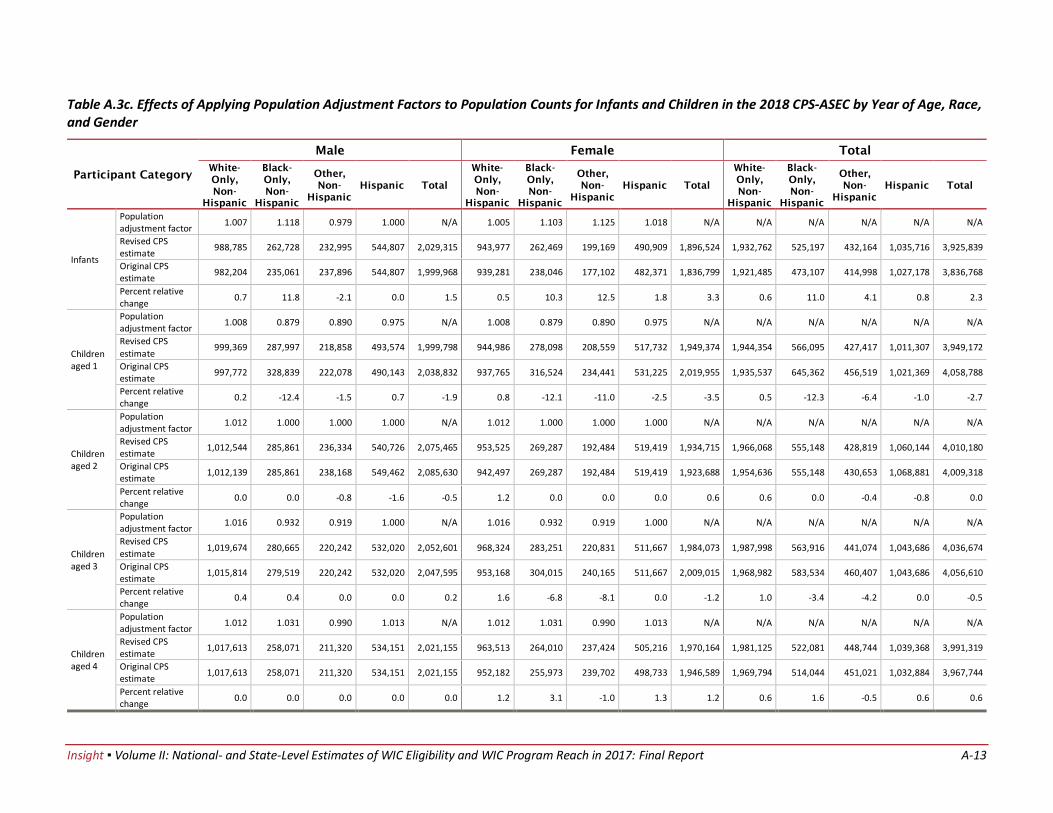
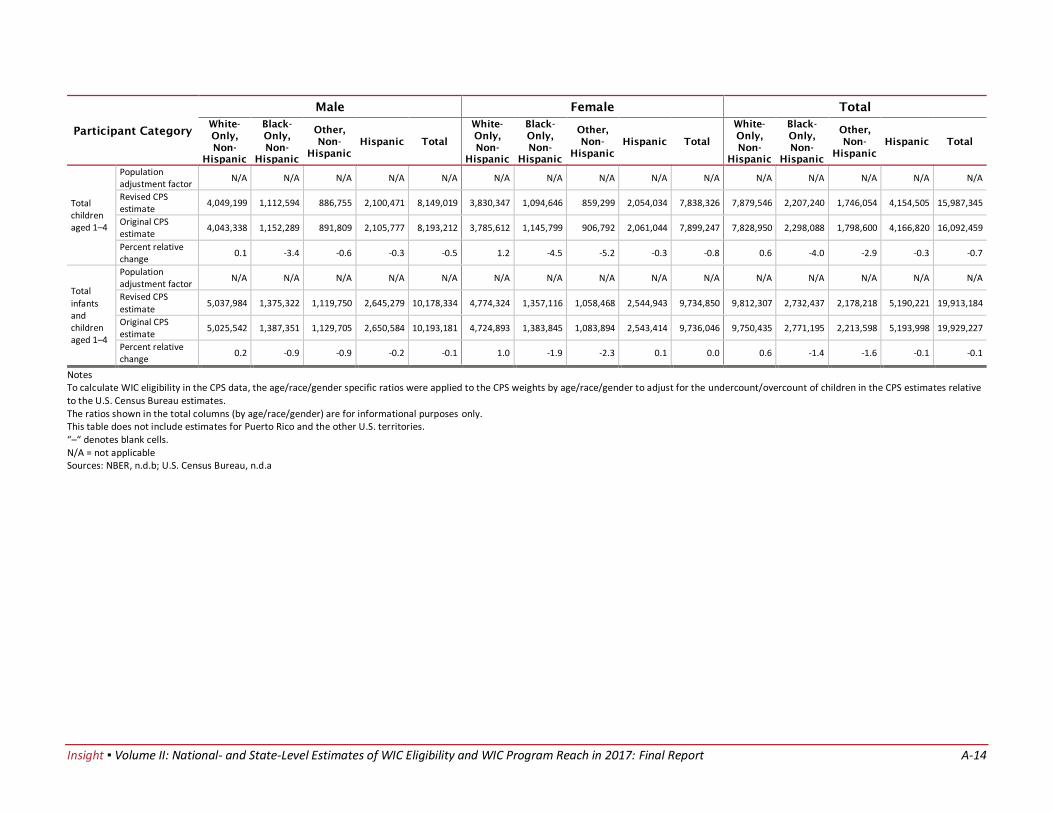
Table A.3c. Effects of Applying Population Adjustment Factors to Population Counts for Infants and Children in the 2018 CPS-ASEC by Year of Age, Race, and Gender
This table shows the results of applying the population adjustment factors (computed based on the information in tables A.3a and A.3b) to the weights for infants and children in the March CPS-ASEC data.
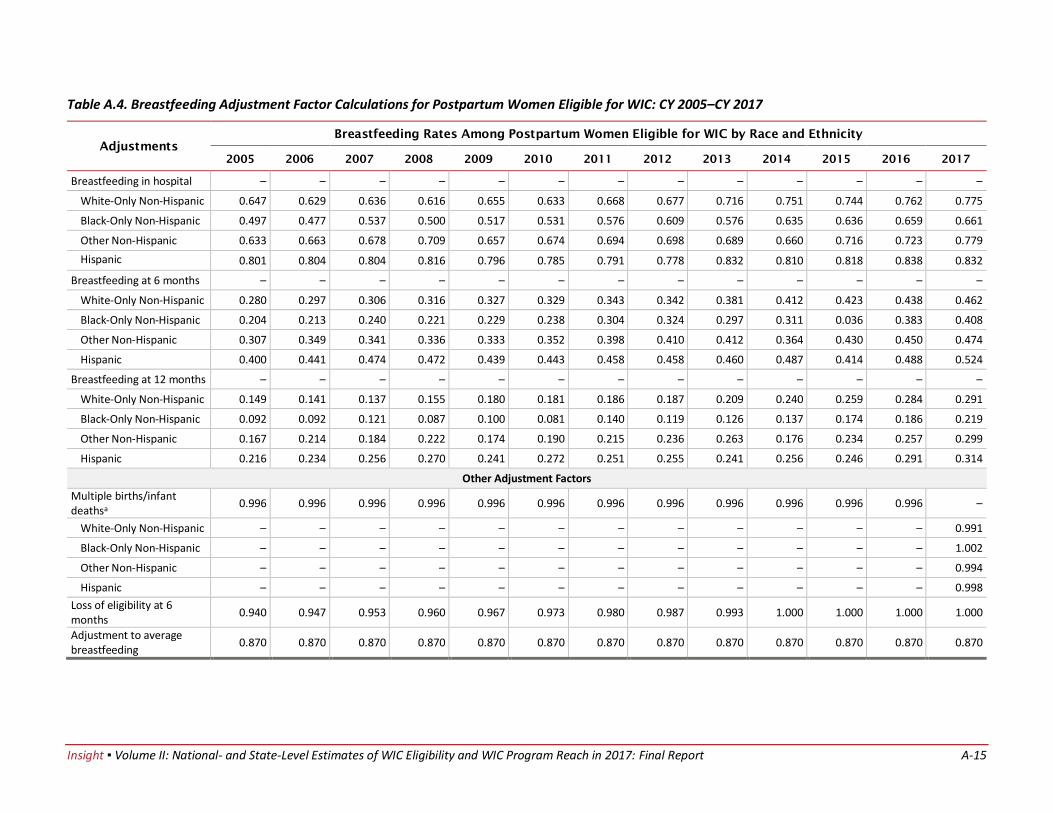
Table A.4. Breastfeeding Adjustment Factor Calculations for Postpartum Women Eligible for WIC: CY 2005–CY 2017
This table shows information on the computation of postpartum eligibility for breastfeeding and non-breastfeeding mothers. The first three sections of the table show three breastfeeding rates based on National Immunization Survey (NIS) data from the Centers for Disease Control and Prevention (CDC)—the percentage of new mothers breastfeeding their infants in the hospital after giving birth (the percentage ever breastfed), at 6 months postpartum, and at 12 months postpartum—with variations by race and ethnicity.
The next section of the table shows three adjustment factors. The first factor adjusted for the fact that the number of pregnant and postpartum women can differ from the number of infants because of the combined impact of multiple births and infant deaths (see appendix E for an explanation of the updated and expanded factor for the 2017 estimates). The second factor adjusted for the fact that (prior to 2014) the analysis assumed some breastfeeding mothers lost eligibility at the 6-month point because they were no longer income-eligible or adjunctively eligible; this factor changed gradually from 0.94 in 2005 to 1.0 for 2014 through 2017. The final factor was used to estimate average monthly breastfeeding rates; that is, the average monthly rate across the first 6 months was assumed to be equal to the mean of the ever-breastfed and 6-month rates multiplied by this factor. This factor, 0.87, was assumed to be constant across the period.
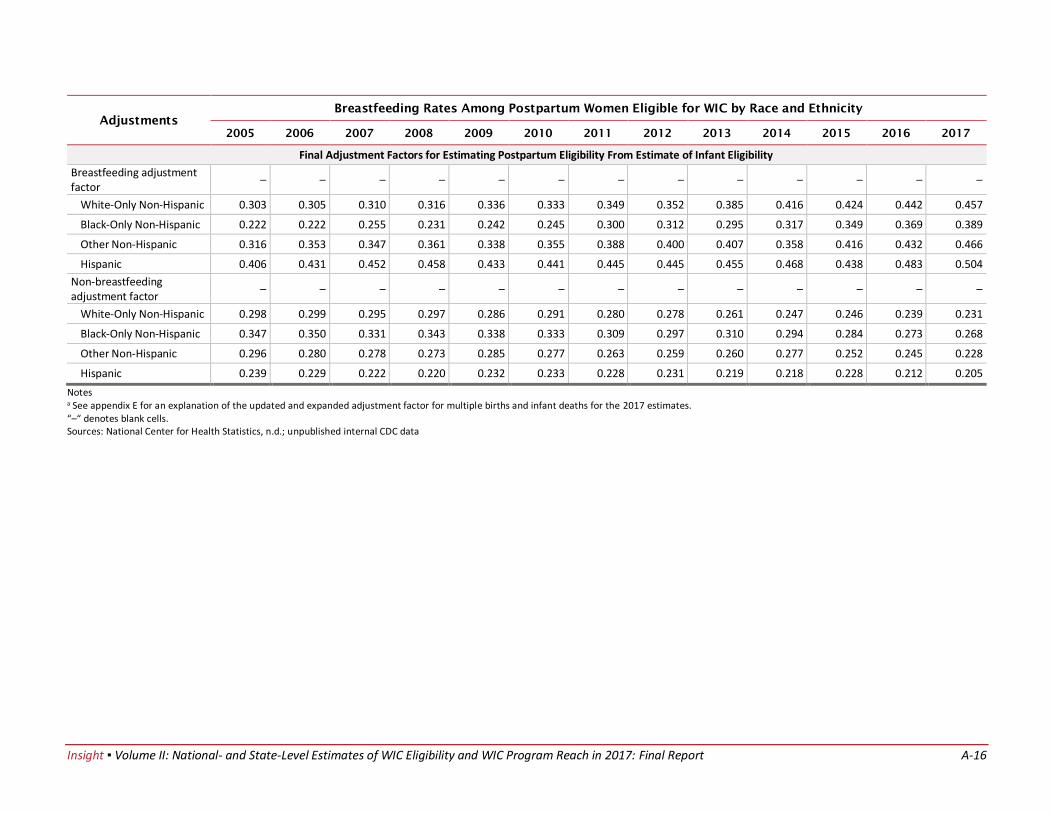
The last section of the table shows the final postpartum adjustment factors produced using the information in the prior portions of the table. For each year, the factors are shown for estimating breastfeeding and non-breastfeeding eligibility for each race and ethnicity group. For example, for Hispanic women in 2017, the estimated average monthly number of women eligible for WIC as breastfeeding mothers was computed as 0.504 times the estimated number of Hispanic infants eligible for WIC.
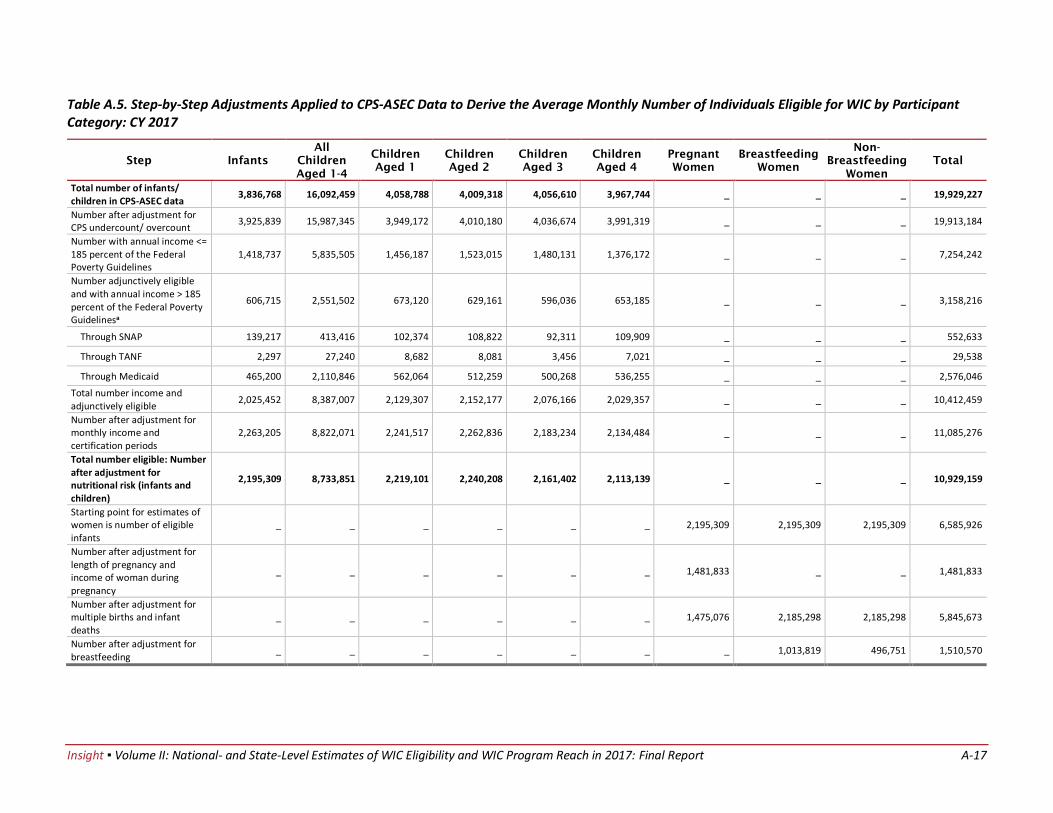
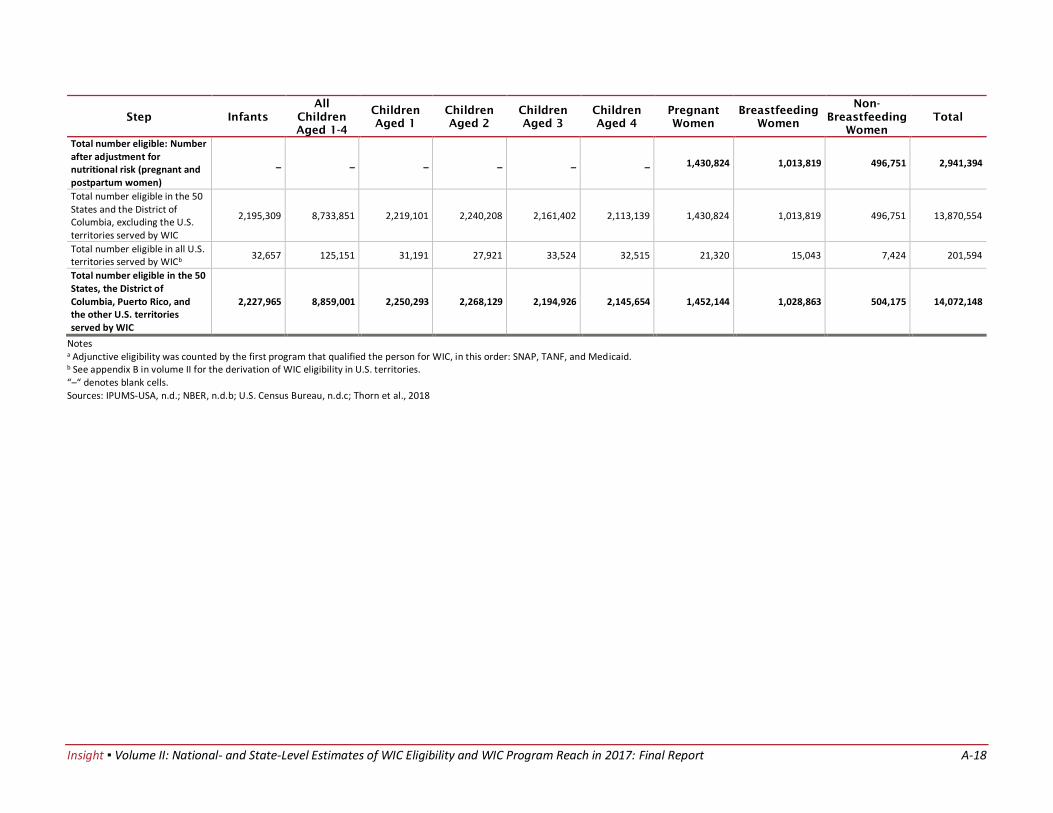
Table A.5. Step-by-Step Adjustments Applied to CPS-ASEC Data to Derive the Average Monthly Number of Individuals Eligible for WIC by Participant Category: CY 2017
This table shows the step-by-step adjustments made from the total number of infants and children to the final numbers of infants, children, and pregnant and postpartum women that were eligible for WIC in the United States in 2017; it also shows the total number eligible in Puerto Rico and each of the other four U.S. territories served by WIC. See tables B.7a and B.7b for the step-by-step adjustments made to derive the total number of individuals eligible for WIC in Puerto Rico and each of the other territories, respectively.
Insight ▪ Volume II: National- and State-Level Estimates of WIC Eligibility and WIC Program Reach in 2017: A-3
Final Report
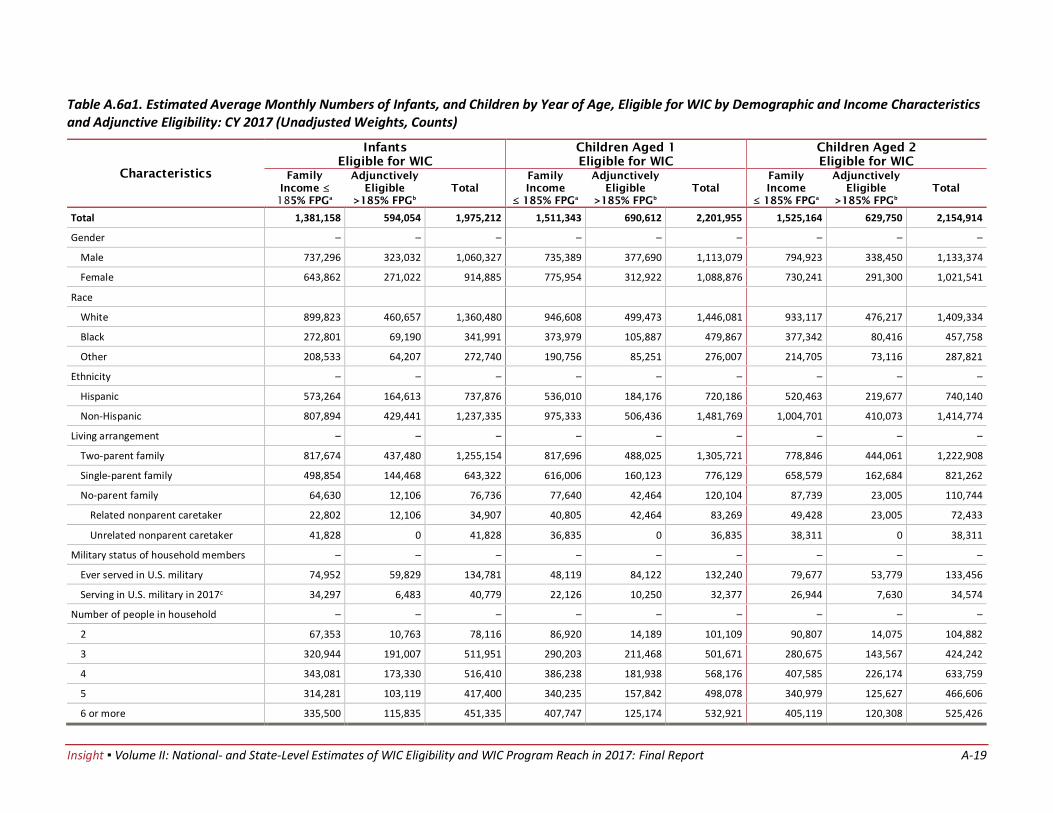
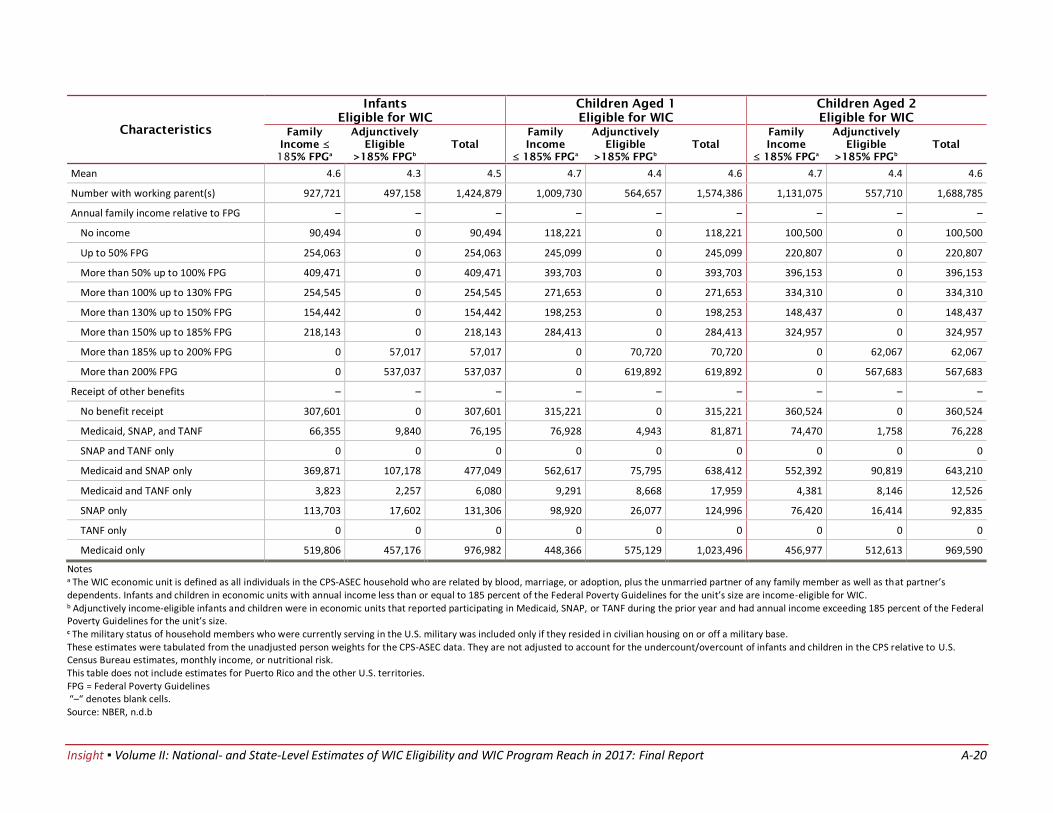
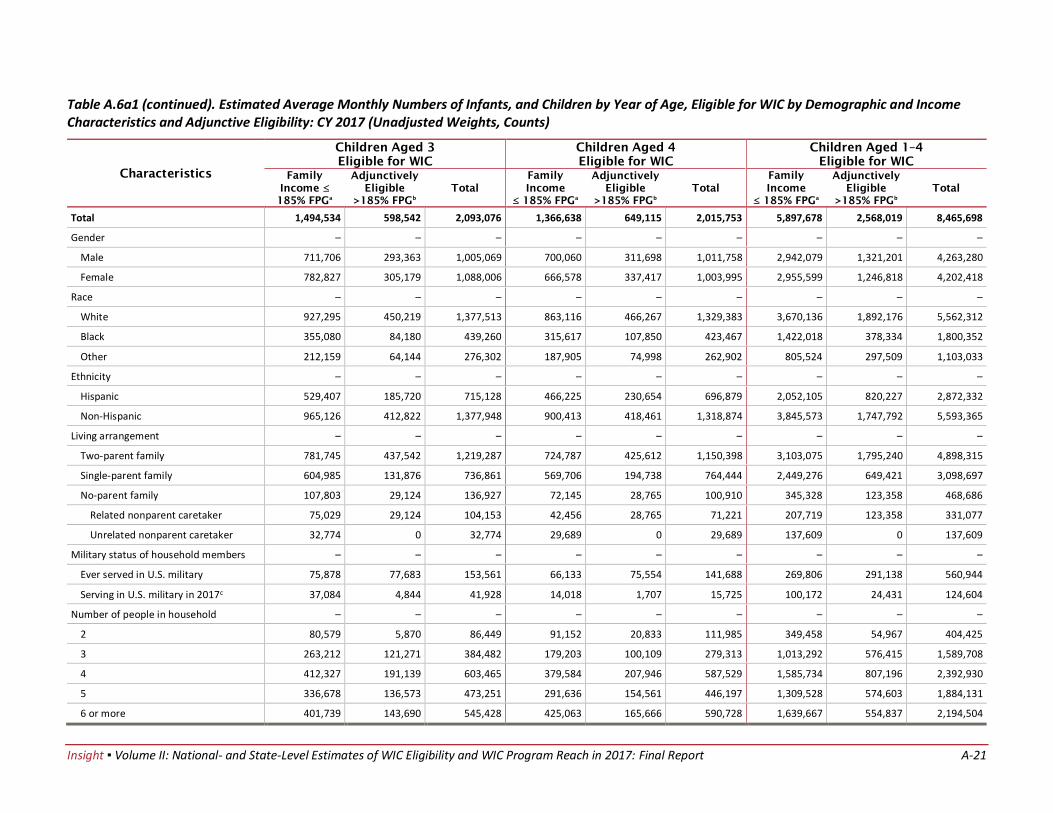
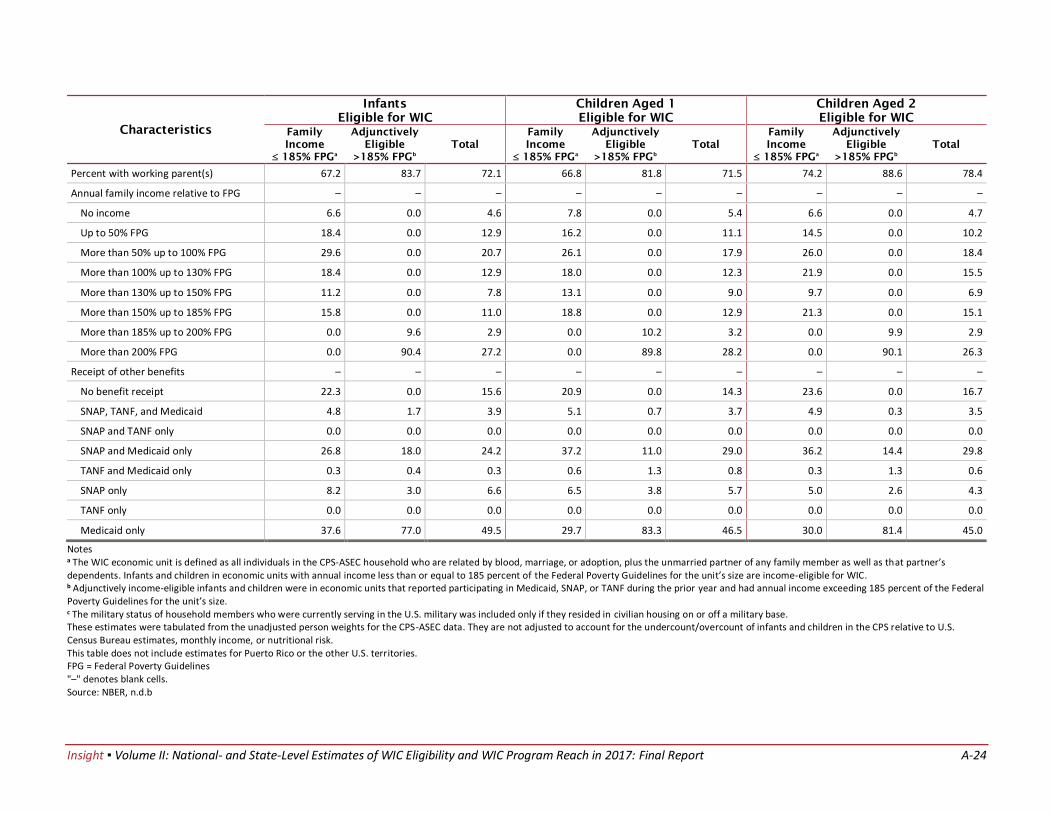
Tables A.6a and A.6b. Estimated Average Monthly Numbers of Infants, and Children by Year of Age, Eligible for WIC by Demographic and Income Characteristics and Adjunctive Eligibility: CY 2017
These tables show the estimates of infants and children eligible for WIC by demographic and income characteristics in the March 2018 CPS-ASEC. Note that these tables do not include infants and children in Puerto Rico and the other U.S. territories. Tables A.6a1 and A.6a2 show the characteristics of infants and children eligible for WIC in the data as determined by using unadjusted person weights, and tables A.6b1 and A.6b2 show these characteristics as determined by using weights that have been fully adjusted, including adjustments for the CPS undercount/overcount (population adjustment), monthly income and certification periods (annual-to-monthly adjustment), and nutritional risk. A comparison of table A.6a and table A.6b shows the impact of the CPS weight adjustments on the national estimates of infants and children eligible for WIC.
Results are also shown in terms of counts (see tables A.6a1 and A.6b1) and percentages (see tables A.6a2 and A.6b2). For example, A.6b1 shows that with the adjusted weights, 1.2 million male infants and 1.0 million female infants were eligible for WIC in March 2018; A.6b2 shows that among infants eligible for WIC, 53.2 percent were male, and 46.8 percent were female.
Table A.7. Changes in the Total Population, Total Number of Individuals Eligible for WIC, and WIC Eligibility Rate by Participant Category: CY 2015–CY 2017
This table shows the changes in the numbers of individuals in the total population and the population eligible for WIC by participant category, and the WIC eligibility rate, between 2015 and 2017.
Table A.8. Stepwise Comparison of Changes in Average Monthly Numbers of Infants and Children Eligible for WIC as Estimated in the March CPS-ASEC: CY 2015–CY 2017
This table shows the step-by-step percentage changes in the numbers of infants and children from 2015 to 2017 (excluding Puerto Rico and the other U.S. territories). For example, it shows that the number of infants and children eligible for WIC through adjunctive eligibility increased by 1.9 percent between 2015 and 2017.
Table A.9. Standard Error and Coefficient of Variation for Estimates by Participant Category: CY 2017
This table shows the standard error of the estimate and coefficient of variance for the national estimates of the total population of women, infants, and children and the number of individuals eligible for WIC by participant category.
Insight ▪ Volume II: National- and State-Level Estimates of WIC Eligibility and WIC Program Reach in 2017: Final Report A-4
Table A.1. Steps, Data Sources, Methods, and Adjustment Factors Used for 2017 Estimates of WIC Eligibility
Step Data Source(s) Methods and Adjustment Factors
Infants and Children
Demographic eligibility ● 2018 CPS-ASEC, National estimates
● 2017 ACS, State estimates
● 2017 PRCS, Puerto Rico estimates
● 2017 IDB, Other island territories estimates
Identify individuals aged 0, 1, 2, 3, and 4 in each survey.
Weight adjustment ● National estimates
– Postcensal population estimates from
Census Bureau and March CPS-ASEC for
2015, 2016, 2017, and 2018
● State and Puerto Rico estimates
– Postcensal population estimates from U.S.
Census Bureau for July 2017
Adjust sampling weights to account for undercount or overcount in CPS estimates relative to U.S. Census
Bureau estimates by year of age, gender, and four race/ethnic categories (White-Only Non-Hispanic,
Black-Only Non-Hispanic, Other Non-Hispanic, and Hispanic).
Adjustment Factors for Females Adjustment Factors for Males
● Infants
– White-Only Non-Hispanic: 1.005
– Black-Only Non-Hispanic: 1.103
– Other Non-Hispanic: 1.125
– Hispanic: 1.018
● Children aged 1
– White-Only Non-Hispanic: 1.008
– Black-Only Non-Hispanic: 0.879
– Other Non-Hispanic: 0.890 – Hispanic: 0.975
● Children aged 2
– White-Only Non-Hispanic: 1.012
– Black-Only Non-Hispanic: 1.000
– Other Non-Hispanic: 1.000
– Hispanic: 1.000
● Children aged 3
– White-Only Non-Hispanic: 1.016
– Black-Only Non-Hispanic: 0.932
– Other Non-Hispanic: 0.919
– Hispanic: 1.000
● Children aged 4 – White-Only Non-Hispanic: 1.012
– Black-Only Non-Hispanic: 1.031
– Other Non-Hispanic: 0.990
– Hispanic: 1.013
● Infants
– White-Only Non-Hispanic: 1.007
– Black-Only Non-Hispanic: 1.118
– Other Non-Hispanic: 0.979
– Hispanic: 1.000
● Children aged 1
– White-Only Non-Hispanic: 1.002
– Black-Only Non-Hispanic: 0.876
– Other Non-Hispanic: 0.985 – Hispanic: 1.007
● Children aged 2
– White-Only Non-Hispanic: 1.000
– Black-Only Non-Hispanic: 1.000
– Other Non-Hispanic: 0.992
– Hispanic: 0.984
● Children aged 3
– White-Only Non-Hispanic: 1.004
– Black-Only Non-Hispanic: 1.004
– Other Non-Hispanic: 1.000
– Hispanic: 1.000
● Children aged 4 – White-Only Non-Hispanic: 1.000
– Black-Only Non-Hispanic: 1.000
– Other Non-Hispanic: 1.000
– Hispanic: 1.000
Insight ▪ Volume II: National- and State-Level Estimates of WIC Eligibility and WIC Program Reach in 2017: Final Report A-5
Step Data Source(s) Methods and Adjustment Factors
Income eligibility ● 2018 CPS-ASEC, National estimates
● 2017 ACS, State estimates
● 2017 PRCS, Puerto Rico estimates
● 2017 IDB, Other island territories estimates
● Blended 2016 and 2017 FPGs
Count as eligible if prior year’s annual income was ≤ 185 percent of the Federal Poverty Guidelines.
Adjunctive eligibility ● 2018 CPS-ASEC
● 2017 ACS
● 2017 PRCS
Add in as eligible those infants and children in families who reported participating in Medicaid, SNAP, or
TANF at any point during the prior calendar year.
Adjust for fluctuations in
monthly income and
certification periods
Average of factors for 2010, 2011, and 2012, as
computed from 2008 Survey of Income and
Program Participation panel
Adjust estimates to account for impact of monthly fluctuations in income and program participation and
for impact of 6- and 12-month certification periods.a
● Infants adjustment factor (used for estimates from PRCS and IDB data): 1.14
● Infants adjustment factors by race and ethnicity (used for estimates from CPS-ASEC and ACS data)
– White-Only Non-Hispanic: 1.20
– All others: 1.07
● Children adjustment factor assuming 12-month certification periods (used for estimates from PRCS
and IDB data): 1.05
● Children adjustment factors by race and ethnicity (used for estimates from CPS-ASEC data)
– White-Only Non-Hispanic: 1.09
– All others: 1.03
Adjust for nutritional risk Committee on National Statistics (CNSTAT) panel Multiply infant and child estimates by factor to account for otherwise eligible infants and children who
might not be at nutritional risk.
● Adjustment factors
– Infants: 0.97
– Children: 0.99
Pregnant and Postpartum Women
Starting point Infants as estimated using methods outlined earlier
in table
Use as a starting point the final average monthly eligibility estimate for infants.
Adjust for multiple births
and infant deaths
Average 3 years of most recent CDC National Vital
Statistics data (i.e., 2015-2017 Births: Final Data,
2014-2016 Period Linked Birth – Infant Death Data
Files, and 2014 – 2016 Fetal Death Data Files)
Multiply by factor to account for impact of multiple births and infant deaths (so the number of pregnant
women/mothers is not exactly equal to the number of infants).
● Adjustment factors
– White-Only Non-Hispanic: 0.9911
– Black-Only Non-Hispanic: 1.0019
– Other Non-Hispanic: 0.9944
– Hispanic: 0.9977
Insight ▪ Volume II: National- and State-Level Estimates of WIC Eligibility and WIC Program Reach in 2017: Final Report A-6
Step Data Source(s) Methods and Adjustment Factors
For pregnant women:
Adjust for length of
pregnancy and income
during pregnancy
2001, 2004, and 2008 panels of Survey of Income
and Program Participation data
Multiply by combined factor to account for (1) 9 months of pregnancy (0.75 factor) and (2) lower
likelihood of financial eligibility during pregnancy versus after birth (0.9 factor).
Combined adjustment factor: 0.675
For postpartum women:
Adjust for breastfeeding
status
CDC NIS breastfeeding rates computed for 2015
birth cohort (NIS survey years 2016 and 2017)
Multiply by factors to estimate average monthly women eligible for WIC as breastfeeding women (0 < 12
months postpartum) or non-breastfeeding women (< 6 months postpartum). Separate State-level
breastfeeding adjustments are used for the ACS data.
● Breastfeeding (used for estimates from PRCS and IDB data): 0.462
● Breastfeeding by race and ethnicity (used for estimates from CPS-ASEC)
– White-Only Non-Hispanic: 0.457
– Black-Only Non-Hispanic: 0.389
– Other Non-Hispanic: 0.466
– Hispanic: 0.504
● Non-breastfeeding (used for estimates from PRCS and IDB data): 0.228
● Non-breastfeeding by race and ethnicity (used for estimates from CPS-ASEC)
– White-Only Non-Hispanic: 0.231 – Black-Only Non-Hispanic: 0.268
– Other Non-Hispanic: 0.228
– Hispanic: 0.205
Adjust for nutritional risk CNSTAT panel Multiply estimates for pregnant and postpartum women by factor to account for some otherwise eligible
women who may not have been at nutritional risk. The estimates assume all postpartum women were at
nutritional risk.
Adjustment factors: Pregnant women: 0.97; Postpartum women: 1.0
Notes a An adjustment factor for the total number of children (1.04) was also calculated but not used for any adjustment. The separate adjustment factors by race and ethnicity were used for the estimates. The data sources listed in this table are as follows, in order of mention: for 2018 CPS-ASEC data, see NBER, n.d.b; for 2017 ACS and PRCS data, see IPUMS-USA, n.d.; for 2017 IDB data, see U.S. Census Bureau, n.d.c; for March 2015, 2016, 2017, 2018 CPS-ASEC data, see NBER, n.d.b; for July 2017 postcensal population estimate data, see U.S. Census Bureau, n.d.b, n.d.e; for 2016/2017 and 2017/2018 Federal Poverty Guidelines data, see Special Supplemental Nutrition Program for Women, Infants and Children (WIC): Income Eligibility Guidelines, 2016, 2017; for 2014–2017 National Vital Statistics data, see National Center for Health Statistics, n.d.; for 2001, 2004, 2008 Survey of Income and Program Participation panel data, see U.S. Census Bureau, n.d.e; for the Committee on National Statistics panel data, see Ver Ploeg & Betson, 2003. CDC NIS breastfeeding rates are based on unpublished internal CDC data. Adjustment factors shown in this table were used to produce estimates of eligible individuals. When applicable, the same adjustment factors were used to produce estimates of the total population; as a result of differences in breastfeeding rates, adjustment factors differed for mothers eligible for WIC and the total population of mothers.
Insight ▪ Volume II: National- and State-Level Estimates of WIC Eligibility and WIC Program Reach in 2017: A-7
Final Report
Table A.2. Estimated Average Monthly Number of Individuals Eligible for WIC by Participant Category: CY 2017
Participant Category Number
Eligible
Percent of
Total Eligible
Total
Population
Eligibility
Rate
Infants 2,227,965 15.8 3,959,629 56.3
Children aged 1–4 8,859,001 63.0 16,133,557 54.9
Children aged 1 2,250,293 16.0 3,983,480 56.5
Children aged 2 2,268,129 16.1 4,046,080 56.1
Children aged 3 2,194,926 15.6 4,074,089 53.9
Children aged 4 2,145,654 15.2 4,029,908 53.2
Women 2,985,182 21.2 6,892,918 43.3
Pregnant women 1,452,144 10.3 2,953,892 49.2
Postpartum women 1,533,038 10.9 3,939,025 38.9
Breastfeeding women 1,028,863 7.3 2,338,744 44.0
Non-breastfeeding women 504,175 3.6 1,600,281 31.5
Total 14,072,148 100.0 26,986,104 52.1
Notes The total population consists of individuals in the 50 States, the District of Columbia, Puerto Rico, and the other U.S. terr itories served by WIC in each participant category. The eligibility rate is the ratio of the total number of individuals eligible for WIC to the total population in each participant category. Sources: IPUMS-USA,2 n.d.; NBER,3 n.d.b; U.S. Census Bureau, n.d.c
2 Integrated Public Use Microdata Series-USA 3 National Bureau of Economic Research
Insight ▪ Volume II: National- and State-Level Estimates of WIC Eligibility and WIC Program Reach in 2017: Final Report A-8
Table A.3a. Four-Year Accumulations of U.S. Census Bureau Estimates and CPS-ASEC Estimates for Infants and Children by Year of Age, Race, and Gender: March 2015–March 2018
Participant
Category
Females Males Total
White
Non-
Hispanic
Black
Non-
Hispanic
Other
Non-
Hispanic
Hispanic Total
White
Non-
Hispanic
Black
Non-
Hispanic
Other
Non-
Hispanic
Hispanic Total
White
Non-
Hispanic
Black
Non-
Hispanic
Other
Non-
Hispanic
Hispanic Total
Infants – – – – – – – – – – – – – – –
U.S. Census Bureau estimates 3,817,556 1,068,962 823,325 2,021,298 7,731,141 4,019,115 1,104,018 865,190 2,107,496 8,095,819 7,836,671 2,172,980 1,688,515 4,128,794 15,826,960
CPS estimate 3,779,304 969,487 732,090 1,986,130 7,467,012 3,972,674 987,776 883,381 2,097,476 7,941,306 7,751,978 1,957,263 1,615,471 4,083,606 15,408,318
Ratio of Census estimate to CPS estimate 1.0101 1.1026 1.1246 1.0177 1.0354 1.0117 1.1177 0.9794 1.0048 1.0195 1.0109 1.1102 1.0452 1.0111 1.0272
Children aged 1
– – – – – – – – – – – – – – –
U.S. Census Bureau estimates 3,837,275 1,077,146 829,981 2,020,738 7,765,140 4,046,660 1,107,644 872,504 2,104,323 8,131,131 7,883,935 2,184,790 1,702,485 4,125,061 15,896,271
CPS estimate 3,807,765 1,225,996 933,022 2,073,349 8,040,129 4,040,389 1,264,777 891,788 2,089,686 8,286,638 7,848,154 2,490,773 1,824,810 4,163,035 16,326,767
Ratio of Census estimate to CPS estimate 1.0077 0.8786 0.8896 0.9746 0.9658 1.0016 0.8758 0.9784 1.0070 0.9812 1.0046 0.8772 0.9330 0.9909 0.9736
Children aged 2
– – – – – – – – – – – – – – –
U.S. Census Bureau estimates 3,853,273 1,081,957 840,596 2,023,231 7,799,057 4,062,920 1,111,923 883,556 2,103,442 8,161,841 7,916,193 2,193,880 1,724,152 4,126,673 15,960,898
CPS estimate 3,808,600 1,105,758 888,799 2,019,043 7,822,201 4,052,510 1,069,744 890,404 2,137,407 8,150,064 7,861,110 2,175,502 1,779,203 4,156,450 15,972,265
Ratio of Census estimate to CPS estimate 1.0117 0.9785 0.9458 1.0021 0.9970 1.0026 1.0394 0.9923 0.9841 1.0014 1.0070 1.0084 0.9691 0.9928 0.9993
Insight ▪ Volume II: National- and State-Level Estimates of WIC Eligibility and WIC Program Reach in 2017: Final Report A-9
Participant
Category
Females Males Total
White
Non-
Hispanic
Black
Non-
Hispanic
Other
Non-
Hispanic
Hispanic Total
White
Non-
Hispanic
Black
Non-
Hispanic
Other
Non-
Hispanic
Hispanic Total
White
Non-
Hispanic
Black
Non-
Hispanic
Other
Non-
Hispanic
Hispanic Total
Children aged 3
– – – – – – – – – – – – – – –
U.S. Census Bureau estimates 3,866,091 1,085,128 838,695 2,024,807 7,814,721 4,075,523 1,115,830 881,286 2,103,638 8,176,277 7,941,614 2,200,958 1,719,981 4,128,445 15,990,998
CPS estimate 3,805,464 1,164,666 912,127 2,029,481 7,911,739 4,060,202 1,086,538 923,410 2,094,348 8,164,497 7,865,666 2,251,204 1,835,537 4,123,829 16,076,236
Ratio of Census estimate to CPS estimate 1.0159 0.9317 0.9195 0.9977 0.9877 1.0038 1.0270 0.9544 1.0044 1.0014 1.0097 0.9777 0.9370 1.0011 0.9947
Children aged 4
– – – – – – – – – – – – – – –
U.S. Census Bureau estimates 3,878,195 1,088,029 830,449 2,040,503 7,837,176 4,086,042 1,120,423 871,674 2,119,532 8,197,671 7,964,237 2,208,452 1,702,123 4,160,035 16,034,847
CPS estimate 3,828,984 1,054,870 838,419 1,992,860 7,715,132 4,075,712 1,139,410 894,603 2,098,128 8,207,852 7,904,696 2,194,280 1,733,022 4,090,988 15,922,984
Ratio of Census estimate to CPS estimate 1.0129 1.0314 0.9905 1.0239 1.0158 1.0025 0.9833 0.9744 1.0102 0.9988 1.0075 1.0065 0.9822 1.0169 1.0070
All children aged 1–4
– – – – – – – – – – – – – – –
U.S. Census Bureau estimates 15,434,834 4,332,260 3,339,721 8,109,279 31,216,094 16,271,145 4,455,820 3,509,020 8,430,935 32,666,920 31,705,979 8,788,080 6,848,741 16,540,214 63,883,014
CPS estimate 15,250,813 4,551,290 3,572,367 8,114,733 31,489,201 16,228,813 4,560,469 3,600,205 8,419,569 32,809,051 31,479,626 9,111,759 7,172,572 16,534,302 64,298,252
Ratio of Census estimate to CPS estimate 1.0121 0.9519 0.9349 0.9993 0.9913 1.0026 0.9771 0.9747 1.0013 0.9957 1.0072 0.9645 0.9549 1.0004 0.9935
Insight ▪ Volume II: National- and State-Level Estimates of WIC Eligibility and WIC Program Reach in 2017: Final Report A-10
Participant
Category
Females Males Total
White
Non-
Hispanic
Black
Non-
Hispanic
Other
Non-
Hispanic
Hispanic Total
White
Non-
Hispanic
Black
Non-
Hispanic
Other
Non-
Hispanic
Hispanic Total
White
Non-
Hispanic
Black
Non-
Hispanic
Other
Non-
Hispanic
Hispanic Total
Total infants and children aged 1–4
– – – – – – – – – – – – – – –
U.S. Census Bureau estimates 19,252,390 5,401,222 4,163,046 10,130,577 38,947,235 20,290,260 5,559,838 4,374,210 10,538,431 40,762,739 39,542,650 10,961,060 8,537,256 20,669,008 79,709,974
CPS estimate 19,030,119 5,520,778 4,304,457 10,100,861 38,956,213 20,201,487 5,548,243 4,483,586 10,517,045 40,750,359 39,231,606 11,069,021 8,788,043 20,617,906 79,706,572
Ratio of Census estimate to CPS estimate 1.0117 0.9783 0.9671 1.0029 0.9998 1.0044 1.0021 0.9756 1.0020 1.0003 1.0079 0.9902 0.9715 1.0025 1.0000
Notes To calculate WIC eligibility in the CPS data, the age/race/gender specific ratios were applied to the CPS weights by age/race/gender to adjust for the undercount/overcount of children in the CPS relative to the U.S. Census Bureau estimates. The ratios shown in the total columns (by age/race/gender) are for informational purposes only. This table does not include estimates for Puerto Rico and the other U.S. territories. “–“ denotes blank cells. Sources: NBER, n.d.b; U.S. Census Bureau, n.d.a
Insight ▪ Volume II: National- and State-Level Estimates of WIC Eligibility and WIC Program Reach in 2017: Final Report A-11
Table A.3b. U.S. Census Bureau Estimates and CPS-ASEC Estimates for Infants and Children by Year of Age, Race, and Gender: CY 2017
Participant
Category
Females Males Total
White
Non-
Hispanic
Black
Non-
Hispanic
Other
Non-
Hispanic
Hispanic Total
White
Non-
Hispanic
Black
Non-
Hispanic
Other
Non-
Hispanic
Hispanic Total
White
Non-
Hispanic
Black
Non-
Hispanic
Other
Non-
Hispanic
Hispanic Total
Infants – – – – – – – – – – – – – – –
U.S. Census Bureau estimates
943,991 263,862 209,874 506,488 1,924,215 988,788 276,070 219,657 530,723 2,015,238 1,932,779 539,932 429,531 1,037,211 3,939,453
CPS estimate 939,281 238,046 177,102 482,371 1,836,799 982,204 235,061 237,896 544,807 1,999,968 1,921,485 473,107 414,998 1,027,178 3,836,767
Ratio of Census estimate to CPS estimate
1.0050 1.1084 1.1850 1.0500 1.0476 1.0067 1.1745 0.9233 0.9741 1.0076 1.0059 1.1412 1.0350 1.0098 1.0268
Children aged 1 – – – – – – – – – – – – – – –
U.S. Census Bureau estimates
951,230 267,622 208,412 506,673 1,933,937 1,002,104 275,892 218,849 528,101 2,024,946 1,953,334 543,514 427,261 1,034,774 3,958,883
CPS estimate 937,765 316,524 234,441 531,225 2,019,955 997,772 328,839 222,078 490,143 2,038,832 1,935,537 645,363 456,519 1,021,368 4,058,787
Ratio of Census estimate to CPS estimate
1.0144 0.8455 0.8890 0.9538 0.9574 1.0043 0.8390 0.9855 1.0774 0.9932 1.0092 0.8422 0.9359 1.0131 0.9754
Children aged 2 – – – – – – – – – – – – – – –
U.S. Census Bureau estimates
959,796 270,108 212,602 513,196 1,955,702 1,012,582 277,403 223,006 534,408 2,047,399 1,972,378 547,511 435,608 1,047,604 4,003,101
CPS estimate 942,497 269,287 192,484 519,419 1,923,688 1,012,139 285,861 238,168 549,462 2,085,630 1,954,636 555,148 430,652 1,068,881 4,009,318
Ratio of Census estimate to CPS estimate
1.0184 1.0030 1.1045 0.9880 1.0166 1.0004 0.9704 0.9363 0.9726 0.9817 1.0091 0.9862 1.0115 0.9801 0.9984
Children aged 3 – – – – – – – – – – – – – – –
U.S. Census Bureau estimates
968,778 273,658 217,464 512,448 1,972,348 1,022,405 280,659 228,807 531,509 2,063,380 1,991,183 554,317 446,271 1,043,957 4,035,728
CPS estimate 953,168 304,015 240,165 511,667 2,009,015 1,015,814 279,519 220,242 532,020 2,047,595 1,968,982 583,534 460,407 1,043,687 4,056,610
Ratio of Census estimate to CPS estimate
1.0164 0.9001 0.9055 1.0015 0.9817 1.0065 1.0041 1.0389 0.9990 1.0077 1.0113 0.9499 0.9693 1.0003 0.9949
Insight ▪ Volume II: National- and State-Level Estimates of WIC Eligibility and WIC Program Reach in 2017: Final Report A-12
Participant
Category
Females Males Total
White
Non-
Hispanic
Black
Non-
Hispanic
Other
Non-
Hispanic
Hispanic Total
White
Non-
Hispanic
Black
Non-
Hispanic
Other
Non-
Hispanic
Hispanic Total
White
Non-
Hispanic
Black
Non-
Hispanic
Other
Non-
Hispanic
Hispanic Total
Children aged 4 – – – – – – – – – – – – – – –
U.S. Census Bureau estimates
963,510 272,191 211,632 505,237 1,952,570 1,016,338 279,899 222,231 526,462 2,044,930 1,979,848 552,090 433,863 1,031,699 3,997,500
CPS estimate 952,182 255,973 239,702 498,733 1,946,589 1,017,613 258,071 211,320 534,151 2,021,155 1,969,795 514,044 451,022 1,032,884 3,967,744
Ratio of Census estimate to CPS estimate
1.0119 1.0634 0.8829 1.0130 1.0031 0.9987 1.0846 1.0516 0.9856 1.0118 1.0051 1.0740 0.9620 0.9989 1.0075
All children aged 1–4
– – – – – – – – – – – – – – –
U.S. Census Bureau estimates
3,843,314 1,083,579 850,110 2,037,554 7,814,557 4,053,429 1,113,853 892,893 2,120,480 8,180,655 7,896,743 2,197,432 1,743,003 4,158,034 15,995,212
CPS estimate 3,785,612 1,145,799 906,792 2,061,044 7,899,247 4,043,338 1,152,290 891,808 2,105,776 8,193,212 7,828,950 2,298,089 1,798,600 4,166,820 16,092,459
Ratio of Census estimate to CPS estimate
1.0152 0.9457 0.9375 0.9886 0.9893 1.0025 0.9666 1.0012 1.0070 0.9985 1.0087 0.9562 0.9691 0.9979 0.9940
Total infants and children aged 1–4
– – – – – – – – – – – – – – –
U.S. Census Bureau estimates
4,787,305 1,347,441 1,059,984 2,544,042 9,738,772 5,042,217 1,389,923 1,112,550 2,651,203 10,195,893 9,829,522 2,737,364 2,172,534 5,195,245 19,934,665
CPS estimate 4,724,893 1,383,845 1,083,894 2,543,414 9,736,046 5,025,542 1,387,351 1,129,705 2,650,584 10,193,181 9,750,435 2,771,196 2,213,599 5,193,998 19,929,227
Ratio of Census estimate to CPS estimate
1.0132 0.9737 0.9779 1.0002 1.0003 1.0033 1.0019 0.9848 1.0002 1.0003 1.0081 0.9878 0.9814 1.0002 1.0003
Notes To calculate WIC eligibility in the CPS data, the age/race/gender specific ratios were applied to the CPS weights by age/race/gender to adjust for the undercount/overcount of children in the CPS relative to the U.S. Census Bureau estimates. The ratios shown in the total columns (by age/race/gender) are for informational purposes only. This table does not include estimates for Puerto Rico and the other U.S. territories. “–“ denotes blank cells. Sources: NBER, n.d.b; U.S. Census Bureau, n.d.a
Insight ▪ Volume II: National- and State-Level Estimates of WIC Eligibility and WIC Program Reach in 2017: Final Report A-13
Table A.3c. Effects of Applying Population Adjustment Factors to Population Counts for Infants and Children in the 2018 CPS-ASEC by Year of Age, Race, and Gender
Participant Category
Male Female Total
White-
Only,
Non-
Hispanic
Black-
Only,
Non-
Hispanic
Other,
Non-
Hispanic
Hispanic Total
White-
Only,
Non-
Hispanic
Black-
Only,
Non-
Hispanic
Other,
Non-
Hispanic
Hispanic Total
White-
Only,
Non-
Hispanic
Black-
Only,
Non-
Hispanic
Other,
Non-
Hispanic
Hispanic Total
Infants
Population adjustment factor
1.007 1.118 0.979 1.000 N/A 1.005 1.103 1.125 1.018 N/A N/A N/A N/A N/A N/A
Revised CPS estimate
988,785 262,728 232,995 544,807 2,029,315 943,977 262,469 199,169 490,909 1,896,524 1,932,762 525,197 432,164 1,035,716 3,925,839
Original CPS estimate
982,204 235,061 237,896 544,807 1,999,968 939,281 238,046 177,102 482,371 1,836,799 1,921,485 473,107 414,998 1,027,178 3,836,768
Percent relative change
0.7 11.8 -2.1 0.0 1.5 0.5 10.3 12.5 1.8 3.3 0.6 11.0 4.1 0.8 2.3
Children aged 1
Population adjustment factor
1.008 0.879 0.890 0.975 N/A 1.008 0.879 0.890 0.975 N/A N/A N/A N/A N/A N/A
Revised CPS
estimate 999,369 287,997 218,858 493,574 1,999,798 944,986 278,098 208,559 517,732 1,949,374 1,944,354 566,095 427,417 1,011,307 3,949,172
Original CPS estimate
997,772 328,839 222,078 490,143 2,038,832 937,765 316,524 234,441 531,225 2,019,955 1,935,537 645,362 456,519 1,021,369 4,058,788
Percent relative change
0.2 -12.4 -1.5 0.7 -1.9 0.8 -12.1 -11.0 -2.5 -3.5 0.5 -12.3 -6.4 -1.0 -2.7
Children aged 2
Population adjustment factor
1.012 1.000 1.000 1.000 N/A 1.012 1.000 1.000 1.000 N/A N/A N/A N/A N/A N/A
Revised CPS estimate
1,012,544 285,861 236,334 540,726 2,075,465 953,525 269,287 192,484 519,419 1,934,715 1,966,068 555,148 428,819 1,060,144 4,010,180
Original CPS estimate
1,012,139 285,861 238,168 549,462 2,085,630 942,497 269,287 192,484 519,419 1,923,688 1,954,636 555,148 430,653 1,068,881 4,009,318
Percent relative change
0.0 0.0 -0.8 -1.6 -0.5 1.2 0.0 0.0 0.0 0.6 0.6 0.0 -0.4 -0.8 0.0
Children aged 3
Population adjustment factor
1.016 0.932 0.919 1.000 N/A 1.016 0.932 0.919 1.000 N/A N/A N/A N/A N/A N/A
Revised CPS
estimate 1,019,674 280,665 220,242 532,020 2,052,601 968,324 283,251 220,831 511,667 1,984,073 1,987,998 563,916 441,074 1,043,686 4,036,674
Original CPS estimate
1,015,814 279,519 220,242 532,020 2,047,595 953,168 304,015 240,165 511,667 2,009,015 1,968,982 583,534 460,407 1,043,686 4,056,610
Percent relative change
0.4 0.4 0.0 0.0 0.2 1.6 -6.8 -8.1 0.0 -1.2 1.0 -3.4 -4.2 0.0 -0.5
Children aged 4
Population adjustment factor
1.012 1.031 0.990 1.013 N/A 1.012 1.031 0.990 1.013 N/A N/A N/A N/A N/A N/A
Revised CPS estimate
1,017,613 258,071 211,320 534,151 2,021,155 963,513 264,010 237,424 505,216 1,970,164 1,981,125 522,081 448,744 1,039,368 3,991,319
Original CPS estimate
1,017,613 258,071 211,320 534,151 2,021,155 952,182 255,973 239,702 498,733 1,946,589 1,969,794 514,044 451,021 1,032,884 3,967,744
Percent relative change
0.0 0.0 0.0 0.0 0.0 1.2 3.1 -1.0 1.3 1.2 0.6 1.6 -0.5 0.6 0.6
Insight ▪ Volume II: National- and State-Level Estimates of WIC Eligibility and WIC Program Reach in 2017: Final Report A-14
Participant Category
Male Female Total
White-
Only,
Non-
Hispanic
Black-
Only,
Non-
Hispanic
Other,
Non-
Hispanic
Hispanic Total
White-
Only,
Non-
Hispanic
Black-
Only,
Non-
Hispanic
Other,
Non-
Hispanic
Hispanic Total
White-
Only,
Non-
Hispanic
Black-
Only,
Non-
Hispanic
Other,
Non-
Hispanic
Hispanic Total
Total children aged 1–4
Population adjustment factor
N/A N/A N/A N/A N/A N/A N/A N/A N/A N/A N/A N/A N/A N/A N/A
Revised CPS estimate
4,049,199 1,112,594 886,755 2,100,471 8,149,019 3,830,347 1,094,646 859,299 2,054,034 7,838,326 7,879,546 2,207,240 1,746,054 4,154,505 15,987,345
Original CPS estimate
4,043,338 1,152,289 891,809 2,105,777 8,193,212 3,785,612 1,145,799 906,792 2,061,044 7,899,247 7,828,950 2,298,088 1,798,600 4,166,820 16,092,459
Percent relative change
0.1 -3.4 -0.6 -0.3 -0.5 1.2 -4.5 -5.2 -0.3 -0.8 0.6 -4.0 -2.9 -0.3 -0.7
Total
infants and children aged 1–4
Population adjustment factor
N/A N/A N/A N/A N/A N/A N/A N/A N/A N/A N/A N/A N/A N/A N/A
Revised CPS
estimate 5,037,984 1,375,322 1,119,750 2,645,279 10,178,334 4,774,324 1,357,116 1,058,468 2,544,943 9,734,850 9,812,307 2,732,437 2,178,218 5,190,221 19,913,184
Original CPS estimate
5,025,542 1,387,351 1,129,705 2,650,584 10,193,181 4,724,893 1,383,845 1,083,894 2,543,414 9,736,046 9,750,435 2,771,195 2,213,598 5,193,998 19,929,227
Percent relative change
0.2 -0.9 -0.9 -0.2 -0.1 1.0 -1.9 -2.3 0.1 0.0 0.6 -1.4 -1.6 -0.1 -0.1
Notes To calculate WIC eligibility in the CPS data, the age/race/gender specific ratios were applied to the CPS weights by age/race/gender to adjust for the undercount/overcount of children in the CPS estimates relative to the U.S. Census Bureau estimates. The ratios shown in the total columns (by age/race/gender) are for informational purposes only. This table does not include estimates for Puerto Rico and the other U.S. territories. “–“ denotes blank cells. N/A = not applicable Sources: NBER, n.d.b; U.S. Census Bureau, n.d.a
Insight ▪ Volume II: National- and State-Level Estimates of WIC Eligibility and WIC Program Reach in 2017: Final Report A-15
Table A.4. Breastfeeding Adjustment Factor Calculations for Postpartum Women Eligible for WIC: CY 2005–CY 2017
Adjustments
Breastfeeding Rates Among Postpartum Women Eligible for WIC by Race and Ethnicity
2005 2006 2007 2008 2009 2010 2011 2012 2013 2014 2015 2016 2017
Breastfeeding in hospital – – – – – – – – – – – – –
White-Only Non-Hispanic 0.647 0.629 0.636 0.616 0.655 0.633 0.668 0.677 0.716 0.751 0.744 0.762 0.775
Black-Only Non-Hispanic 0.497 0.477 0.537 0.500 0.517 0.531 0.576 0.609 0.576 0.635 0.636 0.659 0.661
Other Non-Hispanic 0.633 0.663 0.678 0.709 0.657 0.674 0.694 0.698 0.689 0.660 0.716 0.723 0.779
Hispanic 0.801 0.804 0.804 0.816 0.796 0.785 0.791 0.778 0.832 0.810 0.818 0.838 0.832
Breastfeeding at 6 months – – – – – – – – – – – – –
White-Only Non-Hispanic 0.280 0.297 0.306 0.316 0.327 0.329 0.343 0.342 0.381 0.412 0.423 0.438 0.462
Black-Only Non-Hispanic 0.204 0.213 0.240 0.221 0.229 0.238 0.304 0.324 0.297 0.311 0.036 0.383 0.408
Other Non-Hispanic 0.307 0.349 0.341 0.336 0.333 0.352 0.398 0.410 0.412 0.364 0.430 0.450 0.474
Hispanic 0.400 0.441 0.474 0.472 0.439 0.443 0.458 0.458 0.460 0.487 0.414 0.488 0.524
Breastfeeding at 12 months – – – – – – – – – – – – –
White-Only Non-Hispanic 0.149 0.141 0.137 0.155 0.180 0.181 0.186 0.187 0.209 0.240 0.259 0.284 0.291
Black-Only Non-Hispanic 0.092 0.092 0.121 0.087 0.100 0.081 0.140 0.119 0.126 0.137 0.174 0.186 0.219
Other Non-Hispanic 0.167 0.214 0.184 0.222 0.174 0.190 0.215 0.236 0.263 0.176 0.234 0.257 0.299
Hispanic 0.216 0.234 0.256 0.270 0.241 0.272 0.251 0.255 0.241 0.256 0.246 0.291 0.314
Other Adjustment Factors
Multiple births/infant deathsa
0.996 0.996 0.996 0.996 0.996 0.996 0.996 0.996 0.996 0.996 0.996 0.996 –
White-Only Non-Hispanic – – – – – – – – – – – – 0.991
Black-Only Non-Hispanic – – – – – – – – – – – – 1.002
Other Non-Hispanic – – – – – – – – – – – – 0.994
Hispanic – – – – – – – – – – – – 0.998
Loss of eligibility at 6 months
0.940 0.947 0.953 0.960 0.967 0.973 0.980 0.987 0.993 1.000 1.000 1.000 1.000
Adjustment to average breastfeeding
0.870 0.870 0.870 0.870 0.870 0.870 0.870 0.870 0.870 0.870 0.870 0.870 0.870
Insight ▪ Volume II: National- and State-Level Estimates of WIC Eligibility and WIC Program Reach in 2017: Final Report A-16
Adjustments
Breastfeeding Rates Among Postpartum Women Eligible for WIC by Race and Ethnicity
2005 2006 2007 2008 2009 2010 2011 2012 2013 2014 2015 2016 2017
Final Adjustment Factors for Estimating Postpartum Eligibility From Estimate of Infant Eligibility
Breastfeeding adjustment factor
– – – – – – – – – – – – –
White-Only Non-Hispanic 0.303 0.305 0.310 0.316 0.336 0.333 0.349 0.352 0.385 0.416 0.424 0.442 0.457
Black-Only Non-Hispanic 0.222 0.222 0.255 0.231 0.242 0.245 0.300 0.312 0.295 0.317 0.349 0.369 0.389
Other Non-Hispanic 0.316 0.353 0.347 0.361 0.338 0.355 0.388 0.400 0.407 0.358 0.416 0.432 0.466
Hispanic 0.406 0.431 0.452 0.458 0.433 0.441 0.445 0.445 0.455 0.468 0.438 0.483 0.504
Non-breastfeeding adjustment factor
– – – – – – – – – – – – –
White-Only Non-Hispanic 0.298 0.299 0.295 0.297 0.286 0.291 0.280 0.278 0.261 0.247 0.246 0.239 0.231
Black-Only Non-Hispanic 0.347 0.350 0.331 0.343 0.338 0.333 0.309 0.297 0.310 0.294 0.284 0.273 0.268
Other Non-Hispanic 0.296 0.280 0.278 0.273 0.285 0.277 0.263 0.259 0.260 0.277 0.252 0.245 0.228
Hispanic 0.239 0.229 0.222 0.220 0.232 0.233 0.228 0.231 0.219 0.218 0.228 0.212 0.205
Notes a See appendix E for an explanation of the updated and expanded adjustment factor for multiple births and infant deaths for the 2017 estimates. “–“ denotes blank cells. Sources: National Center for Health Statistics, n.d.; unpublished internal CDC data
Insight ▪ Volume II: National- and State-Level Estimates of WIC Eligibility and WIC Program Reach in 2017: Final Report A-17
Table A.5. Step-by-Step Adjustments Applied to CPS-ASEC Data to Derive the Average Monthly Number of Individuals Eligible for WIC by Participant Category: CY 2017
Step Infants
All
Children
Aged 1-4
Children
Aged 1
Children
Aged 2
Children
Aged 3
Children
Aged 4
Pregnant
Women
Breastfeeding
Women
Non-
Breastfeeding
Women
Total
Total number of infants/ children in CPS-ASEC data
3,836,768 16,092,459 4,058,788 4,009,318 4,056,610 3,967,744 _ _ _ 19,929,227
Number after adjustment for CPS undercount/ overcount
3,925,839 15,987,345 3,949,172 4,010,180 4,036,674 3,991,319 _ _ _ 19,913,184
Number with annual income <= 185 percent of the Federal Poverty Guidelines
1,418,737 5,835,505 1,456,187 1,523,015 1,480,131 1,376,172 _ _ _ 7,254,242
Number adjunctively eligible and with annual income > 185 percent of the Federal Poverty Guidelinesa
606,715 2,551,502 673,120 629,161 596,036 653,185 _ _ _ 3,158,216
Through SNAP 139,217 413,416 102,374 108,822 92,311 109,909 _ _ _ 552,633
Through TANF 2,297 27,240 8,682 8,081 3,456 7,021 _ _ _ 29,538
Through Medicaid 465,200 2,110,846 562,064 512,259 500,268 536,255 _ _ _ 2,576,046
Total number income and adjunctively eligible
2,025,452 8,387,007 2,129,307 2,152,177 2,076,166 2,029,357 _ _ _ 10,412,459
Number after adjustment for monthly income and certification periods
2,263,205 8,822,071 2,241,517 2,262,836 2,183,234 2,134,484 _ _ _ 11,085,276
Total number eligible: Number after adjustment for nutritional risk (infants and children)
2,195,309 8,733,851 2,219,101 2,240,208 2,161,402 2,113,139 _ _ _ 10,929,159
Starting point for estimates of women is number of eligible infants
_ _ _ _ _ _ 2,195,309 2,195,309 2,195,309 6,585,926
Number after adjustment for length of pregnancy and income of woman during pregnancy
_ _ _ _ _ _ 1,481,833 _ _ 1,481,833
Number after adjustment for multiple births and infant deaths
_ _ _ _ _ _ 1,475,076 2,185,298 2,185,298 5,845,673
Number after adjustment for breastfeeding
_ _ _ _ _ _ _ 1,013,819 496,751 1,510,570
Insight ▪ Volume II: National- and State-Level Estimates of WIC Eligibility and WIC Program Reach in 2017: Final Report A-18
Step Infants
All
Children
Aged 1-4
Children
Aged 1
Children
Aged 2
Children
Aged 3
Children
Aged 4
Pregnant
Women
Breastfeeding
Women
Non-
Breastfeeding
Women
Total
Total number eligible: Number after adjustment for nutritional risk (pregnant and postpartum women)
_ _ _ _ _ _ 1,430,824 1,013,819 496,751 2,941,394
Total number eligible in the 50 States and the District of Columbia, excluding the U.S. territories served by WIC
2,195,309 8,733,851 2,219,101 2,240,208 2,161,402 2,113,139 1,430,824 1,013,819 496,751 13,870,554
Total number eligible in all U.S. territories served by WICb
32,657 125,151 31,191 27,921 33,524 32,515 21,320 15,043 7,424 201,594
Total number eligible in the 50 States, the District of Columbia, Puerto Rico, and the other U.S. territories served by WIC
2,227,965 8,859,001 2,250,293 2,268,129 2,194,926 2,145,654 1,452,144 1,028,863 504,175 14,072,148
Notes a Adjunctive eligibility was counted by the first program that qualified the person for WIC, in this order: SNAP, TANF, and Medicaid. b See appendix B in volume II for the derivation of WIC eligibility in U.S. territories. “–“ denotes blank cells. Sources: IPUMS-USA, n.d.; NBER, n.d.b; U.S. Census Bureau, n.d.c; Thorn et al., 2018
Insight ▪ Volume II: National- and State-Level Estimates of WIC Eligibility and WIC Program Reach in 2017: Final Report A-19
Table A.6a1. Estimated Average Monthly Numbers of Infants, and Children by Year of Age, Eligible for WIC by Demographic and Income Characteristics and Adjunctive Eligibility: CY 2017 (Unadjusted Weights, Counts)
Characteristics
Infants
Eligible for WIC
Children Aged 1
Eligible for WIC
Children Aged 2
Eligible for WIC
Family
Income ≤
185% FPGa
Adjunctively
Eligible
>185% FPGb
Total
Family
Income
≤ 185% FPGa
Adjunctively
Eligible
>185% FPGb
Total
Family
Income
≤ 185% FPGa
Adjunctively
Eligible
>185% FPGb
Total
Total 1,381,158 594,054 1,975,212 1,511,343 690,612 2,201,955 1,525,164 629,750 2,154,914
Gender – – – – – – – – –
Male 737,296 323,032 1,060,327 735,389 377,690 1,113,079 794,923 338,450 1,133,374
Female 643,862 271,022 914,885 775,954 312,922 1,088,876 730,241 291,300 1,021,541
Race
White 899,823 460,657 1,360,480 946,608 499,473 1,446,081 933,117 476,217 1,409,334
Black 272,801 69,190 341,991 373,979 105,887 479,867 377,342 80,416 457,758
Other 208,533 64,207 272,740 190,756 85,251 276,007 214,705 73,116 287,821
Ethnicity – – – – – – – – –
Hispanic 573,264 164,613 737,876 536,010 184,176 720,186 520,463 219,677 740,140
Non-Hispanic 807,894 429,441 1,237,335 975,333 506,436 1,481,769 1,004,701 410,073 1,414,774
Living arrangement – – – – – – – – –
Two-parent family 817,674 437,480 1,255,154 817,696 488,025 1,305,721 778,846 444,061 1,222,908
Single-parent family 498,854 144,468 643,322 616,006 160,123 776,129 658,579 162,684 821,262
No-parent family 64,630 12,106 76,736 77,640 42,464 120,104 87,739 23,005 110,744
Related nonparent caretaker 22,802 12,106 34,907 40,805 42,464 83,269 49,428 23,005 72,433
Unrelated nonparent caretaker 41,828 0 41,828 36,835 0 36,835 38,311 0 38,311
Military status of household members – – – – – – – – –
Ever served in U.S. military 74,952 59,829 134,781 48,119 84,122 132,240 79,677 53,779 133,456
Serving in U.S. military in 2017c 34,297 6,483 40,779 22,126 10,250 32,377 26,944 7,630 34,574
Number of people in household – – – – – – – – –
2 67,353 10,763 78,116 86,920 14,189 101,109 90,807 14,075 104,882
3 320,944 191,007 511,951 290,203 211,468 501,671 280,675 143,567 424,242
4 343,081 173,330 516,410 386,238 181,938 568,176 407,585 226,174 633,759
5 314,281 103,119 417,400 340,235 157,842 498,078 340,979 125,627 466,606
6 or more 335,500 115,835 451,335 407,747 125,174 532,921 405,119 120,308 525,426
Insight ▪ Volume II: National- and State-Level Estimates of WIC Eligibility and WIC Program Reach in 2017: Final Report A-20
Characteristics
Infants
Eligible for WIC
Children Aged 1
Eligible for WIC
Children Aged 2
Eligible for WIC
Family
Income ≤
185% FPGa
Adjunctively
Eligible
>185% FPGb
Total
Family
Income
≤ 185% FPGa
Adjunctively
Eligible
>185% FPGb
Total
Family
Income
≤ 185% FPGa
Adjunctively
Eligible
>185% FPGb
Total
Mean 4.6 4.3 4.5 4.7 4.4 4.6 4.7 4.4 4.6
Number with working parent(s) 927,721 497,158 1,424,879 1,009,730 564,657 1,574,386 1,131,075 557,710 1,688,785
Annual family income relative to FPG – – – – – – – – –
No income 90,494 0 90,494 118,221 0 118,221 100,500 0 100,500
Up to 50% FPG 254,063 0 254,063 245,099 0 245,099 220,807 0 220,807
More than 50% up to 100% FPG 409,471 0 409,471 393,703 0 393,703 396,153 0 396,153
More than 100% up to 130% FPG 254,545 0 254,545 271,653 0 271,653 334,310 0 334,310
More than 130% up to 150% FPG 154,442 0 154,442 198,253 0 198,253 148,437 0 148,437
More than 150% up to 185% FPG 218,143 0 218,143 284,413 0 284,413 324,957 0 324,957
More than 185% up to 200% FPG 0 57,017 57,017 0 70,720 70,720 0 62,067 62,067
More than 200% FPG 0 537,037 537,037 0 619,892 619,892 0 567,683 567,683
Receipt of other benefits – – – – – – – – –
No benefit receipt 307,601 0 307,601 315,221 0 315,221 360,524 0 360,524
Medicaid, SNAP, and TANF 66,355 9,840 76,195 76,928 4,943 81,871 74,470 1,758 76,228
SNAP and TANF only 0 0 0 0 0 0 0 0 0
Medicaid and SNAP only 369,871 107,178 477,049 562,617 75,795 638,412 552,392 90,819 643,210
Medicaid and TANF only 3,823 2,257 6,080 9,291 8,668 17,959 4,381 8,146 12,526
SNAP only 113,703 17,602 131,306 98,920 26,077 124,996 76,420 16,414 92,835
TANF only 0 0 0 0 0 0 0 0 0
Medicaid only 519,806 457,176 976,982 448,366 575,129 1,023,496 456,977 512,613 969,590
Notes a The WIC economic unit is defined as all individuals in the CPS-ASEC household who are related by blood, marriage, or adoption, plus the unmarried partner of any family member as well as that partner’s dependents. Infants and children in economic units with annual income less than or equal to 185 percent of the Federal Poverty Guidelines for the unit’s size are income-eligible for WIC. b Adjunctively income-eligible infants and children were in economic units that reported participating in Medicaid, SNAP, or TANF during the prior year and had annual income exceeding 185 percent of the Federal Poverty Guidelines for the unit’s size.
c The military status of household members who were currently serving in the U.S. military was included only if they resided in civilian housing on or off a military base. These estimates were tabulated from the unadjusted person weights for the CPS-ASEC data. They are not adjusted to account for the undercount/overcount of infants and children in the CPS relative to U.S. Census Bureau estimates, monthly income, or nutritional risk. This table does not include estimates for Puerto Rico and the other U.S. territories. FPG = Federal Poverty Guidelines “–“ denotes blank cells. Source: NBER, n.d.b
Insight ▪ Volume II: National- and State-Level Estimates of WIC Eligibility and WIC Program Reach in 2017: Final Report A-21
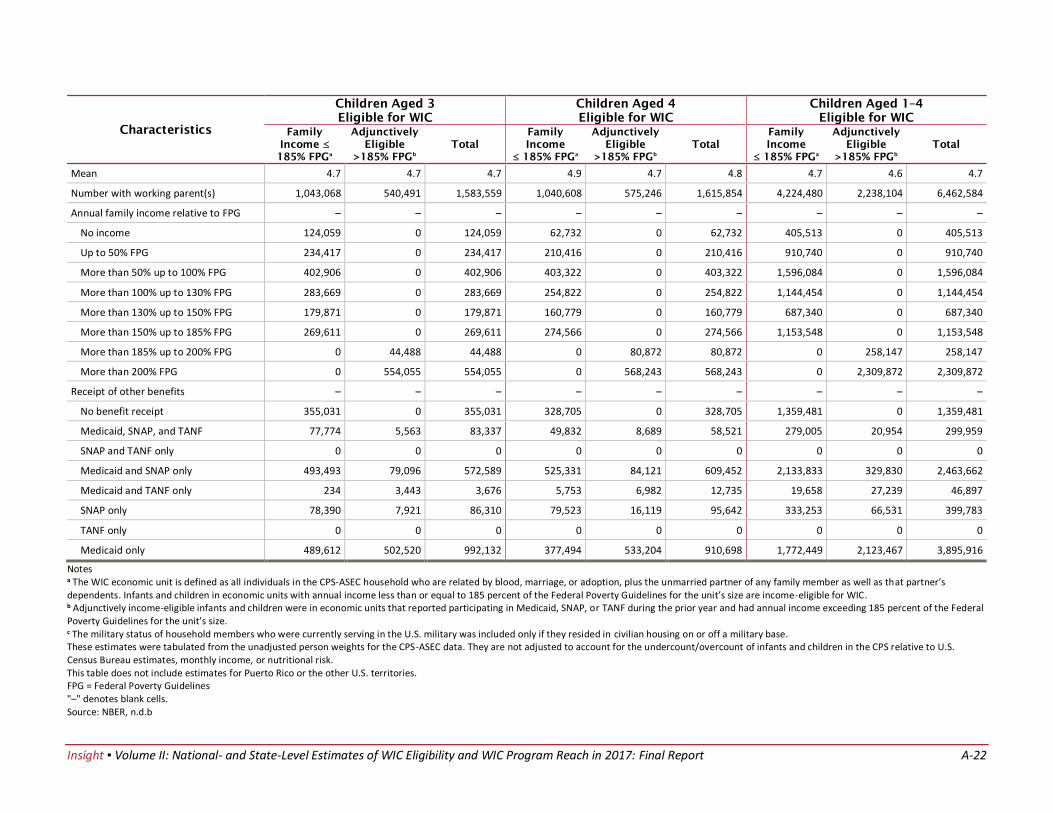
Table A.6a1 (continued). Estimated Average Monthly Numbers of Infants, and Children by Year of Age, Eligible for WIC by Demographic and Income Characteristics and Adjunctive Eligibility: CY 2017 (Unadjusted Weights, Counts)
Characteristics
Children Aged 3
Eligible for WIC
Children Aged 4
Eligible for WIC
Children Aged 1–4
Eligible for WIC
Family
Income ≤
185% FPGa
Adjunctively
Eligible
>185% FPGb
Total
Family
Income
≤ 185% FPGa
Adjunctively
Eligible
>185% FPGb
Total
Family
Income
≤ 185% FPGa
Adjunctively
Eligible
>185% FPGb
Total
Total 1,494,534 598,542 2,093,076 1,366,638 649,115 2,015,753 5,897,678 2,568,019 8,465,698
Gender – – – – – – – – –
Male 711,706 293,363 1,005,069 700,060 311,698 1,011,758 2,942,079 1,321,201 4,263,280
Female 782,827 305,179 1,088,006 666,578 337,417 1,003,995 2,955,599 1,246,818 4,202,418
Race – – – – – – – – –
White 927,295 450,219 1,377,513 863,116 466,267 1,329,383 3,670,136 1,892,176 5,562,312
Black 355,080 84,180 439,260 315,617 107,850 423,467 1,422,018 378,334 1,800,352
Other 212,159 64,144 276,302 187,905 74,998 262,902 805,524 297,509 1,103,033
Ethnicity – – – – – – – – –
Hispanic 529,407 185,720 715,128 466,225 230,654 696,879 2,052,105 820,227 2,872,332
Non-Hispanic 965,126 412,822 1,377,948 900,413 418,461 1,318,874 3,845,573 1,747,792 5,593,365
Living arrangement – – – – – – – – –
Two-parent family 781,745 437,542 1,219,287 724,787 425,612 1,150,398 3,103,075 1,795,240 4,898,315
Single-parent family 604,985 131,876 736,861 569,706 194,738 764,444 2,449,276 649,421 3,098,697
No-parent family 107,803 29,124 136,927 72,145 28,765 100,910 345,328 123,358 468,686
Related nonparent caretaker 75,029 29,124 104,153 42,456 28,765 71,221 207,719 123,358 331,077
Unrelated nonparent caretaker 32,774 0 32,774 29,689 0 29,689 137,609 0 137,609
Military status of household members – – – – – – – – –
Ever served in U.S. military 75,878 77,683 153,561 66,133 75,554 141,688 269,806 291,138 560,944
Serving in U.S. military in 2017c 37,084 4,844 41,928 14,018 1,707 15,725 100,172 24,431 124,604
Number of people in household – – – – – – – – –
2 80,579 5,870 86,449 91,152 20,833 111,985 349,458 54,967 404,425
3 263,212 121,271 384,482 179,203 100,109 279,313 1,013,292 576,415 1,589,708
4 412,327 191,139 603,465 379,584 207,946 587,529 1,585,734 807,196 2,392,930
5 336,678 136,573 473,251 291,636 154,561 446,197 1,309,528 574,603 1,884,131
6 or more 401,739 143,690 545,428 425,063 165,666 590,728 1,639,667 554,837 2,194,504
Insight ▪ Volume II: National- and State-Level Estimates of WIC Eligibility and WIC Program Reach in 2017: Final Report A-22
Characteristics
Children Aged 3
Eligible for WIC
Children Aged 4
Eligible for WIC
Children Aged 1–4
Eligible for WIC
Family
Income ≤
185% FPGa
Adjunctively
Eligible
>185% FPGb
Total
Family
Income
≤ 185% FPGa
Adjunctively
Eligible
>185% FPGb
Total
Family
Income
≤ 185% FPGa
Adjunctively
Eligible
>185% FPGb
Total
Mean 4.7 4.7 4.7 4.9 4.7 4.8 4.7 4.6 4.7
Number with working parent(s) 1,043,068 540,491 1,583,559 1,040,608 575,246 1,615,854 4,224,480 2,238,104 6,462,584
Annual family income relative to FPG – – – – – – – – –
No income 124,059 0 124,059 62,732 0 62,732 405,513 0 405,513
Up to 50% FPG 234,417 0 234,417 210,416 0 210,416 910,740 0 910,740
More than 50% up to 100% FPG 402,906 0 402,906 403,322 0 403,322 1,596,084 0 1,596,084
More than 100% up to 130% FPG 283,669 0 283,669 254,822 0 254,822 1,144,454 0 1,144,454
More than 130% up to 150% FPG 179,871 0 179,871 160,779 0 160,779 687,340 0 687,340
More than 150% up to 185% FPG 269,611 0 269,611 274,566 0 274,566 1,153,548 0 1,153,548
More than 185% up to 200% FPG 0 44,488 44,488 0 80,872 80,872 0 258,147 258,147
More than 200% FPG 0 554,055 554,055 0 568,243 568,243 0 2,309,872 2,309,872
Receipt of other benefits – – – – – – – – –
No benefit receipt 355,031 0 355,031 328,705 0 328,705 1,359,481 0 1,359,481
Medicaid, SNAP, and TANF 77,774 5,563 83,337 49,832 8,689 58,521 279,005 20,954 299,959
SNAP and TANF only 0 0 0 0 0 0 0 0 0
Medicaid and SNAP only 493,493 79,096 572,589 525,331 84,121 609,452 2,133,833 329,830 2,463,662
Medicaid and TANF only 234 3,443 3,676 5,753 6,982 12,735 19,658 27,239 46,897
SNAP only 78,390 7,921 86,310 79,523 16,119 95,642 333,253 66,531 399,783
TANF only 0 0 0 0 0 0 0 0 0
Medicaid only 489,612 502,520 992,132 377,494 533,204 910,698 1,772,449 2,123,467 3,895,916
Notes a The WIC economic unit is defined as all individuals in the CPS-ASEC household who are related by blood, marriage, or adoption, plus the unmarried partner of any family member as well as that partner’s dependents. Infants and children in economic units with annual income less than or equal to 185 percent of the Federal Poverty Guidelines for the unit’s size are income-eligible for WIC. b Adjunctively income-eligible infants and children were in economic units that reported participating in Medicaid, SNAP, or TANF during the prior year and had annual income exceeding 185 percent of the Federal Poverty Guidelines for the unit’s size. c The military status of household members who were currently serving in the U.S. military was included only if they resided in civilian housing on or off a military base. These estimates were tabulated from the unadjusted person weights for the CPS-ASEC data. They are not adjusted to account for the undercount/overcount of infants and children in the CPS relative to U.S. Census Bureau estimates, monthly income, or nutritional risk. This table does not include estimates for Puerto Rico or the other U.S. territories. FPG = Federal Poverty Guidelines "–" denotes blank cells. Source: NBER, n.d.b
Insight ▪ Volume II: National- and State-Level Estimates of WIC Eligibility and WIC Program Reach in 2017: Final Report A-23
Table A.6a2. Estimated Average Monthly Numbers of Infants, and Children by Year of Age, Eligible for WIC by Demographic and Income Characteristics and Adjunctive Eligibility: CY 2017 (Unadjusted Weights, Percentages)
Characteristics
Infants
Eligible for WIC
Children Aged 1
Eligible for WIC
Children Aged 2
Eligible for WIC
Family
Income
≤ 185% FPGa
Adjunctively
Eligible
>185% FPGb
Total
Family
Income
≤ 185% FPGa
Adjunctively
Eligible
>185% FPGb
Total
Family
Income
≤ 185% FPGa
Adjunctively
Eligible
>185% FPGb
Total
Total 1,381,158 594,054 1,975,212 1,511,343 690,612 2,201,955 1,525,164 629,750 2,154,914
Gender – – – – – – – – –
Male 53.4 54.4 53.7 48.7 54.7 50.6 52.1 53.7 52.6
Female 46.6 45.6 46.3 51.3 45.3 49.5 47.9 46.3 47.4
Race – – – – – – – – –
White 65.2 77.5 68.9 62.6 72.3 65.7 61.2 75.6 65.4
Black 19.8 11.6 17.3 24.7 15.3 21.8 24.7 12.8 21.2
Other 15.1 10.8 13.8 12.6 12.3 12.5 14.1 11.6 13.4
Ethnicity – – – – – – – – –
Hispanic 41.5 27.7 37.4 35.5 26.7 32.7 34.1 34.9 34.3
Non-Hispanic 58.5 72.3 62.6 64.5 73.3 67.3 65.9 65.1 65.7
Living arrangement – – – – – – – – –
Two-parent family 59.2 73.6 63.5 54.1 70.7 59.3 51.1 70.5 56.8
Single-parent family 36.1 24.3 32.6 40.8 23.2 35.2 43.2 25.8 38.1
No-parent family 4.7 2.0 3.9 5.1 6.1 5.5 5.8 3.7 5.1
Related nonparent caretaker 1.7 2.0 1.8 2.7 6.1 3.8 3.2 3.7 3.4
Unrelated nonparent caretaker 3.0 0.0 2.1 2.4 0.0 1.7 2.5 0.0 1.8
Military status of household members – – – – – – – – –
Ever served in U.S. military 5.4 10.1 6.8 3.2 12.2 6.0 5.2 8.5 6.2
Serving in U.S. military in 2017c 2.5 1.1 2.1 1.5 1.5 1.5 1.8 1.2 1.6
Number of people in household – – – – – – – – –
2 4.9 1.8 4.0 5.8 2.1 4.6 6.0 2.2 4.9
3 23.2 32.2 25.9 19.2 30.6 22.8 18.4 22.8 19.7
4 24.8 29.2 26.1 25.6 26.3 25.8 26.7 35.9 29.4
5 22.8 17.4 21.1 22.5 22.9 22.6 22.4 19.9 21.7
6 or more 24.3 19.5 22.9 27.0 18.1 24.2 26.6 19.1 24.4
Insight ▪ Volume II: National- and State-Level Estimates of WIC Eligibility and WIC Program Reach in 2017: Final Report A-24
Characteristics
Infants
Eligible for WIC
Children Aged 1
Eligible for WIC
Children Aged 2
Eligible for WIC
Family
Income
≤ 185% FPGa
Adjunctively
Eligible
>185% FPGb
Total
Family
Income
≤ 185% FPGa
Adjunctively
Eligible
>185% FPGb
Total
Family
Income
≤ 185% FPGa
Adjunctively
Eligible
>185% FPGb
Total
Percent with working parent(s) 67.2 83.7 72.1 66.8 81.8 71.5 74.2 88.6 78.4
Annual family income relative to FPG – – – – – – – – –
No income 6.6 0.0 4.6 7.8 0.0 5.4 6.6 0.0 4.7
Up to 50% FPG 18.4 0.0 12.9 16.2 0.0 11.1 14.5 0.0 10.2
More than 50% up to 100% FPG 29.6 0.0 20.7 26.1 0.0 17.9 26.0 0.0 18.4
More than 100% up to 130% FPG 18.4 0.0 12.9 18.0 0.0 12.3 21.9 0.0 15.5
More than 130% up to 150% FPG 11.2 0.0 7.8 13.1 0.0 9.0 9.7 0.0 6.9
More than 150% up to 185% FPG 15.8 0.0 11.0 18.8 0.0 12.9 21.3 0.0 15.1
More than 185% up to 200% FPG 0.0 9.6 2.9 0.0 10.2 3.2 0.0 9.9 2.9
More than 200% FPG 0.0 90.4 27.2 0.0 89.8 28.2 0.0 90.1 26.3
Receipt of other benefits – – – – – – – – –
No benefit receipt 22.3 0.0 15.6 20.9 0.0 14.3 23.6 0.0 16.7
SNAP, TANF, and Medicaid 4.8 1.7 3.9 5.1 0.7 3.7 4.9 0.3 3.5
SNAP and TANF only 0.0 0.0 0.0 0.0 0.0 0.0 0.0 0.0 0.0
SNAP and Medicaid only 26.8 18.0 24.2 37.2 11.0 29.0 36.2 14.4 29.8
TANF and Medicaid only 0.3 0.4 0.3 0.6 1.3 0.8 0.3 1.3 0.6
SNAP only 8.2 3.0 6.6 6.5 3.8 5.7 5.0 2.6 4.3
TANF only 0.0 0.0 0.0 0.0 0.0 0.0 0.0 0.0 0.0
Medicaid only 37.6 77.0 49.5 29.7 83.3 46.5 30.0 81.4 45.0
Notes a The WIC economic unit is defined as all individuals in the CPS-ASEC household who are related by blood, marriage, or adoption, plus the unmarried partner of any family member as well as that partner’s dependents. Infants and children in economic units with annual income less than or equal to 185 percent of the Federal Poverty Guidelines for the unit’s size are income-eligible for WIC. b Adjunctively income-eligible infants and children were in economic units that reported participating in Medicaid, SNAP, or TANF during the prior year and had annual income exceeding 185 percent of the Federal Poverty Guidelines for the unit’s size. c The military status of household members who were currently serving in the U.S. military was included only if they resided in civilian housing on or off a military base. These estimates were tabulated from the unadjusted person weights for the CPS-ASEC data. They are not adjusted to account for the undercount/overcount of infants and children in the CPS relative to U.S. Census Bureau estimates, monthly income, or nutritional risk. This table does not include estimates for Puerto Rico or the other U.S. territories. FPG = Federal Poverty Guidelines "–" denotes blank cells. Source: NBER, n.d.b
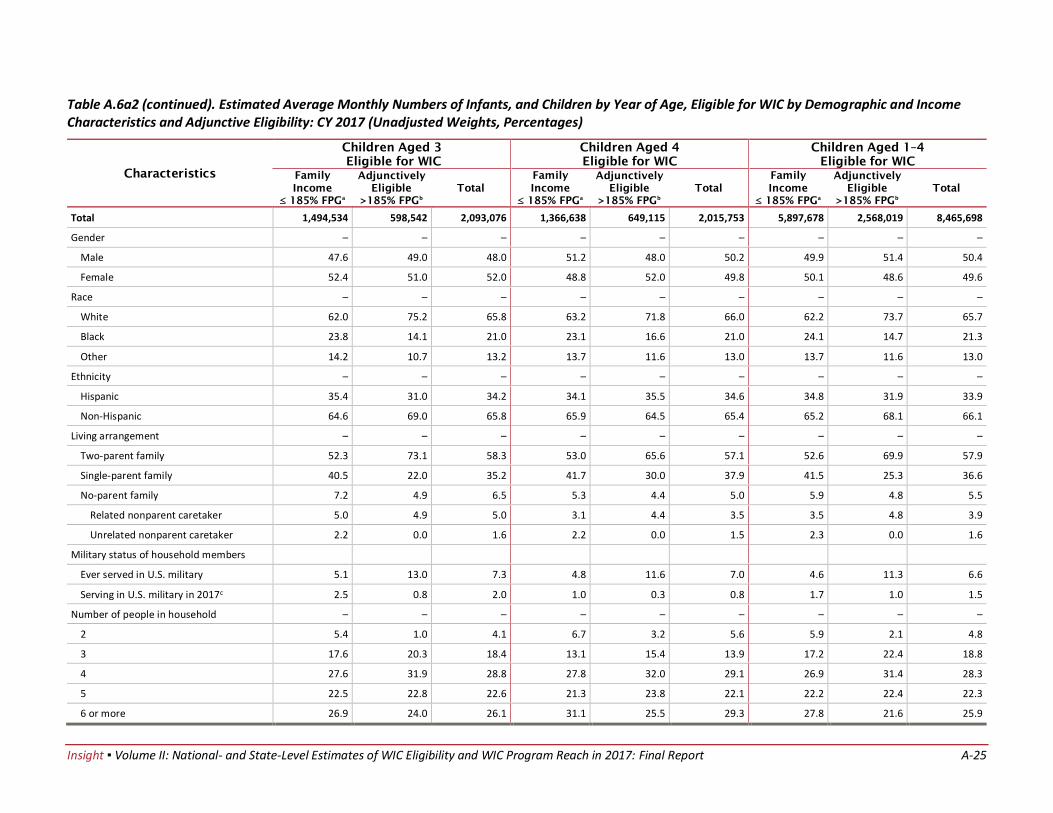
Insight ▪ Volume II: National- and State-Level Estimates of WIC Eligibility and WIC Program Reach in 2017: Final Report A-25
Table A.6a2 (continued). Estimated Average Monthly Numbers of Infants, and Children by Year of Age, Eligible for WIC by Demographic and Income Characteristics and Adjunctive Eligibility: CY 2017 (Unadjusted Weights, Percentages)
Characteristics
Children Aged 3
Eligible for WIC
Children Aged 4
Eligible for WIC
Children Aged 1–4
Eligible for WIC
Family
Income
≤ 185% FPGa
Adjunctively
Eligible
>185% FPGb
Total
Family
Income
≤ 185% FPGa
Adjunctively
Eligible
>185% FPGb
Total
Family
Income
≤ 185% FPGa
Adjunctively
Eligible
>185% FPGb
Total
Total 1,494,534 598,542 2,093,076 1,366,638 649,115 2,015,753 5,897,678 2,568,019 8,465,698
Gender – – – – – – – – –
Male 47.6 49.0 48.0 51.2 48.0 50.2 49.9 51.4 50.4
Female 52.4 51.0 52.0 48.8 52.0 49.8 50.1 48.6 49.6
Race – – – – – – – – –
White 62.0 75.2 65.8 63.2 71.8 66.0 62.2 73.7 65.7
Black 23.8 14.1 21.0 23.1 16.6 21.0 24.1 14.7 21.3
Other 14.2 10.7 13.2 13.7 11.6 13.0 13.7 11.6 13.0
Ethnicity – – – – – – – – –
Hispanic 35.4 31.0 34.2 34.1 35.5 34.6 34.8 31.9 33.9
Non-Hispanic 64.6 69.0 65.8 65.9 64.5 65.4 65.2 68.1 66.1
Living arrangement – – – – – – – – –
Two-parent family 52.3 73.1 58.3 53.0 65.6 57.1 52.6 69.9 57.9
Single-parent family 40.5 22.0 35.2 41.7 30.0 37.9 41.5 25.3 36.6
No-parent family 7.2 4.9 6.5 5.3 4.4 5.0 5.9 4.8 5.5
Related nonparent caretaker 5.0 4.9 5.0 3.1 4.4 3.5 3.5 4.8 3.9
Unrelated nonparent caretaker 2.2 0.0 1.6 2.2 0.0 1.5 2.3 0.0 1.6
Military status of household members
Ever served in U.S. military 5.1 13.0 7.3 4.8 11.6 7.0 4.6 11.3 6.6
Serving in U.S. military in 2017c 2.5 0.8 2.0 1.0 0.3 0.8 1.7 1.0 1.5
Number of people in household – – – – – – – – –
2 5.4 1.0 4.1 6.7 3.2 5.6 5.9 2.1 4.8
3 17.6 20.3 18.4 13.1 15.4 13.9 17.2 22.4 18.8
4 27.6 31.9 28.8 27.8 32.0 29.1 26.9 31.4 28.3
5 22.5 22.8 22.6 21.3 23.8 22.1 22.2 22.4 22.3
6 or more 26.9 24.0 26.1 31.1 25.5 29.3 27.8 21.6 25.9
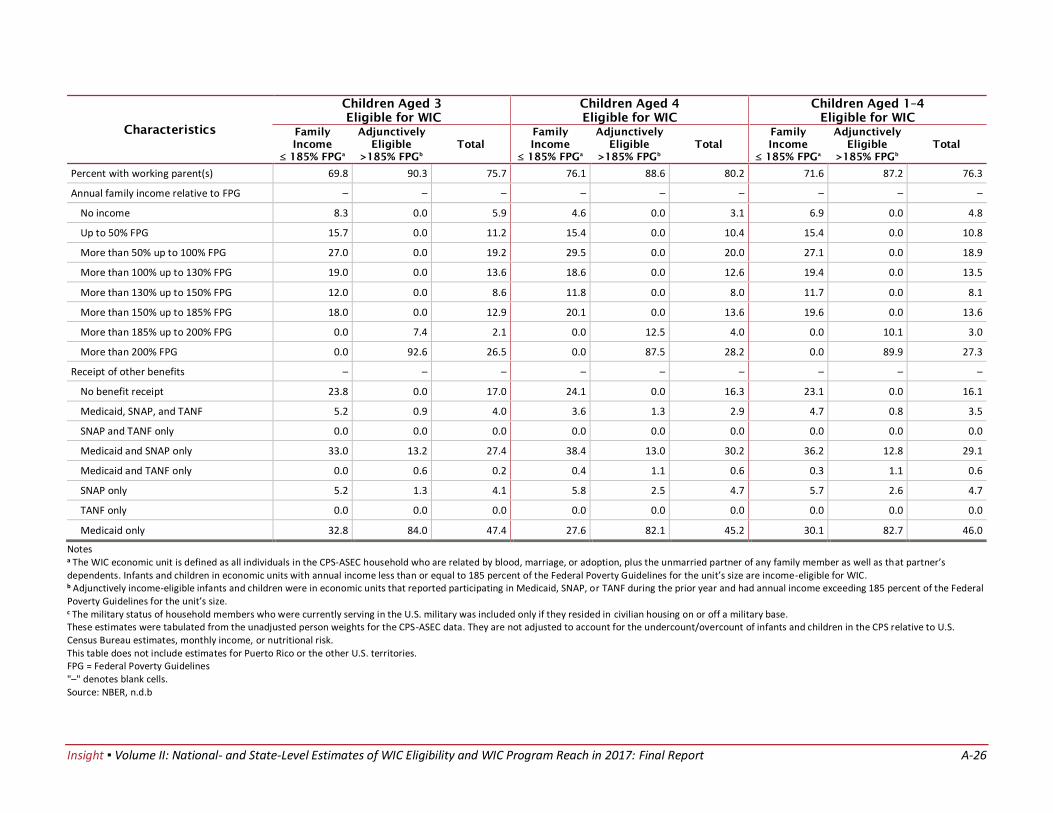
Insight ▪ Volume II: National- and State-Level Estimates of WIC Eligibility and WIC Program Reach in 2017: Final Report A-26
Characteristics
Children Aged 3
Eligible for WIC
Children Aged 4
Eligible for WIC
Children Aged 1–4
Eligible for WIC
Family
Income
≤ 185% FPGa
Adjunctively
Eligible
>185% FPGb
Total
Family
Income
≤ 185% FPGa
Adjunctively
Eligible
>185% FPGb
Total
Family
Income
≤ 185% FPGa
Adjunctively
Eligible
>185% FPGb
Total
Percent with working parent(s) 69.8 90.3 75.7 76.1 88.6 80.2 71.6 87.2 76.3
Annual family income relative to FPG – – – – – – – – –
No income 8.3 0.0 5.9 4.6 0.0 3.1 6.9 0.0 4.8
Up to 50% FPG 15.7 0.0 11.2 15.4 0.0 10.4 15.4 0.0 10.8
More than 50% up to 100% FPG 27.0 0.0 19.2 29.5 0.0 20.0 27.1 0.0 18.9
More than 100% up to 130% FPG 19.0 0.0 13.6 18.6 0.0 12.6 19.4 0.0 13.5
More than 130% up to 150% FPG 12.0 0.0 8.6 11.8 0.0 8.0 11.7 0.0 8.1
More than 150% up to 185% FPG 18.0 0.0 12.9 20.1 0.0 13.6 19.6 0.0 13.6
More than 185% up to 200% FPG 0.0 7.4 2.1 0.0 12.5 4.0 0.0 10.1 3.0
More than 200% FPG 0.0 92.6 26.5 0.0 87.5 28.2 0.0 89.9 27.3
Receipt of other benefits – – – – – – – – –
No benefit receipt 23.8 0.0 17.0 24.1 0.0 16.3 23.1 0.0 16.1
Medicaid, SNAP, and TANF 5.2 0.9 4.0 3.6 1.3 2.9 4.7 0.8 3.5
SNAP and TANF only 0.0 0.0 0.0 0.0 0.0 0.0 0.0 0.0 0.0
Medicaid and SNAP only 33.0 13.2 27.4 38.4 13.0 30.2 36.2 12.8 29.1
Medicaid and TANF only 0.0 0.6 0.2 0.4 1.1 0.6 0.3 1.1 0.6
SNAP only 5.2 1.3 4.1 5.8 2.5 4.7 5.7 2.6 4.7
TANF only 0.0 0.0 0.0 0.0 0.0 0.0 0.0 0.0 0.0
Medicaid only 32.8 84.0 47.4 27.6 82.1 45.2 30.1 82.7 46.0
Notes a The WIC economic unit is defined as all individuals in the CPS-ASEC household who are related by blood, marriage, or adoption, plus the unmarried partner of any family member as well as that partner’s dependents. Infants and children in economic units with annual income less than or equal to 185 percent of the Federal Poverty Guidelines for the unit’s size are income-eligible for WIC. b Adjunctively income-eligible infants and children were in economic units that reported participating in Medicaid, SNAP, or TANF during the prior year and had annual income exceeding 185 percent of the Federal Poverty Guidelines for the unit’s size. c The military status of household members who were currently serving in the U.S. military was included only if they resided in civilian housing on or off a military base. These estimates were tabulated from the unadjusted person weights for the CPS-ASEC data. They are not adjusted to account for the undercount/overcount of infants and children in the CPS relative to U.S. Census Bureau estimates, monthly income, or nutritional risk. This table does not include estimates for Puerto Rico or the other U.S. territories. FPG = Federal Poverty Guidelines "–" denotes blank cells. Source: NBER, n.d.b
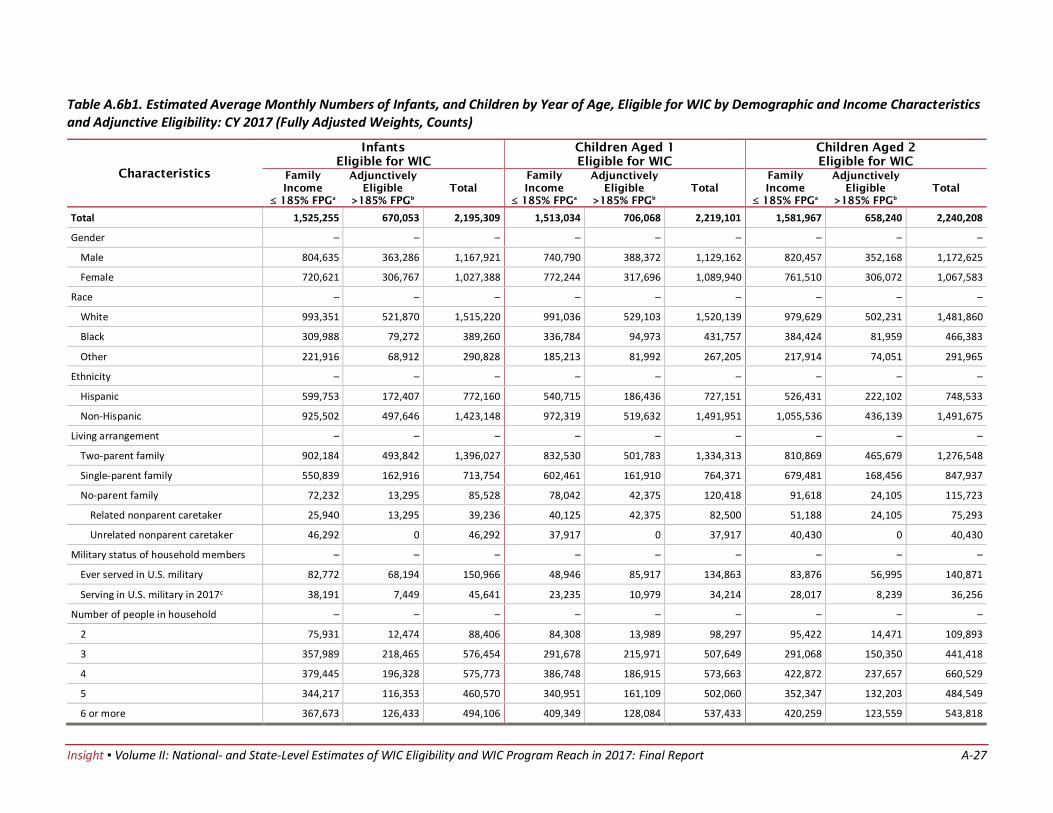
Insight ▪ Volume II: National- and State-Level Estimates of WIC Eligibility and WIC Program Reach in 2017: Final Report A-27
Table A.6b1. Estimated Average Monthly Numbers of Infants, and Children by Year of Age, Eligible for WIC by Demographic and Income Characteristics and Adjunctive Eligibility: CY 2017 (Fully Adjusted Weights, Counts)
Characteristics
Infants
Eligible for WIC
Children Aged 1
Eligible for WIC
Children Aged 2
Eligible for WIC
Family
Income
≤ 185% FPGa
Adjunctively
Eligible
>185% FPGb
Total
Family
Income
≤ 185% FPGa
Adjunctively
Eligible
>185% FPGb
Total
Family
Income
≤ 185% FPGa
Adjunctively
Eligible
>185% FPGb
Total
Total 1,525,255 670,053 2,195,309 1,513,034 706,068 2,219,101 1,581,967 658,240 2,240,208
Gender – – – – – – – – –
Male 804,635 363,286 1,167,921 740,790 388,372 1,129,162 820,457 352,168 1,172,625
Female 720,621 306,767 1,027,388 772,244 317,696 1,089,940 761,510 306,072 1,067,583
Race – – – – – – – – –
White 993,351 521,870 1,515,220 991,036 529,103 1,520,139 979,629 502,231 1,481,860
Black 309,988 79,272 389,260 336,784 94,973 431,757 384,424 81,959 466,383
Other 221,916 68,912 290,828 185,213 81,992 267,205 217,914 74,051 291,965
Ethnicity – – – – – – – – –
Hispanic 599,753 172,407 772,160 540,715 186,436 727,151 526,431 222,102 748,533
Non-Hispanic 925,502 497,646 1,423,148 972,319 519,632 1,491,951 1,055,536 436,139 1,491,675
Living arrangement – – – – – – – – –
Two-parent family 902,184 493,842 1,396,027 832,530 501,783 1,334,313 810,869 465,679 1,276,548
Single-parent family 550,839 162,916 713,754 602,461 161,910 764,371 679,481 168,456 847,937
No-parent family 72,232 13,295 85,528 78,042 42,375 120,418 91,618 24,105 115,723
Related nonparent caretaker 25,940 13,295 39,236 40,125 42,375 82,500 51,188 24,105 75,293
Unrelated nonparent caretaker 46,292 0 46,292 37,917 0 37,917 40,430 0 40,430
Military status of household members – – – – – – – – –
Ever served in U.S. military 82,772 68,194 150,966 48,946 85,917 134,863 83,876 56,995 140,871
Serving in U.S. military in 2017c 38,191 7,449 45,641 23,235 10,979 34,214 28,017 8,239 36,256
Number of people in household – – – – – – – – –
2 75,931 12,474 88,406 84,308 13,989 98,297 95,422 14,471 109,893
3 357,989 218,465 576,454 291,678 215,971 507,649 291,068 150,350 441,418
4 379,445 196,328 575,773 386,748 186,915 573,663 422,872 237,657 660,529
5 344,217 116,353 460,570 340,951 161,109 502,060 352,347 132,203 484,549
6 or more 367,673 126,433 494,106 409,349 128,084 537,433 420,259 123,559 543,818
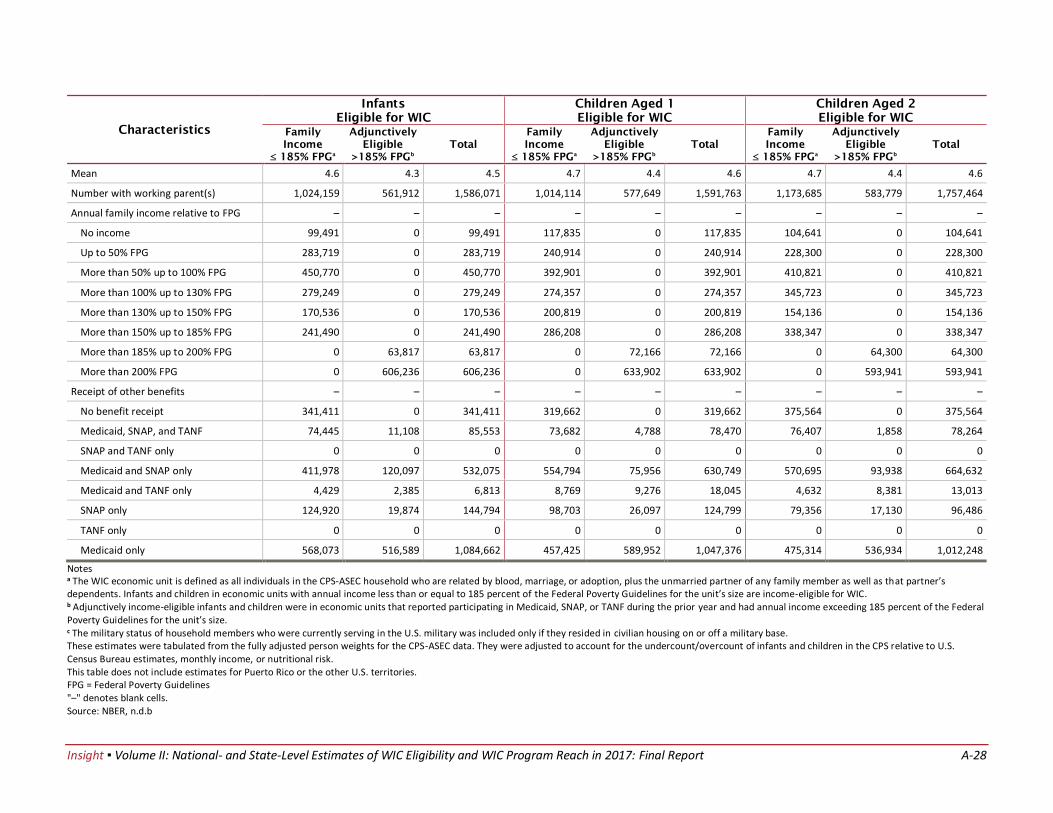
Insight ▪ Volume II: National- and State-Level Estimates of WIC Eligibility and WIC Program Reach in 2017: Final Report A-28
Characteristics
Infants
Eligible for WIC
Children Aged 1
Eligible for WIC
Children Aged 2
Eligible for WIC
Family
Income
≤ 185% FPGa
Adjunctively
Eligible
>185% FPGb
Total
Family
Income
≤ 185% FPGa
Adjunctively
Eligible
>185% FPGb
Total
Family
Income
≤ 185% FPGa
Adjunctively
Eligible
>185% FPGb
Total
Mean 4.6 4.3 4.5 4.7 4.4 4.6 4.7 4.4 4.6
Number with working parent(s) 1,024,159 561,912 1,586,071 1,014,114 577,649 1,591,763 1,173,685 583,779 1,757,464
Annual family income relative to FPG – – – – – – – – –
No income 99,491 0 99,491 117,835 0 117,835 104,641 0 104,641
Up to 50% FPG 283,719 0 283,719 240,914 0 240,914 228,300 0 228,300
More than 50% up to 100% FPG 450,770 0 450,770 392,901 0 392,901 410,821 0 410,821
More than 100% up to 130% FPG 279,249 0 279,249 274,357 0 274,357 345,723 0 345,723
More than 130% up to 150% FPG 170,536 0 170,536 200,819 0 200,819 154,136 0 154,136
More than 150% up to 185% FPG 241,490 0 241,490 286,208 0 286,208 338,347 0 338,347
More than 185% up to 200% FPG 0 63,817 63,817 0 72,166 72,166 0 64,300 64,300
More than 200% FPG 0 606,236 606,236 0 633,902 633,902 0 593,941 593,941
Receipt of other benefits – – – – – – – – –
No benefit receipt 341,411 0 341,411 319,662 0 319,662 375,564 0 375,564
Medicaid, SNAP, and TANF 74,445 11,108 85,553 73,682 4,788 78,470 76,407 1,858 78,264
SNAP and TANF only 0 0 0 0 0 0 0 0 0
Medicaid and SNAP only 411,978 120,097 532,075 554,794 75,956 630,749 570,695 93,938 664,632
Medicaid and TANF only 4,429 2,385 6,813 8,769 9,276 18,045 4,632 8,381 13,013
SNAP only 124,920 19,874 144,794 98,703 26,097 124,799 79,356 17,130 96,486
TANF only 0 0 0 0 0 0 0 0 0
Medicaid only 568,073 516,589 1,084,662 457,425 589,952 1,047,376 475,314 536,934 1,012,248
Notes a The WIC economic unit is defined as all individuals in the CPS-ASEC household who are related by blood, marriage, or adoption, plus the unmarried partner of any family member as well as that partner’s dependents. Infants and children in economic units with annual income less than or equal to 185 percent of the Federal Poverty Guidelines for the unit’s size are income-eligible for WIC. b Adjunctively income-eligible infants and children were in economic units that reported participating in Medicaid, SNAP, or TANF during the prior year and had annual income exceeding 185 percent of the Federal Poverty Guidelines for the unit’s size. c The military status of household members who were currently serving in the U.S. military was included only if they resided in civilian housing on or off a military base. These estimates were tabulated from the fully adjusted person weights for the CPS-ASEC data. They were adjusted to account for the undercount/overcount of infants and children in the CPS relative to U.S. Census Bureau estimates, monthly income, or nutritional risk. This table does not include estimates for Puerto Rico or the other U.S. territories. FPG = Federal Poverty Guidelines "–" denotes blank cells. Source: NBER, n.d.b
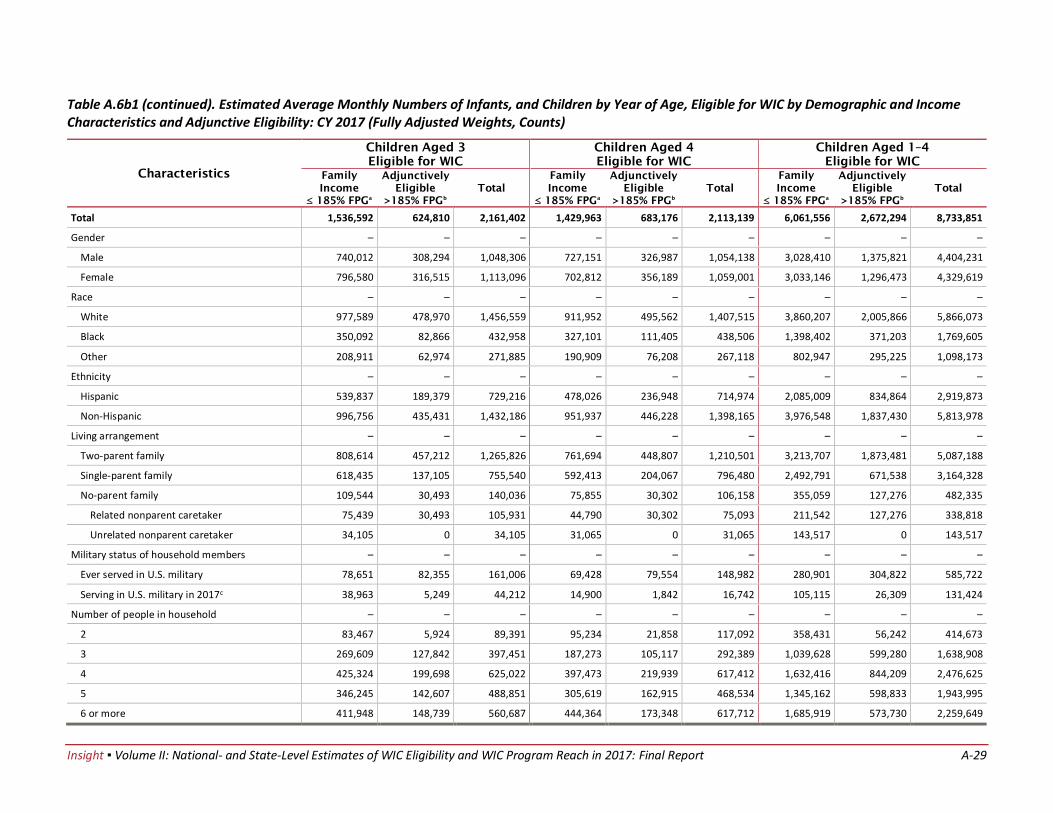
Insight ▪ Volume II: National- and State-Level Estimates of WIC Eligibility and WIC Program Reach in 2017: Final Report A-29
Table A.6b1 (continued). Estimated Average Monthly Numbers of Infants, and Children by Year of Age, Eligible for WIC by Demographic and Income Characteristics and Adjunctive Eligibility: CY 2017 (Fully Adjusted Weights, Counts)
Characteristics
Children Aged 3
Eligible for WIC
Children Aged 4
Eligible for WIC
Children Aged 1–4
Eligible for WIC
Family
Income
≤ 185% FPGa
Adjunctively
Eligible
>185% FPGb
Total
Family
Income
≤ 185% FPGa
Adjunctively
Eligible
>185% FPGb
Total
Family
Income
≤ 185% FPGa
Adjunctively
Eligible
>185% FPGb
Total
Total 1,536,592 624,810 2,161,402 1,429,963 683,176 2,113,139 6,061,556 2,672,294 8,733,851
Gender – – – – – – – – –
Male 740,012 308,294 1,048,306 727,151 326,987 1,054,138 3,028,410 1,375,821 4,404,231
Female 796,580 316,515 1,113,096 702,812 356,189 1,059,001 3,033,146 1,296,473 4,329,619
Race – – – – – – – – –
White 977,589 478,970 1,456,559 911,952 495,562 1,407,515 3,860,207 2,005,866 5,866,073
Black 350,092 82,866 432,958 327,101 111,405 438,506 1,398,402 371,203 1,769,605
Other 208,911 62,974 271,885 190,909 76,208 267,118 802,947 295,225 1,098,173
Ethnicity – – – – – – – – –
Hispanic 539,837 189,379 729,216 478,026 236,948 714,974 2,085,009 834,864 2,919,873
Non-Hispanic 996,756 435,431 1,432,186 951,937 446,228 1,398,165 3,976,548 1,837,430 5,813,978
Living arrangement – – – – – – – – –
Two-parent family 808,614 457,212 1,265,826 761,694 448,807 1,210,501 3,213,707 1,873,481 5,087,188
Single-parent family 618,435 137,105 755,540 592,413 204,067 796,480 2,492,791 671,538 3,164,328
No-parent family 109,544 30,493 140,036 75,855 30,302 106,158 355,059 127,276 482,335
Related nonparent caretaker 75,439 30,493 105,931 44,790 30,302 75,093 211,542 127,276 338,818
Unrelated nonparent caretaker 34,105 0 34,105 31,065 0 31,065 143,517 0 143,517
Military status of household members – – – – – – – – –
Ever served in U.S. military 78,651 82,355 161,006 69,428 79,554 148,982 280,901 304,822 585,722
Serving in U.S. military in 2017c 38,963 5,249 44,212 14,900 1,842 16,742 105,115 26,309 131,424
Number of people in household – – – – – – – – –
2 83,467 5,924 89,391 95,234 21,858 117,092 358,431 56,242 414,673
3 269,609 127,842 397,451 187,273 105,117 292,389 1,039,628 599,280 1,638,908
4 425,324 199,698 625,022 397,473 219,939 617,412 1,632,416 844,209 2,476,625
5 346,245 142,607 488,851 305,619 162,915 468,534 1,345,162 598,833 1,943,995
6 or more 411,948 148,739 560,687 444,364 173,348 617,712 1,685,919 573,730 2,259,649
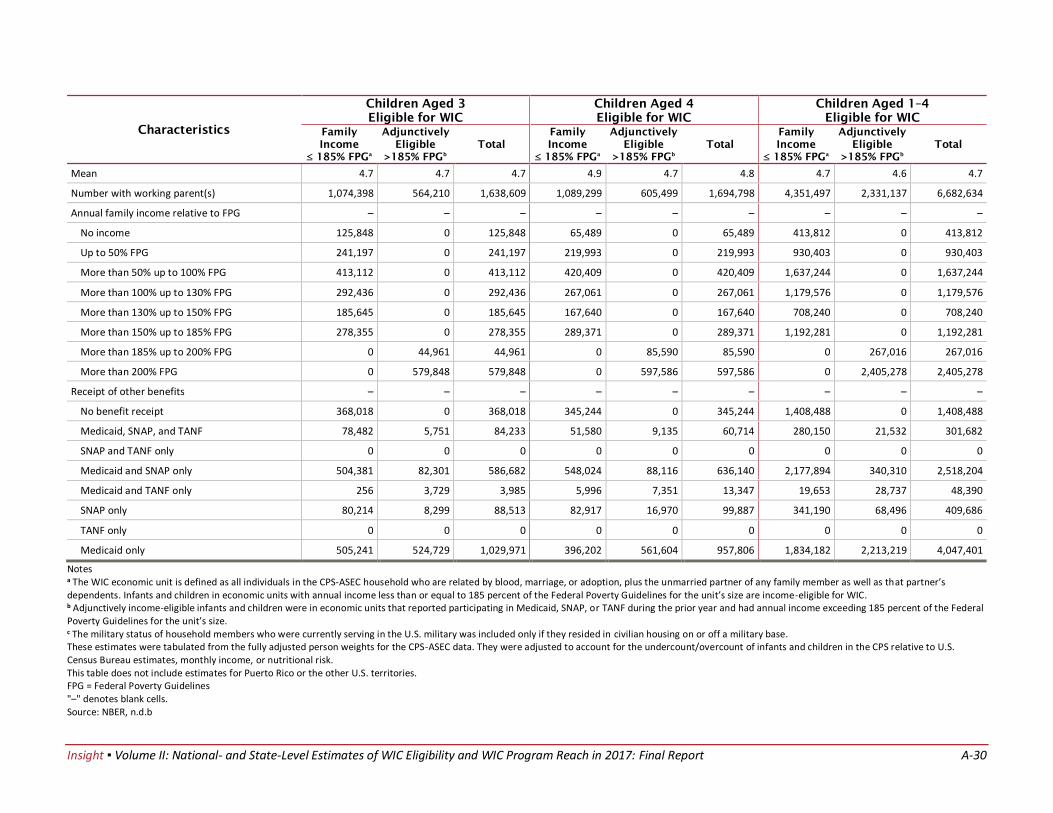
Insight ▪ Volume II: National- and State-Level Estimates of WIC Eligibility and WIC Program Reach in 2017: Final Report A-30
Characteristics
Children Aged 3
Eligible for WIC
Children Aged 4
Eligible for WIC
Children Aged 1–4
Eligible for WIC
Family
Income
≤ 185% FPGa
Adjunctively
Eligible
>185% FPGb
Total
Family
Income
≤ 185% FPGa
Adjunctively
Eligible
>185% FPGb
Total
Family
Income
≤ 185% FPGa
Adjunctively
Eligible
>185% FPGb
Total
Mean 4.7 4.7 4.7 4.9 4.7 4.8 4.7 4.6 4.7
Number with working parent(s) 1,074,398 564,210 1,638,609 1,089,299 605,499 1,694,798 4,351,497 2,331,137 6,682,634
Annual family income relative to FPG – – – – – – – – –
No income 125,848 0 125,848 65,489 0 65,489 413,812 0 413,812
Up to 50% FPG 241,197 0 241,197 219,993 0 219,993 930,403 0 930,403
More than 50% up to 100% FPG 413,112 0 413,112 420,409 0 420,409 1,637,244 0 1,637,244
More than 100% up to 130% FPG 292,436 0 292,436 267,061 0 267,061 1,179,576 0 1,179,576
More than 130% up to 150% FPG 185,645 0 185,645 167,640 0 167,640 708,240 0 708,240
More than 150% up to 185% FPG 278,355 0 278,355 289,371 0 289,371 1,192,281 0 1,192,281
More than 185% up to 200% FPG 0 44,961 44,961 0 85,590 85,590 0 267,016 267,016
More than 200% FPG 0 579,848 579,848 0 597,586 597,586 0 2,405,278 2,405,278
Receipt of other benefits – – – – – – – – –
No benefit receipt 368,018 0 368,018 345,244 0 345,244 1,408,488 0 1,408,488
Medicaid, SNAP, and TANF 78,482 5,751 84,233 51,580 9,135 60,714 280,150 21,532 301,682
SNAP and TANF only 0 0 0 0 0 0 0 0 0
Medicaid and SNAP only 504,381 82,301 586,682 548,024 88,116 636,140 2,177,894 340,310 2,518,204
Medicaid and TANF only 256 3,729 3,985 5,996 7,351 13,347 19,653 28,737 48,390
SNAP only 80,214 8,299 88,513 82,917 16,970 99,887 341,190 68,496 409,686
TANF only 0 0 0 0 0 0 0 0 0
Medicaid only 505,241 524,729 1,029,971 396,202 561,604 957,806 1,834,182 2,213,219 4,047,401
Notes a The WIC economic unit is defined as all individuals in the CPS-ASEC household who are related by blood, marriage, or adoption, plus the unmarried partner of any family member as well as that partner’s dependents. Infants and children in economic units with annual income less than or equal to 185 percent of the Federal Poverty Guidelines for the unit’s size are income-eligible for WIC. b Adjunctively income-eligible infants and children were in economic units that reported participating in Medicaid, SNAP, or TANF during the prior year and had annual income exceeding 185 percent of the Federal Poverty Guidelines for the unit’s size. c The military status of household members who were currently serving in the U.S. military was included only if they resided in civilian housing on or off a military base. These estimates were tabulated from the fully adjusted person weights for the CPS-ASEC data. They were adjusted to account for the undercount/overcount of infants and children in the CPS relative to U.S. Census Bureau estimates, monthly income, or nutritional risk. This table does not include estimates for Puerto Rico or the other U.S. territories. FPG = Federal Poverty Guidelines "–" denotes blank cells. Source: NBER, n.d.b
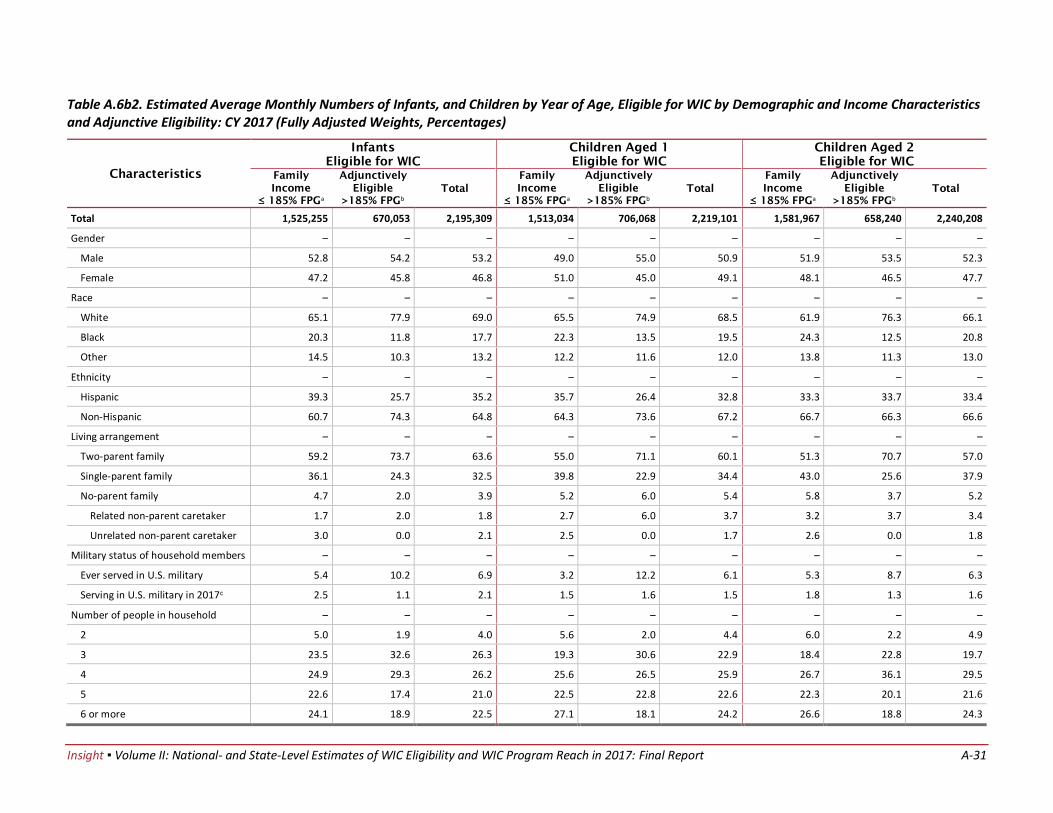
Insight ▪ Volume II: National- and State-Level Estimates of WIC Eligibility and WIC Program Reach in 2017: Final Report A-31
Table A.6b2. Estimated Average Monthly Numbers of Infants, and Children by Year of Age, Eligible for WIC by Demographic and Income Characteristics and Adjunctive Eligibility: CY 2017 (Fully Adjusted Weights, Percentages)
Characteristics
Infants
Eligible for WIC
Children Aged 1
Eligible for WIC
Children Aged 2
Eligible for WIC
Family
Income
≤ 185% FPGa
Adjunctively
Eligible
>185% FPGb
Total
Family
Income
≤ 185% FPGa
Adjunctively
Eligible
>185% FPGb
Total
Family
Income
≤ 185% FPGa
Adjunctively
Eligible
>185% FPGb
Total
Total 1,525,255 670,053 2,195,309 1,513,034 706,068 2,219,101 1,581,967 658,240 2,240,208
Gender – – – – – – – – –
Male 52.8 54.2 53.2 49.0 55.0 50.9 51.9 53.5 52.3
Female 47.2 45.8 46.8 51.0 45.0 49.1 48.1 46.5 47.7
Race – – – – – – – – –
White 65.1 77.9 69.0 65.5 74.9 68.5 61.9 76.3 66.1
Black 20.3 11.8 17.7 22.3 13.5 19.5 24.3 12.5 20.8
Other 14.5 10.3 13.2 12.2 11.6 12.0 13.8 11.3 13.0
Ethnicity – – – – – – – – –
Hispanic 39.3 25.7 35.2 35.7 26.4 32.8 33.3 33.7 33.4
Non-Hispanic 60.7 74.3 64.8 64.3 73.6 67.2 66.7 66.3 66.6
Living arrangement – – – – – – – – –
Two-parent family 59.2 73.7 63.6 55.0 71.1 60.1 51.3 70.7 57.0
Single-parent family 36.1 24.3 32.5 39.8 22.9 34.4 43.0 25.6 37.9
No-parent family 4.7 2.0 3.9 5.2 6.0 5.4 5.8 3.7 5.2
Related non-parent caretaker 1.7 2.0 1.8 2.7 6.0 3.7 3.2 3.7 3.4
Unrelated non-parent caretaker 3.0 0.0 2.1 2.5 0.0 1.7 2.6 0.0 1.8
Military status of household members – – – – – – – – –
Ever served in U.S. military 5.4 10.2 6.9 3.2 12.2 6.1 5.3 8.7 6.3
Serving in U.S. military in 2017c 2.5 1.1 2.1 1.5 1.6 1.5 1.8 1.3 1.6
Number of people in household – – – – – – – – –
2 5.0 1.9 4.0 5.6 2.0 4.4 6.0 2.2 4.9
3 23.5 32.6 26.3 19.3 30.6 22.9 18.4 22.8 19.7
4 24.9 29.3 26.2 25.6 26.5 25.9 26.7 36.1 29.5
5 22.6 17.4 21.0 22.5 22.8 22.6 22.3 20.1 21.6
6 or more 24.1 18.9 22.5 27.1 18.1 24.2 26.6 18.8 24.3
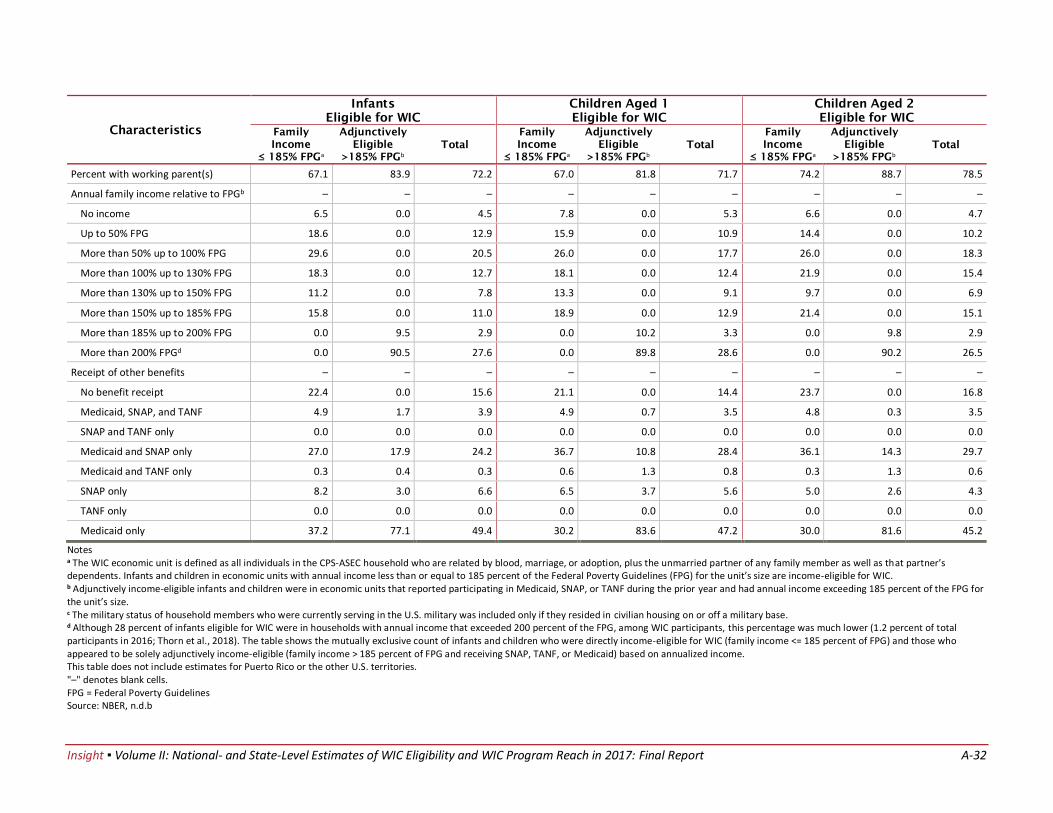
Insight ▪ Volume II: National- and State-Level Estimates of WIC Eligibility and WIC Program Reach in 2017: Final Report A-32
Characteristics
Infants
Eligible for WIC
Children Aged 1
Eligible for WIC
Children Aged 2
Eligible for WIC
Family
Income
≤ 185% FPGa
Adjunctively
Eligible
>185% FPGb
Total
Family
Income
≤ 185% FPGa
Adjunctively
Eligible
>185% FPGb
Total
Family
Income
≤ 185% FPGa
Adjunctively
Eligible
>185% FPGb
Total
Percent with working parent(s) 67.1 83.9 72.2 67.0 81.8 71.7 74.2 88.7 78.5
Annual family income relative to FPGb – – – – – – – – –
No income 6.5 0.0 4.5 7.8 0.0 5.3 6.6 0.0 4.7
Up to 50% FPG 18.6 0.0 12.9 15.9 0.0 10.9 14.4 0.0 10.2
More than 50% up to 100% FPG 29.6 0.0 20.5 26.0 0.0 17.7 26.0 0.0 18.3
More than 100% up to 130% FPG 18.3 0.0 12.7 18.1 0.0 12.4 21.9 0.0 15.4
More than 130% up to 150% FPG 11.2 0.0 7.8 13.3 0.0 9.1 9.7 0.0 6.9
More than 150% up to 185% FPG 15.8 0.0 11.0 18.9 0.0 12.9 21.4 0.0 15.1
More than 185% up to 200% FPG 0.0 9.5 2.9 0.0 10.2 3.3 0.0 9.8 2.9
More than 200% FPGd 0.0 90.5 27.6 0.0 89.8 28.6 0.0 90.2 26.5
Receipt of other benefits – – – – – – – – –
No benefit receipt 22.4 0.0 15.6 21.1 0.0 14.4 23.7 0.0 16.8
Medicaid, SNAP, and TANF 4.9 1.7 3.9 4.9 0.7 3.5 4.8 0.3 3.5
SNAP and TANF only 0.0 0.0 0.0 0.0 0.0 0.0 0.0 0.0 0.0
Medicaid and SNAP only 27.0 17.9 24.2 36.7 10.8 28.4 36.1 14.3 29.7
Medicaid and TANF only 0.3 0.4 0.3 0.6 1.3 0.8 0.3 1.3 0.6
SNAP only 8.2 3.0 6.6 6.5 3.7 5.6 5.0 2.6 4.3
TANF only 0.0 0.0 0.0 0.0 0.0 0.0 0.0 0.0 0.0
Medicaid only 37.2 77.1 49.4 30.2 83.6 47.2 30.0 81.6 45.2
Notes a The WIC economic unit is defined as all individuals in the CPS-ASEC household who are related by blood, marriage, or adoption, plus the unmarried partner of any family member as well as that partner’s dependents. Infants and children in economic units with annual income less than or equal to 185 percent of the Federal Poverty Guidelines (FPG) for the unit’s size are income-eligible for WIC. b Adjunctively income-eligible infants and children were in economic units that reported participating in Medicaid, SNAP, or TANF during the prior year and had annual income exceeding 185 percent of the FPG for the unit’s size. c The military status of household members who were currently serving in the U.S. military was included only if they resided in civilian housing on or off a military base. d Although 28 percent of infants eligible for WIC were in households with annual income that exceeded 200 percent of the FPG, among WIC participants, this percentage was much lower (1.2 percent of total participants in 2016; Thorn et al., 2018). The table shows the mutually exclusive count of infants and children who were directly income-eligible for WIC (family income <= 185 percent of FPG) and those who appeared to be solely adjunctively income-eligible (family income > 185 percent of FPG and receiving SNAP, TANF, or Medicaid) based on annualized income. This table does not include estimates for Puerto Rico or the other U.S. territories. "–" denotes blank cells. FPG = Federal Poverty Guidelines Source: NBER, n.d.b
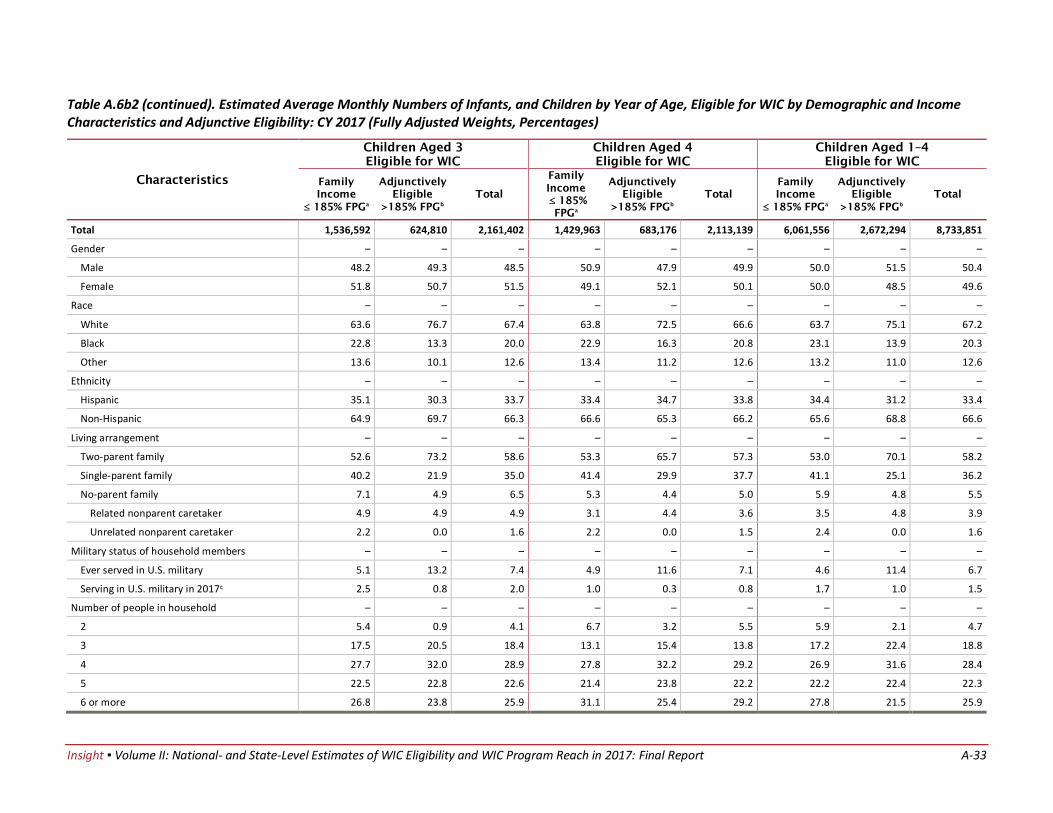
Insight ▪ Volume II: National- and State-Level Estimates of WIC Eligibility and WIC Program Reach in 2017: Final Report A-33
Table A.6b2 (continued). Estimated Average Monthly Numbers of Infants, and Children by Year of Age, Eligible for WIC by Demographic and Income Characteristics and Adjunctive Eligibility: CY 2017 (Fully Adjusted Weights, Percentages)
Characteristics
Children Aged 3
Eligible for WIC
Children Aged 4
Eligible for WIC
Children Aged 1–4
Eligible for WIC
Family
Income
≤ 185% FPGa
Adjunctively
Eligible
>185% FPGb
Total
Family
Income
≤ 185%
FPGa
Adjunctively
Eligible
>185% FPGb
Total
Family
Income
≤ 185% FPGa
Adjunctively
Eligible
>185% FPGb
Total
Total 1,536,592 624,810 2,161,402 1,429,963 683,176 2,113,139 6,061,556 2,672,294 8,733,851
Gender – – – – – – – – –
Male 48.2 49.3 48.5 50.9 47.9 49.9 50.0 51.5 50.4
Female 51.8 50.7 51.5 49.1 52.1 50.1 50.0 48.5 49.6
Race – – – – – – – – –
White 63.6 76.7 67.4 63.8 72.5 66.6 63.7 75.1 67.2
Black 22.8 13.3 20.0 22.9 16.3 20.8 23.1 13.9 20.3
Other 13.6 10.1 12.6 13.4 11.2 12.6 13.2 11.0 12.6
Ethnicity – – – – – – – – –
Hispanic 35.1 30.3 33.7 33.4 34.7 33.8 34.4 31.2 33.4
Non-Hispanic 64.9 69.7 66.3 66.6 65.3 66.2 65.6 68.8 66.6
Living arrangement – – – – – – – – –
Two-parent family 52.6 73.2 58.6 53.3 65.7 57.3 53.0 70.1 58.2
Single-parent family 40.2 21.9 35.0 41.4 29.9 37.7 41.1 25.1 36.2
No-parent family 7.1 4.9 6.5 5.3 4.4 5.0 5.9 4.8 5.5
Related nonparent caretaker 4.9 4.9 4.9 3.1 4.4 3.6 3.5 4.8 3.9
Unrelated nonparent caretaker 2.2 0.0 1.6 2.2 0.0 1.5 2.4 0.0 1.6
Military status of household members – – – – – – – – –
Ever served in U.S. military 5.1 13.2 7.4 4.9 11.6 7.1 4.6 11.4 6.7
Serving in U.S. military in 2017c 2.5 0.8 2.0 1.0 0.3 0.8 1.7 1.0 1.5
Number of people in household – – – – – – – – –
2 5.4 0.9 4.1 6.7 3.2 5.5 5.9 2.1 4.7
3 17.5 20.5 18.4 13.1 15.4 13.8 17.2 22.4 18.8
4 27.7 32.0 28.9 27.8 32.2 29.2 26.9 31.6 28.4
5 22.5 22.8 22.6 21.4 23.8 22.2 22.2 22.4 22.3
6 or more 26.8 23.8 25.9 31.1 25.4 29.2 27.8 21.5 25.9

Insight ▪ Volume II: National- and State-Level Estimates of WIC Eligibility and WIC Program Reach in 2017: Final Report A-34
Characteristics
Children Aged 3
Eligible for WIC
Children Aged 4
Eligible for WIC
Children Aged 1–4
Eligible for WIC
Family
Income
≤ 185% FPGa
Adjunctively
Eligible
>185% FPGb
Total
Family
Income
≤ 185%
FPGa
Adjunctively
Eligible
>185% FPGb
Total
Family
Income
≤ 185% FPGa
Adjunctively
Eligible
>185% FPGb
Total
Percent with working parent(s) 69.9 90.3 75.8 76.2 88.6 80.2 71.8 87.2 76.5
Annual family income relative to FPG – – – – – – – – –
No income 8.2 0.0 5.8 4.6 0.0 3.1 6.8 0.0 4.7
Up to 50% FPG 15.7 0.0 11.2 15.4 0.0 10.4 15.3 0.0 10.7
More than 50% up to 100% FPG 26.9 0.0 19.1 29.4 0.0 19.9 27.0 0.0 18.7
More than 100% up to 130% FPG 19.0 0.0 13.5 18.7 0.0 12.6 19.5 0.0 13.5
More than 130% up to 150% FPG 12.1 0.0 8.6 11.7 0.0 7.9 11.7 0.0 8.1
More than 150% up to 185% FPG 18.1 0.0 12.9 20.2 0.0 13.7 19.7 0.0 13.7
More than 185% up to 200% FPG 0.0 7.2 2.1 0.0 12.5 4.1 0.0 10.0 3.1
More than 200% FPGd 0.0 92.8 26.8 0.0 87.5 28.3 0.0 90.0 27.5
Receipt of other benefits – – – – – – – – –
No benefit receipt 24.0 0.0 17.0 24.1 0.0 16.3 23.2 0.0 16.1
Medicaid, SNAP, and TANF 5.1 0.9 3.9 3.6 1.3 2.9 4.6 0.8 3.5
SNAP and TANF only 0.0 0.0 0.0 0.0 0.0 0.0 0.0 0.0 0.0
Medicaid and SNAP only 32.8 13.2 27.1 38.3 12.9 30.1 35.9 12.7 28.8
Medicaid and TANF only 0.0 0.6 0.2 0.4 1.1 0.6 0.3 1.1 0.6
SNAP only 5.2 1.3 4.1 5.8 2.5 4.7 5.6 2.6 4.7
TANF only 0.0 0.0 0.0 0.0 0.0 0.0 0.0 0.0 0.0
Medicaid only 32.9 84.0 47.7 27.7 82.2 45.3 30.3 82.8 46.3
Notes a The WIC economic unit is defined as all individuals in the CPS-ASEC household who are related by blood, marriage, or adoption, plus the unmarried partner of any family member as well as that partner’s dependents. Infants and children in economic units with annual income less than or equal to 185 percent of the Federal Poverty Guidelines for the unit’s size are income-eligible for WIC. b Adjunctively income-eligible infants and children were in economic units that reported participating in Medicaid, SNAP, or TANF during the prior year and had annual income exceeding 185 percent of the Federal Poverty Guidelines for the unit’s size. c The military status of household members who were currently serving in the U.S. military was included only if they resided in civilian housing on or off a military base. d Although 28 percent of infants and children eligible for WIC were in households with annual income that exceeded 200 percent of the FPG, among WIC participants, this percentage was much lower (1.2 percent of total participants in 2016; Thorn et al., 2018). The table shows the mutually exclusive count of infants and children who were directly income-eligible for WIC (family income <= 185 percent of FPG) and those who appeared to be solely adjunctively income-eligible (family income > 185 percent of FPG and receiving SNAP, TANF, or Medicaid) based on annualized income. These estimates were tabulated from the fully adjusted person weights for the CPS-ASEC data. They were adjusted to account for the undercount/overcount of infants and children in the CPS relative to U.S. Census Bureau estimates, monthly income, or nutritional risk. This table does not include estimates for Puerto Rico and the other U.S. territories. FPG = Federal Poverty Guidelines “–“ denotes blank cells. Source: NBER, n.d.b
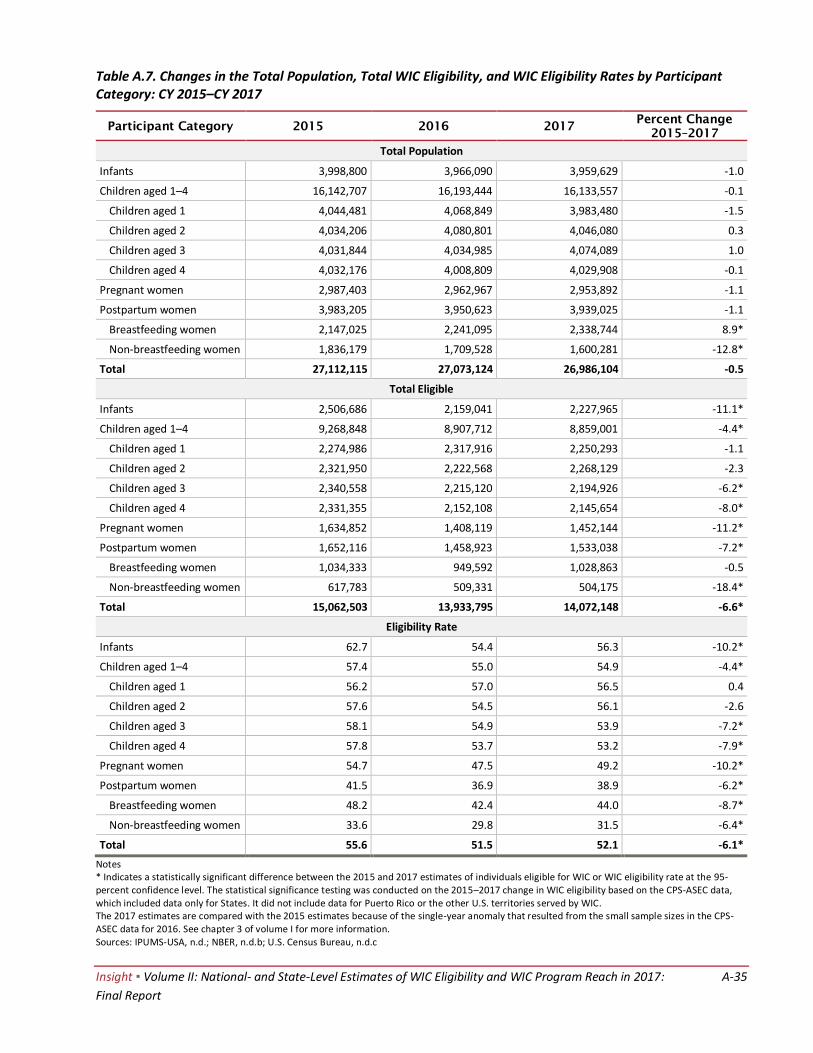
Insight ▪ Volume II: National- and State-Level Estimates of WIC Eligibility and WIC Program Reach in 2017: A-35
Final Report
Table A.7. Changes in the Total Population, Total WIC Eligibility, and WIC Eligibility Rates by Participant Category: CY 2015–CY 2017
Participant Category 2015 2016 2017 Percent Change
2015–2017
Total Population
Infants 3,998,800 3,966,090 3,959,629 -1.0
Children aged 1–4 16,142,707 16,193,444 16,133,557 -0.1
Children aged 1 4,044,481 4,068,849 3,983,480 -1.5
Children aged 2 4,034,206 4,080,801 4,046,080 0.3
Children aged 3 4,031,844 4,034,985 4,074,089 1.0
Children aged 4 4,032,176 4,008,809 4,029,908 -0.1
Pregnant women 2,987,403 2,962,967 2,953,892 -1.1
Postpartum women 3,983,205 3,950,623 3,939,025 -1.1
Breastfeeding women 2,147,025 2,241,095 2,338,744 8.9*
Non-breastfeeding women 1,836,179 1,709,528 1,600,281 -12.8*
Total 27,112,115 27,073,124 26,986,104 -0.5
Total Eligible
Infants 2,506,686 2,159,041 2,227,965 -11.1*
Children aged 1–4 9,268,848 8,907,712 8,859,001 -4.4*
Children aged 1 2,274,986 2,317,916 2,250,293 -1.1
Children aged 2 2,321,950 2,222,568 2,268,129 -2.3
Children aged 3 2,340,558 2,215,120 2,194,926 -6.2*
Children aged 4 2,331,355 2,152,108 2,145,654 -8.0*
Pregnant women 1,634,852 1,408,119 1,452,144 -11.2*
Postpartum women 1,652,116 1,458,923 1,533,038 -7.2*
Breastfeeding women 1,034,333 949,592 1,028,863 -0.5
Non-breastfeeding women 617,783 509,331 504,175 -18.4*
Total 15,062,503 13,933,795 14,072,148 -6.6*
Eligibility Rate
Infants 62.7 54.4 56.3 -10.2*
Children aged 1–4 57.4 55.0 54.9 -4.4*
Children aged 1 56.2 57.0 56.5 0.4
Children aged 2 57.6 54.5 56.1 -2.6
Children aged 3 58.1 54.9 53.9 -7.2*
Children aged 4 57.8 53.7 53.2 -7.9*
Pregnant women 54.7 47.5 49.2 -10.2*
Postpartum women 41.5 36.9 38.9 -6.2*
Breastfeeding women 48.2 42.4 44.0 -8.7*
Non-breastfeeding women 33.6 29.8 31.5 -6.4*
Total 55.6 51.5 52.1 -6.1*
Notes * Indicates a statistically significant difference between the 2015 and 2017 estimates of individuals eligible for WIC or WIC eligibility rate at the 95-percent confidence level. The statistical significance testing was conducted on the 2015–2017 change in WIC eligibility based on the CPS-ASEC data, which included data only for States. It did not include data for Puerto Rico or the other U.S. territories served by WIC. The 2017 estimates are compared with the 2015 estimates because of the single-year anomaly that resulted from the small sample sizes in the CPS-ASEC data for 2016. See chapter 3 of volume I for more information. Sources: IPUMS-USA, n.d.; NBER, n.d.b; U.S. Census Bureau, n.d.c

Insight ▪ Volume II: National- and State-Level Estimates of WIC Eligibility and WIC Program Reach in 2017: A-36
Final Report
Table A.8. Stepwise Comparison of Changes in Average Monthly Numbers of Infants and Children Eligible for WIC as Estimated in the March CPS-ASEC: CY 2015–CY 2017
Step Infants Children Aged
1–4 Total
2015
Total number of infants/children in the March CPS 3,876,774 16,045,983 19,922,757
Number (non-U.S. territory) after adjustment for CPS undercount/overcount
3,959,291 15,978,073 19,937,364
Number with annual income < 185% FPG 1,654,704 6,315,836 7,970,540
Number with adjunctive eligibility 621,483 2,478,408 3,099,891
Through SNAP 110,205 600,043 710,248
Through TANF 6,897 9,745 16,642
Through Medicaid 504,382 1,868,619 2,373,001
Number before monthly income adjustment 2,276,187 8,794,243 11,070,431
Number after monthly income adjustment 2,545,826 9,224,611 11,770,437
Total eligibility: Number after adjustment for nutritional risk (infants and children)
2,469,451 9,132,365 11,601,816
2016
Total number of infants/children in the March CPS 3,822,275 16,131,250 19,953,525
Number (non-U.S. territory) after adjustment for CPS undercount/overcount
3,929,453 16,036,048 19,965,501
Number with annual income < 185% FPG 1,282,473 5,914,209 7,196,682
Number with adjunctive eligibility 674,832 2,507,080 3,181,913
Through SNAP 149,963 536,013 685,976
Through TANF 6,591 23,266 29,857
Through Medicaid 518,278 1,947,801 2,466,079
Number before monthly income adjustment 1,957,305 8,421,289 10,378,594
Number after monthly income adjustment 2,192,433 8,857,494 11,049,927
Total eligibility: Number after adjustment for nutritional risk (infants and children)
2,126,660 8,768,919 10,895,579
2017
Total number of infants/children in the March CPS 3,836,768 16,092,459 19,929,227
Number (non-U.S. territory) after adjustment for CPS undercount/overcount
3,925,839 15,987,345 19,913,184
Number with annual income < 185% FPG 1,418,737 5,835,505 7,254,242
Number with adjunctive eligibility 606,715 2,551,502 3,158,216
Through SNAP 139,217 413,416 552,633
Through TANF 2,297 27,240 29,538
Through Medicaid 465,200 2,110,846 2,576,046
Number before monthly income adjustment 2,025,452 8,387,007 10,412,459
Number after monthly income adjustment 2,263,205 8,822,071 11,085,276
Total eligibility: Number after adjustment for nutritional risk (infants and children)
2,195,309 8,733,851 10,929,159
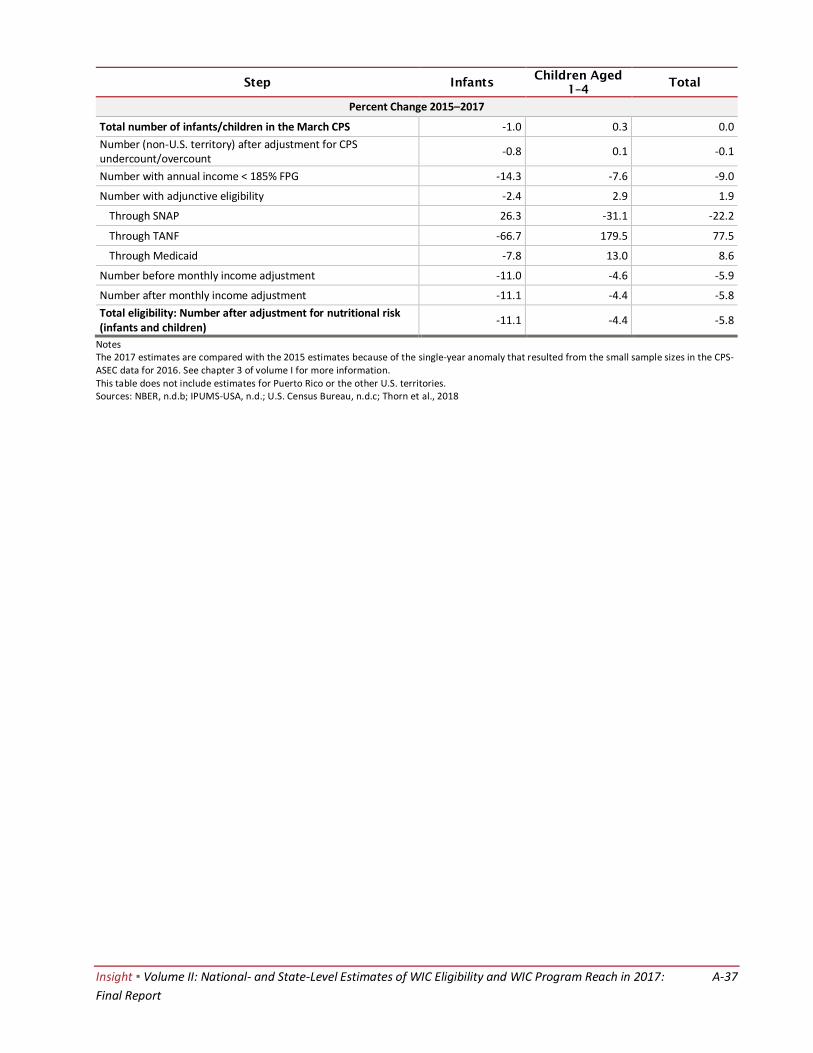
Insight ▪ Volume II: National- and State-Level Estimates of WIC Eligibility and WIC Program Reach in 2017: A-37
Final Report
Step Infants Children Aged
1–4 Total
Percent Change 2015–2017
Total number of infants/children in the March CPS -1.0 0.3 0.0
Number (non-U.S. territory) after adjustment for CPS undercount/overcount
-0.8 0.1 -0.1
Number with annual income < 185% FPG -14.3 -7.6 -9.0
Number with adjunctive eligibility -2.4 2.9 1.9
Through SNAP 26.3 -31.1 -22.2
Through TANF -66.7 179.5 77.5
Through Medicaid -7.8 13.0 8.6
Number before monthly income adjustment -11.0 -4.6 -5.9
Number after monthly income adjustment -11.1 -4.4 -5.8
Total eligibility: Number after adjustment for nutritional risk (infants and children)
-11.1 -4.4 -5.8
Notes The 2017 estimates are compared with the 2015 estimates because of the single-year anomaly that resulted from the small sample sizes in the CPS-ASEC data for 2016. See chapter 3 of volume I for more information.
This table does not include estimates for Puerto Rico or the other U.S. territories. Sources: NBER, n.d.b; IPUMS-USA, n.d.; U.S. Census Bureau, n.d.c; Thorn et al., 2018
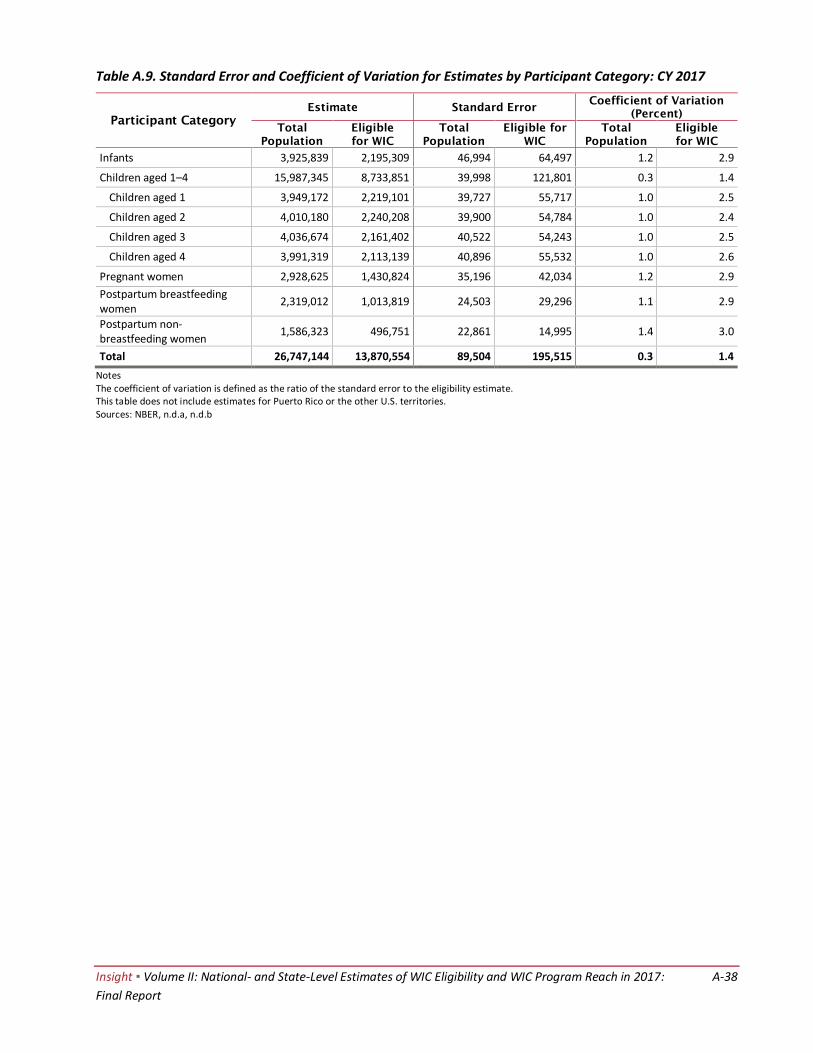
Insight ▪ Volume II: National- and State-Level Estimates of WIC Eligibility and WIC Program Reach in 2017: A-38
Final Report
Table A.9. Standard Error and Coefficient of Variation for Estimates by Participant Category: CY 2017
Participant Category
Estimate Standard Error Coefficient of Variation
(Percent)
Total
Population
Eligible
for WIC
Total
Population
Eligible for
WIC
Total
Population
Eligible
for WIC
Infants 3,925,839 2,195,309 46,994 64,497 1.2 2.9
Children aged 1–4 15,987,345 8,733,851 39,998 121,801 0.3 1.4
Children aged 1 3,949,172 2,219,101 39,727 55,717 1.0 2.5
Children aged 2 4,010,180 2,240,208 39,900 54,784 1.0 2.4
Children aged 3 4,036,674 2,161,402 40,522 54,243 1.0 2.5
Children aged 4 3,991,319 2,113,139 40,896 55,532 1.0 2.6
Pregnant women 2,928,625 1,430,824 35,196 42,034 1.2 2.9
Postpartum breastfeeding women
2,319,012 1,013,819 24,503 29,296 1.1 2.9
Postpartum non-breastfeeding women
1,586,323 496,751 22,861 14,995 1.4 3.0
Total 26,747,144 13,870,554 89,504 195,515 0.3 1.4
Notes The coefficient of variation is defined as the ratio of the standard error to the eligibility estimate. This table does not include estimates for Puerto Rico or the other U.S. territories. Sources: NBER, n.d.a, n.d.b
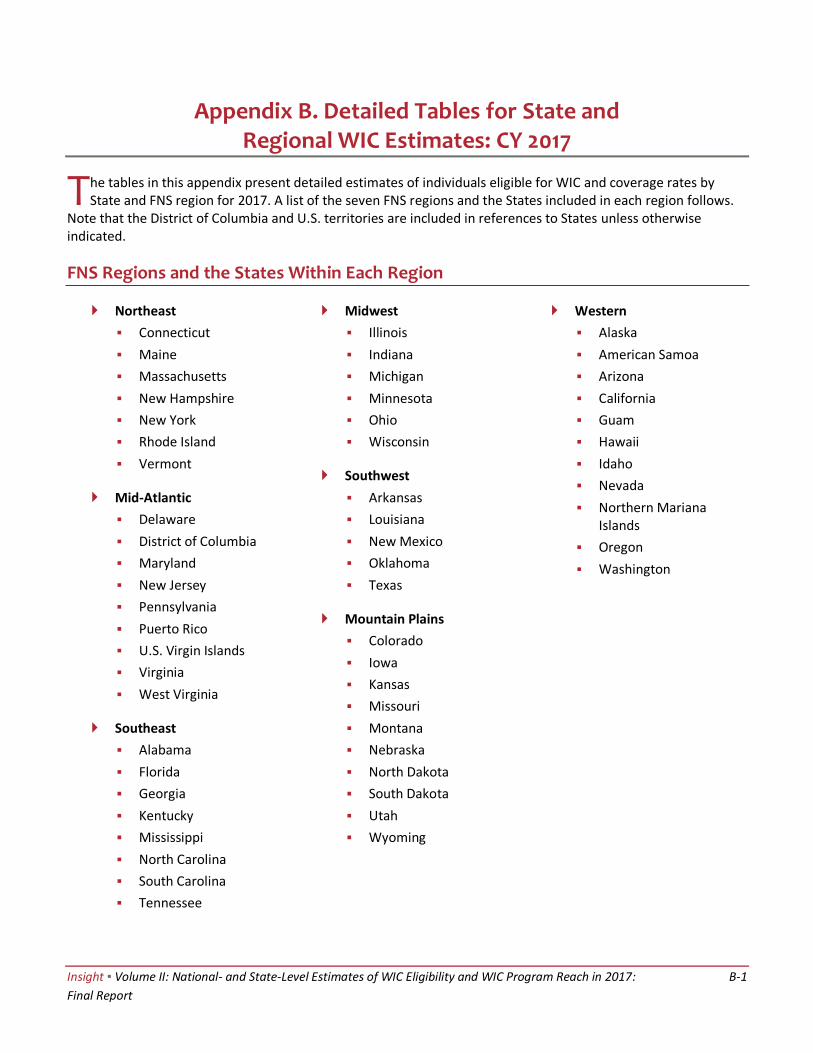
Insight ▪ Volume II: National- and State-Level Estimates of WIC Eligibility and WIC Program Reach in 2017: B-1
Final Report
Appendix B. Detailed Tables for State and Regional WIC Estimates: CY 2017
FNS Regions and the States Within Each Region
Northeast
▪ Connecticut
▪ Maine
▪ Massachusetts
▪ New Hampshire
▪ New York
▪ Rhode Island
▪ Vermont
Mid-Atlantic
▪ Delaware
▪ District of Columbia
▪ Maryland
▪ New Jersey
▪ Pennsylvania
▪ Puerto Rico
▪ U.S. Virgin Islands
▪ Virginia
▪ West Virginia
Southeast
▪ Alabama
▪ Florida
▪ Georgia
▪ Kentucky
▪ Mississippi
▪ North Carolina
▪ South Carolina
▪ Tennessee
Midwest
▪ Illinois
▪ Indiana
▪ Michigan
▪ Minnesota
▪ Ohio
▪ Wisconsin
Southwest
▪ Arkansas
▪ Louisiana
▪ New Mexico
▪ Oklahoma
▪ Texas
Mountain Plains
▪ Colorado
▪ Iowa
▪ Kansas
▪ Missouri
▪ Montana
▪ Nebraska
▪ North Dakota
▪ South Dakota
▪ Utah
▪ Wyoming
Western
▪ Alaska
▪ American Samoa
▪ Arizona
▪ California
▪ Guam
▪ Hawaii
▪ Idaho
▪ Nevada
▪ Northern Mariana Islands
▪ Oregon
▪ Washington
Th e tables in this appendix present detailed estimates of individuals eligible for WIC and coverage rates by State and FNS region for 2017. A list of the seven FNS regions and the States included in each region follows.
Note that the District of Columbia and U.S. territories are included in references to States unless otherwise indicated.
Insight ▪ Volume II: National- and State-Level Estimates of WIC Eligibility and WIC Program Reach in 2017: B-2
Final Report
Table B.1. WIC Eligibility and Coverage Rates by State and FNS Region: CY 2017
This table shows the estimated number of individuals eligible for WIC, the number of individuals participating in WIC, and the resulting coverage rates by State and FNS region.
Table B.2. WIC Eligibility and Coverage Rates by FNS Region and States in Each Region: CY 2017
This table shows the estimated number of individuals eligible for WIC, the number of individuals participating in WIC, and the resulting coverage rates by FNS region and the States within each region.
Table B.3. WIC Eligibility, Participants, and Coverage Rates by FNS Region and Participant Category: CY 2017
This table shows the estimated number of individuals eligible for WIC, the number of individuals participating in WIC, and the resulting coverage rates by FNS region and participant category.
Table B.4. WIC Eligibility Standard Errors by State and FNS Region: CY 2017
This table shows the estimated number of individuals eligible for WIC and the associated standard errors and coefficients of variation by State and FNS region.
Table B.5. WIC Eligibility Standard Errors by FNS Region and States in Each Region: CY 2017
This table shows the estimated number of individuals eligible for WIC and the associated standard errors and coefficients of variation by FNS region and the States within each region.
Table B.6. Standard Errors for WIC Eligibility by FNS Region and Participant Category: CY 2017
This table shows the estimated number of individuals eligible for WIC and the associated standard errors and coefficients of variation by FNS region and participant category.
Table B.7. Adjustments for Calculating the Average Monthly Number of Individuals Eligible for WIC in Puerto Rico and the Other U.S. Territories by Participant Category: CY 2017
Analogous to table A.5 of the national estimates, this table shows the step-by-step adjustments made to calculate the final numbers of infants, children, and pregnant and postpartum women who were eligible for WIC in Puerto Rico (table B.7a) and the other U.S. territories (table B.7b) based on the PRCS data for Puerto Rico (IPUMS-USA, n.d.) and the U.S. Census Bureau population estimates for the other territories (U.S. Census Bureau, n.d.c).
Table B.8. Regional Estimates of the Average Monthly Numbers of Infants and Children Eligible for WIC by Demographic and Income Characteristics: CY 2017
This table shows the estimated numbers of infants and children eligible for WIC by demographic and income characteristics in the CPS-ASEC data by FNS region (NBER, n.d.b). It is similar to table A.6a but shows the data by region and does not show results for children by year of age. Note that this table does not include infants and children from Puerto Rico or the other U.S. territories. This table shows these characteristics using weights that have been fully adjusted, including adjustments for the undercount/overcount in the CPS (population adjustment), monthly income and certification periods (annual-to-monthly adjustment), and nutritional risk.
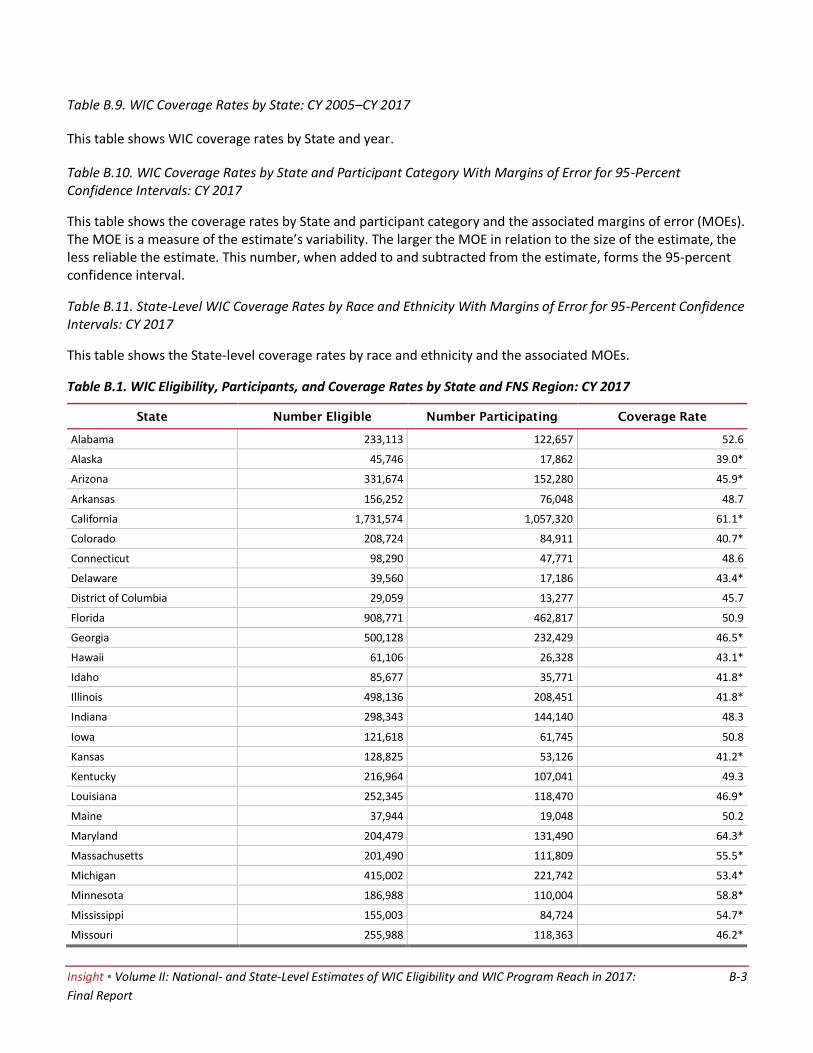
Insight ▪ Volume II: National- and State-Level Estimates of WIC Eligibility and WIC Program Reach in 2017: B-3
Final Report
Table B.9. WIC Coverage Rates by State: CY 2005–CY 2017
This table shows WIC coverage rates by State and year.
Table B.10. WIC Coverage Rates by State and Participant Category With Margins of Error for 95-Percent Confidence Intervals: CY 2017
This table shows the coverage rates by State and participant category and the associated margins of error (MOEs). The MOE is a measure of the estimate’s variability. The larger the MOE in relation to the size of the estimate, the less reliable the estimate. This number, when added to and subtracted from the estimate, forms the 95-percent confidence interval.
Table B.11. State-Level WIC Coverage Rates by Race and Ethnicity With Margins of Error for 95-Percent Confidence Intervals: CY 2017
This table shows the State-level coverage rates by race and ethnicity and the associated MOEs.
Table B.1. WIC Eligibility, Participants, and Coverage Rates by State and FNS Region: CY 2017
State Number Eligible Number Participating Coverage Rate
Alabama 233,113 122,657 52.6
Alaska 45,746 17,862 39.0*
Arizona 331,674 152,280 45.9*
Arkansas 156,252 76,048 48.7
California 1,731,574 1,057,320 61.1*
Colorado 208,724 84,911 40.7*
Connecticut 98,290 47,771 48.6
Delaware 39,560 17,186 43.4*
District of Columbia 29,059 13,277 45.7
Florida 908,771 462,817 50.9
Georgia 500,128 232,429 46.5*
Hawaii 61,106 26,328 43.1*
Idaho 85,677 35,771 41.8*
Illinois 498,136 208,451 41.8*
Indiana 298,343 144,140 48.3
Iowa 121,618 61,745 50.8
Kansas 128,825 53,126 41.2*
Kentucky 216,964 107,041 49.3
Louisiana 252,345 118,470 46.9*
Maine 37,944 19,048 50.2
Maryland 204,479 131,490 64.3*
Massachusetts 201,490 111,809 55.5*
Michigan 415,002 221,742 53.4*
Minnesota 186,988 110,004 58.8*
Mississippi 155,003 84,724 54.7*
Missouri 255,988 118,363 46.2*
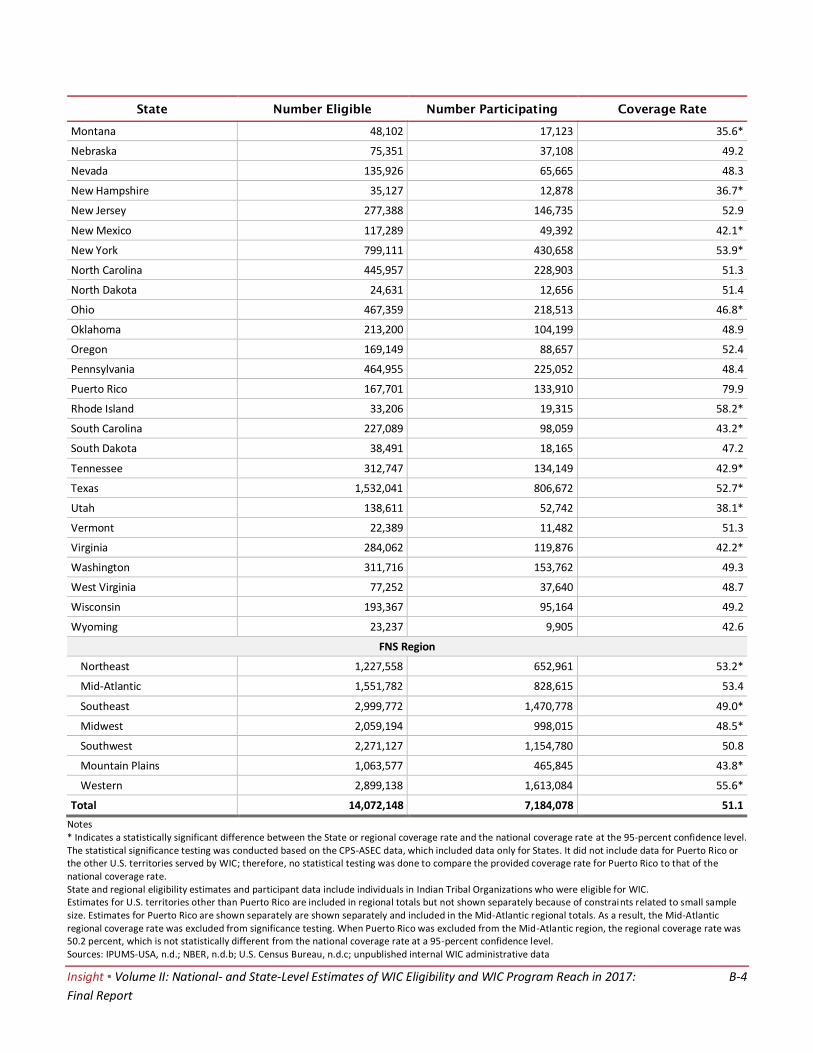
Insight ▪ Volume II: National- and State-Level Estimates of WIC Eligibility and WIC Program Reach in 2017: B-4
Final Report
State Number Eligible Number Participating Coverage Rate
Montana 48,102 17,123 35.6*
Nebraska 75,351 37,108 49.2
Nevada 135,926 65,665 48.3
New Hampshire 35,127 12,878 36.7*
New Jersey 277,388 146,735 52.9
New Mexico 117,289 49,392 42.1*
New York 799,111 430,658 53.9*
North Carolina 445,957 228,903 51.3
North Dakota 24,631 12,656 51.4
Ohio 467,359 218,513 46.8*
Oklahoma 213,200 104,199 48.9
Oregon 169,149 88,657 52.4
Pennsylvania 464,955 225,052 48.4
Puerto Rico 167,701 133,910 79.9
Rhode Island 33,206 19,315 58.2*
South Carolina 227,089 98,059 43.2*
South Dakota 38,491 18,165 47.2
Tennessee 312,747 134,149 42.9*
Texas 1,532,041 806,672 52.7*
Utah 138,611 52,742 38.1*
Vermont 22,389 11,482 51.3
Virginia 284,062 119,876 42.2*
Washington 311,716 153,762 49.3
West Virginia 77,252 37,640 48.7
Wisconsin 193,367 95,164 49.2
Wyoming 23,237 9,905 42.6
FNS Region
Northeast 1,227,558 652,961 53.2*
Mid-Atlantic 1,551,782 828,615 53.4
Southeast 2,999,772 1,470,778 49.0*
Midwest 2,059,194 998,015 48.5*
Southwest 2,271,127 1,154,780 50.8
Mountain Plains 1,063,577 465,845 43.8*
Western 2,899,138 1,613,084 55.6*
Total 14,072,148 7,184,078 51.1
Notes * Indicates a statistically significant difference between the State or regional coverage rate and the national coverage rate at the 95-percent confidence level. The statistical significance testing was conducted based on the CPS-ASEC data, which included data only for States. It did not include data for Puerto Rico or the other U.S. territories served by WIC; therefore, no statistical testing was done to compare the provided coverage rate for Puerto Rico to that of the national coverage rate. State and regional eligibility estimates and participant data include individuals in Indian Tribal Organizations who were eligible for WIC. Estimates for U.S. territories other than Puerto Rico are included in regional totals but not shown separately because of constraints related to small sample size. Estimates for Puerto Rico are shown separately are shown separately and included in the Mid-Atlantic regional totals. As a result, the Mid-Atlantic regional coverage rate was excluded from significance testing. When Puerto Rico was excluded from the Mid-Atlantic region, the regional coverage rate was 50.2 percent, which is not statistically different from the national coverage rate at a 95-percent confidence level. Sources: IPUMS-USA, n.d.; NBER, n.d.b; U.S. Census Bureau, n.d.c; unpublished internal WIC administrative data
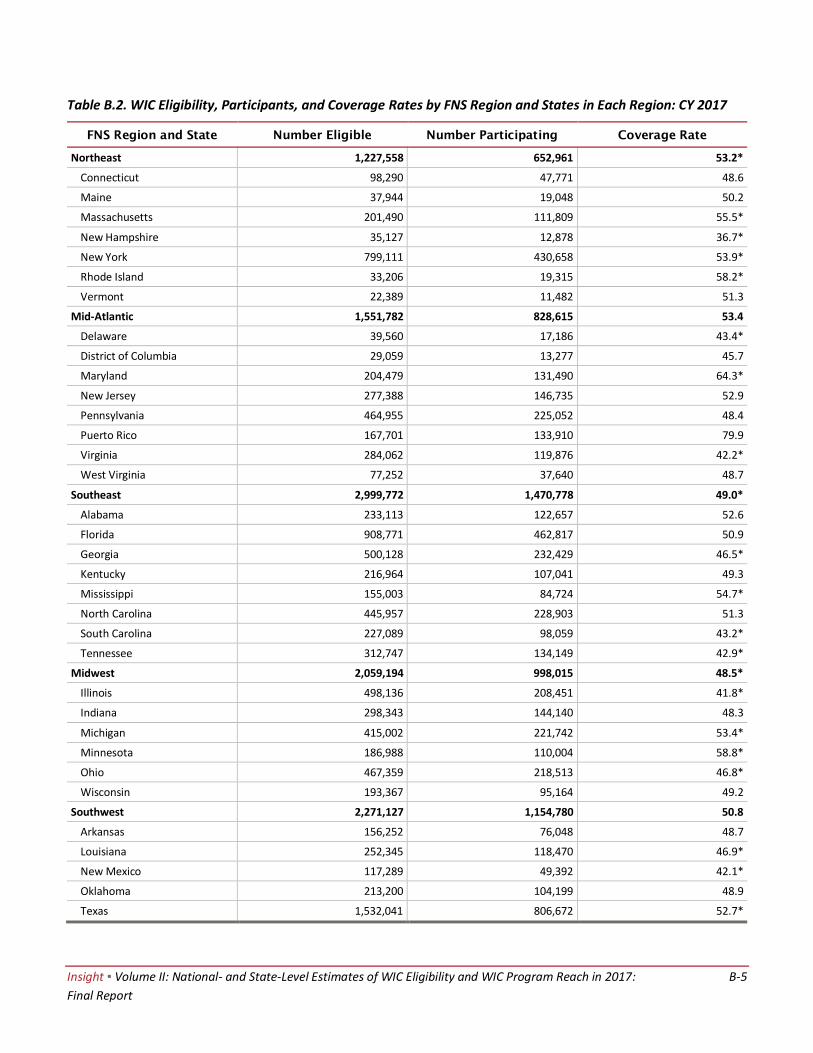
Insight ▪ Volume II: National- and State-Level Estimates of WIC Eligibility and WIC Program Reach in 2017: B-5
Final Report
Table B.2. WIC Eligibility, Participants, and Coverage Rates by FNS Region and States in Each Region: CY 2017
FNS Region and State Number Eligible Number Participating Coverage Rate
Northeast 1,227,558 652,961 53.2*
Connecticut 98,290 47,771 48.6
Maine 37,944 19,048 50.2
Massachusetts 201,490 111,809 55.5*
New Hampshire 35,127 12,878 36.7*
New York 799,111 430,658 53.9*
Rhode Island 33,206 19,315 58.2*
Vermont 22,389 11,482 51.3
Mid-Atlantic 1,551,782 828,615 53.4
Delaware 39,560 17,186 43.4*
District of Columbia 29,059 13,277 45.7
Maryland 204,479 131,490 64.3*
New Jersey 277,388 146,735 52.9
Pennsylvania 464,955 225,052 48.4
Puerto Rico 167,701 133,910 79.9
Virginia 284,062 119,876 42.2*
West Virginia 77,252 37,640 48.7
Southeast 2,999,772 1,470,778 49.0*
Alabama 233,113 122,657 52.6
Florida 908,771 462,817 50.9
Georgia 500,128 232,429 46.5*
Kentucky 216,964 107,041 49.3
Mississippi 155,003 84,724 54.7*
North Carolina 445,957 228,903 51.3
South Carolina 227,089 98,059 43.2*
Tennessee 312,747 134,149 42.9*
Midwest 2,059,194 998,015 48.5*
Illinois 498,136 208,451 41.8*
Indiana 298,343 144,140 48.3
Michigan 415,002 221,742 53.4*
Minnesota 186,988 110,004 58.8*
Ohio 467,359 218,513 46.8*
Wisconsin 193,367 95,164 49.2
Southwest 2,271,127 1,154,780 50.8
Arkansas 156,252 76,048 48.7
Louisiana 252,345 118,470 46.9*
New Mexico 117,289 49,392 42.1*
Oklahoma 213,200 104,199 48.9
Texas 1,532,041 806,672 52.7*
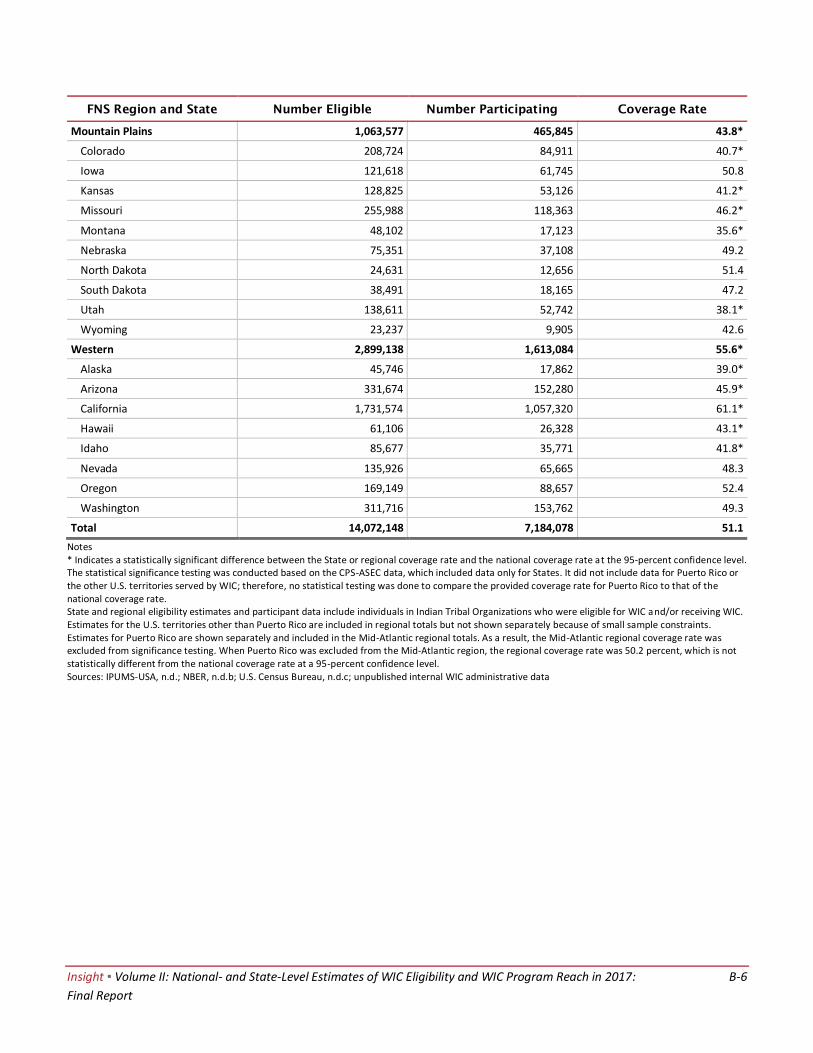
Insight ▪ Volume II: National- and State-Level Estimates of WIC Eligibility and WIC Program Reach in 2017: B-6
Final Report
FNS Region and State Number Eligible Number Participating Coverage Rate
Mountain Plains 1,063,577 465,845 43.8*
Colorado 208,724 84,911 40.7*
Iowa 121,618 61,745 50.8
Kansas 128,825 53,126 41.2*
Missouri 255,988 118,363 46.2*
Montana 48,102 17,123 35.6*
Nebraska 75,351 37,108 49.2
North Dakota 24,631 12,656 51.4
South Dakota 38,491 18,165 47.2
Utah 138,611 52,742 38.1*
Wyoming 23,237 9,905 42.6
Western 2,899,138 1,613,084 55.6*
Alaska 45,746 17,862 39.0*
Arizona 331,674 152,280 45.9*
California 1,731,574 1,057,320 61.1*
Hawaii 61,106 26,328 43.1*
Idaho 85,677 35,771 41.8*
Nevada 135,926 65,665 48.3
Oregon 169,149 88,657 52.4
Washington 311,716 153,762 49.3
Total 14,072,148 7,184,078 51.1
Notes * Indicates a statistically significant difference between the State or regional coverage rate and the national coverage rate at the 95-percent confidence level. The statistical significance testing was conducted based on the CPS-ASEC data, which included data only for States. It did not include data for Puerto Rico or the other U.S. territories served by WIC; therefore, no statistical testing was done to compare the provided coverage rate for Puerto Rico to that of the national coverage rate. State and regional eligibility estimates and participant data include individuals in Indian Tribal Organizations who were eligible for WIC and/or receiving WIC. Estimates for the U.S. territories other than Puerto Rico are included in regional totals but not shown separately because of small sample constraints. Estimates for Puerto Rico are shown separately and included in the Mid-Atlantic regional totals. As a result, the Mid-Atlantic regional coverage rate was excluded from significance testing. When Puerto Rico was excluded from the Mid-Atlantic region, the regional coverage rate was 50.2 percent, which is not statistically different from the national coverage rate at a 95-percent confidence level. Sources: IPUMS-USA, n.d.; NBER, n.d.b; U.S. Census Bureau, n.d.c; unpublished internal WIC administrative data
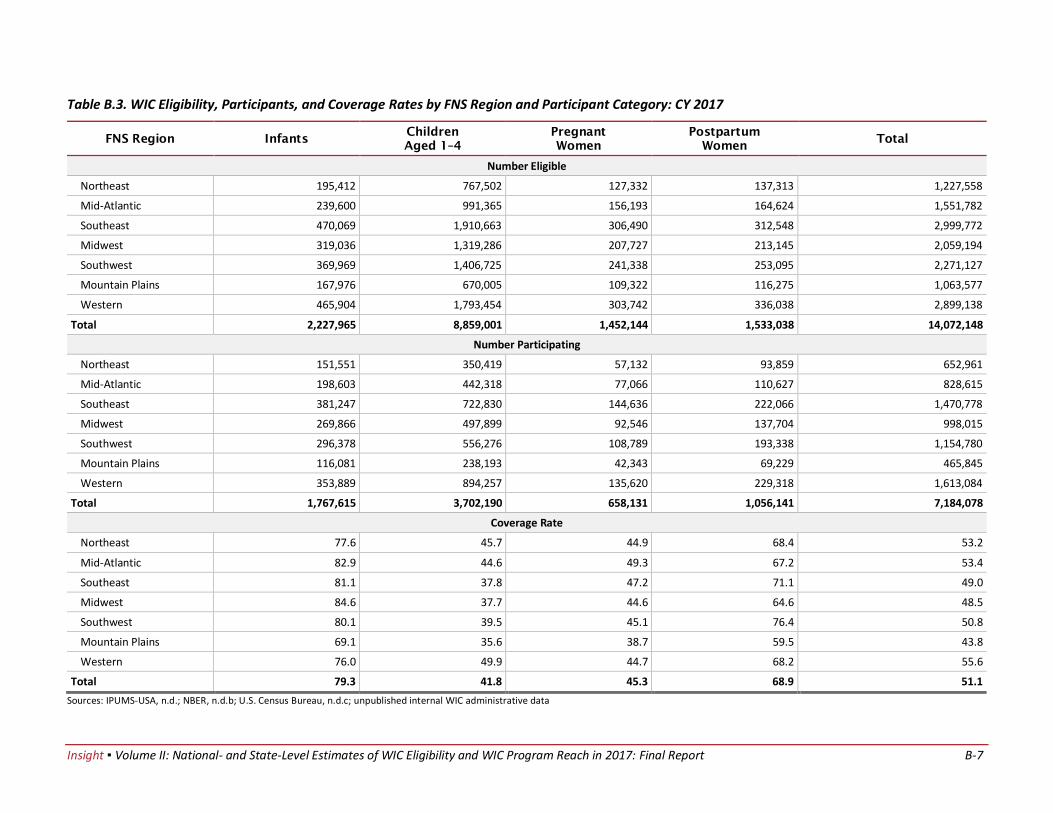
Insight ▪ Volume II: National- and State-Level Estimates of WIC Eligibility and WIC Program Reach in 2017: Final Report B-7
Table B.3. WIC Eligibility, Participants, and Coverage Rates by FNS Region and Participant Category: CY 2017
FNS Region Infants Children
Aged 1–4
Pregnant
Women
Postpartum
Women Total
Number Eligible
Northeast 195,412 767,502 127,332 137,313 1,227,558
Mid-Atlantic 239,600 991,365 156,193 164,624 1,551,782
Southeast 470,069 1,910,663 306,490 312,548 2,999,772
Midwest 319,036 1,319,286 207,727 213,145 2,059,194
Southwest 369,969 1,406,725 241,338 253,095 2,271,127
Mountain Plains 167,976 670,005 109,322 116,275 1,063,577
Western 465,904 1,793,454 303,742 336,038 2,899,138
Total 2,227,965 8,859,001 1,452,144 1,533,038 14,072,148
Number Participating
Northeast 151,551 350,419 57,132 93,859 652,961
Mid-Atlantic 198,603 442,318 77,066 110,627 828,615
Southeast 381,247 722,830 144,636 222,066 1,470,778
Midwest 269,866 497,899 92,546 137,704 998,015
Southwest 296,378 556,276 108,789 193,338 1,154,780
Mountain Plains 116,081 238,193 42,343 69,229 465,845
Western 353,889 894,257 135,620 229,318 1,613,084
Total 1,767,615 3,702,190 658,131 1,056,141 7,184,078
Coverage Rate
Northeast 77.6 45.7 44.9 68.4 53.2
Mid-Atlantic 82.9 44.6 49.3 67.2 53.4
Southeast 81.1 37.8 47.2 71.1 49.0
Midwest 84.6 37.7 44.6 64.6 48.5
Southwest 80.1 39.5 45.1 76.4 50.8
Mountain Plains 69.1 35.6 38.7 59.5 43.8
Western 76.0 49.9 44.7 68.2 55.6
Total 79.3 41.8 45.3 68.9 51.1
Sources: IPUMS-USA, n.d.; NBER, n.d.b; U.S. Census Bureau, n.d.c; unpublished internal WIC administrative data
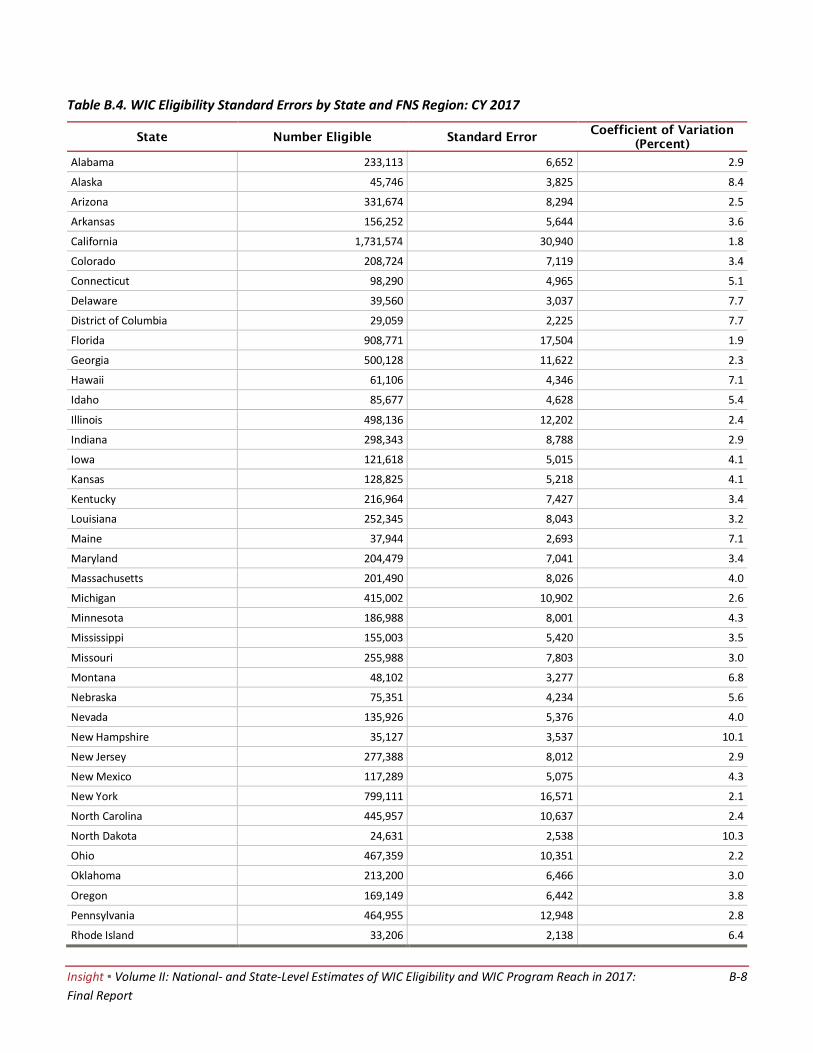
Insight ▪ Volume II: National- and State-Level Estimates of WIC Eligibility and WIC Program Reach in 2017: B-8
Final Report
Table B.4. WIC Eligibility Standard Errors by State and FNS Region: CY 2017
State Number Eligible Standard Error Coefficient of Variation
(Percent)
Alabama 233,113 6,652 2.9
Alaska 45,746 3,825 8.4
Arizona 331,674 8,294 2.5
Arkansas 156,252 5,644 3.6
California 1,731,574 30,940 1.8
Colorado 208,724 7,119 3.4
Connecticut 98,290 4,965 5.1
Delaware 39,560 3,037 7.7
District of Columbia 29,059 2,225 7.7
Florida 908,771 17,504 1.9
Georgia 500,128 11,622 2.3
Hawaii 61,106 4,346 7.1
Idaho 85,677 4,628 5.4
Illinois 498,136 12,202 2.4
Indiana 298,343 8,788 2.9
Iowa 121,618 5,015 4.1
Kansas 128,825 5,218 4.1
Kentucky 216,964 7,427 3.4
Louisiana 252,345 8,043 3.2
Maine 37,944 2,693 7.1
Maryland 204,479 7,041 3.4
Massachusetts 201,490 8,026 4.0
Michigan 415,002 10,902 2.6
Minnesota 186,988 8,001 4.3
Mississippi 155,003 5,420 3.5
Missouri 255,988 7,803 3.0
Montana 48,102 3,277 6.8
Nebraska 75,351 4,234 5.6
Nevada 135,926 5,376 4.0
New Hampshire 35,127 3,537 10.1
New Jersey 277,388 8,012 2.9
New Mexico 117,289 5,075 4.3
New York 799,111 16,571 2.1
North Carolina 445,957 10,637 2.4
North Dakota 24,631 2,538 10.3
Ohio 467,359 10,351 2.2
Oklahoma 213,200 6,466 3.0
Oregon 169,149 6,442 3.8
Pennsylvania 464,955 12,948 2.8
Rhode Island 33,206 2,138 6.4
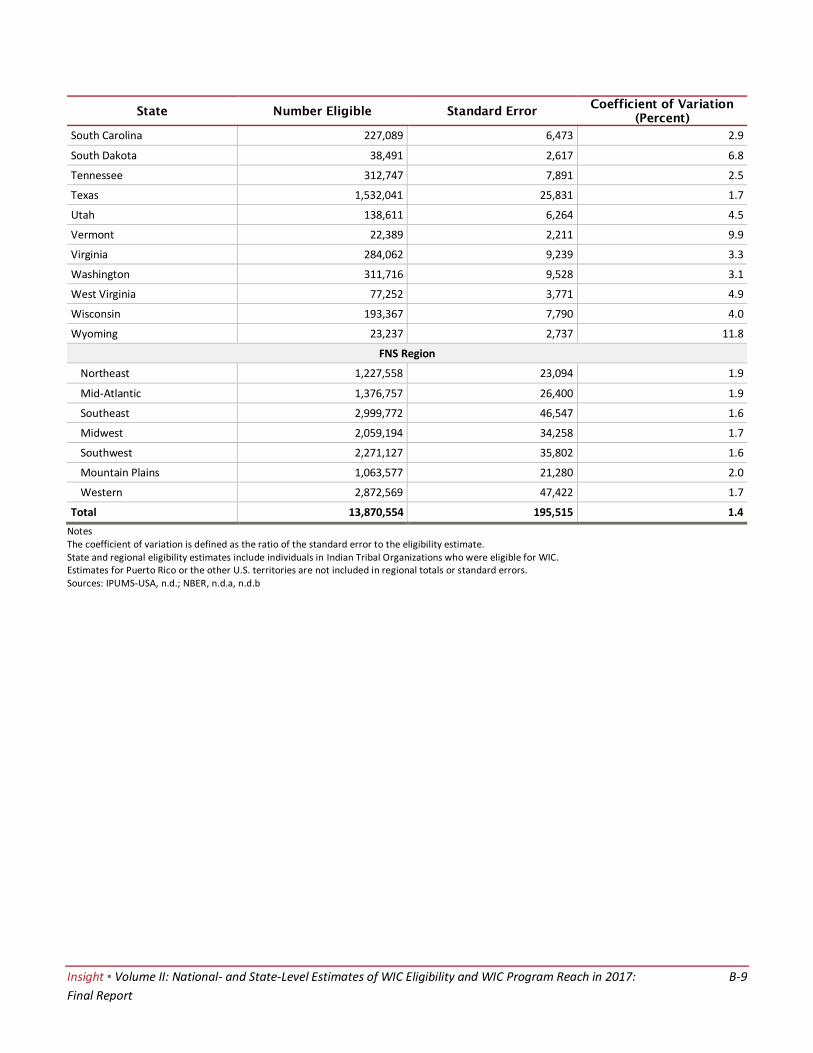
Insight ▪ Volume II: National- and State-Level Estimates of WIC Eligibility and WIC Program Reach in 2017: B-9
Final Report
State Number Eligible Standard Error Coefficient of Variation
(Percent)
South Carolina 227,089 6,473 2.9
South Dakota 38,491 2,617 6.8
Tennessee 312,747 7,891 2.5
Texas 1,532,041 25,831 1.7
Utah 138,611 6,264 4.5
Vermont 22,389 2,211 9.9
Virginia 284,062 9,239 3.3
Washington 311,716 9,528 3.1
West Virginia 77,252 3,771 4.9
Wisconsin 193,367 7,790 4.0
Wyoming 23,237 2,737 11.8
FNS Region
Northeast 1,227,558 23,094 1.9
Mid-Atlantic 1,376,757 26,400 1.9
Southeast 2,999,772 46,547 1.6
Midwest 2,059,194 34,258 1.7
Southwest 2,271,127 35,802 1.6
Mountain Plains 1,063,577 21,280 2.0
Western 2,872,569 47,422 1.7
Total 13,870,554 195,515 1.4
Notes The coefficient of variation is defined as the ratio of the standard error to the eligibility estimate. State and regional eligibility estimates include individuals in Indian Tribal Organizations who were eligible for WIC. Estimates for Puerto Rico or the other U.S. territories are not included in regional totals or standard errors. Sources: IPUMS-USA, n.d.; NBER, n.d.a, n.d.b
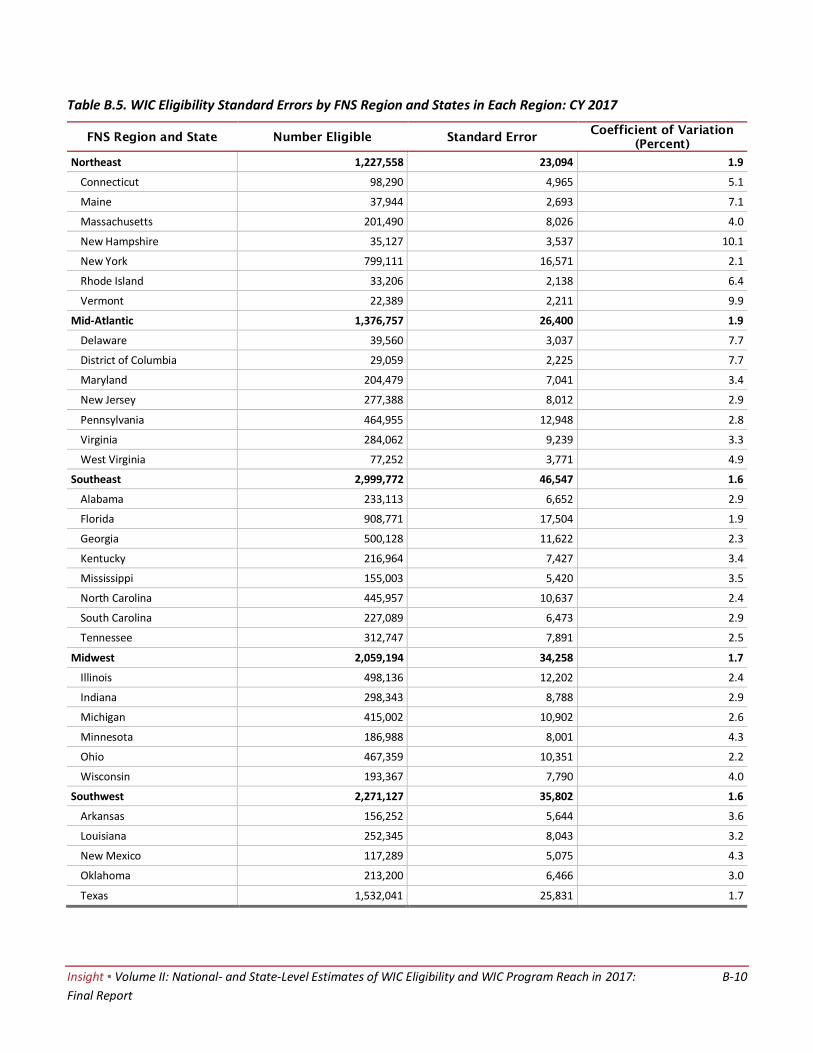
Insight ▪ Volume II: National- and State-Level Estimates of WIC Eligibility and WIC Program Reach in 2017: B-10
Final Report
Table B.5. WIC Eligibility Standard Errors by FNS Region and States in Each Region: CY 2017
FNS Region and State Number Eligible Standard Error Coefficient of Variation
(Percent)
Northeast 1,227,558 23,094 1.9
Connecticut 98,290 4,965 5.1
Maine 37,944 2,693 7.1
Massachusetts 201,490 8,026 4.0
New Hampshire 35,127 3,537 10.1
New York 799,111 16,571 2.1
Rhode Island 33,206 2,138 6.4
Vermont 22,389 2,211 9.9
Mid-Atlantic 1,376,757 26,400 1.9
Delaware 39,560 3,037 7.7
District of Columbia 29,059 2,225 7.7
Maryland 204,479 7,041 3.4
New Jersey 277,388 8,012 2.9
Pennsylvania 464,955 12,948 2.8
Virginia 284,062 9,239 3.3
West Virginia 77,252 3,771 4.9
Southeast 2,999,772 46,547 1.6
Alabama 233,113 6,652 2.9
Florida 908,771 17,504 1.9
Georgia 500,128 11,622 2.3
Kentucky 216,964 7,427 3.4
Mississippi 155,003 5,420 3.5
North Carolina 445,957 10,637 2.4
South Carolina 227,089 6,473 2.9
Tennessee 312,747 7,891 2.5
Midwest 2,059,194 34,258 1.7
Illinois 498,136 12,202 2.4
Indiana 298,343 8,788 2.9
Michigan 415,002 10,902 2.6
Minnesota 186,988 8,001 4.3
Ohio 467,359 10,351 2.2
Wisconsin 193,367 7,790 4.0
Southwest 2,271,127 35,802 1.6
Arkansas 156,252 5,644 3.6
Louisiana 252,345 8,043 3.2
New Mexico 117,289 5,075 4.3
Oklahoma 213,200 6,466 3.0
Texas 1,532,041 25,831 1.7
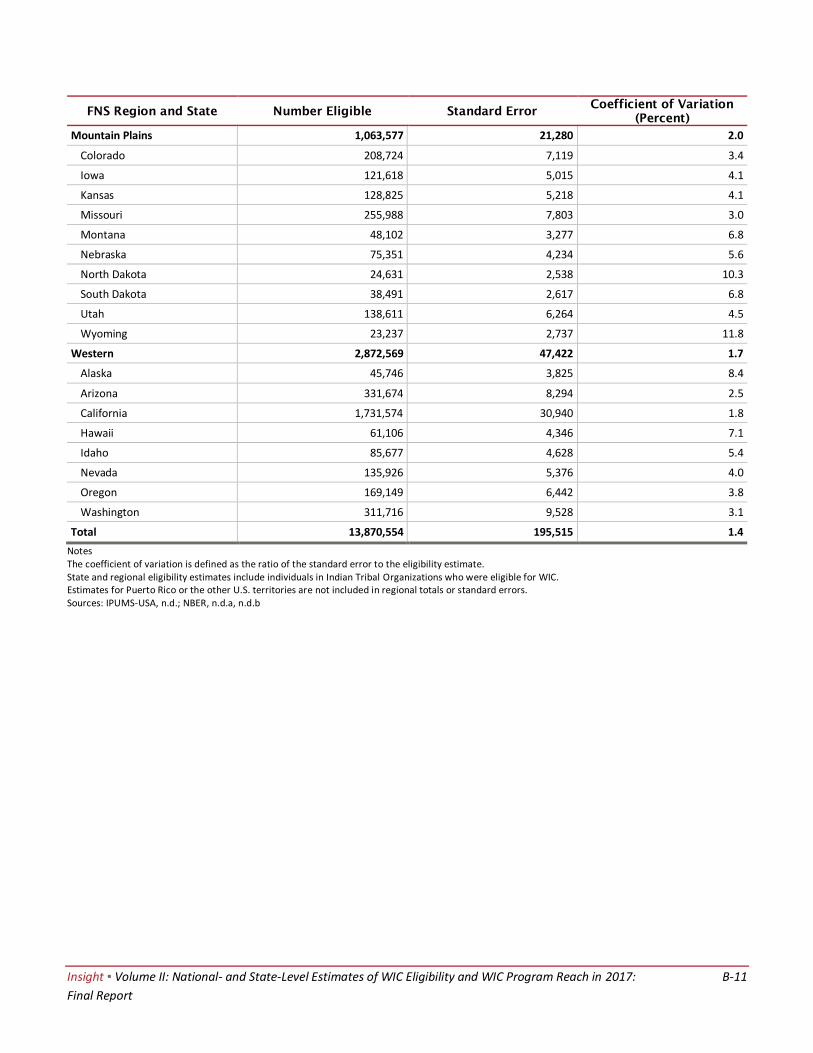
Insight ▪ Volume II: National- and State-Level Estimates of WIC Eligibility and WIC Program Reach in 2017: B-11
Final Report
FNS Region and State Number Eligible Standard Error Coefficient of Variation
(Percent)
Mountain Plains 1,063,577 21,280 2.0
Colorado 208,724 7,119 3.4
Iowa 121,618 5,015 4.1
Kansas 128,825 5,218 4.1
Missouri 255,988 7,803 3.0
Montana 48,102 3,277 6.8
Nebraska 75,351 4,234 5.6
North Dakota 24,631 2,538 10.3
South Dakota 38,491 2,617 6.8
Utah 138,611 6,264 4.5
Wyoming 23,237 2,737 11.8
Western 2,872,569 47,422 1.7
Alaska 45,746 3,825 8.4
Arizona 331,674 8,294 2.5
California 1,731,574 30,940 1.8
Hawaii 61,106 4,346 7.1
Idaho 85,677 4,628 5.4
Nevada 135,926 5,376 4.0
Oregon 169,149 6,442 3.8
Washington 311,716 9,528 3.1
Total 13,870,554 195,515 1.4
Notes The coefficient of variation is defined as the ratio of the standard error to the eligibility estimate. State and regional eligibility estimates include individuals in Indian Tribal Organizations who were eligible for WIC. Estimates for Puerto Rico or the other U.S. territories are not included in regional totals or standard errors. Sources: IPUMS-USA, n.d.; NBER, n.d.a, n.d.b
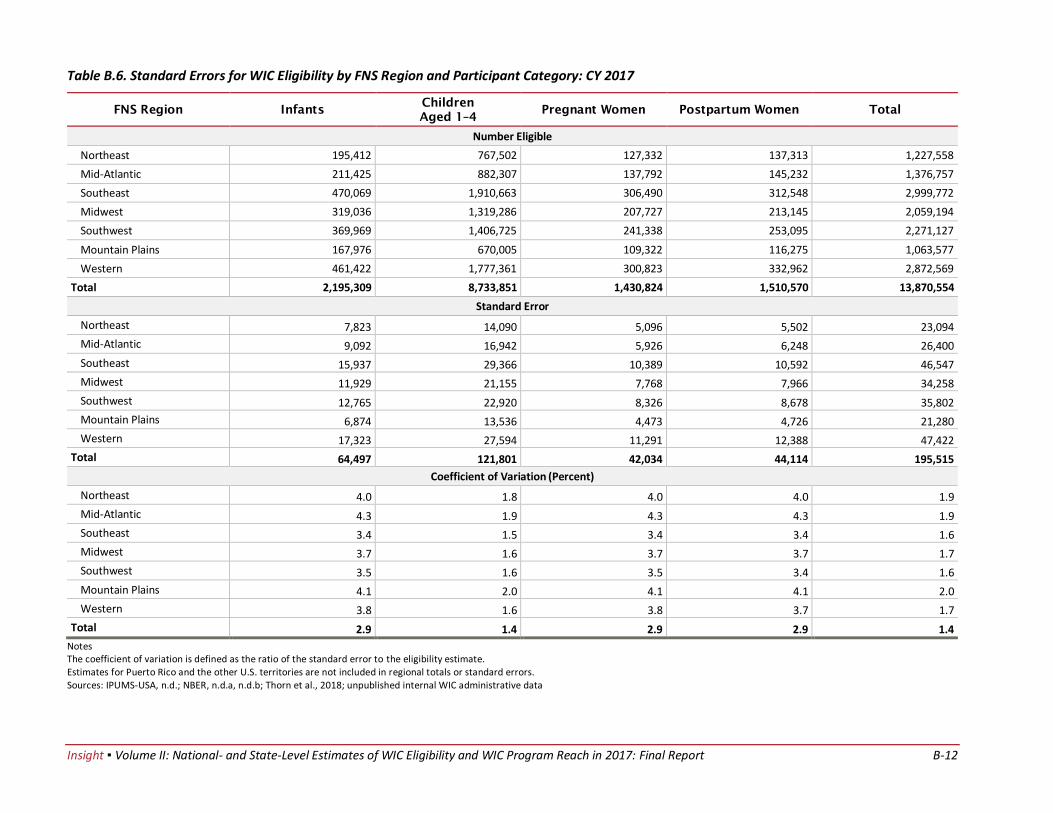
Insight ▪ Volume II: National- and State-Level Estimates of WIC Eligibility and WIC Program Reach in 2017: Final Report B-12
Table B.6. Standard Errors for WIC Eligibility by FNS Region and Participant Category: CY 2017
FNS Region Infants Children
Aged 1–4 Pregnant Women Postpartum Women Total
Number Eligible
Northeast 195,412 767,502 127,332 137,313 1,227,558
Mid-Atlantic 211,425 882,307 137,792 145,232 1,376,757
Southeast 470,069 1,910,663 306,490 312,548 2,999,772
Midwest 319,036 1,319,286 207,727 213,145 2,059,194
Southwest 369,969 1,406,725 241,338 253,095 2,271,127
Mountain Plains 167,976 670,005 109,322 116,275 1,063,577
Western 461,422 1,777,361 300,823 332,962 2,872,569
Total 2,195,309 8,733,851 1,430,824 1,510,570 13,870,554
Standard Error
Northeast 7,823 14,090 5,096 5,502 23,094
Mid-Atlantic 9,092 16,942 5,926 6,248 26,400
Southeast 15,937 29,366 10,389 10,592 46,547
Midwest 11,929 21,155 7,768 7,966 34,258
Southwest 12,765 22,920 8,326 8,678 35,802
Mountain Plains 6,874 13,536 4,473 4,726 21,280
Western 17,323 27,594 11,291 12,388 47,422
Total 64,497 121,801 42,034 44,114 195,515
Coefficient of Variation (Percent)
Northeast 4.0 1.8 4.0 4.0 1.9
Mid-Atlantic 4.3 1.9 4.3 4.3 1.9
Southeast 3.4 1.5 3.4 3.4 1.6
Midwest 3.7 1.6 3.7 3.7 1.7
Southwest 3.5 1.6 3.5 3.4 1.6
Mountain Plains 4.1 2.0 4.1 4.1 2.0
Western 3.8 1.6 3.8 3.7 1.7
Total 2.9 1.4 2.9 2.9 1.4
Notes The coefficient of variation is defined as the ratio of the standard error to the eligibility estimate. Estimates for Puerto Rico and the other U.S. territories are not included in regional totals or standard errors. Sources: IPUMS-USA, n.d.; NBER, n.d.a, n.d.b; Thorn et al., 2018; unpublished internal WIC administrative data

Insight ▪ National- and State-Level Estimates of WIC Eligibility and WIC Program Reach in 2017: Final Report B-13
Table B.7a. Adjustments for Calculating the Average Monthly Number of Individuals Eligible for WIC in Puerto Rico by Participant Category: CY 2017
Puerto Rico Infants
All
Children
Aged 1-4
Children
Aged 1
Children
Aged 2
Children
Aged 3
Children
Aged 4
Pregnant
Women
Breastfeeding
Women
Non-
Breastfeeding
Women
Total
Total number of infants/children in
the PRCS 24,140 122,561 29,833 26,102 34,228 32,398 _ _ _ 146,701
Number after adjustment for PRCS undercount/ overcount
27,379 120,591 27,885 29,488 31,067 32,151 _ _ _ 147,970
Number with annual income <= 185 percent of the Federal Poverty Guidelines
24,010 97,149 23,769 20,559 27,139 25,683 _ _ _ 121,159
Number adjunctively eligible and with
annual income > 185 percent of the Federal Poverty Guidelinesa
362 3,471 1,280 1,352 211 627 _ _ _ 3,832
Through SNAP 362 2,264 1,280 836 0 149 _ _ _ 2,626
Through TANF 0 0 0 0 0 0 _ _ _ 0
Through Medicaid 0 1,206 0 516 211 478 _ _ _ 1,206
Total number income and adjunctively
eligible 24,372 100,619 25,048 21,911 27,350 26,310 _ _ _ 124,991
Number after adjustment for monthly income and certification periods
27,784 105,650 26,301 23,007 28,718 27,625 _ _ _ 133,435
Total number eligible: Number after
adjustment for nutritional risk (infants and children)
26,951 104,594 26,038 22,776 28,431 27,349 _ _ _ 131,545
Starting point for estimates of women is number of eligible infants
_ _ _ _ _ _ 26,951 26,951 26,951 80,853
Number after adjustment for length of pregnancy and income of woman during pregnancy
_ _ _ _ _ _ 18,192 _ _ 18,192
Number after adjustment for multiple births and infant deaths
_ _ _ _ _ _ 18,149 26,887 26,887 71,923
Number after adjustment for breastfeeding
_ _ _ _ _ _ _ 12,422 6,130 18,552
Total number eligible: Number after adjustment for nutritional risk (pregnant and postpartum women)
_ _ _ _ _ _ 17,604 12,422 6,130 36,156
Total number eligible in Puerto Rico 26,951 104,594 26,038 22,776 28,431 27,349 17,604 12,422 6,130 167,701
Notes a Adjunctive eligibility was counted by the first program that qualified the person for WIC, in this order: SNAP, TANF, Medicaid. “–“ denotes blank cells. Source: IPUMS-USA, n.d.
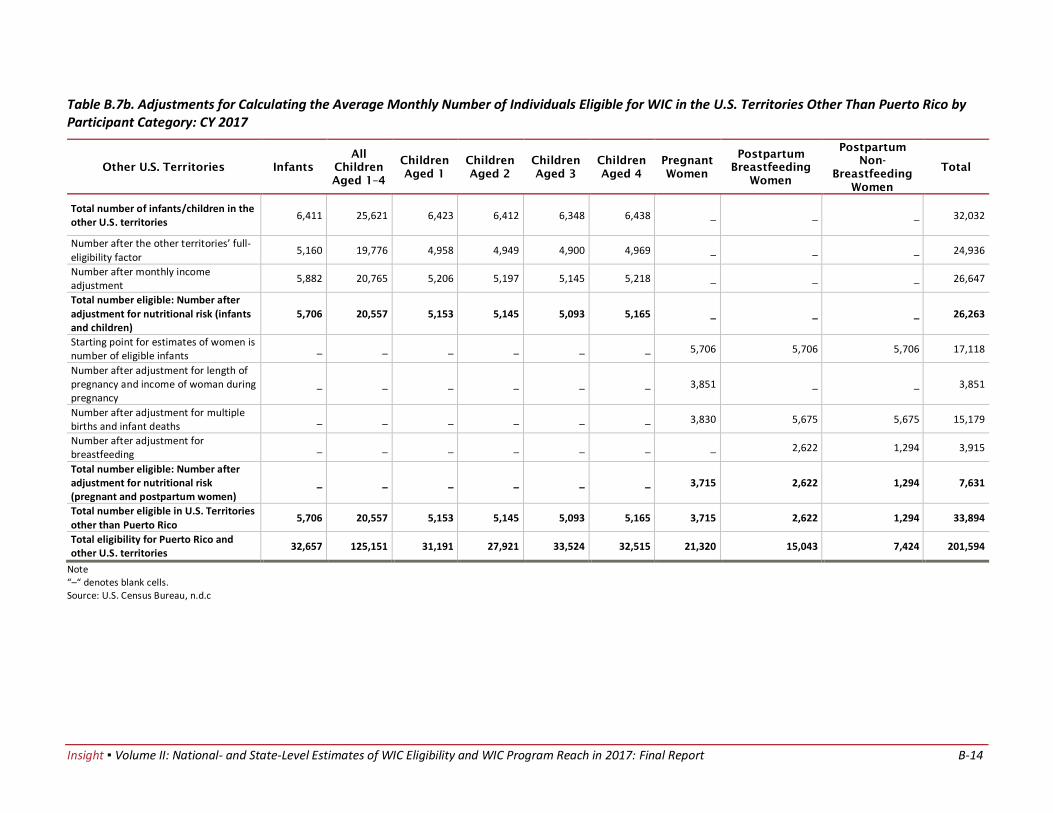
Insight ▪ Volume II: National- and State-Level Estimates of WIC Eligibility and WIC Program Reach in 2017: Final Report B-14
Table B.7b. Adjustments for Calculating the Average Monthly Number of Individuals Eligible for WIC in the U.S. Territories Other Than Puerto Rico by Participant Category: CY 2017
Other U.S. Territories Infants
All
Children
Aged 1–4
Children
Aged 1
Children
Aged 2
Children
Aged 3
Children
Aged 4
Pregnant
Women
Postpartum
Breastfeeding
Women
Postpartum
Non-
Breastfeeding
Women
Total
Total number of infants/children in the other U.S. territories
6,411 25,621 6,423 6,412 6,348 6,438 _ _ _ 32,032
Number after the other territories’ full-
eligibility factor 5,160 19,776 4,958 4,949 4,900 4,969 _ _ _ 24,936
Number after monthly income adjustment
5,882 20,765 5,206 5,197 5,145 5,218 _ _ _ 26,647
Total number eligible: Number after
adjustment for nutritional risk (infants and children)
5,706 20,557 5,153 5,145 5,093 5,165 _ _ _ 26,263
Starting point for estimates of women is number of eligible infants
_ _ _ _ _ _ 5,706 5,706 5,706 17,118
Number after adjustment for length of pregnancy and income of woman during pregnancy
_ _ _ _ _ _ 3,851 _ _ 3,851
Number after adjustment for multiple births and infant deaths
_ _ _ _ _ _ 3,830 5,675 5,675 15,179
Number after adjustment for breastfeeding
_ _ _ _ _ _ _ 2,622 1,294 3,915
Total number eligible: Number after adjustment for nutritional risk (pregnant and postpartum women)
_ _ _ _ _ _ 3,715 2,622 1,294 7,631
Total number eligible in U.S. Territories
other than Puerto Rico 5,706 20,557 5,153 5,145 5,093 5,165 3,715 2,622 1,294 33,894
Total eligibility for Puerto Rico and other U.S. territories
32,657 125,151 31,191 27,921 33,524 32,515 21,320 15,043 7,424 201,594
Note “–“ denotes blank cells. Source: U.S. Census Bureau, n.d.c
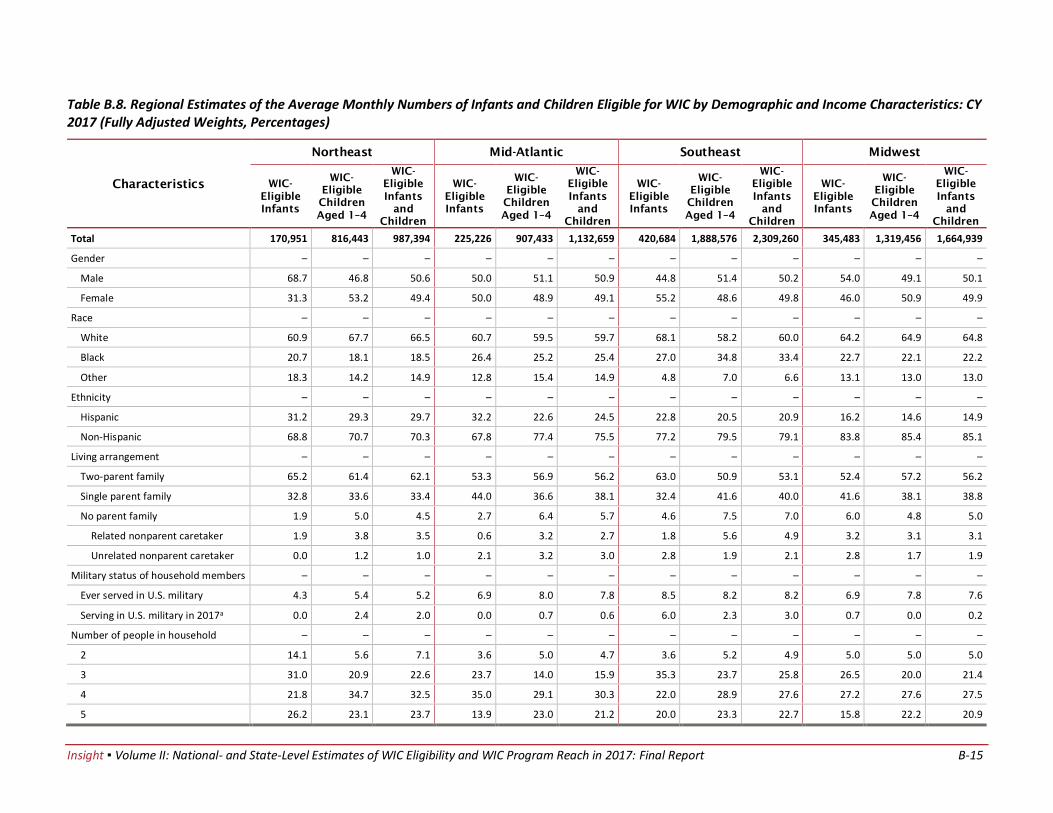
Insight ▪ Volume II: National- and State-Level Estimates of WIC Eligibility and WIC Program Reach in 2017: Final Report B-15
Table B.8. Regional Estimates of the Average Monthly Numbers of Infants and Children Eligible for WIC by Demographic and Income Characteristics: CY 2017 (Fully Adjusted Weights, Percentages)
Characteristics
Northeast Mid-Atlantic Southeast Midwest
WIC-
Eligible
Infants
WIC-
Eligible
Children
Aged 1–4
WIC-
Eligible
Infants
and
Children
WIC-
Eligible
Infants
WIC-
Eligible
Children
Aged 1–4
WIC-
Eligible
Infants
and
Children
WIC-
Eligible
Infants
WIC-
Eligible
Children
Aged 1–4
WIC-
Eligible
Infants
and
Children
WIC-
Eligible
Infants
WIC-
Eligible
Children
Aged 1–4
WIC-
Eligible
Infants
and
Children
Total 170,951 816,443 987,394 225,226 907,433 1,132,659 420,684 1,888,576 2,309,260 345,483 1,319,456 1,664,939
Gender – – – – – – – – – – – –
Male 68.7 46.8 50.6 50.0 51.1 50.9 44.8 51.4 50.2 54.0 49.1 50.1
Female 31.3 53.2 49.4 50.0 48.9 49.1 55.2 48.6 49.8 46.0 50.9 49.9
Race – – – – – – – – – – – –
White 60.9 67.7 66.5 60.7 59.5 59.7 68.1 58.2 60.0 64.2 64.9 64.8
Black 20.7 18.1 18.5 26.4 25.2 25.4 27.0 34.8 33.4 22.7 22.1 22.2
Other 18.3 14.2 14.9 12.8 15.4 14.9 4.8 7.0 6.6 13.1 13.0 13.0
Ethnicity – – – – – – – – – – – –
Hispanic 31.2 29.3 29.7 32.2 22.6 24.5 22.8 20.5 20.9 16.2 14.6 14.9
Non-Hispanic 68.8 70.7 70.3 67.8 77.4 75.5 77.2 79.5 79.1 83.8 85.4 85.1
Living arrangement – – – – – – – – – – – –
Two-parent family 65.2 61.4 62.1 53.3 56.9 56.2 63.0 50.9 53.1 52.4 57.2 56.2
Single parent family 32.8 33.6 33.4 44.0 36.6 38.1 32.4 41.6 40.0 41.6 38.1 38.8
No parent family 1.9 5.0 4.5 2.7 6.4 5.7 4.6 7.5 7.0 6.0 4.8 5.0
Related nonparent caretaker 1.9 3.8 3.5 0.6 3.2 2.7 1.8 5.6 4.9 3.2 3.1 3.1
Unrelated nonparent caretaker 0.0 1.2 1.0 2.1 3.2 3.0 2.8 1.9 2.1 2.8 1.7 1.9
Military status of household members – – – – – – – – – – – –
Ever served in U.S. military 4.3 5.4 5.2 6.9 8.0 7.8 8.5 8.2 8.2 6.9 7.8 7.6
Serving in U.S. military in 2017a 0.0 2.4 2.0 0.0 0.7 0.6 6.0 2.3 3.0 0.7 0.0 0.2
Number of people in household – – – – – – – – – – – –
2 14.1 5.6 7.1 3.6 5.0 4.7 3.6 5.2 4.9 5.0 5.0 5.0
3 31.0 20.9 22.6 23.7 14.0 15.9 35.3 23.7 25.8 26.5 20.0 21.4
4 21.8 34.7 32.5 35.0 29.1 30.3 22.0 28.9 27.6 27.2 27.6 27.5
5 26.2 23.1 23.7 13.9 23.0 21.2 20.0 23.3 22.7 15.8 22.2 20.9

Insight ▪ Volume II: National- and State-Level Estimates of WIC Eligibility and WIC Program Reach in 2017: Final Report B-16
Characteristics
Northeast Mid-Atlantic Southeast Midwest
WIC-
Eligible
Infants
WIC-
Eligible
Children
Aged 1–4
WIC-
Eligible
Infants
and
Children
WIC-
Eligible
Infants
WIC-
Eligible
Children
Aged 1–4
WIC-
Eligible
Infants
and
Children
WIC-
Eligible
Infants
WIC-
Eligible
Children
Aged 1–4
WIC-
Eligible
Infants
and
Children
WIC-
Eligible
Infants
WIC-
Eligible
Children
Aged 1–4
WIC-
Eligible
Infants
and
Children
6 or more 6.9 15.7 14.2 23.9 28.9 27.9 19.1 18.9 19.0 25.5 25.1 25.2
Percent with working parent(s) 76.5 78.1 77.8 59.3 73.7 70.9 76.8 73.2 73.9 67.6 76.9 75.0
Annual family income relative to FPG – – – – – – – – – – – –
No income 0.0 2.7 2.3 7.5 6.3 6.5 6.3 6.9 6.8 5.0 4.0 4.2
Up to 50% FPG 16.9 10.5 11.6 7.9 10.2 9.7 10.3 14.0 13.4 20.8 11.2 13.2
More than 50% up to 100% FPG 22.9 21.2 21.5 16.9 18.1 17.8 19.8 15.7 16.4 17.2 19.1 18.7
More than 100% up to 130% FPG 5.6 13.6 12.2 14.2 10.9 11.6 11.7 14.3 13.8 8.5 13.5 12.5
More than 130% up to 150% FPG 4.8 5.3 5.2 3.3 7.6 6.7 7.9 8.7 8.6 7.0 6.8 6.8
More than 150% up to 185% FPG 6.7 12.3 11.3 12.1 12.8 12.7 10.3 10.7 10.6 15.2 18.2 17.6
More than 185% up to 200% FPG 3.0 4.2 4.0 6.4 3.2 3.9 3.7 3.6 3.6 1.2 1.9 1.8
More than 200% FPG 40.2 30.2 31.9 31.7 31.0 31.1 30.0 26.0 26.8 25.1 25.3 25.2
Receipt of other benefits – – – – – – – – – – – –
No benefit receipt 8.2 15.0 13.9 9.4 16.7 15.2 17.3 15.9 16.2 16.2 14.8 15.1
Medicaid, SNAP and TANF 4.2 4.0 4.0 2.7 2.3 2.4 2.9 2.8 2.8 3.5 3.8 3.8
SNAP and TANF only 0.0 0.0 0.0 0.0 0.0 0.0 0.0 0.0 0.0 0.0 0.0 0.0
Medicaid and SNAP only 26.5 20.7 21.7 32.6 29.7 30.3 28.8 32.5 31.8 27.7 30.9 30.3
Medicaid and TANF only 0.0 0.0 0.0 0.0 0.6 0.4 0.0 0.7 0.5 0.0 0.6 0.5
SNAP only 5.2 4.2 4.4 4.7 3.7 3.9 6.6 5.2 5.5 6.2 6.7 6.6
TANF only 0.0 0.0 0.0 0.0 0.0 0.0 0.0 0.0 0.0 0.0 0.0 0.0
Medicaid only 55.9 56.1 56.0 50.6 47.0 47.7 44.4 42.9 43.2 46.4 43.1 43.8
Notes a The military status of household members who were currently serving in the U.S. military was included only if they resided in civilian housing on or off a military base. These estimates were tabulated from the fully adjusted person weights for the CPS-ASEC data. They were adjusted to account for the undercount/overcount of infants and children in the CPS relative to U.S. Census Bureau estimates, monthly income, or nutritional risk. This table does not include estimates for Puerto Rico or the other U.S. territories. FPG = Federal Poverty Guidelines “–“ denotes blank cells. Sources: IPUMS-USA, n.d.; NBER, n.d.b
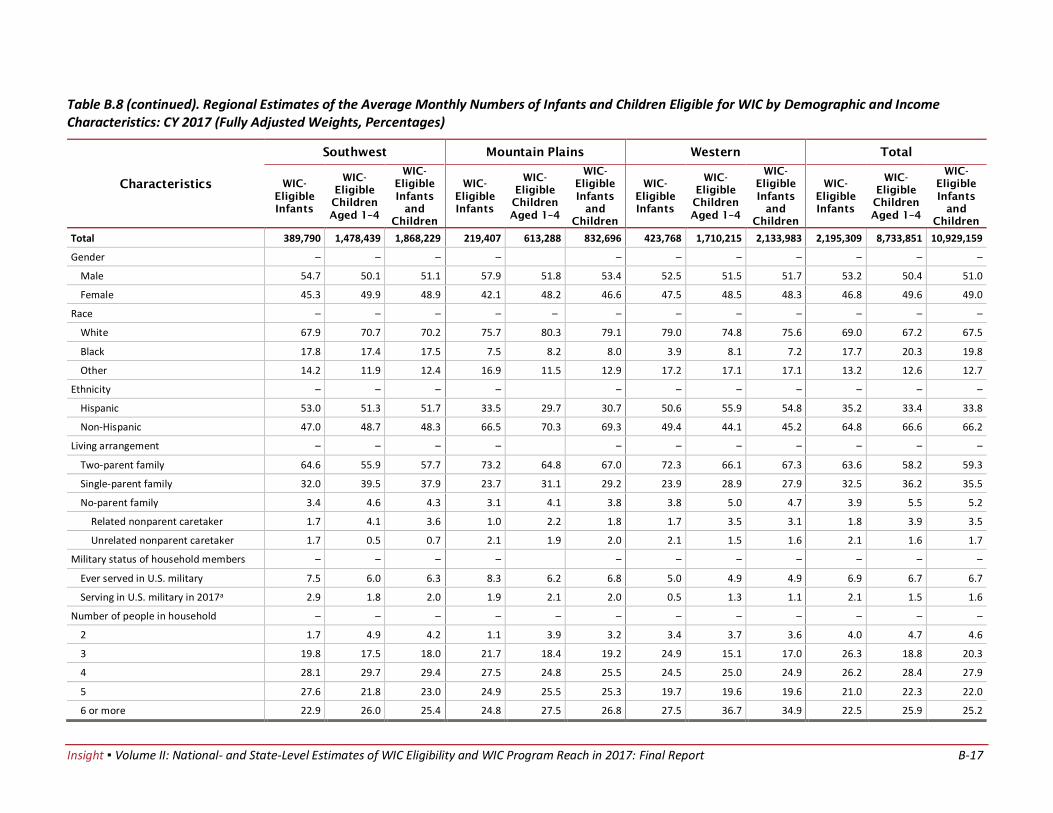
Insight ▪ Volume II: National- and State-Level Estimates of WIC Eligibility and WIC Program Reach in 2017: Final Report B-17
Table B.8 (continued). Regional Estimates of the Average Monthly Numbers of Infants and Children Eligible for WIC by Demographic and Income Characteristics: CY 2017 (Fully Adjusted Weights, Percentages)
Characteristics
Southwest Mountain Plains Western Total
WIC-
Eligible
Infants
WIC-
Eligible
Children
Aged 1–4
WIC-
Eligible
Infants
and
Children
WIC-
Eligible
Infants
WIC-
Eligible
Children
Aged 1–4
WIC-
Eligible
Infants
and
Children
WIC-
Eligible
Infants
WIC-
Eligible
Children
Aged 1–4
WIC-
Eligible
Infants
and
Children
WIC-
Eligible
Infants
WIC-
Eligible
Children
Aged 1–4
WIC-
Eligible
Infants
and
Children
Total 389,790 1,478,439 1,868,229 219,407 613,288 832,696 423,768 1,710,215 2,133,983 2,195,309 8,733,851 10,929,159
Gender – – – – – – – – – – –
Male 54.7 50.1 51.1 57.9 51.8 53.4 52.5 51.5 51.7 53.2 50.4 51.0
Female 45.3 49.9 48.9 42.1 48.2 46.6 47.5 48.5 48.3 46.8 49.6 49.0
Race – – – – – – – – – – –
White 67.9 70.7 70.2 75.7 80.3 79.1 79.0 74.8 75.6 69.0 67.2 67.5
Black 17.8 17.4 17.5 7.5 8.2 8.0 3.9 8.1 7.2 17.7 20.3 19.8
Other 14.2 11.9 12.4 16.9 11.5 12.9 17.2 17.1 17.1 13.2 12.6 12.7
Ethnicity – – – – – – – – – – –
Hispanic 53.0 51.3 51.7 33.5 29.7 30.7 50.6 55.9 54.8 35.2 33.4 33.8
Non-Hispanic 47.0 48.7 48.3 66.5 70.3 69.3 49.4 44.1 45.2 64.8 66.6 66.2
Living arrangement – – – – – – – – – – –
Two-parent family 64.6 55.9 57.7 73.2 64.8 67.0 72.3 66.1 67.3 63.6 58.2 59.3
Single-parent family 32.0 39.5 37.9 23.7 31.1 29.2 23.9 28.9 27.9 32.5 36.2 35.5
No-parent family 3.4 4.6 4.3 3.1 4.1 3.8 3.8 5.0 4.7 3.9 5.5 5.2
Related nonparent caretaker 1.7 4.1 3.6 1.0 2.2 1.8 1.7 3.5 3.1 1.8 3.9 3.5
Unrelated nonparent caretaker 1.7 0.5 0.7 2.1 1.9 2.0 2.1 1.5 1.6 2.1 1.6 1.7
Military status of household members – – – – – – – – – – –
Ever served in U.S. military 7.5 6.0 6.3 8.3 6.2 6.8 5.0 4.9 4.9 6.9 6.7 6.7
Serving in U.S. military in 2017a 2.9 1.8 2.0 1.9 2.1 2.0 0.5 1.3 1.1 2.1 1.5 1.6
Number of people in household – – – – – – – – – – – –
2 1.7 4.9 4.2 1.1 3.9 3.2 3.4 3.7 3.6 4.0 4.7 4.6
3 19.8 17.5 18.0 21.7 18.4 19.2 24.9 15.1 17.0 26.3 18.8 20.3
4 28.1 29.7 29.4 27.5 24.8 25.5 24.5 25.0 24.9 26.2 28.4 27.9
5 27.6 21.8 23.0 24.9 25.5 25.3 19.7 19.6 19.6 21.0 22.3 22.0
6 or more 22.9 26.0 25.4 24.8 27.5 26.8 27.5 36.7 34.9 22.5 25.9 25.2
–
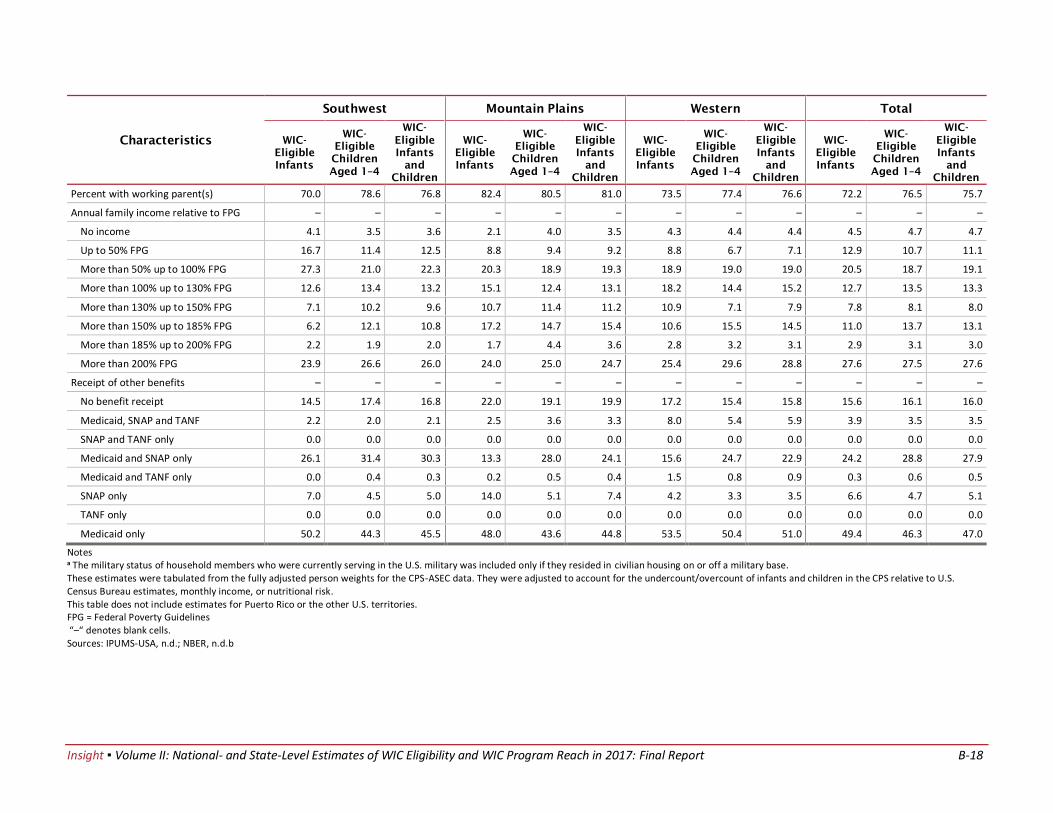
Insight ▪ Volume II: National- and State-Level Estimates of WIC Eligibility and WIC Program Reach in 2017: Final Report B-18
Characteristics
Southwest Mountain Plains Western Total
WIC-
Eligible
Infants
WIC-
Eligible
Children
Aged 1–4
WIC-
Eligible
Infants
and
Children
WIC-
Eligible
Infants
WIC-
Eligible
Children
Aged 1–4
WIC-
Eligible
Infants
and
Children
WIC-
Eligible
Infants
WIC-
Eligible
Children
Aged 1–4
WIC-
Eligible
Infants
and
Children
WIC-
Eligible
Infants
WIC-
Eligible
Children
Aged 1–4
WIC-
Eligible
Infants
and
Children
Percent with working parent(s) 70.0 78.6 76.8 82.4 80.5 81.0 73.5 77.4 76.6 72.2 76.5 75.7
Annual family income relative to FPG – – – – – – – – – – – –
No income 4.1 3.5 3.6 2.1 4.0 3.5 4.3 4.4 4.4 4.5 4.7 4.7
Up to 50% FPG 16.7 11.4 12.5 8.8 9.4 9.2 8.8 6.7 7.1 12.9 10.7 11.1
More than 50% up to 100% FPG 27.3 21.0 22.3 20.3 18.9 19.3 18.9 19.0 19.0 20.5 18.7 19.1
More than 100% up to 130% FPG 12.6 13.4 13.2 15.1 12.4 13.1 18.2 14.4 15.2 12.7 13.5 13.3
More than 130% up to 150% FPG 7.1 10.2 9.6 10.7 11.4 11.2 10.9 7.1 7.9 7.8 8.1 8.0
More than 150% up to 185% FPG 6.2 12.1 10.8 17.2 14.7 15.4 10.6 15.5 14.5 11.0 13.7 13.1
More than 185% up to 200% FPG 2.2 1.9 2.0 1.7 4.4 3.6 2.8 3.2 3.1 2.9 3.1 3.0
More than 200% FPG 23.9 26.6 26.0 24.0 25.0 24.7 25.4 29.6 28.8 27.6 27.5 27.6
Receipt of other benefits – – – – – – – – – – – –
No benefit receipt 14.5 17.4 16.8 22.0 19.1 19.9 17.2 15.4 15.8 15.6 16.1 16.0
Medicaid, SNAP and TANF 2.2 2.0 2.1 2.5 3.6 3.3 8.0 5.4 5.9 3.9 3.5 3.5
SNAP and TANF only 0.0 0.0 0.0 0.0 0.0 0.0 0.0 0.0 0.0 0.0 0.0 0.0
Medicaid and SNAP only 26.1 31.4 30.3 13.3 28.0 24.1 15.6 24.7 22.9 24.2 28.8 27.9
Medicaid and TANF only 0.0 0.4 0.3 0.2 0.5 0.4 1.5 0.8 0.9 0.3 0.6 0.5
SNAP only 7.0 4.5 5.0 14.0 5.1 7.4 4.2 3.3 3.5 6.6 4.7 5.1
TANF only 0.0 0.0 0.0 0.0 0.0 0.0 0.0 0.0 0.0 0.0 0.0 0.0
Medicaid only 50.2 44.3 45.5 48.0 43.6 44.8 53.5 50.4 51.0 49.4 46.3 47.0
Notes a The military status of household members who were currently serving in the U.S. military was included only if they resided in civilian housing on or off a military base. These estimates were tabulated from the fully adjusted person weights for the CPS-ASEC data. They were adjusted to account for the undercount/overcount of infants and children in the CPS relative to U.S. Census Bureau estimates, monthly income, or nutritional risk. This table does not include estimates for Puerto Rico or the other U.S. territories. FPG = Federal Poverty Guidelines “–“ denotes blank cells. Sources: IPUMS-USA, n.d.; NBER, n.d.b
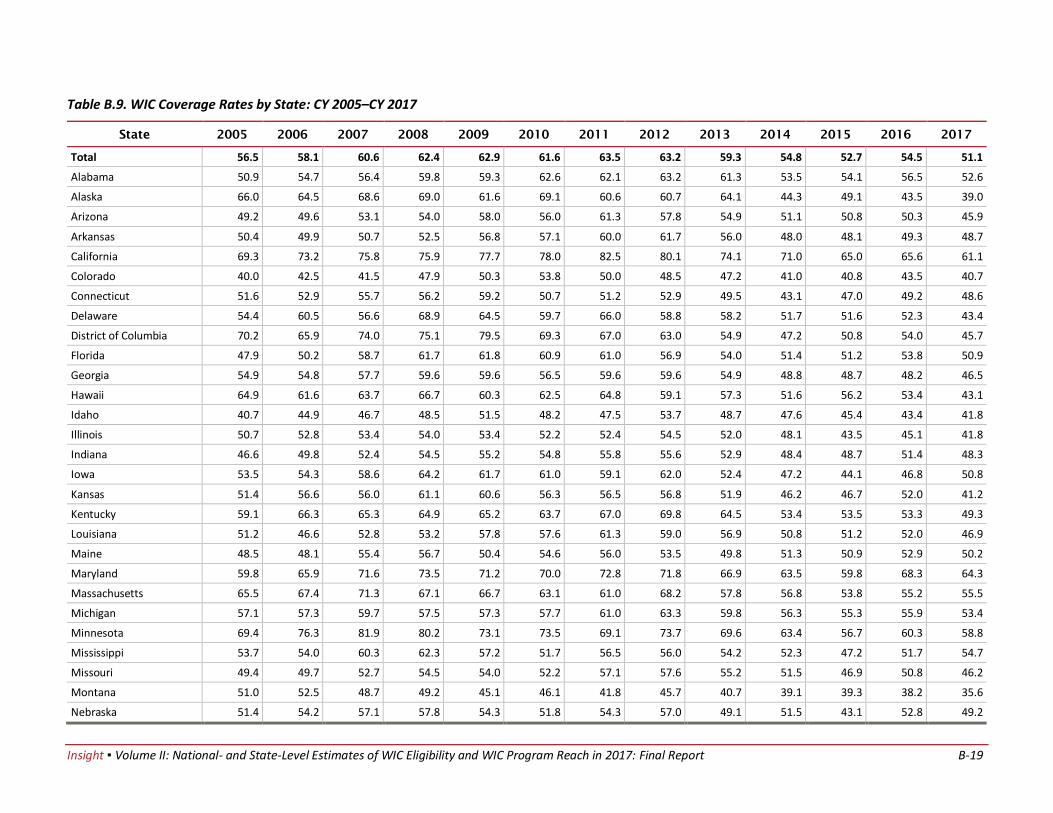
Insight ▪ Volume II: National- and State-Level Estimates of WIC Eligibility and WIC Program Reach in 2017: Final Report B-19
Table B.9. WIC Coverage Rates by State: CY 2005–CY 2017
State 2005 2006 2007 2008 2009 2010 2011 2012 2013 2014 2015 2016 2017
Total 56.5 58.1 60.6 62.4 62.9 61.6 63.5 63.2 59.3 54.8 52.7 54.5 51.1
Alabama 50.9 54.7 56.4 59.8 59.3 62.6 62.1 63.2 61.3 53.5 54.1 56.5 52.6
Alaska 66.0 64.5 68.6 69.0 61.6 69.1 60.6 60.7 64.1 44.3 49.1 43.5 39.0
Arizona 49.2 49.6 53.1 54.0 58.0 56.0 61.3 57.8 54.9 51.1 50.8 50.3 45.9
Arkansas 50.4 49.9 50.7 52.5 56.8 57.1 60.0 61.7 56.0 48.0 48.1 49.3 48.7
California 69.3 73.2 75.8 75.9 77.7 78.0 82.5 80.1 74.1 71.0 65.0 65.6 61.1
Colorado 40.0 42.5 41.5 47.9 50.3 53.8 50.0 48.5 47.2 41.0 40.8 43.5 40.7
Connecticut 51.6 52.9 55.7 56.2 59.2 50.7 51.2 52.9 49.5 43.1 47.0 49.2 48.6
Delaware 54.4 60.5 56.6 68.9 64.5 59.7 66.0 58.8 58.2 51.7 51.6 52.3 43.4
District of Columbia 70.2 65.9 74.0 75.1 79.5 69.3 67.0 63.0 54.9 47.2 50.8 54.0 45.7
Florida 47.9 50.2 58.7 61.7 61.8 60.9 61.0 56.9 54.0 51.4 51.2 53.8 50.9
Georgia 54.9 54.8 57.7 59.6 59.6 56.5 59.6 59.6 54.9 48.8 48.7 48.2 46.5
Hawaii 64.9 61.6 63.7 66.7 60.3 62.5 64.8 59.1 57.3 51.6 56.2 53.4 43.1
Idaho 40.7 44.9 46.7 48.5 51.5 48.2 47.5 53.7 48.7 47.6 45.4 43.4 41.8
Illinois 50.7 52.8 53.4 54.0 53.4 52.2 52.4 54.5 52.0 48.1 43.5 45.1 41.8
Indiana 46.6 49.8 52.4 54.5 55.2 54.8 55.8 55.6 52.9 48.4 48.7 51.4 48.3
Iowa 53.5 54.3 58.6 64.2 61.7 61.0 59.1 62.0 52.4 47.2 44.1 46.8 50.8
Kansas 51.4 56.6 56.0 61.1 60.6 56.3 56.5 56.8 51.9 46.2 46.7 52.0 41.2
Kentucky 59.1 66.3 65.3 64.9 65.2 63.7 67.0 69.8 64.5 53.4 53.5 53.3 49.3
Louisiana 51.2 46.6 52.8 53.2 57.8 57.6 61.3 59.0 56.9 50.8 51.2 52.0 46.9
Maine 48.5 48.1 55.4 56.7 50.4 54.6 56.0 53.5 49.8 51.3 50.9 52.9 50.2
Maryland 59.8 65.9 71.6 73.5 71.2 70.0 72.8 71.8 66.9 63.5 59.8 68.3 64.3
Massachusetts 65.5 67.4 71.3 67.1 66.7 63.1 61.0 68.2 57.8 56.8 53.8 55.2 55.5
Michigan 57.1 57.3 59.7 57.5 57.3 57.7 61.0 63.3 59.8 56.3 55.3 55.9 53.4
Minnesota 69.4 76.3 81.9 80.2 73.1 73.5 69.1 73.7 69.6 63.4 56.7 60.3 58.8
Mississippi 53.7 54.0 60.3 62.3 57.2 51.7 56.5 56.0 54.2 52.3 47.2 51.7 54.7
Missouri 49.4 49.7 52.7 54.5 54.0 52.2 57.1 57.6 55.2 51.5 46.9 50.8 46.2
Montana 51.0 52.5 48.7 49.2 45.1 46.1 41.8 45.7 40.7 39.1 39.3 38.2 35.6
Nebraska 51.4 54.2 57.1 57.8 54.3 51.8 54.3 57.0 49.1 51.5 43.1 52.8 49.2
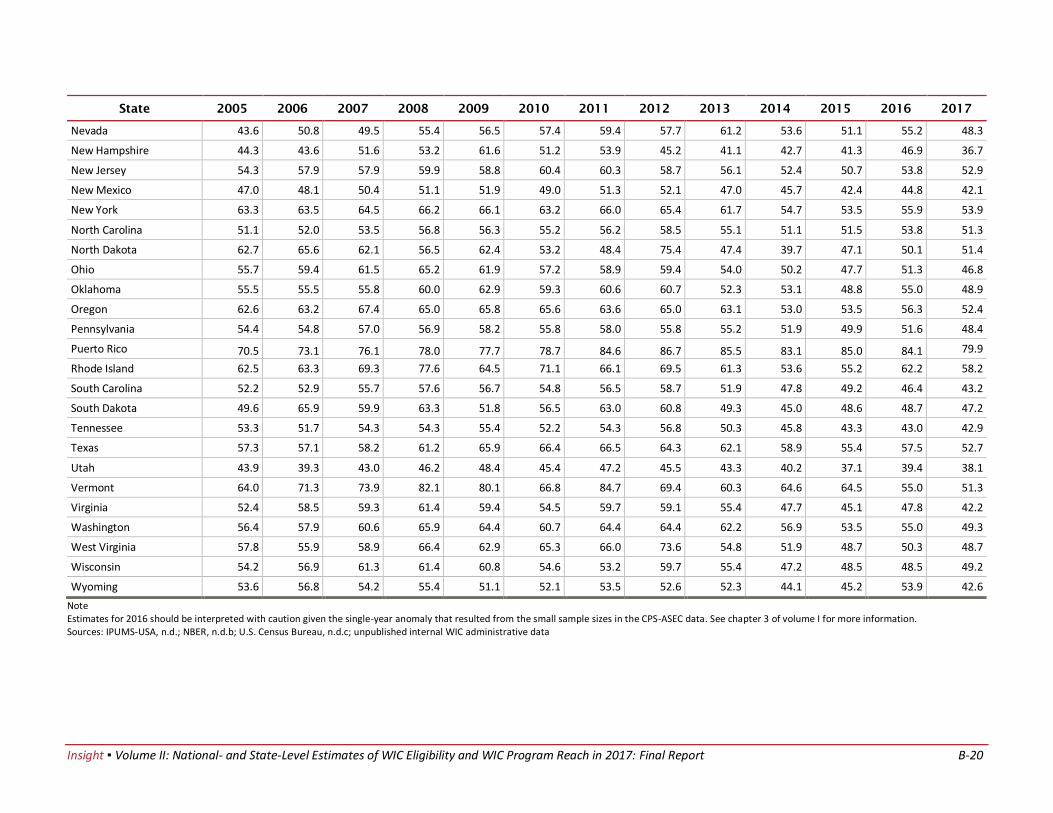
Insight ▪ Volume II: National- and State-Level Estimates of WIC Eligibility and WIC Program Reach in 2017: Final Report B-20
State 2005 2006 2007 2008 2009 2010 2011 2012 2013 2014 2015 2016 2017
Nevada 43.6 50.8 49.5 55.4 56.5 57.4 59.4 57.7 61.2 53.6 51.1 55.2 48.3
New Hampshire 44.3 43.6 51.6 53.2 61.6 51.2 53.9 45.2 41.1 42.7 41.3 46.9 36.7
New Jersey 54.3 57.9 57.9 59.9 58.8 60.4 60.3 58.7 56.1 52.4 50.7 53.8 52.9
New Mexico 47.0 48.1 50.4 51.1 51.9 49.0 51.3 52.1 47.0 45.7 42.4 44.8 42.1
New York 63.3 63.5 64.5 66.2 66.1 63.2 66.0 65.4 61.7 54.7 53.5 55.9 53.9
North Carolina 51.1 52.0 53.5 56.8 56.3 55.2 56.2 58.5 55.1 51.1 51.5 53.8 51.3
North Dakota 62.7 65.6 62.1 56.5 62.4 53.2 48.4 75.4 47.4 39.7 47.1 50.1 51.4
Ohio 55.7 59.4 61.5 65.2 61.9 57.2 58.9 59.4 54.0 50.2 47.7 51.3 46.8
Oklahoma 55.5 55.5 55.8 60.0 62.9 59.3 60.6 60.7 52.3 53.1 48.8 55.0 48.9
Oregon 62.6 63.2 67.4 65.0 65.8 65.6 63.6 65.0 63.1 53.0 53.5 56.3 52.4
Pennsylvania 54.4 54.8 57.0 56.9 58.2 55.8 58.0 55.8 55.2 51.9 49.9 51.6 48.4
Puerto Rico 70.5 73.1 76.1 78.0 77.7 78.7 84.6 86.7 85.5 83.1 85.0 84.1 79.9
Rhode Island 62.5 63.3 69.3 77.6 64.5 71.1 66.1 69.5 61.3 53.6 55.2 62.2 58.2
South Carolina 52.2 52.9 55.7 57.6 56.7 54.8 56.5 58.7 51.9 47.8 49.2 46.4 43.2
South Dakota 49.6 65.9 59.9 63.3 51.8 56.5 63.0 60.8 49.3 45.0 48.6 48.7 47.2
Tennessee 53.3 51.7 54.3 54.3 55.4 52.2 54.3 56.8 50.3 45.8 43.3 43.0 42.9
Texas 57.3 57.1 58.2 61.2 65.9 66.4 66.5 64.3 62.1 58.9 55.4 57.5 52.7
Utah 43.9 39.3 43.0 46.2 48.4 45.4 47.2 45.5 43.3 40.2 37.1 39.4 38.1
Vermont 64.0 71.3 73.9 82.1 80.1 66.8 84.7 69.4 60.3 64.6 64.5 55.0 51.3
Virginia 52.4 58.5 59.3 61.4 59.4 54.5 59.7 59.1 55.4 47.7 45.1 47.8 42.2
Washington 56.4 57.9 60.6 65.9 64.4 60.7 64.4 64.4 62.2 56.9 53.5 55.0 49.3
West Virginia 57.8 55.9 58.9 66.4 62.9 65.3 66.0 73.6 54.8 51.9 48.7 50.3 48.7
Wisconsin 54.2 56.9 61.3 61.4 60.8 54.6 53.2 59.7 55.4 47.2 48.5 48.5 49.2
Wyoming 53.6 56.8 54.2 55.4 51.1 52.1 53.5 52.6 52.3 44.1 45.2 53.9 42.6
Note Estimates for 2016 should be interpreted with caution given the single-year anomaly that resulted from the small sample sizes in the CPS-ASEC data. See chapter 3 of volume I for more information. Sources: IPUMS-USA, n.d.; NBER, n.d.b; U.S. Census Bureau, n.d.c; unpublished internal WIC administrative data

Insight ▪ Volume II: National- and State-Level Estimates of WIC Eligibility and WIC Program Reach in 2017: Final Report B-21
Table B.10. WIC Coverage Rates by State and Participant Category With Margins of Error for 95-Percent Confidence Intervals: CY 2017
State
Infants Children
Aged 1
Children
Aged 2
Children
Aged 3
Children
Aged 4
All Children
Aged 1-4
Pregnant
Women
Postpartum
Women Total
Rate MOE Rate MOE Rate MOE Rate MOE Rate MOE Rate MOE Rate MOE Rate MOE Rate MOE
Alabama 89.4 13.4 53.6 7.0 41.4 6.2 36.0 5.0 26.6 3.7 39.6 2.2 58.5 8.8 69.3 10.4 52.6 2.9
Alaska 56.0 19.2 41.5 12.6 35.7 17.2 33.2 11.8 22.5 8.1 33.9 5.9 35.7 12.3 45.5 15.5 39.0 6.4
Arizona 74.4 8.8 54.2 6.6 39.5 4.7 35.4 4.1 20.0 2.3 37.4 1.8 35.0 4.2 65.1 7.7 45.9 2.3
Arkansas 87.6 14.4 54.1 8.5 36.1 6.4 28.2 4.2 19.7 3.4 34.7 2.5 52.9 8.7 68.3 11.2 48.7 3.4
California 81.6 6.5 67.2 4.4 55.4 3.7 54.1 3.6 43.7 2.9 55.1 1.9 49.8 4.0 74.7 5.9 61.1 2.1
Colorado 62.5 8.6 48.9 6.7 33.0 4.3 31.1 3.9 19.4 3.0 33.1 2.2 35.4 4.9 57.7 7.9 40.7 2.7
Connecticut 91.0 22.3 59.7 12.5 37.3 7.5 31.9 6.6 21.7 3.9 37.0 3.3 59.1 14.5 55.3 13.6 48.6 4.8
Delaware 71.0 25.0 51.6 20.6 39.4 11.6 31.3 13.1 16.1 5.3 34.8 5.2 40.7 14.3 49.8 17.5 43.4 6.5
District of Columbia 89.0 38.2 55.1 23.2 30.8 14.8 30.7 16.7 11.7 4.1 31.3 4.7 37.0 15.9 75.7 32.5 45.7 6.9
Florida 81.8 7.2 59.0 5.1 42.9 3.5 37.4 3.1 21.5 1.9 40.5 1.6 47.9 4.2 71.1 6.3 50.9 1.9
Georgia 70.2 7.5 50.8 5.3 40.4 4.1 35.6 3.5 21.4 2.1 37.3 1.8 35.7 3.8 76.6 8.2 46.5 2.1
Hawaii 65.5 20.5 49.9 13.9 41.8 10.1 31.3 8.9 25.9 6.0 36.2 3.6 35.9 11.2 53.5 16.7 43.1 6.0
Idaho 59.0 12.6 58.4 14.0 37.5 8.0 34.8 7.3 15.9 3.6 36.6 3.7 32.7 7.0 51.6 11.0 41.8 4.4
Illinois 80.4 8.5 39.6 4.3 32.1 3.4 28.2 2.6 20.1 2.3 30.2 1.4 40.2 4.3 63.9 6.8 41.8 2.0
Indiana 77.9 11.4 54.5 6.1 46.6 5.4 35.1 4.4 16.0 1.9 38.7 2.0 40.3 5.9 69.6 10.2 48.3 2.8
Iowa 82.3 15.4 55.7 9.7 45.7 7.7 36.8 6.8 21.2 3.7 40.5 3.5 44.5 8.3 79.2 14.9 50.8 4.1
Kansas 62.7 10.4 50.5 10.0 37.5 6.2 35.2 5.9 16.2 2.7 34.7 2.7 37.8 6.3 49.9 8.3 41.2 3.3
Kentucky 78.9 13.8 54.3 7.1 40.6 5.2 38.1 5.5 26.1 3.6 39.8 2.4 48.5 8.5 60.5 10.6 49.3 3.3
Louisiana 85.7 14.5 46.7 7.5 35.5 4.5 28.6 3.4 19.6 2.4 33.1 2.0 48.0 8.1 70.6 11.9 46.9 2.9
Maine 67.0 24.2 60.2 22.9 47.5 13.9 52.1 13.6 28.2 7.4 46.7 6.0 37.6 13.6 55.2 19.9 50.2 7.0
Maryland 100.0 16.4 70.9 10.5 53.4 8.3 54.2 8.8 27.7 3.6 51.6 3.7 66.7 10.4 84.2 13.2 64.3 4.3
Massachusetts 74.8 11.5 68.3 11.6 53.9 8.6 46.9 6.5 29.2 5.0 49.9 4.0 45.3 7.0 68.1 10.5 55.5 4.3
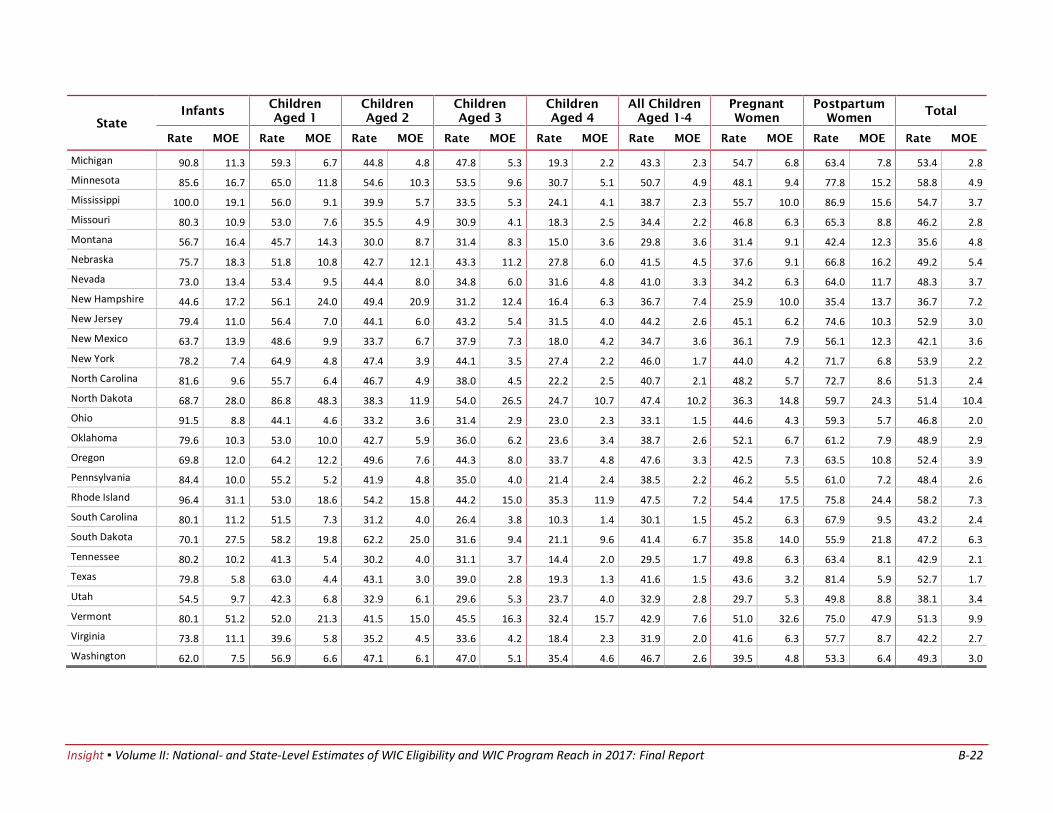
Insight ▪ Volume II: National- and State-Level Estimates of WIC Eligibility and WIC Program Reach in 2017: Final Report B-22
State
Infants Children
Aged 1
Children
Aged 2
Children
Aged 3
Children
Aged 4
All Children
Aged 1-4
Pregnant
Women
Postpartum
Women Total
Rate MOE Rate MOE Rate MOE Rate MOE Rate MOE Rate MOE Rate MOE Rate MOE Rate MOE
Michigan 90.8 11.3 59.3 6.7 44.8 4.8 47.8 5.3 19.3 2.2 43.3 2.3 54.7 6.8 63.4 7.8 53.4 2.8
Minnesota 85.6 16.7 65.0 11.8 54.6 10.3 53.5 9.6 30.7 5.1 50.7 4.9 48.1 9.4 77.8 15.2 58.8 4.9
Mississippi 100.0 19.1 56.0 9.1 39.9 5.7 33.5 5.3 24.1 4.1 38.7 2.3 55.7 10.0 86.9 15.6 54.7 3.7
Missouri 80.3 10.9 53.0 7.6 35.5 4.9 30.9 4.1 18.3 2.5 34.4 2.2 46.8 6.3 65.3 8.8 46.2 2.8
Montana 56.7 16.4 45.7 14.3 30.0 8.7 31.4 8.3 15.0 3.6 29.8 3.6 31.4 9.1 42.4 12.3 35.6 4.8
Nebraska 75.7 18.3 51.8 10.8 42.7 12.1 43.3 11.2 27.8 6.0 41.5 4.5 37.6 9.1 66.8 16.2 49.2 5.4
Nevada 73.0 13.4 53.4 9.5 44.4 8.0 34.8 6.0 31.6 4.8 41.0 3.3 34.2 6.3 64.0 11.7 48.3 3.7
New Hampshire 44.6 17.2 56.1 24.0 49.4 20.9 31.2 12.4 16.4 6.3 36.7 7.4 25.9 10.0 35.4 13.7 36.7 7.2
New Jersey 79.4 11.0 56.4 7.0 44.1 6.0 43.2 5.4 31.5 4.0 44.2 2.6 45.1 6.2 74.6 10.3 52.9 3.0
New Mexico 63.7 13.9 48.6 9.9 33.7 6.7 37.9 7.3 18.0 4.2 34.7 3.6 36.1 7.9 56.1 12.3 42.1 3.6
New York 78.2 7.4 64.9 4.8 47.4 3.9 44.1 3.5 27.4 2.2 46.0 1.7 44.0 4.2 71.7 6.8 53.9 2.2
North Carolina 81.6 9.6 55.7 6.4 46.7 4.9 38.0 4.5 22.2 2.5 40.7 2.1 48.2 5.7 72.7 8.6 51.3 2.4
North Dakota 68.7 28.0 86.8 48.3 38.3 11.9 54.0 26.5 24.7 10.7 47.4 10.2 36.3 14.8 59.7 24.3 51.4 10.4
Ohio 91.5 8.8 44.1 4.6 33.2 3.6 31.4 2.9 23.0 2.3 33.1 1.5 44.6 4.3 59.3 5.7 46.8 2.0
Oklahoma 79.6 10.3 53.0 10.0 42.7 5.9 36.0 6.2 23.6 3.4 38.7 2.6 52.1 6.7 61.2 7.9 48.9 2.9
Oregon 69.8 12.0 64.2 12.2 49.6 7.6 44.3 8.0 33.7 4.8 47.6 3.3 42.5 7.3 63.5 10.8 52.4 3.9
Pennsylvania 84.4 10.0 55.2 5.2 41.9 4.8 35.0 4.0 21.4 2.4 38.5 2.2 46.2 5.5 61.0 7.2 48.4 2.6
Rhode Island 96.4 31.1 53.0 18.6 54.2 15.8 44.2 15.0 35.3 11.9 47.5 7.2 54.4 17.5 75.8 24.4 58.2 7.3
South Carolina 80.1 11.2 51.5 7.3 31.2 4.0 26.4 3.8 10.3 1.4 30.1 1.5 45.2 6.3 67.9 9.5 43.2 2.4
South Dakota 70.1 27.5 58.2 19.8 62.2 25.0 31.6 9.4 21.1 9.6 41.4 6.7 35.8 14.0 55.9 21.8 47.2 6.3
Tennessee 80.2 10.2 41.3 5.4 30.2 4.0 31.1 3.7 14.4 2.0 29.5 1.7 49.8 6.3 63.4 8.1 42.9 2.1
Texas 79.8 5.8 63.0 4.4 43.1 3.0 39.0 2.8 19.3 1.3 41.6 1.5 43.6 3.2 81.4 5.9 52.7 1.7
Utah 54.5 9.7 42.3 6.8 32.9 6.1 29.6 5.3 23.7 4.0 32.9 2.8 29.7 5.3 49.8 8.8 38.1 3.4
Vermont 80.1 51.2 52.0 21.3 41.5 15.0 45.5 16.3 32.4 15.7 42.9 7.6 51.0 32.6 75.0 47.9 51.3 9.9
Virginia 73.8 11.1 39.6 5.8 35.2 4.5 33.6 4.2 18.4 2.3 31.9 2.0 41.6 6.3 57.7 8.7 42.2 2.7
Washington 62.0 7.5 56.9 6.6 47.1 6.1 47.0 5.1 35.4 4.6 46.7 2.6 39.5 4.8 53.3 6.4 49.3 3.0
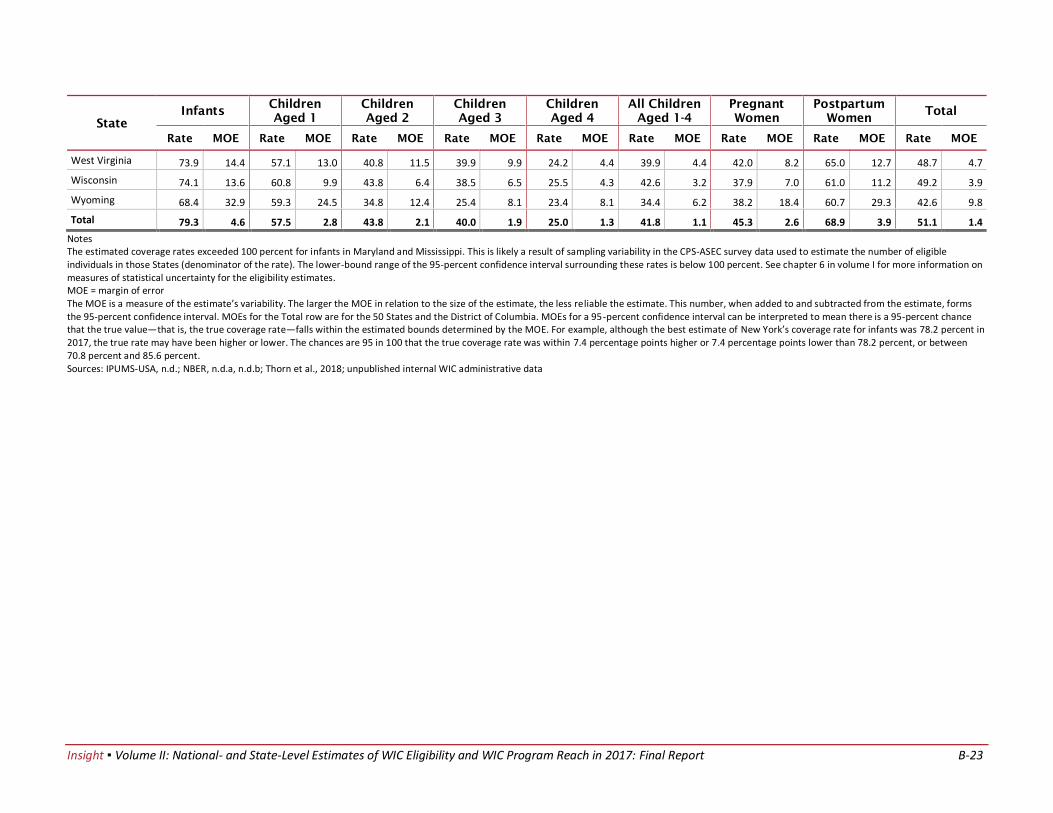
Insight ▪ Volume II: National- and State-Level Estimates of WIC Eligibility and WIC Program Reach in 2017: Final Report B-23
State
Infants Children
Aged 1
Children
Aged 2
Children
Aged 3
Children
Aged 4
All Children
Aged 1-4
Pregnant
Women
Postpartum
Women Total
Rate MOE Rate MOE Rate MOE Rate MOE Rate MOE Rate MOE Rate MOE Rate MOE Rate MOE
West Virginia 73.9 14.4 57.1 13.0 40.8 11.5 39.9 9.9 24.2 4.4 39.9 4.4 42.0 8.2 65.0 12.7 48.7 4.7
Wisconsin 74.1 13.6 60.8 9.9 43.8 6.4 38.5 6.5 25.5 4.3 42.6 3.2 37.9 7.0 61.0 11.2 49.2 3.9
Wyoming 68.4 32.9 59.3 24.5 34.8 12.4 25.4 8.1 23.4 8.1 34.4 6.2 38.2 18.4 60.7 29.3 42.6 9.8
Total 79.3 4.6 57.5 2.8 43.8 2.1 40.0 1.9 25.0 1.3 41.8 1.1 45.3 2.6 68.9 3.9 51.1 1.4
Notes The estimated coverage rates exceeded 100 percent for infants in Maryland and Mississippi. This is likely a result of sampling variability in the CPS-ASEC survey data used to estimate the number of eligible individuals in those States (denominator of the rate). The lower-bound range of the 95-percent confidence interval surrounding these rates is below 100 percent. See chapter 6 in volume I for more information on measures of statistical uncertainty for the eligibility estimates. MOE = margin of error The MOE is a measure of the estimate’s variability. The larger the MOE in relation to the size of the estimate, the less reliable the estimate. This number, when added to and subtracted from the estimate, forms the 95-percent confidence interval. MOEs for the Total row are for the 50 States and the District of Columbia. MOEs for a 95-percent confidence interval can be interpreted to mean there is a 95-percent chance that the true value—that is, the true coverage rate—falls within the estimated bounds determined by the MOE. For example, although the best estimate of New York’s coverage rate for infants was 78.2 percent in 2017, the true rate may have been higher or lower. The chances are 95 in 100 that the true coverage rate was within 7.4 percentage points higher or 7.4 percentage points lower than 78.2 percent, or between 70.8 percent and 85.6 percent. Sources: IPUMS-USA, n.d.; NBER, n.d.a, n.d.b; Thorn et al., 2018; unpublished internal WIC administrative data
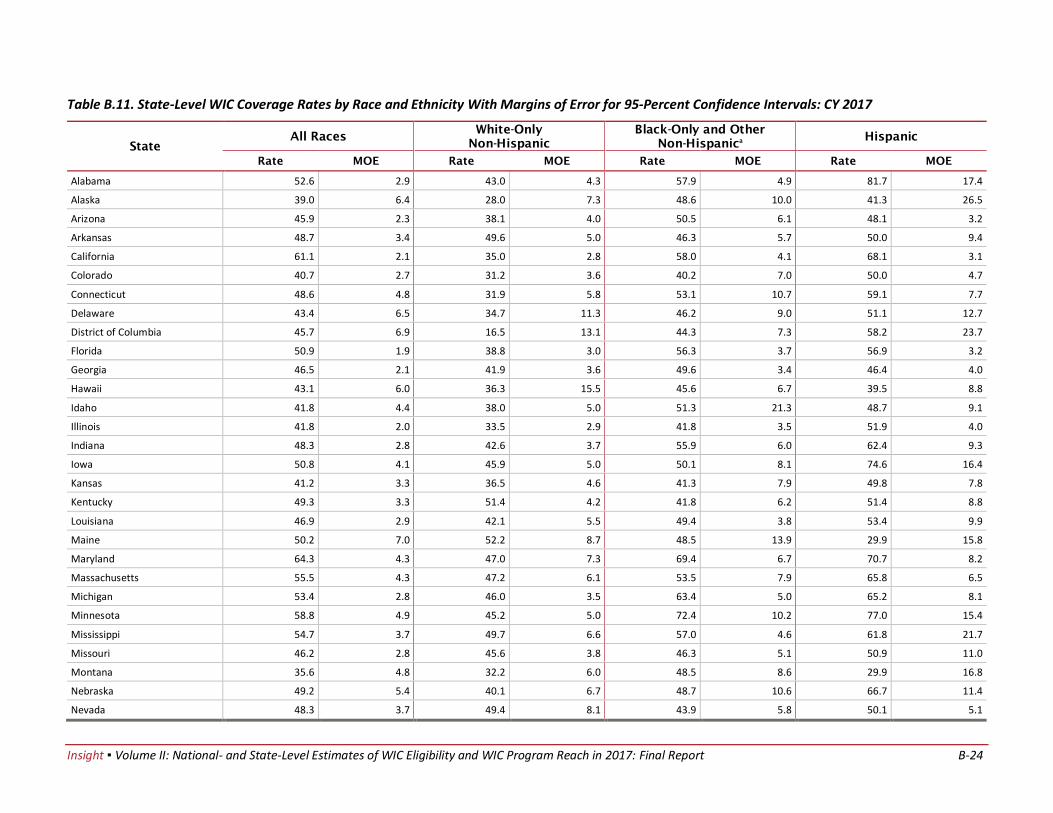
Insight ▪ Volume II: National- and State-Level Estimates of WIC Eligibility and WIC Program Reach in 2017: Final Report B-24
Table B.11. State-Level WIC Coverage Rates by Race and Ethnicity With Margins of Error for 95-Percent Confidence Intervals: CY 2017
State
All RacesWhite-Only
Non-Hispanic
Black-Only and Other
Non-Hispanica
Hispanic
Rate MOE Rate MOE Rate MOE Rate MOE
Alabama 52.6 2.9 43.0 4.3 57.9 4.9 81.7 17.4
Alaska 39.0 6.4 28.0 7.3 48.6 10.0 41.3 26.5
Arizona 45.9 2.3 38.1 4.0 50.5 6.1 48.1 3.2
Arkansas 48.7 3.4 49.6 5.0 46.3 5.7 50.0 9.4
California 61.1 2.1 35.0 2.8 58.0 4.1 68.1 3.1
Colorado 40.7 2.7 31.2 3.6 40.2 7.0 50.0 4.7
Connecticut 48.6 4.8 31.9 5.8 53.1 10.7 59.1 7.7
Delaware 43.4 6.5 34.7 11.3 46.2 9.0 51.1 12.7
District of Columbia 45.7 6.9 16.5 13.1 44.3 7.3 58.2 23.7
Florida 50.9 1.9 38.8 3.0 56.3 3.7 56.9 3.2
Georgia 46.5 2.1 41.9 3.6 49.6 3.4 46.4 4.0
Hawaii 43.1 6.0 36.3 15.5 45.6 6.7 39.5 8.8
Idaho 41.8 4.4 38.0 5.0 51.3 21.3 48.7 9.1
Illinois 41.8 2.0 33.5 2.9 41.8 3.5 51.9 4.0
Indiana 48.3 2.8 42.6 3.7 55.9 6.0 62.4 9.3
Iowa 50.8 4.1 45.9 5.0 50.1 8.1 74.6 16.4
Kansas 41.2 3.3 36.5 4.6 41.3 7.9 49.8 7.8
Kentucky 49.3 3.3 51.4 4.2 41.8 6.2 51.4 8.8
Louisiana 46.9 2.9 42.1 5.5 49.4 3.8 53.4 9.9
Maine 50.2 7.0 52.2 8.7 48.5 13.9 29.9 15.8
Maryland 64.3 4.3 47.0 7.3 69.4 6.7 70.7 8.2
Massachusetts 55.5 4.3 47.2 6.1 53.5 7.9 65.8 6.5
Michigan 53.4 2.8 46.0 3.5 63.4 5.0 65.2 8.1
Minnesota 58.8 4.9 45.2 5.0 72.4 10.2 77.0 15.4
Mississippi 54.7 3.7 49.7 6.6 57.0 4.6 61.8 21.7
Missouri 46.2 2.8 45.6 3.8 46.3 5.1 50.9 11.0
Montana 35.6 4.8 32.2 6.0 48.5 8.6 29.9 16.8
Nebraska 49.2 5.4 40.1 6.7 48.7 10.6 66.7 11.4
Nevada 48.3 3.7 49.4 8.1 43.9 5.8 50.1 5.1
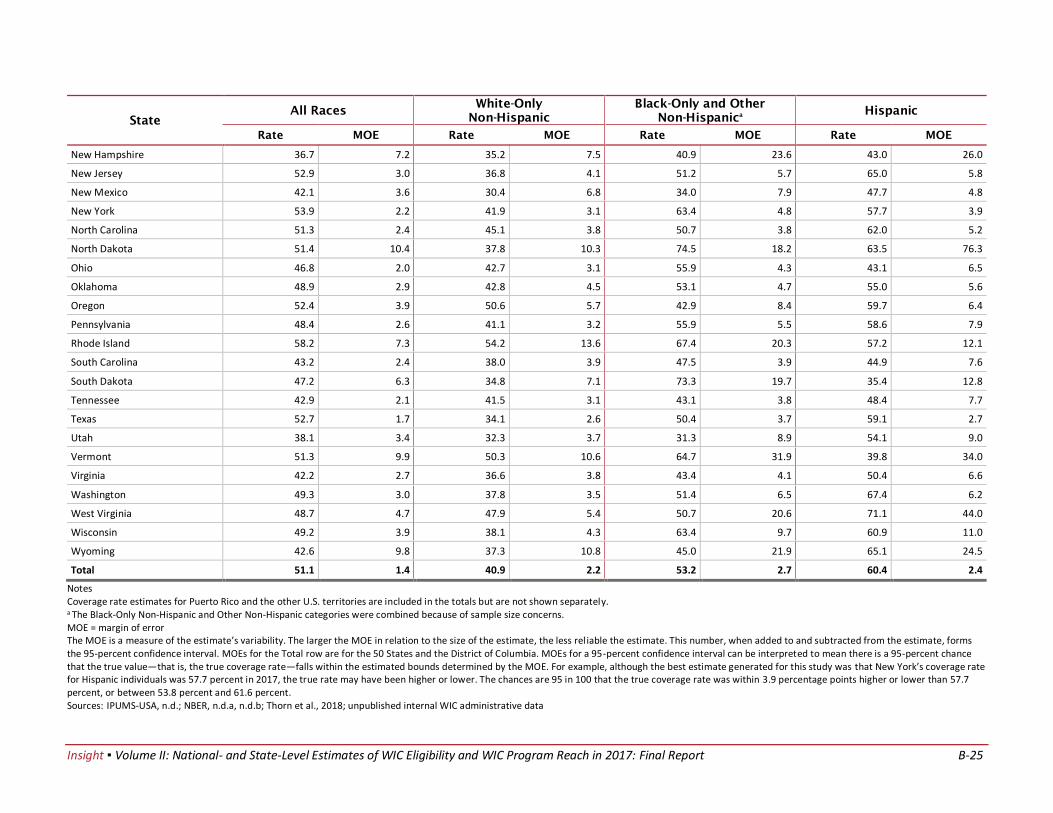
Insight ▪ Volume II: National- and State-Level Estimates of WIC Eligibility and WIC Program Reach in 2017: Final Report B-25
State
All RacesWhite-Only
Non-Hispanic
Black-Only and Other
Non-Hispanica
Hispanic
Rate MOE Rate MOE Rate MOE Rate MOE
New Hampshire 36.7 7.2 35.2 7.5 40.9 23.6 43.0 26.0
New Jersey 52.9 3.0 36.8 4.1 51.2 5.7 65.0 5.8
New Mexico 42.1 3.6 30.4 6.8 34.0 7.9 47.7 4.8
New York 53.9 2.2 41.9 3.1 63.4 4.8 57.7 3.9
North Carolina 51.3 2.4 45.1 3.8 50.7 3.8 62.0 5.2
North Dakota 51.4 10.4 37.8 10.3 74.5 18.2 63.5 76.3
Ohio 46.8 2.0 42.7 3.1 55.9 4.3 43.1 6.5
Oklahoma 48.9 2.9 42.8 4.5 53.1 4.7 55.0 5.6
Oregon 52.4 3.9 50.6 5.7 42.9 8.4 59.7 6.4
Pennsylvania 48.4 2.6 41.1 3.2 55.9 5.5 58.6 7.9
Rhode Island 58.2 7.3 54.2 13.6 67.4 20.3 57.2 12.1
South Carolina 43.2 2.4 38.0 3.9 47.5 3.9 44.9 7.6
South Dakota 47.2 6.3 34.8 7.1 73.3 19.7 35.4 12.8
Tennessee 42.9 2.1 41.5 3.1 43.1 3.8 48.4 7.7
Texas 52.7 1.7 34.1 2.6 50.4 3.7 59.1 2.7
Utah 38.1 3.4 32.3 3.7 31.3 8.9 54.1 9.0
Vermont 51.3 9.9 50.3 10.6 64.7 31.9 39.8 34.0
Virginia 42.2 2.7 36.6 3.8 43.4 4.1 50.4 6.6
Washington 49.3 3.0 37.8 3.5 51.4 6.5 67.4 6.2
West Virginia 48.7 4.7 47.9 5.4 50.7 20.6 71.1 44.0
Wisconsin 49.2 3.9 38.1 4.3 63.4 9.7 60.9 11.0
Wyoming 42.6 9.8 37.3 10.8 45.0 21.9 65.1 24.5
Total 51.1 1.4 40.9 2.2 53.2 2.7 60.4 2.4
Notes Coverage rate estimates for Puerto Rico and the other U.S. territories are included in the totals but are not shown separately. a The Black-Only Non-Hispanic and Other Non-Hispanic categories were combined because of sample size concerns. MOE = margin of error The MOE is a measure of the estimate’s variability. The larger the MOE in relation to the size of the estimate, the less rel iable the estimate. This number, when added to and subtracted from the estimate, forms the 95-percent confidence interval. MOEs for the Total row are for the 50 States and the District of Columbia. MOEs for a 95-percent confidence interval can be interpreted to mean there is a 95-percent chance that the true value—that is, the true coverage rate—falls within the estimated bounds determined by the MOE. For example, although the best estimate generated for this study was that New York’s coverage rate for Hispanic individuals was 57.7 percent in 2017, the true rate may have been higher or lower. The chances are 95 in 100 that the true coverage rate was within 3.9 percentage points higher or lower than 57.7 percent, or between 53.8 percent and 61.6 percent. Sources: IPUMS-USA, n.d.; NBER, n.d.a, n.d.b; Thorn et al., 2018; unpublished internal WIC administrative data
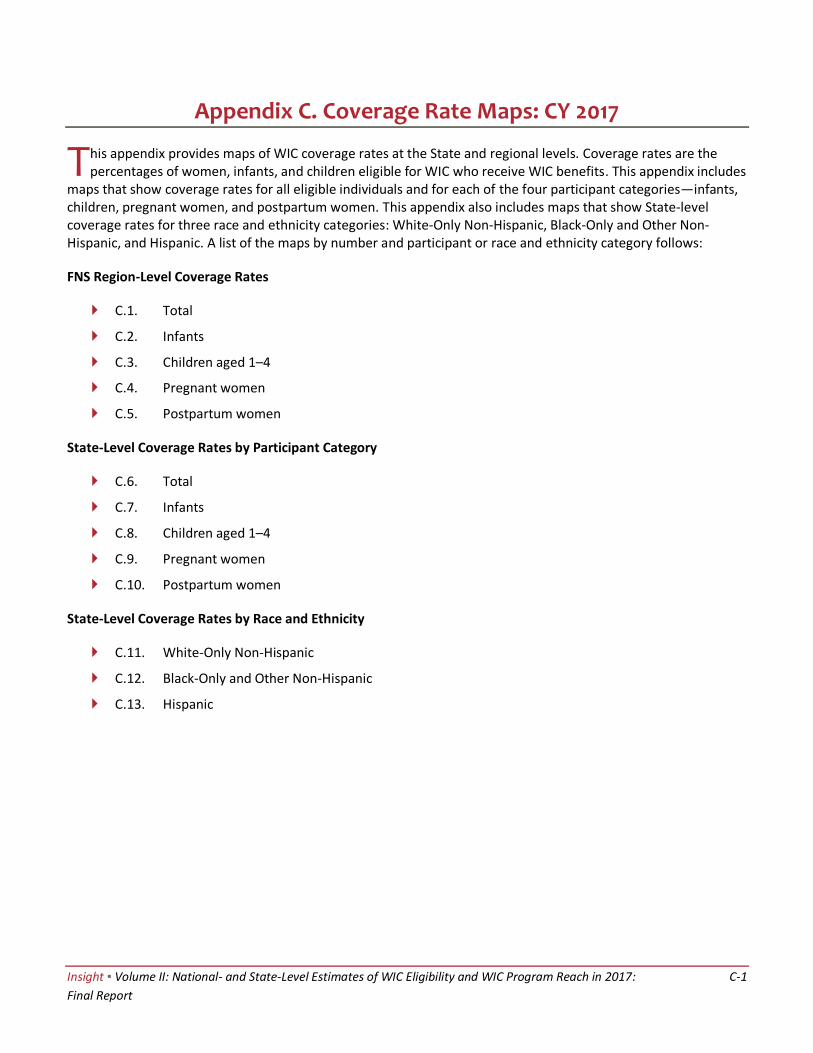
Insight ▪ Volume II: National- and State-Level Estimates of WIC Eligibility and WIC Program Reach in 2017: C-1
Final Report
Appendix C. Coverage Rate Maps: CY 2017
FNS Region-Level Coverage Rates
C.1. Total
C.2. Infants
C.3. Children aged 1–4
C.4. Pregnant women
C.5. Postpartum women
State-Level Coverage Rates by Participant Category
C.6. Total
C.7. Infants
C.8. Children aged 1–4
C.9. Pregnant women
C.10. Postpartum women
State-Level Coverage Rates by Race and Ethnicity
C.11. White-Only Non-Hispanic
C.12. Black-Only and Other Non-Hispanic
C.13. Hispanic
Th is appendix provides maps of WIC coverage rates at the State and regional levels. Coverage rates are the percentages of women, infants, and children eligible for WIC who receive WIC benefits. This appendix includes
maps that show coverage rates for all eligible individuals and for each of the four participant categories—infants, children, pregnant women, and postpartum women. This appendix also includes maps that show State-level coverage rates for three race and ethnicity categories: White-Only Non-Hispanic, Black-Only and Other Non-Hispanic, and Hispanic. A list of the maps by number and participant or race and ethnicity category follows:
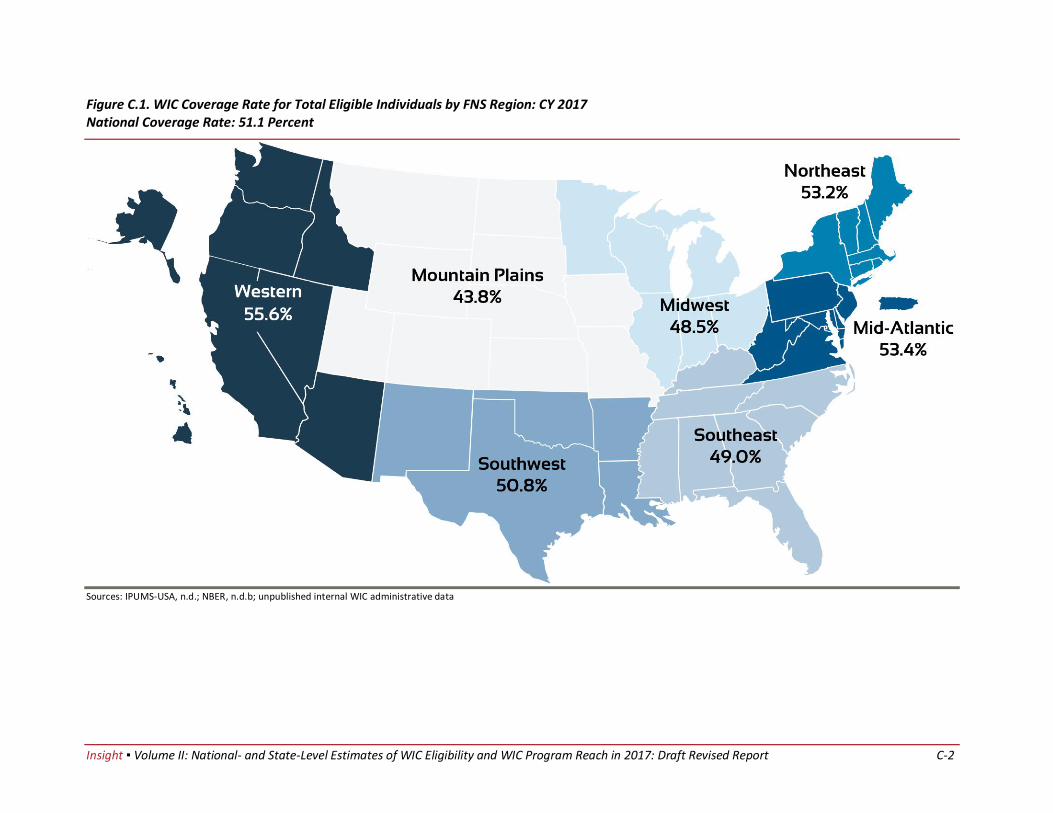
Insight ▪ Volume II: National- and State-Level Estimates of WIC Eligibility and WIC Program Reach in 2017: Draft Revised Report C-2
Figure C.1. WIC Coverage Rate for Total Eligible Individuals by FNS Region: CY 2017 National Coverage Rate: 51.1 Percent
Sources: IPUMS-USA, n.d.; NBER, n.d.b; unpublished internal WIC administrative data
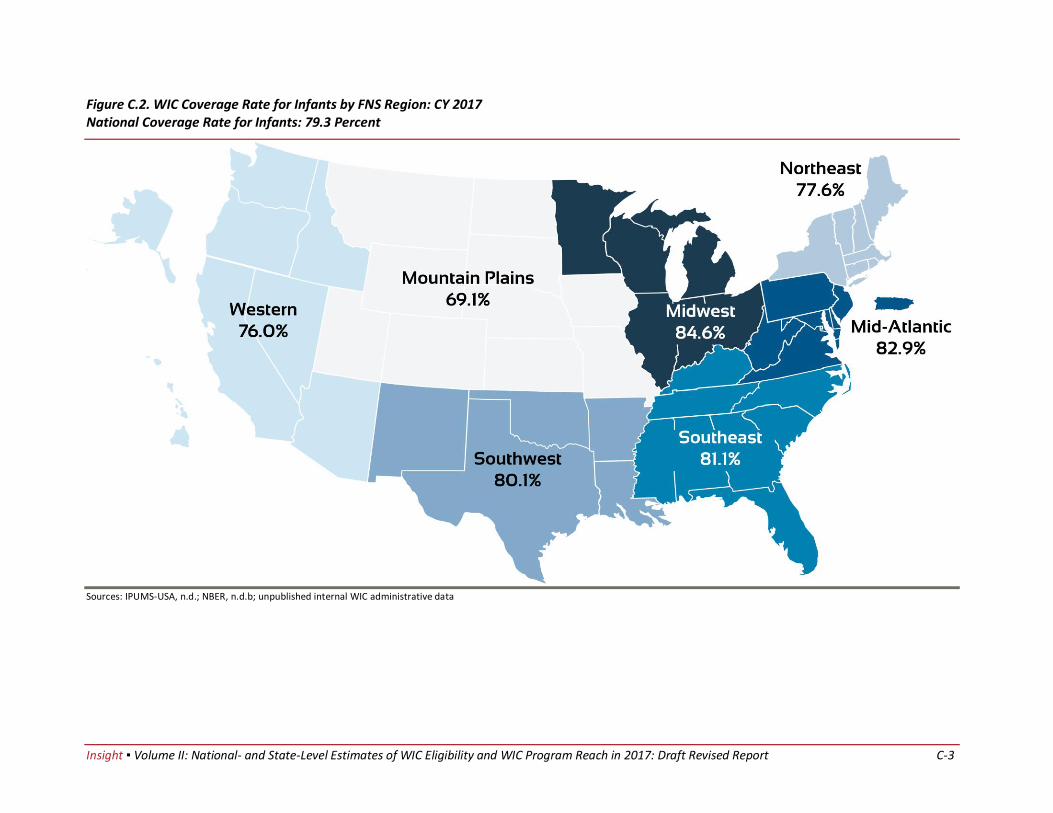
Insight ▪ Volume II: National- and State-Level Estimates of WIC Eligibility and WIC Program Reach in 2017: Draft Revised Report C-3
Figure C.2. WIC Coverage Rate for Infants by FNS Region: CY 2017 National Coverage Rate for Infants: 79.3 Percent
Sources: IPUMS-USA, n.d.; NBER, n.d.b; unpublished internal WIC administrative data
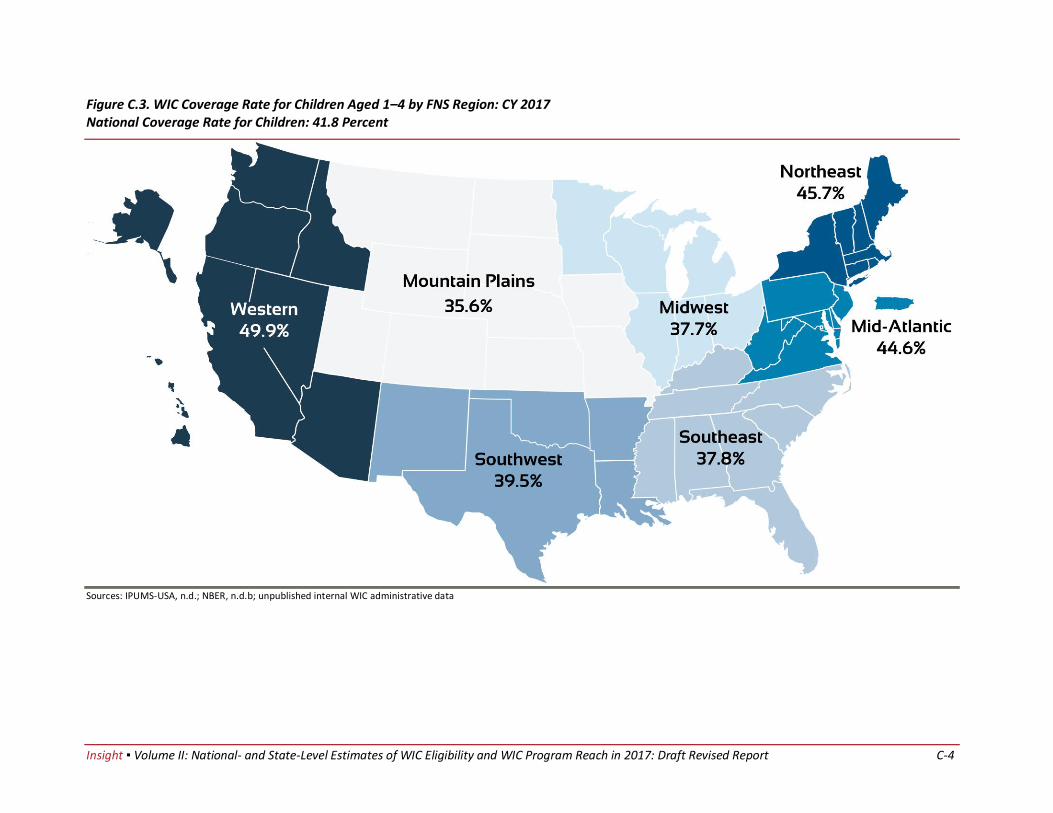
Insight ▪ Volume II: National- and State-Level Estimates of WIC Eligibility and WIC Program Reach in 2017: Draft Revised Report C-4
Figure C.3. WIC Coverage Rate for Children Aged 1–4 by FNS Region: CY 2017 National Coverage Rate for Children: 41.8 Percent
Sources: IPUMS-USA, n.d.; NBER, n.d.b; unpublished internal WIC administrative data
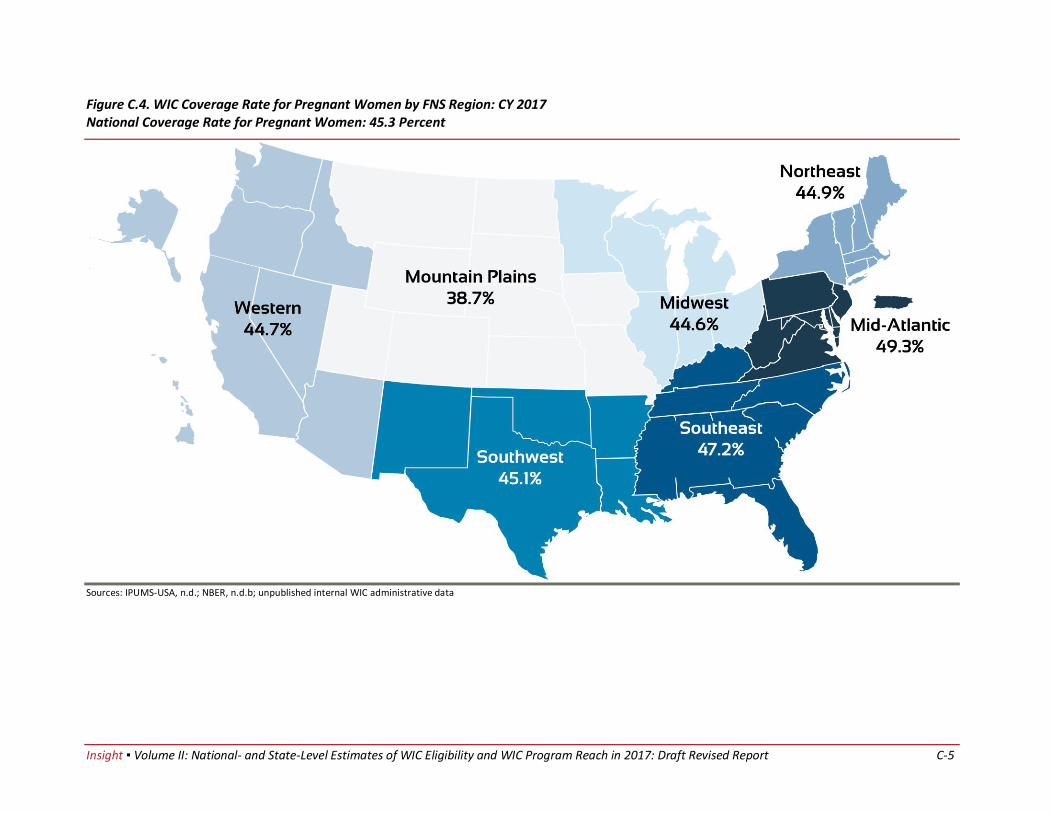
Insight ▪ Volume II: National- and State-Level Estimates of WIC Eligibility and WIC Program Reach in 2017: Draft Revised Report C-5
Figure C.4. WIC Coverage Rate for Pregnant Women by FNS Region: CY 2017 National Coverage Rate for Pregnant Women: 45.3 Percent
Sources: IPUMS-USA, n.d.; NBER, n.d.b; unpublished internal WIC administrative data
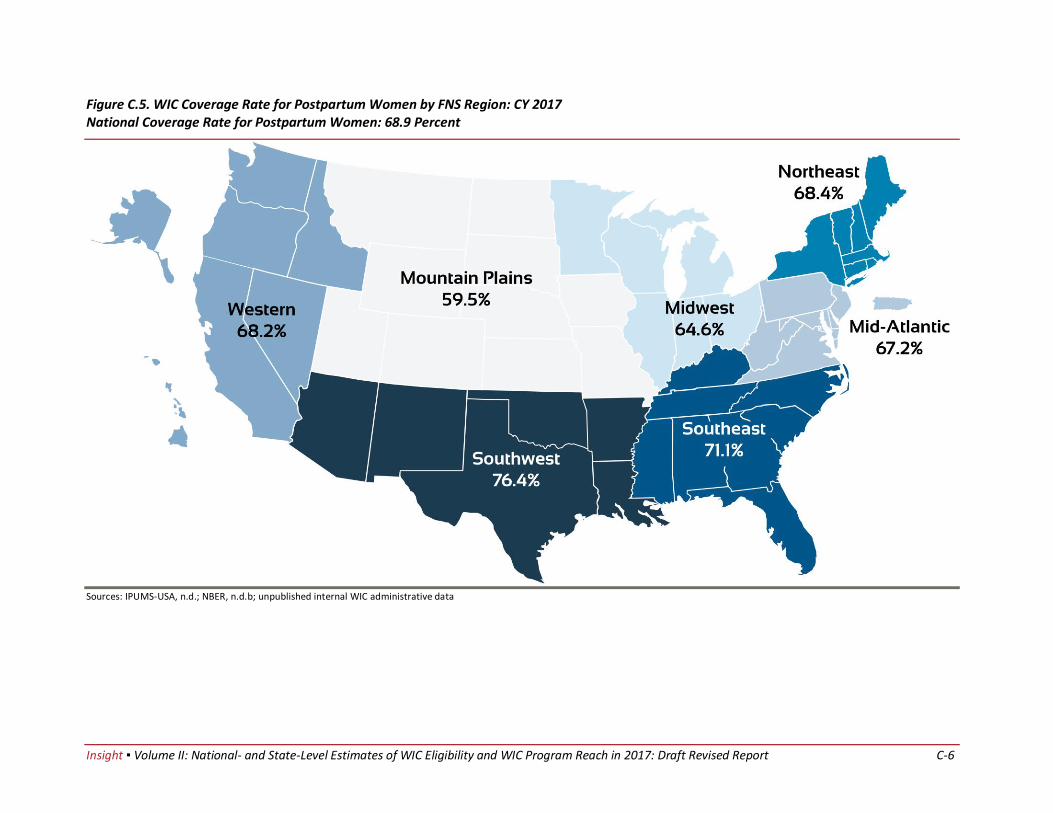
Insight ▪ Volume II: National- and State-Level Estimates of WIC Eligibility and WIC Program Reach in 2017: Draft Revised Report C-6
Figure C.5. WIC Coverage Rate for Postpartum Women by FNS Region: CY 2017 National Coverage Rate for Postpartum Women: 68.9 Percent
Sources: IPUMS-USA, n.d.; NBER, n.d.b; unpublished internal WIC administrative data
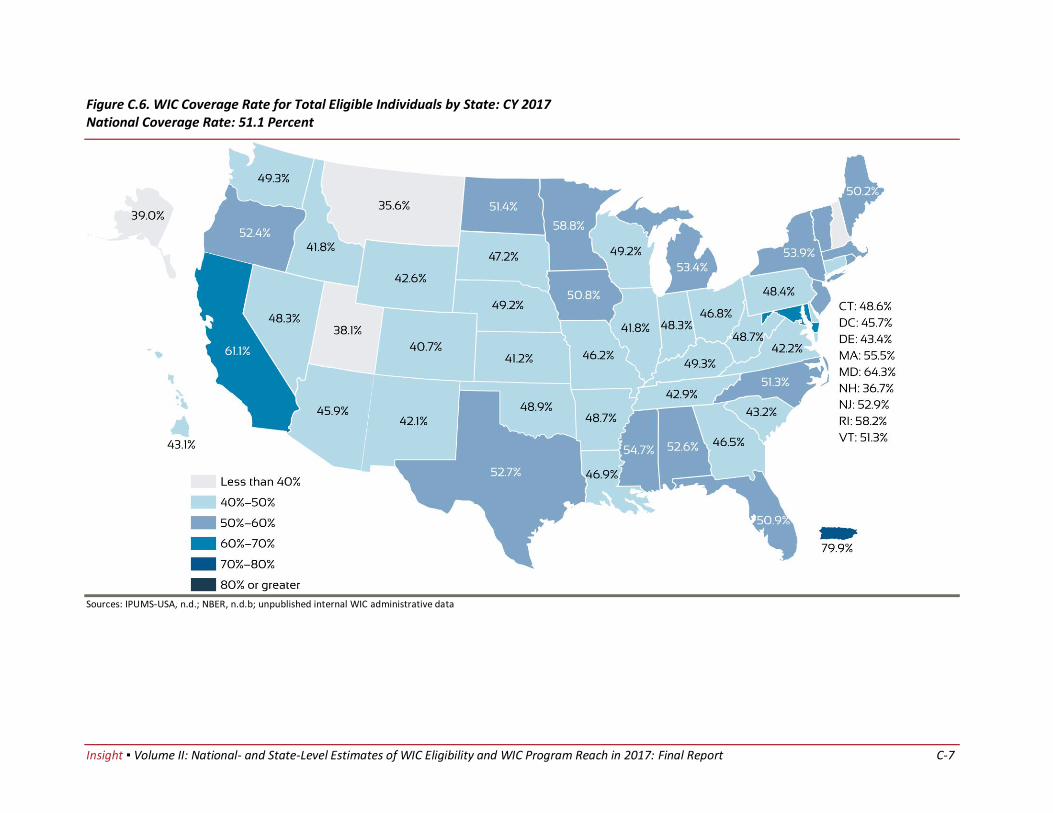
Insight ▪ Volume II: National- and State-Level Estimates of WIC Eligibility and WIC Program Reach in 2017: Final Report C-7
Figure C.6. WIC Coverage Rate for Total Eligible Individuals by State: CY 2017 National Coverage Rate: 51.1 Percent
Sources: IPUMS-USA, n.d.; NBER, n.d.b; unpublished internal WIC administrative data

Insight ▪ Volume II: National- and State-Level Estimates of WIC Eligibility and WIC Program Reach in 2017: Final Report C-8
Figure C.7. WIC Coverage Rate for Infants by State: CY 2017 National Coverage Rate for Infants: 79.3 Percent
Note The estimated coverage rates exceeded 100 percent for infants in Maryland and Mississippi. This is likely a result of sampling variability in the CPS-ASEC survey data used to estimate the number of eligible individuals in those States (denominator of the rate). The lower-bound range of the 95-percent confidence interval surrounding these rates is below 100 percent. See chapter 6 in volume I for more information on measures of statistical uncertainty for the eligibility estimates. Sources: IPUMS-USA, n.d.; NBER, n.d.b; unpublished internal WIC administrative data
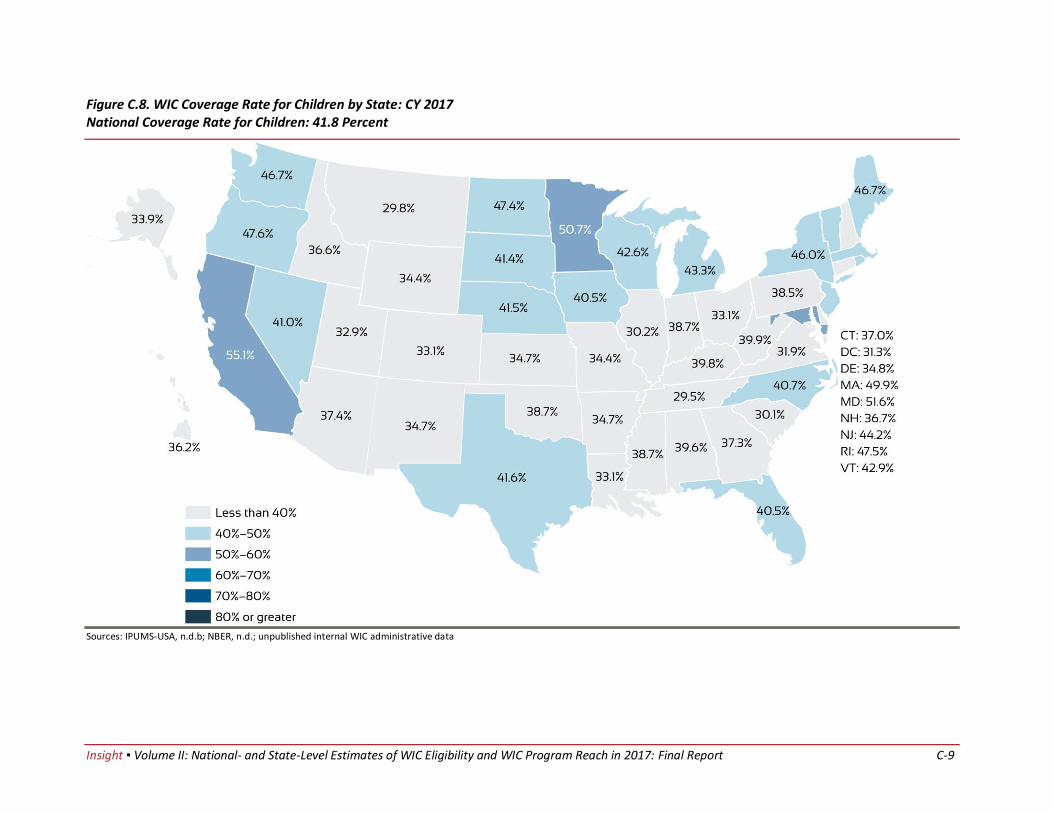
Insight ▪ Volume II: National- and State-Level Estimates of WIC Eligibility and WIC Program Reach in 2017: Final Report C-9
Figure C.8. WIC Coverage Rate for Children by State: CY 2017 National Coverage Rate for Children: 41.8 Percent
Sources: IPUMS-USA, n.d.b; NBER, n.d.; unpublished internal WIC administrative data

Insight ▪ Volume II: National- and State-Level Estimates of WIC Eligibility and WIC Program Reach in 2017: Final Report C-10
Figure C.9. WIC Coverage Rate for Pregnant Women by State: CY 2017 National Coverage Rate for Pregnant Women: 45.3 Percent
Sources: IPUMS-USA, n.d.; NBER, n.d.b; unpublished internal WIC administrative data
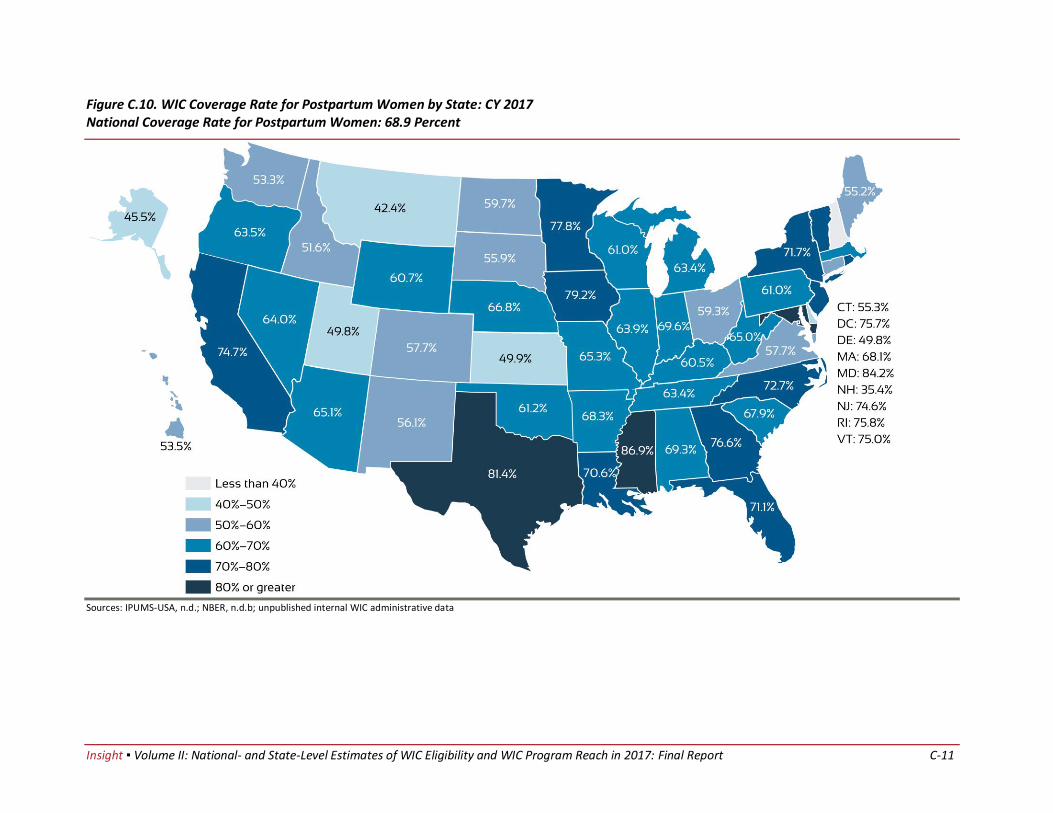
Insight ▪ Volume II: National- and State-Level Estimates of WIC Eligibility and WIC Program Reach in 2017: Final Report C-11
Figure C.10. WIC Coverage Rate for Postpartum Women by State: CY 2017 National Coverage Rate for Postpartum Women: 68.9 Percent
Sources: IPUMS-USA, n.d.; NBER, n.d.b; unpublished internal WIC administrative data
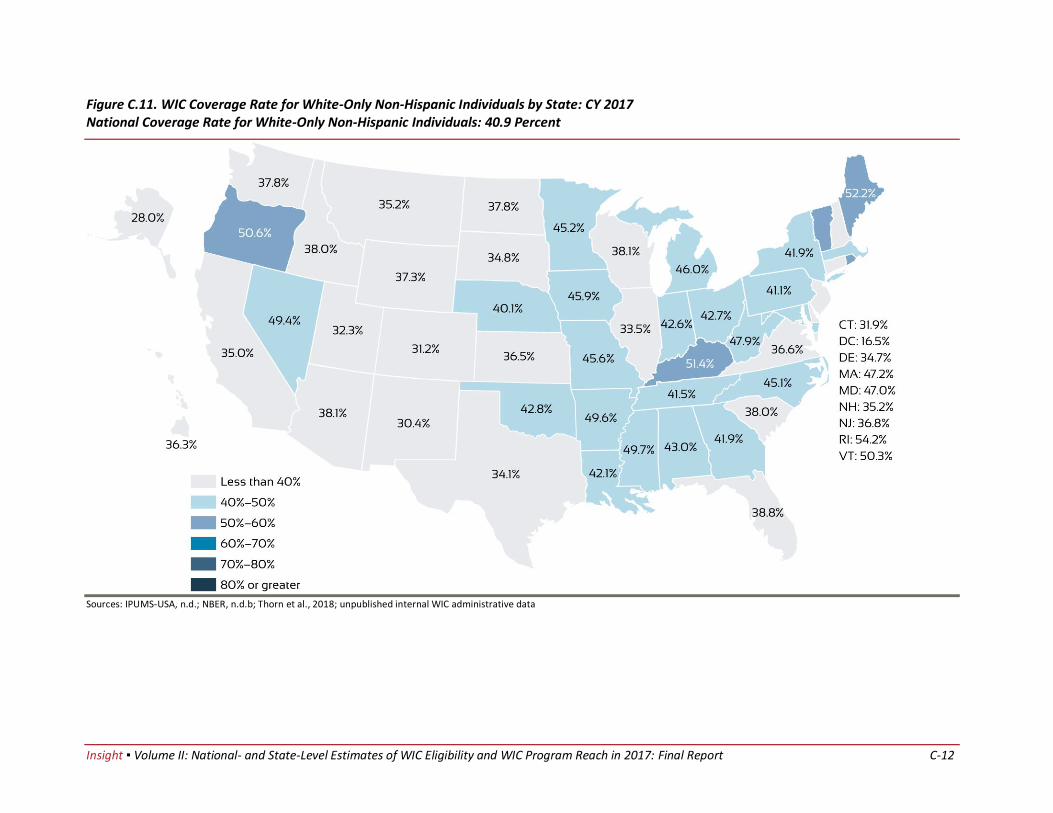
Insight ▪ Volume II: National- and State-Level Estimates of WIC Eligibility and WIC Program Reach in 2017: Final Report C-12
Figure C.11. WIC Coverage Rate for White-Only Non-Hispanic Individuals by State: CY 2017 National Coverage Rate for White-Only Non-Hispanic Individuals: 40.9 Percent
Sources: IPUMS-USA, n.d.; NBER, n.d.b; Thorn et al., 2018; unpublished internal WIC administrative data
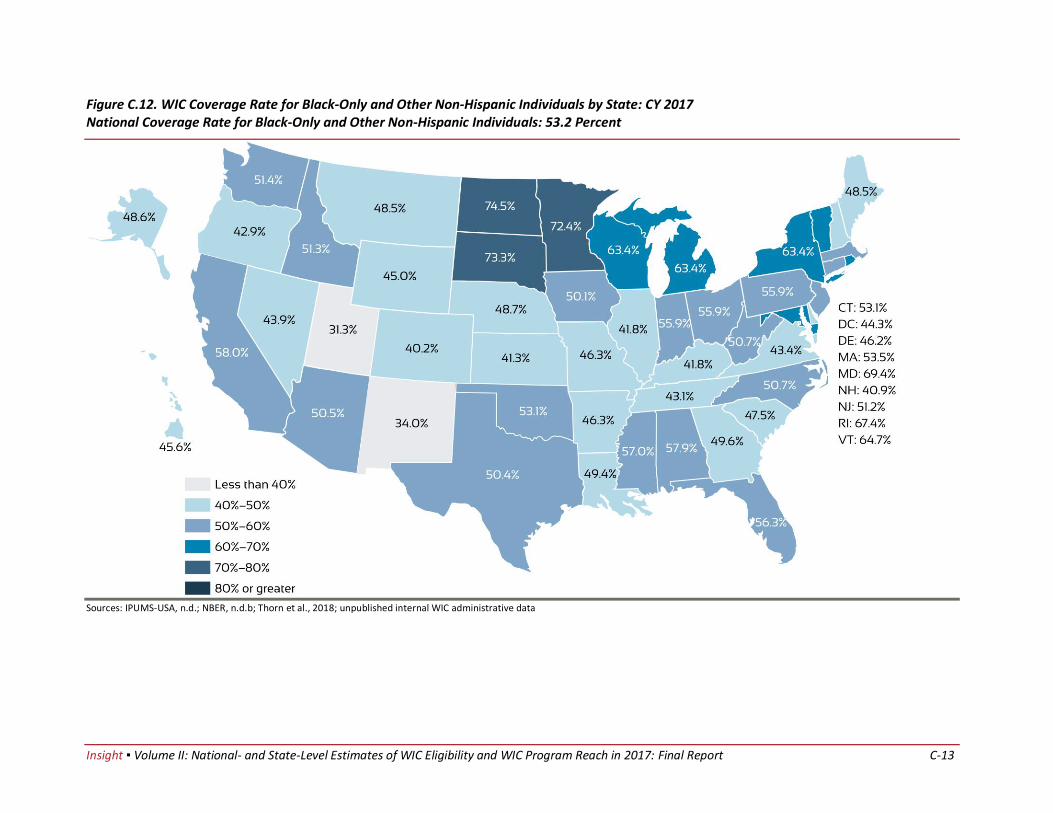
Insight ▪ Volume II: National- and State-Level Estimates of WIC Eligibility and WIC Program Reach in 2017: Final Report C-13
Figure C.12. WIC Coverage Rate for Black-Only and Other Non-Hispanic Individuals by State: CY 2017 National Coverage Rate for Black-Only and Other Non-Hispanic Individuals: 53.2 Percent
Sources: IPUMS-USA, n.d.; NBER, n.d.b; Thorn et al., 2018; unpublished internal WIC administrative data
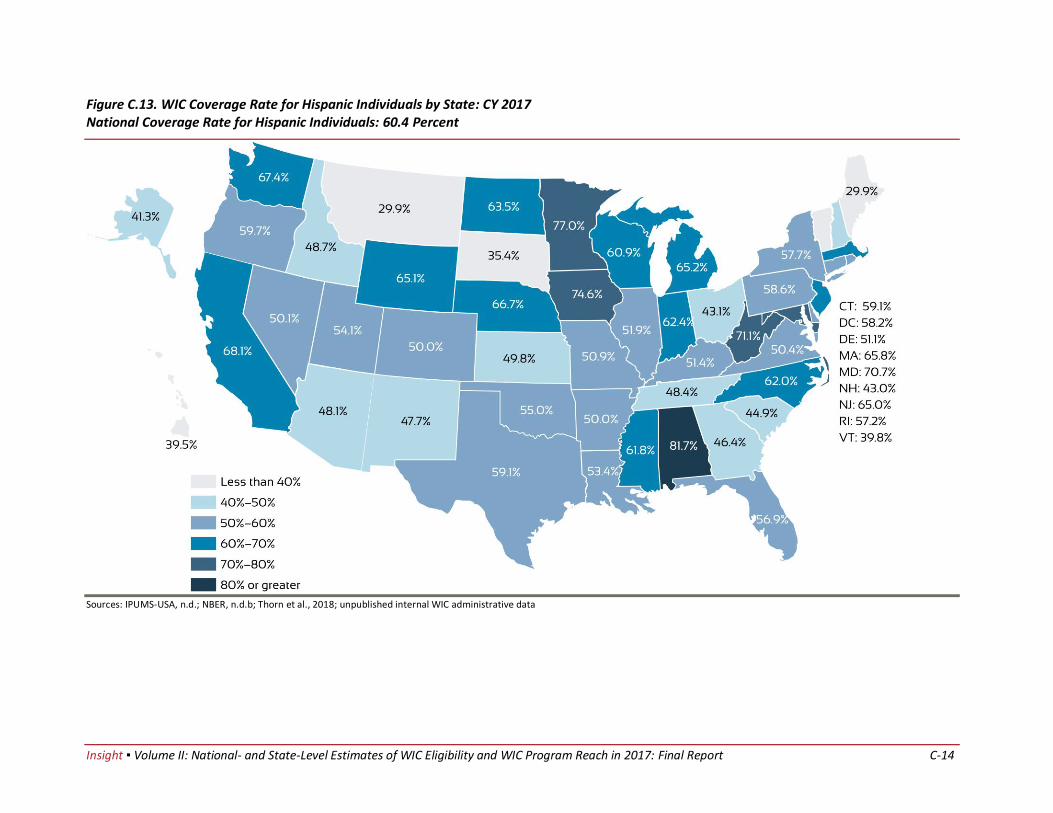
Insight ▪ Volume II: National- and State-Level Estimates of WIC Eligibility and WIC Program Reach in 2017: Final Report C-14
Figure C.13. WIC Coverage Rate for Hispanic Individuals by State: CY 2017 National Coverage Rate for Hispanic Individuals: 60.4 Percent
Sources: IPUMS-USA, n.d.; NBER, n.d.b; Thorn et al., 2018; unpublished internal WIC administrative data
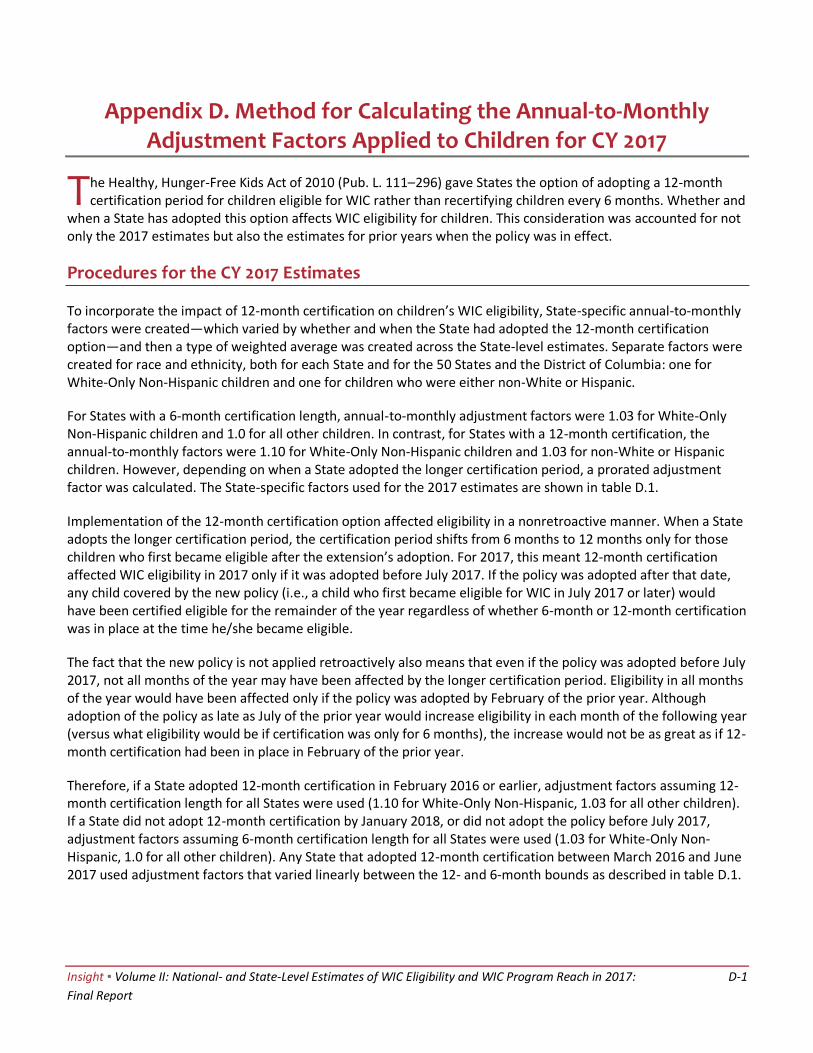
Insight ▪ Volume II: National- and State-Level Estimates of WIC Eligibility and WIC Program Reach in 2017: D-1
Final Report
Appendix D. Method for Calculating the Annual-to-Monthly Adjustment Factors Applied to Children for CY 2017
Procedures for the CY 2017 Estimates
To incorporate the impact of 12-month certification on children’s WIC eligibility, State-specific annual-to-monthly factors were created—which varied by whether and when the State had adopted the 12-month certification option—and then a type of weighted average was created across the State-level estimates. Separate factors were created for race and ethnicity, both for each State and for the 50 States and the District of Columbia: one for White-Only Non-Hispanic children and one for children who were either non-White or Hispanic.
For States with a 6-month certification length, annual-to-monthly adjustment factors were 1.03 for White-Only Non-Hispanic children and 1.0 for all other children. In contrast, for States with a 12-month certification, the annual-to-monthly factors were 1.10 for White-Only Non-Hispanic children and 1.03 for non-White or Hispanic children. However, depending on when a State adopted the longer certification period, a prorated adjustment factor was calculated. The State-specific factors used for the 2017 estimates are shown in table D.1.
Implementation of the 12-month certification option affected eligibility in a nonretroactive manner. When a State adopts the longer certification period, the certification period shifts from 6 months to 12 months only for those children who first became eligible after the extension’s adoption. For 2017, this meant 12-month certification affected WIC eligibility in 2017 only if it was adopted before July 2017. If the policy was adopted after that date, any child covered by the new policy (i.e., a child who first became eligible for WIC in July 2017 or later) would have been certified eligible for the remainder of the year regardless of whether 6-month or 12-month certification was in place at the time he/she became eligible.
The fact that the new policy is not applied retroactively also means that even if the policy was adopted before July 2017, not all months of the year may have been affected by the longer certification period. Eligibility in all months of the year would have been affected only if the policy was adopted by February of the prior year. Although adoption of the policy as late as July of the prior year would increase eligibility in each month of the following year (versus what eligibility would be if certification was only for 6 months), the increase would not be as great as if 12-month certification had been in place in February of the prior year.
Therefore, if a State adopted 12-month certification in February 2016 or earlier, adjustment factors assuming 12-month certification length for all States were used (1.10 for White-Only Non-Hispanic, 1.03 for all other children). If a State did not adopt 12-month certification by January 2018, or did not adopt the policy before July 2017, adjustment factors assuming 6-month certification length for all States were used (1.03 for White-Only Non-Hispanic, 1.0 for all other children). Any State that adopted 12-month certification between March 2016 and June 2017 used adjustment factors that varied linearly between the 12- and 6-month bounds as described in table D.1.
T he Healthy, Hunger-Free Kids Act of 2010 (Pub. L. 111–296) gave States the option of adopting a 12-month certification period for children eligible for WIC rather than recertifying children every 6 months. Whether and
when a State has adopted this option affects WIC eligibility for children. This consideration was accounted for not only the 2017 estimates but also the estimates for prior years when the policy was in effect.
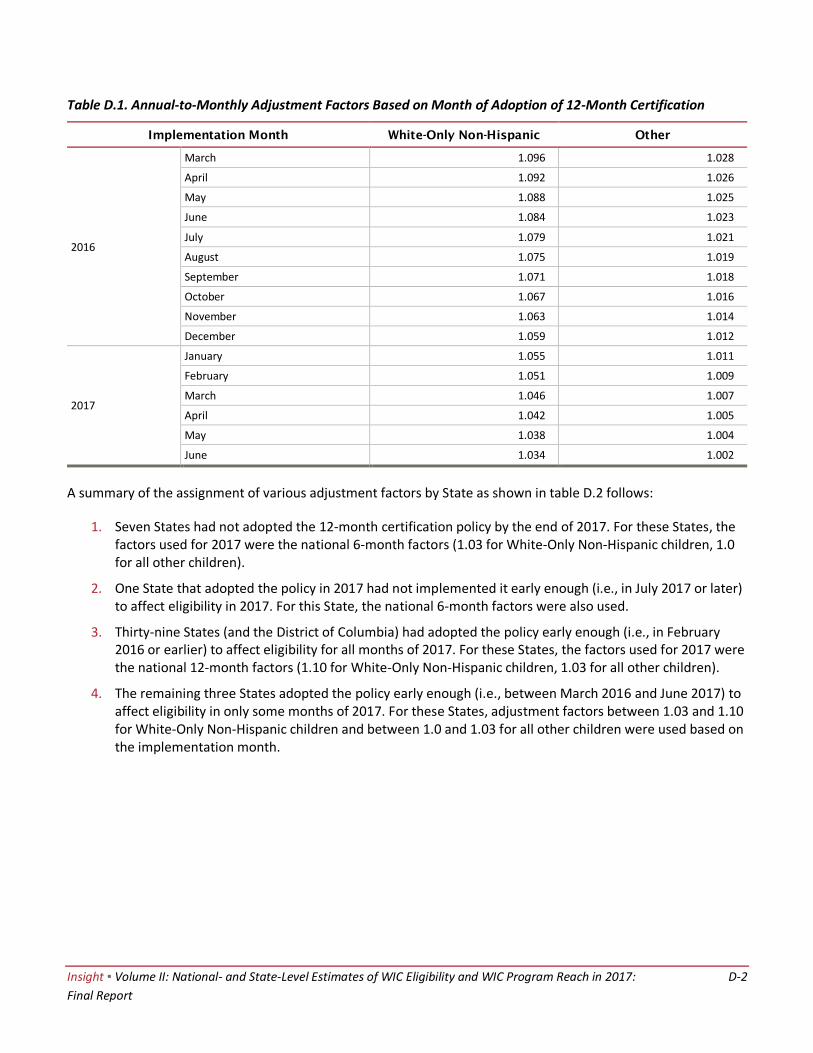
Insight ▪ Volume II: National- and State-Level Estimates of WIC Eligibility and WIC Program Reach in 2017: D-2
Final Report
Table D.1. Annual-to-Monthly Adjustment Factors Based on Month of Adoption of 12-Month Certification
Implementation Month White-Only Non-Hispanic Other
2016
March 1.096 1.028
April 1.092 1.026
May 1.088 1.025
June 1.084 1.023
July 1.079 1.021
August 1.075 1.019
September 1.071 1.018
October 1.067 1.016
November 1.063 1.014
December 1.059 1.012
2017
January 1.055 1.011
February 1.051 1.009
March 1.046 1.007
April 1.042 1.005
May 1.038 1.004
June 1.034 1.002
A summary of the assignment of various adjustment factors by State as shown in table D.2 follows:
1. Seven States had not adopted the 12-month certification policy by the end of 2017. For these States, the factors used for 2017 were the national 6-month factors (1.03 for White-Only Non-Hispanic children, 1.0 for all other children).
2. One State that adopted the policy in 2017 had not implemented it early enough (i.e., in July 2017 or later) to affect eligibility in 2017. For this State, the national 6-month factors were also used.
3. Thirty-nine States (and the District of Columbia) had adopted the policy early enough (i.e., in February 2016 or earlier) to affect eligibility for all months of 2017. For these States, the factors used for 2017 were the national 12-month factors (1.10 for White-Only Non-Hispanic children, 1.03 for all other children).
4. The remaining three States adopted the policy early enough (i.e., between March 2016 and June 2017) to affect eligibility in only some months of 2017. For these States, adjustment factors between 1.03 and 1.10 for White-Only Non-Hispanic children and between 1.0 and 1.03 for all other children were used based on the implementation month.
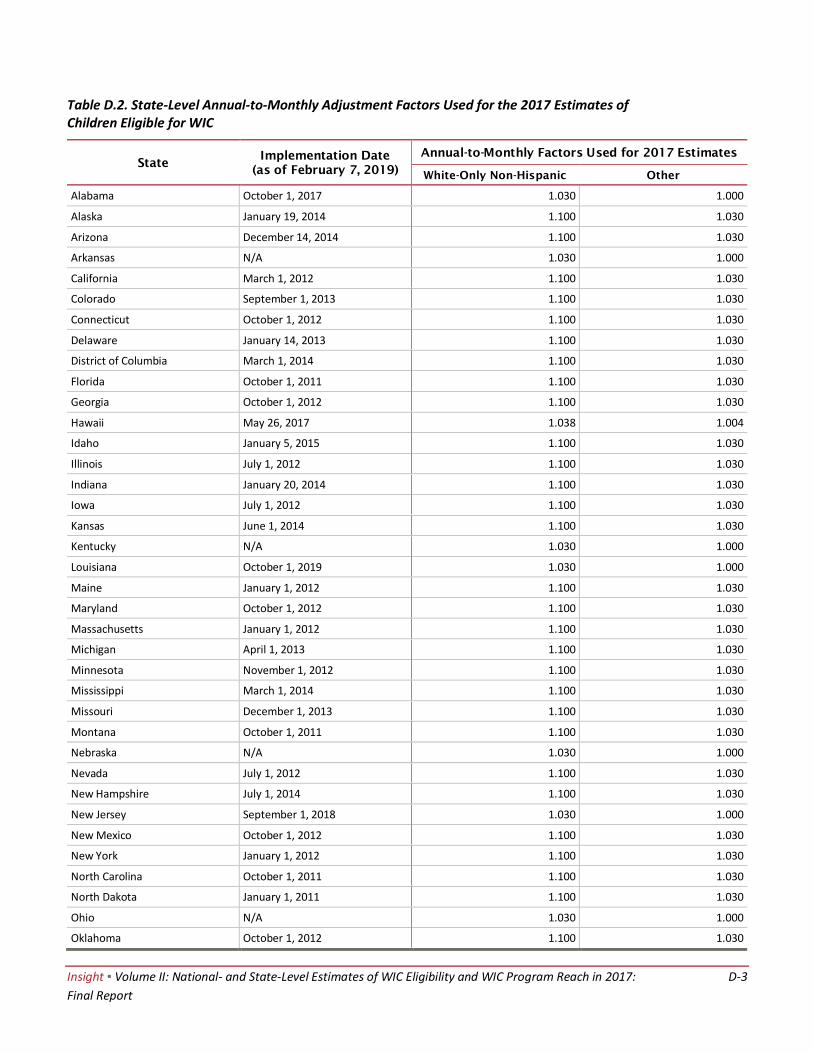
Insight ▪ Volume II: National- and State-Level Estimates of WIC Eligibility and WIC Program Reach in 2017: D-3
Final Report
Table D.2. State-Level Annual-to-Monthly Adjustment Factors Used for the 2017 Estimates of Children Eligible for WIC
State Implementation Date
(as of February 7, 2019)
Annual-to-Monthly Factors Used for 2017 Estimates
White-Only Non-Hispanic Other
Alabama October 1, 2017 1.030 1.000
Alaska January 19, 2014 1.100 1.030
Arizona December 14, 2014 1.100 1.030
Arkansas N/A 1.030 1.000
California March 1, 2012 1.100 1.030
Colorado September 1, 2013 1.100 1.030
Connecticut October 1, 2012 1.100 1.030
Delaware January 14, 2013 1.100 1.030
District of Columbia March 1, 2014 1.100 1.030
Florida October 1, 2011 1.100 1.030
Georgia October 1, 2012 1.100 1.030
Hawaii May 26, 2017 1.038 1.004
Idaho January 5, 2015 1.100 1.030
Illinois July 1, 2012 1.100 1.030
Indiana January 20, 2014 1.100 1.030
Iowa July 1, 2012 1.100 1.030
Kansas June 1, 2014 1.100 1.030
Kentucky N/A 1.030 1.000
Louisiana October 1, 2019 1.030 1.000
Maine January 1, 2012 1.100 1.030
Maryland October 1, 2012 1.100 1.030
Massachusetts January 1, 2012 1.100 1.030
Michigan April 1, 2013 1.100 1.030
Minnesota November 1, 2012 1.100 1.030
Mississippi March 1, 2014 1.100 1.030
Missouri December 1, 2013 1.100 1.030
Montana October 1, 2011 1.100 1.030
Nebraska N/A 1.030 1.000
Nevada July 1, 2012 1.100 1.030
New Hampshire July 1, 2014 1.100 1.030
New Jersey September 1, 2018 1.030 1.000
New Mexico October 1, 2012 1.100 1.030
New York January 1, 2012 1.100 1.030
North Carolina October 1, 2011 1.100 1.030
North Dakota January 1, 2011 1.100 1.030
Ohio N/A 1.030 1.000
Oklahoma October 1, 2012 1.100 1.030
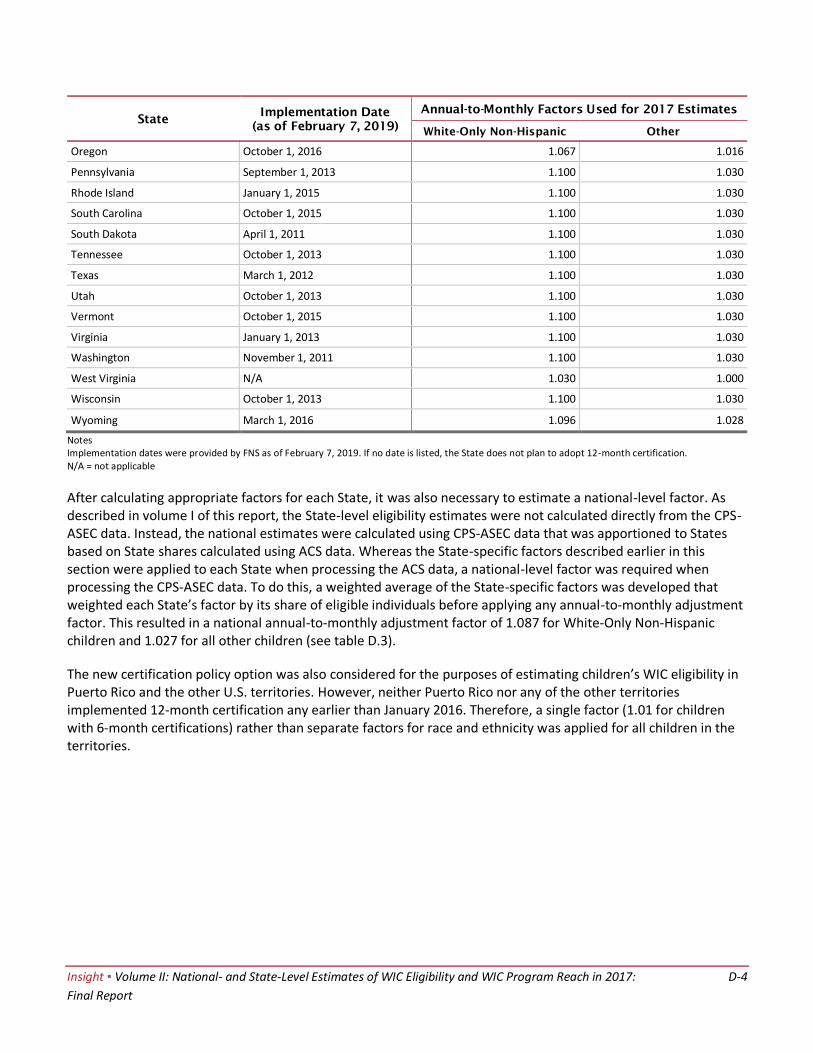
Insight ▪ Volume II: National- and State-Level Estimates of WIC Eligibility and WIC Program Reach in 2017: D-4
Final Report
State Implementation Date
(as of February 7, 2019)
Annual-to-Monthly Factors Used for 2017 Estimates
White-Only Non-Hispanic Other
Oregon October 1, 2016 1.067 1.016
Pennsylvania September 1, 2013 1.100 1.030
Rhode Island January 1, 2015 1.100 1.030
South Carolina October 1, 2015 1.100 1.030
South Dakota April 1, 2011 1.100 1.030
Tennessee October 1, 2013 1.100 1.030
Texas March 1, 2012 1.100 1.030
Utah October 1, 2013 1.100 1.030
Vermont October 1, 2015 1.100 1.030
Virginia January 1, 2013 1.100 1.030
Washington November 1, 2011 1.100 1.030
West Virginia N/A 1.030 1.000
Wisconsin October 1, 2013 1.100 1.030
Wyoming March 1, 2016 1.096 1.028
Notes Implementation dates were provided by FNS as of February 7, 2019. If no date is listed, the State does not plan to adopt 12-month certification. N/A = not applicable
After calculating appropriate factors for each State, it was also necessary to estimate a national-level factor. As described in volume I of this report, the State-level eligibility estimates were not calculated directly from the CPS-ASEC data. Instead, the national estimates were calculated using CPS-ASEC data that was apportioned to States based on State shares calculated using ACS data. Whereas the State-specific factors described earlier in this section were applied to each State when processing the ACS data, a national-level factor was required when processing the CPS-ASEC data. To do this, a weighted average of the State-specific factors was developed that weighted each State’s factor by its share of eligible individuals before applying any annual-to-monthly adjustment factor. This resulted in a national annual-to-monthly adjustment factor of 1.087 for White-Only Non-Hispanic children and 1.027 for all other children (see table D.3).
The new certification policy option was also considered for the purposes of estimating children’s WIC eligibility in Puerto Rico and the other U.S. territories. However, neither Puerto Rico nor any of the other territories implemented 12-month certification any earlier than January 2016. Therefore, a single factor (1.01 for children with 6-month certifications) rather than separate factors for race and ethnicity was applied for all children in the territories.
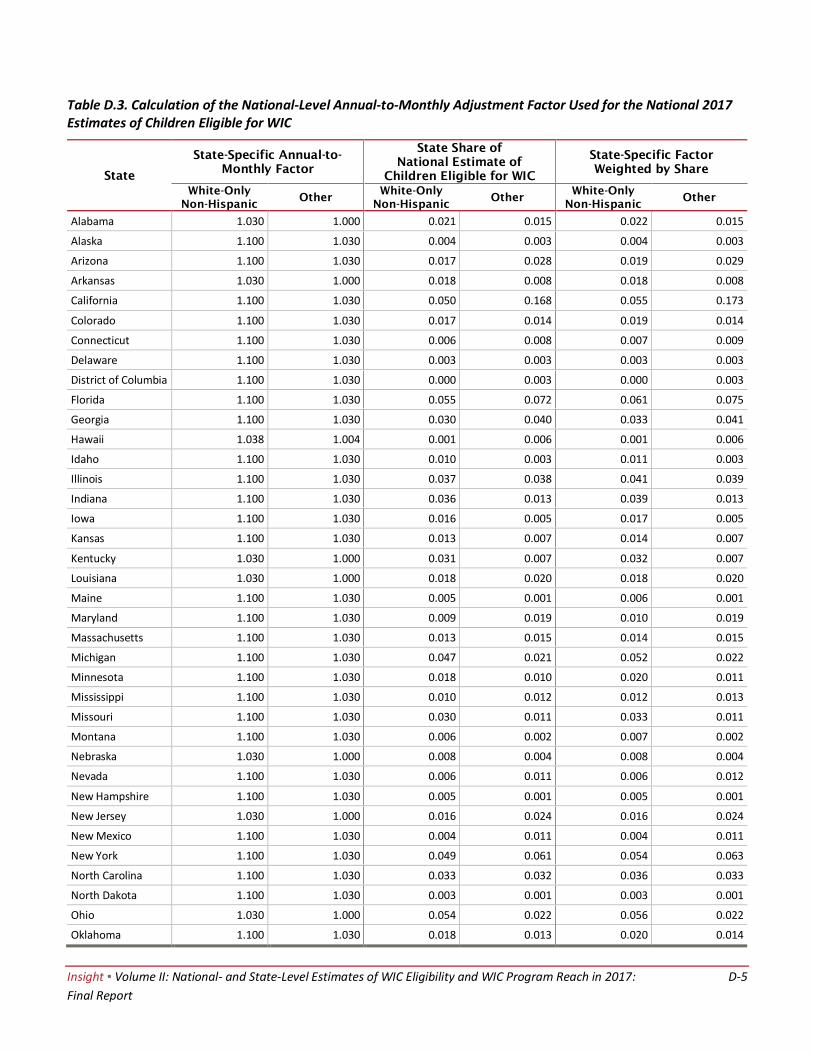
Insight ▪ Volume II: National- and State-Level Estimates of WIC Eligibility and WIC Program Reach in 2017: D-5
Final Report
Table D.3. Calculation of the National-Level Annual-to-Monthly Adjustment Factor Used for the National 2017 Estimates of Children Eligible for WIC
State
State-Specific Annual-to-
Monthly Factor
State Share of
National Estimate of
Children Eligible for WIC
State-Specific Factor
Weighted by Share
White-Only
Non-Hispanic Other
White-Only
Non-Hispanic Other
White-Only
Non-Hispanic Other
Alabama 1.030 1.000 0.021 0.015 0.022 0.015
Alaska 1.100 1.030 0.004 0.003 0.004 0.003
Arizona 1.100 1.030 0.017 0.028 0.019 0.029
Arkansas 1.030 1.000 0.018 0.008 0.018 0.008
California 1.100 1.030 0.050 0.168 0.055 0.173
Colorado 1.100 1.030 0.017 0.014 0.019 0.014
Connecticut 1.100 1.030 0.006 0.008 0.007 0.009
Delaware 1.100 1.030 0.003 0.003 0.003 0.003
District of Columbia 1.100 1.030 0.000 0.003 0.000 0.003
Florida 1.100 1.030 0.055 0.072 0.061 0.075
Georgia 1.100 1.030 0.030 0.040 0.033 0.041
Hawaii 1.038 1.004 0.001 0.006 0.001 0.006
Idaho 1.100 1.030 0.010 0.003 0.011 0.003
Illinois 1.100 1.030 0.037 0.038 0.041 0.039
Indiana 1.100 1.030 0.036 0.013 0.039 0.013
Iowa 1.100 1.030 0.016 0.005 0.017 0.005
Kansas 1.100 1.030 0.013 0.007 0.014 0.007
Kentucky 1.030 1.000 0.031 0.007 0.032 0.007
Louisiana 1.030 1.000 0.018 0.020 0.018 0.020
Maine 1.100 1.030 0.005 0.001 0.006 0.001
Maryland 1.100 1.030 0.009 0.019 0.010 0.019
Massachusetts 1.100 1.030 0.013 0.015 0.014 0.015
Michigan 1.100 1.030 0.047 0.021 0.052 0.022
Minnesota 1.100 1.030 0.018 0.010 0.020 0.011
Mississippi 1.100 1.030 0.010 0.012 0.012 0.013
Missouri 1.100 1.030 0.030 0.011 0.033 0.011
Montana 1.100 1.030 0.006 0.002 0.007 0.002
Nebraska 1.030 1.000 0.008 0.004 0.008 0.004
Nevada 1.100 1.030 0.006 0.011 0.006 0.012
New Hampshire 1.100 1.030 0.005 0.001 0.005 0.001
New Jersey 1.030 1.000 0.016 0.024 0.016 0.024
New Mexico 1.100 1.030 0.004 0.011 0.004 0.011
New York 1.100 1.030 0.049 0.061 0.054 0.063
North Carolina 1.100 1.030 0.033 0.032 0.036 0.033
North Dakota 1.100 1.030 0.003 0.001 0.003 0.001
Ohio 1.030 1.000 0.054 0.022 0.056 0.022
Oklahoma 1.100 1.030 0.018 0.013 0.020 0.014
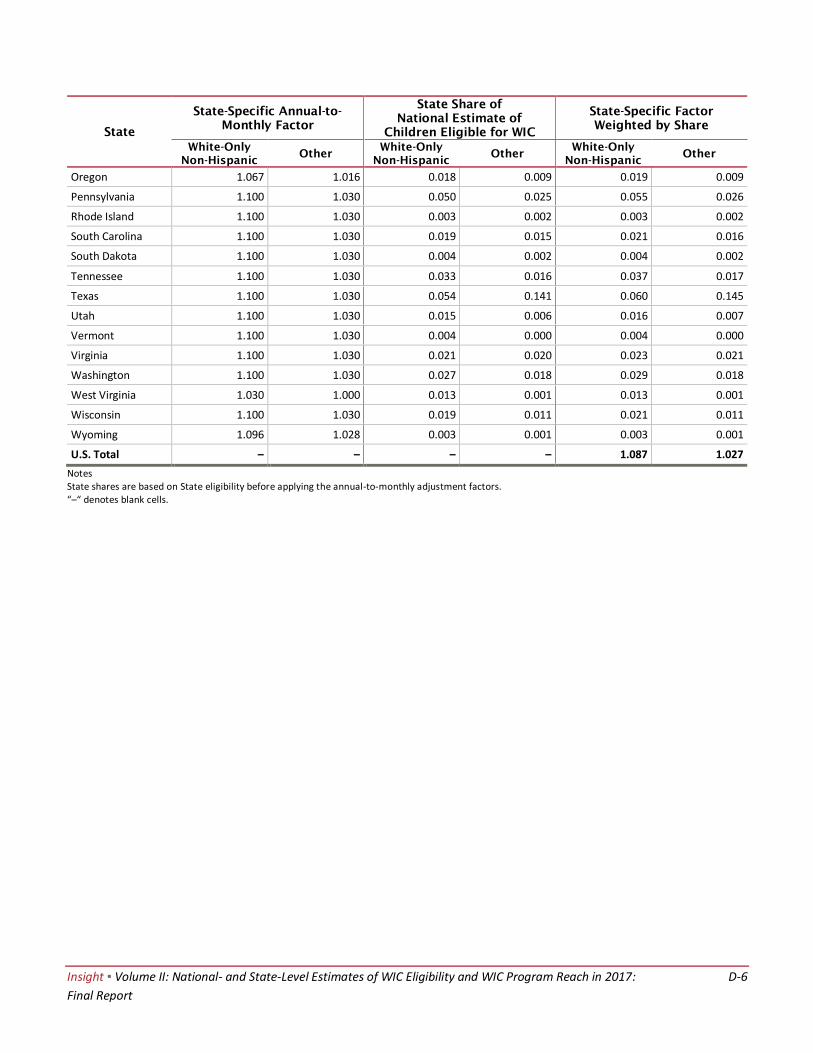
Insight ▪ Volume II: National- and State-Level Estimates of WIC Eligibility and WIC Program Reach in 2017: D-6
Final Report
State
State-Specific Annual-to-
Monthly Factor
State Share of
National Estimate of
Children Eligible for WIC
State-Specific Factor
Weighted by Share
White-Only
Non-Hispanic Other
White-Only
Non-Hispanic Other
White-Only
Non-Hispanic Other
Oregon 1.067 1.016 0.018 0.009 0.019 0.009
Pennsylvania 1.100 1.030 0.050 0.025 0.055 0.026
Rhode Island 1.100 1.030 0.003 0.002 0.003 0.002
South Carolina 1.100 1.030 0.019 0.015 0.021 0.016
South Dakota 1.100 1.030 0.004 0.002 0.004 0.002
Tennessee 1.100 1.030 0.033 0.016 0.037 0.017
Texas 1.100 1.030 0.054 0.141 0.060 0.145
Utah 1.100 1.030 0.015 0.006 0.016 0.007
Vermont 1.100 1.030 0.004 0.000 0.004 0.000
Virginia 1.100 1.030 0.021 0.020 0.023 0.021
Washington 1.100 1.030 0.027 0.018 0.029 0.018
West Virginia 1.030 1.000 0.013 0.001 0.013 0.001
Wisconsin 1.100 1.030 0.019 0.011 0.021 0.011
Wyoming 1.096 1.028 0.003 0.001 0.003 0.001
U.S. Total – – – – 1.087 1.027
Notes State shares are based on State eligibility before applying the annual-to-monthly adjustment factors. “–“ denotes blank cells.

Insight ▪ Volume II: National- and State-Level Estimates of WIC Eligibility and WIC Program Reach in 2017: E-1
Final Report
Appendix E. Method for Calculating Multiple Births and Infant Deaths Factor for CY 2017
The number of pregnant and postpartum women eligible for WIC is estimated by applying an adjustment factor to the number of infants eligible for WIC in the CPS-ASEC data. The adjustment factor is important because the number of pregnant and postpartum women can differ from the number of infants. There are two reasons for this discrepancy: (1) the number of pregnant or postpartum women can be smaller than the number of infants because of multiple births; and (2) the number of pregnant or postpartum women can be greater than the number of infants because of fetal and infant deaths. As multiple births are more common than infant deaths, the adjustment factor results in an estimate of fewer pregnant and postpartum women than infants.
The adjustment factors used for estimates of pregnant and postpartum women eligible for WIC from 2000 through 2016 are shown in table E.1 along with the years of application and source data for the factor estimation.
Table E.1. Adjustment Factors for Estimates of Pregnant and Postpartum Women Eligible for WIC
Factor Years of Application for
WIC Estimates Source Data for Adjustment Factor
0.9966 2000 through 2003 2002 National Vital Statistics data for multiple births and infant deaths March 2002 census estimates for count of infants
0.9961 2004 through 2016 2004 National Vital Statistics data for multiple births and infant deaths March 2004 census estimates for count of infants
Calculating the Updated and Expanded Adjustment Factor
The adjustment factors were updated and expanded using National Vital Statistics data (National Center for Health Statistics, n.d.). The following sources of information were used to produce the factor for the 2017 estimates:
Births: Final Data for 2015–2017
Period Linked Birth – Infant Death Data Files for 2014–2016
Fetal Death Data Files for 2014–2016
To estimate the number of births, a 3-year average was calculated using data from 2015 to 2017. Because the Period Linked Birth – Infant Death Data Files and the Fetal Death Data Files were available only for 2016 and earlier, data from 2014 through 2016 were used to update the factor and calculate a 3-year average. To account for differences by race and ethnicity, individual factors were calculated for the following four groups: White-Only Non-Hispanic, Black-Only Non-Hispanic, Other Non-Hispanic, and Hispanic. Table E.2 shows the estimated factor adjustments since 2013.
Th is purpose of this appendix is to describe the methodology used for updating and expanding the multiple births and infant deaths factor for estimating the number of pregnant and postpartum women eligible for WIC
in 2017.
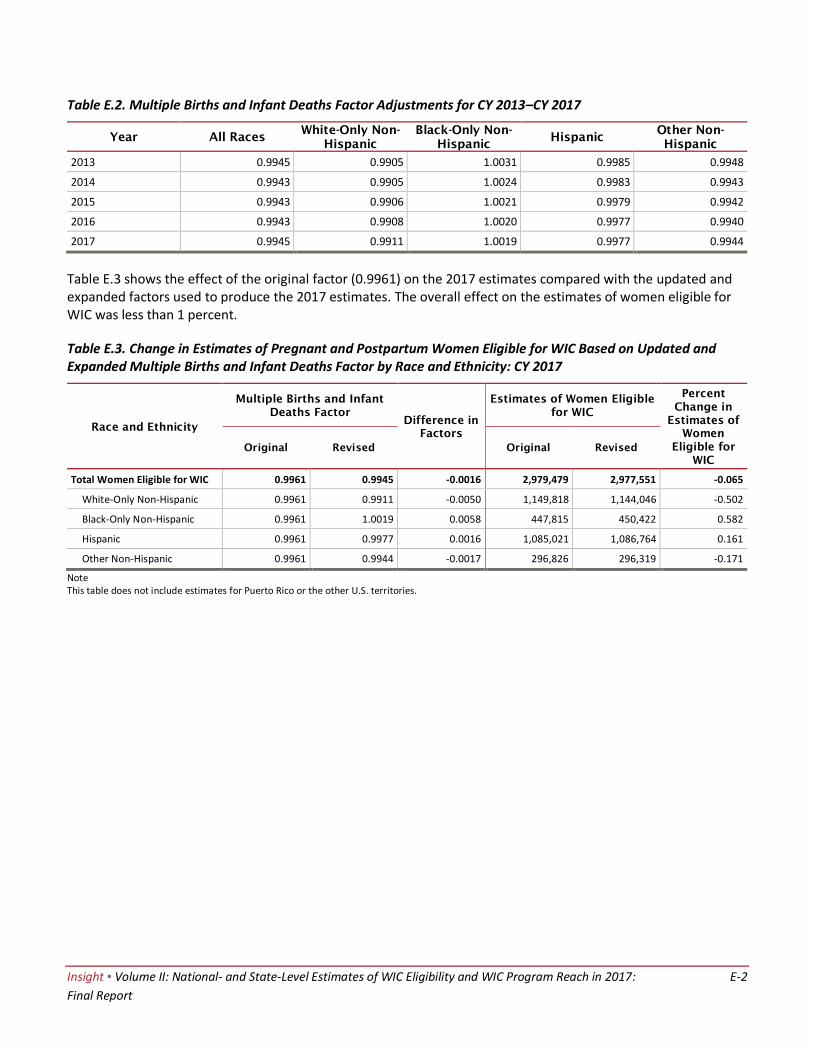
Insight ▪ Volume II: National- and State-Level Estimates of WIC Eligibility and WIC Program Reach in 2017: E-2
Final Report
Table E.2. Multiple Births and Infant Deaths Factor Adjustments for CY 2013–CY 2017
Year All Races White-Only Non-
Hispanic
Black-Only Non-
Hispanic Hispanic
Other Non-
Hispanic
2013 0.9945 0.9905 1.0031 0.9985 0.9948
2014 0.9943 0.9905 1.0024 0.9983 0.9943
2015 0.9943 0.9906 1.0021 0.9979 0.9942
2016 0.9943 0.9908 1.0020 0.9977 0.9940
2017 0.9945 0.9911 1.0019 0.9977 0.9944
Table E.3 shows the effect of the original factor (0.9961) on the 2017 estimates compared with the updated and expanded factors used to produce the 2017 estimates. The overall effect on the estimates of women eligible for WIC was less than 1 percent.
Table E.3. Change in Estimates of Pregnant and Postpartum Women Eligible for WIC Based on Updated and Expanded Multiple Births and Infant Deaths Factor by Race and Ethnicity: CY 2017
Race and Ethnicity
Multiple Births and Infant
Deaths Factor
Difference in
Factors
Estimates of Women Eligible
for WIC
Percent
Change in
Estimates of
Women
Eligible for
WIC
Original Revised Original Revised
Total Women Eligible for WIC 0.9961 0.9945 -0.0016 2,979,479 2,977,551 -0.065
White-Only Non-Hispanic 0.9961 0.9911 -0.0050 1,149,818 1,144,046 -0.502
Black-Only Non-Hispanic 0.9961 1.0019 0.0058 447,815 450,422 0.582
Hispanic 0.9961 0.9977 0.0016 1,085,021 1,086,764 0.161
Other Non-Hispanic 0.9961 0.9944 -0.0017 296,826 296,319 -0.171
Note This table does not include estimates for Puerto Rico or the other U.S. territories.
Insight ▪ Volume II: National- and State-Level Estimates of WIC Eligibility and WIC Program Reach in 2017: F-1
Final Report
Appendix F. Data for Figures in Volumes I and II
Th is section includes additional data used for figures or maps of this report.

Insight ▪ Volume II: National- and State-Level Estimates of WIC Eligibility and WIC Program Reach in 2017: Final Report F-2
Table F.1. Trends in WIC Eligibility by Participant Category: CY 2005–CY 2017
Participant
Category 2005 2006 2007 2008 2009 2010 2011 2012 2013 2014 2015 2016 2017
Infants 2,558,198 2,547,352 2,469,895 2,444,907 2,450,486 2,492,692 2,369,335 2,293,360 2,383,446 2,451,750 2,506,686 2,159,041 2,227,965
Children aged 1–4 8,438,790 8,199,817 8,189,922 8,565,160 9,025,534 9,100,231 8,675,794 8,752,082 8,929,389 9,347,672 9,268,848 8,907,712 8,859,001
Children aged 1 2,254,002 2,153,096 2,132,181 2,243,777 2,317,085 2,203,653 2,251,413 2,160,352 2,246,216 2,312,140 2,274,986 2,317,916 2,250,293
Children aged 2 2,115,499 2,047,789 2,052,056 2,087,040 2,267,648 2,275,554 2,097,521 2,176,383 2,210,997 2,318,334 2,321,950 2,222,568 2,268,129
Children aged 3 2,021,426 1,999,006 2,032,293 2,119,326 2,264,937 2,358,306 2,142,043 2,223,216 2,189,298 2,357,342 2,340,558 2,215,120 2,194,926
Children aged 4 2,047,864 1,999,926 1,973,393 2,115,017 2,175,865 2,262,718 2,184,818 2,192,131 2,282,879 2,359,857 2,331,355 2,152,108 2,145,654
Pregnant women 1,668,448 1,661,374 1,610,857 1,594,559 1,598,198 1,625,725 1,545,272 1,495,721 1,554,475 1,599,023 1,634,852 1,408,119 1,452,144
Postpartum women 1,555,282 1,571,818 1,544,977 1,537,912 1,535,907 1,570,531 1,515,309 1,475,700 1,544,490 1,606,863 1,652,116 1,458,923 1,533,038
Postpartum
breastfeeding women
822,301 853,615 870,455 867,826 860,220 879,159 886,444 876,592 938,157 998,025 1,034,333 949,592 1,028,863
Postpartum non-breastfeeding
women
732,981 718,203 674,522 670,086 675,687 691,372 628,865 599,108 606,333 608,838 617,783 509,331 504,175
Total 14,220,718 13,980,361 13,815,651 14,142,538 14,610,125 14,789,179 14,105,710 14,016,863 14,411,800 15,005,308 15,062,503 13,933,795 14,072,148
Note
Estimates for 2016 should be interpreted with caution given the single-year anomaly that resulted from the small sample sizes in the CPS-ASEC data. See chapter 3 of volume I for more information.
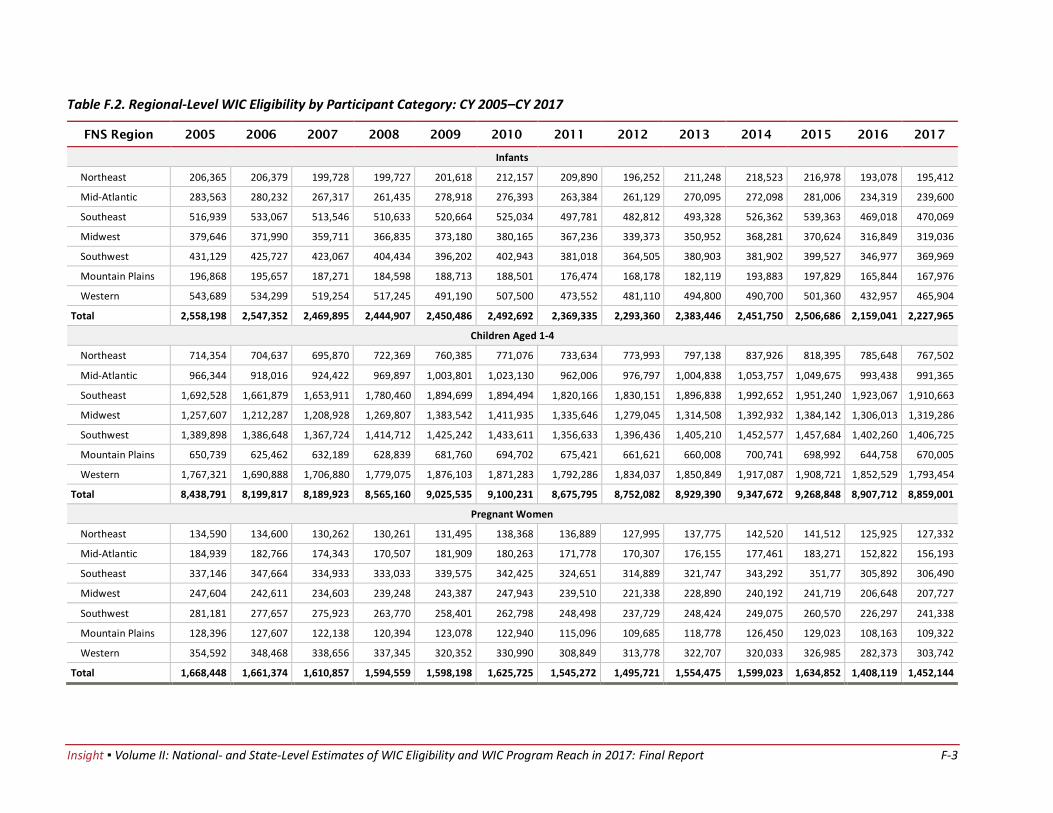
Insight ▪ Volume II: National- and State-Level Estimates of WIC Eligibility and WIC Program Reach in 2017: Final Report F-3
Table F.2. Regional-Level WIC Eligibility by Participant Category: CY 2005–CY 2017
FNS Region 2005 2006 2007 2008 2009 2010 2011 2012 2013 2014 2015 2016 2017
Infants
Northeast 206,365 206,379 199,728 199,727 201,618 212,157 209,890 196,252 211,248 218,523 216,978 193,078 195,412
Mid-Atlantic 283,563 280,232 267,317 261,435 278,918 276,393 263,384 261,129 270,095 272,098 281,006 234,319 239,600
Southeast 516,939 533,067 513,546 510,633 520,664 525,034 497,781 482,812 493,328 526,362 539,363 469,018 470,069
Midwest 379,646 371,990 359,711 366,835 373,180 380,165 367,236 339,373 350,952 368,281 370,624 316,849 319,036
Southwest 431,129 425,727 423,067 404,434 396,202 402,943 381,018 364,505 380,903 381,902 399,527 346,977 369,969
Mountain Plains 196,868 195,657 187,271 184,598 188,713 188,501 176,474 168,178 182,119 193,883 197,829 165,844 167,976
Western 543,689 534,299 519,254 517,245 491,190 507,500 473,552 481,110 494,800 490,700 501,360 432,957 465,904
Total 2,558,198 2,547,352 2,469,895 2,444,907 2,450,486 2,492,692 2,369,335 2,293,360 2,383,446 2,451,750 2,506,686 2,159,041 2,227,965
Children Aged 1-4
Northeast 714,354 704,637 695,870 722,369 760,385 771,076 733,634 773,993 797,138 837,926 818,395 785,648 767,502
Mid-Atlantic 966,344 918,016 924,422 969,897 1,003,801 1,023,130 962,006 976,797 1,004,838 1,053,757 1,049,675 993,438 991,365
Southeast 1,692,528 1,661,879 1,653,911 1,780,460 1,894,699 1,894,494 1,820,166 1,830,151 1,896,838 1,992,652 1,951,240 1,923,067 1,910,663
Midwest 1,257,607 1,212,287 1,208,928 1,269,807 1,383,542 1,411,935 1,335,646 1,279,045 1,314,508 1,392,932 1,384,142 1,306,013 1,319,286
Southwest 1,389,898 1,386,648 1,367,724 1,414,712 1,425,242 1,433,611 1,356,633 1,396,436 1,405,210 1,452,577 1,457,684 1,402,260 1,406,725
Mountain Plains 650,739 625,462 632,189 628,839 681,760 694,702 675,421 661,621 660,008 700,741 698,992 644,758 670,005
Western 1,767,321 1,690,888 1,706,880 1,779,075 1,876,103 1,871,283 1,792,286 1,834,037 1,850,849 1,917,087 1,908,721 1,852,529 1,793,454
Total 8,438,791 8,199,817 8,189,923 8,565,160 9,025,535 9,100,231 8,675,795 8,752,082 8,929,390 9,347,672 9,268,848 8,907,712 8,859,001
Pregnant Women
Northeast 134,590 134,600 130,262 130,261 131,495 138,368 136,889 127,995 137,775 142,520 141,512 125,925 127,332
Mid-Atlantic 184,939 182,766 174,343 170,507 181,909 180,263 171,778 170,307 176,155 177,461 183,271 152,822 156,193
Southeast 337,146 347,664 334,933 333,033 339,575 342,425 324,651 314,889 321,747 343,292 351,77 305,892 306,490
Midwest 247,604 242,611 234,603 239,248 243,387 247,943 239,510 221,338 228,890 240,192 241,719 206,648 207,727
Southwest 281,181 277,657 275,923 263,770 258,401 262,798 248,498 237,729 248,424 249,075 260,570 226,297 241,338
Mountain Plains 128,396 127,607 122,138 120,394 123,078 122,940 115,096 109,685 118,778 126,450 129,023 108,163 109,322
Western 354,592 348,468 338,656 337,345 320,352 330,990 308,849 313,778 322,707 320,033 326,985 282,373 303,742
Total 1,668,448 1,661,374 1,610,857 1,594,559 1,598,198 1,625,725 1,545,272 1,495,721 1,554,475 1,599,023 1,634,852 1,408,119 1,452,144
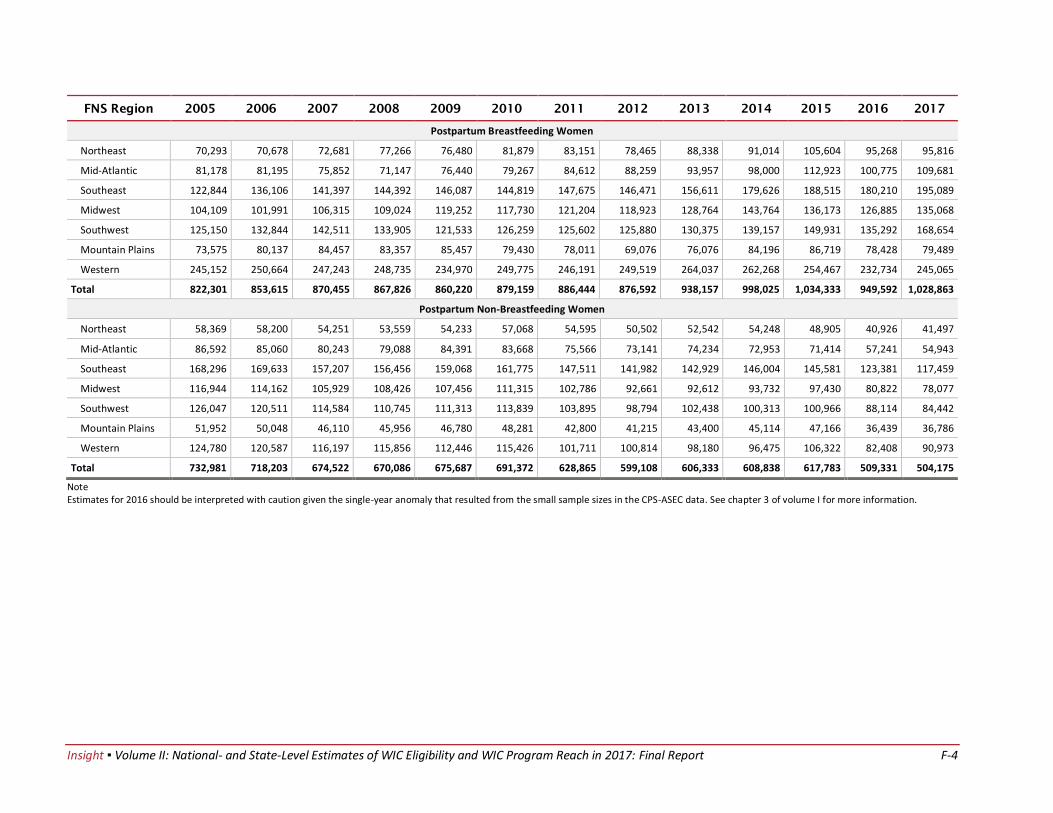
Insight ▪ Volume II: National- and State-Level Estimates of WIC Eligibility and WIC Program Reach in 2017: Final Report F-4
FNS Region 2005 2006 2007 2008 2009 2010 2011 2012 2013 2014 2015 2016 2017
Postpartum Breastfeeding Women
Northeast 70,293 70,678 72,681 77,266 76,480 81,879 83,151 78,465 88,338 91,014 105,604 95,268 95,816
Mid-Atlantic 81,178 81,195 75,852 71,147 76,440 79,267 84,612 88,259 93,957 98,000 112,923 100,775 109,681
Southeast 122,844 136,106 141,397 144,392 146,087 144,819 147,675 146,471 156,611 179,626 188,515 180,210 195,089
Midwest 104,109 101,991 106,315 109,024 119,252 117,730 121,204 118,923 128,764 143,764 136,173 126,885 135,068
Southwest 125,150 132,844 142,511 133,905 121,533 126,259 125,602 125,880 130,375 139,157 149,931 135,292 168,654
Mountain Plains 73,575 80,137 84,457 83,357 85,457 79,430 78,011 69,076 76,076 84,196 86,719 78,428 79,489
Western 245,152 250,664 247,243 248,735 234,970 249,775 246,191 249,519 264,037 262,268 254,467 232,734 245,065
Total 822,301 853,615 870,455 867,826 860,220 879,159 886,444 876,592 938,157 998,025 1,034,333 949,592 1,028,863
Postpartum Non-Breastfeeding Women
Northeast 58,369 58,200 54,251 53,559 54,233 57,068 54,595 50,502 52,542 54,248 48,905 40,926 41,497
Mid-Atlantic 86,592 85,060 80,243 79,088 84,391 83,668 75,566 73,141 74,234 72,953 71,414 57,241 54,943
Southeast 168,296 169,633 157,207 156,456 159,068 161,775 147,511 141,982 142,929 146,004 145,581 123,381 117,459
Midwest 116,944 114,162 105,929 108,426 107,456 111,315 102,786 92,661 92,612 93,732 97,430 80,822 78,077
Southwest 126,047 120,511 114,584 110,745 111,313 113,839 103,895 98,794 102,438 100,313 100,966 88,114 84,442
Mountain Plains 51,952 50,048 46,110 45,956 46,780 48,281 42,800 41,215 43,400 45,114 47,166 36,439 36,786
Western 124,780 120,587 116,197 115,856 112,446 115,426 101,711 100,814 98,180 96,475 106,322 82,408 90,973
Total 732,981 718,203 674,522 670,086 675,687 691,372 628,865 599,108 606,333 608,838 617,783 509,331 504,175
Note Estimates for 2016 should be interpreted with caution given the single-year anomaly that resulted from the small sample sizes in the CPS-ASEC data. See chapter 3 of volume I for more information.
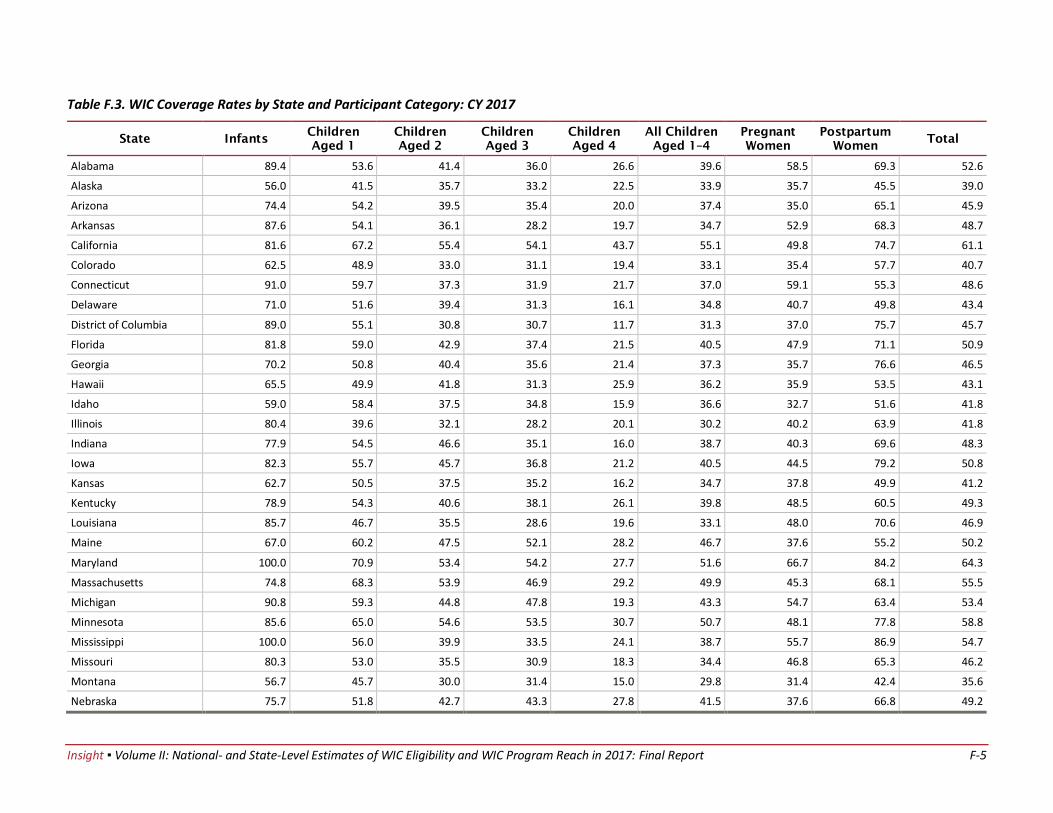
Insight ▪ Volume II: National- and State-Level Estimates of WIC Eligibility and WIC Program Reach in 2017: Final Report F-5
Table F.3. WIC Coverage Rates by State and Participant Category: CY 2017
State Infants Children
Aged 1
Children
Aged 2
Children
Aged 3
Children
Aged 4
All Children
Aged 1–4
Pregnant
Women
Postpartum
Women Total
Alabama 89.4 53.6 41.4 36.0 26.6 39.6 58.5 69.3 52.6
Alaska 56.0 41.5 35.7 33.2 22.5 33.9 35.7 45.5 39.0
Arizona 74.4 54.2 39.5 35.4 20.0 37.4 35.0 65.1 45.9
Arkansas 87.6 54.1 36.1 28.2 19.7 34.7 52.9 68.3 48.7
California 81.6 67.2 55.4 54.1 43.7 55.1 49.8 74.7 61.1
Colorado 62.5 48.9 33.0 31.1 19.4 33.1 35.4 57.7 40.7
Connecticut 91.0 59.7 37.3 31.9 21.7 37.0 59.1 55.3 48.6
Delaware 71.0 51.6 39.4 31.3 16.1 34.8 40.7 49.8 43.4
District of Columbia 89.0 55.1 30.8 30.7 11.7 31.3 37.0 75.7 45.7
Florida 81.8 59.0 42.9 37.4 21.5 40.5 47.9 71.1 50.9
Georgia 70.2 50.8 40.4 35.6 21.4 37.3 35.7 76.6 46.5
Hawaii 65.5 49.9 41.8 31.3 25.9 36.2 35.9 53.5 43.1
Idaho 59.0 58.4 37.5 34.8 15.9 36.6 32.7 51.6 41.8
Illinois 80.4 39.6 32.1 28.2 20.1 30.2 40.2 63.9 41.8
Indiana 77.9 54.5 46.6 35.1 16.0 38.7 40.3 69.6 48.3
Iowa 82.3 55.7 45.7 36.8 21.2 40.5 44.5 79.2 50.8
Kansas 62.7 50.5 37.5 35.2 16.2 34.7 37.8 49.9 41.2
Kentucky 78.9 54.3 40.6 38.1 26.1 39.8 48.5 60.5 49.3
Louisiana 85.7 46.7 35.5 28.6 19.6 33.1 48.0 70.6 46.9
Maine 67.0 60.2 47.5 52.1 28.2 46.7 37.6 55.2 50.2
Maryland 100.0 70.9 53.4 54.2 27.7 51.6 66.7 84.2 64.3
Massachusetts 74.8 68.3 53.9 46.9 29.2 49.9 45.3 68.1 55.5
Michigan 90.8 59.3 44.8 47.8 19.3 43.3 54.7 63.4 53.4
Minnesota 85.6 65.0 54.6 53.5 30.7 50.7 48.1 77.8 58.8
Mississippi 100.0 56.0 39.9 33.5 24.1 38.7 55.7 86.9 54.7
Missouri 80.3 53.0 35.5 30.9 18.3 34.4 46.8 65.3 46.2
Montana 56.7 45.7 30.0 31.4 15.0 29.8 31.4 42.4 35.6
Nebraska 75.7 51.8 42.7 43.3 27.8 41.5 37.6 66.8 49.2
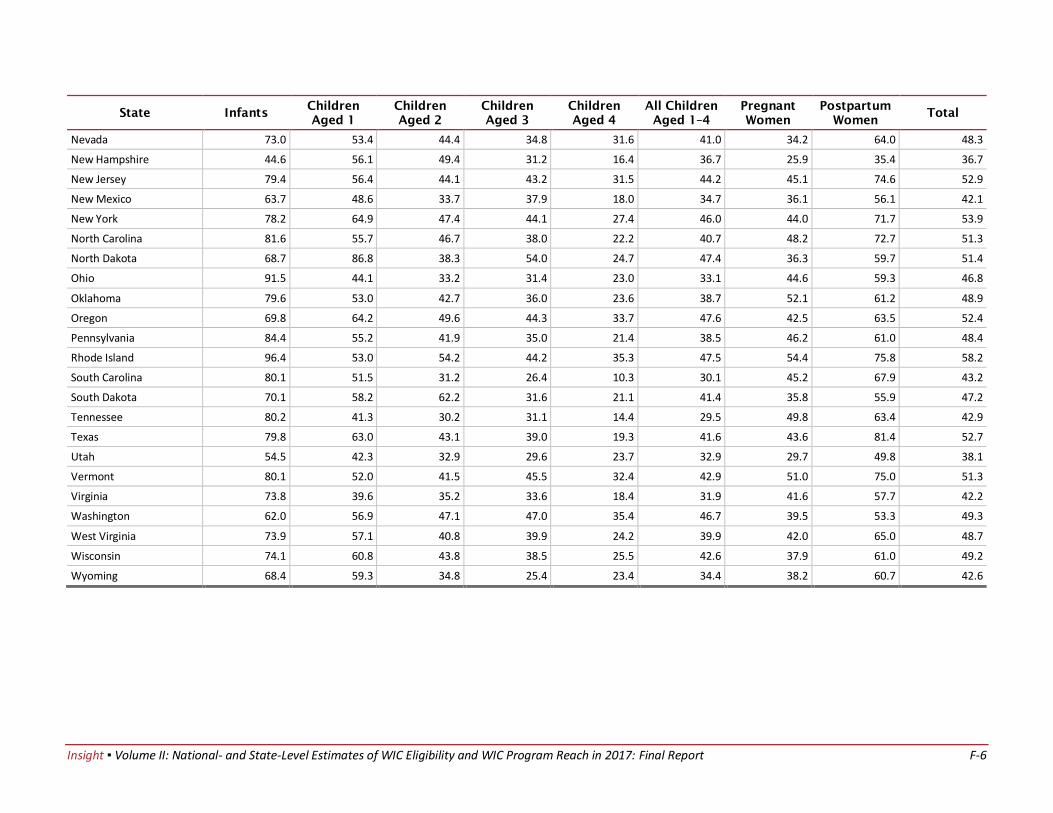
Insight ▪ Volume II: National- and State-Level Estimates of WIC Eligibility and WIC Program Reach in 2017: Final Report F-6
State Infants Children
Aged 1
Children
Aged 2
Children
Aged 3
Children
Aged 4
All Children
Aged 1–4
Pregnant
Women
Postpartum
Women Total
Nevada 73.0 53.4 44.4 34.8 31.6 41.0 34.2 64.0 48.3
New Hampshire 44.6 56.1 49.4 31.2 16.4 36.7 25.9 35.4 36.7
New Jersey 79.4 56.4 44.1 43.2 31.5 44.2 45.1 74.6 52.9
New Mexico 63.7 48.6 33.7 37.9 18.0 34.7 36.1 56.1 42.1
New York 78.2 64.9 47.4 44.1 27.4 46.0 44.0 71.7 53.9
North Carolina 81.6 55.7 46.7 38.0 22.2 40.7 48.2 72.7 51.3
North Dakota 68.7 86.8 38.3 54.0 24.7 47.4 36.3 59.7 51.4
Ohio 91.5 44.1 33.2 31.4 23.0 33.1 44.6 59.3 46.8
Oklahoma 79.6 53.0 42.7 36.0 23.6 38.7 52.1 61.2 48.9
Oregon 69.8 64.2 49.6 44.3 33.7 47.6 42.5 63.5 52.4
Pennsylvania 84.4 55.2 41.9 35.0 21.4 38.5 46.2 61.0 48.4
Rhode Island 96.4 53.0 54.2 44.2 35.3 47.5 54.4 75.8 58.2
South Carolina 80.1 51.5 31.2 26.4 10.3 30.1 45.2 67.9 43.2
South Dakota 70.1 58.2 62.2 31.6 21.1 41.4 35.8 55.9 47.2
Tennessee 80.2 41.3 30.2 31.1 14.4 29.5 49.8 63.4 42.9
Texas 79.8 63.0 43.1 39.0 19.3 41.6 43.6 81.4 52.7
Utah 54.5 42.3 32.9 29.6 23.7 32.9 29.7 49.8 38.1
Vermont 80.1 52.0 41.5 45.5 32.4 42.9 51.0 75.0 51.3
Virginia 73.8 39.6 35.2 33.6 18.4 31.9 41.6 57.7 42.2
Washington 62.0 56.9 47.1 47.0 35.4 46.7 39.5 53.3 49.3
West Virginia 73.9 57.1 40.8 39.9 24.2 39.9 42.0 65.0 48.7
Wisconsin 74.1 60.8 43.8 38.5 25.5 42.6 37.9 61.0 49.2
Wyoming 68.4 59.3 34.8 25.4 23.4 34.4 38.2 60.7 42.6
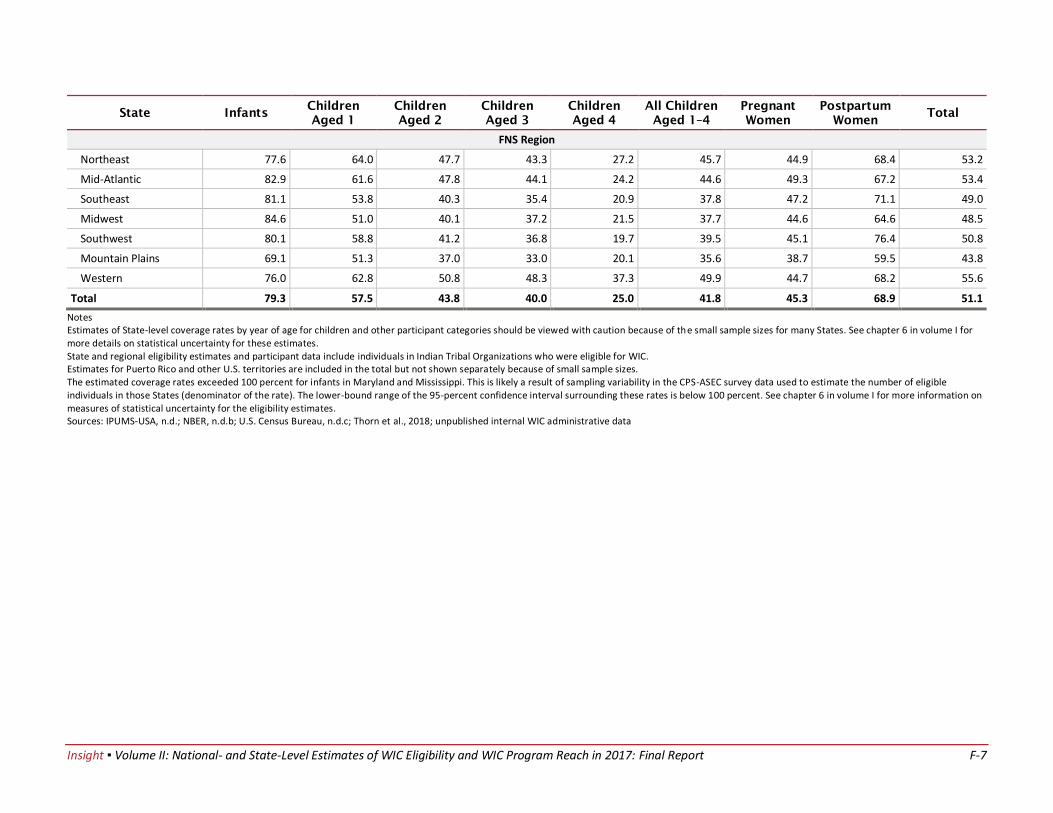
Insight ▪ Volume II: National- and State-Level Estimates of WIC Eligibility and WIC Program Reach in 2017: Final Report F-7
State Infants Children
Aged 1
Children
Aged 2
Children
Aged 3
Children
Aged 4
All Children
Aged 1–4
Pregnant
Women
Postpartum
Women Total
FNS Region
Northeast 77.6 64.0 47.7 43.3 27.2 45.7 44.9 68.4 53.2
Mid-Atlantic 82.9 61.6 47.8 44.1 24.2 44.6 49.3 67.2 53.4
Southeast 81.1 53.8 40.3 35.4 20.9 37.8 47.2 71.1 49.0
Midwest 84.6 51.0 40.1 37.2 21.5 37.7 44.6 64.6 48.5
Southwest 80.1 58.8 41.2 36.8 19.7 39.5 45.1 76.4 50.8
Mountain Plains 69.1 51.3 37.0 33.0 20.1 35.6 38.7 59.5 43.8
Western 76.0 62.8 50.8 48.3 37.3 49.9 44.7 68.2 55.6
Total 79.3 57.5 43.8 40.0 25.0 41.8 45.3 68.9 51.1
Notes Estimates of State-level coverage rates by year of age for children and other participant categories should be viewed with caution because of the small sample sizes for many States. See chapter 6 in volume I for more details on statistical uncertainty for these estimates. State and regional eligibility estimates and participant data include individuals in Indian Tribal Organizations who were eligible for WIC. Estimates for Puerto Rico and other U.S. territories are included in the total but not shown separately because of small sample sizes. The estimated coverage rates exceeded 100 percent for infants in Maryland and Mississippi. This is likely a result of sampling variability in the CPS-ASEC survey data used to estimate the number of eligible individuals in those States (denominator of the rate). The lower-bound range of the 95-percent confidence interval surrounding these rates is below 100 percent. See chapter 6 in volume I for more information on measures of statistical uncertainty for the eligibility estimates. Sources: IPUMS-USA, n.d.; NBER, n.d.b; U.S. Census Bureau, n.d.c; Thorn et al., 2018; unpublished internal WIC administrative data

Insight ▪ Volume II: National- and State-Level Estimates of WIC Eligibility and WIC Program Reach in 2017: Final Report F-8
Table F.4. WIC Coverage Rates by Participant Category: CY 2005–CY 2017
Participant Category 2005 2006 2007 2008 2009 2010 2011 2012 2013 2014 2015 2016 2017
All Participants 56.5 58.1 60.6 62.4 62.9 61.6 63.5 63.2 59.3 54.8 52.7 54.5 51.1
Infants 80.3 82.2 88.5 91.1 90.5 86.3 88.5 89.8 84.6 80.0 76.9 85.9 79.3
Children aged 1–4 47.4 48.6 49.8 51.7 53.1 53.2 54.8 53.9 50.5 46.0 44.4 44.1 41.8
Children aged 1 62.0 65.8 67.9 72.0 75.4 76.5 73.6 76.1 70.0 68.2 62.8 59.2 57.5
Children aged 2 49.0 50.2 51.3 54.2 54.0 55.7 59.5 54.9 51.6 48.1 47.0 47.4 43.8
Children aged 3 45.1 44.5 44.7 46.0 46.5 46.8 50.7 49.5 48.0 42.2 41.8 42.1 40.0
Children aged 4 32.0 32.7 33.9 33.4 35.2 34.5 35.1 35.5 32.6 25.9 26.3 26.5 25.0
Pregnant women 52.4 54.1 56.5 58.1 59.0 56.8 57.9 59.0 54.0 50.2 46.4 50.3 45.3
Postpartum women 70.8 72.9 77.7 80.3 80.5 76.3 79.3 81.6 76.6 72.6 69.2 75.8 68.9
Postpartum breastfeeding women
61.4 62.1 64.1 67.2 68.4 64.4 65.1 67.5 63.3 59.5 57.4 62.2 55.5
Postpartum non-breastfeeding women
81.3 85.8 95.3 97.4 95.8 91.4 99.4 100.0 97.2 94.1 88.9 100.0 96.3
Notes Estimates for 2016 should be interpreted with caution given the single-year anomaly that resulted from the small sample sizes in the CPS-ASEC data. See chapter 3 of volume I for more information. The estimated coverage rates for postpartum non-breastfeeding women exceeded 100 percent in 2012 and 2016. This is likely a result of sampling variability in the CPS survey data used to estimate the number of postpartum women in those States (denominator of the rate). The lower-bound range of the 95-percent confidence interval surrounding these rates is below 100 percent. See chapter 6 in volume I for more information on measures of statistical uncertainty for the eligibility estimates.
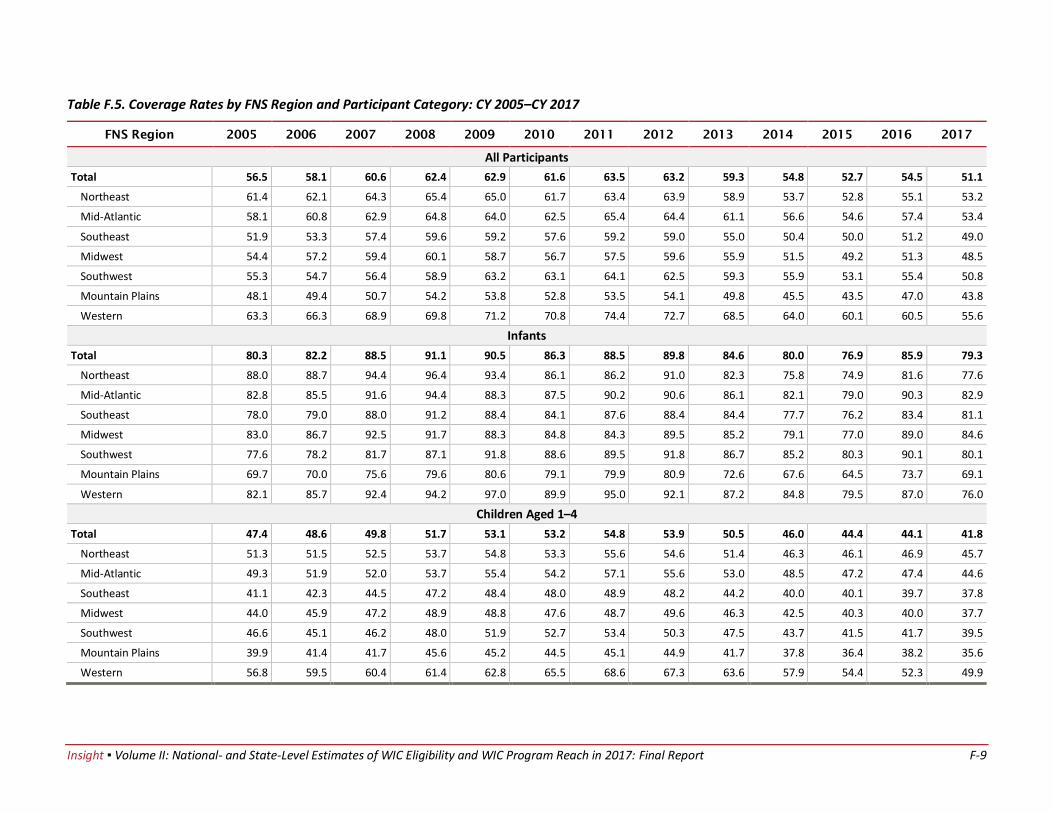
Insight ▪ Volume II: National- and State-Level Estimates of WIC Eligibility and WIC Program Reach in 2017: Final Report F-9
Table F.5. Coverage Rates by FNS Region and Participant Category: CY 2005–CY 2017
FNS Region 2005 2006 2007 2008 2009 2010 2011 2012 2013 2014 2015 2016 2017
All Participants
Total 56.5 58.1 60.6 62.4 62.9 61.6 63.5 63.2 59.3 54.8 52.7 54.5 51.1
Northeast 61.4 62.1 64.3 65.4 65.0 61.7 63.4 63.9 58.9 53.7 52.8 55.1 53.2
Mid-Atlantic 58.1 60.8 62.9 64.8 64.0 62.5 65.4 64.4 61.1 56.6 54.6 57.4 53.4
Southeast 51.9 53.3 57.4 59.6 59.2 57.6 59.2 59.0 55.0 50.4 50.0 51.2 49.0
Midwest 54.4 57.2 59.4 60.1 58.7 56.7 57.5 59.6 55.9 51.5 49.2 51.3 48.5
Southwest 55.3 54.7 56.4 58.9 63.2 63.1 64.1 62.5 59.3 55.9 53.1 55.4 50.8
Mountain Plains 48.1 49.4 50.7 54.2 53.8 52.8 53.5 54.1 49.8 45.5 43.5 47.0 43.8
Western 63.3 66.3 68.9 69.8 71.2 70.8 74.4 72.7 68.5 64.0 60.1 60.5 55.6
Infants
Total 80.3 82.2 88.5 91.1 90.5 86.3 88.5 89.8 84.6 80.0 76.9 85.9 79.3
Northeast 88.0 88.7 94.4 96.4 93.4 86.1 86.2 91.0 82.3 75.8 74.9 81.6 77.6
Mid-Atlantic 82.8 85.5 91.6 94.4 88.3 87.5 90.2 90.6 86.1 82.1 79.0 90.3 82.9
Southeast 78.0 79.0 88.0 91.2 88.4 84.1 87.6 88.4 84.4 77.7 76.2 83.4 81.1
Midwest 83.0 86.7 92.5 91.7 88.3 84.8 84.3 89.5 85.2 79.1 77.0 89.0 84.6
Southwest 77.6 78.2 81.7 87.1 91.8 88.6 89.5 91.8 86.7 85.2 80.3 90.1 80.1
Mountain Plains 69.7 70.0 75.6 79.6 80.6 79.1 79.9 80.9 72.6 67.6 64.5 73.7 69.1
Western 82.1 85.7 92.4 94.2 97.0 89.9 95.0 92.1 87.2 84.8 79.5 87.0 76.0
Children Aged 1–4
Total 47.4 48.6 49.8 51.7 53.1 53.2 54.8 53.9 50.5 46.0 44.4 44.1 41.8
Northeast 51.3 51.5 52.5 53.7 54.8 53.3 55.6 54.6 51.4 46.3 46.1 46.9 45.7
Mid-Atlantic 49.3 51.9 52.0 53.7 55.4 54.2 57.1 55.6 53.0 48.5 47.2 47.4 44.6
Southeast 41.1 42.3 44.5 47.2 48.4 48.0 48.9 48.2 44.2 40.0 40.1 39.7 37.8
Midwest 44.0 45.9 47.2 48.9 48.8 47.6 48.7 49.6 46.3 42.5 40.3 40.0 37.7
Southwest 46.6 45.1 46.2 48.0 51.9 52.7 53.4 50.3 47.5 43.7 41.5 41.7 39.5
Mountain Plains 39.9 41.4 41.7 45.6 45.2 44.5 45.1 44.9 41.7 37.8 36.4 38.2 35.6
Western 56.8 59.5 60.4 61.4 62.8 65.5 68.6 67.3 63.6 57.9 54.4 52.3 49.9
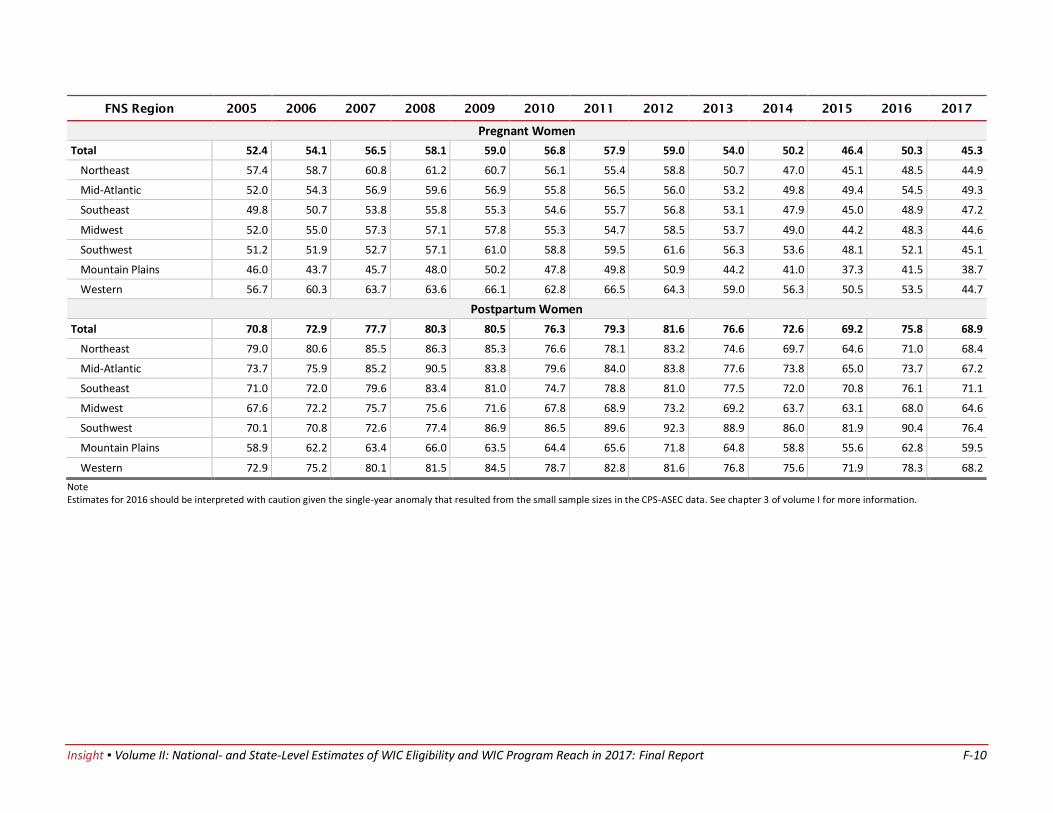
Insight ▪ Volume II: National- and State-Level Estimates of WIC Eligibility and WIC Program Reach in 2017: Final Report F-10
FNS Region 2005 2006 2007 2008 2009 2010 2011 2012 2013 2014 2015 2016 2017
Pregnant Women
Total 52.4 54.1 56.5 58.1 59.0 56.8 57.9 59.0 54.0 50.2 46.4 50.3 45.3
Northeast 57.4 58.7 60.8 61.2 60.7 56.1 55.4 58.8 50.7 47.0 45.1 48.5 44.9
Mid-Atlantic 52.0 54.3 56.9 59.6 56.9 55.8 56.5 56.0 53.2 49.8 49.4 54.5 49.3
Southeast 49.8 50.7 53.8 55.8 55.3 54.6 55.7 56.8 53.1 47.9 45.0 48.9 47.2
Midwest 52.0 55.0 57.3 57.1 57.8 55.3 54.7 58.5 53.7 49.0 44.2 48.3 44.6
Southwest 51.2 51.9 52.7 57.1 61.0 58.8 59.5 61.6 56.3 53.6 48.1 52.1 45.1
Mountain Plains 46.0 43.7 45.7 48.0 50.2 47.8 49.8 50.9 44.2 41.0 37.3 41.5 38.7
Western 56.7 60.3 63.7 63.6 66.1 62.8 66.5 64.3 59.0 56.3 50.5 53.5 44.7
Postpartum Women
Total 70.8 72.9 77.7 80.3 80.5 76.3 79.3 81.6 76.6 72.6 69.2 75.8 68.9
Northeast 79.0 80.6 85.5 86.3 85.3 76.6 78.1 83.2 74.6 69.7 64.6 71.0 68.4
Mid-Atlantic 73.7 75.9 85.2 90.5 83.8 79.6 84.0 83.8 77.6 73.8 65.0 73.7 67.2
Southeast 71.0 72.0 79.6 83.4 81.0 74.7 78.8 81.0 77.5 72.0 70.8 76.1 71.1
Midwest 67.6 72.2 75.7 75.6 71.6 67.8 68.9 73.2 69.2 63.7 63.1 68.0 64.6
Southwest 70.1 70.8 72.6 77.4 86.9 86.5 89.6 92.3 88.9 86.0 81.9 90.4 76.4
Mountain Plains 58.9 62.2 63.4 66.0 63.5 64.4 65.6 71.8 64.8 58.8 55.6 62.8 59.5
Western 72.9 75.2 80.1 81.5 84.5 78.7 82.8 81.6 76.8 75.6 71.9 78.3 68.2
Note Estimates for 2016 should be interpreted with caution given the single-year anomaly that resulted from the small sample sizes in the CPS-ASEC data. See chapter 3 of volume I for more information.
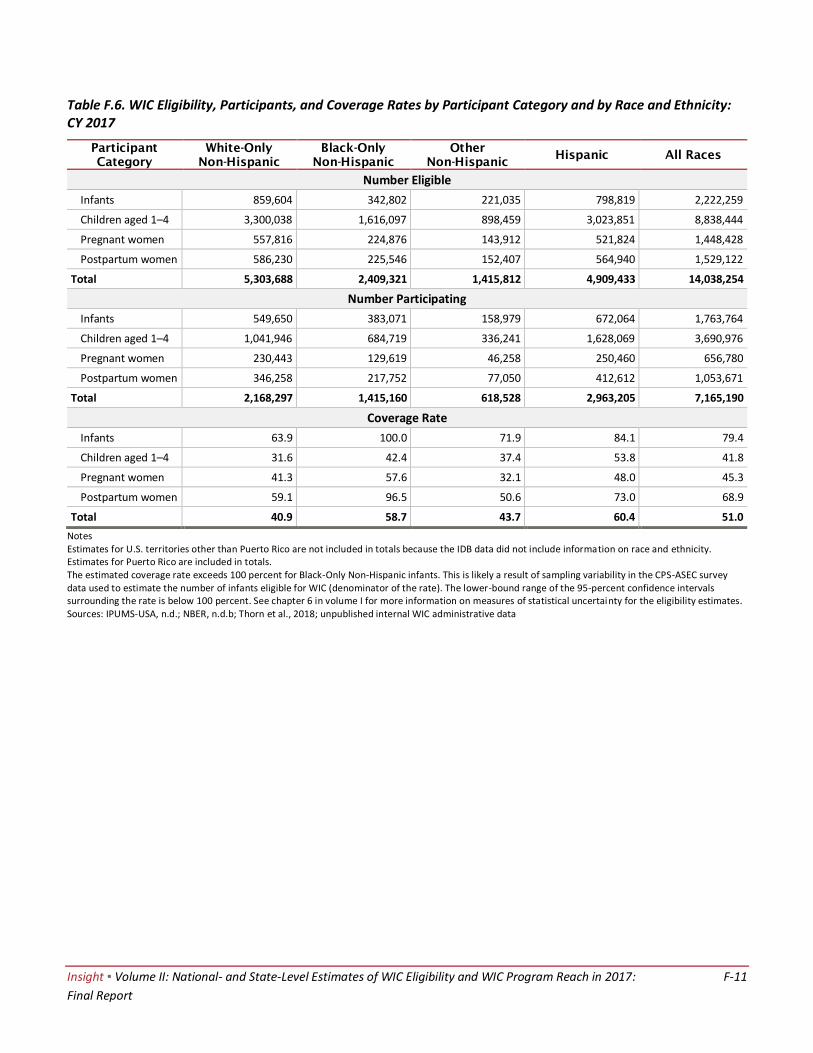
Insight ▪ Volume II: National- and State-Level Estimates of WIC Eligibility and WIC Program Reach in 2017: F-11
Final Report
Table F.6. WIC Eligibility, Participants, and Coverage Rates by Participant Category and by Race and Ethnicity: CY 2017
Participant
Category
White-Only
Non-Hispanic
Black-Only
Non-Hispanic
Other
Non-Hispanic Hispanic All Races
Number Eligible
Infants 859,604 342,802 221,035 798,819 2,222,259
Children aged 1–4 3,300,038 1,616,097 898,459 3,023,851 8,838,444
Pregnant women 557,816 224,876 143,912 521,824 1,448,428
Postpartum women 586,230 225,546 152,407 564,940 1,529,122
Total 5,303,688 2,409,321 1,415,812 4,909,433 14,038,254
Number Participating
Infants 549,650 383,071 158,979 672,064 1,763,764
Children aged 1–4 1,041,946 684,719 336,241 1,628,069 3,690,976
Pregnant women 230,443 129,619 46,258 250,460 656,780
Postpartum women 346,258 217,752 77,050 412,612 1,053,671
Total 2,168,297 1,415,160 618,528 2,963,205 7,165,190
Coverage Rate
Infants 63.9 100.0 71.9 84.1 79.4
Children aged 1–4 31.6 42.4 37.4 53.8 41.8
Pregnant women 41.3 57.6 32.1 48.0 45.3
Postpartum women 59.1 96.5 50.6 73.0 68.9
Total 40.9 58.7 43.7 60.4 51.0
Notes Estimates for U.S. territories other than Puerto Rico are not included in totals because the IDB data did not include information on race and ethnicity. Estimates for Puerto Rico are included in totals. The estimated coverage rate exceeds 100 percent for Black-Only Non-Hispanic infants. This is likely a result of sampling variability in the CPS-ASEC survey data used to estimate the number of infants eligible for WIC (denominator of the rate). The lower-bound range of the 95-percent confidence intervals surrounding the rate is below 100 percent. See chapter 6 in volume I for more information on measures of statistical uncertainty for the eligibility estimates. Sources: IPUMS-USA, n.d.; NBER, n.d.b; Thorn et al., 2018; unpublished internal WIC administrative data
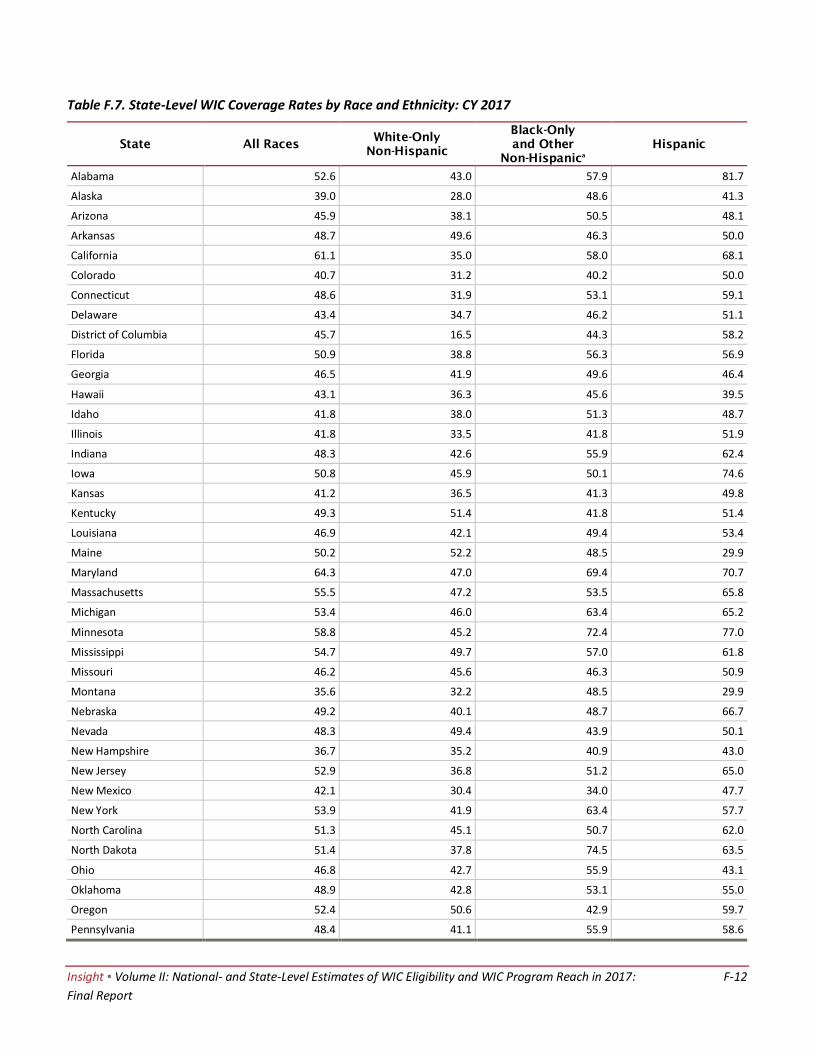
Insight ▪ Volume II: National- and State-Level Estimates of WIC Eligibility and WIC Program Reach in 2017: F-12
Final Report
Table F.7. State-Level WIC Coverage Rates by Race and Ethnicity: CY 2017
State All Races White-Only
Non-Hispanic
Black-Only
and Other
Non-Hispanica
Hispanic
Alabama 52.6 43.0 57.9 81.7
Alaska 39.0 28.0 48.6 41.3
Arizona 45.9 38.1 50.5 48.1
Arkansas 48.7 49.6 46.3 50.0
California 61.1 35.0 58.0 68.1
Colorado 40.7 31.2 40.2 50.0
Connecticut 48.6 31.9 53.1 59.1
Delaware 43.4 34.7 46.2 51.1
District of Columbia 45.7 16.5 44.3 58.2
Florida 50.9 38.8 56.3 56.9
Georgia 46.5 41.9 49.6 46.4
Hawaii 43.1 36.3 45.6 39.5
Idaho 41.8 38.0 51.3 48.7
Illinois 41.8 33.5 41.8 51.9
Indiana 48.3 42.6 55.9 62.4
Iowa 50.8 45.9 50.1 74.6
Kansas 41.2 36.5 41.3 49.8
Kentucky 49.3 51.4 41.8 51.4
Louisiana 46.9 42.1 49.4 53.4
Maine 50.2 52.2 48.5 29.9
Maryland 64.3 47.0 69.4 70.7
Massachusetts 55.5 47.2 53.5 65.8
Michigan 53.4 46.0 63.4 65.2
Minnesota 58.8 45.2 72.4 77.0
Mississippi 54.7 49.7 57.0 61.8
Missouri 46.2 45.6 46.3 50.9
Montana 35.6 32.2 48.5 29.9
Nebraska 49.2 40.1 48.7 66.7
Nevada 48.3 49.4 43.9 50.1
New Hampshire 36.7 35.2 40.9 43.0
New Jersey 52.9 36.8 51.2 65.0
New Mexico 42.1 30.4 34.0 47.7
New York 53.9 41.9 63.4 57.7
North Carolina 51.3 45.1 50.7 62.0
North Dakota 51.4 37.8 74.5 63.5
Ohio 46.8 42.7 55.9 43.1
Oklahoma 48.9 42.8 53.1 55.0
Oregon 52.4 50.6 42.9 59.7
Pennsylvania 48.4 41.1 55.9 58.6
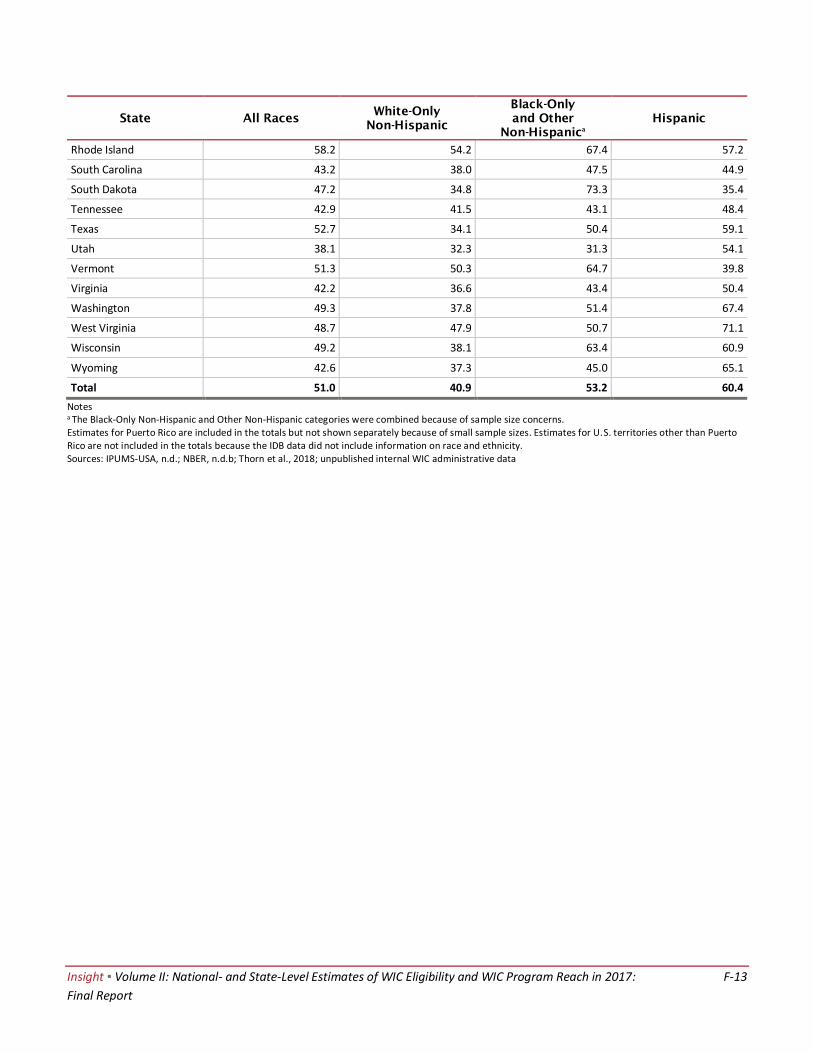
Insight ▪ Volume II: National- and State-Level Estimates of WIC Eligibility and WIC Program Reach in 2017: F-13
Final Report
State All Races White-Only
Non-Hispanic
Black-Only
and Other
Non-Hispanica
Hispanic
Rhode Island 58.2 54.2 67.4 57.2
South Carolina 43.2 38.0 47.5 44.9
South Dakota 47.2 34.8 73.3 35.4
Tennessee 42.9 41.5 43.1 48.4
Texas 52.7 34.1 50.4 59.1
Utah 38.1 32.3 31.3 54.1
Vermont 51.3 50.3 64.7 39.8
Virginia 42.2 36.6 43.4 50.4
Washington 49.3 37.8 51.4 67.4
West Virginia 48.7 47.9 50.7 71.1
Wisconsin 49.2 38.1 63.4 60.9
Wyoming 42.6 37.3 45.0 65.1
Total 51.0 40.9 53.2 60.4
Notes a The Black-Only Non-Hispanic and Other Non-Hispanic categories were combined because of sample size concerns. Estimates for Puerto Rico are included in the totals but not shown separately because of small sample sizes. Estimates for U.S. territories other than Puerto Rico are not included in the totals because the IDB data did not include information on race and ethnicity. Sources: IPUMS-USA, n.d.; NBER, n.d.b; Thorn et al., 2018; unpublished internal WIC administrative data
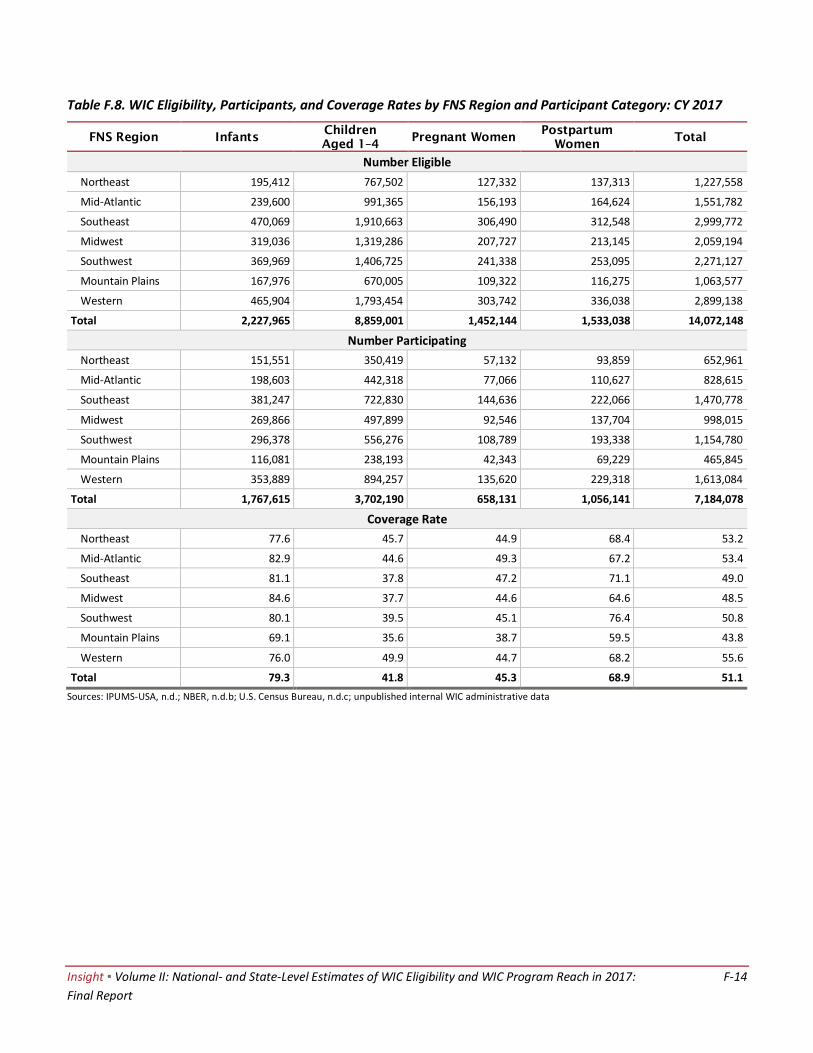
Insight ▪ Volume II: National- and State-Level Estimates of WIC Eligibility and WIC Program Reach in 2017: F-14
Final Report
Table F.8. WIC Eligibility, Participants, and Coverage Rates by FNS Region and Participant Category: CY 2017
FNS Region Infants Children
Aged 1–4 Pregnant Women
Postpartum
Women Total
Number Eligible
Northeast 195,412 767,502 127,332 137,313 1,227,558
Mid-Atlantic 239,600 991,365 156,193 164,624 1,551,782
Southeast 470,069 1,910,663 306,490 312,548 2,999,772
Midwest 319,036 1,319,286 207,727 213,145 2,059,194
Southwest 369,969 1,406,725 241,338 253,095 2,271,127
Mountain Plains 167,976 670,005 109,322 116,275 1,063,577
Western 465,904 1,793,454 303,742 336,038 2,899,138
Total 2,227,965 8,859,001 1,452,144 1,533,038 14,072,148
Number Participating
Northeast 151,551 350,419 57,132 93,859 652,961
Mid-Atlantic 198,603 442,318 77,066 110,627 828,615
Southeast 381,247 722,830 144,636 222,066 1,470,778
Midwest 269,866 497,899 92,546 137,704 998,015
Southwest 296,378 556,276 108,789 193,338 1,154,780
Mountain Plains 116,081 238,193 42,343 69,229 465,845
Western 353,889 894,257 135,620 229,318 1,613,084
Total 1,767,615 3,702,190 658,131 1,056,141 7,184,078
Coverage Rate
Northeast 77.6 45.7 44.9 68.4 53.2
Mid-Atlantic 82.9 44.6 49.3 67.2 53.4
Southeast 81.1 37.8 47.2 71.1 49.0
Midwest 84.6 37.7 44.6 64.6 48.5
Southwest 80.1 39.5 45.1 76.4 50.8
Mountain Plains 69.1 35.6 38.7 59.5 43.8
Western 76.0 49.9 44.7 68.2 55.6
Total 79.3 41.8 45.3 68.9 51.1
Sources: IPUMS-USA, n.d.; NBER, n.d.b; U.S. Census Bureau, n.d.c; unpublished internal WIC administrative data