Embed Size (px)
Citation preview

APPENDICES
H1 2018 RESULTS
July 27th, 2018

APPENDICES - INDEX
FINANCIALAPPENDICES
PAGE 24
Generation capacity & electricity output 25
Outright power generation
in Europe nuclear & hydro 33
Reportable segments 35
— North America 36
— Latin America 38
— Africa/Asia 40
— Benelux 42
— France 45
— Europe excluding France & Benelux 49
— Infrastructures Europe 52
— GEM 54
— Others 55
PAGE 57
Impact of weather in France 58
Change in scope & forex 60
Balance sheet, P/L & cash flow statement 64
Profit & Loss details 71
Cash flow details 85
Credit 91
BUSINESS APPENDICES

BUSINESS APPENDICES
H1 2018 RESULTS

GENERATION CAPACITY
& ELECTRICITY OUTPUT

At 100%
% consolidation(2)
Net ownership(3)
58.4 GW
7%
11%
49%1%
5%
19%
5%
2%
BREAKDOWN OF GENERATION CAPACITY BY TECHNOLOGYAS OF 06/30/2018
26
(1) Excluding pumped storage for hydro capacity(2) % of consolidation for full consolidated and joint operations affiliates and % holding for equity consolidated companies(3) ENGIE ownership
Natural gas
Hydro
Wind
Biomass
& biogas
Coal
Nuclear
Other
non-renewable
Solar
H1 2018 RESULTS
low CO2 emissions
89% 71%
renewable(1)
24% 49%
low CO2 emissions
86% 74%
renewable(1)
26% 60%
low CO2 emissions
88% 76%
renewable(1)
23% 60%
Installed Under construction
101.8 GW
6%6%
2%
56%
1%
5%
19%
5%
67.2 GW
8%
10%2%
46%1%
5%
23%
5%
6.7 GW
28%
15%
22%
31%
3%
4.2 GW
26%
22%
14%
35%
2%
3.6 GW
23%
25%
17%
33%
2%<1%
Other
renewable
BU
SIN
ES
S A
PP
EN
DIC
ES
>1%
<1%
GENERATION CAPACITY & ELECTRICITY OUTPUT
in MW Hydro(1) WindBiomass
& biogasSolar
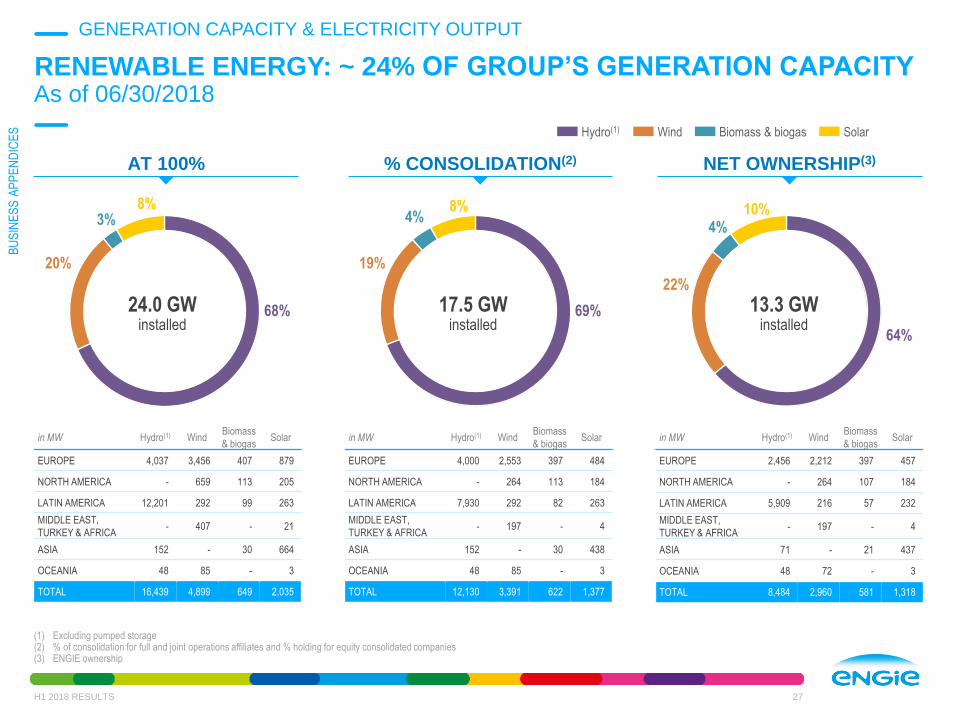
EUROPE 4,037 3,456 407 879
NORTH AMERICA - 659 113 205
LATIN AMERICA 12,201 292 99 263
MIDDLE EAST,
TURKEY & AFRICA- 407 - 21
ASIA 152 - 30 664
OCEANIA 48 85 - 3
TOTAL 16,439 4,899 649 2,035
RENEWABLE ENERGY: ~ 24% OF GROUP’S GENERATION CAPACITYAs of 06/30/2018
27
(1) Excluding pumped storage(2) % of consolidation for full and joint operations affiliates and % holding for equity consolidated companies(3) ENGIE ownership
24.0 GWinstalled
8%3%
20%
68%
8%4%
19%
17.5 GWinstalled
69%
in MW Hydro(1) WindBiomass
& biogasSolar
EUROPE 4,000 2,553 397 484
NORTH AMERICA - 264 113 184
LATIN AMERICA 7,930 292 82 263
MIDDLE EAST,
TURKEY & AFRICA- 197 - 4
ASIA 152 - 30 438
OCEANIA 48 85 - 3
TOTAL 12,130 3,391 622 1,377
in MW Hydro(1) WindBiomass
& biogasSolar
EUROPE 2,456 2,212 397 457
NORTH AMERICA - 264 107 184
LATIN AMERICA 5,909 216 57 232
MIDDLE EAST,
TURKEY & AFRICA- 197 - 4
ASIA 71 - 21 437
OCEANIA 48 72 - 3
TOTAL 8,484 2,960 581 1,318
10%4%
22%
13.3 GWinstalled
64%
Hydro(1) Wind Biomass & biogas Solar
H1 2018 RESULTS
AT 100% % CONSOLIDATION(2) NET OWNERSHIP(3)
BU
SIN
ES
S A
PP
EN
DIC
ES
GENERATION CAPACITY & ELECTRICITY OUTPUT

INSTALLED CAPACITY EVOLUTION VS END 2017AS OF 06/30/2018, IN GW, AT 100%
28
102.7
101.8
12/31/2017 06/30/2018Americas Europe & Others Africa/Asia Disposals &
others
Closing/
Decommissioning
+0.3 +0.2+0.04
• France, solar 75 MW
• France, wind 63 MW
• Belgium, wind 15 MW
• Netherlands, solar, 10 MW
• China, gas, 18 MW
• China, solar, 18 MW
(1.0)
(0.1)• Loy Yang B
(Australia, coal, 986 MW)
-1.3 GW closed or sold
of which -1.0 GW coal
• Longwood (USA, non renewable, 101 MW)
• USA, solar, 111 MW
• Intipampa(Peru, solar, 45 MW)
• Campo Largo(Brazil, wind, 30 MW)
• Pocri(Panama, solar, 21 MW)
+0.5 GW of new capacity added: • 100% in low CO2 technologies
o/w 77% renewable
• 58% international
• Arjona(Brazil, gas, 190 MW)
• Alegrete(Brazil, non renewable, 60 MW)
• Iquique (Chile, non renewable, 42 MW)
H1 2018 RESULTS
BU
SIN
ES
S A
PP
EN
DIC
ES
43%International
57%Europe
89%low CO2 emissions
24%renewable
GENERATION CAPACITY & ELECTRICITY OUTPUT
(0.3)
Capacity revision:
• Solar in India 108 MW and in China 21 MW

In MWBiomass
and biogas Coal Hydro Natural gas Nuclear
Other non
renewable Solar WindTOTAL
NORTH AMERICA 113 - - 2,365 - 101 205 659 3,443
LATIN AMERICA 99 1,949 12,201 1,907 - 1,327 242 292 18,017
Chile - 1,052 44 673 - 163 63 48 2,043
Peru - 125 255 917 - 1,164 45 - 2,504
Mexico - - - 316 - - - - 316
Brazil 99 773 11,903 - - - 134 244 13,153
AFRICA/ASIA 30 1,015 152 35,799 - 1,482 664 453 39,595
Asia Pacific 30 1,015 152 5,715 - 478 308 46 7,744
Middle East, South and Central Asia
and Turkey- - - 30,084 - - 356 - 30,440
Africa - - - - - 1,004 - 407 1,411
BENELUX - - - - 6,429 - 16 375 6,820
FRANCE 93 92 3,873 990 - 358 843 1,962 8,211
EUROPE
excl. France & Benelux9 88 2,295 661 - 60 22 1,157 4,293
GEM - - - 1,100 - - - - 1,100
OTHER 305 2 855 1,306 14,435 - 1,377 42 - 20,320
Generation Europe 305 2,855 1,306 14,435 - 1,377 - - 20,278
Solairedirect - - - - - - 42 - 42
TOTAL 649 5,999 19,828 57,257 6,429 4,704 2,035 4,899 101,799
TOTAL CAPACITY BY SEGMENT AND BY TECHNOLOGYAs of 06/30/2018, at 100%
29H1 2018 RESULTS
BU
SIN
ES
S A
PP
EN
DIC
ES
GENERATION CAPACITY & ELECTRICITY OUTPUT

EXPECTED COMMISSIONING OF CAPACITY UNDER CONSTRUCTIONBY MAIN PROJECTAs of 06/30/2018, at 100%
30H1 2018 RESULTS
In MW 2018 2019 2020 TOTAL
SOLAR 256 746 - 1,003
Paracatu - Brazil 158 - - 158
Kathu CSP - South Africa - 100 - 100
NTPC Kadapa - India - 250 - 250
Villa Ahumada - Mexico - 199 - 199
Trompezon - Mexico - 158 - 158
WIND 1,083 1,031 - 2,114
Campo Largo - Brazil 238 59 - 297
Umburanas - Brazil 213 148 - 360
Live Oak - USA 200 - - 200
Onshore projects - France 156 51 - 207
Willogoleche - Australia 119 - - 119
Onshore projects - Spain - 303 - 303
Ras Ghareb wind - Egypt - 263 - 263
Tonstad - Norway - 208 - 208
OTHER RENEWABLE - 80 91 171
Muara Laboh - Indonesia - 80 - 80
Rantau Dedap - Indonesia - - 91 91
NATURAL GAS - 1,507 - 1,507
Fadhili – Saudi Arabia - 1,507 - 1,507
THERMAL CONTRACTED 1,588 324 - 1,911
Safi - Morocco 1,250 - - 1,250
Mejilones – Chile 338 - - 338
Pampa Sul - Brazil - 324 - 324
TOTAL(1) 2,946 3,699 91 6,736
BU
SIN
ES
S A
PP
EN
DIC
ES
(1) Including hydro (2 MW in 2018), other non renewable (19 MW in 2018 and 9 MW in 2019)
o/w
o/w
GENERATION CAPACITY & ELECTRICITY OUTPUT
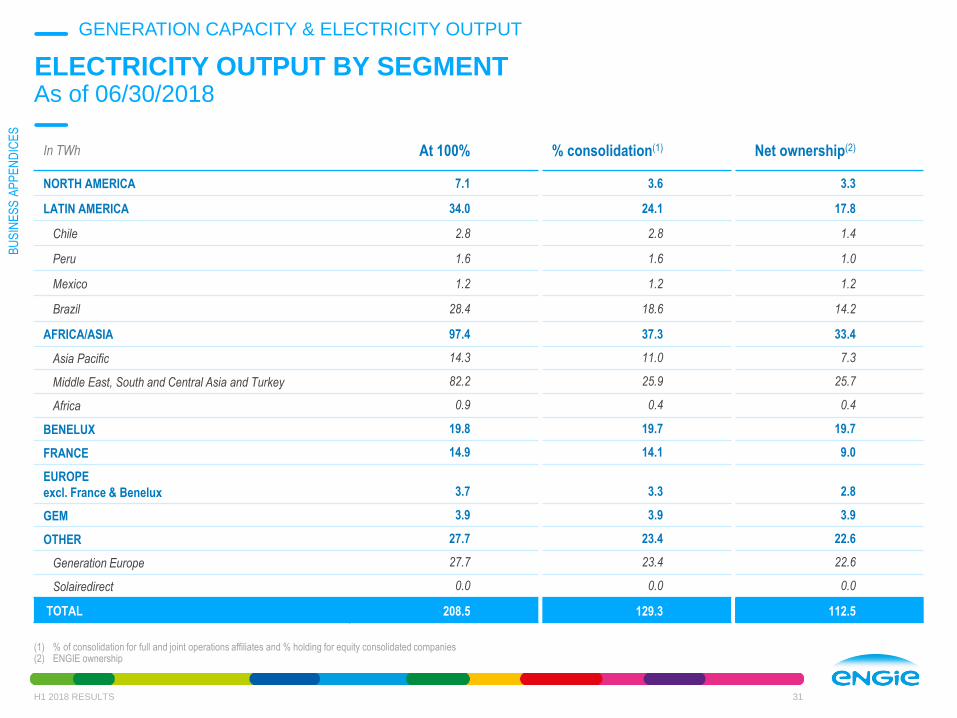
In TWh At 100% % consolidation(1) Net ownership(2)
NORTH AMERICA 7.1 3.6 3.3
LATIN AMERICA 34.0 24.1 17.8
Chile 2.8 2.8 1.4
Peru 1.6 1.6 1.0
Mexico 1.2 1.2 1.2
Brazil 28.4 18.6 14.2
AFRICA/ASIA 97.4 37.3 33.4
Asia Pacific 14.3 11.0 7.3
Middle East, South and Central Asia and Turkey 82.2 25.9 25.7
Africa 0.9 0.4 0.4
BENELUX 19.8 19.7 19.7
FRANCE 14.9 14.1 9.0
EUROPE
excl. France & Benelux 3.7 3.3 2.8
GEM 3.9 3.9 3.9
OTHER 27.7 23.4 22.6
Generation Europe 27.7 23.4 22.6
Solairedirect 0.0 0.0 0.0
TOTAL 208.5 129.3 112.5
ELECTRICITY OUTPUT BY SEGMENTAs of 06/30/2018
31
(1) % of consolidation for full and joint operations affiliates and % holding for equity consolidated companies(2) ENGIE ownership
H1 2018 RESULTS
BU
SIN
ES
S A
PP
EN
DIC
ES
GENERATION CAPACITY & ELECTRICITY OUTPUT

In TWh Biomass
and biogas Coal Hydro Natural gas Nuclear
Other non
renewable Solar WindTOTAL
NORTH AMERICA 0.4 - - 2.4 - 0.2 0.1 0.4 3.6
LATIN AMERICA 0.2 3.6 17.3 2.6 - 0.0 0.1 0.2 24.1
Chile - 1.9 0.0 0.7 - 0.0 0.0 0.0 2.8
Peru - 0.0 0.8 0.7 - 0.0 0.0 - 1.6
Mexico - - - 1.2 - - - - 1.2
Brazil 0.2 1.6 16.5 - - 0.0 0.0 0.2 18.6
AFRICA/ASIA - 4.1 0.2 32.2 - 0.1 0.2 0.4 37.3
Asia Pacific - 4.1 0.2 6.5 - 0.1 0.0 0.1 11.0
Middle East, South and Central Asia and Turkey - - - 25.7 - 0.0 0.2 - 25.9
Africa - - - - - 0.0 - 0.4 0.4
BENELUX - - - - 19.4(1) - 0.0 0.3 19.7
FRANCE 0.2 - 10.9 1.1 - 0.3 0.2 1.4 14.1
EUROPE
excl. France & Benelux- 0.1 1.4 0.8 - 0.0 0.0 1.0 3.3
GEM - - - 3.9 - - - - 3.9
OTHER 1.0 4.9 0.7 14.8 - 2.1 0.0 - 23.4
Generation Europe 1.0 4.9 0.7 14.8 - 2.1 - - 23.4
Solairedirect - - - - - - 0.0 - 0.0
TOTAL 1.8 12.6 30.5 57.8 19.4 2.7 0.7 3.8 129.3
ELECTRICITY OUTPUT BY SEGMENT AND BY TECHNOLOGYAs of 06/30/2018, in % of consolidation
32
(1) o/w France 4.0 TWh and Germany 1.0 TWh
H1 2018 RESULTS
BU
SIN
ES
S A
PP
EN
DIC
ES
GENERATION CAPACITY & ELECTRICITY OUTPUT

OUTRIGHT POWER
GENERATION IN EUROPE
Nuclear & Hydro

CWE outright: EBITDA price sensitivity
+/- €1/MWh in achieved price
n ca. +/- €60m EBITDA impact before hedging
3-year rolling hedging policy
OUTRIGHT POWER GENERATION IN EUROPENuclear & Hydro
34
(1) Estimates, average hydro conditions
As of 06/30/18
France, Belgium
France
~35%
Belgium
~65%
~60
TWh/year(1)
Forward outright prices Belgium baseload
25
30
35
40
45
50
55
01/01/2013 01/01/2014 01/01/2015 01/01/2016 01/01/2017
Cal16 Cal17 Cal18 Cal19 Cal20
3-year rolling hedging policy
CWE outright: forward prices and hedges
€/MWh
BU
SIN
ES
S A
PP
EN
DIC
ES
OUTRIGHT POWER GENERATION IN EUROPE - NUCLEAR & HYDRO
H1 2018 RESULTS
CWE outright: hedged ratios & prices
€/MWh
100% 36%73%100% 100% 9%
2016 2017 2018 2019 2020
40
3633
39
42
Achieved prices MtM(1)
2021
35
3840

REPORTABLE
SEGMENTS
36
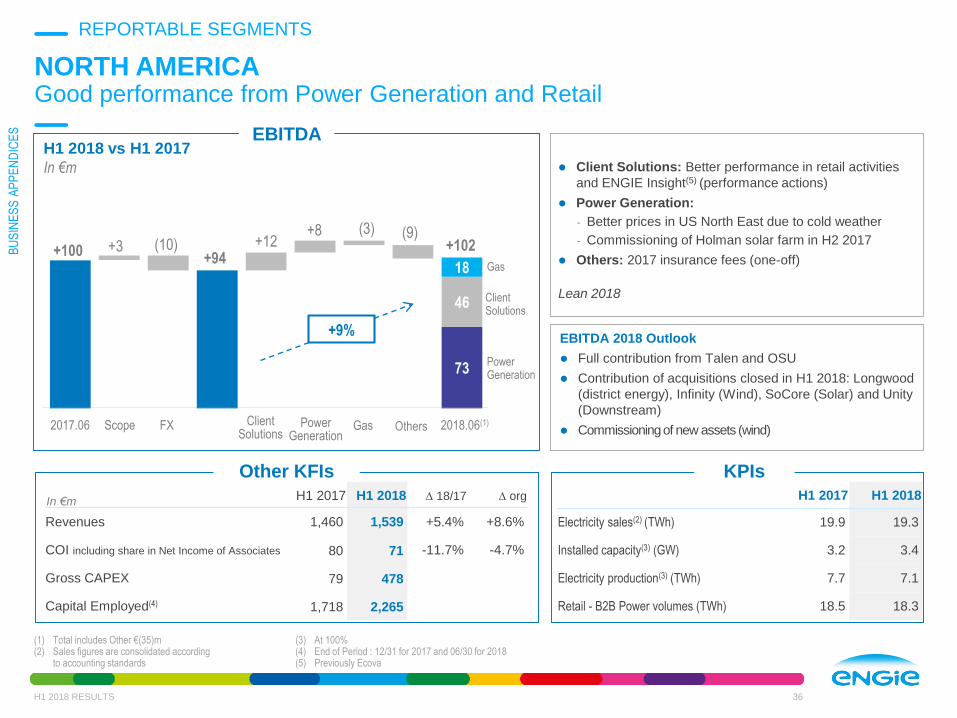
NORTH AMERICAGood performance from Power Generation and Retail
(1) Total includes Other €(35)m (2) Sales figures are consolidated according
to accounting standards
(3) At 100%(4) End of Period : 12/31 for 2017 and 06/30 for 2018(5) Previously Ecova
Client Solutions: Better performance in retail activities
and ENGIE Insight(5) (performance actions)
Power Generation:
- Better prices in US North East due to cold weather
- Commissioning of Holman solar farm in H2 2017
Others: 2017 insurance fees (one-off)
Lean 2018
EBITDA 2018 Outlook
Full contribution from Talen and OSU
Contribution of acquisitions closed in H1 2018: Longwood
(district energy), Infinity (Wind), SoCore (Solar) and Unity
(Downstream)
Commissioning of new assets (wind)
73
+3 (10) +12+8 (3)
46
18
ClientSolutions
PowerGeneration
+102
In €m H1 2017 H1 2018 D 18/17 D org
Revenues 1,460 1,539 +5.4% +8.6%
COI including share in Net Income of Associates 80 71 -11.7% -4.7%
Gross CAPEX 79 478
Capital Employed(4) 1,718 2,265
H1 2017 H1 2018
Electricity sales(2) (TWh) 19.9 19.3
Installed capacity(3) (GW) 3.2 3.4
Electricity production(3) (TWh) 7.7 7.1
Retail - B2B Power volumes (TWh) 18.5 18.3
Other KFIs KPIs
Scope FX2017.06 ClientSolutions
PowerGeneration
2018.06(1)Others
+9%
REPORTABLE SEGMENTS
+100 +94
H1 2018 RESULTS
Gas
Gas
(9)
H1 2018 vs H1 2017
In €m
EBITDA
BU
SIN
ES
S A
PP
EN
DIC
ES

NORTH AMERICAGeneration capacity and production as of 06/30/2018, at 100%
H1 2018 RESULTS 37
In MW In operation
Under
construction Total
USA 2,131 207 2,338
CANADA 805 - 805
PUERTO RICO 507 - 507
TOTAL 3,443 207 3,650
In TWh Total
USA 4.6
CANADA 1.1
PUERTO RICO 1.5
TOTAL 7.1
7.1 TWh
2%14%
73%
3.4 GW
installed
3% 19%
69%
6%
Natural gas
Wind
Biomass & biogas
Other non-renewable
Solar
6%6%
BREAKDOWN OF ELECTRICITY OUTPUTBREAKDOWN OF GENERATION CAPACITY
BU
SIN
ES
S A
PP
EN
DIC
ES
REPORTABLE SEGMENTS
3%

EBITDA 2018 Outlook
Brazil: lower margins in Jirau and lower GSF expected in H2.
Latin America: full impact of tariff increases in Mexico and
Argentina, higher volume in Chile (new Disco PPA), but lower
margins in Peru
920 856 856 856 912 890 890
501
(64) +56 +38 (61) +34
177
119
128
LATIN AMERICAStrong energy management in Brazil, new PPA in Chile and tariff increase in our LDCs, partially offset by lower margins in Peru
FX&Scope: Negative impact from EUR/BRL and EUR/USD,
partially compensated by hydro concessions won in Brazil
(Jaguara and Miranda HPPs).
Brazil:
- Better results from spot market (mainly less exposure to GSF)
- COD of Santa Monica (wind) and Assu (solar)
Latin America:
- Chile: higher volumes from the start of PPA with distribution
companies in Jan’18
- Peru: end of high margin PPAs (Las Bambas and SPCC)
during 2017 and one-off effect of Las Bambas penalty
received in 2017
- Mexico and Argentina: tariff increase in the LDCs
Lean 2018
+8.7%
In €m H1 2017 H1 2018 D 18/17 D org
Revenues 2,233 2,173 -2.6% +8.6%
COI including share in Net Income of Associates 702 721 +2.8% +9.6%
Gross CAPEX 573 684
Capital Employed(3) 9,281 9,427
H1 2017 H1 2018
Electricity sales(1) (TWh) 28.6 30.4
Gas sales(1) (TWh) 14.6 14.4
Electricity production(2) (TWh) 36 34.0
Mexico: transport capacity sold (MGJ) 73 73
Brazil - Average PLD price (BRL/MWh) 230 249
Brazil - GSF (%) 96.5 97.3
Other KFIs KPIs
(1) Sales figures are consolidated accordingto accounting standards
(2) At 100%
(3) End of Period : 12/31 for 2017 and 06/30 for 2018
Mexico & Others
Peru
Chile
Brazil
Forex& Scope
Chile Peru 2018.06Mexico & Others
Brazil2017.06
924
38
REPORTABLE SEGMENTS
H1 2018 RESULTS
H1 2018 vs H1 2017
In €m
EBITDA
BU
SIN
ES
S A
PP
EN
DIC
ES

LATIN AMERICAGeneration capacity and production as of 06/30/2018, at 100%
39
In MW In operation
Under
construction Total
BRAZIL 13,153 1,139 14,291
CHILE 2,043 338 2,381
PERU 2,505 - 2,505
MEXICO 316 437 754
TOTAL 18,017 1,913 19,930
In TWh Total
BRAZIL 28.4
CHILE 2.8
PERU 1.6
MEXICO 1.2
TOTAL 34.0
Coal
Other non-renewable
Solar
18.0 GW
installed
1%7% 11%
68%
2%
11%
1%
H1 2018 RESULTS
BREAKDOWN OF ELECTRICITY OUTPUTBREAKDOWN OF GENERATION CAPACITY
34.0 TWh
1%11%
80%
1%8%
>0%
BU
SIN
ES
S A
PP
EN
DIC
ES
REPORTABLE SEGMENTS
Hydro
Natural gas
Wind
Biomass & biogas

KPIs
40
AFRICA/ASIAHigher availability of power plants in Thailand & Turkey offset by 2017 one-offs and phase out of coal assets in Australia
(1) Sales figures are consolidated according to accounting standards(2) At 100%
(3) Million Imperial Gallons per Day - installed capacity at 100%(4) End of Period : 12/31 for 2017 and 06/30 for 2018
Scope : Sale of Loy Yang B in Jan. 2018 partly offset by contribution
of Tabreed (Middle-East, Sept. 2017) and Solar India (Jan. 2018) ;
MESCAT: 2017 positive one-offs (Fadhili contract closing and
positive Al Dur & MIRFA settlements of claims) partially offset by
higher availability in Baymina (major outage in Jan/Feb 2017)
and organic growth of Solar India.
Australia: Lower volumes on power generation mainly driven by
the closure of Hazelwood (March 2017) and lower margins in
retail activities.
Thailand: Higher energy margin driven by higher availability and
lower maintenance costs on Gheco-1 (planned major outage in
Jan/Feb 2017).
Lean 2018
EBITDA 2018 Outlook
Closing of Glow disposal in H2 2018.
Contribution of Q1 2018 BtB & BtC acquisitions in Africa (Spie
Maroc; Fenix; Thermaire & Ampair; Tieri).
Major CODs expected in 2018: Safi (coal - Morocco),
Willogoleche (wind - Australia), Barka 4 IWP (Oman).
MESCAT
Australia
Thailand
In €m H1 2017 H1 2018 D 18/17 D org
Revenues 1,950 1,892 -3.0% +4.5%
COI including share in Net Income of Associates 545 460 -15.7% -3.5%
Gross CAPEX -186 -330
Capital Employed(4) 5,186 3,409
H1 2017 H1 2018
Electricity sales(1) (TWh) 22.1 17,4
Gas distributed (TWh) 7.3 7,8
Installed capacity(2) (GW) 38.7 39.6
Electricity production(2) (TWh) 101.2 97.4
Middle-East - Water desalination capacity (MIGD)(3) 1 160 1 208
Other KFIs
534
REPORTABLE SEGMENTS
H1 2018 RESULTS
Others
665567
225
(53)(45)
(20) (27) +8 +6
78
232
-1
2017.06 Scope FX MESCAT Australia Thailand Others 2018.06
-6,2%
H1 2018 vs H1 2017
In €m
EBITDA
BU
SIN
ES
S A
PP
EN
DIC
ES

AFRICA/ASIAGeneration capacity and production as of 06/30/2018, at 100%
41
In MW
In
operation
Under
construction Total
AUSTRALIA 1,015 119 1,134
BAHRAIN 3,117 - 3,117
CHINA 326 21 347
EGYPT - 263 263
INDIA 355 250 605
INDONESIA - 171 171
KUWAIT 1,539 - 1,539
LAO PDR 152 - 152
MONGOLIA - 55 55
MOROCCO 316 1,250 1,566
OMAN 3,693 - 3,693
In MW
In
operation
Under
construction Total
PAKISTAN 932 - 932
QATAR 3,755 - 3,755
SAUDI ARABIA 6,072 1,507 7,579
SINGAPORE 3,201 - 3,021
SOUTH
AFRICA1,095 100 1,195
THAILAND 3,050 7 3,057
TURKEY 1,243 - 1,243
UAE 9,733 - 9,733
TOTAL 39,595 3,742 43,337
97.4 TWh
4% >0%1%
94%
>0%
Solar
Natural gas
Hydro
Wind
Biomass & biogas
Coal
Other non-renewable
In TWh Total
AUSTRALIA 1.5
BAHRAIN 7.4
CHINA 0.2
INDIA 0.2
KUWAIT 6.6
LAO PDR 0.2
MOROCCO 0.6
OMAN 8.4
PAKISTAN 3.6
H1 2018 RESULTS
BREAKDOWN OF ELECTRICITY OUTPUTBREAKDOWN OF GENERATION CAPACITY
In TWh Total
QATAR 6.6
SAUDI ARABIA 24.1
SINGAPORE 4.5
SOUTH AFRICA 0.3
THAILAND 7.9
TURKEY 1.5
UAE 23.7
TOTAL 97.4
BU
SIN
ES
S A
PP
EN
DIC
ES
39.6 GW
installed
4%3%>0%
1%
90%
2%
REPORTABLE SEGMENTS

42
242
159
(17) (87)
(5)
180
-55
-17
BENELUXLower Nuclear volumes and achieved prices, lower Client Solutions performance in NL and International partly offset by better wind conditions and services in Belgium
(1) Sales figures are expressed in contributive & exclude Giants sales(2) At 100%(3) End of Period : 12/31 for 2017 and 06/30 for 2018
Client Solutions:
- B2C: higher volumes sold (positive churn) with lower
margin (competitive pressure)
- Services: good activity and performance in Belgium.
Difficulties in Fabricom International Operations and
lower performance in NL.
Power Generation: Nuke: lower volumes due to the D3
outage, T3 revision extension and lower achieved prices.
RES: better wind volumes
Lean 2018
EBITDA 2018 Outlook
Nuclear: unplanned outages of D3 till August, extension
of the revision of D4,T2, T3 for 219 cumulated days
Services Belgium: better performance in H2
In €m H1 2017 H1 2018 D 18/17 D org
Revenues 3,490 3,405 -2.5% -2.4%
COI including share in Net Income of Associates -26 -149 n/a n/a
Gross CAPEX -333 -447
Capital Employed(3) -3,019 -3,071
H1 2017 H1 2018
Electricity sales(1) (TWh) 23.3 20.5
Gas sales(1) (TWh) 28.4 30.1
Electricity production(2) (TWh) 21.6 19.8
Nuclear plants availability 73% 69%
Outright nuclear achieved price (€/MWh) 37 33
Nuclear production (TWh) 21.3 19.4
ClientSolutions
PowerGenerationRenewables
133
-45%
Other KFIs KPIs
Client solutions
Power Generation
Others2017.06 2018.06(1)
REPORTABLE SEGMENTS
30
H1 2018 RESULTS
24
Nuke
Other
H1 2018 vs H1 2017
In €m
EBITDA
BU
SIN
ES
S A
PP
EN
DIC
ES

NUCLEAR CAPACITYAs of 06/30/2018
H1 2018 RESULTS 43
(1) Net of third party capacity and drawing rights. Tihange 1, Doel 1 & Doel 2 extended for 10 years (Tihange 1 until 10/01/2025, Doel 1 until 02/15/2025 and Doel 2 until 12/01/2025)
4.9
0.5
0.5
4.9
1.2
0.3
6.4 GW
net capacity
In Belgium, ENGIE operates 5.9 GW through 7 units
(to reach 40/50-year lifetime between 2022 and 2025)
5.9 GW
operated
Germany
France
Belgium
EDF Luminus
EDF
ENGIE
BELGIAN OPERATED CAPACITY BY OWNER(1)
ENGIE: 6.4 GW(1) IN BELGIUM, FRANCE
AND GERMANY
REPORTABLE SEGMENTSB
US
INE
SS
AP
PE
ND
ICE
S

Contracts(1) (Million) Sales(2) (TWh)
Gas Electricity Gas Electricity
TOTAL BENELUX 1.7 3.0 30.1 20.5
of which Belgium 1.4 2.7 22.4 15.2
of which Netherlands 0.3 0.3 7.7 3.3
BENELUXBreakdown of electricity and gas sales to final customers
H1 2018 RESULTS 44
Electricity
Electricity
13.5 14.8 17.1
9.4 9.8
2015 2016 2017 2017 H1 2018 H1
21.7 22.2 19.9
11.7 12.6
2015 2016 2017 2017 H1 2018 H1
11.7 11.29.1
4.7 4.7
2015 2016 2017 2017 H1 2018 H1
Gas at real climate
Gas at real climate
(1) Number of contracts is consolidated at 100%, excluding entities at equity method (3) In 2018, Local Business Accounts (small professionals) transferred from B2C to B2B(2) Sales figures are consolidated according to accounting rules, Group contribution (2017 restated for comparison purposes).
BELGIUM - B2B SALES(3) (TWh)
BELGIUM - B2C SALES (3) (TWh)
REPORTABLE SEGMENTS
13.7 13.2 13.1
6.5 6.9
2015 2016 2017 2017 H1 2018 H1
BU
SIN
ES
S A
PP
EN
DIC
ES

45
FRANCEVery good hydrology partly offset by decrease in B2C gas margins
(1) Sales figures are consolidated according to accounting standards & exclude Giants sales(2) At 100%(3) End of Period : 12/31 for 2017 and 06/30 for 2018
820 815
(5)+65 (23)
220
638
858
+5,3%Client solutions
France Renewables
H1 2017 H1 2018
Electricity sales(1) (TWh) 17.4 22.2
Gas sales(1) (TWh) 56.2 54.6Renewable - Installed capacity2) (GW) 5.8 6.6Renewable - Electricity production(2) (TWh) 8.6 13.2
CNR achieved price (€/MWh) 38.6 39.5
CNR hydro production (TWh) 6.1 9.4Services - Net commercial development (€m/y) 41 49Installations - Backlog (€m) 4 004 4 542
Other KFIs KPIs
Scope& Forex
2018.06France Renewables
ClientSolutions
In €m H1 2017 H1 2018 D 18/17 D org
Revenues 7,265 7,813 +7.5% +5.2%
COI including share in Net Income of Associates 527 553 +4.9% +5.4%
Gross CAPEX -393 -423
Capital Employed(3) 5,890 6,862
2017.06
Scope: loss of contribution of wind & solar parks disposed
in 2017, partly offset by acquisitions in installation &
services (MCI, CNN MCO,…)
Renewable: very good hydrology conditions
Client solutions:
- B2C: Lower margins in gas, partly compensated by
higher volumes in electricity
- Networks: favorable climate conditions
- B2B: increase in revenues from installation business
Lean 2018
EBITDA 2018 Outlook
Wind and Solar: sell-downs planned in Q4 2018
B2B: market recovery in installation and services
(increase in backlog), along with fierce competition
REPORTABLE SEGMENTS
H1 2018 RESULTS
H1 2018 vs H1 2017
In €m
EBITDA
BU
SIN
ES
S A
PP
EN
DIC
ES

FRANCEGeneration capacity and production as of 06/30/2018, at 100%
46
14.9 TWh
In MW In operation
Under
construction Total
FRANCE 7,826 293 8,119
FRENCH POLYNESIA 283 - 283
MONACO 3 - 3
NEW CALEDONIA 62 - 62
VANUATU 28 - 28
WALLIS AND FUTUNA 9 - 9
TOTAL 8,211 293 8,504
In TWh Total
FRANCE RENEWABLES 13.2
FRANCE NETWORKS 0.9
FRANCE BTOB 0.8
TOTAL 14.9
1% 2%
Natural gas
Hydro
Wind
Biomass & biogas
Other non-renewable
Solar
73%
3%
7%
8.2 GW
installed
1%
4%
1%
46%
25%
12%
11%
13%
Coal
H1 2018 RESULTS
BREAKDOWN OF ELECTRICITY OUTPUTBREAKDOWN OF GENERATION CAPACITY
BU
SIN
ES
S A
PP
EN
DIC
ES
REPORTABLE SEGMENTS

FRANCEBreakdown of electricity and gas sales to final customers
H1 2018 RESULTS 47
(1) Of which public distribution tariffs: 114.1 TWh in FY 2013; 78.8 TWh in FY 2014; 68.4 TWh in FY 2015; 67.3 TWh in 2016, 56.5 TWh in 2017, 35,2 TWh in H1 2017, 29,5 TWh in H1 2018,
Gas at real climate(1) Electricity
● Development of B2C power sales, market share increased to
11.8%
● H1 2018 VS H1 2017 : Decrease due to loss in the residential gas
customer base market share (70%), partially compensated by a
favorable temperature effect
Contracts (Million) Sales (TWh)
Gas Electricity Gas Electricity
France 7.5 4.1 54.6 9.8
B2C SALES (TWh)
REPORTABLE SEGMENTS
7.1 7.9 10.4 12.515.8
7.9 9.8
2013 2014 2015 2016 2017 H1 2017 H1 2018
127.996.2 99.6 102.6 94.7
56.2 54.6
2013 2014 2015 2016 2017 H1 2017 H1 2018
BU
SIN
ES
S A
PP
EN
DIC
ES

FRANCE B2CResidential & small business customers portfolio in France
H1 2018 RESULTS 48
Portfolio of 189,000(1) contracts at end July 2018,
decrease of 5,000 contracts since July 2017
Household
Increased by 504,000 contracts since end July 2017
The growth in electricity exceeds the decrease in gas
Small businessIncreased by 30,000 contracts since end July 2017
Thousands of contracts
HOUSEHOLD & SMALL BUSINESSMillions of contracts
HOUSEHOLD
Decreased by 322,000 contracts since July 2017
versus 340,000 between July 2016 and July 2017
SMALL BUSINESS
ENGIE Competitors
10.2
10.0
9.9
9.8
9.7
9.6
9.4
9.3
9.2
9.1
9.0
8.8
8.7
8.5
8.4
8.2
8.0
7.8
7.7
7.5
7.4
0.1
0.3
0.5
0.6
0.7
0.7
0.9
1.0
1.1
1.2
1.3
1.4
1.6
1.8
1.9
2.1
2.3
2.5
2.6
2.8
2.9
jun-
08
dec-
08
jun-
09
dec-
09
jun-
10
dec-
10
jun-
11
dec-
11
jun-
12
dec-
12
jun-
13
dec-
13
jun-
14
dec-
14
jun-
15
dec-
15
jun-
16
dec-
16
jun-
17
dec-
17
jun-
18
Mill
ions
of c
ontr
acts
163
368
500
724
880
939
1,02
2
1,16
7
1,32
2
1,47
6
1,60
5
1,73
8
1,94
5
2,13
8
2,37
7
2,54
7
2,71
3
3,00
1
3,31
8
3,58
8
3,82
2
7781 84
8485 85 86 85
8686 86 88
90101
118141
161183
207222237
jun-
08
dec-
08
jun-
09
dec-
09
jun-
10
dec-
10
jun-
11
dec-
11
jun-
12
dec-
12
jun-
13
dec-
13
jun-
14
dec-
14
jun-
15
dec-
15
jun-
16
dec-
16
jun-
17
dec-
17
jun-
18
Household Small business
ELECTRICITY GAS
REPORTABLE SEGMENTSB
US
INE
SS
AP
PE
ND
ICE
S
(1) 189,000 contracts, figure without VGR portfolio (vente de gaz réparti), transferred from France B2C to Entreprise et Collectivité as from January 1st 2018. Last year, published figure was 245,000 contratcs at end July 2017 o/ wich 51,000 VGR.

49
H1 2017 H1 2018
Electricity sales(1) (TWh) 14.5 14.3
Gas sales(1) (TWh) 39.6 39.7
Renewable - Installed capacity(2) (GW) 1.2 1.2
Renewable - Electricity production(2) (TWh) 1.4 1.5
Romania - Gas distributed (GWh) 27 26
EUROPE (excluding FRANCE & BENELUX)Unfavorable regulatory impacts in Romania and less favorable UK spreads
(1) Sales figures are consolidated according to accounting standards & exclude Giants sales(2) At 100%
(3) End of Period : 12/31 for 2017 and 06/30 for 2018
Scope & FX: DSO Hungary disposal compensated by
Keepmoat Regeneration (UK) acquisition in 2017,
negative FX impact (UK, Romania)
Romania: unfavorable regulatory impact on B2C energy
supply.
Italy: end of significant service contracts, lower B2C gas
margins.
UK: favorable power supply margins in H1 2017.
Others: Spain better hydro conditions and service
performance.
Lean 2018
EBITDA 2018 Outlook
Full year contribution from Keepmoat-Regeneration
Romania : challenging regulatory context for distribution
and B2C supply
389 384
(5) (5) +1 (4) (9) +8
92
71
78
100
34
-2,5%
Germany
Italy
UK
Others
375
Romania
Other KFIs KPIs
Scope& Forex
2018.06Germ. UKRoman. Italy Others
In €mH1 2017 H1 2018 D 18/17 D org
Revenues 4,236 4,769 +12,6% 4,9%
COI including share in Net Income of Associates 289 279 -3,6% -2,6%
Gross CAPEX -452 -212
Capital Employed(3) 5,022 5,060
2017.06
REPORTABLE SEGMENTS
H1 2018 RESULTS
H1 2018 vs H1 2017
In €m
EBITDA
BU
SIN
ES
S A
PP
EN
DIC
ES

7.6 TWh
1%
Natural gas
Hydro
Wind
Biomass & biogas
Other non-renewable
Solar
19%
63%
17%
Coal
EUROPE (excluding FRANCE & BENELUX)Generation capacity and production as of 06/30/2018, at 100%
H1 2018 RESULTS 50
In MW In operation Under construction TotalCZECH REPUBLIC 5 - 5
GERMANY 782 10 792
GREECE 148 - 148
ITALY 1,390 - 1,390
NORWAY - 208 208
POLAND 138 - 138
PORTUGAL 493 - 493
ROMANIA 98 - 98
SLOVAKIA 1 - 1
SPAIN 102 303 405
UNITED KINGDOM 2,236 - 2,236
TOTAL 5,393 521 5,914
5.4 GW
installed
1% 2%
21%
33%
43%
>0% >0%
BREAKDOWN OF ELECTRICITY OUTPUT(2)BREAKDOWN OF GENERATION CAPACITY(1)
In TWh TotalCZECH REPUBLIC >0
GERMANY 0.5
GREECE >0
ITALY 4.4
POLAND 0.2
PORTUGAL 0.6
ROMANIA 0.1
SLOVAKIA >0
SPAIN 0.3
UNITED KINGDOM 1.4
TOTAL 7.6
BU
SIN
ES
S A
PP
EN
DIC
ES
REPORTABLE SEGMENTS
(1) Includes 1.1 GW capacity in Italy managed by BU GEM(2) Includes 3.9 TWh output in Italy managed by BU GEM

EUROPE (excluding FRANCE & BENELUX)Breakdown of electricity and gas sales to final customers
H1 2018 RESULTS 51
(1) Number of contracts is consolidated at 100%, excluding entities at equity method
(2) Sales figures are consolidated according to accounting rules, Group contribution
(3) SME Romania (Power & Gas) classified as B2C in 2016 moved to B2B as from 2017
30.1 34.5 30.2 25.715.2 15.3
2014 2015 2016 2017 2017 H1 2018 H1
40.0 39.9 38.045.7
24.3 24.6
2014 2015 2016 2017 2017 H1 2018 H1
B2B
5.815.1
24.2 26.0
12.1 11.9
2014 2015 2016 2017 2017 H1 2018 H1
B2B(3)
Gas at real climate Electricity
Gas at real climate Electricity
1.0 1.21.9 1.7
0.8 0.9
2014 2015 2016 2017 2017 H1 2018 H1
Contracts(1) (Million) Sales(2) (TWh)
Gas Electricity Gas Electricity
TOTAL EUROPE exc. FR/BENELUX(3) 2.5 0.4 39.9 12.8
of which Romania 1.7 0.0 21.0 1.4
of which Italy 0.7 0.1 4.4 0.4
of which Germany 0.1 0.2 4.4 5.2
of which Others (UK mainly) 0.1 0.1 10.1 5.8
B2B SALES (TWh) (3)
B2C SALES (TWh) (3)
REPORTABLE SEGMENTSB
US
INE
SS
AP
PE
ND
ICE
S
52
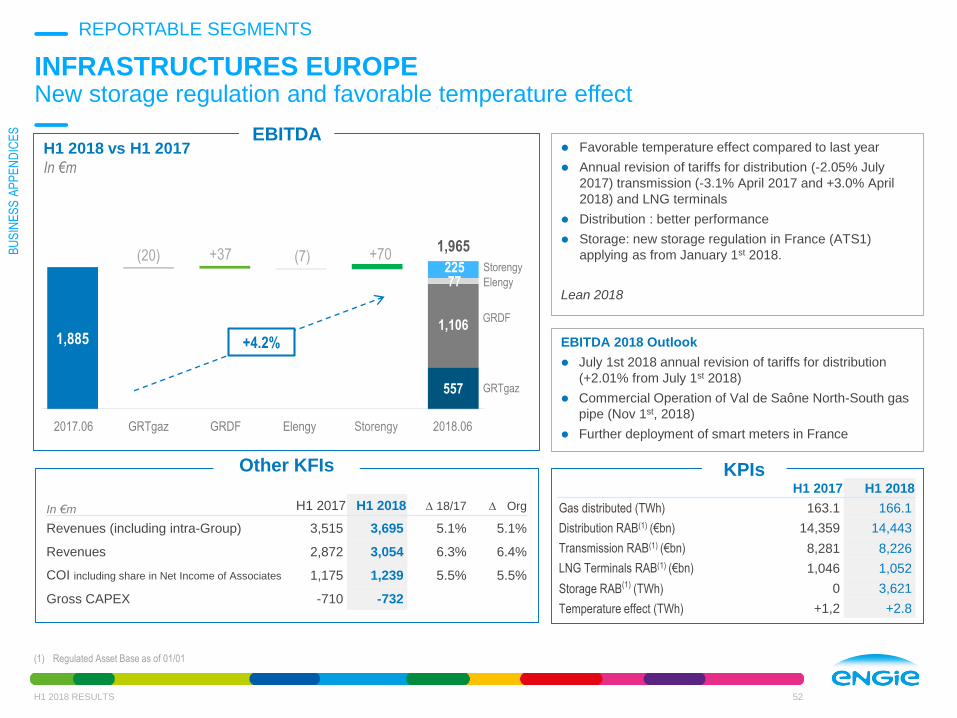
INFRASTRUCTURES EUROPENew storage regulation and favorable temperature effect
(1) Regulated Asset Base as of 01/01
164
GRTgaz
Elengy
1,885
557
77225
(20) +37 (7)1,965
1,106
+70Storengy
GRDF
Favorable temperature effect compared to last year
Annual revision of tariffs for distribution (-2.05% July
2017) transmission (-3.1% April 2017 and +3.0% April
2018) and LNG terminals
Distribution : better performance
Storage: new storage regulation in France (ATS1)
applying as from January 1st 2018.
Lean 2018
EBITDA 2018 Outlook
July 1st 2018 annual revision of tariffs for distribution
(+2.01% from July 1st 2018)
Commercial Operation of Val de Saône North-South gas
pipe (Nov 1st, 2018)
Further deployment of smart meters in France
H1 2017 H1 2018
Gas distributed (TWh) 163.1 166.1
Distribution RAB(1) (€bn) 14,359 14,443
Transmission RAB(1) (€bn) 8,281 8,226
LNG Terminals RAB(1) (€bn) 1,046 1,052
Storage RAB(1) (TWh) 0 3,621
Temperature effect (TWh) +1,2 +2.8
Other KFIs KPIs
GRTgaz2017.06 2018.06ElengyGRDF Storengy
+4.2%
In €m H1 2017 H1 2018 D 18/17 D Org
Revenues (including intra-Group) 3,515 3,695 5.1% 5.1%
Revenues 2,872 3,054 6.3% 6.4%
COI including share in Net Income of Associates 1,175 1,239 5.5% 5.5%
Gross CAPEX -710 -732
REPORTABLE SEGMENTS
H1 2018 vs H1 2017
In €m
EBITDA
BU
SIN
ES
S A
PP
EN
DIC
ES
H1 2018 RESULTS

INFRASTRUCTURES EUROPESecured cash flows and visibility
H1 2018 RESULTS 53
Distribution France
Transmission
Storage
LNG terminals
€1,965m €732m
€8m
€393m
€252m
€79m€77m
€1,106m
€557m
€225m
H1 2018 CAPEX BREAKDOWN H1 2018 EBITDA BREAKDOWN
REPORTABLE SEGMENTS

INFRASTRUCTURES EUROPERegulation in France
H1 2018 RESULTS 54
(1) For already decided projects; for new projects: ad hoc fixed premium(2) Estimate
(3) Géométhane, an Economic Interest Group shared equally by Géosud and Storengy
Period of regulation
CAPEX (in €m) RAB remuneration(real pre-tax) Type of tariff
Regulated asset base at
01/01/2018 (in €bn)(2)H1 2017 H1 2018
Distribution07/01/2016-
07/01/2020345 393
5.0%
+ incentives of 200bps
over 20yrs for Gazpar
Price cap
yearly update14.4
Transmission04/01/2017-
03/31/2021293 252
5.25%
+ incentives up to
300bps over 10yrs(1)
Cost +
yearly update8.2
LNG terminals04/01/2017-
03/31/202113 8
7.25%
+ incentives 125bps
(for Capex decided
in 2004-2008)
and 200bps for
extensions over 10yrs
Cost +
update every 2 years1.1
Storage (France)01/01/2018
03/31/202047 57 5.75%
Cost +
yearly update
Storengy: 3.5
Géométhane(3): 0.19
TOTAL 710 732 27.3
REPORTABLE SEGMENTS

55
GEM New management set up for LT contracts & positive market evolution leading to strong results improvement
(1) Giants customers(2) End of Period : 12/31 for 2017 and 06/30 for 2018
Favorable market and weather conditions in Europe in
Q1 2018 (cold snap + low stock level in Feb) versus gas
congestion situation in February 2017 (South of France)
Value extraction from the new management set up of LT
gas supply contract management
Continuous effort on cost base
Lean 2018
EBITDA 2018 Outlook
Maximization of LT supply contracts performance under
the new management set up
Ongoing renegotiation of gas supply conditions
Active portfolio optimization and focus on cost savings
(119.6) (120.5)
124
(0.9)
+40
+50
+156
In €m H1 2017 H1 2018 D 18/17 D org
Revenues 3,800 3,214 -15.4% -15.0%
COI including share in Net Income of Associates -140 104 +174% +173%
Gross CAPEX -238 -44
Capital Employed(2) 611 733
H1 2017 H1 2018
GEM - Gas sales (TWh)(1) 24.2 26,4
GEM - Electricity sales (TWh)(1) 10.6 10,6
Other KFIs KPIs
Scope& Forex
One-off 2017 losses in
South France
Favorable weather cond.
2018
2018.062017.06 Gas assets optimization & other activities
REPORTABLE SEGMENTS
H1 2018 vs H1 2017
In €m
EBITDA
BU
SIN
ES
S A
PP
EN
DIC
ES
H1 2018 RESULTS

56
OTHERSEBITDA decrease mainly due to disposal of thermal assets and favorable European market conditions in H1 2017
(1) Including NewCorp, GBS, E&C, Solairedirect and SUEZ(2) At 100%
(3) End of Period : 12/31 for 2017 and 06/30 for 2018
Scope-outs: Poland & UK coal assets and nuclear project
Generation:
- Favorable 2017 market conditions for spread power
generation despite good fleet availability in H1 2018
- Increasing ancillaries revenues
GTT: higher revenues and margins
Others: Lower corporate costs thanks to performance
plan
Lean 2018
EBITDA 2018 Outlook
Further actions on Corporate costs
Commercial development of B2B supply in France
Gas spreads recovery and thermal assets review
99
54 50
(45)
(55)
+10 (6)
+47
In €m H1 2017 H1 2018 D 18/17 D org
Revenues 2,854 2,322 -18.7% -8.9%
COI including share in Net Income of Associates -135 -215 -59.4% -28.5%
Gross CAPEX -828 -235
Capital Employed(3) 7,447 7,554
H1 2017 H1 2018
Electricity production(2) (TWh) 41.9 27.7
Generation - Load factor gas fleet 40% 28%
Generation - Load factor coal fleet 55% 46%
Tractebel Engineering - Backlog (€m) 910 836
Electricity sales to B2B customers (TWh) 12.8 12.8
Gas sales to B2B customers (TWh) 25.0 22.0
Other KFIs KPIs
Scope& Forex
Others(1)GTT Tractebel 2018.06Generation2017.06
REPORTABLE SEGMENTS
H1 2018 RESULTS
H1 2018 vs H1 2017
In €m
EBITDA
BU
SIN
ES
S A
PP
EN
DIC
ES

20.3 GW
installed
7%14%
71%
6%
2%>0%
OTHERSGeneration capacity and production as of 06/30/2018, at 100%
57
In MW
In
operation
Under
construction Total
BELGIUM 4,416 8 4,424
FRANCE 2,191 - 2,191
GERMANY 1,660 - 1,660
GREECE 422 - 422
ITALY 3,547 - 3,547
27.7 TWh
21%
Natural gas
Hydro
Biomass & biogas
Other non-renewable
Solar
3%
65%
Coal
4%8%
In MW
In
operation
Under
construction Total
NETHERLANDS 3,647 - 3,647
PANAMA (SD) 21 - 21
PORTUGAL 2,406 - 2,406
SOUTH AFRICA (SD) 21 - 21
SPAIN 1,990 - 1,990
TOTAL 20,320 8 20,328
H1 2018 RESULTS
BREAKDOWN OF ELECTRICITY OUTPUTBREAKDOWN OF GENERATION CAPACITY
In TWh Total
BELGIUM 7.2
FRANCE 2.6
GERMANY 2.6
GREECE 0.6
ITALY 4.9
NETHERLANDS 5.9
In TWh Total
PORTUGAL 3.7
SPAIN 0.1
TOTAL 27.7
BU
SIN
ES
S A
PP
EN
DIC
ES
REPORTABLE SEGMENTS
>0%
FINANCIAL APPENDICES
H1 2018 RESULTS

IMPACT OF WEATHER
IN FRANCE

+2.2+1.0
-0.9-0.4
H1 2018 CLIMATE ADJUSTMENT IN FRANCEIMPACT ON GAS SALES AND DISTRIBUTION
H1 2018 RESULTS 60
IMPACT OF WEATHER IN FRANCE
Estimates, in €m
EBITDA
H1
2017
H1
2018 ∆ 18/17
France B2C/B2B
Gas sales+6 +13 +7
Infrastructures Europe
GRDF+9 +20 +11
Total weather adjustment +15 +33 +18
Estimates, in €m
Net income(1)
H1
2017
H1
2018 ∆ 18/17
France B2C/B2B
Gas sales+4 +9 +5
Infrastructures Europe
GRDF+6 +13 +7
Total weather adjustment +10 +21 +12
-0.8
+4.4
+2.0
-1.6
Sales (B2C/B2B): +1.3 TWh
Distribution (infras): +2.8 TWhH1 2018
Q1
Q2
Sales - B2C/B2B Distribution - Infrastructures
Sales (B2C/B2B): +0.6 TWh
Distribution (infras): +1.2 TWhH1 2017
Q1
Q2
(1) Impact on Net Income Group share and Net Recurring Income Group share, with a normative income tax
COOLER
WARMER
AVERAGE CLIMATE
Sales – B2C/B2B:
~€10m EBITDA / TWh
Distribution – Infrastructures:
~€7m EBITDA / TWh
SENSITIVITY
FIN
AN
CIA
L A
PP
EN
DIC
ES
60
CHANGE
IN SCOPE & FOREX
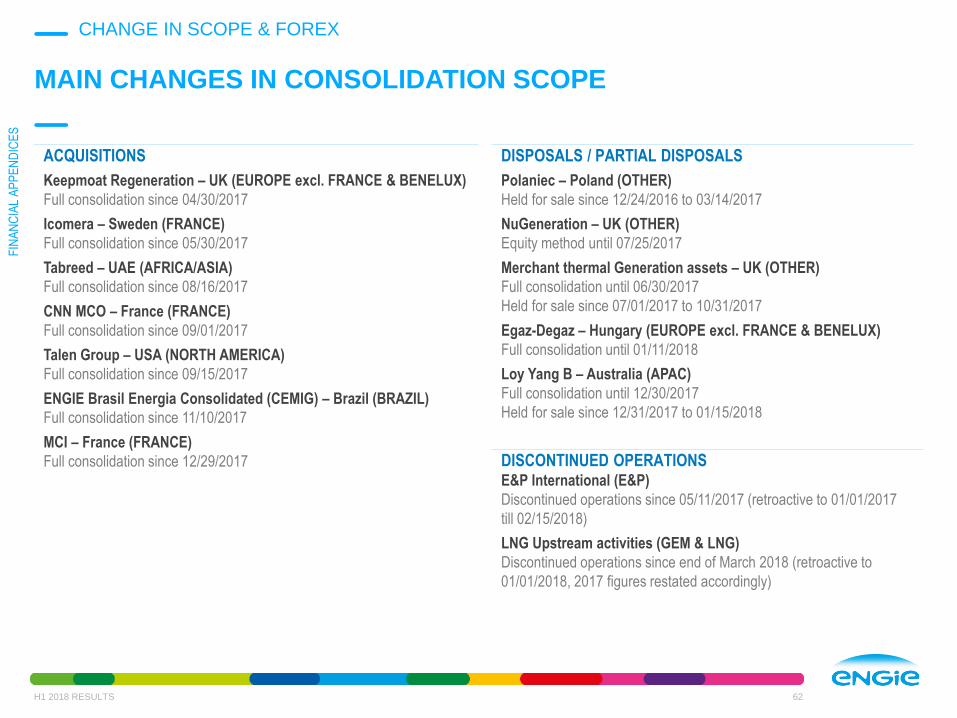
MAIN CHANGES IN CONSOLIDATION SCOPE
H1 2018 RESULTS 62
ACQUISITIONS
Keepmoat Regeneration – UK (EUROPE excl. FRANCE & BENELUX)
Full consolidation since 04/30/2017
Icomera – Sweden (FRANCE)
Full consolidation since 05/30/2017
Tabreed – UAE (AFRICA/ASIA)
Full consolidation since 08/16/2017
CNN MCO – France (FRANCE)
Full consolidation since 09/01/2017
Talen Group – USA (NORTH AMERICA)
Full consolidation since 09/15/2017
ENGIE Brasil Energia Consolidated (CEMIG) – Brazil (BRAZIL)
Full consolidation since 11/10/2017
MCI – France (FRANCE)
Full consolidation since 12/29/2017
DISPOSALS / PARTIAL DISPOSALS
Polaniec – Poland (OTHER)
Held for sale since 12/24/2016 to 03/14/2017
NuGeneration – UK (OTHER)
Equity method until 07/25/2017
Merchant thermal Generation assets – UK (OTHER)
Full consolidation until 06/30/2017
Held for sale since 07/01/2017 to 10/31/2017
Egaz-Degaz – Hungary (EUROPE excl. FRANCE & BENELUX)
Full consolidation until 01/11/2018
Loy Yang B – Australia (APAC)
Full consolidation until 12/30/2017
Held for sale since 12/31/2017 to 01/15/2018
DISCONTINUED OPERATIONSE&P International (E&P)
Discontinued operations since 05/11/2017 (retroactive to 01/01/2017
till 02/15/2018)
LNG Upstream activities (GEM & LNG)
Discontinued operations since end of March 2018 (retroactive to
01/01/2018, 2017 figures restated accordingly)
FIN
AN
CIA
L A
PP
EN
DIC
ES
CHANGE IN SCOPE & FOREX
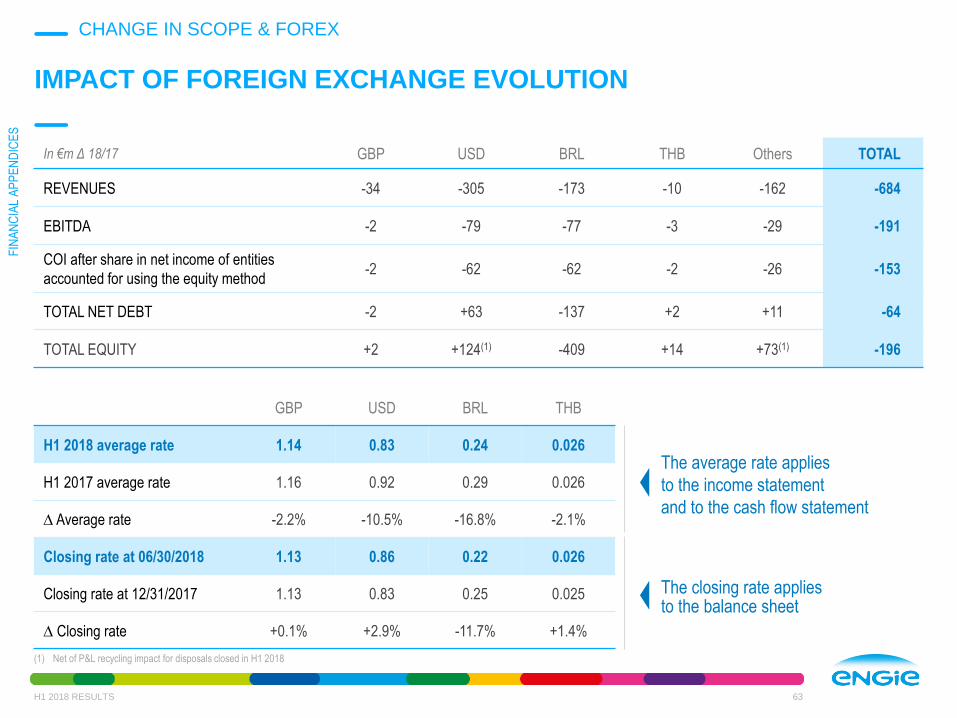
IMPACT OF FOREIGN EXCHANGE EVOLUTION
H1 2018 RESULTS 63
The average rate applies
to the income statement
and to the cash flow statement
The closing rate applies to the balance sheet
In €m Δ 18/17 GBP USD BRL THB Others TOTAL
REVENUES -34 -305 -173 -10 -162 -684
EBITDA -2 -79 -77 -3 -29 -191
COI after share in net income of entities
accounted for using the equity method-2 -62 -62 -2 -26 -153
TOTAL NET DEBT -2 +63 -137 +2 +11 -64
TOTAL EQUITY +2 +124(1) -409 +14 +73(1) -196
GBP USD BRL THB
H1 2018 average rate 1.14 0.83 0.24 0.026
H1 2017 average rate 1.16 0.92 0.29 0.026
D Average rate -2.2% -10.5% -16.8% -2.1%
Closing rate at 06/30/2018 1.13 0.86 0.22 0.026
Closing rate at 12/31/2017 1.13 0.83 0.25 0.025
D Closing rate +0.1% +2.9% -11.7% +1.4%
(1) Net of P&L recycling impact for disposals closed in H1 2018
FIN
AN
CIA
L A
PP
EN
DIC
ES
CHANGE IN SCOPE & FOREX

H1 2018 EBITDA / COI BREAKDOWN BY CURRENCY
H1 2018 RESULTS 64
(1) After share in net income of entities accounted for using the equity method
€3.1bn€5.1bn
THB/EUR0.03
AUD/EUR0.64
GBP/EUR1.14
BRL/EUR0.24
USD/EUR0.83
EUR3.24
FX36%
USD0.68
BRL0.50
0.120.08
0.15
Other0.29
USD0.51
BRL0.42
0.09
0.060.12
Other0.25
FX47%
EUR53%
EUR1.62
EUR64%
EBITDA H1 2018Amount in EUR after translation (average rate)
FX VS. EURAverage H1 2018
COI(1) H1 2018Amount in EUR after translation (average rate)
FIN
AN
CIA
L A
PP
EN
DIC
ES
CHANGE IN SCOPE & FOREX

BALANCE SHEET,
P/L & CASH FLOW
STATEMENT
SUMMARY STATEMENTS OF FINANCIAL POSITION
66
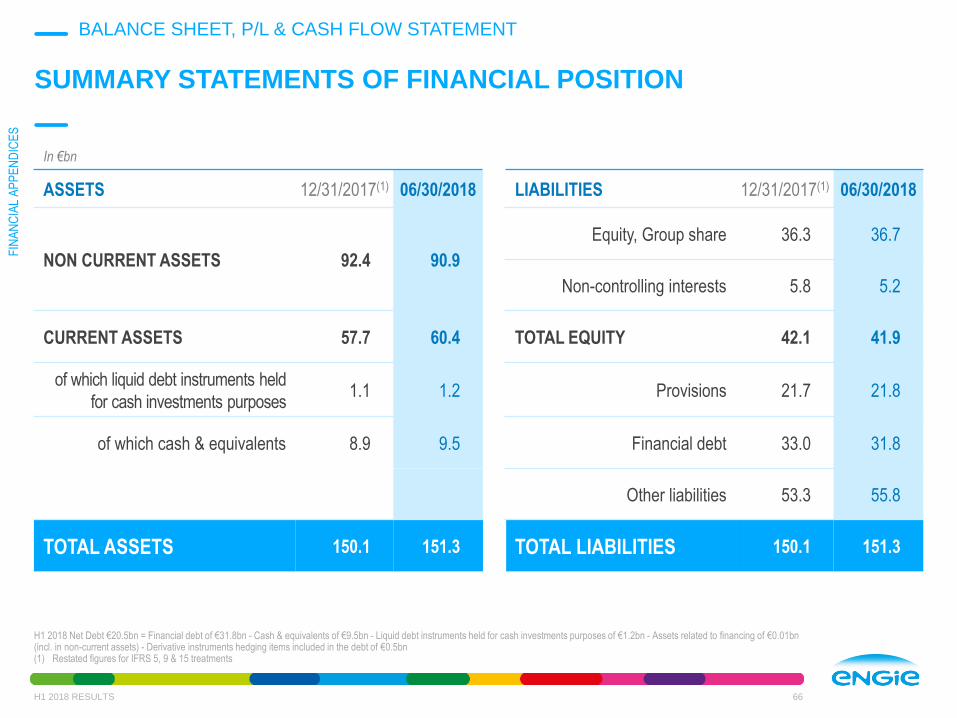
H1 2018 Net Debt €20.5bn = Financial debt of €31.8bn - Cash & equivalents of €9.5bn - Liquid debt instruments held for cash investments purposes of €1.2bn - Assets related to financing of €0.01bn(incl. in non-current assets) - Derivative instruments hedging items included in the debt of €0.5bn(1) Restated figures for IFRS 5, 9 & 15 treatments
In €bn
ASSETS 12/31/2017(1) 06/30/2018 LIABILITIES 12/31/2017(1) 06/30/2018
NON CURRENT ASSETS 92.4 90.9
Equity, Group share 36.3 36.7
Non-controlling interests 5.8 5.2
CURRENT ASSETS 57.7 60.4 TOTAL EQUITY 42.1 41.9
of which liquid debt instruments held
for cash investments purposes1.1 1.2 Provisions 21.7 21.8
of which cash & equivalents 8.9 9.5 Financial debt 33.0 31.8
Other liabilities 53.3 55.8
TOTAL ASSETS 150.1 151.3 TOTAL LIABILITIES 150.1 151.3
FIN
AN
CIA
L A
PP
EN
DIC
ES
H1 2018 RESULTS
BALANCE SHEET, P/L & CASH FLOW STATEMENT

DETAILS OF SOME ASSETS AND PROVISIONS
67
Other
financial
assets
€8.2bn
Assets from contracts
with customers
€7.0bn
Trade and other
receivables, net
€12.2bn
Others
€3.2bn
Recycling and storage & site rehabilitation€6.4bn
Dismantling
€5.8bn
Pensions
€6.4bn
Total provisions
€21.8bn
• Equity instruments at fair
value through equity 0.7
• Equity instruments at fair
value through income 0.4
• Debt instruments at fair
value through equity 2.0
• Debt instruments at fair
value through income 0.9
• Loans and receivables
at amortized costs 4.1
PROVISIONS AS OF 06/30/2018DETAILS OF SOME ASSETS AS OF 06/30/2018
FIN
AN
CIA
L A
PP
EN
DIC
ES
H1 2018 RESULTS
BALANCE SHEET, P/L & CASH FLOW STATEMENT
Stakes
in associates
€7.9bn

ECONOMIC NET DEBT / EBITDA
H1 2018 RESULTS 68
BALANCE SHEET, P/L & CASH FLOW STATEMENT
Economic Net Debt incorporates additional
commitments monitored by the group,
in line with rating agencies adjustments –
although differences in definitions exist
BRIDGE FINANCIAL TO ECONOMIC NET DEBT
In €bn (1) 12/31/17(2) 06/30/18
Last 12 month EBITDA 9.2 9.3
Financial net debt(3) 20.8 20.4
Financial Net Debt / EBITDA 2.3x 2.2x
Operating leases (commitments) 2.3 2.3
ARO provisions 12.0 12.2
Post-employment provisions (minus deferred tax assets)
w/o regulated subsidiaries2.7 2.8
-Nuke dedicated assets (2.7) (2.8)
Economic net debt 35.1 34.9
Economic Net Debt / EBITDA 3.8x 3.8x
(1) Pro forma E&P intercompany debt, provisions and operating lease(2) Restated figures for IFRS 9 & 15 treatments and excluding E&P and LNG(3) Excl. intercompany debt of discontinued operations
FIN
AN
CIA
L A
PP
EN
DIC
ES
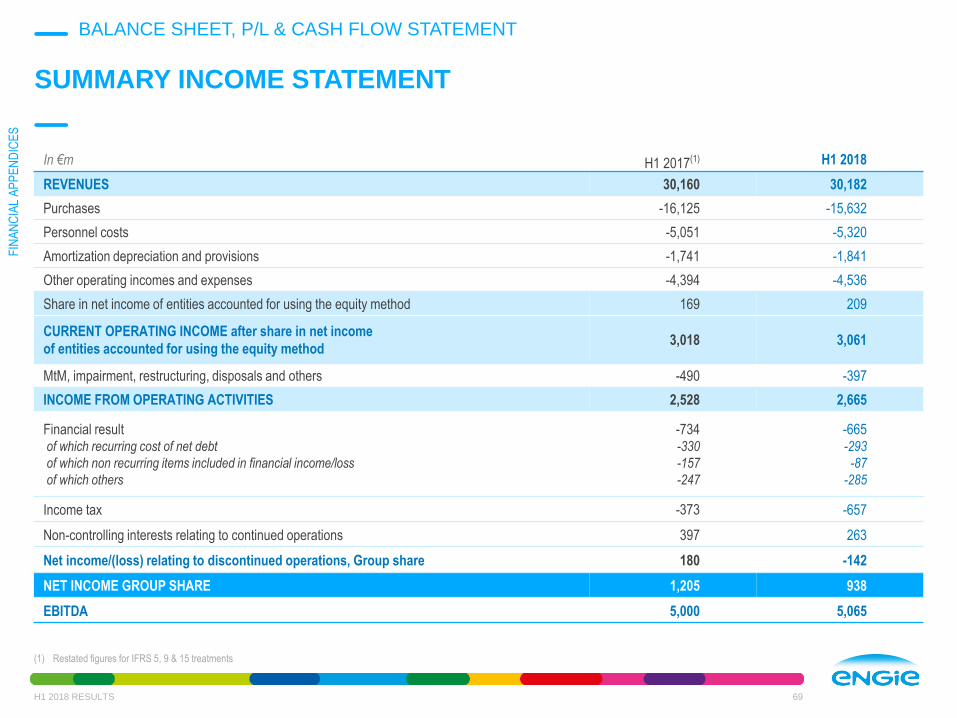
In €m H1 2017(1) H1 2018
REVENUES 30,160 30,182
Purchases -16,125 -15,632
Personnel costs -5,051 -5,320
Amortization depreciation and provisions -1,741 -1,841
Other operating incomes and expenses -4,394 -4,536
Share in net income of entities accounted for using the equity method 169 209
CURRENT OPERATING INCOME after share in net income
of entities accounted for using the equity method3,018 3,061
MtM, impairment, restructuring, disposals and others -490 -397
INCOME FROM OPERATING ACTIVITIES 2,528 2,665
Financial resultof which recurring cost of net debt
of which non recurring items included in financial income/loss
of which others
-734-330
-157
-247
-665-293
-87
-285
Income tax -373 -657
Non-controlling interests relating to continued operations 397 263
Net income/(loss) relating to discontinued operations, Group share 180 -142
NET INCOME GROUP SHARE 1,205 938
EBITDA 5,000 5,065
SUMMARY INCOME STATEMENT
H1 2018 RESULTS 69
(1) Restated figures for IFRS 5, 9 & 15 treatments
FIN
AN
CIA
L A
PP
EN
DIC
ES
BALANCE SHEET, P/L & CASH FLOW STATEMENT
SUMMARY RECURRING INCOME STATEMENT
H1 2018 RESULTS 70
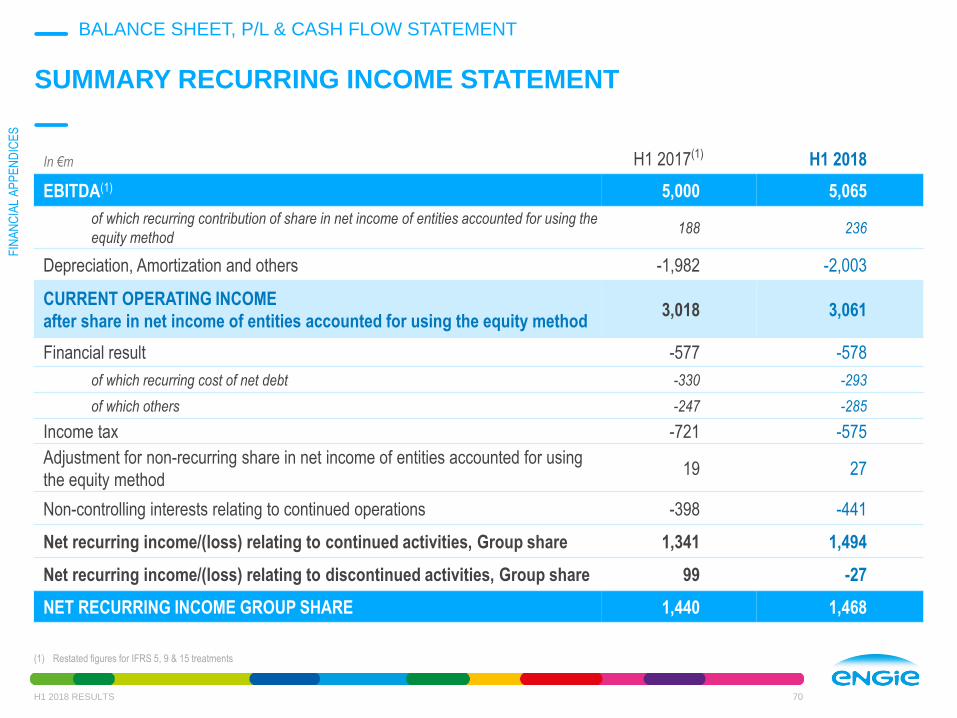
In €m H1 2017(1) H1 2018
EBITDA(1) 5,000 5,065
of which recurring contribution of share in net income of entities accounted for using the
equity method188 236
Depreciation, Amortization and others -1,982 -2,003
CURRENT OPERATING INCOME
after share in net income of entities accounted for using the equity method3,018 3,061
Financial result -577 -578
of which recurring cost of net debt -330 -293
of which others -247 -285
Income tax -721 -575
Adjustment for non-recurring share in net income of entities accounted for using
the equity method19 27
Non-controlling interests relating to continued operations -398 -441
Net recurring income/(loss) relating to continued activities, Group share 1,341 1,494
Net recurring income/(loss) relating to discontinued activities, Group share 99 -27
NET RECURRING INCOME GROUP SHARE 1,440 1,468
(1) Restated figures for IFRS 5, 9 & 15 treatments
FIN
AN
CIA
L A
PP
EN
DIC
ES
BALANCE SHEET, P/L & CASH FLOW STATEMENT

CASH FLOW STATEMENT
H1 2018 RESULTS 71
In €m H1 2017(1) H1 2018
Gross cash flow before financial loss and income taxIncome tax paid (excl. income tax paid on disposals)Change in operating working capitalCash flow from (used in) operating activities relating to continued operationsCash flow from (used in) operating activities relating to discontinued operations
4,326-569279
4,036-26
4,760-291-968
3,50182
CASH FLOW FROM (USED IN) OPERATING ACTIVITIES 4,010 3,583
Net tangible and intangible investmentsFinancial investmentsDisposals and other investment flowsCash flow from (used in) investment activities relating to continued operationsCash flow from (used in) investment activities relating to discontinued operations
-2,285-1,2203,556
5067
-2,603-844885
-2,562-155
CASH FLOW FROM (USED IN) INVESTMENT ACTIVITIES 117 -2,717
Dividends paidShare buy backBalance of reimbursement of debt/new debtNet interests paid on financial activitiesCapital increase Issue of subordinated perpetual notes (hybrid)Other cash flowsCash flow from (used in) financial activities relating to continued operationsCash flow from (used in) financial activities relating to discontinued operations
-1,6225
-216-369
480
-752-2,906
5
-1,428-1
-123-307
15989
-314-1,1681,020
CASH FLOW FROM (USED IN) FINANCIAL ACTIVITIES -2,901 -148
Impact of currency and other relating to continued operationsImpact of currency and other relating to discontinued operations
-12737
-109-1
CASH AND CASH EQUIVALENTS AT THE BEGINNING OF THE PERIOD 9,813 8,929
TOTAL CASH FLOWS FOR THE PERIODReclassification of cash and cash equivalents relating to discontinued operations
1,136-21
607-1
CASH AND CASH EQUIVALENTS AT THE END OF THE PERIOD 10,927 9,535
(1) Restated figures for IFRS 5, 9 & 15 treatments. Figures for cash flow from operating activities and from investment activities are different from the publication of July, 16th 2018 due to an internal reclassification of €113M
FIN
AN
CIA
L A
PP
EN
DIC
ES
BALANCE SHEET, P/L & CASH FLOW STATEMENT

PROFIT & LOSS DETAILS

BREAKDOWN OF REVENUES
H1 2018 RESULTS 73
In €m H1 2017(1) H1 2018
Breakdown
H1 2018 ∆ 18/17 ∆ Organic
NORTH AMERICA 1,460 1,539 5.1% +5.4% +8.6%
LATIN AMERICA 2,233 2,173 7.2% -2.6% +8.6%
AFRICA/ASIA 1,950 1,892 6.3% -3.0% +4.5%
BENELUX 3,490 3,405 11.3% -2.5% -2.4%
FRANCE 7,265 7,813 25.9% +7.5% +5.2%
EUROPE excl. France & Benelux 4,236 4,769 15.8% +12.6% +4.7%
INFRASTRUCTURES EUROPE 2,872 3,054 10.1% +6.3% +6.4%
GEM 3,800 3,214 10.6% -15.4% -15.0%
OTHER 2,854 2,322 7.7% -18.7% -8.9%
TOTAL 30,160 30,182 100% +0.1% +0.8%
(1) Restated figures for IFRS 5, 9 & 15 treatments
FIN
AN
CIA
L A
PP
EN
DIC
ES
PROFIT & LOSS DETAILS

BREAKDOWN OF EBITDA
H1 2018 RESULTS 74
(1) Restated figures for IFRS 5, 9 & 15 treatments
FIN
AN
CIA
L A
PP
EN
DIC
ES
PROFIT & LOSS DETAILS
In €m H1 2017(1) H1 2018
Breakdown
H1 2018 ∆ 18/17 ∆ Organic
NORTH AMERICA 100 102 2.0% +1.9% +9.0%
LATIN AMERICA 920 924 18.2% +0.4% +8.7%
AFRICA/ASIA 665 534 10.5% -19.8% -6.2%
BENELUX 242 133 2.6% -44.9% -44.9%
FRANCE 820 858 16.9% +4.6% +5.3%
EUROPE excl. France & Benelux 389 375 7.4% -3.7% -2.5%
INFRASTRUCTURES EUROPE 1,885 1,965 38.8% +4.2% +4.2%
GEM -120 124 2.4% +203.4% +201.5%
OTHER 99 50 1.0% -49.3% -5.3%
TOTAL 5,000 5,065 100% +1.3% +6.2%

16.9% €0.9bnFrance
BREAKDOWN OF H1 2018 EBITDA
H1 2018 RESULTS 75
(1) By origin
49.5%France
6.1%Belgium
12.6%Other Europe
Italy 2.5%
Netherlands 1.5%
Germany 2.7%
12.1%Rest of the world
3.3%North America
16.4%Latin America
10.5%€0.5bnAfrica/Asia
2.4%€0.1bn
GEM
38.8%€2.0bn
InfrastructuresEurope
18.2%€0.9bnLatin America
1.0%€0.1bn
Other
2.6%€0.1bnBenelux
7.4%€0.4bn
Europe excl.France
& Benelux
2.0%€0.1bnNorth America
o/w UK 2.0%
BREAKDOWN BY REPORTABLE SEGMENTGEOGRAPHIC BREAKDOWN(1)
€5.1bn€5.1bn
FIN
AN
CIA
L A
PP
EN
DIC
ES
PROFIT & LOSS DETAILS

H1 2018 EBITDA BREAKDOWN - MATRIX
76
Unaudited figures(1) % excluding “Other”
3 Métiers
10 SegmentsServices
Retail
Other-
incl Sold
Entities TOTAL
RES+Thermal
Contracted
Thermal
Merchant
Infra-
structures Upstream
North America 0.08 0.00 0.02 0.05 (0.04) 0.10
Latin America 0.80 0.13 (0.00) (0.01) 0.92
Africa/Asia Pacific/ME 0.26 0.02 0.02 0.05 0.19 0.53
Benelux 0.02 (0.06) 0.18 (0.02) 0.13
France 0.22 0.64 0.86
Other Europeexcl. France, Benelux 0.06 0.06 0.08 0.22 (0.04) 0.38
Infrastructures Europe 1.97 1.97
GEM (0.01) 0.09 0.04 (0.00) 0.12
E&P
Other (0.01) 0.20 (0.01) 0.09 0.08 (0.31) 0.05
Total %(1)
1.44 0.22 2.18 0.19 1.25 (0.22) 5,07
CLIENT
SOLUTIONSNETWORKS
H1 2018 RESULTS
FIN
AN
CIA
L A
PP
EN
DIC
ES
PROFIT & LOSS DETAILS
GENERATION –
RES & THERMAL
CONTRACTED
In €bnunaudited figures

H1 2017 EBITDA BREAKDOWN - MATRIX
77
FIN
AN
CIA
L A
PP
EN
DIC
ES
H1 2018 RESULTS
PROFIT & LOSS DETAILS
Unaudited figures(1) % excluding “Other”
In €bnunaudited figures
3 Métiers
10 SegmentsServices
Retail
Other-
incl Sold
Entities TOTAL
RES+Thermal
Contracted
Thermal
Merchant
Infra-
structures Upstream
North America 0.07 0.00 0.00 0.02 0.03 (0.02) 0.10
Latin America 0.82 0.12 0.00 (0.02) 0.92
Africa/Asia Pacific/ME 0.28 0.05 0.02 0.00 0.04 0.28 0.66
Benelux 0.02 0.04 0.20 (0.01) 0.24
France 0.16 0.66 0.00 0.82
Other Europeexcl. France, Benelux 0.04 0.06 0.10 0.22 (0.04) 0.39
Infrastructures Europe 1.88 1.88
GEM 0.04 (0.20) 0.04 0.00 (0.12)
E&P
Other (0.01) 0.25 (0.01) 0.08 0.08 (0.30) 0.10
Total %(1)
1.38 0.44 2.12 (0.10) 1.27 (0.10) 5.00
GENERATION –
RES & THERMAL
CONTRACTED
CLIENT
SOLUTIONSNETWORKS

BREAKDOWN OF SHARE IN NET INCOMEOF ENTITIES ACCOUNTED FOR USING EQUITY METHOD
H1 2018 RESULTS 78
In €m H1 2017(1) H1 2018 ∆ 18/17 ∆ Organic
NORTH AMERICA 41 44 +8.7% +18.2%
LATIN AMERICA -23 -4 +80.6% +76.1%
AFRICA/ASIA 104 135 +30.0% +24.6%
BENELUX 2 3 +70.0% +70.0%
FRANCE -3 -3 -10.4% -9.9%
EUROPE excl. France & Benelux 36 36 -0.4% 0.0%
INFRASTRUCTURES EUROPE 7 4 -39.4% -39.4%
GEM -1 -2 -45.0% -62.0%
OTHER 7 -4 -150.0% -124.9%
TOTAL 169 209 +23.6% +6.7%
(1) Restated figures for IFRS 5, 9 & 15 treatments
FIN
AN
CIA
L A
PP
EN
DIC
ES
PROFIT & LOSS DETAILS
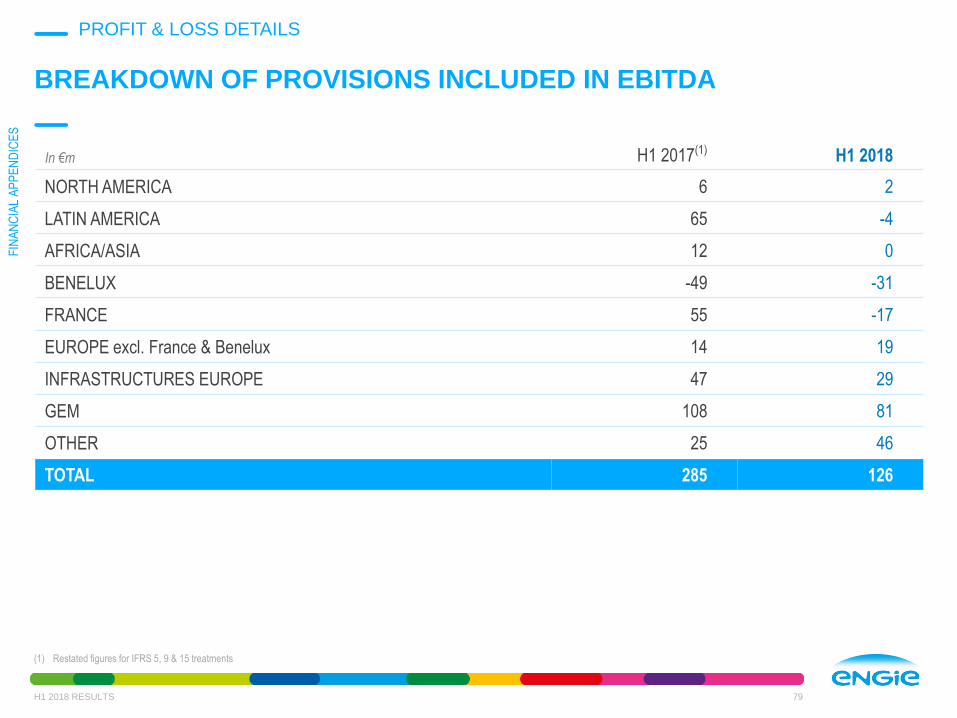
BREAKDOWN OF PROVISIONS INCLUDED IN EBITDA
H1 2018 RESULTS 79
In €m H1 2017(1) H1 2018
NORTH AMERICA 6 2
LATIN AMERICA 65 -4
AFRICA/ASIA 12 0
BENELUX -49 -31
FRANCE 55 -17
EUROPE excl. France & Benelux 14 19
INFRASTRUCTURES EUROPE 47 29
GEM 108 81
OTHER 25 46
TOTAL 285 126
(1) Restated figures for IFRS 5, 9 & 15 treatments
FIN
AN
CIA
L A
PP
EN
DIC
ES
PROFIT & LOSS DETAILS

BREAKDOWN OF CURRENT OPERATING INCOMEAfter share in net income of entities accounted for using the equity method
H1 2018 RESULTS 80
In €m H1 2017(1) H1 2018 ∆ 18/17 ∆ Organic
NORTH AMERICA 80 71 -11.7% -4.7%
LATIN AMERICA 702 721 +2.8% +9.6%
AFRICA/ASIA 545 460 -15.7% -3.5%
BENELUX -26 -149 -486.1% -485.2%
FRANCE 527 553 +4.8% +5.4%
EUROPE excl. France & Benelux 289 279 -3.6% -2.7%
INFRASTRUCTURES EUROPE 1,175 1,239 +5.5% +5.5%
GEM -140 104 +174.3% +173.0%
OTHER -135 -215 -59.4% -28.5%
TOTAL 3 018 3 061 +1.4% +7.2%
(1) Restated figures for IFRS 5, 9 & 15 treatments
FIN
AN
CIA
L A
PP
EN
DIC
ES
PROFIT & LOSS DETAILS

In €m
North
America Latin America Africa/Asia Benelux France
Europe exc. France & Benelux
Infrastructures
Europe GEM Other H1 2018
EBITDA 102 924 534 133 858 375 1,965 124 50 5065
Depreciation -32 -200 -93 -281 -302 -100 -725 -19 -170 -1,922
Share based payments -1 -1 -2 -2 -4 -2 0 -1 -42 -55
Non recurring contribution
of shares
in net income of entities
accounted for using the
equity method
2 -1 21 1 0 5 0 0 -54 -27
COI after share in net
income of entities
accounted for using the
equity method
71 721 460 -149 553 279 1,239 104 -215 3,061
DIVISIONAL RECONCILIATION BETWEEN EBITDA AND COIAfter share in net income of entities accounted for using the equity method
H1 2018 RESULTS 81
FIN
AN
CIA
L A
PP
EN
DIC
ES
PROFIT & LOSS DETAILS

FROM COI AFTER SHARE IN NET INCOME OF ENTITIES ACCOUNTED FOR USING THE EQUITY METHOD TO NET INCOME GROUP SHARE
H1 2018 RESULTS 82
In €m H1 2017(1) H1 2018
COI after share in net incomeof entities accounted for using the equity method
3,018 3,061
MtM commodities -600 520
Impairment 4 -752
Restructuring costs -475 -50
Asset disposals & others 581 -115
INCOME FROM OPERATING ACTIVITIES 2,528 2,665
Financial result -734 -665
Income tax -373 -657
Non-controlling interests -401 -287(2)
Income from discontinued operations, Group share 184 -119
NET INCOME GROUP SHARE 1,205 938
(1) H1 2017 restated for IFRS 5 (E&P accounted as discontinued operations)(2) Of which €-24M of on-controlling interests relating to discontinued operations
FIN
AN
CIA
L A
PP
EN
DIC
ES
PROFIT & LOSS DETAILS

BREAKDOWN OF NON-CONTROLLING INTERESTS
H1 2018 RESULTS 83
In €m H1 2017(1) H1 2018 ∆ 18/17
NORTH AMERICA 8 7 -1
LATIN AMERICA 164 130 -34
AFRICA/ASIA 64 93 29
BENELUX 1 1 0
FRANCE 15 42 27
EUROPE excl. France & Benelux 33 35 2
INFRASTRUCTURES EUROPE 52 54 2
GEM 0 1 1
OTHER 61 -99 -160
Non-controlling interests 397 263 -134
(1) H1 2017 restated for IFRS 5 (E&P accounted as discontinued operations)
FIN
AN
CIA
L A
PP
EN
DIC
ES
PROFIT & LOSS DETAILS

NET RECURRING INCOME GROUP SHARE
H1 2018 RESULTS 84
In €m H1 2017(1) H1 2018
Net income/(loss) relating to continued operations, Group share 1,025 1,081
Net income/(loss) relating to discontinued operations, Group share 180 -142
NET INCOME GROUP SHARE 1,205 938
MtM commodities 600 -520
Impairment -4 752
Restructuring costs 475 50
Asset disposals & others -581 115
Financial result (non-recurring items) 157 87
Share in net income of entities accounted for using the equity method
(non-recurring items)19 27
Income tax on non-recurring items -348 82
Non-controlling interests on above items -1 -178
Non-recurring items relating to discontinued operations, Group share -81 116
NET RECURRING INCOME GROUP SHARE 1,440 1,468
(1) H1 2017 restated for IFRS 5 (E&P accounted as discontinued operations)
FIN
AN
CIA
L A
PP
EN
DIC
ES
PROFIT & LOSS DETAILS

TAX POSITION
H1 2018 RESULTS 85
In €m H1 2017(1) H1 2018
Consolidated income before tax and share
in entities accounted for using the equity method1,625 1,791
Consolidated income tax (373) (657)
Effective tax rate 22.9% 36,7%
Recurrent effective tax rate 31.7% 25.3%
(1) H1 2017 restated for IFRS 5 (E&P accounted as discontinued operations)
FIN
AN
CIA
L A
PP
EN
DIC
ES
PROFIT & LOSS DETAILS
CASH FLOW DETAILS

FROM EBITDA TO FREE CASH FLOW
H1 2018 RESULTS 87
H1 2018FREE CASH
FLOW
Restructuring& others
Cash generated from operations before income tax and working
capital requirements
H1 2018EBITDA
Tax cashexpenses
WCR
Maintenancecapex
Net financialexpenses
5.14.8 (0.3)
(1.0)
(0.3)
2.2
(1.1)
(0.3)
3.3
H1 2018CFFO
FIN
AN
CIA
L A
PP
EN
DIC
ES
CASH FLOW DETAILS
In €bn

In €m H1 2017(1) H1 2018
EBITDA 5,000 5,065
Restructuring costs cashed out -210 -194
Provisions -303 -175
Share in net recurring income of entities accounted for using the equity
method-188 -236
Dividends and others 27 300
Cash generated from operations before income tax
and working capital requirements4,326 4,760
RECONCILIATION BETWEEN EBITDA AND OPERATING CASH FLOW
H1 2018 RESULTS 88
(1) H1 2017 restated for IFRS 5 (E&P accounted as discontinued operations)
FIN
AN
CIA
L A
PP
EN
DIC
ES
PROFIT & LOSS DETAILS

FREE CASH FLOW(1) GENERATION FROM H1 2017 TO H1 2018
H1 2018 RESULTS 89
D Operating cash flow
H1 2017FCF(2)
D Tax cashexpenses
D WCR DMaintenance
capex
H1 2018FCF
D Netfinancial expenses2.8
+0.4(1.2)
+0.0
+0.3 (0.0)
2.2
(1) Free Cash Flow = CFFO after Maintenance Capex(2) H1 2017 restated for IFRS 5 (E&P accounted as discontinued operations)
FIN
AN
CIA
L A
PP
EN
DIC
ES
CASH FLOW DETAILS
In €bn

BREAKDOWN OF INVESTMENTS
H1 2018 RESULTS 90
In €m Maintenance Development Financial H1 2018
NORTH AMERICA 13 153 311 478
LATIN AMERICA 51 609 24 684
AFRICA/ASIA 45 94 192 330
BENELUX 278 23 146 447
FRANCE 107 245 70 423
EUROPE excl. France & Benelux 46 61 105 212
INFRASTRUCTURES EUROPE 391 343 -3 732
GEM 6 14 24 44
OTHER 120 4 112 235
TOTAL 1,057 1,546 982 3,585
FIN
AN
CIA
L A
PP
EN
DIC
ES
CASH FLOW DETAILS

DETAIL OF H1 2018 TOTAL GROSS CAPEX
H1 2018 RESULTS 91
€3.6bn
1.0
1.5
1.1
Financial
Development
Maintenance
Campo Largo & Umbranas
(Wind – Brazil) ~ €0.2bn
Solar & Wind – France ~ €0.2bn
GRDF (France) ~ €0.2bn
Infinity (Wind – USA ) ~ €0.1bn
Paracatu (Solar – Brazil) ~ €0.1bn
Pampa Sul (Thermal – Brazil) ~ €0.1bn
Willogoleche (Wind – Australia) ~ €0.1bn
GRTgaz (France) ~ €0.1bn
ENGIE Energia Chile (Chile) ~ €0.1bn
Longwood (B2T – USA) ~€0.1bn
Infinity Ressources (Wind – USA)~€0.1bn
Socore (Solar – USA) ~€0.1bn
Unity (B2B – USA) ~€0.1bn
Kathu (Solar – South Africa) ~€0.1bn
Priora (B2T – Switzerland) ~€0.1bn
EPS (B2T – France) ~€0.1bn
Synatom (SICAV Benelux) ~€0.1bnFIN
AN
CIA
L A
PP
EN
DIC
ES
CASH FLOW DETAILS

CREDIT

“INVESTMENT GRADE” CATEGORY RATING
93
CREDIT RATINGS as of June 30, 2018
FIN
AN
CIA
L A
PP
EN
DIC
ES
S&P
A+
A
A- ENGIE (stable) 04/30/2018
EDF (negative) 11/20/2017
EnBW (stable) 06/20/2017
BBB+ ENEL (stable) 12/06/2017
Iberdrola (stable) 04/22/2016
Vattenfall (stable) 06/07/2017
BBB EON (stable) 03/15/2017
Naturgy (stable) 03/29/2016
Innogy (stable) 10/11/2017
Uniper (stable) 04/27/2018
Fortum (neg) 01/18/2018
BBB-
Moody’s
A1
A2 ENGIE (stable) 04/27/2016
A3 EDF (stable) 09/28/2016
EnBW (stable) 06/06/2018
Vattenfall (stable) 05/13/2016
Baa1 Iberdrola (stable) 03/14/2018
Baa2 E.ON (stable) 05/17/2018
ENEL (stable) 12/12/2016
Naturgy (stable) 10/17/2014
Innogy (stable) 05/23/2018
Fortum (neg) 02/15/2018
Baa3 RWE (stable) 05/17/2018
Fitch
A+
A ENGIE (stable) 10/09/2017
A- EDF (stable) 06/07/2016
EnBW (stable)
Iberdrola (stable) 01/26/2018
Innogy (CW neg) 03/14/2018
EON (CW neg) 03/14/2018
BBB+ ENEL (stable)
Vattenfall (negative) 01/18/2016
Naturgy (negative) 08/02/2016
Fortum (CW negative) 20/03/2018
BBB RWE (CW evolving) 03/14/2018
H1 2018 RESULTS
CREDIT
Dates refer to the latest rating actions

SPLIT OF GROSS DEBT(1) & DEBT MATURITY PROFILE(2)
94
FIN
AN
CIA
L A
PP
EN
DIC
ES
H1 2018 RESULTS
CREDIT
DEBT MATURITY PROFILE(2)
(1) Without IFRS 9 (+€1.2bn) without bank overdraft (+€0.4bn)(2) Excluding/net of €3.8bn of NEU CP/US CP(3) Negotiable European Commercial Paper(4) Cash & cash equivalents (€9.3bn), plus financial assets qualifying or designated at faire value through income (€1.1bn), net of bank overdraft (€0.4bn)
AVERAGE COST
OF GROSS DEBT:
€30.9bn21.8 Bonds
3.8NEU CP(3) /US CP
0.5Financial Leasing
0.1Other borrowings
4.7Bank borrowings
SPLIT OF GROSS DEBT(1)
10.3
0,8 0.82.5 1.8 2.6 2.7
10.6
9.3
0.7 0.3
0.9
0.30.4 0.3
1.7
0.1 0.1
0.1
0.10.0 0.0
0.1
06/30/2018Liquidity
2018 2019 2020 2021 2022 2023 2024and beyond
Undrawn credit lines(2)
Cash(4)
2.63%as of
12/31/2017 2.53% VS AVERAGE NET DEBT MATURITY: 11YEARS
Bank borrowingsOther Bonds
19.6
11.4
3.03.02.2
3.5
1.21.6
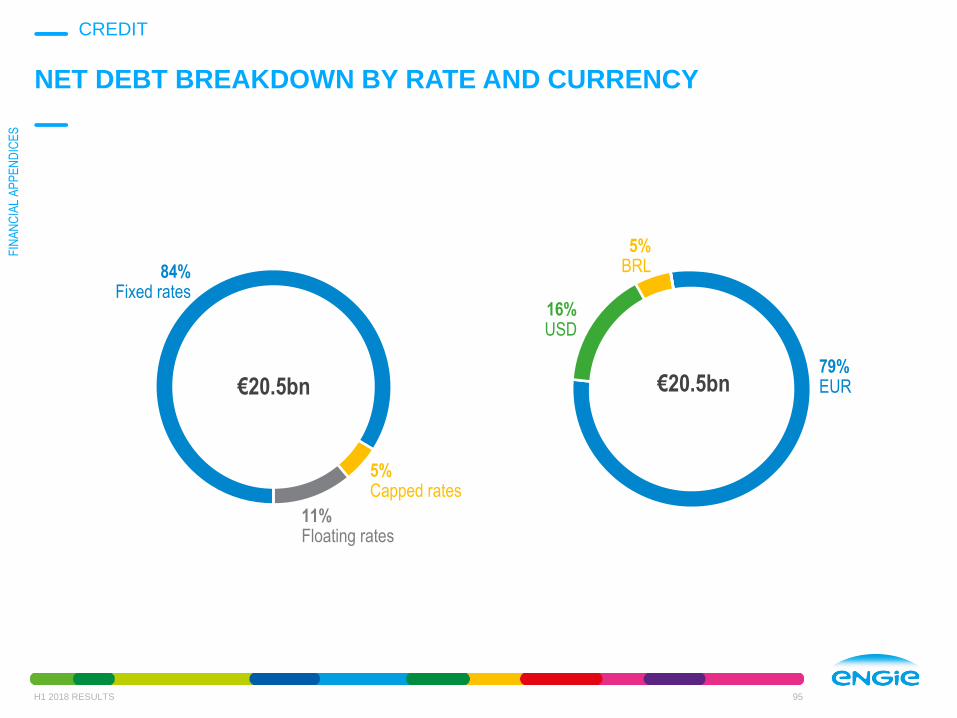
NET DEBT BREAKDOWN BY RATE AND CURRENCY
95
FIN
AN
CIA
L A
PP
EN
DIC
ES
H1 2018 RESULTS
CREDIT
€20.5bn
5%Capped rates
84%Fixed rates
11%Floating rates
€20.5bn79%EUR
5%BRL
16%USD
Disclaimer
Forward-Looking statements
This communication contains forward-looking information and statements. These statements
include financial projections, synergies, cost-savings and estimates, statements regarding plans,
objectives, savings, expectations and benefits from the transactions and expectations with respect
to future operations, products and services, and statements regarding future performance.
Although the management of ENGIE believes that the expectations reflected in such forward-
looking statements are reasonable, investors and holders of ENGIE securities are cautioned that
forward-looking information and statements are not guarantees of future performances and are
subject to various risks and uncertainties, many of which are difficult to predict and generally
beyond the control of ENGIE , that could cause actual results, developments, synergies, savings
and benefits to differ materially from those expressed in, or implied or projected by, the forward-
looking information and statements. These risks and uncertainties include those discussed or
identified in the public filings made by ENGIE with the Autorité des Marchés Financiers (AMF),
including those listed under “Facteurs de Risque” (Risk factors) section in the Document de
Référence filed by ENGIE (ex GDF SUEZ) with the AMF on 28 March 2018 (under no: D.18-0207).
Investors and holders of ENGIE securities should consider that the occurrence of some or all of
these risks may have a material adverse effect on ENGIE.
H1 2018 RESULTS 96

Symbol ENGIY
CUSIP 29286D105
Platform OTC
Type of programme Level 1 sponsored
ADR ratio 1:1
Depositary bank Citibank, NA
ADR PROGRAMAMERICAN DEPOSITARY RECEIPT
97
FOR MORE INFORMATION, GO TO
http://www.citi.com/dr
H1 2018 RESULTS

FOR MORE INFORMATION ABOUT ENGIE
+33 1 44 22 66 29
Presentation
http://www.engie.com/en/investors-area/
FOR MORE INFORMATION ABOUT H1 2018 RESULTS, YOU WILL FIND ON
http://www.engie.com/en/investors/results/results-2018/
Analyst
pack
Appendices Press
Release
Recorded
conference
audiocast
Financial
report
Download the new ENGIE Investor relations app !
98
2018HALF YEAR
Ticker: ENGI
98H1 2018 RESULTS